Adaptive Network Flow Parameters for Stealthy Botnet Behavior

NANYANG TECHNOLOGICAL UNIVERSITY
Detection and Mitigation of Botnet Infiltration using
Intelligent Swarm Networks
Supervisor: A/P Yow Kin Choong
A/P Lee Keok Kee
Examiner: A/P Vinod Achutavarrier Prasad
Student: Lee Wai Seng Jonathan
School of Computer Engineering
2011/2012

NANYANG TECHNOLOGICAL UNIVERSITY
SCE11-0315
Detection and Mitigation of Botnet Infiltration using
Intelligent Swarm Networks
Submitted in Partial Fulfillment of the Requirements
for the Degree of Bachelor of Computer Engineering
of Nanyang Technological University
by
Lee Wai Seng Jonathan
School of Computer Engineering
2011/2012

ii
ABSTRACT
This paper discusses the development of appropriate algorithms to analyze traffic
patterns from internal machines to outside machines. Strange anomalies such as the
abnormal amount of network traffic, or immense differences in request and response
packets can indicate a botnet command and control attempt. A three-pronged
approach was suggested to neutralize, mitigate and attack the source of attacks,
which was later modified to follow a more assured path. We propose to analyse the
traffic coming from internal nodes to external networks using a threshold and known
flooding signs. Simulation experiments have been carried out with Wireshark, a
network protocol analyzer, and LOIC, a network stress testing tool. Out of 6 files and
15 tests, our method proved to be rather accurate at 73.33%. Nevertheless, the
accuracy could be better calculated with larger sample sizes.

iii
ACKNOWLEDGEMENTS
I would like to express my sincere gratitude to my supervisor, Associate Professor
Yow Kin Choong, who has been continuously providing invaluable advice and
direction throughout the process of this project. It would not have been such an
enriching and enjoyable experience without him.
Additionally, I am also appreciative of the efforts of my second supervisor, Associate
Professor Lee Keok Kee, for the assistance and supervision over my report.
Last but not least, I would like to give my thanks and appreciation to Lua Ruiping,
who has given me pointers as well as guidance in the completion of my
experimentations.
iv
TABLE OF CONTENTS
ABSTRACT ................................................................................................................. ii
ACKNOWLEDGEMENTS ........................................................................................ iii
TABLE OF CONTENTS ............................................................................................ iv
LIST OF FIGURES ................................................................................................... vii
1. INTRODUCTION ................................................................................................... 1
1.1 Background information ............................................................................... 1
1.2 Objective ....................................................................................................... 2
1.3 Scope ............................................................................................................. 3
1.4 Overview ....................................................................................................... 3
2. REVIEW OF RELATED WORK ........................................................................... 4
2.1 Statistical Anomaly Detection ........................................................................... 4
2.2 Chi-Square Statistic Approach ........................................................................... 4
2.3 Covariance Analysis Method ............................................................................. 6
2.4 Intelligent Fast-Flux Swarm Network ............................................................... 6
3. PROJECT PLAN AND STRATEGY ...................................................................... 8
3.1 Initial Idea – Three-Pronged Approach (1) ........................................................ 8
3.1.1 DDoS Mitigation Module ........................................................................... 8
3.1.2 DDoS Neutralizing Module ........................................................................ 9
3.1.3 DDoS Attack Module ............................................................................... 10
3.2 Initial Idea – Three Pronged Approach (2) ...................................................... 12
4. IMPLEMENTATION ............................................................................................ 13
4.1 Attack Simulation ............................................................................................ 13
4.1.1 Experiment Software ................................................................................ 14
4.1.1.1 XAMPP v1.17 VC9 ........................................................................... 14
4.1.1.2 No-IP DNS Update Client (DUC) v3.0.4 .......................................... 15
4.1.1.3 Hive Mind LOIC v1.1.2.1 .................................................................. 16
4.1.1.4 mIRC v7.22 ........................................................................................ 17
4.1.1.5 Wireshark v1.6.5 (SVN Rev 40429 from /trunk-1.6) ........................ 18
4.1.1.6 Sawmill Enterprise v8.5.5 .................................................................. 19
4.1.1.7 NetWitness Investigator v9.0.5.4 ....................................................... 20
4.1.1.8 WinDump ........................................................................................... 20

v
4.1.2 Experiment Set-Up ................................................................................... 21
4.1.3 Experiment Steps and Details ................................................................... 22
4.1.4 Experiment Results ................................................................................... 23
4.1.5 Experiment Discussion ............................................................................. 25
4.2 Network Bandwidth Analysis .......................................................................... 27
4.2.1 Analysis Approach and Design ................................................................. 27
4.2.1.1 Tracing Analysis ................................................................................ 28
4.2.1.2 Statistical Analysis ............................................................................. 28
4.2.1.3 Graphical Analysis ............................................................................. 28
4.3 Main Implementation ....................................................................................... 31
4.3.1 Wireshark Filters ....................................................................................... 31
4.3.1.1 HTTP flood ........................................................................................ 31
4.3.1.2 SYN flood .......................................................................................... 32
4.3.1.3 UDP flood .......................................................................................... 33
4.3.1.4 ICMP flood ........................................................................................ 33
4.3.1.5 Using Wireshark ................................................................................ 33
4.3.2 Outflow.java ............................................................................................. 35
4.3.2.1 Outflow.java Input Parameters .......................................................... 35
4.3.2.2 Outflow.java Methods ....................................................................... 37
4.3.2.3 Outflow.java Output .......................................................................... 40
4.3.3 Testing ...................................................................................................... 41
4.3.3.1 FileNotFound Exception .................................................................... 41
4.3.3.2 ArrayIndexOutOfBounds Exception ................................................. 41
4.3.3.3 Invalid Arguments ............................................................................. 42
5. RESULTS .............................................................................................................. 43
6. DISCUSSION ........................................................................................................ 44
6.1 Observed Results ............................................................................................. 44
6.2 Design Limitations ........................................................................................... 44
6.2.1 Assumptions .............................................................................................. 44
6.2.2 Response time ........................................................................................... 45
6.2.3 Logic Limitations ...................................................................................... 45
7. CONCLUSION ...................................................................................................... 47

vi
8. RECOMMENDATIONS ....................................................................................... 48
REFERENCES .......................................................................................................... 49
APPENDIX ................................................................................................................ 50
1. PROGRAM SOURCE CODE ............................................................................... 50
1.1 Outflow.java .................................................................................................... 50
1.2 Calc.java .......................................................................................................... 60
2. SAMPLE FILES .................................................................................................... 68
2.1 Sample filtered log file from Wireshark(.csv) ................................................. 68
2.2 Sample results file ............................................................................................ 69

vii
LIST OF FIGURES
Figure 1 – XAMPP in operation ............................................................................. 14
Figure 2 – No-IP DUC Client .................................................................................. 15
Figure 3 – Hive Mind LOIC .................................................................................... 16
Figure 4 - mIRC ....................................................................................................... 17
Figure 5 - Wireshark ............................................................................................... 18
Figure 6 – Sawmill Enterprise ................................................................................ 19
Figure 7 – NetWitness Investigator ........................................................................ 20
Figure 8 - WinDump ................................................................................................ 20
Figure 9 – Experiment Set-Up ................................................................................ 21
Figure 10 – NetWitness Investigator log of IRC-commanded LOIC .................. 23
Figure 11 - NetWitness Investigator log of Twitter-commanded LOIC ............. 24
Figure 12 - NetWitness Investigator demo collection showing ‘Alerts’ .............. 25
Figure 13 – Wireshark > Statistics > IO Graphs .................................................. 34
Figure 14 – Wireshark IO Graphs ......................................................................... 34
Figure 15 – Outflow.java in use .............................................................................. 35
Figure 16 – Outflow.java Output ........................................................................... 40
Figure 17 – FileNotFound Exception ..................................................................... 41
Figure 18 – ArrayIndexOutOfBounds Exception ................................................. 41
Figure 19 - Invalid Arguments ............................................................................... 42

1
1. INTRODUCTION
1.1 Background information
In today’s digital age, technology advances at such a progressive rate that new
Information Technology (IT) related jargons have to be coined every few years. In
comes “botnets”, “zombie computers” and “Denial of Service (DoS) attacks”. Each
of them a new term to strike fear into end-users.
Zombie computers are computers that are remotely-controlled by a Command and
Control (C&C) server mainly through IRC ports. Together, they form a botnet, or a
net of ‘bots’. Users of these machines may not even realize that they are part of one
as all that they will notice is a slight lag in accessing the Internet.
As organized crime took to the digital realm in the last decade, their activities were
mainly attributed to money-making through phishing and blackmails. Botnets
were used in this sense to send spam emails and launch distributed DoS (DDoS)
attacks in an attempt to bring down the targeted organisation’s website. In the present
days, threats to the cyber world continue to rise as their foci shift with the times.
Motion Picture Association of America (MPAA) was brought down by Anonymous
for its anti-piracy stands[1]. Similarly, websites of Mastercard, Visa, Paypal, CIA,
The Vatican and many other security firms and high profile targets were taken offline
by the groups, Anonymous and LulzSec, for the reasons of revenge or highlighting
and demonstrating security flaws in insecure systems[2][3][4].
DDoS attacks are simply DoS attacks on a larger scale, usually from thousands of
zombie computers trying to open connections with the targeted website, flooding it
with requests and causing servers or websites to lose online availability and
serviceability. Low Orbit Ion Cannon (LOIC), an open source network stress testing
tool, was tweaked and used by members of the groups Anonymous and LulzSec in
their recent acts[5].

2
Companies which require their websites to be highly available would lose a
considerable amount of returns due to disruptions in their online services. Most of
them would even resort to spending 75% more for extra bandwidth. Furthermore,
Bandwidth overprovisioning is not the cheapest nor most productive solution to the
problem as it is only used to counter against the worst outcome possible. Recent
statistics indicate that DDoS attacks nowadays range from as high as 1 million
packets per second (Mpps) to almost 5 Mpps. An attack of such magnitude would
easily cripple networks, even those that are sufficiently prepared[6].
These trends clearly signify a call for a new and efficient method to respond to such
attacks.
1.2 Objective
This project aims to develop appropriate algorithms to analyze traffic patterns from
internal machines to outside machines. Strange anomalies in connection duration,
time of day, or type of information uploaded/ downloaded can indicate a botnet
command and control attempt. However, the computing demands to analyze this
massive amount of data on a single machine make this task infeasible, and hence we
look for a distributed approach to overcome this – using an intelligent swarm
network.
3
1.3 Scope
In this project, we explored an appropriate method and algorithm, in conjunction
with the intelligent swarm network model network infrastructure, to alleviate attacks
as well as to detect unusual network traffic activity with a reasonable measure of
certainty. It identifies and classifies IP addresses that could be the source of a
probable DDoS attack. This is further assisted by utilizing Wireshark, a network
protocol analyser that captures packets and traffic on a network.
A simulated DDoS attack was carried out by attackers and their attack data,
alongside its usual traffic data, were captured for analysis. The captured data was
compared against multiple factors from its input/ output (IO) results.
1.4 Overview
The entire report is divided into four main segments.
The introduction is presented in chapter 1.
Chapter 2 reviews related works and articles.
Chapters 3, 4 and 5 cover the project strategy, implementation as well as the
results.
Chapters 6, 7 and 8 discusses about the results of the implementation, the
conclusion and also any other possibilities or improvements that could be
applied in future.

4
2. REVIEW OF RELATED WORK
Chapter 2 describes a few useful articles that are related to the study and the
contributions of this report.
2.1 Statistical Anomaly Detection
Roland used a statistical anomaly approach in the detection of DDoS attacks [7]. As
anomalies in network traffic can usually be attributed to attacks, statistical anomaly
detection exploits this notion as it calculates the deviation of parameters between
current traffic and normal traffic. Header field values from the packets are estimated
to a multinomial distribution. The empirical cumulative distribution function (ECDF)
of the oscillations are calculated around the expected mean as well as for the last N
oscillation values before using a 2-sample Goodness-of-Fit test and comparing the
difference in area under the two ECDFs to determine if an anomaly has occurred.
This detection method is based on the assumption that equates all anomalies to
attacks on the network. Furthermore, the nominal traffic is also assumed to include
all possible cases of normal traffic such as the downloading / uploading of files as
well as the spectrum of TCP or UDP ports used. If the second assumption is not
validated accurately, this detection method would produce multiple false positives.
2.2 Chi-Square Statistic Approach
AIDS by Leu and Lin is a distributed security system using distributed computing in
the form of mobile agents in order to delegate analysis tasks to multiple components,
greatly reducing the computation workload of the detection task [8]. Once the
detection of an attack occurs, the attack source information would be saved into a
database where a firewall can be updated automatically in real-time to forcibly drop
current connections and preventing further communication between the system and
the attacker.

5
AIDS improves on the chi-square formula used by Feinstein et al. in DoS
detection[9]. According to the original chi-square formula, the authors created two
groups of data which comprises of the frequencies of the packets from connections
recorded during the current time and previous time respectively. The connections in
each group are further segmented into six ranges of varying packet frequencies. The
difference of the two groups of data is calculated with a chi-square statistical method
and compared in order to detect the presence of a DoS or DDoS attack based on the
significance of the magnitude of difference. Leu and Lin further improved the
approach by creating different mechanisms in order to capture the source of the
attack as well as broaden and increase the number of ranges used to classify the
various connections. AIDS establishes a baseline profile by collecting normal
packets from subunits of a geographically concentrated unit before it starts its
detection algorithm. Source information such as the IP address, port used, packet
frequencies per day over a range of 7 days as well as the average per-10-seconds
frequency would be recorded in a database for analysis before being updated every
10 seconds and organised into the different ranges ranked accordingly based on the
magnitude of packet frequency sent.
On the contrary, design and logic flaws exist within such a system. Firstly, the
detection assumes that the first contact of every new connection would have
frequencies similar to that of normal traffic. The captured source information would
then be recorded and the connection ranked. In the case of a new IP source trying to
connect to the system, assuming that the attacker is DoS-ing right from the start and
that his attack pattern is somewhat constant to a certain extent, all the system would
do would be to log in the information and later rank it at the top of the list since the
frequency of packets sent would be much greater than usual traffic. Detection of a
DoS attack would not occur since the chi-square value of the packet frequency in the
first 10 seconds would not differ much from the next 10 seconds. By the time
detection occurs, it would be when the attacker has decreased or stopped the slew of
attacks but yet remain connected to the system. The difference between the chi-
square values would now be significantly greater. Assuming that if it were more than
one of such connections, the system would easily be overloaded and brought down.

6
Secondly, this system only provides a preventive approach in solving the DDoS
situation. In the case of an actual compromise, it does not provide a cure, relief or
any other failsafe methods to alleviate the situation.
2.3 Covariance Analysis Method
Jin and Yeung proposed the effect of multivariate correlation analysis and covariance
matrices to detect DDoS attacks by its characteristic SYN flooding[10]. In such
attacks, the numbers of the SYN and FIN flags in the control field of the TCP header
do not match. Correlation changes between each pairs of flags in the TCP header
control field could allow for the detection of the incidence of an anomaly. This
method allows for an apparent differentiation between the normal and attack traffic;
however, the selection of an appropriate time interval for observation is debatable.
2.4 Intelligent Fast-Flux Swarm Network
The intelligent swarm network as proposed by Lua and Yow has the ability to self-
organize in order to react to different situations in the case of an attack[11]. The
swarm network is essentially almost similar in equivalence to a botnet where
multiple bots, or in this case, nodes, are connected to form a network infrastructure
which organizes and transmits messages between clients and servers. Swarm
networks utilize the benefits of distributed computing in order to mitigate the number
of requests in the event of an attack. Comparable to a zombie computer, spare
bandwidth of the swarm nodes would be employed for such a purpose.
Swarm networks use the Intelligent Water-Drop algorithm for a large-scale parallel
search to delegate the networking demands. This algorithm searches for optimal
relay routes similar to how water flowing naturally would follow a path of least
resistance. The fast-fluxing hosting technique allows for the rapid shuffling of IP
addresses under a domain host which connects the swarm nodes, servers and clients.
Combining both the Intelligent Water-Drop algorithm with fast-fluxing allows for a
robust and optimized system in withstanding against an overload of connections.

7
Furthermore, this implementation would be easily applied as no alteration to the
clients and servers are needed – IP addresses and domains can simply be registered
together with the swarm network. On the other hand, there is simply just that much
that the network can withstand. If the number of connections or malicious nodes
were to be far larger than the number of swarm nodes, overwhelming is still a
probable outcome.

8
3. PROJECT PLAN AND STRATEGY
Chapter 3 discusses various methods that give rise to a suitable and effective model
of DDoS protection that consumers can adopt. It expounds more on the purpose of
this report by describing the rationale behind it. It also elucidates the initial ideas as
well as the research conducted preceding the implementation, in order to arrive at an
appropriate recommendation.
3.1 Initial Idea – Three-Pronged Approach (1)
An effective and comprehensive solution to counter against the threat of DDoS
attacks would be to adopt a three-pronged approach in mitigating, neutralizing and
attacking the source of flooding of packets on servers and websites.
The mitigation section alleviates any excessive traffic that is unable to be disengaged
or identified.
The neutralizing section would most definitely be the crucial and primary portion of
this model as it is where attacks are stopped in its tracks. Great emphasis has been
placed in this area as made evident by the many detection methods and preventive
measures researched and recommended by the industry.
The last section would be the attacking section, which is rare for it to be included
into this model, or for any other proposals. However, we are bold enough to
incorporate this function as it gives a chance to shut down the source of the attack.
These three focus areas will be further explained in the sections below.
3.1.1 DDoS Mitigation Module
In order to first protect against an attack, the first resource that should be needed is
bandwidth as it acts as a failsafe. With reference to section 1.1 in the introduction of

9
this report, we mentioned that bandwidth overprovisioning was not the most efficient
nor cost-effective solution.
Looking at Anonymous’ attack on Sony Playstation Network in April 2011[12], the
DDoS attack was merely a diversion for other sophisticated attacks taking place at
the same time. Learning from these incidents, perhaps a method to absorb or cushion
these impacts would be much more desirable a trait to implement in our model.
Therefore, we propose the adoption of Lua and Yow’s Intelligent Swarm Network as
the preferred network infrastructure that is effective in the act of absorbing the
impacts of DDoS attacks.
3.1.2 DDoS Neutralizing Module
Based on this design, we also propose the use of a ban list or firewall. Once an attack
is detected, the source IP addresses that are found to be DDoS-ing will be added into
a database which will also be included into the firewall itself. This prevents further
threats from the confirmed and suspected IP source addresses. Conversely, we
acknowledge that in all detection methods, be it statistical or by correlation, there
might still be a slim chance of false positives reported. Thus, a CAPTCHA would be
implemented in an authentication page whereby users who have been falsely reported
to send malicious traffic could regain their connections and remove the bans on
themselves, unless they were banned again for infringing the detection conditions,
which should be unlikely if they were human users.
Using the firewall, rules can be added in order to block specific DDoS tools, such as
LOIC, which was being used by the Anonymous group in the recent spate of political
protesting events. The binary version of LOIC, initially created as a network stress
testing tool by Praetox Technologies, allows for the attack selection of HTTP, UDP
or TCP SYN floods as well as the target port number, package message, number of
threads and the request timeout[13]. A new web-based Javascript version of LOIC
that was released in 2010 only allowed for HTTP attacks. Notable signatures of

10
LOIC have been analysed by Montoro and they can easily be detected when these
behavioural patterns are included in the firewall rules[14].
DDoS attacks have many different variations such as UDP floods, TCP SYN floods,
ICMP floods and HTTP floods. According to latest statistics, HTTP floods remain
the highest and most-used form of DDoS attacks with UDP floods at second place
with a huge gap of frequency difference[15]. Even though the Swarm layer would be
effective enough to counter against such floods, nevertheless, we should endeavour
to add on as much layers of protection as possible for the best defence. One method
that we can deploy is the use of the Covariance Analysis method as mentioned by Jin
and Yeung to specially tackle against TCP SYN floods. Similarly, an Anomaly
Detection method would help in identifying threats based on the different protocols.
Using the Statistical Analysis method, a high traffic rate or atypical number of
packets from bots can be identified and filtered. Using the Anomaly Recognition
method, auto-learning of nominal baselines for protocol and source network traffic
can help in the identification and filtering of such malicious activities.
3.1.3 DDoS Attack Module
One special characteristic of this model that is rarely seen would be the decision to
include an approach for counterattack even in the midst of an attack.
In the early stages of planning, the initial idea was to set aside a small group of
selected swarm nodes to ‘flank’ and counter-DDoS the C&C server such that the
botnet’s instructions for attack to its bots would cease, thereby bringing it to an
immediate end. Despite it being an effective ‘fight fire with fire’ approach, a few
reasons were ascertained to reconsider a different strategy.
Firstly, an algorithm or criteria would be required for the selection process of swarm
nodes in the swarm network. Clusters have to be formed and it could be done using
either nodes from a common geographical location, hierarchical cluster or just
simply nodes that were entertaining low demands of bandwidth. This would require a

11
complicated set of rules to account for the many different situations that would arise.
Furthermore, this cluster would have to be temporal and also automated. Focusing
too much on this technical scope would overlook the other concerns underlying the
purpose of forming such a cluster, which are presented in the points that follow.
Secondly, given that the botnet utilized IP spoofing together with fast-flux
technology, it would not be impossible but it would be tough to determine the actual
IP address of the C&C server. Especially when combined with fast-fluxing, the IP
addresses would be changing itself continuously within a broad range of other
obscure IP addesses. Tracing the actual cyber-location of the server would have to be
done manually and the effort needed would be tedious. Perhaps after all the analysis,
the attacks would have already ceased and it might defeat the purpose of the counter-
attacking module. In addition, insisting on bombarding all those IP addresses would
eventually affect innocent individuals whose workstations are unknowingly
transformed into zombie computers. Although it adopts the ‘sacrifice some for the
greater good’ methodology, these individuals might just be genuine users of the
online service provided by the organisation and thus will have an effect on their
brand loyalty in a certain way.
Thirdly, retaliation in a like manner would result in a greater counteroffensive by the
botnet. Knowing that hacktivists, Anonymous, are a group of individuals who push
political ideas through cyber crimes, it can be envisaged that a great form of
vengeance would follow after the initial assault.
Through the above reasons, we conclude that a counter-offensive in like manner is
deemed as an undesirable resolution in this approach and we seek a solution a
simple, yet quick solution in deducing the source of the botnet attacks in which it
would reduce any possible negative implications. Therefore, we propose an alternate
idea in the attacking phase. In section 3.2, we begin to explore the analysis of
internal swarm nodes which might have a part to play in the botnet attacks.

12
3.2 Initial Idea – Three Pronged Approach (2)
Still conforming to the three-pronged strategy as mentioned in section 3.1, the
second strategy proposed a safer method that could be implemented in the attacking
module of the said approach.
A technique could be used to detect the range of fast-fluxed IP addresses used by the
botnet through the analysis of communication exchange from the internal swarm
nodes with the external botnet server. This implies that we have to assume a node in
the swarm network is compromised and that it in itself is sending a flood of packets
to its own or other networks.
Therefore, we propose to search for anomalous traffic between a node and external
networks that could involve the node communicating with the server. From this, we
attempt to produce a list of possible IP addresses of the botnet server, together with
an algorithm to classify the probability of the suspected IP being a C&C server. In
turn, the results will be ranked, with this list being sent to a relevant authority to shut
down the source of the attack, namely, the C&C server. This would further reduce any
friction between the botnet and the organisation using this model.
Even though this approach may not be targeting the desired effect we initially had in
mind, i.e. the quick impedance of the botnet sending an overflow of packets, we
believe that it will benefit in the long run.
An experiment was conducted to explore the feasibility of the solution. Details of the
simulation will be further explained in Chapter 4.1.

13
4. IMPLEMENTATION
This chapter describes the process as well as the challenges faced in searching for a
suitable attack approach for the three-pronged model proposed in section 3.2.
4.1 Attack Simulation
In this experiment, we simulate an actual botnet attack to an online server while
gathering information and data on the modes of attack as well as communication
with the botnet server.

14
4.1.1 Experiment Software
This section lists the different software that were beneficial to this experiment.
4.1.1.1 XAMPP v1.17 VC9
Figure 1 – XAMPP in operation
XAMPP is a fuss-free Apache distribution containing MySQL, PHP and Perl which
easily facilitates the setting up of an online server.
15
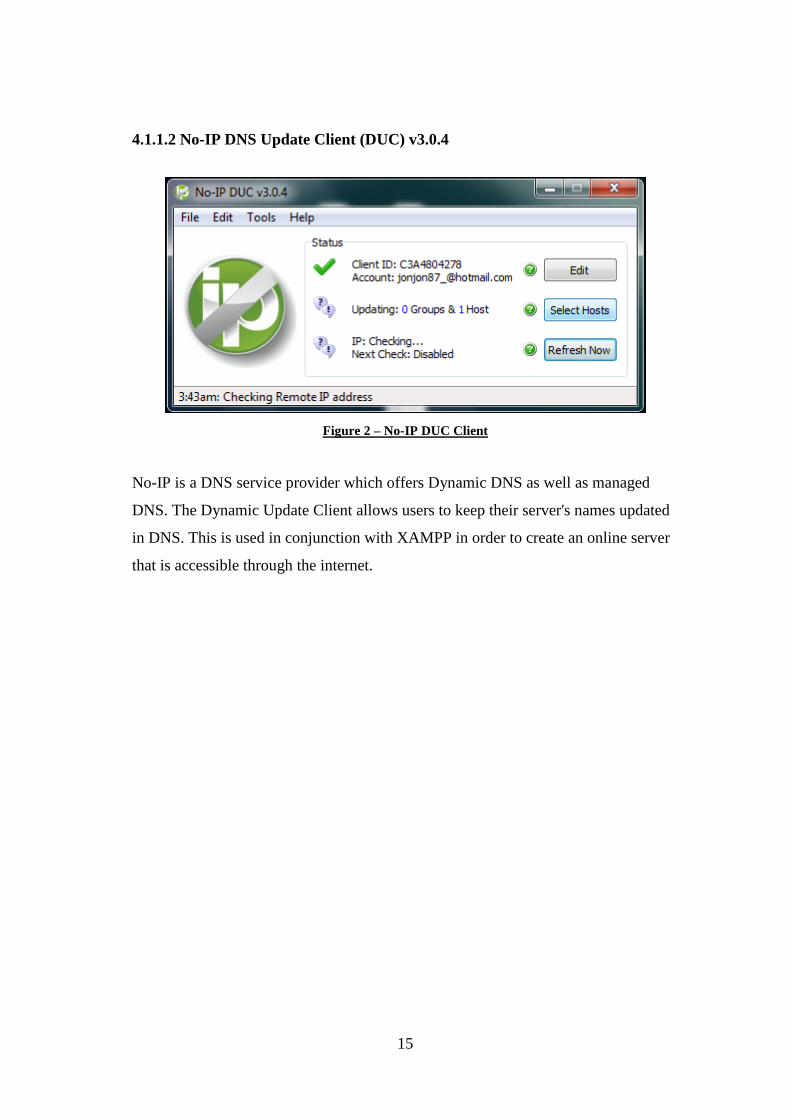
4.1.1.2 No-IP DNS Update Client (DUC) v3.0.4
Figure 2 – No-IP DUC Client
No-IP is a DNS service provider which offers Dynamic DNS as well as managed
DNS. The Dynamic Update Client allows users to keep their server's names updated
in DNS. This is used in conjunction with XAMPP in order to create an online server
that is accessible through the internet.

16
4.1.1.3 Hive Mind LOIC v1.1.2.1
Figure 3 – Hive Mind LOIC
LOIC was created by Praetox Technologies for the basic purpose of network stress
testing. It delivers a Denial of Service attack by flooding with the various network
protocols such as HTTP, TCP and UDP. Hive Mind LOIC, a variation of the original
LOIC, was adapted for centralized control by ‘NewEraCracker’ before the project
later taken over by ‘Urijah’. The first version included remote control through
Internet Relay Chat (IRC) in which a particular IRC channel could dish commands
through messages. The later revision added RSS control which allowed more modern
and easily accessible social media such as Twitter.

17
4.1.1.4 mIRC v7.22
Figure 4 - mIRC
mIRC is a full featured Internet Relay Chat client that can be used to communicate,
with others on IRC networks around the world, either in group or private discussions.
18
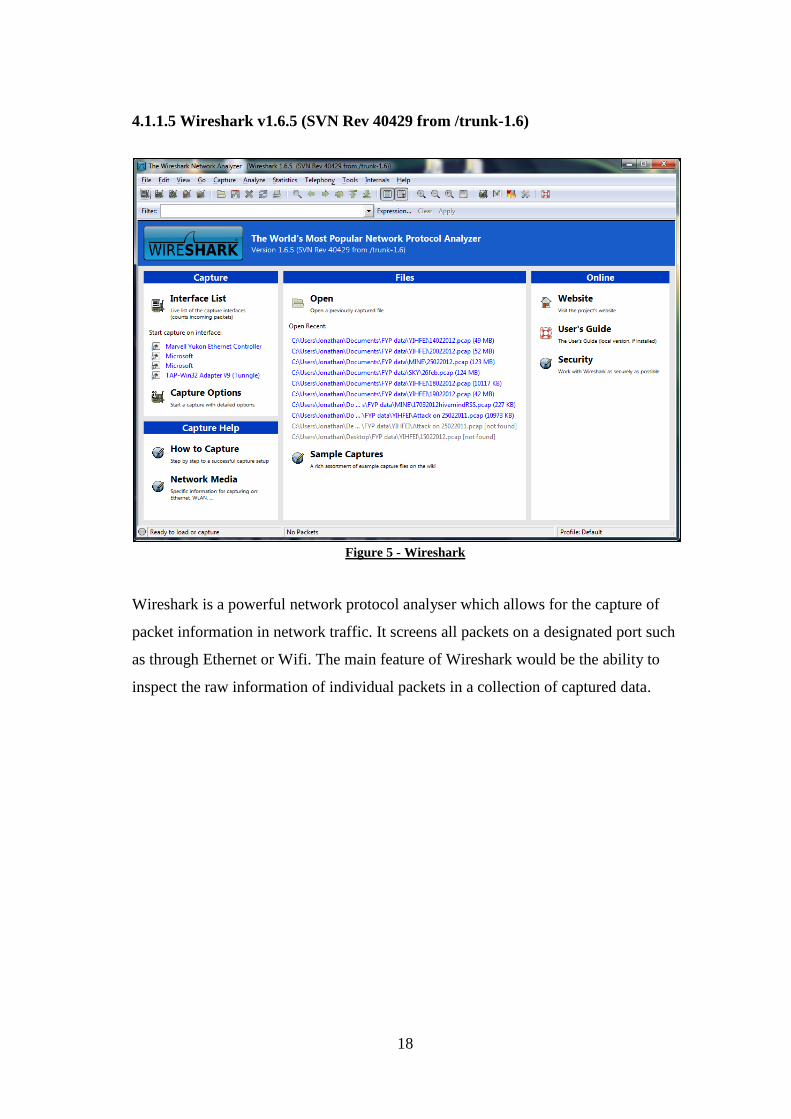
4.1.1.5 Wireshark v1.6.5 (SVN Rev 40429 from /trunk-1.6)
Figure 5 - Wireshark
Wireshark is a powerful network protocol analyser which allows for the capture of
packet information in network traffic. It screens all packets on a designated port such
as through Ethernet or Wifi. The main feature of Wireshark would be the ability to
inspect the raw information of individual packets in a collection of captured data.

19
4.1.1.6 Sawmill Enterprise v8.5.5
Figure 6 – Sawmill Enterprise
Sawmill is a web-based hierarchical log analysis tool that is able to process almost
any type of log data. It displays reports of statistics and graphs through records saved
into its database. It also allows dynamic segmentation of the reports through its
advanced filtering capabilities.

20
4.1.1.7 NetWitness Investigator v9.0.5.4
Figure 7 – NetWitness Investigator
NetWitness Investigator is a threat analysis tool that provides an accurate analysis of
raw captured network data. It has the ability to parse packets by using a lexicon of
words, verbs and adjectives.
4.1.1.8 WinDump
Figure 8 - WinDump
WinDump is the Windows version of tcpdump, a command line network analyzer for
UNIX. It captures information using the WinPcap library and drivers. WinDump can
also inspect and diagnose network traffic according to various complex rules.

21
4.1.2 Experiment Set-Up
The figure below shows the configuration of the various hardware components used.
Figure 9 – Experiment Set-Up
A few workstations would be conducting an attack through Hive Mind LOIC on an
online server. Wireshark will be installed on all workstations as well as on the server
to capture the flow of network traffic to and from the workstations. These logs will
then be parsed using NetWitness, and Sawmill through WinDump, to see if there are
any suspicious indicators while LOIC relies on the IRC or Twitter RSS feeds for
commands.

22
4.1.3 Experiment Steps and Details
This section explains the detailed steps as to how the experiment was carried out.
1. XAMPP is set up and both Apache and MySQL is running.
2. Static IP address is created.
3. No-IP account created and DNS Update Client is started to ensure that
the server is accessible online.
4. Wireshark is installed on all workstations to start capturing data.
5. An mIRC channel is set up and the following sample command is
used to start the attack.
6. Similarly, we use the same command through Twitter’s RSS feeds.
7. Once a sufficient amount of data is logged, we stop the capturing and
pass it through Sawmill and NetWitness Investigator to detect whether
there are any anomalies.
!lazor targetip=127.0.0.1 message=test_test port=80 method=tcp wait=false random=true
start

23
4.1.4 Experiment Results
The following shows no obvious alerts when the logs are parsed using Sawmill and
NetWitness Investigator. Screenshots of the results are taken and displayed below.
Figures 10 and 11 show the logs that are parsed through NetWitness Investigator for
the IRC and Twitter-based DDoS attacks.
Figure 10 – NetWitness Investigator log of IRC-commanded LOIC
24
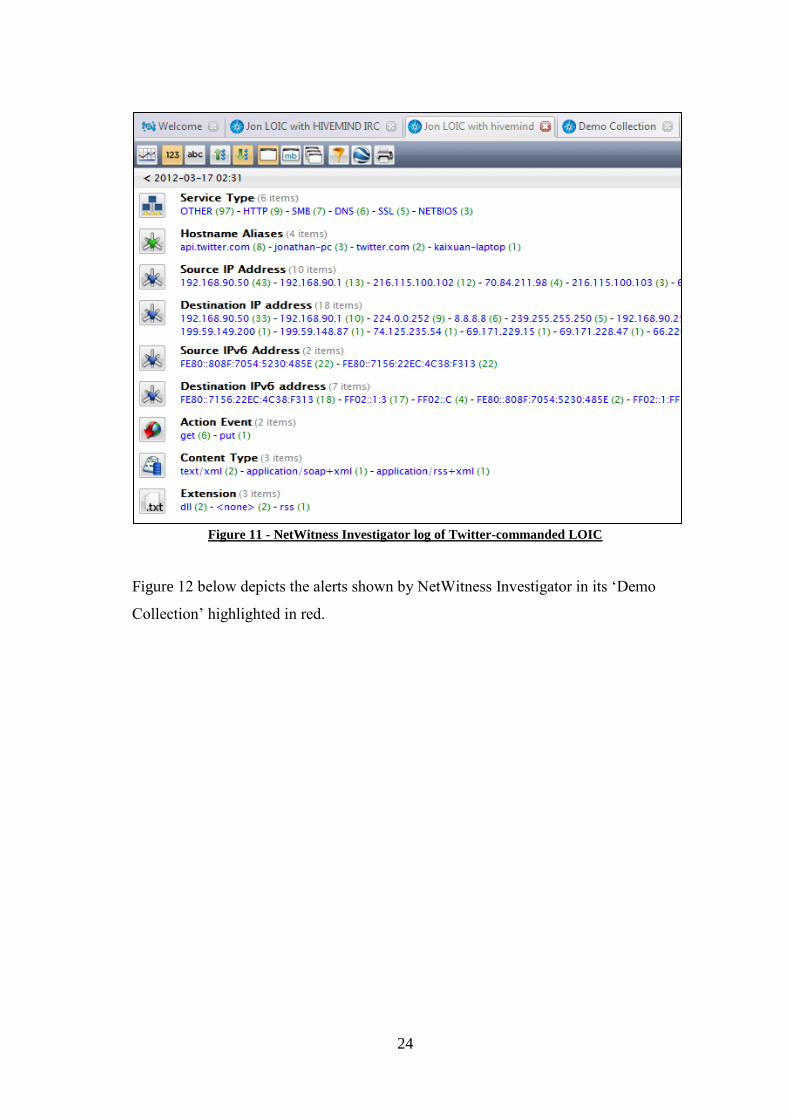
Figure 11 - NetWitness Investigator log of Twitter-commanded LOIC
Figure 12 below depicts the alerts shown by NetWitness Investigator in its ‘Demo
Collection’ highlighted in red.

25
Figure 12 - NetWitness Investigator demo collection showing ‘Alerts’
Screenshots from Sawmill and Wireshark are not posted as the results do not differ
much in the statistics of the reports generated from logs of normal traffic.
4.1.5 Experiment Discussion
The results from section 4.1.4 give us a sample idea that not all communication
between the C&C server and the actual bot dishing the DDoS attacks can be easily
sieved out. Currently, LOIC’s method of extracting understandable instructions can
easily be replicated in any other applications such as a basic RSS reader.
Furthermore, the underlying medium connecting these zombie computers may not
simply be the case of a network stress testing tool that was voluntarily engaged by
the user- malware may infect unknowing users and turning their machines into
slaves. Directives for different malware will definitely be poles apart and we cannot

26
expect to search for common answers in random ports or information in packets
associated with this connection.
There are many other solutions that are currently available in the industry that might
help in seeking out these IP addresses. Network tracing is one good manual
resolution. However, we do not seek to reinvent the wheel, but rather derive
alternative solutions to a similar problem from a dissimilar angle.
Therefore, we propose to analyse the traffic from an internal swarm node to an
external network – not the communication as before, but rather the quantity of data
sent.

27
4.2 Network Bandwidth Analysis
In this approach, we no longer tackle this subject through the offensive perspective
of counterattacking and the like. Instead, we seek out solutions to prevent bandwidth
drain in both internal and external networks in these two possible scenarios.
Firstly, the internal node is compromised and it spams the internal network with
requests. This might be the more precarious situation as the malware might be spread
through the swarm network or directly through flash drives by unsuspecting
consumers of a node’s services within the same geographical location.
Secondly, similar to the first in terms of a compromised internal node, but just that it
would be flooding external networks instead. As the internal swarm layer utilizes a
fast-flux technology to mitigate traffic, external networks that detect an attack from
our internal node might try to ban its IP address, which might lead to a ban of
multiple IPs assuming the fast-flux works for outgoing traffic as well.
In an actual situation, we propose the analysis of network logs captured by the
network administrator or Internet service provider to compare against a log of
nominal traffic flow with a reasonable threshold of 250% to determine if the
bandwidth exceeds the expected normal flow. However, we simulate this with the
same set up and logs as in section 4.1.2.
4.2.1 Analysis Approach and Design
We utilize Java as our platform choice as it is portable, powerful and that it has a
well-designed set of APIs, coupled with sophisticated just-in-time compilers.
Three different methods have been brainstormed, which would enable the detection
of the presence of an anomalously large traffic.

28
4.2.1.1 Tracing Analysis
The first method thought out was to parse the log files using a different algorithm
and to trace suspicious packets streams to verify the intent and the cause of heavy
traffic when it occurs. On the other hand, as stated previously in section 4.1.5 that
tracing, in itself, is largely manual in nature since it would be tough to program for
all significantly different case scenarios. Therefore we come to consider the second
method.
4.2.1.2 Statistical Analysis
In terms of statistics, the closest distribution would be the Chi-Square distribution
with its Goodness-of-Fit test. Initially the Chi-Square test was implemented in the
program when the frequencies of packets at regular intervals where averaged and
classified into different ranges according to the values in the nominal traffic. This
was to assist in deriving the observed and expected values. However, structural
zeros, cells in the contingency table in which observations can never occur, are
present in the table due to the way it was constructed. Thus, we come to our final
choice.
4.2.1.3 Graphical Analysis
The initial idea was to rely on the use of weights for different ranges of frequencies
but given a large datafile of 10000 seconds and the attack takes 3 minutes, the
significance of the 3 minutes is only 1.8%, which will be rather unfeasible.
The next idea was to find the difference in total area under the current and nominal
data graphs with a threshold difference from the nominal graph. The areas will be
normalized such that both graphs are set to the same reference points before
comparison.
29
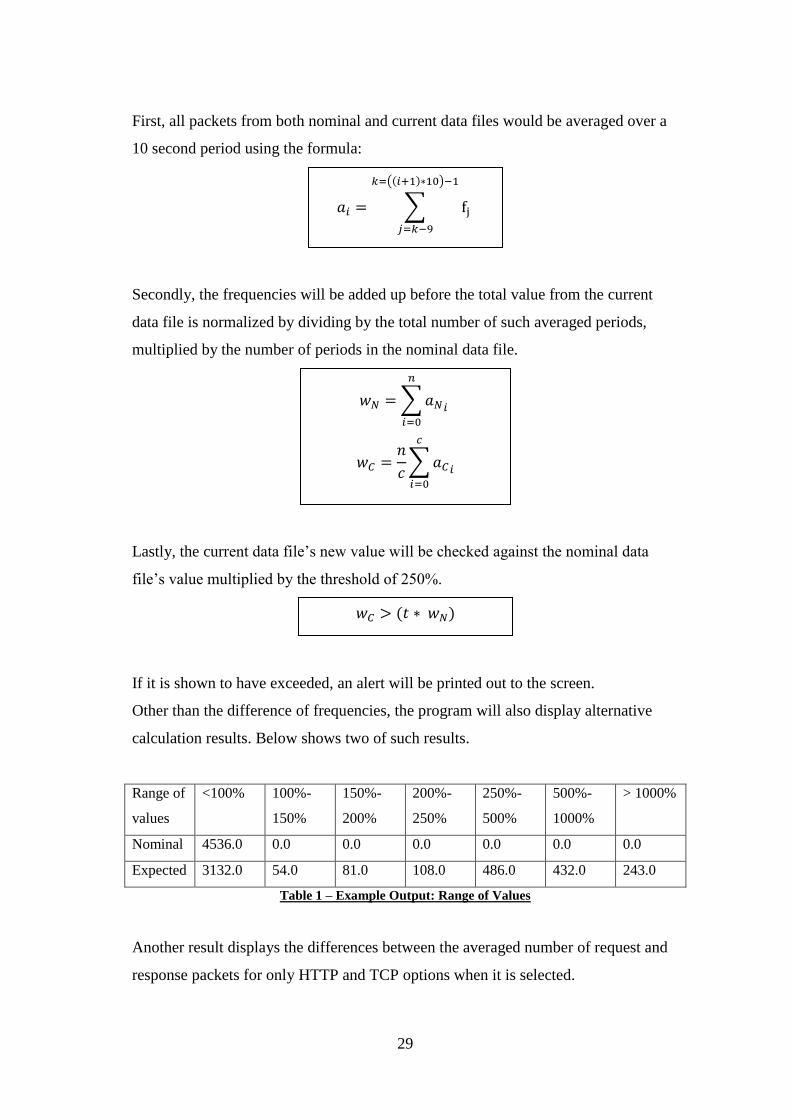
First, all packets from both nominal and current data files would be averaged over a
10 second period using the formula:
Secondly, the frequencies will be added up before the total value from the current
data file is normalized by dividing by the total number of such averaged periods,
multiplied by the number of periods in the nominal data file.
Lastly, the current data file’s new value will be checked against the nominal data
file’s value multiplied by the threshold of 250%.
If it is shown to have exceeded, an alert will be printed out to the screen.
Other than the difference of frequencies, the program will also display alternative
calculation results. Below shows two of such results.
Range of
values
<100% 100%-
150%
150%-
200%
200%-
250%
250%-
500%
500%-
1000%
> 1000%
Nominal 4536.0 0.0 0.0 0.0 0.0 0.0 0.0
Expected 3132.0 54.0 81.0 108.0 486.0 432.0 243.0
Table 1 – Example Output: Range of Values
Another result displays the differences between the averaged number of request and
response packets for only HTTP and TCP options when it is selected.

30
Nominal 5.5 2.5 0.3 0.7 2.4 5.4 0.3 0.4 0.3 4.8 0.9
Current 12.1 2.3 3.4 3.1 8.9 5.2 6.9 2.0 2.9 2.7 6.2
Table 2 – Example Output: Difference in request and response packets
This helps the user of the program to interpret the data from a different angle, as well
as to support the claim that a possible attack sequence is present.

31
4.3 Main Implementation
This section touches on the methodology of how a log file is filtered and passed into
the program in order to derive a conclusion with substantial probability.
4.3.1 Wireshark Filters
Wireshark's most powerful feature is its vast array of display filters. It allows for one
to drill down to the exact traffic that one would like to see. It forms the basis of many
of Wireshark's other features such as the coloring rules. We shall employ these
display filters in our methodology.
Before we commence on searching for the preferred filter, it is imperative to first
recognise the necessity of the filters and the main intent of employing them.
One of the most significant features of a DDoS bot’s traffic would be that it would
always try to create as many connections as possible within a short time, in order to
bring down the serviceability of a website or server. Thus, with this knowledge, we
make use of Wireshark’s filters to pinpoint on request packets that are sent by the
node.
The following sections explain on the use different filters used for each type of
flooding.
4.3.1.1 HTTP flood
A HTTP flood attack sends as many requests as possible without waiting for
acknowledgement or port assignment responses. This provides the potential to take
down any single server from any reasonably fast system with a decent connection
simply by running the server out of available response ports, roughly around 64
thousands of them per Ethernet port before the 90 second connection timeouts occur.

32
Although this would not be as effective on most cloud servers, it could take down a
small Intranet or privately hosted site entirely.
Therefore, we make use of the following filters to sieve out packets from and to the
node.
HTTP GET Request
HTTP Response
The IP address filter ‘192.168.0.0/16’ signifies a wildcard filter of a total of 16 bits
where the ‘zero’ value is.
4.3.1.2 SYN flood
Detecting SYN Flood attacks is usually rather easy - if there are countlesss packets
coming in with the SYN flag set in a very short time frame, from either one single IP
or multiple from around the world, it would indicate the occurrence of an attack.
Typically those attacks try to flood servers with a rapid series of SYN packets
without ever reacting to the resulting SYN/ACK.
SYN/ACK
SYN
(tcp.flags.syn == 1 and tcp.flags.ack == 0 and ip.src == 192.168.0.0/16)
(tcp.flags.syn == 1 and tcp.flags.ack == 1 and ip.dst == 192.168.0.0/16)
(ip.dst== 192.168.0.0/16 and http.response)
(ip.src == 192.168.0.0/16 and http.request)

33
4.3.1.3 UDP flood
UDP is a connectionless protocol and it does not require any connection setup
procedure to transfer data. A UDP flood occurs when an attacker sends a UDP
packet to a random port on the victim system. When the victim system receives a
UDP packet, it will determine what application is waiting on the destination port.
When it realizes that there is no application that is waiting on the port, it generates an
ICMP packet of destination unreachable to the forged source address. If enough
UDP packets are delivered to ports on the victim, the system will go down.
UDP
4.3.1.4 ICMP flood
ICMP flood attack is also known as a ping attack. It is where large ICMP ping
packets are sent to the server repeatedly so that the server will not have time to
respond to other servers.
ICMP
4.3.1.5 Using Wireshark
This section lists the steps of utilizing Wireshark in aid in the parsing of log files.
1. After a log has been captured, we can navigate to the IO Graphs function as
seen in Figure 13.
(icmp)
(udp)

34
Figure 13 – Wireshark > Statistics > IO Graphs
2. From here, we can input the various filters from sections 4.3.1.1 through
4.3.1.4, or no filter at all to compare the raw traffic. However, only up to 5
graphs can be defined, as depicted in Figure 14.
Figure 14 – Wireshark IO Graphs

35
3. Note that the various filters have to be in order, such as HTTP and TCP
where the ‘HTTP GET Request’ filter has to be directly before the ‘HTTP
Response’ filter.
4. After loading all the graphs, click on ‘Copy’.
5. Open a ‘New Text Document’ and paste the values into the Notepad (or text
editor of choice).
6. Save the document as a “.csv” file.
7. Repeat for both current and nominal files.
4.3.2 Outflow.java
Outflow.java and Calc.java, its corresponding calculation class, were created to help
in the parsing of these Wireshark logs. It follows the logic as mentioned in section
4.2.1.3. This section describes the methods and input and output parameters.
4.3.2.1 Outflow.java Input Parameters
Figure 15 below shows the usage of Outflow.
Figure 15 – Outflow.java in use
The input command to execute Outflow.java is as follows:
java Outflow “nominal.csv” “current.csv” “outputfile” (-h) (-t) (-r) (-u) (-i)

36
The table below shows the arguments as well as what they signify:
Arg Explanation
-h HTTP GET Requests and HTTP Response packets
-t TCP SYN and TCP SYN/ACK packets
-r Raw (unfiltered) packets
-u UDP packets
-i ICMP packets
Table 3 – Outflow.java Available Arguments
The options in the brackets are only limited to 3 per execution - the reason being that
Wireshark only allows for the definition of 5 graphs, for which HTTP and TCP
already require 2 graphs each for comparison.

37
4.3.2.2 Outflow.java Methods
Below shows the main method of Outflow.java.
The main method was created to take in arguments from the command prompt and
check if the arguments are valid before storing the arguments into variables.
The arguments are passed into the file read in method to create 2 arrays to store the
values. Calc objects are created to store the relevant information of each test (http,
tcp, udp, icmp).

38
For the corresponding Calc.java, it handles all the calculations of the values that are
passed in. Such methods include calculating the average values in periods of 10
seconds, classifying data into different ranges and finding the weightage of both
current and nominal data before comparing the two based on a given threshold of
250%.

39
Other methods not included here are the file input and output methods in
Outflow.java, as well as the ‘get’ methods in Calc.java. The rest of the source code
will be included in the Appendix.

40
4.3.2.3 Outflow.java Output
Figure 15 in section 4.3.2.1 shows the printed output of Outflow.java in addition to
its usage in the command prompt.
Figure 16 – Outflow.java Output

41
4.3.3 Testing
Numerous exception catching and checks have been put in place in the program. This
portion will seek to address any such flaws that may occur within the execution. We
define the following input parameter as the optimal input in the command line:
The following attempts have been made to see if there was any failed catching of
exceptions:
1) FileNotFound Exception
2) ArrayIndexOutOfBounds Exception
3) Invalid Arguments
4.3.3.1 FileNotFound Exception
In the input parameters, we produce the following output in Figure 17 by changing
the name of the input file. This indicates that the exception has been caught.
Figure 17 – FileNotFound Exception
4.3.3.2 ArrayIndexOutOfBounds Exception
Now, we try to change the values in the read in files to see if any exceptions are
caught.
Figure 18 – ArrayIndexOutOfBounds Exception
java Outflow nom.csv cur.csv out.txt -h -t -u

42
4.3.3.3 Invalid Arguments
Instead of the optimal input, we added extra arguments and lessened arguments in
which all of them have been mitigated.
Figure 19 - Invalid Arguments
Thus, we conclude that our testing is complete and that there are no human coding
errors.

43
5. RESULTS
Filename Tested Against
Actual Status Type
Time captured
Max Avg
Nominal Weight
Current Weight
Attack Prob.
False Positive
?
150212 140212 Normal
HTTP Get
34000
16.3 540.2 881.94 N.A. No
HTTP Response 16.5
TCP SYN 6.8 143 383.74 26.84 Yes
TCP SYN/ACK 6.8
UDP 15.3 3840.77 5223.23 N.A. No
250212 140212 Victim
of attack
HTTP Get
17004
11.7 540.2 348.8 N.A. No
HTTP Response 12
TCP SYN 12.1 143 325.11 N.A. No
TCP SYN/ACK 11
UDP 15.7 3840.77 1193.75 N.A. Not sure
260212 140212 Victim
of attack
HTTP Get
17713
19.4 540.2 3093.77 57.27 Yes
HTTP Response 18.6
TCP SYN 12.6 143 2743.18 191.83 Yes
TCP SYN/ACK 12.3
UDP 284.4 3840.77 61162.5
5 159.25 Not sure
17032012hivemindR
SS 140212
Failed Attacker
HTTP Get
122
0.4 540.2 422.58 57.27 No
HTTP Response 0.9
TCP SYN 0.4 143 528.23 36.94 No
TCP SYN/ACK 0.4
UDP 6.5 3840.77 7923.46 N.A. No
20032012hivemindR
SS 140212
Failed Attacker
HTTP Get
32
0 540.2 0 N.A. No
HTTP Response 0
TCP SYN 0.1 143 114.45 N.A. No
TCP SYN/ACK 0.1
UDP 0.6 3840.77 686.7 N.A. No
The program has successfully achieved a 73.33% accuracy thus far from a total of 6
files with normal traffic and 0 files that are malicious in nature. This proves that the
logic behind the program is significant and could be considered as a possible solution
to be employed and recommended in thwarting internal machines from inflicting
digital harm to external networks.

44
6. DISCUSSION
In this chapter, we discuss the results as well as a few limitations that are relevant to
the model that we have proposed.
6.1 Observed Results
While the initial estimate for the accuracy of our program to be in the range of 80%
to 98%, results taken from 6 files from multiple computers showed 73.33% accuracy.
This could largely be due to the small sample size that enabled it to obtain a low
score. In order to fully test the capabilities of Outflow.java, real data of at least a 100
files would be sufficient. Since this experiment was merely a simulation, it followed
as closely as possible to obtain a normal traffic flow similar to real world data.
This could imply that the traits used to identify such outgoing threats could be much
of a consideration for employment in the industry.
6.2 Design Limitations
Even though we believe that the model that we have recommended is appropriate and
effective in botnet attacks, there are still certain areas that could be looked into to
improve its efficiency or its logic. We expound on three limitations below.
6.2.1 Assumptions
The first and most important assumption that we have to make is that a node within
the swarm layer is compromised and has been infected with malware that allows it to
be part of the zombie network.
The second assumption that we make is that we assume the nominal flow is perfect.
Or even before that, what constitutes as a good nominal flow? If this question is not
answered, it is tough to define a perfect flow or even attain it. Furthermore, the

45
traffic flow rates might change with time and events, and new nominal flows have to
be calculated if needed.
6.2.2 Response time
One big con in this model is that the network administrator has to manually operate
the capturing of the packets of different nodes through Wireshark, later to be parsed
individually through the program that has been created. It is tedious and results in a
great bottleneck at the log capture portion instead of the analysis portion.
In addition, using such statistical or graphical analysis requires that data has to be
first collected before any form of computation can be carried out. This implies that
when threats or anomalies do occur, their presence will be made known only when
logs of the nodes are examined. This lowers the response time greatly.
6.2.3 Logic Limitations
Having an irregular sample size for analysis means that complex logics and
algorithms are required in order to deal with such cases. Given a standardised capture
time size, it would improve the efficiency by incorporating intricate algorithms that
are better fitting and produce more accurate results.
‘Pulsing’ zombies are compromised computers that are instructed to launch
intermittent and short-lived spamming of victims with the intent of merely slowing it
rather than crashing it. This type of attack, referred to as "degradation-of-service"
rather than "denial-of-service", can be more difficult to detect than regular zombie
invasions and can disrupt and hamper connection to websites for prolonged periods
of time, potentially causing more disruption than concentrated floods. Exposure of
degradation-of-service attacks is complicated further by the matter of discerning
whether the attacks really are attacks, or just healthy increases in website traffic.

46
With the threshold of the program set at 250%, we may not be able to accurately
detect such a small-scale attack. Nonetheless, given that we are employing the use of
swarm networks as the base of our model, mitigation of 250% of normal traffic
would not put much of a dent in the serviceability of the network.

47
7. CONCLUSION
In this paper, we presented an effective DoS detection technique. A simulation
experiment with 19 sample traffic files was carried out to test the effectiveness of the
program. The proposed algorithm searches for abnormality in the frequency of
network packets sent and received. The compromised node is analysed by
highlighting certain known facts in HTTP, TCP, UDP and ICMP floods such as the
multiple requests for connection without reacting much to the response given. The
program calculates the difference through the averages of the frequencies of packet
occurences after Wireshark is used to filter the said packets. The program analyses
these information and produces a result with certain probability that it is accurate.
Additional data was produced that could help the user in the support of the argument.
Results have shown that such threats from internal to external machines can be easily
identified using the said algorithm.

48
8. RECOMMENDATIONS
This program and model as a whole would be suitable for consumers to adopt. The
efficiency could be improved by creating a GUI for the program, analysing in
batches, or even using a script such as Tshark to automate both the Wireshark
filtering as well as analysis.
Possible ways to include backscatter analysis and Chi-Square analysis into the
program and model could be looked into as potential methods to detect and halt
attacks in their tracks.

49
REFERENCES
[1] ‘4chan Users Crash MPAA Website in Pro-Piracy Protest’. [Online].
Available: http://mashable.com/2010/09/18/4chan-mpaa-ddos-attack/. [Accessed:
29-Mar-2012].
[2] ‘Anonymous retaliates for LulzSec arrests, hacks Panda Security website |
Fox News’. [Online]. Available:
http://www.foxnews.com/scitech/2012/03/07/anonymous-retaliates-for-lulzsec-
arrests-hacks-panda-security-website/. [Accessed: 29-Mar-2012].
[3] ‘Anonymous takes down Vatican website • The Register’. [Online].
Available: http://www.theregister.co.uk/2012/03/08/anonymous_italy_hit_vatican/.
[Accessed: 29-Mar-2012].
[4] ‘Anonymous, WikiLeaks team up | News.com.au’. [Online]. Available:
http://www.news.com.au/breaking-news/anonymous-wikileaks-team-up/story-
e6frfku0-1226283931894. [Accessed: 29-Mar-2012].
[5] ‘LOIC: The Tool Anonymous Is Using to Essentially Turn You Into a
Botnet’. [Online]. Available: http://gizmodo.com/5877719/heres-the-tool-
anonymous-is-tricking-the-internet-into-using. [Accessed: 29-Mar-2012].
[6] Forrester Consulting, DDoS: A Threat You Can't A_ord To Ignore, 2009,
available_at http://verisigninc.com/assets/whitepaper-ddos-threat-forrester.pdf
[7] Roland Kwitt, A Statistical Anomaly Detection Approach for Detecting Network
Attacks.PDF, 2004,available at http://www.6qm.net/workshop/slides/6qm.PDF
[8] F. Y. Leu and I. L. Lin, ‘A DoS/DDoS Attack Detection System Using Chi-
Square Statistic Approach’.
[9] L. Feinstein, D. Schnackenberg, R. Balupari, and D. Kindred, ‘Statistical
approaches to DDoS attack detection and response’, in DARPA Information
Survivability Conference and Exposition, 2003. Proceedings, 2003, vol. 1, pp. 303–
314.
[10] S. Jin and D. S. Yeung, ‘A covariance analysis model for DDoS attack
detection’, in Communications, 2004 IEEE International Conference on, 2004, vol.
4, pp. 1882–1886.
[11] R. Lua and K. C. Yow, ‘Mitigating DDoS Attacks with Transparent and
Intelligent Fast-Flux Swarm Network’. [Online]. Available:
http://dl.comsoc.org/livepubs/ni/public/2011/jul/lua.html. [Accessed: 29-Mar-2012].
[12] ‘The hacktivist threat: Brazilian bank sites continue to fall victim to DDoS
attacks | Security Bistro’. [Online]. Available:
http://www.securitybistro.com/blog/?p=975. [Accessed: 29-Mar-2012].
[13] ‘Attacks by “Anonymous” WikiLeaks Proponents not Anonymous -
UTpublications’. [Online]. Available: http://doc.utwente.nl/75331/. [Accessed: 29-
Mar-2012].
[14] ‘LOIC DDoS Analysis and Detection - SpiderLabs Anterior’. [Online].
Available: http://blog.spiderlabs.com/2011/01/loic-ddos-analysis-and-detection.html.
[Accessed: 29-Mar-2012].
[15] ‘DDoS attacks in H2 2011 - Securelist’. [Online]. Available:
http://www.securelist.com/en/analysis/204792221/DDoS_attacks_in_H2_2011.
[Accessed: 29-Mar-2012].

50
APPENDIX
1. PROGRAM SOURCE CODE
1.1 Outflow.java
import java.io.*;
import java.util.*;
import java.lang.*;
public class Outflow
{
/*Initialize all the variables*/
private static String nominalfile;
private static String currentfile;
private static String outputfile;
private static String nominalBank[][];
private static String currentBank[][];
private static Calc analysisTable[];
private static long startTime, endTime;
private static String type[] = new String [3];
private static int fileCol;
private static String choice;
public static void main(String[] args) throws IOException
{
try
{
fileCol=1;
/*Ensure that there is at least 4 and at most 6 parameters*/
if((args.length >= 4) && (args.length <= 6))
{
nominalfile = args[0];
currentfile = args[1];
outputfile = args[2];
for(int arg = 3; arg < args.length; arg++)
{
if (args[arg].equals("-h") || args[arg].equals("-t") ||
args[arg].equals("-u") || args[arg].equals("-i") || args[arg].equals("-r"))

51
type[arg-3]=args[arg];
else
{
System.out.println("Invalid Argument "+args[arg]);
System.exit(0);
}
}
}
else
{
System.out.println("Invalid Argument...");
System.exit(0);
}
/*Start the time taken for the process*/
startTime = System.nanoTime();
/*Read in the test data and the train data*/
fileReadIn(nominalfile, currentfile);
/*check if file read in is equivalent to number of choices*/
if((nominalBank[0].length-1)<(args.length-
3)||(currentBank[0].length-1)<(args.length-3))
{
System.out.println("Insufficient data...");
System.exit(0);
}
analysisTable = new Calc[type.length];
for(int i = 3; i <args.length; i++)
{
choice = args[i];
Calc cal = new Calc(nominalBank, currentBank, choice,
fileCol);
analysisTable[i-3]=cal;
if (args[i].equals("-h") ||args[i].equals("-t"))
fileCol+=2;
else //If choice is "-u", "-i" or "-r"
fileCol+=1;
}

52
/*Create output file*/
BufferedWriter outfile = new BufferedWriter(new FileWriter(new
File( outputfile )));
outfile.write("=============================================================
=====================");
outfile.newLine();
outfile.write("Detection of Botnets in Network Traffic
Outflow");
outfile.newLine();
outfile.write("=============================================================
=====================");
outfile.newLine();
outfile.write("Capture details of Nominal Packet file:");
outfile.newLine();
outfile.write("Total Time Captured = "+(nominalBank.length-1));
outfile.newLine();
outfile.write("Number of 10 second periods = " +
analysisTable[0].getNomNumPeriod());
outfile.newLine();
outfile.newLine();
outfile.write("Capture details of Current Packet file:");
outfile.newLine();
outfile.write("Total Time Captured = "+(currentBank.length-1));
outfile.newLine();
outfile.write("Number of 10 second periods = " +
analysisTable[0].getCurNumPeriod());
outfile.newLine();
outfile.newLine();
outfile.newLine();
for(int i=0; i< analysisTable.length; i++)
{
outfile.write("----------------------------------------------
------------------------------------");
outfile.newLine();
if ((analysisTable[i].getChoice()).equals("-h"))

53
outfile.write("Comparison of HTTP Get Requests and HTTP
Response packets");
else if ((analysisTable[i].getChoice()).equals("-t"))
outfile.write("Comparison of TCP SYN and TCP SYN/ACK
packets");
else if ((analysisTable[i].getChoice()).equals("-u"))
outfile.write("Comparison of UDP packets");
else if ((analysisTable[i].getChoice()).equals("-i"))
outfile.write("Comparison of ICMP packets");
else if ((analysisTable[i].getChoice()).equals("-r"))
outfile.write("Comparison of raw packets");
outfile.newLine();
outfile.write("----------------------------------------------
------------------------------------");
outfile.newLine();
outfile.newLine();
/*
outfile.write("average of nominal Data: ");
outfile.newLine();
for(int row = 0; row < analysisTable[0].getNomData().length;
row++)
{
for(int col = 0; col <
analysisTable[0].getNomData()[0].length; col++)
{
outfile.write(analysisTable[0].getNomData()[row][col]+"
");
}
outfile.newLine();
}
*/
outfile.write("Peak average values: ");
outfile.newLine();
outfile.write("Nominal file: ");
outfile.newLine();
if ((analysisTable[i].getChoice()).equals("-h"))
outfile.write("HTTP Get Requests HTTP Response
packets");

54
else if ((analysisTable[i].getChoice()).equals("-t"))
outfile.write("TCP SYN TCP SYN/ACK");
else if ((analysisTable[i].getChoice()).equals("-u"))
outfile.write("UDP");
else if ((analysisTable[i].getChoice()).equals("-i"))
outfile.write("ICMP");
else if ((analysisTable[i].getChoice()).equals("-r"))
outfile.write("Raw");
outfile.newLine();
for(int row = 0; row <
(analysisTable[i].getNomMaxAvg()).length; row++)
outfile.write(analysisTable[i].getNomMaxAvg()[row]+"
");
outfile.newLine();
outfile.newLine();
outfile.write("Current file: ");
outfile.newLine();
if ((analysisTable[i].getChoice()).equals("-h"))
outfile.write("HTTP Get Requests HTTP Response
packets");
else if ((analysisTable[i].getChoice()).equals("-t"))
outfile.write("TCP SYN TCP SYN/ACK");
else if ((analysisTable[i].getChoice()).equals("-u"))
outfile.write("UDP");
else if ((analysisTable[i].getChoice()).equals("-i"))
outfile.write("ICMP");
else if ((analysisTable[i].getChoice()).equals("-r"))
outfile.write("Raw");
outfile.newLine();
for(int row = 0; row <
(analysisTable[i].getCurMaxAvg()).length; row++)
outfile.write(analysisTable[i].getCurMaxAvg()[row]+"
");
outfile.newLine();
outfile.newLine();
if ((analysisTable[i].getChoice()).equals("-h") ||
(analysisTable[i].getChoice()).equals("-t"))
{
outfile.write("Difference in request and response

55
packets");
outfile.newLine();
outfile.write("Nominal: ");
for(int j=0; j<analysisTable[i].getNomDiff().length; j++)
outfile.write(analysisTable[i].getNomDiff()[j]+" ");
outfile.newLine();
outfile.write("Current: ");
for(int j=0; j<analysisTable[i].getCurDiff().length; j++)
outfile.write(analysisTable[i].getCurDiff()[j]+" ");
outfile.newLine();
outfile.newLine();
outfile.newLine();
}
outfile.write("Normalized frequency proportional to nominal
file");
outfile.newLine();
outfile.write("Range classes:");
outfile.newLine();
outfile.write(" <=100%, 100%-150%, 150%-200%, 200%-
250%, 250%-500%, 500%-1000%, >1000%");
outfile.newLine();
outfile.write("Nominal: ");
for(int
col=0;col<analysisTable[i].getRange()[0].length;col++)
outfile.write(analysisTable[i].getRange()[0][col]+" ");
outfile.newLine();
outfile.write("Current: ");
for(int
col=0;col<analysisTable[i].getRange()[1].length;col++)
outfile.write(analysisTable[i].getRange()[1][col]+" ");
outfile.newLine();
outfile.newLine();
outfile.newLine();
outfile.write("Weight of Nominal Data = " +
analysisTable[i].getWeightage()[0]);
outfile.newLine();
outfile.write("Weight of Current Data = " +

56
analysisTable[i].getWeightage()[1]);
outfile.newLine();
outfile.write("Threshold = " +
(analysisTable[i].getThreshold()*100)+"%");
outfile.newLine();
if
(analysisTable[i].getWeightage()[1]>(analysisTable[i].getWeightage()[0]*anal
ysisTable[i].getThreshold()))
outfile.write("Possible attack sequence detected with
probability of " + analysisTable[i].getProbability()+"%" );
outfile.newLine();
outfile.newLine();
outfile.newLine();
}
System.out.println("Output file saved to: "+outputfile);
outfile.close();
}
catch (FileNotFoundException e)
{
System.err.println("FileNotFoundException: " +
e.getMessage());
}
catch (IOException e)
{
System.err.println( "IOException: " + e.getMessage());
}
/*print out duration of the process*/
endTime = System.nanoTime();
System.out.println("Duration: " + ((endTime - startTime))/1000000
+" msec");
}//end main()
/*Read in the nominal and current data*/
public static void fileReadIn(String nomFileName, String
curFileName)throws IOException
{
try
{
String line;
int nomRowCount = 0;

57
int nomColCount = 0;
int curRowCount = 0;
int curColCount = 0;
int nomRow = 0, nomCol = 0, curRow = 0, curCol = 0;
/*Count number of lines*/
BufferedReader nominalfile = new BufferedReader (new
FileReader(nomFileName));
while ( (line = nominalfile.readLine()) != null )
{
nomRowCount++;
if (nomRowCount == 1)
{
StringTokenizer nomRowTokenizer = new
StringTokenizer(line, ",");
nomColCount=nomRowTokenizer.countTokens();
}
}
nominalfile.close();
/*Initialise nominalBank*/
nominalBank = new String[nomRowCount][nomColCount];
for(int row = 0; row < nominalBank.length; row++)
{
for(int col = 0; col < nominalBank[row].length; col++)
nominalBank[row][col] = "0";
}
/*Read in the nominal data*/
BufferedReader nominalfile2 = new BufferedReader (new
FileReader(nomFileName));
while (nominalfile2.ready())
{
line = nominalfile2.readLine();
StringTokenizer nomRowTokenizer = new StringTokenizer(line,
",");
/*first token is time label*/
nominalBank[nomRow][nomCol++] = nomRowTokenizer.nextToken();
while(nomRowTokenizer.hasMoreTokens())
{
StringTokenizer nomColTokenizer = new

58
StringTokenizer(nomRowTokenizer.nextToken(),"\"");
nominalBank[nomRow][nomCol++] =
nomColTokenizer.nextToken();
}
nomRow++;
nomCol = 0;
}
nominalfile2.close();
/*Count number of lines in current file*/
BufferedReader currentfile = new BufferedReader (new
FileReader(curFileName));
while ( (line = currentfile.readLine()) != null )
{
curRowCount++;
if (curRowCount == 1)
{
StringTokenizer curRowTokenizer = new
StringTokenizer(line, ",");
curColCount=curRowTokenizer.countTokens();
}
}
currentfile.close();
/*Initialise currentBank*/
currentBank = new String[curRowCount][curColCount];
for(int row = 0; row < currentBank.length; row++)
{
for(int col = 0; col < currentBank[row].length; col++)
currentBank[row][col] = "0";
}
/*Read in the current data*/
BufferedReader currentfile2 = new BufferedReader (new
FileReader(curFileName));
while (currentfile2.ready())
{
line = currentfile2.readLine();
StringTokenizer curRowTokenizer = new StringTokenizer(line,
",");
59
/*first token is time label*/
currentBank[curRow][curCol++] = curRowTokenizer.nextToken();
while(curRowTokenizer.hasMoreTokens())
{
StringTokenizer curColTokenizer = new
StringTokenizer(curRowTokenizer.nextToken(),"\"");
currentBank[curRow][curCol++] =
curColTokenizer.nextToken();
}
curRow++;
curCol = 0;
}
currentfile2.close();
}
catch (ArrayIndexOutOfBoundsException e)
{
System.err.println("Caught ArrayIndexOutOfBoundsException: "
+ e.getMessage());
System.exit(0);
}
}//end fileReadIn()
}

60
1.2 Calc.java
import java.io.*;
import java.lang.Math.*;
public class Calc
{
private String[][] nomData;
private String[][] curData;
private double[] nomMaxAvg;
private double[] curMaxAvg;
private double[] nomDiff;
private double[] curDiff;
private int nomNumPeriod;
private int curNumPeriod;
private String choice;
private double[][] range;
private double mean;
private double[] weightage;
private double threshold;
private double probability;
public Calc(String nominal[][], String current[][], String choice, int
column)
{
int k;
this.choice = choice;
if (choice.equals("-h") || choice.equals("-t"))
k = 2;
else //If choice is "-u", "-i" or "-r"
k = 1;
/*Initialising Size of Period array*/
nomNumPeriod = (nominal.length-1)/10;
if ((nominal.length-1)%10 !=0)
nomNumPeriod+=1;
curNumPeriod = (current.length-1)/10;
if ((current.length-1)%10 !=0)
curNumPeriod+=1;
nomData = new String[nomNumPeriod][k];

61
curData = new String[curNumPeriod][k];
/*Finding average of packet frequecies in 10 sec period*/
int col = 0; //col is the column for nomData, the averages
for(int i = column; i<(k+column); i++) //i is the column of data
where the average is calc-ed from
{
double sum =0;
/*Calculating averages for Nominal Data*/
for(int row =1; row<nominal.length; row++)
{
sum+=Integer.parseInt(nominal[row][i]);
if (row%10==0)
{
nomData[(row/10)-1][col]=Double.toString(sum/10);
sum=0;
}
if (row==(nominal.length-2))//minus 2 for header and array
indexing
{
nomData[row/10][col]=Double.toString(sum/((nominal.length-
1)%10));
sum=0;
}
}
/*Calculating averages for Current Data*/
for(int row =1; row<current.length; row++)
{
sum+=Integer.parseInt(current[row][i]);
if (row%10==0)
{
curData[(row/10)-1][col]=Double.toString(sum/10);
sum=0;
}
if (row==(current.length-2)) //minus 2 for header and array
indexing
{
curData[row/10][col]=Double.toString(sum/((current.length-
1)%10));
sum=0;

62
}
}
col++;
}
analyse();
}//end of Calc constructor
private void analyse()
{
/*Initializing Nominal and Current differences for HTTP or TCP*/
if (choice.equals("-h") || choice.equals("-t"))
{
nomDiff= new double[nomData.length];
curDiff= new double[curData.length];
for(int i = 0; i<nomData.length; i++)
nomDiff[i]=Double.parseDouble(nomData[i][0])-
Double.parseDouble(nomData[i][1]);
for(int i = 0; i<curData.length; i++)
curDiff[i]=Double.parseDouble(curData[i][0])-
Double.parseDouble(curData[i][1]);
/*Begin bubble sort*/
//sort(nomData,1);
//sort(curData,1);
}
//sort(nomData,0);
//sort(curData,0);
/*Classify and Weightage*/
findMaxAvg();
//Range classes: <100%, 100%, 150%, 200%, 250%, 500%, 1000%
//Initialise Variables
range = new double[2][7];
weightage = new double[2];
weightage[0] = 0.0;
weightage[1] = 0.0;
threshold = 2.5;
for(int i=0;i<range.length;i++)

63
for(int j=0;j<range[0].length;j++)
range[i][j]=0.0;
//comparing Data (GET values) with Nominal Max Average (GET values)
range[0][0] = nomData.length;
//Find weightage of Nominal Data
for(int i =0;i < nomData.length; i++)
weightage[0]+=Double.parseDouble(nomData[i][0]);
//Find weightage of Current Data & ranges
for(int i =0;i < curData.length; i++)
{
weightage[1]+=Double.parseDouble(curData[i][0]);
if (Double.parseDouble(curData[i][0])>(nomMaxAvg[0]*10))
range[1][6]+=1;
else if (Double.parseDouble(curData[i][0])>(nomMaxAvg[0]*5))
range[1][5]+=1;
else if (Double.parseDouble(curData[i][0])>(nomMaxAvg[0]*2.5))
range[1][4]+=1;
else if (Double.parseDouble(curData[i][0])>(nomMaxAvg[0]*2))
range[1][3]+=1;
else if (Double.parseDouble(curData[i][0])>(nomMaxAvg[0]*1.5))
range[1][2]+=1;
else if (Double.parseDouble(curData[i][0])>(nomMaxAvg[0]))
range[1][1]+=1;
else if (Double.parseDouble(curData[i][0])<(nomMaxAvg[0]))
range[1][0]+=1;
}
//Normalizing
for(int i =0;i < range[1].length; i++)
range[1][i]=(range[1][i]/curNumPeriod)*nomNumPeriod;
weightage[1]=(weightage[1]/curNumPeriod)*nomNumPeriod;
probability = weightage[1]*10/weightage[0];
if (weightage[1]>(weightage[0]*threshold))
{
System.out.println();
if (choice.equals("-h"))
System.out.println("---------HTTP Get Requests and HTTP

64
Response packets---------");
else if (choice.equals("-t"))
System.out.println("----------------TCP SYN and TCP SYN/ACK
packets--------------");
else if (choice.equals("-u"))
System.out.println("---------------------------UDP packets---
--------------------");
else if (choice.equals("-i"))
System.out.println("--------------------------ICMP packets---
--------------------");
else if (choice.equals("-r"))
System.out.println("--------------------------Raw packets----
-------------------");
System.out.printf("Possible attack sequence detected with
probability of %.2f", probability );
System.out.print("%.");
System.out.println();
System.out.println();
System.out.println();
}
}//end analyse()
/*Bubblesort Method*/
private void sort(String[][] data, int column)
{
boolean swap = true;
while(swap)
{
swap = false;
for (int i=0; i<data.length-1; i++)
{
if(data[i+1][column] != null)
{
if (Double.parseDouble(data[i][column]) <
Double.parseDouble(data[i+1][column]))
{
String temp = "";
temp = data[i][column];
data[i][column] = data[i+1][column];
data[i+1][column] = temp;
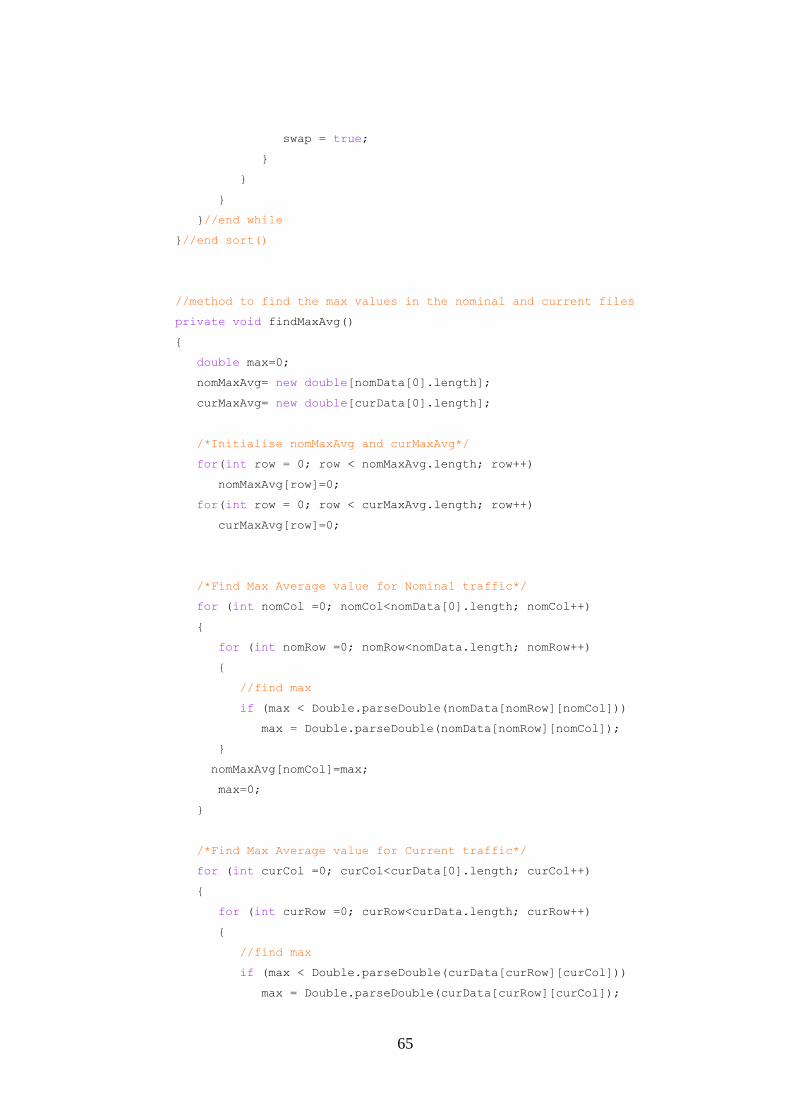
65
swap = true;
}
}
}
}//end while
}//end sort()
//method to find the max values in the nominal and current files
private void findMaxAvg()
{
double max=0;
nomMaxAvg= new double[nomData[0].length];
curMaxAvg= new double[curData[0].length];
/*Initialise nomMaxAvg and curMaxAvg*/
for(int row = 0; row < nomMaxAvg.length; row++)
nomMaxAvg[row]=0;
for(int row = 0; row < curMaxAvg.length; row++)
curMaxAvg[row]=0;
/*Find Max Average value for Nominal traffic*/
for (int nomCol =0; nomCol<nomData[0].length; nomCol++)
{
for (int nomRow =0; nomRow<nomData.length; nomRow++)
{
//find max
if (max < Double.parseDouble(nomData[nomRow][nomCol]))
max = Double.parseDouble(nomData[nomRow][nomCol]);
}
nomMaxAvg[nomCol]=max;
max=0;
}
/*Find Max Average value for Current traffic*/
for (int curCol =0; curCol<curData[0].length; curCol++)
{
for (int curRow =0; curRow<curData.length; curRow++)
{
//find max
if (max < Double.parseDouble(curData[curRow][curCol]))
max = Double.parseDouble(curData[curRow][curCol]);

66
}
curMaxAvg[curCol]=max;
max=0;
}
}//end findMaxAvg()
/*GET METHODS*/
public String[][] getNomData()
{
return nomData;
}
public String[][] getCurData()
{
return curData;
}
public double[] getNomMaxAvg()
{
return nomMaxAvg;
}
public double[] getCurMaxAvg()
{
return curMaxAvg;
}
public int getNomNumPeriod()
{
return nomNumPeriod;
}
public int getCurNumPeriod()
{
return curNumPeriod;
}
public double[] getNomDiff()
{
return nomDiff;
67
}
public double[] getCurDiff()
{
return curDiff;
}
public String getChoice()
{
return choice;
}
public double[][] getRange()
{
return range;
}
public double getMean()
{
return mean;
}
public double[] getWeightage()
{
return weightage;
}
public double getThreshold()
{
return threshold;
}
public double getProbability()
{
return probability;
}
}
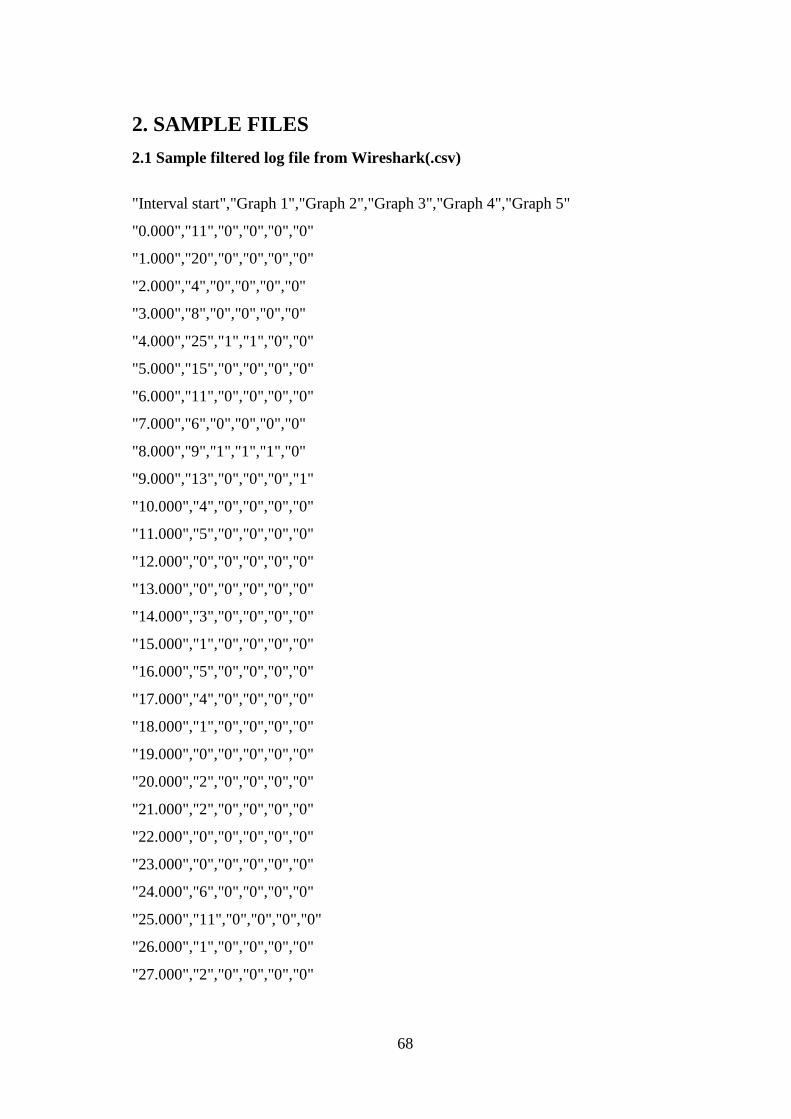
68
2. SAMPLE FILES
2.1 Sample filtered log file from Wireshark(.csv)
"Interval start","Graph 1","Graph 2","Graph 3","Graph 4","Graph 5"
"0.000","11","0","0","0","0"
"1.000","20","0","0","0","0"
"2.000","4","0","0","0","0"
"3.000","8","0","0","0","0"
"4.000","25","1","1","0","0"
"5.000","15","0","0","0","0"
"6.000","11","0","0","0","0"
"7.000","6","0","0","0","0"
"8.000","9","1","1","1","0"
"9.000","13","0","0","0","1"
"10.000","4","0","0","0","0"
"11.000","5","0","0","0","0"
"12.000","0","0","0","0","0"
"13.000","0","0","0","0","0"
"14.000","3","0","0","0","0"
"15.000","1","0","0","0","0"
"16.000","5","0","0","0","0"
"17.000","4","0","0","0","0"
"18.000","1","0","0","0","0"
"19.000","0","0","0","0","0"
"20.000","2","0","0","0","0"
"21.000","2","0","0","0","0"
"22.000","0","0","0","0","0"
"23.000","0","0","0","0","0"
"24.000","6","0","0","0","0"
"25.000","11","0","0","0","0"
"26.000","1","0","0","0","0"
"27.000","2","0","0","0","0"

69
2.2 Sample results file
=====================================================================
Detection of Botnets in Network Traffic Outflow
=====================================================================
Capture details of Nominal Packet file:
Total Time Captured = 45352
Number of 10 second periods = 4536
Capture details of Current Packet file:
Total Time Captured = 1671
Number of 10 second periods = 168
----------------------------------------------------------------------------------
Comparison of HTTP Get Requests and HTTP Response packets
----------------------------------------------------------------------------------
Peak average values:
Nominal file:
HTTP Get Requests HTTP Response packets
71.7 3.6
Current file:
HTTP Get Requests HTTP Response packets
971.5 121.5
Difference in request and response packets
Nominal: 5.5 2.5 0.3 0.7 2.4 5.4 0.3 0.4 0.3 4.8 0.9 1.0 4.8 1.0 2.9 0.3 4.2 0.9 2.3 5.0
Current: 12.100000000000001 2.3 3.4 3.1 8.9 5.2 6.9 2.0 2.9 2.7 6.2 4.3 11.4 5.5 5.6 1.4
22.6 35.7 7.1
Normalized frequency proportional to nominal file
Range classes:
<=100%, 100%-150%, 150%-200%, 200%-250%, 250%-500%, 500%-1000%, >1000%
Nominal: 4536.0 0.0 0.0 0.0 0.0 0.0 0.0
Current: 3402.0 297.0 135.0 27.0 540.0 108.0 27.0

70
Weight of Nominal Data = 34521.600000000086
Weight of Current Data = 301843.7999999999
Threshold = 250.0%
Possible attack sequence detected with probability of 87.43621384872054%
----------------------------------------------------------------------------------
Comparison of TCP SYN and TCP SYN/ACK packets
----------------------------------------------------------------------------------
Peak average values:
Nominal file:
TCP SYN TCP SYN/ACK
3.5 1.5
Current file:
TCP SYN TCP SYN/ACK
118.5 34.8
Difference in request and response packets
Nominal: 0.3 0.0 0.0 0.0 0.1 0.3 0.0 0.0 0.0 0.3 0.0 -0.1 -0.10000000000000003 -0.1
Current: 0.1 0.0 0.0 0.0 0.0 0.0 0.0 0.0 0.0 0.0 -0.1 0.0 1.0 0.0 0.0 0.0
0.10000000000000003 2.7
Normalized frequency proportional to nominal file
Range classes:
<=100%, 100%-150%, 150%-200%, 200%-250%, 250%-500%, 500%-1000%, >1000%
Nominal: 4536.0 0.0 0.0 0.0 0.0 0.0 0.0
Current: 3159.0 162.0 81.0 135.0 324.0 405.0 270.0
Weight of Nominal Data = 504.40000000000833
Weight of Current Data = 31538.70000000001
Threshold = 250.0%
Possible attack sequence detected with probability of 625.2716098334554%
----------------------------------------------------------------------------------
Comparison of UDP packets

71
----------------------------------------------------------------------------------
Peak average values:
Nominal file:
UDP
1.6
Current file:
UDP
34.0
Normalized frequency proportional to nominal file
Range classes:
<=100%, 100%-150%, 150%-200%, 200%-250%, 250%-500%, 500%-1000%, >1000%
Nominal: 4536.0 0.0 0.0 0.0 0.0 0.0 0.0
Current: 3132.0 54.0 81.0 108.0 486.0 432.0 243.0
Weight of Nominal Data = 24.000000000000004
Weight of Current Data = 13410.9
Threshold = 250.0%
Possible attack sequence detected with probability of 5587.874999999999%
Copyright © 2022 FDOKUMEN