Botnet spam campaigns can be long lasting: evidence, implications, and analysis
12
Botnet Spam Campaigns Can Be Long Lasting: Evidence, Implications, and Analysis Abhinav Pathak 1 , Feng Qian 2 , Y. Charlie Hu 1 , Z. Morley Mao 2 , and Supranamaya Ranjan 3 1 Purdue University, West Lafayette, IN 47907 2 University of Michigan, Ann Arbor, MI 48109 3 Narus Inc., Mountain View, CA 94043 ABSTRACT Accurately identifying spam campaigns launched by a large num- ber of bots in a botnet allows for accurate spam campaign signa- ture generation and hence is critical to defeating spamming botnets. The straight-forward approach of clustering all spam containing the same label such as an URL into a campaign can be easily defeated by techniques such as simple obfuscations of URLs. In this pa- per, we perform a comprehensive study of content-agnostic char- acteristics of spam campaigns, e.g., duration and source-network distribution of spammers, in order to ascertain whether and how they can assist the simple label-based clustering methods in identi- fying campaigns and generating campaign signatures. In particular, from a five-month trace collected by a relay sinkhole, we manually identified and then analyzed seven URL-based botnet spam cam- paigns consisting of 52 million spam messages sent over 2.09 mil- lion SMTP connections originated from over 150,000 non-proxy spamming hosts and destined to about 200,000 end domains. Our analysis shows that the spam campaigns, when observed from large destination domains, exhibit durations far longer than the five-day period as reported in a recent study. We analyze the implications of this finding on spam campaign signature generation. We further study other characteristics of these long-lasting campaigns. Our analysis reveals several new findings regarding workload distribu- tion, sending patterns, and coordination among the spamming ma- chines. Categories and Subject Descriptors: C.2.3 Computer Communi- cation Networks: Network Operations–network management; C.2.0 Computer Communication Networks: General–security and pro- tection General Terms: Measurement, Security Keywords: Spam campaign, botnet, burstiness, distributedness, open relay 1. INTRODUCTION Ever since spam first became a major problem, spamming tech- niques have escalated in complexity in response to the increasing sophistication of spam filtering techniques. Due to the fundamental Permission to make digital or hard copies of all or part of this work for personal or classroom use is granted without fee provided that copies are not made or distributed for profit or commercial advantage and that copies bear this notice and the full citation on the first page. To copy otherwise, to republish, to post on servers or to redistribute to lists, requires prior specific permission and/or a fee. SIGMETRICS/Performance’09, June 15–19, 2009, Seattle, WA, USA. Copyright 2009 ACM 978-1-60558-511-6/09/06 ...$5.00. weakness of content-based spam filtering techniques, i.e., there are simply too many ways to obfuscate the content, researchers have developed IP-address-based techniques. Such techniques maintain a blacklist of IP addresses that are known to have originated spam in the past, and offer a simple interface such as DNS for convenient and efficient lookups by mail servers in the future. In reaction to DNS blacklisting, spammers resorted to employing botnets, each of which consists of a large number of compromised machines, typically operated under a central Command-and-Control (CnC) to originate spam. The low volume of spam originated from each indi- vidual bot significantly adds to the difficulty of accurate and timely blacklisting of these bot machines. Because of the sheer size of botnets, spam due to bots amount to a major percentage of the total spam worldwide [24, 20]. The difficulty with identifying individual bots due to their stealthy spamming behavior suggests that an effective approach to identify- ing and defeating botnets has to resort to identifying the collective behavior, i.e., the spam campaign that the bots in a botnet launch collectively for pushing the same spam (including all of its obfus- cated forms) to millions of mailboxes. Under such an approach, the new challenge in the battle against botnet spam is shifted to the abil- ity to accurately cluster spam belonging to the same campaign and generate signatures characterizing a campaign immediately upon its onset. Such spam campaign signatures can then be used to iden- tify and filter future spam belonging to the same campaign. A key observation about spam campaigns is that spam belong- ing to the same campaign typically share the same spam label, such as a URL or a phone number, which is needed to carry out the spamming purpose, for example, to tell the recipients how to buy the medication advertised in the spam. However, clustering spam into campaigns solely based on the labels embedded in the message such as URLs is insufficient as it is easily defeated by techniques such as simple obfuscations of URLs, using HTTP fea- tures such as URL redirection, and including additional legitimate URLs in the mail body. A natural question then is whether the label-based spam campaign clustering approach can benefit from exploiting some defining content-agnostic characteristics inherent in a campaign? In this paper, we perform a trace-driven analysis that searches for such definitive characteristics of spam campaigns. In particular, we focus on characterizing the burstiness, i.e., how long a spam cam- paign lasts, and distributedness, i.e., how widespread the sources of a spam campaign are. To facilitate our investigation, we lever- age the technique previously developed for peeking into spammers’ behavior from relay sinkholes [15] which provides the unique and broad view of numerous, possibly concurrent, spam campaigns hit- ting many diverse end domains (including spam to major domains such as Hotmail, Yahoo! mail, Gmail). In particular, from a five-
-
Upload
independent -
Category
Documents
-
view
0 -
download
0
Transcript of Botnet spam campaigns can be long lasting: evidence, implications, and analysis

Botnet Spam Campaigns Can Be Long Lasting:Evidence, Implications, and Analysis
Abhinav Pathak1, Feng Qian2, Y. Charlie Hu1, Z. Morley Mao2, and Supranamaya Ranjan3
1Purdue University, West Lafayette, IN 479072University of Michigan, Ann Arbor, MI 48109
3Narus Inc., Mountain View, CA 94043
ABSTRACTAccurately identifying spam campaigns launched by a large num-ber of bots in a botnet allows for accurate spam campaign signa-ture generation and hence is critical to defeating spamming botnets.The straight-forward approach of clustering all spam containing thesame label such as an URL into a campaign can be easily defeatedby techniques such as simple obfuscations of URLs. In this pa-per, we perform a comprehensive study of content-agnostic char-acteristics of spam campaigns, e.g., duration and source-networkdistribution of spammers, in order to ascertain whether and howthey can assist the simple label-based clustering methods in identi-fying campaigns and generating campaign signatures. In particular,from a five-month trace collected by a relay sinkhole, we manuallyidentified and then analyzed seven URL-based botnet spam cam-paigns consisting of 52 million spam messages sent over 2.09 mil-lion SMTP connections originated from over 150,000 non-proxyspamming hosts and destined to about 200,000 end domains. Ouranalysis shows that the spam campaigns, when observed from largedestination domains, exhibit durations far longer than the five-dayperiod as reported in a recent study. We analyze the implicationsof this finding on spam campaign signature generation. We furtherstudy other characteristics of these long-lasting campaigns. Ouranalysis reveals several new findings regarding workload distribu-tion, sending patterns, and coordination among the spamming ma-chines.Categories and Subject Descriptors: C.2.3 Computer Communi-cation Networks: Network Operations–network management; C.2.0Computer Communication Networks: General–security and pro-tectionGeneral Terms: Measurement, SecurityKeywords: Spam campaign, botnet, burstiness, distributedness,open relay
1. INTRODUCTIONEver since spam first became a major problem, spamming tech-
niques have escalated in complexity in response to the increasingsophistication of spam filtering techniques. Due to the fundamental
Permission to make digital or hard copies of all or part of this work forpersonal or classroom use is granted without fee provided that copies arenot made or distributed for profit or commercial advantage and that copiesbear this notice and the full citation on the first page. To copy otherwise, torepublish, to post on servers or to redistribute to lists, requires prior specificpermission and/or a fee.SIGMETRICS/Performance’09, June 15–19, 2009, Seattle, WA, USA.Copyright 2009 ACM 978-1-60558-511-6/09/06 ...$5.00.
weakness of content-based spam filtering techniques, i.e., there aresimply too many ways to obfuscate the content, researchers havedeveloped IP-address-based techniques. Such techniques maintaina blacklist of IP addresses that are known to have originated spamin the past, and offer a simple interface such as DNS for convenientand efficient lookups by mail servers in the future. In reaction toDNS blacklisting, spammers resorted to employing botnets, eachof which consists of a large number of compromised machines,typically operated under a central Command-and-Control (CnC) tooriginate spam. The low volume of spam originated from each indi-vidual bot significantly adds to the difficulty of accurate and timelyblacklisting of these bot machines. Because of the sheer size ofbotnets, spam due to bots amount to a major percentage of the totalspam worldwide [24, 20].
The difficulty with identifying individual bots due to their stealthyspamming behavior suggests that an effective approach to identify-ing and defeating botnets has to resort to identifying the collectivebehavior, i.e., the spam campaign that the bots in a botnet launchcollectively for pushing the same spam (including all of its obfus-cated forms) to millions of mailboxes. Under such an approach, thenew challenge in the battle against botnet spam is shifted to the abil-ity to accurately cluster spam belonging to the same campaign andgenerate signatures characterizing a campaign immediately uponits onset. Such spam campaign signatures can then be used to iden-tify and filter future spam belonging to the same campaign.
A key observation about spam campaigns is that spam belong-ing to the same campaign typically share the same spam label,such as a URL or a phone number, which is needed to carry outthe spamming purpose, for example, to tell the recipients how tobuy the medication advertised in the spam. However, clusteringspam into campaigns solely based on the labels embedded in themessage such as URLs is insufficient as it is easily defeated bytechniques such as simple obfuscations of URLs, using HTTP fea-tures such as URL redirection, and including additional legitimateURLs in the mail body. A natural question then is whether thelabel-based spam campaign clustering approach can benefit fromexploiting some defining content-agnostic characteristics inherentin a campaign?
In this paper, we perform a trace-driven analysis that searches forsuch definitive characteristics of spam campaigns. In particular, wefocus on characterizing the burstiness, i.e., how long a spam cam-paign lasts, and distributedness, i.e., how widespread the sourcesof a spam campaign are. To facilitate our investigation, we lever-age the technique previously developed for peeking into spammers’behavior from relay sinkholes [15] which provides the unique andbroad view of numerous, possibly concurrent, spam campaigns hit-ting many diverse end domains (including spam to major domainssuch as Hotmail, Yahoo! mail, Gmail). In particular, from a five-

month trace collected by a relay sinkhole, we manually identifiedseven URL-based botnet spam campaigns which consist of 52 mil-lion spam messages sent over 2.09 million SMTP connections orig-inated from over 150,000 non-relay, non-proxy IP addresses anddestined to about 200,000 end domains.
We observe that nearly all spam campaigns, when observed fromlarge destination domains, exhibit a burst duration far longer thanthe five-day period used as the campaign burstiness threshold ina recent study [22]. One immediate implication of this finding isthat one can not simply cluster all the spam from a large numberof spamming sources that contain similar URLs and the deliveryof which is finished within a short period of time as a single spamcampaign, as burstiness is not a definitive characteristic for manyspam campaigns. In other words, while burstiness plus distributed-ness may be a sufficient condition for identifying a spam campaign,it is not a necessary condition. Hence, using it as the definitivecharacteristic can result in a high false negative ratio. Our analysisshows that the complete URL signatures generated using a five-dayburstiness cutoff and a 20-AS distributedness cutoff on our sevenspam campaign trace result in a false negative ratio of 98.21% (con-sidering only the spam that satisfy the 20-AS distributedness cut-off). In contrast, the study in [22] never reported false negativeresults while evaluating their spam campaign signature generationtechnique.
A second important contribution of the paper is an in-depth anal-ysis of these long-duration botnet spam campaigns identified in ourtrace. Unlike previous analysis of spam campaigns [22, 23], theunique vantage point of our relay sinkhole allows us to study thespamming patterns of individual spammers to multiple destinationdomains, as well as the coordination of the sending patterns of indi-vidual spammers on behalf of different spam campaigns. Overall,the major findings of our study include:
• Many spam campaigns are not bursty in nature, whether ob-served from the relay’s point of view or from an end domain’spoint of view; they continue on for months.
• Though a spam campaign as a whole may not be bursty innature, the bots carrying out the work can in fact be burstyand stealthy within the campaign. In many cases, bots com-plete their entire workload for a particular spam campaignwithin the first one hour of their arrival into the campaign, asobserved by the relay.
• There exist many common spamming IPs across multiplespam campaigns.
• The bots that appear in multiple spam campaigns typicallyspam for different campaigns in close-by time instances. Fur-ther, they appear to spam nearly the same workload (numberof spam emails) but to distinct recipients across the multiplecampaigns.
• An individual spamming host’s involvement in a campaign isrelated to its upload link bandwidth. The higher the uploadbandwidth, the more spam was observed to originate from it.
The rest of this paper is organized as follows. Section 2 discussesrelated work. Section 3 briefly reviews the methodology and advan-tages of using relay sinkholes to collect spam. In Section 4, we dis-cuss the challenges with spam campaign identification and how weidentified seven URL-based spam campaigns manually. We charac-terize the burstiness and distributedness of botnet spam campaignsin Section 5, and perform an in-depth analysis of individual spam-mer behavior and the coordination among spammers in Sections 6and 7. Finally, we conclude in Section 8.
2. RELATED WORKThe major shift of spammers from using high-volume spam-
ming hosts to low-volume but coordinated bots has significantly in-creased the difficulty in identifying individual spamming sources.In reaction, a number of recent studies [2, 23, 10, 22, 11] havefocused on learning and identifying bots’ collective behavior, i.e.,the spam campaign they launched, with the goal of deriving spamcampaign signatures which can then be used to filter future spam.
One approach is to perform string extraction on the entire mailcontent in order to identify common “shingles” that characterize acampaign. For example, Zhuang et al. [23] applied the shinglingalgorithm [4] to spam mail bodies to separate different spam cam-paigns in spam traces collected from Hotmail.
A less resource-intensive approach than string extraction fromthe email body is to look for labels that characterize the intentionbehind the message, e.g., the advertised URLs. For instance, An-derson et al. [2] used spam traces collected from a top-level four-letter domain to study the spam infrastructure. They used the sim-ple notion of a spam campaign to consist of all emails that containthe same URL (after all redirections). However, as exhibited by ourtrace, it is possible for two URLs that do not render the same pageto belong to the same campaign. One way to work around this is tocompare the page displayed for different URLs as images [2] andcluster them based on similarity of the rendered pages using image-shingling. However, this method can be quite resource-intensive.
In contrast, in this paper we take a different approach by firstmanually identifying spam campaigns and then analyzing content-agnostic characteristics of a campaign that can assist with cam-paign identification. In this regard, similar to our approach, Konteet al. [11] also first manually identified campaigns and classifiedspam in their trace containing URLs belonging to 3,360 domainnames into 21 distinct campaigns. However, their goals are differ-ent than ours in that they focus on how fast-flux service networksare used to host the online scams advertised by the spam messages.
Most recently, Xie et al. [22] proposed to use burstiness and dis-tributedness as two definitive characteristics of botnet spam cam-paigns to assist in identifying URL-based botnet spam campaigns.In particular, in extracting clusters of same-URL-containing spamfrom an email trace sampled at 1:25,000 from a large mail serviceprovider, the authors exercised a burstiness filter of active periodless than five days, and a distributedness filter of spammers orig-inating from over 20 ASes. The URLs contained in such clustersare then used in a regular-expression-based automated campaignsignature generation process for URL-based spam campaigns.
Related to spam campaign analysis, Kanich et al. [10] studied theconversion rate of spam – the probability that an unsolicited mailwill ultimately elicit a sale – by infiltrating CnC channels of “TheStorm” botnet and injecting three spam campaigns that spammed500 million recipients.
Finally, several studies have focused on analyzing the network-level properties of spammers. As an example, Ramachandran andFeamster [17] analyzed the network-level behavior of spam orig-inating from botnets and discovered a new spamming technique,called BGP spectrum agility, that uses hijacked prefixes to sendspam. Ramachandran et al. [18] focuses on analyzing the simi-larity in the sending patterns of individual spammers such as thetemporal and spatial locality (e.g., in destination domains) in thespam they generated. They used email traces from 115 domains todevelop a behavioral blacklist based on the sending behavior (theset of target domains that a particular IP address sends spam to) ofspammers rather than a fixed identity such as an IP address. Suchan approach requires sharing of spam collected from across multi-ple end domains.

3. METHODOLOGYIn our study, we used the methodology described in [15] for col-
lecting a large spam trace from the unique vantage point of an openrelay sinkhole. Such a unique vantage point provides a snapshotview of many spam campaigns involving a large number of coor-dinated hosts and many destination domains. In the following, webriefly review the methodology and discuss its advantages and lim-itations, and summarize the trace we collected.
3.1 Spam Collection using an Open RelayOpen relay sinkhole. An open relay is an MTA (Mail TransferAgent) that forwards emails from any client to any destination. Ingeneral, spamming through an open relay is lucrative for a spam-mer since they can go undetected, as the final mail receiver seesonly the mail relay as the spamming source. While the bots in abotnet generally send spam in low volume and hence are less likelyto be detected, using a relay whenever possible remains lucrativeas long as the relay is not blacklisted.
Spammers use relay testing software [19] to scan the Internetfor open relays that could be exploited by them for spamming. Todetect open relays, they first scan the hosts that have mail serversrunning on port 25 (SMTP). The hosts that are detected to acceptport 25 connections are then checked if they also relay. A spam-mer tries to relay a test email to its own email address through thedetected host. Typically, the subject or the body of such an emailcontains the IP address of the host being tested. Once the test emailis successfully received, the IP address of the host is extracted fromthe body and the host is confirmed to relay emails.
Once an open relay is detected, the spamming hosts start exploit-ing the host to relay spam. The relay testers periodically (aboutonce a week as observed by the relay) check whether the host isstill relaying the email using the technique above. We observedthat if the host stops responding to relay testers at any time, spam-ming through the relay is stopped within a few days.
To sustain spam collection through the relay without actuallycompromising it, i.e., the relay being blacklisted by DNSBLs, theopen relay is carefully configured to forward only the emails thatare involved in relay testing. In this way, the relay testers are givencontinuous false assurance that the relay continues to forward allemails whereas in reality only the testing emails are relayed and allothers are stored (and not forwarded). An important step here is toidentify which emails are for testing the relays. Most of the relaytesters could be trivially identified as they contain the IP address(in plain text/hex) of the relay server in either the mail body or inthe subject lines. Some of them also contain words like “relay”,“test”, “successful”, etc. So any email that contains either the re-lay’s IP address or these keywords are let through. An importantpoint to note here is that relay testing is also done by DNSBL(s)for purposes of blacklisting and these test emails also contain theIP address of the relay in the mail body. Hence, any email thatcontains words like “dnsbl”, “ordb”, “sorbs”, etc., are denied frompassing through to prevent our relay from being blacklisted. Wenote that this relay testing behavior is based on observations fromour relay and hence the mechanism for detecting relay testers maynot necessarily be general.Advantages and Limitations of a Relay Sinkhole Trace. Uponbeing recruited by spammers to relay spam, an open relay providesa unique vantage point for observing Internet spam traffic. Sincespammers typically spam mailboxes in many organizational do-mains, a conventional sinkhole which pretends to be a normal mailserver at an organization only observes the spam traffic to that sin-gle organizational domain. Such a sinkhole therefore only observes
1
10
100
1000
10000
100000
1e+06
1e+07
FebJanDecNovOct
Numb
er
Time
Mail-data
mail countconn. count
source IP count
Figure 1: Number of emails supposed to be relayed, number of incom-ing connections and number of unique spammer IPs per day.
a portion of the spam originated from the spammers. In contrast,a spam sinkhole that masquerades as a normal open relay on oneside sees a plethora of origin spammers that attempt to relay spamthrough it, and on the other side sees all the final destinations ofthe spam. Such a broader view point of the spam traffic potentiallyreveals the global behavior of spammers. In particular, it poten-tially captures snapshots of many spam campaigns, each of whichtargeting many destination domains.
In principle, trace collection at a single domain can potentiallycover 100% of all the spam destined to that domain. In practice,however, due to the sheer volume of spam at such domains, stud-ies using them typically use sampling techniques. For example,in [22], the trace used by the authors are sampled at the ratio of1:25,000. The spam trace collected at the relay sinkhole can alsobe viewed as a form of sampling, i.e., of the spam campaigns goingto each destination domain. Since the uniformity of this samplingof our relay trace is arguable, i.e., the trace may not see all thespammers that are part of a campaign, in this paper, we will onlyextract properties of spam campaigns that are lower-bounded bywhat is seen in the trace. For example, if the duration of a spamcampaign seen in the trace is X days, then we know the actual du-ration can only be longer, but not shorter. In other words, we willanalyze the trace in a way that avoids its limitation.
3.2 Trace StatisticsUsing an open relay, we collected a spam trace for a period of
five months from September 30, 2007 to February 28, 2008. Fig-ure 1 plots the number of emails that our relay was asked to relayper day and the number of unique IPs that generated these requestsper day. We observe that the spam through the relay was initiallylow in volume but ramped up to one million per day in the sec-ond month until mid-January. From mid-January we observe aneven higher volume of about 10 million spam per day. Except forthe first month, the spam each day originated from about 10,000spamming hosts. We observe that spam through the relay drops tozero in two time periods (in early October and early November).These two drops were not a result of data collection issues, thuswe surmise that they were likely due to a modified decision at thespamming sources with respect to our relay.
Table 1 summarizes the statistics of the collected spam. In total,on the source side, over half a million unique IP addresses origi-nated about 11 million SMTP connections to the relay. These IPaddresses are spread across 2,243 ASes and 168 countries as de-termined by consulting the routing table database published by theRouteViews project [1]1. On the destination side, our relay was1Routeviews publishes routing table updates every 15 minutes. AnIP is resolved to the AS that announced the longest prefix coveringthe IP.

Table 1: Statistics of the whole trace, collected at a relay sinkhole fromSep. 30, 2007 to Feb. 28, 2008.
Source side statistics# incoming SMTP conn.: 11,269,081# unique IP addresses: 543,828Avg. # recipients per conn.: 25.32# network prefixes: 9,222# ASes: 2,243# spam originating countries: 168
Destination side statistics# mails to be delivered: 285,422,502# unique recipients: 53,950,777# destination domains: 628,092
1 10
100 1000
10000 100000 1e+06 1e+07 1e+08 1e+09
1 10 100 1000 10000 100000 1e+06
Numb
er of
Mails
Destination domain - sorted by number of mails
Figure 2: Emails received per destination domain.
asked to relay about 285 million messages in the five month periodto about 54 million unique mailboxes distributed across 628,092end domains. We found that about 75% of the hosts were alreadyblacklisted in at least one of the five DNSBLs [5, 21, 9, 8, 3]which were queried by the relay at the time of receiving the spam.Figure 2 shows the number of emails that were destined to eachdomain, where the domains are sorted by the number of emails.We observe that a few providers, e.g., Yahoo!, Gmail, Hotmailand Hinet, are the target of a lot of spam (89.39% of 285 mil-lion spam), indicating that the stakes are higher for them in thearms race against spam. These large end domains could also serveas a good spam information source for potentially helping othersvia a coordinated spam sharing mechanism (in a similar manneras Google’s safe browsing API). We also observe in our trace thatspam sources that generate high volumes, spam almost all domains,and conversely, domains that receive the most spam, receive fromnearly all the spamming hosts.
In the rest the paper, we focus on the number of SMTP con-nections as opposed to the total number of spam messages to bereceived by all the destination mailboxes, for the following tworeasons. First, in a single SMTP connection, a spamming sourcetypically delivers the same spam message to multiple destinationmailboxes in the same destination domain. This is achieved bytransferring one spam message body and multiple destination mail-boxes to the receiving mail server. Hence the number of SMTPconnections is a more relevant metric for measuring the workloadexecuted (as opposed to assigned) by a spammer, compared to thetotal number of spam messages finally delivered (e.g., by the re-ceiving mail servers) to all the destination mailboxes. Second, anSMTP connection carries the spamming source information and thetime when the spam was delivered from the source, and hence ismore specific than the multiple mailboxes being spammed in thatconnection when we analyze the duration and distributedness ofspam campaigns.
Table 2: Breakdown of the 11 million connections by spam label type.SC Label Type % of Spam # of distinct spam labelsURLs 58.63a 2,501
(6.50 million)Phone Number 15.02 10Skype ID 9.45 2Mail ID 1.43 1No Subject/Body 5.31 1Others 9.90 -
aWe removed 0.26% of the connections which containinvalid URLs or URLs of the form www.dom.tld/location-OOOO where OOOO denotes per-connection ob-fuscated string as each such URL appears in spam sent in onlyone connection.
4. SPAM CAMPAIGN IDENTIFICATIONIn this section, we formally define spam campaigns (SCs), and
discuss challenges with identifying URL-based SCs and how wemanually identified seven URL-based SCs accounting for 52 mil-lion spam messages and over 2 million connections in our trace.
4.1 DefinitionsWe formally define a spam campaign to be the set of email spam
that are meant to achieve the same spamming purpose, for example,in trying to sell a certain medication. To evade the increasingly so-phisticated content-based spam filters, the content of a spam cam-paign is typically obfuscated (in more and more sophisticated man-ners). However, no matter how much the content is obfuscated,spam belonging to the same campaign have to contain the sameunderlying “contact information” to execute the purpose, e.g., to“sell the medication.” Such “contact information” comes in vari-ous forms. The first and still most widely used format is a URLthat points to the web page that in turn contains detailed informa-tion for executing the spamming purpose. More recent “contactinformation” types include phone numbers and Skype IDs.
We denote such “contact information” as the spam label, as inprinciple each of them uniquely identifies the spam that belong toa campaign. In practice, realizing that the static “contact informa-tion” contained in the messages for a campaign can be used by acontent-based spam filter to detect spam, the spammers try to ob-fuscate the “contact information” to the extent they can. For exam-ple, this is easy to do for URLs by using standard features of HTTPprotocols such as redirection (using simple HTTP or javascript).
We denote different types of “contact information” as differentspam label types. Table 2 gives a breakdown of the 11 millionconnections in our spam trace according to different label types.We observe that 58.63% of the connections are for spam contain-ing URLs (6.50 million connections), 15% contain phone num-bers, 9.45% contain Skype IDs, 1.43% contain Mail IDs (emailaddresses in spam messages for recipients to contact the spam orig-inators) as the “contact information”. We denote the above labeltypes as simple label types. Interestingly, 5.31% of the connectionshave completely empty subject field and mail body. The purposeof such spam remains unclear and we suspect they could be dueto bugs in the spam template of the spammers. Finally, 9.9% ofthe connections do not belong to any of the above simple signaturetypes. They do not contain URLs or specific contact information.These spam emails seek to influence the behavior of the recipientwithout listing a means for contacting the spam originator. Pumpand Dump stock spams have these characteristics though there areseveral other kinds in our trace.
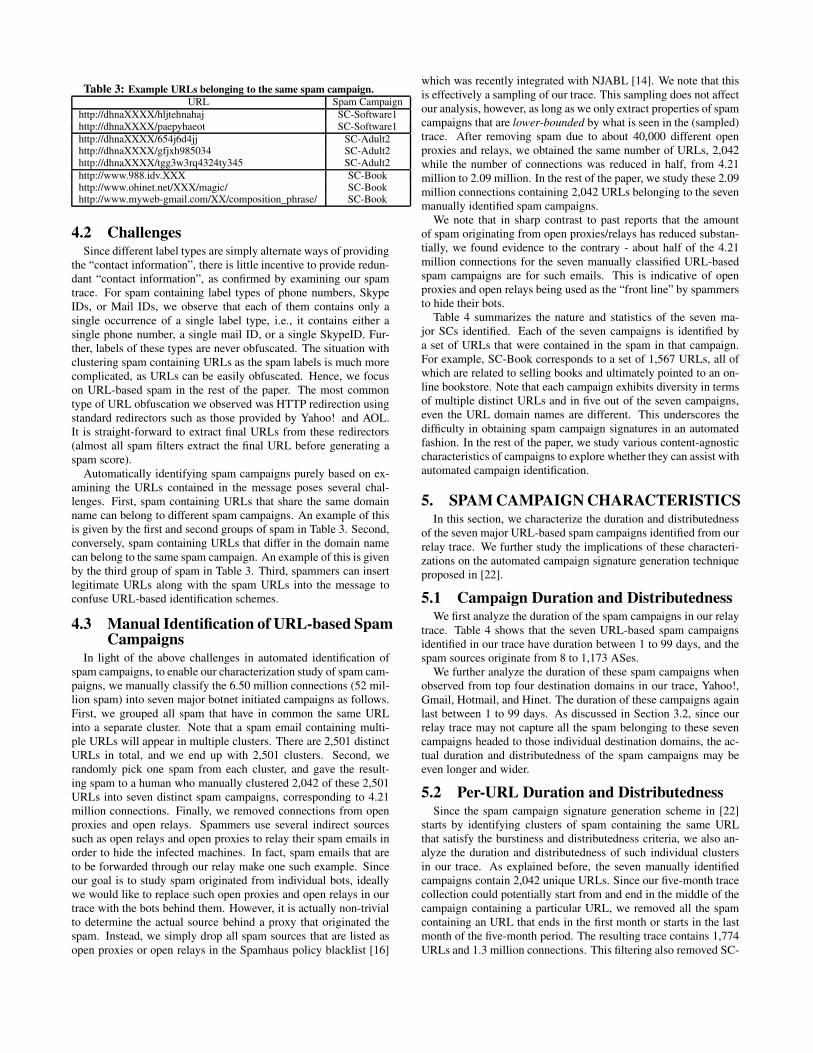
Table 3: Example URLs belonging to the same spam campaign.URL Spam Campaign
http://dhnaXXXX/hljtehnahaj SC-Software1http://dhnaXXXX/paepyhaeot SC-Software1http://dhnaXXXX/654j6d4jj SC-Adult2http://dhnaXXXX/gfjxh985034 SC-Adult2http://dhnaXXXX/tgg3w3rq4324ty345 SC-Adult2http://www.988.idv.XXX SC-Bookhttp://www.ohinet.net/XXX/magic/ SC-Bookhttp://www.myweb-gmail.com/XX/composition_phrase/ SC-Book
4.2 ChallengesSince different label types are simply alternate ways of providing
the “contact information”, there is little incentive to provide redun-dant “contact information”, as confirmed by examining our spamtrace. For spam containing label types of phone numbers, SkypeIDs, or Mail IDs, we observe that each of them contains only asingle occurrence of a single label type, i.e., it contains either asingle phone number, a single mail ID, or a single SkypeID. Fur-ther, labels of these types are never obfuscated. The situation withclustering spam containing URLs as the spam labels is much morecomplicated, as URLs can be easily obfuscated. Hence, we focuson URL-based spam in the rest of the paper. The most commontype of URL obfuscation we observed was HTTP redirection usingstandard redirectors such as those provided by Yahoo! and AOL.It is straight-forward to extract final URLs from these redirectors(almost all spam filters extract the final URL before generating aspam score).
Automatically identifying spam campaigns purely based on ex-amining the URLs contained in the message poses several chal-lenges. First, spam containing URLs that share the same domainname can belong to different spam campaigns. An example of thisis given by the first and second groups of spam in Table 3. Second,conversely, spam containing URLs that differ in the domain namecan belong to the same spam campaign. An example of this is givenby the third group of spam in Table 3. Third, spammers can insertlegitimate URLs along with the spam URLs into the message toconfuse URL-based identification schemes.
4.3 Manual Identification of URL-based SpamCampaigns
In light of the above challenges in automated identification ofspam campaigns, to enable our characterization study of spam cam-paigns, we manually classify the 6.50 million connections (52 mil-lion spam) into seven major botnet initiated campaigns as follows.First, we grouped all spam that have in common the same URLinto a separate cluster. Note that a spam email containing multi-ple URLs will appear in multiple clusters. There are 2,501 distinctURLs in total, and we end up with 2,501 clusters. Second, werandomly pick one spam from each cluster, and gave the result-ing spam to a human who manually clustered 2,042 of these 2,501URLs into seven distinct spam campaigns, corresponding to 4.21million connections. Finally, we removed connections from openproxies and open relays. Spammers use several indirect sourcessuch as open relays and open proxies to relay their spam emails inorder to hide the infected machines. In fact, spam emails that areto be forwarded through our relay make one such example. Sinceour goal is to study spam originated from individual bots, ideallywe would like to replace such open proxies and open relays in ourtrace with the bots behind them. However, it is actually non-trivialto determine the actual source behind a proxy that originated thespam. Instead, we simply drop all spam sources that are listed asopen proxies or open relays in the Spamhaus policy blacklist [16]
which was recently integrated with NJABL [14]. We note that thisis effectively a sampling of our trace. This sampling does not affectour analysis, however, as long as we only extract properties of spamcampaigns that are lower-bounded by what is seen in the (sampled)trace. After removing spam due to about 40,000 different openproxies and relays, we obtained the same number of URLs, 2,042while the number of connections was reduced in half, from 4.21million to 2.09 million. In the rest of the paper, we study these 2.09million connections containing 2,042 URLs belonging to the sevenmanually identified spam campaigns.
We note that in sharp contrast to past reports that the amountof spam originating from open proxies/relays has reduced substan-tially, we found evidence to the contrary - about half of the 4.21million connections for the seven manually classified URL-basedspam campaigns are for such emails. This is indicative of openproxies and open relays being used as the “front line” by spammersto hide their bots.
Table 4 summarizes the nature and statistics of the seven ma-jor SCs identified. Each of the seven campaigns is identified bya set of URLs that were contained in the spam in that campaign.For example, SC-Book corresponds to a set of 1,567 URLs, all ofwhich are related to selling books and ultimately pointed to an on-line bookstore. Note that each campaign exhibits diversity in termsof multiple distinct URLs and in five out of the seven campaigns,even the URL domain names are different. This underscores thedifficulty in obtaining spam campaign signatures in an automatedfashion. In the rest of the paper, we study various content-agnosticcharacteristics of campaigns to explore whether they can assist withautomated campaign identification.
5. SPAM CAMPAIGN CHARACTERISTICSIn this section, we characterize the duration and distributedness
of the seven major URL-based spam campaigns identified from ourrelay trace. We further study the implications of these characteri-zations on the automated campaign signature generation techniqueproposed in [22].
5.1 Campaign Duration and DistributednessWe first analyze the duration of the spam campaigns in our relay
trace. Table 4 shows that the seven URL-based spam campaignsidentified in our trace have duration between 1 to 99 days, and thespam sources originate from 8 to 1,173 ASes.
We further analyze the duration of these spam campaigns whenobserved from top four destination domains in our trace, Yahoo!,Gmail, Hotmail, and Hinet. The duration of these campaigns againlast between 1 to 99 days. As discussed in Section 3.2, since ourrelay trace may not capture all the spam belonging to these sevencampaigns headed to those individual destination domains, the ac-tual duration and distributedness of the spam campaigns may beeven longer and wider.
5.2 Per-URL Duration and DistributednessSince the spam campaign signature generation scheme in [22]
starts by identifying clusters of spam containing the same URLthat satisfy the burstiness and distributedness criteria, we also an-alyze the duration and distributedness of such individual clustersin our trace. As explained before, the seven manually identifiedcampaigns contain 2,042 unique URLs. Since our five-month tracecollection could potentially start from and end in the middle of thecampaign containing a particular URL, we removed all the spamcontaining an URL that ends in the first month or starts in the lastmonth of the five-month period. The resulting trace contains 1,774URLs and 1.3 million connections. This filtering also removed SC-

Table 4: Summary of the seven manually identified major URL-based spam campaigns.SC Name Ad Type Distinct Distinct # of # of # of # of Duration Start
URLs URL Source IPs Source SMTP Destination of SC DateDomains ASes Connections Domains (Days)
Book Book Store 1,567 31 8,555 8 287,705 94,466 71 Dec 19Adult1 Adult Drug 38 12 92,441 1,173 720,076 80,034 92 Nov 28Adult2 Adult Site 306 12 62,117 1,055 419,750 54,622 99 Nov 19Adult3 Adult Tool 24 1 228 80 4,611 143 1 Jan 28
Shopping Shopping 5 1 20,375 592 107,934 26,917 36 Nov 28Software1 Software 54 4 28,502 702 265,476 45,308 12 Feb 12Software2 Software 48 3 36,178 856 279,799 44,472 63 Dec 22
Table 5: Distribution of URLs and SMTP connections in the six cam-paigns over varying burstiness and distributedness ranges – all spam(1,774 URLs and 1.3 million connections).
Distributedness (# of ASes)Duration(days)
1-10 10-20 20-100 100-500 ≥ 500 Total
0-5 3.66 0.96 0.00 0.45 0.00 5.07(6.32) (0.02) (0.00) (0.96) (0.00) (7.30)
6-10 1.58 0.00 0.00 1.52 0.00 3.1(6.04) (0.00) (0.00) (1.26) (0.00) (7.30)
11-20 1.52 0.00 0.00 5.13 0.00 6.65(10.74) (0.00) (0.00) (19.40) (0.00) (30.14)
21-40 2.76 0.00 0.00 1.80 0.00 4.56(17.89) (0.00) (0.00) (17.70) (0.00) (35.59)
>40 79.71 0.00 0.28 0.00 0.06 80.05(40.03) (0.00) (0.07) (0.00) (10.67) (50.77)
Total 89.23 0.96 0.28 8.90 0.06(81.02) (0.02) (0.07) (39.32) (10.67)
Software1, all URLs for which started in the last month of the five-month period. A breakdown analysis of distributedness and bursti-ness of the 1,774 URLs for the remaining six campaigns is givenin Tables 5, 6 and 7. Each cell in the tables provides two numbers,the percentage of URLs and the percentage of connections that arecharacterized by a certain range of distributedness and burstiness.Note that the percent values for URLs across a row or column in thetables add up to 100% but this may not be true for percent valuesfor connections. This is because a spam message may contain mul-tiple URLs where each URL may be characterized differently, i.e.,in different cells in the table. Hence, an SMTP connection that sentsuch a message would get counted multiple times, once for each ofthe URLs that it corresponds to.
Table 5 shows the distribution of these 1,774 URLs (1.3 mil-lion connections) in the six campaigns over varying burstiness anddistributedness ranges. We observe that only 0.45% of the URLs(0.96% of SMTP connections) have duration of five days or shorterand are distributed over more than 20 ASes. If we ignore distribut-edness, relatively few connections (7.30%) and URLs (5.07%) oc-cur over short duration (five or fewer days) whereas a majority ofthe connections (50.77%) and URLs (80.05%) advertise URLs thatlasted a long duration (more than 40 days). If we ignore dura-tion, a majority of connections (81.02%) and URLs (89.23%) orig-inate from a small number of ASes (10 or fewer) while a relativelysmaller number (49.99% connections and 8.96% URLs) originatefrom a larger number of ASes (100 or more).
We further analyze whether the above distribution will changesignificantly when a campaign is viewed from an individual desti-nation domain. Such an analysis is useful as spam filtering tech-niques are often deployed at individual domains. Table 6 shows thedistribution of the 1,774 URLs corresponding to over 0.9 millionconnections in the six campaigns that were destined to Yahoo! only.We chose Yahoo! as the destination domain in this analysis as about70% of the spam in the six campaigns were destined to it. We ob-serve the distributions are very similar to those in Table 5; a sig-
Table 6: Distribution of URLs and connections in the six campaignsover varying burstiness and distributedness ranges - only spam des-tined to the Yahoo! domain (1,774 URLs and 0.9 million connections).
Distributedness (# of ASes)Duration(days)
1-10 10-20 20-100 100-500 ≥ 500 Total
0-5 3.72 0.90 0.06 0.45 0.00 5.13(7.53) (0.03) (0.04) (1.00) (0.00) (8.6)
6-10 1.80 0.00 0.00 1.52 0.00 3.32(5.93) (0.00) (0.00) (1.24) (0.00) (7.17)
11-20 1.30 0.00 0.00 5.13 0.00 6.43(8.52) (0.00) (0.00) (21.27) (0.00) (29.79)
21-40 2.82 0.00 0.00 1.80 0.00 4.62(16.14) (0.00) (0.00) (17.96) (0.00) (34.1)
>40 79.59 0.23 0.00 0.00 0.06 79.88(37.94) (0.03) (0.00) (0.00) (10.80) (48.77)
Total 89.23 1.13 0.06 8.90 0.06(76.06) (0.06) (0.04) (41.47) (10.80)
Table 7: Distribution of URLs and connections in the six campaignsover varying burstiness and distributedness ranges – only spam fromnon-blacklisted IPs and destined to the Yahoo! domain (1,748 URLsand 200,000 connections).
DistributednessDuration(days)
1-10 10-20 20-100 100-500 ≥ 500 Total
0-5 6.01 0.06 0.46 0.00 0.00 6.53(27.17) (0.05) (0.93) (0.00) (0.00) (28.15)
6-10 3.38 0.00 1.54 0.00 0.00 4.92(7.59) (0.00) (0.98) (0.00) (0.00) (8.57)
11-20 4.29 0.00 2.80 2.57 0.00 9.66(9.43) (0.00) (11.94) (20.80) (0.00) (42.17)
21-40 21.11 0.00 0.00 1.66 0.00 22.77(22.85) (0.00) (0.00) (14.49) (0.00) (37.34)
>40 53.83 0.00 0.00 0.06 0.00 53.89(19.01) (0.00) (0.00) (10.91) (0.00) (29.92)
Total 88.62 0.06 4.8 4.29 0.00(86.05) (0.05) (13.85) (46.2) (0.00)
nificant percentage of spammed URLs exhibit persistence and areadvertised via a small number of ASes.
Finally, we analyze whether the above distribution will changewhen the spam trace is examined after filtering out the spam origi-nated from blacklisted source IPs. We perform this analysis as thetrace in [22] was processed this way and hence it helps us to isolatefactors that potentially contribute to the different observations. Af-ter removing the spam originated from blacklisted source IPs (over75% spam sources were blacklisted in at least one of the five black-lists queried), there are 1,748 URLs and about 200,000 connectionsin the six spam campaigns that were destined to Yahoo! only. Ta-ble 7 shows the distribution of these URLs and connections. Com-pared to the distribution before removing spam due to blacklistedIPs, there is a significant reduction in distributedness, but only arelatively small reduction in duration. In particular, the URLs thathave duration of five days or shorter and distributed over more than

20 ASes remain at 0.46% (and the connections at 0.93%). If weignore distributedness, 6.53% of the URLs have duration of fivedays or shorter, but the URLs with duration over 40 days remainssubstantial, at 53.89%. If we ignore duration, 88.62% of the URLsorignate from 10 or fewer ASes, while 4.29% of URLs originatefrom 100 or more ASes.
The above finding on the duration of per-URL spam clustersfrom our trace is in sharp contrast to the previous study in [22]where the authors observed that the vast majority of URLs are ac-tively advertised for a short burst of less than five days. This findinghas significant implications on the design of signature extraction al-gorithms for detecting spam, as we show next.
5.3 Implications on Signature GenerationTo estimate the impact of this finding on the efficacy of campaign
signature generation, we re-implemented the spam signature gen-eration technique proposed in [22]. Specifically, we analyzed thesix manually identified campaigns as observed by Yahoo! after fil-tering out spam from blacklisted source IPs. The URL/connectiondistributions of this trace are in Table 7. We first used the same at-least-20-ASes cutoff for the “distributedness” property as in [22] tofilter out the spam containing URLs that are not distributed enough.For the remaining spam, we then used the burstiness duration offive days as in [22], and generated Complete URL (CU) signatures.We focused on the CUs as the authors of [22] reported a majority(70.3-79.6%) of the spam campaigns identified belonged to the CUcategory. Using the signatures generated, we calculated the num-ber of connections that would be blocked by those signatures, as apercentage of all the spam mails containing all the URLs originatedfrom 20 or more ASes. This gives us the “false negative ratio” inusing the CU signatures to filter the spam. The false negative ratiois calculated to be 98.21%. We repeated the scheme using a 20-dayburstiness cutoff, and the false negative ratio is reduced to 79.21%.
To summarize, while the authors in [22] considered burstiness asa necessary criteria in narrowing down the candidate pool of URLson which they apply signature extraction, we argue otherwise. Us-ing a short duration of five days as the burstiness criteria can leadto very high false negative ratios. Our empirical observation high-lights the challenges in accurately extracting spam signatures, sinceto reduce false negatives, it would be necessary to apply keywordextraction and signature generation algorithm across a very largeset of spam that encompass duration as large as several months.This suggests that relying on burstiness as a criteria for signatureextraction may prove counter-effective as it may be too late to reactand block the spam.
6. INDIVIDUAL SPAMMER BEHAVIORIn this and the next section, we analyze botnet spam campaigns
in detail to gain insights into the workload distribution and coordi-nation amongst the members of a botnet that originate a spam cam-paign. Since we no longer analyze the spam for individual URLs,we make use of the entire spam trace for all seven manually identi-fied campaigns of 2.09 million connections and 2,042 URLs. Dueto space restrictions, in this section we focus on three spam cam-paigns identified in our trace, based on their distinctive features:SC-Book has a large number of distinct URLs, SC-Adult1 has alarge number of source IPs, and SC-Software1 is relatively short induration but is highly distributed in terms of the number of ASescorresponding to the spam sources. As explained in Section 3.2, weuse the number of SMTP connections to characterize the workload.
Figure 3 shows the number of SMTP connections made per dayto our spam relay and number of unique IP addresses per day thatcontact our relay for the three selected spam campaigns. We ob-
serve similarly as in Figure 1, that all three campaigns have a fairlysteady total workload per day over the 2.5-month period. But doesthis stability in aggregate behavior for a spam campaign imply uni-formity in terms of workload per spammer as well? In particular,we seek to answer the following two questions related to the work-load distribution amongst the spammers of one campaign:
• Are the spammers belonging to the same campaign assignedan equal amount of workload, i.e., connections made? If not,what causes the uneven workload?
• How does each spammer accomplish its workload over time?
6.1 Workload DistributionFigure 4 shows the workload distribution per spammer IP for the
three spam campaigns. Note that despite the relative stability interms of the total number of connections per spam campaign overtime, the workload of each spammer for a given campaign varieswidely from 1 to 1,000 SMTP connections per spammer IP address.
A natural question that arises is whether this uneven workloaddistribution is correlated with, and hence explained by, the arrivaltime of spammers joining a spam campaign. In other words, dospammers that join a campaign earlier than others send more spamfor a given campaign, potentially due to their confirmed ability todeliver spam?
While it is possible that a spammer joined a campaign long be-fore it initiated its first SMTP session to our relay, there is no easyway to establish the ground truth about this. Therefore, we usethe time a spammer initiated its first SMTP session for a particularcampaign to our relay as its arrival time for that campaign.
Figure 5 plots the spamming activities of spammers sorted inincreasing order of their arrival time, for the three spam campaigns.We see a fairly even spread in arrival times for spammers, and amajority of spammers continue spamming for a campaign for longperiods of time. In particular, for SC-Adult1, a few spammers wereseen to be actively spamming for almost 2.5 months.
Next, Figure 6 plots the number of spam connections per IP ad-dress for the three campaigns, sorted in increasing order of theirarrival time, as in Figure 5. From Figure 6, it is hard to observe atrend for SC-Book, SC-Adult1, and SC-Software1. Hence we alsoplot a Simple Moving Average (SMA) curve for these campaigns.For every IP address on the y-axis, we average the values for the250 IP addresses above it and 250 below it, and join these pointsper IP through a curve which we call SMA. Now a trend can beobserved for SC-Book, with the latter arrivals sending less spamthan the earlier arrivals. Interestingly, no such trends are presentfor SC-Software1 and SC-Adult1, with each IP address making asimilar 7-10 connections during its lifetime of the campaign.
6.2 Workload Spread Over TimeNext, we study how an individual spammer in a campaign ac-
complishes its workload over time.Short-duration spammers. Figure 7 depicts a percentage-percentageplot, where the y-axis is the percentage of spam sources and the x-axis is the percentage of spam sent by them, during the first 1, 8 and24 hours of their arrival into the three campaigns, Book, Adult1,and Software1, as seen by the relay. A point (x, y) on the curve fort hours for a particular campaign means y% of spam sources spamat least x% of their workload in the first t hours of their arrival.
For SC-Book, Figure 7(a) shows that 20% of sources completetheir entire workload (100% on the x-axis) within the first hour oftheir arrival. However, only 60% of the sources send 10% or moreof their total workload within the first hour of spamming. Further-more, note that the percentage of spam sent by a spammer during

1
10
100
1000
10000
100000
1e+06
FebJanDecNov
Num
ber
Time
SC-Book
conn. countsource IP count
1
10
100
1000
10000
100000
1e+06
FebJanDecNov
Num
ber
Time
SC-Adult1
conn. countsource IP count
1
10
100
1000
10000
100000
1e+06
FebJanDecNov
Num
ber
Time
SC-Software1
conn. countsource IP count
Figure 3: Number of mails and number of source IPs per day for SC-Book, SC-Adult1, and SC-Software1.
Figure 4: CDF of workload per source IP for three spam campaigns.
Figure 5: Correlation between spammer IP and its spamming activities, sorted in increasing order of arrival time, for the three spam campaigns.
the first 1, 8 and 24 hours of its arrival in the campaign remainsnearly the same. These facts imply that some spammers (20%) fin-ish their workload as soon as they first arrive in the campaign, whileothers make multiple visits across several days before they deliver100% of their workload.
For SC-Adult1 and SC-Software1, we see a completely differenttrend when compared to SC-Book. We see that these two cam-paigns observe different workload behavior during the first 1, 8, 24hours. More than 90% of the spam sources complete all their workwithin 8 hours after their arrival, and about 75% complete their en-tire workload during the first hour.
Bursty spamming behavior. The above analysis of SC-Adult1 andSC-Software1 indicates the “spam and move on” behavior by indi-vidual spam sources. We emphasize that this is not to be confusedwith the “burstiness” of spam campaigns as defined in Section 5.SC-Book, on the other hand, shows reuse of a spammer for spam-ming since a spammer does not complete its workload on the firstday (Figure 7(a)) of its appearance. We next focus on SC-Book toinvestigate how often spam sources revisit our relay and the char-acteristics of their spamming activities such as the number of con-nections and the duration of spamming at each visit.
We define a “burst” event by a spam source as the time durationthat starts when we observe the first spam from an IP and ends at apoint after which there is no spamming activity from it for at least apre-chosen period of time which we denote as the “numb” period.Within a burst, the time gap between any two consecutive spamemails would be less than the “numb” period. Using this definition,the spam history of an IP follows the pattern of oscillating periodsof burst and numb, i.e., burst - numb - burst - numb, and so on.
We select a “numb” period of one hour since Figure 7(a) shows forSC-Book the spam workload distribution for the first hour nearlyequals the workload distribution for the first 8 and 24 hours.
We now study the burst characteristics for SC-Book. Figure 8plots the CDF of the number of bursts per IP. We see that 20%of IP addresses participate in the campaign with only one burst.The fact that spammers revisit the relay to continue SC-Book isvindicated by observing that about 18% of spam sources participatein the campaign for more than 10 bursts. Figure 9 plots the CDFof the average time duration of a burst per IP address. We see thatmore than 80% of IPs have average burst lengths longer than 100seconds and nearly all of them finish in less than 1,000 seconds.This indicates the stealthy behavior of spammers where they finishtheir workload per burst within 100-1,000 seconds. Figure 10 plotsthe CDF of the average workload per burst per IP address. 90%of the IPs for this campaign have an average workload per burst offewer than 10 connections. We also plot the CDF of the spammingworkload per IP address for the first hour. We observe that the firstburst by an IP typically delivers fewer spam emails compared to theaverage workload per burst. In summary, SC-Book shows a stealthybehavior, where spammers visit the relay multiple times, with eachvisit of “bursty” short duration on the order of 100-1,000 seconds,and comprising of a low volume of 10 or fewer connections.
6.3 Workload and Access Link CapacityWe now turn back to the question raised in Section 6.1 regard-
ing the cause for the uneven workload distribution among spam-mers and examine possible correlation between the workload andthe network access link capacity of different spammers.

0 1000 2000 3000 4000 5000 6000 7000 8000 9000
10 20 30 40 50 60 70 80 90 100
Sour
ce IP
Number of connections
SC-Book
Figure 6: Number of connections per source IP for three spam campaigns, sorted in increasing order of their arrival time. (note: the x-axis haslinear scale for SC-Book and log scale for other two graphs.)
0
20
40
60
80
100
10 20 30 40 50 60 70 80 90 100
% S
ourc
e IP
(a) %load
SC-Book
1 hour8 hours
24 hours 0
20
40
60
80
100
10 20 30 40 50 60 70 80 90 100
% S
ourc
e IP
(b) %load
SC-Adult1
1 hour8 hours
24 hours 0
20
40
60
80
100
10 20 30 40 50 60 70 80 90 100
% S
ourc
e IP
(c) %load
SC-Software1
1 hour8 hours
24 hours
Figure 7: Distribution of workload (in connections) accomplished by spammers in the first 1/8/24 hours for SC-Book, SC-Adult1, and SC-Software1.
Measuring the access link capacity of a link remotely is a diffi-cult problem [7]. We used the tool proposed in [7] to measure theaccess link capacity of a remote spamming host as follows. Foreach five-hour duration, we collected all the new IP addresses thatspammed our relay. At the end of it, if there were more than 800 IPscollected, we randomly sampled 800 of them (otherwise we choseall of them)2 and fed them to four machines, each of which used thetool described in [7] to measure the link capacity of 200 hosts. Thecap of 800 was so that the measurement could finish in five hoursusing the four machines. We repeated this procedure for about onemonth and measured the link capacity for a total of 92,000 spamsources. Unfortunately, only 2,231 hosts responded to the packettrains sent by the prober.
Since we had the capacity information for only 2,231 hosts, in-stead of performing a per spam campaign analysis for them, we per-formed an aggregate study for these sources. In particular, for eachof these 2,231 IP sources, we found out the average burst workload,average burst length, and number of bursts across all the campaignscombined, with the “numb” period being one hour. Figures 11(a)-(c) show the scatter plots between these metrics for each of theseIPs, versus its upload capacity. We also plot the Simple MovingAverage (SMA) for all three scatter plots by taking an average of50 points above and 50 below a particular point.
Figure 11(a) shows that the higher the spammer upload capacity,the larger the workload per burst to the relay from that spammer(note that the x-axis is in log scale). The SMA of the average burstworkload in fact shows an exponential increase as the upload ca-pacity increases. Figure 11(b) suggests that the higher the uploadlink capacity (of a spamming host), the longer the burst duration.The SMA of the average burst time increases from about 30 min-utes for low link capacity spammers to about three hours for highlink capacity spammers. Figure 11(c) shows a similar trend in thenumber of bursts from an IP address when compared with its up-load capacity.
We conclude from above that the higher a spammer’s capacityto spam, the heavier workload it tends to deliver. This suggeststhat the controllers exploit the upload capacities of their spamming2We note that an IP address seen by our relay could be a NAT. Wedo not make a distinction among spam sources in this regard.
bots. The simplest way to achieve this appears to be one where acontroller divides the workload into equally sized chunks, and asa bot finishes a piece, it retrieves another. This would enable thecontroller to exploit the different capacities of bots, as well as dealreasonably well with bots that get turned off unexpectedly.
7. COORDINATION AMONGST SPAMMERSIn Section 6, we made the observation that spam campaigns are
fairly stable over time in terms of the number of SMTP connec-tions and the number of source IPs per campaign (see Figure 3).We also saw that individual spammers could be bursty, with spam-mers for an example campaign (SC-Book) sending multiple shortbursts, each lasting 100-1,000 seconds. Finally, we saw that in-dividual spammers are assigned a diverse workload per campaignranging from 1 to 1,000 SMTP connections per campaign (see Fig-ure 4). That still leaves the following question unanswered: despitethe disparity in workload across spammers, why does the aggregatebehavior of a campaign still appear relatively stable over time? Inthis section, we provide a breakdown of a spam campaign in termsof the geographical distribution of spammers in an attempt to an-swer this question. Further, we also study the coordination amongstthe spammers that participate in the same campaign and those thatparticipate across different campaigns. In Sections 7.1 and 7.2, weuse SC-Adult1 which involves over 90,000 spammers from all overthe world.
7.1 Steady Aggregate Behavior of a CampaignTo better understand the disparity between the steady aggregate
behavior of a campaign and the diverse individual behavior of spam-mers, we break down the spammers belonging to a campaign bythe domains targeted and by the geographic regions from whichthe spammers originate. We obtain the geographic region for an IPusing Maxmind [13].
We study one week of spam activity in SC-Adult1 from Febru-ary 10th to 17th. We start by looking at all the spamming activitiesdestined to all the domains as seen at the relay. In this one weekperiod, our relay observed a total of about 0.15 million connec-tions containing spam messages destined to 90,000 domains. Fig-ure 12(a) shows the number of SMTP connections per hour made

0
20
40
60
80
100
1 10 100
CDF
Number of bursts
Figure 8: CDF of number of bursts per IP forSC-Book.
0
20
40
60
80
100
1 10 100 1000 10000
CDF
Burst Time Length (seconds)
Figure 9: CDF of average length of bursts perIP address for SC-Book.
0
20
40
60
80
100
1 10 100
CDF
Load (number of connections)
burstfirst hour
Figure 10: CDF of average workload perburst per IP, and of workload in the first hourof spamming per IP, over all IPs, for SC-Book.
0 100 200 300 400 500 600 700 800 900
1 10 100 1000
Uplo
ad C
apac
ity (k
bps)
(a) Burst Load
0 100 200 300 400 500 600 700 800 900
1 10 100 1000 10000 100000
Uplo
ad C
apac
ity (k
bps)
(b) Burst Time Length (seconds)
0 100 200 300 400 500 600 700 800 900
1 10 100 1000
Uplo
ad C
apac
ity (k
bps)
(c) Number of bursts
Figure 11: Scatter plots of the upload capacity of an IP vs. its burst characteristics (across all campaigns spammed by the IP), (a) average burstworkload, (b) average burst duration, and (c) number of bursts, for 2,231 spamming IPs. Also shown are the SMA (simple moving average) across100 neighboring IPs.
to our relay over the one week time period. Similar to what wasseen from Figure 3, the aggregate behavior in terms of the numberof connections is stable over time.
Per-day activities to different domains. We next separate spamfor SC-Adult1 by the different domains targeted. We identify thatthis campaign targets users in four major domains: Yahoo!, Gmail,Hotmail, and Hinet. Interestingly, the number of connections madeto our relay for this campaign that is heading to any of these do-mains is still stable over time (figures not shown).
Per-day activities from different regions. We next separate spamfor SC-Adult1 according to where the spammer is geographicallylocated: India, Argentina, Brazil, and China, as shown in Fig-ure 12(b)-(e). Note that the time on the x-axis for all figures isin EST. Interestingly, the number of connections made from eachgeographic region follows a diurnal variation, peaking during thelocal timezone’s mid-day. For instance, for sources originatingfrom India, the leftmost point on the x-axis corresponds to 1:30pm IST, which is when the peak activity occurs. Similar behavioris seen for Argentina and Brazil. The number of connections fromChina does not exhibit as pronounced diurnal variations and wesuspect this could be due to the country straddling many longitudeswhich could contribute to a statistically multiplexed behavior. Thefact that bots from each country seem to generate the maximumspam during their local mid-day could be explained by previous re-ports about the working of spam botnets. For instance, the authorsin [12] reported that Storm Bots typically finish majority of theirspam workload within four hours of the machine being booted up.
Interestingly, the geographically distributed nature of botnets com-bined with the different timezones explains the reason why cam-paigns such as SC-Adult1 (and all other campaigns observed byour relay) exhibit a stable behavior over time.
Per-hour activities per region to a domain. Finally, we study thenumber of connections made by spammers from different countriesto a single destination domain, Yahoo! mail. The resulting graphs,not shown due to space limitation, appear very similar to thosein Figure 12(b)-(e). This is because about 60% of the recipients
for SC-Adult1 are in the Yahoo! domain. Plots for other domainssuch as Hotmail, Gmail and Hinet also show similar behavior. Themain observation we derive from these results is that there is nodestination-specific scheduling of spam by spammers, with each ofthe large domains exhibiting similar per-origin-country pattern asthe aggregate spam campaign.
7.2 Intra-Campaign CoordinationNext, we explore the coordination amongst spammers that par-
ticipate in the same campaign. This coordination is reflected in avery interesting way in the mailboxes being spammed. First, weobserve that each SMTP connection delivers spam mails to alpha-betically close recipients (an observation similar to [6, 15]). Tofurther investigate the workload balancing strategy used across thespamming sources, we analyze the correlation between the spamsource IPs and the corresponding mailboxes. In Figure 13, we plota scatter plot of spam source IPs versus the recipients to whom theyspam in SC-Adult1, where all the recipients in the campaign, i.e.,the email addresses, are sorted alphabetically, and the spam sourceIPs are sorted in increasing order of their arrival time in the cam-paign. For clarity, we only show a portion of the whole campaign -10,000 contiguous spam sources labeled from 10,000 to 20,000.
We observe a few “slanted” lines in Figure 13. Based on this weconjecture that either the Botnet controller or a “job dispatcher” ismaintaining the list of recipients in an alphabetically sorted manner.Two IPs that contact the controller one after another are given outrecipients from the sorted list in a first-in first-out order, and hencea slanted line joins two IPs close in time with recipient lists that arealso close in the alphabetical order.
Interestingly, there are several such slanted lines in the figure.One possible explanation for this could be due to the existence ofmultiple “job dispatchers” (which could be located on a single ma-chine or on several machines in an overlay as observed in the StormBotnet [12]), where each dispatcher has a sorted recipient list of itsown. Thus, IPs in a botnet contact their respective job dispatch-ers, and the parallel slanted lines correspond to jobs obtained fromdifferent dispatchers.

1
10
100
1000
2/172/162/152/142/132/122/112/10
(a) From all sources
All
1
10
100
1000
2/172/162/152/142/132/122/112/10
(b) From India
IN
1
10
100
1000
2/172/162/152/142/132/122/112/10
(c) From Argentina
AR
1
10
100
1000
2/172/162/152/142/132/122/112/10
(d) From Brazil
BR
1
10
100
1000
2/172/162/152/142/132/122/112/10
(e) From China
CN
Figure 12: Connection count per IP per hour for SC-Adult1 accordingto all sources, sources from India, Argentina, Brazil and China.
7.3 Cross-Campaign InteractionsNext, we study cross-campaign interactions from the point of
view of spam sources. Specifically, we analyze the overlap betweenspammers across different spam campaigns.Do spam sources participate in different campaigns? We firstfind out whether there is an overlap amongst spammer IPs that par-ticipate in different campaigns. For this purpose, we define a met-ric, source overlap, to quantify the overlap in terms of spam sourcesacross two campaigns. If set A and set B contain IP addressesspamming campaigns A and B respectively, then we define sourceoverlap OA,B between these two sets as
OA,B =‖ A ∩ B ‖
min(‖ A ‖, ‖ B ‖)× 100 (1)
Figure 14 plots the source overlap metric for each pair of theeight spam campaigns that were identified in Table 4. From thefigure we see that SC-Book does not have much overlap with otherSCs, but there is a considerable overlap amongst the other SCs.
We observe that SC-Adult1 and SC-Software1 have about 48%source overlap. Earlier we had observed that nearly all the spamsources for these two campaigns finish their spam workload in thefirst one hour of spamming (Figure 7). We next explore what thesespam sources do once they are done with sending spam for onecampaign. In particular, do they immediately start sending spamfor the other campaign?
In the following analysis, we carefully construct a set of IP ad-dresses (described next) and study their properties across these twocampaigns, Adult1 and Software1. Since SC-Software1 is observed
Figure 13: Scatter plot demonstrating the breakdown of workload interms of spam recipients across IPs for SC-Adult1. Each point in theplot depicts a particular IP on y-axis spamming a recipient on x-axis.
100
100
100
100
100
100
100
0.11 0.06 0 0.02 0 0
69.24 40.20 39.99 29.77 47.79
72.61 38.78 37.87 32.10
23.87 76.63 15.32
6.64 3.56
5.00
Book Adult2Adult3 Software2
Software1ShoppingAdult1
Book
Adult1
Adult2
Adult3
Shopping
Software2
Software1
Figure 14: Pairwise “Source IP Overlap” among the seven campaigns.
for about 12 days, starting mid-February, we first prune all the spammails in SC-Adult1 that lie outside the 12-day period (February 12 -25) of SC-Software1. This leaves us with 22,567 total spam sourcesand 228,000 total SMTP connections for SC-Adult1. Second, sincewe are interested in spam sources that spam most of their workloadin the first one hour, we further prune sources that spam more thanone burst from both campaigns. Third, we extract the spam sourcesleft after step two that were observed spamming in both campaigns.We call this set the “common-set”. We now study the properties ofthe 6,550 spam sources belonging to this common-set.
How close in time do the sources spam for different campaigns?For the spam sources in the common-set, we calculated the timedifference when they started spamming for SC-Adult1 and SC-Software1. Figure 15 plots the CDF of the absolute time differencebetween the starting time of the bursts by the common IPs acrossthe two campaigns. We observe that about 70% of the spam sourcesspam the two campaigns within a period of one hour. About 85% ofsources spam the two campaigns within a period of two hours. Thisclearly suggests that spam sources switch to the next campaign assoon as they are done with their workload in one campaign.
Do the sources spam the same amount of workload across cam-paigns? For the spam sources in the common-set, we calculatedthe number of SMTP connections (workload) they spammed foreach of the campaigns. Specifically, we are interested in find-ing whether they spammed different amount of workload in thetwo campaigns. Figure 16 plots the CDF of the absolute differ-ence of per-IP workload in the two campaigns, for every IP in thecommon-set. From the figure we see that 40% of IPs belonging tothe common-set had a workload difference of at most one connec-tion. About 80% of IPs had a workload difference of less than fourconnections. This suggests that the spamming workload of a sourceis a property dependent on the characteristics of the spam host andnot much dependent on the campaign that it spams for.

0
20
40
60
80
100
0 1 2 3 4 5
CDF
Time difference (hrs)
Figure 15: CDF of absolute time difference between first spam by anIP to SC-Adult1 and first spam to SC-Software1, for all the IPs in thecommon-set.
0
20
40
60
80
100
1 10 100
CDF
Load Difference
Figure 16: CDF of absolute difference between workload for all theIPs in the common-set for SC-Adult1 and SC-Software1.
Do spam sources spam the same recipients across campaigns?We next analyze whether the spam sources belonging to the common-set spam the same set of recipients. The 6,550 IPs belonging to thecommon-set made about 87,294 and 96,387 connections to our re-lay to deliver spam to SC-Adult1 and SC-Software1, respectively.They attempted to relay spam to 207,538 and 209,566 recipients,respectively. Out of 6,550 IPs, only three had at least one commonrecipient across the two campaigns. This suggests though the com-mon IP addresses spam in close time intervals across campaignsand with the same workload, they do not spam the same mailboxes.
8. CONCLUSIONSIn this paper, we presented a trace-driven analysis that character-
izes the burstiness and distributedness of botnet spam campaigns.To enable our study, we manually identified seven major URL-based botnet spam campaigns containing 2,042 distinct URLs and2.09 million SMTP connections from a five-month trace capturedby a spam relay. Our study shows that URL-based campaigns canbe prolonged, sometimes lasting for periods of 99 days, suggestingthat burstiness can not be used as a necessary criteria to assist clus-tering URL-based spam campaigns. Indeed, we showed burstiness-based campaign generation with a cutoff of five days led to a highfalse negative ratio (98.21%). Our finding suggests that despiterecent advances, the problem of campaign identification with rea-sonable false negatives is harder than previously thought.
We further studied the characteristics of three botnet campaigns.Though campaigns are found to be long lasting, individual botscan exhibit a bursty behavior, with bots for one campaign (Book)contacting the relay in multiple bursts (18% of bots arrive in 10 ormore bursts) with each burst lasting a short duration of 100-1,000seconds. We also studied the coordination across spammers in acampaign and for one campaign (Adult1), we identified a patternwhere the spammers that arrived at the relay in contiguous timewere found spamming recipients that were in alphabetically sortedorder, suggesting FIFO job dispatching by the spam coordinators.Finally, we studied the interactions among the bots that spam on
behalf of multiple campaigns and found that such common botsgenerate spam for each campaign in close-by time, with the sameworkload per campaign, but to distinct recipients across campaigns.
In future work, we plan to study the interactions between spamcampaign identification schemes and IP blacklisting. On one hand,bots identified in botnet spam campaigns can help to enhance thefreshness of IP blacklists. On the other hand, the IPs already inthe IP blacklists can potentially help to speed up the detection ofnew or evolving campaigns. Finally, we plan to develop automatedschemes that exploit the spam content in addition to spam labelsfor accurate and timely campaign identification and signature gen-eration.Acknowledgments: We thank the anonymous reviewers for theirhelpful comments. We are especially grateful to our shepherd, Mar-tin Arlitt, whose detailed comments drastically improved the pre-sentation of this paper. This work was supported in part by NSFgrant CNS-0738419.9. REFERENCES[1] Route Views Project Page. http://www.routeviews.org.[2] D. S. Anderson, C. Fleizach, S. Savage, and G. M. Voelker.
Spamscatter: Characterizing internet scam hosting infrastructure. InProc. of USENIX Security, 2007.
[3] Bl: Spamcop blocking list. http://bl.spamcop.net.[4] A. Z. Broder, S. C. Glassman, M. S. Manasse, and G. Zweig.
Syntactic clustering of the web. Comput. Netw. ISDN Syst.,29(8-13):1157–1166, 1997.
[5] CBL: Composite Blocking List. http://cbl.abuseat.org/.[6] R. Clayton. Do zebras get more spam than aardvarks? In Proc. of
CEAS, 2008.[7] M. Dischinger, A. Haeberlen, K. P. Gummadi, and S. Saroiu.
Characterizing residential broadband networks. In Proc. of ACMSIGCOMM IMC, 2007.
[8] SORBS: Spam and Open-Relay Blocking System.http://dnsbl.sorbs.net.
[9] DSBL: Distributed Sender Blackhole List. http://list.dsbl.org.[10] C. Kanich, C. Kreibich, K. Levchenko, B. Enright, G. M. Voelker,
V. Paxson, and S. Savage. Spamalytics: an empirical analysis ofspam marketing conversion. In Proc. of ACM CCS, 2008.
[11] M. Konte, N. Feamster, and J. Jung. Dynamics of online scamhosting infrastructure. In Proc. of PAM, 2009.
[12] C. Kreibich, C. Kanich, K. Levchenko, B. Enright, G. M. Voelker,V. Paxson, and S. Savage. On the spam campaign trail. In Proc. ofUSENIX LEET, 2008.
[13] Maxmind - ip geolocation and online fraud prevention.http://www.maxmind.com/.
[14] Njabl: Spam blocking blacklist. http://www.njabl.org/.[15] A. Pathak, Y. C. Hu, and Z. M. Mao. Peeking into spammer behavior
from a unique vantage point. In Proc. of USENIX LEET, 2008.[16] Pbl: The policy block list. http://www.spamhaus.org/pbl/.[17] A. Ramachandran and N. Feamster. Understanding the network-level
behavior of spammers. In Proc. of ACM SIGCOMM, 2006.[18] A. Ramachandran, N. Feamster, and S. Vempala. Filtering spam with
behavioral blacklisting. In Proc. of ACM CCS, 2007.[19] Super webscan.
http://www.sharewareconnection.com/super-webscan.htm.[20] Joe st sauver: Evolving methods for sending spam and malware.
http://www.ftc.gov/bcp/workshops/spamsummit/presentations/Evolving-Methods.pdf.
[21] The spamhaus project. sbl-xbl.spamhaus.org.[22] Y. Xie, F. Yu, K. Achan, R. Panigrahy, G. Hulten, and I. Osipkov.
Spamming botnets: signatures and characteristics. In Proc. of ACMSIGCOMM, 2008.
[23] L. Zhuang, J. Dunagan, D. R. Simon, H. J. Wang, I. Osipkov,G. Hulten, and J. Tygar. Characterizing botnets from email spamrecords. In Proc. of USENIX LEET, 2008.
[24] 2006 spam trends report: Year of the zombies.http://www.commtouch.com/downloads/Commtouch_2006_Spam_Trends_Year_of_the_Zombies.pdf.