brand building strategies through promotional campaigns
29
ZENITH International Journal of Business Economics & Management Research Vol.2 Issue 5, May 2012, ISSN 2249 8826 Online available at http://zenithresearch.org.in/ www.zenithresearch.org.in 153 BRAND BUILDING STRATEGIES THROUGH PROMOTIONAL CAMPAIGNS: AN EMPIRICAL STUDY DR. PARIKSHAT SINGH MANHAS*; VIVEK SHARMA** *Associate Professor, The Business School, University of Jammu, Baba Sahib, Ambedkar Road, New Campus, Jammu (J&K) - 180006 India. **Co-ordinator, Department of Life long Learning, University of Jammu, Baba Sahib Ambedkar Road, New Campus, Jammu (J&K) - 180006 India. ABSTRACT The present study is based on exploring the link between brand building and the Promotional Campaigns. Companies are spending millions of rupees on these promotional Campaigns with an objective of build their brands thus this study is an attempt to study the connectivity between them. With this objective carbonated soft drink market was selected and various umbrella / sub- brands of Pepsi along with their promotional Campaigns were studied to assess their contribution in the brand building process. Also the various parameters on which consumers evaluate a particular brand along with perception of the consumers about these Promotional Campaigns were studied so to conclude that “Are they successful in changing the perception of the consumers?” Finally, Promotion was studied bro adly and the various Promotional tools used by these companies were studied and the consumers were asked to rate these tools on a five point likert scale to assess the effectiveness in the brand building process. Thus findings of the study suggested that also to consider new Promotion strategies along with traditional methods of Promotion. KEYWORDS: Branding, Brand building, Pepsi, Promotion, Promotional Campaigns; Promotional tools. ______________________________________________________________________________ INTRODUCTION Promotional Campaigns as an element plays a crucial part in brand building. Although, the four basic elements of Promotion are Advertising, Personal selling, Sales Promotion and Publicity or Public Relations but Laric & Lynagh (2009) concluded that Advertising used to be the body and soul of promotion. Even the role of Public Relation is as important as Advertising. The public relation mix strategies are helpful and effective for promotion. Duncan (2008) explained the public relations (PR) mix includes publications, events, news, speeches, and others. The next thing is Personal Selling and according to Engle et. al., (2008), Personal Selling is interpersonal, face-to-face promotion where the exposure is usually done on a voluntary basis and the feedback comes quickly. The use of personal selling is an important ingredient in promotion, but perhaps more important in the industrial goods segment. In the similar way, Sales Promotion also holds up a strategic position in the overall promotional campaigns processes.
-
Upload
khangminh22 -
Category
Documents
-
view
4 -
download
0
Transcript of brand building strategies through promotional campaigns

ZENITH International Journal of Business Economics & Management Research
Vol.2 Issue 5, May 2012, ISSN 2249 8826 Online available at http://zenithresearch.org.in/
ww
w.z
enit
hre
sear
ch.o
rg.i
n
15
3
BRAND BUILDING STRATEGIES THROUGH PROMOTIONAL
CAMPAIGNS: AN EMPIRICAL STUDY
DR. PARIKSHAT SINGH MANHAS*; VIVEK SHARMA**
*Associate Professor,
The Business School,
University of Jammu, Baba Sahib, Ambedkar Road, New Campus, Jammu (J&K) - 180006 India.
**Co-ordinator, Department of Life long Learning,
University of Jammu, Baba Sahib Ambedkar Road,
New Campus, Jammu (J&K) - 180006 India.
ABSTRACT
The present study is based on exploring the link between brand building and the Promotional
Campaigns. Companies are spending millions of rupees on these promotional Campaigns with an
objective of build their brands thus this study is an attempt to study the connectivity between
them. With this objective carbonated soft drink market was selected and various umbrella / sub-
brands of Pepsi along with their promotional Campaigns were studied to assess their contribution
in the brand building process. Also the various parameters on which consumers evaluate a
particular brand along with perception of the consumers about these Promotional Campaigns
were studied so to conclude that “Are they successful in changing the perception of the
consumers?” Finally, Promotion was studied broadly and the various Promotional tools used by
these companies were studied and the consumers were asked to rate these tools on a five point
likert scale to assess the effectiveness in the brand building process. Thus findings of the study
suggested that also to consider new Promotion strategies along with traditional methods of
Promotion.
KEYWORDS: Branding, Brand building, Pepsi, Promotion, Promotional Campaigns;
Promotional tools.
______________________________________________________________________________
INTRODUCTION
Promotional Campaigns as an element plays a crucial part in brand building. Although, the four
basic elements of Promotion are Advertising, Personal selling, Sales Promotion and Publicity or
Public Relations but Laric & Lynagh (2009) concluded that Advertising used to be the body and
soul of promotion. Even the role of Public Relation is as important as Advertising. The public
relation mix strategies are helpful and effective for promotion. Duncan (2008) explained the
public relations (PR) mix includes publications, events, news, speeches, and others. The next
thing is Personal Selling and according to Engle et. al., (2008), Personal Selling is interpersonal,
face-to-face promotion where the exposure is usually done on a voluntary basis and the feedback
comes quickly. The use of personal selling is an important ingredient in promotion, but perhaps
more important in the industrial goods segment. In the similar way, Sales Promotion also holds
up a strategic position in the overall promotional campaigns processes.

ZENITH International Journal of Business Economics & Management Research
Vol.2 Issue 5, May 2012, ISSN 2249 8826 Online available at http://zenithresearch.org.in/
ww
w.z
enit
hre
sear
ch.o
rg.i
n
15
4
While the terms “Brand”, “Branding” and “Brand Building” are inter-related to each-
other. These hold utter importance in the segment of product selling as well as service sector
where the intangible aspects raised their significance. To understand, the terminology of these
three terms, their definitions and other relevant supportably references are defined further in this
chapter of introduction. After that, the promotional campaigns and their role in these terms are
defined with the last section of this chapter correlated the role and impact of the promotional
campaigns in building the overall brand, particularly, in product segment, where the tangibles
aspects heavenly relied on continuous promotional campaigns to pull the customers towards buy
the product or to consume the services.
Previously, brand was just another step and it come under the broad category of
Marketing the products. It was served as an effective and efficient tool for selling the product
and helps in retaining the customers through practicing the concept of brand loyalty. With the
passage of time, the brand‟s paradigm shifted towards the branding and brand building
processes. After the term “brand”, the process of “branding” came into existence. Philip Kotler
(2000, p. 404), mentioned the role of “branding” as “a major issue in product strategy”. From
product designing to the product consuming, the branding ultimately became a strategically
importance for the product existence.
Marketing plays a vital role in build the strategic brand while the continuous innovation
helps the business to re-emerge several times and expands their business life-span. Promotional
Campaigns under the stream of Marketing hold relevance in overall brand building of the
product. The case studies form British Market in FMCG sector clearly depicted the role of brand
building and brand enhancing. Fitzgerald (1995) showed how the development of key brands in
the firm such as Aero and Kit-Kat reversed the ill-fortunes of the company by being market-
focused, clearly positioned, highly differentiated from their competitors and possessing qualities
which resonated with consumer needs and preferences. The second work is Vernon Ward‟s
account of the marketing and branding of Horlicks during the interwar period (Ward, 1994).
Vernon shows how Horlicks, with the assistance of the market-research and advertising
consultants J.W. Thompson, re-positioned their product from an essentially malted-milk drink
with medicinal properties to one which was promoted on its sleep-enhancing virtues, its
healthiness and its taste. This was achieved through a sophisticated process of market research,
segmentation, positioning and an integrated marketing-mix which emphasized all four P‟s. Its
promotional element was highly innovative using campaign advertising, cognitive dissonance,
original use of imagery, photography and storylines, professional endorsement and an integrated
use of promotional channels including film and radio. As a consequence of this, Horlicks was
able to charge a premium price, far in excess of its competitors Ovaltine and Cadbury‟s
Bournvita, by an emphasis on its added values which successfully resonated with customer
needs. What stands out in both studies is how successful branding was an integral part and result
of a marketing process which incorporated market research, customer profiling, careful
positioning, brand building, unique selling points and an integrated communication programme.
The present study was designed to cater the inter-relationship between two parameters of
promotional campaigns and brand building and this study was focused on carbonated soft drink
market.

ZENITH International Journal of Business Economics & Management Research
Vol.2 Issue 5, May 2012, ISSN 2249 8826 Online available at http://zenithresearch.org.in/
ww
w.z
enit
hre
sear
ch.o
rg.i
n
15
5
RESEARCH OBJECTIVES
To assess the perception of the consumers about the various market brands.
To assess the various parameters on which a consumer evaluate a particular brand.
To assess the effect of promotional campaigns on consumer perception.
To assess and measure the effectiveness of various promotional tools used by the companies
to build their brand.
HYPOTHESIS
Ho1: Promotional campaigns affect the brand image as well as the brand perception of the
consumers.
Ho2: Promotional Mix has a positive correlation in brand building.
REVIEW OF LITERATURE
PROMOTIONAL CAMPAIGNS
The last element of Marketing Mix called “Promotional Campaigns” effect greatly the
overall marketing of the product and also contributing hefty in expanding the life-span of the
product. Due to the promotional campaigns, the whole new avatar of the product can be seen and
help to drag the attention of the marketing, potential and present customers and also the
competitors. A broad promotional campaign is a campaign intended to “sell” the idea of
bicycling to those who currently don‟t cycle, and to create a positive image for cycling among
the public in general. Similar to the way that automobile advertising promotes a certain lifestyle,
a successful cycling campaign appeals to the emotions of its audience to sell the idea of cycling.
According to Matthew (1988), the promotional campaigns are also designed to inform are
often aimed at specific market segments. It is possible that the consumer perceives a promotion
but does not modify his or her behavior. In this case, the manufacturers and/or retailers are
investing resources in promotional activities that do not have any effect on the consumer. It is
very important to know the consumer‟s preferences and the actions that significantly influence
consumer behavior. So, resources invested in promotion campaigns that are not valued by
consumers should be diverted towards other promotional activities which are valued by
consumers (e.g. price cuts) (Alvarez et. al., 2005).
The promotional campaigns not only effective via direct advertising but virtually it is also
very effective in attracting the attention of the customers. After the internet arrival, the term e-
branding or e-marketing emerged and hence the promotion through the online medium started.
Ibeh et. al, (2005) examined companies marketed through internet also seem to have employed a
variety of traditional, offline methods and leading-edge online tools in communicating their key
e-brand values and promoting their online platforms and offerings. Due to the vitality of these

ZENITH International Journal of Business Economics & Management Research
Vol.2 Issue 5, May 2012, ISSN 2249 8826 Online available at http://zenithresearch.org.in/
ww
w.z
enit
hre
sear
ch.o
rg.i
n
15
6
promotional campaigns and efforts, Harvey (1993), stressed that all promotional efforts must be
adapted to some degree even if that only means a translation into the local language.
BRAND BUILDING
After the concepts of “brand” and “branding”, the next shift is towards the “brand
building” paradigm. According to Kotler and Armstrong (2006), Brand Building and
Management are essential skills in the marketing of any product, service, organization, person,
place or cause. Basically, a brand is not just the name put on an offering; it is the driving force
that shapes the marketing mix, providing a platform for an organization‟s strategies and tactics.
Indeed, building a strong brand position and managing it, requires the followings:
determining of brand positioning and value proposition,
planning and implementing of brand building programs,
strengthening of consumer-brand relationships and measuring brand performance.
From its initial roots as a sign of ownership, branding has evolved and developed to the point
where it can be used as a significant measure of distinction, with the ability to command price
premiums, engage consumer loyalty both at the rational and emotional level and create a strong
attachment in the mind of consumers.
Kapferer (1997) mentions that before the 1980‟s there was a different approach towards
brands. “Companies wished to buy a producer of chocolate or pasta: after 1980, they wanted to
buy KitKat or Buitoni. This distinction is very important; in the first case firms wish to buy
production capacity and in the second they want to buy a place in the mind of the consumer”
(p. 23). Therefore, branding and brand building should focus on developing brand value for
strategic advantage.
INTER-RELATIONSHIP OF PROMOTIONAL CAMPAIGNS & BRAND BUILDING IN
INDIA
The contribution of promotional and sponsorship program in the brand building and even
it also contributes towards to build the brand image of product as well as corporate. Noordin et
al., (2011) studied the effectiveness of promotional campaigns is defined by the success of a
sponsorship program to capture the audience attention in elevating the brand power and brand
image. Today, a large number of promotional events are using sponsorship support to offer more
exciting programs and to help defray rising costs. Sponsorship allows companies to reach
specifically targeted niche markets without any waste. Sponsorship offers the possibility of
achieving several goals at once.
From global trends in advertisement and promotion in brand building to Indian context,
the figures are also impressive. With India emerging as one of the fastest growing market, an
analysis of their advertisement expenditure and net sales turnover suggests companies in these
sectors witnessed robust growth in their sales turnover despite falling advertisement expenditure,
according to an ASSOCHAM Study. Furthermore, According to the analysis of FMCG sector,

ZENITH International Journal of Business Economics & Management Research
Vol.2 Issue 5, May 2012, ISSN 2249 8826 Online available at http://zenithresearch.org.in/
ww
w.z
enit
hre
sear
ch.o
rg.i
n
15
7
Hindustan Unilever Limited increased its advertising costs in 2008-09 by 48 per cent while its
net sales rose by 47.12 per cent. Another FMCG major ITC Limited spent nearly 33 per cent
more in 2008-09 than the previous year, as the company earned 8.4 per cent growth in net sales
during the same period whereas Britannia which spent about 17.50 per cent more on
advertisements in 2008-09 as compared to the previous year recorded a growth of 20.50 per cent
in its net sales (ASSOCHAM Eco Pulse Study, 2009).
RESEARCH METHODOLOGY
The present research study is exploratory in nature and is based on both primary and
secondary data. A pilot survey was conducted by the researcher to spot out the scope of present
study particularly in the FMCG market. This pilot survey was mainly done to check out the Role
of Promotional Campaigns carried out by the soft drink companies for their brand building in
emerging markets. This survey along with available literature helped the researcher to enlist the
brands in the carbonated soft drink market and enlist the brands to be studied. Pilot survey also
served the purpose to pre-test the questionnaire and the feedback of the respondents was well
taken and helped researcher to select four soft drink brands for study. This pilot survey was
basically divided into two phases:
PHASE I
This Phase was primarily undertaken to identify and select the soft drink brands and their
promotional campaigns to be studied. Hence this phase of pilot survey had three stages:
STAGE 1: IDENTIFICATION OF CARBONATED SOFT DRINK BRANDS: In this stage
the researcher studied the various carbonated soft drink brands available in the market in
different regions starting from Jammu city by an informal interview to identify the various
brands.
STAGE II: SELECTION OF CARBONATED SOFT DRINK BRANDS: After identification
of the carbonated soft drink brands the consumers were asked to rank them in terms of
Promotional campaigns and the brand success, The total number of consumer interviewed was
about 100 and maximum promotional campaigns were of brand Pepsi and its sub brands but less
brand success than coca-cola and its sub brands.
STAGE III: SELECTION OF BRANDS: Further major four carbonated soft drink brands of
Pepsi were selected the study. The researcher has selected following carbonated soft drink brands
and their corresponding Promotional campaigns for analysis based on the feedback from the
consumers:

ZENITH International Journal of Business Economics & Management Research
Vol.2 Issue 5, May 2012, ISSN 2249 8826 Online available at http://zenithresearch.org.in/
ww
w.z
enit
hre
sear
ch.o
rg.i
n
15
8
Soft Drink Brands Promotional Campaigns
Mountain Dew “Darr ke Aage Jeet Hai”
Pepsi “Youngistaan ka Wow”
Mirinda “Weekend Aaye toh Pagalpanti Zaroori Hai”
Mango Slice “Sabr Ka Phal Meetha Hota Hai”
PHASE II
The second phase of pilot survey was concerned with questionnaire development and it‟s
pre-testing; prerequisite to designing a questionnaire is to determine what is exactly required to
be measured to achieve the objectives of the study. The objective of adding the question 1, 2, 5,
6, 7 & 8 was to measure the perception about the brands. The next objective was to find out the
various parameters on which the consumers evaluate a particular brand and thus question no.3
was incorporated in the questionnaire. However, the effect of the promotional campaigns on the
selected carbonated soft drink brands was assessed by adding question 11 to 31. Finally the
effectiveness of various promotional tools was assessed by incorporating question 31 & 38 in the
questionnaire.
DESIGNING AND PRE-TESTING THE QUESTIONNAIRE
After drafting the questionnaire for the selected carbonated soft drink brands and their
corresponding promotional campaigns it was pretested with more than 100 consumers, this initial
survey data provided sufficient inputs to design a more structured questionnaire with all the
relevant Promotional factors responsible for brand building.
SAMPLING DESIGN AND SAMPLE SIZE
A convenient sampling method was used for this study. Field interviews were conducted
in the four cities and a total of 1723 questionnaires were distributed among the respondents,
since 223 questionnaires were incomplete and thus were rejected, so a sample size of this survey
was 1500.This sample size was divided as:
CITY SAMPLE SIZE
DELHI 586
LUDHIANA 374
JAMMU 324

ZENITH International Journal of Business Economics & Management Research
Vol.2 Issue 5, May 2012, ISSN 2249 8826 Online available at http://zenithresearch.org.in/
ww
w.z
enit
hre
sear
ch.o
rg.i
n
15
9
SRINAGAR 216
STATISTICAL TECHNIQUES USED
The primary techniques used were Frequency Distribution, Chi-Square test and
Correlation.
CHAPTER SCHEME
The main body of this research study is divided into six chapters along with tables and
annexure to support the analysis and findings of the study.
Introduction
Review of literature
Research Methodology
Results and Discussion
Summary, Conclusions, Limitations and Future Research
Appendices
Bibliography
DATA ANALYSIS
In this chapter, we present data in the appropriate tables for further analysis and
interpretations; here is the presentation of the demographic profile of the respondents.
Demographic Data No of Respondents Percentage
Gender
Male 893 59.53%
Female 607 40.47%
Age Under 20 190 12.66%
21-30 610 40.66%
31-40 320 21.33%
41-50 140 9.3%

ZENITH International Journal of Business Economics & Management Research
Vol.2 Issue 5, May 2012, ISSN 2249 8826 Online available at http://zenithresearch.org.in/
ww
w.z
enit
hre
sear
ch.o
rg.i
n
16
0
51-60 120 8%
60 & Above 120 8%
Educational
Level
Below Matric 232 15.46%
Matric 321 21.4%
Graduate 679 45.26%
Post
Graduate
268 17.86%
Household
Income
Below 10,000 232 15.46%
10,000 to
20,000
633 42.20%
20,000 to
40,000
452 30.13%
Above 40,000 183 12.20%
BRAND ASSOCIATION
Here the objective of the research was to know the association of each cold drink brand
with the consumers and thus Chi square test was applied to determine the relationship between
them and this association was studied for each of the brands.

ZENITH International Journal of Business Economics & Management Research
Vol.2 Issue 5, May 2012, ISSN 2249 8826 Online available at http://zenithresearch.org.in/
ww
w.z
enit
hre
sear
ch.o
rg.i
n
16
1
BRAND ASSOCIATION - MOUNTAIN DEW
Brand Association
Total
Disagree Neutral Agree
Strongly
Agree
Mountain.dew No Count 100 200 150 0 450
% within
Mountain.dew 22.2% 44.4% 33.3% .0% 100.0%
Yes Count 200 249 301 300 1050
% within
Mountain.dew 19.0% 23.7% 28.7% 28.6% 100.0%
Total Count 300 449 451 300 1500
% within
Mountain.dew 20.0% 29.9% 30.1% 20.0% 100.0%
BRAND ASSOCIATION - CHI-SQUARE TESTS OF MOUNTAIN DEW
Value Df Asymp. Sig. (2-sided)
Pearson Chi-Square 1.777E2a 3 .000
Likelihood Ratio 259.924 3 .000
N of Valid Cases 1500
a. 0 cells (.0%) have expected count less than 5. The minimum expected count is 90.00.

ZENITH International Journal of Business Economics & Management Research
Vol.2 Issue 5, May 2012, ISSN 2249 8826 Online available at http://zenithresearch.org.in/
ww
w.z
enit
hre
sear
ch.o
rg.i
n
16
2
BRAND ASSOCIATION - PEPSI
Brand Association
Total Disagree Neutral Agree Strongly Agree
Pepsi No Count 0 0 100 50 150
% within Pepsi .0% .0% 66.7% 33.3% 100.0%
Yes Count 300 449 351 250 1350
% within Pepsi 22.2% 33.3% 26.0% 18.5% 100.0%
Total Count 300 449 451 300 1500
% within Pepsi 20.0% 29.9% 30.1% 20.0% 100.0%
BRAND ASSOCIATION - CHI-SQUARE TESTS OF PEPSI
Value Df Asymp. Sig. (2-sided)
Pearson Chi-Square 1.723E2a 3 .000
Likelihood Ratio 227.675 3 .000
N of Valid Cases 1500
a. 0 cells (.0%) have expected count less than 5. The minimum expected count is 30.00.
BRAND ASSOCIATION - MIRINDA
Brand Association
Total
Disagree Neutral Agree
Strongly
Agree
Mirinda No Count 100 300 250 100 750
% within Mirinda 13.3% 40.0% 33.3% 13.3% 100.0%

ZENITH International Journal of Business Economics & Management Research
Vol.2 Issue 5, May 2012, ISSN 2249 8826 Online available at http://zenithresearch.org.in/
ww
w.z
enit
hre
sear
ch.o
rg.i
n
16
3
Yes Count 200 149 201 200 750
% within Mirinda 26.7% 19.9% 26.8% 26.7% 100.0%
Total Count 300 449 451 300 1500
% within Mirinda 20.0% 29.9% 30.1% 20.0% 100.0%
BRAND ASSOCIATION - CHI-SQUARE TESTS OF MIRINDA
Value Df Asymp. Sig. (2-sided)
Pearson Chi-Square 1.228E2a 3 .000
Likelihood Ratio 125.079 3 .000
N of Valid Cases 1500
a. 0 cells (.0%) have expected count less than 5. The minimum expected count is 150.00.
BRAND ASSOCIATION - MANGO SLICE
Brand Association
Total
Disagree Neutral Agree
Strongly
Agree
Mango
Slice
No Count 150 150 50 100 450
% within Mango
Slice 33.3% 33.3% 11.1% 22.2% 100.0%
Yes Count 150 299 401 200 1050
% within Mango
Slice 14.3% 28.5% 38.2% 19.0% 100.0%
Total Count 300 449 451 300 1500

ZENITH International Journal of Business Economics & Management Research
Vol.2 Issue 5, May 2012, ISSN 2249 8826 Online available at http://zenithresearch.org.in/
ww
w.z
enit
hre
sear
ch.o
rg.i
n
16
4
Brand Association
Total
Disagree Neutral Agree
Strongly
Agree
Mango
Slice
No Count 150 150 50 100 450
% within Mango
Slice 33.3% 33.3% 11.1% 22.2% 100.0%
Yes Count 150 299 401 200 1050
% within Mango
Slice 14.3% 28.5% 38.2% 19.0% 100.0%
Total Count 300 449 451 300 1500
% within Mango
Slice 20.0% 29.9% 30.1% 20.0% 100.0%
BRAND ASSOCIATION - CHI-SQUARE TESTS OF MANGO SLICE
Value Df Asymp. Sig. (2-sided)
Pearson Chi-Square 1.380E2a 3 .000
Likelihood Ratio 148.561 3 .000
N of Valid Cases 1500
a. 0 cells (.0%) have expected count less than 5. The minimum expected count is 90.00.
Brand Evaluation By Consumers
Here, an attempt was made to determine the various parameters on which the consumer
evaluates a particular brand and the dependency of these variables on the consumer decision
making process and it was studied for each of the soft drink brands.

ZENITH International Journal of Business Economics & Management Research
Vol.2 Issue 5, May 2012, ISSN 2249 8826 Online available at http://zenithresearch.org.in/
ww
w.z
enit
hre
sear
ch.o
rg.i
n
16
5
MOUNTAIN DEW
Parameters Value Df Asymp. Sig.
(2-sided)
Taste Pearson Chi-
Square
98.282a 2 .000
Contents Pearson Chi-
Square
1.185E2a 3 .000
Price Pearson Chi-
Square
73.972a 2 .000
Advertisements Pearson Chi-
Square
1.071E2a 2 .000
Availability Pearson Chi-
Square
2.725E2a 2 .000
Quality Pearson Chi-
Square
2.050E2a 2 .000
Packaging Pearson Chi-
Square
1.243E2a 3 .000
Promotion Pearson Chi-
Square
11.905a 2 .003
Shop Display Pearson Chi-
Square
3.889E2a 2 .000
Colour Pearson Chi-
Square
2.687E2a 3 .000

ZENITH International Journal of Business Economics & Management Research
Vol.2 Issue 5, May 2012, ISSN 2249 8826 Online available at http://zenithresearch.org.in/
ww
w.z
enit
hre
sear
ch.o
rg.i
n
16
6
PEPSI
Parameters
Value Df
Asymp. Sig.
(2-sided)
Taste Pearson Chi-
Square 80.076a
2 .000
Contents Pearson Chi-
Square 2.653E2a
3 .000
Price Pearson Chi-
Square 73.877a
2 .000
Advertisements Pearson Chi-
Square 55.556a
2 .000
Availability Pearson Chi-
Square 1.728E2a
2 .000
Quality Pearson Chi-
Square 1.265E2a
2 .000
Packaging Pearson Chi-
Square 2.654E2a
3 .000
Promotion Pearson Chi-
Square 2.500E2a
2 .000
Shop Display Pearson Chi-
Square 64.815a
2 .000
Colour Pearson Chi-
Square 1.111E2a
3 .000

ZENITH International Journal of Business Economics & Management Research
Vol.2 Issue 5, May 2012, ISSN 2249 8826 Online available at http://zenithresearch.org.in/
ww
w.z
enit
hre
sear
ch.o
rg.i
n
16
7
MIRINDA
Parameters
Value Df
Asymp. Sig. (2-
sided)
Taste Pearson Chi-
Square 1.236E2a
2 .000
Contents Pearson Chi-
Square 2.571E2a
3 .000
Price Pearson Chi-
Square 42.144a
2 .000
Advertisements Pearson Chi-
Square 1.700E2a
2 .000
Availability Pearson Chi-
Square 2.756E2a
2 .000
Quality Pearson Chi-
Square 2.966E2a
2 .000
Packaging Pearson Chi-
Square 77.778a
3 .000
Promotion Pearson Chi-
Square 50.000a
2 .000
Shop Display Pearson Chi-
Square 1.333E2a
2 .000
Colour Pearson Chi-
Square 1.992E2a
3 .000

ZENITH International Journal of Business Economics & Management Research
Vol.2 Issue 5, May 2012, ISSN 2249 8826 Online available at http://zenithresearch.org.in/
ww
w.z
enit
hre
sear
ch.o
rg.i
n
16
8
MANGO SLICE
Parameters
Value Df
Asymp. Sig. (2-
sided)
Taste Pearson Chi-
Square 12.138a
2 .002
Contents Pearson Chi-
Square 1.504E2a
3 .000
Price Pearson Chi-
Square 73.972a
2 .000
Advertisements Pearson Chi-
Square 75.397a
2 .000
Availability Pearson Chi-
Square 74.074a
2 .000
Quality Pearson Chi-
Square 64.225a
2 .000
Packaging Pearson Chi-
Square 97.884a
3 .000
Promotion Pearson Chi-
Square 11.905a
2 .003
Shop Display Pearson Chi-
Square 2.500E2a
2 .000
Colour Pearson Chi-
Square 1.992E2a
3 .000
PERCEPTION OF THE CONSUMERS ABOUT THESE CAMPAIGNS
Here, the perception of the consumers about each of these promotional campaigns was
studied on five point scale and then Chi-square test was applied to know the relationship between
them.

ZENITH International Journal of Business Economics & Management Research
Vol.2 Issue 5, May 2012, ISSN 2249 8826 Online available at http://zenithresearch.org.in/
ww
w.z
enit
hre
sear
ch.o
rg.i
n
16
9
PERCEPTION REGARDING “DARR KE AAGE JEET HAI”
Perception
Total
Disagree Neutral Agree
Strongly
Agree
Darr.ke.aage.jeet.hai No Count 50 0 300 100 450
% within
Darr.ke.aage.jeet.hai 11.1% .0% 66.7% 22.2% 100.0%
Yes Count 100 300 301 349 1050
% within
Darr.ke.aage.jeet.hai 9.5% 28.6% 28.7% 33.2% 100.0%
Total Count 150 300 601 449 1500
% within
Darr.ke.aage.jeet.hai 10.0% 20.0% 40.1% 29.9% 100.0%
CHI-SQUARE TESTS
Value Df Asymp. Sig. (2-sided)
Pearson Chi-Square 2.557E2a 3 .000
Likelihood Ratio 332.245 3 .000
N of Valid Cases 1500
a. 0 cells (.0%) have expected count less than 5. The minimum expected count is 45.00.
ZENITH International Journal of Business Economics & Management Research
Vol.2 Issue 5, May 2012, ISSN 2249 8826 Online available at http://zenithresearch.org.in/
ww
w.z
enit
hre
sear
ch.o
rg.i
n
17
0
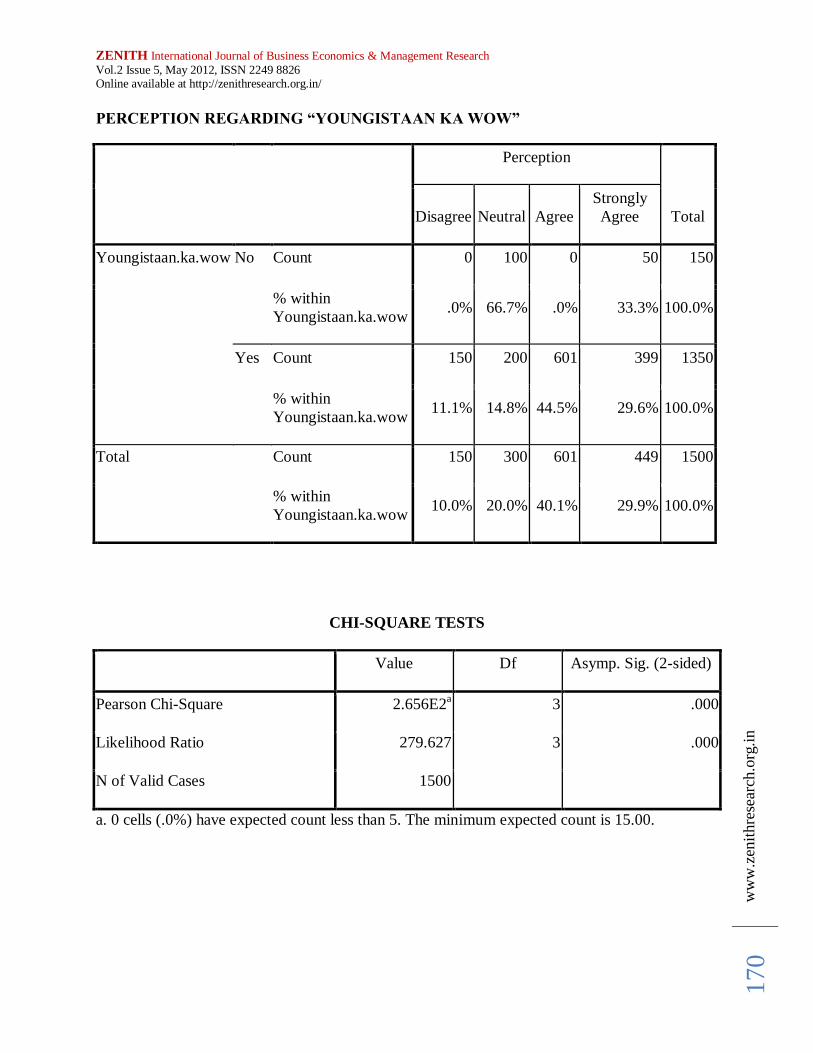
PERCEPTION REGARDING “YOUNGISTAAN KA WOW”
Perception
Total
Disagree Neutral Agree
Strongly
Agree
Youngistaan.ka.wow No Count 0 100 0 50 150
% within
Youngistaan.ka.wow .0% 66.7% .0% 33.3% 100.0%
Yes Count 150 200 601 399 1350
% within
Youngistaan.ka.wow 11.1% 14.8% 44.5% 29.6% 100.0%
Total Count 150 300 601 449 1500
% within
Youngistaan.ka.wow 10.0% 20.0% 40.1% 29.9% 100.0%
CHI-SQUARE TESTS
Value Df Asymp. Sig. (2-sided)
Pearson Chi-Square 2.656E2a 3 .000
Likelihood Ratio 279.627 3 .000
N of Valid Cases 1500
a. 0 cells (.0%) have expected count less than 5. The minimum expected count is 15.00.

ZENITH International Journal of Business Economics & Management Research
Vol.2 Issue 5, May 2012, ISSN 2249 8826 Online available at http://zenithresearch.org.in/
ww
w.z
enit
hre
sear
ch.o
rg.i
n
17
1
PERCEPTION REGARDING “WEEKEND PAR PAGALPANTI ZAROORI HAI”
Perception
Total
Disagree Neutral Agree
Strongly
Agree
Weekend.pagalpanti No Count 100 250 351 349 1050
% within
Weekend.pagalpanti 9.5% 23.8% 33.4% 33.2% 100.0%
Yes Count 50 50 250 100 450
% within
Weekend.pagalpanti 11.1% 11.1% 55.6% 22.2% 100.0%
Total Count 150 300 601 449 1500
% within
Weekend.pagalpanti 10.0% 20.0% 40.1% 29.9% 100.0%
CHI-SQUARE TESTS
Value Df Asymp. Sig. (2-sided)
Pearson Chi-Square 77.453a 3 .000
Likelihood Ratio 78.961 3 .000
N of Valid Cases 1500
a. 0 cells (.0%) have expected count less than 5. The minimum expected count is 45.00.

ZENITH International Journal of Business Economics & Management Research
Vol.2 Issue 5, May 2012, ISSN 2249 8826 Online available at http://zenithresearch.org.in/
ww
w.z
enit
hre
sear
ch.o
rg.i
n
17
2
PERCEPTION REGARDING “SABAR KA PHAL MEETHA HOTA HAI”
Perception
Total
Disagree Neutral Agree
Strongly
Agree
Sabar.ka.phal.meetha No Count 100 50 100 200 450
% within
Sabar.ka.phal.meetha 22.2% 11.1% 22.2% 44.4% 100.0%
Yes Count 50 250 501 249 1050
% within
Sabar.ka.phal.meetha 4.8% 23.8% 47.7% 23.7% 100.0%
Total Count 150 300 601 449 1500
% within
Sabar.ka.phal.meetha 10.0% 20.0% 40.1% 29.9% 100.0%
CHI-SQUARE TESTS
Value Df Asymp. Sig. (2-sided)
Pearson Chi-Square 2.177E2a 3 .000
Likelihood Ratio 213.176 3 .000
N of Valid Cases 1500
a. 0 cells (.0%) have expected count less than 5. The minimum expected count is 45.00.

ZENITH International Journal of Business Economics & Management Research
Vol.2 Issue 5, May 2012, ISSN 2249 8826 Online available at http://zenithresearch.org.in/
ww
w.z
enit
hre
sear
ch.o
rg.i
n
17
3
PROMOTIONAL CAMPAIGNS OF COLD DRINKS
Here all the soft drink brands were studied with reference to various promotional tools
used by the soft drink companies to promote their brands and thus the association between the
Mountain Dew was studied with each of the promotional tool separately so to as to conclude
which one is the best promotional tool so that the most effective tool can be used in the brand
building process.
MOUNTAIN DEW
Parameters Value Df Asymp. Sig.
(2-sided)
Publicity Pearson
Chi-Square 6.997E2
a 2 .000
Word of Mouth Pearson
Chi-Square 6.998E2
a 3 .000
Telemarketing Pearson
Chi-Square 2.500E2
a 3 .000
Direct Marketing Pearson
Chi-Square 1.905E2
a 3 .000
Sales Promotion Pearson
Chi-Square 6.969E2
a 2 .000
Personal Selling Pearson
Chi-Square 4.286E2
a 3 .000
Public Relations Pearson
Chi-Square 6.997E2
a 2 .000
Ad Campaign Pearson
Chi-Square 6.998E2
a 2 .000
Advertisement by
Print and
Electronic Media
Pearson
Chi-Square 6.997E2a 2 .000

ZENITH International Journal of Business Economics & Management Research
Vol.2 Issue 5, May 2012, ISSN 2249 8826 Online available at http://zenithresearch.org.in/
ww
w.z
enit
hre
sear
ch.o
rg.i
n
17
4
PEPSI
Parameters Value Df Asymp. Sig.
(2-sided)
Publicity Pearson
Chi-Square 80.247
a 2 .000
Word of Mouth Pearson
Chi-Square 80.384
a 3 .000
Telemarketing Pearson
Chi-Square 2.500E2
a 3 .000
Direct Marketing Pearson
Chi-Square 3.889E2
a 3 .000
Sales Promotion Pearson
Chi-Square 80.384
a 2 .000
Personal Selling Pearson
Chi-Square 2.500E2
a 3 .000
Public Relations Pearson
Chi-Square 80.247
a 2 .000
Ad Campaign Pearson
Chi-Square 80.076
a 2 .000
Advertisement by
Print and
Electronic Media
Pearson
Chi-Square 80.247a 2 .000
MIRINDA
Parameters Value Df Asymp. Sig.
(2-sided)
Publicity Pearson
Chi-Square 2.056E2
a 2 .000
Word of Mouth Pearson
Chi-Square 2.073E2
a 3 .000

ZENITH International Journal of Business Economics & Management Research
Vol.2 Issue 5, May 2012, ISSN 2249 8826 Online available at http://zenithresearch.org.in/
ww
w.z
enit
hre
sear
ch.o
rg.i
n
17
5
Telemarketing Pearson
Chi-Square 1.050E3
a 3 .000
Direct Marketing Pearson
Chi-Square 7.000E2
a 3 .000
Sales Promotion Pearson
Chi-Square 2.071E2
a 2 .000
Personal Selling Pearson
Chi-Square 4.500E2
a 3 .000
Public Relations Pearson
Chi-Square 2.056E2
a 2 .000
Ad Campaign Pearson
Chi-Square 2.060E2
a 2 .000
Advertisement by
Print and
Electronic Media
Pearson
Chi-Square 2.056E2a 2 .000
MANGO SLICE
Parameters Value Df Asymp. Sig.
(2-sided)
Publicity Pearson
Chi-Square 2.235E2
a 2 .000
Word of Mouth Pearson
Chi-Square 2.245E2
a 3 .000
Telemarketing Pearson
Chi-Square 7.857E2
a 3 .000
Direct Marketing Pearson
Chi-Square 3.095E2
a 3 .000
Sales Promotion Pearson
Chi-Square 2.235E2
a 2 .000
Personal Selling Pearson
Chi-Square 4.286E2
a 3 .000

ZENITH International Journal of Business Economics & Management Research
Vol.2 Issue 5, May 2012, ISSN 2249 8826 Online available at http://zenithresearch.org.in/
ww
w.z
enit
hre
sear
ch.o
rg.i
n
17
6
Public Relations Pearson
Chi-Square 2.235E2
a 2 .000
Ad Campaign Pearson
Chi-Square 2.245E2
a 2 .000
Advertisement by
Print and
Electronic Media
Pearson
Chi-Square 2.235E2a 2 .000
PROMOTIONAL CAMPAIGN AND BRAND BUILDING
Here, Spearman rank correlation has been used to find out the correlation of the various
Promotional campaigns with their corresponding carbonated soft drink brands and the different
values of correlation coefficients shows whether and how strongly pairs of variables are related.
“DARR KE AAGE JEET HAI”- MOUNTAIN DEW
MD MDA MDB MDC MDD MDE MDF
Spearman's
rho
MD Correlation
Coefficient 1.000 -.211
** .338
** .094
** -.184
** .225
** -.232
**
Sig. (2-tailed) . .000 .000 .004 .000 .000 .000
Rank 5 1 3 4 2 6
**Correlation is significant at the 0.01 level
(2- tailed).
MDA – Relationship of “Darr ke aage jeet hai” with the brand Mountain Dew.
MDB - Brand connectivity between “Darr kea age jeet hai” with Mountain Dew.
MDC - Communication of Mountain Dew as a brand for the people who dare.
MDD – “Darr ke aage jeet hai” relationship with “No fear personality”.
MDE - Relationship of Black Colour with No fear personality.
MDF- “Salman Khan” as the brand ambassador of Mountain Dew.

ZENITH International Journal of Business Economics & Management Research
Vol.2 Issue 5, May 2012, ISSN 2249 8826 Online available at http://zenithresearch.org.in/
ww
w.z
enit
hre
sear
ch.o
rg.i
n
17
7
IN THE ABOVE ANALYSIS, THE RESPONDENTS HAVE RANKED MDB AS RANK 1
WHICH INDICATES THAT THE CONSUMERS PERCEIVE THAT THERE IS A STRONG
CONNECTIVITY BETWEEN THE PROMOTIONAL CAMPAIGN “DARR KE AAGE JEET
HAI” WITH THE SOFT DRINK MOUNTAIN DEW, ON THE OTHER SIDE THE
NEGATIVE VALUE OF MDF AS RANK 6 IS INDICATIVE THAT THE RESPONDENTS
DO NOT RECOGNIZE SALMAN KHAN AS THE BRAND AMBASSADOR OF
MOUNTAIN DEW.
“YOUNGISTAAN KA WOW” – PEPSI
P PA PB PC PD PE PF PG
Spearman's
rho
P Correlation
Coefficient 1.000 -.008 -.090
** -.051 .256
** .432
** -.038 .233
**
Sig. (2-tailed) . .797 .006 .117 .000 .000 .238 .000
Rank 4 7 6 2 1 5 3
**Correlation is significant at the 0.01
level (2-tailed).
PA- Relationship of “Youngistaan ka wow” with the brand Pepsi.
PB- Brand connectivity between “Youngistaan ka wow” with the brand Pepsi.
PC- “Youngistaan ka wow” conveys Pepsi as X Generation Drink.
PD- Positioning of Pepsi by the campaign Youngistaan as a Younger generation drink.
PE- “Youngistaan ka wow” success in targeting the Youth sentiments.
PF- Colour Blue of Pepsi conveys eternal youthfulness & openness.
PG- “Youngistaan ka wow” focuses on Youth‟s Personality, attitude & lifestyle.
On the basis of spearman rank correlation the respondents have ranked PE as Rank 1
which indicates that the consumers perceive that the promotional campaign “Youngistaan ka
wow” has succeeded in targeting the youth sentiments, on the other side the lowest rank of PB as
Rank 7 is indicative that the respondents do not recognize that the campaign “Youngistaan ka
wow” connects overall with the brand Pepsi.

ZENITH International Journal of Business Economics & Management Research
Vol.2 Issue 5, May 2012, ISSN 2249 8826 Online available at http://zenithresearch.org.in/
ww
w.z
enit
hre
sear
ch.o
rg.i
n
17
8
“WEEKEND AAYE TO PAGALPANTI ZAROORI HAI” - MIRINDA
M MIA MIB MIC MID
Spearman's rho M Correlation
Coefficient 1.000 .219
** .219
** .219
** .219
**
Sig. (2-tailed) . .000 .000 .000 .000
Rank 1 1 1 1 1
**. Correlation is significant at the 0.01 level (2-tailed).
MIA- Relationship of “Weekend aaye to pagalpanti zaroori hai” with the brand Mirinda.
MIB- Brand connectivity between“Weekend aaye to pagalpanti zaroori hai” with Mirinda.
MIC- “Weekend aaye to pagalpanti zaroori hai” coveys itself as a “Girl savy drink”.
MID- “Weekend aaye to pagalpanti zaroori hai” has succeeded in targeting the girls.
On the basis of spearman rank correlation the respondents have given equal ranks to all
the parameters of the promotional campaign which indicates that the consumers perceive that the
promotional campaign “Weekend aaye to Pagalpanti zaroori hai” same on all the aspects of this
promotional campaign.
“SABAR KA PHAL MEETHA HOTA HAI”- MANGO SLICE
MA MSA MSB MSC MSD
MA Pearson Correlation 1 .369**
.130* .369
** -.322
**
Sig. (2-tailed) .000 .036 .000 .000
Rank 1 2 1 3
**. Correlation is significant at the 0.01 level (2-tailed).
*. Correlation is significant at the 0.05 level (2-tailed).

ZENITH International Journal of Business Economics & Management Research
Vol.2 Issue 5, May 2012, ISSN 2249 8826 Online available at http://zenithresearch.org.in/
ww
w.z
enit
hre
sear
ch.o
rg.i
n
17
9
MSA- Relationship of “Sabar ka Phal Meetha Hota hai” with Mango Slice.
MSB- Brand connectivity between “Sabar ka Phal Meetha Hota hai” and Mango Slice.
MSC- “Sabar ka Phal Meetha Hota hai” celebrates itself as the sweet fruit of patience.
MSD- Katrina Kaif as the brand ambassador of “Sabar ka Phal Meetha Hota hai”
On the basis of spearman rank correlation the respondents have ranked both MSA and
MSC as Rank 1 which indicates that the consumers perceive that the promotional campaign
“Sabar ka Phal Meetha Hota hai” as having a strong relationship with the brand Mango slice but
the negative value of MSD as Rank 3 is indicative that the respondents do not recognize Katrina
Kaif as the brand ambassador of Mango Slice.
CONCLUSIONS
Majority of the respondents were aware about the presence of all these carbonated soft drink
brands in the market but the awareness level of Pepsi was the highest.
Majority of the respondents were able to associate themselves with these carbonated soft
drink brands.
It was also noted from the consumer decision making variables, promotion was considered
most important among the other variables.
Further it was also seen that these promotional campaigns were able to shift the consumers
from one brand to another.
Similarly other important conclusions were also drawn from this research.
SUGGESTIONS
Following are the few suggestions among the various suggestions of the present research:
Right promotional Mix should be formulated by the companies for effective brand building
and the campaigns should be able to connect it with their brands.
Promotional media chosen for the campaign should be in accordance with the target
consumers and the penetration these media in the market.
Brands developed should be differentiated products and consumers should perceive it.
In order to avoid failure of promotional campaign right celebrities shall be selected who are
able to connect themselves with these brands.
With increasing advent of Publicity and Public Relations, the companies should give up their
more dependency on advertising and should opt for innovative tools of promotion

ZENITH International Journal of Business Economics & Management Research
Vol.2 Issue 5, May 2012, ISSN 2249 8826 Online available at http://zenithresearch.org.in/
ww
w.z
enit
hre
sear
ch.o
rg.i
n
18
0
Similarly other suggestions have also emerged.
Thus, it can be concluded that promotional campaigns do lead to brand building and they
have a pivotal role but these promotional campaigns should be well planned and should reach the
consumers through the right channel and these campaigns should be in line with these brands.
LIMITATIONS OF THE STUDY
There were no doubts many constraints in the research work like:
Personal bias of the researcher in selecting the sample size and sampling method.
Personal bias of the respondents in providing the information.
Lack of funds and time constraints restricted the scope of the research.
REFERENCES
Alvarez, Begon˜a Alvarez., & Casielles, Rodolfo Va´zquez. (2005). Consumer evaluations of
sales promotion: the effect on brand choice, European Journal of Marketing, 39 (1/2), pp. 54-70.
DOI: 10.1108/03090560510572016
ASSOCHAM (2009). Cost-Benefit Analysis of Advertisement Campaigns. An Eco Pulse Study.
ASSOCHAM Research Bureau.
Duncan, Tom. (2008). Principles of Advertising & IMC, 2nd ed. (New York: McGraw-
Hill/Irwin, 2008)
Fitzgerald, Robert (1995) Rowntree and the Marketing Revolution, 1862-1969, Cambridge:
Cambridge University Press.
Harvey, M.G. (1993), “Point of view: a model to determine standardization of the advertising
process in international markets”, Journal of Advertising Research, pp. 57-64.
Ibeh, Kevin I. N., Luo, Ying., & Dinnie, Keith. (2005). E-branding strategies of internet
companies: Some preliminary insights from the UK, Henry Stewart Publications, Brand
Management, 12 (5), pp. 355–373.
Kapferer, Jean-Noël. (1997), Strategic Brand Management, Great Britain, Kogan Page.
Kotler P., & Armstrong G. (2006). The Principles of Marketing, Prentice Hall, 2006.
Kotler, Philip. (2000). Marketing Management. The Millennium Edition, Upper Saddle River,
Prentice Hall.
Laric, Michael V. & Lynagh, Peter M. (2009). The New Marketing, IMC and the role of Online
Promotion, Proceedings of ASBBS, ASBBS Annual Conference: Las Vegas, 16 (1).

ZENITH International Journal of Business Economics & Management Research
Vol.2 Issue 5, May 2012, ISSN 2249 8826 Online available at http://zenithresearch.org.in/
ww
w.z
enit
hre
sear
ch.o
rg.i
n
18
1
Noordin, Akbar Ali Mohamed., Kamaruddin, Zulkeply., Amer, Afizan. & Zulkepli, Danial
Fahmi. (2011). The power of sponsorship program in enhancing Brand Image: A study on the
effectiveness of Kia Sponsoring the FIFA World Cup 2010. 2nd International Conference on
Business and Economic Research (2nd ICBER 2011) Proceeding. Retrieved on June 24, 2011
from
http://www.scirus.com/srsapp/sciruslink?src=rpc&url=http%3A%2F%2Fideas.repec.org%2Fp%
2Fcms%2F2icb11%2F2011-106.html
Ward, Vernon (1994). „Marketing Convenience Foods Between The Wars‟, in Geoffrey Jones
and Nicholas J. Morgan (eds.) Adding Value: Brands and Marketing in Food and Drink, London:
Routledge, 1994.