“Impact study on various promotional practices done by ...
189
“Impact study on various promotional practices done by pharmaceutical companies on doctor's prescription behavior” A Thesis submitted to Gujarat Technological University for the Award of Doctor of Philosophy in Management By Krunal Shashikant Vishavadia Enrollment No.: 129990992042 under supervision of Dr. Sandip Solanki GUJARAT TECHNOLOGICAL UNIVERSITY AHMEDABAD December 2021
-
Upload
khangminh22 -
Category
Documents
-
view
5 -
download
0
Transcript of “Impact study on various promotional practices done by ...

“Impact study on various promotional
practices done by pharmaceutical companies
on doctor's prescription behavior”
A Thesis submitted to Gujarat Technological University
for the Award of
Doctor of Philosophy
in
Management
By
Krunal Shashikant Vishavadia Enrollment No.: 129990992042
under supervision of
Dr. Sandip Solanki
GUJARAT TECHNOLOGICAL UNIVERSITY
AHMEDABAD
December 2021

© Krunal Shashikant Vishavadia

I
DECLARATION
I declare that the thesis entitled “Impact study on various promotional practices done
by pharmaceutical companies on doctor’s prescription behavior” submitted by me
for the degree of Doctor of Philosophy is the record of research work carried out by me
during the period from November 2012 to December 2021 under the supervision of
Dr. Sandip Solanki and this has not formed the basis for the award of any degree,
diploma, associateship, fellowship, titles in this or any other University or other
institution of higher learning.
I further declare that the material obtained from other sources has been duly
acknowledged in the thesis. I shall be solely responsible for any plagiarism or other
irregularities, if noticed in the thesis.
Signature of the Research Scholar: ……………… Date: 3/12/2021
Name of Research Scholar: Krunal Shashikant Vishavadia
Place: Ahmedabad

II
CERTIFICATE
I certify that the work incorporated in the thesis “Impact study on various
promotional practices done by pharmaceutical companies on doctor’s
prescription behavior” submitted by Mr. Krunal Shashikant
Vishavadia was carried out by the candidate under my supervision/guidance. To the
best of my knowledge: (i) the candidate has not submitted the same research work
to any other institution for any degree/diploma, Associateship, Fellowship or other
similar titles (ii) the thesis submitted is a record of original research work done by
the Research Scholar during the period of study under my supervision, and (iii) the
thesis represents independent research work on the part of the Research Scholar.
Signature of Supervisor: Date: 3/12/2021
Name of Supervisor: Dr. Sandip Solanki
Place: ………………… Pune

III
COURSE-WORK COMPLETION CERTIFICATE
This is to certify that Mr. Krunal Shashikant Vishavadia enrolment no. 129990992042
is a PhD scholar enrolled for PhD program in the branch Management of Gujarat
Technological University, Ahmedabad.
(Please tick the relevant option(s))
He has been exempted from the course-work (successfully completed during
M.Phil Course)
He has been exempted from Research Methodology Course only (successfully completed
during M.Phil Course)
He has successfully completed the PhD course work for the partial requirement for the
award of PhD Degree. His/ Her performance in the course work is as follows-
Grade Obtained in Research Methodology
(PH001)
Grade Obtained in Self Study Course (Core Subject)
(PH002)
BC AA
Supervisor’s Sign
Dr. Sandip Solanki

IV
ORIGINALITY REPORT CERTIFICATE
It is certified that PhD Thesis titled “Impact study on various promotional practices
done by pharmaceutical companies on doctor’s prescription behavior” by Mr.
Krunal Shashikant Vishavadia has been examined by us. We undertake the following:
a. Thesis has significant new work / knowledge as compared already published or
are under consideration to be published elsewhere. No sentence, equation,
diagram, table, paragraph or section has been copied verbatim from previous work
unless it is placed under quotation marks and duly referenced.
b. The work presented is original and own work of the author (i.e. there is no
plagiarism). No ideas, processes, results or words of others have been presented
as Author own work.
c. There is no fabrication of data or results which have been compiled / analysed.
d. There is no falsification by manipulating research materials, equipment or
processes, or changing or omitting data or results such that the research is not
accurately represented in the research record.
e. The thesis has been checked using Turnitin (copy of originality report attached)
and found within limits (8%) as per GTU Plagiarism Policy and instructions issued
from time to time (i.e. permitted similarity index <=25%).
Signature of the Research Scholar: …………………………… Date: ….………
Name of Research Scholar: Krunal Shashikant Vishavadia
Place: Ahmedabad
Signature of Supervisor: ……………………………… Date: ………………
Name of Supervisor: Dr. Sandip Solanki
Place: ………………… Pune
3/12/2021
3/12/2021

V

VI

VII
PHD THESIS NON-EXCLUSIVE LICENSE TO
GUJARAT TECHNOLOGICAL UNIVERSITY
In consideration of being a PhD Research Scholar at GTU and in the interests of the
facilitation of research at GTU and elsewhere, I,
Krunal Shashikant Vishavadia having (Enrollment No.) 129990992042 hereby grant a
non-exclusive, royalty free and perpetual license to GTU on the following terms:
a) GTU is permitted to archive, reproduce and distribute my thesis, in whole or in part,
and/or my abstract, in whole or in part ( referred to collectively as the “Work”) anywhere
in the world, for non-commercial purposes, in all forms of media;
b) GTU is permitted to authorize, sub-lease, sub-contract or procure any of the acts
mentioned in paragraph (a);
c) GTU is authorized to submit the Work at any National / International Library, under the
authority of their “Thesis Non-Exclusive License”;
d) The Universal Copyright Notice (©) shall appear on all copies made under the authority
of this license;
e) I undertake to submit my thesis, through my University, to any Library and Archives.
Any abstract submitted with the thesis will be considered to form part of the thesis.
f) I represent that my thesis is my original work, does not infringe any rights of others,
including privacy rights, and that I have the right to make the grant conferred by this non-
exclusive license.
g) If third party copyrighted material was included in my thesis for which, under the
terms of the Copyright Act, written permission from the copyright owners is required,
I have obtained such permission from the copyright owners to do the acts mentioned
in paragraph (a) above for the full term of copyright protection.
h) I retain copyright ownership and moral rights in my thesis, and may deal with the
copyright in my thesis, in any way consistent with rights granted by me to my University
in this non-exclusive license.
i) I further promise to inform any person to whom I may hereafter assign or license my
copyright in my thesis of the rights granted by me to my University in this non- exclusive
license.

VIII
j) I am aware of and agree to accept the conditions and regulations of PhD including all
policy matters related to authorship and plagiarism.
Signature of the Research Scholar:
Name of Research Scholar: Krunal Shashikant Vishavadia
Date: 3/12/2021
Place: Ahmedabad
Signature of Supervisor:
Name of Supervisor: Dr. Sandip Solanki
Date: 3/12/2021 Place: Pune
Seal: Symbiosis Institute of International Business (SIIB), Pune
IX
THESIS APPROVAL FORM
The viva-voce of the PhD Thesis submitted by Mr. Krunal
Shashikant Vishavadia (Enrollment No. 129990992042) entitled “Impact study on
various promotional practices done by pharmaceutical companies on doctor’s
prescription behavior” was conducted on Friday, 3rd December 2021 at Google Meet,
online platform of Gujarat Technological University.
(Please tick any one of the following option)
The performance of the candidate was satisfactory. We recommend that he/she be
awarded the PhD degree.
Any further modifications in research work recommended by the panel after 3 months
from the date of first viva-voce upon request of the Supervisor or request of
Independent Research Scholar after which viva-voce can be re-conducted by the
same panel again.
The performance of the candidate was unsatisfactory. We recommend that he/she
should not be awarded the PhD degree.
Dr. Sandip Solanki,
Symbiosis Institute of
International Business,
Pune
Dr. Vinod Mishra
Monash Business School,
Monash University,
Australia
Dr. Madhuri Deshpande
School of Commerce &
Management Sciences, SRTM
University, Nanded
(Briefly specify the modifications suggested by the panel)
(The panel must give justifications for rejecting the research work)

X
ABSTRACT
Pharmaceutical promotion is based on the interaction between pharmaceutical sales representative and
doctors. Pharmaceutical companies use many tactics to engage doctors and find a ways to highlight
their brands. The objective behind these tactics is to give maximum exposure of brand in front of doctor
& get it registered in doctor’s mind. The probability of getting prescription is very high if the brand
name is registered in subconscious mind of doctor. The objective of this study is to check whether
pharmaceutical promotional tactics really change the prescription habit of doctors or not. Medical
representative detailing, Corporate Social activity, Corporate image, Continues Medical Education,
Personal attire of company representative, Sponsorship, Literatures and reminders of Pharmaceutical
companies, Medical representative’s Knowledge, Medical camp and Customer Relationship
Management, these are few pharmaceutical promotional tools to promote their brands.
The study was conducted with self-administered structured questionnaires and data collected till
response rate reach to the desired sample size. Responses asked from the doctors practicing in different
specialties like General practitioners, Physicians, Gynecologists, Pediatricians, and dentists. The study
was conducted in a metro cities of Gujarat, i.e Ahmedabad, Surat, Rajkot and Baroda. The reliability
of questionnaire was tested with Cronbach alpha value. The study covers a comprehensive analysis on
which promotional tool impact more on the prescription behavior of physicians. The multiple linear
regression model used to test the hypothesis. Regression analysis used to check the relationship
between pharmaceutical promotional tool and doctor’s prescription behavior. Data analysis confirms
that variables or promotional tools like Detailing of Medical Representative, Sampling, Continues
Medical Education, Journal Subscription, Corporate Social Responsibility, Patient Education,
Corporate Image, Personal Attire of Medical Representative, Digital marketing, Literatures and
Reminders, Medical Representative’s Knowledge & Customer Relationship Management are
positively impact on doctor’s prescription behavior. While variables or promotional tools like
Promotional Pricing, Product demonstration, Sponsorship & Medical Camp don’t have any impact in
attracting prescription from doctors.
Other relevant and practical recommendations are also made while completing the thesis. This can be
of great help to pharmaceutical marketers to develop their future marketing strategies and prospects.

XI
ACKNOWLEDGEMENT
Words are poor substitute to express one’s feelings especially when one is overwhelmed with
emotions of gratitude. The wisdom, commitment and efforts of many people were a source of
inspiration while completing this thesis. They have given me valuable contributions and expedient
comments. It gives me a great pleasure to acknowledge all those who have contributed towards the
conception, origin and nurturing of this research and who made my task less onerous.
First and foremost, I thank to God, my father and my mother; because of their blessings, I could
successfully complete my research work.
The most importantly, I would like to express my deepest regards and sincere thanks to my
supervisor Dr. Sandip Solanki, Associate Professor, Symbiosis Institute of International Business
(SIIB), Symbiosis International (Deemed University) (SIU), Pune, Maharashtra, India for the
continuous support for my research, for his patience, motivation, enthusiasm, and immense
knowledge. His guidance helped me in all the time of research and writing of this thesis. I could not
have imagined having a better advisor and mentor for my doctoral study.
The completion of the doctoral work could not have been possible without flawless support and
guidance of the DPC (Doctoral Progress Committee) Members: Dr. Jay Badiyani, Asst. Professor,
Department of Business Administration, Bhavnagar University, Bhavnagar and Dr. Vijay H. Vyas,
Professor, Department of Commerce and Management, KSKV Kachchh University, Bhuj and Prof.
(Dr.) K.J. Thankachan, Principal, Christ Institute of Management, Rajkot. Their unconditional
support, cooperation and correct guidance would always be remembered.
I express my sincere gratitude towards my superiors and colleague at Ban Labs Ltd, especially to
Mr. Rajesh Patel, Vice President (sales and marketing), Mr. Harshal Lalwani, Vice President
(sales and marketing) & Mr. N. D. Vora, Manager, Ban Labs, Rajkot. With their able guidance and
support I could able to start my doctorate along with corporate work assignments.
I also express my sincere gratitude towards my superiors at Cadila Pharmaceuticals Ltd, especially
to Dr. Jitendrasingh Huda, Vice President (sales and marketing), Mr. Kaushik Dasgupta,
General Manager (Marketing). With their supportive nature, I could continue my research work
without hurdles.
I also express my sincere gratitude towards my superiors & colleague at Intas Pharmaceuticals Ltd,

XII
especially to Mr. Sunil Panat, Sr. Vice President, Mr. Satish Pandey, Vice President, Mr. Amit
Chauhan, General Manager, Mr. Nishant Singh, Marketing Manager and Mr. Abhinav Mishra,
Therapy Manager. Needless to say that their worthy suggestions, encouragement, support, and
motivation have helped me to complete this research work successfully.
My journey of research was always supported by my parents – Dr. Shashikant Vishavadia &
Mrs. Jayshree Vishavadia, parents-in-law – Mr. Gordhan Jethwa & Mrs. Usha Jethwa, my
brother – Mr. Jignesh Vishavadia, and most of all - my wife. The thesis is dedicated to them for
all their support, love and motivation. Special mention is to be given to my wife – Bina, her
unconditional love & continuous support were the factors that kept me going during the ups and
downs of the doctoral process.
I would like to extend my thanks to Dr. Krishna Murthy Inumula, Associate Professor, Symbiosis
Institute of International Business (SIIB), Symbiosis International (Deemed University) (SIU),
Pune, Dr. Mitesh Dadhania & Dr. Raju Rathod for their support in better understanding the
journey of doctorate. I am also very thankful to my Ph.D. friend Dr. Jaydeep Sheth for his
continuous support during my research work.
I would like to extend my thanks towards Gujarat Technological University (GTU) Vice Chancellor,
Registrar and PHD section for all support during my research work. Also special thanks to all the
expert panel members of each of the research week presentations for their valuable suggestions.
I am also very grateful to all the respondent doctors who have participated in this study and provided
valuable information for completing this research.
I am highly obliged to the past and present authors mentioned in the bibliography, whose
contribution was of a great help to me during this investigation.
Finally, let me seize this opportunity to express my sincere gratitude to all those people who directly
or indirectly helped me in completing this research work.
Krunal Vishavadia

XIII
TABLE OF CONTENT
Sr. No. Content
Page
No.
Title Page
Declaration I
Certificate II
Course-Work Completion Certificate III
Originality Report Certificate IV
Non Exclusive License Certificate VII
Thesis Approval Form IX
Abstract X
Acknowledgement XI
Table of Content XIII
List of Abbreviation XV
List of Figures XVIII
List of Tables XIX
List of Appendices XXII
Chapter
I
INTRODUCTION : PHARMACEUTICAL INDUSTRY 1 – 36
1.1 Evolution of Pharmaceutical industry 2
1.2 Global pharmaceutical market 7
1.3 Global Trend in Pharmaceutical market 11
1.4 Indian Pharmaceutical Market 13
1.5 Opportunities for Indian Pharmaceutical Market 20
1.6 Challenges for Indian Pharmaceutical Market 22
1.7 Uniform Code for Pharmaceuticals Marketing Practices
(UCPMP) 24
1.8 Channel of distribution 28
1.9 Regulations in Indian Pharmaceutical Industry 32
1.10 Rationale of the Study 34
1.11 Statement of the Problem 34
1.12 Scope of the study 36
Chapter
II
REVIEW OF LITERATURE 37 – 70
2.1 Pharmaceutical Marketing 38
2.1.1 Role of Pharmaceutical Marketing 38
2.1.2 Expenditure on pharmaceutical marketing 39
2.1.3 Global Trend in Pharmaceutical Marketing 42
2.1.4 Pharmaceutical Marketing-An Indian Perspective 44
2.2 Types of Pharmaceutical Activities 47
2.3 ROI in Pharmaceutical industry 50
2.4 Pharmaceutical Promotional Tools 51
2.5 Research Gap 69

XIV
Sr. No. Content Page No.
Chapter
III
RESEARCH METHODOLOGY 71-82
3.0 Introduction 72
3.1 Research Objective 72
3.2 Hypothesis 72
3.3 Research Design 73
3.3.1 The Context 74
3.4 Population of the Study 74
3.5 Sample Size 75
3.6 Sampling Technique 75
3.7 Sources of Data 76
3.8 Tools used for Data Collection 76
3.8.1 Tool for doctor's prescription behaviour 77
3.8.2 Pilot Study 77
3.8.3 Reliability and Validity of Tool 78
3.9 Data Processing 79
3.9.1 Questionnaire Checking 79
3.9.2 Data Editing 79
3.9.3 Data Coding 80
3.9.4 Data Transcribing 80
3.10 Theoretical Framework 80
3.11 Statistical Techniques 81
3.12 SPSS Software Used for Analysis 82
Chapter
IV
DATA ANALYSIS AND INTERPRETATION 83 – 124
4.1 General Information 84
4.2 General Profile of Respondents 84
4.2.1 City & Specialty 84
4.2.2 Practicing Experience 85
4.2.3 Average Patients per Day 87
4.2.4 Entertain activities by pharmaceutical companies 88
4.2.5 Preference of Activity Performed 89
4.3 Impact of Specialty on Activities 89
4.4 Hypothesis Testing 94
Chapter
V
FINDINGS, CONCLUSION AND FUTURE SCOPE 125 – 135
5.1 Finding in context of objective 126
5.2 Conclusion and future scope 133
REFERENCES 136 – 152
6.1 List of References 137
6.2 List of Publications 152
APPENDICES 153 – 164
7.1 Questionnaire 153

XV
LIST OF ABBREVIATION
Abbreviation Full form
% MS % Market Share
ABM Area Business Manager
ADHD Attention deficit hyperactivity disorder
AHA African human tripanosomiasis
AI Artificial intelligence
AIOCD All India Organisation of Chemists and Druggists
ANOVA Analysis of Variance
APIs Active Pharmaceutical Ingredients
Apps Mobile Application
AVE Average variance extracted
BC Before Christ
CAGR Compound annual growth rate
Cas9 CRISPR associated protein 9
CDSCO Central Drugs Standard Control Organisation
CFAs Clearing and Forwarding Agents
CHCl3 Chloroform
CME Continuing medical education
CNS Central nervous system
CRISPR Clustered Regularly Interspaced Short Palindromic Repeats
CRM Customer relationship management
CRO Contract / Clinical Research Organization
CSO Central Statistical Office
CSR Corporate social responsibility
Df Degrees of freedom
DM Doctor of Medicine
DNA Deoxyribonucleic acid
DNB Diplomate of National Board
DPCO Drug Price Control Order
DTABs Drug Technical Advisory Board
DTC / DTCA Direct to consumer advertising
DTx Digital Therapeutics
EBIT Earnings before interest and taxes
EU European Union
FDA Food and Drug Administration
FDI Foreign Direct Investment
FMCG Fast-moving consumer goods
GDP Gross domestic product
GI Gastrointestinal
GNP Gross National Product
GOI Government of India

XVI
Abbreviation Full form
GP General Practitioner
H2 Histamine type 2 receptors
HCP Health care personnel / professionals
ICMR The Indian Council of Medical Research
IFPMA
International Federation of Pharmaceutical Manufacturers &
Associations
IMS Intercontinental Medical Statistics
IoT The Internet of things
IP In Patients
IPM Indian Pharmaceutical Market
iPSC Induced Pluripotent Stem Cells
IQVIA Quintiles and IMS Health Inc., an American multinational company
IT Information Technology
IV Intravenous therapy
KAM Key Account Manager
KOL Key opinion leaders
MBBS Bachelor of Medicine, Bachelor of Surgery
MCI The Medical Council of India
MDGs Millennium Development Goals
ML Machine Learning
MNC Multinational Corporation
MOHFW Ministry of Health and Family Welfare
MR Medical Representative
MRP Maximum Retail Price
NGB Next Generation Biotherapeutics
NGO Non-Government Organizations
NLEM National List of Essential Medicines
NPPA National Pharmaceutical Pricing Authority
NTDs Neglected tropical diseases
OoP Out of Pocket
OP Out Patients
OTC Over-The-Counter
PhRMA Pharmaceutical Research and Manufacturers of America
PPOI Pharmaceutical Producers Organization of India
PSR Product Sales Representative
PvPI Pharmacovigilance Programme of India
R & D Research & development
RBM Regional Business Manager
RCT Randomized controlled / clinical trial
ROI Return on Investment
RT Resource Transfer

XVII
Abbreviation Full form
RWD Real World Data
RWE Real World Evidence
SaaS Software as a service
Sig. Statistical testing of significance
SKUs Stock Keeping Unit
SMS Short message service
SPSS Statistical Package for the Social Sciences
STH Schytosomiasis
SWOT Strengths, Weaknesses, Opportunities, and Threats analysis
TV Television
UCPMP Uniform Code of Pharmaceutical Marketing Practices
UK United Kingdom
UN United Nations
US The United States of America
USD United States Dollar
USFDA United States Food and Drug Administration
Vita. Vitamins
WHO World Health Organization

XVIII
LIST OF FIGURES
Figure
No. Content
Page
No.
1.1.1 FDA approvals & R & D spending: 1995 – 2006 7
1.2.1 Global Prescription Drug Sales (2010-2024) 8
1.2.2 Global Medicine Spending and Growth in Selected Regions, 2018–2023 9
1.2.3 Top 10 Companies as per global prescription drug sales in 2024 11
1.4.1 Indian pharmaceutical industry's projected scale, USD billion 17
1.4.2 Relationship triangle: Pharmaceutical, Physicians, Patients and Chemists 18
1.6.1 Current distribution chain in India 30
1.6.2 Patterns of complex distribution of pharmaceuticals in India 31
2.1.1 Medical Marketing 1997 vs 2016 in US 40
2.1.2 Expenditure spread of large pharmaceutical company 40
2.1.3 Staff participate at different pharmacy network levels 46
2.4.1 Objective of pricing 53
2.4.2 Types of Pricing Strategies 54
3.1.1 Research Design 74
3.2.1 Theoretical framework based on Stimulus - Organism - Response (S-O-R)
Model 81
4.1.1 Frequency of specialty pattern 85
4.2.1 Practicing experience pattern 86
4.2.2 Average Patients per Day 88
4.3.1 Impact of Activities on Dentist 90
4.3.2 Impact of Activities on General Practitioner 91
4.3.3 Impact of Activities on Gynaecologists 92
4.3.4 Impact of Activities on Paediatricians 93
4.3.5 Impact of Activities on Consulting Physicians 94
4.4.1 Regression standardized residual plot for variable detailing 96
4.4.2 Regression standardized residual plot for variable sampling 98
4.4.3 Regression standardized residual plot for variable CME 100
4.4.4 Regression standardized residual plot for variable product demonstration 102
4.4.5 Regression standardized residual plot for variable sponsorship 104
4.4.6 Regression standardized residual plot for variable journal subscription 105
4.4.7 Regression standardized residual plot for variable medical camps 107
4.4.8 Regression standardized residual plot for variable corporate image 109
4.4.9 Regression standardized residual plot for variable patient education 111
4.4.10 Regression standardized residual plot for variable personal attire 114
4.4.11 Regression standardized residual plot for variable digital marketing 116
4.4.12 Regression standardized residual plot for variable MR’s product knowledge 119
4.4.13 Regression standardized residual plot for variable CRM 121
4.4.14 Regression standardized residual plot for variable pharmaceutical promotional
tools 123
XIX
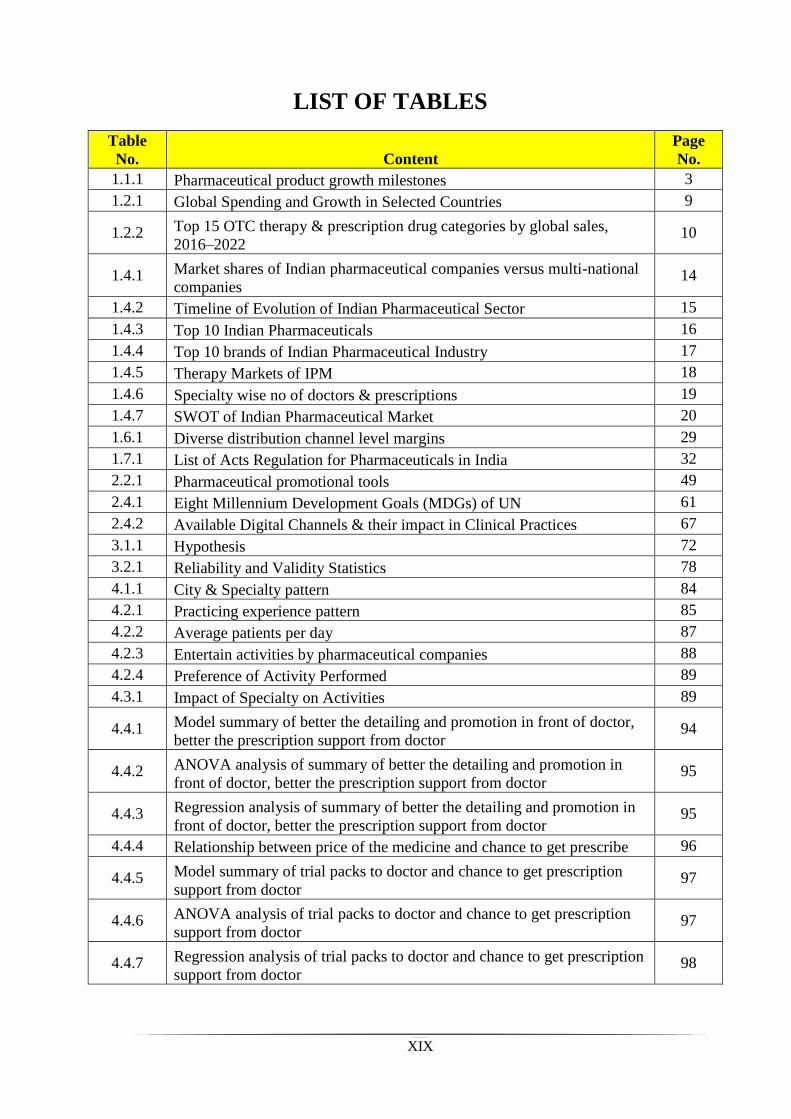
LIST OF TABLES
Table
No. Content
Page
No.
1.1.1 Pharmaceutical product growth milestones 3
1.2.1 Global Spending and Growth in Selected Countries 9
1.2.2 Top 15 OTC therapy & prescription drug categories by global sales,
2016–2022 10
1.4.1 Market shares of Indian pharmaceutical companies versus multi-national
companies 14
1.4.2 Timeline of Evolution of Indian Pharmaceutical Sector 15
1.4.3 Top 10 Indian Pharmaceuticals 16
1.4.4 Top 10 brands of Indian Pharmaceutical Industry 17
1.4.5 Therapy Markets of IPM 18
1.4.6 Specialty wise no of doctors & prescriptions 19
1.4.7 SWOT of Indian Pharmaceutical Market 20
1.6.1 Diverse distribution channel level margins 29
1.7.1 List of Acts Regulation for Pharmaceuticals in India 32
2.2.1 Pharmaceutical promotional tools 49
2.4.1 Eight Millennium Development Goals (MDGs) of UN 61
2.4.2 Available Digital Channels & their impact in Clinical Practices 67
3.1.1 Hypothesis 72
3.2.1 Reliability and Validity Statistics 78
4.1.1 City & Specialty pattern 84
4.2.1 Practicing experience pattern 85
4.2.2 Average patients per day 87
4.2.3 Entertain activities by pharmaceutical companies 88
4.2.4 Preference of Activity Performed 89
4.3.1 Impact of Specialty on Activities 89
4.4.1 Model summary of better the detailing and promotion in front of doctor,
better the prescription support from doctor 94
4.4.2 ANOVA analysis of summary of better the detailing and promotion in
front of doctor, better the prescription support from doctor 95
4.4.3 Regression analysis of summary of better the detailing and promotion in
front of doctor, better the prescription support from doctor 95
4.4.4 Relationship between price of the medicine and chance to get prescribe 96
4.4.5 Model summary of trial packs to doctor and chance to get prescription
support from doctor 97
4.4.6 ANOVA analysis of trial packs to doctor and chance to get prescription
support from doctor 97
4.4.7 Regression analysis of trial packs to doctor and chance to get prescription
support from doctor 98

XX
Table
No. Content
Page
No.
4.4.8 Model summary of continues medical education does impact of
prescription habit of doctor 99
4.4.9 ANOVA analysis of continues medical education does impact of
prescription habit of doctor 99
4.4.10 Regression analysis of continues medical education does impact of
prescription habit of doctor 99
4.4.11 Model summary of good demonstration of brand and chance of brand
recall at a time of prescribing medicine 100
4.4.12 ANOVA analysis of good demonstration of brand and chance of brand
recall at a time of prescribing medicine 101
4.4.13 Regression analysis of good demonstration of brand and chance of brand
recall at a time of prescribing medicine 101
4.4.14 Model summary of sponsorship makes doctor loyal towards sponsored
brand 102
4.4.15 ANOVA analysis of sponsorship makes doctor loyal towards sponsored
brand 103
4.4.16 Regression analysis of sponsorship makes doctor loyal towards sponsored
brand 103
4.4.17 Model summary of renowned journal subscription appreciated by doctors 104
4.4.18 ANOVA analysis of renowned journal subscription appreciated by
doctors 104
4.4.19 Regression analysis of renowned journal subscription appreciated by
doctors 105
4.4.20 Model summary of sampling camp / diagnostic camp at doctor’s clinic,
higher the prescription support of doctor 106
4.4.21 ANOVA analysis of sampling camp / diagnostic camp at doctor’s clinic,
higher the prescription support of doctor 106
4.4.22 Regression analysis of sampling camp / diagnostic camp at doctor’s
clinic, higher the prescription support of doctor 106
4.4.23 Model summary of corporate social activity improves the corporate
image in doctor’s mind 108
4.4.24 ANOVA analysis of corporate social activity improves the corporate
image in doctor’s mind 108
4.4.25 Regression analysis of corporate social activity improves the corporate
image in doctor’s mind 108
4.4.26 Model summary of doctor’s preference goes to brand which provides
better patient education 109
4.4.27 ANOVA analysis of doctor’s preference goes to brand which provides
better patient education 110
4.4.28 Regression analysis of doctor’s preference goes to brand which provides
better patient education 110

XXI
Table
No. Content
Page
No.
4.4.29 Model summary of corporate image and chance of brand to get prescribes 111
4.4.30 ANOVA analysis of corporate image and chance of brand to get
prescribes 111
4.4.31 Regression analysis of corporate image and chance of brand to get
prescribes 112
4.4.32 Model summary of good personal attire and a better company’s image in
doctor’s mind 112
4.4.33 ANOVA analysis of good personal attire and a better company’s image in
doctor’s mind 113
4.4.34 Regression analysis of good personal attire and a better company’s image
in doctor’s mind 113
4.4.35 Model summary of digital marketing and doctor’s attention towards the
brand 114
4.4.36 ANOVA analysis of digital marketing and doctor’s attention towards the
brand 114
4.4.37 Regression analysis of digital marketing and doctor’s attention towards
the brand 115
4.4.38 Model summary of reminders to the doctor of Brand and chance to get
prescription support from doctor 116
4.4.39 ANOVA analysis of reminders to the doctor of brand and chance to get
prescription support from doctor 117
4.4.40 Regression analysis of reminders to the doctor of brand and chance to get
prescription support from doctor 117
4.4.41 Model summary of doctor’s always appreciate a representative with good
product knowledge 118
4.4.42 ANOVA analysis of doctor’s always appreciate a representative with
good product knowledge 118
4.4.43 Regression analysis of doctor’s always appreciate a representative with
good product knowledge 118
4.4.44 Model summary of pharmaceutical companies are good in customer
relationship management 119
4.4.45 ANOVA analysis of pharmaceutical companies are good in customer
relationship management 120
4.4.46 Regression analysis of pharmaceutical companies are good in customer
relationship management 120
4.4.47 Model summary of pharmaceutical promotional tools helps to get
prescription support from doctor 121
4.4.48 ANOVA analysis of pharmaceutical promotional tools helps to get
prescription support from doctor 122
4.4.49 Regression analysis of pharmaceutical promotional tools helps to get
prescription support from doctor 122
4.4.50 Summary of hypothesis 124

XXII
LIST OF APPENDICES
Appendix A : Questionnaire to identify impact of various promotional
practices done by pharmaceutical companies on doctor's
prescription behavior

1 | P a g e
CHAPTER – I
INTRODUCTION TO THE PHARMACEUTICAL
INDUSTRY
Chapter Contents:
1..1 Evolution of the Pharmaceutical industry
1..2 Global pharmaceutical market
1..3 Global Trend in Pharmaceutical market
1..4 Indian Pharmaceutical Market
1..5 Opportunities for Indian Pharmaceutical Market
1..6 Challenges for Indian Pharmaceutical Market
1..7 Uniform Code for Pharmaceuticals Marketing Practices (UCPMP)
1..8 Channel of distribution
1..9 Regulations in Indian Pharmaceutical Industry
1..10 The rationale of the Study
1..11 Statement of the Problem
1..12 Scope of the study

2 | P a g e
1.1 Evolution of the Pharmaceutical industry
Drugs are the chemical substance, used in the diagnosis, treatment, or prevention of a condition
or disease, which are discovered, developed, manufactured, and sold by pharmaceutical
companies [1]. In the early 1800s, only botanical drugs such as morphine and quinine were
used in the pharmaceutical industry. Morphine was found by German apothecary Friedrich
Sertürner's, the first discovered foreign drug which is isolated from opium. Morphine is named
after Morpheus, the Greek god of the dream. Throughout the mid-1800s local apothecaries
extended their traditional function of selling botanical medicinal products such as morphine
and quinine through wholesale production. The Darmstadt firm Merck, founded in 1668, was
the first local drug firm to venture into the mass production and sale of pharmaceuticals. In
1864, there were 311 plants were incorporated in the first edition of the British Pharmacopoeia.
Which included 103 plants derived substances, inorganics substances such as iodine, iron
sulfate, sodium bicarbonate, and a few animal-derived products such as cochineal, lard &
cantharidin [2]. With notable progress in medical science (and particularly in pharmacology)
& synthetic organic chemicals, the pharmaceutical industry has transformed.
The first synthetic drug synthesized in 1540 was diethyl ether. Humphrey Davy used it as a
surgical anesthetic; it was controversial until the 1840s when chloroform (CHCL3) was
developed, which later became important as a general anesthetic. Simpson highlighted the
benefits of chloroform to reduce labor-related pain, and in 1872 her first patient was Queen
Victoria of England [3]. In 1874 salicylic acid was extracted from willow bark which had been
widely used as a pain killer. By the late 1880s, Germen dye manufacturer Bayer (founded by
Friedrich Bayer) had purified organic compounds from tar and other mineral sources to be used
as a medicinal compound. In 1899, Bayer had marketed acetylsalicylic acid under the brand
name Aspirin, the first blockbuster molecule of the world, which is still in use [4].
Paul Ehrlich and Alexander Fleming are considered as an originator of the modern “antibiotic
era”. In 1904 Paul Ehrlich discovered a drug against syphilis, a sexually transmitted disease
that was endemic and almost incurable at that time. The drug was marketed by Hoechst under
the name Arsphenamine, which had enjoyed the status of most prescribed medication until its
replacement by penicillin in the 1940s. September 3, 1928, was the historical day in the history
of mankind, Alexander Fleming had discovered penicillin, the first of its kind antibiotic that
saved millions of lives worldwide. After 12 years of initial observation, mass production and

3 | P a g e
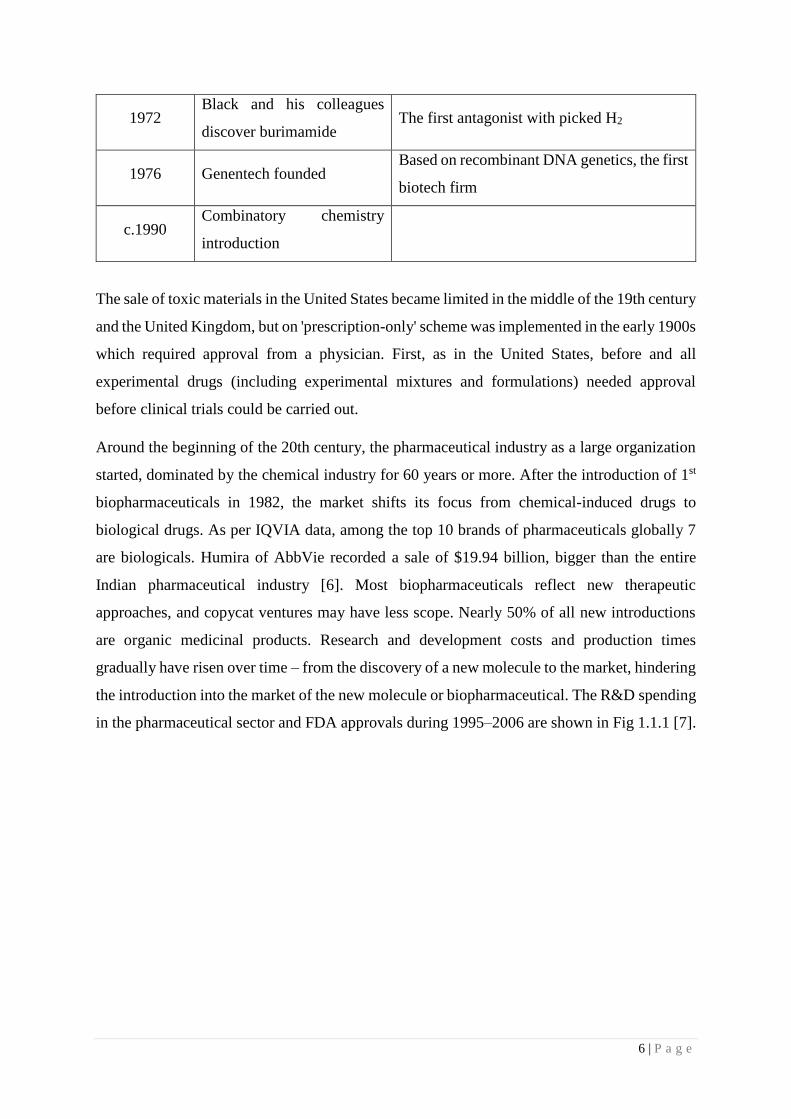
distribution of penicillin started in 1945 [5]. Table 1.1 resumed some of the pharmaceutical
industry's biggest achievements.
Table 1.1.1 Pharmaceutical product growth milestones [2]
Year Event Notes
1550 BC Ebers papyrus First known medical diagnosis compendium
1540 Synthesized diethyl ether The first synthetic drug could be 'sweet oil of
vitriol'
1668 Establishment of Merck
(Darmstadt)
The pharmaceutical industry was the first big
business in the past (1827).
1763 Lind shows that lack of fruit
causes scurvy
1775 Synthesized nitrous oxide
1785
Withering explains why the
digital extract "dropsy" is
required
The first demonstration of therapeutic
efficacy
1798
Jenner indicates that with
vaccination smallpox can
been avoided
1799
Humphrey Davy has
explained the anesthetic
effect of nitrous oxide
1803
Napoleon set up a doctor
certification and review
scheme
1806
Sertürner cleanses morphine
and demonstrates the strong
opium theory
A big move forward – first evidence of active
chemicals in herbal remedies.
Many other alkaloids have been isolated
1820–1840
1846
In Massachusetts General
Hospital, Morton
administers ether as an
anesthetic
First practical anesthesia test

4 | P a g e
1847
Chloroform was
administered to Queen
Victoria to control labor pain
1847 Bucheim founded the first
Pharmacological Institute
mid-19C
The first drug companies
were formed:
Merck (1827)
Squibb (1858)
Hoechst (1862)
Parke Davis (1866)
Lilley (1876)
Burroughs Wellcome (1880)
Pharmacy companies have in many cases
grown from pharmaceutical firms or
apothecaries.
1858 Amyl cell theory is given by
Virchow
1859 Synthesized amyl nitrate
1865
Elucised benzene structure
(Kekule) and the first use of
organic molecules of
structural formulas
Fundamentals for organic synthesis
production
1867
Brunton reveals that amyl
nitrate is used to relieve
angina pain
1878 Pasteur gives germ disease
theory
1898 Bayer-developed heroin
(diacetylmorphine)
The first synthetic version of a natural
product. Heroin is a safe and unsubstantial
remedy for morphine
1899 Bayer-designed aspirin
1903 Bayer's invention of Barbital

5 | P a g e
1904
Elliott reveals the biological
function of surface gland
extracts and suggests the
release of adrenaline as a
physiological mechanism
The first evidence for a chemistry mediator-
the main ingredient of modern medicines
1910 Discovered Salvarsan by
Ehrlich The first antibiotic to treat syphilis
1912 The word 'hormone' coined
by Starling
1921 Insulin found by MacLeod,
Banting, and Best
Lilly's pancreas (1925) was produced
commercially
1926
Loewi has explained the
release of ‘Vagusstoff’ from
heart
The First Sign of Chemical Neurotransfer
1929 Penicillin was discovered by
Fleming
Before Chain and Florey struggled with
production issues in 1938, penicillin was not
used widely.
1935 Sulfonamides were
discovered by Domagk
The first effective antibacterial medicines and
anti-metabolite prescriber
1936 Steroid hormones isolated
by Upjohn company
1937 Antihistamines were
discovered by Bovet Then antipsychotic drugs were discovered.
1946
Gilman and Philips prove
that nitrogen mustards have
an anticancer effect
First anticancer drug
1951 Discover mercaptopurine
by Hitchings and Elion The first drug for antimetabolites cancer
1961 Hitchings and Schwartz
discover azathioprine
The first successful immunosuppressant,
which can also prevent transplant rejection
from the antimetabolite system
1962 Black and his colleagues
discover pronethalol
The first β-adrenoceptor antagonist to be used
clinically
6 | P a g e
1972 Black and his colleagues
discover burimamide The first antagonist with picked H2
1976 Genentech founded Based on recombinant DNA genetics, the first
biotech firm
c.1990 Combinatory chemistry
introduction
The sale of toxic materials in the United States became limited in the middle of the 19th century
and the United Kingdom, but on 'prescription-only' scheme was implemented in the early 1900s
which required approval from a physician. First, as in the United States, before and all
experimental drugs (including experimental mixtures and formulations) needed approval
before clinical trials could be carried out.
Around the beginning of the 20th century, the pharmaceutical industry as a large organization
started, dominated by the chemical industry for 60 years or more. After the introduction of 1st
biopharmaceuticals in 1982, the market shifts its focus from chemical-induced drugs to
biological drugs. As per IQVIA data, among the top 10 brands of pharmaceuticals globally 7
are biologicals. Humira of AbbVie recorded a sale of $19.94 billion, bigger than the entire
Indian pharmaceutical industry [6]. Most biopharmaceuticals reflect new therapeutic
approaches, and copycat ventures may have less scope. Nearly 50% of all new introductions
are organic medicinal products. Research and development costs and production times
gradually have risen over time – from the discovery of a new molecule to the market, hindering
the introduction into the market of the new molecule or biopharmaceutical. The R&D spending
in the pharmaceutical sector and FDA approvals during 1995–2006 are shown in Fig 1.1.1 [7].

7 | P a g e
Fig 1.1.1: FDA approvals & R & D spending: 1995 – 2006
As far as new product creation is concerned, the pharmaceutical industry faces many obstacles.
Governments are now demanding to reduce the price of a drug to offer chipper medications to
patients to make it affordable to even the poorest person in the country. In such a scenario to
make new drug development more affordable, companies need to identify new avenues of
R&D.
1.2 Global pharmaceutical market
Global health care spending is rising. Between 2018 and 2022, the compound annual growth
rate (CAGR) across 60 countries is predicted to increase 5.4% compared to 2.9% over 2013-
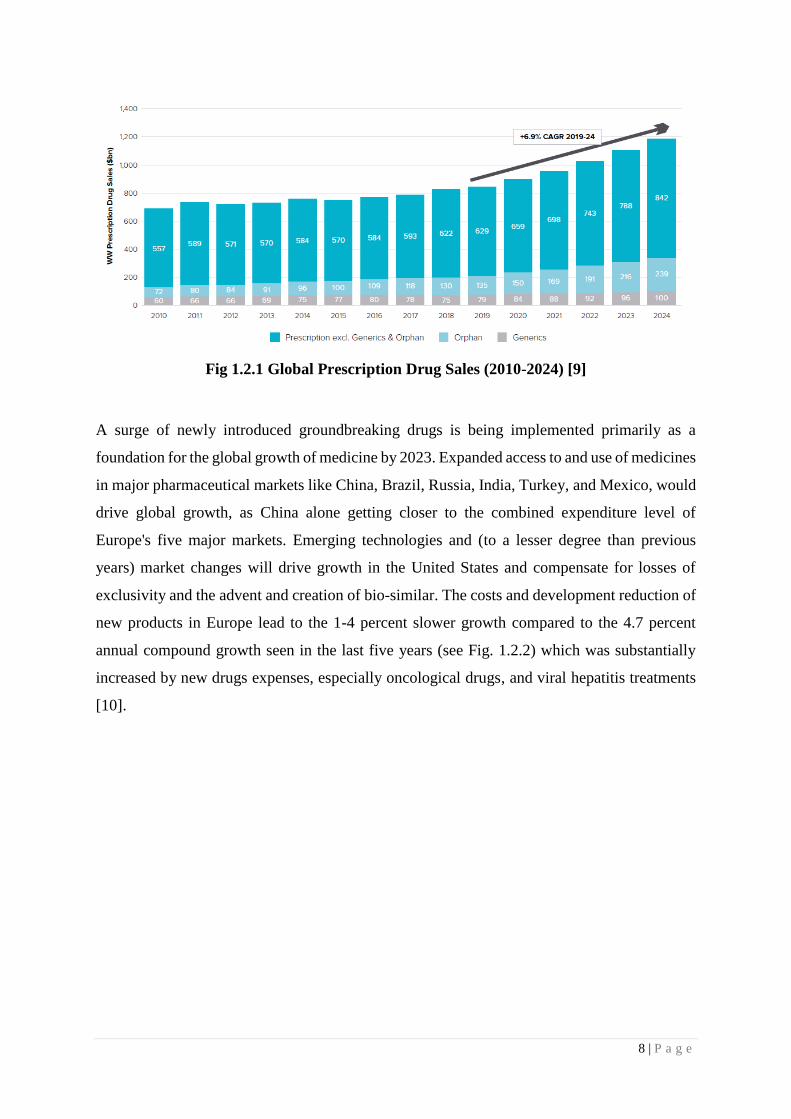
20017. Worldwide prescription drug sale is USD 900 billion in 2019 and is expected to rise
USD 1.2 trillion by 2024 [Fig 1.4]. Challenges to the global pharmaceutical industry are payer
control, generalization market losses, and bio-similar competition [8].
8 | P a g e
Fig 1.2.1 Global Prescription Drug Sales (2010-2024) [9]
A surge of newly introduced groundbreaking drugs is being implemented primarily as a
foundation for the global growth of medicine by 2023. Expanded access to and use of medicines
in major pharmaceutical markets like China, Brazil, Russia, India, Turkey, and Mexico, would
drive global growth, as China alone getting closer to the combined expenditure level of
Europe's five major markets. Emerging technologies and (to a lesser degree than previous
years) market changes will drive growth in the United States and compensate for losses of
exclusivity and the advent and creation of bio-similar. The costs and development reduction of
new products in Europe lead to the 1-4 percent slower growth compared to the 4.7 percent
annual compound growth seen in the last five years (see Fig. 1.2.2) which was substantially
increased by new drugs expenses, especially oncological drugs, and viral hepatitis treatments
[10].

9 | P a g e
Fig. 1.2.2: Global Medicine Spending and Growth in Selected Regions, 2018–2023
2018 spending USD in billion 2014–2018 CAGR constant USD
Global 1,204.80 6.3%
Developed 800 5.7%
U.S. 484.9 7.2%
EU5 177.5 4.7%
Germany 53.5 5.0%
France 36.8 1.5%
Italy 34.4 6.3%
U.K. 28.4 6.2%
Spain 24.6 5.4%
Japan 86.4 1.0%
Canada 22.2 5.0%
South Korea 15.8 4.7%
Australia 13.1 4.3%
Pharmerging 285.9 9.3%
China 132.3 7.6%
Tier 2 67.7 10.7%
Brazil 31.8 10.8%
India 20.4 11.2%
Russia 15.5 9.9%
Tier 3 85.9 11.3%
Rest of World 118.9 3.2%
Table 1.2.1: Global Spending and Growth in Selected Countries [10]
According to IQVIA industry statistics, global pharmaceutical spending exceeds
approximately USD 1204.8 billion. Around 66 percent of global investment, developing

10 | P a g e
countries contributed around USD 800 billion. The US is the world's biggest market in volume
for USD 485 billion with a CAGR of 5.7%, which is much higher than the Pharmerging
countries and the rest of the world in their overall markets. Nearly 60% of US spending comes
from initial labels. Five big countries in Europe, including Germany, France, Italy, United
Kingdom, and Spain, contribute about 15% of overall pharmaceutical spending globally. After
the US and the EU, Japan has the third-largest market with a volume of around USD 86.4
billion worth of 7 percent. The Indian market reported a value of 20.4 billion USD with a
CAGR of 11.2% following tire 3, i.e. 11.3%.
Another way to evaluate the demand is via the therapy field. Oncology will remain a leading
field of care with estimated worldwide sales of 129 billion dollars in 2017–224 and a peak of
233 billion dollars in 2024. It is estimated that the highest CAGR growth in immune
suppressants is 15.7 percent for the period 2017-2024, led by dermatologic drugs (13 percent).
Table 1.2.2: Top 15 OTC therapy & prescription drug categories by global sales, 2016–
2022 [8]
Sr. No Therapy Areas Global Sales 2017
(USD Billion)
Projected Global Sales 2024
(USD Billion)
1 Oncology 104.0 233.0
2 Anti-diabetics 46.0 59.5
3 Anti-rheumatics 55.7 56.7
4 Vaccines 22.7 44.6
5 Anti-virals 42.4 39.9
6 Immunosuppressants 3.7 38.1
7 Bronchodilators 27.2 32.3
8 Dermatologicals 12.9 30.3
9 Sensory organs 21.6 26.9
10 Anti-hypertensives 23.0 24.4
11 Anti-coagulants 16.8 22.9
12 Multiple Sclerosis
Therapies
22.7 21.5
13 Anti-fibrinolytics 12.7 20.4
14 Anti-hyperlipidemics 11.3 16.4
15 Anti-anemics 7.6 15.7
Top 15 445.0 683.0
Other 379.0 567.0
Total Worldwide
Prescription & OTC
825.0 1247.0

11 | P a g e
Fig 1.2.3: Top 10 Companies as per global prescription drug sales in 2024 [11]
In global prescription sales, Pfizer leads the market with 51.2 billion USD sales, expected
CAGR for the 2018-2024 period is 2.1%. Novartis expected to gain rank from Roche with 49.8
billion USD sales at a CAGR of 2.3%. Roche expected to register a CAGR of 0.8% and land
at 3rd rank. Other multinationals among the top 10 include Johnson and Johnson, Merck & Co,
Sanofi, GlaxoSmithKline, AbbVie, Takeda, and AstraZeneca. The total value of the top 10
corporate worth 414.9 billion USD which is around 33% of the worldwide pharmaceutical
market.
1.3 Global Trend in the Pharmaceutical market
The drugs industry is at the intersection. No gradual changes or permanent improvement would
likely avoid the collapse of a conventional pharmaceutical business model in a deeply disrupted
market that includes evolving payer strategies and patient empowerment. Next-generation
biotherapeutics, prescription digital therapy, neglected diseases, Artificial Intelligence, and
new pharmaceutical position the digital revolution and the available biotechnology innovations
will fundamentally change the practice of medicine [12].
Next-Generation Biotherapeutics
Nine biotherapeutics of the next generation (NGB) [13] have already been introduced. Selected
patient cohorts can be treated using CRISPR / Cas9 and other cells or gene editing strategies
triggered by multipotent stem cells (iPSC). The cost and accessibility modalities for these
treatments have yet to be optimized to make them more affordable. To decide better the use of
technologies such as the CRISPR / Cas9, consideration of bioethics is also required. On the

12 | P a g e
other hand, the dynamic nature of the production and distribution process limits competition in
the market.
Prescription digital therapeutics
Digital drug therapy (DTx) [14] may be a whole new way of thinking about a medicinal
product. They are tools that provide new methods of treatment and provide signs and statements
of efficacy in their prescription labels for care for particular diseases. In this group, the number
of mobile apps submitted to the FDA for approval or clearance (under the De Novo route) is
growing. Cognitive processes and behavioral forces, attention deficiency (ADHD), severe
depressive deficiency, as well as schizophrenia are all fields of intervention. IT technology
developers also partner with pharmaceutical firms to support their respective abilities in
designing novel treatment strategies.
Neglected tropical disease
In general, the prevalence of neglected tropical diseases (NTDs) in low populations is
predicted, but evidence remains available. The London Declaration of Improved Regulation
and Elimination included nine NTDs: Lymphatic Filariasis, Onchosocceresis, Schytosomiasis
(STH), Waste, Chagas disease, African human tripanosomiasis (AHA), lepsy, and visceral
leishmaniasis [15]. The London Declaration of Improved Regulation: The activities of
numerous philanthropic organizations whose work programmers are always close to receiving
regulative approval typically cover the area of tropical diseases that have been overlooked.
Millions of people working on diseases were believed to pursue short-term solutions and that
help was supported and provided first in philanthropic organizations.
Machine learning and artificial intelligence
The investment will continue to focus on Artificial Intelligence, Computer and Deep Learning,
which will help identify and develop new innovative therapies, especially in the field of
validation, targeted detection, and efficiency in clinical growth. As AI superannuates more and
more of the average knowledge worker’s monotonous tasks, it may provide even greater value
to pharmaceutical professionals by, helping them parse and interpret data faster, enabling faster
decision-making, allowing them to swiftly visualize, analyze and find patterns in data,
eliminating repetitive processes, reducing human errors [16]. AI’s “value-add” benefits and its
uses in the pharmaceutical industry are limitless. Astounding and previously unimagined AI
applications continue to emerge on the pharmaceuticals landscape on a seemingly daily basis.

13 | P a g e
Real-World Evidence: expanding use and new trial designs
Whereby RCT remains the gold standard of evidence in the regulatory application, Regulators
increasingly recognized the use of real-world (RWE) and real-world (RWD) data. The RWD
level and new conditions to use this knowledge are a stronger basis for decision-making by the
regulator. Using this data, both positive and negative clinical outcomes along with
pharmaceutical products will demonstrate the success of innovators, regulators, clinicians, and
patients.
Patient engagement: Pharmaceutical companies hiring patient advocacy leaders
Pharmaceutical producers slowly grow "beyond the pill" to create a better narrative of
consumer value. They have also built support programs to enhance the health of patients,
strengthen patient recovery and meet special patient groups. Over the next five years,
pharmaceutical firms will continue to hire public affairs and advocacy specialists.
The pharmaceutical industry is witnessing a paradigm shift from the traditional pill-based
approach to the next generation biopharmaceutical and artificial intelligence-based therapies.
Global tech giants like Google [17], Amazon [18], and Microsoft [19] are now entered in the
healthcare sector to bridge the gap between technology and the healthcare sector. Google
working on its artificial intelligence to improve healthcare outcomes. Amazon working on its
cloud technology to provide better healthcare services. Microsoft Genomics service produces
results that help to encode the gene science to beat major diseases like Cancer, Alzheimer and
many more. This collaboration of technology and science will open a new horizon in healthcare
& pharmaceutical sector for the benefit of the patients.
1.4 Indian Pharmaceutical Market
From the Gupta period, Indian pharmaceutical history started, which was about 320 to 550
BCE (Before Common Era). In India, allopathic treatment was introduced under the British
government. Sushruta Samhita & Charak Samhita are two fundamental books of ayurvedic
therapy that explained medicine, pharmaceuticals, and surgeries. But such medicinal products
were not manufactured in the region. International countries use raw materials imported from
India to manufacture their finished goods in their units and re-export those drugs to India. It
was in 1882 that a few Indian scholars such as PC Ray and TK Gajjr set the stage for the
pharmaceutical industry. In 1901, Bangal Chemical started in Calcutta that was Acharya PC

14 | P a g e
Ray's first indigenous pharmaceutical company [20]. A few other Indian businesses established
pharmaceutical companies within a few years. Bengal immunity began in 1907 & at the same
time, Alembic Chemical Works was founded in Baroda, which is considered as the basis of the
Indian pharmaceutical industry. This early practice of the pharmaceutical industry meets the
medical needs of 13% of the countries. During World War II (1939-1945) there was a sharp
decline in the supply of narcotics from foreign companies. Many pharmaceutical firms have
begun in India included Unichem, Chemo Pharmaceutics, Calcutta Chemicals, Cipla, East
India Pharmaceutical Works, Chemical Industrial & Pharmaceuticals Laboratories, and others.
Almost 70% of countries' requirements were met with the production of these modern
pharmaceutical industries before independence.
The global pharmaceutical industry expanded exponentially from the 1950s. The major
countries contributing to global growth were Germany, Switzerland, the United Kingdom, and
to some degree, the United States. A systematic approach to the treatment of diseases itself has
been begun in medicine. As the market saw the invention and commercialization of newly
developed drugs such as penicillin and other synthetic drugs, the industries focused more on
research and development on the production of manufacturing systems. As a result of the
simplification of government policies, many foreign companies have invested in the Indian
market.
Table 1.4.1: Market shares of Indian pharmaceutical companies versus multi-national
companies [20] [21]
Year Indian
Company (%
MS)
MNC (%MS)
1952 62 38
1970 32 68
1978 40 60
1980 50 50
1991 60 40
1998 68 32
2004 77 23
2019 80 20
Currently, the Indian pharmaceutical sector is fragmented with more than 20,000 registered
units and 3000 registered pharmaceutical companies [22]. In India, the pharmaceutical industry
supplies 70% of the national demand for bulk drugs, pharmaceutical intermediates,

15 | P a g e
pharmaceutical ingredients, additives, tablets, capsules, orals, and injection for drugs. It has
grown rapidly over the last two decades. The pharmaceutical industry in India has about 250
large units (including five central government sectors) and 8000 small units [23]. 7 states like
Gujarat, Maharashtra, Andhra Pradesh, Karnataka, Tamil Nadu, Goa, and West Bengal have
over 75% control over drug manufacturing, while 10 states such as Bihar, Kerala, Madhya
Pradesh, Delhi, Haryana, Rajasthan, Andaman and Nicobar Islands, Orissa, Uttar Pradesh, and
Punjab accounted for 20% of drug production units. There are just 5% of the processing
facilities in the remaining 18 states and union territories. Out of 22 pharmaceutical and biotech
products SEZ available in India, the majority of them are located in states like Andhra Pradesh,
Maharashtra, Gujarat, and Karnataka [24].
Table 1.4.2: Timeline of Evolution of Indian Pharmaceutical Sector [22]
Year Event
1970-90 Several domestic firms begin operations
In 1970 Indian Patent Act passed
Programs to export
Infrastructure advancement of production
1990-2010 Indian companies are rapidly starting operations abroad
Liberalized market
Patent approval (amendment) Act 2005 leading to drug
patents in India
India is a crucial destination in the manufacture of generic
drugs
2010 National Pricing Policy 2012 on Pharmaceutical
Adoption of new business models including channel
administration, KAM and CSO
Improved pharmaceutical companies' patent filings
2010- 2015 2014: 100% FDI in the medical equipment industry
allowed.
2015: India has 10,500 production plants and more than
3,000 pharmaceuticals firms
Leading Indian Pharmaceutical companies actively collect
funds to finance their acquirements in Germany as well as
globally
2013: New Drug Price Control Order (DPCO) issued by the
Food and Drugs Directorate.
2016 onwards The Indian government has proposed 'Pharma Dream 2020'
to make India, the leader in the world, for the production of
end-to-end medicines. Time for approval of new facilities
to improve investment has been that.
FDI in existing pharmaceutical firms rose to 74% under the
2016 Union Budget

16 | P a g e
After patent expiry, Indian pharmaceuticals promote generic drug with own brand name as a
branded generics. In such conditions, any company can manufacture the drug and promote their
brand in front of the doctor, which makes the pharmaceutical market very competitive in
nature. In 2018, the Indian market was around 18.12 billion USD in absolute value with a
growth of 9.4% year on year, [22] out of it branded generics have 90% share, rest 10% share
taken by generic medicines [25]
Table: 1.4.3: Top 10 Indian Pharmaceuticals [26]
RANKINGS TOP CORPORATES
Nov-19 MAT
MAT Value Crs % MS % Grth
1 SUN 10,931 7.50 8.4
2 ABBOTT 9,271 6.36 9.8
3 CIPLA 7,471 5.13 8.6
4 MANKIND 5,603 3.84 9.5
5 ALKEM 5,498 3.77 17.7
6 LUPIN LIMITED 5,233 3.59 10.6
7 TORRENT PHARMA 4,636 3.18 8.8
8 INTAS PHARMA 4,544 3.12 14.7
9 MACLEODS PHARMA 4,531 3.11 7.0
10 ZYDUS CADILA 4,450 3.05 7.8
MAT – Moving Annual Total, %MS - % Market Share, %Grth - % Growth
Indian pharmaceutical market is smaller in size compared to other industries like automobile,
petrochemical or information technology; but competition is never less than other industries.
The top 10 Indian pharmaceutical companies contribute about 40% of the total sales of the
Indian pharmaceutical market (IPM) & the top 50 companies generate about 83% of the sale
in IPM [27]. In 2030, the industry's annual turnover may rise to about USD 80-90 billion even
at present levels of about 7-8 percent CAGR. It could also set ambitious goals of 11% to 12%
CAGR and raise annual sales by 2024 by about 65 billion USD and by 2030 by about 120
billion USD, to 130 billion USD [28].

17 | P a g e
Fig 1.4.1: Indian pharmaceutical industry's projected scale, USD billion
Indian medicine market is known for its branded generic formulations. Companies market
generic formulations with their brand name and also convinced a doctor to prescribe a
particular brand with help of their qualified field force. Millions of such generic brands are
available in the Indian market.
Table 1.4.4: Top 10 brands of the Indian Pharmaceutical Industry
RANKING TOP BRANDS COMPANY
Nov-19 Mat
MAT Value Crs % MS % Grth
1 MIXTARD ABBOTT 717 0.49 6.8
2 GLYCOMET-GP USV 512 0.35 16.0
3 AUGMENTIN GLAXO 489 0.34 26.2
4 LANTUS SANOFI 487 0.33 16.1
5 JANUMET MSD 450 0.31 6.1
6 NOVOMIX ABBOTT 433 0.30 9.0
7 CLAVAM ALKEM 417 0.29 20.8
8 MONOCEF ARISTO 415 0.28 21.2
9 THYRONORM ABBOTT 391 0.27 12.9
10 LIV-52 HIMALAYA 391 0.27 12.7
Cardiac and anti-infective are the leading therapy areas and contributors in the Indian
pharmaceutical industry for years. As per the WHO report 98 million people in India may have
type 2 diabetes by 2030 [29]; which makes India a hub for the anti-diabetic market. Poor
hygiene & careless use of antibiotics makes an anti-infective market, the second-biggest market
in India. Table 1.4.5 describes some major therapy areas of the Indian pharmaceutical market
(IPM).

18 | P a g e
Table: 1.4.5: Therapy Markets of IPM [30]
Therapy Area Nov-19 Mat
Val. Cr % Grth
Cardiac 14,579 10.8
Anti-infective 14,441 11
Respiratory 10,297 9.1
Dermatology 9,749 8.8
Oral Anti Diabetic 9,120 12.5
G. I. Market 8,852 9.6
Neurology / CNS 7,294 9.2
Gynaecology 6,256 10.4
Pain Management 5,910 9.5
Vita. /Minerals / Nutrients 5,051 9.8
Ophthalmology 2,111 9.9
Urology market 1,942 13.1
The pharmaceutical industry is closely connected with health care practitioners. The
pharmaceutical industry is different in terms of market dynamics, here customers are not the
consumers and direct reach to the consumer is not allowable as per the regulations set by the
governments. The target audience and customers for the pharmaceutical companies are doctors,
but the real consumers (patients) are out of the reach for drug makers [31]. Drug makers are
indirectly in touch with patients with help of physicians and chemists. The relationship between
pharmaceuticals, physicians, patients, and chemists can be best explained by a triangle theory.
The physician is the center of the triangle and is in touch with all three dimensions of the
healthcare system [Fig. 1.4.2]. Physicians are the power center of the healthcare system and
therefore target audience for all pharmaceutical companies.

19 | P a g e
Fig 1.4.2: Relationship triangle: Pharmaceutical, Physicians, Patients, and Chemists
The growth of the pharmaceutical industry also depends on the no of doctors in the county and
the reach of the healthcare system to the patient. As per the IMS prescription data of Dec’19,
in India, more than 3,70,370 doctors are practicing with are generating 2.7 billion prescriptions
every year. Each doctor generates 600 prescriptions every month with an average of 20
prescriptions per day [32].
Table 1.4.6: Specialty wise no of doctors & prescriptions [32]
Specialty No of
Doctors
%
Contribution
Prescriptions
(in Lacs)
%
Contribution
Total 3,70,370 100 26,728 100
GP - Non MBBS 86,032 23 6,642 25
Dentist 53,075 14 2,830 11
GP– MBBS 41,059 11 3,688 14
Consultant Physician 30,957 8 2,249 8
Gynaecologist 29,109 8 1,896 7
Paediatrician 20,786 6 1,965 7
Ophthalmologist 17,954 5 1,043 4
Orthopaedics 15,553 4 1,181 4
ENT Specialist 14,461 4 1,235 5
General Surgeon 13,590 4 840 3
Cardiologist 8,867 2 634 2
Dermatologist 7,020 2 559 2
Chest Specialist 6,746 2 425 2
Nephrologist/Urologist 5,340 1 303 1
Diabetologist/Endocrinologist 5,259 1 349 1
Neurologist/Neuro Surgeon 5,174 1 329 1
Gastroenterologist 4,742 1 285 1
Psychiatrist 3,615 1 224 1
Oncologist 1,030 0 51 0
General practitioners (GP MBBS and GP Non-MBBS) having 34% contribution in total
doctors available in the country which are responsible for 39% of prescriptions. Dentists are
the second biggest specialty with a 14% contribution with a prescription share of 11%, followed
by consultant physicians with 8% contribution and 8% prescription share. Pediatricianss hiving
the highest prescriptions per month with an average of 788 prescriptions i.e. 26 prescriptions
per day.
In the future, the pharmaceutical industry can benefit from many influential factors. Many of
them are nature-intrinsic and others foreign. Indian pharmaceutical has flourished both in India

20 | P a g e
and in developing countries, as in three decades, India has been able to become the world's
leading medicine manufacturer. Any of the key variables are used in a SWOT study.
Table 1.4.7: SWOT of Indian Pharmaceutical Market [33]
Strengths
Design, production and logistics low cost. Growth in the GDP sector has increased the
availability of income in the hands of the
general public and their optimistic spending on
health services is increasing the growing health
care population of patients. Clinical trials data management Intellectual property rights
Weakness
Bad all-around infrastructure is an
incredibly daunting obstacle. Low
investment in advanced R&D.
Most companies lack the opportunity,
because of lack of capital, to compete
with New Drug Discovery of MNCs and
molecular searches around the world.
Low quality in health benefits.
Opportunities
Infrastructure improving public-private
partnerships
Fast OTC global demand and generic market
growth
Major export opportunities.
The expansion of the healthcare market and the
increase in per capita income - the drivers of
growth for the pharmaceutical industry - were
patented by USD 40 billion worth of drugs in
the United States and 25 billion USD in drugs in
Europe.
Threats
Wage inflation
Drug Price Control Order renders drug
costs and competitiveness
unrealistically;
Improper structures complicate the
reach of Indian clinical trials
International players (advanced
technology-based products) enter the
Indian market
1.5 Opportunities for Indian Pharmaceutical Market
In key areas of the value chain, such as growth, product creation and process innovation, the
success of the Indian pharmaceutical industry was based on its distinctive ability. There are
several opportunities for Indian pharmaceutical players to find an accelerated growth path
through new geographies and product categories.
State-sponsored health coverage programs
It is estimated that ten crore vulnerable families (around 50 crore beneficiaries or about forty
percent of the Indian population) benefit Ayushman Bharat Yojana (a centrally funded National
Health Protection Program) [34]. This would allow poorer households access to health services

21 | P a g e
and increase coverage of health insurance. This offers the industry an opportunity to help the
underserved masses in India with affordable medicines.
Newer product classes such as bio-similar, gene therapy and specialty drugs
The development of generic medicines was mainly attributed to the Indian pharmaceutical
industry. Being one of the first companies in the industry to initiate bio-like production and
launch on the Indian market, the success of new product classes like gene therapy and specialty
drugs in the next generation product classes was minimal (e.g. the first bio-like one for
Rituximab was introduced by India's Dr Reddy in 2007 [35]) The environment that would be
useful for development support, i.e. biotechnology department and regulatory authorities
would have played a more helpful role but may have been restricted.
A large skilled, yet the cost-efficient workforce
In the Indian education system, more than 2,25,000 [36] pharmacists have graduated (compared
with only about 17,000 pharmaceutical students in the United States). The team comprises
highly qualified doctors and specialists who bring tremendous skills to clinical research and
contribute actively to it. It is assisted by a smart, highly skilled team of people from all over
industry and academia employed in the clinical research sector. Moreover, India becomes one
of the most promising destinations for clinical research through the availability of a diverse
patient pool. Labor cost efficiencies also provide Indian companies with a major competitive
advantage.
Leveraging the patent cliff
Branded molecules patents with total global revenues of over USD 251 billion, which will open
to the market, are set to expire between 2018 and 2024 [11]. The Patent cliff will greatly benefit
the Indian generics market with increased New Drug Application Share. The industry may need
to build a sharp strategy at the molecular level, along with excellent regulatory and market
results.
International markets & exports
The next wave of growth may be the growing export to large traditionally-sustained markets,
such as Japan, China, Africa, Indonesia, and Latin America, as the industry aspires to become
by its volume the world's largest supplier. Entering these markets could require a new business

22 | P a g e
model to adapt to local market needs. Aid for government interventions and trade relations
would allow Indian pharmaceutical companies to gain market access to these markets.
1.6 Challenges for Indian Pharmaceutical Market
In the current climate, however, the Indian pharmaceutical industry faces many challenges but
the main challenges are as follows:
Huge ‘Out of Pocket (OoP)’ expense
It limits access to drugs because the Indian Insurance Portion is intended for patients in IP
rather than OP, creating a lot of dents. It is primarily for the following significant reasons [37]:
Poor public health care spends, only 1.1 percent of GDP
Weak healthcare facility & system
Low access to health insurance programs in all sectors of society
NLEM (New List of Essential Medicines) & DPCO (Drug Price Control Order)
The National Critical Medicinal Products List is one of the main instruments in a country's
universal health care program that provides affordable, available, high-quality medicine at all
primary, secondary, tertiary healthcare rates. Achieving this Indian government, Health and
Family Welfare Ministry (GOI, MOHFW) has agreed to provide a list of medicines of
significant value. India's first National Medicines Essential List was prepared and published in
1996. Subsequently, this list was amended in 2003.
The GOI and MOHFW took into account the need to update NLEM [38] in addressing the
issues related to evolving disease prevalence, therapeutics, the implementation of new
medicines and the assessment of an appropriate risk-benefit profile.
NPPA is an Indian Government organization that was created, inter alia, under the DPCO 1995
to set/revise the cost of verified bulk medicinal and preparations as well as to enforce prices
and the availability of medicinal products in the country. Furthermore, the company is
responsible for recovering from customer's overwhelmed volumes by suppliers for regulated
medications. It also tracks unregulated drug prices, so that they are kept at a fair level [39].
DPCO controls the price of drugs on behalf of the government of India and forces
pharmaceutical companies not to increase the price beyond the limit. This cited as a major

23 | P a g e
challenge the revenues they earn are essentially peanuts for most pharmaceutical firms, and
such revenue is not enough to allow more investment.
Lack of capabilities in the innovation space
In the field of innovation (e.g. new engines, complex generics), Indian pharmaceutical
companies have been growing slowly, with a small ecosystem of government-supported
research. The college curriculum is also divided into the specifications of the industry.
However, there is room in the research initiatives focused on innovation to strengthen
cooperation between government institutes and industry. The role of government agencies in
clinical trials is frequently questioned for pharmaceutical firms. Approvals for clinical trials
are subject to strict regulatory standards in India.
Dependence on external markets for intermediates and APIs
About 80 percent by volume of India's API requirements are met by China [40], which put
importers in danger of supply disruptions and unpredictable movement of prices. The API
requirements are met by volume by China. Nevertheless, insufficient services such as
uninterrupted supplies of water and power and a lack of scale in 'special economic zones' and
minimal public support in tax incentives, favorable license renewals and capital subsidies have
not been able to capture the API's potential.
Limited presence in markets other than the US
There are also problems with the small presence in main markets such as China and Japan.
Attempts to join those countries have still not achieved the required momentum and scale due
to numerous regulatory obstacles. Even the contribution of non-generic products to the present
sales of pharmaceutical firms is minuscule, despite innovation in new types of medicines, such
as bio-similar and specialty medicines.
Increased scrutiny in quality compliance for exports
As the industry expands in various geographies and the concerns about the quality of imported
medicines are growing globally, regulators will be more vigilant about quality standards. The
largest number of USFDA inspections since 2009 has been faced by India. To order to keep
the promise of a "high quality efficient" supplier of medicines worldwide, the industry needs
to constantly invest in improving quality standards.

24 | P a g e
Uniform Code for Pharmaceuticals Marketing Practices (UCPMP) compliance
'Uniform Code of Procedures for Pharmaceutical Promotion' (UCPMP) was issued by the
central government in December 2014 as guidance for the medicinal products and medical
devices promotion and marketing industry. UCPMP in many ways limits pharmaceutical
purchases to physicians. Such recommendations are, however, voluntary and currently have no
force of law.
As the current study is mainly focused on marketing practices and their impact; UCPMP is the
major guideline affecting marketing activities. It’s worthy to discuss UCPMP in detail for
better understanding.
1.7 Uniform Code for Pharmaceuticals Marketing Practices
(UCPMP) [41][42]
The main promotional instrument for the promotion of pharmaceutical products by
pharmaceutical firms is three key codes concerned with the promotion/advertising of medicinal
goods: (1) International Pharmaceutical Manufacturers Federation (IFPMA) code on
pharmaceutical marketing practices; (2) World Health Organization (WHO) ethical code guide
pharmaceutical industry for various promotional strategies & (3) Uniform Code for
Pharmaceuticals Marketing Practices (UCPMP) [43]. The Department of Pharmaceuticals
under the Union Ministry of Chemicals and Fertilizers has submitted the Draft, Voluntary Code
for the Pharmaceutical Industry. The UCPMP was proposed in March 2012 as the Self-Control
Code, requiring all organizations to implement and report to the government. The UCPMP has
been submitted to all stakeholders 'reviews on the departments' websites. The comments
received have been reviewed and the UCPMP Final Drafts prepared for review and circulated
to Pharmaceutical Associations. The Indian Pharmaceutical Producers Organization (PPOI)
called on the government to make its Uniform Pharmaceutical Marketing Practices Code
(UCPMP). Doing so creates a high level of transparency & accountability which eliminates all
confusion between industry, health professionals and patients. UCPMP guidelines covers,
claims, Information on promotional materials, Comparison of drugs, free samples and Gifts
and other benefits [41].
Claims and Comparison
Allegations of drug use must be based on a current evidence evaluation.

25 | P a g e
"Fresh" must not be used in India for longer than 12 months for any commercially
accessible medication or medical use commonly supported.
"Safe" should not be used with no qualification and should not imply that the medicine
does not have any addictive, toxic, or risk-dependent consequences.
Comparisons between medications should be accurate, rational and substantiated. A
contrast must be rendered such that contradictions, excessive focus, absence or
otherwise are not fooled.
Associations shall not include certain brand names of firms until the businesses
involved have given their prior permission.
Certain businesses do not implicitly or implicatively denigrate their goods, facilities
and promotions.
Information about promotion materials
When the purpose of advertisement is to provide sufficient information as to which people are
eligible for the product or use, there must be transparent and legible details on the following
minimum information, and the promotional material needs to form an integral part:
o The product involved, name and address of control holder or corporate name of
section of organization responsible for selling the medication;
o The medicinal name and list the active ingredients which are immediately
adjacent to the most popular medicinal name show with a generic name;
o Recommended dosage, application method and, if not obvious, application
method; adverse effects, alerts and precautions and relevant counter-indications
for the product;
o A declaration that additional information on request is available;
o Date of generation or last update of the information listed above.
o Promotional materials such as mailings and newspaper advertisements do not
cover up their true existence. Where a drug company pays for or otherwise
ensures that promotional material is published in journals, this promotional
content should not be editorial.

26 | P a g e
Promotional materials in newspapers paid or bought by a client and which relate to any
of the goods of the same enterprise by a brand name shall, as appropriate (the above
requirements) be met, irrespective of the published editorial control of such content.
In-text and illustration, advertising material shall adhere to good-taste canons and
should be presented to consider and be unlikely to compromise the recipients' status
professionally.
The names or pictures of health professionals shall not be used in advertising content.
Advertising materials should not mimic products, phrases or a general style that are
potentially misleading or confusing in other businesses.
Where appropriate (in the area of technical and other data content for instance) the
printing date or the recent review for promotional material should be listed.
No item that may or cannot be called public advertisements includes postcards, other
uncovered mailings, packets, or wrappers.
All the accompanying imprints must endorse audio-visual content to comply with all
applicable Code requirements.
Free Samples
No individual who is not eligible to prescribe such a substance shall be provided with
free drug samples.
If a medical representative distributes samples of the products, a person eligible for the
prescription or a person approved for receipt of the sampling product in his or her name
shall be directly sent to the sample.
The following conditions shall be followed when supplying a person qualified for the
prescription of that drug:
o The following conditions are found in the supply of a patient qualified to
prescribe such a medicine:
o The prescribed dosages for these sample packs for 3 patients shall be limited to
the treatment required;

27 | P a g e
o Such specimens must be supplied in response to a request signed and dated by
the recipient;
o The supply of these samples should be maintained through an appropriate
system of control and accountability;
o Each package of samples shall not exceed the smallest pack on the market.
o "Free-to-sell medical research," or a legend of comparable significance is
branded in any research;
o Commodity Information's most up-to-date version (as provided by the Drugs
and Cosmetics Act of 1940) for this drug shall be accompanied by copies of
each sample.
A pharmaceutical firm shall not have a sample of anti-depressant, hypnotic, sedative or
soothing medication.
Organizations must maintain the information, such as product names, physicians'
names, quantities of given samples, date of distribution of free samples to medical
professionals, etc.
Gifts and other benefits
No donation, financial gain or income in kind given or made available to qualified
persons by or from the pharmaceutical company or their workers, i.e. manufacture,
manufacturing, distributors, etc. a drug manufacturer.
No personal donations (including immediate and enhanced entertainment tickets) are
either available or given to health workers or family members (e.g. entertainment
tickets).
Travel facilities: No travel facility in or outside the country or be extended to, for
holiday or to participate in conferences, seminars, workshops, CME programs, train,
shore, airplane or boat tickets, paid vacation programs etc. by corporations or
associations/representatives or by anyone working for them. It is thus clarified that if a
physician is present, it would be at his own expense to advertise a medication or to
disseminate information at any lecture, conference or meeting of the pharmaceutical
industry.

28 | P a g e
Hospitality: Organizations or their agents shall not provide healthcare practitioners or
their families with any excuse in the form of lodging, such as hotel accommodation.
Cash or monetary grants: Under no reason shall corporations or organizations pay
individual healthcare professionals no cash or monetary benefit.
Medical research, analysis, etc. funding can only be extended transparently by approved
institutions through modalities provided by legislation, regulations and guidelines
followed by such approved institutions. It is always fully communicated.
1.8 Channel of distribution
India is a geographically diverse country with severe conditions which play a critical role in
distribution. To make the product available at the consumer level; the distribution channel plays
an important role. Pharmaceutical products manufactured at plants and to supply medicines at
every corner of the country is another important aspect. The three main pillars of the
distribution system of the Indian pharmaceutical industry are sorting, forwarding agents i.e.
CFAs (depots and dealers), stockiest (wholesalers) & retailers (pharmacies or dispensing
practitioners). Each pillar plays an important role to make medicines available to patients.
CFA (Clearing and forwarding agents) / Depots and Distributors (stockiest)
There has been a change in the delivery of drugs in India. Before 1990, pharmaceutical firms
used a specific distribution network to create their shops, now substituted for carrying / clearing
and forwarding agents (CFAs). These are primarily responsible for holding the stock of the
company's products (stock) and transfer SKUs on demand. Such businesses form the
distribution chain. In every Indian state, most companies maintain one to three CFAs. The CFA
fee can be a fixed percentage margin, depend on turnover, mostly between 2 and 4 percent. On
average, an average company can operate with a total of 25–35 CFAs [44]. In a high selling
product, it may be 4% to 10% on a low sales product several times [45].
Stockiest/wholesalers
Styles are slightly different from CFAs for the stockiest ship. Contrary to the CFA that can
manage the stock of an enterprise, More than one client (usually 5-15 depending on warehouse
capacity), a contractor (regional distributor) may be worked at the same time. In 30-45 days (a
standard loan or period), the stockiest person pays the drugs on behalf of the pharmaceutical
business. Based on the average sales of goods, the company pays the CFA once or twice a year.

29 | P a g e
Some inventories appear to cost retailers up to 6 percent, leaving the dealers just 2-2.5 percent.
Stockiest also collects from businesses 5-10 percent of discounts as free bundles, some of
which are discounted by retailers. In 2006 there were over 60,000 stockiest in India, according
to the All India Organization of Chemists and Druggists, (AlOCD).
Retailers/pharmacies/dispensing practitioners
A significant number of small-scale distributors, who often serve as prescribers and sellers,
make up the remaining sector. According to AIOCD figures, India has a total of over 700,000
retailers with 100sqft [46]. Source of industry estimates that retailers make up about 70–80%
of the country's pharmaceuticals sales. Private practitioners (whether formally trained or
untrained) typically hold stocks of most medicines they expect to prescribe in the rural and
small towns of India (probably represent 25–35 percent of the marketplace). Drug advice of
pharmacists tends to be focused on productivity and the relationship between drug and
substitute goods and members of different enterprises. The retailers are entitled to 16% for
regulated formulations and 20% for Maximum Retail Price (MRP) unregulated formulations.
Nowadays online pharmacy stores like 1mg.com, netmeds.com and pharmeasy.com also act as
a communist pharmacies and supply medicines to the patient with good discounts.
Table: 1.6.1 Diverse distribution channel level margins [47]
Levels Margins
Retailers 16% for the scheduled medicines
20% for the nonscheduled medicines
Stockiest or distributors 8% for the scheduled medicines;
10% for the nonscheduled medicines
CFA (Clearing and
forwarding agents)
1–10% on the total trade volume + other
expenses

30 | P a g e
Fig: 1.6.1 Current distribution chain in India
Figure 1.6.1 demonstrates how a manufactured product is supplied to the CFA or super stock
in the central warehouse operated by a corporation. The inventories are supplied by the CFA
to the most plant, sub-stockiest or hospitals. The specialty drugstore obtains the most processed
or sub-structured goods, from which customers (patients) can finally get access to them. Some
small producers supply the super stockiest medicines directly. There is a dynamic path for
many businesses. The picture below demonstrates and fits into all sorts of potential Indian
pharmaceutical distribution networks.
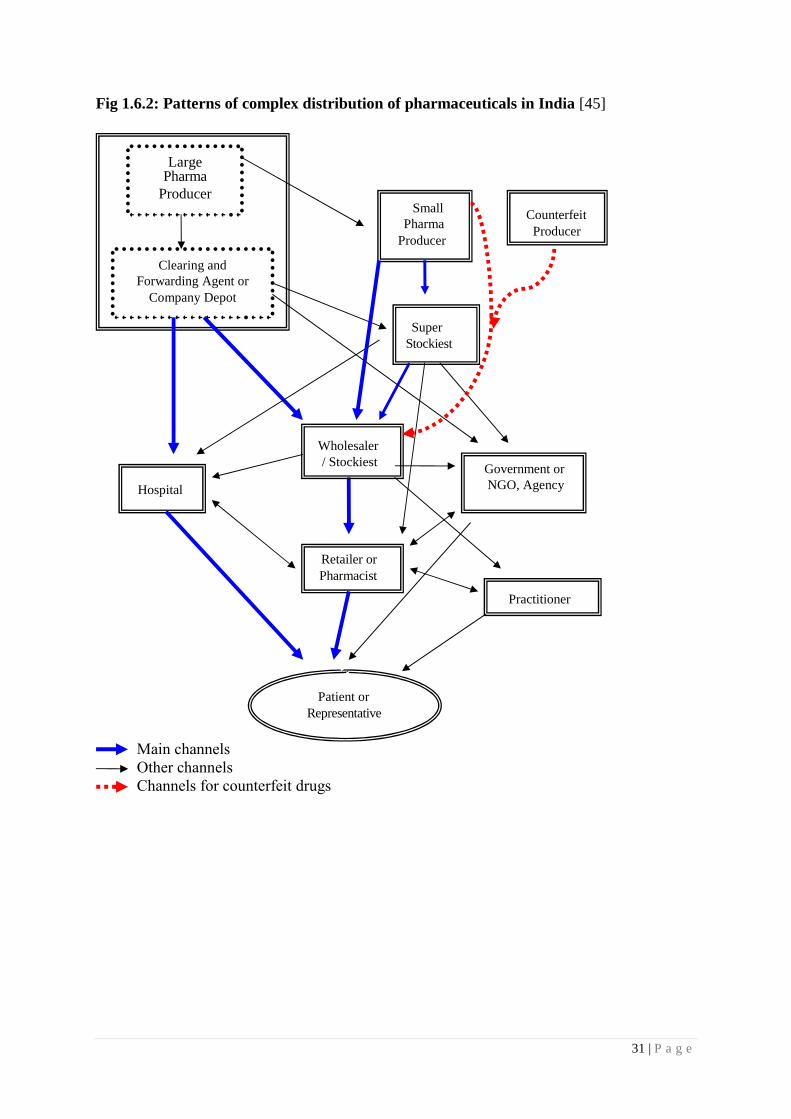
31 | P a g e
Fig 1.6.2: Patterns of complex distribution of pharmaceuticals in India [45]
Large Pharma
Producer Small
Pharma
Producer
Clearing and
Forwarding Agent or
Company Depot
Super
Stockiest
Government or
NGO, Agency
Retailer or
Pharmacist
Patient or
Representative
Practitioner
Hospital
Wholesaler
/ Stockiest
Counterfeit
Producer
Main channels
Other channels
Channels for counterfeit drugs

32 | P a g e
The pharmaceutical distribution system in India is highly competitive and challenging. Some
studies have shown that when we look at ground level, more complex relationships exist [45].
It may also be more difficult to maintain interactions with the stakeholders in such a dynamic
setting because of the lack of communication & the use of sophisticated communication and
data methods is more unavoidable in these complex structures. Picture 1.6.2 gives one full
description of the Indian pharmaceutical distribution network's supply chain, which reflects
several more latent relationships and sum up the total drug distribution relationships or
networks up to the ultimate customer [48].
1.9 Regulations in Indian Pharmaceutical Industry
The pharmaceutical industry in India was in primary phases until the 20th century. Many
medicines from other countries have been imported. Since the First World War, there has been
a massive rise in demand for pharmaceutical drugs, which contributed to the growth in the
market of falsified medicines. Table 1.7.1 lists some significant actions that have paved the
way for Indian regulatory growth.
Table 1.7.1 List of Acts Regulation for Pharmaceuticals in India [49]
Year Act & Regulations
1919 Poisons Act: Possession or sale of toxins
1930 Dangerous Drugs Act: Origin, history and production of opium, manufacture,
production, sale of opium and opium
1940 Drugs and Cosmetics Act: Drugs are manufactured, produced, distributed and
sold. This action includes allopathic, homeopathic, Unani and Siddha medicines
1945 Drugs and Cosmetics Rules: Drugs production for sale. Not for possession, use
or ownership of drugs
1948 Pharmacy Act: Pharmaceutical occupation in India
1955 Drugs and Magic Remedies Rules: Monitoring of medicine’s advertisements
1970 Indian Patent Act: Regulates patents in India
1985 The Narcotic Drugs and Psychotropic Substances Act: The process of Narcotic
substances and drugs
1995 Drug Prices Control Order: Monitoring maximum retail price of drugs for
customers
1999 India joined Paris Cooperation Treaty: Enforcement of product patents and
regulations
2005 Patent Amendment Act: Facility for black box application

33 | P a g e
Clinical Trial Registry-India: Clinical research organization registration in
clinical trials before the first patient
Pharmacovigilance Programme of India (PvPI): Reassurance of drug safety for
Indian patients
The CDSCO, the Indian Medical Research Council and the Minister for Health and Family
Welfare are listed as the regulatory authority for pharmaceuticals in India.
CDSCO (Central Drugs Standard Control Organization) is the central drug authority, the
positions allocated under the Drugs and Cosmetics Act by the Central Government. This works
in the center and the department, ensuring secure, effective and secure medicines given to the
public. The CDSCO inspects the imports, license applications for new drugs, clinical trials,
meetings of DTABs and a public advisory committee. The regulation, marketing and
distribution is the responsibility of the government and central authorities for approvals of
clinical trials, monitoring of the quality of import medicines, the establishment of medication
standards and the implementation of drug testing standards. All licenses shall be provided by
CDSCO by the Central licensing authority, CDSCO. The Indian Drug Controller granted
medication licenses including blood, blood products, vaccines & IV Fluids.
ICMR (The Indian Council of Medical Research), is one of the world's oldest health science
and Indian Apex bodies, sponsored by the Indian government through the Ministry of Health
and Family Welfare, for the formulation and coordination of biomedicine studies. The Council
supports work on diseases that can be transmitted, such as cardiovascular diseases, cancer and
blindness and diabetes, on prevention of communicable diseases, fertility regulation, the safety
of mothers and children, alternative health approaches, the preservation of occupational and
environmental health limits and work on the disease that cannot be transmitted. Such measures
are intended to reduce the overall disease burden and encourage public health and well-being.
The Ministry of Health and Family Welfare is a Ministry of Indian Health Policy Ministry
in India. Two divisions are housed within the Department: the Department of Education and
Family Welfare, and the Ministry of Agriculture. It is also responsible for the family planning
programs relevant to all government initiatives in India. Ministry of Health shall be responsible
for family health aspects, particularly in the fields of reproductive, maternal, pediatric,
information, education and communication; cooperation with NGOs and international
assistance organizations; health and community programs, including awareness-raising,
vaccination initiatives and preventive measures.
34 | P a g e
1.10 Rationale of the Study
The researcher chose this subject in research because he has been working in the
pharmaceutical industry for the past ten years in a sales and marketing team. So he has taken a
closer look and observed that there have been a lot of changes in pharmaceutical marketing and
promotional tools over the last decade.
Pharmaceutical companies spend almost 24% of their revenue on marketing activity at various
levels, including stockiest, retailers and doctors. Expenses on marketing activities are the
second biggest cost to the company after manufacturing. So, return on marketing investment
plays a crucial role in the growth of the organization. Selection of the right activity on the right
doctor is very decisive to get the highest return on activity investment. The impact of activity
also varies with the specialty of the practitioner. Pharmaceutical marketers are always in
dilemma for the selection of the right activities for their brand to outperform in the marketplace.
The current research aptly guides marketers to select the right activity for their customers to
gain better mind share for their brands. As a pharmaceutical marketer, he saw the impact of
such activities on sales and prescription. Therefore, he tried to analyze and document the
effectiveness of various pharmaceutical promotional tools and came up with some useful
suggestions for their effects on prescription behavior.
The pharmaceutical industry is more regulated in nature, the industry is concerned with the
lives of the people so the government enforces multiple regulations on the market of
pharmaceutical products along with the manufacturer. The researcher sought to study
government law on the future trends of this industry and the pharmaceutical industry.
Finally, the researcher tries to capture participants and pharmaceutical industry professionals'
expected pharmaceutical marketing strategies by tailoring their future goals and strategic plans
accordingly.
1.11 Statement of the Problem
There is huge potential in the Indian pharmaceutical industry. A big change is happening as
new markets for new products and services grow and some old markets disappear. Many new
pharmaceutical companies have entered the Indian pharmaceutical market with their new
product line. Many combinations and acquisitions are possible. In particular, the marketing
strategy of pharmaceutical companies has also changed over time. Therefore, it is important to

35 | P a g e
look at changes in prescription-based drug marketing. In this intense competition,
pharmaceutical companies use their best marketing brains to change doctors for their brand.
In the development or subsequent development of pharmaceutical advertising for prescription-
based drugs, marketers need to know the expectations of their customers. As a marketing
aspect, it is important for marketers to know these expectations as well as future trends in the
industry, to satisfy customers and to plan for other successful marketing strategies in the future.
But for marketers, the desired return on investment is possible only if they have the idea that
the drug promotion tool will have a better impact on prescription behavior. Here the researcher
tried to identify the effect of various pharmaceutical promotional tools on the prescription
behavior of healthcare practitioners.
Healthcare practitioners can be divided into two categories, generalists and specialists.
Generalist covers general practitioners & consultant physicians whereas specialist covers
gynecologist, pediatrician, dentist, surgeons, orthopedic, etc. Super specialists like urologists,
cardiologists, oncologists etc. have been covered under the specialist category only [50].
Science proceeds by replication and by the generalization of individual study result into broader
hypotheses, theories, or conclusions of fact. Establishing study boundaries and conducting
“population-based” research within them enhances both internal validity and the likelihood that
results may apply to similar and dissimilar groups. However, studies of specifically defined
groups may also generalize to extend our knowledge [51]. The current research was conducted
on both the category of a healthcare practitioner to generalize the outcome for the population.
With the above bifurcation, in India, 43% of doctors are generalists where as 57% of doctors
are specialists [32]. All generalists behave similarly while specialists follow their
characteristics. If the sample of study can mimics the population with respect to number of
specialists and generalist, the result of survey can generalize to population, as sample exactly
represent the population. The researcher tried to incorporate the above criteria while designing
a sample group for the study, so that result of the study can be implacable to entire medical
fraternity and the outcome helps pharmaceutical marketer to formulate better strategists to
enhance the ROI of their activities.
Since it is difficult to study the entire Indian pharmaceutical market, the researcher did this
research in metro cities of Gujarat i.e. Ahmedabad, Baroda, Surat and Rajkot.

36 | P a g e
1.12 Scope of the study
1. The subject of the study is limited to “Impact study on various promotional practices
done by Pharmaceutical companies on doctor's prescription behavior”
2. The research was conducted in the metro cities like Ahmedabad, Baroda, Surat and
Rajkot in Gujarat, so the scope, results and recommendations of the study are limited
to the metro cities of Gujarat.
3. The researcher selects only limited specialties of healthcare practitioners such as
General Practitioner, Consulting Physicians, Dentists, Pediatrician and Gynecologist.
The range is therefore limited to these specialties only. Other channel
partners/stakeholders such as chemists, stockiest, medical representatives and hospital
nursing staff will not be considered in this study, so this scope is limited to healthcare
practitioners only.
4. The researcher focused on very specific aspects of pharmaceutical marketing, such as
the promotional tools used by drug companies. Product availability or other parameters
leading to a prescription such as tender and corporate business are not taken into
account here.
5. The scope of the study was limited to measuring the effectiveness of pharmaceutical
promotional tools on prescription-based drugs, while other types of drugs such as over-
the-counter were not considered for this study.

37 | P a g e
CHAPTER – II
LITERATURE REVIEW
Chapter Contents:
2.1 Pharmaceutical Marketing
2.2 Types of Pharmaceutical Activities
2.3 ROI in Pharmaceutical industry
2.4 Pharmaceutical Promotional Tools
2.5 Research Gap
38 | P a g e
2.1 Pharmaceutical Marketing
2.1.1 Role of Pharmaceutical Marketing
Medical marketing or pharmaceutical marketing is also called an advertisement or otherwise
promotion of the selling of pharmaceuticals or medicines. Pharmaceutical marketing has been
criticized for distorting the recommendation made by doctors. An alternative solution is to
enhance customer well-being in the effective marketing of pharmaceuticals by growing
opportunities to invest in R&D and directing research and development to make it more user-
friendly. It is especially important to encourage pharmaceuticals, as information is of great
importance, highly technical and can rapidly alter. The marketing of drugs is necessary (and
perhaps unique) to enable medical practitioners to take a greater interest in the needs of
customers (i.e. preparedness to pay). In this sense, customer advertisement is likely to improve
their wellbeing by improving their compliance with medications. Effective pharmaceutical
commercialization also enhances R&D returns while exploring market demand and
contributing to fundamental research on the role of medicines. This method can also be very
beneficial for consumers [52].
Marketing also plays an important role in influencing or directing operations from
manufacturer to patient. For this, a pharmaceutical marketer is required to know the varied
constituents of the external environment just like the economic environment, the regulatory
environment, the competitive environment, the social environment, the technological
environment and also the ecological environment. GNP rate of growth, personal income,
inflationary pressure, interest rates, industrial growth rates etc. are the indications, which
suggest where the economic environment is heading for. The general economic environment
does affect a pharmaceutical organization because the demand for medicinal products is
certainly associated with the economic conditions prevailing within the marketplace [53].
Pharmaceutical Marketing also plays important role in studying the supply and demand of
medicinal products. Few sorts of demands are often enlisted as [54]:
Negative
Absent
Hidden
Decreasing

39 | P a g e
Irregular
High-grade
Excessive
Irrational
Pharmaceutical marketing also includes market research for proper decision-making. Below
listed points mentioned the role of marketing research in pharmaceutical marketing.
Market research is used as an effective decision-matching tool.
It is used to measure market potentials, characteristics of market and market share.
To study the impact of socio-economic changes.
Helps to make a short-term and long-term forecast.
To determine prospects and acceptability of new products and to test existing products
for the products of rivals.
Facilitates designing antibiotics marketing operations and plays a beneficial role in a
segmentation strategy.
Facilitates developing pricing policy and in price discrimination policy.
Facilitates evolving effective distribution strategy.
Beneficial role in promotion strategy to help make better advertising decisions and
appropriate promotional strategy to adopt.
Helps to control adjustments in the market and source of supply to guard against intense
competition.
The customer is not the client, it’s another aspect of pharmaceutical marketing. To determine
prospects and acceptability of new products and to test existing products for the products of
rivals. As a result, Pharmaceutical companies recognize that the prescribing habits of doctors
is very important to control by the use of different forms of advertising methods. Therefore,
most pharmaceutical companies spend more than a third of their sales revenue on promotional
strategies, which is almost double what they spend on R&D to maintain and promote their
market share [55].
2.1.2 Expenditure on pharmaceutical marketing
As per the survey in the US over the last 20 years, 69% rise in medical marketing spends by
pharmaceutical companies. From 1997 to 2016, the total annual expenditure on disease
awareness campaigns, prescription drugs promotion, laboratory testing and health services

40 | P a g e
raised from USD 17.7 billion to USD 29.9 billion, out of which 68% of the total cost is for
prescription drug marketing. [56].
Fig. 2.1.1: Medical Marketing 1997 vs 2016 in the US
In India, direct-to-consumer advertisement is not allowed as per regulations set by the Indian
government, still spend on product promotion is not less than 20% of the total revenue of the
company [57]. The objective of such promotion is to change the prescribing habit of doctors
towards the promoted brand.
E. de Laat et.al. [57] studied pharmaceutical companies’ expenditure over various marketing
activities; pharmaceutical branded products are the most heavily promoted products as
companies are spending 20% or more of their revenues on various promotional practices. The
objective behind such expenses is to influence the prescription of healthcare professionals
towards the promoted brands.
Fig 2.1.2: Expenditure spread of large pharmaceutical company [57]
Most countries have in situ legislation to restrict pharmaceutical ads. There are different
41 | P a g e
portions under which expenditure of pharmaceutical marketing is often covered.
Healthcare providers
Consumers
Healthcare providers:
Marketing for healthcare professionals takes three primary forms: drug sales representative
operation, product screening service, and continuing medical education (CME) sponsorship.
Since 2008, PhRMA (Pharmaceutical Research and Makers of America) ethics guidelines have
recently banned the use of gifts like pens and bags with pharmaceutical product names [58].
Free samples are demonstrated to influence the actions of the medical practitioner. Free-
sampling doctors are more probable to advise branded drugs for equivalent generic medicines
[58]. The prescription cost is not reduced by getting pharmaceutical samples. Although samples
are received, prescription costs continue to excessively burden recipients of samples [59]. Free
samples immediately give the patient access to the medication, so treatment can begin directly.
This also saves time to go to a pharmacy before care begins. Since all medications are not
working for each other and others, Free trials will help patients figure out what dosage and type
of medication work best before they spent money on a full pharmaceutical prescription.
Physicians spend more time on industry-supported CMEs more than all schools of medicine
[58]. Furthermore, the structure, management and productivity assessment of the sales
department pose essential business problems due to the mass scale of the pharmaceutical
industry. In the realms of physician selection, distribution and organization, distribution
department efficiency, call preparation and sales forces effectiveness, management functions
are typically weakened. A few pharmaceutical companies recognize that the training of sales
officials alone is inadequate, especially if most goods are of similar quality. In addition to life
science and product expertise, sales managers will also contribute to the success of the sales
department. Physicians are more relay on sales managers for scientific material as they are
more experienced than medical representatives.
Consumers:
The purpose of direct ads is primarily to influence the interaction between the patient and the
healthcare professional [60]. Many patients will question or even question a drug that they need
to be seen on TV. Mass media advertising for pharmaceutical products has grown in the US in
recent years. The FDA revised the legislation over the seven years from $1.1 billion in 1997 to
42 | P a g e
a good many $ 4.2 billion in 2005, a 19.6% annual rise in line with the Government
Accountability Office [58]. Expenses for direct-to-consumer ads have quadrupled
dramatically.
Drug makers also supply customers with a pharmacy coupon in many countries to help cover
health insurers' copayments for prescription drugs. Such coupons are typically required to
support non-preferred drugs and generic alternatives to minimize or avoid the cost of bags
normally charged by insurers in a non-preferred medicinal drug to the consumers [61].
The advent of new media and technology has changed the pharmaceutical promotional scenario
rapidly in recent years. Doctors & consumers both are increasingly dependent on the web for
health and medical knowledge and are enabling pharmaceutical companies to appear on digital
platforms to large audiences. Sales representatives find it more difficult to urge doctors for
individual details in an equivalent time. Online marketing is being explored by pharmaceutical
companies as an alternative. Video content, online events, Customer services platforms such
as e-sampling and physical services, such as PV, MDLinx, Aptus Health and Epocrates, are the
emerging e-promotional activities. Due to more scratched audiences and the number of news,
entertainment and knowledge access points, users are also aware of the need to move to the
digital channels. DTC advertisement is less important than ever, with companies beginning to
focus more than ever on digitalizing, for example, product portals, internet ads, service
marketing, television promotions, place-base television and health information and mobile ads
to over 1.5 billion U.S. citizens.
2.1.3 Global Trend in Pharmaceutical Marketing
From a splash of AI to automated machine systems, including digital marketing and e-
prescription (telemedicine), pharmaceutical marketing has been evolved with an entirely new
look. The worldwide trends in pharmaceutical marketing which may not be overlooked are:
1. Smart multichannel mix
There is a significant tendency to use online services across multiple channels. Gradually,
the intelligent multi-channel approach often affects HCPs' relationships. Health alerts or
information about drugs could be easily obtained via the Internet at any time. It leads to
more specific digital solutions offered by pharmaceutical products, interactive information

43 | P a g e
and e-sampling. A high-performing doctor with no digital display on his / her tablet appears
unlikely to be ascertained.
2. Using big tech- Mobile generation
In recent years, pharmaceuticals have made a significant move to use mobile technologies.
Doctors have access to all clinical knowledge on their smartphones during the day. Just one
button is needed to request the latest sources or to check for any details. It offers doctors
the chance to focus on more complex tasks and to let smart technology solve their simple
tasks. Therefore far superior online pharmacy services are safer for consumers.
3. No way to miss AI and ML
Artificial intelligence is profoundly intertwined, machine learning and massive files.
Today, doctors are working with additional interactivities to find deep, specialized data sets
in real-time. With this in mind, how data is collected and interpreted has changed to the
goal of making it credible and up to date. ML and automated strategies will affect the future
of pharmaceutical marketing from cost reduction, remote monitoring and patient journey
to the integration and optimization of computer functions worldwide, with no need for
human senses.
Nevertheless, every technical process and the automated algorithm requires people. AI and
machine learning can not only be linked to and excluded from any challenges. The triangle
of information, processes and technology also calls for the strategic thought and learning
of humans. Multichannel targeted marketing and value-driven treatment will still matter.
4. Social media networks
Pharmaceutical goods can reach very large markets worldwide and deliver qualified content
precisely when and where it is needed. Please notice that patients can do personal medical
research on any site. Undoubtedly, people often rely on what they hear, whether
scientifically confirmed or not. Digital channels and social media are also better controlled.
In compliance with the existing FDA regulations and other limitations, pharmaceuticals are
not authorized to enter a conversation. As a consequence, a greater number of data are also
both unreliable and adverse. It is therefore important to look at how drug companies grow
their brand and comply with regulatory requirements. In addition, growing numbers of
businesses with ample analytics would have the ability to provide value (including deals
outside the pill) to any kind of public in particular. Simply, great customer service without

44 | P a g e
tightly controlled social media work is difficult, and if an organization wishes to stay
relevant, those networks cannot be ignored.
5. From Big data to Internet of Things (IoT) and edge computing
IoT can transform and revolutionize the marketing business of pharmaceuticals completely.
Data will now also be stored in an IoT system itself, not inside the cloud. Lightweight,
small devices would be able to process thousands of data themselves in real-time. The new
medical innovations have already shown a big difference in health and life sciences in the
longer term. Analysts and analysts continually explore how advanced computing can
transform the workings of the pharmaceutical and healthcare industries. The SaaS
(Software-as-Service) program offers a quick solution for pharmaceutical companies where
all apps can be accessed from any computer anywhere. Almost 50% of all drug producers
currently employ a kind of cloud-based technology, according to Insights Pharmaceutical
survey.
2.1.4 Pharmaceutical Marketing-An Indian Perspective
Today, the Indian pharmaceutical industry is in the midst of a 'self-destructing loop' [62] [63]
[64], due to intense rivalry and exceptional growth of local pharmaceutical manufacturers. The
"Ranking of Indian Pharmaceutical Firms" indicates how large national companies compete in
the Indian health care sector with their global corporations. The Government has taken several
big measures since the 1970s: i) allowing domestic companies, in contrast to their previous
repackaging of foreign terminology, to supply generic versions of patented molecules; ii)
offering major monetary encouragements and state grants to local medicines; and, iii). Of
course, this led most local drug firms to gain considerable momentum and soon grew to state
that they had a considerable market share [63] [65]. Due to the strong rivalry between
pharmaceutical firms, most pharmaceutical companies are now extending their product into
ways to market their products and thus to increase their indication, exaggerating the efficacy
of their products, ignoring the contraindications and undercut the negative effects that have
become routine [62] [66]. Besides a few studies [67] that focused critically on problems with
the invasion, in several anthropological studies, international pharmaceutical firms and their
non-ethical marketing strategies have been attempting to catch various "living processes of
medicines." Nevertheless, due to the complex nature of the pharmaceutical links [68] and the
near interconnection of formal and informal sector systems, many researchers were able to
understand the complexity in one dimension alone without understanding the opposite. In

45 | P a g e
addition, new issues and an ever-increasing awareness of prescription coverage, the use of
drugs, health costs and non-compliance diagnostics have helped some researchers focus on the
essence of globalization in today's capitalist enterprise [69] [70]. A couple of research studies
have also shown that drug marketing can even work at a deeper level by changing health
experience, politics, ethics, and economics. Therefore, in the majority of the cases, such
research has failed to explain how pharmaceutical products were, or perhaps their role in,
"pharmaceutical," and "improve" health an essence and embodiment of Indian communities.
Another competitive choice, primarily used by Indian pharmaceutical companies, is the
'marketing distinction.' New system of drug delivery, end-use, dose ease, consistency, etc. are
often sponsored for distinction. Some businesses use concentrated marketing as well as
differential marketing to boost the performance of both instruments. In particular, the
"Undifferentiated Marketing," in which the company targets for mass consumers such as
corporations and government hospitals. Generics are promoted by undifferentiated marketing
technology, but certain qualitative distinction or better value may be needed if generic
marketing is being successful.
To understand pharmaceutical promotion, it is important to understand from the sales and
marketing point of view the marketing process & personnel involved in the pharmaceutical
industry. The hierarchy of the sales promotional wing includes workers such as the Medical
Representative (MR), the Area Business Manager (ABM), and the Regional Business Manager
(RBM). Likewise, the production and distribution network outside the business includes
consumers such as inventors, stock owners, chemists, physicians and their final customers i.e.
patients [71]. The rights of intermediaries, including pharmaceutical stores, sub-stock
companies and stock producers are highly hierarchically based upon their rate expenditure. The
doctor and the patient are separate, not a wheel-wheel or an external, but an amazingly critical
cog. A physician may decide on a prescription drug for a patient based on the
indications/symptoms of a specific patient. A business transaction is created between the
patient and pharmacies; the information transaction is created between the MR and doctors.

46 | P a g e
Fig. 2.1.3: Staff participate at different pharmacy network levels
In the method, all intermediaries such as chemists, sub-stockers and inventors generate income
and revenue. Because chemists purchase this medicine from sub-stock companies who in turn
purchase medicine from stockholders receiving the same medicine from production companies.
All of them have their own set of goals, physicians, patients and other players involved in a
pharmaceutical industry network. Every individual in the business network must fulfill their
respective duties and obligations for a minimum level of performance. Physicians are
preferably familiar with the "patients' benefit" dimension and patients have remediation steps,
while stockholders are merely profiting. The pharmaceutical sales process and marketing
process is mainly based on the successful management of various direct sale networks driven
by the head office with their marketing strategies.
Controlling and operation of each region and area are often strategically controlled by head
sales and the ABMs and RBMs. The ABMs and RBMs have respectively retained the status of
their revenues and have agreed on the critical strategic needs of all territories and regions.
ABMs/ RBMs discuss the targets and financial objectives with their respective team members
i.e. MRs during their visits to the MR’s territory. The RBM, along with all of its ABM's,
received orders from various sub-stockiest and stockiest of the different areas during the first
four days of a month and then took the pre-determined goal of the previous month into account.
Throughout these meetings, RBM addressed whether there were any differences between its
goals, its successes, and the potential measures for its prevention throughout addition to the
allocation of next month's goal among ABMs and MRs. The main task of the promotional team
47 | P a g e
at the company's headquarters is to develop various promotional tools for the brand that the
medical representative can detail or discuss in front of the doctor, to persuade them to produce
a prescription for the brand rather than competitors.
2.2 Types of Pharmaceutical Activities
Pharmaceutical companies are taking on an increasingly active role in engaging with opinion
leaders to fulfill their reputation, identify business opportunities, facilitate product
identification and positioning, and build desire and brand loyalty for consumers.
Product Branding:
Product branding is crucial for any product to become successful. The foremost effective
marketing strategy is cohesion. With a unified branding strategy, the merchandise can more
easily carve out its niche within the marketplace. By maintaining a continuing product “look,”
the buyer more readily identifies with the merchandise, strengthening the brand image and
increasing the product’s marketability. Trademarks also help marketing teams, as they're able
to craft ads that are ready to hit the market before the drug is even launched.
Some key points which should be considered are as:
1. Unify promotional “look” for all stages of product promotion to make the strongest
brand image.
2. Employ cross-functional portfolio teams to oversee product decisions and resource
allocation for branding and marketing.
3. Conduct trademark development activities in early development stages to realize a
status before launch.
4. Use multiple communication channels for both internal and external publicity to create
brand equity rapidly.
To lessen the confusion between the generic or scientific name and therefore the new
trademark, companies mount prominent internal publicity campaigns through:
Newsletters
Meetings
Launch announcements
48 | P a g e
Internet site publicity
5. Intensify internal and external publicity to disseminate trademarked names and build
brand identity.
Traditional Pharmaceutical Marketing and Promotion Activities: Techniques and Tools
Various promotional tools have been studied to identify their influence on healthcare
practitioner’s prescribing habits; some of them are Medical representative detailing, Corporate
Social activity, Promotional pricing, Patient Education Program, Sampling, Corporate image,
Continues Medical Education, Personal attire of company representative, Product
demonstration, Digital marketing, Sponsorship, Literatures and reminders, Journal
Subscription, Medical representative’s Knowledge, Medical camp and Customer Relationship
Management [72]. Serhat Vancelik et al. [73] studied the medical representative number of
visits (frequency ) and its impact; moreover, he also studied the effect of GP’s participation in
training courses on their prescription behavior. Pharmaceutical companies offer promotional
and educational courses to physicians which influence their prescribing decisions. Vilte
Auruskeviciene et al [74] had looked at the role of electronic and mobile-based communication
channels in the perception of the general practitioners. Communication from opinion leaders,
articles published in local health journals, conferences organized by local scientific societies,
medical information received by email, phone calls from pharmaceutical representatives and
SMS from pharmaceutical representatives had been studied. International health journals and
international scientific conferences have become more popular and are considered a more
reliable form of communication and have had a greater impact on prescription. Joel Lexchin et
al [75] had studied physician-industry interaction in form of clinical trials and CMEs. The study
concluded physicians are affected by their interaction with the pharmaceutical industry. Roy
H. Perlis et al [76] had observed that payments to physicians were associated with greater
prescribing costs per patient and more number of branded medication prescribing. M. A. Al-
Areefi et al. [77] confirm that regular visits by medical representatives could impact the
prescribing habit of doctors in Yamen. Ishak Abubakar Y. Ibrahim et al. [78] had identified
factors impacting doctor’s brand selection decisions. Prevailing hospital policies and patient’s
financial situation are the most impactful factors, followed by frequent visits from sales
representatives and advertising. Susan Kamal et al. [79] observed that pharmaceutical
promotional tools like detailing, conference invitations, gifts and financial incentives
influenced physician’s prescribing behavior. Farooq M et al. [80] studied the impact of
scientific literature by medical representatives on Indian general practitioners. The study

49 | P a g e
concluded scientific literature by pharmaceutical companies is a very important source of
information for physicians and may influence prescribing behavior. Handa et al [81] surveyed
115 physicians of India to identify their perception towards pharmaceutical promotion in India.
The promotional tools covered under study are journal, clinical studies, conference/symposia
participation, medical representative, medical association, direct mail, company website,
sample catch cover & advertisement. The study confirms the positive relationship between the
reliability of promotional tools and the extent to which this affects prescribing behavior.
Shamimulhaq et al [82] cited that sponsorship to conferences, a new drug in the market, brand
prescription and drug samples are the causes that impact the prescription habit of clinicians.
Influence also depends on the salesperson’s promotional tactics while discussing brands. Girish
Taneja et al. [83] surveyed 600 Indian physicians to check the influence of scientific
promotional tools, sponsorships, common promotional tools and personal touch on prescription
behavior. Sponsorships had the highest influence on prescribing decisions; followed by
scientific promotional tools, personal touch & common promotional tools in sequence. Salmi
Mohd Isa et al [84] explain CSR and its influence on loyalty behavior. Joel Lexchin et al [75]
identify Physician-industry interactions in the forms of Clinical trials & CMEs & concluded
that the pharmaceutical company representative’s interactions with clinicians affected them in
terms of their prescribing behavior. Srivastava et al [85] explained the impact of brand equity
on physician prescribing behavior through the application of the theory of planned behavior.
McMullan M [86] studied the use of the Internet for patient health information search and its
influence on a patient-health professional relationship. The study concluded that proper disease
information is a patient’s right and that physicians also accept patient’s search for knowledge.
Physicians should discuss the information provided by patients which they have collected
through their various health sources and also guide them to a more reliable source of knowledge
like health website, patient education posters and literatures. Pharmaceutical companies can
perform a major role in providing patient education materials to spread awareness about disease
conditions.
Table 2.2.1: Pharmaceutical promotional tools
1. Medical representative detailing 9. Corporate Social activity
2. Promotional pricing 10. Patient Education Program
3. Sampling 11. Corporate image
4. Continues Medical Education 12. Personal attire of company
representative

50 | P a g e
5. Product demonstration 13. Digital marketing by pharmaceutical
companies
6. Sponsorship 14. Literatures and reminders of
pharmaceutical companies
7. Journal Subscription 15. Medical representative’s Knowledge
8. Medical camp 16. Customer Relationship Management of
Pharmaceutical companies
Pharmaceutical activities can be broadly bifurcated into two categories. First, patient-oriented
activities and second, practice-oriented activities. Patient-oriented activity is defined as an
activity that helps the patient to understand a disease condition or helps the patient for better
treatment like patient education videos, do’s and don’ts of disease etc. Such kind of activity
helps the doctor to oblige their patient pool; in return, it helps to get prescription support from
a doctor for the organizer company. Promotional pricing, sampling, medical camp & patient
education program can be categorized as patient-oriented activities. Practice-oriented activity
helps a doctor to sharpen their expertise for better patient care like CMEs, workshops,
conferences, journal subscription, scientific literatures etc.
2.3 ROI in the Pharmaceutical industry
Return on investment (ROI) is the prime requirement for every business promoter to run their
business. Every company allocatess sum of amount on marketing with an expectation of better
ROI and growth of the business. But to get the proper ROI, the business leaders need to
analyses the market situation, internal strength and capabilities, acceptance at the customer
level and many other internal as well as external factors.
First of all, the knowledge required to make decisions that are analytically educated. Such
information is also gathered from different internal and external sources (e.g. multiple
organizations and data collected on a company level) and is of varying quality. Therefore, all
parties involved find it difficult to believe that there is a "true source of truth." The second
factor relates to the need for a detailed analysis of the present data. With a "test and learn"
approach these insights include diligent stress testing to enhance analytics and draw on the
standard findings needed to support the business decision-making.
The third element is to build the company to use this research and decision-making efficiently

51 | P a g e
to optimize business returns. An ideal organization, with management leaders empowered to
decide these analytical results, has properly defined roles and responsibilities. A cultural
change that addresses high-frequency data and transitions from experiential choices to data-
driven choices leads to an improved general confidence in making multiple decisions over the
entire year.
ROI = Assets Turnover X Profit Margin
Assets Turnover = Operating Income X Total Assets
Profit Margin = EBIT X Operating Income
ROI = Rise in profits per extra money spent
A campaign which not able to attract expected ROI is considered a marketing failure; ROI
creates value for shareholders [87]. UCPMP regulation restricts pharmaceuticals to offer gifts
worth more than 1000 INR to any health care practitioner. Indian pharmaceuticals have found
many ways to offer sponsorship for travel, conference, money to the physicians, despite having
strict UCPMP regulations. The major objective behind such bribes is the get physician in their
fold and get the prescriptions from them for the promoted brand. Such a competitive market
makes an entry barrier for a new entrant or smaller firms with less financial power.
2.4 Pharmaceutical Promotional Tools
Pharmaceutical companies apply many promotional tools to attract doctor’s prescriptions.
Narendran et al. [88] and Dey et al. [89] revealed in their studies that pharmaceutical
promotional tools can impact the healthcare practitioner’s prescription habit. Promotional tools
like the quality of the drug & easy to remember the brand name, an image of the company,
launch meetings and rapport of medical representatives with doctors significantly influenced
prescription behavior of doctor while other tools like offering letter pads, brand reminder cards,
advertisement in journals and direct mailers were less effective among Indian doctors. Product
quality and good image/reputation of the company are still influencing factors for a prescription
generation. Marketing strategies by pharmaceutical companies surely influences the selection
of the brand by a physician. Following are 16 different tools has been identified which impacts
the prescription behavior of physicians.
1. Medical representative detailing
Detailing by the medical representative is personal selling, which comes under the category of

52 | P a g e
direct marketing. Medical representatives detail the brand, discuss the scientific points &
resolve the doctor’s query. With help of visual aid he/she tries to convince the doctor to start
prescribing his/her brand [90]. It is MRs who do calls of doctors (visit clinics) to highlight their
company's brands, through practices such as, gifting, drug detailing, providing drug samples,
sponsoring Continuing Medical Education & conferences [91]. Singh et.al. [92] had identified
a conceptual model to understand the dual relation between MRs and physician prescribing.
This addressed the three-dimensional model: network interconnection dimensions, resource
transfer probability (RT), successful integration and circular actor relationships as predictors
of action prescriptive medical professionals. RT is closely linked to the high prescribing
behavior, comparable to drug awareness acquired from information / MRs activities. This
found that when the interaction between MRs and doctors is solid, the correlation between
product knowledge and prescribing behavior is robust. Likewise, it also emerged that the high
level of promotion activities, such as the continuing education of physicians provided by MRs
and the launch of recent medications, is also connected to a high rate of medical prescription.
Sufrin et al. [93] investigated the fact that for every 7.9 doctors, the United States has one
medical representative. He thus studied the persistence of pharmaceutical employees as a result
of which physicians are put a huge burden. As the number of representatives grew, the time
spent on medical practitioners dropped and thus resulted in strategic crises. Medical
representatives are the first touch point for medical companies in front of doctors. MRs are
business strategy communicators to physicians and it is therefore important to provide the right
and persuasive message to the medical representative which can be better communicated in
front of doctors. It is estimated that almost 75% of the marketing budget is spent on the medical
representative by pharmaceutical companies [94]. In compliance with M.M. Punchibandara
Tharaka et. al [95] studied factors such as regular medical representative in-clinical meetings,
debate through research materials and CME are more important than information and sampling
but most prescriber groups require effective communication skills and sufficient
documentation from health workers to persuade them to prescribe a supported brand [96]. In
this digitization age, with electronic details; in contrast to conventional information with
written visual aids, MRs will speak more effectively about their products in the medical room
[97]. A professional representative may encourage a doctor to prescribe marketed products by
providing information about the brand with scientific support.
2. Promotional Pricing
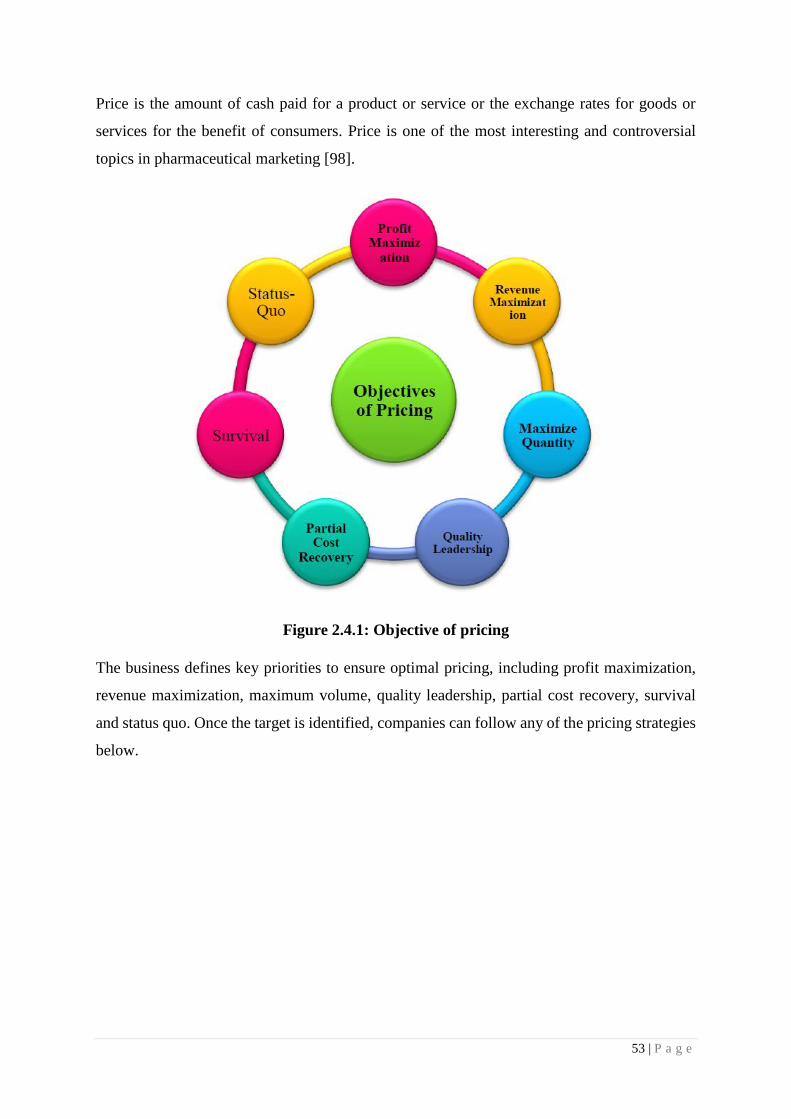
53 | P a g e
Price is the amount of cash paid for a product or service or the exchange rates for goods or
services for the benefit of consumers. Price is one of the most interesting and controversial
topics in pharmaceutical marketing [98].
Figure 2.4.1: Objective of pricing
The business defines key priorities to ensure optimal pricing, including profit maximization,
revenue maximization, maximum volume, quality leadership, partial cost recovery, survival
and status quo. Once the target is identified, companies can follow any of the pricing strategies
below.
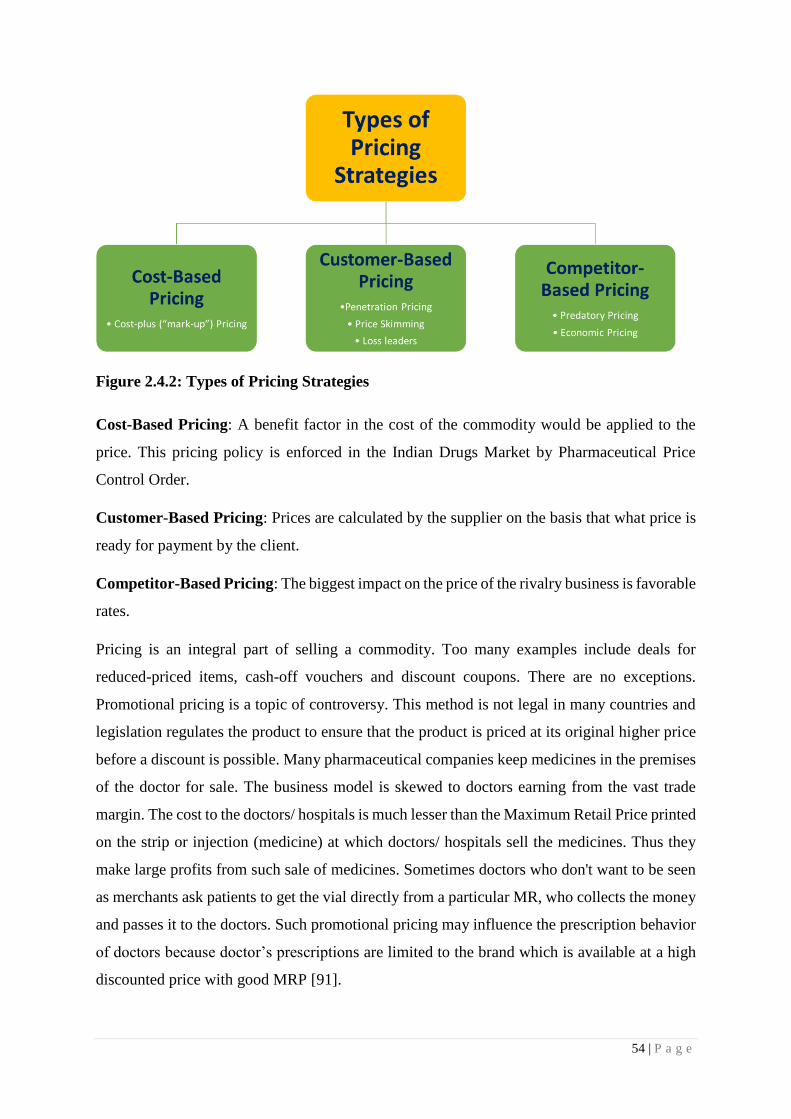
54 | P a g e
Figure 2.4.2: Types of Pricing Strategies
Cost-Based Pricing: A benefit factor in the cost of the commodity would be applied to the
price. This pricing policy is enforced in the Indian Drugs Market by Pharmaceutical Price
Control Order.
Customer-Based Pricing: Prices are calculated by the supplier on the basis that what price is
ready for payment by the client.
Competitor-Based Pricing: The biggest impact on the price of the rivalry business is favorable
rates.
Pricing is an integral part of selling a commodity. Too many examples include deals for
reduced-priced items, cash-off vouchers and discount coupons. There are no exceptions.
Promotional pricing is a topic of controversy. This method is not legal in many countries and
legislation regulates the product to ensure that the product is priced at its original higher price
before a discount is possible. Many pharmaceutical companies keep medicines in the premises
of the doctor for sale. The business model is skewed to doctors earning from the vast trade
margin. The cost to the doctors/ hospitals is much lesser than the Maximum Retail Price printed
on the strip or injection (medicine) at which doctors/ hospitals sell the medicines. Thus they
make large profits from such sale of medicines. Sometimes doctors who don't want to be seen
as merchants ask patients to get the vial directly from a particular MR, who collects the money
and passes it to the doctors. Such promotional pricing may influence the prescription behavior
of doctors because doctor’s prescriptions are limited to the brand which is available at a high
discounted price with good MRP [91].
55 | P a g e
Two different pricing strategies appear in prescription drug markets where no regulation is
made regarding the company's pricing practice: the Flat Pricing Strategy, where all tablet
strengths are at the same price, whereas the monotonic pricing strategy defined as 'prices are
more or less proportional to the strength of the tablet. [99]. Lexchin et al. [100] state that in the
case of monotonous pricing the expenses are higher, while flat pricing contributes to lower
expenditure and offers more predictability in spending for public drug programs. But
companies who make scored tablets can feel that they 'need to use single pricing since the cost
savings from splitting tablets are not recognized by physicians. The product innovation has a
positive impact on the price level for an early market entrant. Later entries, on the other hand,
frequently lead to a lower price. Despite what Cooper and Kleinschmidt [101] show, a
'economic costing strategy is usually not successful.' This is supported by Lexchin et al. [100],
who says that 'doctors do not usually know the prices of medicinal products both relative and
absolute. In addition, the fact that 'drug pricing sensitivity is typically second regarding product
effectiveness problems and to patient conditions, finds evidence in Gonu ̈l, Carter, Petrova, and
Srinivasan [102]. Nevertheless, Narayanan et al. [103] and Rizzo [104] have shown that
product promotions inhibit pharmaceutical price competition, reduce price elasticity and result
in higher price balances [105].
3. Sampling
Alowiet al [55] has found that comparisons of medications, impact the prescription decisions
of doctors in the United States. Aanandet al. [106] found that medicinal samples have been
positive and strongly influenced by the prescribing decisions of 77 percent of their doctors and
promotions. The study's drawback is that it contains no clear details about how the drug
samples are to be assessed and how their prescription effect is quantified.
De Ferrari et al [107] analyzed the approach of doctors to the pharmaceutical industry and
found that 91.2% of participants received medicine samples. This was found to be ethically
appropriate and to be helpful to patients. Nevertheless, the doctors agreed that the drug samples
did not affect their prescribing behavior. The representatives used different methods for
supporting their results, and it was especially helpful that drug samples, like old ones, were
used regularly. The duration of visits and the delivery of drug samples depended somewhat on
the age of the patient. The conclusion is that medical representatives are viewed by GPs as an
effective method to collect drug knowledge. As for distributing product samples, the one aim
of new novel drugs may be to give the doctor a chance to understand the medication, but other

56 | P a g e
reasons for distributing samples might have been already identified and recommended by the
GPs several times. Jesper et al [108] cited the statistically significant effect of drug samples on
the prescription generation but it depends on drug age; however, the drop is small.
The medical use of samples is in divergence. Physicians can benefit by providing immediate
treatment, determining the initial effect or adverse effects, and adjusting prescription doses
before the patient completes full prescription treatment, bearing the cost of patients with
medications for abstinence, and allowing patients appropriate medications use. In the case of
drug trials, on the other hand, dangerous medications can be promoted, evidence-based advice
not being followed, or medications not available in hospitals or controlled health systems can
be recommended. In addition, drug therapy and non-drug interaction recognition cannot help
patients if doctors review drugs. The prospect of a re-sale of drug products and the ethical
ramifications of products for personal use were also discussed by the healthcare professionals.
There have been concerns as well. Many organizations have established guidelines to
encourage the safe use of product samples. A variety of drug sampling policies were established
by health care providers; some prohibit sampling while others do not restrict drug quality or
consumption.
Two experiments indicate that the prescribing of sample medications after the diagnosis would
be increased by the availability of drugs. Morelli and Koenigsberg [109] observed a clear
association between medication sample dispensation and subsequent medication prescription,
which suggests that tests affect physician prescription habits. In a study by Shaughnessy and
Bucci, 55% of participants agreed that the prescription of drugs was affected by sampling
[110]. This work offers an insightful overview of the potential effects of the provision of
prescription samples; however, it doesn't address when and why doctors take medication
samples nor, in some situations, doctors prescribe a medicinal drug originally dispensed as a
sample. Pharmaceuticals companies were used during the procedure to provide prompt
treatment for medication samples, allowing physicians to begin care immediately to relieve
patient symptoms and to prevent potential complications. Sampling is also a good medical
diagnosis technique [111].
4. Continuing Medical Education (CME)
Continuing medical education (CME) is a platform for the medical fraternity to sharpen their
competence by getting knowledge about recent, upcoming and emerging areas of their arena.
Content of CME is designed, reviewed and delivered by expert faculties of respective clinical

57 | P a g e
areas. It may be either as a part of a live event or online through webcast, audio, video or other
electronic media. It also can be in the form of written publications. A survey done on 150
doctors in Srilanka; confirms that continues medical education is highly impactful and
positively correlated to influence healthcare practitioner’s prescription habits towards the
promoted drug [95]. Ahmed et al. have established an optimistic association between CMEs
and the prescription habits of doctors [112]. Continuing medical education that augments
participant’s knowledge and offers the opportunity to practice skills can change participant’s
prescription behavior and, on occasion, health care outcomes [113]. Many times, it has been
observed that traditional CMEs and passive distribution of knowledge are not effective. CMEs
that include interactive seasons such as small group conversation or case discussion are
effective in changing healthcare practitioner’s prescribing habits and refining the quality of
care [114]. Pharmaceuticals has also come up with a new concept in CME called webcast;
whereby international or national key opinion leaders (KOL) address the audience through
digital media. The physical presence at the CME venue is not required in webcast and
participants can learn the skills from KOL at his/her place. In webcast concentration of the
listener on speaker remains suboptimal and thereby the learning as well, compared with
physical CME. Continuing medical education provides a platform for the doctors to learn about
the new molecule, new usage of a drug, or new indication from expect of the fraternity.
Pharmaceutical companies can take mindshare of doctors by arranging CMEs for a particular
brand that turns into a prescription.
Rodwin et al. [115] in their article discussed the historical view of the CMEs and their changing
nature. This study revealed parallel issues between advertising and industry-funded CME. The
study concluded that to hinder industry influence and improve the CME experience, there
should be an independent body for funding the medical industry and physicians for education.
The CME syllabus should be developed by independent public and professional authorities and
all institutions should consider allocating funds to educational institutions for this approved
course. Saxena et al. [116] informed with the assistance of the medical marketing team,
marketers should seek out the sources of data preferred by the clinicians. The study was
conducted at CME settings by interviewing the physicians. CME, Medical journals and
therefore the peer interaction were found to be the primary three valuable sources by the
physicians putting the sales representatives on subsequent level of the ladder. Black et al. [117]
in their conceptual paper on the tutorial role of continuous medical education asserts that
pharmaceutical companies should make sure the drug promotion is embedded within wider

58 | P a g e
disease management. The author has discussed the role of CME on further three categories of
education: 1. Predisposing 2. Enabling & 3. Reinforcing, which affects the beliefs, attitudes &
behavioral intentions of physicians. He concluded that the credibility factor differentiates the
tutorial detailing & this detailing ultimately decides the integrity of CME. The utility of CME
remains to be assessed in high-risk therapeutic categories.
Dumovic P et al. [118] explored the medical advancement communication methods and their
impact on the prescription habit of the healthcare practitioner. Various methods of imparting
the medical updation like peer-reviewed literature, practice guidelines, interactions with the
opinion leaders, informal exchange with colleagues and postgraduate educational activities
were evaluated supported their simple access and their availability at the doctor's disposal.
Their research projected that referee literature and clinical guidelines were less handy and
suffered the delay as compared to the tutorial activities. The authors also acknowledged the
impact of the pharmaceutical industry's participation within the program on prescription
behavior. One among the result of the study is to encourage the tutorial program to be
conducted by the acridities educational institute.
5. Product Demonstration
Proper usage of the pharmaceutical product is very necessary to ensure the desired action.
Advanced research in medical science enables a novel drug delivery system that requires
technical expertise for drug delivery like insulin pens for diabetics, novel inhalers for asthma
patients and many more. Proper usage demonstration to the patient is required by doctor or
nursing staff or pharmaceutical medical representative to ensure the right usage of product for
the desired action. Sayed Hesam Aldin Sharifnia et al [119] had shown that effective
pharmaceutical product usage demonstration promotes the prescribing of that product as a
refill. Unless available reports of some adverse side effects from the patients, the physicians
usually do not tend to change the prescribed drugs and continue on the same brand. Proper
product usage assistance may be a deciding factor for the physician to choose the brand for
such medications.
6. Sponsorship
Pharmaceutical companies sponsored doctors in many ways, sponsorship for a stay in
conferences, sponsorship for travel expenses in symposiums, high-value gifts or health
equipment as gift or sponsorship for personal tours. The objective behind such sponsorship is
to develop a good rapport with doctor & provide a customized service to the doctor in turn to

59 | P a g e
get maximum return on investment. Girish Taneja et al [120] cited that sponsorship of travel
expenses by a pharmaceutical company can change the prescribing habits of a healthcare
practitioner. The impact of sponsorship on physician’s prescribing behavior may vary from one
researcher to another. Saad Shamim-ul-Haq et al [121] concluded that the sponsorship has an
inconsequential impact on healthcare practitioner’s prescription habits; it all depends on how
medical repetitive promote their brand in front of the doctor. Personal relation and value of
medical representative in mind of doctor are more important rather than company’s image or
its investments. Many doctors considered high-value gifts & sponsorships as unethical
practices by a pharmaceutical company and did not accept to encourage ethical promotional of
brands. They also believe that such pharmaceutical activities are not good for the well-being
of patients and society [95]. Muhammad Alshurideh et al [122] confirmed that sponsorships
and medical representative detailing during visits were the lowest influential pharmaceutical
promotional tools.
Taneja et al. [123] reviewed the factors that impact physician's views with various promotional
tactics in five groups: sponsorships, personal sales, promotional tools for the school, research
promotional tools and a private touch. This result is related to research by Arora and Taneja in
2006 in the Haryana state. Doctors' perception of sponsorship factors was found to be
independent of age, gender, legal status, education, area and practice. This study also stated
that government doctors typically receive sponsorships from the government for attending
conferences and are subject to government laws. Pharmaceutical firms typically fund doctors
with more patients than physicians with fewer patients, i.e. a lower income, with higher
incomes. Therefore, doctors who are wealthier than doctors with lower salaries are more likely
to get sponsorship calls from pharmaceutical companies.
In another research by Al-areefi MA et al. [124] Sponsorship promotional tools include travel
sponsorship, conference sponsorship and high-value personal and business gifts. Perlis et al.
[76] confirm that sponsorship influence the prescribing behavior of doctor also because it affect
the doctor’s behavior toward the representative and company. Some countries have strict rules
and regulations to regulate unethical practices for the advantage of the patient. Payment for a
clinical test is another quiet sponsorship promotion tool. Companies pay a grant to the doctor
to conduct a clinical test, but without proper control, this type of grant influences the doctor’s
prescription pattern.
7. Journal Subscription
Scientific journals with good impact factors, always remains the prime source of information

60 | P a g e
like new research and trends in the health care sector for doctors. To facilitate this hunger of
knowledge, many pharmaceutical companies provide full-text articles or full journal
subscriptions to greet doctors. Bauer R and et.al [125] in their paper on the Physician and his
source of data about drugs studied various sources of data employed by doctors for acquiring
the new drug/product information and its impact on the adoption of a replacement
brand/product. The target was to review the predominance of the economic or scientific source
of data in physician's awareness and decision. This paper considers mainly journal papers and
articles, a medical journal advertisement, direct mails, doctor’s conversation samples and staff
meetings as the major source of data. The study causes a conclusion that doctors with little
variation have used both commercial and non-commercial sources for acquiring information
but commercial sources convinced them to prescribe a specific brand. The importance of
commercial or scientific sources changes consistent with the severity of treatment. The
national-level survey in which a cross-sectional sample of over 1000 physicians to know the
predominantly used source of data and their relative importance for themselves and for 'most
of the doctors was considered. Detailing Men (MR), Medical journals (papers and articles)
were considered to be the useful sources that are frequently employed by physicians.
Caplow et al. [126] in their research conducted a survey of 182 physicians for understanding
various sources used for the adoption of almost 302 brands from multiple specialty reports that
commercial source acted as the first source of information and the same source convinced them
to prescribe the respective brands. The study does not consider characteristics of the drug under
consideration, the disease for which it is prescribed and its impact on physician's information
need. Providing the latest information to a physician through various means like full-text article
to support brand or journal subscription helps to drag the prescription from a physician for
promoted brand [116].
8. Medical Camp
As a part of patient care initiatives, many pharmaceutical companies organized free health
checkup camps or medical camps; where they offer free diagnostic tests and trial therapy to the
patients. It’s a win-win situation for the doctor as well as pharmaceutical companies. Doctor
gets more numbers of patients and good recognition in area nearby clinic, as well as
pharmaceutical companies, get plenty of prescriptions during the camp. It’s a mutual
understanding between medical representatives and doctors that MR arranges camp at the
doctor’s clinic and in turn doctor gives a prescription of the promoted brand. Shamimulhaq et

61 | P a g e
al. studied, medical camps positively impact changing the prescription habits of medical
practitioners [121]. His research also told the factors which influenced the doctors' prescribing
behavior, the questionnaire discusses the price of the goods, the accessibility of the goods, the
contact made by MR, the quality of the products that were being marketed, the brand name,
new research molecule, and the new drug-free study combination samples. The result indicates
that 4Ps related marketing tactics impact the prescribing actions of physicians during this
research.
The variables to be used are brand prescription, advertising resources, conference support, new
drugs and product samples. Those are the independent variable, which was taken as a predictor
and the recommended conduct of a physician was 263. The findings of multivariate analyzes
to assess the influence of the tests used to indicate that new medications, techniques and clinical
samples substantially affect medical prescribing behavior and that there are no major effects
left by residual causes.
9. Corporate Social Responsibility
The conviction that corporations have responsibility for fundamental groups in society other
than certain creditors and beyond the provisions of legislation or the union agreement [127] is
corporate social responsibility. Corporate social responsibility (CSR) helps companies to
develop a positive social profile. The CSR is a separate arm of big pharmaceuticals that offer
various social programs like healthcare, old age care, blood banks, health services, etc.
Throughout the year 2000, the United Nations (UN) and its 189 member states pledged
themselves and subsequently became the eight Millennium Development Goals (MDGs). The
priorities were directed at the well-being of society and the United Nations needs businesses to
play a major role. Many of these programs relate to health and thus need the sponsorship of
pharmaceutical businesses [128].
Goals
Better maternal health
Deal with HIV / AIDS, malaria and other diseases
Support gender equality and empower women
Provides environmental sustainability
Achieve universal basic education
Remove extreme poverty and hunger
Developing global partnerships with organizations for growth
Reduce child mortality

62 | P a g e
Table 2.4.1: Eight Millennium Development Goals (MDGs) of UN
Salmi Mohd Isa et. al. [84] researched to define views of physicians about CSR and the
reliability of pharmaceutical corporations. He concluded that social behavior, playing a major
role in his choice of medicines by doctors and pharmaceutical firms. In his analysis, Urquhart
et al. [129] noticed that the relationship between CSR and value for a company was very much
visible. Although patient preference is related to CSR programs, the purpose of medical
physicians to prescribe drugs has not been investigated. Therefore an empirical study was
performed to investigate the effect on doctors prescribing decisions of the CSR activities of
pharmaceutical companies. It has been found that 32.3% of doctors chose to use the medication
of an organization actively engaged in CSR activities using individual data from a web survey
of 300 doctors in Japan. The findings of a two-tailed t-test showed the preferences for medical
professionals in a complex care hospital who frequently attended conferences are substantially
higher. CSR activities improved the company's prestige and made it more possible for
physicians to choose its products.
10. Patient Education Program
Much pharmaceutical promotional activity is patient-centric, patient education program about
disease condition is one of them. Pharmaceutical companies trying to create awareness among
patients about disease conditions to increase the flow of a patient in the promoted therapy area.
In continuation of the same, they prepare disease awareness posters, distribute pamphlets that
highlight the symptoms, or create videos in different languages to show the progress of disease
and its impact on quality of life. They do such activity with help of health care practitioners
and in their clinic to attract the attention of patients. It’s a win-win situation for both doctors
as well as pharmaceutical companies. With patient education programs, the doctor can show
their care and positive attitude towards patients; while pharmaceuticals can attract more
patients by generating awareness about disease conditions.
Kamarudin et al [130] have carried out work that met the inclusion criteria and included a total
of 47 studies in the systematic assessment. The studies have been categorized according to their
assessment process, with 20 studies assessing competency and 27 assessing the efficiency of
prescriptions. A good kind of educational activity with different outcome indicators and
assessment methods was employed. Six studies have in particular demonstrated improved
medication competence in a wide range of settings using a WHO Good Drug Guide. Continued

63 | P a g e
medical education and direct reviews from scientific research have also produced positive
outcomes. Only four studies have examined non-medical educational approaches, which
indicates that additional work is needed in this area.
In many countries like USA, UK, Japan, Australia and other European counties where direct
to consumer advertisement (DTCA) is permitted; which serve the purpose of pharmaceuticals
to spread awareness about disease condition. DTCA allows, (i) Patient Education - Informed
patients are more involved in their health care (ii) Dealing with under-treatment is one of the
most serious health problems today. (iii) Improving the economic value of health care -
Treatment drug treatment is more effective than other and subsequent medical interventions
(iv) Treatment improving drug compliance - a major health problem for patients who do not
take prescribed medications. (v) Good Physician / Patient Relations - Information / Involved
Patients Good Patients. Consumers surveyed in Prevention Magazine in 1999 said that DTCA
helped them discuss their health better with their doctor. Thus good patient education programs
by pharmaceuticals always create a positive impression in the mind of doctors which leads to
their prescription support [131].
11. Corporate image
The credibility of the organization can, given its performance with main competitors, be
described as the collective understanding of the past activities of the organization, and its
expectations regarding its future actions [132]. Many scholars claim that the reputation of a
business influences the efficiency of an organization, while others argued the opposite:
corporate credibility is influenced by organizational efficiency. Scholars and managers
consider good credibility as the intangible resource that is the most important in an
organization, for the following reasons:
Benefits of a good corporate reputation [133]
The major advantage of a good corporate reputation are:
Consumer desires to do business with you while other goods and services are available
at the same prices and quality;
The right to charge higher rates at products and services;
Stakeholders help your company in times of crisis;
The financial interest of your company.

64 | P a g e
While reputation is an intangible term, research unanimously shows that a good name shows a
significant increase in corporate credibility and the benefit of consistent competition. A
company can achieve its goals more easily if it has a good reputation among its shareholders,
especially its core customers, leaders with business views, suppliers and current and future
shareholders.
The prescription help from the doctor is attracted by corporate prestige in the pharmaceutical
field. The effect that affects the prescription behavior as outlined by Lim et al. [134]: (a) the
importance of brand value in branded items, (b) the importance of brand equity in companies
and (c) the importance of opinion leaders as brand communicators. Corporate brand values
have been improved through their marketing campaigns by companies such as Novartis,
AstraZeneca, Sanofi etc. In an online survey of more than 1,500 practitioners from across the
USA, the United Kingdom, France, Germany, Italy and Spain, TNS Healthcare found that
Europeans ranked Novartis No. 1 in the ranking of service provision and that Merck earned the
leading rank in the United States. The corporate integrity of the company is to the point that
physicians trust and respect it. The credibility of the medical practitioner is likely to affect PSR
beliefs. Since doctors believe that the prestige of the business is well-deserved, they still prefer
to recommend their medications based on the background of effective medicines [135].
12. Personal attire/ personality traits of company representative
The characteristics of personality represent the distinctive patterns of thought, feeling and
behaviors of individuals. Service employees and particularly the leading employees engage
with customers to build a strong brand. The explanation is that consumer expectations of
quality of service, corporate identity, and customer loyalty can influence the attitude, ability,
and actions of frontline employees [136]. Empirical proof shows that dress can directly
influence intent. C.Y. Shao et al. [137] analyzed the relationship of clothing to personal
decisions made in connection with dresses and decisions of the whole company that hires the
person (service companies for example). Therefore, consumers are not only likely to judge
their service workers by their clothing, but even all communications are likely to be proof for
the nature of the service business itself. This indicates that service managers should not take
the problem with lightness about what their workers wear. We find that properly dressed
service contact workers contribute to higher customer satisfaction and a higher desire to buy
service from the company than unsuitable customer service contact personnel.
65 | P a g e
Though pharmaceuticals are essential goods when it comes to the brand selection in
prescription, it depends on many factors and medical representative personal attire and
personality traits are one of them. N. Kasliwal et al. [31] revealed that the activities of the medical
representative, his association with the doctors and his personality traits, leaflets & brochures
and free drug samples given by the medical representative were found to be very effective. The
medical representative can create a positive impact with good personality traits and attire which
leads to prescription support from the physician.
13. Medical representative’s knowledge
Pharmaceutical marketing is not only a tactic to draw the attention of customers but it also
needs to be backed with scientific evidence. Medical representatives are the crucial arm of
pharmaceutical marketing; as he/she should be equipped with medical knowledge to have a
fruitful discussion with doctors. But in recent days, doctors complained about the ‘quality of
medical representatives visiting their clinics; according to doctors, majorities of MRs are just
salespersons & only a few maintain their subject knowledge deeply & share the latest updates
in the therapy area [97]. In 1988, the World Health Assembly adopted the World Health
Organization (WHO) ethical standards for the promotion of health drugs, which recommended
that the sales drug sales representative should have an appropriate educational background and
provide information about drugs in important therapies, and must be trained with technology
and reliability, in an accurate, inappropriate and responsible manner. [138]. Rizwan Raheem
Ahmed [139] studied medical representatives detailing knowledge and its impact on
prescribing behavior of doctors; the study confirmed the significance of medical representative
knowledge on prescribing behavior. Pharmaceutical companies should select the appropriately
qualified candidate as a medical representative as well as they should develop a proper training
course for the fortified candidate with proper scientific knowledge before joining the field.
Kasliwal et al. [31] in their study found that The doctors with the age bracket of 41-45 years
age were seen to possess less influenced by the medical representatives (MRs) personality and
MR’s product knowledge and distribution of leaflets and brochures by the businesses. The
promotional efforts done by the businesses didn't influence the prescribing behavior of 41-45
years an aged segment of doctors. MR’s product knowledge, free drug samples, relying upon
the source of latest drug information from colleagues have substantiated positive effect on the
youngest category of doctors with age bracket of 25-35 years, while the foremost senior doctors
within the age group of 61 and above years showed a positive behavior towards the materials
66 | P a g e
distributed by the pharmaceutical companies within the sort of leaflets and brochures.
14. Customer Relationship Management
Customer Relationship Management (CRM) is where the company interacts with its customer,
increasing customer lifetime value to the company and increasing customer satisfaction. [140].
This is a new marketing model that allows companies to understand how doctors view MR and
what components affect those perceptions. If certain characteristics of a medical representative
in a physician’s room can positively change these perceptions; companies need to develop
features in their MRs to make them more effective in the clinic. [141]. Effective application of
segmentation and targeting strategies could strengthen the pharmaceutical corporations, to
identify the proper needs of the customer which help in the right investments results in
maximum return on investment (ROI) and also increase efficiency in terms of prescription
generation [140].
To et al. [142] confirmed that the emergence of self-help online websites and portals has forced
pharmaceutical companies to re-evaluate their current sales strategies and develop strategies
such as CRM applications and other IT-based implementation to enhance their relationships
with customers. CRM plays a key role in shaping the pharmaceutical business in India by
gaining the right time market intelligence to create a strategy of building strong relationships
with customers (doctors).
15. Digital marketing
Kumar et al [143] concluded from his research that digital marketing like other markets has
made a good impact on the pharmaceutical industry too. Research done on fifty Super-
specialists doctors who had DM/ DNB degrees, with an in-depth interview format was used. A
complete of fifty websites of varied super specialists’ doctors were inspected and researched
within the study. A survey conducted also included the top 15 pharmaceutical companies, 12
leading chains of hospitals, and 16 stand-alone hospitals. Among the specialist doctors included
within the study, only a few had their websites. Whereas, the hospitals had full-fledged
websites. Though the first objective of those websites was to book appointments, only a couple
had blogs and of interactive nature. On the contrary, the pharmaceutical companies had well-
managed websites, with up-to-the-mark content. Supported results of the study mention that,
despite the very fact that digital marketing is getting used within the pharmaceutical companies,
but it's a lower acceptance rate and its potential is yet to be utilized completely. In India, the

67 | P a g e
utilization of digital marketing in pharmaceuticals and allied fields especially the specialist
doctors and application products, it's underutilized. During these tech-savvy times, Digital
marketing is often of great importance in the creation of a brand value and raising equity. The
authors highly recommend digital marketing as an efficient tool to realize a maximum outreach
and gain better outcomes for both the pharmaceutical industry and therefore the super
specialist’s doctors in coordination with minimal efforts and maximum outputs.
Digital marketing replaces conventional marketing approaches in the pharmaceutical industry.
The main reason for this is quick communication with end-users, less time-consuming effort
and high financial efficiency. Jawaid et al. [144] found that WhatsApp (29.94%), Practical
Health Websites (20.6%) and smartphone apps are the most accessible digital marketing
platforms. E-detailing (8.1%), webinars / webcasts (7.7%), tele-detailing (6.0%), site self-
direction (5.2%) and marketing e-mail (4.2%) are the less frequently accessible resources.
Webinars/webcasts were most successful in changing clinical practice (48%) despite limited
use, followed by web pages (42%), smartphone applications (41%), WhatsApp (37%), and
broad-based information (36%).
Table 2.4.2: Available Digital Channels & their impact on Clinical Practices [144]
Digital devices affect the clinical practice of physicians and the relationship between doctor
and patient. In the past, traditional libraries, paper textbooks, scientific journals and CME
sessions were important outlets for improving medical information for a physician. Recently,
however, the search for medical information for physicians who have more time for such work
has improved digital access resources and improved accessibility.
16. Literatures and reminders of pharmaceutical companies
Digital Channel Impact in clinical
practice (%)
E-detailing 36%
Webinars / Webcast 48%
Website 42%
Web Detailing 37%
WhatsApp / SMS 37%
Mobile Apps 41%
Tele Detailing 34%
Marketing Emails 8%
68 | P a g e
Ravindra Goyalet al. [145] found that the compliment from the pharmaceutical companies
prompts the physician to the promoted drug's brand & contributes to supporting in terms of
prescription. Nevertheless, these donations cost money which, without their knowledge, is
eventually passed to the patients. When the prescribing habits are compromised, the patient
relationship can also be challenged.
The brief reward is used to promote prescriptions in the promotion of sales. In-clinic branding
can be done with help of letter pads, pens, pen stands, paperweights etc. Sales promotion also
includes high-value gifts. Good interactions with the physician, initial meetings, business
credibility, quality drug quality and brand name significantly affected prescription behavior,
while direct mail, journal advertising and prescription pads and other brand recalls were
successful, but with a limited framework within. [88]. Personal selling factors such as daily
visits of medical representatives/executives, relationships between doctors and medical
representatives, detailed medical stories and medical information received by doctors during
their visits, product literature/reviews and free-samples coupons, can therefore be inferred that
the personalization of specific compliments, most affects physician’s prescribing behavior.
Literature surveys indicate that drug literature and brand records affect the prescribing actions
of the doctor but at different rates, which rely largely on the relationship and personalities of
the doctor's medical representatives [146].

69 | P a g e
2.5 RESEARCH GAP
Pharmaceutical promotion and its impact on prescription have been the area of interest for
many researchers and policymakers. The existing studies highlighted the role of different
promotional tactics like Customer Relationship Management, Sponsorship, MR’s Knowledge,
Continuous Medical Education, Detailing by Medical Representative, Sampling, Corporate
Image, Personal Attire of MR, Promotional Pricing, Patient Education, Corporate Social
Responsibility, Digital marketing & Literature and Reminders on healthcare practitioner’s
prescription habit/behavior. The majority of studies are on promotional tools like Sponsorship,
Medical Representative’s Knowledge & Continuous Medical Education, very few of them are
on Patient Education, Digital marketing, Personal Attire of MR & Promotional Pricing. Very
few studies highlighted the role of pharmaceutical promotional tactics on healthcare
practitioner’s prescription habits/behavior in the domestic market.
Indian pharmaceutical market is different in terms of government regulations, price cap, and
availability of branded generics rather than innovative / research products. Unlike the European
and American markets, advertisements for pharmaceutical products are banned in India, so the
conclusion and remarks made by European and American studies are quite irrelevant to the
Indian pharmaceutical market. Due to the UCPMP guidelines and drug price control by DPCO,
the way Indian pharmaceutical companies promoted their brand in front of doctors is very much
different compared to other countries. Branded generic product is another aspect that makes
the Indian pharmaceutical market different from other countries. In such a competitive
environment, pharmaceutical companies are trying innovative promotional tactics to sustain
their business. But very few researchers had tried to recognize the influence of such tactics on
healthcare practitioner’s prescription habit/behavior. This is the reason that despite several
types of research, the area of Indian pharmaceutical promotional tools and their impact has
maintained its importance from the research point of view.
This study would deal with doctors of different specialties (General Practitioner, Consulting
Physician, Dentist, Paediatrician, and Gynaecologist) practicing in metro cities of Gujarat.
Gujarat is the hub for pharmaceutical companies in India, having the corporate head office of
top pharmaceutical companies like Cadila healthcare Ltd, Torrent Pharmaceuticals Ltd, Intas
Pharmaceuticals Ltd, Eris Life Sciences & Cadila Pharmaceuticals Ltd. Apart from these big
corporates, many mid and small-cap pharmaceutical companies are also having their corporate
offices in metro cities of Gujarat like Comed Chemicals & Vasu healthcare in Baroda, Ban

70 | P a g e
Labs in Rajkot, Sundyota numandis & Corona Remedies in Ahmedabad and many others. All
major Indian pharmaceutical companies as well as MNCs having their marketing operation in
metro cities of Gujarat through their medical representatives. Such a competitive environment
as well as the availability of India’s top healthcare specialists make metro cities of Gujarat,
preferred choice to analyze the impact of pharmaceutical marketing tactics on healthcare
practitioner’s prescription habits/behavior.
The existing literature though belongs to different countries, would help in building the
theoretical framework. It would also help to develop the indicators and research methodology.
71 | P a g e
CHAPTER – III
RESEARCH METHODOLOGY
Chapter Contents:
3.0 Introduction
3.1 Research Objective
3.2 Hypothesis
3.3 Research Design
3.4 Population of the Study
3.5 Sample Size
3.6 Sampling Technique
3.7 Sources of Data
3.8 Tools used for Data Collection
3.9 Data Processing
3.10 Theoretical Framework
3.11 Statistical Techniques
3.12 SPSS Software Used for Analysis

72 | P a g e
3.0 Introduction
The whole chapter focused on the research goals, hypotheses, scope, limitations or methods of
data collection, interpretation throughout the research. The success of research varies mostly
on methods used to collect data.
The literature review of the previous section prompted the methodology chapter. This chapter
that following “sections-headings were assembled: Research design, Population, Sampling
including Sampling technique, Instrument Validity, Instrument Reliability, Data Collection
method and data analysis”. A few prominent pieces of the literature surveyed helped
accomplish this process of research [147][148][31][149][150].
3.1 Research Objective
1. To study the current marketing trend in the Indian pharmaceutical industry
2. To identify the various promotional tools used by pharmaceuticals for product marketing
3. To analyze the impact of pharmaceutical promotional tools on doctor’s prescribing behavior
3.2 Hypothesis
Sr. No Variable Hypothesis
1
Detailing of
Medical
Representative
Better the detailing and promotion in front of the doctor, better the
prescription support from a doctor
2 Promotional
Pricing
Lower the price of the medicine, greater the chance to get
prescribe
3 Sampling More number of trial packs to the doctor, higher the chance to get
prescription support from a doctor
4 Continues Medical
Education
Continues medical education does the impact of a prescription
habit of doctor
5 Product
demonstration
A good demonstration of the brand improves the chance of brand
recall at a time of prescribing medicine
6 Sponsorship Sponsorship makes doctors loyal towards the sponsored brand
7 Journal
Subscription Renowned journal subscription always appreciated by doctors
8 Medical Camp Better the sampling camp / Diagnostic camp at doctor’s clinic,
higher the prescription support of a doctor

73 | P a g e
9 Corporate Social
Responsibility
Corporate social activity improves the corporate image in doctor’s
mind
10 Patient Education Doctor’s preference goes to brand which provides better patient
education
11 Corporate Image Better the corporate image, higher the chance of brand to get
prescribes
12 Personal Attire of
MR
A representative with good personal attire impacts a better
company’s image in doctor’s mind
13 Digital marketing Digital marketing helps to get doctor’s attention towards the brand
14 Literature and
Reminders
Higher the reminders to the doctor of Brand, greater the chance to
get prescription support from a doctor
15
Medical
Representative’s
Knowledge
Doctor’s always appreciated a representative with good product
knowledge
16
Customer
Relationship
Management
Pharmaceutical companies are good at customer relationship
management
Table 3.1.1 Hypothesis
3.3 Research Design
This study is quantitative in nature. The researcher adopted a descriptive survey research design
for this study. Primary data was collected through a well-structured questionnaire. According
to Bakar et al. [151] questionnaires for the collection of primary data, are focused on
exploration, evaluation and survey. In addition, when designing a questionnaire that measures
one’s attitude towards a particular topic, researchers generally prefer asking the subject’s
degree of agreement or disagreement on the topic, instead of giving a dichotomous choice; this
helps in avoiding socially preferred responses [152]. Present research design analyses the
impact of similar promotional activities of pharmaceutical firms on doctor's prescribing
behavior. For the process, random sampling and a structured questionnaire were administered
for data collection. Advanced decisions were made when formulating “objective, designing
method, selecting sample, collecting data”. Finally, data analyses and reporting were planned
with expertise’s approval. Research design follows mainly three phases.
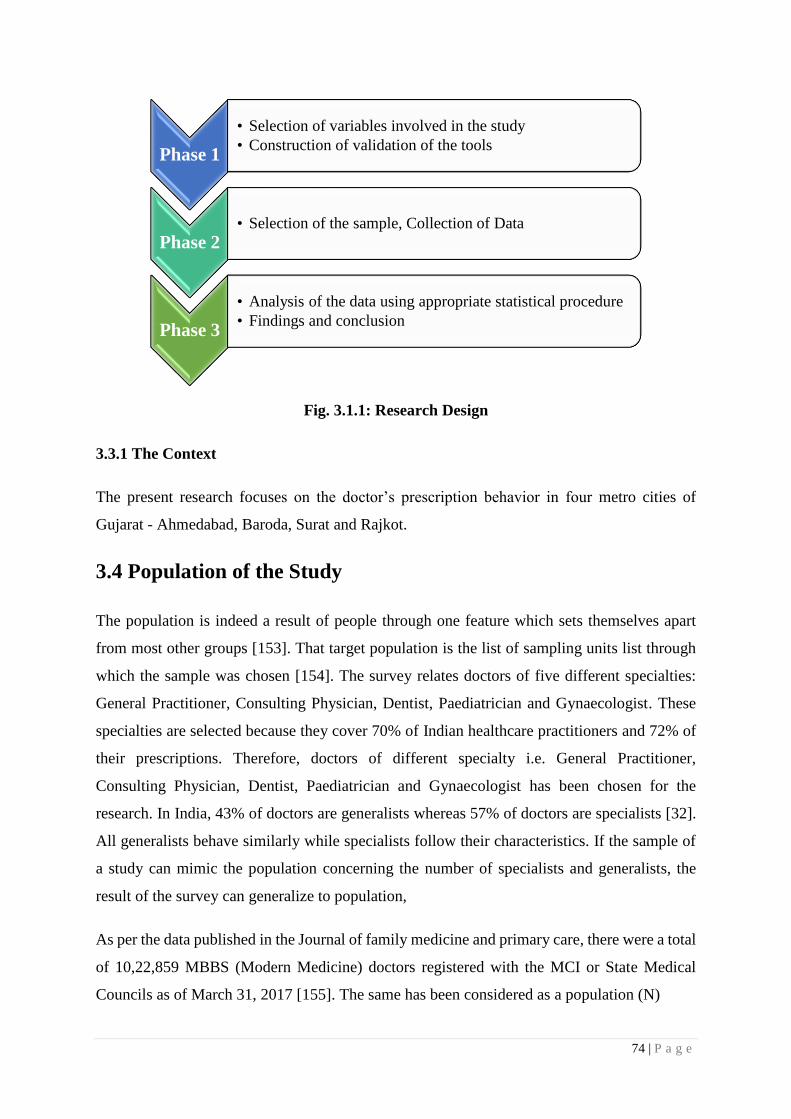
74 | P a g e
Fig. 3.1.1: Research Design
3.3.1 The Context
The present research focuses on the doctor’s prescription behavior in four metro cities of
Gujarat - Ahmedabad, Baroda, Surat and Rajkot.
3.4 Population of the Study
The population is indeed a result of people through one feature which sets themselves apart
from most other groups [153]. That target population is the list of sampling units list through
which the sample was chosen [154]. The survey relates doctors of five different specialties:
General Practitioner, Consulting Physician, Dentist, Paediatrician and Gynaecologist. These
specialties are selected because they cover 70% of Indian healthcare practitioners and 72% of
their prescriptions. Therefore, doctors of different specialty i.e. General Practitioner,
Consulting Physician, Dentist, Paediatrician and Gynaecologist has been chosen for the
research. In India, 43% of doctors are generalists whereas 57% of doctors are specialists [32].
All generalists behave similarly while specialists follow their characteristics. If the sample of
a study can mimic the population concerning the number of specialists and generalists, the
result of the survey can generalize to population,
As per the data published in the Journal of family medicine and primary care, there were a total
of 10,22,859 MBBS (Modern Medicine) doctors registered with the MCI or State Medical
Councils as of March 31, 2017 [155]. The same has been considered as a population (N)
Phase 1
• Selection of variables involved in the study
• Construction of validation of the tools
Phase 2• Selection of the sample, Collection of Data
Phase 3
• Analysis of the data using appropriate statistical procedure
• Findings and conclusion

75 | P a g e
3.5 Sample Size
Sample size means the selection of items from the universe to constitute a sample. According
to Levin & Rubin, 2006, pp378 and Kothari, 2004, pp174, the optimal sample is something
that satisfies performance, representatives or reliability criteria. Any measurement error can
occur attributable to all the correct sample size that can also be managed through increasing
the sample size with good accuracy [156][154]. The sample size has been calculation has been
narrated below.
z = 1.96, p=0.05, e=0.03 and N=1022859
By putting above values, we get sample size
n= 1067
3.6 Sampling Technique
To formulate a simple design that truly represents the population both systematic bias and
sampling error are brought to a minimum by following an objective sampling procedure.
Stratified Random Sampling was chosen for the study [157]. The first list of doctors from four
metro cities of Gujrat (Ahmedabad, Baroda, Surat & Rajkot) has been collected. Doctors were
bifurcated into 5 different subgroups according to their specialty. A total of 1100 doctors were
selected randomly from each subgroup, which was a sample of the study. No of doctors selected
from each city was as per their contribution in total doctors of selected cities. The questionnaire
was distributed among selected doctors contacted through personal or email. The majority of
doctors contacted personally, if he/she asked to email the questionnaire to review later, then it
collected through email.
The ideal sampling technique should minimize the selection bias. Self-selection bias refers to
issues of sampling representativeness and generalizability [159]. Research sampling involves

76 | P a g e
identifying a target population, the group about which the researcher would like to make
statements, and collecting data from a sample, the group that participates in the research. When
the sample is representative of the target population, the results of the research are said to be
generalizable to the target population. Bias is introduced if the members of the target population
do not participate. Loss of participants from the target population does not necessarily result in
bias. Whether or not there is bias depends on how well the sample represents the target
population, and some formal procedure is necessary to evaluate this possibility. Selection bias
is usually introduced as an error with the sampling and having a selection for analysis that is
not properly randomized [158]. Evaluating self-selection bias can be extremely difficult
because the researcher typically does not have information about the non-participants and
therefore cannot compare them with the participants [159]. Using random methods when
selecting subgroups from populations can avoid selection biases [158]. To prepare the sample
for the study, a doctor list of selected specialties from identified cities has been collected.
Subgroup created based on doctor’s city and specialty. Random selection is done from the
doctor list based on the weightage of the number of doctors in the city and their specialty among
the population to avoid selection bias & the result of the study can be generalized for the
population.
3.7 Sources of Data
Primary data were initial information gathered by first-hand analysis, although secondary data
is information commonly accessible but collected from several other parties. The researcher
collected the data from the primary source only. Primary sources involve a well-constructed
and self-developed questionnaire.
Secondary data refers to information which someone other than the consumer obtained. A
common example of essential social science data provides censuses, government department-
gathered statistics, internal documents that have been initially collected for most other
academic purposes. Secondary data was obtained from various published articles, research
papers submitted thesis as well as white papers published by government or agencies.
3.8 Tools used for Data Collection

77 | P a g e
3.8.1 Tool for doctor's prescription behavior
The researcher used a well-constructed and self-developed closed-ended questionnaire to get
the desired information from the doctors. The questions are formed by the Likert scale. The
questionnaire was built based on current literature, questionnaire, and recent research. Likert
scale is perhaps the most appropriate ranking to be used in the configuration of both the test
questionnaire thus according [160]. A scale of 1-7 was being used to assess the agreement of
the applicant to just the questions posed.
That measure was better suited because it offers participants an assumption that they are solid
or just not. 79 questions were written for this study to assess prescription behavior. Question
1, 2 & 3 narrate his expertise and professional experience. Question 4 gives an idea about
whether he/she entertained pharmaceutical professionals or not. Question 5 talks about which
kind of activity the doctor prefers, either patient-related or practice-related. Question 6 were
related to the detailing of medical representative. Question 7 was related to the promotional
pricing of the pharmaceutical brand. Question 8 was related to sampling. Question 9 was
related to CME. Question 10 was related to a product demonstration. Question 11 was related
to sponsorship. Question 12 were related to journal subscription. Question 13 was related to
the medical camp. Question 14 was related to corporate social activity. Question 15 was related
to the patient education program. Question 16 was related to corporate image. Question 17 was
related to the personal attire of the company representative. Question 18 was related to digital
marketing by pharmaceutical companies. Question 19 was related to literature and reminders
of pharmaceutical companies. Question 20 was related to medical representative’s knowledge
and Question 21 was related to customer relationship management of pharmaceutical
companies.
3.8.2 Pilot Study
Textbook of Educational Research cited “whether you create your instrument or choose to
administer a previously developed one, you need to pre-test or pilot test” [161]. A pilot study
was conducted with 100 doctors by administering the questionnaire. For the pilot study, 4
different variables were identified, that was detailing medical representatives, continues
medical education (CMEs), medical camps, and customer relationship management. For item
analysis, Cronbach Alpha was used to assess the degree of internal consistency, Cronbach alpha
with ‘r’ value lesser than 0.30 were rejected as per the correlation analysis guideline. For

78 | P a g e
Content validation, the researcher requested three experts to validate the tool.
The experts suggested keeping the items specific, relevant and clear of each statement, at the
same time suitability and accuracy of the language used. The Experts’ suggestions were useful
and were accepted; accordingly, distracters were removed from the item. Items were kept
simple and easy for the respondents to understand and answer each section of the questionnaire.
3.8.3 Reliability and Validity of Tool
According to Sekaran and Roger et al [162], this is necessary to ensure that perhaps the
instrument produced for evaluating a specific topic appropriately measures this same
component but instead currently measures this same framework it should be going to measure
within research. Nonetheless, the consistency study relates to determining the degree of
accuracy between several validities of the questionnaires, Although the consistency review
describes the degree to which the model correctly reflects a metric or series of steps [152].
That instrument's precision was calculated through the alpha coefficient from Cronbach.
Furthermore, another scholar e.g. Bagozziet al [163] recommended that almost all metrics or
dimensional measurements would surpass the required value of 0.60. From table 3.1 the
reliability analysis of all the constructs indicates high reliability as it is above 0.6, which is a
good signal.
The validity of the tool is measured by the average variance explained (AVE) which should be
greater than 0.5 according to Hair et al [164]. In table 3.1 the Average variance explained
(AVE) of all the constructs is greater than 0.5 which confirms the validity of the tool.
Table 3.2.1: Reliability and Validity Statistics
Construct Cronbach’s alpha CR AVE
Detailing of medical
representative 0.756 0.735 0.601
Promotional pricing of
pharmaceutical brand 0.781 0.765 0.667
Sampling 0.778 0.789 0.685
Medical education 0.766 0.754 0.586
Demonstration 0.788 0.761 0.623
Sponsorship 0.810 0.786 0.614
Journal subscription 0.796 0.813 0.608

79 | P a g e
Medical camp 0.809 0.788 0.629
Corporate social activity 0.818 0.762 0.673
Patient education program 0.765 0.738 0.660
Corporate image 0.771 0.742 0.631
Personal attire of company 0.821 0.780 0.578
Digital marketing by
pharmaceutical companies 0.763 0.749 0.654
Literatures and reminders of
pharmaceutical companies 0.738 0.775 0.589
Medical representative’s
knowledge 0.786 0.746 0.616
Customer relationship
management 0.794 0.773 0.679
3.9 Data Processing
According to Malhotra et al [165], data processing which used for data analysis method which
is come used in a preliminary plan like questionnaire checking, data editing, data coding, data
transcribing and data cleaning.
3.9.1 Questionnaire Checking
In this process when an error arises during the questionnaire is prepared it detected that error
after the process of the questionnaire is completed. This is important because of quality and
completeness process is required. The pilot test is removing all the grammar mistakes and
modify before the actual survey was distributed.
3.9.2 Data Editing
It is a process that will increase the closeness of a measured value to a standard or known value
of the questionnaire. During the survey data is missed to reduce this error it is important to do
the data editing. If any value is identified, incomplete, inconsistent then it is a very important
process [165]. That method should be to reduce the amount of errors that occur [166]. That
editing of data offers retrospective care for unsatisfactory answers such as allocated missed
importance and removed error reporting to receive improved and accurate data. Unfilled and
unappropriated responses were removed, 1000 responses were set as per the data analysis
criteria & considered for further analysis. Out of 1100 filled questionnaire, 9% (almost 100)

80 | P a g e
was not filled appropriately. Each question in the questionnaire has 3-4 sub-questions; in
unappropriated responses, doctors had missed to ticked 1-2 sub-questions. The majority of
unappropriated responses were received via email, where the questionnaire was filled without
guidance/supervision. The contribution of the unfilled questionnaire with respect to specialty
was almost similar but the majority of them are from Ahmedabad and Surat city. To avoid any
bias or error in data filling, the majority of questionnaires were filled in presence of the
researcher; so that he can guide respondents in case if required.
3.9.3 Data Coding
Data coding refers that create a code throughout the questionnaire to describe every answer
[165]. That coding of data may have been classified through numerical numbers or some other
character. Data must be reliable so data coding is very important so that the error which occurs
gets minimize.
3.9.4 Data Transcribing
The data collected with the help of the questionnaire will be analyzed with the help of the
statistical package SPSS 22.
3.10 Theoretical Framework
The field of marketing has expanded recently and become of increased importance as one of
the most important activities of any organization or firm. Pharmaceutical marketing seems to
be the advertisement sector, or simply the selling of pharmaceuticals or medications. Instead
of investing in research and development, Indian pharmaceutical companies mainly focus on
creativity and marketing. The pharmaceutical companies invest and spend heavily on
marketing and promotion, up to 10% of the pharmaceutical manufacturing companies are
investing in promotion considering detailing as the most used promotional instrument.
To help explain certain influences affecting decision-making and procedure by doctors, the
associated research suggested how such influences may provide a role to play in shaping the
prescription behavior of doctors. Based on existing literature, the influencing factors that have
been selected are Medical representative detailing, Promotional pricing, Sampling, Continues
Medical Education, Product demonstration, Sponsorship, Journal Subscription, Medical camp,
Corporate Social activity, Patient Education Program, Corporate image, Personal attire of

81 | P a g e
company representative, Digital marketing by pharmaceutical companies, Literature and
reminders of pharmaceutical companies, Medical representative’s Knowledge, Customer
Relationship Management of Pharmaceutical companies which directly influences Physician's
prescribing behavior. Further, a research model was developed as shown in fig. 3.2.
Independent Variables
Medical representative detailing
Promotional pricing
Sampling
Continues Medical Education
Product demonstration
Sponsorship
Journal Subscription
Medical camp
Corporate Social activity
Patient Education Program
Corporate image
Personal attire of company
representative
Digital marketing by pharmaceutical companies
Literature and reminders of
pharmaceutical companies
Medical representative’s Knowledge
Customer Relationship Management of
Pharmaceutical companies
Fig. 3.2.1: Theoretical framework based on Stimulus - Organism - Response (S-O-R)
Model
3.11 Statistical Techniques
This study was analyzing the data obtained using systematic analysis. Even though the
statistical analysis gives the scholar the same opportunity to receive communicative relevant
data via average output [167].
a. Descriptive statistics
This same study utilized mean, standard deviation, mean square error & median methods to
explain the effects for knowledge which helps scholars to arrange vast amounts of information
in even a concise way. In such a way, descriptive statistics in the form of outlining vast amounts
Dependent Variable
Physician's prescribing
behavior
82 | P a g e
of data into investigating the research numerical units in order to assist explain outcomes.
b. Cronbach’s Alpha
These are achieved to examine that instrument’s internal durability. That Cronbach's Alpha
value was well above 0.6 is above the normal value indicated through Wim et al [168].
According to Wim et. al.[168] the value of Cronbach’s alpha above 0.6 is acceptable.
c. Pearson correlation
A Pearson correlation analysis among components is often used to perform statistical analysis
of the linear relationship between two and has been referred to as r. A Pearson's correlation
aims to create a line of best fit through their results of two factors and that Pearson correlation
coefficient, 'r' means however far removed from this line of the best match all such results
points were. Pearson correlation of variables was examined with one another and for any
identified variable covariates correctly with other parameters elements in the study. SPSS by
selecting ANALYSIS –> CORRELATE –> BIVARIATE.
d. Regression
Regression analysis is an extension of correlation. Through this analysis one can understand
the Connection between that and a predicted outcome or each or even more risk factors and
ambiguous variables; that independent variables are often called that reaction or predictor
variables or the risk influences, and the determinants and explanatory variable, were called
confuses. It can predict/measure how the extent of change in one or more variables
(predictor/independent variable) jointly affects or changes the other variable (dependent
variable). (Multivariable Methods) This analysis can be performed in SPSS by selecting
ANALYSIS –>REGRESSION –> LINEAR.
3.12 SPSS Software Used for Analysis
SPSS, the name stands for (Statistical Package for the Social Sciences); postgraduate students
at Stanford University developed the statistical software in 1968. It is widely used in both
academic and commercial spheres. SPSS provides a wide range of tools from basic tabulation
to sophisticated multivariate analysis. It is user-friendly software that can be very much handy
to users in statistical analysis.

83 | P a g e
CHAPTER – IV
DATA ANALYSIS AND INTERPRETATION
Chapter Contents:
4.1 General Information
4.2 General Profile of Respondents
4.3 Impact of Specialty on Activities
4.4 Hypothesis Testing

84 | P a g e
4.1 General Information
The prescription-based pharmaceutical market is merely dependent on doctor’s prescription
power. The customer, doctors are in the driving seat, and pharmaceutical companies are
utilizing their best creativity to registered their brand in doctor’s minds and thereby on the
prescription copy. Doctors are the final decision-makers as they advise patients regarding the
medication and even a particular brand that patients should consume to alleviate disease
conditions. Such power of doctors makes them venerable to pharmaceutical companies to
influence their prescribing behavior. Pharmaceutical companies invest heavily in marketing
activities and promotional tools to promote their brand in front of doctors and try to influence
their prescribing behavior, especially towards their promoted brand. This current study
explores the effects of such marketing strategies on doctor’s prescription behavior.
4.2 General Profile of Respondents
A general profile of the respondents is given below to create a background to the data analysis
and interpretation based on objectives.
4.2.1 City & Specialty
In this section specialty of respondents has been explored based on the survey and the results
are shown below.
Table 4.1.1: City & Specialty pattern
Specialty Frequency Percent City Frequency Percent
General
Practitioner 240 24.0 Ahmedabad 530 53.0
Consulting
Physician 180 18.0 Rajkot 120 12.0
Dentist 250 25.0 Baroda 150 15.0
Paediatrician 180 18.0 Surat 200 20.0
Gynaecologist 150 15.0 Total 1000 100.0
Total 1000 100.0

85 | P a g e
Fig. 4.1.1: Frequency of specialty pattern
From the above fig. 4.1, it is evident that in sample respondents, 25 percent are dentists, 24
percent are General Practitioner, 18 percents are pediatricians and Consulting physicians, while
15 percent are gynecologists.
4.2.2 Practicing Experience
In this section practicing experience of respondents has been explored based on the survey and
the results are shown below.
Table 4.2.1: Practicing experience pattern
Experience
(years) Frequency Percent
Valid
Percent
Cumulative
Percent
Valid
1.00 16 1.6 1.6 1.6
2.00 48 4.8 4.8 6.4
3.00 56 5.6 5.6 12.0
4.00 70 7.0 7.0 19.0
5.00 126 12.6 12.6 31.6
6.00 78 7.8 7.8 39.4
7.00 50 5.0 5.0 44.4
0
5
10
15
20
25
30
General
Practitioner
Consulting
Physician
Dentist Paediatrician Gynaecologist
Per
cen
tage

86 | P a g e
8.00 60 6.0 6.0 50.4
9.00 34 3.4 3.4 53.8
10.00 92 9.2 9.2 63.0
11.00 20 2.0 2.0 65.0
12.00 50 5.0 5.0 70.0
13.00 30 3.0 3.0 73.0
14.00 20 2.0 2.0 75.0
15.00 50 5.0 5.0 80.0
16.00 30 3.0 3.0 83.0
17.00 20 2.0 2.0 85.0
18.00 20 2.0 2.0 87.0
19.00 10 1.0 1.0 88.0
20.00 60 6.0 6.0 94.0
24.00 10 1.0 1.0 95.0
25.00 30 3.0 3.0 98.0
30.00 10 1.0 1.0 99.0
40.00 10 1.0 1.0 100.0
Total 1000 100.0 100.0
Fig. 4.2.1: Practicing experience pattern
0
2
4
6
8
10
12
14
1 2 3 4 5 6 7 8 9 10 11 12 13 14 15 16 17 18 19 20 24 25 30 40
Per
cen
tag
e
Experience

87 | P a g e
4.2.3 Average Patients per Day
In this section average patients per day has been explored based on the survey and the results
are shown below.
Table 4.2.2: Average Patients per Day
Average
Patients per
Day
Frequency Percent Valid
Percent
Cumulative
Percent
Valid 4.00 12 1.2 1.2 1.2
5.00 62 6.2 6.2 7.4
6.00 14 1.4 1.4 8.8
8.00 36 3.6 3.6 12.4
10.00 152 15.2 15.2 27.6
11.00 10 1.0 1.0 28.6
12.00 50 5.0 5.0 33.6
14.00 10 1.0 1.0 34.6
15.00 174 17.4 17.4 52.0
18.00 20 2.0 2.0 54.0
20.00 140 14.0 14.0 68.0
22.00 10 1.0 1.0 69.0
24.00 10 1.0 1.0 70.0
25.00 40 4.0 4.0 74.0
26.00 10 1.0 1.0 75.0
27.00 10 1.0 1.0 76.0
30.00 120 12.0 12.0 88.0
35.00 30 3.0 3.0 91.0
37.00 10 1.0 1.0 92.0
40.00 30 3.0 3.0 95.0
45.00 10 1.0 1.0 96.0
50.00 40 4.0 4.0 100.0
Total 1000 100.0 100.0

88 | P a g e
Fig. 4.2.2: Average Patients per Day
4.2.4 Entertain activities by pharmaceutical companies
Many doctors don’t entertain activities by pharmaceutical companies; they don’t want to tag
their name with any companies. In this section entertaining activities by pharmaceutical
companies have been explored based on a survey and the results are shown below.
Table 4.2.3: Entertain activities by pharmaceutical companies
Frequency Percent
Valid
Percent
Cumulative
Percent
Valid Yes 976 97.6 97.6 97.6
No 24 2.4 2.4 100.0
Total 1000 100.0 100.0
It is evident from the table that, majority of respondents (97.6 percent) entertain activities by
pharmaceutical companies while only 2.4 percent do not entertain activities by pharmaceutical
companies.
0
2
4
6
8
10
12
14
16
18
20
4 5 6 8 10 11 12 14 15 18 20 22 24 25 26 27 30 35 37 40 45 50
Per
cen
tag
e
Average Patients Per Day

89 | P a g e
4.2.5 Preference of Activity Performed
Patient-oriented activity is defined as an activity that helps a patient to understand a disease
condition or helps the patient for better treatment like patient education videos, dos, and don’ts
of disease, etc. Such kind of activity helps the doctor to oblige their patient pool; in return, it
helps to get prescription support from the doctor for Organizer Company. Practice-oriented
activity helps the doctor to sharpen their expertise for better patient care like CMEs, workshops,
conferences, etc. In this section preference of activity performed has been explored based on
the survey and the results are shown below.
Table 4.2.4: Preference of Activity Performed
Frequency Percent
Valid
Percent
Cumulative
Percent
Valid
Patient
oriented 780 78 78 78
Practice oriented 220 22 22 100.0
Total 1000 100.0 100.0
It is evident from the table that, majority of respondents (78 percent) preferred patient-oriented
and 22 percent preferred practice-oriented.
4.3 Impact of Specialty on Activities
To explore the impact of specialty on activities, the average scoring of each activity was used.
Here used average score of the Likert scale to measure the impact of various activities on each
specialty.
Table 4.3.1: Impact of Specialty on Activities
Activity Dentist General
Practitioner Gynecologist Pediatrician
Consulting
Physician
Customer Relationship Management 5.77 5.75 5.59 5.71 5.65
Sponsorship 5.57 5.51 5.40 5.43 5.57
Medical Representative’s Knowledge 5.27 5.34 5.25 5.15 5.24
Continues Medical Education 5.14 5.07 5.10 5.10 5.19
Detailing of Medical Representative 5.13 5.05 5.04 5.05 5.09
Medical Camp 4.89 4.85 4.85 4.93 4.85
Sampling 4.87 4.84 4.83 4.85 4.82
Product demonstration 4.81 4.80 4.78 4.77 4.77

90 | P a g e
Corporate Image 4.68 4.70 4.66 4.70 4.70
Journal Subscription 4.66 4.65 4.52 4.63 4.58
Personal Attire of MR 4.60 4.60 4.49 4.52 4.50
Promotional Pricing 4.42 4.33 4.31 4.33 4.31
Patient Education 4.25 4.25 4.31 4.30 4.25
Corporate Social Responsibility 3.74 3.74 3.81 3.91 3.82
Digital marketing 3.72 3.58 3.50 3.63 3.61
Literatures and Reminders 3.69 3.46 3.41 3.54 3.58
Specialty: Dentist
At the dentist level, customer relationship management is the most accepted activity followed
by sponsorship, medical representative knowledge, Continues Medical Education, Detailing of
Medical Representative, Medical Camp, Sampling, Product demonstration, Corporate Image,
Journal Subscription, Personal Attire of MR, Promotional Pricing, Patient Education,
Corporate Social Responsibility, Digital marketing & Literature and Reminders.
Fig. 4.3.1: Impact of Activities on Dentist
It clearly shows that, if companies want more prescriptions from dentists, they should more
focus on CRM and sponsorship kinds of activities rather than digital marketing or literature
and reminders.
Specialty: General Practitioner
0.00
1.00
2.00
3.00
4.00
5.00
6.00
7.00 D E N T I S T
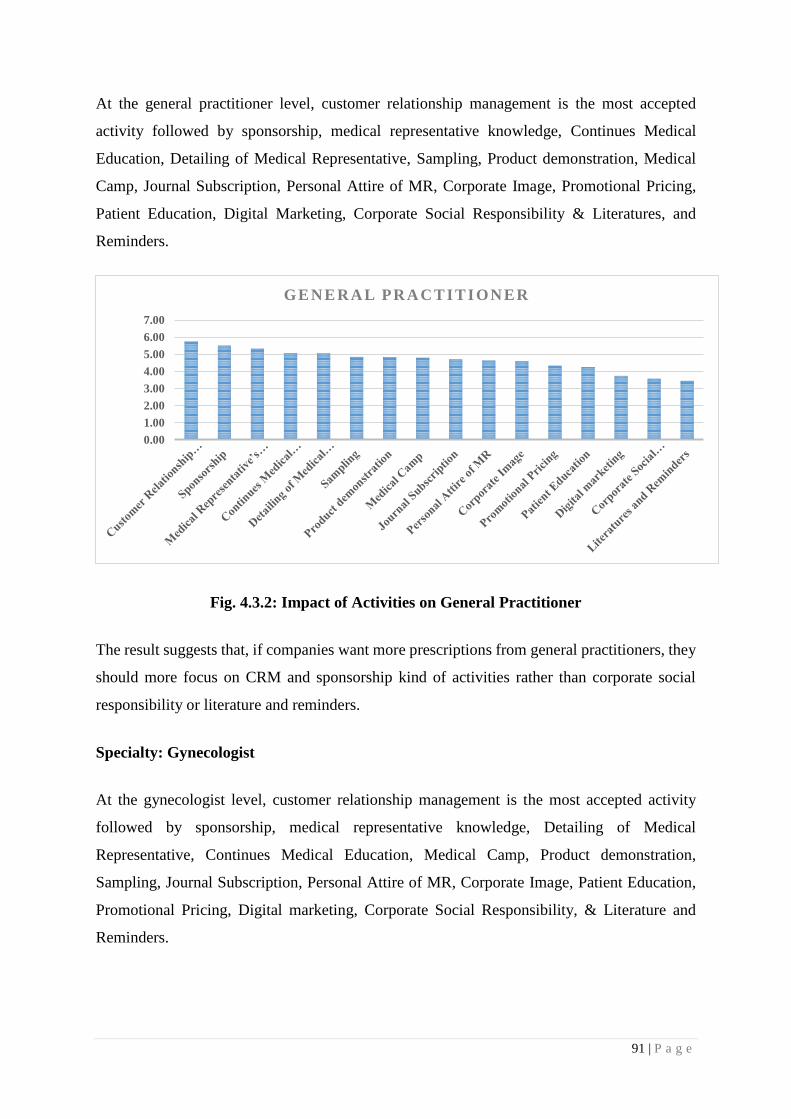
91 | P a g e
At the general practitioner level, customer relationship management is the most accepted
activity followed by sponsorship, medical representative knowledge, Continues Medical
Education, Detailing of Medical Representative, Sampling, Product demonstration, Medical
Camp, Journal Subscription, Personal Attire of MR, Corporate Image, Promotional Pricing,
Patient Education, Digital Marketing, Corporate Social Responsibility & Literatures, and
Reminders.
Fig. 4.3.2: Impact of Activities on General Practitioner
The result suggests that, if companies want more prescriptions from general practitioners, they
should more focus on CRM and sponsorship kind of activities rather than corporate social
responsibility or literature and reminders.
Specialty: Gynecologist
At the gynecologist level, customer relationship management is the most accepted activity
followed by sponsorship, medical representative knowledge, Detailing of Medical
Representative, Continues Medical Education, Medical Camp, Product demonstration,
Sampling, Journal Subscription, Personal Attire of MR, Corporate Image, Patient Education,
Promotional Pricing, Digital marketing, Corporate Social Responsibility, & Literature and
Reminders.
0.00
1.00
2.00
3.00
4.00
5.00
6.00
7.00
GE N E R A L PR A C T I T I ON ER

92 | P a g e
Fig. 4.3.3: Impact of Activities on Gynecologist
The study confirms that, if companies want more prescriptions from gynecologists, they should
more focus on CRM and sponsorship kind of activities rather than corporate social
responsibility or literature and reminders.
Specialty: Pediatrician
At the pediatrician level, customer relationship management is the most accepted activity
followed by sponsorship, Medical Representative’s Knowledge, Detailing of Medical
Representative, Continues Medical Education, Medical Camp, Sampling, Product
demonstration, Journal Subscription. Personal Attire of MR, Corporate Image, Promotional
Pricing, Patient Education, Digital Marketing, Corporate Social Responsibility, & Literature
and Reminders.
0.00
1.00
2.00
3.00
4.00
5.00
6.00
GY N E C O L OGI ST

93 | P a g e
Fig. 4.3.4: Impact of Activities on Pediatrician
The data confirms that, if companies want more prescriptions from pediatricians, they should
more focus on CRM and sponsorship kinds of activities rather than corporate social
responsibility or literature and reminders.
Specialty: Consultant Physician
At the Consultant Physician level, customer relationship management is the most accepted
activity followed by sponsorship, Medical Representative’s Knowledge, Continues Medical
Education, Detailing of Medical Representative, Medical Camp, Sampling, Journal
Subscription, Product demonstration, Personal Attire of MR, Corporate Image, Promotional
Pricing, Patient Education, Digital Marketing, Corporate Social Responsibility, & Literature
and Reminders.
0.00
1.00
2.00
3.00
4.00
5.00
6.00
PE D I AT R I CI AN

94 | P a g e
Fig. 4.3.5: Impact of Activities on Consulting Physician
The impact of activities on specialty is depicted in fig. 4.1-4.5. It indicates that customer
relationship management is the most impactful activity and the least impactful activity is
literature and reminders on doctors with a different specialty.
4.4 Hypothesis Testing
Hypothesis 1: Better the detailing and promotion in front of the doctor, better the
prescription support from a doctor
To examine the impact of detailing and promotion in front of the doctor towards prescription
support from the doctor, regression analysis was fitted.
Table 4.4.1: Model summary of better the detailing and promotion in front of the
doctor, better the prescription support from a doctor
Model Summary
Model R R
Square
Adjusted
R Square
Std. Error
of the
Estimate
(S)
1 .250a .062 .061 .62581
a. Predictors: (Constant), Detailing
R2 value 0.062 implies that is 6.2% of the variation in detailing and promotion in front of the
0.00
1.00
2.00
3.00
4.00
5.00
6.00
C o n s u l t ing Ph y s i c i a n

95 | P a g e
doctor and the remaining 93.8% can be explained by other variables. S must be <= 2.5 to
produce a sufficiently narrow 95% prediction interval [169]. Here the value of S is 0.63, which
confirms the precision of the model.
Table 4.4.2: ANOVA analysis of the summary of better the detailing and promotion in
front of the doctor, better the prescription support from a doctor
ANOVAa
Model Sum of
Squares Df
Mean
Square F Sig.
1 Regression 33.543 1 33.543 64.931 .000b
Residual 503.683 975 .517
Total 537.226 976
a. Dependent Variable: Prescription support from doctor
b. Predictors: (Constant), Detailing and promotion in front of doctor
The above table shows that detailing and promotion in front of doctor has an impact on
prescription support from doctor. The F-statistic obtained is 64.931 and the p-value is 0.000.
The p-value is smaller than 0.05 at 5% level of significance.
Table 4.4.3: Regression analysis of the summary of better the detailing and promotion
in front of doctor, better the prescription support from doctor
Coefficientsa
Model
Unstandardized
Coefficients
Standardized
Coefficients T Sig.
B Std.
Error Beta
1 (Constant) 3.709 .181 20.455 .000
Prescription
support
from doctor .287 .036 .250 8.058 .000
a. Dependent Variable: Prescription support from doctor
The above table depicts that, the relationship between detailing and promotion in front of
doctor, with prescription support from doctor was proposed positive with path coefficient,
β=0.25 at p<0.05. This makes the findings in the support of the hypothesis. Therefore,
hypothesis is accepted and concluded that better the detailing and promotion in front of doctor,
better the prescription support from doctor.

96 | P a g e
Fig. 4.4.1 Regression standardized residual plot for variable detailing
Hypothesis 2: Lower the price of the medicine, the greater the chance to get prescribed.
To find out the type of relationship between the prices of the medicine and the chance to get
prescribed. Karl Pearson’s co-efficient correlation was applied to know the variable’s
correlation [153].
Table 4.4.4: Relationship between the price of the medicine and chance to get prescribe
Correlations
Lower the price of
the medicine
Greater the chance
to get prescribe
Lower the price of
the medicine,
Pearson
Correlation 1 -.286**
Sig. (2-tailed) .000
N 977 977
Greater the
chance to get
prescribe
Pearson
Correlation -.286** 1
Sig. (2-tailed) .000
N 977 977
**. Correlation is significant at the 0.01 level (2-tailed).
In this hypothesis, price of the medicine was correlated with a chance to get prescribed. From
the table, a Pearson correlation coefficient r = -.286; (p < 0.01) is calculated, which shows a

97 | P a g e
negative relationship between the price of the medicine and the chance to get prescribed.
Therefore, the researcher rejects the null hypothesis and concluded that the lower the price of
the medicine, the greater the chance to get prescribed.
Hypothesis 3: More number of trial packs to doctor, higher the chance to get prescription
support from the doctor
To test the above hypothesis, regression analysis was applied.
Table 4.4.5: Model summary of trial packs to doctor and chance to get prescription
support from doctor
Model Summary
Model R R
Square
Adjusted R
Square
Std. Error of the
Estimate
1 .270a .073 .072 .59341
a. Predictors: (Constant), Chance to get prescription support from doctor
R2 value 0.073 implies that is 7.3% of the variation in the chance to get prescription support
from doctor and the remaining 92.7% can be explained by other variables. Here S value is 0.59
which is below the maximum allowable limit of 2.5, henceforth it proved the precision of the
model.
Table 4.4.6: ANOVA analysis of trial packs to doctor and chance to get prescription
support from doctor
ANOVAa
Model Sum of
Squares Df
Mean
Square F Sig.
1 Regression 56.360 1 56.360 76.842 .000b
Residual 715.111 975 .733
Total 771.471 976
a. Dependent Variable: Trial packs to doctor
b. Predictors: (Constant), Prescription support from doctor
The above table shows that prescription support from doctor has an impact on trial packs to
doctor. The F-statistic obtained is 76.842 and the p-value is 0.000. The p-value is smaller than
0.05 at 5% level of significance.
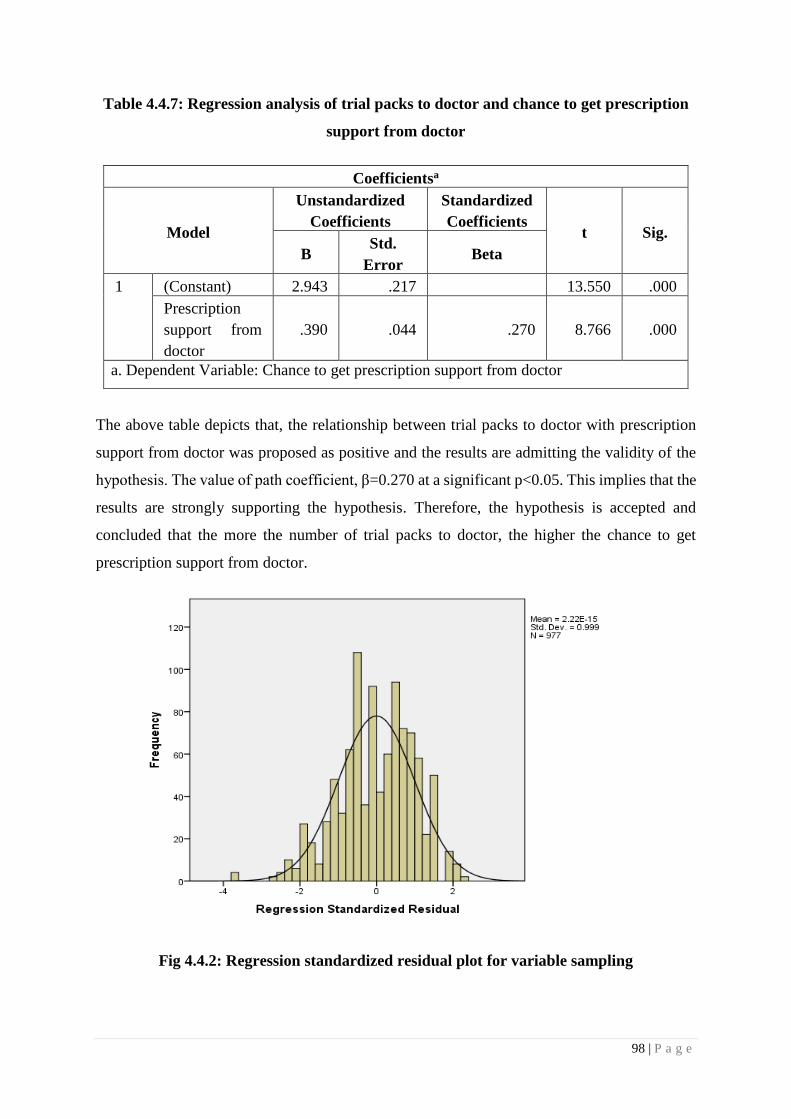
98 | P a g e
Table 4.4.7: Regression analysis of trial packs to doctor and chance to get prescription
support from doctor
Coefficientsa
Model
Unstandardized
Coefficients
Standardized
Coefficients t Sig.
B Std.
Error Beta
1 (Constant) 2.943 .217 13.550 .000
Prescription
support from
doctor
.390 .044 .270 8.766 .000
a. Dependent Variable: Chance to get prescription support from doctor
The above table depicts that, the relationship between trial packs to doctor with prescription
support from doctor was proposed as positive and the results are admitting the validity of the
hypothesis. The value of path coefficient, β=0.270 at a significant p<0.05. This implies that the
results are strongly supporting the hypothesis. Therefore, the hypothesis is accepted and
concluded that the more the number of trial packs to doctor, the higher the chance to get
prescription support from doctor.
Fig 4.4.2: Regression standardized residual plot for variable sampling

99 | P a g e
Hypothesis 4: Continues medical education does impact the prescription habit of doctor.
Regression analysis was applied for testing the above hypothesis.
Table 4.4.8: Model summary of continues medical education does impact of the
prescription habit of doctor
Model Summary
Model R R
Square
Adjusted R
Square
Std. Error of
the Estimate
1 .171a .029 .028 .54633
a. Predictors: (Constant), Medical education
R2 value 0.029 implies that is 2.9% of the variation in the chance to get prescription support
from doctor and the remaining 97.1% can be explained by other variables. S value is 0.546
under the maximum allowable limit i.e. 2.5, which confirms the precision of the model.
Table 4.4.9: ANOVA analysis of continues medical education does impact of
prescription habit of doctor
ANOVAa
Model Sum of
Squares Df
Mean
Square F Sig.
1 Regression 8.723 1 8.723 29.226 .000b
Residual 291.012 975 .298
Total 299.735 976
a. Dependent Variable: Medical education
b. Predictors: (Constant), Prescription habit of doctor
Above table shows that medical education has an impact on the prescription habit of doctor.
The F-statistic obtained is 29.226 and the p-value is 0.000. The p-value is smaller than 0.05 at
5% level of significance.
Table 4.4.10: Regression analysis of continues medical education does impact of
prescription habit of doctor
Coefficientsa
Model
Unstandardized
Coefficients
Standardized
Coefficients t Sig.
B Std.
Error Beta
1 (Constant) 4.268 .130 32.918 .000

100 | P a g e
Prescription
habit of doctor .125 .023 .171 5.406 .000
a. Dependent Variable: Prescription habit of doctor
The above table depicts that, the relationship between medical educations with the prescription
habit of doctor was proposed as positive and the results are admitting the validity of hypothesis.
The value of path coefficient, β=0.171 at a significant p<0.05. This implies that the results are
strongly supporting the hypothesis. Therefore, hypothesis is accepted and concluded that
continues medical education impact on prescription habit of doctor.
Fig 4.4.3: Regression standardized residual plot for variable CME
Hypothesis 5: Good demonstration of brand, improves the chance of brand recall at a
time of prescribing medicine
Regression analysis was applied for testing the above hypothesis.
Table 4.4.11: Model summary of good demonstration of brand and chance of brand recall
at a time of prescribing medicine

101 | P a g e
Model Summary
Model R R Square Adjusted R
Square
Std. Error of
the Estimate
1 .046a .002 .001 .53397
a. Predictors: (Constant), Good demonstration of brand
b. Dependent Variable: Prescribing medicine
R2 value 0.002 implies that is 0.2% of the variation in good demonstration of brand and
remaining 99.8% can be explained by other variables. 0.53 is the value of S, which confirms
the accuracy of the model.
Table 4.4.12: ANOVA analysis of good demonstration of brand and chance of brand
recall at a time of prescribing medicine
ANOVAa
Model Sum of
Squares Df
Mean
Square F Sig.
1 Regression .796 1 .796 2.084 .149b
Residual 372.151 974 .382
Total 372.947 975
a. Dependent Variable: Brand recall at a time of prescribing medicine
b. Predictors: (Constant), Good demonstration of brand
The above table shows that good demonstration of brand does not have an impact on the chance
of brand recall at a time of prescribing medicine. The F-statistic obtained is 2.084 and the p-
value is 0.149. The p-value is greater than 0.05 at 5% level of significance.
Table 4.4.13: Regression analysis of good demonstration of brand and chance of brand
recall at a time of prescribing medicine
Coefficientsa
Model
Unstandardized
Coefficients
Standardized
Coefficients t Sig.
B Std.
Error Beta
1 (Constant) 5.313 .151 35.148 .000
Medicine -.043 .029 .046 -1.444 .149
a. Dependent Variable: Brand recall at a time of prescribing medicine

102 | P a g e
The above table depicts that, the relationship between good demonstrations of brand with
chance of brand recall at a time of prescribing medicine was proposed as weak and positive
and the results are not admitting the validity of hypothesis. The value of path coefficient,
β=0.046 at a significant p<0.05. This implies that the results are not supporting the hypothesis.
Therefore, hypothesis is rejected and concluded that brand demonstration in front of doctor
doesn’t impact of prescription habit of doctor.
Fig. 4.4.4: Regression standardized residual plot for variable product demonstration
Hypothesis 6: Sponsorship makes doctor loyal towards sponsored brand.
Regression analysis was applied for testing the above hypothesis.
Table 4.4.14: Model summary of sponsorship makes doctor loyal towards sponsored
brand
Model Summary
Model R R Square Adjusted R
Square
Std. Error of
the Estimate
1 .047a .002 .001 .67252
a. Predictors: (Constant), Sponsorship
R2 value 0.002 implies that is 0.2% of the variation in sponsorship and remaining 99.8% can
be explained by other variables. The model is precise as the value of S is 0.67 which is below

103 | P a g e
the maximum allowable limit of 2.5.
Table 4.4.15: ANOVA analysis of sponsorship makes doctor loyal towards the
sponsored brand
ANOVAa
Model Sum of
Squares Df
Mean
Square F Sig.
1 Regression .973 1 .973 2.151 .143b
Residual 440.970 975 .452
Total 441.943 976
a. Dependent Variable: Brand Loyalty
b. Predictors: (Constant), Sponsorship
The above table shows that sponsorship does not have an impact on doctor loyal towards the
sponsored brand. The F-statistic obtained is 2.151 and the p-value is 0.143. The p-value is
greater than 0.05 at 5% level of significance.
Table 4.4.16: Regression analysis of sponsorship makes doctor loyal towards sponsored
brand
Coefficientsa
Model
Unstandardized
Coefficients
Standardized
Coefficients t Sig.
B Std.
Error Beta
1 (Constant) 5.373 .201 26.771 .000
Sponsorship -.051 .034 .047 -1.467 .143
a. Dependent Variable: Brand Loyalty
The above table depicts that, the relationship between sponsorship with doctor loyal towards
sponsored brand was proposed as weak and positive and the results are not admitting the
validity of hypothesis. The value of path coefficient, β=0.047 at a significant p>0.05. This
implies that the results are not supporting the hypothesis. Therefore, hypothesis is rejected and
concluded that sponsorship does not make doctor loyal to the sponsored brand. It helps to give
a temporary hike in the prescription but not make doctor loyal towards brand.

104 | P a g e
Fig. 4.4.5: Regression standardized residual plot for variable sponsorship
Hypothesis 7: Renowned journal subscriptions are always appreciated by doctors.
Regression analysis was applied for testing the above hypothesis.
Table 4.4.17: Model summary of renowned journal subscription appreciated by doctors
Model Summary
Model R R Square Adjusted R
Square
Std. Error of
the Estimate
1 .231a .054 .053 .83291
a. Predictors: (Constant), Renowned journal subscription
R2 value 0.054 implies that is 5.4% of the variation in renowned journal subscription and the
remaining 94.6% can be explained by other variables. 0.83 value of S signifies the precision
level of the model.
Table 4.4.18: ANOVA analysis of renowned journal subscription appreciated by
doctors
ANOVAa
Model Sum of
Squares Df
Mean
Square F Sig.
1 Regression 38.228 1 38.228 55.103 .000b
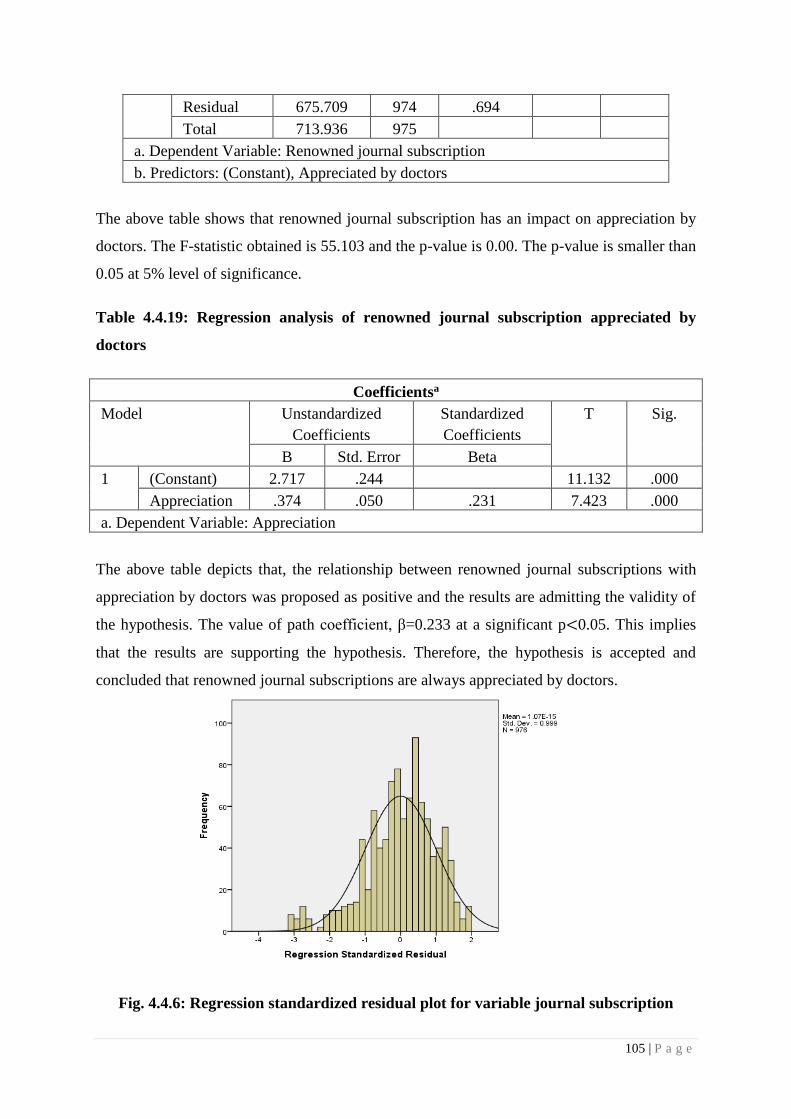
105 | P a g e
Residual 675.709 974 .694
Total 713.936 975
a. Dependent Variable: Renowned journal subscription
b. Predictors: (Constant), Appreciated by doctors
The above table shows that renowned journal subscription has an impact on appreciation by
doctors. The F-statistic obtained is 55.103 and the p-value is 0.00. The p-value is smaller than
0.05 at 5% level of significance.
Table 4.4.19: Regression analysis of renowned journal subscription appreciated by
doctors
Coefficientsa
Model Unstandardized
Coefficients
Standardized
Coefficients
T Sig.
B Std. Error Beta
1 (Constant) 2.717 .244 11.132 .000
Appreciation .374 .050 .231 7.423 .000
a. Dependent Variable: Appreciation
The above table depicts that, the relationship between renowned journal subscriptions with
appreciation by doctors was proposed as positive and the results are admitting the validity of
the hypothesis. The value of path coefficient, β=0.233 at a significant p<0.05. This implies
that the results are supporting the hypothesis. Therefore, the hypothesis is accepted and
concluded that renowned journal subscriptions are always appreciated by doctors.
Fig. 4.4.6: Regression standardized residual plot for variable journal subscription

106 | P a g e
Hypothesis 8: Better the sampling camp / Diagnostic camp at doctor’s clinic, higher the
prescription support of doctor.
Regression analysis was applied for testing the above hypothesis.
Table 4.4.20: Model summary of sampling camp / diagnostic camp at doctor’s clinic,
higher the prescription support of doctor
Model Summary
Model R R
Square
Adjusted R
Square
Std. Error
of the
Estimate
1 .045a .002 .001 .49388
a. Predictors: (Constant), Sampling camp / diagnostic camp
R2 value 0.002 implies that is 0.2% of the variation in sampling camp / diagnostic camp at
doctor’s clinic and remaining 99.8% can be explained by other variables. The ideal value of S
to signify the accuracy of the model is below 2.5, here the value of S is 0.49, which confirms
the precession level of the model.
Table 4.4.21: ANOVA analysis of sampling camp / diagnostic camp at doctor’s clinic,
higher the prescription support of doctor
ANOVAa
Model Sum of
Squares Df
Mean
Square F Sig.
1 Regression .489 1 .489 2.003 .157b
Residual 237.578 974 .244
Total 238.066 975
a. Dependent Variable: Prescription support of doctor
b. Predictors: (Constant), Sampling camp / diagnostic camp
The above table shows that sampling camp / diagnostic camp at doctor’s clinic does not have
an impact on prescription support of doctor. The F-statistic obtained is 2.003 and the p-value
is 0.157. The p-value is greater than 0.05 at 5% level of significance.
Table 4.4.22: Regression analysis of sampling camp / diagnostic camp at doctor’s clinic,
higher the prescription support of doctor

107 | P a g e
Coefficientsa
Model Unstandardized
Coefficients Standardized
Coefficients t Sig.
B Std.
Error Beta
1 (Constant) 4.482 .279 16.045 .000
Appreciation -.074 .052 .045 -1.429 .153
a. Dependent Variable: Prescription support of doctor
The above table depicts that, the relationship between sampling camp / diagnostic camp at
doctor’s clinic and prescription support of doctor was proposed as weak and positive and the
results are not admitting the validity of hypothesis. The value of path coefficient, β=0.045 at a
significant p<0.05. This implies that the results are not supporting the hypothesis. Therefore,
hypothesis is rejected and concluded that sampling camp / diagnostic camp at doctor’s clinic
does not impact on prescription support of doctor.
Fig. 4.4.7: Regression standardized residual plot for variable medical camps
Hypothesis 9: Corporate social activity improves the corporate image in doctor’s mind
Regression analysis was applied for testing the above hypothesis.

108 | P a g e
Table 4.4.23: Model summary of corporate social activity improves the corporate image
in doctor’s mind
Model Summary
Model R R
Square
Adjusted R
Square
Std. Error of
the estimate
1 .064a .004 .003 .80122
a. Predictors: (Constant), Corporate social activity
R2 value 0.004 implies that is 0.4% of the variation incorporates social activity and the
remaining 99.6% can be explained by other variables. S value of 0.80 confirms the accuracy
of model.
Table 4.4.24: ANOVA analysis of corporate social activity improves the corporate
image in doctor’s mind
ANOVAa
Model Sum of
Squares df
Mean
Square F Sig.
1 Regression 2.539 1 2.539 3.955 .047b
Residual 625.902 975 .642
Total 628.441 976
a. Dependent Variable: Corporate image in doctor’s mind
b. Predictors: (Constant), Corporate social activity
The above table shows that corporate social activity improves the corporate image in doctor’s
& patient’s mind. The F-statistic obtained is 3.955 and the p-value is 0.047. The p-value is
smaller than 0.05 at 5% level of significance.
Table 4.4.25: Regression analysis of corporate social activity improves the corporate
image in doctor’s & patient’s mind
Coefficientsa
Model
Unstandardized
Coefficients
Standardized
Coefficients T Sig.
B Std.
Error Beta
1 (Constant) 3.766 .112 33.603 .000
Corporate image -.059 .030 .064 -1.989 .047
a. Dependent Variable: Corporate image in doctor’s mind
The above table depicts that, relationship between corporate social activities with the corporate

109 | P a g e
image in doctor’s mind was proposed as positive and the results are admitting the validity of
hypothesis. The value of path coefficient, β=0.064 at a significant p<0.05. This implies that
the results are supporting the hypothesis. Therefore, hypothesis is accepted and concluded that
corporate social activity improves the corporate image in doctor’s minds.
Fig. 4.4.8: Regression standardized residual plot for variable corporate image
Hypothesis 10: Doctor’s preference goes to brand which provides better patient
education.
Regression analysis was applied for testing the above hypothesis.
Table 4.4.26: Model summary of doctor’s preference goes to brand which provides
better patient education
Model Summary
Model R R
Square
Adjusted
R Square
Std. Error of
the Estimate
1 .097a .009 .008 .62528
a. Predictors: (Constant), Patient education
R2 value 0.009 implies that is 0.9% of the variation in doctor’s preference and the remaining
99.1% can be explained by other variables. 0.62 value of S, confirms the accuracy of the model.

110 | P a g e
Table 4.4.27: ANOVA analysis of doctor’s preference goes to brand which provides
better patient education
ANOVAa
Model Sum of
Squares df
Mean
Square F Sig.
1 Regression 3.632 1 3.632 9.288 .002b
Residual 380.810 974 .391
Total 384.442 975
a. Dependent Variable: Doctor preference of brand
b. Predictors: (Constant), Patient education
The above table shows that doctor’s preference goes to brand which provides better patient
education. The F-statistic obtained is 9.288 and the p-value is 0.002. The p-value is smaller
than 0.05 at 5% level of significance.
Table 4.4.28: Regression analysis of doctor’s preference goes to brand which provides
better patient education
Coefficientsa
Model
Unstandardized
Coefficients
Standardized
Coefficients t Sig.
B Std.
Error Beta
1 (Constant) 4.906 .107 45.80 .000
Patient
education -.079 .026 .097 -3.048 .002
a. Dependent Variable: Doctor preference of brand
The above table depicts that, the relationship between doctor’s preference with brand which
provides better patient education was proposed as positive and the results are admitting the
validity of hypothesis. The value of path coefficient, β=0.097 at a significant p<0.05. This
implies that the results are supporting the hypothesis. Therefore, hypothesis is accepted and
concluded that doctor’s preference goes to brand which provides better patient education.
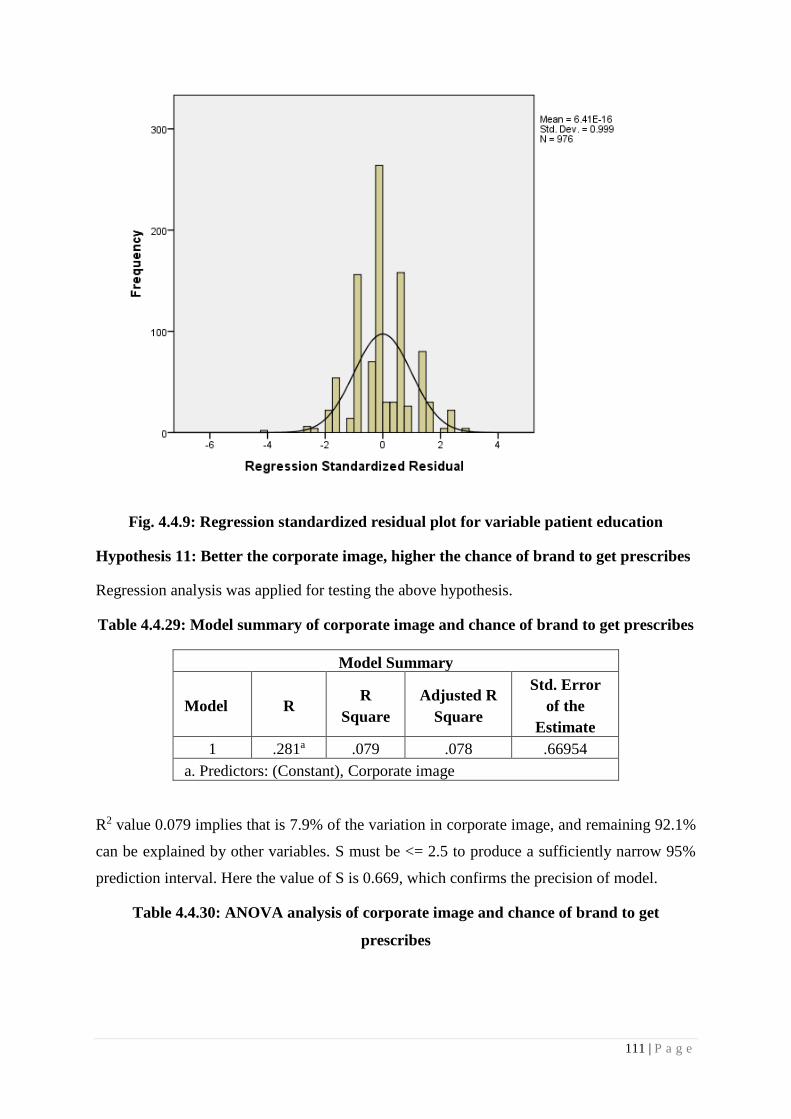
111 | P a g e
Fig. 4.4.9: Regression standardized residual plot for variable patient education
Hypothesis 11: Better the corporate image, higher the chance of brand to get prescribes
Regression analysis was applied for testing the above hypothesis.
Table 4.4.29: Model summary of corporate image and chance of brand to get prescribes
Model Summary
Model R R
Square
Adjusted R
Square
Std. Error
of the
Estimate
1 .281a .079 .078 .66954
a. Predictors: (Constant), Corporate image
R2 value 0.079 implies that is 7.9% of the variation in corporate image, and remaining 92.1%
can be explained by other variables. S must be <= 2.5 to produce a sufficiently narrow 95%
prediction interval. Here the value of S is 0.669, which confirms the precision of model.
Table 4.4.30: ANOVA analysis of corporate image and chance of brand to get
prescribes

112 | P a g e
ANOVAa
Model Sum of
Squares df
Mean
Square F Sig.
1 Regression 37.321 1 37.321 83.252 .000b
Residual 436.635 974 .448
Total 473.956 975
a. Dependent Variable: Chance of brand to get prescribes
b. Predictors: (Constant), Corporate image
The above table shows that doctor’s preference goes to brand which provides better patient
education. The F-statistic obtained is 83.252 and the p-value is 0.000. The p-value is smaller
than 0.05 at 5% level of significance.
Table 4.4.31: Regression analysis of corporate image and chance of brand to get
prescribes
Coefficientsa
Model
Unstandardized
Coefficients
Standardized
Coefficients t Sig.
B Std.
Error
Beta
1 (Constant) 2.647 .163 16.245 .000
Chance of
brand to get
prescribes
.281 .031 .281 9.124 .000
a. Dependent Variable: Chance of brand to get prescribes
The above table depicts that, relationship between the corporate image with a chance of brand
to get prescribes was proposed as positive and the results are admitting the validity of
hypothesis. The value of path coefficient, β=0.281 at a significant p<0.05. This implies that
the results are supporting the hypothesis. Therefore, hypothesis is accepted and concluded that
the better the corporate image, the higher the chance of the brand to get prescribes.
Hypothesis 12: Representative with good personal attire impacts a better company’s
image in doctor’s mind.
Regression analysis was applied for testing the above hypothesis.
Table 4.4.32: Model summary of good personal attire and a better company’s image in
doctor’s mind

113 | P a g e
Model Summary
Model R R
Square
Adjusted
R Square
Std. Error
of the
Estimate
1 .120a .014 .013 .60892
a. Predictors: (Constant), Good personal attire
R2 value 0.014 implies that is 1.4% of the variation in personal attire, and remaining 98.6% can
be explained by other variables. S must be <= 2.5 to produce a sufficiently narrow 95%
prediction interval. Here the value of S is 0.608, which confirms the precision of model.
Table 4.4.33: ANOVA analysis of good personal attire and a better company’s image in
doctor’s mind
ANOVAa
Model Sum of
Squares df
Mean
Square F Sig.
1 Regression 5.240 1 5.240 14.132 .000b
Residual 361.144 974 .371
Total 366.384 975
a. Dependent Variable: Company’s image in doctor’s mind
b. Predictors: (Constant), Good personal attire
The above table shows that good personal attire impacts on better company image in doctor’s
mind. The F-statistic obtained is 14.132 and the p-value is 0.000. The p-value is smaller than
0.05 at 5% level of significance.
Table 4.4.34: Regression analysis of good personal attire and a better company’s image
in doctor’s mind
Coefficientsa
Model
Unstandardized
Coefficients
Standardized
Coefficients T Sig.
B Std.
Error Beta
1 (Constant) 5.757 .095 60.771 .000
Company’s image in
doctor’s mind .092 .024 .120 -3.759 .000
a. Dependent Variable: Company’s image in doctor’s mind
The above table depicts that, the relationship between good personal attire with better company
image in doctor’s mind was proposed as positive and the results are admitting the validity of

114 | P a g e
the hypothesis. The value of path coefficient, β=0.12 at a significant p<0.05. This implies that
the results are supporting the hypothesis. Therefore, the hypothesis is accepted and concluded
that representative with good personal attire impacts a better company’s image in doctor’s
mind.
Fig. 4.4.10: Regression standardized residual plot for variable personal attire
Hypothesis 13: Digital marketing helps to get doctor’s attention towards the brand.
Table 4.4.35: Model summary of digital marketing and doctor’s attention towards the
brand
Model Summary
Model R R
Square
Adjusted
R Square
Std. Error
of the
Estimate
1 .998a .996 .996 .04270
a. Predictors: (Constant), Digital marketing
R2 value 0.996 implies that is 99.6% of the variation in digital marketing, and remaining 0.4%
can be explained by other variables. S value of 0.042 signify the accuracy of model.
Table 4.4.36: ANOVA analysis of digital marketing and doctor’s attention towards the
brand
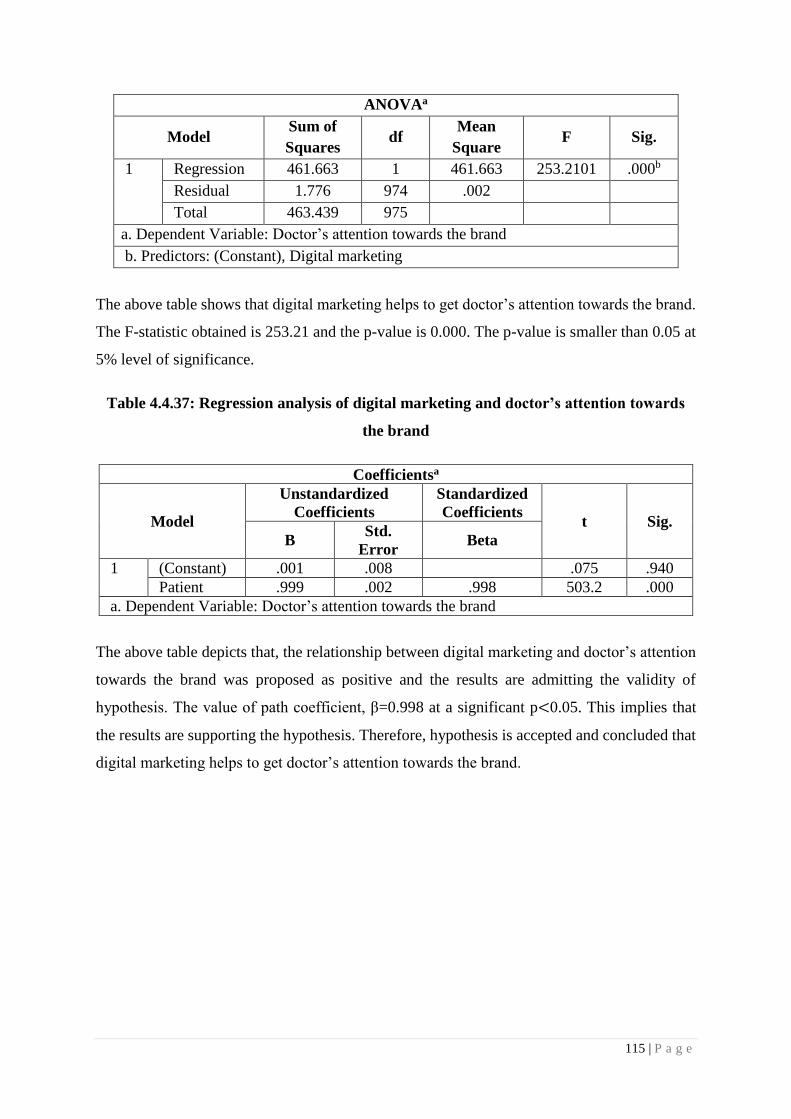
115 | P a g e
ANOVAa
Model Sum of
Squares df
Mean
Square F Sig.
1 Regression 461.663 1 461.663 253.2101 .000b
Residual 1.776 974 .002
Total 463.439 975
a. Dependent Variable: Doctor’s attention towards the brand
b. Predictors: (Constant), Digital marketing
The above table shows that digital marketing helps to get doctor’s attention towards the brand.
The F-statistic obtained is 253.21 and the p-value is 0.000. The p-value is smaller than 0.05 at
5% level of significance.
Table 4.4.37: Regression analysis of digital marketing and doctor’s attention towards
the brand
Coefficientsa
Model
Unstandardized
Coefficients
Standardized
Coefficients t Sig.
B Std.
Error Beta
1 (Constant) .001 .008 .075 .940
Patient .999 .002 .998 503.2 .000
a. Dependent Variable: Doctor’s attention towards the brand
The above table depicts that, the relationship between digital marketing and doctor’s attention
towards the brand was proposed as positive and the results are admitting the validity of
hypothesis. The value of path coefficient, β=0.998 at a significant p<0.05. This implies that
the results are supporting the hypothesis. Therefore, hypothesis is accepted and concluded that
digital marketing helps to get doctor’s attention towards the brand.

116 | P a g e
Fig. 4.4.11: Regression standardized residual plot for variable digital marketing
Hypothesis 14: Higher the reminders to the doctor of Brand, the greater the chance to get
prescription support from doctor.
To test the above hypothesis, a regression test was applied.
Table 4.4.38: Model summary of reminders to the doctor of Brand and chance to get
prescription support from a doctor
Model Summary
Model R R
Square
Adjusted R
Square
Std. Error
of the
Estimate
1 .332a .110 .108 1.00439
a. Predictors: (Constant), Reminders to the doctor of brand
R2 value 0.110 implies that is 11% of the variation in reminders to the doctor of brand and the
remaining 89% can be explained by other variables. S must be <= 2.5 to produce a sufficiently
narrow 95% prediction interval. Here the value of S is 1.00, which confirms the precision of
the model.

117 | P a g e
Table 4.4.39: ANOVA analysis of reminders to the doctor of brand and chance to get
prescription support from doctor
ANOVAa
Model Sum of
Squares df
Mean
Square F Sig.
1 Regression 43.149 1 43.149 101.55 .000b
Residual 413.834 974 .425
Total 456.984 975
a. Dependent Variable: Prescription support from doctor
b. Predictors: (Constant), Reminders to the doctor of brand
The above table shows that higher the reminders to the doctor of brand, greater the chance to
get prescription support from doctor. The F-statistic obtained is 101.55 and the p-value is 0.000.
The p-value is smaller than 0.05 at 5% level of significance.
Table 4.4.40: Regression analysis of reminders to the doctor of brand and chance to get
prescription support from doctor
Coefficientsa
Model
Unstandardized
Coefficients
Standardized
Coefficients t Sig.
B Std.
Error Beta
1 (Constant) 2.661 .078 34.030 .000
Prescription
support
from doctor
.203 .020 .307 10.077 .000
a. Dependent Variable: Prescription support from doctor
The above table depicts that, relationship between reminders to the doctor of brand and the
chance to get prescription support from doctor was proposed as positive and the results are
admitting the validity of hypothesis. The value of path coefficient, β=0.307 at a significant
p<0.05. This implies that the results are supporting the hypothesis. Therefore, hypothesis is
accepted and concluded that higher the reminders to the doctor of brand, greater the chance to
get prescription support from doctor.
Hypothesis 15: Doctor’s always appreciate a representative with good product
knowledge.

118 | P a g e
To test the above hypothesis, regression test was applied.
Table 4.4.41: Model summary of doctor’s always appreciate a representative with good
product knowledge
Model Summary
Model R R
Square
Adjusted
R Square
Std. Error of
the Estimate
1 .347a .121 .120 .58453
a. Predictors: (Constant), MR’s good product knowledge
R2 value 0.121 implies that is 12.1% of the variation in doctor’s and remaining 87.9% can be
explained by other variables. S must be <= 2.5 to produce a sufficiently narrow 95% prediction
interval. Here the value of S is 0.58, which confirms the precision of model.
Table 4.4.42: ANOVA analysis of doctor’s always appreciate a representative with good
product knowledge
ANOVAa
Model Sum of
Squares df
Mean
Square F Sig.
1 Regression 45.630 1 45.630 133.54 .000b
Residual 332.796 974 .342
Total 378.426 975
a. Dependent Variable: MR’s good product knowledge
b. Predictors: (Constant), Doctor’s appreciation
The above table shows that doctor’s always appreciated a representative with good product
knowledge. The F-statistic obtained is 133.54 and the p-value is 0.000. The p-value is smaller
than 0.05 at 5% level of significance.
Table 4.4.43: Regression analysis of doctor’s always appreciate a representative with
good product knowledge
Coefficientsa
Model
Unstandardized
Coefficients
Standardized
Coefficients t Sig.
B Std.
Error Beta
1 (Constant) 3.774 .123 30.596 .000
Product .262 .023 .347 11.556 .000

119 | P a g e
a. Dependent Variable: Doctor’s appreciation
The above table depicts that, the relationship between doctor’s always appreciate and good
product knowledge was proposed as positive and the results are admitting the validity of
hypothesis. The value of path coefficient, β=0.347 at a significant p<0.05. This implies that
the results are supporting the hypothesis. Therefore, hypothesis is accepted and concluded that
doctor’s always appreciated a representative with good product knowledge.
Fig.4.4.12: Regression standardized residual plot for variable MR’s product knowledge
Hypothesis 16: Pharmaceutical companies are good in customer relationship
management.
To test the above hypothesis, a regression test was applied.
Table 4.4.44: Model summary of pharmaceutical companies are good in customer
relationship management
Model Summary
Model R R
Square
Adjusted
R Square
Std. Error
of the
Estimate
1 .213a .045 .045 .55994
a. Predictors: (Constant), Pharmaceutical company’s CRM

120 | P a g e
R2 value 0.045 implies that is 4.5% of the variation in pharmaceutical companies and the
remaining 95.5% can be explained by other variables. S value is 0.55 which confirms the
accuracy of the model.
Table 4.4.45: ANOVA analysis of pharmaceutical companies are good in customer
relationship management
ANOVAa
Model Sum of
Squares df
Mean
Square F Sig.
1 Regression 14.554 1 14.554 46.418 .000b
Residual 305.380 974 .314
Total 319.933 975
a. Dependent Variable: Doctor’s appreciation and support
b. Predictors: (Constant), Pharmaceutical company’s CRM
The above table shows that pharmaceutical companies are good in customer relationship
management. The F-statistic obtained is 46.418 and the p-value is 0.000. The p-value is smaller
than 0.05 at 5% level of significance.
Table 4.4.46: Regression analysis of pharmaceutical companies are good in customer
relationship management
Coefficientsa
Model Unstandardized
Coefficients
Standardized
Coefficients t Sig.
B Std.
Error Beta
1
(Constant) 5.064 .130 39.024 .000
Customer
relationship
management
.160 .023 .213 6.813 .000
a. Dependent Variable: Doctor’s appreciation and support
The above table depicts that, relationship between doctor’s prescription behavior and
pharmaceutical company’s customer relationship management was proposed as positive and
the results are admitting the validity of hypothesis. The value of path coefficient, β=0.213 at a
significant p<0.05. This implies that the results are supporting the hypothesis. Therefore,
hypothesis is accepted and concluded that pharmaceutical companies are good at customer
relationship management.

121 | P a g e
Fig. 4.4.13: Regression standardized residual plot for variable CRM
After analyzing individual hypothesis, now it’s time to check the overall impact of
pharmaceutical promotional tools on doctor’s prescription behavior.
Hypothesis: Pharmaceutical promotional tools help to get prescription support from
doctor
To test the above hypothesis, a regression test was applied.
Table 4.4.47: Model summary of pharmaceutical promotional tools helps to get
prescription support from doctor
Model Summaryb
Model R R
Square
Adjusted R
Square
Std. Error of
the Estimate
(S)
1 .376a .141 .141 .21871
a. Predictors: (Constant),: Pharmaceutical promotional tools
b. Dependent Variable: support from doctor
R2 value 0.141 implies that is 14.1% of the variation in pharmaceutical companies and the
remaining 85.9% can be explained by other variables. S must be <= 2.5 to produce a sufficiently

122 | P a g e
narrow 95% prediction interval. Here the value of S is 0.22, which confirms the precision of
model.
Table 4.4.48: ANOVA analysis of pharmaceutical promotional tools helps to get
prescription support from doctor
ANOVAa
Model Sum of
Squares
df Mean
Square
F Sig.
1 Regression 7.782 1 7.782 162.672 .000b
Residual 47.214 987 .048
Total 54.995 988
a. Dependent Variable: Support from doctor
b. Predictors: (Constant), Pharmaceutical promotional tools
The above table shows that pharmaceutical companies are good at customer relationship
management. The F-statistic obtained is 162.67 and the p-value is 0.000. The p-value is smaller
than 0.05 at 5% level of significance.
Table 4.4.49: Regression analysis of pharmaceutical promotional tools helps to get
prescription support from doctor
Coefficientsa
Model Unstandardized
Coefficients
Standardiz
ed
Coefficient
s
t Sig.
B Std.
Error
Beta
1 (Constant) 3.011 .116 25.930 .000
Promotional .300 .024 .376 12.754 .000
a. Dependent Variable: Support from doctor
The above table depicts that, the relationship between pharmaceutical promotional tools and
doctor’s prescription behavior was proposed as positive and the results are admitting the
validity of hypothesis. The value of path coefficient, β=0.376 at a significant p<0.05. This
implies that the results are supporting the hypothesis. Therefore, hypothesis is accepted and

123 | P a g e
concluded that pharmaceutical promotional tools have an impact on doctor’s prescription
behavior.
Fig. 4.4.14: Regression standardized residual plot for variable pharmaceutical
promotional tools
Summary of hypothesis
Data analysis confirms that out of 16, 12 hypotheses are accepted and 4 are rejected. It shows
that variables or promotional tools like Detailing of Medical Representative, Sampling,
Continues Medical Education, Journal Subscription, Corporate Social Responsibility, Patient
Education, Corporate Image, Personal Attire of MR, Digital marketing, Literature and
Reminders, Medical Representative’s Knowledge & Customer Relationship Management
positively impacts on doctor’s prescription behavior. While variables or promotional tools like
Promotional Pricing, Product demonstration, Sponsorship & Medical Camp don’t have any
impact in attracting prescriptions from doctors. The final hypothesis was accepted, which
confirms the positive correlation between pharmaceutical promotional tools and doctor’s
prescription behavior.

124 | P a g e
Table 4.4.50: Summary of hypothesis
Sr. No Variable Hypothesis Status
1
Detailing of
Medical
Representative
Better the detailing and promotion in front of doctor, better
the prescription support from doctor Accepted
2 Promotional
Pricing
Lower the price of the medicine, greater the chance to get
prescribe Rejected
3 Sampling More number of trial packs to doctor, higher the chance to
get prescription support from doctor Accepted
4
Continues
Medical
Education
Continues medical education does the impact of
prescription habit of doctor Accepted
5 Product
demonstration
A good demonstration of brand, improves the chance of
brand recall at a time of prescribing medicine Rejected
6 Sponsorship Sponsorship makes doctor loyal towards the sponsored
brand Rejected
7 Journal
Subscription
Renowned journal subscription always appreciated by
doctors Accepted
8 Medical Camp Better the sampling camp / Diagnostic camp at doctor’s
clinic, higher the prescription support of doctor Rejected
9
Corporate
Social
Responsibility
Corporate social activity improves the corporate image in
doctor’s mind Accepted
10 Patient
Education
Doctor’s preference goes to brand which provides better
patient education Accepted
11 Corporate
Image
Better the corporate image, higher the chance of brand to
get prescribes Accepted
12 Personal Attire
of MR
A representative with good personal attire impacts a better
company’s image in doctor’s mind Accepted
13 Digital
marketing
Digital marketing helps to get doctor’s attention towards
the brand Accepted
14 Literatures and
Reminders
Higher the reminders to the doctor of Brand, greater the
chance to get prescription support from doctor Accepted
15
Medical
Representative’s
Knowledge
Doctor’s always appreciated a representative with good
product knowledge Accepted
16
Customer
Relationship
Management
Pharmaceutical companies are good in customer
relationship management Accepted

125 | P a g e
CHAPTER – V
FINDINGS, CONCLUSION, AND FUTURE
SCOPE
Chapter Contents:
5.1 Finding in context of objective
5.2 Conclusion and future scope

126 | P a g e
5.1 Finding in context of objective
Pharmaceutical marketing is more kind of personal marketing, unlike FMCG which enables
pharmaceutical companies to measure proper return on every investment. To measure the
return on investment (ROI) of an advertisement in FMCG is not possible, whereas
pharmaceutical companies can measure ROI of even every visit of the medical representative
to doctors. The major objective of the companies is to get the maximum return on investment
in terms of prescription from the invested doctors. But pharmaceutical companies are always
in dilemma regarding their investments in the doctors; which investment gives maximum ROI
is the key area of concentration for pharmaceutical companies. The current study tried to satisfy
the need of the industry by identifying the promotional tools which impact prescription
behavior at most.
After putting up the results and discussion of the results concerning past relevant studies, this
section of the report summarizes the major findings concerning objectives. The study has been
conducted on three aspects. The first objective is to study the current marketing trend in the
Indian pharmaceutical industry, the second is to identify the different marketing tactics used
by pharmaceuticals for product marketing and the third is to analyze the influence of
pharmaceutical marketing tactics on healthcare practitioner’s prescription habits/behavior.
By analyzing secondary data, we can conclude the first objective of studying the current trend
in the pharmaceutical industry. Biopharmaceuticals are the next generation of pharmaceuticals.
As currently, we are dependent on conventional therapies and formulation, the future of
pharmaceuticals is of Biopharmaceuticals. Digital therapies are another aspect of the next
generation. IT technology developers also partner with pharmaceutical firms to support their
respective abilities in designing novel treatment strategies. Machine learning and artificial
intelligence add value to their benefits and usage in the pharmaceutical industry. Astounding
and previously unimagined AI applications continue to emerge on the pharmaceuticals
landscape on a seemingly daily basis. 3600 Patient engagement is the next level in
pharmaceutical marketing. Pharmaceutical companies hiring patient advocacy leaders to
provide the best patient care in major diseases like Cancer, Alzheimer's, and many more. The
collaboration of technology and science will open a new horizon in the healthcare &
pharmaceutical segment for the benefit of the patients. The Indian pharmaceutical market is
majorly driven by customer services, gifts, and doctor engagement programs. The global

127 | P a g e
pharmaceutical sector is moving towards scientific & technology-driven promotion and
reduces the burden on such short-duration promotional tactics like gifts and customer services.
Industries are now moving from customer satisfaction to customer delight concept & the
pharmaceutical industry depends merely on high-level professionals i.e. doctors. To oblige
doctors, just satisfaction is not enough, companies should try to delight their customers to get
maximum return in terms of prescription.
The literature review also provides information about the different tools used by drug
companies to greet physicians. The second objective of the study is to identify the various
promotional tools used by the company & with extensive secondary data analysis, the
researcher had identified 16 various marketing tactics used by the pharmaceutical companies,
which named as Medical representative detailing, Corporate Social activity, Promotional
pricing, Patient Education Program, Sampling, Corporate image, Continues Medical
Education, Personal attire of company representative, Product demonstration, Digital
marketing by pharmaceutical companies, Sponsorship, Literatures and reminders of
pharmaceutical companies, Journal subscription, Medical representative’s Knowledge,
Medical camp & Customer Relationship Management of Pharmaceutical companies. The
structured questionnaire was designed with the above promotional tools to recognize their
influence on physician’s prescription habits, which was the 3rd aim of the research. The analysis
of data offers the following finding and interpretations.
A medical representative’s detailing is personal selling, which comes under the category of
direct marketing. Medical representatives detail the brand, discuss the scientific points &
resolve the doctor’s query with the help of visual aid to convince the doctor, and start
prescribing his/her brand. The finding of this study confirms, by providing them, to the point
information about a brand with scientific backed up, a medical representative can convince the
doctor to prescribe promoted brands. 88% of doctors from the study agreed that pharmaceutical
companies should trained medical representatives properly about the detailing of brand and
product knowledge. Pharmaceuticals can invest in training of medical representatives to
improve their scientific & product knowledge to have a better discussion with doctors, which
ultimately helps doctors to recollect brand while writing prescriptions.
Continuous Medical Education (CME) is a platform for the medical fraternity to sharpen
their competence by getting knowledge regarding the novel, upcoming, and emerging areas of
their arena. The data shows the positive correlation between continuing medical education and

128 | P a g e
doctor’s prescribing behavior. 91% of doctors agreed that CME helps to improve their
scientific knowledge and change prescribing behavior. Continuing medical education provides
a platform for the doctors to learn about the new molecule, new usage of a drug, or new
indication from expect of the fraternity. CME allows the organizer company for brand exposure
to doctors by venue branding. Pharmaceutical companies can take mindshare of doctors by
arranging CMEs for a particular brand that turns into a prescription. Pharmaceuticals has also
come up with a new concept in CME called webcast; whereby international or national key
opinion leaders (KOL) address the audience through digital media. The physical presence at
the CME venue is not required in webcast and participants can learn the skills from KOL at
his/her place.
Medical Camp is a part of patient care initiatives, many pharmaceutical companies organized
free health check-up camps or medical camps; where they offer free diagnostic tests and trial
therapy to the patients. The finding rejected the hypothesis of better the sampling camp /
diagnostic camp at the doctor’s clinic, better the chance to get a prescription of doctors. Medical
camps with doctors may help medical representatives to build equity with doctors but it may
not help to convert the same into the prescription. Data shows that doctors usually prescribe
the brand which is there in their mind and not of the camp-sponsored company. In the long
term, it may show a beneficial impact, but in the short term, data don’t show a positive
correlation between medical camp and doctor’s prescription support.
Customer Relationship Management (CRM) is where the company interacts with its
customer, increasing customer lifetime value to the company and increasing customer
satisfaction. The finding supports the positive correlation between customer relationship
management by the pharmaceutical company and its impact on doctor’s prescription behavior.
98% of doctors agreed that pharmaceutical companies are good at customer relationship
management and it leads to a change in prescribing habits. Though pharmaceutical activates
are customer-centric, today’s era is of customized activities. Pharmaceutical companies try to
identify the need for individual doctors and prepared a customized program to satisfy the
individual’s needs. As already we have discussed that today’s time is of customer delight rather
than customer satisfaction. To delight customers and get maximum return on investment from
individual doctors, pharmaceutical companies need to identify the scientific need of individual
doctors and try to satisfy them within the allowable limits by UCPMP guidelines.
Promotional Pricing is a topic of controversy. Many authors cited that a low price strategy is

129 | P a g e
generally not successful as doctors do not usually know the prices of medicinal products both
relative and absolute. Drug pricing sensitivity is typically second concerning product
effectiveness problems and patient conditions [101] [100] [102]. Some authors are in favor of
promotional pricing as well. The data from the current study conclude that price lowering may
not lead to prescription support. The hypothesis, lower the price of the medicine, the greater
the chance to get prescribe was rejected. Promotional pricing may have greater acceptance in
tender/institute business, but not in the prescription-based sale. The data confirms that
promotional pricing as a major or only strategy to drive brand in the market may not be the
right move for pharmaceutical companies.
Sampling can benefit by providing immediate treatment, determining the initial effect or
adverse effects, and adjusting prescription doses before the patient completes full prescription
treatment, bearing the cost of patients with medications for abstinence, and allowing patients
appropriate medications use. The hypothesis, more the number of trial packs to the doctor, the
higher the chance to get prescription support from the doctor was accepted and confirms the
positive correlation of sampling on physician’s prescription support. 75% of doctors are agreed
that sampling affects their prescription behavior where 23% of doctors were neutral; only 2%
of doctors deny the correlation between sampling and prescription behavior. One of the reasons
for the positive impact of sampling is maybe it reminds the doctor about the brand as it is
available on the doctor’s desk. So, for the newly launched brand / unestablished brand, huge
sampling may be the right proposition for pharmaceutical companies.
Product demonstration ensures proper usage of pharmaceutical products, which is very
necessary to get the desired action. Proper usage demonstration to the patient is required by the
doctor or nursing staff or pharmaceutical medical representative to ensure the right usage of
products for the desired action. The data is not in favor of the hypothesis, a good demonstration
of the product improves the chance of brand recall at a time of prescribing medicine. The
majority of the time doctors are not allocating sufficient time to a medical representative for
product demonstration, maybe because they are familiar with it or not intended to try any
unconventional product. Product demonstration may be effective for novel therapies, but the
usage of such products seems to be very limited.
Sponsorship can be through various means such as sponsorship at conferences of drug
companies, sponsorship for travel expenses at conventions, in the form of high-value personal
gifts or medical devices, or sponsorship for personal visits to physicians. Pay for the clinical

130 | P a g e
trial is another sponsorship promotion tool. Several studies have confirmed the positive effect
of sponsorship on the prescription habit of the clinician. The current finding denies such
correlation as hypothesis sponsorship makes doctors loyal towards the sponsored brand, got
rejected. Doctors don’t want to open up about their relationship with pharmaceutical companies
in front of 3rd person (researcher), which could be the major reason behind it. As per the
UCPMP guideline, to accept any gift or material from pharmaceutical companies valued more
than 1000 is inappropriate. If any doctor is caught for having any such relationship with a
pharmaceutical company, he/she may lose his/her medical practice license. Due to such fear,
doctors had not filled the actual answer but provided an ideal response. Thus, as per the result
from the current study, sponsorship doesn’t make doctors loyal to the sponsored brand. In other
words, we can also conclude that if any other company provides better sponsorship, the doctor
may start writing their brand. So, to make the doctor loyal to the brand, sponsorship is not an
ideal promotional tool.
Journal Subscription is the way to provide authenticated research and trends in the medical
segment to the doctors. Many pharmaceutical companies provide the full-text article which
relates to their promoted brand or provides a full journal subscription to greet doctors. The data
analysis confirms the positive correlation between journal subscription and its influence on
clinician’s prescription habits. 68% of doctors agreed on the latest scientific update by journals
may lead to a change in prescription habits. By providing supporting articles about
brand/molecule from reputed journals always attract the attention of doctor & influence them
to prescribe a particular molecule or brand. Pharmaceutical companies can share journal
articles for their newly launched molecule / fixed-dose combination, also to highlight the new
usage / supporting data of old molecule in front of doctors. It increases the confidence of
prescribers about brand/molecule to prescribe a particular brand/molecule.
Corporate Social Responsibility helps companies to develop a positive social profile. Many
researchers have studied the views of physicians about CSR and the allegiance of
pharmaceutical organizations. They concluded that social behavior, playing a major role in his
choice of medicines by doctors and pharmaceutical firms. The hypothesis, corporate social
activity improves the corporate image in doctors & the patient’s mind was accepted and a
positive correlation between CSR and corporate image has been established. Effective CSR
activity and media coverage help to register a positive corporate image in the doctor’s mind.
The pharmaceutical companies can encash this opportunity with subsequent in-clinic

131 | P a g e
marketing activity with the help of their medical representatives.
A patient education program by pharmaceutical companies helps to create awareness among
patients about disease conditions to increase the flow of patients in the promoted therapy area.
A meta-analysis [130] of 47 studies confirmed the positive relationship between patient
education programs by pharmaceutical companies and clinician’s prescription habits. The
finding of the current study supports the hypothesis of a doctor’s preference goes to a brand
that provides better patient education. A good patient education program helps to create
awareness amongst patients regarding when to visit a doctor or how to maintain quality of life
with a disease condition. It helps to increase the trust of patients in doctors while fighting
disease conditions which can attract more patients by word of mouth publicity. In a turn of
such patient education support, pharmaceutical companies can win the prescription of doctors.
Corporate Image is the credibility of the organization that can, given its performance
concerning main competitors, be described as the collective understanding of the past activities
of the organization, and its expectations regarding its future actions. Companies earn a
reputation for their year’s long relationship with customers. The current data shows that the
better the corporate image, the higher the chance of the brand to get prescribes. Corporate
image and change to get prescriptions from doctors are having a positive correlation. Another
advantage of a better corporate image is the reception that medical representatives get in the
doctor’s chamber. Medical representatives get more time to discuss brand/science if the doctor
respects the company. So to get faster acceptance from doctors about brands, companies should
also work to build a better corporate image in the doctor’s mind.
Personal Attire of Medical Representative should be formal and attractive; it’s very
important to build a positive first impression about medical representatives and thereby
company in doctor's minds. Empirical proof shows that dress can directly influence the intent.
Literature review shows that properly dressed service contact workers contribute to higher
customer satisfaction and a higher desire to buy service from the company than unsuitable
customer service contact personnel. The hypothesis, representative with good personal attire
impacts a better company’s image in the doctor’s mind was accepted and confirms the positive
correlation between the personal attire of medical representative and its positive impact on the
doctor’s mind. 69% of doctors agreed-upon personal attire of medical representatives attract
their attention. Formal dress with tie and properly groomed face are the identity of a medical
representative in India. Doctors readily accept MR in this attire. Multinational pharmaceutical

132 | P a g e
companies and top-ranked Indian pharmaceutical companies have specially trained their
medical representative on the personal grooming part, as they don’t want to ruin the reputation
that they have built-in doctor’s minds with medical representative’s behavior or attire. Small
and mid-cap pharmaceutical companies should also work on the personal attire of MR if they
want to get good reception from doctors as well as ready acceptance about their brands.
Digital marketing is often of great importance in the creation of brand value and raising equity.
Digital marketing replaces conventional marketing approaches in the pharmaceutical industry.
This is primarily because of quick contact with end-users, less time-consuming effort, and a lot
of economic efficiencies. Studies found that WhatsApp, insightful websites, and smartphone
apps are the most commonly accessible digital marketing platforms. The current study also
supports the fact that digital marketing helps to get doctor's & patient’s attention towards the
brand. With the help of digital marketing as well as conventional marketing pharmaceutical
companies can approach 3600 marketing. They can highlight their brand in front of doctors in
all possible manners. Digital marketing also helps pharmaceutical companies to engage
patients through their scientific patient education program or patient club via website or
application or any social media platform. They can also engage patients by offering customized
patient education platforms to doctors. In turn, they can ask for prescription support from
doctors. Branding on different doctor-centric websites or social media platforms is another
digital tool for pharmaceutical companies. So by increasing the availability of the digital
platform, pharmaceutical companies can register their brand in a doctor’s mind which turns
into prescription later on.
Literature and Reminders are the tools from pharmaceutical companies to their medical
representative to discuss the science behind their brand as well as spend more time in-clinic.
Pharmaceutical literature having much information starting from a range of products/brands,
new articles/information about molecule/brand, a case study from renowned key opinion leader
(KOL), guidelines, infographics, clinical trials, or any other useful information about the brand.
Literature surveys indicate that drug literature and brand records affect the prescribing actions
of the doctor but at different rates, which rely largely on the relationship and personalities of
the doctor's medical representatives. The analysis of the current study suggests, higher the
reminders to the doctor of the brand, the greater the chance to get prescription support from a
doctor. Every pharmaceutical company spends thousands of rupees every month on literature
and brand reminders but only a few of them have an innovative and informative quality that

133 | P a g e
can attract the attention of doctors. Rather than preparing only front-back literature or
reminders, companies should focus on innovative and more informative literature.
Medical Representative’s Knowledge is very essential for better and effective in-clinic
discussion. Medical representatives are the crucial arm of pharmaceutical marketing; as he/she
should be equipped with medical knowledge to have a fruitful discussion with doctors. The
majority of pharmaceutical companies are having a dedicated training department to a trained
medical representative about the therapy area, disease conditions, and benefits of brands to
have a better in-clinic discussion. Poor scientific knowledge about brand or therapy area not
only spoils the image of medical representative but also creates a question mark on the
reputation of the pharmaceutical company in the clinician’s focus. The majority of MNCs and
top-ranked Indian pharmaceutical companies restricted entry of medical representatives with
B.Pharma or at least science graduation. The current finding also supports the hypothesis,
doctors always appreciate a representative with good product knowledge. 90% of doctors
agreed on medical representative knowledge is very much important to influence their
prescribing behavior. A medical representative with sound product knowledge can convince
doctors easily for their brand compared to the MR with poor medical / product knowledge.
Pharmaceuticals can invest in training of medical representatives to improve their scientific &
product knowledge to have a better discussion with doctors, which ultimately helps doctors to
recollect brand while writing prescriptions.
5.2 Conclusion and future scope
Every effort made by the pharmaceutical companies to sell their product endorsed by the
doctors plays a crucial role in the widespread acceptance and use of medicines in the public
domain. The relationship between doctors and drug companies should be ethical in practice
and commercially competitive so that medicines reach in right time at the right place, at the
right price. Pharmaceutical promotion is a vast area of research the present study tries to
understand the impact of pharmaceutical promotion tools only from a doctor’s perspective.
This study concludes that pharmaceutical marketing tactics have a positive influence on the
clinician’s prescription habit/behavior in varying proportions. Both patients oriented, as well
as practice-oriented pharmaceutical activities, can influence the prescriber's behavior. The
activities like sampling, CME, journal subscription, CSR, patient education program, digital
marketing, literature, and reminders & CMR help pharmaceutical companies to get more

134 | P a g e
prescriptions from targeted doctors. Few employee excellence activities like the detailing of a
medical representative, product demonstration, personal attire of medical representative, and
knowledge of salesforce are also helping pharmaceutical organizations to affect the prescribing
habits of doctors. The long-term relationship with doctors as well as market presence helps
companies to build their equity in the doctor’s mind & which can be encashed further with the
help of various promotional activities. The effectiveness of activity and ROI also depends on
the rapport among MRs and physicians. Few promotional tools like promotional pricing,
product demonstration, sponsorship & medical camp don’t show their effectiveness in
influencing prescription behavior in the present study but some researchers had proven them
effective. The pharmaceutical industry should plan them as per the market move and demand.
Government rules and regulation helps to encourage the ethical promotion of drugs by
pharmaceutical companies; in India, Uniform Code of Pharmaceuticals Marketing Practices
(UCPMP) is already established but the strict monitoring and implantation are required to
restrict the unethical practices to make drugs even more economical to end-users.
Scope for further research can be narrated as below:
1. In the present study, there is only the effect of drug promotion tools on prescription-
based drugs; Therefore another study may be conducted to study the effect of promotion
tools on non-prescription or OTC (over the counter) drugs.
2. In the present study demographic factors of respondents such as age, gender, religion,
socioeconomic status, etc. were not taken into consideration. These factors may affect
the prescribing habit of the clinician. A separate study can be conducted to identify the
impact of promotional tools on doctor’s prescribing habits concerning demographic
factors.
3. This research study was conducted in metro cities of Gujarat; In addition, research can
be done to cover Tier II and Tier III cities in the state of Gujarat or the whole of India.
4. The present study is concerned only with the influence of the promotional tools of the
companies on the practice of allopathic medicine by companies; In addition, another
study may be conducted to evaluate the impact of promotional tools on Ayurvedic,
homeopathic or Unani physicians.

135 | P a g e
5. This study will have only the effect of changing the marketing scenario on selected
shareholders, i.e. physicians. In addition, the new research will help other stakeholders
such as chemists, stockiest, MRs, managers like ABMs / RBMs & patients to
understand their expectations and study the impact of drug promotion tools on them.
6. The impact of drug promotion tools on prescription-based medicine alone was assessed
in this study; In addition, a study can be conducted to determine the effectiveness of
non-prescription (OTC) drugs or herbal promotion tools in Ayurvedic, Homeopathic or
Unani medicine.
With the findings and conclusions listed above, presenting them both in light of the limitations
and scope of the study, current research would like to rethink its assumptions with a good hope
of influencing factors not included in the current study in the context of further research. Ending
the concept is not the end of the research, but it is the beginning of future research.

136 | P a g e
REFERENCES
Chapter Contents:
List of References
List of Publications

137 | P a g e
List of References
[1] M. Z. JOHN L. MCGUIRE, HORST HASSKARL, GERD BODE, INGRID
KLINGMANN, “Pharmaceuticals, General Survey,” Ullman’s Encycl. Ind. Chem., vol.
26, pp. 503–519, 2012.
[2] H. P. Rang, The development of the pharmaceutical industry, Second Edi. Elsevier Ltd,
2012.
[3] A. W. Jones, “Early drug discovery and the rise of pharmaceutical chemistry,” Drug
Test. Anal., vol. 3, no. 6, pp. 337–344, 2011.
[4] M. S. LESNEY, “The Pharmaceutical Century - 1800 to 1919,” ACS Publications.
[Online]. Available: http://www3.uah.es/farmamol/The Pharmaceutical
Century/Ch1.html. [Accessed: 12-Oct-2019].
[5] R. I. Aminov, “A brief history of the antibiotic era: Lessons learned and challenges for
the future,” Front. Microbiol., vol. 1, no. DEC, pp. 1–7, 2010.
[6] Alex Philippidis, “Top 15 Best Selling Drugs of 2018,” Mary Ann Liebert, Inc.
Publishers, 2019. [Online]. Available: https://www.genengnews.com/a-lists/top-15-
best-selling-drugs-of-2018/. [Accessed: 13-Oct-2019].
[7] N. S. Terblanche, “New pharmaceutical product development: Barriers to overcome and
opportunities to exploit,” J. Commer. Biotechnol., vol. 14, no. 3, pp. 201–212, 2008.
[8] Deloitte, “2019 Global life sciences outlook | Focus and transform | Accelerating change
in life sciences,” 2019.
[9] A. Lervolino and L. Urquhart, “World preview 2017, outlook to 2022,”
EvaluatePharma, no. June, pp. 1–48, 2017.
[10] IQVIA, “The Global Use of Medicine in 2019 and Outlook to 2023,” IQVIA Inst. Hum.
Data Sci., no. January, p. 75, 2019.
[11] EvaluatePharma, “World Preview 2018, Outlook to 2024,” no. 11th Edition,June, p. 47,
2018.
[12] Giuliana Miglierini, “Emerging trends for the pharmaceutical market - Pharma World,”
2019. [Online]. Available: https://www.pharmaworldmagazine.com/emerging-trends-

138 | P a g e
for-the-pharmaceutical-market/. [Accessed: 24-Nov-2019].
[13] T. Ueda, “Next-generation optimized biotherapeutics — A review and preclinical
study,” Biochim. Biophys. Acta - Proteins Proteomics, vol. 1844, no. 11, pp. 2053–2057,
Nov. 2014.
[14] S. Makin, “The emerging world of digital therapeutics,” Nature, vol. 573, no. 7775, pp.
S106–S109, 2019.
[15] T. A. J. Houweling et al., “Socioeconomic Inequalities in Neglected Tropical Diseases:
A Systematic Review,” PLoS Neglected Tropical Diseases. 2016.
[16] A. WNS Perspective, “Top 5 Trends in the Insurance Industry,” 2018.
[17] “Google Heallth Blog.” [Online]. Available: https://blog.google/technology/health/.
[Accessed: 21-Dec-2019].
[18] “Amazon Healthcare: Is Haven A Game Changer? | Built In.” [Online]. Available:
https://builtin.com/healthcare-technology/amazon-healthcare. [Accessed: 21-Dec-
2019].
[19] R. Pandya and E. Cosgun, “Accelerate precision medicine with Microsoft Genomics,”
2018.
[20] N. Chandran and S. K. Brahmachari, “Policy as a driver of economic growth: Historical
evidence from the Indian pharmaceutical industry,” Curr. Sci., vol. 114, no. 6, pp. 1181–
1193, 2018.
[21] P. M. A. T. Oct, “AIOCD AWACS Indian Pharmaceutical Industry Overview OCT 19,”
2019.
[22] IBEF, “Pharmaceuticals IBEF Report June 2019,” 2019.
[23] S. Kulkarni, “A BRIEF REPORT ON PHARMACEUTICAL INDUSTRY IN INDIA
July, 2015,” ASA Assoc. LLP, 2015.
[24] G. Akhtar, “Indian Pharmaceutical Industry: An Overview,” IOSR J. Humanit. Soc. Sci.,
vol. 13, no. 3, pp. 51–66, 2013.
[25] V. Galani, “Choice of Better Medicine in India: Branded Vs Generic Medicine,” Pharm.
Pharmacol. Int. J., vol. 5, no. 3, pp. 124–125, 2017.

139 | P a g e
[26] IQVIA, “IMS TSA TOP CORPORATES & TOP 300 BRANDS REPORT.” 2019.
[27] IQVIA, “Top 50 Companies Sales Audit,” 2019.
[28] V. Aggarwal, “The Indian Pharmaceutical Industry,” Aust. Prescr., vol. 20, no. SUPPL.
1, pp. 51–52, 1997.
[29] WHO, “Diabetes epidemic in India,” World Heal. Organ., 2015.
[30] IQVIA, “IMS Industry Highlights.” 2019.
[31] N. Kasliwal and I. Bansal, “Influence of pharmaceutical promotional tools on doctors’
prescribing behaviour: An exploratory study,” Indian J. Mark., vol. 43, no. 8, pp. 23–
34, 2013.
[32] IMS, “IPM Company Standing IMS Rx Dec’19.” 2019.
[33] A. V. Jayapala Reddy and B. Madhusdhan Rao, “Opportunities and challenges for indian
pharmaceutical companies in overseas markets and need of digital tools for sustainable
success,” Indian J. Pharm. Educ. Res., vol. 51, no. 2, pp. 226–238, 2017.
[34] Government of India and Ministry of Health and Family We, “Ayushman Bharat –
Pradhan Mantri Jan AarogyaYojana (AB-PMJAY) to be launched by Prime Minister
Shri Narendra Modi in Ranchi, Jharkahnd on September 23, 2018.” [Online]. Available:
https://pib.gov.in/newsite/PrintRelease.aspx?relid=183624. [Accessed: 12-Jan-2020].
[35] P. A. Scolnik, “mAbs: A business perspective,” MAbs, vol. 1, no. 2, pp. 179–184, 2009.
[36] MHRD India, “AISHE 2017-18,” 2018.
[37] T. Ray, “Nine Major Challenges Constraining Indian Pharmaceutical Industry From
Taking a Quantum Leap | PILMAN,” 2012. [Online]. Available:
http://www.tapanray.in/nine-major-challenges-constraining-indian-pharmaceutical-
industry-from-taking-a-quantum-leap/. [Accessed: 12-Jan-2020].
[38] M. of H. & F. W. (MOHFW) Government of India, “National List of Essential
Medicines of India,” 2011.
[39] Department of Pharmaceuticals, “DPCO/NPPA | Department of Pharmaceuticals,”
2015. [Online]. Available: https://pharmaceuticals.gov.in/dpconppa. [Accessed: 15-Jan-
2020].

140 | P a g e
[40] D. Patel, “Pharma Sector: 80 per cent APIs via Chinese imports despite similar making
costs,” The Indian Express, 2018. [Online]. Available:
https://indianexpress.com/article/business/business-others/pharma-sector-80-per-cent-
apis-via-chinese-imports-despite-similar-making-costs-5222951/. [Accessed: 15-Jan-
2020].
[41] Government of India, “Uniform Code for Pharmaceuticals Marketing Practices.” pp. 1–
14, 2014.
[42] Nishith Desai Associates, “Uniform Code for Pharmaceutical Marketing Practices
(UCPMP) Decoded,” no. November, p. 1, 2017.
[43] P. M. M. Preeti Patil, Virendra Siddharam Ligade, “Evaluation of Scientific
Advertisements of Pharmaceutical Products as Per UCPMP Guidelines,” J. Young
Pharm., vol. 9, no. 1, pp. 118–121, 2017.
[44] A. Kelkar and E. Langer, “Pharmaceutical distribution in India,” BioPharm Int., vol. 21,
no. 10, pp. 24–30, 2008.
[45] R. Jeffery, “Pharmaceuticals distribution system in India,” Tracing Pharm. South Asia,
2007.
[46] A. N. Hall, “Pharmacist : OTC Marketing Parameters And Challenges.”
[47] G. of I. NPPA, “What margins are allowed to a Wholesaler and a Retailer as per DPCO,
1995 ? | Official Website of National Pharmaceutical Pricing Authority , Ministry of
Chemicals & Fertilizers, Government of India,” 1995. [Online]. Available:
http://www.nppaindia.nic.in/en/faq/what-margins-are-allowed-to-a-wholesaler-and-a-
retailer-as-per-dpco-1995/. [Accessed: 17-Jan-2020].
[48] W. John, “Distribution Structure in Indian Pharmaceutical Industry : Significance of
Customer Relationship Management ( CRM ) and Distributor Relationships,” vol. 1, no.
3, pp. 55–66, 2016.
[49] N. B. Agarwal and M. Karwa, Pharmaceutical Regulations in India. Elsevier Inc., 2017.
[50] OECD, “OECD Health Statistics 2019 Definitions , Sources and Methods,” Organ.
Econ. Co-operation Dev., pp. 65–74, 2021.
[51] W. A. Kukull and M. Ganguli, “Generalizability: The trees, the forest, and the low-

141 | P a g e
hanging fruit,” Neurology, vol. 78, no. 23, pp. 1886–1891, 2012.
[52] J. E. Calfee, “The Role of Marketing in Pharmaceutical Research and Development,”
Pharmacoeconomics, vol. 20, no. Supplement 3, pp. 77–85, 2002.
[53] S. Vasiljev and D. Ph, “Pharmaceutical Market(ing): Theory and Reality,” Theory
Methodol. Pract., vol. 6, no. 02, pp. 85–91, 2010.
[54] I. V. Pestun and Z. M. Mnushko, “Methodology of modern marketing management
pharmaceutical organizations,” Upr. Ekon. ta zabezpečennâ âkostì v Farm., no. 4(52),
pp. 60–66, Nov. 2017.
[55] M. Alowi and Y. Kani, “Promotion of Prescription Drugs and Its Impact on Physician’s
Choice Behavior,” J. Pharm. Care Heal. Syst., vol. 06, no. 01, 2019.
[56] L. M. Schwartz and S. Woloshin, “Medical Marketing in the United States, 1997-2016,”
JAMA - Journal of the American Medical Association, vol. 321, no. 1. pp. 80–96, 2019.
[57] E. De Laat, F. Windmeijer, and R. Douven, How does pharmaceutical marketing
influence doctors’ prescribing behaviour? 2002.
[58] C. B. Sufrin and J. S. Ross, “Pharmaceutical industry marketing: Understanding its
impact on women’s health,” Obstetrical and Gynecological Survey, vol. 63, no. 9. pp.
585–596, 2008.
[59] G. C. Alexander, J. Zhang, and A. Basu, “Characteristics of patients receiving
pharmaceutical samples and association between sample receipt and out-of-pocket
prescription costs,” Medical Care, vol. 46, no. 4. pp. 394–402, 2008.
[60] S. A. Mogull and D. Balzhiser, “Pharmaceutical companies are writing the script for
health consumerism,” Communication Design Quarterly Review, vol. 3, no. 4. pp. 35–
49, 2015.
[61] F. L. Kritz, “Check out drug coupons, then check bottom line,” Los Angeles Times, 2007.
[Online]. Available: https://www.latimes.com/archives/la-xpm-2007-dec-03-he-
coupons3-story.html. [Accessed: 28-Mar-2020].
[62] C. M. Gulhati, “Marketing of medicines in India,” BMJ, vol. 328, no. 7443, pp. 778–
779, Apr. 2004.
[63] H. N. Joshi, “Analysis of the Indian pharmaceutical industry with emphasis on

142 | P a g e
opportunities in 2005,” Pharm. Technol. North Am., vol. 27, no. 1, pp. 74–94, 2003.
[64] A. Sen Gupta, “Economic Reforms, Health and Pharmaceuticals: Conferring Legitimacy
to the Market,” Economic and Political Weekly, vol. 31. Economic and Political Weekly,
pp. 3135–3145.
[65] N. Lalitha, “Indian Pharmaceutical Industry in WTO Regime: A SWOT Analysis,”
Economic and Political Weekly, vol. 37. Economic and Political Weekly, pp. 3542–
3555.
[66] B. Wierenga, Handbook of Marketing Decision Models, vol. 9, no. 2005. 2008.
[67] R. by: T. S. Bodenheimer, “Review: PRESCRIPTIONS FOR DEATH: REVIEW OF
SILVERMAN, ET AL., ‘PRESCRIPTIONS FOR DEATH: THE DRUGGING OF THE
THIRD WORLD,’” Crime and Social Justice. Social Justice/Global Options, pp. 108–
111, 1983.
[68] S. Timimi, “Global Pharmaceuticals: Ethics, Markets, Practices. Edited by Adriana
Petryna, Andrew Lakoff & Arthur Kleinman. Duke University Press. 2006. 312 pp.
£14.95 (pb). ISBN 082233741X,” Br. J. Psychiatry, vol. 190, no. 4, pp. 367–367, Apr.
2007.
[69] R. by: Edberg and Ark, “Drugging the Poor: Legal and Illegal Drugs and Social
Inequality,” Anthropological Quarterly, vol. 82. The George Washington University
Institute for Ethnographic Research, pp. 337–341.
[70] A. S. Adams, S. B. Soumerai, and D. Ross-Degnan, “The Case for a Medicare Drug
Coverage Benefit: A Critical Review of the Empirical Evidence,” Annu. Rev. Public
Health, vol. 22, no. 1, pp. 49–61, May 2001.
[71] A. Banerjee, A. Das, and G. Chakrabarti, “Tricks and truths of drug marketing: An
insider’s experience of an Indian pharmaceutical organization,” Asian Journal of Social
Science, vol. 39, no. 5. pp. 581–604, 2011.
[72] S. Sandip and K. Vishavadia, “Impact Study on Various Promotional Practices Done by
Pharmaceutical Companies on Doctor ’ s Prescription Behavior : What Does Literature
Say ?,” Int. J. Econ. Res., vol. 14, no. 14, pp. 15–22, 2017.
[73] S. Vancelik, N. E. Beyhun, H. Acemoglu, and O. Calikoglu, “Impact of pharmaceutical
promotion on prescribing decisions of general practitioners in Eastern Turkey,” BMC
143 | P a g e
Public Health, vol. 7, pp. 1–8, 2007.
[74] V. Auruskeviciene, J. Butkeviciene, and L. Salciuviene, “Revisiting the role of
traditional, electronic and mobile-based communication channels in the pharmaceutical
industry of Lithuania,” Eng. Econ., vol. 26, no. 5, pp. 541–550, 2015.
[75] J. Lexchin, “Interactions between physicians and the pharmaceutical industry: what does
the literature say?,” C. Can. Med. Assoc. J. = J. l"Association medicale Can., vol. 149,
no. 10, pp. 1401–1407, 1993.
[76] R. H. Perlis and C. S. Perlis, “Physician payments from industry are associated with
greater medicare Part D prescribing costs,” PLoS One, vol. 11, no. 5, pp. 1–12, 2016.
[77] M. A. Al-Areefi, M. A. Hassali, and M. I. B. M. Ibrahim, “Physicians’ perceptions of
medical representative visits in Yemen: A qualitative study,” BMC Health Serv. Res.,
vol. 13, no. 1, p. 1, 2013.
[78] C. H. B. Ibrahim, Ishak Abubakar Y., “Pharmaceutical Representatives and Prescription
Decisions by Physicians in Saudi Arabia,” J. Mark. Manag., vol. 4, no. 1, pp. 69–79,
2016.
[79] S. Kamal et al., “Perceptions and attitudes of Egyptian health professionals and policy-
makers towards pharmaceutical sales representatives and other promotional activities,”
PLoS One, vol. 10, no. 10, pp. 1–13, 2015.
[80] M. Farooq, R. G. Goel, and M. Goyal, “Effect of Promotional Literature on the
Prescribing Habits of Practitioners,” Int. J. Med. Dent. Sci., vol. 5, no. 1, p. 1104, 2016.
[81] M. Handa, A. Vohra, and V. Srivastava, “Perception of physicians towards
pharmaceutical promotion in India,” J. Med. Mark., vol. 13, no. 2, pp. 82–92, 2013.
[82] S. Shamimulhaq, A. R. Raheem, A. Nawaz, I. Khoso, and P. Vishnu, “Factors
Influencing Prescription Behavior of Physicians,” Pharma Innov. J., vol. 3, no. 5, pp.
30–35, 2014.
[83] U. Arora and G. Taneja, “An Analytical Study of Physicians Behaviour Towards
Marketing of Pharmaceutical Products,” Indian J. Mark., vol. 36, no. 11, 2006.
[84] S. M. Isa and L. K. Kitt, “Influence of corporate social responsibility on loyalty:
Perceptions of medical doctors,” Probl. Perspect. Manag., vol. 13, no. 2, pp. 313–319,

144 | P a g e
2015.
[85] R. K. Srivastava and J. Bodkhe, “Does brand equity play a role on doctors prescribing
behavior in emerging markets?,” Int. J. Healthc. Manag., vol. 0, no. 0, pp. 1–10, 2018.
[86] M. McMullan, “Patients using the Internet to obtain health information: How this affects
the patient-health professional relationship,” Patient Education and Counseling. 2006.
[87] J. Mahlich and B. B. Yurtoglu, “Returns on different types of investment in the global
pharmaceutical industry,” Manag. Decis. Econ., vol. 40, no. 1, pp. 16–36, 2019.
[88] N. R. and N. M., “Influence of pharmaceutical marketing on prescription practices of
physicians,” J. Indian Med. Assoc., vol. 111, no. 1, pp. 47–50, 2013.
[89] A. Dey, U. K. Rai, and A. Chandra, “Pharmaceutical marketing in India: a macroscopic
view,” Conf. South West. …, no. November, 1999.
[90] B. K and F. UK, “Influence of Pharmaceutical Marketing on Prescription Behavior of
Physicians: A Cross-sectional Study in Bangladesh,” J. Account. Mark., vol. 5, no. 2,
pp. 2–5, 2016.
[91] D. A. D. Dr Arun Gadre, “Promotional Practices of the Pharmaceutical Industry and
Implementation Status of Related Regulatory Codes in India,” Support Advocacy Train.
to Heal. Initiat., p. 72, 2019.
[92] R. Singh, “Network connectedness of pharmaceutical sales rep (FLE)-physician dyad
and physician prescription behaviour: A conceptual model,” J. Med. Mark., vol. 8, no.
3, pp. 257–268, 2008.
[93] C. B. Sufrin and J. S. Ross, “Pharmaceutical Industry Marketing: Understanding Its
Impact on Women’s Health,” Obstet. Gynecol. Surv., vol. 63, no. 9, pp. 585–596, Sep.
2008.
[94] G. K. Spurling et al., “Information from pharmaceutical companies and the quality,
quantity, and cost of physicians’ prescribing: A systematic review,” PLoS Med., vol. 7,
no. 10, 2010.
[95] M. M. T. Punchibandara, “The impact of promotional strategies of pharmaceutical
companies on doctor’s recommendation of branded drugs: an empirical study on
pharmaceutical industry in Sri Lanka,” Kelaniya J. Manag., vol. 6, p. 55, 2018.

145 | P a g e
[96] A. A. Naqvi, F. Zehra, N. Khan, R. Ahmad, and K. McGarry, “Interactions and conflicts
of interests between prescribers and medical sales representatives (MSRs) regarding
prescribing and drug promotion practices in Karachi, Pakistan,” Pak. J. Pharm. Sci., vol.
32, no. 2, pp. 687–695, 2019.
[97] P. Bhatt, “Study on Influence of Medical Representative in Conversation of Doctor’s
Prescription in India,” Glob. Journals Online Glob. J. Manag. Bus. Res., vol. 18, no. 3,
2018.
[98] R. R. Ahmed, “Pricing strategies in pharmaceutical marketing,” Pharma Innov., 2014.
[99] B. Jönsson, “Flat or monotonic pricing of pharmaceuticals: practice and consequences,”
Eur. J. Heal. Econ., vol. 2, no. 3, pp. 104–112, Sep. 2001.
[100] J. Lexchin, “Pricing of multiple dosage prescription medications: An analysis of the
Ontario Drug Benefit Formulary,” Health Policy (New. York)., vol. 91, no. 2, pp. 142–
147, Jul. 2009.
[101] R. Cooper, “Major new products: What distinguishes the winners in the chemical
industry?,” J. Prod. Innov. Manag., vol. 10, no. 2, pp. 90–111, Mar. 1993.
[102] F. F. Gönül, F. Carter, E. Petrova, and K. Srinivasan, “Promotion of Prescription Drugs
and Its Impact on Physicians’ Choice Behavior,” J. Mark., vol. 65, no. 3, pp. 79–90, Jul.
2001.
[103] S. Narayanan, R. Desiraju, and P. K. Chintagunta, “Return on Investment Implications
for Pharmaceutical Promotional Expenditures: The Role of Marketing-Mix
Interactions,” J. Mark., vol. 68, no. 4, pp. 90–105, Oct. 2004.
[104] J. A. Rizzo, “Advertising and Competition in the Ethical Pharmaceutical Industry: The
Case of Antihypertensive Drugs,” J. Law Econ., vol. 42, no. 1, pp. 89–116, Apr. 1999.
[105] M. Stros and N. Lee, “Marketing dimensions in the prescription pharmaceutical
industry: a systematic literature review,” J. Strateg. Mark., vol. 23, no. 4, pp. 318–336,
2015.
[106] jessica m skiner and neena s abraham Aanand D Naik, aaron L woofter, “American
journal of managed care,” ajmc, vol. 15, no. 4, pp. 9–15, 2010.
[107] A. De Ferrari, C. Gentille, L. Davalos, L. Huayanay, and G. Malaga, “Attitudes and

146 | P a g e
relationship between physicians and the pharmaceutical industry in a public general
hospital in Lima, Peru,” PLoS One, vol. 9, no. 6, pp. 1–7, 2014.
[108] J. Schramm, M. Andersen, K. Vach, J. Kragstrup, J. P. Kampmann, and J. Søndergaard,
“Promotional methods used by representatives of drug companies: A prospective survey
in general practice,” Scand. J. Prim. Health Care, vol. 25, no. 2, pp. 93–97, 2007.
[109] D. Morelli and M. R. Koenigsberg, “Sample medication dispensing in a residency
practice.,” J. Fam. Pract., vol. 34, no. 1, pp. 42–8, Jan. 1992.
[110] A. F. Shaughnessy and K. K. Bucci, “Drug Samples and Family Practice Residents,”
Ann. Pharmacother., vol. 31, no. 11, pp. 1296–1300, Nov. 1997.
[111] L. D. Chew, T. S. O’Young, T. K. Hazlet, K. A. Bradley, C. Maynard, and D. S. Lessler,
“A physician survey of the effect of drug sample availability on physicians’ behavior,”
J. Gen. Intern. Med., vol. 15, no. 7, pp. 478–483, 2000.
[112] M. Ahmed, R.R., Vveinhardt, J., Streimikiene, D. and Awais, “MEDIATING AND
MARKETING FACTORS INFLUENCE THE PRESCRIPTION BEHAVIOR OF
PHYSICIANS: AN EMPIRICAL INVESTIGATION,” Amfiteatru Econ., vol. 18, no.
February, p. 2016, 2016.
[113] D. Davis, M. A. T. O’Brien, N. Freemantle, F. M. Wolf, P. Mazmanian, and A. Taylor-
Vaisey, “Impact of formal continuing medical education: Do conferences, workshops,
rounds, and other traditional continuing education activities change physician behavior
or health care outcomes?,” Journal of the American Medical Association, vol. 282, no.
9. American Medical Association, pp. 867–874, 01-Sep-1999.
[114] H. Bauchner, L. Simpson, and J. Chessare, “Changing physician behaviour.,” Arch. Dis.
Child., vol. 84, no. 6, pp. 459–62, Jun. 2001.
[115] M. A. Rodwin, “Drug advertising, continuing medical education, and physician
prescribing: A historical review and reform proposal,” J. Law, Med. Ethics, vol. 38, no.
4, pp. 807–815, 2010.
[116] R. Saxena, “REVIEW ON IMPACT OF DIFFERENT FACTOR ’ S ON PHYSICIAN
PRESCRIBING BEHAVIOR,” vol. 2, no. 1, 2018.
[117] I. Black, “Marketing Masterclass — Pharmaceutical marketing strategy: Lessons from
the medical literature,” J. Med. Mark., vol. 5, no. 2, pp. 119–125, Apr. 2005.

147 | P a g e
[118] P. Dumovic and C. de Vries, “A review of pharmaceutical industry-sponsored medical
education: Ten key recommendations for stakeholders,” J. Med. Mark., vol. 4, no. 2, pp.
143–153, Apr. 2004.
[119] S. S.H.A., M. M., A. G., S. J., A. S.A., and Z. A., “Main factors affecting physicians’
prescribing decisions: The Iranian experience,” Iran. J. Pharm. Res., vol. 17, no. 3, pp.
1105–1115, 2018.
[120] G. Taneja, “Influence of Promotional Tools Offered by Pharmaceutical Industry on
Physicians Prescribing Behavior,” SSRN Electron. J., 2012.
[121] S. Shamimulhaq, A. R. Raheem, A. Nawaz, I. Khoso, and P. Vishnu, “Factors
Influencing Prescription Behavior of Physicians,” Pharma Innov. J., vol. 3, no. 5, pp.
30–35, 2014.
[122] M. Alshurideh, B. Al Kurdi, A. Abumari, and S. A. Salloum, “Pharmaceutical
Promotion Tools Effect on Physician's Adoption of Medicine Prescribing:
Evidence from Jordan,” Mod. Appl. Sci., vol. 12, no. 11, p. 210, 2018.
[123] G. Taneja, “Impact of Phar maceutical Industr y Pr omotion Mix Promotion on Doctor
’ s Prescribing Behaviour,” vol. IV, no. 4, pp. 82–95, 2008.
[124] I. M. and I. M. Al-areefi MA, Hassali MA, “Physician perception of medical
representative’s visit in Yemen, a qualitative study.,” pp. 1–8, 2013.
[125] R. A. Bauer and L. H. Wortzel, “Doctor’s Choice: The Physician and his Sources of
Information about Drugs,” J. Mark. Res., vol. 3, no. 1, pp. 40–47, Feb. 1966.
[126] T. Caplow and J. J. Raymond, “Factors Influencing the Selection of Pharmaceutical
Products,” J. Mark., vol. 19, no. 1, pp. 18–23, Jul. 1954.
[127] M. do C. G. Alves and M. M. M. Rodrigues, “Corporate Social Responsibility Revisited,
Redefined,” Calif. Manage. Rev., pp. 1135–1154, 1980.
[128] T. Wu and Y. Kimura, “Case study of corporate social responsibility in Japanese
pharmaceutical companies: A comparison with western firms,” in Emerging Issues in
Global Marketing: A Shifting Paradigm, 2018, pp. 291–309.
[129] Y. Uryuhara, “The impact of corporate social responsibility on doctors’ prescription
intention,” J. Leg. Ethical Regul. Issues, vol. 18, no. 1, pp. 116–129, 2015.

148 | P a g e
[130] G. Kamarudin, J. Penm, B. Chaar, and R. Moles, “Educational interventions to improve
prescribing competency: A systematic review,” BMJ Open, vol. 3, no. 8, 2013.
[131] F. Auton, “The patient as consumer: The advertising of pharmaceuticals directly to
consumers should be allowed and encouraged,” Econ. Aff., vol. 27, no. 2, pp. 64–72,
2007.
[132] V. Pires and G. Trez, “Corporate reputation,” Rev. Gestão, vol. 25, no. 1, pp. 47–64,
Jan. 2018.
[133] K. Harrison, “Why a good corporate reputation is important to your organization,”
Cutting Edge PR, 2013. [Online]. Available: https://cuttingedgepr.com/free-
articles/reputation-trust-stakeholder-relations/good-corporate-reputation-important-
organization/. [Accessed: 05-Apr-2020].
[134] M.-C. Lee, “Explaining and predicting users’ continuance intention toward e-learning:
An extension of the expectation–confirmation model,” Comput. Educ., vol. 54, no. 2,
pp. 506–516, Feb. 2010.
[135] K. Abdul Waheed, M. Jaleel, and M. Laeequddin, “Prescription loyalty behavior of
physicians: An empirical study in India,” Int. J. Pharm. Healthc. Mark., vol. 5, no. 4,
pp. 279–298, 2011.
[136] Y. Ekinci and P. L. Dawes, “Consumer perceptions of frontline service employee
personality traits, interaction quality, and consumer satisfaction,” Serv. Ind. J., vol. 29,
no. 4, pp. 503–521, Apr. 2009.
[137] C. Y. Shao, J. A. Baker, and J. Wagner, “The effects of appropriateness of service
contact personnel dress on customer expectations of service quality and purchase
intention,” J. Bus. Res., vol. 57, no. 10, pp. 1164–1176, Oct. 2004.
[138] N. T. Jacob, “Drug promotion practices: A review,” British Journal of Clinical
Pharmacology, vol. 84, no. 8. pp. 1659–1667, 2018.
[139] R. A.-T. P. Innovation and U. 2014, “Pharmaceutical marketing mix strategy and
physician’s prescription behavior,” Pharma Innov., 2014.
[140] P. K. Padhy and S. C. Patnaik, “Implementation of Right CRM Strategy for
Pharmaceutical Industry,” Delhi Bus. Rev., vol. 9, 2008.

149 | P a g e
[141] R. F. Wright and W. J. Lundstrom, “Physicians ’ perceptions of pharmaceutical sales
representatives : A model for analysing the customer relationship,” Int. J. Med. Mark.,
vol. 4, no. 1, pp. 29–38, 2004.
[142] B. To, T. H. E. Concept, and O. F. P. Marketing, “CRM STRATEGIES ADOPTED BY
THE PHARMACEUTICAL COMPANIES IN INDIA,” 2013.
[143] M. Kumar and P. B. Londhe, “Relevance and impact of digital marketing in Indian
pharmaceutical industry with specific reference to super specialists doctors,” vol. 7, no.
2, pp. 1–7, 2019.
[144] M. Jawaid and S. J. Ahmed, “Pharmaceutical Digital Marketing and Its Impact on
Healthcare Physicians of Pakistan: A National Survey,” Cureus, vol. 10, no. 6, 2018.
[145] R. G. Ravindra Goyal, “A Review Article on Prescription Behavior of Doctors,
Influenced By The Medical Representative In Rajasthan, India,” IOSR J. Bus. Manag.,
vol. 8, no. 1, pp. 56–60, 2013.
[146] G. Taneja, “Impact of Pharmaceutical Industry Promotion Mix on Doctor’s Prescribing
Behaviour,” Asia Pacific Bus. Rev., vol. 4, no. 4, pp. 82–95, 2008.
[147] M. Alowi and Y. Kani, “Impact of Pharmaceutical Companies’ Promotional Tools on
Physicians’ Prescription Patterns: A Systematic Review,” vol. 10, no. 3, 2018.
[148] A. Datta and D. Dave, “Effects of Physician-Directed Pharmaceutical Promotion on
Prescription Behaviors: Longitudinal Evidence,” Cambridge, MA, Nov. 2013.
[149] E. Afi Kayi, R. A. Atinga, and G. A. Ansa, “Informational sources on pharmaceutical
medicines and factors affecting medication prescriptions: Perspectives from Ghanaian
physicians,” J. Med. Mark. Device, Diagnostic Pharm. Mark., vol. 14, no. 4, pp. 176–
181, Nov. 2014.
[150] T. J. Stark and J. Lockyer, “Interactions between physicians and the pharmaceutical
industry: A study into the perceptions of the early career psychiatrist,” ProQuest Diss.
Theses, p. 156, 2014.
[151] M. J. Baker, “Selecting a Research Methodology,” Mark. Rev., vol. 1, no. 3, pp. 373–
397, Sep. 2000.
[152] W. Hair, J. J., Anderson, R., Tatham, R., Black, Multivariate data analysis, 5th ed. NJ,

150 | P a g e
United States: Prentice-Hall, 1998.
[153] John W. Creswell, Educational Research : Planning, Conducting and Evaluating
Quantitative and Qualitative Research, 4th ed. Pearson, 2013.
[154] C.R. Kothari, Research Methodology Methods & Techniques, Second Edi. New Age
International publisher, New Delhi, 2004.
[155] R. Kumar and R. Pal, “India achieves WHO recommended doctor population ratio: A
call for paradigm shift in public health discourse!,” J. Fam. Med. Prim. care, vol. 7, no.
5, pp. 841–844, 2018.
[156] Richard I. Levin; David S. Rubin, Statistics for Management, 7th Editio. Pearson, 1998.
[157] M. Elfil and A. Negida, “Sampling methods in clinical research; an educational review,”
Arch. Acad. Emerg. Med., vol. 7, no. 1, pp. 3–5, 2019.
[158] Tim Bock, “What is Selection Bias?,” displayr, 2021. [Online]. Available:
https://www.displayr.com/what-is-selection-bias/. [Accessed: 03-Sep-2021].
[159] C. L. Costigan and M. J. Cox, “Fathers’ participation in family research: Is there a self-
selection bias?,” J. Fam. Psychol., vol. 15, no. 4, pp. 706–720, 2001.
[160] A. T. Mark Saunders, Philip Lewis, Research Methods for Business Students, Illustrate.
Financial Times/Prentice Hall, 2007, 2007.
[161] J. B. . K. A.-S. Schreiber, Educational Research, 1st Editio. Wiley, 2011.
[162] R. B. Uma Sekaran, Research Methods for Business: A Skill-Building Approach, 6th
Editio. Wiley, 2013.
[163] R. P. Bagozzi and Y. Yi, “On the Use of Structural Equation Models in Experimental
Designs,” J. Mark. Res., vol. 26, no. 3, pp. 271–284, Aug. 1989.
[164] W. Hair, J. J., Anderson, R., Tatham, R., Black, Multivariate data analysis. 2010.
[165] N. K. Malhotra, “Questionnaire Design and Scale Development,” in The Handbook of
Marketing Research, 2455 Teller Road, Thousand Oaks California 91320 United States
of America: SAGE Publications, Inc., pp. 83–94.
[166] L. Stinson, S. Fisher, and S. Kay, “Overview of Data Editing Procedures in Surveys
Administered by the Bureau of Labor Statistics: Procedures and Implications,” … -

151 | P a g e
Assisted Syst. Inf. Comput. Conf. …, 1996.
[167] John Carroll, Human Cognitive Abilities: A Survey of Factor-Analytic Studies, 1st
Editio. Cambridge University Press, 1991.
[168] W. Janssens, K. Wijnen, P. De Pelsmacker, and P. Van Kenhove, Marketing Research
with SPSS, 1st Editio. Prentice Hall, 2008.
[169] A. O. and M. Ellis, “Regression Analysis: How to Interpret S, the Standard Error of the
Regression,” 2014. [Online]. Available: https://blog.minitab.com/blog/adventures-in-
statistics-2/regression-analysis-how-to-interpret-s-the-standard-error-of-the-regression.
[Accessed: 06-Aug-2020].

152 | P a g e
List of Publications
1. S. Sandip and K. Vishavadia, “Impact Study on Various Promotional Practices Done
by Pharmaceutical Companies on Doctor ’ s Prescription Behavior : What Does
Literature Say ?,” Int. J. Econ. Res. (ISSN : 0972-9380), vol. 14, no. 14, pp. 15–22,
2017.
2. Vishavadia Krunal, Solanki Sandip (2020) “Does pharmaceutical promotional tactics
change the prescription habit of doctors?”, Journal of Critical Reviews (ISSN- 2394-
5125), 7 (12), 2980-2992. doi:10.31838/jcr.07.12.453
3. Krunal, Vishavadia; Sandip Solanki; Krishna Murthy Inumula. “Impact study of
various pharmaceutical promotional practices on Indian doctor’s prescription
behavior”, European Journal of Molecular & Clinical Medicine (ISSN: 2515-8260),
vol. 7, no. 8, 2020, pp. 4198–208, https://ejmcm.com/article_6805.html
4. Vishavadia Krunal, Seema Singh, Sandip Solanki (2021). Personal & Professional
Qualities of Medical Representative and Impact on Doctor's Prescribing Behavior.
Universal Journal of Public Health (ISSN: 2331-8880), 9(6), 385 - 391. DOI:
10.13189/ujph.2021.090605

153 | P a g e
APPENDICES
Chapter Contents:
Questionnaire

154 | P a g e
Questionnaire
IMPACT STUDY ON VARIOUS PROMOTIONAL PRACTICES DONE
BY PHARMACEUTICAL COMPANIES ON DOCTOR'S
PRESCRIPTION BEHAVIOR
Explanatory Notes:
Coverage
The survey relates doctors of five different specialties: General Practitioner, Consulting
Physician, Dentist, Pediatrician and Gynecologist.
The Opinion
Questions related to specific activities performed by pharmaceutical companies that affect your
prescription pattern only require your perceptual feedback. Please keep in mind the activities
of the pharmaceutical companies while filling out this questionnaire and read the statements of
the questionnaire and circle the appropriate number against each one. No correct or incorrect
answer or numerical information required. Your opinion is very justifiable.
Some queries may seem similar, but the answer to each of your questions will help us to
scientifically evaluate the response and formulate proper conclusions. Provide your answer
from 1 to 7 whereas 1 indicates strongly disagree & 7 indicates strongly agree.
1. Strongly Disagree
2. Disagree
3. Slightly Disagree
4. Neutral
5. Slightly agree
6. Agree
7. Strongly agree
Privacy and data access
Please ensure that your responses are completely confidential and that the data collected will
only be used for the entire analysis without identifying you as the respondent. Your
participation is voluntary, but we request that you participate for the success of the research.

155 | P a g e
Section I
Kindly furnish the basic information about your self
Q.1. Specialty: __________________________
Q.2. How long you are practicing? _______ Years
Q.3. How many average patients per day? _______
Q.4. Are you entertain activities by pharmaceutical companies?
⃝ Yes ⃝ No (If no, please go directly to section II)
(If yes, kindly answer the questions no. 5)
Q.5. Which kind of activity is more preferred by you?
⃝ Patient oriented ⃝ Practice oriented
Section II
Q.6. To what extent do you agree / disagree with the subsequent statements? "Please keep
detailing of medical representative in your mind while you fill up this questionnaire"
It’s my belief that….
a. Detailing of Medical representative helps
to choose brand.
1 2 3 4 5 6 7
b. Medical representative discuss scientific
points during detailing.
1 2 3 4 5 6 7
c. Medical representative helps to improve
knowledge.
1 2 3 4 5 6 7
d. Medical representatives are properly
trained for detailing.
1 2 3 4 5 6 7
e. Detailing through visual aid is a right
method to discuss brand.
1 2 3 4 5 6 7
Comments (If any):
________________________________________________________________

156 | P a g e
Q.7. To what extent do you agree / disagree with the subsequent statements? "Please keep
promotional pricing of Pharma brand in your mind while you fill up this questionnaire"
I believe that….
a. Promotional price impacted my
prescription habit.
1 2 3 4 5 6 7
b. Promotional price helps my patient to get
medicine economic.
1 2 3 4 5 6 7
c. Brands with lesser price are inferior in
quality.
1 2 3 4 5 6 7
d. It’s only applicable for limited
molecules/ therapies.
1 2 3 4 5 6 7
e. Promotional price are more incline to
injectable.
1 2 3 4 5 6 7
Comments (If any):
________________________________________________________________
Q.8. To what extent do you agree / disagree with the subsequent statements? "Please keep
sampling in your mind while you fill up this questionnaire"
I perceive that ….
a. More number of samples changes
prescription habit.
1 2 3 4 5 6 7
b. Trial packs help to check the effect
of brand.
1 2 3 4 5 6 7
c. Free samples help to serve needy
patients
1 2 3 4 5 6 7
d. Trial packs are more prone to use in
govt. hospitals rather than private
clinics.
1 2 3 4 5 6 7
e. Medical representative should know
how to use samples and what is
1 2 3 4 5 6 7

157 | P a g e
doctor’s need.
Comments (If any):
________________________________________________________________
Q.9. To what extent do you agree / disagree with the subsequent statements? "Please keep
Continues Medical Education in your mind while you fill up this questionnaire"
I believe that ….
a. Scientific CME with good speaker is
really helps to improve knowledge.
1 2 3 4 5 6 7
b. CME with MCI accreditation is only
useful CME
1 2 3 4 5 6 7
c. CME with my interest topic only
attracts me to attend.
1 2 3 4 5 6 7
d. A good CME can change
prescription pattern.
1 2 3 4 5 6 7
e. CME with international speakers is
always better.
1 2 3 4 5 6 7
Comments (If any):
________________________________________________________________
Q.10. To what extent do you agree / disagree with the subsequent statements? "Please keep
demonstration in your mind while you fill up this questionnaire"
I believe that ….
a. Product usage demonstration creates
an impact in brand recall.
1 2 3 4 5 6 7
b. Product demonstration is required
for some brands.
1 2 3 4 5 6 7
c. Product usage demonstration for 1 2 3 4 5 6 7

158 | P a g e
patient / chemist helps my practice.
d. Pharma companies should give
proper training to their field force for
product usage demo.
1 2 3 4 5 6 7
Comments (If any):
________________________________________________________________
Q.11. To what extent do you agree / disagree with the subsequent statements? "Please keep
sponsorship in your mind while you fill up this questionnaire"
It is my opinion that…
a. Sponsorship to me in any way affects
my prescription pattern.
1 2 3 4 5 6 7
b. Sponsorship which helps my patient
is more grace me.
1 2 3 4 5 6 7
c. Sponsorship to conference is good to
attract attention of doctors
1 2 3 4 5 6 7
Comments (If any):
________________________________________________________________
Q.12. To what extent do you agree / disagree with the subsequent statements? "Please keep
Journal Subscription in your mind while you fill up this questionnaire"
It’s my belief that…
a. Renowned journal really helps to
improve my knowledge. I required it.
1 2 3 4 5 6 7
b. I should keep supporting company
which helps me to get international
journals.
1 2 3 4 5 6 7
c. Journals keep me updated with
current trend in health care.
1 2 3 4 5 6 7

159 | P a g e
d. Medical representative has very less
knowledge about articles and journals
1 2 3 4 5 6 7
e. Pharmaceutical companies are the
only source to get renowned
international journals.
1 2 3 4 5 6 7
Comments (If any):
________________________________________________________________
Q.13. To what extent do you agree / disagree with the subsequent statements? "Please keep
medical camp in your mind while you fill up this questionnaire"
I believe that…
a. I appreciate medical camps in my
clinic.
1 2 3 4 5 6 7
b. Free sampling camp helps my
patient and its gain my trust.
1 2 3 4 5 6 7
c. Free diagnostic camp helps to get
more patients to my clinic.
1 2 3 4 5 6 7
d. Free medical camp improves Pharma
company image in front of patient.
1 2 3 4 5 6 7
e. Medical camp at my clinic leads my
prescription support.
1 2 3 4 5 6 7
Comments (If any):
________________________________________________________________
Q.14. To what extent do you agree / disagree with the subsequent statements? "Please keep
Corporate Social activity in your mind while you fill up this questionnaire"
I believe that…
a. Corporate social activities help to
change the corporate image
1 2 3 4 5 6 7
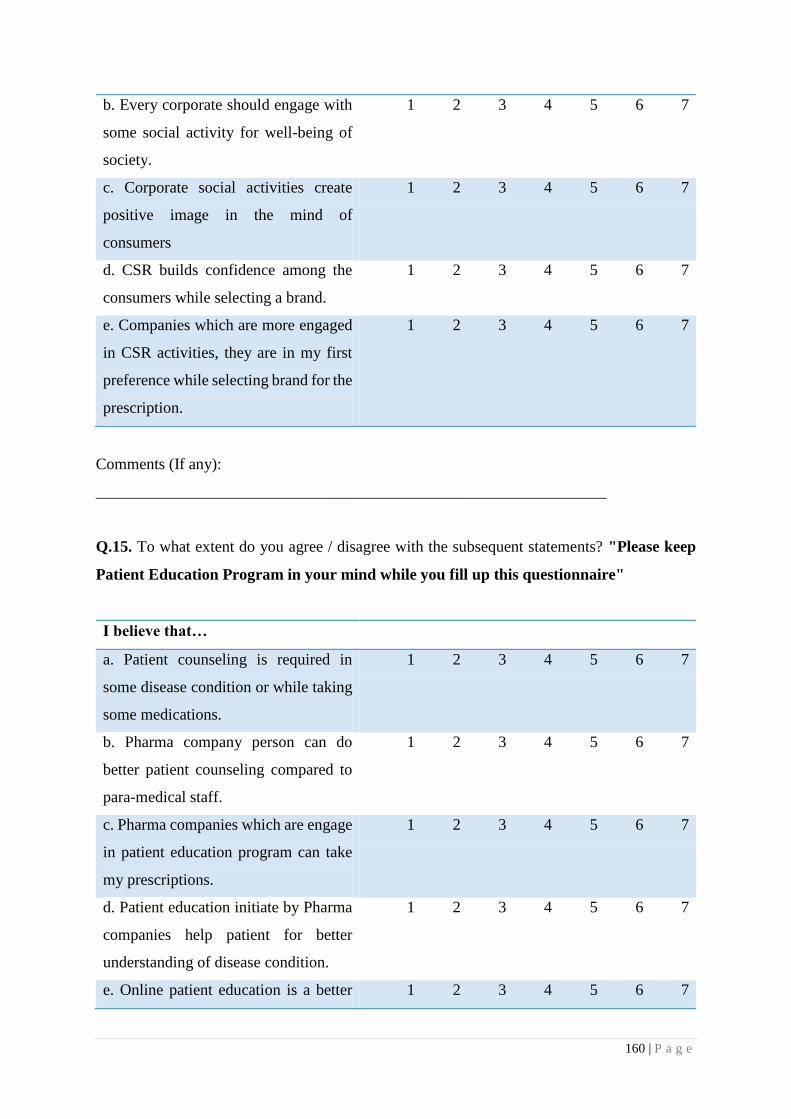
160 | P a g e
b. Every corporate should engage with
some social activity for well-being of
society.
1 2 3 4 5 6 7
c. Corporate social activities create
positive image in the mind of
consumers
1 2 3 4 5 6 7
d. CSR builds confidence among the
consumers while selecting a brand.
1 2 3 4 5 6 7
e. Companies which are more engaged
in CSR activities, they are in my first
preference while selecting brand for the
prescription.
1 2 3 4 5 6 7
Comments (If any):
________________________________________________________________
Q.15. To what extent do you agree / disagree with the subsequent statements? "Please keep
Patient Education Program in your mind while you fill up this questionnaire"
I believe that…
a. Patient counseling is required in
some disease condition or while taking
some medications.
1 2 3 4 5 6 7
b. Pharma company person can do
better patient counseling compared to
para-medical staff.
1 2 3 4 5 6 7
c. Pharma companies which are engage
in patient education program can take
my prescriptions.
1 2 3 4 5 6 7
d. Patient education initiate by Pharma
companies help patient for better
understanding of disease condition.
1 2 3 4 5 6 7
e. Online patient education is a better 1 2 3 4 5 6 7

161 | P a g e
option now days.
Comments (If any):
________________________________________________________________
Q.16. To what extent do you agree / disagree with the subsequent statements? "Please keep
corporate image in your mind while you fill up this questionnaire"
I believe that…
a. I prescribe brands which are from
well-known Pharma house.
1 2 3 4 5 6 7
b. Good & well known Pharma
companies has better quality product.
1 2 3 4 5 6 7
c. Brands from good corporate image
gets faster acceptance.
1 2 3 4 5 6 7
d. It takes years to build good corporate
image.
1 2 3 4 5 6 7
e. Good corporate image builds when it
offers better product and service for the
consumers & customers.
1 2 3 4 5 6 7
Comments (If any):
________________________________________________________________
Q.17. To what extent do you agree / disagree with the subsequent statements? "Please keep
personal attire of company representative in your mind while you fill up this
questionnaire"
I believe that…
a. Representative of MNC’s are
always well dressed and well
disciplined.
1 2 3 4 5 6 7
b. Good attire of company 1 2 3 4 5 6 7

162 | P a g e
representative catches my attention
toward his communication.
c. Well-dressed means educated,
good company and good brands.
1 2 3 4 5 6 7
d. Good attire has impact on by brand
selection for prescription.
1 2 3 4 5 6 7
Comments (If any):
________________________________________________________________
Q.18. To what extent do you agree / disagree with the subsequent statements? "Please keep
digital marketing by Pharma companies in your mind while you fill up this
questionnaire"
I believe that…
a. Pharma product websites are very
much useful for patients to improve
their knowledge.
1 2 3 4 5 6 7
b. Pharmaceutical company’s patient
education applications are useful in
patient’s wellbeing.
1 2 3 4 5 6 7
c. Pharmaceutical industry has very
less scope for digital marketing.
1 2 3 4 5 6 7
d. Pharmaceutical companies itself
very less active towards digital
marketing.
1 2 3 4 5 6 7
Comments (If any):
________________________________________________________________

163 | P a g e
Q.19. To what extent do you agree / disagree with the subsequent statements? "Please keep
Literatures and Reminders of Pharma companies in your mind while you fill up this
questionnaire"
I believe that…
a. Pharma literature helps me to remind
brand.
1 2 3 4 5 6 7
b. Hand written reminders create
positive impact.
1 2 3 4 5 6 7
c. Impact of reminders and literatures
are depends upon the regularity of the
representative.
1 2 3 4 5 6 7
d. Daily reminders help me to recollect
brand while prescribing medication.
1 2 3 4 5 6 7
Comments (If any):
________________________________________________________________
Q.20. To what extent do you agree / disagree with the subsequent statements? "Please keep
Medical Representative’s Knowledge in your mind while you fill up this questionnaire"
I believe that…
a. Doctor’s always appreciate
representative with good scientific
knowledge.
1 2 3 4 5 6 7
b. Because of lack of knowledge, MR
has a fear of scientific discussion with
doctors.
1 2 3 4 5 6 7
c. Medical representative are still
source of knowledge for doctors in
some context.
1 2 3 4 5 6 7
d. Pharmaceutical companies should
give good scientific training to MR for
1 2 3 4 5 6 7

164 | P a g e
discussion with doctors.
Comments (If any):
________________________________________________________________
Q.21. To what extent do you agree / disagree with the subsequent statements? "Please keep
Customer Relationship Management of Pharmaceutical companies in your mind while
you fill up this questionnaire"
I believe that…
a. Pharma Companies are good in
customer relationship management
1 2 3 4 5 6 7
b. I feel good when I get good service
on demand and on time.
1 2 3 4 5 6 7
c. I feel good when I and my patients
get good service from Pharma
company.
1 2 3 4 5 6 7
Comments (If any):
________________________________________________________________
Thank you very much for your valuable time and participation.