The (Hidden) Financial Flows of Terrorist Organizations - IZA ...
Upload
khangminh22Category
view
1download
0
EVIL DONE VULNERABILITY ASSESSMENT: EXAMINING TERRORIST
TARGETS THROUGH SITUATIONAL CRIME PREVENTION
by
Stacy Paton
A Thesis Submitted to the Faculty of
The College for Design and Social Inquiry
in Partial Fulfillment of the Requirements for the Degree of
Master of Science
Florida Atlantic University
Boca Raton, Florida
December 2013


iii
ACKNOWLEDGEMENTS
The author wishes to express her sincere thanks to her family for their support and
encouragement throughout the writing of this manuscript. The author is highly
appreciative and grateful to Dr. Rachel Santos, who guided the student through each step
of the research process. Additionally, the author wishes to thank her colleagues for their
support and motivation throughout the writing process.

iv
ABSTRACT
Author: Stacy Paton
Title: EVIL DONE Vulnerability Assessment: Examining Terrorist
Targets Through Situational Crime Prevention
Institution: Florida Atlantic University
Thesis Advisor: Dr. Rachel Santos
Degree: Master of Science
Year: 2013
Following the events of September 11th, 2001, national attention has been
captivated by terrorism and terrorism prevention. Parallel to this time of increased focus
on terrorism prevention, adequate funding to support new departments or increased
terrorism prevention efforts in existing departments was unattainable. Consequently, a
strong need for prevention strategies that are affordable and highly applicable at the local
level has resulted. Thus, it is the purpose of this study to examine methods of risk
assessment and test the accuracy of such methodologies in order to assist local
organizations in effectively applying limited resources for opportunity reduction at
vulnerable locations based on calculated risks. The primary goal of this thesis is to test
the validity of the EVIL DONE vulnerability assessment and evaluate its ability to
predict the number of fatalities and injured persons resulting from a terrorist attack.

v
EVIL DONE VULNERABILITY ASSESSMENT: EXAMINING TERRORIST
TARGETS THROUGH SITUATIONAL CRIME PREVENTION
TABLES ..................................................................................................................... viii
FIGURES ...................................................................................................................... ix
CHAPTER 1: INTRODUCTION ....................................................................................1
Background ..................................................................................................................1
Problem Statement .......................................................................................................3
Thesis Goal ..................................................................................................................3
Relevance and Significance ..........................................................................................4
Summary .....................................................................................................................5
CHAPTER 2: THEORETICAL FOUNDATIONS AND RESEARCH ............................7
Introduction .................................................................................................................7
Environmental Criminological Theories .......................................................................7
Routine Activities Theory .........................................................................................8
Crime Pattern Theory ............................................................................................. 10
Rational Choice Theory .......................................................................................... 11
Situational Crime Prevention .................................................................................. 13
Terrorism ............................................................................................................... 16
Research on Vulnerability Assessments for Terrorist Attacks ..................................... 31
National Infrastructure Protection Plan ................................................................... 33
Homeland Security – Comprehensive Assessment Model ....................................... 34
Review of Existing Methodologies ............................................................................. 36
Summary ................................................................................................................ 46
Research Questions .................................................................................................... 47
Research Question 1 ............................................................................................... 48
Research Question 2 ............................................................................................... 48
Research Question 3 ............................................................................................... 48

vi
CHAPTER 3: METHODOLOGY OF RISK AND VULNERABILITY
ASSESSMENT .................................................................................................. 50
Introduction ............................................................................................................... 50
Research Design ........................................................................................................ 51
Data Collection .......................................................................................................... 52
Sampling .................................................................................................................... 54
EVIL DONE Vulnerability Assessment Methodology and Coding ............................. 58
Data Analysis Procedures ........................................................................................... 64
Dependent and Independent Variables........................................................................ 65
Analysis Methods Research Question 1 ...................................................................... 67
Analysis Methods Research Question 2 ...................................................................... 69
Analysis Methods Research Question 3 ...................................................................... 70
Summary and Limitations .......................................................................................... 71
CHAPTER 4: DATA ANALYSIS ................................................................................. 74
Descriptive Statistics .................................................................................................. 74
Characteristics of the Terrorist Attacks ................................................................... 75
Correlations ............................................................................................................ 84
Research Question 1................................................................................................... 91
Research Question 2................................................................................................... 92
Hypothesis 2 ........................................................................................................... 92
Multiple Regression Results ................................................................................... 93
Research Question 3................................................................................................... 99
Hypothesis 3 ........................................................................................................... 99
Multiple Regression Results ................................................................................. 100
Summary ................................................................................................................. 104
CHAPTER 5: DISCUSSION, LIMITATIONS, CONCLUSIONS, AND
IMPLICATIONS ............................................................................................. 107
Discussion of the Findings ....................................................................................... 107
Pearson Correlation Discussion ................................................................................ 109
Multiple Regression Analyses Discussion ................................................................ 114
Limitations ............................................................................................................... 120
Future Research ....................................................................................................... 125
Conclusions and Implications for Terrorism Opportunity Reduction ........................ 128

vii
BIBLIOGRAPHY ....................................................................................................... 130
viii
TABLES
Table 1: Frequency of Type of Attack ............................................................................ 75
Table 2: Terrorist Attack Target Type ............................................................................ 76
Table 3: Terrorist Attacks by Year ................................................................................. 77
Table 4: Terrorist Attacks by Country ............................................................................ 78
Table 5: Description of Variable Data ............................................................................ 79
Table 6: Pearson Correlation .......................................................................................... 85
Table 7: Backward Stepwise Regression ........................................................................ 95
Table 8: Backward Stepwise Multivariate Regression Analysis Models 1, 2, 3 .............. 95
Table 9: Backward Stepwise Multivariate Regression Analysis Models 4, 5, 6, 7 .......... 96
Table 10: Forward Stepwise Regression ...................................................................... 101
Table 11: Frontward Stepwise Multivariate Regression Analysis Models 1, 2, 3 .......... 101
Table 12: Frontward Stepwise Multivariate Regression Analysis Models 4, 5, 6, 7 ...... 102

ix
FIGURES
Figure 1: Crime triangle ...................................................................................................9
Figure 2: Double crime triangle .......................................................................................9

1
CHAPTER 1: INTRODUCTION
Background
Historically, a major focus of the government and society has been placed on
public safety and crime prevention at the individual or micro-level; more recently,
however, the focus has been placed upon protecting large clusters of society at the macro-
level. Following the events of September 11th, 2001, national attention has been
captivated by terrorism and terrorism prevention. Between 1970 and 2011, there have
been 104,689 documented cases of terrorism around the world, 2,362 of which occurred
in the United States. These terrorist attacks have resulted in 228,526 fatalities, 299,202
injured persons, and billions of dollars in property damage (Global Terrorism Database,
2012). Parallel to this time of increased focus on terrorism prevention, adequate funding
to support new departments or increased terrorism prevention efforts in existing
departments was unattainable (Leson, 2005). It was, and still is, unrealistic to expect
local, state, or federal authorities to fund additional personnel and equipment in addition
to their daily costly behaviors in order to address the vulnerability of their communities to
terrorist attacks and implicate the necessary measures to decrease opportunities for such
attacks. Consequently, a strong need for prevention strategies that are affordable and
highly applicable at the local level has resulted.
Concurrent with the attention spreading to terrorism prevention, there is a
growing awareness of significant criminology theories that are highly applicable to the

2
emerging crime prevention goal. The primary theory of interest, situational crime
prevention, provides many valuable techniques to preventing terrorist attacks (Clarke,
1983). Situational crime prevention (SCP) is grounded in the theoretical concepts of
routine activities theory (Cohen & Felson, 1979), crime pattern theory (Brantingham &
Brantingham, 1993), and rational choice theory (Clarke & Cornish, 1985) and is the
application of environmental theory into direct crime prevention actions. Rather than
placing emphasis on the offenders or even the victims, SCP allocates emphasis on the
place (i.e., location) of the crime. The goal of SCP is to alter the environment to reduce
the opportunities for criminal acts, and likewise, terrorist attacks (Boba, 2009). However,
as previously mentioned, because of the limitations in government funding and resources,
it is impractical to reduce opportunities for terrorism at all locations around the world.
Thus, it is the purpose of this study to examine methods of risk assessment and test the
accuracy of such methodologies in order to assist local organizations in effectively
siphoning limited resources for opportunity reduction at vulnerable locations based on
calculated risks.
In response to the need to develop a strategy for identifying vulnerable targets for
efficient opportunity reduction, Clarke and Newman (2006) developed the acronym
EVIL DONE, which defines attributes of locations that may make particular locations
more vulnerable to a terrorist attack. Assessing the vulnerability of specific locations
through the factors of EVIL DONE can assist local authorities by emphasizing the places
most vulnerable to attack (Boba, 2009). When the most vulnerable locations are

3
identified, SCP techniques can be more effectively prioritized for terrorism opportunity
reduction.
Problem Statement
As a nation struggling with economic resources, facing a prevalent concern of
terrorism, and seeking effective methods for terrorism prevention despite these
adversities, a comprehensive problem exists in establishing a method for effectively
allocating limited resources to the most vulnerable locations in order to reduce the
opportunities for terrorist attacks. Additionally, because of the limited resources
hindering the capabilities of law enforcement and homeland security at all levels, the
applicability of such methods must be as straightforward as possible in order to be
employed by an average proletarian. Thus, the method for assessing terrorism
vulnerability must be affordable, easily applicable, and efficient at identifying the most
vulnerable targets in order to address the locations most in need of terrorism opportunity
reduction.
Thesis Goal
The marginal goal of this thesis is to discuss the limitations of pre-existing
vulnerability assessment methodologies and present the EVIL DONE vulnerability
assessment. In addition to the presentation of EVIL DONE, the primary goal of this thesis
is to present the EVIL DONE vulnerability assessment methodology, test its validity, and
evaluate its ability to predict the number of fatalities and injured persons resulting from a
terrorist attack. Validity refers to how well a test measures what it is designed to measure
(Babbie, 2010); thus, a test of validity will assess whether the EVIL DONE vulnerability

4
score accurately measures the vulnerability of such locations/targets. Although the
assessment is designed to be applied proactively to specific locations within a unique
jurisdiction, it is impractical to use this same concept in research. One cannot measure the
vulnerability of locations all over the world in anticipation of the next terrorist attack to
test the validity. Therefore, because terrorists seek to impact as many people as possible
in order to strengthen their objectives, this study will be applied reactively to historical
terrorist attacks to assess whether or not the vulnerability score is reflective of the number
of fatalities and injured persons.
Relevance and Significance
Past efforts by the United States Department of Homeland Security to collect
vulnerability assessment methodologies in hopes of discovering an affordable and locally
applicable method yielded unsatisfactory results (Leson, 2005). These endeavors
emphasized a need for vulnerability assessment methodologies that would be useful to
local authorities and could contribute to the prevention of terrorist attacks on locations
within local jurisdictions (Leson, 2005; Boba, 2009). Therefore, in a post-9/11 era where
terrorism prevention has become a principle concern to both government sectors and the
general public, the relevance of the current study is evident.
In addition to the relevance, the current study also offers significant contributions
to the field of criminology. Clarke and Newman are two principal contributors to the field
of criminology and the earliest advocates of key theories such as rational choice and
situational crime prevention. Despite their vast wisdom and contributions, this theory has
not yet been tested to the best of their knowledge. Therefore, this study is highly

5
significant in that it will be the first to test the validity of the EVIL DONE vulnerability
assessment for terrorism opportunity reduction. Additionally, contingent on the findings
and results, this study may reveal vital attributes of targets and locations whose
characteristics influence its vulnerability to terrorist attacks. The design of the EVIL
DONE vulnerability assessment was formulated for easy application at the local level;
therefore, subject to the validity of the tests, it is possible that future research could
further assess the validity and promote integration of the vulnerability assessment into
local opportunity reduction efforts.
Summary
Recent shifts in government and public concerns have placed terrorism
opportunity reduction on the forefront. Apart from these concerns, increased funding and
capabilities for terrorism prevention across the nation is unrealistic and unfeasible.
However, through the use of situational crime prevention and EVIL DONE, certain
locations that are more vulnerable to attack can be identified in order to more effectively
apply limited resources. It is the primary goal of this thesis to test the validity of the
EVIL DONE vulnerability assessment to evaluate its usefulness in identifying the
locations most vulnerable to a terrorist attack. The increased concerns in terrorism
highlight the key relevance of this study in the current era. Additionally, this study will
be the first to test the validity of EVIL DONE following its development by Clarke and
Newman (2006).
Chapter 2 will discuss the multiple theoretical concepts of environmental
criminology that contributed to the development of EVIL DONE. The chapter will also

6
formally introduce and define terrorism and its components, followed by an application
of situational crime prevention to terrorism opportunity reduction. Lastly, the chapter
will examine existing vulnerability assessment methodologies, their attributes, and their
weaknesses. Chapter 3 will define the purpose of this study, followed by a description of
the research design and the data collection and sampling methods. The chapter will then
introduce the EVIL DONE vulnerability assessment methodology and the research
questions of this study. Chapter 4 will include an examination of the statistical findings
through descriptive statistics, correlations, and multiple regression analyses’ results.
Lastly, chapter 5 will discuss the findings and the limitations of the study. To conclude,
this chapter will also discuss the scholarly conclusions and implications for future
research.

7
CHAPTER 2: THEORETICAL FOUNDATIONS AND RESEARCH
Introduction
Multiple theoretical concepts from environmental criminology contributed to the
development of the EVIL DONE vulnerability assessment including routine activities
theory, crime pattern theory, and rational choice theory. Additionally, key components of
situational crime prevention and environmental criminology have further contributed to
the assessment. The first section of this chapter briefly examines the key components of
each theory, followed by their application to terrorism. Next, the importance of targets,
weapons, tools, and facilitating conditions of terrorism are discussed along with an
analysis of target vulnerability and its association to EVIL DONE. The second section
examines previous research on target vulnerability and discusses the current gaps in the
literature, which illustrate the need for determining the validity and reliability of current
vulnerability assessments, which is the main focus of this thesis. The third section
examines existing vulnerability assessment methodologies and their attributes and
weaknesses. Conclusively, the final section will discuss the focal research questions
addressed in this study.
Environmental Criminological Theories
Contrary to traditional criminology theories which focus on explaining why
people commit crimes, the concepts of environmental criminology focus on explaining

8
the criminal event, with the setting of the crime being the primary emphasis
(Brantingham & Brantingham, 1993; Felson & Boba, 2010). Many traditional
criminology theories attempt to explain why certain people commit crimes and what
factors indorse criminality (Brantingham & Brantingham, 1993; Felson & Boba, 2010).
In environmental criminology, researchers instead focus on a specific location at precise
times to find the unique characteristics of these settings that encourage particular
behaviors (i.e., crime) (Santos, 2012). Thus, the goal is to identify patterns in the
characteristics of settings and behaviors that create opportunities for crime, and
consequently to understand how to decrease these opportunities (Santos, 2012).
The three pillars of environmental criminology are routine activities theory, crime
pattern theory and rational choice theory. Each of these theories contributes to the
understanding of how crime events happen, how offenders and victims come together,
and the importance of setting and time. The following is a more in depth discussion of
each theory followed by its application to terrorism.
Routine Activities Theory
Cohen and Felson (1979) developed the routine activities theory by establishing
that crime results from a convergence of three critical components at a particular time and
space. The three critical components include a motivated offender, a suitable target, and
the absence of a capable guardian. The three components establish what has become
known as the crime triangle (Figure 1). When the three components converge, a crime
opportunity is developed. If any of the three components are missing at any given time or
setting, the opportunity for crime is decreased (Tillyer & Eck, 2011).

9
Figure 1: Crime triangle
In addition to the three critical components of crime opportunities, controllers can
supervise either the target (victim), the place (setting), or the offender. Guardians
contribute to crime prevention through protecting and watching over specific targets.
Place managers maintain control and supervision over specific places. Handlers oversee
and influence the decisions of offenders. Figure 2 depicts the controllers which converge
with the three components of a crime opportunity to create a double crime triangle
(Tillyer & Eck, 2011).
Figure 2: Double crime triangle
The center triangle represents the three critical components of crime. The
convergence of these components at a particular time and space creates opportunity. The
10
outer triangle represents potential controllers whose presence can contribute to crime
prevention, whereas their absence promotes the crime opportunities. Guardians can
include one's self, an adult looking after a child, bystanders, or anyone responsible for
watching over a crime target or victim. Handlers can be a parent, teacher, spouse,
probation officer, or any person that could influence the decisions of a potentially
motivated offender. Place managers can include homeowners, business managers, or any
person who can alter the method in which a place/setting is operated. Homeowners can
alter the setting of their homes to increase crime prevention through installing alarm
systems, improving perimeter control and lighting, and locking doors. Business managers
can maintain control over their settings by enforcing policies, restricting alcohol use
and/or sales, and formally responding to crime and disorder (Tillyer & Eck, 2011).
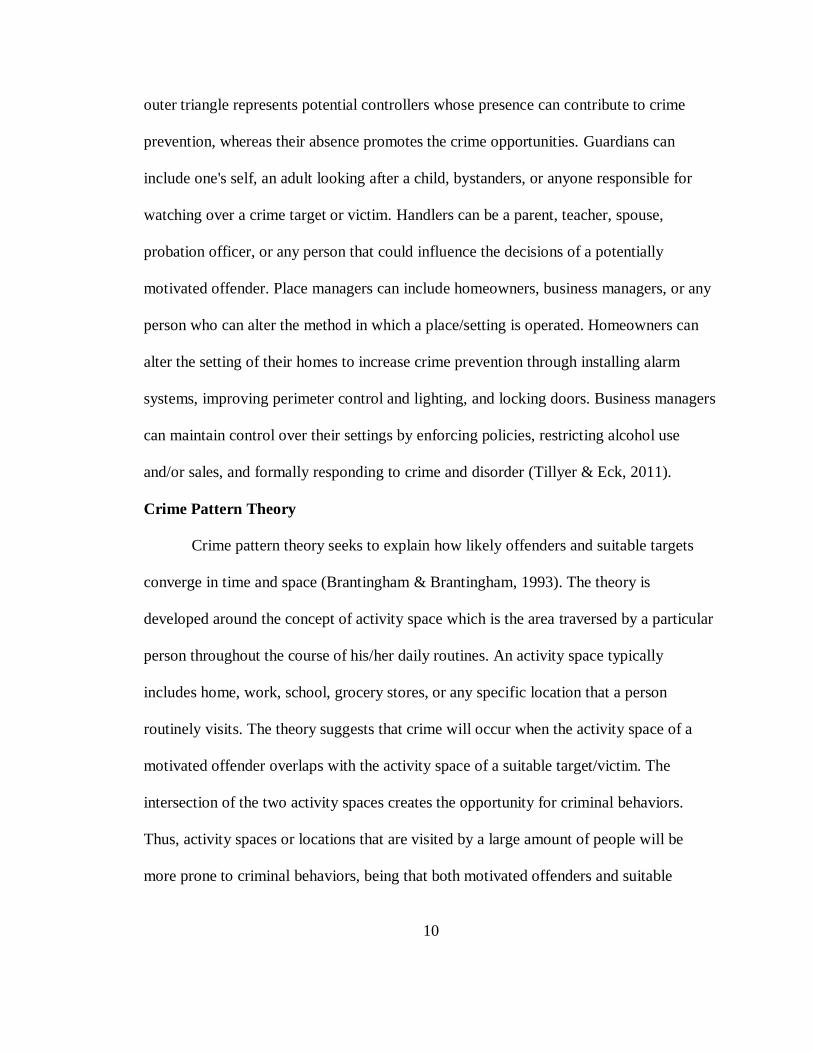
Crime Pattern Theory
Crime pattern theory seeks to explain how likely offenders and suitable targets
converge in time and space (Brantingham & Brantingham, 1993). The theory is
developed around the concept of activity space which is the area traversed by a particular
person throughout the course of his/her daily routines. An activity space typically
includes home, work, school, grocery stores, or any specific location that a person
routinely visits. The theory suggests that crime will occur when the activity space of a
motivated offender overlaps with the activity space of a suitable target/victim. The
intersection of the two activity spaces creates the opportunity for criminal behaviors.
Thus, activity spaces or locations that are visited by a large amount of people will be
more prone to criminal behaviors, being that both motivated offenders and suitable

11
targets are likely to be present. For example, locations such as restaurants, downtown
shopping centers, or movie theaters commonly attract a multitude of individuals.
Because these locations fall into the activity space of many people, the convergence of
the offender and the victim/target at any particular time and place is probable
(Brantingham & Brantingham, 1993).
Crime pattern theory has also developed concepts suggesting that offenders
commit crimes in the areas they are most comfortable in and accustomed to, typically the
areas closest to their homes. According to Bernasco (2010), offenders are 22 times more
likely to commit a crime in an area that they are currently living in or have formerly lived
in as opposed to a location the offender is unfamiliar with. The findings suggest that
offenders choose the location of the crime in an area that is commonly visited and
included in the offender’s activity space.
Rational Choice Theory
Clarke and Cornish (1985) applied rational choice theory to the process in which
offenders make decisions and choose to deter from or conform to criminality. The theory
assumes that all humans are rational individuals who will weigh the potential costs
against the perceived rewards or benefits of a particular action during decision making,
and suggests that the decision to commit a crime is a two-stage process including the
“involvement decision” and the “event decision” (Clarke & Cornish, 1985).
During the involvement decision stage, the offender decides whether or not he/she
is ready to commit an offense. The offender contemplates his/her involvement in a certain
crime and decides that the offense is the preferred solution to meet his/her needs. This

12
decision process is driven by the offender’s previous experiences and prior learning,
which helps guide the offender’s choices (Clarke & Cornish, 1985). Drawing from
previous experiences, the offender commits to a certain offense under specific
circumstances.
Following the involvement decision, the event decision is initiated. During the
latter stage, situational factors dominate the decision making process. It is important to
note that despite the ability of situational factors to control event decisions, situations are
viewed differently by different people. Previous experiences stimulate the manner in
which an offender perceives the situation. Reinforcements and punishments modify the
offender’s perceptions of criminal events. The effects of these consequences later
increase or decrease the probability or frequency of future offending (Tillyer & Eck,
2011).
The idea that situations are perceived uniquely acknowledges distinct differences
in decision making and recognizes a concept referred to as bounded or limited nature of
human rationality (Clarke & Cornish, 1985). The offender’s opinions regarding criminal
or law-abiding behaviors may change as life-altering situations present themselves. These
life-altering situations may include professional opportunities, shifts in peer groups,
networking, and family development. When an individual’s personal situation or the
environment is altered, the costs and benefits of crime are also adjusted, and the
perceived benefits may no longer outweigh the risks (Cornish & Clarke, 1985).

13
Situational Crime Prevention
Situational crime prevention (SCP) is grounded in the theoretical concepts of
routine activities theory, crime pattern theory, and rational choice theory and is the
application of environmental theory into direct crime prevention actions. Its focus is to
reduce the opportunities for very specific crimes by altering the immediate environment
(i.e., the setting) (Clarke, 1983). The goal is to modify the environment, to adjust the
offender’s perception of costs and benefits, and to ultimately influence their decision
making process (Clarke, 1983). In order to reduce opportunities and manipulate the
offender’s perceptions, SCP proposes five general categories of focus, each of which
incorporates more specific techniques. The five general categories of focus include
increasing the perceived effort of the crime, increasing the perceived risk of the crime,
reducing the anticipated rewards, reducing provocations, and removing excuses (Clarke,
1983).
Increasing the perceived effort of committing the crime is the first technique
suggested by the SCP model. It is important to note that the actual effort may not need to
be increased, but rather the effort perceived by the offender. The five techniques within
this category all involve making it more difficult for a crime to occur by requiring the
offender to exert more effort to complete the desired task. These include: (1) target
hardening (e.g., deadbolt locks or unbreakable glass), (2) controlling access to facilities
(e.g., electronic card access or gated communities), (3) screening exits (e.g., ticket,
stamped document, or identification needed for exit), (4) deflecting offenders (e.g., street

14
closures or separating rival sports fans), and (5) controlling tools/weapons (e.g., waiting
period on firearms purchases or using plastic cups instead of glass) (Clarke, 1997).
Increasing the risk again refers to the perceived risk of being caught committing a
crime by the motivated offender, as opposed to the actual risk which may be quite
different in some situations. The goal is to prompt the offender into believing that the risk
of being spotted or apprehended outweighs the potential rewards of the crime. The five
techniques that increase the perceived risk of being caught include: (1) extending
guardianship (e.g., traveling in groups or carry a phone), (2) assisting natural surveillance
(e.g., improving street lighting or decrease sight-hindering objects), (3), reducing
anonymity (e.g., requiring uniforms or requiring taxi drivers to post photo identification),
(4) utilizing place managers (e.g., two clerks at a convenience store), and (5)
strengthening formal surveillance (e.g., alarm systems or security guards) (Clarke, 1997).
The third category of situational crime prevention techniques involves reducing
the anticipated rewards. The anticipated rewards are what the offender seeks to gain from
taking advantage of the crime opportunity (i.e., the anticipated benefits). Consistent with
the above mentioned techniques, the actual reward may not need to be reduced, but rather
the perception of the reward by the offender. The five techniques to reduce these
anticipated rewards include: (1) concealing targets (e.g., parking in a personal garage or
hiding valuable out of plain view), (2) removing targets (e.g., keeping a low amount of
cash in a register) (3) identifying property (e.g., personal engraving on valuable items or
marking property), (4) disrupting markets (e.g., monitoring pawn shops for reportedly

15
stolen goods), and (5) denying benefits (e.g., ink tags on merchandise or graffiti clean-up)
(Clarke, 1997).
The fourth category of situational crime prevention is reducing provocations
which involves reducing factors that may instigate criminal tendencies or increase
motivations for criminal behavior. The aim of the techniques in this category is to reduce
conflicts and triggers for crime. The five techniques include: (1) reducing frustrations and
stress (e.g., soothing music or ample seating options in crowded areas), (2) avoiding
disputes (e.g., reducing crowding or separating rival sporting teams), (3) reducing
emotional arousal (e.g., prohibiting racial slurs or enforcing positive behaviors), (4)
neutralizing peer pressure (e.g., promoting designated drivers or saying “no”), and (5)
discouraging imitation (e.g., rapid repair of vandalism or conceal details of crimes in
media) (Clarke, 1997).
The last category of situational crime prevention techniques involves removing
excuses. These techniques seek to reduce reasons or justifications for specific crimes.
They include methods of informing citizens about the expectations placed upon them and
their behaviors in order to promote legal compliance (Clarke, 1997). The five techniques
include: (1) setting rules (e.g., rental agreements), (2) posting instructions (e.g., “No
Parking,” “No Loitering”), (3) alerting conscience (e.g., roadside speed display boards or
“Shoplifting is stealing” signs), (4) assisting compliance (e.g., easy check out or public
restrooms), and (5) controlling drugs and alcohol (e.g., alcohol-free events or quantity
restrictions on alcohol consumption) (Clarke, 1997).

16
Each of the above mentioned situational crime prevention techniques contribute to
reducing the opportunities for crime. It is these unique approaches provided by SCP that
can be applied to altering the environment to prevent a specific incident and/or a related
pattern or trend of criminal activity. Environmental criminology and situational crime
prevention have been used to explain and address a variety of different types of crime and
problematic behavior (e.g., see POP Center Problem-Specific Guides) (POP Center,
2013). More recently, it has been applied to terrorism which is the focus of this research.
Thus, the following section presents these theories and considerations in the context of
terrorism and more specifically terrorist targets (i.e., places).
Terrorism
Before discussing the implications of opportunity reduction on terrorism, it is
important to define what exactly constitutes a terrorist act. While there is not a single,
universally accepted definition of terrorism, an accredited definition can be derived from
the United States Code of Federal Regulations which defines terrorism as “the unlawful
use of force and violence against persons or property to intimidate or coerce a
government, the civilian population, or any segment thereof, in furtherance of political or
social objectives” (28 C.F.R. Section 0.85). Additionally, the United States Federal
Bureau of Investigations (FBI) divides the term into two distinct categories: domestic or
international. The classification of acts is based upon the origin, base, and objectives of
the terrorist group or organization (Terrorism 2002-2005, n.d.).

17
The two definitions are as follows:
Domestic terrorism is the unlawful use, or threatened use, of force or
violence by a group or individual based and operating entirely within the
United States or Puerto Rico without foreign direction committed against
persons or property to intimidate or coerce a government, the civilian
population, or any segment thereof in furtherance of political or social
objectives.
International terrorism involves violent acts or acts dangerous to human
life that are a violation of the criminal laws of the United States or any
state, or that would be a criminal violation if committed within the
jurisdiction of the United States or any state. These acts appear to be
intended to intimidate or coerce a civilian population, influence the policy
of a government by intimidation or coercion, or affect the conduct of a
government by assassination or kidnapping. International terrorist acts
occur outside the United States or transcend national boundaries in terms
of the means by which they are accomplished, the persons they appear
intended to coerce or intimidate, or the locale in which their perpetrators
operate or seek asylum. (Terrorism 2002-2005, n.d.).
Traditional criminology focuses on explaining the motivations of criminals.
Although terrorists’ motivations are substantively different than a “typical” criminal’s
motivation in committing Part I index crimes (homicide, rape, robbery, burglary, assault,
larceny, motor vehicle theft, and arson), Clarke and Newman (2006) assert that these

18
differences are frivolous in terms of crime prevention. Rather, Clarke and Newman
(2006) suggest that in reality, although motivation for different types of crimes may vary,
all crimes are the result of situational opportunities, and thus can be explained using
theories of environmental criminology and addressed with situational crime prevention
techniques. For example, the motivation for robbery differs greatly from the motivation
for rape or murder. Likewise, political motivations differ greatly from religious
motivations of terrorism; yet, despite the differences, Clarke and Newman (2006) assert
that all offenses can be prevented through SCP and opportunity reduction. Therefore, it is
vital to understand that in any type of crime, in order to reduce opportunities, one must
look at how crime opportunities are developed rather than motivations for why offenders
commit crimes.
Another important factor facing researchers who attempt to apply criminal justice
theories to the realm of terrorism is the differences between Part I index crimes and
terrorism. The focus of research has been placed upon identifying these differences and
recognizing similarities among the two. The current terrorism research focuses on the
following differences: (1) terrorists’ determination is much greater than typical criminals,
(2) terrorism requires much more excessive planning than most crime and is less
dependent on opportunities, (3) terrorism is heavily dependent on external funding
whereas most crime is not, (4) terrorism involves much larger criminal acts, and (5)
terrorist acts are typically conducted by organized groups, whereas most index crimes are
committed by individual people (Clarke & Newman, 2006).

19
Clarke and Newman (2006) rebut these claims and suggest that in reality, the
differences between terrorism and ordinary crimes are trivial. Many terrorists value their
lives, and despite their motivations, they procure similar measures to protect themselves.
In their view, planning for terrorist attacks can have the same complexity level as other
offenses and is just as strongly reliant on opportunity, thus planning is not as vital to the
completion of terrorism as is the opportunities to execute the acts. Additionally, while
terrorism does require more tools and costly weapons (discussed later), the funds are
usually consequential and sometimes exclusive of conventional crimes’ gain. Although it
is commonly believed that terrorist attacks affect a large population, many acts are
provoked against a single individual or small group, as with conventional crimes.
Conversely, conventional crimes can also be targeted against a large population, such as
fraud or cyber-crimes that victimize populations in the millions (Clarke & Newman,
2006). Lastly, like a majority of terrorist attacks, an ample amount of ordinary crimes are
conducted in large groups as opposed to single individuals such as drug dealing and
corporate crimes (Clarke & Newman, 2006).
Consequently, Clarke and Newman (2006) assert that just as an index crimes can
be successfully prevented through identifying and reducing opportunities, so too can
terrorist attacks. It is a two-step process in which the first step involves identifying the
opportunities that terrorists exploit to fulfill their desires, and the second step involves
removing these opportunities through SCP techniques. However, these two steps are not
unidirectional. That is, because terrorists are likely to adapt to opportunity changes and
seek new opportunities, it is important to observe the opportunities that may be developed

20
as a result of SCP. Eliminating opportunities allows terrorists to adapt to new
circumstances that facilitate new opportunities, which must once again be identified and
removed (Clarke & Newman, 2006).
Because terrorist acts are substantively different that traditional crime, Clarke and
Newman (2006) have broken down the opportunities exploited by terrorists to complete
terrorist acts into four vital pillars of opportunity—targets, weapons, tools, and
facilitating conditions. Targets are the endless locations that are potentially attractive to
terrorists. They include, but are not limited to, public transportation systems, government
buildings, and political/iconic infrastructures. Weapons are the devices used to carry-out
a specific act. Different motivations, tasks, and intentions require different weapons,
which emphasizes the need for specific applications of SCP to very specific acts. Possible
weapons could include, but are not limited to, firearms, explosives, toxic materials,
missiles, and nuclear weapons.
Tools include the gear and instruments needed to carry out the act, not including
the actual weapon. For example, in the case of the September 11th
attacks, the terrorist
attacks required an airplane, identification, box cutters to gain control of the plane, a
trained pilot, etc. to carry out their attack. Tools comprise of items in everyday life that
assist in carrying out a specific act. They include, but are not limited to, methods of
transportation and identification. Facilitating conditions are any societal circumstance
that generates greater opportunities for crime. These conditions include, but are not
limited to, insufficient policies and procedures on firearms sales and ease of access to
toxic or nuclear materials. The importance of the four pillars of opportunity will be
21
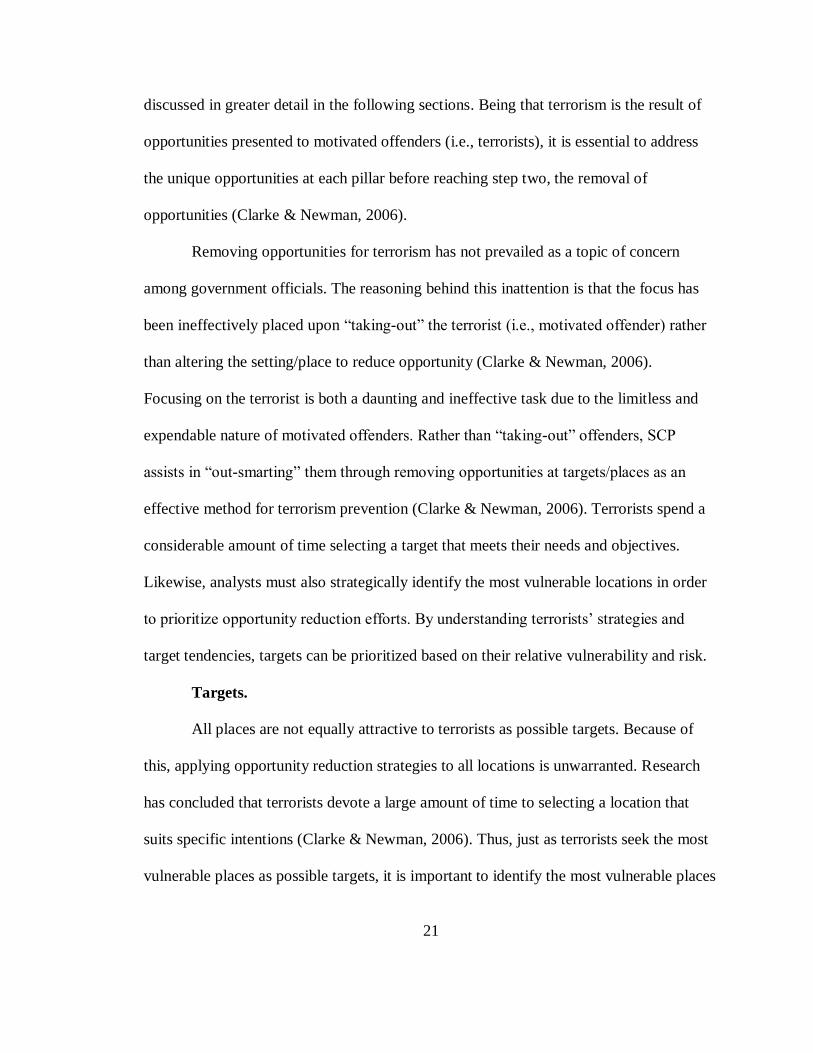
discussed in greater detail in the following sections. Being that terrorism is the result of
opportunities presented to motivated offenders (i.e., terrorists), it is essential to address
the unique opportunities at each pillar before reaching step two, the removal of
opportunities (Clarke & Newman, 2006).
Removing opportunities for terrorism has not prevailed as a topic of concern
among government officials. The reasoning behind this inattention is that the focus has
been ineffectively placed upon “taking-out” the terrorist (i.e., motivated offender) rather
than altering the setting/place to reduce opportunity (Clarke & Newman, 2006).
Focusing on the terrorist is both a daunting and ineffective task due to the limitless and
expendable nature of motivated offenders. Rather than “taking-out” offenders, SCP
assists in “out-smarting” them through removing opportunities at targets/places as an
effective method for terrorism prevention (Clarke & Newman, 2006). Terrorists spend a
considerable amount of time selecting a target that meets their needs and objectives.
Likewise, analysts must also strategically identify the most vulnerable locations in order
to prioritize opportunity reduction efforts. By understanding terrorists’ strategies and
target tendencies, targets can be prioritized based on their relative vulnerability and risk.
Targets.
All places are not equally attractive to terrorists as possible targets. Because of
this, applying opportunity reduction strategies to all locations is unwarranted. Research
has concluded that terrorists devote a large amount of time to selecting a location that
suits specific intentions (Clarke & Newman, 2006). Thus, just as terrorists seek the most
vulnerable places as possible targets, it is important to identify the most vulnerable places

22
in order to prioritize SCP efforts. Additionally, because terrorists have many different
objectives, the kind of targets they select will be consistent with their motivations.
Therefore, knowing the objectives of terrorism provides insight into which places
terrorists may choose.
Weapons.
The weapons available to terrorists have been categorized into three classes by
Clarke and Newman (2006). The choice of weapon is highly dependent on certain
factors, including the objective of the attack, and dictates which of the following classes
of weapon the terrorists may choose: guns and other small arms, explosives, and
unconventional weapons (e.g., nuclear, chemical, or biological weapons) (Clarke &
Newman, 2006). Like targets, there are certain factors that make specific weapons more
or less attractive to terrorists. The factors that contribute to the terrorists weapon selection
have been summed up by the acronym MURDEROUS by Clarke and Newman (2006)—
Multipurpose, Undetectable, Removable, Destructive, Enjoyable, Reliable, Obtainable,
Uncomplicated, and Safe.
Multipurpose refers to the weapons applicability to a wide variety of situations.
An example of a multipurpose weapon would be an explosive that could be used in
different situations, compared to a high-powered rifle that is only applicable to
assassinations (Clarke & Newman, 2006). Undetectable refers to the weapon’s ability to
remain concealed and hidden. This is especially important for targets with heavier
security (Clarke & Newman, 2006). Removable weapons are light, small, and easily
portable. Destructive refers to the weapon’s ability to cause as much damage as possible.

23
Enjoyable weapons are those that trigger excitement and pleasure upon using. Reliable
refers to a weapon that will operate properly at any given time. To test the reliability of a
weapon, some terrorists participate in experimental attacks of a smaller magnitude prior
to the actual planned event. This ensures that the weapons are reliable and will function
when needed (Clarke & Newman, 2006).
Obtainable is the most important attribute for weapon selection. This refers to the
amount of efforts needed to access the weapon. For instance, small arms, which are the
most common weapon among terrorists, are easily obtained in today’s society (Clarke &
Newman, 2006). Conversely, unconventional weapons are hard to access because they
are not as widely available as small arms. An uncomplicated weapon is one that is user-
friendly and requires little to no training for proper handling (Clarke & Newman, 2006).
Clarke and Newman (2006) declare that “the more widely used particular weapons are,
the more easily available will be personnel who are trained to use them or who can train
others to use them” (p.115). Lastly, a safe weapon is preferred over an unsafe weapon.
For example, it is not uncommon for terrorists to accidently detonate a bomb while
building it. Thus, terrorists seek to reduce dangers to themselves and others until the
desired time (Clarke & Newman, 2006).
Tools and facilitating conditions.
The two major components of a terrorist attack include the targets and weapons
selected. In order for the terrorist attack to be completed, Clarke and Newman (2006)
conclude that a link between these two components must be created. That is, to bring the
weapons together with the selected target, both tools and facilitating conditions are

24
needed (Clarke & Newman, 2006). Tools include tangible products that enable the
terrorists to commit a specific act. Common tools include methods of transportation (e.g.,
cars and truck), finances (e.g., credit card and cash), identification (e.g., driver’s licenses,
passports, or visas - typically stolen or fake), methods of communication (e.g., cell
phones), and specific information about the selected target (e.g., maps, addresses, and
specific details) (Clarke & Newman, 2006).
While weapons resemble the definition of tools, they hold a more specific
function and are therefore classified by Clarke and Newman as a distinct label. Because
terrorists rely heavily upon tools to carry out specific acts, it is possible to reduce the
opportunities presented to terrorists by restricting the availability and access to these
tools. Clarke and Newman (2006) provide three options for disrupting the availability
and usefulness of tools to terrorists. They suggest modifying the tools design to reduce
misuse, limiting illegal access to the tools, and tracking the products, as well as the
people using them. The third option, tracking the products and users, holds the greatest
potential due the advances in technology and electronic capabilities.
Beyond the use of tools, facilitating conditions further enable terrorist acts (Clarke
& Newman, 2006). Unlike tools, facilitating conditions include the specific features of a
society and/or system that assist terrorists in launching attacks. Clarke and Newman
(2006) provide a framework for distinguishing which conditions facilitate terrorism. This
framework is established around the five situational crime prevention categories (i.e.,
increase effort, increase risk, reduce reward, remove excuses, and remove provocations).

25
Facilitating conditions include those that make crime Easy, Safe, Excusable, Enticing and
Rewarding (ESEER) (Clarke & Newman, 2006).
While the four pillars of opportunity are vital to decreasing the vulnerability of
targets to terrorism, it is of equal importance to put emphasis on the target (i.e., location)
as the primary focus for opportunity reduction. Focusing on the target with consideration
of the four pillars creates the most effective strategy for terrorism prevention.
Vulnerability.
The availability of tools and the degree of facilitating conditions in a certain area
can further contribute to the vulnerability of a place. The four pillars of opportunity
(targets, weapons, tools, and facilitation conditions) can be reduced through
implementing SCP strategies. In order to reduce or remove the opportunities, the
vulnerability of specific locations must be addressed with the purpose of prioritizing
efforts. Therefore, a methodology is required to analyze which locations represent the
most vulnerable targets for terrorism. In order to establish an effective methodology for
vulnerability assessment, there must first be a clear distinction of factors that foster or
hinder vulnerability (Clarke & Newman, 2006).
Research conducted by Boba (2009) breaks down the examination of terrorism
opportunity and SCP into three units of analysis (UOA) which include: (1) a specific
target under a specific threat, (2) a general threat to a specific target, and (3) a general
threat to a general target (i.e., broad areas within a community) (Boba, 2009). The first
UOA is typically addressed by federal authorities in response to promising terrorism
intelligence or a direct threat. Because these threats are out of the jurisdiction of local

26
enforcement, there are few situational techniques applicable to this UOA. The second
UOA refers to specific locations or settings that have a general risk of becoming a target
for terrorism. The third UOA includes areas surrounding a cluster of “risky” locations
that establish a “hot spot” for target vulnerability (Boba, 2009).
Boba (2009) asserts that the second and third UOA are used to select and
prioritize specific locations that are susceptible to terrorist attack which can then be
addressed through the application of SCP techniques. Being that there are endless
potential targets, in a practical application of vulnerability assessment, locations must be
prioritized based on the calculated risks, just as terrorists would prioritize based an
evaluation of maximum opportunities when choosing a specific target. Because it is
impractical to reduce opportunities for terrorism at all settings around the world, the
purpose of this study is to examine methods of risk assessment and test the accuracy of
such evaluations.
Prior to examining risk assessments, a definition of risk must first be assigned.
The risk of a place/setting becoming a target of terrorism is dependent on two factors—
expected loss and vulnerability (Boba, 2009; Clarke & Newman, 2006). The expected
loss of a location can be calculated through the consideration of the probable magnitude
and type of damage resulting from a terrorist attack. It can include fatalities, injuries,
financial loss, destruction or hindrances of transportation, and deprivation of necessities
(clean water, food, electricity, etc.) (Boba, 2009).
The vulnerability of a target is calculated based on “the inherent features of
targets that make them susceptible or attractive to attack by terrorist” (Clarke & Newman,
27
2006, p.90). In order to prioritize specific settings based on risk assessment (i.e., expected
loss + vulnerability), Clarke and Newman established a set of factors that assist in
evaluating the vulnerability of such locations. The factors, known collectively by the
acronym EVIL DONE, are consistent with the techniques of SCP and aim to assess the
vulnerability of settings within the second UOA previously mentioned - general risk at a
specific location.
EVIL DONE.
Prior to assessing the factors of EVIL DONE at a location, possible targets must
be narrowed down to prioritize the examination of those locations with a greater potential
for risk. Literature on the topic of terrorism targets assists in confining the sample
locations down to the areas with historically higher risks. In other words, it is very
unlikely that a convenience store will be a target for terrorism over a power plant or a
major transient station. Once the at-risk locations have been focused in on, the factors of
EVIL DONE can be assessed.
The primary purpose of EVIL DONE is to be the first step in identifying
vulnerable targets through identifying features of specific locations that make it more
vulnerable to attack (Clarke & Newman, 2006). The elements of EVIL DONE include:
Exposed, Vital, Iconic, Legitimate, Destructible, Occupied, Near, and Easy (Clarke &
Newman, 2006). The more elements that apply to a location, the more vulnerable the
target is to terrorism. Assessing the risk of specific locations through the factors of EVIL
DONE can assist local authorities by emphasizing those places most vulnerable to
attacks. Once the most vulnerable locations have been identified, SCP techniques can be

28
more effectively prioritized for terrorism opportunity reduction. The following sections
describe, in detail, each element of EVIL DONE as described by Clarke and Newman
(2006):
Exposed.
Exposed refers to the ability of the location to attract attention and be visible to
surrounding areas or to stand out in any manner. Targets that “stick out” are more
vulnerable than locations that are hidden among other buildings or structures. The degree
of exposure is contingent upon the type of environment that surrounds the target. In other
words, the only three-story building in a rural area may be considered highly Exposed,
whereas a three story building in New York City would be smothered and hidden by
surrounding high-rises. Therefore, the degree of exposure is dependent on the
surrounding structures and landscape style. An example of an Exposed target would be an
inner city high-rise such as the Twin Towers, Statue of Liberty, or the only large
shopping plaza among single retail stores and small buildings.
Vital.
Vital targets are those that play a crucial role in the daily behaviors of a
community. Locations that are highly Vital include water and food supply sources,
electricity grids, and transportation systems. The inability of any of these locations to
operate properly greatly inhibits the functionality of the community. These targets attract
the attention of terrorists due to their ability to cause mayhem when inoperative.

29
Iconic.
Iconic refers to the symbolic value of the specific location. Symbols that represent
the nation’s power and unity are attractive to terrorists who seek to figuratively impair the
strength of the country. Examples of Iconic locations include the Statue of Liberty or the
White House.
Legitimate.
Legitimate targets include those that will bring about a positive reaction from the
supporters of the terrorist or the terrorist organization. Consistent with the idea that
terrorists are rational beings, they seek to maximize positive reinforcements and avoid
condemnation, or negative consequences. Therefore, terrorists seek targets that will be
viewed as Legitimate, which typically include locations housing military and government
officials. Illegitimate targets would be considered locations housing children or
defenseless persons.
Destructible.
Destructible refers to the ability to destroy the target/location or kill a targeted
person. Although all targets are destructible in some way, some locations are more
durable than others, and some persons are more heavily protected than others. Thus, the
Destructible element refers to “the amount and accessibility of weapons required to
destroy a target” (Boba, 2009, p.14). Targets that would require a large amount of
weapons that are not easily accessible could be less attractive to terrorists than a target
that could be destroyed with easily obtainable, conventional weapons.

30
Occupied.
Occupied targets include those that house a large amount of people. Terrorists
characteristically seek to harm as many people as possible in order to strengthen their
purpose (increase fear, increase legitimacy, etc.). Locations with high population
densities provide the greatest opportunities for terrorists to exert great harm and establish
fear among the targeted community. The Occupied element is dependent on timing as
some locations may be heavily occupied only during certain times of the day or certain
periods in the year. For example, a sporting arena houses tens of thousands of people in a
compact location, but only during a sporting event. The locations with greater
occupancies will be more vulnerable than those with fewer.
Near.
Near refers to the distance from which the location is to the terrorist’s home or the
terrorist organization’s abode. Crime pattern theory and criminological studies have
emphasized that offenders prefer targets that are closer to home and rarely travel large
distances to commit crimes. This theory holds true for terrorism in that terrorists prefer
opportunities in locations that they are familiar with and require less travel. Targets that
are near home are not only easier to attack, but also easier to escape from. Clarke and
Newman suggest that this element holds the greatest relevance in domestic terrorism
when the jurisdiction is larger. In foreign terrorism, all terrorists are relatively distant.
Easy.
Easy targets include those that are weakly protected or are accessible to the
public. It refers to the effort required to obtain access to the locations based on the

31
provided security measures. For example, it was easy for the recent domestic terrorists to
place the pressure-cooker bomb in a duffle bag and leave it on a busy public street during
the 2013 Boston Marathon. It would be much more difficult to gain access to a federal
building to do the same. The lack of security measures and accessibility reduces the
required effort and increases the ease targeting a specific location.
Research on Vulnerability Assessments for Terrorist Attacks
Understanding that terrorism risk is contingent upon the combination of expected
loss and vulnerability establishes the foundation for research analyses to reveal specific
locations susceptible to terrorist attacks. Given the theories that contribute to the creation
of EVIL DONE, the application of SCP to terrorism, and the comprehension of each
EVIL DONE element, risk assessments can be developed to effectively apply the
concepts to opportunity reduction. While many methodologies of risk assessment exist,
few have been successfully applied in research studies.
Research on vulnerability assessments of potential terrorist targets exposes an
imperative gap in the literature. Multiple methodologies for vulnerability assessment
exist; however, many dwell in the field of science and mathematics rather than in
criminology. Among these methodologies are the Fuzzy Integrated Vulnerability
Assessment Model (FIVAM), Quantitative Terrorism Risk Assessment, and the
Infrastructure Vulnerability Assessment Model (I-VAM). Because these assessment
models are focused around heavily convoluted scientific and mathematical formulas, they
require subject matter experts. They are not easily applicable to local or state

32
jurisdictions, nor are they pertinent to the field of criminal justice. Therefore, they will
not be considered for the purposes of this paper.
Many criminology-based methodologies exist that provide instructions on how to
measure the vulnerability of certain locations or potential targets; however, despite their
existence, results of analytical testing of these methodologies are not available. Extensive
research seeking results of vulnerability studies has yielded inconclusive findings in
terms of methodology application. The specific methodologies implemented at the state
and federal level are discussed later in this chapter. Albeit the absence of methodology
testing, few departments have concluded generalized findings of critical infrastructures
related to the vulnerability of terrorist attacks.
Previous research on the vulnerability of places has identified generalized
infrastructures that pose greater risks for becoming a terrorist target. Following the
September 11th attacks, George W. Bush initiated a strategy for identifying the critical
infrastructures and key assets of the United States (Leson, 2005). The locations deemed
to be the most vulnerable included those that were “the most critical to national public
health and safety, governance, economic, and national security, and retaining public
confidence” (Leson, 2005, p.3).
Many of the elements that contribute to vulnerability, according to Bush, are
similar to those considered in the EVIL DONE methodology. The infrastructures
considered critical or vulnerable to attack include agriculture, banking and finance,
chemical and hazardous waste, defense industrial base, energy, emergency services, food,
government, information and telecommunications, transportation, postal and shipping

33
services, public health, and water (Leson, 2005). Additionally, key assets were listed as
national monuments and icons, nuclear power plants, dams, government facilities, and
commercial assets (Leson, 2005). Bush utilized the abovementioned information on
vulnerability in order to structure what became known as the National Infrastructure
Protection Plan (Leson, 2005).
National Infrastructure Protection Plan.
While the guidelines provided by Bush in the post-9/11 era offered a generalized
approach to identifying targets vulnerable to attack, there is still a dire need for a more
specialized methodology. In response to this need, the United States Department of
Homeland Security (DHS) founded the National Infrastructure Protection Plan (NIPP).
The NIPP provides guidelines for critical infrastructure and key resource (CIKR)
identification, prioritization, and protection (National Infrastructure Protection Plan,
2009). Most importantly, the NIPP proposed clearly defined roles and responsibilities of
vulnerability assessment methodologies.
The NIPP’s core criteria for risk and vulnerability assessment methodologies
include: documented, reproducible, defensible, and complete (National Infrastructure
Protection Plan, 2009). Documented refers to the methodology’s ability to clearly record
the information that will be used and how the information will be integrated for risk
estimates. Reproducible refers to the methodology’s ability to produce comparable,
repeatable results. The defensible criteria ensures that the methodology must be
logically integrated and be free of significant errors. Lastly, the complete criteria suggest

34
that the methodology should assess consequences, vulnerabilities, and threats for each
applied target (National Infrastructure Protection Plan, 2009).
Homeland Security – Comprehensive Assessment Model.
Following the requirements provided by the NIPP, the National Domestic
Preparedness Coalition (NDPCI), a non-profit organization in Florida, developed what is
now known as the Homeland Security - Comprehensive Assessment Model (HLS-CAM)
(Glantz & Turner, 2009). Though no specific studies on the assessment of the HLS-CAM
methodology have been documented, basic conclusions have been developed.
HLS-CAM is a software program used to develop a database of all critical and
vulnerable assets and infrastructure locations. The program integrates threat, risk, and
vulnerability assessment into a five step process (Glantz & Turner, 2009). Steps one
through four include a threat assessment, criticality assessment, risk assessment, and a
community priority assessment plan, respectively. The fifth step is the vulnerability
assessment. The vulnerability assessment utilized by the HLS-CAM requires a thorough,
on-site physical inspection of specific places and assets. The inspection also includes
property within the location, the building’s exterior and interior spaces, and all
operational systems (Glantz & Turner, 2009).
During the inspection, four factors are measured to assess vulnerability. These
factors include: location, accessibility, adequacy, and availability. Location refers to the
geographic placement of the target in relation to public areas, transportation, or other
susceptible areas. Accessibility refers to ability of a terrorist to “enter, operate, collect
information, and evade response forces” (Leson, 2005, p.7). Adequacy refers to the

35
capability of the facility to store, protect, or deny access to valuable assets such as
weapons and tools. Lastly, availability refers to the obtainability of equipment, response
forces, or physical security measures to protect the target (Leson, 2005). Using the four
aforementioned factors, vulnerability is then calculated using a five-point scale. A highly
vulnerable target is scored as a five; a moderately vulnerable target is scored as a three; a
low vulnerability target is scored as a one (Leson, 2005).
As previously mentioned, specific research providing detailed results of
methodology assessments are seemingly nonexistent. However, one evaluation of the
HLS-CAM methodology revealed somewhat useful results. The DHS’ Office of Grants
and Training conducted an evaluation titled Comparative Analysis Evaluation of
Assessment Methodologies: Phase II – Task 3 HLS- CAM – Validation Team (Glantz &
Turner, 2009). The evaluation discovered that the HLS-CAM satisfied all the
requirements of the NIPP for methodology assessments. Additionally, the Validation
Team found that the assessment captured 92 percent of the critical infrastructures in the
targeted location. Though the team found the HLS-CAM to be a valid measure of target
vulnerability, additional concerns must be addressed.
The limitations of the HLS-CAM include ease of application, costs, and validity
testing. In their explanation of the methodology, Leson (2005) asserts that the evaluation
may seem overwhelming to many law enforcement and emergency service agency.
Considering that implementation and application of assessments are vital to such
evaluations, one could argue that if the vulnerability assessments are not user friendly

36
and/or easily applicable, their contributions to SCP and opportunity reduction will be
depleted.
An additional concern regarding the HLS-CAM methodology is the costs
associated with implementation. State officials have expressed a major concern that the
cost of application is excessive (Glantz & Turner, 2009). The methodology requires
software that may not be accessible or affordable to some departments. Lastly, the
validity testing reveals a source of uncertainty. The HLS-CAM Validity Team concluded
that the program successfully identified 92 percent of the critical infrastructures in the
target area; however, as key developers to the program, the members of the Validity
Team were critical proponents of the methodology; thus, biases ought to be considered.
Review of Existing Methodologies
Less than a year after the historical September 11th
attacks, the President of the
United States approved the National Strategy for Homeland Security, which addressed
and emphasized the need to prevent terrorist attacks from occurring (Leson, 2005).
Following the strategy approval, the U.S. Department of Homeland Security (DHS)
Office for Domestic Preparedness (ODP) moreover expressed a need for vulnerability
assessment methodologies that would be useful to local authorities and that could
contribute to the prevention of terrorist attacks on locations within local jurisdictions. As
a result of identifying this need, the ODP conducted a Vulnerability Assessment
Methodology Report that identified, analyzed, and reported vulnerability assessment
methodologies from around the country (Leson, 2005).

37
A notice was published and distributed to various commercial and government
organizations requesting information on the vulnerability assessment methodologies,
software, and tools that were being implemented at the time. Although the number of
organizations included in the initial request is not available, 44 responses were received
and considered in the report (Leson, 2005). Of the 44 responses received, only 24
methodologies had sufficient information to conduct thorough assessments. It is
important to note that although the DHS collected information on each of the reported
vulnerability assessment methodologies, the report did not include testing on the
accuracy, usability, or effectiveness of each of the methodologies. Thus, the report was
for basic descriptive purposes only. However, despite its limitations, this report seems to
be the most comprehensive source of vulnerability assessment methodologies available.
Extensive research seeking assessment methodologies at both the commercial and
government level yielded no evidence on the existence and details of additional
methodologies or research testing the validity and applicability of the methodologies.
Consequently, the report from the DHS ODP was the main data source for collecting
information and reviewing existing methodologies. The following is a brief description of
each of the vulnerability assessment methodologies reported to the DHS ODP and all the
documented details derived from the Vulnerability Assessment Methodology Report.
A major weakness of the data source is the lack of reported information from the
commercial or government organization. Unless otherwise stated, information for each
methodology on the specific data collection methods, vulnerability and risk assessment
validity, findings based on the use of the methodology, and exact costs of implementing

38
the methodology was not reported to the ODP, and thus, is not reflected in the data
report. All information included in the report has been transcribed in the following
description of each methodology.
ASDWA Vulnerability Self-Assessment Guide.
The Association of State Drinking Water Administrators created a vulnerability
assessment in the form of a self-conducted checklist designed specifically for evaluating
small drinking water system facilities. The self-conducted checklist list is designed for
physical, personnel, and cyber security to address people, information, equipment, and
facilities. The specific threats addressed include tampering of or the threat of
contamination through biological, chemical, or explosive disruption.
The Buddy System.
This vulnerability assessment is a survey-based risk management software
program that was developed around pre-existing Navy and Coast Guard methodologies.
The software provides ready-to-use datasets which contain information on threats,
vulnerability, and counter measures on gas, oil, energy, transportation, water, non-
government critical and governmental functions. The cost of implementation includes a
two-day training course and the cost of the software.
Business Continuity Management (BCM) Methodology.
This vulnerability assessment was designed specifically for use by financial
institutions to identify and place value on assets in order to identify potential threats,
losses or disruptions, and/or vulnerabilities. The assets examined included “loss or
39
disruptions in confidentiality, integrity, and availability of financial information” (p. D-
3).
California Highway Patrol Crime Prevention Plan.
This vulnerability assessment is a self-assessment which provides guidelines for
crime prevention awareness, risk assessment, and responding actions for property and
personal security. It is strongly directed towards physical security of law enforcement
facilities.
DOJ Assessment and Strategy Development Tool Kit.
This vulnerability assessment was developed by the Department of Justice and the
Office for State and Local Domestic Preparedness Support. It is applicable to all sectors
to identify potential terrorist targets and conduct vulnerability assessments in order to
effectively allocate State Domestic Preparedness funds to the proper locations. Data is
collected via a subjective self-assessment of people, facilities, and values. The assets
considered for loss include injuries and fatalities, damages to facilities, and financial
disturbances. Threats are measured using a revised Department of Defense terrorist threat
analysis methodology. Vulnerability is measured via consideration of eight factors:
visibility, attractiveness, criticality, value, access, target threat of hazard, population
capacity, and collateral mass casualties. Each factor is subjectively scored on a 0 to 5
numerical scale. The risk is then estimated based on a risk assessment matrix.
Fixed Chemical Sites.
This vulnerability assessment, Guidelines for Analyzing and Managing the
Security Vulnerabilities of Fixed Chemical Sites, offers strategies given by the Center for
40
Chemical Process Safety, American Institute of Chemical Engineers specifically directed
towards chemical sites and physical, personnel, and operational security. The data
collection method is qualitative, though specific details were not reported. The assets
considered include people, chemicals, information, environment, equipment, facilities,
and activities and consequences including loss of chemical containment, theft or misuse,
contamination or spoilage, and degradation of assets or infrastructure. Threats of such
locations are based on responses to terrorist attacks and internal and external risks. The
vulnerability is measured by estimating risk via a methodical process that was not
disclosed.
Florida Domestic Security Risk Assessment Model.
This vulnerability assessment was developed for use by Florida’s Regional
Domestic Security Task Forces and public and private organizations to protect Florida
citizens, facilities, and infrastructures from terrorist attacks. The assessment focuses
specifically on the physical security of facilities and venues that are the most likely to be
vulnerable to terrorist attacks. The data collection involves visiting specific sites and
interacting with site personnel. The assets considered for loss include injuries and
fatalities, economic impact, environmental impact, impact on critical infrastructure, and
symbolic effects. The threat of each infrastructure is based on critical intelligence and/or
terrorists attacks on similar locations. Each factor is subjectively scored on a 1 to 5 scale
to calculate a numerical estimated risk. After an estimated risk is developed,
countermeasure recommendations are made to improve policy, procedural, and structural
weaknesses.

41
Method to Assess the Vulnerability of US Chemical Facilities.
This vulnerability assessment provides a methodology prototype that compares
relative security risks of chemical facilities and offers recommendations for risk
reduction. It focuses on collecting qualitative and quantitative data on chemical facilities,
equipment, and operations. The asset considered included disruption of chemical
facilities. Threats of chemical detection, delay, and response are assessed, and
vulnerability is measured based on the availability, accessibility, organic security, target
design and construction, and countermeasures of the chemical facilities. Risk is then
estimated based on these evaluations.
MIL-STD-882D, DoD Standard Practice for System Safety.
This vulnerability assessment provides environmental, safety, and health risk
assessments for the development, testing, production, use, and disposal of Department of
Defense systems, equipment and facilities. Threats of numerous sub-categories of hazards
(e.g., natural or man-made) are examined. Vulnerabilities are then estimated based on the
probabilities of such mishaps. After the assessment, recommendations for risk reductions
are made.
Naval Criminal Investigative Service (NCIS) Threat Planner.
This vulnerability assessment is a software program that assesses risk based on
relative terrorist and criminal threats. It is used strictly by the Navy and Marine Corps to
generate threat assessments of people, equipment, facilities, and operations. The initial
cost of the program is $442,000, with a total cost of $7,614,000 over a 7-year period. The
risk is estimated, though specific methodologies were not disclosed.
42
NC Terrorism Vulnerability Self-Assessment.
This vulnerability assessment provides a general guidelines worksheet for
subjective qualitative data collection. The worksheet is completed by state agencies and
allows them to rank locations and/or assets on a scale from one to twenty in each of the
following factors: potential terrorist intentions, specific targeting, visibility, on-site
hazard, population, mass casualty potential, security environment, criticality, high risk
personnel, communications, and security/emergency response preparedness with
emphasis on bio-terrorism response capabilities.
Port Facility Vulnerability Assessment (prevention and suppression of acts of
terrorism against shipping).
This vulnerability assessment set guidelines and criteria for accessing port
facilities consistent with risk analysis. The assessment uses a risk analysis tool to
understand, identify, and mitigate vulnerabilities through criticality, threat, and
vulnerability assessments specifically for port facilities.
Probabilistic Risk Assessment.
This vulnerability assessment is a human reliability assessment training course
designed to train staff to use the Probabilistic Risk Assessment techniques in order to
regulate and inspect nuclear power plants. The primary focus is on personnel security
(i.e., human reliability). The qualitative data are collected by examining human
contributions to risk. Risk is then estimated based on these findings.
43
Risk Management for Non-Profit Organizations.
This vulnerability assessment follows a five-part process that focuses on
establishing context, identifying risk, evaluating and prioritizing risk, strategies and
responses, and monitoring the program.
Sandia National Lab Community Vulnerability Assessment Methodology.
This vulnerability assessment is a computer-based vulnerability assessment tool
that examines all mission categories, such as education, recreational venues, emergency
facilities, foreign governments, and special locations such as abortion clinics and
religious facilities. The assessment considers the number of injuries and fatalities,
revenue, vital equipment, and vital capabilities as the primary concerns. Vulnerability is
then measured based on these assets with consideration of availability, accessibility,
organic security, and target design and construction. Risk is measured through
consideration of the severity of the event consequences, likelihood of attack, and
effectiveness of security. The resource costs include the cost of training personnel.
Sandia National Lab RADTRAN 5.
This vulnerability assessment uses a technical manual with mathematical
calculation models and numerical formulas to compute transportation risk and
consequence assessments. It was specifically developed for the analysis of consequences
and risk of radioactive-material transported via highway, rail, water, and air. Risk is
estimated based on the exposure of transportation systems, receptor populations, package
behavior, and accident severity and probability.

44
Sandia National Lab Risk Assessment Methodology for Water Safety.
This vulnerability assessment focuses specifically on water utilities and the
associated physical, cyber, operational, and personnel risks. Data is collected in a
qualitative manner and considers people, facilities, equipment, and processes. The assets
examined include fatalities, number of illnesses, loss of critical customers, economic
losses, and loss of public confidence. Threats are then measured through consideration of
threat type, tactic mode, capabilities, threat level, and likelihood of threats. Risk is
calculated using a matrix of the above mentioned factors.
Sandia National Lab VAM-CF.
This vulnerability assessment focuses specifically on chemical facilities and
transport activities with a primary emphasis on physical security. Data is collected using
surveys and worksheets that concentrate on the detection, delay, response, safety, and
mitigation of chemical transportation paths. A matrix is then used to identify
vulnerabilities and risks. The assets examined include chemical facilities which are
screened and prioritized prior to assessment based on population and the potentially
impacted areas. The type of attack, tactics, and capabilities are considered in the threat
assessment. Vulnerability is then measured based on estimates of attack with
consideration of the existence, capability, history and intent, motivation, targeting,
attractiveness, and accessibility of such facilities.
SmartRISK.
This vulnerability assessment is a software program implemented by the
Environmental Protection Agency. No further information was reported.

45
State of Colorado CIKA Assessment Methodology.
The Critical Infrastructure and Key Asset (CIKA) vulnerability assessment is a
self-assessment software program that allows users to numerically scale critical
infrastructures from 0 to 5 based on ten factors: visibility, value, accessibility, hazard,
population, mass casualties, criticality, service disruption, primary function, and
geographical impact. The cumulative score of each ten factors creates the
criticality/vulnerability rating. The data is collected via subjective self-assessment to
generate a reported estimated risk.
USAF Operational Risk Management (ORM).
This vulnerability assessment is a six-step process used to detect, assess, and
control risk while maximizing performance and combat capabilities of the Air Force. The
six steps include identifying hazards, assessing risk, analyzing risk controls, making
control decisions, implementing risk controls, and supervising decisions. The risk of an
attack is calculated using a pre-designed risk assessment matrix.
US Coast Guard Risk Assessment (RA) Project Management.
This vulnerability assessment process involves guidelines for selecting risk
assessment based on the scope of the evaluation, required stakeholders, required
preparations, data validation, and recommendation evaluations. The assets considered
include public or personal injury, equipment, property, or environmental damages,
revenue losses, and community relations.

46
US Coast Guard Risk-Based Decision Making.
This vulnerability assessment is implemented specifically by the transportation
sector for port and waterway conveyance. It examines physical, personnel, cyber, and
operational security to reduce the risk of attack and asset loss consequences. The
assessment is geared towards reducing and controlling hazards that increase terrorism
vulnerabilities, though specifics on vulnerability reductions were not reported. Risk of
attack is estimated by the probability, consequence, and severity of such events. The costs
of implementing such resources include proper training and procedures, though no
monetary values were reported.
Virginia Statewide Terrorism Target Assessment Survey.
This vulnerability assessment is implemented by law enforcement and examines
the potential of terrorist attacks at local events or locations. The vulnerability of local
events and locations is measured using a 0 to 5 scale for the following factors: visibility,
criticality, value, access, threat of hazard, population involved, and potential collateral
mass casualties.
Summary.
The ODP’s Vulnerability Assessment Methodology Report is the most
comprehensive record of existing methodologies, yet even this report is ineffectual. This
collection of information from commercial and government organization provided an
opportunity for departments to market their methods and maximize their department’s
potential; however, despite the opportunity to share compelling methodologies, the
reported methods were highly deficient, at best. While many methodologies exist, very

47
few offer inclusive instructions, details, and guides to measuring the vulnerability of
locations. Furthermore, in the rare event that the methodology does provide feeble
guidelines, the evaluations are highly subjective, leaving major room for error and biases
in the vulnerability scores. As presented through the above descriptions of existing
vulnerability assessment methodologies, there is a dire need for a comprehensive,
understandable, applicable, and objective-based methodology that can be easily applied
to assess the vulnerability of specific locations at the local level. The lack of objectivity
and difficulty applying existing methodology to real life targets and locations supports
the strengths of the EVIL DONE vulnerability assessment and the underlying need to
implement such a comprehensive and pertinent methodology.
Research Questions
Conclusively, a review of the literature reveals limited research findings on the
application of vulnerability assessments. Though many methodologies exist, a thorough
review of peer articles, government publications, and academic journals has yielded
inconclusive results on the application, as well as testing the validity of such
methodologies. In the post 9/11 era, government officials and the general public have
advocated for a simple and applicable method of assessing the vulnerability of specific
places. The research illuminates a need for a place vulnerability assessment that is based
on the theoretical foundations of situational crime prevention. The implementation of
vulnerability assessments that are easily applicable at the local level may contribute to
terrorism opportunity reduction.

48
Thus, the research questions that will frame this thesis examine the vulnerability
assessment methodology created by Clarke and Newman (2006) and Boba (2009), as
well as its validity in predicting the aftermath of terrorist attacks. In response to the
advocates’ desire for a simple, applicable method of assessing vulnerability, the study
will apply this methodology to a number of targets in hopes of determining the ease of
application for local officials.
Research Question 1
Is there a relationship between the EVIL DONE vulnerability score and the
number of fatalities and injured persons resulting from a terrorist attack? This research
question seeks to understand the correlation between the vulnerability score and the
aftermath of a terrorist attack in order to determine if there is a statistically significant
relationship.
Research Question 2
How are the components of EVIL DONE predictive of the number of fatalities
and injured persons resulting from a terrorist attack? This research question seeks to
understand how the individual components of EVIL DONE are related to the aftermath of
a terrorist attack. In other words, how does the score of Exposed/Vital/Iconic/etc.
independently reflect the number of fatalities and injured persons?
Research Question 3
How are the components of EVIL DONE predictive of the EVIL DONE
vulnerability score? This research question seeks to understand how the individual
components of EVIL DONE are related to the overall vulnerability score. In other words,

49
how does the score of Exposed/Vital/Iconic/etc. independently reflect the overall
vulnerability score once all factors have been considered?

50
CHAPTER 3: METHODOLOGY OF RISK AND VULNERABILITY ASSESSMENT
Introduction
Prior to assessing the factors of EVIL DONE on a location, possible targets within
a specific jurisdiction must be narrowed down to examine the locations with greater
potential risks. Literature on the topic of terrorism targets assists in confining the sample
locations down to the areas with historically higher risks. In other words, it is very
unlikely that a convenience store will be a target for terrorism over a skyscraper or a
major transient station. Therefore, previous literature reveals the types of locations that
are typically selected for assessment given their tendencies to bear greater risks. These
locations include water supplies, government buildings, schools, transportation hubs,
hospitals, information technology infrastructures, stadiums/arenas, ports, large buildings,
power plants, federal facilities, military locations, and international borders (Newman &
Clarke, 2008). Once the at-risk locations have been focused in on, the factors of EVIL
DONE can be assessed.
The purpose of this study is to evaluate the EVIL DONE vulnerability assessment
in order to determine if the methodology produces a cumulative vulnerability score that is
consistent with the number of fatalities and injured persons resulting from a terrorist
attack. Recognizing that the ultimate consequence from terrorist attacks is injury or loss
of human life justifies the selection of these variables as the primary dependent variables

51
of the study. Additionally, the study will seek to determine how strongly each
component of EVIL DONE predicts the number of fatalities and injured persons in
specific terrorist attacks. Lastly, this study will seek to distinguish which EVIL DONE
factors best predict the same dependent variables while controlling for other factors.
Research Design
The research design of this study is correlational given that the goal is to
determine the relationships between multiple variables. The correlational research design
does not insinuate a causal relationship with a definite cause and effect between
variables, but rather declares that a change in one variable is associated with a change in
the other (Babbie, 2010). Additionally, the research is designed to examine the
application of EVIL DONE to targets or locations that have previously been attacked, and
not in the original, prescriptive design to predict where an attack may occur. The reactive
application of EVIL DONE will be implemented in order to inform law enforcement
officials, researchers, and comparable practitioners of the uses of EVIL DONE so that the
methodology can be prescriptively applied within their jurisdictions.
The research will utilize both bivariate and multivariate analyses. A bivariate
analysis is used to examine two variables simultaneously in order to determine the
relationship between them (Babbie, 2010). The bivariate analysis used in this research
design is the computation of simple correlation coefficients. A multivariate analysis is
used to examine multiple variables simultaneously in order to determine the relationships
between them. Unlike bivariate analysis where there is one dependent variable and one
independent variable, multivariate analysis has more than one independent variable

52
(Babbie, 2010). Thus, rather than explaining variations in the dependent variable as a
result of changes in a single independent variable, multivariate analysis explains the
variations in the dependent variable as a result of multiple independent variables.
Data Collection
In examining the application of EVIL DONE to historical terrorist attacks, there
are many data that must be collected prior to the assessment. In collecting data on
historical terrorist attacks, one main data source and multiple supplemental data sources
were utilized.
The Global Terrorism Database (GTD) functioned as the main data source for
terrorist attacks occurring between 1970 and 2011. This is an open-source database that
includes detailed information on domestic, transnational, and international terrorist
attacks that have occurred around the world throughout the forty-year span (Global
Terrorism Database, 2012). When known and identifiable, information is reported on the
date and location of the incident, type of attack, type of target, type of weapons used,
number of fatalities and injured persons, and the extent of property damage as well as an
array of supplemental details. The data is collected, released, and updated via the
University of Maryland and The National Consortium for the Study of Terrorism and
Responses to Terrorism (START): A Center of Excellence of the U.S Department of
Homeland Security (GTD, 2012).
In addition to the GTD, multiple supplemental data sources were utilized to
collect information on terrorist attacks occurring after 2011 and to acquire more
comprehensive material on select incidents that was not available through the main data

53
source. The primary location of the supplemental data was Google Earth. Google Earth is
a “virtual globe” software system that allows users to view satellite images of locations
around the world (Sheppard & Cizek, 2009). The 3-dimensional interface of the entire
planet provides satellite imagery with the ability to zoom into individual countries, cities,
streets, and down to precise buildings (Sheppard & Cizek, 2009). Thus, to collect
information on the level of exposure, destructibility, and precise locations of specific
targets, each location was examined using this software program.
For this study, Google Earth was used to examine cases from the GTD (consisting
of terrorist attacks from 1991 to 2011) where the attributes of certain locations were
initially unknown. The notorious terrorist attacks selected that occurred prior to 1991
were not examined using Google Earth because of the potential inaccuracy of the images
due to physical changes over time and because there was sufficient information about
each location from other sources. That is, these notorious attacks were heavily supported
by media coverage at the time of the attack; therefore, the attributes of the locations were
heavily reported and easily identified.
Additionally, information was collected via Clarke and Newman’s text,
Outsmarting the Terrorist (2006). This text served not only as a sample population source
of historical terrorist attacks, but also as a source of data on each of these incidents.
Lastly, Google Internet searches provided newspaper articles from around the world that
were published shortly after each terrorist attack. Many of these publications originated
from the area immediately surrounding the targeted location, thus, they served as an
important source of information regarding each attack.
54
Sampling
Because the nature of terrorism is very complex and there are many factors that
differ from one attack to another, the sample was derived using a purposive sampling
method. Purposive sampling is a form of nonprobability sampling which does not utilize
randomization of selection (Babbie, 2010). Rather, purposive sampling, sometimes
referred to as judgmental sampling, is a method used to select a sample based on
available data and the purpose of the study (Babbie, 2010).
The sample size selected is based upon previous statistical analyses’
recommendations for the minimum number of subjects required to conduct the
appropriate tests. In conducting multiple regression analyses, the minimum number of
subjects can be equated through the greater total of two formulas: 50 + 8K or 104 + K
where k equals the number of variables in the study (Green, 1991). In this study, there are
seven variables (Exposed, Vital, Iconic, Legitimate, Destructible, Occupied, and Near).
The formulas correspond to a minimum of 106 or 111 subjects, respectively. In selecting
the greater of the two, the minimum number of subjects required to perform a multiple
regression analysis in this study is 111.
In this study, the data available via the GTD was a strong decree as to which
terrorist attacks would be selected for examination. Additionally, the purpose of the study
is to identify locations (i.e., targets) where the terrorist attacks occurred whose
characteristics stimulated terrorist attacks’ consequences. Thus, because the focus of
situational crime prevention and EVIL DONE is placed profoundly upon the target and

55
location, terrorist events were further selected based on the availability of information
meeting these criteria.
The primary data source, the GTD, consists of a population of over 104,000
terrorist attacks that occurred between 1970 and 2011. The database is divided into two
separate documents - terrorist attacks occurring between 1970 and 1990 and terrorist
attacks occurring between 1991 and 2011. The database of terrorist attacks occurring
between 1970 and 1990 is limited in the number of variables and information collected
on each attack in comparison to the data available in the latter database. For this reason,
as well as the relativity of more recent attacks in relation to older attacks, the data from
1991 to 2011 were chosen from which further purposive sampling was done.
The 1991 to 2011 database consisted of 59,786 terrorist events (i.e., cases). Using
the Global Terrorism Database Codebook: Inclusion Criteria and Variables, certain
events were eliminated after failing to meet specific requirements. In accordance with the
definition of terrorism, events were eliminated from the database if they 1) did not meet
the criterion for a political, economic, religious, or social goal, 2) if they did not meet the
criterion for intention to coerce, intimidate, or publicize to larger audiences, and 3) if they
did not meet the criterion for outside international humanitarian law. This resulted in
42,736 cases. Secondly, events were eliminated if there was a doubt as to whether the
incident was in fact an act of terrorism which resulted in 20,945 cases. Lastly, events
were eliminated if any important characteristics relevant to the EVIL DONE coding were
unknown, such as the type of target, location, and the type of weapons used which
resulted in 19,673 cases.

56
After narrowing down the sample by the abovementioned eliminations,
frequency by country was conducted. There were two natural breaks in the distribution at
less than 50 and more than 500 terrorist events. The countries with much higher counts
of terrorist attacks included Afghanistan (864), India (1,123), Pakistan (1,157), and Iraq
(1,844). Thus, countries with less than 50 events and more than 500 were eliminated from
the data resulting in approximately 1,500 cases.
From this point, particular events were chosen based on the amount and quality of
the available information on the targeted locations and the applicability of these locations
to the factors in EVIL DONE. In other words, the cases with the strongest information
available to assess the level of exposure, vitality, iconicity, legitimacy, destructibility,
occupancy, and location of the target were selected for evaluation. This final selection
resulted in 237 cases, which were then selected on a case-to-case basis to meet the
required number of cases for the multiple regression analyses.
In addition to the units selected through the database, terrorist attacks were also
selected for evaluation based on their historical value and notoriety. Because a
preponderance of information on terrorism and EVIL DONE has been collated in Clarke
and Newman’s book Outsmarting the Terrorists (2006), this source acted as a secondary
data source for terrorist events. Clarke and Newman (2006) used a wide variety of
important and notable terrorist events, such as the attack on the U.S.S. Cole and the
Oklahoma City bombings, as examples. Thus, 16 cases discussed in the text were also
included in the sample if they were not already included in the GTD.
57
Finally, notorious terrorist attacks occurring after the 2011 cut-off of the Global
Terrorism Database and the publishing of Outsmarting the Terrorists (2006) were
selected for target vulnerability assessments. These included events such as the 2012
bombing of the U.S. Embassy in Bengasi, Libya and the 2013 bombings at the U.S.
Boston Marathon. The combination of cases from the GTD, Outsmarting the Terrorists
(2006), and the recent terrorist attacks selected through purposive sampling results in a
database of 111 which is within the requirements for multivariate analysis (Green, 1991)
previously discussed.
Through the abovementioned sources, information valuable to the coding process
was collected. The data includes:
Country, Province or State, City: the location where the terrorist event occurred.
Location: the landmark or precise site of the terrorist event.
Attack type: the primary form of attack or tactics inflicted upon the target/location
(includes seven categories: bombing/explosion, armed assault, hijacking,
assassination, facility/infrastructure attack, hostage, and chemical).
Target type: the primary type of target or victim (includes eleven categories:
government, private citizens and property, police, military, business,
transportation, utilities, religious figures, airport and airlines, educational
institutions, and tourists).
Corporation: the name of the primary entity that was targeted (for example, Pan
Am Flight 103, Israeli Army, or the Russian Law Enforcement).

58
Target: the specific person, building, business, etc., from the corporation that was
victimized during the terrorist event (for example, civilians on Pan Am Flight
103, Israeli Defense Force (IDF) Reservists, or police patrol guarding an oil
pipeline near Goragorsky, Chechnya, Russia).
Number of fatalities: the total number of confirmed fatalities resulting from the
terrorist event. The number includes victims of the attack as well as the terrorists
involved.
Number of injuries: the total number of confirmed non-fatal injuries resulting
from the terrorist attack for both victims and the terrorists involved.
EVIL DONE Vulnerability Assessment Methodology and Coding
To further specify EVIL DONE, Boba (2009) established an objective coding
methodology, similar to some of the above-mentioned scaling methods, that assists in
scoring each one of the EVIL DONE factors. However, unlike the previously mentioned
methods, the methodology created by Boba attempts to reduce the biases and fickleness
of the coding procedures to strengthen the reliability of the EVIL DONE vulnerability
assessment score by breaking down each factor of EVIL DONE into a specific set of
criteria.
The coding methods were formulated similar to the CARVER schema, which is a
practice used by the U.S. Special Operations Forces as a guide for assessing targets from
the view point of the target’s owner (Criticality, Accessibility, Recuperability,
Vulnerability, Effect, and Recognizability) (Boba, 2009). By contrast, because the focus
of situational crime prevention is placed upon perception (e.g., increasing perceived

59
efforts and perceived risks, reducing perceived rewards, etc.) and “outsmarting”
terrorists, the coding method for EVIL DONE was formulated from the viewpoint of the
terrorists (Boba, 2009).
The goal of the coding system is to quantify and standardize a vulnerability
assessment based on the EVIL DONE concept (Boba, 2009). The first six factors
(Exposed, Vital, Iconic, Legitimate, Destructible, and Occupied) are scaled from zero to
five, meaning each item is ordinal and mutually exclusive. The last two factors (Near and
Exposed) are indexed, meaning each relevant item is summed to reach a numeric total
(Boba, 2009). For each factor, zero represents the lowest possible value and is only
warranted when the target does not meet the minimum criteria for the vulnerability of that
particular factor (Boba, 2009). Five represents the highest value and signifies the greatest
vulnerability of a target for that particular factor. Therefore, the utmost vulnerable target
and highest cumulative score for all EVIL DONE factors is 40. The least vulnerable
target and lowest cumulative score is 0.
Each factor has the highest vulnerability score of 5 and a lowest of 0 and is coded
based on knowledge of terrorist targets and key concepts of situational crime prevention
(Boba, 2009). After scoring each factor of a particular target, the cumulative score
functions as the EVIL DONE vulnerability score. The following coding information was
acquired from Boba (2009) and will function as the methodology for the vulnerability
assessment of each target from sampled terrorist attacks in this study.
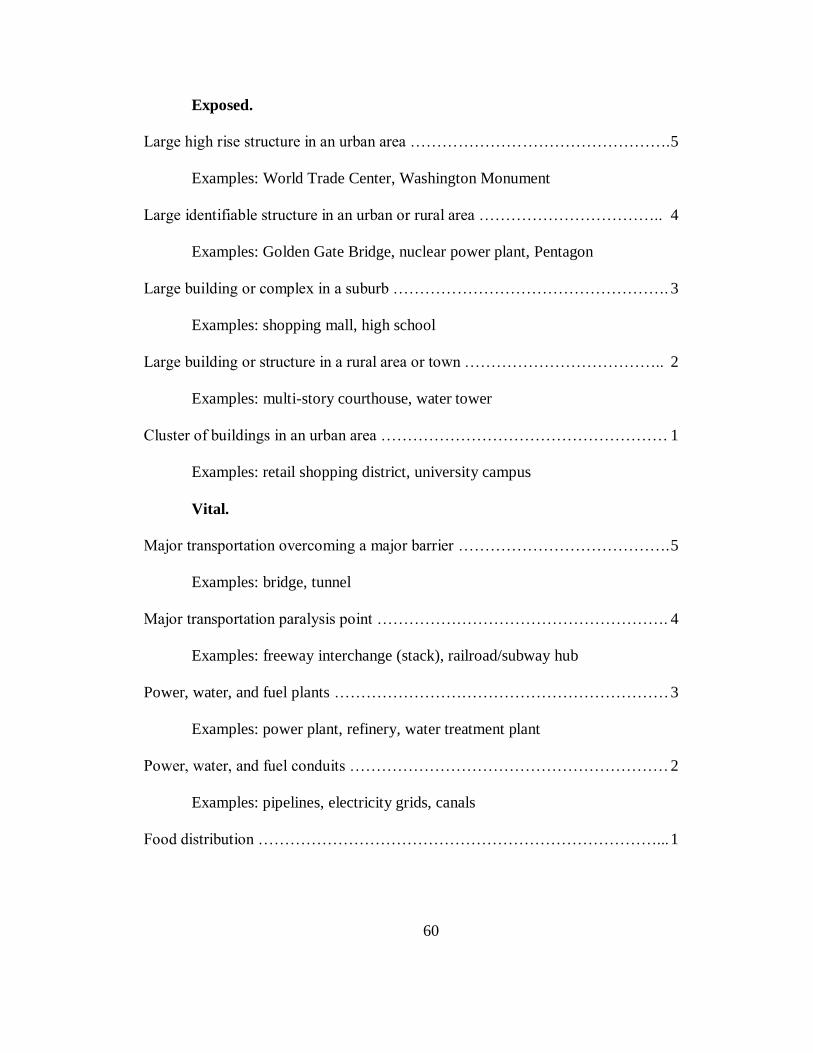
60
Exposed.
Large high rise structure in an urban area …………………………………………. 5
Examples: World Trade Center, Washington Monument
Large identifiable structure in an urban or rural area …………………………….. 4
Examples: Golden Gate Bridge, nuclear power plant, Pentagon
Large building or complex in a suburb ……………………………………………. 3
Examples: shopping mall, high school
Large building or structure in a rural area or town ……………………………….. 2
Examples: multi-story courthouse, water tower
Cluster of buildings in an urban area ……………………………………………… 1
Examples: retail shopping district, university campus
Vital.
Major transportation overcoming a major barrier …………………………………. 5
Examples: bridge, tunnel
Major transportation paralysis point ………………………………………………. 4
Examples: freeway interchange (stack), railroad/subway hub
Power, water, and fuel plants ……………………………………………………… 3
Examples: power plant, refinery, water treatment plant
Power, water, and fuel conduits …………………………………………………… 2
Examples: pipelines, electricity grids, canals
Food distribution …………………………………………………………………... 1

61
Iconic.
Major political symbol ……………………………………………………………. 5
Examples: White House, Capitol
Major national symbol …………………………………………………………….. 4
Examples: Statue of Liberty, Mt. Rushmore, Washington Monument
Federal and state government building …………………………………………… 3
Examples: FBI building, State capitol
Major commercial symbol ………………………………………………………… 2
Examples: Disney, Microsoft
Major city, town, religious building ………………………………………………. 1
Examples: city hall, large church or synagogue
Legitimate.
Houses military personnel or politicians ………………………………………….. 5
Examples: Pentagon, Capitol
Houses federal government employees or federal law enforcement personnel …… 4
Examples: State Department, Treasury Building, FBI headquarters
Houses state or local government or police ……………………………………….. 3
Examples: state capitol building, city hall, NYPD headquarters
Houses civilian workers …………………………………………………………... 2
Examples: World Trade Center, Microsoft, Ford auto making plant
Houses general citizenry ………………………………………………………….. 1
Examples: shopping mall, amusement park, house of worship

62
Destructible.
Destructible with IED (improvised explosive device) ……………………………. 5
Contains chemicals or other material that would hasten its
own or another targets destruction ……………………………………………. 4
Examples: chemical plant, oil refinery, train carrying radioactive material
Destructible with small conventional weapons …………………………………… 3
Destructible with heavy conventional weapons ……………………………………2
Destructible with a combination of weapons listed
in items 2 through 5 destruction…………………………………………….….. 1
Occupied.
Houses many people 24 hours per day, 7 days per week …………………………. 5
Examples: military base, hospital
Houses many people 8 – 12 hours daily ………………………………………….. 4
Examples: schools, large office buildings
Crowded space at specific times of day and days of the week ……………………. 3
Examples: subway terminals, buses, houses of worship
Crowded space at specific dates and times ……………………………………….. 2
Examples: concert hall, political speech/rally, sports stadium
Crowded spaces at specific times of the year; seasonal …………………………… 1
Examples: shopping mall at holiday season, water park, outdoor park on holidays

63
Near.
Close to known/suspected domestic/foreign terrorist base ……………………….. __
Close to country’s border, land, or sea (coast) …………………………………… __
Close to domestic immigrant community …………………………………………. __
Close to major transportation hub ………………………………………………… __
Examples: airport, train station, port
Many similar targets ………………………………………………………………. __
Examples: bus stops, open markets, subway stations
Total Score ………………………………………………………………… __
Easy.
Public access to building/ no security check ……………………………………… __
Parking near the building and/or unrestricted …………………………………… __
Some entry points unsecured or not monitored …………………………………… __
Inadequate security personnel …………………………………………………….. __
Inadequate security cameras and monitoring ……………………………………… __
Total Score ………………………………………………………………… __
For example, the coding process of the September 11th, 2001 attack on the World
Trade Center is as follows: For the Exposed factor, the large high rise structure in an
urban area was coded as a 5. Because the target does not meet the minimum criteria for
the Vital factor, Vital was coded as a 0. For the Iconic factor, the target is not a political
symbol, but does meet the criteria for a major national symbol; therefore, the Iconic
factor was coded as a 4. Due to the lack of political or government relations and

64
following the criteria for Legitimate, the target received a 2 for housing civilian workers.
While the destructibility of each location is subject to the internal composition and
construction of the building, this factor is scored on the basic/observable structure of the
target. Because of the failure to destruct the in the 1993 attack using an IED and based on
the durability of present-age construction, the Destructible factor was scored as a 2,
meaning destructible with heavy conventional weapons. The Occupied factor was scored
as a 4 due to the nature of the building – large office building that houses many people
for 8-12 hours daily. The indexed Near factor earned a total of 3 points for being close to
the country’s border, close to major transportation hub, and close to many similar targets.
For reasons that will be subsequently discussed, two of the five criteria for the Near
factor (close to known/suspected domestic/foreign terrorist base and close to domestic
immigrant community) as well as the entire Easy factor were excluded from this analysis.
Thus, the total vulnerability score for the World Trade Center is a 20.
Data Analysis Procedures
In analyzing the relationship between the EVIL DONE vulnerability assessment
and the number of fatalities and injured persons resulting from a terrorist attack, multiple
methods will be utilized based on the nature of the research question. Before discussing
the analyses that was used in this study, an examination of the variables is warranted. The
dependent variables of the study are the number of fatalities, the number of injured
persons, and the EVIL DONE vulnerability assessment score (i.e., the sum of all scores
from each EVIL DONE factor).

65
Dependent and Independent Variables
Throughout the coding process, certain variables were revealed after assessing the
research questions and the data required to answer each. Two dependent variables were
used in the analyses depending on the research question. The first is a sum of the injuries
and fatalities caused by the terrorist attack. The two measures—fatalities and injuries—
are combined to indicate the results of the terrorist attack and thus its overall seriousness.
To compute this variable, total number of injuries was added to the number of deaths
multiplied by 20. That is, fatalities were scaled to a value of 20 per individual fatality, to
represent the fact that fatalities are a much deeper consequence than less severe/nonfatal
injuries.
The second dependent variable is the EVIL DONE vulnerability assessment score
which indicates the level of vulnerability of a particular location. Although Boba (2009)
provides specific and objective criteria for each factor of EVIL DONE, this study
excludes the Easy factor due to unknown and/or unreported information regarding the
specific criteria of this factor from the selected data sources. For example, parking near
the building and/or unrestricted parking is difficult to accurately measure from a remote
location. Additionally, the other factors, such as the adequacy of security personnel on
duty and the number and adequacy of security cameras and monitoring systems are not
reported in the GTD, nor are they typically reported to the public. However, this is not a
weakness of EVIL DONE but a deficiency in the data that were used. This deficiency
further accentuates the importance of applying the assessment as a method of situational
crime prevention and opportunity reduction rather than subsequent application after a

66
terrorist attack. The vulnerability assessment was created with the intention of identifying
targets vulnerable to terrorist attacks, and not for application to locations that have
already been victimized. Thus, during the identification process of potential targets, the
criterion for the Easy factor may be more easily measured and obtained.
Additionally, two of the criteria for the Near factor were also excluded from this
study for comparable reasons. The Near factor is indexed based on five criteria—close to
known/suspected terrorist base, close to own country’s border or coast, close to domestic
immigrant community, near major transportation hub, and many similar targets. Based on
the information provided via the main data source and supplemental data sources, sparse
findings regarding the location of known/suspected terrorist bases and domestic
immigrant communities would result in inconsistent scoring of the Near factor.
Furthermore, because of the age of some events, this information is not available through
additional inquiries. Thus, to increase the reliability of the overall vulnerability
assessments, these two criteria were eliminated from the Near index, resulting in a
maximum score of 3 instead of 5 for this factor. Considering the exclusion of the Easy
factor and two of the indexes for the Near factor, the maximum EVIL DONE
vulnerability assessment score is 33 instead of 40. Finally, the independent variables are
the seven coded factors which include Exposed, Vital, Iconic, Legitimate, Destructible,
Occupied, and Near. The following sections lay out how these variables will be
examined for each research question.

67
Analysis Methods Research Question 1
The first research question is: Is there a relationship between the EVIL DONE
vulnerability score and the cumulative number of fatalities and injured persons resulting
from a terrorist attack? The question seeks to determine if there is a bivariate relationship
between the EVIL DONE vulnerability score and combined number of fatalities
(multiplied times 20) and injured persons. This question was examined using a simple
correlational analysis.
The correlation statistics show relationship between two variables and the strength
of the relationship (or linear association) (Norusis, 2008). Multiple correlation
coefficients can be used to discover the relationship of the variables depending on the
nature and measurability of those variables. For example, a Pearson correlation
coefficient is used when the variables are measured at the interval level. Kendall’s tau-b
correlational coefficient is used when the variables are measured at the ordinal level.
Lastly, a Spearman correlational coefficient is used when variables have ranking orders
that are also measured at an ordinal level (Norusis, 2008). Because the variables in this
study are measured at the interval level, a Pearson correlation coefficient was used.
Additionally, there are two forms of Pearson correlation coefficient – one-tailed
tests and two-tailed tests. One-tailed tests are used when the relationship between the
variables is directional (i.e., the higher the Exposure score, the higher the overall
vulnerability score). Two-tailed tests are used when the relationship between the
variables is non-directional (i.e., the higher the Exposure score, the lower or higher the

68
overall vulnerability score may be) (Field, 2009). Because the relationship between the
two variables is non-directional, two-tailed tests were used.
Correlation coefficient tests reveal the strength of the relationship between two
variables in the form of a numeric decimal ranging from positive or negative 0.00 to 1.00.
A correlation of 0.00 indicates that the two variables are entirely unassociated with one
another. A correlation of 1.0 indicates that the two variables are directly associated with
one another. Additionally, a positive score reveals that the two variables hold a positive
relationship; in other words, as one variable rises, so too does the other. A negative score
reveals that the two variables hold a negative relationship; in other words, as one variable
rises, the other variable declines.
Once the relationship is expressed in a numerical value, the significance of the
findings must be examined. In other words, what does a -.037 correlation mean? Does a
significant relationship exist between two variables with a -.037 correlation coefficient?
While many measures of significance exist, the measure utilized in this study was
developed by Salkind (2011). Salkind (2011) states the following regarding the
significance or strength of the correlation coefficient:
+/- .8 to .10 – very strong relationship
+/- .6 to .8 – strong relationship
+/- .4 to .6 – moderate relationship
+/- .2 to .4 – weak relationship
+/- .0 to .2 – very weak relationship

69
Thus, according to Salkind’s guidelines for the strength of a correlation, the
relationship between two variables was considered moderate at the 0.40 level and
significantly stronger thereafter.
The hypothesis for this research question is that the more fatalities and injured
persons resulting from a terrorist attack, the higher the EVIL DONE vulnerability score.
Analysis Methods Research Question 2
The second research question is: How are the components of EVIL DONE
predictive of the cumulative number of fatalities and injured persons? This question
seeks to determine how well the independent variables (i.e., EVIL DONE factors) predict
the value of the dependent variable – the number of injured fatalities and injured persons.
This question was examined using multiple regression analysis. A multiple regression
analysis examines the relationships more precisely than the previous analysis
(correlation) in that it seeks to determine how well the independent variables explain the
variance in the dependent variable, while controlling for other independent variables.
The variance is a measure of variability based on the distance between each value to the
mean (Norusis, 2008). To compute the variance of any given sample, the following
formula is used (Norusis, 2008):
Variance = Sum of squared distances from the mean for all cases
(Number of cases – 1)
A variance of 0 indicates that all of the cases in the sample have the same value.
A low variance indicates that the value of each variable is close together. A high variance
indicates that the value of each variable is highly spread out. Once the variance is

70
calculated, the standard deviation can be found by taking the square root of the variance
(Norusis, 2008).
Multiple regression analysis is a more complex form of testing often used when a
dependent variable is affected by multiple independent variables and is used to
understand the impact of two or more variables on a single dependent variable (Babbie,
2010). While there are multiple methods of multiple regression analysis, the most
commonly used methods require less complex computations and are the methods used in
this study: forward selection and backward elimination (Norusis, 2008).
Backward elimination method, also referred to as backward stepwise, begins with
all variables included and considered in the initial model. In each step or model of the
analysis, the variable with the lowest significance is eliminated, thus resulting in the
variable with the strongest significant effect on the dependent variable being the only
variable in the final model (Norusis, 2008). This method of multiple regression was used
to reveal which factor of EVIL DONE was the most predictive of the cumulative number
of fatalities and injured persons resulting from a terrorist attack.
The hypothesis for this research question is that Occupied and Destructible will be
most predictive of the number of fatalities and injured persons resulting from a terrorist
attack.
Analysis Methods Research Question 3
The third research question is: How are the components of EVIL DONE
predictive of the EVIL DONE vulnerability score? It seeks to determine how the
components of EVIL DONE are predictive of the overall vulnerability score using a
71
multiple regression analysis as well. That is, this analysis essentially tests whether the
EVIL DONE methodology and its components are valid and whether individual factors
have more influence over the determination of a location’s overall vulnerability score.
To test this research question, a forward selection, also called forward stepwise,
multiple regression test was conducted. Unlike backward stepwise, forward stepwise
methods starts the analysis using only the strongest constant (i.e., variable) in the initial
model, and progressively adds the next variable that results in the largest increase in
significance, or R2. Variables are added to the model in the order of most to least
significant, and finally ending when no more variables exists that would result in a
significant increase to R2
(Norusis, 2008). This method of multiple regression was used
to discover which component of EVIL DONE was the most predictive of the overall
vulnerability score.
The hypothesis for this research question is that Iconic and Legitimate will be the
most predictive of the EVIL DONE vulnerability score of any given location/target.
Summary and Limitations
The overall goal of this study is to evaluate the validity of the EVIL DONE
vulnerability assessment score in comparison to the number of fatalities injured persons
resulting from a terrorist attack. In order to do so, data has been collected using the most
comprehensive source of information available through the Global Terrorism Database
and supplemental research tactics, such as the use of Google Earth for visual analysis and
international news reports.

72
Using an objective scaling guide provided by Boba (2009), 111 terrorist attacks
have been coded to reveal an overall vulnerability score. The data was then entered into
an SPSS software program where multiple analyses were conducted to address the above
mentioned research questions. While the results of the study will be discussed in the next
section, it is important to address the limitations of the current study.
The greatest limitation of this study concerning the ability of the EVIL DONE
vulnerability assessment to predict the number of fatalities and injured persons is the
exclusion of the Near and Easy factors. While 3 of the 5 indexes in the Near factor were
included in the study, 2 valuable indexes were excluded: close to known/suspected
domestic/foreign terrorist base and close to domestic immigrant community. The entire
Easy factor was also excluded. The exclusion of these factors not only resulted in a
maximum overall vulnerability score of 33, as opposed to 40, but also excluded valuable
variables that may be significantly related to the outcome (i.e., number of fatalities and
injured persons) of the examined terrorist attacks. Future studies implementing EVIL
DONE should seek to apply the assessment in a proactive, rather than reactive manner, in
order to address each of the essential dependent variables.
In addition to the inability to collect information on the Easy and Near factors,
details of every target and/or terrorist attack were not always available and/or uniform.
Thus, in some instances, coding for certain factors was estimated based on the best
available information. In rare events, the number of fatalities and/or injured persons
varied from source to source; though, in most cases, the discrepancies were trivial.

73
In summary, the research design of this study utilized a correlational rather than
causal examination of the variables related to the respective research questions via both
bivariate and multivariate analyses. The data was collected primarily from the GTD,
which acted as both a strength and weakness. Despite the fact that the GTD was the most
comprehensive source available for information on terrorist attacks occurring over the
past forty-years, some information vital to the EVIL DONE methodology was not
available, such as data related to the Easy and Near factor. Thus, two of the five criteria
for Near and all of the Easy factor were excluded from the study. Despite the mentioned
limitations, the study still holds many valuable insights to the use of EVIL DONE as a
vulnerability assessment for potential terrorist targets. The findings of the study will be
examined and analyzed in great detail in the following chapter. Through the use of
correlation and multiple regression analyses, the responses to each research questions
developed through the examination of EVIL DONE and terrorism will be addressed.
74
CHAPTER 4: DATA ANALYSIS
The purpose of this chapter is to present the results of the examination of each of
the research questions and their hypotheses. The chapter covers descriptive statistics of
key variables examined including the frequencies of the type of attack, target type, year
of attack, and distribution of attacks per country. Following that, the statistical findings
of the bivariate and multivariate analysis will be illustrated, specifically, the Pearson
correlations between the dependent and independent variables that seek to answer
Research Question 1, the backward stepwise multiple regression analysis for Research
Question 2, and the frontward stepwise multiple regression analysis for Research
Question 3. The data collected for this study was entered into SPSS statistical software
program. The program was then used to analyze the data and run a variety of statistical
operations (Norusis, 2008). SPSS was utilized as the solitary statistical software in this
study, and conducted both the correlation and multiple regression analyses that were used
to address the research questions. The analysis and interpretation of the results will be
presented in this chapter, while the following chapter will include a discussion and
conclusion of these findings.
Descriptive Statistics
Descriptive statistics provide detailed information about each of the ratio and
nominal variables used in this study. The descriptive analyses examined the attributes of
the 111 terrorist attacks in the study, such as the type of attack, type of target,

75
locations/countries of the terrorist attack, and the years that the attacks occurred. The
independent and dependent variables (i.e., ratio variables) were examined through the use
of mean, median, standard deviation, and minimum and maximum values.
Characteristics of the Terrorist Attacks
Table 1 depicts the breakdown of the terrorist attacks by their type/form. It shows
that the majority of the attacks were bombings or explosions, which totaled 65.8 percent
of the 111 terrorist attacks examined here. These findings are consistent with research
concluding that explosives accounted for nearly 75 percent of all terrorist incidents
occurring between 1980 and 2001 (Clarke & Newman, 2006). The second most frequent
type of attack was armed assault, which comprised 15.3 percent of the total. Following
armed assaults, the subsequent forms of terrorist attacks held minor percentages including
hostage (6.3 percent), hijacking (5.4 percent), facility/ infrastructure attack (4.5 percent),
assassination (1.8 percent), and chemical (0.9 percent).
Table 1
Frequency of Type of Attack
Frequency Percent
Bombing/Explosion 73 65.8
Armed Assault 17 15.3
Hostage 7 6.3
Hijacking 6 5.4
Facility/Infrastructure Attack 5 4.5
Assassination 2 1.8
Chemical 1 0.9
Total 111 100.0

76
Table 2 depicts the breakdown of terrorist attack target types. The most frequent
target was the government, which totaled 21.6 percent of the 111 terrorist attacks
examined here. The second most frequent type of target was private citizens, which
comprised 18.9 percent of the total. Police and military were equally targeted and
comprised 10.8 percent of the total targets independently. Following police and military
targets, the subsequent forms of target types held minor percentages including businesses
(9.9 percent), transportation (7.2 percent), utilities (6.4 percent), religious figures, (5.4
percent), airports and airlines (2.7 percent), educational institutions (2.7 percent), tourists
(1.8 percent), and non-government organizations (1.8 percent).
Table 2
Terrorist Attack Target Type
Frequency Percent
Government 24 21.6
Private Citizen & Property 21 18.9
Police 12 10.8
Military 12 10.8
Business 11 9.9
Transportation 8 7.2
Utilities 7 6.4
Religious Figures 6 5.4
Airports/Airlines 3 2.7
Educational Institutions 3 2.7
Tourists 2 1.8
NGO 2 1.8
Total 111 100.0
Table 3 depicts the frequency of terrorist attacks in 5 year increments, with the
exception of the first and last category. The first category includes all attacks prior to
1990, and the last category includes all attacks from 2011 to 2013. The frequencies show

77
5.4 percent of the attacks occurred in or prior to 1990, with the earliest terrorist attack
occurring in 1972. From 1991 forward, terrorist attacks were examined in 5 year
intervals. Between 1991 and 1995, 5.4 percent of the terrorist attacks occurred. Between
1996 and 2000, 19.8 percent of the attacks occurred. Between 2001 and 2005, 27.9
percent of the attacks occurred. Between 2006 and 2010, 24.3 percent of the attacks
occurred. Lastly, between 2011 and 2013, 17.1 percent of the terrorist attacks occurred. It
is important to note that the frequencies of the attacks by year are not a reflection of the
actual frequencies of terrorist attacks globally, but rather a result of the purposive
sampling method. Each attack was selected using the methodology discussed in the
previous chapter and is not an indication of the frequencies of actual terrorism.
Table 3
Terrorist Attacks by Year
Frequency Percent
1972-1990 6 5.4
1991-1995 6 5.4
1996-2000 22 19.8
2001-2005 31 27.9
2006-2010 27 24.3
2011-2013 19 17.1
Total 111 100.0*
*Totals may not equal 100% because of rounding.
Table 4 depicts the location/country where the terrorist attacks occurred. The table
shows that 14.4 percent of the terrorist attacks in this study occurred in Russia. The
second most frequent country was the United States, which comprised a total of 11.7
percent. Algeria was the third most frequent location for terrorist attacks and comprised a

78
total of 9.9 percent. Following Algeria, 21 countries ranged from 0.9 to 9.0 percent of the
study.
Table 4
Terrorist Attacks by Country
Frequency Percent
Russia 16 14.4
United States 13 11.7
Algeria 11 9.9
Colombia 10 9.0
Philippines 9 8.1
Israel 7 6.3
Nigeria 6 5.4
Somalia 6 5.4
Thailand 5 4.5
United Kingdom 5 4.5
Yemen 4 3.6
Indonesia 3 2.7
Turkey 3 2.7
Nepal 2 1.8
Northern Ireland 2 1.8
Germany 1 0.9
Greece 1 0.9
India 1 0.9
Japan 1 0.9
Kenya 1 0.9
Lebanon 1 0.9
Libya 1 0.9
Scotland 1 0.9
Tanzania 1 0.9
Total 111 100.0*
*Totals may not equal 100% because of rounding.
Independent and dependent variables.
The subsequent analyses used the following 11 variables: Exposed, Vital, Iconic,
Legitimate, Destructible, Occupied, Near, the number of fatalities, the number of injured

79
persons, the number of fatalities and injured persons, and the EVIL DONE vulnerability
score. The independent variables are each of the EVIL DONE factors, whereas the
number of fatalities and injured persons comprise the first dependent variable. The EVIL
DONE vulnerability score functions as an independent variable in Research Question 2
and as a dependent variable in Research Question 3. Measures of central tendency are
used to examine each variable individually, and then correlation is used to describe the
relationship of each variable to one another prior to examining the relationships
addressed in the research questions.
Measures of central tendency.
Table 5 depicts the means, medians, standard deviations, minimum values, and
maximum values of all the variables.
Table 5
Description of Variable Data
Mean Median Standard
Deviation
Minimum Maximum
Exposed 1.52 1.00 1.75 0 5
Vital 0.59 0.00 1.34 0 5
Iconic 1.60 1.00 1.87 0 5
Legitimate 2.43 2.00 1.66 1 5
Destructible 3.84 4.00 1.25 1 5
Occupied 3.10 3.00 1.65 0 5
Near 2.14 2.00 0.95 0 3
Vulnerability Score 15.23 15.00 4.33 6 25
Fatalities 47.99 3.00 268.48 0 2,772
Injured 81.15 8.00 404.80 0 4,000
Fatalities/Injured 511.15 70.00 1448.73 0 8,800
Note: n=111

80
For Exposed, the results show that the minimum score was 0 and the maximum
score was 5. The average for the Exposed factor of the locations was 1.52 with a
standard deviation of 1.75. Fifty percent of the locations scored less than 1 and fifty
percent scored more than 1. Thus, these statistics show that the majority of locations were
not highly Exposed at the time of the attack and resembled a cluster of buildings in an
urban area rather than high-rise structures.
For Vital, the results show that the minimum score was a 0 and the maximum
score was a 5. On average, the locations scored a 0.59 for vitality with a standard
deviation of 1.34. Fifty percent of the locations scored a 0 and fifty percent score higher
than 0. These statistics show that a large majority of the locations (81.6 percent) were
highly non-vital locations at the time of the attack and did not meet the minimum criteria
for scoring.
For Iconic, the results show that the minimum score was a 0 and the maximum
score was a 5. On average, the locations scored a 1.60 for iconicity with a standard
deviation of 1.87. Fifty percent of the locations scored less than 1 and fifty percent scored
more than 1. These statistics show that, similarly to the Exposed factor, the majority of
the locations were not highly Iconic but rather more closely resembled a major city, town,
or religious building.
For Legitimate, the results show that the minimum score was a 1 and the
maximum score was a 5. On average, the locations scored a 2.43 for legitimacy with a
standard deviation of 1.65. Fifty percent of the locations scored less than 2 and fifty
percent scored more than 2. These statistics show that the sample included locations with

81
a fair variety of Legitimate rankings, though the majority still scored towards the lower
end of the scale, resembling locations which house civilian workers.
For Destructible, the results show that the minimum score was a 1 and the
maximum score was a 5. On average, the locations scored a 3.84 for destructibility with a
standard deviation of 1.25. Fifty percent of the locations scored less than 4 and fifty
percent scored more than 4. These statistics show that a majority of the locations were
moderately Destructible (e.g., destructible with small conventional weapons) and that the
majority of scores were only slightly skewed from the mean value of 3.84.
For Occupied, the results show that the minimum score was 0 and the maximum
score was 5. On average, the locations scored a 3.10 for occupancy with a standard
deviation of 1.65. Fifty percent of the locations scored less than 3 and fifty percent scored
more than 3. These statistics show that the distribution of locations’ Occupied score was
relatively equal in that median reflects the true middle value on the occupancy scale,
resembling a crowded space at specific times of day/days of week.
For Near, the results show that the minimum score was a 0 and the maximum
score was a 3. On average, the locations scored a 2.14 with a standard deviation of 0.95.
Fifty percent of the locations scored less than 2 and fifty percent scored more than 2.
Because 3 was the maximum value for the Near index, the statistics show that the
distribution is relatively even; however, a majority of the locations met the criteria for at
least two of the three indexes.
For the EVIL DONE vulnerability score, the results show that the minimum score
was a 6 and the maximum score was a 25. On average, the locations merited a cumulative

82
vulnerability score of 15.23 with a standard deviation of 4.33. Fifty percent of the
locations scored less than 15 and fifty percent scored more than 15. Considering that the
maximum vulnerability score is 33 with a median of 16.5 according to the cumulative
maximum scores of all the EVIL DONE components, the median and mean value of 15,
and the standard deviation being around one third of the mean reflects a fairly equal
distribution of vulnerability scores for the sampled locations.
For the total number of fatalities, the results show that the minimum value was 0
and the maximum value was 2,722. The terrorist attacks resulted in an average of 47.99
fatalities with a standard deviation of 268.48. Fifty percent of these attacks resulted in
less than 3 fatalities and fifty percent resulted in more than 3 fatalities. These statistics
show that the distribution is highly skewed in that most of the incidents had very few
fatalities; however, there were also few incidents with many fatalities which distorted the
mean value. For example, the 9/11 attacks resulted in 2,772 fatalities. The terrorist attack
that resulted in the second most fatalities in this study was a hostage situation at an
Elementary School in Russia, occurring in 2004. This attack resulted in 332 fatalities.
Disregarding the terrorist attacks at the lower end of the fatality reports, the range
between the terrorist attacks with highest and second highest fatalities was 2,440.
For the total number of injured persons, the results show that the minimum value
was 0 and the maximum value was 4,000. The terrorist attacks resulted in an average of
81.15 injured persons with a standard deviation of 404.80. Fifty percent of these attacks
resulted in less than 8 injured persons and fifty percent resulted in more than 8 injured
persons. Similarly to findings in the fatalities results, the statistics show that the

83
distribution is highly skewed in that most of the incidents had very few injured persons;
however, there were also very few incidents with many injured persons which distorted
the mean value. For example, the 1998 attack on the U.S. Embassy in Nairobi, Kenya
resulted in 4,000 injured persons. The attack with the second highest number of injured
persons was the 1991 attack on the World Trade Center in New York City, which
resulted in 1,042 injured persons.
For the combined number of fatalities and injured persons, the results show a
minimum value of 0 and a maximum value of 8,800. The terrorist attacks resulted in an
average of 511.15 harmed (i.e., killed or injured) persons with a standard deviation of
1,448.73. Fifty percent of the attacks resulted in less than 70 harmed persons and fifty
percent resulted in more than 70 harmed persons. Again, similar to the fatalities and
injured persons results, the statistics show that the distribution is highly skewed in that
most of the incidents had few harmed persons; however, there were few incidents with
many harmed persons which distorted the mean value. These findings are sensible
considering that the variable is a combination of the two variables fatalities and injured
persons. Thus, the results should frame the statistical findings of those two variables.
In summary, most of the EVIL DONE components had relatively low average
scores, with the few exceptions of Destructible and Occupied. Occupied was the most
evenly distributed of all components, with a relatively equal distribution of terrorist
attacks at each scoring level. Destructible and Legitimate were the only EVIL DONE
components whose minimum criteria were met for every terrorist attack in the study (i.e.,
no attacks failed to meet the minimum criteria and scored a zero). Three variables had

84
significant outliers that dramatically skewed the average results, including the number of
fatalities, the number of injured persons, and the combined number of fatalities and
injured persons
Correlations
Prior to examining the research questions, it was important to conduct descriptive
statistics on the relationships between the EVIL DONE components to see how, for this
sample, the components are related to one another. The correlations between each
variable in this study can be examined in Table 6.

85
Table 6
Pearson Correlation
Fatalities Injured Fatalities
/
Injured
E V I L D O Near Vul
Score
Fatalities P.Corr 1 .388** .966** .212* -.066 .130 -.013 -.184 .092 .106 .121
Sig .000 .000 .025 .491 .174 .889 .054 .337 .269 .204
Injured P.Corr .388** 1 .613** .215* -.058 .223- .127 -.182 .135 -.063 .198*
Sig .000 .000 .025 .553 .020 .192 .059 .165 .517 .040
Fatalities
/Injured P.Corr .966
** .613
** 1 .137 -.099 .065 .046 -.200
* .182 .062 .096
Sig .000 .000 .157 .307 .501 .636 .038 .059 .525 .322
E P.Corr .212* .215
* .137 1 -.021 .486
** .229
* -.585
** .562
** -.114 .715
**
Sig .025 .025 .157 .825 .000 .016 .000 .000 .234 .000
V P.Corr -.066 -.058 -.099 -.021 1 -.285**
-.280**
.069 -.056 .029 .077
Sig .491 .553 .307 .825 .002 .003 .473 .562 .762 .424
I P.Corr .130 .223* .065 .486
** -.285
** 1 .614
** -.449
** .344
** -.251
** .720
**
Sig .174 .020 .501 .000 .002 .000 .000 .000 .008 .000
L P.Corr -.013 .127 .046 .229* -.280
** .614
** 1 -.323
** .244
** -.258
** .596
**
Sig .899 .192 .636 .016 .003 .000 .001 .010 .006 .000
D P.Corr -.184 -.182 -.200* -.585
** .069 -.449
** -.323
** 1 -.457
** .049 -.407
**
Sig .054 .059 .038 .000 .473 .000 .001 .000 .606 .000
O P.Corr .092 .135 .182 .562**
-.056 .344**
.244**
-.457**
1 .015 .703**
Sig .337 .165 .059 .000 .562 .000 .010 .000 .879 .000
Near P.Corr .106 -.063 .062 -.114 .029 -.251**
-.258**
.049 .015 1 -.005
Sig .269 .517 .525 .234 .762 .008 .006 .606 .879 .956
Vul
Score P.Corr .121 .198
* .096 .715
** .077 .720
** .596
** -.407
** .703
** -.005 1
Sig .204 .040 .322 .000 .424 .000 .000 .000 .000 .956
**. Correlation is significant at the 0.01 level (2-tailed). *. Correlation is significant at the 0.05 level (2-tailed)

86
Salkind (2011) defined parameters for interpreting the strength of the
relationships via the correlation coefficient. The parameters of the coefficient strength are
as follows:
+/- .8 to 1.0 – very strong relationship
+/- .6 to .8 – strong relationship
+/- .4 to .6 – moderate relationship
+/- .2 to .4 – weak relationship
+/- .0 to .2 – very weak relationship
Two “very weak” relationships were found, one of which is related to Research
Question 1, which will later be discussed in greater detail. The first is between the
combined variable of number of fatalities and injured persons and the destructibility of
the location/target with a Pearson correlation of -.200 (p= 0.04). The correlation
expressed a negative relationship between the destructibility and the number of fatalities
and injured persons that suggests that as the destructibility of a target increases, the
number of fatalities and injured persons decreases. This correlation is not in the expected
direction; however, possible explanations for this finding will be discussed in the final
chapter.
The second very weak relationship was found between the number of injured
persons and the EVIL DONE vulnerability score with a Pearson correlation of .198
(p=0.40). This finding suggests that as the EVIL DONE vulnerability score increases, the
number of injured persons also increases. The positive correlation between the EVIL
DONE vulnerability score and the number of injured persons is in the expected direction

87
based on the founding principles of the vulnerability assessment methodology. The
methodology was established to generate a vulnerability score that reflected the aftermath
of a terrorist attack in an equivalent direction.
Twelve “weak” correlations were found. The relationship between Exposed and
the number of fatalities and the number of injured persons is .212 (p=.03), and .215
(p=.03), respectively. Although weak correlations, the direction of these relationships are
positive and suggest that the more Exposed a target or location is, the more fatalities and
injured persons resulted from the terrorist attack independently. These findings are
expected considering the literature which suggests that locations that are more visible are
more attractive to terrorists and receive much more attention than less visible targets.
Iconic was found to have a weak relationship with both the number of injured
persons (.223, p=.02) and the Vital factor (-.285, p=.00). Although weak, the findings
suggest that the more Iconic a target or location is, the more injured persons would result
from a terrorist attack and the less Vital the location may be. These relationships are in
the expected direction given that Iconic locations are characteristically large in size, or
hold some unique feature. Therefore, their ability to house large amounts of people
allows for a greater population to potentially be harmed. Also, the findings between
Iconic and Vital are in the expected direction as Iconic targets (e.g., Statue of Liberty,
Disney World, City Hall, etc.,) are not major necessities of a community, and therefore
are not considered vital to everyday behaviors, as a major transportation point or power
source would be.

88
Legitimate was found to have a weak relationship with five other factors:
Exposed, Vital, Destructible, Occupied and Near. Legitimate held a positive relationship
with both Exposed and Occupied, with a correlation coefficient of .229 and p=.02 and a
correlation coefficient of .244 and p=.01, respectively. The positive relationships suggest
that the more Legitimate a target is, the more Exposed it will be and the more people it
will house. The relationships between these factors are in the expected direction as one
would anticipate highly Legitimate targets (i.e., those that house military personnel or
politicians) to be large identifiable structures that consequently house many people for
longer periods of time, such as the White House or military bases. Legitimate also has a
negative relationship with Vital, Destructible, and Near, with a correlation coefficient of -
.280 and p=.00, -.323 and p=.00, and -.258 and p=.00, respectively. The negative
relationships suggest that as the Legitimate score increases, the Vital, Destructible, and
Near scores decrease. All three of these relationships are in the expected direction
considering that highly Legitimate targets are seldom Vital locations that would deny a
community access to necessities. Additionally, it is expected that highly Legitimate
targets would be less Destructible given their political and military alliances and
prerogatives. The negative relationship between Legitimate and Near is also as expected
as it would be presumed that highly Legitimate targets would be in less susceptible
locations far from borders/coasts, major transportation hubs, and similar targets.
Lastly, Iconic was found to have two weak relationships with Occupied and Near.
Iconic and Occupied held a correlation coefficient of .344 with p=.01, suggesting a
positive relationship in that as one factor increase, so does the other. The direction of this

89
relationship is as expected in that a majority of Iconic targets are large, relative to the
surrounding areas. For example, Disney World is a major commercial symbol in the
United States and has the capacity to house thousands of people at any given time.
Conversely, Iconic and Near held a correlation coefficient of -.251 with p=.008, which
suggests a negative relationship. The findings suggest that the most Iconic locations fail
to meet some, if not all, of the criteria of the Near factor, including close to a country’s
border, land, or sea, close to a major transportation hub, or many similar targets. The
relationship was in the expected direction since most Iconic locations are unique, hence
their Iconic value.
Seven “moderate” correlations were found amongst the EVIL DONE variables,
meaning the correlation coefficient fell between +/- .4 and .6, all of which held p-values
of .00. Exposed and Iconic yielded a correlation coefficient of .486, where Exposed and
Occupied held a correlation coefficient of .562. Both tests indicate that as the exposure of
these locations increases, the iconicity and occupancy also increases. The findings are as
expected considering that large structures typically hold some symbolic value deemed
solely on size. Additionally, large buildings or structures, according to the EVIL DONE
methodology, are considered highly Exposed locations. Thus, given the size of the target,
the occupancy is expected to manifest in a similar manner.
Destructible was found to be related to four other variables moderately and
negatively. That is, Destructible was moderately related in a negative direction to
Exposed (correlation coefficient of -.585), Iconic (correlation coefficient of -.449),
Occupied (correlation coefficient of -.457), and the EVIL DONE vulnerability score

90
(correlation coefficient of -.407). The findings suggest that large structures, which
typically hold Iconic value and higher occupancies based off the previous correlation, are
less Destructible. In other words, as the exposure, iconic value, and occupancy of the
location or target increases, heavier weaponry is needed to destroy the target. The
negative relationship between Destructible and the EVIL DONE vulnerability score is not
as anticipated. Rather, it was expected that the less Destructible a location or target is, the
less vulnerable it would be to a terrorist attack, and consequently result in a lower
vulnerability score. However, possible explanations for this finding will be discussed in
the final chapter.
The last moderate relationship was found between Legitimate and the EVIL
DONE vulnerability score, which yielded a correlation coefficient of .596 with p= .00.
This positive relationship suggests that as the legitimacy of a location increases, the EVIL
DONE vulnerability score also increases. The finding implies that, according to the EVIL
DONE vulnerability methodology, the more Legitimate a location is, the more vulnerable
it is to a terrorist attack.
Lastly, and perhaps most importantly, four “strong” correlations were found
among the studied variables. All of the strong correlations held a p-value of .00, and each
of relationships were positive. Iconic and Legitimate yielded a correlation coefficient of
.614, p=.000 which suggests that as the iconic value of a target or location increases, so
does the legitimacy of the target. Finally, the EVIL DONE vulnerability score was
strongly related to Occupied (correlation coefficient of .703), Exposed (correlation
coefficient of .715), and Iconic (correlation coefficient of .720). These findings indicate

91
that a majority of the relationships are weak, with the exception of a few moderate and
strong correlations. Despite the correlational findings, regardless of relationship strength,
the relationships examined here are all bivariate. Conversely, considering all the variables
together in a multivariate analysis rather than in a bivariate analysis will strengthen the
research and academic contributions of this study.
Research Question 1
Research Question 1 states: Is there a relationship between the EVIL DONE
vulnerability score and the number of fatalities and injured persons resulting from a
terrorist attack? Hypothesis 1 declares that the more fatalities and injured persons
resulting from a terrorist attack, the higher the EVIL DONE vulnerability score. The null
hypothesis is that there is no relationship between the number of fatalities and injured
persons and the EVIL DONE vulnerability score. The alternative hypothesis is that there
is a positive and strong relationship between the number of fatalities and injured persons
together and the EVIL DONE vulnerability score. Deriving from Table 6, the Pearson
correlation of these two variables resulted in a correlation coefficient of .10 (p =.32).
Thus, because the coefficient is in the very weak range and the p-value is greater than
.05, the null hypothesis is retained in that no relationship exists between these two
variables. The results do not support the original hypothesis that more fatalities and
injured persons resulting from a terrorist attack would result in a greater EVIL DONE
vulnerability score.

92
Research Question 2
Research Question 2 states: How are the components of EVIL DONE predictive
of the number of fatalities and injured persons resulting from a terrorist attack? The
hypothesis of this research question was tested using a multiple regression analysis to
determine how the components of EVIL DONE were predictive of the mentioned
dependent variables.
Hypothesis 2
Hypothesis 2 is that Occupied and Destructible will be the most predictive of the
number of fatalities and injured persons resulting from a terrorist attack. This hypothesis
is developed around logical connotations and essential themes in the literature. Primarily,
in order for a large number of persons to be killed and/or injured, there must be a large
number of persons present. For instance, a terrorist attack targeting a small supermarket
whose maximum occupancy is 50 is unlikely to result in as many fatalities/injured
persons as an attack on a full sporting arena whose occupancy is 30,000. Secondly, the
literature suggests that locations with high occupancies provide the greatest opportunities
for terrorists to exert great harm and establish fear among the targeted community. Thus,
because terrorists typically seek to harm as many people as possible to strengthen their
purpose, it is hypothesized that the occupancy of a location will greatly predict the
number of fatalities and injured persons resulting for a terrorist attack even when
considering other important factors within the EVIL DONE criteria.
Additionally, the literature suggests that less Destructible targets require less
conventional and accessible weaponry. Consistent with the theories of situational crime

93
prevention, increasing the effort needed to obtain powerful weaponry to destroy durable
targets will decrease the opportunities for attack. Thus, a target that is highly Destructible
will be more effortlessly destroyed with easily accessible weapons resulting in a greater
number of fatalities and injured persons even when controlling for the other factors.
Multiple Regression Results
Research Question 2 seeks to understand how the components of EVIL DONE are
predictive of the cumulative number of fatalities and injured persons. Using the
cumulative number of fatalities and injured persons as the dependent variable, the
multiple regression analysis was able to determine how well the independent variables
explain the variance in the dependent variable, while controlling of other independent
variables.
The data collected for this study was entered into SPSS statistical software
program. The program was then used to analyze the data and run a variety of statistical
operations (Norusis, 2008). SPSS was utilized as the solitary statistical software in this
study, and conducted both the correlation and multiple regression analyses that were used
to address the research questions.
Regression analyses are statistical techniques used to predict the value of one
variable using the value of another variable or set of variables (Allen, 1997). The
variables whose predictive values are being assessed are the independent variables,
whereas the variable that the analysis is attempting to predict is the dependent variable
(Allen, 1997). In this case, the components of EVIL DONE are the independent variables
whose values are being used to predict the number of fatalities and injuries. The analysis

94
then displays the relationship between the independent variables and the dependent
variable and “determines the proportion of variation in the dependent variable that can be
accounted for by the variation in the independent variable” (Allen, 1997). Lastly, the
analysis reveals the level of statistical significance of each result to determine whether or
not there is true relationship.
A backward stepwise multiple regression analysis was conducted in SPSS, which
tested the hypothesis for this research question. In the backward stepwise model, the
initial model contained all independent variables. As each step progressed, the
independent variable that was responsible for the smallest change in R2 was eliminated,
thus, ending with the single independent variable whose elimination yielded the greatest
impact on the predictability of the number of fatalities and injured persons (Norusis,
2008). Table 7 presents the results from all models in the backward stepwise regression.
Tables 8 and 9 breakdown the analysis into each individual model to examine how the
statistics changed as each variable was removed.
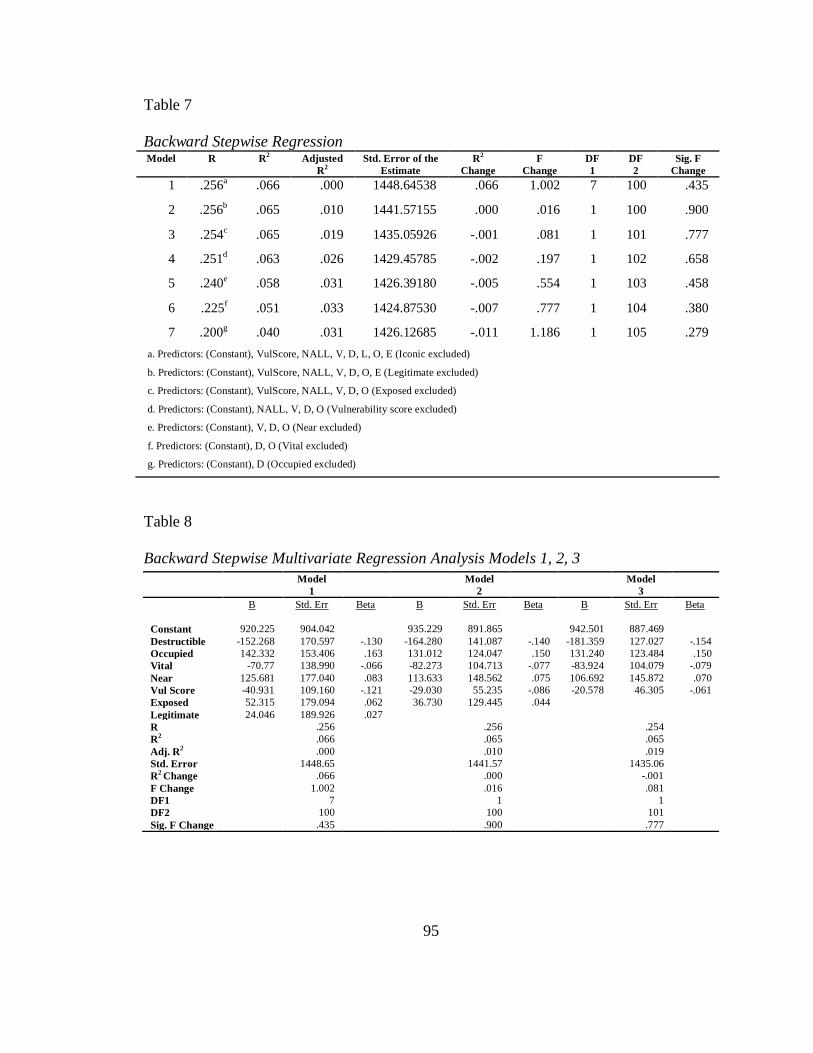
95
Table 7
Backward Stepwise Regression Model R R
2 Adjusted
R2
Std. Error of the
Estimate
R2
Change
F
Change
DF
1
DF
2
Sig. F
Change
1 .256a .066 .000 1448.64538 .066 1.002 7 100 .435
2 .256b .065 .010 1441.57155 .000 .016 1 100 .900
3 .254c .065 .019 1435.05926 -.001 .081 1 101 .777
4 .251d .063 .026 1429.45785 -.002 .197 1 102 .658
5 .240e .058 .031 1426.39180 -.005 .554 1 103 .458
6 .225f .051 .033 1424.87530 -.007 .777 1 104 .380
7 .200g .040 .031 1426.12685 -.011 1.186 1 105 .279
a. Predictors: (Constant), VulScore, NALL, V, D, L, O, E (Iconic excluded)
b. Predictors: (Constant), VulScore, NALL, V, D, O, E (Legitimate excluded)
c. Predictors: (Constant), VulScore, NALL, V, D, O (Exposed excluded)
d. Predictors: (Constant), NALL, V, D, O (Vulnerability score excluded)
e. Predictors: (Constant), V, D, O (Near excluded)
f. Predictors: (Constant), D, O (Vital excluded)
g. Predictors: (Constant), D (Occupied excluded)
Table 8
Backward Stepwise Multivariate Regression Analysis Models 1, 2, 3
Model
1
Model
2
Model
3
B Std. Err Beta B Std. Err Beta B Std. Err Beta
Constant 920.225 904.042 935.229 891.865 942.501 887.469
Destructible -152.268 170.597 -.130 -164.280 141.087 -.140 -181.359 127.027 -.154
Occupied 142.332 153.406 .163 131.012 124.047 .150 131.240 123.484 .150
Vital -70.77 138.990 -.066 -82.273 104.713 -.077 -83.924 104.079 -.079
Near 125.681 177.040 .083 113.633 148.562 .075 106.692 145.872 .070
Vul Score -40.931 109.160 -.121 -29.030 55.235 -.086 -20.578 46.305 -.061
Exposed 52.315 179.094 .062 36.730 129.445 .044
Legitimate 24.046 189.926 .027
R .256 .256 .254
R2 .066 .065 .065
Adj. R2 .000 .010 .019
Std. Error 1448.65 1441.57 1435.06
R2 Change .066 .000 -.001
F Change 1.002 .016 .081
DF1 7 1 1
DF2 100 100 101
Sig. F Change .435 .900 .777

96
Table 9
Backward Stepwise Multivariate Regression Analysis Models 4, 5, 6, 7
The results reveal multiple important statistics including the B, Beta, R, R2, and
adjusted R2 values as well as the statistical significance of the findings. The B value,
referred to as the unstandardized coefficient, represents the direction and amount of
change in the dependent variable that would result from an increase or decrease in the
independent variables by one unit (Norusis, 2008). However, the B value is generally not
a highly informative measure because of the range in the unstandardized values of the
variables. The beta value refers to the standardized coefficient of the model, or the
direction and amount of change in the dependent variable that would result from an
increase or decrease in the independent variables by one standard deviation once all
variables have been standardized to a common mean of 0 and a variance of 0 (Leech,
Barrett, & Morgan, 2008).
The R value refers to the absolute value of the correlation coefficient between the
observed value of the dependent variable and the predicted value of in the independent
Model
4
Model
5
Model
6
Model
7
B Std. Err Beta B Std. Err Beta B Std. Err Beta B Std. Err Beta
Constant 719.57 729.23 912.91 679.97 868.72 677.40 1417.95 452.71
Destruct. -175.25 125.79 -.149 -168.95 125.23 -.144 -173.63 124.99 -.148 -234.86 111.73 -.200
Occupied 95.49 93.31 .109 98.74 93.10 .113 101.15 92.87 .116
Vital -92.26 101.98 -.087 -89.63 101.70 -.084
Near 108.16 145.27 .071
Vul Score
Exposed Legitimate
R .251 .240 .225 .200
R2 .063 .058 .051 .040*
Adj. R2 .026 .031 .033 .031
Std. Error 1429.46 1426.39 1424.88 1426.13 R2 Change -.002 -.005 -.007 -.011
F Change .197 .554 .777 1.186
DF1 1 1 1 1
DF2 102 103 104 105
Sig. F
Change
.658 .458 .380 .279
97
variables collectively (Norusis, 2008). In other words, an R value of 1 indicates that the
dependent variable can be predicted from the independent variables with absolute
certainty. An R value of 0 indicates that the independent variables are not related to the
dependent variable in a linear manner (Norusis, 2008). The R2 value displays the
proportion of variation in the dependent variable that is explained by independent
variables in the current model (Norusis, 2008). For example, an R2 value of .938 signifies
that nearly 94 percent of the variability in the dependent variable is explained by
variability in the independent variables (Norusis, 2008). These two values (R and R2)
will be the main focus of the analysis considering their significance to the research
questions. The adjusted R2 reflects an estimate of how well the current model would fit
into a subsequent model or dataset of the sample population when other variables are
either included or excluded (Norusis, 2008).
The overall purpose and objective of multiple regression analysis is to determine
which variable, or set of variables, most effectively explains the variation in the
dependent variable primarily through the examination of the R and R2 values (Eyduran,
Ozdemir, & Alarslan, 2005). Thus, this analysis was the most important measure of the
strength of the EVIL DONE methodology given the overall purpose of this study and the
selected dependent variables.
Model 1 of the backward stepwise multiple regression analysis used the number
of fatalities and injured persons as the dependent variable and began with all independent
variables (Exposed, Vital, Legitimate, Destructible, Occupied, Near, and EVIL DONE
vulnerability score) except Iconic, which was the most insignificant variable and yielded

98
the smallest change in R2. The R value was .256, showing that the independent variables
have a weak linear relationship to the dependent variable. The R2, or how much of the
variability was explained by the independent variables, was .066, meaning that 6.6
percent of the variability in the number of fatalities and injured persons was explained by
the 7 included independent variables, however, the p-value of this test was .435, yielding
non-significant results. Model 2 eliminated Legitimate, whose exclusion produced the
smallest change in the R2
value, resulting in an R value of .256, R2 of .065, and p-value
of.324. Model 3 eliminated Exposed and resulted in an R value of .254, an R2 of .065, and
p-value of .227. Model 4 eliminated the EVIL DONE vulnerability score and resulted in
an R value of .251, an R2 of .063, and a p-value of .150. Model 5 eliminated Near and
resulted in an R value of .240, an R2 of .058, and p-value of .101. Model 6 eliminated
Vital and resulted in an R value of .225, an R2 of .051, and a p-value of .065. Lastly,
Model 7 eliminated Occupied, leaving Destructible as the only independent variable
being tested against the number of fatalities and injured persons. This resulted in an R
value of .200, an R2 of .040, and reached a significant p-value of .038, suggesting a
statistically significant relationship. This finding implies that 4 percent of the variability
in the number of fatalities and injured persons is explained solely by Destructible.
In testing the hypothesis, Iconic was the first independent factor to be eliminated,
followed by Legitimate, Exposed, EVIL DONE vulnerability score, Near, Vital, and
Occupied. The results of this analysis suggested that Destructible held the strongest
impact on R2 because it was the last variable left in Model 7, after all other variables were
eliminated. After removing all other independent variables, Destructible resulted in R
2

99
of .200 with p=.040, suggesting a statistically significant, weak relationship. However,
the Beta value, or standardized coefficient of Model 7, reveals that the direction of the
relationship is negative. Therefore, considering that the final two variables in the models
were Occupied and Destructible and considering the statistically significant relationship
between Destructible and the number of fatalities and injuries, the null hypothesis is
rejected, even though the direction of the relationship was unexpected.
Research Question 3
Research Question 3 asks: How are the components of EVIL DONE predictive of
the EVIL DONE vulnerability score? Similarly to Research Question 2, the hypothesis
for this research question was tested using a multiple regression analysis to determine
how the individual components of EVIL DONE were predictive of the EVIL DONE
vulnerability score.
Hypothesis 3
Hypothesis 3 is that Iconic and Legitimate will be the most predictive of the EVIL
DONE vulnerability score of any given location/target. This hypothesis is developed
around the literature which suggests that Iconic targets, whose symbolic value represents
that nation’s power and unity, are highly attractive to terrorist whose motives involve a
coercion of government in furtherance of political of social objectives. Targeting an
Iconic location figuratively impairs the strength of a country and can potentially result in
greater satisfaction among terrorists seeking substantial implications. Additionally, this
hypothesis is developed around the parallels found in the Iconic and Legitimate criteria.
Targets that are considered highly Iconic, according to the EVIL DONE criteria, house

100
political personnel or people with influential power. Likewise, targets that are considered
highly Legitimate house people of similar stature. Therefore, not only would Legitimate
targets denote a strong symbolic threat which is a common goal among terrorists, but the
association with iconicity may result in a greater EVIL DONE vulnerability score.
Multiple Regression Results
Research Question 3 seeks to understand how the components of EVIL DONE are
predictive of the EVIL DONE vulnerability score. Using the EVIL DONE vulnerability
score as the dependent variable, the multiple regression analysis was able to determine
how well each independent variable (i.e., each factor of EVIL DONE) explains the
variance in the dependent variable, while controlling for other independent variables. A
forward stepwise model of multiple regression analysis was conducted to test this
research question. Contrary to a backward stepwise multiple regression model, the initial
model in forward stepwise, excluded all independent variables. As each step progressed,
the independent variable that causes the greatest change in R2 was added, thus beginning
with the single independent variable that yielded the greatest impact on the predictability
of the EVIL DONE vulnerability score. Table 10 presents the results from all models in
the stepwise regression. Tables 11 and 12 breakdown the analysis into each individual
model to examine how the statistics changed as each variable was added.

101
Table 10
Forward Stepwise Regression Model R R
2 Adjusted
R2
Std.
Error
R2
Change
F Change DF
1
DF
2
Sig. F
Change
1 .720a .519 .514 3.020 .519 117.510 1 109 .000
2 .868b .754 .750 2.169 .235 103.322 1 108 .000
3 .910c .828 .823 1.823 .074 45.923 1 107 .000
4 .935d .874 .869 1.569 .046 38.281 1 106 .000
5 .956e .915 .911 1.294 .041 50.863 1 105 .000
6 .978f .957 .955 .922 .042 103.029 1 104 .000
7 1.000g 1.000 1.000 .000 .043 . 1 103 .
a. Predictors: (Constant), I (Iconic included)
b. Predictors: (Constant), I, O (Occupied included)
c. Predictors: (Constant), I, O, V (Vital included)
d. Predictors: (Constant), I, O, V, L (Legitimate included)
e. Predictors: (Constant), I, O, V, L, E (Exposed included)
f. Predictors: (Constant), I, O, V, L, E, D (Destructible included)
g. Predictors: (Constant), I, O, V, L, E, D, NALL (Near included)
Table 11
Frontward Stepwise Multivariate Regression Analysis Models 1, 2, 3
Model
1
Model
2
Model
3
B Std. Err Beta B Std. Err Beta B Std. Err Beta
Constant 12.548 .378 8.993 .443 8.242 .388
Iconic 1.669 .154 .720 1.258 .118 .543 1.456 .103 .628
Occupied 1.360 .134 .517 1.324 .113 .503
Vital .915 .135 .284
Legitimate
Exposed
Destructible
Near
R .720 .868 .910
R2 .519 .754 .828
Adj. R2 .514 .750 .823
Std. Error 3.020 2.169 1.823
R2Change .519 .235 .074
F Change 117.510 103.322 45.923
DF1 1 1 1
DF2 109 108 107
Sig. F Change .000 .000 .000

102
Table 12
Frontward Stepwise Multivariate Regression Analysis Models 4, 5, 6, 7
Before examining the statistics of the EVIL DONE vulnerability score analysis, it
is important to note that because the dependent variable is an accumulation of all
independent variables, the significance level of each finding is .000, demonstrating that
the results of each analysis are statistically significant. Model 1 of the forward stepwise
multiple regression analysis used the EVIL DONE vulnerability score as the dependent
variable and began with the independent variable whose inclusion results in the greatest
increase in significance (i.e., R2), which was Iconic. The inclusion of Iconic resulted in an
R value of .720 and an R2 of .519. An R value of .720 shows considerable predictability
of Iconic on the EVIL DONE vulnerability score. The R2
value suggests that 51.9 percent
of the variability was explained by Iconic alone. Model 2 included Occupied, which was
the factor whose addition yielded the greatest increase in the predictability of the
independent variable, subsequent to Iconic. Model 2 resulted in an R value of .868 and an
R2 of .754; thus, Occupied explained a .235 (or 23.5 percent) increase in the variability of
Model
4
Model
5
Model
6
Model
7
B Std. Err Beta B Std. Err Beta B Std. Err Beta B Std. Err Beta
Constant 7.111 .381 7.356 .316 2.713 .510 1.05
E-13
.000
Iconic 1.097 .106 .473 .827 .095 .357 .909 .068 .392 1.00 .000 .432
Occupied 1.293 .097 .491 .975 .092 .370 1.084 .066 .412 1.00 .000 .380
Vital 1.018 .117 .316 .937 .098 .297 .952 .063 .295 1.00 .000 .310
Legitimate .717 .116 .274 .802 .096 .306 .882 .069 .337 1.00 .000 .382
Exposed .667 .093 .270 .935 .072 .378 1.00 .000 .404
Destructible .927 .091 .267 1.00 .000 .288
Near 1.00 .000 .219
R .935 .956 .978 1.000
R2 .874 .915 .957 1.000
Adj. R2 .869 .911 .955 1.000
Std. Error 1.569 1.294 .922 .000
R2 Change .046 .041 .042 .043
F Change 38.281 50.863 103.029 .
DF1 1 1 1 1
DF2 106 105 104 103
Sig. F Change .000 .000 .000 .

103
the vulnerability score. Model 3 included Vital and resulted in an R value of .910 and an
R2 of .828; thus, Vital explained a .074 (or 7.4 percent) increase in the variability of the
vulnerability score. Model 4 included Legitimate and resulted in an R value of .935 and
an R2 of .874; thus Legitimate explained a .046 (or 4.6 percent) increase in the variability.
Model 5 included Exposed and resulted in an R value of .956 and an R2 of .915; thus
Exposed explained a .041 (or 4.1 percent) increase in the variability. Model 6 included
Destructible and resulted in an R value of .978 and an R2 of .957; thus Destructible
explained a .042 (or 4.2 percent) increase in variability. Lastly, Near was included and
resulted in R value of 1.00 and an R2 of 1.00; thus, Near explained a .043 (or 4.3 percent)
increase in variability, the smallest increase of all variables.
Examining the standardized coefficients, or beta, of each model independently
displays how many standard deviations the dependent variable would change as a result
of a change in the independent variable by one standard deviation (s.d.), while holding
the other independent variables constant. In Model 1, the standardized coefficient (i.e.,
beta) of Iconic was .72, meaning that an increase in Iconic by 1.0 s.d., while all other
independent variables remained the same, would result in an increase to the EVIL DONE
vulnerability score 0.72 s.d. In the final model, Model 7, when all independent variables
were included, Iconic and Exposed had the greatest impact on the variation of the EVIL
DONE vulnerability score, yielding an increase of .432 s.d. and .404 s.d. in the EVIL
DONE vulnerability score from an increase of 1.0 s.d. for each independent variable. An
increase in Legitimacy by 1.0 s.d. resulted in an increase of .382 s.d. in the EVIL DONE
vulnerability score, followed by Occupied, Vital, Destructible and Near, which caused an

104
increase of .380, .310, .288, and .219 s.d. respectively. Therefore, considering that the
initial two variables in the models were Iconic and Occupied, and the strength of the beta
values of Iconic and Exposed in the final model, when all independent variables were
considered, the null hypothesis is retained.
Summary
The main goal of this chapter was to present and interpret the results of each
research question and their hypotheses. First, descriptive statistics of key variables were
examined, including frequencies of the type of attack, target type, year of attack, and
attacks per country. Second, Pearson correlations between dependent and independent
variables were examined to address to Research Question 1. Next, multiple regression
analyses were conducted using a backward stepwise and frontward stepwise model to
address Research Questions 2 and 3, respectively.
An examination of the descriptive statistics reveals that a large majority of the
terrorist attacks examined were bombings/explosions, accounting for over 65 percent of
all attacks examined in this. The other six types of terrorist attacks accounted for 35
percent collectively. The two primary target types were government affiliations,
accounting for over 21 percent, and private citizens/property, accounting for nearly 19
percent. The other ten types of terrorist targets accounted for 60 percent collectively. The
large majority of the terrorist attacks examined in this study occurred between 2001 and
2013, accounting for nearly 70 percent. Only a small percentage of terrorist attacks
examined occurred prior to 2000. The frequency of terrorist attacks by country revealed
that four countries were represented in the study 10 or more times, including Russia,
105
United States, Algeria, and Colombia. The additional 61 terrorist attacks occurred in 20
different countries. The measures of central tendencies revealed the normal nature of the
some variables and skewed results for others. Exposed, Vital, and Iconic all resulted in
low median values of 0.00 or 1.00. Legitimate, Near, and Occupied resulted in medians
of 2.0, 2.0, and 3.0, respectively. Destructible resulted in the highest median value of 4
and second lowest standard deviation among all the EVIL DONE components. The
numbers of fatalities, injured persons, and consequently, the combined number of
fatalities and injured persons resulting from a terrorist attack, were all highly skewed
based on the large range between the minimum and maximum values. For example, for
the combined number of fatalities and injured persons, the minimum was 0 and the
maximum was 8,800, with a median of 70.00. Thus, the nature of these variables was
highly skewed.
Despite the findings that there is no significant correlation between the EVIL
DONE vulnerability score and the number of fatalities and injured persons, four vital
correlations were discovered. First, the correlation found that Iconic is strongly related to
the legitimacy of a target, yielding a correlation coefficient of .614, p=.00. These findings
are credible based on the definitions found in the EVIL DONE vulnerability scoring
criteria. The criteria for Iconic and Legitimate ranks political affiliations as the highest
possible standard and allocate a score of 5 to each (i.e., Iconic scores “major political
symbol” as a 5, and Legitimate scores “houses military personnel or politicians” as a 5)
(Boba, 2009). Thus, the correlation between the two is conceivable. More importantly,
however, the correlation between the vulnerability score and the individual factors of

106
EVIL DONE indicated that three EVIL DONE factors are strongly correlated to the
EVIL DONE vulnerability score, including Occupied (correlation coefficient of .703,
p=.00), Exposed (correlation coefficient of .715, p=.00), and Iconic (correlation
coefficient of .720, p=.00). The findings suggest that the correlation between each of
these factors represents a strong linear relationship in that if a target or location scores
high in any of these three factors, the EVIL DONE vulnerability score is likely to rise in a
similar manner.
The multiple regression analysis found that the destructibility of a location/target
was the greatest predictor of the number of fatalities and injured persons resulting from a
terrorist attack, with an R value of .200 and an R2 of .04. This was the last factor
remaining in the backward stepwise regression, signifying that the elimination of
Destructible would have yielded the largest impact on the predictability of the number of
fatalities and injured persons. Additionally, the multiple regression analysis found that
Iconic was the greatest predictor to the overall vulnerability score, with an R value of
.720 and an R2 of .519. This was the first factor included in the forward stepwise
regression, signifying that the inclusion of Iconic in the model yielded the greatest impact
on the predictability of the EVIL DONE vulnerability score.
A discussion of the above findings as well as the implication of such results will
be presented in the final chapter. Additionally, the limitations of this study and
recommendations for future research based on these limitations will be discussed.
107
CHAPTER 5: DISCUSSION, LIMITATIONS, CONCLUSIONS, AND
IMPLICATIONS
Discussion of the Findings
Despite multiple issues, there are three that have predominately hindered the
ability to successfully reduce opportunities for terrorist attacks. Historically, the
responsibility of the initial impediment has fallen on government officials and political
parties whose endeavors have been ineffectively and inappropriately focused on
eliminating terrorists rather than altering the physical environment to reduce the
opportunities for attack.
Secondly, and consequential of the first hindrance, the capabilities of situational
crime prevention and opportunity reduction in this area of study have yet to be
recognized or exploited to their full potential. Developed around the key theoretical
foundations of environmental criminology, SCP takes great consideration for each of the
components of a criminal act. The two-step process of identifying and eliminating
opportunities via SCP techniques has yet to be fully implemented due to the misplaced
efforts focused around the motivated offender rather than the suitable target.
Lastly, postulating that the first two obstacles were removed, the final hindrance
rests in the methodology for identifying the suitable targets (i.e., opportunities)
mentioned in the two-step process. The nationwide efforts of the United States
Department of Homeland Security to collect methodologies for identifying locations

108
vulnerable to terrorist attack illuminated the evident need for a vulnerability assessment
whose methodology is easily understood, applicable, and affordable by local authorities.
The methodologies that currently exist lack some, if not all, of the essential
characteristics for a useful vulnerability assessment. However, each of these
aforementioned issues limiting the successful reduction of opportunities for terrorist
attacks has the potential to be eradicated via the EVIL DONE vulnerability assessment.
The EVIL DONE vulnerability assessment was developed around the same
theoretical foundations as SCP and opportunity reduction; thus, the focus is placed upon
the suitable target/location which increases the applicability of the assessment at the local
level. Local authorities are better able to assess the locations and targets within their
jurisdiction rather than futilely focusing on motivated offenders which is an
insurmountable task. The EVIL DONE methodology embraces each essential
characteristic of a useful vulnerability assessment in that it is easily understood, easily
applicable to a preponderance of locations, and a very affordable method for identifying
highly vulnerable targets in need of opportunity reduction and SCP efforts.
Reflecting on the literature of SCP and terrorism, this study examined the
relationships between the EVIL DONE vulnerability assessment and the aftermath of
historical terrorist attacks. This was the first academic endeavor aimed at applying the
EVIL DONE methodology to real life locations/targets and terrorist events. The study
first examined the relationships between each EVIL DONE factor and the consequences
of terrorist attacks, measured by the number of fatalities and injured persons. Succeeding
the examination of correlations, subsequent multiple regression analyses examined the

109
relationships between individual EVIL DONE factors, the overall vulnerability score, and
the number of fatalities and injured persons. The discussion of the study will begin with
an interpretation of these relationships and emphasize its scholarly contributions. Finally,
the limitations of the current study and consequential implications for future research will
be addressed.
Pearson Correlation Discussion
The findings of the Pearson correlations express multiple relationships among the
components of EVIL DONE and the selected dependent variables. The results suggest
that the destructibility of a location is weakly and negatively related to the number of
fatalities and injured persons. This negative relationship conflicts with the literature
which suggests that targets that require large amounts of inaccessible weapons to destroy
them are less attractive to terrorists due to the perceived increased efforts and reduced
rewards of the attack. Therefore, the relationship between the two variables was not in the
expected direction. This finding may be the result of the power of the weaponry required
to successfully attack an easily/highly destructible location versus the power of the
weaponry required to successfully attack a less destructible/more durable location.
According to the EVIL DONE criteria, the weapons required to destroy highly
destructible locations include IED’s or small conventional weapons, which have a very
narrow range of destruction (Boba, 2009). Small conventional weapons include guns and
other small arms (Clarke & Newman, 2006). The range of destruction or span for these
weapons is very narrow in comparison to heavy conventional weapons, or other
unconventional devices that have historically been used as armaments, such as aircrafts.

110
Thus, when a target requires minimal weaponry to destroy (i.e., scores high on the
Destructibility scale), the result may be fewer fatalities and injured persons due to the
limited range of the weaponry. Alternatively, when a target requires heavy weaponry to
destroy (i.e., scores low on the Destructibility scale), the range of demolition and
devastation is much greater, and consequently, results in more fatalities and injured
persons given the greater strength of the weapon.
Exposed held a statistically significant relationship with both the number of
fatalities and the number of injured persons, independently. The consistency of these
findings independent of one another suggests that the rate of exposure of a target
influences the outcome of the terrorist attack in terms of the number of people affected.
The literature supports this finding by emphasizing the importance of required effort in
finding an opportunity for crime. The larger and/or more Exposed a location is, the easier
it may be to identify and target for a terrorist attack.
However, the relationship is weak showing that an increase in the exposure score
would only feebly influence the rise in the number of fatalities and injured persons.
Additionally, Exposed was also found to be correlated with Iconic and Occupied, both of
which held moderate relationships. Thus, locations that are highly Exposed also tend to
house large amounts of people and hold strong Iconic values. This combination of factors
has been observed in locations like the Twin Towers in New York City, New York,
which were highly Exposed, housed thousands of people, and were nationally iconic due
to the economic and political powers encompassed in the business building.

111
Iconic held a significant relationship with the number of injured persons. While
the strength of this relationship was weak, the combination of destructibility, exposure,
and iconicity create a consistent pattern in the number of fatalities and/or injured persons.
Thus, while the findings only represent a weak relationship, the trend suggests that
locations or targets that encompass these three factors may result in a greater number of
harmed persons. Conversely, the strength of the relationship suggests that no factor, or
combination thereof, considerably increases the number of harmed persons in a strong
linear pattern.
Additional findings of the Pearson correlation suggest significant relationships
between the EVIL DONE vulnerability score and certain factors, which concurrently
address Research Question 1 of the study. The findings show that Legitimates hold a
positive moderate correlation and Occupied, Exposed, and Iconic hold strong positive
correlations to the EVIL DONE vulnerability score. Destructible holds a moderate
negative relationship to the EVIL DONE vulnerability score. Reflecting back on the
historical terrorist attacks occurring around the world and more specifically, around the
United States, many locations that were targeted for a terrorist attack emulated these
exact characteristics.
For example, as part of the 2001 terrorist attack, the Pentagon was targeted in
Arlington, Virginia. For reasons previously discussed, the durability of the structure
required the terrorists to utilize a much stronger powered weapon in order to penetrate
and building and successfully attack the location. Thus, small conventional weapons or
IED’s, though more easily accessible, would not have been sufficient to fulfill the needs

112
of the terrorists. Therefore, the low destructibility score prompted the unconventional use
of an aircraft to destroy the target. Despite the Pentagon’s durable construction, literature
on the Pentagon attack proclaims that “no building could have absorbed the energy of
such a crash without suffering structural damage, and if occupied, casualties” (Goldberg,
Papadopoulous, Putney, Berlage, & Welch, 2007, p.20). The portion of the building that
suffered the initial blow, referred to as Wedge 1, occupied 3,800 workers, with over
20,000 occupants in the entire building (Goldberg et al., 2007). The exposure of the target
was evident based on the sheer size and location of the building, with over 17 miles of
corridors and covering a spread of nearly 29 square acres of land (Goldberg, 1992). The
legitimacy of the Pentagon is apparent given its political affiliations and responsibilities.
Lastly, the Pentagon’s Iconic value was unsurpassed as it earned the nickname “one of
the wonders of the modern world,” and became a major symbol of America’s strength
and power (Goldberg, 1992). Thus, the components of EVIL DONE that were found to
be correlated to the vulnerability score are further exemplified in this example as well as
many other historical terrorist targets and attacks.
Equally as important as the identification of strong correlations within the study
are the relationships that do not exist. The results suggest that Vital, Legitimate, and Near
are not strong predictors of the EVIL DONE vulnerability score. The absence of a
relationship between Vital and the vulnerability score may be supported by advances in
technology that can diminish the amount of time required to repair damages caused by
terrorist attacks on Vital sites. Thus, the interruption and consequential impact of the
impairment on Vital targets is tapered, and the effect on society is reduced. Therefore, the

113
vitality of a target may not significantly increase its attractiveness to terrorist, thus
creating no effect on its vulnerability to attack.
The absence of a relationship between Legitimate and the vulnerability score may
be a result of the vast number of targets that could potentially be considered Legitimate in
the eyes of a terrorist organization and/or terrorist supporters. Considering the importance
of the legitimacy of a target, as described by Boba (2009), terrorists seek to avoid moral
condemnation and to achieve positive support and reaction for their behaviors. Reflecting
back to the 9/11 attacks, targeting civilian workers led to one of the largest national bouts
of terror in history. Thus, while military personnel or politicians are considered more
legitimate targets than civilians, the implications of targeting civilians has historically
resulted in equally devastating and provoking consequences.
Lastly, the absence of a relationship between Near and the vulnerability score
may also be the result of advances in technology which make transportation between
countries much less problematic than in previous eras. Figuratively, the distance between
countries is shrinking as developments in technology allow for communication, travel,
and transportation to move more fluently. Boba (2009) states that the value of ease of
travel to the target is an important criterion for the Near factor. Moreover, aircrafts reduce
the efforts required to reach distant targets, and increases in population have warranted
the mass development of major transportation hubs globally. Thus, the ease of travel is
expanding, limiting the number of targets that remain distant or inaccessible.
In summary, despite the many correlations found among the variables in this
study, most of the relationships were statistically weak, yielding correlation coefficients

114
of +/- .4 or less. These findings are not as expected considering that each location
included in the study had previously been the target of a terrorist attack. Additionally, not
only was each location a previous target, but the criteria for each EVIL DONE
component was established and defined with consideration of the other components;
therefore, it was expected that the components would hold stronger relationships. The
findings refuting the hypothesis that the EVIL DONE vulnerability score is a reflection of
the number of fatalities and injured persons suggest possible limitations in the
operationalization of the study, which will be addressed in a later discussion.
Conclusively, the scholarly contributions of the Pearson correlation emphasize
that Iconic and Exposed are the strongest correlated variables to the EVIL DONE
vulnerability score, whereas Destructible is the strongest correlated variable to the
number of fatalities and injured persons resulting from a terrorist attack, however the
relationship was not in the expected direction.
Multiple Regression Analyses Discussion
The second and third analyses focused on the predictive value of the individual
components of EVIL DONE. The examination utilized two different forms of analyses.
The second analysis tested the predictive value of the components of EVIL DONE
against the number of fatalities and injured persons resulting from a terrorist attack. This
analysis was conducted by testing the independent variables’ explanatory values against
the variability of the dependent variable – the number of fatalities and injured persons.
The third analysis tested the predictive value of the components of EVIL DONE against
the EVIL DONE vulnerability score. This analysis was also conducted by testing the

115
independent variables’ explanatory values against the variability of the dependent
variable – the EVIL DONE vulnerability score.
Research Question 2 sought to determine the relationships between the
components of EVIL DONE and the number of fatalities and injured persons. For the
second analysis, a backward stepwise multiple regression, statistically significant results
were not found until Model 7, where all variables, except Destructible, were removed.
The lack of statistical significance in these results was not expected. The findings suggest
that no combination of EVIL DONE factors can significantly predict the number of
fatalities or injured persons, except for Destructible, independently. Similar to the
absence of a relationship found in the correlation, the lack of relationship between the
EVIL DONE vulnerability score and the number of fatalities and injured persons in the
multiple regression analysis may be a reflection of poor selection of the dependent
variable in a reactive approach. The operationalization of the dependent variable will be
addressed in the limitations discussion.
Nevertheless, the analysis suggested that Destructible was the independent
variable that yielded the greatest explanatory value in the variation of the number of
fatalities or injured persons, as expressed in Model 7. Following Destructible, Occupied
had the second greatest explanatory value in the variability of the number of fatalities and
injured persons, but failed to reach a statistical significance at the .05 level. However,
despite the statistical significance of the findings, the results render logical connotations.
In order for a large amount of people to be harmed, the location or target must house a
large amount of people (similar to the small market versus sporting arena example given
116
in Chapter 4). For reasons previously discussed, less destructible locations result in a
greater number of fatalities and injured persons due to the strength of the weaponry
required to destroy the target/location.
Contrary to the most predictive factors, the two factors that were the least
predictive of the number of harmed persons were Iconic and Legitimate. Again, the
consistency of the findings in consideration of the Pearson correlations suggests
reliability in the testing. In both the multiple regression analysis and correlation,
legitimacy was found to have very little influence on the number of persons harmed.
Reflecting back to the literature, the reasons behind these findings may be a result of the
vast number of targets that could potentially be considered legitimate in the eyes of a
terrorist organization and/or terrorist supporters.
For similar reasons, targeting a specific nation may denote a symbolic attack,
regardless of the Iconic value of the specific location. In other words, the mere attack on
a nations’ people may reflect a strong enough iconic connotation that the symbolic value
of the actual location or building is trivial. Conclusively, the scholarly contributions of
the second analysis offer that a location that is easily destructible may result in a greater
number of fatalities and injured persons, followed by a location that is highly occupied.
Additionally, Iconic and Legitimate values of a location do not affect the outcome of
terrorist attacks in terms of the number of fatalities and injured persons.
Research Question 3 sought to determine the relationships between the
components of EVIL DONE and the EVIL DONE vulnerability score. For the third
analysis, a frontward stepwise multiple regression, Iconic yielded the greatest

117
predictability of the EVIL DONE vulnerability score in the initial model. Surprisingly,
this finding suggested that once all of the variables were considered and included in the
analysis, Iconic and Exposed generated the greatest explanatory value, followed by
Legitimate and Occupied. The strength of predictability for Iconic may be a reflection of
similarities in two of the EVIL DONE components: Iconic and Legitimate. Iconic scores
“major political symbols” as the highest possible rank, and Legitimate scores “houses
military personnel or politicians” as the highest possible rank. Consequently, the two
factors are moderately correlated; thus, an increase in one factor results in an increase in
the other. Because of this relationship, locations that are considered Iconic or Legitimate
typically score relatively high for both factors, resulting in a higher EVIL DONE
vulnerability score.
The strength of the Exposed component, when all other components were
considered, suggests that larger, more Exposed structures result in higher overall
vulnerability scores. Again, similar to the correlation between Iconic and Legitimate,
Exposed and Occupied are also moderately correlated to one another. Logically, the
larger the building or structure, the more people it will house. Thus, the moderate
relationship between Exposed and Occupied, and consequently, their relationship to the
EVIL DONE vulnerably score, is a logical result.
The two factors which least explained variations in the EVIL DONE vulnerability
score were Destructible and Near. Reflecting back to the literature and scoring criteria for
these variables, the findings may be due to variation and increased power of improvised
explosive devices (IEDs). Historically, IEDs have been used to execute a variety of

118
attacks, all varying in the extent of the effects. For example, in the 2013 Boston Marathon
bombings in Boston, Massachusetts, domestic terrorists constructed IEDs using
household pressure cookers filled with hardware, such as nails and ball bearings. This
simply constructed device detonated on a sidewalk and sent sharp pieces of metal flying
through the air causing wounds and amputations to hundreds of people. Likewise,
Timothy McVeigh used an IED to target the Alfred P. Murrah Federal Building in the
1995 Oklahoma City bombing, causing half the building to collapse.
Thus, because the capabilities of IEDs vary greatly, they can be used on diverse
targets (e.g., large crowds versus federal buildings), and a majority of locations are
destructible with this choice of weaponry. Furthermore, reflecting back on the descriptive
statistics of the sample, 65 percent of the terrorist attacks in this study were
bombings/explosions, and the mean Destructible score was the highest among all EVIL
DONE variables (3.84) with the second lowest standard deviation. Accordingly, a
majority of the locations were targeted using explosive devices and resulted in a higher
destructibility score than any other EVIL DONE component. Thus, because the variation
in scoring for the Destructible factor was low and scores were repetitively high, the lack
of explanatory value for the Destructible factor on the variation of the overall
vulnerability score is fathomable.
An interesting finding thus far is the consistency between analyses. First off, there
is great consistency relating to the Near factor. Both the correlation and multiple
regression analysis deemed Near as one of the least predictive and least explanatory
components of EVIL DONE on the EVIL DONE vulnerability score as well as the

119
number of fatalities and injured persons. The lack of explanatory value of Near may
reflect justifications similar to those addressed in the correlation discussion in that
technological advances have made transportation between countries much less
problematic than in previous eras; thus, the location of the target and its nearness to a
terrorist’s abode is not as pivotal as once believed.
An additional consistency in the findings is the ability of Occupied to explain the
variability of both the EVIL DONE vulnerability score and the number of fatalities and
injured persons. In both the forward and backward stepwise multiple regression analysis,
Occupied was the second best explanatory variable for the respective dependent variable.
In other words, Occupied explained more of the variance in the vulnerability score and in
the fatalities and injured persons than any other EVIL DONE component, barring Iconic
for the former and Destructible for the latter.
Lastly, in both the correlation and multiple regression analysis, Iconic was found
to be the strongest predictor of the EVIL DONE vulnerability score. However, it was also
found to be the second worst predictor of the number of fatalities and injured persons.
These findings may be the result of an increase in two factors – Iconic and Legitimate –
as a result of highly analogous scoring criteria that causes the vulnerability score to be
doubly increased. Consequently, the enhanced increase in the vulnerability score does not
accurately reflect an increase in the number of fatalities and injured persons. An
additional explanation for this finding may be that an attack on an Iconic target may
denote a strong enough impairment on a nation’s strength and unity that the number of
people injured is extraneous. In other words, though terrorist seek to inflict great harm in
120
order to force their motivations, an attack on an Iconic target may be symbolic enough
that there does not necessarily have to be any harmed persons. Conclusively, the third
analysis suggests that the Iconic value of a location most accurately predicts the EVIL
DONE vulnerability score, followed by Exposed. Additionally, the Destructible and Near
values of a location do not affect EVIL DONE vulnerability score.
In all, the study concludes that Iconic, Exposed, and Occupied are the strongest
predictors of the EVIL DONE vulnerability score. Concurrently, Destructible and
Occupied are the strongest predictors of the number of fatalities and injured persons
resulting from a terrorist attack. However, despite these conclusions, the analyses and
conclusions in the present study have limitations which should be considered.
Consideration of the abovementioned findings as well as the limitations of the study
establishes the basis for recommendations of future research on this topic.
Limitations
In discussing the results of the research, it is important to address a number of
limitations that were presented throughout this study. Some of the findings from this
research did not sustain expectations. For example, the absence of relationships between
the EVIL DONE vulnerability score and the number of fatalities and injured persons was
not an expected outcome. One reason for the lack of significant relationships was the way
in which the dependent variable was operationalized. The operationalization of a variable
is the process of developing a measurement for a concept, or in this case, an event that
cannot be directly measured (Babbie, 2010). In other words, the outcome of historical
terrorist attacks was operationalized (i.e., measured) solely by the number of fatalities or

121
injuries resulting from the event. Using this value as the only factor for measuring the
outcome of a terrorist attack may not be the most effective means of measuring the
success of terrorists’ efforts or the consequences of attacks on vulnerable targets.
Another limitation of this research study is the inclusion of terrorist attacks
targeted predominantly at transportation systems, such as passenger trains, planes, ferries,
and police convoys in route to various destinations. Fourteen of the 111 attacks in the
study, nearly 13 percent, were inflicted on these types of targets. Because the EVIL
DONE vulnerability assessment was designed to identify permanent locations in a
community that are the most vulnerable to attack, rather than locations that are
temporarily vulnerable given their short-term uses, the EVIL DONE vulnerability score
that the transportation systems received was not a true reflection of their vulnerability at
the time of the attack.
For example, an attack on an en route ferry boat in the Philippines that resulted in
44 fatalities and 50 injured persons received a vulnerability score of 11. The target
yielded a relatively low vulnerability score because it failed to meet the minimum criteria
for certain EVIL DONE components, such as Exposed. The minimum criterion for
Exposed is a “cluster of buildings in an urban area” (Boba, 2009, p.10). Despite the fact
that the ferry is a large identifiable object respective to the surrounding areas, the target is
not a permanent structure/building; therefore, the Exposed score was a zero.
A comparable example is the attack on the U.S Navy guided-missile destroyer,
U.S.S Cole, which occurred in Yemen in 2000 and resulted in 17 fatalities and 85 injured

122
persons. The size of the vessel was comparable to a large identifiable structure; however,
given the temporary location of the vessel, the Exposure score was a zero.
The methodology for scoring the vulnerability of each terrorist attack in this
study also created a limitation. Two criteria of the Near index were excluded from the
analyses due to deficiencies in the data sources. Of the five criteria for the Near factor,
two were not considered in the scoring process: close to known/suspected terrorist base
and close to domestic immigrant community. Based on the information provided via the
main data source and supplemental data sources, sparse findings regarding the location of
known/suspected terrorist bases and domestic immigrant communities would have
resulted in inconsistent scoring of the Near factor.
An additional struggle in collecting data on the indexes is the role of the
researcher as opposed to a government agent. Identifying known or suspected terrorist
bases may require government intelligence and information that is not readily available to
the general public or an academic researcher. As a government agent, information on
suspected terrorists may be more accessible and applicable for the EVIL DONE
vulnerability assessment. The capabilities of a government agent versus an academic
researcher highlights a major difference in the ease of data collection relevant to the
excluded indexes of the EVIL DONE vulnerability assessment. Furthermore, because of
the age of some events, this information was not available through additional inquiries.
Likewise, Easy was excluded from the vulnerability score for similar reasons of
unknown and/or unreported information regarding the specific criteria of this factor from
the selected data sources. For example, parking near the building and/or unrestricted
123
parking is difficult to accurately measure from a remote location. Moreover, the other
factors, such as the adequacy of security personnel on duty and the number and adequacy
of security cameras and monitoring systems are not reported in the Global Terrorism
Database, nor are they typically reported to the public. However, this is not a weakness of
EVIL DONE but rather a deficiency in the data that were used. Due to the possible
discrepancies and inability to collect data on each attack for these criteria, the exclusion
of such items was warranted.
Although the exclusion of Easy from the analysis was warranted based on the lack
of available data, this may have limited the results which could explain the weakness in
the models. All of the components of EVIL DONE are based on situational crime
prevention in some way. However, the Easy component is somewhat different than the
others as it addresses highly specific characteristics about a target and real-time
characteristics that are particularly relevant to the immediate situation of the attack (i.e.,
dynamic characteristics). The items of Easy include public access to the building, parking
near the building, unsecured entry points, inadequate security personnel, and inadequate
security monitoring. The other seven components address more general and static
characteristics, for example, the height and presence of the building, its proximity to
other important locations, and how many people the location generally occupies (versus
how many people there on the day of the attack). Thus, it might have been that inclusion
of Easy, if the data had been available, may have significantly contributed to the analysis
and increased the strength of the models because the data was the most specific and dealt
with the dynamic opportunities presented at each location.
124
Moreover, the conductor of the research creates another viable limitation of this
study. As a graduate student, the researcher had minimal expertise on terrorism prior to
the commencement of this thesis. The lack of expertise may have disseminated
throughout the coding process as the student researcher was the sole party responsible for
coding all the terrorist events examined in the study. Collaborating with other
researchers, possibly those with terrorism backgrounds and knowledge, may have
increased the validity and reliability of the coding process. However, to reduce the flaws
caused by this limitation, the researcher applied the EVIL DONE vulnerability
assessment as objectively and impartially as possible, given the data available.
Another limitation of the study is the sample size. This study examined exactly
111 terrorist attacks which was the minimum number of cases recommended for the
statistical analyses (Green, 1991). This is a limitation because using the minimum
number of cases results in lesser power, making it difficult to see small effects (Salkind,
2011). However, the study did find some fundamental relationships between the EVIL
DONE factors and the selected dependent variables that future research can build upon.
The final, and arguably most important, limitation of this study is the timing of
application. The objective of the EVIL DONE vulnerability assessment is to analyze the
vulnerability of targets long before a specific threat or attack occurs (Boba, 2009). By
design, the methodology is a proactive approach to identifying which targets are the most
vulnerable to attack, and consequently, which targets are in the greatest need of terrorism
opportunity reduction. Opposing the initial timing intentions of the assessment, this
study applied the EVIL DONE methodology in a reactive manner to locations that were
125
already targets of terrorist attacks. Granted, for research purposes, it is unrealistic to
assess locations that have not been targeted and await the next terrorist attack in order to
examine the value of EVIL DONE. Therefore, applying the EVIL DONE vulnerability
assessment in a reactive manner was the only viable technique for testing the
methodology. When applied proactively, and at the local, rather than international level,
the components of EVIL DONE that were excluded from this study could be more easily
measured and incorporated.
Future Research
The current study sought to evaluate the EVIL DONE vulnerability assessment in
order to determine if the methodology produces a vulnerability score that is consistent
with the number of fatalities and injured persons resulting from a terrorist attack.
Additionally, the study sought to determine how strongly each component of EVIL
DONE predicts the number of fatalities and injured persons in specific terrorist attacks.
Cogitating on the above-mentioned limitations, this research provides the foundation and
suggestions for future examinations of this topic.
First, future researchers ought to consider the limitation of the operationalization
of the dependent variable and attempt to develop a better measurement for the outcome of
terrorist attacks. How do terrorist attacks on highly Iconic targets with few fatalities
reflect the true outcome as a result of their vulnerability? Perhaps the number of people
injured or killed in such attacks is not the best method of assessing the true result of high
vulnerability.
126
Considering that extensive research seeking the application of vulnerability
assessments yielded inconclusive results and that this was the first study that applied
EVIL DONE to real life targets, alternative proposals for measurements were not
available. Nevertheless, it was ideal for this study to measure the outcome of terrorist
attacks by the number of fatalities and injured persons because of the data available. The
primary data source for the terrorist incidents, the Global Terrorist Database, included
these numbers for all attacks. Bearing in mind that loss of human life is considered the
most detrimental consequence of a terrorist attack, using these variables as the sole
measure for the outcome of attacks on vulnerable targets was warranted. However, future
research utilizing an alternative dependent variable may contribute to additional findings
on this topic.
Second, future research should consider the limitation of coding transportation
systems methodically and instead rank these locations using the best judgment for each
EVIL DONE component that is not directly applicable. The failure of these locations to
meet the minimum criteria for certain components highlights opportunities for research
improvements. Boba (2009) suggests that when certain attributes of a target are not
covered by the criteria provided in the vulnerability assessment, logical and thoughtful
choices should be applied since the criteria is a general method for assessing vulnerability
rather than a meticulous formula. However, as the first endeavor to test EVIL DONE, it
was ideal for this study to apply the vulnerability assessment methodically (or as near to a
formula as possible) in order to determine its true value. Therefore, future research

127
should consider these suggestions and score transportations systems in a less meticulous
manner.
Third, this study examined a set of terrorist attacks with no specific focus on
certain attributes. The terrorist attacks occurred in 24 countries and included targets
ranging from civilian children to military officials and attack types ranging from
bombings/explosions to assassinations. Narrowing the events by specific locations, such
as attacks solely in the United States, specific targets, such as attacks solely on
transportation systems, or even on specific types, such as attacks solely using IEDs, may
reveal more significant patterns. Thus, future research should seek to examine terrorist
attacks by category or specific attributes in hopes of reaching more specific findings.
Fourth, future research could use alternative statistical analyses to examine these
data. For example, factor analysis is a commonly used statistical method for identifying
the relationship between certain measureable variables and a number of unobservable
factors (Tryfos, 1998). More specifically, it determines “the general dimensions or
factors that exist within a set of concrete observations” (Babbie, 2010, p. 491). This type
of analysis may reveal relationships among the EVIL DONE components that differ from
those that were found in the examination of the third research question in this study.
Fifth, the data examined could be improved upon in future research. That is,
cases considered extreme or “outliers” could be eliminated from the analyses. As
discussed in Chapter 4, the mean of the dependent variable (i.e., number of injured
persons and fatalities) was highly skewed because of one or two cases (e.g., 9/11 had
2,722 fatalities where the average was 47.99). Conducting the analysis on more normally
128
distributed data would ensure that the data more closely adhere to the assumptions of the
statistics used and might result in more meaningful results. Also, a larger sample size
could be used for the analysis. This study examined only 111 terrorist attacks, and the use
of a greater sample size may assist in discovering relationships that were not evident
through the fewer cases examined here.
Lastly, future research should consider the design of the EVIL DONE
vulnerability assessment and the importance of timing. Applying the assessment
reactively and at the international level resulted in numerous limitations, including the
exclusions of key EVIL DONE components. Additionally, because the vulnerability
assessment was applied after terrorist attacks had already occurred, the internal validity
of the findings may be low. Therefore, future research should seek to apply the
methodology at a local level and assess the vulnerability of locations proactively in order
to bring about more pertinent results.
Conclusions and Implications for Terrorism Opportunity Reduction
Terrorism prevention has slowly become a primary concern to not only the federal
government, but also to local police departments who seek to protect their communities
from devastating terrorist attacks. Alongside the expanding interest in terrorism
prevention, financial constraints have forced local authorities to allocate funding
efficiently based on the cost-benefit analyses of certain tasks and programs. Thus, at a
time where terrorism prevention and financial hardships are evident, adopting affordable
methodologies that assist in effectively reducing the opportunities for terrorism is
essential. The current research suggests that EVIL DONE vulnerability assessment is an

129
effective methodology for assisting local police in identifying which locations are the
most vulnerable to terrorist attack. By identifying these targets, limited resources can be
more effectively applied to reduce the opportunities through techniques of situational
crime prevention.
Considering the results of this study, local authorities should focus opportunity
reduction efforts on locations that are Destructible and Occupied. The findings conclude
that these components of EVIL DONE are the most related to the number of fatalities and
injured persons. Building on these results, local authorities should seek to reduce
opportunities of a terrorist attack at the locations that are less destructible and house large
amounts of people for a majority of the day and days of the week by increasing perceived
efforts and risks and reducing perceived rewards, as suggested by SCP. Additionally, a
proactive solution may be to discourage the construction of large buildings that house
many people and hold media-attractive names, as these locations typically comprise
many components of a vulnerable target.
Despite the recommendations provided by the results of the analyses, it is
important to note that research on the EVIL DONE vulnerability assessment is in the very
early stages, with this study being the first academic manuscript to test its validity. Thus,
a more long-term implication of this study is that future analyses of EVIL DONE should
seek to expand the research findings, test the internal and external validity of the
assessment, and postulate future policy recommendations.

130
BIBLIOGRAPHY
Allen, P. (1997). Understanding regression analysis. New York, NY: Plenum Press.
Babbie, E. (2010). The practice of social research (12th ed.). Belmont, CA: Wadsworth.
Bernasco, W. (2010). A sentimental journey to crime: effects of residential history on
crime location choice. American Society of Criminology, 48(2), 389-416.
Boba, R. (2009). EVIL DONE. In J.D Freilich & G. Newman (Eds.) Reducing terrorism
through situational crime prevention, Crime prevention studies series, Volume 25
(pp. 71-91). Monsey, NY: Criminal Justice Press.
Brantingham, P., & Brantingham, P. (1993). Nodes, paths and edges: considerations on
the complexity of crime and the physical environment. Journal of Environmental
Psychology, 13, 3-28.
Clarke, R. V. (1983). Situational crime prevention: Its theoretical basis and practice
scope. Crime and Justice, 4, 225-256.
Clarke, R. V. (1997). Situational crime prevention: Successful case studies (2nd ed.).
Monsey, NY: Criminal Justice Press.
Clarke, R. V., & Cornish, D. (1985). Modeling offenders' decisions: A framework for
research and policy. Chicago Journals, 6, 147-185.
Clarke, R. V., & Newman, G. (2006). Outsmarting the terrorists. Westport, CT: Praeger
Security International.

131
Cohen, L.E., & Felson, M. (1979). Social change and crime rate trends: A routine activity
approach. American Sociological Review, 44(4), 588-608.
Community Oriented Policing Services. (n.d.). The problem analysis triangle. Center for
Problem Oriented Policing. Retrieved from http://www.popcenter.org.
Eyduran, E., Ozdemir, T., & Alarslan, E. (2005). Importance of diagnostics in multiple
regression analysis. Journal of Applied Sciences, 5(10), 1792-1796.
Felson, M., & Boba, R. (2010). Crime and everyday life (4th ed.). Los Angeles, CA:
Sage.
Field, A. (2009). Discovering statistics using SPSS (3rd ed.). Los Angeles, CA: Sage.
Glantz, K., & Turner, A. (2009). Threat, risk, and vulnerability assessment methodology.
Sheriff, 61(1), 14-18.
Global Terrorism Database. (2012). National Consortium for the Study of Terrorism and
Responses to Terrorism. Retrieved from http://www.start.umd.edu/gtd/about/.
Goldberg, A. (1992). The Pentagon: The first fifty years. Washington, DC: Office of the
Secretary of Defense.
Goldberg, A., Papadopoulos, S., Putney, D., Berlage, N., & Welch, R. (2007). Pentagon
9/11. Washington, DC: Office of the Secretary of Defense.
Green, S. B. (1991). How many subjects does it take to do a regression analysis?
Multivariate Behavioral Research, 26, 499-510.
Leech, N. L., Barrett, K. C., & Morgan, G. A. (2008). SPSS for intermediate statistics:
Use and interpretation. New York: L. Erlbaum Associates.

132
Leson, J. (2005). Assessing and managing the terrorism threat. Washington, DC: U.S.
Department of Justice.
National infrastructure protection plan. (2009). Washington, DC: Department of
Homeland Security.
Newman, G. & Clarke, R. (2008). Police terrorism: An executive’s guide. Washington,
DC: Office of Community Oriented Policing Services.
Noru is, M. (2008). SPSS statistics 17.0 guide to data analysis. Upper Saddle River, NJ:
Prentice Hall.
Salkind, N. (2011). Statistics for people who (think they) hate statistics (4th ed.). Los
Angeles, CA: Sage.
Santos, R. (2012). Theoretical foundations of crime analysis. Crime analysis with crime
mapping (3 ed.). Los Angeles, CA: Sage.
Sheppard, S., & Cizek, P. (2009). The ethics of Google Earth: Crossing thresholds from
spatial data to landscape visualization. Journal of Environmental Management,
90(6), 2102-2117.
Terrorism 2002-2005. (n.d.). Washington, DC: U.S. Department of Justice.
Tillyer, M., & Eck, J. (2011). Getting a handle on crime: A further extension of routine
activities theory. Security Journal, 24, 179-193.
Tryfos, P. (1998). Factor Analysis. Methods for business analysis and forecasting: text
and cases (pp. 1-22). New York: Wiley.
Copyright © 2022 FDOKUMEN