Detecting Botnets with Tight Command and Control
8
Detecting Botnets with Tight Command and Control 1 W. Timothy Strayer, Robert Walsh, Carl Livadas, and David Lapsley BBN Technologies 10 Moulton St. Cambridge, MA 02138 {strayer|rwalsh|clivadas|dlapsley}@bbn.com 1 This material is based upon work supported by the US Army Research Office under contract W911NF-05-C-0066. The content of the informa- tion does not necessarily reflect the position or the policy of the US Government, and no official endorsement should be inferred. Abstract Systems are attempting to detect botnets by examin- ing traffic content for IRC commands or by setting up honeynets. Our approach for detecting botnets is to examine flow characteristics such as bandwidth, dura- tion, and packet timing looking for evidence of botnet command and control activity. We have constructed an architecture that first eliminates traffic that is unlikely to be a part of a botnet, classifies the remaining traffic into a group that is likely to be part of a botnet, then correlates the likely traffic to find common communi- cations patterns that would suggest the activity of a botnet. Our results show that botnet evidence can be extracted from a traffic trace containing almost 9 mil- lion flows. 1 Introduction Botnets, and the zombie hosts that comprise their membership, present a particularly dangerous species of network-based attack. In February 2006 in Seattle, systems controlled by the Northwest Hospital com- puter network started acting strangely, and investiga- tion found the network was host to bots that formed a larger, worldwide botnet [1]. In August 2005, Britain’s NISCC (the UK equivalent to CERT) issued a warning about the increase in trojan activity targeting UK gov- ernment networks, stating that “the attacker’s aim ap- pears to be covert gathering and transmitting of com- mercially or economically valuable information” [2]. In November 2005, the discovery of a botnet in US DoD [3] caused the head of JTF-CNO and DISA to issue an “information assurance standdown” followed by a full sweep of all DoD networks [4]. Botnets are built by assembling a large number of compromised hosts into a group that is commanded to carry out attacks. They derive their power by scale, both in their cumulative bandwidth and in their reach. Botnets can cause severe network disruptions through massive distributed denial-of-service attacks, and the threat of this disruption can cost enterprises large sums in extortion fees. They are responsible for 80% of the spam on the Internet today [5]. Botnets are also used to harvest personal, corporate, or government sensitive information for sale on a thriving organized crime market. They are a reusable and renewable resource. Efforts are underway to quantify the botnet problem and design defenses against attacks by botnets. The Honeynet Project [6] has done extensive work on cap- turing live bots and characterizing botnet activities. A group of white-hat vigilantes is scouring the Internet looking for evidence of botnets [7]. A recent paper from a group at MIT suggests ways for websites and other services to thwart bot and other mechanical agents by using Turing tests [8]. Determining the source of a botnet-based attack is somewhat more challenging. First, there is a distinction between the attack and the attack mechanism. For sin- gle-flow [9] and “stepping stone” chained-flow [10] attacks, the flow is both the mechanism and the attack, but for botnets, the mechanism (the botnet) is con- structed and maintained independently of how it is used. Second, there is a difference of what constitutes the “attack origin.” The tracing of flow-based attacks attempts to yield a single responsible host; with bot- nets, every zombie host is an attacker. Finally, most flow-based traceback systems adopt a reactive ap- proach to attacks; the tracing of packets back to their origin hosts is triggered after an attack is detected. Botnets can exist in a benign state for an arbitrary amount of time before they are used for a specific at- tack, affording some opportunity to identify them prior to the attack. This paper presents a system for aggregating moni- tored traffic looking for evidence of botnets so that botnet-based attacks can be attributed to a botnet con- troller. We adopt a proactive approach by identifying hosts that are likely part of a botnet. This is not the same as definitively identifying the botnet and its con- troller; there is uncertainty until there is an actual at- tack. One of the benefits of tracking collections of
-
Upload
independent -
Category
Documents
-
view
2 -
download
0
Transcript of Detecting Botnets with Tight Command and Control

Detecting Botnets with Tight Command and Control1 W. Timothy Strayer, Robert Walsh, Carl Livadas, and David Lapsley
BBN Technologies 10 Moulton St.
Cambridge, MA 02138 {strayer|rwalsh|clivadas|dlapsley}@bbn.com
1 This material is based upon work supported by the US Army Research Office under contract W911NF-05-C-0066. The content of the informa-tion does not necessarily reflect the position or the policy of the US Government, and no official endorsement should be inferred.
Abstract Systems are attempting to detect botnets by examin-
ing traffic content for IRC commands or by setting up honeynets. Our approach for detecting botnets is to examine flow characteristics such as bandwidth, dura-tion, and packet timing looking for evidence of botnet command and control activity. We have constructed an architecture that first eliminates traffic that is unlikely to be a part of a botnet, classifies the remaining traffic into a group that is likely to be part of a botnet, then correlates the likely traffic to find common communi-cations patterns that would suggest the activity of a botnet. Our results show that botnet evidence can be extracted from a traffic trace containing almost 9 mil-lion flows.
1 Introduction Botnets, and the zombie hosts that comprise their
membership, present a particularly dangerous species of network-based attack. In February 2006 in Seattle, systems controlled by the Northwest Hospital com-puter network started acting strangely, and investiga-tion found the network was host to bots that formed a larger, worldwide botnet [1]. In August 2005, Britain’s NISCC (the UK equivalent to CERT) issued a warning about the increase in trojan activity targeting UK gov-ernment networks, stating that “the attacker’s aim ap-pears to be covert gathering and transmitting of com-mercially or economically valuable information” [2]. In November 2005, the discovery of a botnet in US DoD [3] caused the head of JTF-CNO and DISA to issue an “information assurance standdown” followed by a full sweep of all DoD networks [4].
Botnets are built by assembling a large number of compromised hosts into a group that is commanded to carry out attacks. They derive their power by scale, both in their cumulative bandwidth and in their reach. Botnets can cause severe network disruptions through massive distributed denial-of-service attacks, and the threat of this disruption can cost enterprises large sums
in extortion fees. They are responsible for 80% of the spam on the Internet today [5]. Botnets are also used to harvest personal, corporate, or government sensitive information for sale on a thriving organized crime market. They are a reusable and renewable resource.
Efforts are underway to quantify the botnet problem and design defenses against attacks by botnets. The Honeynet Project [6] has done extensive work on cap-turing live bots and characterizing botnet activities. A group of white-hat vigilantes is scouring the Internet looking for evidence of botnets [7]. A recent paper from a group at MIT suggests ways for websites and other services to thwart bot and other mechanical agents by using Turing tests [8].
Determining the source of a botnet-based attack is somewhat more challenging. First, there is a distinction between the attack and the attack mechanism. For sin-gle-flow [9] and “stepping stone” chained-flow [10] attacks, the flow is both the mechanism and the attack, but for botnets, the mechanism (the botnet) is con-structed and maintained independently of how it is used. Second, there is a difference of what constitutes the “attack origin.” The tracing of flow-based attacks attempts to yield a single responsible host; with bot-nets, every zombie host is an attacker. Finally, most flow-based traceback systems adopt a reactive ap-proach to attacks; the tracing of packets back to their origin hosts is triggered after an attack is detected. Botnets can exist in a benign state for an arbitrary amount of time before they are used for a specific at-tack, affording some opportunity to identify them prior to the attack.
This paper presents a system for aggregating moni-tored traffic looking for evidence of botnets so that botnet-based attacks can be attributed to a botnet con-troller. We adopt a proactive approach by identifying hosts that are likely part of a botnet. This is not the same as definitively identifying the botnet and its con-troller; there is uncertainty until there is an actual at-tack. One of the benefits of tracking collections of
hosts displaying botnet characteristics is that there is a possibility (with strong enough evidence) of neutraliz-ing the botnet prior to the launch of a large attack.
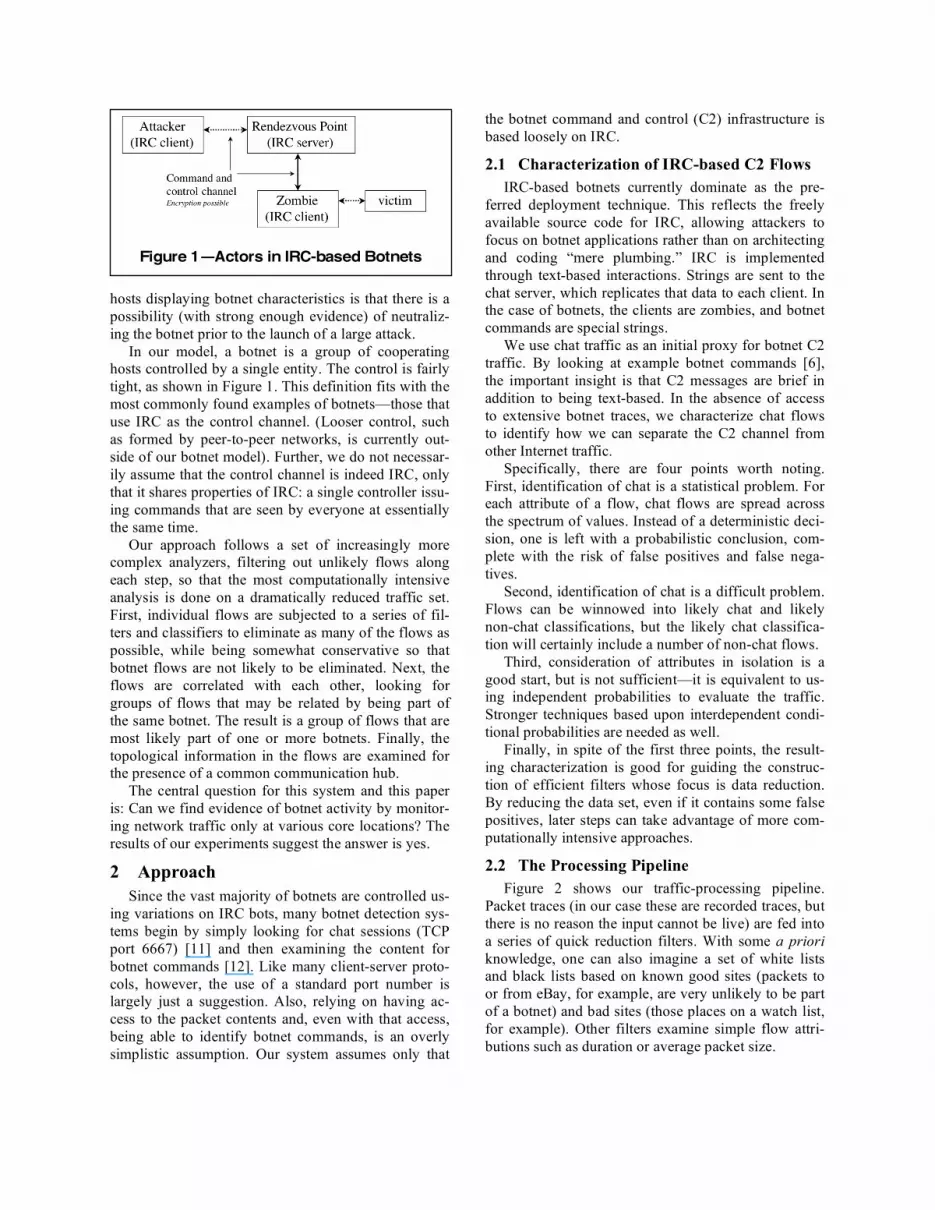
In our model, a botnet is a group of cooperating hosts controlled by a single entity. The control is fairly tight, as shown in Figure 1. This definition fits with the most commonly found examples of botnets—those that use IRC as the control channel. (Looser control, such as formed by peer-to-peer networks, is currently out-side of our botnet model). Further, we do not necessar-ily assume that the control channel is indeed IRC, only that it shares properties of IRC: a single controller issu-ing commands that are seen by everyone at essentially the same time.
Our approach follows a set of increasingly more complex analyzers, filtering out unlikely flows along each step, so that the most computationally intensive analysis is done on a dramatically reduced traffic set. First, individual flows are subjected to a series of fil-ters and classifiers to eliminate as many of the flows as possible, while being somewhat conservative so that botnet flows are not likely to be eliminated. Next, the flows are correlated with each other, looking for groups of flows that may be related by being part of the same botnet. The result is a group of flows that are most likely part of one or more botnets. Finally, the topological information in the flows are examined for the presence of a common communication hub.
The central question for this system and this paper is: Can we find evidence of botnet activity by monitor-ing network traffic only at various core locations? The results of our experiments suggest the answer is yes.
2 Approach Since the vast majority of botnets are controlled us-
ing variations on IRC bots, many botnet detection sys-tems begin by simply looking for chat sessions (TCP port 6667) [11] and then examining the content for botnet commands [12]. Like many client-server proto-cols, however, the use of a standard port number is largely just a suggestion. Also, relying on having ac-cess to the packet contents and, even with that access, being able to identify botnet commands, is an overly simplistic assumption. Our system assumes only that
the botnet command and control (C2) infrastructure is based loosely on IRC.
2.1 Characterization of IRC-based C2 Flows IRC-based botnets currently dominate as the pre-
ferred deployment technique. This reflects the freely available source code for IRC, allowing attackers to focus on botnet applications rather than on architecting and coding “mere plumbing.” IRC is implemented through text-based interactions. Strings are sent to the chat server, which replicates that data to each client. In the case of botnets, the clients are zombies, and botnet commands are special strings.
We use chat traffic as an initial proxy for botnet C2 traffic. By looking at example botnet commands [6], the important insight is that C2 messages are brief in addition to being text-based. In the absence of access to extensive botnet traces, we characterize chat flows to identify how we can separate the C2 channel from other Internet traffic.
Specifically, there are four points worth noting. First, identification of chat is a statistical problem. For each attribute of a flow, chat flows are spread across the spectrum of values. Instead of a deterministic deci-sion, one is left with a probabilistic conclusion, com-plete with the risk of false positives and false nega-tives.
Second, identification of chat is a difficult problem. Flows can be winnowed into likely chat and likely non-chat classifications, but the likely chat classifica-tion will certainly include a number of non-chat flows.
Third, consideration of attributes in isolation is a good start, but is not sufficient—it is equivalent to us-ing independent probabilities to evaluate the traffic. Stronger techniques based upon interdependent condi-tional probabilities are needed as well.
Finally, in spite of the first three points, the result-ing characterization is good for guiding the construc-tion of efficient filters whose focus is data reduction. By reducing the data set, even if it contains some false positives, later steps can take advantage of more com-putationally intensive approaches.
2.2 The Processing Pipeline Figure 2 shows our traffic-processing pipeline.
Packet traces (in our case these are recorded traces, but there is no reason the input cannot be live) are fed into a series of quick reduction filters. With some a priori knowledge, one can also imagine a set of white lists and black lists based on known good sites (packets to or from eBay, for example, are very unlikely to be part of a botnet) and bad sites (those places on a watch list, for example). Other filters examine simple flow attri-butions such as duration or average packet size.
Figure 1—Actors in IRC-based Botnets

After the initial filters, the remaining flows are passed through a flow classification engine based on machine learning techniques. The classifiers attempt to group flows into broadly defined applications. Those flows that appear to have chat-like characteristics are passed on to the correlator stage.
The correlator does a pair-wise examination of the remaining flows looking for flows that are behaving in a similar manner, as one might expect of two flows generated by the same application. Botnets are so large that commands are issued to the whole group, or large subgroups, and not to individuals. Flows that are corre-lated are passed on to topological analysis, where “so-cial topology” is applied to determine which flows share a common controller.
The result of this pipeline is a (hopefully) small set of flows that show a fair amount of evidence that they are related and are part of a botnet. The pipeline does not prove the flows are part of a botnet; rather, the flows that survive strongly suggest closer examination. This examination may be deep, if there is access to the hosts that are the flow endpoints, as may happen in an enterprise or campus, or the examination may be lim-ited to listing the flows and the flow endpoints in a watch list for later use if a botnet-based attack occurs. Knowing the social structure of a group of hosts prior to an attack is better than trying to piece the structure together during the attack.
3 Detecting a Botnet An advantage to using a pipelined approach is that
each stage can be designed and tested largely inde-pendently of the others, but the real test is if the pipe-line behaves as expected from start to finish. We con-ducted many experiments on each stage (in particular, the interesting results and insights from the classifiers stage is discussed in a separate paper [13]); in this pa-per, however, we focus on the whole process, starting with over nine million flows to find evidence of a bot-net operating in the network.
3.1 Source of Background Traffic It would be too contrived to try to create a large
dataset of both background and botnet traffic using a tightly controlled testbed. Instead, we incorporated a background traffic data set that seemed to typify the range and variety of real world traffic. We chose packet traces collected on the Dartmouth campus under their Crawdad project [14]. The traces are a complete set of TCP/IP headers from the campus wireless, taken over a period of four months (November 1, 2003 to February 28, 2004) from a variety of campus locations. No payloads were included in the trace.
In all, the traces were 164 GBytes compressed, and approximately 3.8 times that amount when uncom-pressed. This large trace set means that we truly are looking for the needle (botnet C2 flows) in a haystack.
As the first step of data reduction, we convert the sequence of packets into flow summaries. Later, after suspect infrastructure is identified, a forensic archive of packet-level data can be collected and analyzed.
3.2 Source of Botnet Traces In order to generate traffic that was reprentative of
real botnet traffic, we implemented a benign bot based on the “Kaiten” bot, a widespread bot that has readily downloadable source code. The Kaiten bot was imple-mented in C using approximately 1000 lines of code. We reverse engineered the Kaiten software and then re-implemented it.
The original Kaiten bot had a reportoire of TCP- and UDP-based attacks. Our bot implementation attack code has been modified to render it “harmless.” Like the Kaiten bot, our bot provides a number of remotely controlled features, including a mechanism to execute arbitrary commands on the bot client, HTTP download capability, a flexible multi-process architecture, a highly configurable architecture and a rich command set.
In order to obtain traces of actual botnet traffic, we constructed a botnet test facility. This facility involved a simple setup modeled along the lines of a chat-based botnet architecture. Our setup involved an IRC server,
Figure 2—Botnet Detection Processing Pipeline

a code server, 13 zombies, an attacker, and a victim host. Figure 3 depicts a block diagram of our botnet test facility architecture.
We used this test facility to obtain actual traces of the communications between the various botnet entities while the botnet was in operation. Our experiments entailed using the IRC server to instruct the zombies to download attack code from the code server and to sub-sequently launch a coordinated TCP “attack” on the victim host (the attack consisted of 1 packet from each zombie). The traces collected involved ssh transmis-sions used for setting up and monitoring the experi-ments, IRC traffic between the bots and the IRC server, http traffic between the zombies and the code server (for downloading the attack code), and the TCP traffic involved in the coordinated TCP -attack on the victim host. The setup and the launch of the attack were suc-cessively repeated in order to increase the amount of trace data collected.
We collected 74 flows associated with our botnet, of which 30 were C2 flows. We merged this botnet trace with the Dartmouth traffic data set in order to create a test data set that contained ground truth that could be verified after all of the data reduction filters and other analyzers have been applied. Our botnet was active on the order of hours, while the Dartmouth traces span four months, exacerbating the vast size difference between the needle and the haystack.
3.3 Filtering Stage We recognize that there is a trade-off between iden-
tifying botnet C2 flows, and stepwise reduction of the data set to the meaningful subset of flows. The selec-tion of the cutoff for quick filtering for data reduction requires both quantitative statistical information and human judgment. Even if the selection of the cutoff were phrased in terms of meeting a false positive or a
false negative goal, that goal is based upon judgment. The filters and filter parameters we chose reflect this.
There were five distinct filters in this stage. The first filtered by IP protocol to select TCP-based flows, resulting in 8,933,303 flows. Since the bot was derived from an IRC-style TCP base, all of the ground-truth botnet C2 flows were TCP based. All of the C2 flows survived this filter.
The second filter removed the nuisance port-scanning chaff, reducing the data set to 4,750,262 flows. Flows containing only TCP packets with SYN or RST flags indicate that communication was never established, and so provide no information about chat or botnet C2 flows. No application-level data was transferred by these flows. Unfortunately for today’s Internet, probes of system vulnerabilities are common-place. While SYN-RST exchanges indicate suspicious activity that may be worth investigation, they do not assist with characterizing botnet C2 flows. About 47% of the flows are eliminated by this step. Again, all of the ground-truth botnet C2 flows survived the filter.
Since botnets do not sustain bulk data transfers, the next filter removed high bit-rate flows. Peer-to-peer file sharing is a significant load on the Internet, and may take place on chat ports by co-incidence (since the chat port is not reserved) or by intent (to avoid identifi-cation and filtering). Dropping bulk transfers (flow bandwidth greater than 8 Kb/s with at least 50 packets) also eliminates software updates and rich web page transfers. Yet, filtering the high bit-rate flows had a small effect. About 1% of the flows are dropped, leav-ing 4,699,662. From a flow perspective, this is a minor amount, but from a packet and forensic archive per-spective this represents a worthwhile effort. Again, all of the bot C2 flows survived the filter.
Chat (and botnet C2 commands) generally generate small packets. Using a 300-byte packet size cutoff for the chat packets in the Dartmouth data set shows that about 0.25% of the chat traffic would be falsely re-jected and 72% of the non-chat flows are eliminated. Since there are several orders of magnitude more non-chat flows than chat flows, filtering exclusively on average packet size would cut the amount of data to process in half; since this filter comes fourth, it has a relatively moderate affect. About 7% of the flows are dropped, leaving 4,385,435. All of the ground-truth botnet C2 flows survived the filter.
The fifth filter drops brief flows (less than 2 packets or 60 seconds) from consideration. Real chats and bot-nets are likely not well represented by excessively short duration flows. This filter has a significant effect, reducing the data by a factor of about 18.4, dominating even the elimination of the port-scanning activities. All of the ground-truth botnet C2 flows survived the filter.
Figure 3—Botnet Test Facility
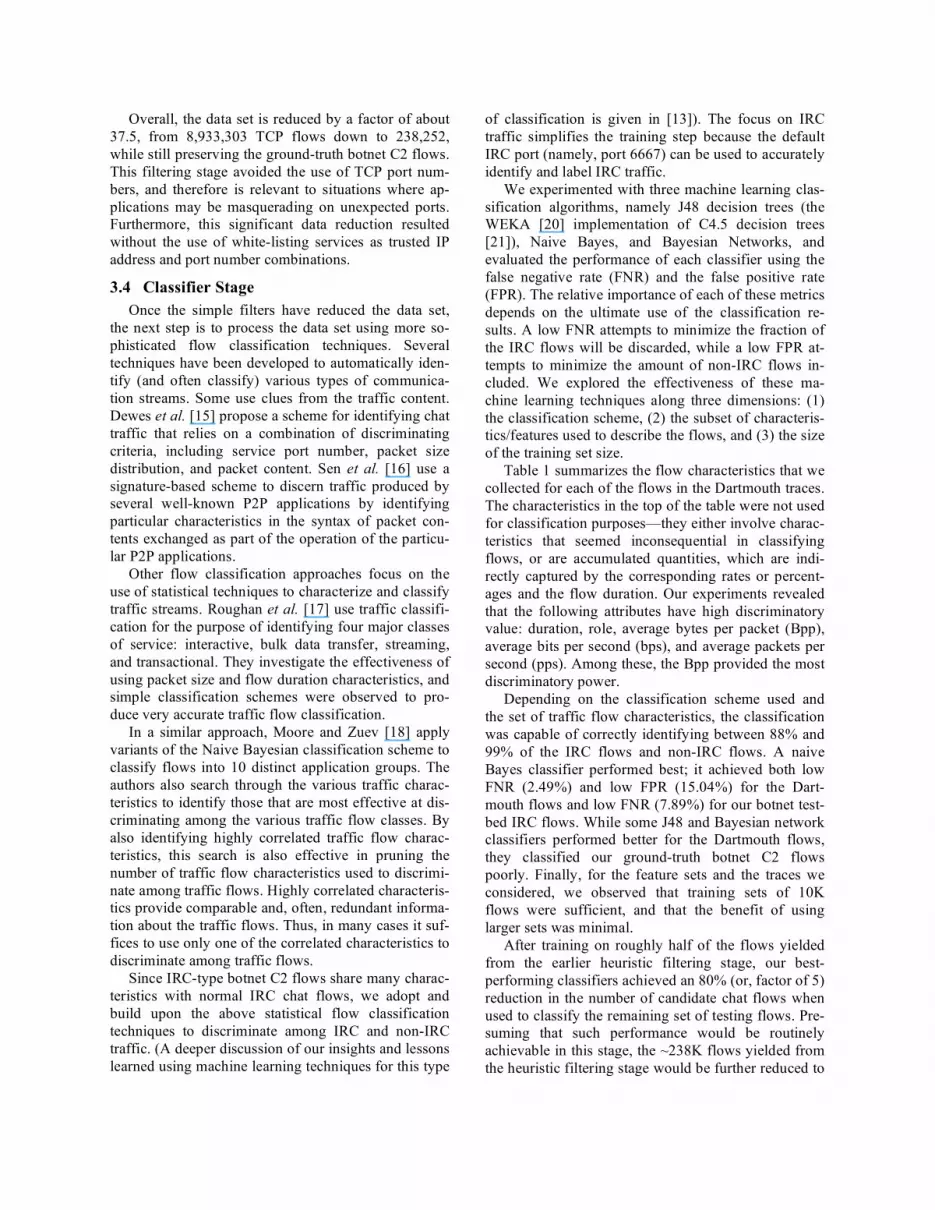
Overall, the data set is reduced by a factor of about 37.5, from 8,933,303 TCP flows down to 238,252, while still preserving the ground-truth botnet C2 flows. This filtering stage avoided the use of TCP port num-bers, and therefore is relevant to situations where ap-plications may be masquerading on unexpected ports. Furthermore, this significant data reduction resulted without the use of white-listing services as trusted IP address and port number combinations.
3.4 Classifier Stage Once the simple filters have reduced the data set,
the next step is to process the data set using more so-phisticated flow classification techniques. Several techniques have been developed to automatically iden-tify (and often classify) various types of communica-tion streams. Some use clues from the traffic content. Dewes et al. [15] propose a scheme for identifying chat traffic that relies on a combination of discriminating criteria, including service port number, packet size distribution, and packet content. Sen et al. [16] use a signature-based scheme to discern traffic produced by several well-known P2P applications by identifying particular characteristics in the syntax of packet con-tents exchanged as part of the operation of the particu-lar P2P applications.
Other flow classification approaches focus on the use of statistical techniques to characterize and classify traffic streams. Roughan et al. [17] use traffic classifi-cation for the purpose of identifying four major classes of service: interactive, bulk data transfer, streaming, and transactional. They investigate the effectiveness of using packet size and flow duration characteristics, and simple classification schemes were observed to pro-duce very accurate traffic flow classification.
In a similar approach, Moore and Zuev [18] apply variants of the Naive Bayesian classification scheme to classify flows into 10 distinct application groups. The authors also search through the various traffic charac-teristics to identify those that are most effective at dis-criminating among the various traffic flow classes. By also identifying highly correlated traffic flow charac-teristics, this search is also effective in pruning the number of traffic flow characteristics used to discrimi-nate among traffic flows. Highly correlated characteris-tics provide comparable and, often, redundant informa-tion about the traffic flows. Thus, in many cases it suf-fices to use only one of the correlated characteristics to discriminate among traffic flows.
Since IRC-type botnet C2 flows share many charac-teristics with normal IRC chat flows, we adopt and build upon the above statistical flow classification techniques to discriminate among IRC and non-IRC traffic. (A deeper discussion of our insights and lessons learned using machine learning techniques for this type
of classification is given in [13]). The focus on IRC traffic simplifies the training step because the default IRC port (namely, port 6667) can be used to accurately identify and label IRC traffic.
We experimented with three machine learning clas-sification algorithms, namely J48 decision trees (the WEKA [20] implementation of C4.5 decision trees [21]), Naive Bayes, and Bayesian Networks, and evaluated the performance of each classifier using the false negative rate (FNR) and the false positive rate (FPR). The relative importance of each of these metrics depends on the ultimate use of the classification re-sults. A low FNR attempts to minimize the fraction of the IRC flows will be discarded, while a low FPR at-tempts to minimize the amount of non-IRC flows in-cluded. We explored the effectiveness of these ma-chine learning techniques along three dimensions: (1) the classification scheme, (2) the subset of characteris-tics/features used to describe the flows, and (3) the size of the training set size.
Table 1 summarizes the flow characteristics that we collected for each of the flows in the Dartmouth traces. The characteristics in the top of the table were not used for classification purposes—they either involve charac-teristics that seemed inconsequential in classifying flows, or are accumulated quantities, which are indi-rectly captured by the corresponding rates or percent-ages and the flow duration. Our experiments revealed that the following attributes have high discriminatory value: duration, role, average bytes per packet (Bpp), average bits per second (bps), and average packets per second (pps). Among these, the Bpp provided the most discriminatory power.
Depending on the classification scheme used and the set of traffic flow characteristics, the classification was capable of correctly identifying between 88% and 99% of the IRC flows and non-IRC flows. A naive Bayes classifier performed best; it achieved both low FNR (2.49%) and low FPR (15.04%) for the Dart-mouth flows and low FNR (7.89%) for our botnet test-bed IRC flows. While some J48 and Bayesian network classifiers performed better for the Dartmouth flows, they classified our ground-truth botnet C2 flows poorly. Finally, for the feature sets and the traces we considered, we observed that training sets of 10K flows were sufficient, and that the benefit of using larger sets was minimal.
After training on roughly half of the flows yielded from the earlier heuristic filtering stage, our best-performing classifiers achieved an 80% (or, factor of 5) reduction in the number of candidate chat flows when used to classify the remaining set of testing flows. Pre-suming that such performance would be routinely achievable in this stage, the ~238K flows yielded from the heuristic filtering stage would be further reduced to

~48K flows. In the case of the testbed flows, our best-performing classifiers retained 29 of the 30 chat flows.
Despite their promise, the training and performance of classifiers was quite sensitive to the flow attributes used, the training set, and the number of flows used for training. Thus, prior to their use in a deployable system we expect that further effort would be needed in order to identify the most beneficial flow characteristics and training set.
3.5 Correlation Stage The filters and classifiers have reduced the traffic
data set from almost 9 million flows to about 48 thou-sand, but recall that these flows span a four-month pe-riod. Our next stage, correlation, looks for relationships between two or more flows that suggest that they are part of the same botnet. The question about whether one flow is correlated with another only makes sense if the two flows are active at the same time, so while we have four months of data, the correlation stage is run at a particular instance in time. The question is: Who is correlated at this moment?
We picked a time during the data when we knew the botnet was active (7:44am on November 2). There were 69 post-filtered flows active at that time, as com-pared to 2112 active flows if no filtering or classifica-tion had occurred. Of the 69 active flows, 30 were ground-truth botnet C2 flows.
There are several reasons for closely correlated flows, namely chains of remote logins, or stepping stones, simultaneous bulk or periodic transfers, and broadcasts or multicasts. Because of the one-to-many “multicasting” model of the C2 (and chat) architecture, we expect the communication flows between the botnet C2 host and the IRC server, and between the IRC server and the botnet members, to be temporally corre-lated. Since data sent to the chat server is promptly multicast to all chat members, the flows to and from all
chat members should exhibit similar timing character-istics as well as contemporary fluctuations in band-width.
There are several temporal correlation algorithms proposed to identify flows related by being part of a “stepping stone” connection chain [10][22][23]. BBN also designed a timing-based correlation algorithm [24]. Any of these could be applied to this stage, but they are each computationally expensive. These and most other current flow correlation algorithms examine each flow every time there is a new packet arrival, and every pair-wise “correlation value” is updated. This implies O(n2) calculations for each packet, where n is the number of active flows. We wanted to develop an algorithm that performed a calculation only on the packet’s flow, delaying the O(n2) comparison until the time when flow correlation question was asked.
However, we decided to use the opportunity to ap-ply a completely new algorithm that we were designing that described a flow as a point in a five-dimensional space. The first three dimensions are moments on the packet interarrival times (IAT), specifically the most recent IAT, the weighted moving average IAT, and the weighted moving variation of the IAT. The fourth and fifth dimensions are moments on the packet size, spe-cifically the weighted moving average packet size and the weighted moving variation of the packet size. We hypothesize that a point in 5-space (normalized to the range 0 to 1 on each axis) can accurately describe a particular flow at a particular moment in time, and that using the distance between two points represents how different two flows are. That is, two flows are consid-ered correlated if the Euclidean distance between their points in 5-space is small.
Figure 4 shows the results of pair-wise distances be-tween each of the 69 flows. Five flows have a distance of less than 0.01 (no units, but highly correlated). These five flows almost completely form a cluster; only flows 1 and 3 do not have a distance less than 0.01. This clustering strongly suggests that the flows
start/end Flow start and end times
IP-proto IP protocol of flow
TCP flags Summary of TCP SYN/FIN/ACK flags
pkts Total pkts exchanged in flow
Bytes Total Bytes exchanged in flow
pushed pkts Total packets pushed in flow
duration Flow duration
maxwin Maximum initial congestion window
role Whether client or server initiated flow
Bpp Average Bytes-per-packet for flow
bps Average bits-per-second for flow
pps Average packets-per-second for flow
PctPktsPushed Percentage of packets pushed in flow
PctBppHistBin0-7 Percent of packets in one of eight packet size
bins; these variables collectively form a
histogram of packet size for flow
varIAT Variance of packet inter-arrival time for flow
varBpp Variance of Bytes-per-packet for flow
Table 1—Traffic Flow Characteristics
Figure 4—Clustering of Correlated Flows

are related and, in fact, they are five of our ground-truth botnet flows.
Two questions arise: Why didn’t more of the botnet flows correlate closely with these 5, and Why is it more important to get at least some in a cluster and not necessarily all? The answer to the first question has to do with the way we constructed the botnet testbed. We hosted 10 bots on two virtual machines, which proba-bly skewed the flow timing. Also, we continue to ex-periment with different flow characteristics as dimen-sions for the correlation algorithm, and packet size appears to be a rather weak one.
It is more important to find an incomplete cluster than to focus on finding a complete one because a clus-ter of any size is unusual enough to suggest further investigation. Once we have a reason to believe that a cluster exists, then we can move to the topological analysis stage to try to figure out why there is a cluster, and if there are other pieces of information we can de-rived from the cluster.
3.6 Topological Analysis Stage The identification of clusters of related flows cer-
tainly suggest further investigation, which is the aim of this last stage, the topological analysis. The correlation stage does not prove the existence of a botnet—there is no test for maliciousness in the filtering, classifying, and clustering of flows—but given a cluster of flows, the natural next question is, What structure do these and other flows form, and does this structure identify a host that is acting like a botnet controller.
The topological analysis starts by using the IP ad-dresses in the cluster to look for a common endpoint, or rendezvous point, as shown in Figure 1. This is the communications relay that takes the commands from the controller and distributes them out to the zombie hosts. (Note that there can be multiple rendezvous points, and these rendezvous points can be hierarchical, to support scalability.) A graph of these clustered flows can be easily generated automatically.
The next step is to expand the cluster of flows dis-covered by correlation by searching through the traffic data set for other flows that share this endpoint and are contemporary to the original cluster.
The final step, one for which we have no automated algorithm, is to examine the flows for clues as to which among them, if any, is the flow between the controller and the rendezvous point. There are several character-istics that this controller flow may exhibit that the oth-ers do not. Such characteristics may include differ-ences in the amount of data, in the timing of the trans-missions, etc. For instance, the controller-rendezvous point flow may initiate more frequent and higher vol-ume transmissions to the rendezvous point than the flows from the rendezvous point to the zombie hosts.
There may also be causal relationship between the transmissions from the controller with respect to the transmissions to the zombies.
4 Discussion While it has been suggested that botnet controllers
will migrate from IRC as their preferred C2 infrastruc-ture [25], the abstract model of tight central control represented by IRC is very efficient and will likely survive for quite some time. It is important, therefore, to consider a system that detects very large, high vol-ume data sets for evidence of tight botnet C2 activity.
Our system performs gross, simple filtering to re-duce the amount of data that will be subjected to more computationally intensive algorithms. Once the data has been filtered, the flows are classified using ma-chine learning techniques, then the flows that are in the “chat” class are correlated to find clusters of flows that share similar timing and packet size characteristics. The cluster is then analyzed to try to identify the botnet controller host.
Our experiment with Dartmouth campus data, start-ing with nearly 9 million flows augmented with traffic traces from a benign botnet, shows that the ground truth botnet C2 flows can indeed survive the data re-duction and correlation to be identified as a cluster. These results show that the method is promising.
This method is also nicely suited for real-time analysis of traffic data. The filtering stage requires very simple logic to cull the data set down by a factor of 37. While we may not be able to expect that degree of re-duction in all cases, there was nothing particularly spe-cial about the Dartmouth data that contributed to the reduction factor. The culling of the data, especially when done in real time, allows much more time for more complex algorithms later in the pipe, namely the machine learning classifiers and the correlation.
An important lesson learned from our classification stage is the importance of both legitimate and mali-cious training traffic and an accurate manner to label it. Given such representative training traffic, machine learning based classifiers can perform well and be very effective. The trick is the get a good training set.
Our experience with the new correlation algorithm showed that the algorithm holds promise. The algo-rithm we used is designed to reduce the computational complexity of comparing n flows in a pair-wise man-ner. The resulting cluster, while not a complete set of flows from the ground truth botnet, was certainly enough to allow the topological analysis of the flow endpoints, and the rest of the ground-truth botnet traf-fic was easily extracted.
Detecting botnet activity is presently labor intensive and largely ad hoc. Our pipelined botnet C2 detection system shows that it is possible to comb through
packet traces, even in real time, to extract evidence of tight command and control activity.
Acknowledgments We also wish to thank Doug Maughan and Cliff
Wang for their support, Mark Allman for his valuable insights, and David Kotz for his help with the back-ground traffic data.
References [1] “Three charged with Seattle hospital botnet at-
tack,” The Register, February 14, 2006. [2] National Infrastructure Security Coordination
Center, “Targeted Trojan Email Attacks,” NISCC Briefing 08/2005, June 16, 2005.
[3] Rob Thormeyer, “Hacker Arrested for Breaching DoD Systems with ‘Botnets’,” Government Computer News, November 4, 2005.
[4] Defense Security Service, Memorandum for Fa-cility Security Officers: Foreign-based Threat to Defense Contractor Unclassified Networks, Oc-tober 18, 2005.
[5] CNN.com, “Expert: Botnets No. 1 Emerging In-ternet Threat,” January 31, 2006.
[6] The Honeynet Project, Know Your Enemy: Learning about Security Threats, 2nd Edition, Addison-Wesley, 2004.
[7] S. Kandula, D. Katabi, M. Jacob, and A. Berger, “Botz-4-Sale: Surviving Organized DDoS At-tacks that Mimic Flash Crowds,” Proc. 2nd Sym-posium on Networked Systems Design and Im-plementation, Boston, MA, May 2-4, 2005.
[8] R. Naraine, “Botnet Hunters Search for ‘Com-mand and Control’ Servers,” eWeek, June 17, 2005.
[9] A. C. Snoeren, C. Partridge, L. A. Sanchez, C. E. Jones, F. Tchakountio, S. T. Kent, and W. T. Strayer, “Single-IP Packet Traceback,” IEEE/ACM Transactions on Networking (ToN), Volume 10, Number 6, December 2002.
[10] Y. Zhang and V. Paxson, “Detecting Stepping Stones,” Proc. 9th USENIX Security Symposium, August 2000.
[11] A. Householder, Art Manion, Linda Pesante, George M. Weaver, and Rob Thomas, “Manag-ing the Threat of Denial-of-Service Attacks,” CERT Coordination Center, October 2001.
[12] P. Barford and V. Yegneswaran, “An Inside Look at Botnets,” Special Workshop on Malware Detection, Advances in Information Security, Springer Verlag, 2006.
[13] C. Livadas, R. Walsh, D. Lapsley, and T. Strayer, “Using Machine Learning Techniques to Identify Botnet Traffic,” Submitted to 2nd IEEE LCN Workshop on Network Security, 2006.
[14] D. Kotz and T. Henderson, “CRAWDAD: A Community Resource for Archiving Wireless Data at Dartmouth,” IEEE Pervasive Computing, Volume 4, Issue 4, October-December 2005.
[15] C. Dewes, A. Wichmann, and A. Feldmann, “An Analysis of Internet Chat Systems,” Proc. 3rd ACM SIGCOMM Conf. on Internet Measure-ment, Miami Beach, FL, 2003.
[16] S. Sen, O. Spatscheck, and D. Wang, “Accurate, Scalable In-Network Identification of P2P Traffic Using Application Signatures,” Proc. 13th Inter-national Conf. on World Wide Web, New York, NY, 2004.
[17] M. Roughan, S. Sen, O. Spatscheck, and N. Duf-field, “Class-of-Service Mapping for QoS: A Sta-tistical Signature-Based Approach to IP Traffic Classification,” Proc. 4th ACM SIGCOMM Conf. on Internet Measurement, Taormina, Sicily, 2004.
[18] A. W. Moore and D. Zuev, “Internet Traffic Classification using Bayesian Analysis Tech-niques,” Proc. 2005 ACM SIGMETRICS Interna-tional Conf. on Measurement and Modeling of Computer Systems, Banff, Alberta, Canada, 2005.
[19] T. Karagiannis, A. Broido, M. Faloutsos, and kc claffy, “Transport Layer Identification of P2P Traffic,” Proc. 4th ACM SIGCOMM Conf. on In-ternet Measurement, Taormina, Sicily, 2004.
[20] I. H. Witten and E. Frank, Data Mining: Practi-cal Machine Learning Tools and Techniques, 2nd Edition, Morgan Kaufmann, 2005.
[21] R. O. Duda, P. E. Hart, and D. G. Stork, Pattern Classification, 2nd Edition, John Wiley & Sons, Inc., 2001.
[22] D. L. Donoho, A. G. Flesia, U. Shankar, V. Pax-son, J. Coit, and S. Staniford, “Multiscale Step-ping-Stone Detection: Detecting Pairs of Jittered Interactive Streams by Exploiting Maximum Tol-erable Delay,” Proc. International Symposium on Recent Advances in Intrusion Detection (RAID), Zurich, Switzerland, October 2002.
[23] K. Yoda and H. Etoh, “Finding a Connection Chain for Tracing Intruders,” Proc. European Symposium on Research in Computer Security, Toulouse, France, October 2000.
[24] W. T. Strayer, C. E. Jones, B. Schwartz, J. Mik-kelson, and C. Livadas, “Architecture for Multi-Stage Network Attack Traceback,” First IEEE LCN Workshop on Network Security, Sydney, Australia, 15-17 November 2005.
[25] E. Cooke, F. Jahanian, and D. McPherson, “The Zombie Roundup: Understanding, Detecting, and Disrupting Botnets,” USENIX SRUTI Workshop, July 7, 2005.