
Trade-Off between Object Selectivity and Tolerance in Monkey Inferotemporal Cortex
16
Behavioral/Systems/Cognitive Trade-Off between Object Selectivity and Tolerance in Monkey Inferotemporal Cortex Davide Zoccolan, Minjoon Kouh, Tomaso Poggio, and James J. DiCarlo McGovern Institute for Brain Research, Department of Brain and Cognitive Sciences, Center for Biological and Computational Learning, Massachusetts Institute of Technology, Cambridge, Massachusetts 02142 Object recognition requires both selectivity among different objects and tolerance to vastly different retinal images of the same object, resulting from natural variation in (e.g.) position, size, illumination, and clutter. Thus, discovering neuronal responses that have object selectivity and tolerance to identity-preserving transformations is fundamental to understanding object recognition. Although selectivity and tolerance are found at the highest level of the primate ventral visual stream [the inferotemporal cortex (IT)], both properties are highly varied and poorly understood. If an IT neuron has very sharp selectivity for a unique combination of object features (“diagnostic features”), this might automatically endow it with high tolerance. However, this relationship cannot be taken as given; although some IT neurons are highly object selective and some are highly tolerant, the empirical connection of these key properties is unknown. In this study, we systematically measured both object selectivity and tolerance to different identity-preserving image transformations in the spiking responses of a population of monkey IT neurons. We found that IT neurons with high object selectivity typically have low tolerance (and vice versa), regardless of how object selectivity was quantified and the type of tolerance examined. The discovery of this trade-off illuminates object selectivity and tolerance in IT and unifies a range of previous, seemingly disparate results. This finding also argues against the idea that diagnostic conjunctions of features guarantee tolerance. Instead, it is naturally explained by object recogni- tion models in which object selectivity is built through AND-like tuning mechanisms. Key words: inferotemporal cortex; monkey; object recognition; multiple objects; trade-off; tolerance Introduction The key computational problem of object recognition is attaining both selectivity among different visual objects and tolerance to variation in each object’s appearance (e.g., as a result of changes in position, size, illumination, clutter, etc.). The primate visual system has solved this problem: primates robustly and effortlessly discriminate among visual objects over the wide range of images that each object produces during natural vision (Potter, 1976; Intraub, 1980; Rubin and Turano, 1992; Logothetis and Shein- berg, 1996; Thorpe et al., 1996; Edelman, 1999; Rousselet et al., 2004). What neuronal architecture and computations create such a selective and tolerant representation of visual objects? Because previous work indicates that these properties are built by a hier- archy of cortical stages (the ventral visual stream) (Logothetis and Sheinberg, 1996; Tanaka, 1996; Rolls, 2000; Rousselet et al., 2004), experimental studies can shed light on this question by examining the strength, variation, and relationship of object se- lectivity and tolerance across the ventral visual stream. Here we focus on the culmination of the ventral visual stream, the anterior portion of the inferotemporal cortex (IT). Although object selectivity and tolerance are found in IT, these properties are highly varied both within and across studies (Logothetis and Sheinberg, 1996; Tanaka, 1996; Rolls, 2000; Rousselet et al., 2004), and their connection at the level of single IT neurons is not understood. One possibility is that, as signals propagate through the visual system, neurons become highly selective for unique combinations of features that also guarantee high tolerance to identity-preserving transformations of those features. This no- tion derives from the grandmother or gnostic cell concept of Lettvin and Konorski (Gross, 2002), and has been recently invig- orated by the observation that some neurons in the human me- dial temporal lobe (Quiroga et al., 2005) respond only to specific visual objects regardless of size, pose, and visual clutter. This notion also seems consistent with previous physiological results: sharpness of object selectivity and tolerance (e.g., to position or size changes) both increase along the ventral visual stream (Ko- batake and Tanaka, 1994; Logothetis and Sheinberg, 1996; Tanaka, 1996; Edelman, 1999; Rolls, 2000; Rousselet et al., 2004). Nevertheless, however appealing, this notion cannot be taken as given; we do not yet know whether individual IT neurons attain high values of both selectivity and tolerance. More generally, we do not even know whether these properties are connected in any Received April 26, 2007; revised Sept. 20, 2007; accepted Sept. 24, 2007. This work was supported primarily by the National Institutes of Health. Additional support was provided by Defense Advanced Research Projects Agency, Office of Naval Research, The Pew Charitable Trusts, The McKnight Foundation, Eastman Kodak Company, Honda Research Institute, Siemens Corporate Research, Sony, and the Mc- Dermott chair (T.P.). D.Z. was supported by a Postdoctoral Fellowship of The International Human Frontier Science Program Organization and by a Charles A. King Trust Postdoctoral Research Fellowship. We thank J. Maunsell, N. Li, and N. Rust for comments on this manuscript; D. Cox, T. Serre, and G. Kreiman for discussion; C. Hung for help in stimulus preparation; and J. Deutsch for technical support. Correspondence should be addressed to James J. DiCarlo, McGovern Institute for Brain Research, Massachusetts Institute of Technology, 77 Massachusetts Avenue, Cambridge, MA 02139. E-mail: [email protected]. DOI:10.1523/JNEUROSCI.1897-07.2007 Copyright © 2007 Society for Neuroscience 0270-6474/07/2712292-16$15.00/0 12292 • The Journal of Neuroscience, November 7, 2007 • 27(45):12292–12307
Transcript of Trade-Off between Object Selectivity and Tolerance in Monkey Inferotemporal Cortex

Behavioral/Systems/Cognitive
Trade-Off between Object Selectivity and Tolerance inMonkey Inferotemporal Cortex
Davide Zoccolan, Minjoon Kouh, Tomaso Poggio, and James J. DiCarloMcGovern Institute for Brain Research, Department of Brain and Cognitive Sciences, Center for Biological and Computational Learning, MassachusettsInstitute of Technology, Cambridge, Massachusetts 02142
Object recognition requires both selectivity among different objects and tolerance to vastly different retinal images of the same object,resulting from natural variation in (e.g.) position, size, illumination, and clutter. Thus, discovering neuronal responses that have objectselectivity and tolerance to identity-preserving transformations is fundamental to understanding object recognition. Although selectivityand tolerance are found at the highest level of the primate ventral visual stream [the inferotemporal cortex (IT)], both properties arehighly varied and poorly understood. If an IT neuron has very sharp selectivity for a unique combination of object features (“diagnosticfeatures”), this might automatically endow it with high tolerance. However, this relationship cannot be taken as given; although some ITneurons are highly object selective and some are highly tolerant, the empirical connection of these key properties is unknown. In thisstudy, we systematically measured both object selectivity and tolerance to different identity-preserving image transformations in thespiking responses of a population of monkey IT neurons. We found that IT neurons with high object selectivity typically have lowtolerance (and vice versa), regardless of how object selectivity was quantified and the type of tolerance examined. The discovery of thistrade-off illuminates object selectivity and tolerance in IT and unifies a range of previous, seemingly disparate results. This finding alsoargues against the idea that diagnostic conjunctions of features guarantee tolerance. Instead, it is naturally explained by object recogni-tion models in which object selectivity is built through AND-like tuning mechanisms.
Key words: inferotemporal cortex; monkey; object recognition; multiple objects; trade-off; tolerance
IntroductionThe key computational problem of object recognition is attainingboth selectivity among different visual objects and tolerance tovariation in each object’s appearance (e.g., as a result of changesin position, size, illumination, clutter, etc.). The primate visualsystem has solved this problem: primates robustly and effortlesslydiscriminate among visual objects over the wide range of imagesthat each object produces during natural vision (Potter, 1976;Intraub, 1980; Rubin and Turano, 1992; Logothetis and Shein-berg, 1996; Thorpe et al., 1996; Edelman, 1999; Rousselet et al.,2004). What neuronal architecture and computations create sucha selective and tolerant representation of visual objects? Becauseprevious work indicates that these properties are built by a hier-archy of cortical stages (the ventral visual stream) (Logothetisand Sheinberg, 1996; Tanaka, 1996; Rolls, 2000; Rousselet et al.,2004), experimental studies can shed light on this question by
examining the strength, variation, and relationship of object se-lectivity and tolerance across the ventral visual stream.
Here we focus on the culmination of the ventral visual stream,the anterior portion of the inferotemporal cortex (IT). Althoughobject selectivity and tolerance are found in IT, these propertiesare highly varied both within and across studies (Logothetis andSheinberg, 1996; Tanaka, 1996; Rolls, 2000; Rousselet et al.,2004), and their connection at the level of single IT neurons is notunderstood. One possibility is that, as signals propagate throughthe visual system, neurons become highly selective for uniquecombinations of features that also guarantee high tolerance toidentity-preserving transformations of those features. This no-tion derives from the grandmother or gnostic cell concept ofLettvin and Konorski (Gross, 2002), and has been recently invig-orated by the observation that some neurons in the human me-dial temporal lobe (Quiroga et al., 2005) respond only to specificvisual objects regardless of size, pose, and visual clutter. Thisnotion also seems consistent with previous physiological results:sharpness of object selectivity and tolerance (e.g., to position orsize changes) both increase along the ventral visual stream (Ko-batake and Tanaka, 1994; Logothetis and Sheinberg, 1996;Tanaka, 1996; Edelman, 1999; Rolls, 2000; Rousselet et al., 2004).Nevertheless, however appealing, this notion cannot be taken asgiven; we do not yet know whether individual IT neurons attainhigh values of both selectivity and tolerance. More generally, wedo not even know whether these properties are connected in any
Received April 26, 2007; revised Sept. 20, 2007; accepted Sept. 24, 2007.This work was supported primarily by the National Institutes of Health. Additional support was provided by
Defense Advanced Research Projects Agency, Office of Naval Research, The Pew Charitable Trusts, The McKnightFoundation, Eastman Kodak Company, Honda Research Institute, Siemens Corporate Research, Sony, and the Mc-Dermott chair (T.P.). D.Z. was supported by a Postdoctoral Fellowship of The International Human Frontier ScienceProgram Organization and by a Charles A. King Trust Postdoctoral Research Fellowship. We thank J. Maunsell, N. Li,and N. Rust for comments on this manuscript; D. Cox, T. Serre, and G. Kreiman for discussion; C. Hung for help instimulus preparation; and J. Deutsch for technical support.
Correspondence should be addressed to James J. DiCarlo, McGovern Institute for Brain Research, MassachusettsInstitute of Technology, 77 Massachusetts Avenue, Cambridge, MA 02139. E-mail: [email protected].
DOI:10.1523/JNEUROSCI.1897-07.2007Copyright © 2007 Society for Neuroscience 0270-6474/07/2712292-16$15.00/0
12292 • The Journal of Neuroscience, November 7, 2007 • 27(45):12292–12307
way, because no study has systematically measured both proper-ties in the same IT neuronal population.
To address this issue, we systematically measured both objectselectivity and tolerance to different identity-preserving imagetransformations within the same IT neuronal population in twomonkey subjects engaged in a simple object detection task. Foreach neuron, we measured (1) how selectively it responded acrossa large object set (object selectivity) (see Fig. 1A, top); and (2)how well preserved its response was to a very effective referenceobject that underwent different transformations: position, size,and contrast changes and addition of visual clutter (absolute tol-erance) (see Fig. 1A, bottom). Although another way to measuretolerance is to check how well relative object preference is pre-served across transformations (relative tolerance) (Tovee et al.,1994; Ito et al., 1995), we focused here on absolute tolerance ofneuronal responses because it provides a bound on other toler-ance metrics and measures the ability of individual neurons tosupport recognition without further processing (see Discussion).Contrary to the appealing idea that IT contains neurons that areboth highly shape selective and highly tolerant, we discoveredthat selectivity and tolerance trade off across the IT population:neurons with high object selectivity typically have relatively lowtolerance, and vice versa.
Materials and MethodsWe used standard procedures for surgical preparation, behavioral taskand training, eye position monitoring, and single-unit electrophysiolog-ical recording in awake monkeys, and details are described by Zoccolan etal. (2005). Here we briefly describe those methods that are most relevantto the present study. All animal procedures were performed in accordwith National Institute of Health guidelines and the Massachusetts Insti-tute of Technology Committee on Animal Care.
Visual stimuli and behavioral taskAll recorded neurons were probed with a fixed set of 213 grayscale pic-tures of isolated real-world objects, mostly modified from the Caltech101 database (Fei-Fei et al., 2004), but including also (1) five fixed objectprototypes from each of three spaces of parameterized objects (see be-low); (2) five patches of texture; (3) four low-contrast images of one ofthe objects; and (4) a blank frame (used to measure neuronal backgroundrate). The full set is shown in supplemental Figure 1 (available at www.jneurosci.org as supplemental material). Some neurons were also testedusing additional objects drawn from the three spaces [cars, faces, andtwo-dimensional (2-D) silhouettes] with parametrically controllableshape similarity within each space. Each object space consisted of 14morph axes (for a total of 42 morph axes), and each morph axis wascomposed of five shapes resulting from blending two object prototypes(e.g., two car brands) in different proportions (see examples in Fig. 2 B)(for details, see Zoccolan et al., 2005). All objects subtended �2°.
During recordings, both monkeys were engaged in a simple recogni-tion task that required the detection of a fixed, red target shape (a redtriangle) that was presented at the end of a temporal sequence of objectconditions drawn from our stimulus set (see Fig. 1 B). The total numberof stimulus conditions presented on each behavioral trial ranged from 3to 20. The target was always the last in the sequence, and each monkeywas rewarded for maintaining fixation (�1.5° fixation window) until theappearance of the target and then making a saccade to a fixed visual fieldlocation (7° eccentricity) within 800 ms after the appearance of the target.
The size of the fixation window was chosen to be small enough toguarantee that the monkeys could not make a saccade to any of theeccentric positions that were tested during the mapping of the receptivefield (RF) (see below) without leaving the fixation window and, there-fore, aborting the trial. This was guaranteed by the fact that the closestpositions to fixation were �2.5° from the fixation spot (see below), i.e.,�1° beyond the edge of the fixation window.
Single objects from the fixed stimulus set and identity-preservingtransformations of a very effective reference object (see Fig. 1 A) were
pseudorandomly interleaved. Visual stimuli were presented at a rate of 5per second; i.e., each stimulus condition was shown for 100 ms, followedby 100 ms of a gray screen (no stimulus), followed by another stimuluscondition for 100 ms, etc. (see Fig. 1 B). This task was meant to obtain alarge amount of data, while still engaging the animal in a recognition task.We have previously shown that clutter suppression during such tasks isnot simply explained by variation in spatial attention (Zoccolan et al.,2005).
Neuronal recordingsDuring each recording session, a single extracellular metal electrode wasadvanced into IT. Over �6 months of daily recording sessions in the twomonkeys, we sampled neurons over an �5 � 4 mm area of the ventralsuperior temporal sulcus and ventral surface lateral to the anterior mid-dle temporal sulcus (Horsey-Clark coordinates: anteroposterior, 13–17mm; 18 –21 mm mediolateral at recording depth).
Screening procedures. Each isolated neuron was tested for responsive-ness across the fixed set of 213 stimuli plus 30 additional object proto-types belonging to the parameterized morphed spaces (Zoccolan et al.,2005) using a very inclusive criterion: a neuron was considered respon-sive if its mean firing rate was significantly higher than background ratefor at least one of these stimuli (t test, p � 0.005, which implies p � 0.7corrected for multiple tests). All stimuli were presented at the center ofgaze. Two to four presentation repetitions were collected for each stim-ulus. This screening procedure was used to identify a very effective ref-erence object (the object that produced the strongest neuronal response,higher than background rate according to the t test) and six poorly effec-tive flanking objects (the objects that produced the smallest response, notsignificantly higher than background rate according to the t test). Note,however, that, because of trial-by-trial noise, in the final testing in whichmore repetitions were used (see below), the chosen objects did not alwaysturn out to be the most effective (and ineffective) objects. Only respon-sive neurons for which these reference and flanking objects could befound were selected for further testing and recordings. The screeningprocedure was also used to decide whether the neuron was responsive toany of the object prototypes belonging to the parameterized morphedspaces (a total of 45 prototypes were used, 15 of which belonged to thefixed set of 213 visual stimuli; see above).
If selected for recordings (see above), a neuron was further screened toidentify its preferred receptive field location (RF center) within a narrowspan of visual angle around the center of gaze. Our goal was not to mapeach neuron RF over the whole visual field, but rather to optimize thelocation in which to present our single object conditions during the maintesting session (see below). To achieve this, the most effective (reference)object and the least effective object were presented over a span of 2°around the fixation spot (8 –10 repetitions). More specifically, six visualfield locations (in addition to fixation) were tested. Four of these loca-tions were the extremes of a “cross” centered on fixation (i.e., 2° aboveand below fixation and 2° left and right to fixation). The other twolocations were �2° in elevation and 2° in azimuth, in the contralateralhemifield with respect to the recording chamber. The visual field locationin which the response produced by the reference was higher was chosenas RF center of the neuron. Within this 2° span, most neurons (75/94)had their RF center at the center of gaze.
Recording session. Complete recordings were obtained from each neu-ron using pseudorandomly interleaved stimuli from our entire battery ofstimulus conditions: (1) single objects belonging to the fixed object setand presented in the neuron’s RF center (see Fig. 1 A, broad sampling);(2) identity-preserving transformations of the reference object to testclutter tolerance (CT), position tolerance (PT), size tolerance (ST), andcontrast tolerance (CrT) (see Fig. 1 A). If the neuron was responsive toany of the 45 morphed object prototypes that were probed during screen-ing (see above), it was also tested with five objects belonging to the morphaxis that included the effective object prototype (see Fig. 1 A, localsampling).
Tolerance to position changes was assessed by mapping the responseto the reference object across a vertical �12° span of visual field (see Fig.3A). The reference object was presented in the RF center (see above) andin eight additional positions: (1) �2.5° below the RF center; and (2) 2.5,
Zoccolan et al. • Selectivity and Tolerance Trade off in Monkey IT J. Neurosci., November 7, 2007 • 27(45):12292–12307 • 12293
3.5, 4.5, 5.5, 7.5, 9.5, and either 11 (73/94 cells) or 12° (21/94 cells) abovethe RF center. Position tolerance was not mapped in full 2-D space be-cause it would have been too time consuming (see below). Based onresults in the literature (Tovee et al., 1994; Ito et al., 1995; Op De Beeckand Vogels, 2000), our testing should provide a reasonable estimate ofposition tolerance, and we have no reason to believe that a full 2-D mapof the RF field would lead to qualitatively different results.
Tolerance to size changes was measured by presenting the referenceobject at four different sizes (1, 2, 4, and 6°) at the RF center (see Fig. 3B).Object conditions to measure ST were tested for all neurons from mon-key 2 (n � 34) but only for a subset of neurons from monkey 1 (18/60).
Tolerance to contrast changes was assessed by presenting the referenceobject at three low contrasts (1.5, 2, and 3%), in addition to its defaultcontrast (mean default contrast across reference objects � SD � 33 �12%), at 2.5° above the RF center (see Fig. 3C). The reason that contrasttolerance was not measured at the RF center is that the data presented inthis study are part of a larger experimental design, in which, among otherthings, the relationship between clutter tolerance and the contrast of theflanker objects was tested. To measure such a relationship, flankers atdifferent low contrasts were presented 2.5° above the RF center. To savetime (see below), the same low-contrast conditions were not presentedalso at the RF center. Stimulus contrast was defined as follows: [med(pix � Lbackground) � med(pix � Lbackground)]/[med(pix � Lbackground)� med (pix � Lbackground)], where med indicates the median taken overthe pixel values either above or below the monitor background lumi-nance level (Lbackground).
To test clutter tolerance, the reference object was presented both inisolation and along with each of the six, poorly effective flanking objects(see above) (see Fig. 3D). Objects in the pairs used to test clutter tolerancewere 2.5° apart (center to center), with the effective reference object inthe neuron RF center and the flanking object located 2.5° either above orbelow the RF center.
As described above, given the time limitations of awake recording,only a limited amount of object conditions could be used to measure eachtolerance property. Therefore, our goal was not to obtain the best possi-ble estimate of each tolerance property per se, but rather to collectenough data to understand how these properties covaried with objectselectivity and with each other.
The transformations of the reference object described above allowmeasuring the absolute tolerance of each neuron, i.e., how well preservedthe response to the effective reference object across each transformation(see below for a definition of the tolerance metrics) is. Alternatively,tolerance can be defined in terms of how well preserved the rank order ofobject selectivity across the tested transformations (relative tolerance) is.Although our study was not meant to provide an accurate estimate ofrelative tolerance (see Introduction and Discussion), in addition to mea-suring how the response to the effective reference object changed byvarying its position, size, and contrast, we also measured how these sametransformations affected the response to a very ineffective object (one ofthe flanking objects). This allows a first-order assessment of relative tol-erance across the recorded population (see below).
Five to thirty presentation repetitions were collected for each objectcondition (see supplemental material 1.B for details, available atwww.jneurosci.org).
Data analysisChoice of the spike count window. To get the most statistical power fromthe data, average firing rates were computed over a time window (relativeto stimulus onset) whose extremes were optimally chosen for each neu-ron by an apposite algorithm. Briefly, epochs of the neuronal responsewere identified in which the background corrected response was at least20% of its peak value. If multiple such epochs existed, they were mergedto the epoch containing the response peak if they were within 25 ms fromit. This algorithm is completely described in supplemental material 1.Aand supplemental Figure 2 (available at www.jneurosci.org as supple-mental material). Analyses performed using either such neuron-specificspike count windows (mean onset across neurons � SD � 101 � 18 ms;mean offset � 236 � 48 ms) or count windows that were held fixed acrossthe recorded neuronal population yielded very similar results (supple-
mental Tables 1, 2, available at www.jneurosci.org as supplemental ma-terial). The neuron-specific spike count windows were used to estimatelatency and duration of the neuronal responses in the analysis shown insupplemental Table 6 (available at www.jneurosci.org as supplementalmaterial). For such analysis, onset and offset of the response were com-puted considering epochs in which the background corrected responsewas at least either 20% (as for our standard spike count window) or 10%(for a better comparison with previous studies) (Brincat and Connor,2006) of its peak value.
To assess the dependency of the selectivity and tolerance properties(see below) from the time course of the neuronal response, firing rateswere also computed in overlapping time windows of 50 ms shifted intime steps of 25 ms (see Fig. 6).
Analyses were performed using absolute firing rates, but very similarresults were obtained when driven (i.e., “background subtracted”) rateswere used (supplemental Tables 1, 2, available at www.jneurosci.org assupplemental material).
Selectivity and tolerance metrics. The selectivity of each neuron acrossthe fixed set of 213 stimuli was quantified by the sparseness of its response(Rolls and Tovee, 1995a; Vinje and Gallant, 2000; Olshausen and Field,2004): S � {1 � [(Ri/n) 2/(Ri
2/n)]}/[1 � (1/n)], where Ri is the neu-ron response to the ith stimulus and n is the number of stimuli in the set.S ranges from 0 (no object selectivity) to 1 (maximal object selectivity).Neuronal selectivity within each morphed set was quantified by the fol-lowing morph tuning index (Rainer et al., 1998): MT � [n � (Ri/Rmax)]/(n � 1), where Ri is the neuron response to the ith morphedobject, Rmax is the maximal response within the morphed set, and n is thenumber of objects in the set. As sparseness, MT ranges from 0 (no shapeselectivity) to 1 (maximal shape selectivity).
For each neuron, PT was defined as two times the SD of the Gaussianfunction that best fitted the normalized driven rates across the tested RFpositions. Operationally, we subtracted the background activity from theneuron responses across the tested RF positions, and we normalized (1.0)the resulting RF profile. Then, we fit a Gaussian function to the RFprofile, with the peak of the Gaussian centered on the peak of the RF. Asa goodness-of-fit measure, we used the sum of the absolute residuals SR.Only neurons such that SR � 1.5 were included in the analyses presentedthroughout the paper. For the analysis shown in Figure 5C (top left), onlyneurons such that SR � 0.8 were included in the population-averaged RFprofiles, to guarantee that only RFs with homogeneous shapes (i.e., allstrictly Gaussian) contributed to the average. Note that in Figure 5C (seelegend), before being averaged, the receptive field profiles were aligned tothe position (elevation) of their peak values. Because the tested elevationswere not located in an equally spaced grid (see above), aligning the peaksproduces a misalignment of the elevations at which each neuron wastested. Thus the RF profiles in Figure 5C were averaged in overlappingwindows of �3°, shifted in steps of �1°. Depending on what elevationsfell in a given averaging window, the average elevation in that windowmay be different between subpopulations.
ST was quantified by normalizing (1.0) the size tuning curves to theirmaximal values (see Fig. 3B, bottom) and then averaging the resultingtuning curve values that were �1, i.e., ST � �Rtest size/max(Rtest size)�,where Rtest size is the mean response to a given tested size of thereference object, and ��� is the average over the sizes such thatRtest size � max(Rtest size). Contrast tolerance (CrT) was similarly mea-sured, but after normalizing each contrast tuning curve to the originalcontrast of the reference object (see Fig. 3C, bottom, leftmost point), i.e.,CrT � �Rtest contrast/Rref contrast�, where Rtest contrast is the mean response toa given tested contrast of the reference object, Rref contrast is the meanresponse to the reference object presented at its original contrast, and ��� isthe average over the tested contrasts (3, 2, and 1.5%) (see Fig. 3D). ST andCrT measure the amount of response that is preserved, on average, whenthe reference object is transformed by changing, respectively, its optimalsize or its reference contrast. Both metrics range between 0 (no tolerance)and 1 (complete invariance).
We quantified the clutter tolerance of each neuron with the followingclutter tolerance (CT) metric: CT � �(Rref & flanker � Rflanker)/(Rref �Rflanker)�, where Rref & flanker is the mean response to a given pair refer-ence/flanker, Rref and Rflanker are the mean responses to the constituent
12294 • J. Neurosci., November 7, 2007 • 27(45):12292–12307 Zoccolan et al. • Selectivity and Tolerance Trade off in Monkey IT
objects of that pair (i.e., the reference and flanker objects presentedalone), and ��� is the average over the included flanker conditions (formost analyses, only flankers such that Rflanker � 50% Rref or less wereconsidered) (but see Fig. 7A). CT values near 0 indicate very poor cluttertolerance (strong suppression by flanker objects), whereas values near 1indicate complete clutter invariance (CCI; no effect of flanker objects).CT � 1 indicates facilitation by clutter. It is important to note that,because the response to the isolated flanker objects is subtracted fromboth Rref & flanker and Rref in the definition of CT, the metric is unbiasedwith respect to either a CCI or a clutter averaging rule (Zoccolan et al.,2005) (see Fig. 7A for details).
Significance and SE of the correlation coefficients reported throughthis manuscript were computed, respectively, using a one-tailed permu-tation test (5000 samples) and bootstrap analysis (500 samples).
Presentation repetitions of the reference object were split to guaranteecomplete independence of the datasets over which selectivity and toler-ance metrics were computed (see supplemental material 1.B, available atwww.jneurosci.org). The number of neurons included in the differentanalyses presented throughout the paper (see Figs. 4 –7; supplementalTables 1–3, available at www.jneurosci.org as supplemental material)was selected according to specific criteria that are fully described in sup-plemental material 1.C (available at www.jneurosci.org).
To obtain a measure of the relative tolerance of object selectivity acrossthe tested transformations, for each of the position, size, and contrastchanges, we computed the difference between the response (average fir-ing rate) to the effective reference object (Rref) and the response to one ofthe poorly effective flanker objects (Rflanker), normalized by the mean ofthe standard deviations (�ref and �flanker) of the two response rates. Inother words, we computed a d index, defined as follows: d � (Rref �Rflanker)/�, with � � (�ref � �flanker)/2. This index tells how far apart theresponses to the effective and ineffective objects are. Negative valuesindicate that, for a given transformation, the tuning of the neuron hasreversed (i.e., the ineffective flanker produced a response larger than theeffective reference).
Spike waveform analysis. Putative inhibitory and excitatory neuronswere identified across the recorded neuronal population based on thewaveform of the action potentials collected for each cell. Previous studies
performed in cortical slices and anesthetizedanimals (McCormick et al., 1985; Connors andGutnick, 1990; Nowak et al., 2003) and addi-tional studies based on cross-correlation analy-sis of spike trains (Bartho et al., 2004; Tamura etal., 2004) have shown the reliability of such anapproach in identifying neuronal typing. As aconsequence, many authors have distinguishedbetween putative excitatory and inhibitory neu-rons recorded in different brain areas of awakeanimals (such as hippocampus, somatosensorycortex, lower and higher visual cortical areas,and rat barrel cortex) using only the temporalfeatures of the spike waveforms (Mountcastle etal., 1969; Gur et al., 1999; Frank et al., 2001;Bruno and Simons, 2002; Andermann et al.,2004; Mitchell et al., 2007). In this study, fol-lowing Bruno and Simons (2002), two compo-nents of the waveform were taken as distinctivefeatures of the neuron type: (1) the duration(width) of the central peak (negative or posi-tive); and (2) the width of the following trough(corresponding to the spike afterhyperpolariza-tion). Figure 5A shows a scatter plot with themean width of the peak and trough for our pop-ulation of 94 neurons. The cluster of neuronswith shorter mean widths (empty circles) wasidentified as putative inhibitory. The clusterwith longer mean widths (filled circles) was des-ignated as excitatory. Waveforms of one exam-ple neuron from each cluster are shown inFigure 5A (top).
Monte Carlo simulations to check that thesparseness and clutter tolerance metrics are not implicitly correlated. MonteCarlo simulations were run to check that the inverse relationship be-tween S and CT (see above) could not arise by chance as the result of animplicit correlation between these metrics computed over a populationof noisy neuronal responses (see Fig. 7B). For any given neuron, re-sponses to the single object conditions were simulated using Poissonspike generators with mean rate equal to the actual mean firing rate thatwas recorded for each single object condition (the same number of rep-etitions collected for each object condition were simulated). The selec-tivity (sparseness, S) of each neuron was computed based on these Pois-son simulated responses to single objects. A simulated response to clutter(i.e., to the tested object pairs) was implemented either assuming anaveraging rule or assuming CCI. Two versions of the averaging rule wereimplemented: (1) one exact, i.e., Rref & flanker � 0.5 (Rref � Rflanker); (2)the other approximate, i.e., with Rref & flanker randomly sampled betweenRflanker and Rref (in both cases, Poisson statistics of spike trains wereassumed). The CT of each neuron was computed based on these Poissonsimulated responses to object pairs. Each Monte Carlo simulation wasrepeated 500 times, yielding the null distributions of regression lines andcorrelation coefficients shown in Figure 7B.
Model simulationsThe hierarchical object recognition model used to generate Figure 9E isfully described in previous reports (Riesenhuber and Poggio, 1999; Serreet al., 2005, 2007a,b). See supplemental material 2 and supplementalFigure 7 (available at www.jneurosci.org as supplemental material) fordetails about model simulations and additional modeling results.
ResultsTo examine the relationship between object selectivity and toler-ance in IT, we performed extracellular microelectrode recordingsin two monkeys that viewed grayscale images of real-world ob-jects presented at a rate of 5 images/s, while the animals wereengaged in a simple object detection task (Fig. 1B) (see Materialsand Methods). Well isolated neurons were randomly sampled
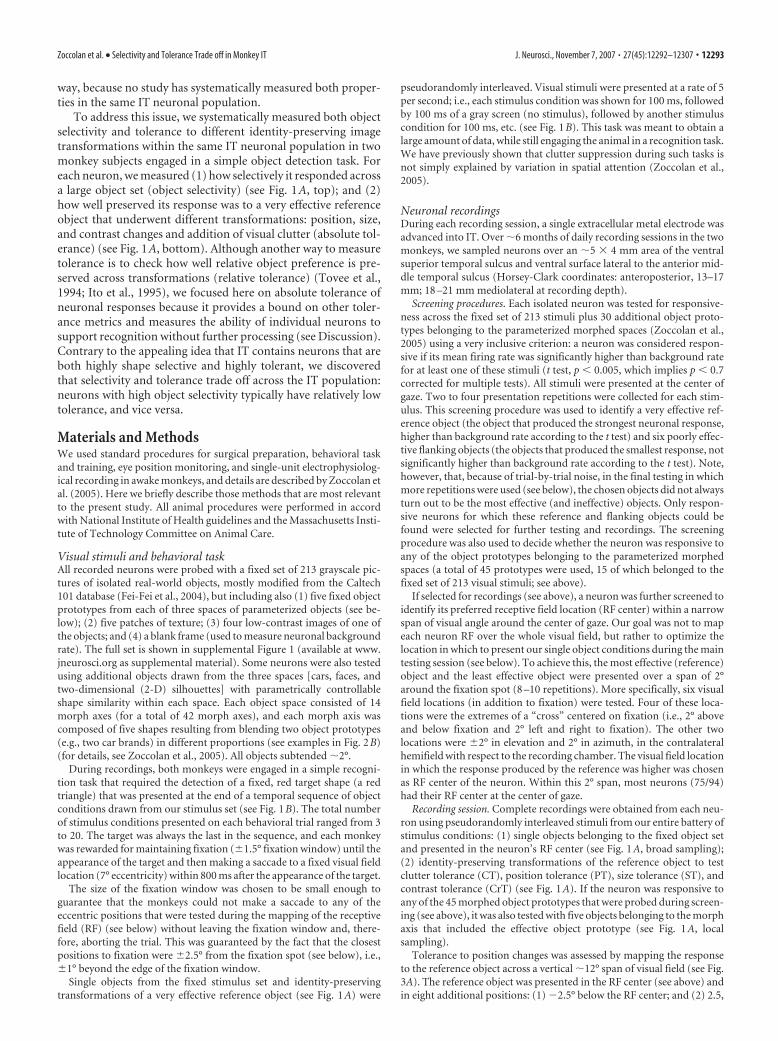
Figure 1. Rationale of the experimental design and behavioral task. A, For each neuron, we measured (1) its object selectivity,i.e., its sensitivity to changes in object identity (measured both across a large set of real-world objects, and, when possible, acrosslocal, parameterized sets of morphed shapes); and (2) its tolerance to different identity-preserving image transformations of aneffective reference object. B, During recordings, monkeys were presented with rapid sequences of pseudorandomly interleavedgrayscale objects used to measure selectivity and tolerance (see above). The monkey’s task was to respond to the red triangle atthe end of each sequence. The number of objects presented before the triangle was random (between 3 and 20).
Zoccolan et al. • Selectivity and Tolerance Trade off in Monkey IT J. Neurosci., November 7, 2007 • 27(45):12292–12307 • 12295
throughout anterior IT and tested for responsiveness across afixed, large set of visual objects (see Materials and Methods). Eachresponsive neuron was then tested with a battery of object con-ditions to measure (1) its object selectivity, i.e., its sensitivity tochanges in object identity (Fig. 1A, top); and (2) its tolerance todifferent identity-preserving transformations of a reference ob-ject, including position, size and contrast changes, and presenceof clutter (Fig. 1A, bottom). Complete recordings were obtainedfrom 94 IT neurons (60 in monkey 1, 34 in monkey 2). We tookspecial care to obtain independent data and design independentmetrics for selectivity and tolerance so as to guarantee no implicitrelationship among these properties (see Materials and Methodsand supplemental material 1B, available at www.jneurosci.org).
Broad range of object selectivity across the ITneuronal populationTo get a first-order measure of each neuron’s object selectivity,we estimated the fraction of objects in a large, fixed set of 213stimuli (see supplemental Fig. 1, available at www.jneurosci.orgas supplemental material, Fig. 2A) that produced a response(sparseness, described immediately below). For most neurons(see Materials and Methods), we also measured shape selectivitywithin several predefined parameterized object shape spaces (Fig.2B, morph tuning, described in detail later in Results) (see also
Zoccolan et al., 2005). Both methods uncovered a remarkablybroad spectrum of sensitivity to shape changes within IT. Forexample, although many neurons responded strongly to theirpreferred object within the fixed shape set (population mean �SD � 49.5 � 21.2 spikes/s) (see supplemental Fig. 5, available atwww.jneurosci.org as supplemental material), the populationwas highly varied in the number of objects that elicited a strongresponse. This can be visually appreciated by ranking, for eachneuron, the 213 test stimuli based on the response they evoked(Fig. 2A, bottom). For example, some neurons were weakly se-lective in that they showed a strong response to many objects [Fig.2A, blue curve and peristimulus time histograms (PSTHs)].Other neurons were highly selective in that they responded wellto only a handful of objects (Fig. 2A, red curve and PSTHs).These example neurons illustrate the broad range of selectivityseen across the IT population (Fig. 2A, gray lines). Note however,that even the least-selective neurons within our IT populationtypically showed some (nonzero) object selectivity in that someobjects elicited little or no response (Fig. 2A). In fact, all neuronsthat fired at least 10 spikes/s to the effective reference object (seeMaterials and Methods) and were included in further analyses(91/94 cells), responded significantly more to the reference objectthan to one of the weakly effective flanker objects chosen during
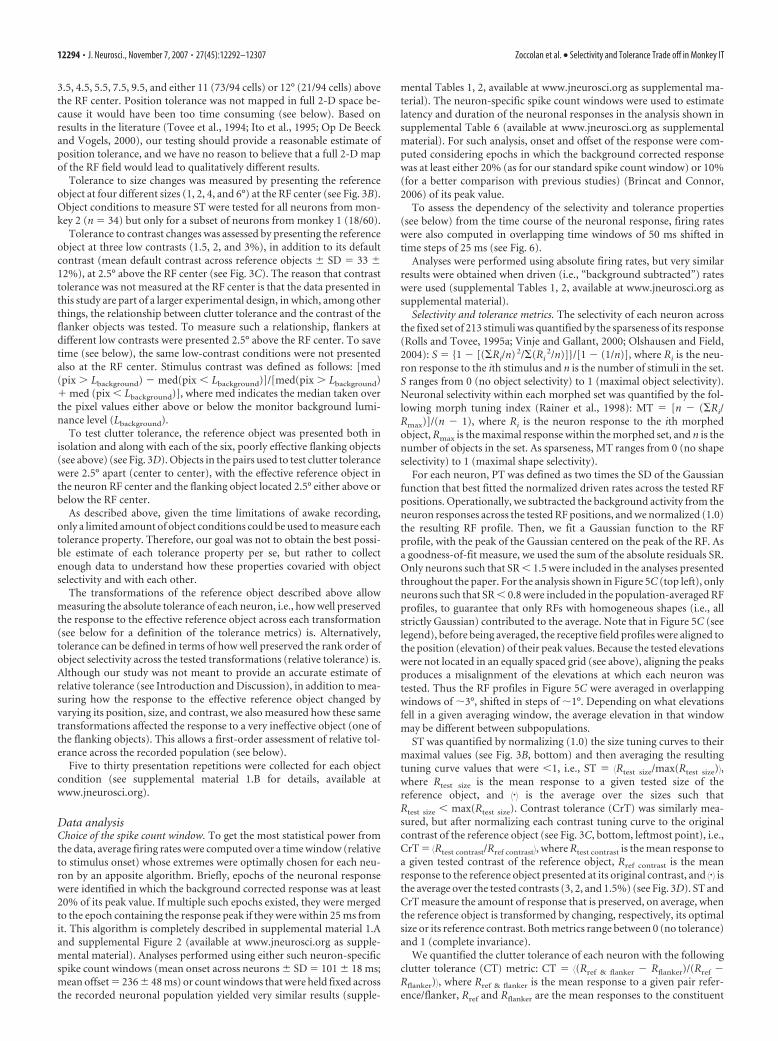
Figure 2. Broadness of object selectivity in IT. A, Normalized firing rate profiles (bottom) across a fixed set of 213 objects for a population of 94 neurons. For each neuron, objects in abscissa areranked based on the mean response they evoked. The figure highlights data from two example neurons (blue and red curves) and their responses (blue and red PSTHs) to five objects chosen at equallyspaced intervals along the abscissa (dashed lines). Gray boxes indicate the spike count window. B, Normalized tuning profiles (bottom) across five parametrically morphed objects (49 cells; each cellwas tested using one of 42 possible morphed object sets). The same example neurons and color code are used as in A. S and MT values are indicated for the example cells.
12296 • J. Neurosci., November 7, 2007 • 27(45):12292–12307 Zoccolan et al. • Selectivity and Tolerance Trade off in Monkey IT
the screening procedure (see Materials and Methods; one-tailed ttest, p � 0.05).
We quantified each neuron’s selectivity across the stimulus setby the sparseness (Rolls and Tovee, 1995a; Vinje and Gallant,2000; Olshausen and Field, 2004) of its response (0 � S � 1; seeMaterials and Methods), which is a well established metric toquantify the fraction of stimuli in a given stimulus set that pro-duce a response. A value of S near 0 indicates that a neuronresponds nearly equally to many objects in the stimulus set (lowobject selectivity), whereas a value near 1 indicates that a neuronresponds well to only a few objects (high object selectivity). Thesparseness distribution across the neuronal population extendedover a very broad range of values (from 0.05 to 0.94; mean �SD � 0.4 � 0.22, n � 94) (see Fig. 5B). This systematic quantifi-cation of the object selectivity of each IT neuron allowed us tolook across the population for any relationship between objectselectivity and tolerance to identity-preserving transformations.
Broad ranges of tolerance properties across the ITneuronal populationTo quantify each neuron’s tolerance to identity-preserving imagetransformations of its highly preferred objects, we measured itschange in firing rate in response to identity-preserving transfor-mations of a reference object. This reference object was chosenfor each neuron from among the objects that most effectivelydrove the cell during a screening procedure preceding the record-ing session (see Materials and Methods). The tested image trans-formations of the reference object were pseudorandomly inter-leaved with the testing of selectivity (Fig. 1B), and they includedchanges in object position and size (position and size tolerance),
changes in object contrast (contrast tolerance), and the additionof other objects (a test of tolerance to visual clutter) (Fig. 1A).
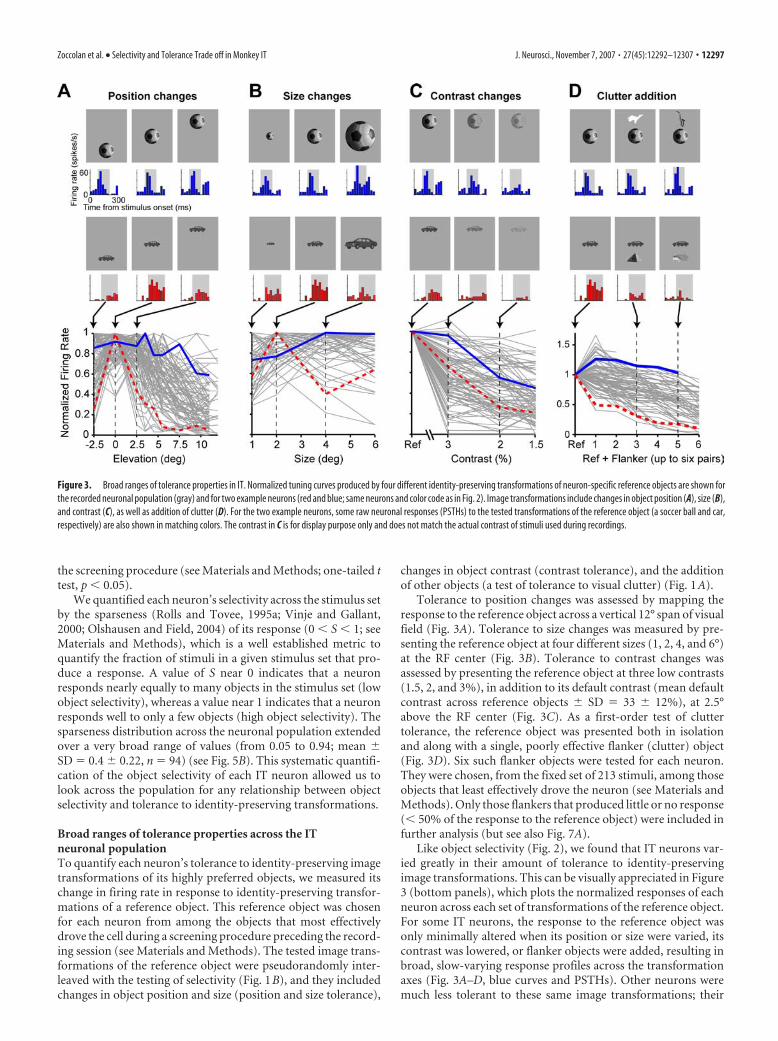
Tolerance to position changes was assessed by mapping theresponse to the reference object across a vertical 12° span of visualfield (Fig. 3A). Tolerance to size changes was measured by pre-senting the reference object at four different sizes (1, 2, 4, and 6°)at the RF center (Fig. 3B). Tolerance to contrast changes wasassessed by presenting the reference object at three low contrasts(1.5, 2, and 3%), in addition to its default contrast (mean defaultcontrast across reference objects � SD � 33 � 12%), at 2.5°above the RF center (Fig. 3C). As a first-order test of cluttertolerance, the reference object was presented both in isolationand along with a single, poorly effective flanker (clutter) object(Fig. 3D). Six such flanker objects were tested for each neuron.They were chosen, from the fixed set of 213 stimuli, among thoseobjects that least effectively drove the neuron (see Materials andMethods). Only those flankers that produced little or no response(� 50% of the response to the reference object) were included infurther analysis (but see also Fig. 7A).
Like object selectivity (Fig. 2), we found that IT neurons var-ied greatly in their amount of tolerance to identity-preservingimage transformations. This can be visually appreciated in Figure3 (bottom panels), which plots the normalized responses of eachneuron across each set of transformations of the reference object.For some IT neurons, the response to the reference object wasonly minimally altered when its position or size were varied, itscontrast was lowered, or flanker objects were added, resulting inbroad, slow-varying response profiles across the transformationaxes (Fig. 3A–D, blue curves and PSTHs). Other neurons weremuch less tolerant to these same image transformations; their
Figure 3. Broad ranges of tolerance properties in IT. Normalized tuning curves produced by four different identity-preserving transformations of neuron-specific reference objects are shown forthe recorded neuronal population (gray) and for two example neurons (red and blue; same neurons and color code as in Fig. 2). Image transformations include changes in object position (A), size (B),and contrast (C), as well as addition of clutter (D). For the two example neurons, some raw neuronal responses (PSTHs) to the tested transformations of the reference object (a soccer ball and car,respectively) are also shown in matching colors. The contrast in C is for display purpose only and does not match the actual contrast of stimuli used during recordings.
Zoccolan et al. • Selectivity and Tolerance Trade off in Monkey IT J. Neurosci., November 7, 2007 • 27(45):12292–12307 • 12297
response was drastically reduced by altering the position, size,and contrast of the reference object and by adding clutter shapes(Fig. 3A–D, red curves and PSTHs). These two example neurons(Fig. 3, blue and red) illustrate the broad ranges of tolerances seenacross the IT population (Fig. 3, bottom panels, spread of graylines).
We quantified the tolerance to position changes of a neuron(PT) by computing the size (in degrees) of its RF. This was doneby fitting a Gaussian function to the RF profile and by takingtwice the SD of the fitted Gaussian as a measure of the diameter ofthe neuron’s RF (see Materials and Methods for details). Toquantify the tolerance to the other identity-preserving transfor-mations, we used a different approach. Under the premise thatthe neuron’s response signals the presence of a preferred object,the mean decrease in neuronal response caused by size or contrastchanges or by addition of clutter objects was taken to be an in-verse measure of the neuron’s tolerance to each of these transfor-mations. Equations defining the ST, CrT, and CT metrics areprovided in Materials and Methods, and important controls areprovided for the clutter tolerance metric later in the Results. Foreach of these metrics, values near 0 indicate very poor tolerance(i.e., strong response reduction caused by the corresponding im-
age transformation), whereas values near 1 indicate maximal tol-erance (i.e., “invariance”; the corresponding image transforma-tion does not reduce the response to the reference object). ST andCrT ranges between 0 and 1, whereas CT can assume values �1 ifthe response to some of the object pairs (reference and flankerobjects shown together) is higher than the response to the iso-lated reference object (see Materials and Methods). We foundthat all four tolerance metrics spanned a broad range of valuesacross the population (see the spread of points along the ordinateaxes in Fig. 4A).
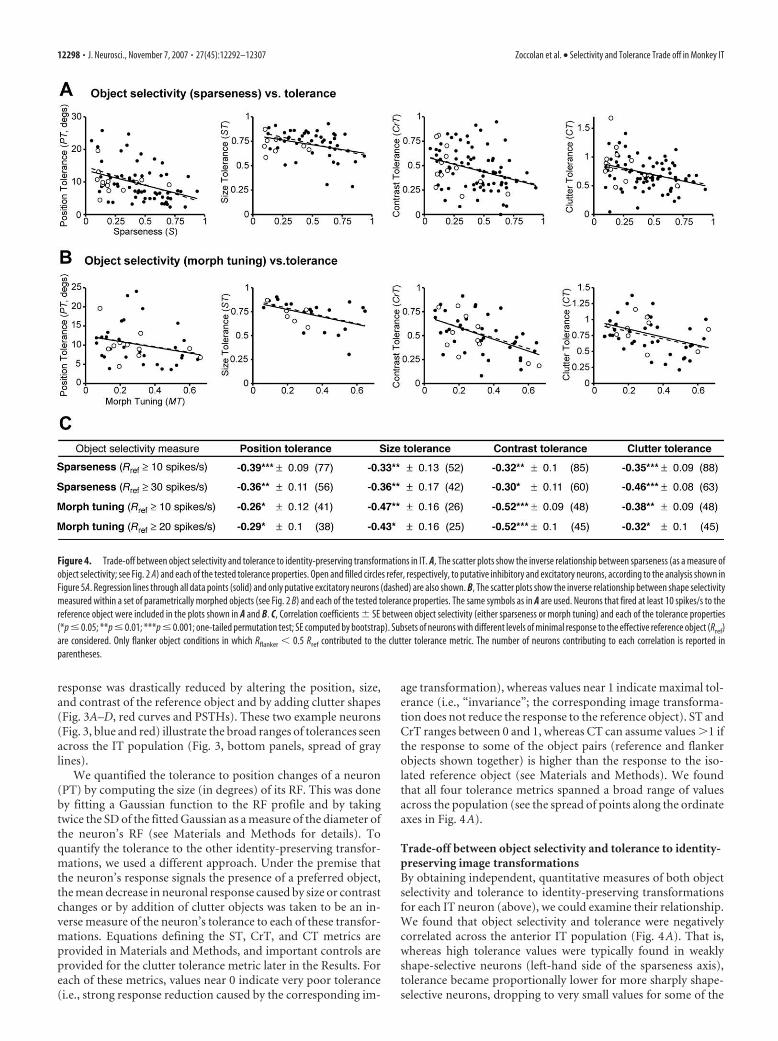
Trade-off between object selectivity and tolerance to identity-preserving image transformationsBy obtaining independent, quantitative measures of both objectselectivity and tolerance to identity-preserving transformationsfor each IT neuron (above), we could examine their relationship.We found that object selectivity and tolerance were negativelycorrelated across the anterior IT population (Fig. 4A). That is,whereas high tolerance values were typically found in weaklyshape-selective neurons (left-hand side of the sparseness axis),tolerance became proportionally lower for more sharply shape-selective neurons, dropping to very small values for some of the
Figure 4. Trade-off between object selectivity and tolerance to identity-preserving transformations in IT. A, The scatter plots show the inverse relationship between sparseness (as a measure ofobject selectivity; see Fig. 2 A) and each of the tested tolerance properties. Open and filled circles refer, respectively, to putative inhibitory and excitatory neurons, according to the analysis shown inFigure 5A. Regression lines through all data points (solid) and only putative excitatory neurons (dashed) are also shown. B, The scatter plots show the inverse relationship between shape selectivitymeasured within a set of parametrically morphed objects (see Fig. 2 B) and each of the tested tolerance properties. The same symbols as in A are used. Neurons that fired at least 10 spikes/s to thereference object were included in the plots shown in A and B. C, Correlation coefficients � SE between object selectivity (either sparseness or morph tuning) and each of the tolerance properties(*p � 0.05; **p � 0.01; ***p � 0.001; one-tailed permutation test; SE computed by bootstrap). Subsets of neurons with different levels of minimal response to the effective reference object (Rref)are considered. Only flanker object conditions in which Rflanker � 0.5 Rref contributed to the clutter tolerance metric. The number of neurons contributing to each correlation is reported inparentheses.
12298 • J. Neurosci., November 7, 2007 • 27(45):12292–12307 Zoccolan et al. • Selectivity and Tolerance Trade off in Monkey IT
most shape-selective neurons (right-hand side of the sparsenessaxis). The correlations between sparseness (shape selectivity) andeach of the tolerance properties were all negative (range: �0.3 to�0.46) and significant (Fig. 4C, first two rows) (one-tailed per-mutation test). These negative relationships did not depend onhow well the neurons responded to the reference objects used tomeasure their tolerance properties (two neuronal subpopula-tions with response to the reference object Rref �10 or 30 spikes/swere considered in Fig. 4C). In sum, the highest levels of shapeselectivity and tolerance observed in IT neurons are not bothfound in individual IT neurons. Instead, selectivity and tolerancetrade off across the IT population, suggesting that individual ITneurons gain object selectivity only at the expense of tolerance,and vice versa.
This trade-off result cannot be explained by differences inbackground firing rate across the population. First, the trade-offdid not crucially depend on whether raw or driven firing rates(i.e., background corrected rates) were used to compute the tol-erance metrics (supplemental Tables 1, 2, available at www.jneurosci.org as supplemental material). Second, when both thesparseness and the tolerance metrics were computed after sub-tracting the minimal response across the 213 stimuli (which in-cludes the “background” blank image; see Materials and Meth-ods), we found inverse correlations nearly identical to thoseobtained using raw rates (see supplemental Table 4 and supple-mental Fig. 6, available at www.jneurosci.org as supplementalmaterial).
As expected, given the negative correlation between selectivityand tolerance, the pairwise correlations between each toleranceproperty were positive, although not large and not always signif-icant (see supplemental Table 5, available at www.jneurosci.orgas supplemental material). This weaker correlation may reflect apoor estimate of each tolerance property, given the relative smallnumber of object conditions that were tested to estimate eachproperty (see Materials and Methods), or, instead, may indicatethat tolerance properties are built, at least at some extent, inde-pendently from one another along the ventral stream (Riesenhu-ber and Poggio, 1999; Serre et al., 2005, 2007b).
Does the trade-off depend on how object selectivityis determined?Because object selectivity might be defined in many ways, wewanted to see whether the trade-off result depended on our par-ticular choice of object selectivity metric or object test set. First, inaddition to sparseness (above), we considered a number of dif-ferent selectivity metrics computed on the responses to the set of213 stimuli. In each case, we found the same result: a negativecorrelation between the object selectivity metric and all four typesof tolerance (see supplemental Table 3, available at www.jneurosci.org as supplemental material).
We also considered the possibility that the inverse relationshipbetween sparseness and some of the tolerance properties was theresult of measuring selectivity over a set of objects that differed inlow-level visual properties (i.e., nonshape properties), such asarea and contrast. To test whether the trade-off between selectiv-ity and size (contrast) tolerance was an artifact of highly selectiveneurons being more sensitive to area (contrast) variations overthe stimulus set, we measured how well each neuronal responseprofile correlated with variation in these low-level propertiesacross the object test set. We considered the neuronal subpopu-lations within the first third (38 poorly selective cells) and the lastthird (17 highly selective cells) of the sparseness range (for addi-tional details, see Fig. 5) and we compared the average sensitivity
of each neuronal response to stimulus area and contrast (i.e., theaverage correlation between the property and the neuronal re-sponse). On average, the responses of poorly selective neuronswere positively (but very weakly) correlated with stimulus area(average correlation � 0.05 � 0.04 SE) and contrast (averagecorrelation � 0.08 � 0.02 SE). A still weaker and negative corre-lation was observed between the responses of highly selectiveneurons and stimulus area (average correlation � �0.02 � 0.05SE) and contrast (average correlation � �0.03 � 0.01 SE). Thus,IT neuronal responses are only minimally affected by area andcontrast of the tested objects. Even more importantly, poorlyselective neurons are more sensitive than highly selective neuronsto these low-level properties over the object set, which wouldtend to make poorly selective neurons less tolerant to object sizeand contrast (by definition), the opposite of the trade-off weobserved. This conclusion was confirmed by comparing thesquares of the correlation coefficients (r 2, explained variance)between neuronal responses and low-level stimulus propertiesfor the two populations of highly and weakly selective cells. Onaverage, the amount of variance of the neuronal response ex-plained by variations of stimulus contrast and area was small andlarger for weakly than highly selective cells (weakly selective cells:r 2
area � 0.075 � 0.015 SE; r 2contrast � 0.023 � 0.005 SE; highly
selective cells: r 2area � 0.039 � 0.022 SE; r 2
contrast � 0.003 �0.001). Overall, this rules out the possibility that the trade-offbetween object selectivity and size/contrast tolerance is producedby variations in neuronal sensitivity to these low-level properties(also see next).
Finally, we also tested a subpopulation of 49 IT neurons usingadditional sets of test objects and an associated selectivity metric.Specifically, each of these neurons showed a response to any of 45objects belonging to three sets of parameterized shapes [cars,faces, and two-dimensional silhouettes; see Materials and Meth-ods and Zoccolan et al. (2005)] and could therefore be tested fortuning along a continuous shape dimension (morph axis) thatincluded the effective object (see Materials and Methods). Each ofthe 49 neurons fired at least 10 spikes/s to the most effectiveobject within the tested morph axis. Selectivity within eachmorph axis (five continuously morphed shapes per morph axis)(see examples in Fig. 2B) was quantified by a morph tuning index[MT; see Materials and Methods and Rainer et al. (1998)]. MTranges from 0 (the neuron responds equally to every shape alongthe morph axis) to 1 (the neuron responds only to one shape).Morph tuning and sparseness (S, above) provide two comple-mentary measures of neuronal selectivity for visual objects.Whereas sparseness quantifies neuronal responsiveness across abroad set of natural objects (that may vary in global shape, num-ber and complexity of features and textures, and low-level visualproperties such as area, luminance, and contrast), morph tuningquantifies neuronal sensitivity to small, controlled shape trans-formations of an effective object (Fig. 1A). Therefore, the morphtuning allowed us to assess the relationship between almost“pure” shape selectivity and tolerance properties, independent ofpotential confounds of low-level stimulus properties such as areaand contrast.
As shown in the top of Figure 2B (same example cells andcolor code as in Fig. 2A), the sensitivity to small shape changes ofthe preferred prototype (a face and a car, respectively, for the twoexample neurons) can be widely different for neurons withinanterior IT. In fact, like sparseness, morph tuning spanned a largerange of values across the recorded neuronal population (from0.06 to 0.66; mean � 0.31 � 0.17 SD, n � 49), and it was wellcorrelated with sparseness (r � 0.51 � 0.12 SEM, p � 0.0002, n �
Zoccolan et al. • Selectivity and Tolerance Trade off in Monkey IT J. Neurosci., November 7, 2007 • 27(45):12292–12307 • 12299

49, one-tailed permutation test), suggest-ing that both measures tap into each neu-ron’s underlying shape selectivity. More-over, like the sparseness metric, the morphtuning reveals a broad range of variationacross the recorded IT population and al-lows an assessment of its correlation withthe tolerance properties. Similar to whatwe found for sparseness, we also observeda trade-off between morph tuning andeach of the four tolerance properties (Fig.4B): morph tuning was negatively and sig-nificantly correlated with all the tolerancemetrics (Fig. 4C, last two rows).
Although these results do not allow usto claim that we have precisely measuredthe shape tuning of any individual IT neu-ron, they show that the uncovered trade-off between object selectivity and toleranceacross the IT population is highly robust tothe metric and stimulus set used to quan-tify object selectivity and holds also whenselectivity to almost pure shape changes isconsidered. Together, the results shown inFigure 4 and supplemental Table 3 (avail-able at www.jneurosci.org as supplementalmaterial) show the existence of a trade-offbetween object selectivity and a wide rangeof tolerances to identity-preserving imagetransformations in IT.
Contribution of putative inhibitory andexcitatory neurons to the observedtrade-off between selectivityand toleranceWe considered the possibility that the ob-served trade-off between object selectivityand clutter tolerance was caused by a mix-ture of excitatory and inhibitory neuronsin the population (e.g., perhaps with in-hibitory neurons being less shape selec-tive). To examine this, the recorded neu-ronal population was divided into putativeinhibitory and excitatory neurons basedon extracellular measures of excitatoryand inhibitory neuronal typing suggestedpreviously (Mountcastle et al., 1969; Guret al., 1999; Frank et al., 2001; Bruno andSimons, 2002; Constantinidis andGoldman-Rakic, 2002; Swadlow, 2003;Andermann et al., 2004; Hasenstaub et al.,2005; Mitchell et al., 2007) (Fig. 5A). Asindicated in the scatter plots of Figure 4, Aand B, inhibitory neurons had a markedtendency to be both less shape selectivethan excitatory neurons (lower sparsenessand morph tuning values) (see also Fig. 5B,black bars) and more tolerant to identity-preserving image transformations. Al-though the putative inhibitory populationis small, it showed a trend consistent withthe trade-off between selectivity and toler-ance observed over the whole neuronal
Figure 5. Population-averaged tolerance profiles for inhibitory and for highly and weakly shape-selective excitatory neurons.A, Two components of the action potentials produced by a given cell were taken as distinctive features of the neuron type (top): (1)the duration (width) of the central peak; and (2) the width of the trailing trough. Across the recorded population, the cluster ofneurons with shorter mean widths (open circles) was designated as putative inhibitory. The cluster with longer mean widths(filled circles) was designated as excitatory. B, Distribution of sparseness values observed across the neuronal population. Blue andred bars show, respectively, putative excitatory neurons in the first and last third of the sparseness range. Black bars show putativeinhibitory neurons. C, Population-averaged tolerance profiles for excitatory weakly shape-selective (in blue) and highly shape-selective (in red) neurons and inhibitory neurons (in black), as defined in B. Before averaging, position and size tuning curves werealigned to the location of their peak values. For position, neuronal responses were averaged in overlapping windows of �3°,shifted in steps of �1° (only curves that were best fitted by Gaussian functions were averaged; see Materials and Methods). Sizetuning curves were plotted as a function of the percentage of size change with respect to the most effective object size (100%) andthen averaged in four nonoverlapping windows (approximately equally spaced on a logarithmic scale). For clutter tolerance, CTvalues in the first (in blue) and last (in red) third of the sparseness range were averaged. The small displacement of back curves inthe bottom panels is for display purpose only.
12300 • J. Neurosci., November 7, 2007 • 27(45):12292–12307 Zoccolan et al. • Selectivity and Tolerance Trade off in Monkey IT

population. More importantly, the full spectrum of selectivityand tolerance values was observed even among only putative ex-citatory neurons (see the spread of filled circles in Fig. 4A,B), aswell as a significant negative correlation between selectivity andeach tolerance (Fig. 4A,B) (correlation values computed usingonly excitatory neurons are reported in supplemental Tables 1, 2,available at www.jneurosci.org as supplemental material). Insummary, the observed trade-off between selectivity and toler-ance does not depend on the putative subtype of the neuronswhose responses were recorded (see also Fig. 5C, populationaverage plots).
Population-averaged tolerance profiles for highly and weaklyshape-selective IT neuronsTo further examine the dependence of the amount of toleranceon each neuron’s object selectivity, we considered the least shape-selective neurons and the most shape selective neurons in ourpopulation. Specifically, we focused on the neuronal subpopula-tion within the first third (0.05 � S � 0.35) (Fig. 5B, blue bars)and the last third (0.64 � S � 0.94) (Fig. 5B, red bars) of theobserved sparseness range. For clarity, putative inhibitory neu-rons were excluded from both subpopulations and analyzed as athird, separate subpopulation (Fig. 5B, black bars), but resultswere nearly identical if this was not done (see below). The nor-malized neuronal responses across each set of transformations ofthe reference object (Fig. 3, bottom) were aligned according totheir peak values (see legend for details) and averaged within eachof the three neuronal subpopulations, yielding the population-averaged tolerance profiles shown in Figure 5C for weakly shape-selective (in blue), highly shape-selective (in red), and inhibitoryneurons (in black).
This analysis confirmed that weakly shape-selective excitatoryneurons were, on average, more tolerant than highly shape-selective excitatory neurons to each of the four identity-preserving transformations (Fig. 5C, compare blue and redcurves). It also shows that the amount of tolerance of putativeinhibitory neurons was nearly identical to that of the weaklyshape-selective excitatory neurons (Fig. 5C, compare black andblue). This means that the difference in the amount of tolerancebetween the populations of weakly and highly selective neurons isnot affected by whether the putative inhibitory neurons aretreated as a separate population or not.
Figure 5 also allows estimating the difference in the averageamount of tolerance in weakly versus highly shape-selective neu-rons. For example, the average RF width (measured at one-halfthe peak response) (Fig. 5C, top left, dashed lines) was more thantwice as large for weakly shape-selective neurons (relative tohighly shape-selective neurons). Similarly, whereas weaklyshape-selective neurons showed, on average, almost no effect of
clutter (CCI; CT � 1), highly shape-selective neurons showedstrong suppression by clutter (CT � 0.5). This CT value meansthat, for more highly shape-selective IT neurons, the response toa pair of simultaneously presented reference and flanker objects(R
ref & flanker) is close to the average of the responses to the reference
(Rref) and flanker (Rflanker) objects presented in isolation, which isconsistent with the averaging rule reported in some recent studies(Zoccolan et al., 2005; De Baene et al., 2007) (described furtherbelow).
Latency of neuronal responses and time course of selectivityand tolerance propertiesWe asked whether the subpopulations of weakly and highly se-lective IT neurons show any significant difference in the latencyand duration of their responses. In agreement with previous find-ings (Brincat and Connor, 2006), we found a weak but significantpositive correlation between object selectivity (i.e., sparseness)and (1) latency of response onset and (2) response duration (seesupplemental Table 6A, available at www.jneurosci.org as sup-plemental material). On average, weakly selective neurons fired�10 ms before highly selective cells, and their responses were�30 ms shorter (see supplemental Table 6B, available at www.jneurosci.org as supplemental material). Although the latency ofthe peak of the response had a tendency to be longer for highlyselective neurons than weakly selective neurons, this differencewas not significant (see supplemental Table 6B, available atwww.jneurosci.org as supplemental material), and no significantcorrelation was found between peak latency and sparseness (seesupplemental Table 6A, available at www.jneurosci.org as sup-plemental material).
Previous studies reported that object selectivity can substan-tially change (e.g., increase) as a function of time during theresponse epoch (Sugase et al., 1999; Matsumoto et al., 2005; Brin-cat and Connor, 2006). A detailed analysis of the informationabout object identity conveyed by different temporal epochs ofthe neuronal response was not the primary goal of this study.However, by measuring the time course of object selectivity as afunction of time (using spike count windows of 50 ms that over-lapped of 25 ms) for the two subpopulations of weakly and highlyselective neurons defined in Figure 5B, we found that sparsenesswas remarkably stable for the duration of the IT responses (Fig.6A). That is, IT neurons that are very object selective in theirinitial response tend to remain very object selective, and viceversa. A similar analysis of the time course of the tolerance met-rics showed that, despite some modulations as a function of time,highly selective neurons were consistently less tolerant thanweakly selective cells for the whole duration of the neuronal re-sponse (Fig. 6B). Overall, these analyses show that selectivity andtolerance metrics are largely independent of the spike count win-
Figure 6. Time course of object selectivity (sparseness) and tolerance properties for the two populations of weakly and highly selective neurons. A, B, Sparseness and tolerance properties werecomputed in spike count windows (time slices) of 50 ms, shifted in steps of 25 ms. In each time slice, the average value (solid line) and the SE (shaded regions) of the sparseness and toleranceproperties were computed for the weakly selective neurons (blue; n � 38) and the highly selective neurons (red; n � 17) defined in Figure 5 (putative inhibitory neurons were included in the twosets). For each time slice, outliers were removed before averaging (i.e., tolerance metric values larger than 95th percentile in the time slice).
Zoccolan et al. • Selectivity and Tolerance Trade off in Monkey IT J. Neurosci., November 7, 2007 • 27(45):12292–12307 • 12301
dow (see also supplemental Tables 1, 2, available at www.jneurosci.org as supplemental material) and that the trade-offbetween selectivity and tolerance holds for the duration of theresponse.
Relative tolerance of object selectivityAbove, we measured tolerance in absolute terms. Although notthe goal of our study, we also collected data that partially addressthe issue of how well preserved the rank order of object selectivityacross different transformations (positions, sizes, and contrasts)is, independent of absolute response rate (i.e., relative tolerance).In particular, for each neuron, we asked how many times theresponse to the poorly effective object became higher than theresponse to the effective object, i.e., how many times the objectpreference of any given neuron reversed over our range of testedidentity-preserving transformations (position, size, and con-trast). This was quantified by computing a d index (see Materialsand Methods) that measures, for each transformation (e.g., agiven position or size), how far apart the responses to the twoobjects are. A negative d indicates that a given transformationproduced a reversal in the object preference of the neuronal re-sponse. Such reversal happened rarely: (1) for position changes, ithappened 15% (7%) of the times for the subpopulation of highly(weakly) selective neurons; (2) for size changes, it happened 0%(4%) of the times for the subpopulation of highly (weakly) selec-tive neurons; (3) for contrast changes, the reversal happened 23%(14%) of the times for the subpopulation of highly (weakly) se-lective neurons. Interestingly, even when reversals occurred, theywere typically small: the average of the reversed d for highlyselective cells was (1) �0.60 � 0.33 (SD) for position changes;and (2) �0.64 � 0.50 for contrast changes. The average of thereversed d for weakly selective cells was (1) �0.31 � 0.28 forposition changes; (2) �0.24 � 0.17 for size changes; and (3)�0.40 � 0.27 for contrast changes (for comparison, the averaged in the reference position was 3.97). This suggests that the re-versal of object preference typically happened when the responseto the effective object became as small as the response to thepoorly effective object (e.g., at the edges of the receptive fields orfor the lowest contrasts), suggesting that the reversal was drivenby the variability of two nearly identical neuronal responses,rather than by a true change of object preference. As expectedbased on our measurements of absolute tolerance (above), suchreversals happened more often for the subset of very selectiveneurons, given the smaller size of their receptive fields and theirlower contrast tolerance, compared with the poorly selectivecells.
A deeper look into clutter toleranceClutter tolerance differs from the other three tolerances testedhere because the image changes that one might expect IT neuronsto be tolerant to are less well defined. For example, size change hasonly one degree of freedom, but there is an unlimited number ofdistractor (clutter) objects that one might add to the visual scene.Considering the overarching goal of the present study (examin-ing the relationship of shape selectivity and tolerance), the mostimportant consideration was to be sure that our choices of flanker(clutter) objects did not produce artifactual dependency betweenshape selectivity and clutter tolerance.
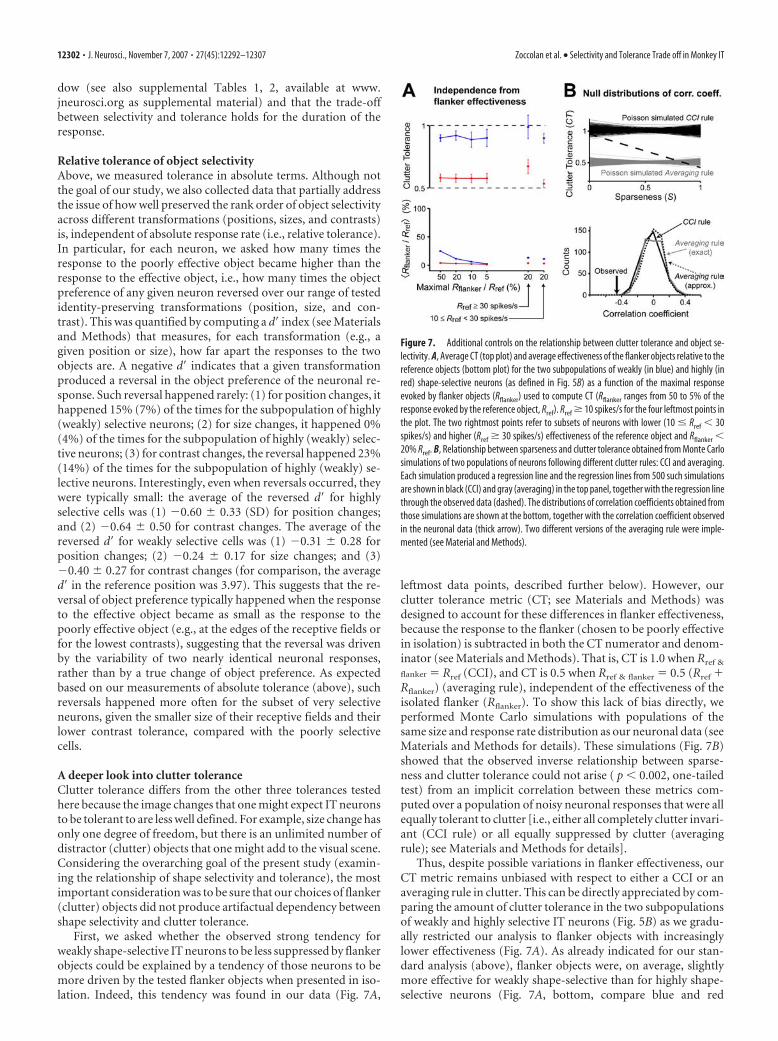
First, we asked whether the observed strong tendency forweakly shape-selective IT neurons to be less suppressed by flankerobjects could be explained by a tendency of those neurons to bemore driven by the tested flanker objects when presented in iso-lation. Indeed, this tendency was found in our data (Fig. 7A,
leftmost data points, described further below). However, ourclutter tolerance metric (CT; see Materials and Methods) wasdesigned to account for these differences in flanker effectiveness,because the response to the flanker (chosen to be poorly effectivein isolation) is subtracted in both the CT numerator and denom-inator (see Materials and Methods). That is, CT is 1.0 when Rref &
flanker � Rref (CCI), and CT is 0.5 when Rref & flanker � 0.5 (Rref �Rflanker) (averaging rule), independent of the effectiveness of theisolated flanker (Rflanker). To show this lack of bias directly, weperformed Monte Carlo simulations with populations of thesame size and response rate distribution as our neuronal data (seeMaterials and Methods for details). These simulations (Fig. 7B)showed that the observed inverse relationship between sparse-ness and clutter tolerance could not arise ( p � 0.002, one-tailedtest) from an implicit correlation between these metrics com-puted over a population of noisy neuronal responses that were allequally tolerant to clutter [i.e., either all completely clutter invari-ant (CCI rule) or all equally suppressed by clutter (averagingrule); see Materials and Methods for details].
Thus, despite possible variations in flanker effectiveness, ourCT metric remains unbiased with respect to either a CCI or anaveraging rule in clutter. This can be directly appreciated by com-paring the amount of clutter tolerance in the two subpopulationsof weakly and highly selective IT neurons (Fig. 5B) as we gradu-ally restricted our analysis to flanker objects with increasinglylower effectiveness (Fig. 7A). As already indicated for our stan-dard analysis (above), flanker objects were, on average, slightlymore effective for weakly shape-selective than for highly shape-selective neurons (Fig. 7A, bottom, compare blue and red
Figure 7. Additional controls on the relationship between clutter tolerance and object se-lectivity. A, Average CT (top plot) and average effectiveness of the flanker objects relative to thereference objects (bottom plot) for the two subpopulations of weakly (in blue) and highly (inred) shape-selective neurons (as defined in Fig. 5B) as a function of the maximal responseevoked by flanker objects (Rflanker) used to compute CT (Rflanker ranges from 50 to 5% of theresponse evoked by the reference object, Rref). Rref � 10 spikes/s for the four leftmost points inthe plot. The two rightmost points refer to subsets of neurons with lower (10 � Rref � 30spikes/s) and higher (Rref � 30 spikes/s) effectiveness of the reference object and Rflanker �20% Rref. B, Relationship between sparseness and clutter tolerance obtained from Monte Carlosimulations of two populations of neurons following different clutter rules: CCI and averaging.Each simulation produced a regression line and the regression lines from 500 such simulationsare shown in black (CCI) and gray (averaging) in the top panel, together with the regression linethrough the observed data (dashed). The distributions of correlation coefficients obtained fromthose simulations are shown at the bottom, together with the correlation coefficient observedin the neuronal data (thick arrow). Two different versions of the averaging rule were imple-mented (see Material and Methods).
12302 • J. Neurosci., November 7, 2007 • 27(45):12292–12307 Zoccolan et al. • Selectivity and Tolerance Trade off in Monkey IT
curves). Of course, by construction this difference in flanker ef-fectiveness disappeared as the analysis was restricted to flankerobjects that were less and less effective (Fig. 7A, bottom, right-most points). Nevertheless, the difference in the amount of clut-ter tolerance in the two neuronal subpopulations was largely un-affected by this manipulation (Fig. 7A, top, compare blue and redcurves). That is, regardless of flanker effectiveness, the weaklyselective IT neurons tended to show high flanker (clutter) toler-ance (CT � 1), whereas the highly shape-selective IT neuronsshowed stronger clutter suppression (CT � 0.5). Furthermore,we also checked that this result did not depend on the effective-ness of the reference object (Fig. 7A, rightmost points).
Finally, we also verified that the inverse relationship betweenobject selectivity and clutter tolerance did not arise from any biasin the low-level visual properties of flanker objects (such as con-trast) (see supplemental Fig. 3, available at www.jneurosci.org assupplemental material) or flanker object identity (see supple-mental Fig. 4, available at www.jneurosci.org as supplementalmaterial) used to test weakly versus highly shape selective neu-rons. In summary, IT neurons that are intrinsically the mostselective for object shape are typically the least tolerant to theaddition of other poorly effective (clutter) objects in the visualfield, and this result is not simply attributable to the choice ofclutter objects.
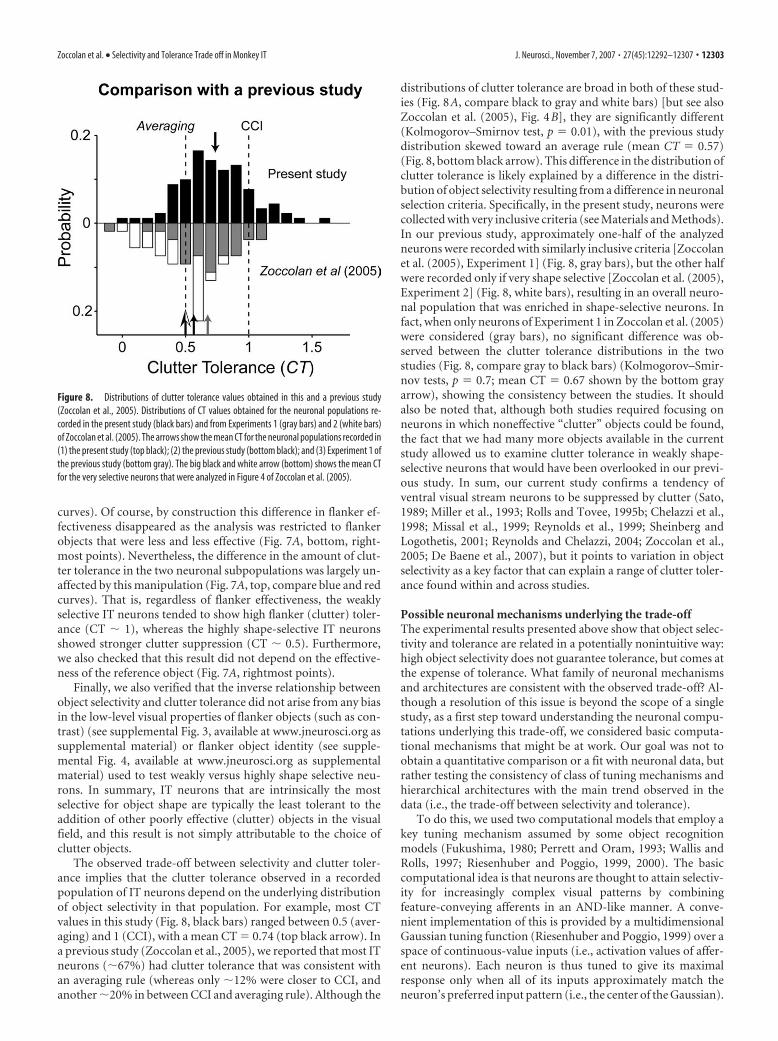
The observed trade-off between selectivity and clutter toler-ance implies that the clutter tolerance observed in a recordedpopulation of IT neurons depend on the underlying distributionof object selectivity in that population. For example, most CTvalues in this study (Fig. 8, black bars) ranged between 0.5 (aver-aging) and 1 (CCI), with a mean CT � 0.74 (top black arrow). Ina previous study (Zoccolan et al., 2005), we reported that most ITneurons (�67%) had clutter tolerance that was consistent withan averaging rule (whereas only �12% were closer to CCI, andanother �20% in between CCI and averaging rule). Although the
distributions of clutter tolerance are broad in both of these stud-ies (Fig. 8A, compare black to gray and white bars) [but see alsoZoccolan et al. (2005), Fig. 4B], they are significantly different(Kolmogorov–Smirnov test, p � 0.01), with the previous studydistribution skewed toward an average rule (mean CT � 0.57)(Fig. 8, bottom black arrow). This difference in the distribution ofclutter tolerance is likely explained by a difference in the distri-bution of object selectivity resulting from a difference in neuronalselection criteria. Specifically, in the present study, neurons werecollected with very inclusive criteria (see Materials and Methods).In our previous study, approximately one-half of the analyzedneurons were recorded with similarly inclusive criteria [Zoccolanet al. (2005), Experiment 1] (Fig. 8, gray bars), but the other halfwere recorded only if very shape selective [Zoccolan et al. (2005),Experiment 2] (Fig. 8, white bars), resulting in an overall neuro-nal population that was enriched in shape-selective neurons. Infact, when only neurons of Experiment 1 in Zoccolan et al. (2005)were considered (gray bars), no significant difference was ob-served between the clutter tolerance distributions in the twostudies (Fig. 8, compare gray to black bars) (Kolmogorov–Smir-nov tests, p � 0.7; mean CT � 0.67 shown by the bottom grayarrow), showing the consistency between the studies. It shouldalso be noted that, although both studies required focusing onneurons in which noneffective “clutter” objects could be found,the fact that we had many more objects available in the currentstudy allowed us to examine clutter tolerance in weakly shape-selective neurons that would have been overlooked in our previ-ous study. In sum, our current study confirms a tendency ofventral visual stream neurons to be suppressed by clutter (Sato,1989; Miller et al., 1993; Rolls and Tovee, 1995b; Chelazzi et al.,1998; Missal et al., 1999; Reynolds et al., 1999; Sheinberg andLogothetis, 2001; Reynolds and Chelazzi, 2004; Zoccolan et al.,2005; De Baene et al., 2007), but it points to variation in objectselectivity as a key factor that can explain a range of clutter toler-ance found within and across studies.
Possible neuronal mechanisms underlying the trade-offThe experimental results presented above show that object selec-tivity and tolerance are related in a potentially nonintuitive way:high object selectivity does not guarantee tolerance, but comes atthe expense of tolerance. What family of neuronal mechanismsand architectures are consistent with the observed trade-off? Al-though a resolution of this issue is beyond the scope of a singlestudy, as a first step toward understanding the neuronal compu-tations underlying this trade-off, we considered basic computa-tional mechanisms that might be at work. Our goal was not toobtain a quantitative comparison or a fit with neuronal data, butrather testing the consistency of class of tuning mechanisms andhierarchical architectures with the main trend observed in thedata (i.e., the trade-off between selectivity and tolerance).
To do this, we used two computational models that employ akey tuning mechanism assumed by some object recognitionmodels (Fukushima, 1980; Perrett and Oram, 1993; Wallis andRolls, 1997; Riesenhuber and Poggio, 1999, 2000). The basiccomputational idea is that neurons are thought to attain selectiv-ity for increasingly complex visual patterns by combiningfeature-conveying afferents in an AND-like manner. A conve-nient implementation of this is provided by a multidimensionalGaussian tuning function (Riesenhuber and Poggio, 1999) over aspace of continuous-value inputs (i.e., activation values of affer-ent neurons). Each neuron is thus tuned to give its maximalresponse only when all of its inputs approximately match theneuron’s preferred input pattern (i.e., the center of the Gaussian).
Figure 8. Distributions of clutter tolerance values obtained in this and a previous study(Zoccolan et al., 2005). Distributions of CT values obtained for the neuronal populations re-corded in the present study (black bars) and from Experiments 1 (gray bars) and 2 (white bars)of Zoccolan et al. (2005). The arrows show the mean CT for the neuronal populations recorded in(1) the present study (top black); (2) the previous study (bottom black); and (3) Experiment 1 ofthe previous study (bottom gray). The big black and white arrow (bottom) shows the mean CTfor the very selective neurons that were analyzed in Figure 4 of Zoccolan et al. (2005).
Zoccolan et al. • Selectivity and Tolerance Trade off in Monkey IT J. Neurosci., November 7, 2007 • 27(45):12292–12307 • 12303
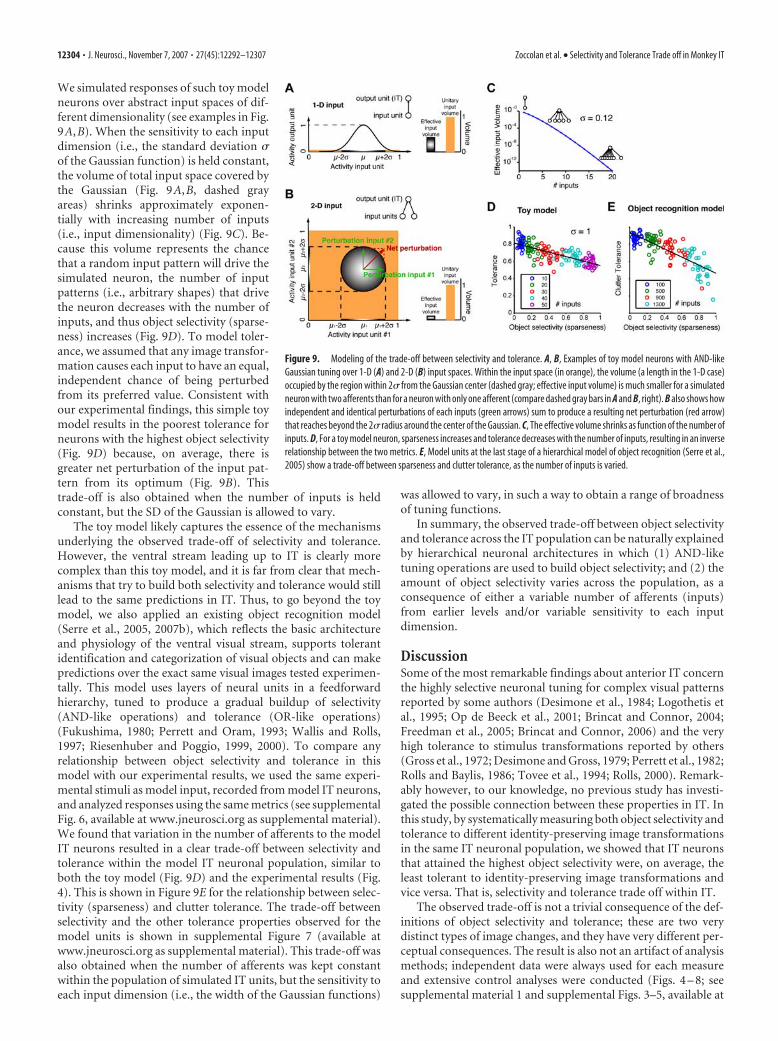
We simulated responses of such toy modelneurons over abstract input spaces of dif-ferent dimensionality (see examples in Fig.9A,B). When the sensitivity to each inputdimension (i.e., the standard deviation �of the Gaussian function) is held constant,the volume of total input space covered bythe Gaussian (Fig. 9A,B, dashed grayareas) shrinks approximately exponen-tially with increasing number of inputs(i.e., input dimensionality) (Fig. 9C). Be-cause this volume represents the chancethat a random input pattern will drive thesimulated neuron, the number of inputpatterns (i.e., arbitrary shapes) that drivethe neuron decreases with the number ofinputs, and thus object selectivity (sparse-ness) increases (Fig. 9D). To model toler-ance, we assumed that any image transfor-mation causes each input to have an equal,independent chance of being perturbedfrom its preferred value. Consistent withour experimental findings, this simple toymodel results in the poorest tolerance forneurons with the highest object selectivity(Fig. 9D) because, on average, there isgreater net perturbation of the input pat-tern from its optimum (Fig. 9B). Thistrade-off is also obtained when the number of inputs is heldconstant, but the SD of the Gaussian is allowed to vary.
The toy model likely captures the essence of the mechanismsunderlying the observed trade-off of selectivity and tolerance.However, the ventral stream leading up to IT is clearly morecomplex than this toy model, and it is far from clear that mech-anisms that try to build both selectivity and tolerance would stilllead to the same predictions in IT. Thus, to go beyond the toymodel, we also applied an existing object recognition model(Serre et al., 2005, 2007b), which reflects the basic architectureand physiology of the ventral visual stream, supports tolerantidentification and categorization of visual objects and can makepredictions over the exact same visual images tested experimen-tally. This model uses layers of neural units in a feedforwardhierarchy, tuned to produce a gradual buildup of selectivity(AND-like operations) and tolerance (OR-like operations)(Fukushima, 1980; Perrett and Oram, 1993; Wallis and Rolls,1997; Riesenhuber and Poggio, 1999, 2000). To compare anyrelationship between object selectivity and tolerance in thismodel with our experimental results, we used the same experi-mental stimuli as model input, recorded from model IT neurons,and analyzed responses using the same metrics (see supplementalFig. 6, available at www.jneurosci.org as supplemental material).We found that variation in the number of afferents to the modelIT neurons resulted in a clear trade-off between selectivity andtolerance within the model IT neuronal population, similar toboth the toy model (Fig. 9D) and the experimental results (Fig.4). This is shown in Figure 9E for the relationship between selec-tivity (sparseness) and clutter tolerance. The trade-off betweenselectivity and the other tolerance properties observed for themodel units is shown in supplemental Figure 7 (available atwww.jneurosci.org as supplemental material). This trade-off wasalso obtained when the number of afferents was kept constantwithin the population of simulated IT units, but the sensitivity toeach input dimension (i.e., the width of the Gaussian functions)
was allowed to vary, in such a way to obtain a range of broadnessof tuning functions.
In summary, the observed trade-off between object selectivityand tolerance across the IT population can be naturally explainedby hierarchical neuronal architectures in which (1) AND-liketuning operations are used to build object selectivity; and (2) theamount of object selectivity varies across the population, as aconsequence of either a variable number of afferents (inputs)from earlier levels and/or variable sensitivity to each inputdimension.
DiscussionSome of the most remarkable findings about anterior IT concernthe highly selective neuronal tuning for complex visual patternsreported by some authors (Desimone et al., 1984; Logothetis etal., 1995; Op de Beeck et al., 2001; Brincat and Connor, 2004;Freedman et al., 2005; Brincat and Connor, 2006) and the veryhigh tolerance to stimulus transformations reported by others(Gross et al., 1972; Desimone and Gross, 1979; Perrett et al., 1982;Rolls and Baylis, 1986; Tovee et al., 1994; Rolls, 2000). Remark-ably however, to our knowledge, no previous study has investi-gated the possible connection between these properties in IT. Inthis study, by systematically measuring both object selectivity andtolerance to different identity-preserving image transformationsin the same IT neuronal population, we showed that IT neuronsthat attained the highest object selectivity were, on average, theleast tolerant to identity-preserving image transformations andvice versa. That is, selectivity and tolerance trade off within IT.
The observed trade-off is not a trivial consequence of the def-initions of object selectivity and tolerance; these are two verydistinct types of image changes, and they have very different per-ceptual consequences. The result is also not an artifact of analysismethods; independent data were always used for each measureand extensive control analyses were conducted (Figs. 4 – 8; seesupplemental material 1 and supplemental Figs. 3–5, available at
Figure 9. Modeling of the trade-off between selectivity and tolerance. A, B, Examples of toy model neurons with AND-likeGaussian tuning over 1-D (A) and 2-D (B) input spaces. Within the input space (in orange), the volume (a length in the 1-D case)occupied by the region within 2� from the Gaussian center (dashed gray; effective input volume) is much smaller for a simulatedneuron with two afferents than for a neuron with only one afferent (compare dashed gray bars in A and B, right). B also shows howindependent and identical perturbations of each inputs (green arrows) sum to produce a resulting net perturbation (red arrow)that reaches beyond the 2� radius around the center of the Gaussian. C, The effective volume shrinks as function of the number ofinputs. D, For a toy model neuron, sparseness increases and tolerance decreases with the number of inputs, resulting in an inverserelationship between the two metrics. E, Model units at the last stage of a hierarchical model of object recognition (Serre et al.,2005) show a trade-off between sparseness and clutter tolerance, as the number of inputs is varied.
12304 • J. Neurosci., November 7, 2007 • 27(45):12292–12307 Zoccolan et al. • Selectivity and Tolerance Trade off in Monkey IT
www.jneurosci.org as supplemental material). The trade-off can-not be accounted for by a differential sensitivity of highly versusweakly selective neurons to variations in low-level properties ofthe tested objects (see Results). We also showed that the result isrobust to the way in which object selectivity and tolerance aremeasured, and it holds for all types of tolerance we tested (posi-tion, size, contrast, and clutter) (Figs. 4 – 6; supplemental Tables1– 4, available at www.jneurosci.org as supplemental material).In addition, we found that object selectivity, tolerance, and theirinverse relationship are largely independent of the temporal ep-och of the neuronal response (Fig. 6), suggesting that they arelargely established as feedforward properties of the processing ofvisual objects (at least for the behavioral task and stimulus pre-sentation rate tested here).
Comparison with previous findingsThis trade-off between selectivity and tolerance is consistent withprevious work showing that selectivity and tolerance both growalong the ventral visual stream, to reach peak values in anterior IT(Kobatake and Tanaka, 1994; Logothetis and Sheinberg, 1996;Tanaka, 1996; Edelman, 1999; Rolls, 2000; Rousselet et al., 2004).Indeed, we suspect that the mean level of object selectivity and themean level of tolerance are higher in IT than in lower ventralvisual areas. However, our experiments indicate that, althoughsingle IT neurons are capable of achieving either very high selec-tivity or very high tolerance, they do not manage to attain both atonce. This empirical discovery has several important implica-tions and connections with previous work.
The present result helps unify a body of previous IT work byexplaining why the amount of tolerance is highly varied withinand across those studies (Gross et al., 1972; Desimone and Gross,1979; Perrett et al., 1982; Desimone et al., 1984; Rolls and Baylis,1986; Sato, 1989; Lueschow et al., 1994; Tovee et al., 1994; Ito etal., 1995; Logothetis et al., 1995; Logothetis and Sheinberg, 1996;Tanaka, 1996; Chelazzi et al., 1998; Edelman, 1999; Op De Beeckand Vogels, 2000; Rolls, 2000; Sheinberg and Logothetis, 2001;DiCarlo and Maunsell, 2003; Rousselet et al., 2004). Specifically,our results show that, because each IT neuron’s tolerance de-pends on its object selectivity, the wide variation in object selec-tivity across the IT population (Fig. 5B) might explain the widevariation in tolerance. For instance, the amount of clutter toler-ance of neuronal responses along the ventral visual stream is thesubject of debate. Although many studies found that neuronalresponses in IT and earlier visual areas (V4 and V2) are oftenstrongly suppressed by clutter (Sato, 1989; Miller et al., 1993;Rolls and Tovee, 1995b; Chelazzi et al., 1998; Missal et al., 1999;Reynolds et al., 1999; Sheinberg and Logothetis, 2001; Reynoldsand Chelazzi, 2004; Zoccolan et al., 2005; De Baene et al., 2007),most of these studies found that some fraction of neurons weremuch more tolerant to clutter (Chelazzi et al., 1998; Reynolds etal., 1999; Zoccolan et al., 2005), sometimes a large fraction (Sato,1989; Sheinberg and Logothetis, 2001) or a majority (Gawne andMartin, 2002) of neurons. Our results suggest that, because theamount of clutter tolerance of any given IT neuron dependsstrongly on its object selectivity, all of these answers are correct;there is no single amount of clutter tolerance for all ventralstream neurons.
Possible neuronal mechanisms underlying the trade-offAn exhaustive examination of the neuronal mechanisms under-lying the observed trade-off is beyond the scope of the presentwork. However, using both a toy model and a hierarchical modelof object recognition (Fig. 9), we showed the consistency between
the observed trade-off and neuronal tuning mechanisms (AND-like or Gaussian tuning) that are often assumed to be at the baseof neuronal selectivity for visual objects (Fukushima, 1980;Perrett and Oram, 1993; Wallis and Rolls, 1997; Riesenhuberand Poggio, 1999, 2000). Because AND-like, approximatelyGaussian tuning functions can be implemented through divi-sive normalization (Poggio and Bizzi, 2004), these simulationsshow the consistency between the observed trade-off and di-visive normalization models (Heeger, 1992; Carandini et al.,1997; Recanzone et al., 1997; Britten and Heuer, 1999; Reyn-olds et al., 1999; Schwartz and Simoncelli, 2001; Reynolds andChelazzi, 2004). Interestingly, although the hierarchical rec-ognition model also employs OR-like (MAX) pooling opera-tions to build tolerance to position and size changes, it stillreveals an IT trade-off between object selectivity and toleranceto position and size variation. Future computational workmay illuminate the family of mechanisms and architecturesthat lead to the observed trade-off.
Generality and limitations of the present studyThe main strength of our results is that a significant inverserelationship between object selectivity and tolerance was con-sistently observed between each tolerance property and eachselectivity metric (Fig. 4). Importantly, we did not attempt touncover what combination of visual features each neuron re-sponded to. Rather, we aimed to estimate the sensitivity ofeach IT neuron to object identity changes (object selectivity)by measuring what fraction of objects, in two complementarysets, evoked a response in any neuron. Admittedly, however,object selectivity as measured here is not a perfect predictor oftolerance at the level of individual neurons (Fig. 4). This mightreflect a failure to perfectly measure object selectivity and tol-erance for each neuron, rather than a weak link between theseproperties. Another, nonexclusive possibility is that the trade-off produced by AND-like tuning mechanisms is partially op-posed by OR-like pooling mechanisms used by ventral streamneurons to build tolerance to specific transformations (e.g.,position and size). The interaction between such mechanismswould likely affect the strength of the correlation betweenselectivity and some tolerance properties.
When considering the possible mechanisms underlying theobserved trade-off, we note that the lower retinal sampling in theperiphery could contribute to limit position and size tolerance(Op De Beeck and Vogels, 2000). This might be especially true forhighly selective neurons. Nevertheless, because we found thatselectivity trades off with clutter and contrast tolerance, our ex-periments already provide evidence that retinal sampling cannotbe the only underlying mechanism. In this regard, the AND-liketuning operation simulated in the computational models pro-vides a more general mechanism that can explain the inverserelationship between object selectivity and every type of toler-ance. The extent to which this relationship is affected by thebalance between AND-like and OR-like operations (see above),as well as other properties/mechanisms (such as retinal sam-pling), may be revealed by further simulations of biologicallygrounded object recognition models.
The interaction between different tuning and tolerance mech-anisms and retinal sampling could also explain why other trends,beside the trade-off between selectivity and each tolerance, seemto be present in some of the scatter plots of Figure 4. For instance,the range of variation of position tolerance seems to be wider forweakly selective than highly selective neurons. We do not yetknow whether these other trends only reflect a failure to perfectly
Zoccolan et al. • Selectivity and Tolerance Trade off in Monkey IT J. Neurosci., November 7, 2007 • 27(45):12292–12307 • 12305
measure object selectivity and tolerance for each neuron (seediscussion above). Future studies could explore this further bymeasuring object selectivity and just one tolerance property usingmany more stimuli.
Possible functional consequences of the trade-offIn discussing the functional implications of the observed trade-off, it should be noticed that tolerance to identity-preservingtransformations can be conceptualized and measured in differentways. In this study, we focused on absolute tolerance. That is, weasked each IT neuron the same question one can ask of behavioralperformance: How well preserved is its response to a very effec-tive object when this object undergoes different identity-preserving transformations? However, this is not the only poten-tially relevant measure of neuronal tolerance. A related questionis how well IT neurons maintain the rank order of their objectpreference across positions, sizes, etc. (relative tolerance). Thesemeasures are related. In particular, the results presented here onabsolute tolerance provide a bound on relative tolerance: whenthe response to an effective object falls to near zero (the responseto ineffective objects), no relative tolerance can remain. Similarly,when the absolute response is reduced, signal-to-noise in relativetolerance will also be reduced.
Which tolerance measure is most appropriate remains an im-portant open question and ultimately requires an understandingof how IT neuronal activity is “read out” to guide behavior (Hunget al., 2005). IT neurons with absolutely tolerant selectivity coulddirectly support tolerant object recognition behavior. If IT neu-rons have only relative tolerance, this would require further pro-cessing beyond IT to support that behavior. For example, appro-priate combinations of IT neurons with only relative position andsize tolerance can likely support position and size tolerant objectrecognition (Dicarlo and Cox, 2007). However, given the virtu-ally infinite number of clutter conditions that can be encounteredin natural vision, it is less obvious that populations of neuronswith limited clutter tolerance can support recognition in clutter.Indeed, there is some empirical evidence that the brain aims toachieve absolute clutter tolerance at the level of individual ventralstream neurons. Specifically, when an animal is precued with theidentity or position of a target object, existing studies (Moran andDesimone, 1985; Chelazzi et al., 1998; Reynolds et al., 1999; Reyn-olds and Chelazzi, 2004) suggest that ventral stream neuronsmove their absolute responses toward levels seen without clutter(i.e., as if no clutter stimuli were present). This suggests that,when possible, the brain employs resources to actively compen-sate for the interference produced by clutter and to achieve com-plete clutter tolerance (in absolute terms) at the level of individ-ual neurons.
Our finding of broad ranges of selectivity and tolerance prop-erties within IT and the trade-off of those properties suggests thatthe ventral visual stream is not striving to create a representationcontaining only cells with very sharp object selectivity (Kobatakeand Tanaka, 1994). Rather, its goal may be to maximize theamount of tolerance given the constraint of achieving a spectrumof shape selectivity. Such a spectrum might provide a flexiblebasis in IT to support recognition tasks ranging from fine-grainedidentification to coarse categorization (Hung et al., 2005; Serre etal., 2005). In this regard, highly selective IT neurons, althoughcapable of supporting very fine shape discriminations, likely re-quire further feedforward stages of processing or top-down mod-ulation (such as attentional feedback to filter out clutter interfer-ence). On the contrary, weakly selective IT neurons may quicklyand reliably report the presence of some coarse classes of objects,
without clutter interference and over a large span of visual field,even without attentional control and the need of further process-ing stages.
ReferencesAndermann ML, Ritt J, Neimark MA, Moore CI (2004) Neural correlates of
vibrissa resonance; band-pass and somatotopic representation of high-frequency stimuli. Neuron 42:451– 463.
Bartho P, Hirase H, Monconduit L, Zugaro M, Harris KD, Buzsaki G (2004)Characterization of neocortical principal cells and interneurons by net-work interactions and extracellular features. J Neurophysiol 92:600 – 608.
Brincat SL, Connor CE (2004) Underlying principles of visual shape selec-tivity in posterior inferotemporal cortex. Nat Neurosci 7:880 – 886.
Brincat SL, Connor CE (2006) Dynamic shape synthesis in posterior infero-temporal cortex. Neuron 49:17–24.
Britten KH, Heuer HW (1999) Spatial summation in the receptive fields ofMT neurons. J Neurosci 19:5074 –5084.
Bruno RM, Simons DJ (2002) Feedforward mechanisms of excitatory andinhibitory cortical receptive fields. J Neurosci 22:10966 –10975.
Carandini M, Heeger DJ, Movshon JA (1997) Linearity and normalizationin simple cells of the macaque primary visual cortex. J Neurosci17:8621– 8644.
Chelazzi L, Duncan J, Miller EK, Desimone R (1998) Responses of neuronsin inferior temporal cortex during memory-guided visual search. J Neu-rophysiol 80:2918 –2940.
Connors BW, Gutnick MJ (1990) Intrinsic firing patterns of diverse neocor-tical neurons. Trends Neurosci 13:99 –104.
Constantinidis C, Goldman-Rakic PS (2002) Correlated discharges amongputative pyramidal neurons and interneurons in the primate prefrontalcortex. J Neurophysiol 88:3487–3497.
De Baene W, Premereur E, Vogels R (2007) Properties of shape tuning ofmacaque inferior temporal neurons examined using rapid serial visualpresentation. J Neurophysiol 97:2900 –2916.
Desimone R, Gross CG (1979) Visual areas in the temporal cortex of themacaque. Brain Res 178:363–380.
Desimone R, Albright TD, Gross CG, Bruce C (1984) Stimulus-selectiveproperties of inferior temporal neurons in the macaque. J Neurosci4:2051–2062.
DiCarlo JJ, Cox DD (2007) Untangling invariant object recognition. TrendsCogn Sci 11:333–341.
DiCarlo JJ, Maunsell JH (2003) Anterior inferotemporal neurons of mon-keys engaged in object recognition can be highly sensitive to object retinalposition. J Neurophysiol 89:3264 –3278.
Edelman S (1999) Representation and recognition in vision. Cambridge,MA: MIT.
Fei-Fei L, Fergus R, Perona P (2004) Learning generative visual models fromfew training examples: an incremental Bayesian approach tested on 101object categories. Paper presented at IEEE Conference on Computer Vi-sion and Pattern Recognition, Workshop on Generative-Model BasedVision, Washington DC, June 27–July 2, 2004.
Frank LM, Brown EN, Wilson MA (2001) A comparison of the firing prop-erties of putative excitatory and inhibitory neurons from CA1 and theentorhinal cortex. J Neurophysiol 86:2029 –2040.
Freedman DJ, Riesenhuber M, Poggio T, Miller EK (2005) Experience-dependent sharpening of visual shape selectivity in inferior temporal cor-tex. Cereb Cortex 16:1631–1644.
Fukushima K (1980) Neocognitron: a self organizing neural network modelfor a mechanism of pattern recognition unaffected by shift in position.Biol Cybern 36:193–202.
Gawne TJ, Martin JM (2002) Responses of primate visual cortical V4 neu-rons to simultaneously presented stimuli. J Neurophysiol 88:1128 –1135.
Gross CG (2002) Genealogy of the “grandmother cell”. Neuroscientist8:512–518.
Gross CG, Rocha-Miranda CE, Bender DB (1972) Visual properties of neu-rons in inferotemporal cortex of the Macaque. J Neurophysiol 35:96 –111.
Gur M, Beylin A, Snodderly DM (1999) Physiological properties of ma-caque V1 neurons are correlated with extracellular spike amplitude, du-ration, and polarity. J Neurophysiol 82:1451–1464.
Hasenstaub A, Shu Y, Haider B, Kraushaar U, Duque A, McCormick DA(2005) Inhibitory postsynaptic potentials carry synchronized frequencyinformation in active cortical networks. Neuron 47:423– 435.
12306 • J. Neurosci., November 7, 2007 • 27(45):12292–12307 Zoccolan et al. • Selectivity and Tolerance Trade off in Monkey IT

Heeger DJ (1992) Normalization of cell responses in cat striate cortex. VisNeurosci 9:181–197.
Hung CP, Kreiman G, Poggio T, DiCarlo JJ (2005) Fast readout of objectidentity from macaque inferior temporal cortex. Science 310:863– 866.
Intraub H (1980) Presentation rate and the representation of brieflyglimpsed pictures in memory. J Exp Psychol [Hum Learn] 6:1–12.
Ito M, Tamura H, Fujita I, Tanaka K (1995) Size and position invariance ofneuronal responses in monkey inferotemporal cortex. J Neurophysiol73:218 –226.
Kobatake E, Tanaka K (1994) Neuronal selectivities to complex object fea-tures in the ventral visual pathway of the macaque cerebral cortex. J Neu-rophysiol 71:856 – 867.
Logothetis NK, Sheinberg DL (1996) Visual object recognition. Annu RevNeurosci 19:577– 621.
Logothetis NK, Pauls J, Poggio T (1995) Shape representation in the inferiortemporal cortex of monkeys. Curr Biol 5:552–563.
Lueschow A, Miller EK, Desimone R (1994) Inferior temporal mechanismsfor invariant object recognition. Cereb Cortex 4:523–531.
Matsumoto N, Okada M, Sugase-Miyamoto Y, Yamane S, Kawano K (2005)Population dynamics of face-responsive neurons in the inferior temporalcortex. Cereb Cortex 15:1103–1112.
McCormick DA, Connors BW, Lighthall JW, Prince DA (1985) Compara-tive electrophysiology of pyramidal and sparsely spiny stellate neurons ofthe neocortex. J Neurophysiol 54:782– 806.
Miller EK, Gochin PM, Gross CG (1993) Suppression of visual responses ofneurons in inferior temporal cortex of the awake macaque by addition ofa second stimulus. Brain Res 616:25–29.
Missal M, Vogels R, Li CY, Orban GA (1999) Shape interactions in macaqueinferior temporal neurons. J Neurophysiol 82:131–142.
Mitchell JF, Sundberg KA, Reynolds JH (2007) Differential attention-dependent response modulation across cell classes in macaque visual areaV4. Neuron 55:131–141.
Moran J, Desimone R (1985) Selective attention gates visual processing inthe extrastriate cortex. Science 229:782–784.
Mountcastle VB, Talbot WH, Sakata H, Hyvarinen J (1969) Cortical neuro-nal mechanisms in flutter-vibration studied in unanesthetized monkeys.Neuronal periodicity and frequency discrimination. J Neurophysiol32:452– 484.
Nowak LG, Azouz R, Sanchez-Vives MV, Gray CM, McCormick DA (2003)Electrophysiological classes of cat primary visual cortical neurons in vivoas revealed by quantitative analyses. J Neurophysiol 89:1541–1566.
Olshausen BA, Field DJ (2004) Sparse coding of sensory inputs. Curr OpinNeurobiol 14:481– 487.
Op De Beeck H, Vogels R (2000) Spatial sensitivity of macaque inferiortemporal neurons. J Comp Neurol 426:505–518.
Op de Beeck H, Wagemans J, Vogels R (2001) Inferotemporal neurons rep-resent low-dimensional configurations of parameterized shapes. NatNeurosci 4:1244 –1252.
Perrett DI, Oram MW (1993) Neurophysiology of shape processing. ImageVision Comput 11:317–333.
Perrett DI, Rolls ET, Caan W (1982) Visual neurones responsive to faces inthe monkey temporal cortex. Exp Brain Res 47:329 –342.
Poggio T, Bizzi E (2004) Generalization in vision and motor control. Nature431:768 –774.
Potter MC (1976) Short-term conceptual memory for pictures. J Exp Psy-chol [Hum Learn] 2:509 –522.
Quiroga RQ, Reddy L, Kreiman G, Koch C, Fried I (2005) Invariant visualrepresentation by single neurons in the human brain. Nature435:1102–1107.
Rainer G, Asaad WF, Miller EK (1998) Selective representation of relevantinformation by neurons in the primate prefrontal cortex. Nature393:577–579.
Recanzone GH, Wurtz RH, Schwarz U (1997) Responses of MT and MST
neurons to one and two moving objects in the receptive field. J Neuro-physiol 78:2904 –2915.
Reynolds JH, Chelazzi L (2004) Attentional modulation of visual process-ing. Annu Rev Neurosci 27:611– 647.
Reynolds JH, Chelazzi L, Desimone R (1999) Competitive mechanisms sub-serve attention in macaque areas V2 and V4. J Neurosci 19:1736 –1753.
Riesenhuber M, Poggio T (1999) Hierarchical models of object recognitionin cortex. Nat Neurosci 2:1019 –1025.
Riesenhuber M, Poggio T (2000) Models of object recognition. Nat Neuro-sci 3 [Suppl]:1199 –1204.
Rolls ET (2000) Functions of the primate temporal lobe cortical visual areasin invariant visual object and face recognition. Neuron 27:205–218.
Rolls ET, Baylis GC (1986) Size and contrast have only small effects on theresponses to faces of neurons in the cortex of the superior temporal sulcusof the monkey. Exp Brain Res 65:38 – 48.
Rolls ET, Tovee MJ (1995a) Sparseness of the neuronal representation ofstimuli in the primate temporal visual cortex. J Neurophysiol 73:713–726.
Rolls ET, Tovee MJ (1995b) The responses of single neurons in the temporalvisual cortical areas of the macaque when more than one stimulus ispresent in the receptive field. Exp Brain Res 103:409 – 420.
Rousselet GA, Thorpe SJ, Fabre-Thorpe M (2004) How parallel is visualprocessing in the ventral pathway? Trends Cogn Sci 8:363–370.
Rubin GS, Turano K (1992) Reading without saccadic eye movements. Vi-sion Res 32:895–902.
Sato T (1989) Interactions of visual stimuli in the receptive fields of inferiortemporal neurons in awake macaques. Exp Brain Res 77:23–30.
Schwartz O, Simoncelli EP (2001) Natural signal statistics and sensory gaincontrol. Nat Neurosci 4:819 – 825.
Serre T, Wolf L, Bileschi S, Riesenhuber M, Poggio T (2007a) Robust objectrecognition with cortex-like mechanisms. IEEE Trans Pattern Anal MachIntell 29:411– 426.
Serre T, Oliva A, Poggio T (2007b) A feedforward architecture accounts forrapid categorization. Proc Natl Acad Sci USA 104:6424 – 6429.
Serre T, Kouh M, Cadieu C, Knoblich U, Kreiman G, Poggio T (2005) Atheory of object recognition: computations and circuits in the feedfor-ward path of the ventral stream in primate visual cortex. CBCL Paper#259/AI Memo #2005-036. Cambridge, MA: MIT.
Sheinberg DL, Logothetis NK (2001) Noticing familiar objects in real worldscenes: the role of temporal cortical neurons in natural vision. J Neurosci21:1340 –1350.
Sugase Y, Yamane S, Ueno S, Kawano K (1999) Global and fine informationcoded by single neurons in the temporal visual cortex. Nature400:869 – 873.
Swadlow HA (2003) Fast-spike interneurons and feedforward inhibition inawake sensory neocortex. Cereb Cortex 13:25–32.
Tamura H, Kaneko H, Kawasaki K, Fujita I (2004) Presumed inhibitoryneurons in the macaque inferior temporal cortex: visual response prop-erties and functional interactions with adjacent neurons. J Neurophysiol91:2782–2796.
Tanaka K (1996) Inferotemporal cortex and object vision. Annu Rev Neu-rosci 19:109 –139.
Thorpe S, Fize D, Marlot C (1996) Speed of processing in the human visualsystem. Nature 381:520 –522.
Tovee MJ, Rolls ET, Azzopardi P (1994) Translation invariance in the re-sponses to faces of single neurons in the temporal visual cortical areas ofthe alert macaque. J Neurophysiol 72:1049 –1060.
Vinje WE, Gallant JL (2000) Sparse coding and decorrelation in primaryvisual cortex during natural vision. Science 287:1273–1276.
Wallis G, Rolls ET (1997) Invariant face and object recognition in the visualsystem. Prog Neurobiol 51:167–194.
Zoccolan D, Cox DD, DiCarlo JJ (2005) Multiple object response normal-ization in monkey inferotemporal cortex. J Neurosci 25:8150 – 8164.
Zoccolan et al. • Selectivity and Tolerance Trade off in Monkey IT J. Neurosci., November 7, 2007 • 27(45):12292–12307 • 12307