Tracking Light-Induced Electron Transfer towards O2 in a Hybrid ...
34
HAL Id: hal-03190584 https://hal.archives-ouvertes.fr/hal-03190584 Submitted on 27 Oct 2021 HAL is a multi-disciplinary open access archive for the deposit and dissemination of sci- entific research documents, whether they are pub- lished or not. The documents may come from teaching and research institutions in France or abroad, or from public or private research centers. L’archive ouverte pluridisciplinaire HAL, est destinée au dépôt et à la diffusion de documents scientifiques de niveau recherche, publiés ou non, émanant des établissements d’enseignement et de recherche français ou étrangers, des laboratoires publics ou privés. Tracking Light-Induced Electron Transfer towards O2 in a Hybrid Photoredox-Laccase System Rajaa Farran, Yasmina Mekmouche, Nhat Tam Vo, Christian Herrero, Annamaria Quaranta, Marie Sircoglou, Frédéric Banse, Pierre Rousselot-Pailley, A. Jalila Simaan, Ally Aukauloo, et al. To cite this version: Rajaa Farran, Yasmina Mekmouche, Nhat Tam Vo, Christian Herrero, Annamaria Quaranta, et al.. Tracking Light-Induced Electron Transfer towards O2 in a Hybrid Photoredox-Laccase System. iScience, Elsevier, 2021, pp.102378. 10.1016/j.isci.2021.102378. hal-03190584
-
Upload
khangminh22 -
Category
Documents
-
view
1 -
download
0
Transcript of Tracking Light-Induced Electron Transfer towards O2 in a Hybrid ...
HAL Id: hal-03190584https://hal.archives-ouvertes.fr/hal-03190584
Submitted on 27 Oct 2021
HAL is a multi-disciplinary open accessarchive for the deposit and dissemination of sci-entific research documents, whether they are pub-lished or not. The documents may come fromteaching and research institutions in France orabroad, or from public or private research centers.
L’archive ouverte pluridisciplinaire HAL, estdestinée au dépôt et à la diffusion de documentsscientifiques de niveau recherche, publiés ou non,émanant des établissements d’enseignement et derecherche français ou étrangers, des laboratoirespublics ou privés.
Tracking Light-Induced Electron Transfer towards O2 ina Hybrid Photoredox-Laccase System
Rajaa Farran, Yasmina Mekmouche, Nhat Tam Vo, Christian Herrero,Annamaria Quaranta, Marie Sircoglou, Frédéric Banse, Pierre
Rousselot-Pailley, A. Jalila Simaan, Ally Aukauloo, et al.
To cite this version:Rajaa Farran, Yasmina Mekmouche, Nhat Tam Vo, Christian Herrero, Annamaria Quaranta, etal.. Tracking Light-Induced Electron Transfer towards O2 in a Hybrid Photoredox-Laccase System.iScience, Elsevier, 2021, pp.102378. �10.1016/j.isci.2021.102378�. �hal-03190584�

llOPEN ACCESS
iScience
Article
Tracking light-induced electron transfer toward O2
in a hybrid photoredox-laccase system
Rajaa Farran,
Yasmina
Mekmouche, Nhat
Tam Vo, ..., Ally
Aukauloo, Thierry
Tron, Winfried
Leibl
HighlightsAn electron relay boosts
photoreduction of laccase
Superoxide is efficiently
captured by laccase
preventing formation of
H2O2
Light activation reveals
information on elementary
steps inside the enzyme
Laccase enables O2 as
terminal electron acceptor
for oxidative
photocatalysis
Farran et al., iScience 24,102378April 23, 2021 ª 2021 TheAuthor(s).
https://doi.org/10.1016/
j.isci.2021.102378

llOPEN ACCESS
iScience
Article
Tracking light-induced electron transfertoward O2 in a hybridphotoredox-laccase system
Rajaa Farran,1,2 Yasmina Mekmouche,3 Nhat Tam Vo,4 Christian Herrero,4 Annamaria Quaranta,1
Marie Sircoglou,4 Frederic Banse,4 Pierre Rousselot-Pailley,3 A. Jalila Simaan,3 Ally Aukauloo,1,4 Thierry Tron,3
and Winfried Leibl1,5,*
SUMMARY
Photobiocatalysis uses light to perform specific chemical transformations in a se-lective and efficient way. The intention is to couple a photoredox cycle with anenzyme performing multielectronic catalytic activities. Laccase, a robust multi-copper oxidase, can be envisioned to use dioxygen as a clean electron sinkwhen coupled to an oxidation photocatalyst. Here, we provide a detailed studyof the coupling of a [Ru(bpy)3]
2+ photosensitizer to laccase. We demonstratethat efficient laccase reduction requires an electron relay like methyl viologen.In the presence of dioxygen, electrons transiently stored in superoxide ions arescavenged by laccase to form water instead of H2O2. The net result is the photoaccumulation of highly oxidizing [Ru(bpy)3]
3+. This study provides ground for theuse of laccase in tandemwith a light-driven oxidative process and O2 as one-elec-tron transfer relay and as four-electron substrate to be a sustainable final electronacceptor in a photocatalytic process.
1Universite Paris-Saclay, CEA,CNRS, Institute forIntegrative Biology of the Cell(I2BC), 91191 Gif-sur-Yvette,France
2Lebanese InternationalUniversity, 146404 Mazraa,Beirut, Lebanon
3Aix Marseille Universite,Centrale Marseille, CNRS,iSm2 UMR 7313, 13397Marseille, France
4Universite Paris-Saclay,Institut de ChimieMoleculaire et des Materiauxd’Orsay (ICMMO), 91405Orsay, France
5Lead contact
*Correspondence:[email protected]
https://doi.org/10.1016/j.isci.2021.102378
INTRODUCTION
Electron transfer (ET) reactions are of fundamental importance in biological processes such as photosyn-
thesis and respiration (Winkler, 2005). Understanding how electrons are transported in these complex
systems may help chemists discover new tools to perform sustainable multielectronic chemical transforma-
tions. Currently, chemists and biologists are gathering their efforts to use light energy to drive enzymes to
realize both chemical oxidation and reduction reactions of high importance for our societies (Lee et al.,
2018; Litman et al., 2018; Guo et al., 2018; Schmermund et al., 2019). These targets are gaining much atten-
tion from both a fundamental and applied point of view due to the fact that to date we do not have catalytic
systems that can match the activities and specificities of the biological catalysts. Hence, discoveries in this
field may help develop sustainable chemical processes and also help in the design of more simple and
robust photocatalytic systems (Pellegrin and Odobel, 2011).
Laccases are robust enzymes used in many industrial and biotechnological processes (Mate and Alcalde,
2017; Couto and Herrera, 2006; Agrawal et al., 2018; Riva, 2006). In nature, laccases couple the oxidation
of organic substrates such as phenol derivatives, to the reduction of O2 to water (Madhavi and Lele,
2009; Tron, 2013). The catalytic mechanism of laccases has been extensively studied (Solomon et al.,
2008; Jones and Solomon, 2015; Heppner et al., 2014). At a type 1 (T1) Cu ion site the one-electron oxida-
tion of substrate molecules occurs, and electrons are sequentially transferred inside the protein to a trinu-
clear copper catalytic center (TNC) where O2 is eventually reduced in a four-electron, four-proton reaction
(Jones and Solomon, 2015; Bertrand et al., 2002). The TNC consists of a pair of coupled type 3 (T3) Cu ions
and a mononuclear type 2 (T2) Cu ion (Solomon et al., 1996; Hakulinen and Rouvinen, 2015). Although lac-
cases are active on a wide range of natural substrates including phenol, polyphenols, hydroxyindoles, and
benzenethiols among others, their oxidative power is locked by the one-electron oxidation process taking
place at the T1 site whose potential ranges from 420 to 790 mV versus NHE, thus limiting the scope for the
oxidation of organic substrates. Inspired by this biological tandem of oxidative and reductive processes
performed by MCOs we have been interested in demonstrating that we can employ O2 as the final oxidant
by coupling a photoredox cycle with a laccase. Light-induced ET from the excited state of a photosensitizer
iScience 24, 102378, April 23, 2021 ª 2021 The Author(s).This is an open access article under the CC BY license (http://creativecommons.org/licenses/by/4.0/).
1

llOPEN ACCESS
iScienceArticle
to laccase leads to the reduced enzyme and the generation of a highly oxidizing chromophore. In doing so,
we can use the reductive facet of this family of enzymes as a substitute for the problematic and unsustain-
able sacrificial electron scavengers such as persulfate or cobalt(III) ions widely used in photocatalytic multi-
electronic oxidative processes (Herrero et al., 2011). From our first studies, it appears that the effective
quantum yield for the reduction of the MCO using ruthenium(II) polypyridine-type chromophores in the
presence of a sacrificial electron donor does not exceed 1% (Simaan et al., 2011). When a porphyrin-based
chromophore is used, this yield approaches 35% (Lazarides et al., 2013) but suffers from an intrinsic low sta-
bility of the chromophore in the presence of O2. The poor efficiency observed with the ruthenium photo-
sensitizers was initially conferred to the shorter excited state lifetime of [Ru(bpy)3]2+ (600 ns) as
compared with the zinc porphyrin triplet state (720 ms). However, other factors such as energy transfer
quenching and back electron transfer might also hamper this bimolecular light-activation process.
Such pathways can hardly be assessed from measurements of overall yields under continuous illumination.
To improve the efficiency of the light-driven activation of laccase by [Ru(bpy)3]2+, we set to reinvestigate
the photophysical events occurring upon excitation of a [Ru(bpy)3]2+ chromophore and its
interaction with laccase. In the present study we show that the efficiency of light-induced electron transfer
between our synthetic photosensitizer and the laccase enzyme can be strongly enhanced, from 1% to
20%, by the introduction of methyl viologen (MV2+) as an electron relay. We track the role of methyl violo-
gen acting as an efficient oxidative quencher of the photosensitizer excited triplet state to form a
methyl viologen radical, MV,+, which efficiently reduces the laccase. We furthermore delineate the reaction
pathways under aerobic conditions, where MV,+ reacts with O2 to form superoxide radicals that are effi-
ciently scavenged by the enzyme to perform the 4-electron reduction of O2 to H2O. As a result of these
processes the powerful and long-lived oxidant [Ru(bpy)3]3+ with an oxidizing power of ca. 1300 mV versus
NHE is generated. At all stages experimental data are confronted with kinetic simulations to arrive at a
consistent description of the reaction sequence and the interactions at play between the different
components.
RESULTS AND DISCUSSION
Laccase photoreduction by [Ru(bpy)3]2+*: Marcus versus Forster
We first reinvestigated the interaction between the [Ru(bpy)3]2+ photosensitizer and the laccase enzyme.
Steady-state and time-resolved emission and absorption studies were performed on solutions containing
[Ru(bpy)3]2+ and various concentrations of laccase (LAC3 from Trametes sp. C30) in de-aerated Britton-
Robinson (B&R) buffer at pH 6. As illustrated in Figure S1 in the supplemental information, the
[Ru(bpy)3]2+ chromophore is characterized by its 450-nm metal-to-ligand charge-transfer (MLCT) band
(ε = 14,600 M�1 cm�1) (Kalyanasundaram, 1982a) with an emission band of its excited state at 610 nm,
whereas the oxidized copper(II) ion at the T1 site of the laccase displays an absorption band at
610 nm (ε = 5600 M�1 cm�1) (Solomon et al., 2004). These spectroscopic probes were used accordingly
to monitor the excited state of the photosensitizer and LAC3 photoreduction.
Time-resolved emissionmeasurements with increasing LAC3 concentrations indicate a dynamic quenching
process of the ruthenium excited state by laccase with a diffusion-limited bimolecular rate constant of 6.1
109$M�1s�1 (Figure S2). This emission quenching could be due to energy and/or electron transfer from the
sensitizer to the laccase. If all the quenching were due to ET a quantum yield of 12% of laccase reduction
(compared with the concentration of excited state formed by the laser excitation) would be expected for a
concentration of laccase of 37 mM. However, the amplitude of the measured absorption changes at long
times, i.e., after decay of the excited state (Figure 1, inset) indicates a yield for the laser-flash-induced for-
mation of the charge-separated state (CSS) of [Ru(bpy)3]3+ and reduced LAC3 (CuI) of only 0.7% (see Fig-
ure 1 for details). This yield is 17 times lower than what is expected for the products of the quenching pro-
cess, suggesting that less than 10% of the quenching reactions lead to an effective reduction of laccase
despite the high driving force for the ET from the ruthenium to the copper center T1 of –DG = 1.52 eV esti-
mated from the redox potentials (E(RuIII/RuII*) = �0.84 V; E(CuII/CuI) = 0.68 V) (Kalyanasundaram, 1982a;
Balland et al., 2008; Bock et al., 1979). These findings suggest that the major part of quenching is related
to a Forster-type energy transfer process that can be expected to be rather efficient due to the strong spec-
tral overlap between the [Ru(bpy)3]2+* emission spectrum and the absorption band of the CuII of the T1 site
(Figure S1) (Winkler, 2013). The Forster radius (R0 = 2.6 nm) calculated for this interaction implies that upon
encounter, through-space resonance energy transfer will largely outcompete ET, the rate of which is seven
orders of magnitude slower at that distance (see supplemental information, transparent methods Section
and Figure S5).
2 iScience 24, 102378, April 23, 2021

Figure 1. Laccase photoreduction by [Ru(bpy)3]2+*
Transient absorption kinetics of a solution of [Ru(bpy)3]2+ (15 mM) and LAC3 (37 mM) in argon-purged B&R buffer, pH = 6
after laser flash excitation at 455 nm. Inset: vertical zoom of the data. The absorption transient at 450 nm (red trace)
indicates formation of 9.7 mM of [Ru(bpy)3]2+* by the nanosecond laser flash decaying to a residual long-lived negative
absorption difference of 0.8 3 10�3 indicating formation of 0.063 mM of [Ru(bpy)3]3+ and thus a yield of 0.65% for
photoinduced ET. The bleaching observed at 610 nm at long times (blue trace, DA = �0.0004) indicates reduction of
0.07 mM of T1 in good agreement with the quantity of oxidized chromophore. Used extinction coefficients: DεRu*450 =
εRu*450 – εRu2+450 = �11,300 M�1 cm�1 (Muller and Brettel, 2012); DεRu3+450 = εRu3+450 – εRu2+450 = �12,600 M�1 cm�1
(Kalyanasundaram, 1982b); εT1610 = 5600 M�1 cm�1 (Solomon et al., 2004). Small contributions to absorption changes at
450 nm due to T1 reduction and at 610 nm due to Ru3+ were neglected. The dashed pink line is the scaled kinetics of
emission at 610 nm, indicating that the 610 nm absorption transient contains contribution from other species than the
excited state. Green dashed line: difference between the dashed pink line and the 610 nm emission kinetics representing
transient bleaching of T1 absorption. Bottom: residuals for best fit according to the reaction scheme described in the text
(Scheme 1) and in the supplemental information. Best fit traces are superimposed on the red and blue experimental traces
as black lines both in the main window and in the inset.
llOPEN ACCESS
iScienceArticle
Interestingly, a careful comparison of the kinetics of the emission transient at 610 nm, expected to repre-
sent the decay of the [Ru(bpy)3]2+* excited state, and the absorption transient at 610 nm reveals significant
differences in the kinetics (Figure 1, compare blue and dashed pink lines). It appears clearly that the tran-
sient absorption trace recorded at 610 nm contains, in addition to the positive absorption attributable to
the [Ru(bpy)3]2+* excited state that has a small absorption at this wavelength (Yoshimura et al., 1993), a tran-
sient bleaching that can be related to a loss of Cu2+ absorption of the T1 site. The transient bleaching at
610 nm (green dashed line in Figure 1) is well described by two exponential functions for its formation
and decay with rate constants of 107 s�1 and 2 3 106 s�1, respectively. Considering a concentration of lac-
case of 37 mM, the observed forward rate is too fast to be compatible with a diffusion-limited reaction
between the sensitizer and the laccase. This fact leads us to postulate the formation of a relatively strong
association complex between the [Ru(bpy)3]2+ chromophore and LAC3 (Ka = 4.75 mM�1; determined by
kinetic simulations described below), present in equilibrium with the separated species before and directly
after the excitation flash. Such association complexes between ruthenium polypyridine and other transition
metal complexes with blue copper proteins have been reported before (Brunschwig et al., 1985; Goldberg
and Pecht, 1976). This interaction is usually attributed to the presence of negatively charged regions on the
protein surface interacting with the positively charged metal complexes. The crystal structure of a laccase
from Trametes versicolor revealed a dominance of negative charges of the protein and the substrate bind-
ing site as a small negatively charged cavity near copper T1 (Piontek et al., 2002). However, interactions
other than electrostatic may occur (Kurzeev et al., 2009). For LAC3, molecular docking calculations predict
a proximal binding position for [Ru(bpy)3]2+ at a distance as short as 11.2 A from the Cu T1 (Robert et al.,
2017). We note that the association constant Ka = 4.75 mM�1 implies that under the conditions of the exper-
iment shown in Figure 1, 12.5% of the [Ru(bpy)3]2+ complexes (1.9 mMof 15 mMemployed) are in association
with a LAC3 protein.
iScience 24, 102378, April 23, 2021 3
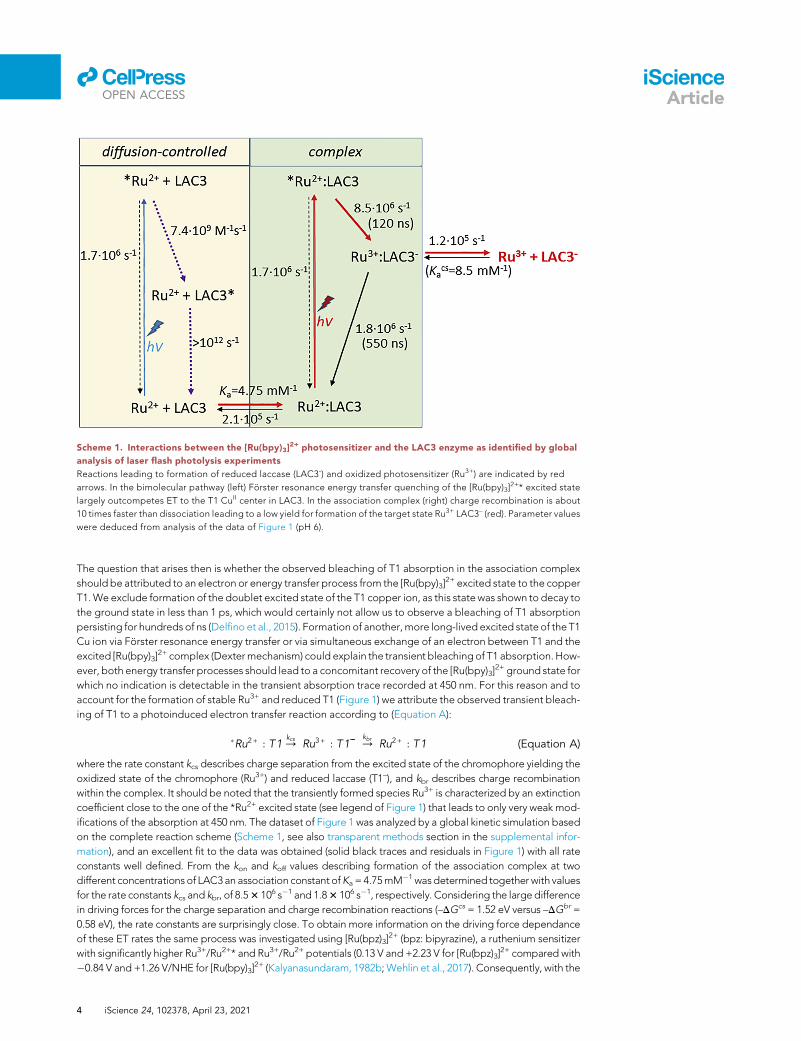
Scheme 1. Interactions between the [Ru(bpy)3]2+ photosensitizer and the LAC3 enzyme as identified by global
analysis of laser flash photolysis experiments
Reactions leading to formation of reduced laccase (LAC3-) and oxidized photosensitizer (Ru3+) are indicated by red
arrows. In the bimolecular pathway (left) Forster resonance energy transfer quenching of the [Ru(bpy)3]2+* excited state
largely outcompetes ET to the T1 CuII center in LAC3. In the association complex (right) charge recombination is about
10 times faster than dissociation leading to a low yield for formation of the target state Ru3+ LAC3– (red). Parameter values
were deduced from analysis of the data of Figure 1 (pH 6).
llOPEN ACCESS
iScienceArticle
The question that arises then is whether the observed bleaching of T1 absorption in the association complex
should be attributed to an electron or energy transfer process from the [Ru(bpy)3]2+ excited state to the copper
T1.We exclude formation of the doublet excited state of the T1 copper ion, as this statewas shown to decay to
the ground state in less than 1 ps, which would certainly not allow us to observe a bleaching of T1 absorption
persisting for hundreds of ns (Delfino et al., 2015). Formation of another,more long-lived excited state of the T1
Cu ion via Forster resonance energy transfer or via simultaneous exchange of an electron between T1 and the
excited [Ru(bpy)3]2+ complex (Dextermechanism) could explain the transient bleachingof T1 absorption.How-
ever, both energy transfer processes should lead to a concomitant recovery of the [Ru(bpy)3]2+ ground state for
which no indication is detectable in the transient absorption trace recorded at 450 nm. For this reason and to
account for the formation of stable Ru3+ and reduced T1 (Figure 1) we attribute the observed transient bleach-
ing of T1 to a photoinduced electron transfer reaction according to (Equation A):
�Ru2+ : T1/kcs
Ru3+ : T1-- /kbr
Ru2+ : T1 (Equation A)
where the rate constant kcs describes charge separation from the excited state of the chromophore yielding the
oxidized state of the chromophore (Ru3+) and reduced laccase (T1–), and kbr describes charge recombination
within the complex. It should be noted that the transiently formed species Ru3+ is characterized by an extinction
coefficient close to the one of the *Ru2+ excited state (see legend of Figure 1) that leads to only very weak mod-
ifications of the absorption at 450 nm. The dataset of Figure 1 was analyzed by a global kinetic simulation based
on the complete reaction scheme (Scheme 1, see also transparent methods section in the supplemental infor-
mation), and an excellent fit to the data was obtained (solid black traces and residuals in Figure 1) with all rate
constants well defined. From the kon and koff values describing formation of the association complex at two
different concentrations of LAC3an association constant ofKa = 4.75mM�1 wasdetermined together with values
for the rate constants kcs and kbr, of 8.53 106 s�1 and 1.83 106 s�1, respectively. Considering the large difference
in driving forces for the charge separation and charge recombination reactions (–DGcs = 1.52 eV versus –DGbr =
0.58 eV), the rate constants are surprisingly close. To obtain more information on the driving force dependance
of these ET rates the same process was investigated using [Ru(bpz)3]2+ (bpz: bipyrazine), a ruthenium sensitizer
with significantly higher Ru3+/Ru2+* and Ru3+/Ru2+ potentials (0.13 V and +2.23 V for [Ru(bpz)3]2+ compared with
�0.84 V and+1.26 V/NHE for [Ru(bpy)3]2+ (Kalyanasundaram, 1982b;Wehlin et al., 2017). Consequently, with the
4 iScience 24, 102378, April 23, 2021

llOPEN ACCESS
iScienceArticle
[Ru(bpz)3]2+ sensitizer the driving force for charge separation is about 1 eV lower than with [Ru(bpy)3]
2+, whereas
the driving force for charge recombination is increasedby the sameamount. Global kinetic simulation (Figure S3)
revealed an affinity of [Ru(bpz)3]2+ for LAC3 about 2 times lower than in the case of [Ru(bpy)3]
2+ (Ka = 2.36 mM�1
versus 4.75mM�1), implying a lower steady-state concentrationof complexes in the case of [Ru(bpz)3]2+. The rate
constants for the two ET reactions in the association complex between [Ru(bpz)3]2+ and LAC3 were determined
as kcs = 6.6 3 106 s�1and kbr = 1.2 3 106 s�1, close to the values found in the case of [Ru(bpy)3]2+.
With the known driving forces for the two reactions in eq (A) for the two sensitizers, the rates could be
analyzed in the framework of Marcus theory permitting an estimation of the reorganization energy and
distances for the ET reactions (Figure S4; see also transparent methods Section in the supplemental infor-
mation). A value of 1.05 G 0.07 eV for the reorganization energy of ET for both charge separation and
recombination can be deduced, which places the two ET reactions with high driving force in the inverted
region of the Marcus curve (Figure S4). The value for the reorganization energy is consistent with values
reported in literature for oxidation or reduction of T1 copper sites (0.6–0.8 eV) and the low internal reorga-
nization energy of the Ru2+/Ru3+ (or Ru2+*/Ru3+) transition (Di Bilio et al., 1997; Farver et al., 2004; Wijma
et al., 2007; Mines et al., 1996). Also, the distances extracted from the Marcus analysis, r = 12.5–13.5 A,
compare reasonably well with the RuII-to-T1 CuII distance of 11.2 A found by non-covalent docking simu-
lations (Robert et al., 2017). Interestingly, when the rates for charge separation and recombination were
analyzed separately (red and blue fit curves in Figure S4) the donor-acceptor distance for charge recombi-
nation was found to be 1 A larger than the distance for charge separation. Clearly additional data points on
the Marcus plot would be desirable to draw definite conclusions, but it is tempting to attribute this differ-
ence to the location of the electron transferred upon charge separation on the peripheral bipyridine ligand
in the *Ru2+ excited state in contrast to the location of the positive charge receiving the electron during
back ET on the central metal ion Ru3+. The fact that all rates determined by our global simulation can be
consistently described by Marcus theory with meaningful parameters for distances and reorganization en-
ergy further supports the proposed mechanism of electron transfer described by eq. (A).
The flash-induced energy and electron transfer reactions occurring upon excitation of [Ru(bpy)3]2+ in a so-
lution containing LAC3 are summarized in Scheme 1 and values for the case of [Ru(bpz)3]2+ are shown in
Scheme S1 in the supplemental information. It can be concluded from this investigation that diffusion-
controlled electron transfer from [Ru(bpy)3]2+* to LAC3 is short circuited by Forster energy transfer because
the latter operates over longer distances and that only excitation of a sensitizer present in a Ru:LAC3 as-
sociation complex at the time of photon absorption leads to electron transfer to the enzyme. The right-
side mechanism in Scheme 1 further predicts that the yield of effective laccase reduction is given by the
competition between the dissociation of the [Ru(bpy)3]3+:LAC3– complex described by the rate koff and
charge recombination within the complex described by the rate kbr. The association constant for the charge
separated state can be determined from the value of koff resulting from the global fit (koff = 1.2 3 105 s�1),
yielding Kacs = 8.5 mM�1. The slightly increased affinity of the sensitizer for LAC3 in the charge separated
state (Kacs = 8.5 mM�1 versus Ka = 4.75 mM�1) can be attributed to an increased electrostatic interaction
between oxidized Ru3+ and reduced laccase. The ratio of koff/(koff + kbr) then gives a yield of 6% for the
effective formation of Ru3+ and LAC3– from the charge separated state. With only 12.5% of the ruthenium
sensitizers engaged in such a complex, the overall quantum yield of persistent, not only transient, laccase
reduction (and Ru3+ formation) drops to 0.75%. Put together, these different phenomena explain well the
observed low yield of photoreduction of laccase from the excited state of the ruthenium sensitizer.
Although the simple reaction sequence proposed to occur in the association complexes (right panel of
Scheme 1) describes well the spectroscopic data, it is surprising that no energy transfer reaction from
[Ru(bpy)3]2+* to LAC3 had to be considered in the analysis. In other words, it appears that in the complex
the rate of energy transfer is slower than the rate of ET. This situation is reminiscent of a recent observation
in a flexible BODIPY-C60 dyad where photoinduced ET occurs in the folded conformer (R = 8.8 A), whereas
energy transfer is observed in extended conformers (R = 17–20 A) (Tran et al., 2020). Similarly, in studies on
single-walled carbon nanotubes tethered with porphyrins, excited-state energy transfer was found to be
absent in the sample with a short tether (Li et al., 2004). Our results therefore seem not to be a unique
case where at close distance the rate of energy transfer appears much slower than expected from the clas-
sical Forster rate-distance dependence. Although the different distance dependences between Forster en-
ergy transfer and ET (R�6 versus exponential) is expected to lead to a crossing of the k(r) curves with the rate
of electron transfer becoming faster than the rate of energy transfer for short distances, in our case this
iScience 24, 102378, April 23, 2021 5

llOPEN ACCESS
iScienceArticle
crossing occurs at too short distance to provide a simple explanation for the dominance of ET over energy
transfer (Figure S5). It might be argued that Forster energy transfer theory is an approximation based on
point dipole-dipole interaction restricted to weak coupling, valid at distances greater than R0 (dashed
green line in Figure S5), and extrapolation to significantly shorter distances might have to be taken with
care (Braslavsky et al., 2008; F}orster, 1959). However, there exist a huge body of experimental data where
the theoretical predictions hold even for quit short distances (Stryer and Haugland, 1967). We therefore
favor another explication related to the spin multiplicity in our system with a *Ru2+ triplet state and a
doublet ground state of the copper T1. Although examples of triplet-singlet and triplet-doublet energy
transfer reactions have been described (Naqvi, 1981; Cravcenco et al., 2019), the selection rules for angular
momentum conservation might result in a strong decrease of the energy transfer rates. A particularly strik-
ing example is the study by McCusker and coworkers on a model system where energy transfer was occur-
ring or inhibited as a function of the spin state of the acceptor (Guo et al., 2011). In our system, even two
orders of magnitude decrease in energy transfer rate due to the doublet spin state of the T1 Cu(II) could
have little effect at long distances (zR0) where the rate of electron transfer is slow but could be crucial
at short distances where the rate of electron transfer is fast enough to compete (Figure S5). It would be
interesting to investigate on the predominance of energy versus electron transfer in covalently linked ruthe-
nium-laccase constructs where the distance can be varied in a controlled manner.
Considering the results described above it appears clearly that an efficient reduction of laccase cannot be ob-
tained directly from the excited state of the sensitizer. In the following we assessed the possibility to overcome
these limitations by usingmethyl viologen (MV2+) as an electron relay between [Ru(bpy)3]2+* and LAC3. Systems
combining [Ru(bpy)3]2+ and MV2+ are probably the most extensively studied photoredox systems (Bock et al.,
1974; Sun et al., 1994; Mandal and Hoffman, 1984; Wilson et al., 1998). Acting as an oxidative quencher to the
photosensitizer’s excited state, this well-known mediator is converted into a long-lived reduced species that
could deliver electrons extracted from the chromophore to the enzyme even when the latter is present at
low concentration. Such an approach has helped to convey electrons to redox enzymes such as hydrogenases
under anaerobic conditions (Noji et al., 2014; Honda et al., 2016; Okura et al., 1979).
Laccase photoreduction via MV,+
To act as mediator, the chemical species to be used must meet several requirements. Besides a suitable
redox potential, it should have good solubility in aqueous solution, the oxidized form (necessarily present
in mM concentration for good dynamic quenching of the photosensitizer’s excited state) should have little
absorption in the visible to avoid absorption of excitation light, and, most importantly, the reduced mole-
cule must be able to act as a reductant for the enzyme. In contrast to many other small redox molecules
investigated as mediator, MV2+ was found fit for this duty. It offers the additional advantage that the
characteristic absorption features of its reduced state at 395 nm and 605 nm permit an easy tracking of
its reduction and reoxidation. Under anaerobic conditions, the emission of [Ru(bpy)3]2+* was quenched
by the addition of 10 mM MV2+ with a shortening of the lifetime of the excited state from 600 ns to
110 ns. The classic oxidative quenching of the [Ru(bpy)3]2+* by MV2+ involves a diffusion-limited encounter
followed by an intermolecular electron transfer process (Kalyanasundaram, 1982c; Sun et al., 1994). The
charge separated state (CSS) [Ru(bpy)3]3+ - MV,+ formed by dissociation of the encounter complex in
competition with the back ET is described by a cage escape yield of about 20% (Sun et al., 1994). The addi-
tion of LAC3 (17 mM) to the [Ru(bpy)3]2+/MV2+ mixture did not result in a significant change of the
[Ru(bpy)3]2+* excited state lifetime. This experimental observation suggests that the dominating deactiva-
tion pathway of the excited triplet state [Ru(bpy)3]2+* in the presence of both MV2+ and LAC3 is an ET pro-
cess to MV2+, which is faster than energy transfer to the laccase because of the much higher concentration
of MV2+ compared with LAC3. Transient absorption spectra were recorded at different time delays after the
laser flash (Figure S6). At 1 ms after the laser pulse, a bleaching around 450 nm and the typical positive ab-
sorption features of the MV,+ radical (395 nm and 605 nm) were observed indicating the formation of about
1 mMof the [Ru(bpy)3]3+ - MV,+ CSS by the oxidative quenching mechanism discussed above. Spectral evo-
lution up to 500 ms shows that the signature of reducedmethyl viologen disappears completely followed by
a bleaching around 610 nm, which denotes the consumption of the MV,+ radical and the loss of oxidized T1
in LAC3. These findings can be assigned to the charge shift from MV,+ to the T1 locus of the laccase while
the bleaching due to the [Ru(bpy)3]3+ species partially persists (Figure S6, red trace).
The absorption transients at specific wavelengths (Figure 2) allowed us to follow the concentration of the
different intermediate species. In the [Ru(bpy)3]2+/MV2+/LAC3 system, excitation of [Ru(bpy)3]
2+ leads to
6 iScience 24, 102378, April 23, 2021
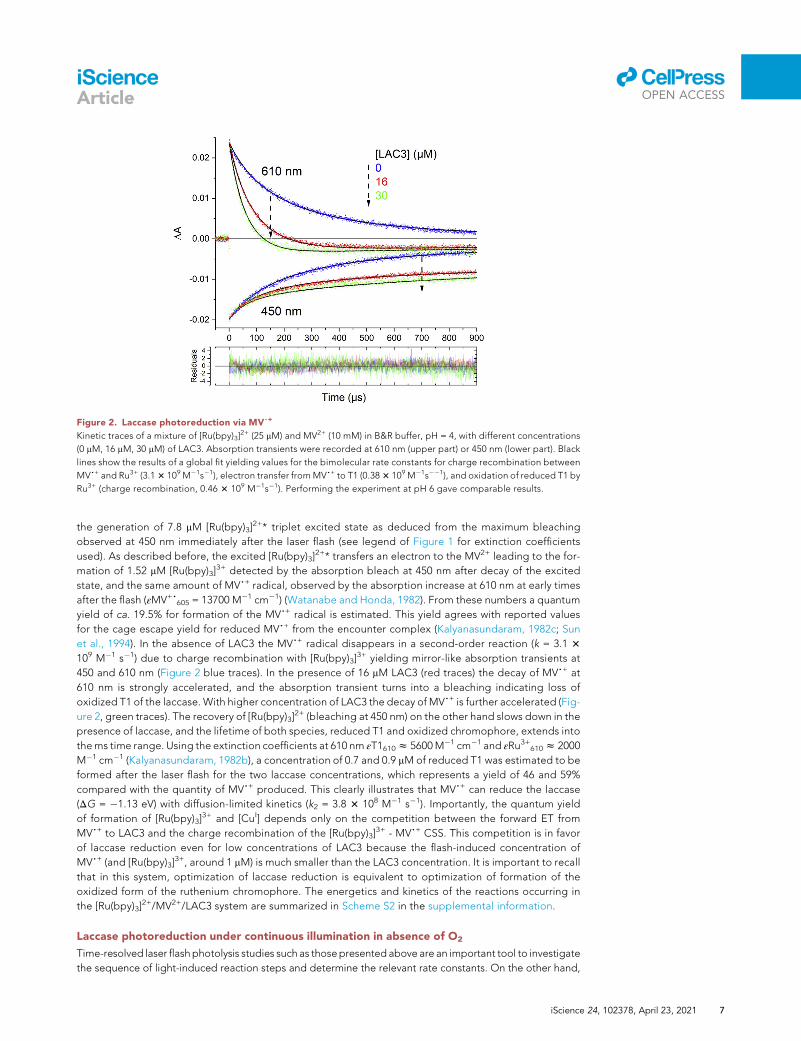
Figure 2. Laccase photoreduction via MV,+
Kinetic traces of a mixture of [Ru(bpy)3]2+ (25 mM) and MV2+ (10 mM) in B&R buffer, pH = 4, with different concentrations
(0 mM, 16 mM, 30 mM) of LAC3. Absorption transients were recorded at 610 nm (upper part) or 450 nm (lower part). Black
lines show the results of a global fit yielding values for the bimolecular rate constants for charge recombination between
MV,+ and Ru3+ (3.13 109 M�1s�1), electron transfer fromMV,+ to T1 (0.383 109 M�1s��1), and oxidation of reduced T1 by
Ru3+ (charge recombination, 0.46 3 109 M�1s�1). Performing the experiment at pH 6 gave comparable results.
llOPEN ACCESS
iScienceArticle
the generation of 7.8 mM [Ru(bpy)3]2+* triplet excited state as deduced from the maximum bleaching
observed at 450 nm immediately after the laser flash (see legend of Figure 1 for extinction coefficients
used). As described before, the excited [Ru(bpy)3]2+* transfers an electron to the MV2+ leading to the for-
mation of 1.52 mM [Ru(bpy)3]3+ detected by the absorption bleach at 450 nm after decay of the excited
state, and the same amount of MV,+ radical, observed by the absorption increase at 610 nm at early times
after the flash (εMV+,605 = 13700 M�1 cm�1) (Watanabe and Honda, 1982). From these numbers a quantum
yield of ca. 19.5% for formation of the MV,+ radical is estimated. This yield agrees with reported values
for the cage escape yield for reduced MV,+ from the encounter complex (Kalyanasundaram, 1982c; Sun
et al., 1994). In the absence of LAC3 the MV,+ radical disappears in a second-order reaction (k = 3.1 3
109 M�1 s�1) due to charge recombination with [Ru(bpy)3]3+ yielding mirror-like absorption transients at
450 and 610 nm (Figure 2 blue traces). In the presence of 16 mM LAC3 (red traces) the decay of MV,+ at
610 nm is strongly accelerated, and the absorption transient turns into a bleaching indicating loss of
oxidized T1 of the laccase. With higher concentration of LAC3 the decay of MV,+ is further accelerated (Fig-
ure 2, green traces). The recovery of [Ru(bpy)3]2+ (bleaching at 450 nm) on the other hand slows down in the
presence of laccase, and the lifetime of both species, reduced T1 and oxidized chromophore, extends into
thems time range. Using the extinction coefficients at 610 nm εT1610z 5600M�1 cm�1 and εRu3+610z 2000
M�1 cm�1 (Kalyanasundaram, 1982b), a concentration of 0.7 and 0.9 mM of reduced T1 was estimated to be
formed after the laser flash for the two laccase concentrations, which represents a yield of 46 and 59%
compared with the quantity of MV,+ produced. This clearly illustrates that MV,+ can reduce the laccase
(DG = �1.13 eV) with diffusion-limited kinetics (k2 = 3.8 3 108 M�1 s�1). Importantly, the quantum yield
of formation of [Ru(bpy)3]3+ and [CuI] depends only on the competition between the forward ET from
MV,+ to LAC3 and the charge recombination of the [Ru(bpy)3]3+ - MV,+ CSS. This competition is in favor
of laccase reduction even for low concentrations of LAC3 because the flash-induced concentration of
MV,+ (and [Ru(bpy)3]3+, around 1 mM) is much smaller than the LAC3 concentration. It is important to recall
that in this system, optimization of laccase reduction is equivalent to optimization of formation of the
oxidized form of the ruthenium chromophore. The energetics and kinetics of the reactions occurring in
the [Ru(bpy)3]2+/MV2+/LAC3 system are summarized in Scheme S2 in the supplemental information.
Laccase photoreduction under continuous illumination in absence of O2
Time-resolved laser flashphotolysis studies such as thosepresented above are an important tool to investigate
the sequence of light-induced reaction steps and determine the relevant rate constants. On the other hand,
iScience 24, 102378, April 23, 2021 7
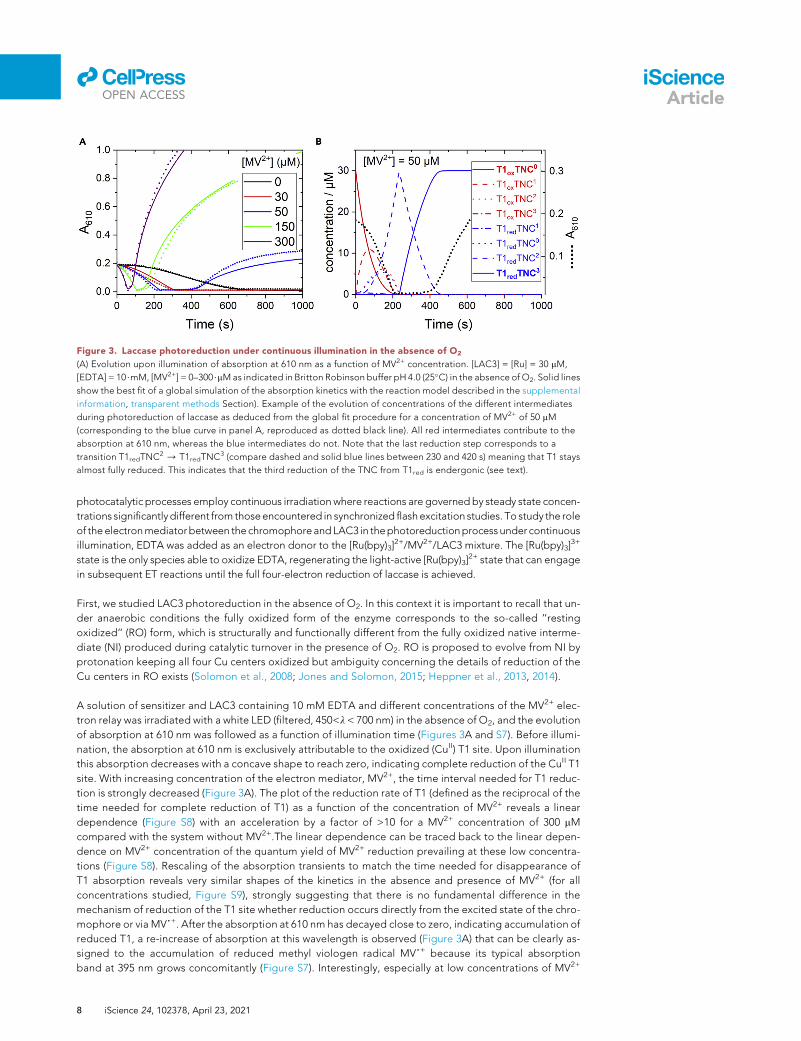
Figure 3. Laccase photoreduction under continuous illumination in the absence of O2
(A) Evolution upon illumination of absorption at 610 nm as a function of MV2+ concentration. [LAC3] = [Ru] = 30 mM,
[EDTA] = 10$mM, [MV2+] = 0–300$mMas indicated in Britton Robinson buffer pH 4.0 (25�C) in the absence of O2. Solid lines
show the best fit of a global simulation of the absorption kinetics with the reaction model described in the supplemental
information, transparent methods Section). Example of the evolution of concentrations of the different intermediates
during photoreduction of laccase as deduced from the global fit procedure for a concentration of MV2+ of 50 mM
(corresponding to the blue curve in panel A, reproduced as dotted black line). All red intermediates contribute to the
absorption at 610 nm, whereas the blue intermediates do not. Note that the last reduction step corresponds to a
transition T1redTNC2 / T1redTNC3 (compare dashed and solid blue lines between 230 and 420 s) meaning that T1 stays
almost fully reduced. This indicates that the third reduction of the TNC from T1red is endergonic (see text).
llOPEN ACCESS
iScienceArticle
photocatalytic processes employ continuous irradiationwhere reactions are governed by steady state concen-
trations significantlydifferent from thoseencountered in synchronized flashexcitation studies. To study the role
of theelectronmediatorbetween thechromophoreandLAC3 in thephotoreductionprocess under continuous
illumination, EDTA was added as an electron donor to the [Ru(bpy)3]2+/MV2+/LAC3 mixture. The [Ru(bpy)3]
3+
state is the only species able to oxidize EDTA, regenerating the light-active [Ru(bpy)3]2+ state that can engage
in subsequent ET reactions until the full four-electron reduction of laccase is achieved.
First, we studied LAC3 photoreduction in the absence of O2. In this context it is important to recall that un-
der anaerobic conditions the fully oxidized form of the enzyme corresponds to the so-called ‘‘resting
oxidized’’ (RO) form, which is structurally and functionally different from the fully oxidized native interme-
diate (NI) produced during catalytic turnover in the presence of O2. RO is proposed to evolve from NI by
protonation keeping all four Cu centers oxidized but ambiguity concerning the details of reduction of the
Cu centers in RO exists (Solomon et al., 2008; Jones and Solomon, 2015; Heppner et al., 2013, 2014).
A solution of sensitizer and LAC3 containing 10 mM EDTA and different concentrations of the MV2+ elec-
tron relay was irradiated with a white LED (filtered, 450<l < 700 nm) in the absence of O2, and the evolution
of absorption at 610 nm was followed as a function of illumination time (Figures 3A and S7). Before illumi-
nation, the absorption at 610 nm is exclusively attributable to the oxidized (CuII) T1 site. Upon illumination
this absorption decreases with a concave shape to reach zero, indicating complete reduction of the CuII T1
site. With increasing concentration of the electron mediator, MV2+, the time interval needed for T1 reduc-
tion is strongly decreased (Figure 3A). The plot of the reduction rate of T1 (defined as the reciprocal of the
time needed for complete reduction of T1) as a function of the concentration of MV2+ reveals a linear
dependence (Figure S8) with an acceleration by a factor of >10 for a MV2+ concentration of 300 mM
compared with the system without MV2+.The linear dependence can be traced back to the linear depen-
dence on MV2+ concentration of the quantum yield of MV2+ reduction prevailing at these low concentra-
tions (Figure S8). Rescaling of the absorption transients to match the time needed for disappearance of
T1 absorption reveals very similar shapes of the kinetics in the absence and presence of MV2+ (for all
concentrations studied, Figure S9), strongly suggesting that there is no fundamental difference in the
mechanism of reduction of the T1 site whether reduction occurs directly from the excited state of the chro-
mophore or via MV,+. After the absorption at 610 nm has decayed close to zero, indicating accumulation of
reduced T1, a re-increase of absorption at this wavelength is observed (Figure 3A) that can be clearly as-
signed to the accumulation of reduced methyl viologen radical MV,+ because its typical absorption
band at 395 nm grows concomitantly (Figure S7). Interestingly, especially at low concentrations of MV2+
8 iScience 24, 102378, April 23, 2021
llOPEN ACCESS
iScienceArticle
we noted a lag time between complete T1 reduction and the start of accumulation of MV,+ (Figures 3A and
S7 right). As observed for the reduction of T1, this time is shorter for higher concentrations of MV2+. It
seems reasonable to attribute this delay to the time needed for the total reduction of laccase (four reducing
equivalents). The fact that noMV,+ radical is detectable before complete laccase reduction implies that the
rate of generation of theMV,+ radical species by the excited sensitizer is slower than its consumption by the
laccase enzyme. To put numbers to this, at the highest MV2+ concentration a rate of formation of MV,+ of
2 mM/s is estimated. This means that with the employed concentration of LAC3 (30 mM) themaximum rate of
photoreduction of LAC3 is < 0.067 s�1.
To investigate the observed kinetics, we performed a global simulation of the absorption changes re-
corded with different concentrations of MV2+ (Figure 3). The presence of four different reduction states
of the laccase that can interact with two potential electron donors, [Ru(bpy)3]2+* or MV,+, makes the system
rather inimical to analyze and requires some simplifying assumptions. First, it seems sound to assume that
electron input into the LAC3 from either [Ru(bpy)3]2+* or MV,+ occurs via the T1 site (as supported by the
laser flash data, at least for the first reduction). Furthermore, we neglect the details of reactions occurring
within association complexes between [Ru(bpy)3]2+ and LAC3 and modeled laccase reduction from the
sensitizer’s excited state by a low-yield process. With these simplifications and because many rate con-
stants are reasonably well known from kinetic flash photolysis measurements and are independent of
MV2+ concentration, a reasonable fit to the experimental data could be obtained, which reproduces the
major features of the photoreduction assay with a common set of parameters (solid lines in Figure 3A).
With this model in hand, we can now investigate the critical parameters with the aim to extract information
on the mechanism governing the photoreduction of laccase and to determinate the rate constants for the
reactions describing internal electron transfer (IET) from T1 to the TNC center. In the following we will pre-
sent only the major results; details of the analysis are given in the transparent methods section in the sup-
plemental information.
We use the nomenclature of Sekretaryova et al. (Sekretaryova et al., 2019) to describe the redox states of
laccase from fully oxidized (T1oxTNC0) to the fully reduced form (T1redTNC3; with TNCx, x = number of elec-
trons on the TNC). The initial absorption decrease at 610 nm describes the loss of absorption from oxidized
T1 and corresponds to the consumption of three electrons, leading to reduced T1 and doubly reduced
TNC (T1redTNC2, dashed blue trace in Figure 3B). The first two IET steps from T1 to TNC, leading to the
formation of T1redTNC2, are fast compared with the photoproduction of MV,+, which is the rate limiting
step. Accordingly, the analysis was found to be not sensitive to the rates of forward electron transfer
from T1 to the TNC, provided they are faster than about 0.1 s�1. We assumed for the fits rate constants
of 1 s�1 as found in a pulse radiolysis study (Farver et al., 2011). The lag time following reduction of T1 cor-
responds to the uptake by the laccase of the fourth electron leading to full reduction of the enzyme
(T1redTNC3, solid blue line in Figure 3B). As can be seen in the profiles of the intermediates, this last reduc-
tion step corresponds to the transition T1redTNC2 / T1redTNC3 (compare dashed and solid blue lines be-
tween 230 and 420 s) meaning that T1 stays almost fully reduced during the process although T1 is the
entrance side for the electron. In fact, the kinetic parameters determined from the global fit clearly show
that the third reduction of the TNC from T1red is significantly endergonic (k+/k- z 1/4500; DG z +200
meV), in contrast to the first two IET steps that are close to equilibrium (Scheme 3). Because during catalytic
turnover all internal electron transfer steps leading to full reduction of the oxidized native intermediate (NI)
are fast, even in high-potential laccases as LAC3 used in our study,(Sekretaryova et al., 2019; Heppner et al.,
2014; Solomon et al., 1996), we attribute this sluggish third-electron reduction of the TNC to the fact that
under the anaerobic conditions of this experiment the oxidized enzyme is not in its native intermediate
form but in the resting oxidized (RO) state well described in the literature (Tollin et al., 1993). The charac-
teristics of internal electron transfer deduced from our experiment are in agreement with results from pulse
radiolysis and direct electrochemical measurements reporting a potential of the T2 Cu site in the RO state
of around 400 mV versus NHE, i.e. about 300 mV lower than the potentials of T1 and T3 (Farver et al., 2011;
Shleev et al., 2005). Although there is ‘‘insufficient driving force’’ for ET from reduced T1 to T2, our results
show that electron transfer occurs because the overall energetics is still favorable due to the low potential
of the MV,+ ‘‘substrate.’’ The possibility of uphill intramolecular electron transfer under certain conditions
had also been proposed based on electrochemical and quantum chemical studies (Shleev et al., 2012).
Furthermore, our conclusions fit with observations of Lazarides et al. on laccase photoreduction by a
porphyrin chromophore in presence of EDTA where it was found that the ESR signal of the T1 Cu(II) site
disappeared much faster (30 s) than the signal of the T2 Cu(II) species (30 min) (Lazarides et al., 2013). It
iScience 24, 102378, April 23, 2021 9

llOPEN ACCESS
iScienceArticle
appears that monitoring the accumulation of the reduced MV,+ radical is an indirect but valuable tool to
obtain information about IET events within the laccase enzyme, complementing measurements of absorp-
tion changes related to the oxidation state of T1, which are the only observables in the absence of MV2+.
Interestingly, the consistent analysis performed on this set of experiments, i.e., laccase photoreduction in
the absence and the presence of MV2+, reveals that in the absence of MV2+, where laccase reduction occurs
via the excited state of the chromophore, the enzyme is only reduced by three electrons (Figure S10). The
reason for this is the unfavorable pre-equilibrium resulting from the endergonic nature of the third reduc-
tion of the TNC, which makes the IET T1redTNC2 / T1oxTNC3 too slow to be compatible with the short
lifetime of the [Ru(bpy)3]2+* excited state. In contrast, the MV,+ species is long-lived and can progressively
reduce the state T1oxTNC3 present at low concentration in the above-mentioned equilibrium with
T1redTNC2 to form T1redTNC3. Of note, in the presence of dioxygen where all internal electron transfer
steps are nearly isoenergetic, the complete, four-electron reduction of laccase via [Ru(bpy)3]2+* is possible.
Finally, to obtain a satisfactory global fit of the absorption transients describing accumulation of MV,+ after
full, four-electron reduction of the enzyme (Figure 3A), we had to include in the simulation a feature that
accounts for a lack of the quantity of MV,+ accumulating (reaction A15 in the supplemental information,
transparent methods Section). The missing quantity, most clearly visible in the traces for low concentration
of MV2+ (see Figure S9), corresponds roughly to the quantity of enzyme present (30 mM). We therefore
tentatively attribute this feature to the formation of adducts of MV2+, with the enzyme being most efficient
when LAC3 becomes fully reduced. The ‘‘bound’’ MV2+ might still be reducible by [Ru(bpy)3]2+* but the
dissociation rate for MV,+ or Ru3+ from the Ru3+:MV,+:LAC3 complex might be too low to avoid charge
recombination between MV,+ and Ru3+.
Dioxygen consumption
With the finding that the presence of an electron mediator helps transferring electrons faster and more
efficiently to the LAC3, we then performed a set of dioxygen consumption experiments to characterize
the catalytic activity of the laccase when reduced by a sensitizer/electron mediator/electron donor
photoredox system. Under these aerobic conditions, O2 competes with the laccase for the electron
from the MV,+ species as it is well known that in aqueous solution MV,+ reacts rapidly with O2 to
form O2,– (or O2H
, at our operating pH) (Farrington et al., 1973). This competition between laccase
and O2 is clearly evident from transient absorption measurements revealing a markedly reduced effi-
ciency of flash-induced T1 reduction with increasing amounts of O2 (Figure S11). Surprisingly though,
when light-induced dioxygen consumption was measured with a Clark electrode, the effect of laccase
was much stronger than expected from this simple competition scheme. Figure 4 shows the rate of
O2 consumption as a function of LAC3 concentration in the absence and presence (250 mM) of MV2+.
In the absence of MV2+, the rate increases linearly with the concentration of LAC3, a behavior easily ex-
plained by an increased reduction of laccase from the excited state of the chromophore due to increased
formation of association complexes (see above). When MV2+ is present, but no laccase, a fast dioxygen
consumption rate is observed, which corresponds to the two-electron reduction of O2 to H2O2 via dis-
mutation of O2,– (eqs. B and D, Figure 5 red trace). Addition of LAC3 at a concentration much lower
than O2 (10–20 mM of LAC3 compared with 250 mM O2) leads to a very significant reduction of the dioxy-
gen consumption rate (Figure 4, black curve; Figure 5 blue trace).
MV,+ + O2 / MV2+ + O2,–
(B)4 MV,+ + 4 CuII / 4 MV2+ + 4 CuI
(C)2 O2,– + 2 H+ / O2 + H2O2
(D)4 O2,– + 4 CuII / 4 O2 + 4 CuI
(E)4 CuI + O2 + 4H+ / 4 CuII + 2 H2O
(F)10 iScience 24, 102378, April 23, 2021

Figure 4. Rate of light-induced dioxygen consumption as a function of laccase concentration
[Ru] = 30$mM, [EDTA] = 10$mM, [MV2+] = 0 or 250$mM, [LAC3] = 0–81$mM in Britton Robinson buffer pH 4.0 (25�C). Initialdissolved oxygen concentration was 250 mM.
llOPEN ACCESS
iScienceArticle
2 MV,+ + O2 + 2 H+ / 2 MV2+ + H2O2 (B)+(D)
4 MV,+ + O2 + 4H+ / 4 MV2+ + 2 H2O (C)+(F) or 4x(B)+(E)+(F)
When laccase accepts electrons, a four-electron/four-proton total reduction of O2 is performed by the
enzyme (eqs. C and F) in addition to the two-electron/two-proton partial direct reduction of O2 to H2O2
(eqs. B and D). A substantial addition of an enzyme consuming half as much O2 for the same concentration
of photogenerated MV,+ could thus show up in the dioxygen consumption curve as a decrease in the di-
oxygen consumption rate compared with MV2+ alone. Therefore, the pattern in Figure 4 can be explained
by a competitive scheme where O2 is being progressively substituted by LAC3 as electron recipient from
MV,+ because the two paths distinctively produce end products, either H2O2 or H2O (Scheme 2). When
enough laccase is present to compete with O2 for electrons from MV,+ the rate increases and reaches a
saturation value given by the light intensity and efficiency of the sacrificial electron donor. However, the
effect of laccase on the rate of O2 consumption at laccase concentrations much lower than the concentra-
tion of dissolved O2 (250 mM) is surprisingly pronounced. This suggests that laccase reduction is more effi-
cient than expected from a simple competition between laccase and O2 for electrons from MV,+ as
observed in Figure S11. We therefore propose that laccase can be reduced not only by MV,+ but also
and quite significantly by the O2,– formed via electron transfer from MV,+ to O2 (eq. 4xB, E). Analysis of
the O2 consumption kinetics in the absence and presence of laccase (Figures 5 and S12) supports the inter-
pretation that it is indeed O2,– that is the dominant reductant for the laccase under these conditions. Lac-
case reduction by O2,– had also been reported based on pulse-radiolysis studies (Guissani et al., 1982;
(Pecht et al., 1977)). The two processes (eqs. (C)+(F) or 4x(B)+(E)+(F)) should then significantly prevent an
accumulation of H2O2. As a matter of fact, H2O2 concentration dropped dramatically as laccase was intro-
duced in dioxygen consumption experiments (Figure S14). The reaction sequence for photoreduction of
laccase under aerobic conditions is summarized in Scheme 2.
However, if O2,– can replace MV,+ for reduction of LAC3 as suggested by the O2 consumption experi-
ments, then the question arises why is the bleaching of T1 absorption, as detected in the laser flash
experiment (Figure S11), strongly reduced in the presence of O2? To answer this question, we performed
a global kinetic analysis of the oxygen consumption profile in the absence and presence of laccase (Fig-
ure 5). It is interesting to note that a first analysis of the O2 consumption kinetics (see Figure S12 and
transparent methods Section in the supplemental information) supports a slow reaction of superoxide
with LAC3 with a rate not exceeding 5 3 106 M�1s�1 (yielding a time constant of >1 ms for a concentra-
tion of O2 of 250 mM), about two orders of magnitude slower than the rate of laccase reduction by MV+,
iScience 24, 102378, April 23, 2021 11
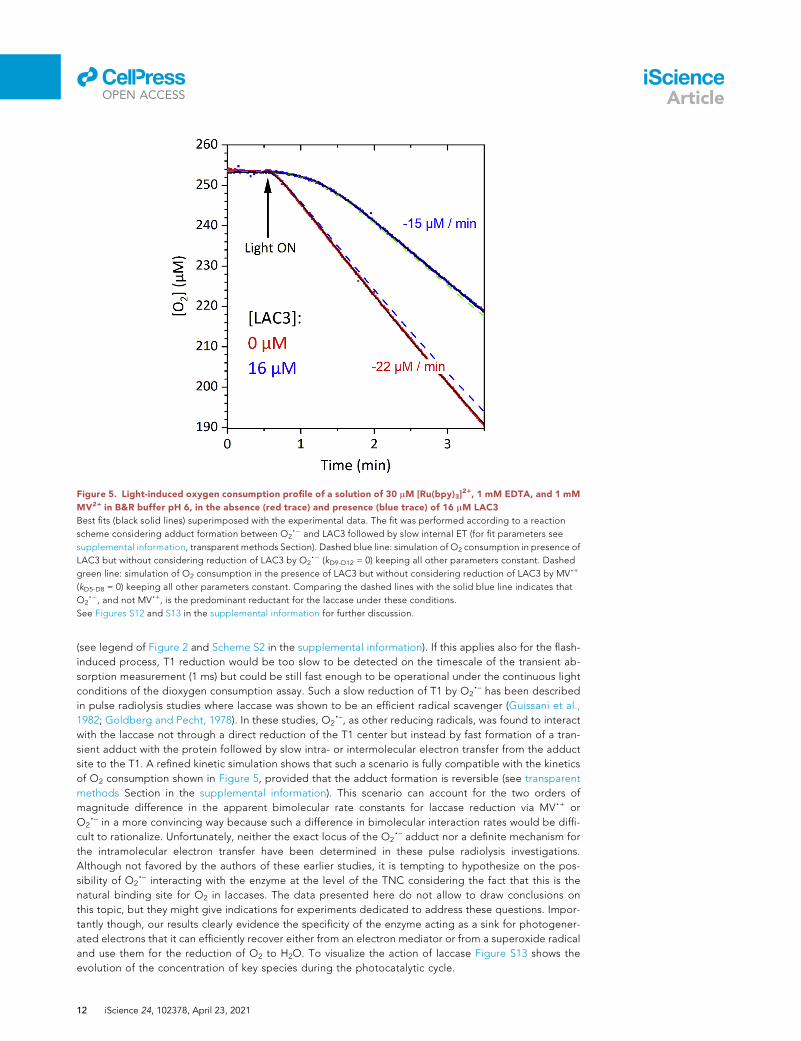
Figure 5. Light-induced oxygen consumption profile of a solution of 30 mM [Ru(bpy)3]2+, 1 mM EDTA, and 1 mM
MV2+ in B&R buffer pH 6, in the absence (red trace) and presence (blue trace) of 16 mM LAC3
Best fits (black solid lines) superimposed with the experimental data. The fit was performed according to a reaction
scheme considering adduct formation between O2,� and LAC3 followed by slow internal ET (for fit parameters see
supplemental information, transparent methods Section). Dashed blue line: simulation of O2 consumption in presence of
LAC3 but without considering reduction of LAC3 by O2,� (kD9-D12 = 0) keeping all other parameters constant. Dashed
green line: simulation of O2 consumption in the presence of LAC3 but without considering reduction of LAC3 by MV,+
(kD5-D8 = 0) keeping all other parameters constant. Comparing the dashed lines with the solid blue line indicates that
O2,�, and not MV,+, is the predominant reductant for the laccase under these conditions.
See Figures S12 and S13 in the supplemental information for further discussion.
llOPEN ACCESS
iScienceArticle
(see legend of Figure 2 and Scheme S2 in the supplemental information). If this applies also for the flash-
induced process, T1 reduction would be too slow to be detected on the timescale of the transient ab-
sorption measurement (1 ms) but could be still fast enough to be operational under the continuous light
conditions of the dioxygen consumption assay. Such a slow reduction of T1 by O2,– has been described
in pulse radiolysis studies where laccase was shown to be an efficient radical scavenger (Guissani et al.,
1982; Goldberg and Pecht, 1978). In these studies, O2,–, as other reducing radicals, was found to interact
with the laccase not through a direct reduction of the T1 center but instead by fast formation of a tran-
sient adduct with the protein followed by slow intra- or intermolecular electron transfer from the adduct
site to the T1. A refined kinetic simulation shows that such a scenario is fully compatible with the kinetics
of O2 consumption shown in Figure 5, provided that the adduct formation is reversible (see transparent
methods Section in the supplemental information). This scenario can account for the two orders of
magnitude difference in the apparent bimolecular rate constants for laccase reduction via MV,+ or
O2,– in a more convincing way because such a difference in bimolecular interaction rates would be diffi-
cult to rationalize. Unfortunately, neither the exact locus of the O2,– adduct nor a definite mechanism for
the intramolecular electron transfer have been determined in these pulse radiolysis investigations.
Although not favored by the authors of these earlier studies, it is tempting to hypothesize on the pos-
sibility of O2,– interacting with the enzyme at the level of the TNC considering the fact that this is the
natural binding site for O2 in laccases. The data presented here do not allow to draw conclusions on
this topic, but they might give indications for experiments dedicated to address these questions. Impor-
tantly though, our results clearly evidence the specificity of the enzyme acting as a sink for photogener-
ated electrons that it can efficiently recover either from an electron mediator or from a superoxide radical
and use them for the reduction of O2 to H2O. To visualize the action of laccase Figure S13 shows the
evolution of the concentration of key species during the photocatalytic cycle.
12 iScience 24, 102378, April 23, 2021
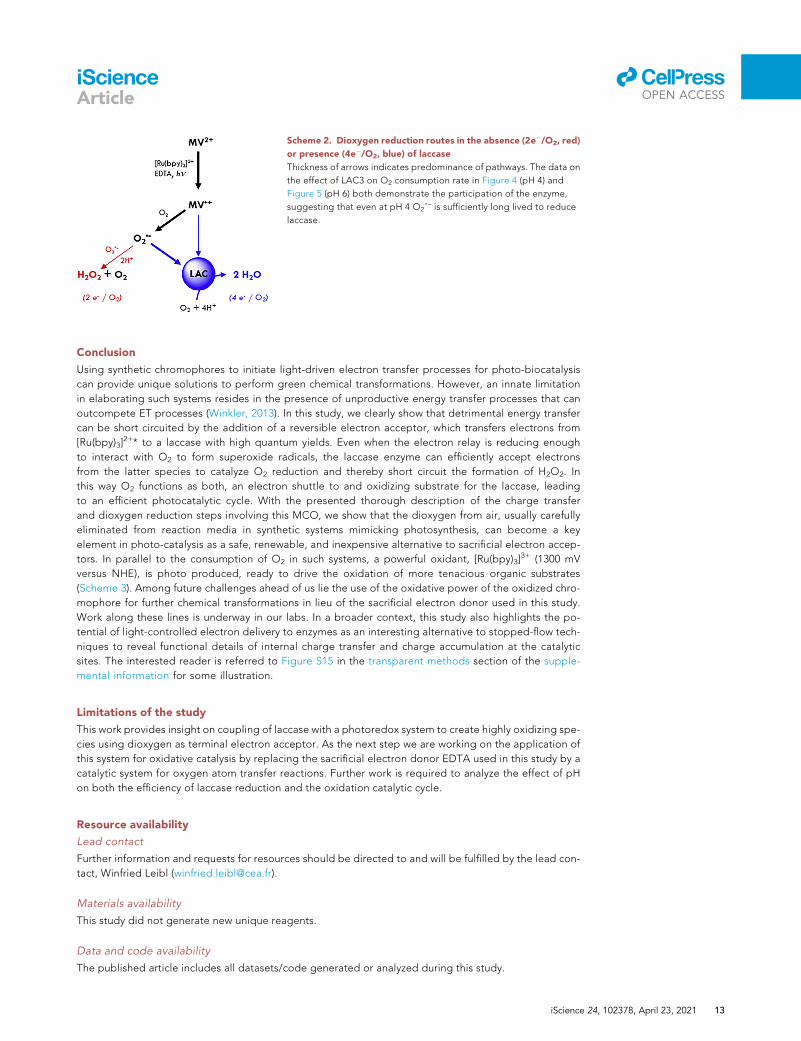
Scheme 2. Dioxygen reduction routes in the absence (2e�/O2, red)
or presence (4e�/O2, blue) of laccase
Thickness of arrows indicates predominance of pathways. The data on
the effect of LAC3 on O2 consumption rate in Figure 4 (pH 4) and
Figure 5 (pH 6) both demonstrate the participation of the enzyme,
suggesting that even at pH 4 O2,– is sufficiently long lived to reduce
laccase.
llOPEN ACCESS
iScienceArticle
Conclusion
Using synthetic chromophores to initiate light-driven electron transfer processes for photo-biocatalysis
can provide unique solutions to perform green chemical transformations. However, an innate limitation
in elaborating such systems resides in the presence of unproductive energy transfer processes that can
outcompete ET processes (Winkler, 2013). In this study, we clearly show that detrimental energy transfer
can be short circuited by the addition of a reversible electron acceptor, which transfers electrons from
[Ru(bpy)3]2+* to a laccase with high quantum yields. Even when the electron relay is reducing enough
to interact with O2 to form superoxide radicals, the laccase enzyme can efficiently accept electrons
from the latter species to catalyze O2 reduction and thereby short circuit the formation of H2O2. In
this way O2 functions as both, an electron shuttle to and oxidizing substrate for the laccase, leading
to an efficient photocatalytic cycle. With the presented thorough description of the charge transfer
and dioxygen reduction steps involving this MCO, we show that the dioxygen from air, usually carefully
eliminated from reaction media in synthetic systems mimicking photosynthesis, can become a key
element in photo-catalysis as a safe, renewable, and inexpensive alternative to sacrificial electron accep-
tors. In parallel to the consumption of O2 in such systems, a powerful oxidant, [Ru(bpy)3]3+ (1300 mV
versus NHE), is photo produced, ready to drive the oxidation of more tenacious organic substrates
(Scheme 3). Among future challenges ahead of us lie the use of the oxidative power of the oxidized chro-
mophore for further chemical transformations in lieu of the sacrificial electron donor used in this study.
Work along these lines is underway in our labs. In a broader context, this study also highlights the po-
tential of light-controlled electron delivery to enzymes as an interesting alternative to stopped-flow tech-
niques to reveal functional details of internal charge transfer and charge accumulation at the catalytic
sites. The interested reader is referred to Figure S15 in the transparent methods section of the supple-
mental information for some illustration.
Limitations of the study
This work provides insight on coupling of laccase with a photoredox system to create highly oxidizing spe-
cies using dioxygen as terminal electron acceptor. As the next step we are working on the application of
this system for oxidative catalysis by replacing the sacrificial electron donor EDTA used in this study by a
catalytic system for oxygen atom transfer reactions. Further work is required to analyze the effect of pH
on both the efficiency of laccase reduction and the oxidation catalytic cycle.
Resource availability
Lead contact
Further information and requests for resources should be directed to and will be fulfilled by the lead con-
tact, Winfried Leibl ([email protected]).
Materials availability
This study did not generate new unique reagents.
Data and code availability
The published article includes all datasets/code generated or analyzed during this study.
iScience 24, 102378, April 23, 2021 13
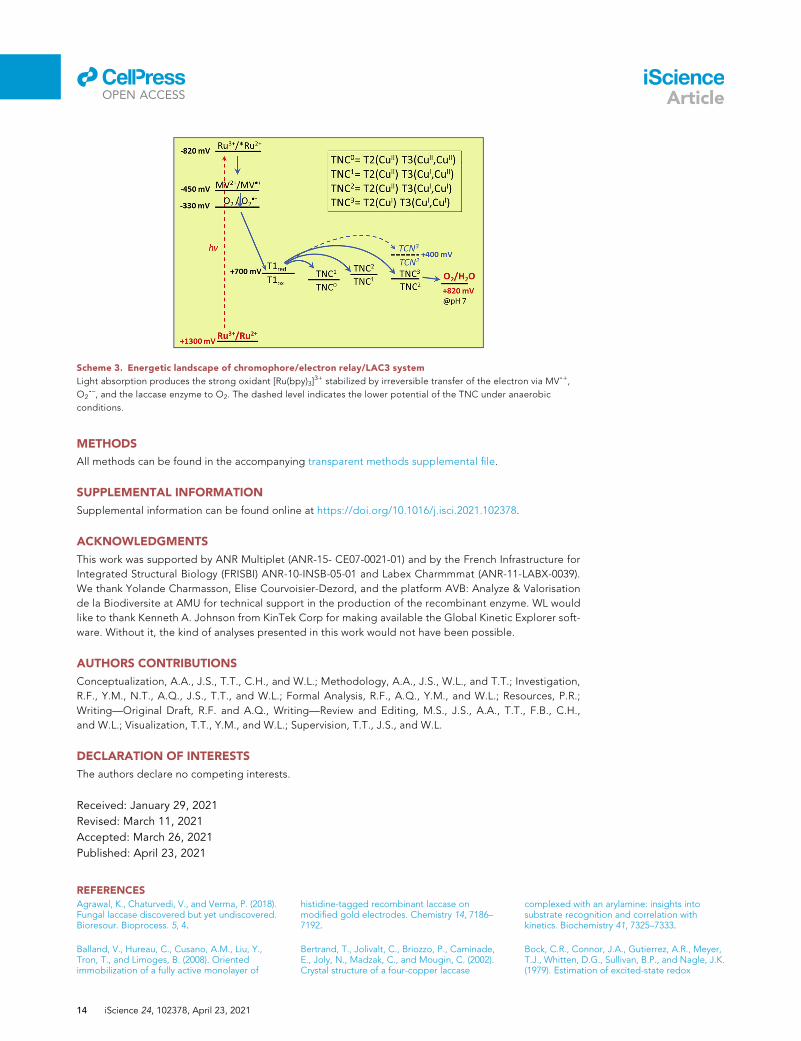
Scheme 3. Energetic landscape of chromophore/electron relay/LAC3 system
Light absorption produces the strong oxidant [Ru(bpy)3]3+ stabilized by irreversible transfer of the electron via MV,+,
O2,–, and the laccase enzyme to O2. The dashed level indicates the lower potential of the TNC under anaerobic
conditions.
llOPEN ACCESS
iScienceArticle
METHODS
All methods can be found in the accompanying transparent methods supplemental file.
SUPPLEMENTAL INFORMATION
Supplemental information can be found online at https://doi.org/10.1016/j.isci.2021.102378.
ACKNOWLEDGMENTS
This work was supported by ANR Multiplet (ANR-15- CE07-0021-01) and by the French Infrastructure for
Integrated Structural Biology (FRISBI) ANR-10-INSB-05-01 and Labex Charmmmat (ANR-11-LABX-0039).
We thank Yolande Charmasson, Elise Courvoisier-Dezord, and the platform AVB: Analyze & Valorisation
de la Biodiversite at AMU for technical support in the production of the recombinant enzyme. WL would
like to thank Kenneth A. Johnson from KinTek Corp for making available the Global Kinetic Explorer soft-
ware. Without it, the kind of analyses presented in this work would not have been possible.
AUTHORS CONTRIBUTIONS
Conceptualization, A.A., J.S., T.T., C.H., and W.L.; Methodology, A.A., J.S., W.L., and T.T.; Investigation,
R.F., Y.M., N.T., A.Q., J.S., T.T., and W.L.; Formal Analysis, R.F., A.Q., Y.M., and W.L.; Resources, P.R.;
Writing—Original Draft, R.F. and A.Q., Writing—Review and Editing, M.S., J.S., A.A., T.T., F.B., C.H.,
and W.L.; Visualization, T.T., Y.M., and W.L.; Supervision, T.T., J.S., and W.L.
DECLARATION OF INTERESTS
The authors declare no competing interests.
Received: January 29, 2021
Revised: March 11, 2021
Accepted: March 26, 2021
Published: April 23, 2021
REFERENCES
Agrawal, K., Chaturvedi, V., and Verma, P. (2018).Fungal laccase discovered but yet undiscovered.Bioresour. Bioprocess. 5, 4.Balland, V., Hureau, C., Cusano, A.M., Liu, Y.,Tron, T., and Limoges, B. (2008). Orientedimmobilization of a fully active monolayer of
14 iScience 24, 102378, April 23, 2021
histidine-tagged recombinant laccase onmodified gold electrodes. Chemistry 14, 7186–7192.
Bertrand, T., Jolivalt, C., Briozzo, P., Caminade,E., Joly, N., Madzak, C., and Mougin, C. (2002).Crystal structure of a four-copper laccase
complexed with an arylamine: insights intosubstrate recognition and correlation withkinetics. Biochemistry 41, 7325–7333.
Bock, C.R., Connor, J.A., Gutierrez, A.R., Meyer,T.J., Whitten, D.G., Sullivan, B.P., and Nagle, J.K.(1979). Estimation of excited-state redox
llOPEN ACCESS
iScienceArticle
potentials by electron-transfer quenching.Application of electron-transfer theory toexcited-state redox processes. J. Am. Chem. Soc.101, 4815–4824.
Bock, C.R., Meyer, T.J., and Whitten, D.G. (1974).Electron-transfer quenching of luminescentexcited-state of Tris(2,2’-Bipyridine)Ruthenium(Ii)- flash-photolysis relaxation technique formeasuring rates of very rapid electron-transferreactions. J. Am. Chem. Soc. 96, 4710–4712.
Braslavsky, S.E., Fron, E., Rodriguez, H.B., Roman,E.S., Scholes, G.D., Schweitzer, G., Valeur, B., andWirz, J. (2008). Pitfalls and limitations in thepractical use of Forster’s theory of resonanceenergy transfer. Photochem. Photobiol. Sci. 7,1444–1448.
Brunschwig, B.S., Delaive, P.J., English, A.M.,Goldberg, M., Gray, H.B., Mayo, S.L., and Sutin,N. (1985). Kinetics and mechanisms of electrontransfer between blue copper proteins andelectronically excited chromium and rutheniumpolypyridine complexes. Inorg. Chem. 24, 3743–3749.
Couto, S.R., and Herrera, J.L.T. (2006). Industrialand biotechnological applications of laccases: areview. Biotechnol. Adv. 24, 500–513.
Cravcenco, A., Hertzog, M., Ye, C., Iqbal, M.N.,Mueller, U., Eriksson, L., and Borjesson, K. (2019).Multiplicity conversion based on intramoleculartriplet-to-singlet energy transfer. Sci. Adv. 5,eaaw5978.
Delfino, I., Viola, D., Cerullo, G., and Lepore, M.(2015). Ultrafast excited-state charge-transferdynamics in laccase type I copper site. Biophys.Chem. 200-201, 41–47.
Di Bilio, A.J., Hill, M.G., Bonander, N., Karlsson,B.G., Villahermosa, R.M., Malmstrom, B.G.,Winkler, J.R., and Gray, H.B. (1997).Reorganization energy of blue Copper: effects oftemperature and driving force on the rates ofelectron transfer in ruthenium- and osmium-modified azurins. J. Am. Chem. Soc. 119, 9921–9922.
Farrington, J.A., Ebert, M., Land, E.J., andFletcher, K. (1973). Bipyridylium quaternary saltsand related compounds. V. Pulse radiolysisstudies of the reaction of paraquat radical withoxygen. Implications for the mode of action ofbipyridyl herbicides. Biochim. Biophys. Acta 314,372–381.
Farver, O., Eady, R.R., and Pecht, I. (2004).Reorganization energies of the individual coppercenters in dissimilatory nitrite Reductases:modulation and control of internal electrontransfer. J. Phys. Chem. A 108, 9005–9007.
Farver, O., Wherland, S., Koroleva, O., Loginov,D.S., and Pecht, I. (2011). Intramolecular electrontransfer in laccases. FEBS J. 278, 3463–3471.
F}orster, T. (1959). 10th Spiers Memorial Lecture.Transfer mechanisms of electronic excitation.Discuss. Faraday Soc. 27, 7–17.
Goldberg, M., and Pecht, I. (1976). Kinetics andequilibria of the electron transfer between azurinand the hexacyanoiron (II/III) couple.Biochemistry 15, 4197–4208.
Goldberg, M., and Pecht, I. (1978). The reaction of"blue" copper oxidases with O2: a pulseradiolysis study. Biophysical J. 24, 371–373.
Guissani, A., Henry, Y., and Gilles, L. (1982).Radical scavenging and electron-transferreactions in Polyporus versicolor laccase a pulseradiolysis study. Biophys. Chem. 15, 177–190.
Guo, D., Knight, T.E., and Mccusker, J.K. (2011).Angular momentum conservation in dipolarenergy transfer. Science 334, 1684–1687.
Guo, X., Okamoto, Y., Schreier, M.R., Ward, T.R.,and Wenger, O.S. (2018). Enantioselectivesynthesis of amines by combining photoredoxand enzymatic catalysis in a cyclic reactionnetwork. Chem. Sci. 9, 5052–5056.
Hakulinen, N., and Rouvinen, J. (2015). Three-dimensional structures of laccases. Cell. Mol. LifeSci. 72, 857–868.
Heppner, D.E., Kjaergaard, C.H., and Solomon,E.I. (2013). Molecular origin of rapid versus slowintramolecular electron transfer in the catalyticcycle of the multicopper oxidases. J. Am. Chem.Soc. 135, 12212–12215.
Heppner, D.E., Kjaergaard, C.H., and Solomon,E.I. (2014). Mechanism of the reduction of thenative intermediate in the multicopper oxidases:insights into rapid intramolecular electrontransfer in turnover. J. Am. Chem. Soc. 136,17788–17801.
Herrero, C., Quaranta, A., Leibl, W., Rutherford,A.W., and Aukauloo, A. (2011). Artificialphotosynthetic systems. Using light and water toprovide electrons and protons for the synthesis ofa fuel. Energ. Environ. Sci. 4, 2353–2365.
Honda, Y., Hagiwara, H., Ida, S., and Ishihara, T.(2016). Application to photocatalytic H2production of a whole-cell reaction byrecombinant Escherichia coli cells expressing[FeFe]-Hydrogenase and maturases genes.Angew. Chem. Int. Ed. Engl. 55, 8045–8048.
Jones, S.M., and Solomon, E.I. (2015). Electrontransfer and reactionmechanism of laccases. Cell.Mol. Life Sci. 72, 869–883.
Kalyanasundaram, K. (1982a). Photophysics,photochemistry and solar-energy conversion withTris(Bipyridyl)Ruthenium(Ii) and its analogs.Coord. Chem. Rev. 46, 159–244.
Kalyanasundaram, K. 1982b. Photophysics,Photochemistry and Solar Energy Conversionwith tris(bipyridyl)ruthenium(II) and its Analogues,Amsterdam.
Kalyanasundaram, K.N.-S.M. (1982c). Influence ofadded salts on the cage excape yields in thephotoredox quenching of Ru(bpy)32+ excitedstates. Chem. Phys. Lett. 88, 7–12.
Kurzeev, S.A., Vilesov, A.S., Fedorova, T.V.,Stepanova, E.V., Koroleva, O.V., Bukh, C.,Bjerrum, M.J., Kurnikov, I.V., and Ryabov, A.D.(2009). Kinetic and theoretical comprehension ofdiverse rate laws and reactivity gaps in Coriolushirsutus laccase-catalyzed oxidation of acido andcyclometalated Ru(II) complexes. Biochemistry48, 4519–4527.
Lazarides, T., Sazanovich, I.V., Simaan, A.J.,Kafentzi, M.C., Delor, M., Mekmouche, Y., Faure,
B., Reglier, M., Weinstein, J.A., Coutsolelos, A.G.,and Tron, T. (2013). Visible light-driven O2
reduction by a porphyrin–laccase system. J. Am.Chem. Soc. 135, 3095–3103.
Lee, S.H., Choi, D.S., Kuk, S.K., and Park, C.B.(2018). Photobiocatalysis: activating redoxenzymes by direct or indirect transfer ofphotoinduced electrons. Angew. Chem. Int. Ed.Engl. 57, 7958–7985.
Li, H., Martin, R.B., Harruff, B.A., Carino, R.A.,Allard, L.F., and Sun, Y.-P. (2004). Single-walledcarbon nanotubes tethered with porphyrins:synthesis and photophysical properties. Adv.Mater. 16, 896–900.
Litman, Z.C., Wang, Y., Zhao, H., and Hartwig, J.F.(2018). Cooperative asymmetric reactionscombining photocatalysis and enzymaticcatalysis. Nature 560, 355–359.
Madhavi, V., and Lele, S.S. (2009). Laccase:properties and applications. Bioresources 4,1694–1717.
Mandal, K., and Hoffman, M.Z. (1984). Quantumyield of formation of methylviologen radicalcation in the photolysis of the Ru(bpy)32+/methylviologen/EDTA system. J. Phys. Chem. 88,5632–5639.
Mate, D.M., and Alcalde, M. (2017). Laccase: amulti-purpose biocatalyst at the forefront ofbiotechnology. Microb. Biotechnol. 10, 1457–1467.
Mines, G.A., Bjerrum, M.J., Hill, M.G., Casimiro,D.R., Chang, I.J., Winkler, J.R., and Gray, H.B.(1996). Rates of heme oxidation and reduction inRu(His33)cytochrome c at very high driving forces.J. Am. Chem. Soc. 118, 1961–1965.
Muller, P., and Brettel, K. (2012). [Ru(bpy)(3)](2+)as a reference in transient absorptionspectroscopy: differential absorption coefficientsfor formation of the long-lived (3)MLCT excitedstate. Photochem. Photobiol. Sci. 11, 632–636.
Naqvi, K.R. (1981). Spin selection rules concerningintermolecular energy transfer. Energy-transferstudies using doublet-state acceptors. J. Phys.Chem. 85, 2303–2304.
Noji, T., Kondo, M., Jin, T., Yazawa, T., Osuka, H.,Higuchi, Y., Nango, M., Itoh, S., and Dewa, T.(2014). Light-driven hydrogen production byhydrogenases and a Ru-complex inside ananoporous glass plate under aerobic externalconditions. J. Phys. Chem. Lett. 5, 2402–2407.
Okura, I., Nakamura, S., Kimthuan, N., andNakamura, K.I. (1979). Kinetics and mechanism ofmethyl viologen reduction and hydrogengeneration by visible-light with Tris (2,2’-bipyridine) ruthenium dication. J. Mol. Catal. 6,261–267.
Pecht, I., Farver, O.L.E., and Goldberg, M. (1977).Electron transfer pathways in blue copperproteins. In Bioinorganic Chemistry-II, 162,Raymond., ed. Advances in Chemistry(Washington D.C.: American Chemical Society),pp. 179–206.
Pellegrin, Y., and Odobel, F. (2011). Moleculardevices featuring sequential photoinducedcharge separations for the storage of multiple
iScience 24, 102378, April 23, 2021 15
llOPEN ACCESS
iScienceArticle
redox equivalents. Coord. Chem. Rev. 255, 2578–2593.
Piontek, K., Antorini, M., and Choinowski, T.(2002). Crystal structure of a laccase from thefungus Trametes versicolor at 1.90-A resolutioncontaining a full complement of coppers. J. Biol.Chem. 277, 37663–37669.
Riva, S. (2006). Laccases: blue enzymes for greenchemistry. Trends Biotechnol. 24, 219–226.
Robert, V., Monza, E., Tarrago, L., Sancho, F., DeFalco, A., Schneider, L., Npetgat Ngoutane, E.,Mekmouche, Y., Pailley, P.R., Simaan, A.J., et al.(2017). Probing the surface of a laccase for cluestowards the design of chemo-enzymatic catalysts.ChemPlusChem 82, 607–614.
Schmermund, L., Jurka�s, V., Ozgen, F.F., Barone,G.D., Buchsenschutz, H.C., Winkler, C.K.,Schmidt, S., Kourist, R., and Kroutil, W. (2019).Photo-biocatalysis: biotransformations in thepresence of light. ACS Catal. 9, 4115–4144.
Sekretaryova, A., Jones, S.M., and Solomon, E.I.(2019). O2 reduction to water by high potentialmulticopper oxidases: contributions of the T1copper site potential and the local environmentof the trinuclear copper cluster. J. Am. Chem.Soc. 141, 11304–11314.
Shleev, S., Andoralov, V., Falk, M., Reimann, C.T.,Ruzgas, T., Srnec, M., Ryde, U., and Rulı�sek, L.(2012). On the possibility of uphill intramolecularelectron transfer in multicopper oxidases:electrochemical and quantum chemical study ofbilirubin oxidase. Electroanalysis 24, 1524–1540.
Shleev, S., Christenson, A., Serezhenkov, V.,Burbaev, D., Yaropolov, A., Gorton, L., andRuzgas, T. (2005). Electrochemical redoxtransformations of T1 and T2 copper sites innative Trametes hirsuta laccase at gold electrode.Biochem. J. 385, 745–754.
16 iScience 24, 102378, April 23, 2021
Simaan, A.J., Mekmouche, Y., Herrero, C.,Moreno, P., Aukauloo, A., Delaire, J.A., Reglier,M., and Tron, T. (2011). Photoinducedmultielectron transfer to a multicopper oxidaseresulting in dioxygen reduction into water.Chemistry 17, 11743–11746.
Solomon, E.I., Augustine, A.J., and Yoon, J.(2008). O2 reduction to H2O by the multicopperoxidases. Dalton Trans. 3921–3932.
Solomon, E.I., Sundaram, U.M., and Machonkin,T.E. (1996). Multicopper oxidases andoxygenases. Chem. Rev. 96, 2563–2606.
Solomon, E.I., Szilagyi, R.K., Debeer George, S.,and Basumallick, L. (2004). Electronic structures ofmetal sites in proteins and models: contributionsto function in blue copper proteins. Chem. Rev.104, 419–458.
Stryer, L., and Haugland, R.P. (1967). Energytransfer: a spectroscopic ruler. Proc. Natl. Acad.Sci. U S A 58, 719–726.
Sun, H., Yoshimura, A., and Hoffman, M.Z. (1994).Oxidative quenching of the excited-state ofTris(2,2’-Bipyridine)Ruthenium(2+) ion bymethylviologen - variation of solution mediumand temperature. J. Phys. Chem. 98, 5058–5064.
Tollin, G., Meyer, T.E., Cusanovich, M.A., Curir, P.,and Marchesini, A. (1993). Oxidative turnoverincreases the rate constant and extent ofintramolecular electron transfer in themulticopper enzymes, ascorbate oxidase andlaccase. Biochim. Biophys. Acta 1183, 309–314.
Tran, T.-T., Rabah, J., Ha-Thi, M.-H., Allard, E.,Nizinski, S., Burdzinski, G., Aloıse, S.,Fensterbank, H., Baczko, K., Nasrallah, H., et al.(2020). Photoinduced electron transfer andenergy transfer processes in a flexible BODIPY-C60 dyad. J. Phys. Chem. B 124, 9396–9410.
Tron, T. (2013). Laccases. In Encyclopedia ofMetalloproteins, R.H. Kretsinger, V.N. Uversky,and E.A. Permyakov, eds. (Springer), pp. 1066–1070.
Watanabe, T., and Honda, K. (1982).Measurement of the extinction coefficient of themethyl viologen cation radical and the efficiencyof its formation by semiconductor photocatalysis.J. Phys. Chem. 86, 2617–2619.
Wehlin, S.A.M., Troian-Gautier, L., Li, G., andMeyer, G.J. (2017). Chloride oxidation byruthenium excited-states in solution. J. Am.Chem. Soc. 139, 12903–12906.
Wijma, H.J., Macpherson, I., Farver, O., Tocheva,E.I., Pecht, I., Verbeet, M.P., Murphy, M.E.P., andCanters, G.W. (2007). Effect of the methionineligand on the reorganization energy of the type-1copper site of nitrite reductase. J. Am. Chem.Soc. 129, 519–525.
Wilson, G.J., Launikonis, A., Sasse, W.H.F., andMau, A.W.H. (1998). Chromophore-specificquenching of ruthenium Trisbipyridine�Arenebichromophores by methyl viologen. J. Phys.Chem. A 102, 5150–5156.
Winkler, J.R. (2005). Long-Range ElectronTransfer in Biology (Encyclopedia of InorganicChemistry).
Winkler, J.R. (2013). Chemistry. FRETting over thespectroscopic ruler. Science 339, 1530–1531.
Yoshimura, A., Hoffman, M.Z., and Sun, H. (1993).An evaluation of the excited state absorptionspectrum of Ru(bpy)32+ in aqueous andacetonitrile solutions. J. Photochem. Photobiol. AChem. 70, 29–33.
iScience, Volume 24
Supplemental information
Tracking light-induced electron transfer
toward O2 in a hybrid
photoredox-laccase system
Rajaa Farran, Yasmina Mekmouche, Nhat Tam Vo, Christian Herrero, AnnamariaQuaranta, Marie Sircoglou, Frédéric Banse, Pierre Rousselot-Pailley, A. JalilaSimaan, Ally Aukauloo, Thierry Tron, and Winfried Leibl
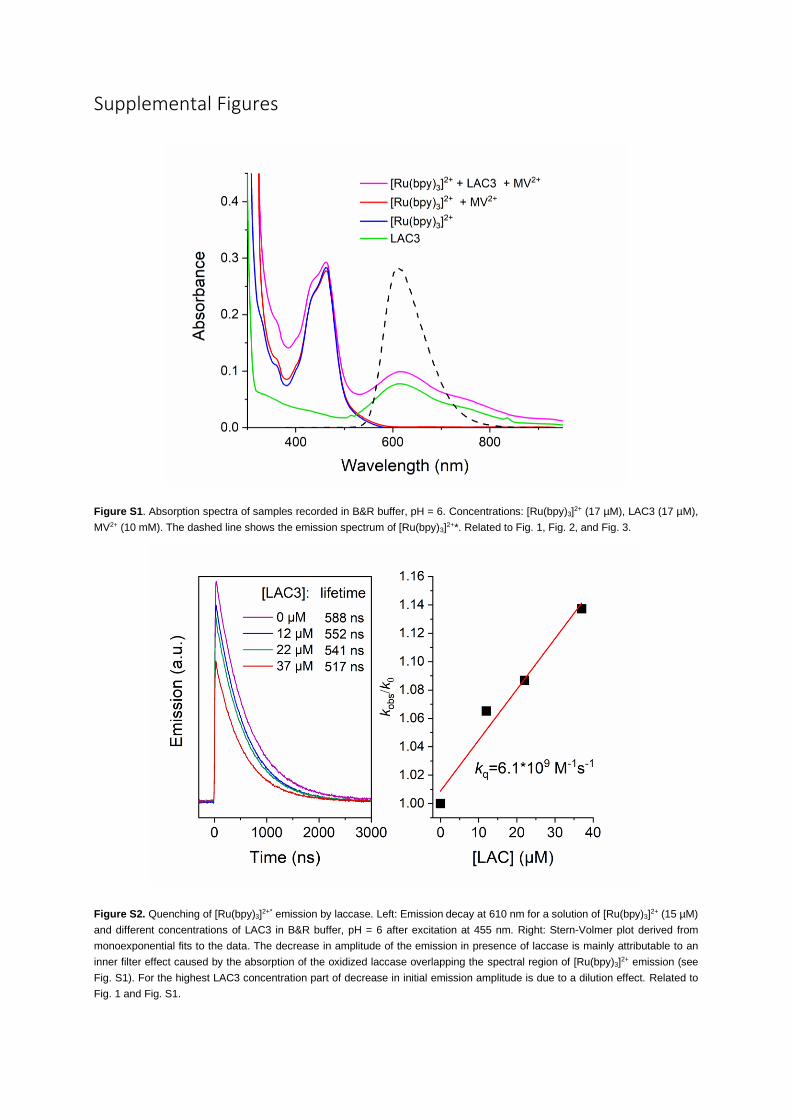
Supplemental Figures
Figure S1. Absorption spectra of samples recorded in B&R buffer, pH = 6. Concentrations: [Ru(bpy)3]2+ (17 µM), LAC3 (17 µM),
MV2+ (10 mM). The dashed line shows the emission spectrum of [Ru(bpy)3]2+*. Related to Fig. 1, Fig. 2, and Fig. 3.
Figure S2. Quenching of [Ru(bpy)3]2+* emission by laccase. Left: Emission decay at 610 nm for a solution of [Ru(bpy)3]
2+ (15 µM)
and different concentrations of LAC3 in B&R buffer, pH = 6 after excitation at 455 nm. Right: Stern-Volmer plot derived from
monoexponential fits to the data. The decrease in amplitude of the emission in presence of laccase is mainly attributable to an
inner filter effect caused by the absorption of the oxidized laccase overlapping the spectral region of [Ru(bpy)3]2+ emission (see
Fig. S1). For the highest LAC3 concentration part of decrease in initial emission amplitude is due to a dilution effect. Related to
Fig. 1 and Fig. S1.
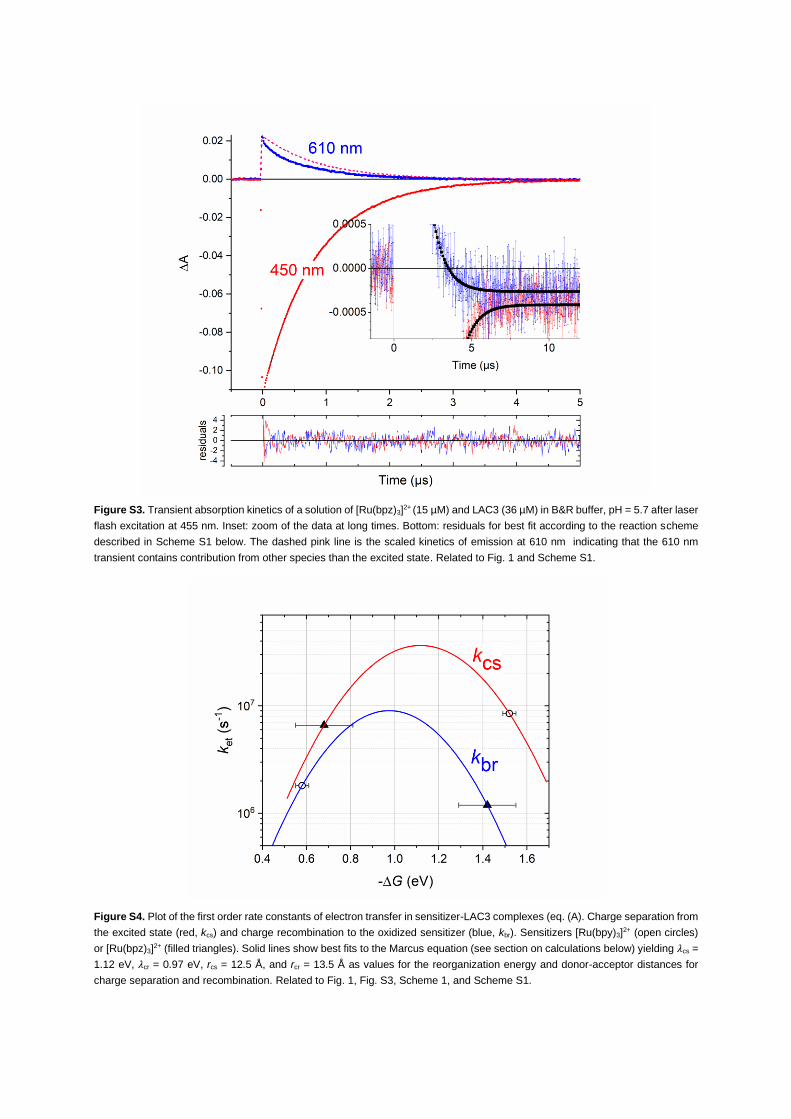
Figure S3. Transient absorption kinetics of a solution of [Ru(bpz)3]2+ (15 µM) and LAC3 (36 µM) in B&R buffer, pH = 5.7 after laser
flash excitation at 455 nm. Inset: zoom of the data at long times. Bottom: residuals for best fit according to the reaction scheme
described in Scheme S1 below. The dashed pink line is the scaled kinetics of emission at 610 nm indicating that the 610 nm
transient contains contribution from other species than the excited state. Related to Fig. 1 and Scheme S1.
Figure S4. Plot of the first order rate constants of electron transfer in sensitizer-LAC3 complexes (eq. (A). Charge separation from
the excited state (red, kcs) and charge recombination to the oxidized sensitizer (blue, kbr). Sensitizers [Ru(bpy)3]2+ (open circles)
or [Ru(bpz)3]2+ (filled triangles). Solid lines show best fits to the Marcus equation (see section on calculations below) yielding 𝜆cs =
1.12 eV, 𝜆cr = 0.97 eV, rcs = 12.5 Å, and rcr = 13.5 Å as values for the reorganization energy and donor-acceptor distances for
charge separation and recombination. Related to Fig. 1, Fig. S3, Scheme 1, and Scheme S1.

Scheme S1. Interactions between the [Ru(bpz)3]2+ photosensitizer and the LAC3 enzyme identified by laser flash
photolysis experiments. Reactions leading to formation of reduced laccase (LAC3-) and oxidized photosensitizer (Ru3+)
are indicated by red arrows. In the bimolecular pathway (left) Förster resonance energy transfer quenching of the
[Ru(bpz)3]2+* excited state largely outcompetes with electron transfer to the T1 CuII center in LAC3. In the association
complex (right) charge recombination is about 10 times faster than dissociation leading to a low yield for formation of the
target state Ru3+ LAC3– (red). Parameter values were deduced from analysis of the data of Fig. S3 (pH 5.7). Related to
Fig. 1, Fig. S3, and Scheme 1.
Figure S5. Rates for Förster energy transfer (blue, Eq. 1) and electron transfer (red, Eq. 4) as a function of donor-acceptor distance
r. For the electron transfer rate, values for charge separation (-𝛥G = 1.52 eV and 𝜆 = 1.12 eV) from Fig. S4 were used and the
experimental rates for ET between the two chromophores and LAC3 are indicated by dots. The black dashed line represents the
maximal electron transfer rate (-𝛥G = 𝜆). The dashed blue line shows energy transfer rates 100 times slower than the Förster rates
to account for a hypothetical effect of selection rules related to the triplet/doublet spin multiplicity (see text). The value of the
Förster radius R0 = 26.4 Å is represented by the dashed green line. See Methods Section for equations and details.
At the employed concentrations of LAC3 the mean distance between the photosensitizers and LAC3 are larger than 30 Å. If the
position of LAC3 is taken at r = 0 Å a photosensitizer approaching (from the left side of the graph) will have to cross a k(r) curve
providing a rate faster than the diffusion limit for an interaction to occur. This occurs at about 23 Å in the case of “slow” Förster
energy transfer and at much larger distance for normal Förster energy transfer. At these large distances Marcus ET is many orders
of magnitude slower and therefore cannot occur. Related to Fig. 1, Scheme 1, Fig. S3, and Scheme S1.
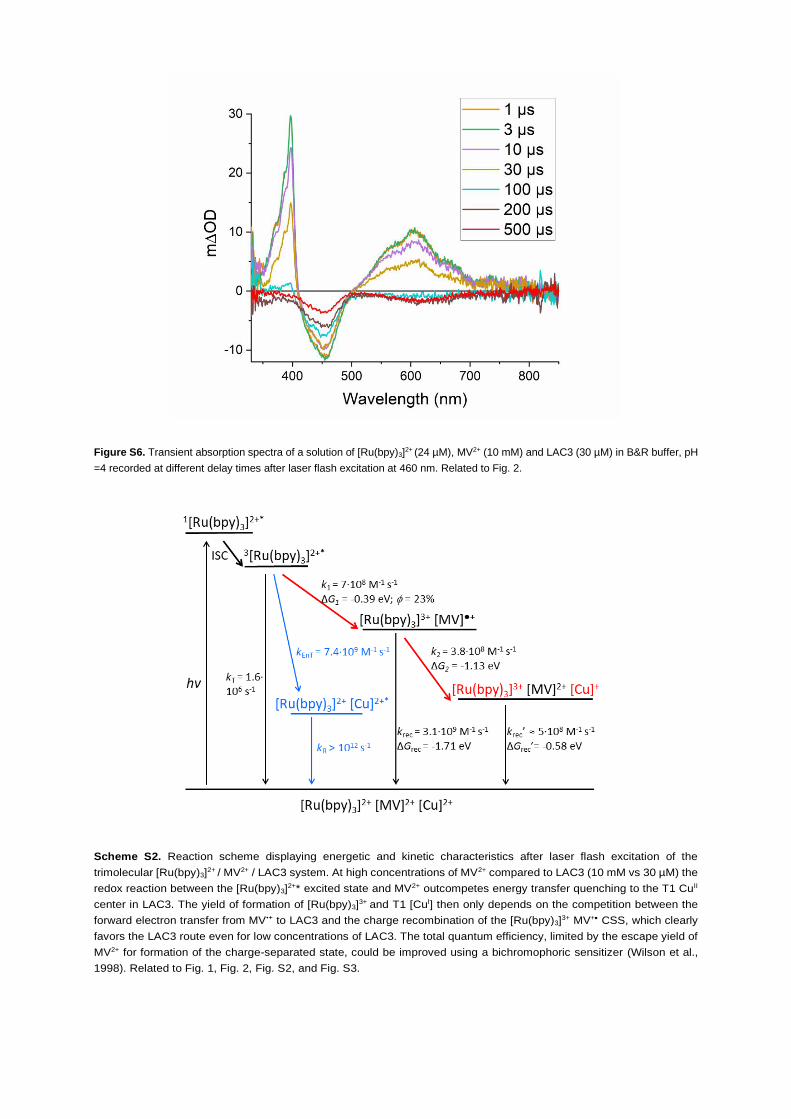
Figure S6. Transient absorption spectra of a solution of [Ru(bpy)3]2+ (24 µM), MV2+ (10 mM) and LAC3 (30 µM) in B&R buffer, pH
=4 recorded at different delay times after laser flash excitation at 460 nm. Related to Fig. 2.
Scheme S2. Reaction scheme displaying energetic and kinetic characteristics after laser flash excitation of the
trimolecular [Ru(bpy)3]2+ / MV2+ / LAC3 system. At high concentrations of MV2+ compared to LAC3 (10 mM vs 30 µM) the
redox reaction between the [Ru(bpy)3]2+* excited state and MV2+ outcompetes energy transfer quenching to the T1 CuII
center in LAC3. The yield of formation of [Ru(bpy)3]3+ and T1 [CuI] then only depends on the competition between the
forward electron transfer from MV•+ to LAC3 and the charge recombination of the [Ru(bpy)3]3+ MV+• CSS, which clearly
favors the LAC3 route even for low concentrations of LAC3. The total quantum efficiency, limited by the escape yield of
MV2+ for formation of the charge-separated state, could be improved using a bichromophoric sensitizer (Wilson et al.,
1998). Related to Fig. 1, Fig. 2, Fig. S2, and Fig. S3.

Figure S7. Evolution of absorption spectra during continuous illumination of [Ru(bpy)3]2+ (30 µM), LAC3 (30 µM), MV2+ (150 µM),
and EDTA (10 mM) under anaerobic conditions. Left, Inset: absorption spectra at the indicated delay after onset of illumination.
The initial absorption spectrum (red) shows contributions from [Ru(bpy)3]2+ (𝜆=450 nm) and the CuII T1 site of laccase in its oxidized
form (𝜆=500-700 nm). After 1.6 min of illumination the 610 nm absorption band has disappeared leaving [Ru(bpy)3]2+ absorption
(𝜆=450 nm, blue). After a lag phase without spectral changes the typical spectrum of MV+• radical (395 nm, 605 nm) starts
growing (black). Right: Characteristics of the time dependence of absorption changes at 610 nm with a phase of CuII T1 reduction
(1) followed by a lag phase (2) and accumulation of MV+• radical (3). Related to Figure 3.
Figure S8. Effect of MV2+ concentration on the rate of photoreduction of T1 in a [Ru(bpy)3]2+/EDTA/MV2+ system. Rates k were
taken as the reciprocal of the time of illumination needed for the total bleach of the absorption at 610 nm. k0 is the rate in absence
of MV2+. Blue symbols indicate the simulated quantum yield of MV2+ reduction from the chromophore excited state which occurs
in competition with the intrinsic decay of the excited state, considering the escape yield for MV•+ of 20%. The good correlation
shows that laccase reduction is controlled by the yield of photoproduction of MV•+. Related to Figure 3A.

Figure S9. Laccase photoreduction under continuous illumination in absence of O2 for increasing concentrations of MV2+. Data of
Fig. 3A with rescaled time axis to match the time for complete reduction of T1 for any concentration of MV2+ with that in the
absence of MV2+ (for which complete reduction occurs at 620 s). The similar time courses of T1 reduction suggest the same
mechanism in the absence and in the presence of MV2+. The dash-dotted horizontal lines for the two lowest MV2+ concentrations
indicate the absorption expected after complete accumulation of reduced MV2+ which do not match with the final absorption of the
red and blue experimental traces. Related to Fig. 3.
Figure S10. Plot of the time course of oxidation of the sacrificial electron donor (EDTA) in the absence of MV2+ (blue curve) and
in the presence of 50 µM MV2+ (green curve). Reaction scheme and rate constants identical to those determined from the global
fit of absorption transients at 610 nm (Fig. 3A). Only three electrons per LAC3 are mobilized in the absence of the electron
mediator. In the presence of MV2+ three electrons are quickly consumed (in about 200 s), followed by a slower fourth reduction
and additional consumption of electrons due to accumulation of MV+•. The dashed lines show for the case of presence of 50 µM
MV2+ the partition of electron flux to laccase either via the excited state of the chromophore or via the electron mediator. For higher
concentrations of MV2+ ET from Ru* becomes negligible. Related to Fig. 3.
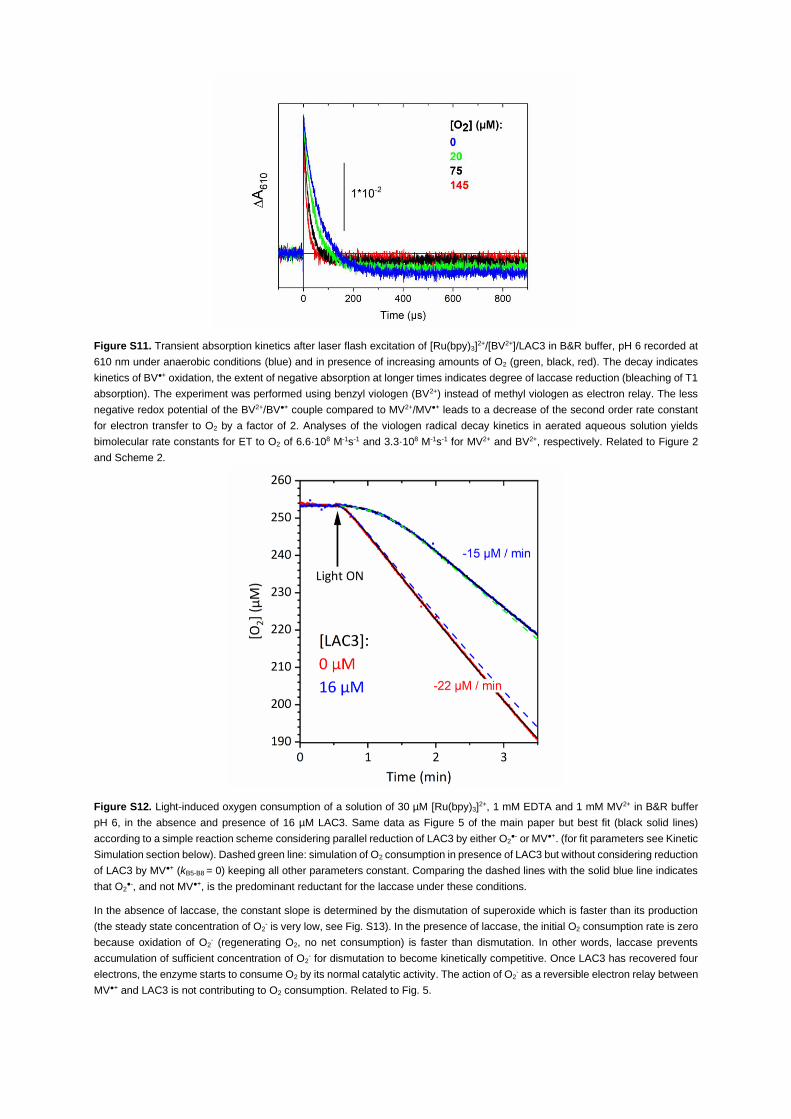
Figure S11. Transient absorption kinetics after laser flash excitation of [Ru(bpy)3]2+/[BV2+]/LAC3 in B&R buffer, pH 6 recorded at
610 nm under anaerobic conditions (blue) and in presence of increasing amounts of O2 (green, black, red). The decay indicates
kinetics of BV●+ oxidation, the extent of negative absorption at longer times indicates degree of laccase reduction (bleaching of T1
absorption). The experiment was performed using benzyl viologen (BV2+) instead of methyl viologen as electron relay. The less
negative redox potential of the BV2+/BV●+ couple compared to MV2+/MV●+ leads to a decrease of the second order rate constant
for electron transfer to O2 by a factor of 2. Analyses of the viologen radical decay kinetics in aerated aqueous solution yields
bimolecular rate constants for ET to O2 of 6.6·108 M-1s-1 and 3.3·108 M-1s-1 for MV2+ and BV2+, respectively. Related to Figure 2
and Scheme 2.
Figure S12. Light-induced oxygen consumption of a solution of 30 µM [Ru(bpy)3]2+, 1 mM EDTA and 1 mM MV2+ in B&R buffer
pH 6, in the absence and presence of 16 µM LAC3. Same data as Figure 5 of the main paper but best fit (black solid lines)
according to a simple reaction scheme considering parallel reduction of LAC3 by either O2●- or MV●+. (for fit parameters see Kinetic
Simulation section below). Dashed green line: simulation of O2 consumption in presence of LAC3 but without considering reduction
of LAC3 by MV●+ (kB5-B8 = 0) keeping all other parameters constant. Comparing the dashed lines with the solid blue line indicates
that O2●-, and not MV●+, is the predominant reductant for the laccase under these conditions.
In the absence of laccase, the constant slope is determined by the dismutation of superoxide which is faster than its production
(the steady state concentration of O2- is very low, see Fig. S13). In the presence of laccase, the initial O2 consumption rate is zero
because oxidation of O2- (regenerating O2, no net consumption) is faster than dismutation. In other words, laccase prevents
accumulation of sufficient concentration of O2- for dismutation to become kinetically competitive. Once LAC3 has recovered four
electrons, the enzyme starts to consume O2 by its normal catalytic activity. The action of O2- as a reversible electron relay between
MV●+ and LAC3 is not contributing to O2 consumption. Related to Fig. 5.
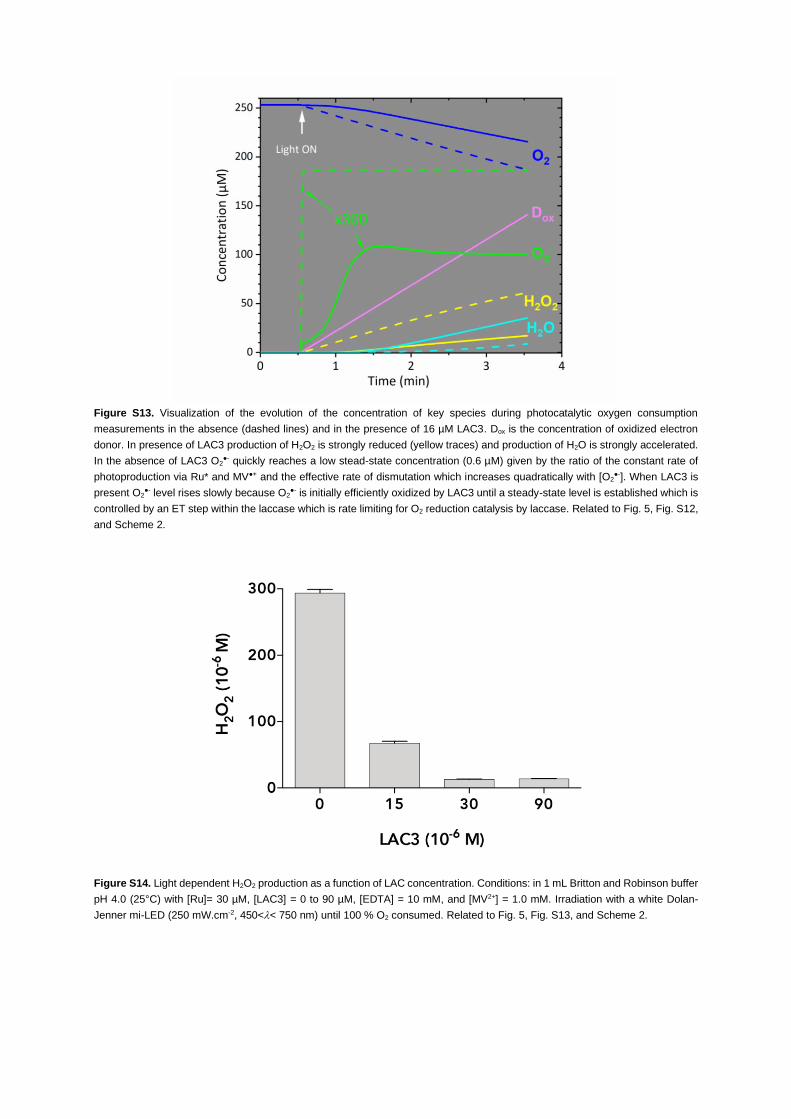
Figure S13. Visualization of the evolution of the concentration of key species during photocatalytic oxygen consumption
measurements in the absence (dashed lines) and in the presence of 16 µM LAC3. Dox is the concentration of oxidized electron
donor. In presence of LAC3 production of H2O2 is strongly reduced (yellow traces) and production of H2O is strongly accelerated.
In the absence of LAC3 O2●- quickly reaches a low stead-state concentration (0.6 µM) given by the ratio of the constant rate of
photoproduction via Ru* and MV●+ and the effective rate of dismutation which increases quadratically with [O2●-]. When LAC3 is
present O2●- level rises slowly because O2
●- is initially efficiently oxidized by LAC3 until a steady-state level is established which is
controlled by an ET step within the laccase which is rate limiting for O2 reduction catalysis by laccase. Related to Fig. 5, Fig. S12,
and Scheme 2.
Figure S14. Light dependent H2O2 production as a function of LAC concentration. Conditions: in 1 mL Britton and Robinson buffer
pH 4.0 (25°C) with [Ru]= 30 µM, [LAC3] = 0 to 90 µM, [EDTA] = 10 mM, and [MV2+] = 1.0 mM. Irradiation with a white Dolan-
Jenner mi-LED (250 mW.cm-2, 450<< 750 nm) until 100 % O2 consumed. Related to Fig. 5, Fig. S13, and Scheme 2.

Fig. S15. Simulation of a typical anaerobic photoreduction experiment to visualize the sensitivity of the absorption changes at 610
nm on rate constants for internal electron transfer from T1 to the TNC. Presence of excess MV2+ (2 mM) is assumed which permits
to neglect direct, inefficient interaction of the chromophore with laccase (reactions C1-C6 above). Light intensity was chosen to
produce 3 µM/s of MV●+ reductant. A) Variation of the rate of the first IET from T1 to TNC; B) Variation of the rate of the second
IET from T1 to TNC; C) Variation of the rate for reverse IET from the fully reduced TNC to T1. The latter corresponds to a change
from an exergonic to an endergonic reduction step for the storage of the third electron on the TNC. All forward rate constants
besides the ones varied are assumed not limiting (10 s-1). All backward rate constants besides the one varied in panel C are set
to 0. Related to Fig. 3.

Transparent Methods
Materials
Tris(2,2’-bipyridyl)dichlororuthenium(II) hexahydrate (99.5%), methyl viologen dichloride hydrate (98%)
and benzyl viologen dichloride (97%) were purchased from Sigma-Aldrich. The laccase LAC3 from
Trametes sp. C30 was produced as a recombinant enzyme in Aspergillus niger as described.(Klonowska
et al., 2005, Mekmouche et al., 2014)
Laser flash photolysis
For transient absorption and emission measurements an Edinburgh Instruments LP920 flash photolysis
spectrometer system was used with a Continuum Surelite OPO laser (5 ns pulse duration, typical energy
10 mJ) for excitation at 460 nm, a pulsed 450 W Xenon lamp for the probe light, and either a PMT
(Hamamatsu) or ICCD camera (Andor) as detectors. Presented data are typically averages over 10-20
measurements. Samples were prepared in sealed quartz cuvettes containing Britton–Robinson (B&R)
buffer at the indicated pH and were purged for 20 min with argon prior to each experiment.
Light-induced dioxygen consumption studies
Dioxygen consumption was measured by polarography using a model 781 oxygen meter (Strathkelvin
Instruments) or a Hansatech Oxygraph system with a micro-Clark electrode fitted to a temperature-
controlled glass chamber. Irradiation of the sample was performed through the glass chamber with a
Dolan JENNER LED (250 mW.cm-2) equipped with filters (450 nm <<700 nm). For the data in Fig. S11
irradiation was done with a Flexilux 600 Longlife 150 W 21 V halogen lamp through an ultraviolet cut-off
(λ≥375 nm) and a 23% neutral density filter.
H2O2 quantification
H2O2 production after illumination as a function of laccase concentration was determined by HRP assay.
40 µL of the reaction solution, filtered through a 3 kDa filter was added to a solution of 240 µL ABTS (2
mg/mL) in phosphate buffer pH 8.0 and 10 µL HRP (Sigma, 0.103 mg/mL) in 100 mM phosphate buffer
pH 8 was added. After 5 minutes of incubation the absorbance at 420 nm was recorded. Calibration was
done with reference measurements in the absence of light.
Kinetic spectroscopic studies
UV-vis absorption spectra were recorded on a Cary 50 spectrophotometer equipped with a homemade
irradiation setup including a Dolan JENNER LED (250 mW.cm-2) equipped with filters (450 nm <<700
nm). For each MV2+ concentration a quartz cuvette was filled with the reaction mixture and sealed in a
glovebox prior recording the corresponding spectrum.
Kinetic Simulation
Analysis of the kinetics of LAC3 photoreduction was performed using the KinTek Explorer simulation
program (Johnson et al., 2009b, Johnson et al., 2009a).
A) Simulation of flash-induced absorption changes in absence of MV2+ (Fig. 1, Fig. S3)
The simulation is based on the reaction scheme shown in Scheme 1:
A1) Rufree + Lox RuLox formation of association complex
A2) RuLox + light Ru*Lox excitation in association complex
A3) Ru*Lox RuLox intrinsic excited state decay in complex
A4) Ru*Lox RuIIILred electron transfer
A5) RuIIILred RuLox back electron transfer
A6) RuIIILred RuIII+ Lred dissociation of charge separated state
A7) Rufree + light Rufree* excitation of free chromophore
A8) Rufree* Rufree excited state decay of free chromophore
A9) Rufree* + Lox = Rufree + Lox excitation of free chromophore
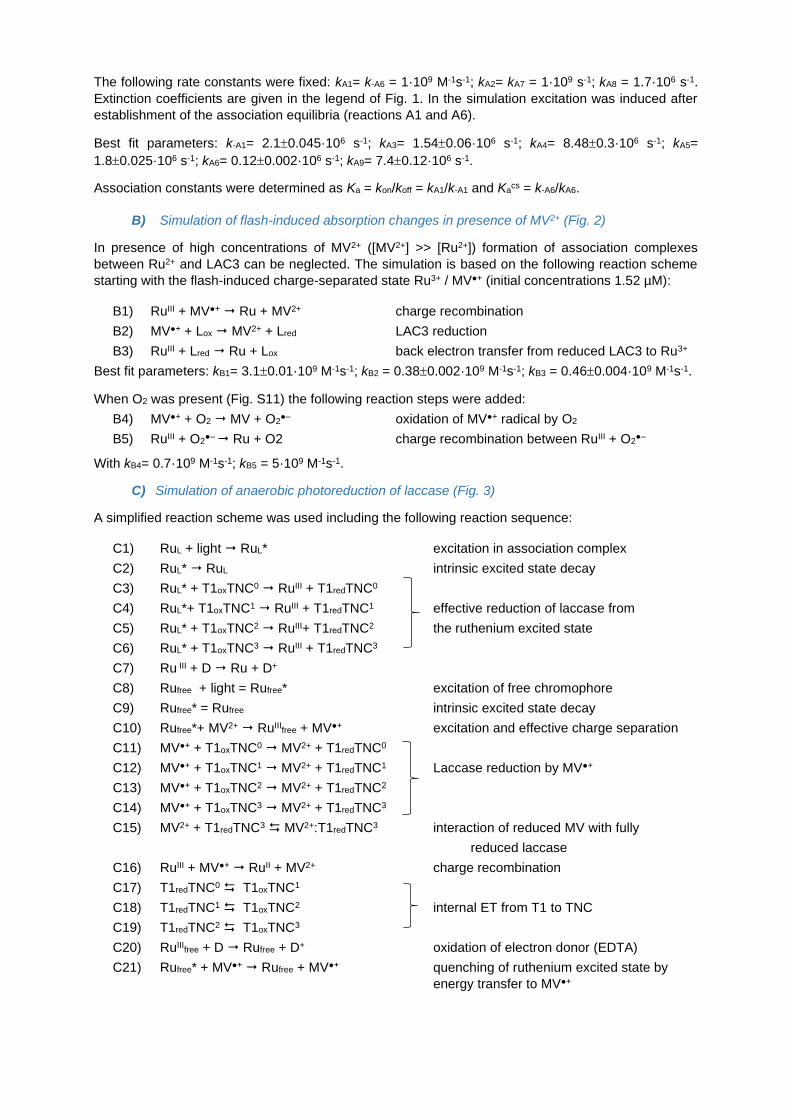
The following rate constants were fixed: kA1= k-A6 = 1·109 M-1s-1; kA2= kA7 = 1·109 s-1; kA8 = 1.7·106 s-1.
Extinction coefficients are given in the legend of Fig. 1. In the simulation excitation was induced after
establishment of the association equilibria (reactions A1 and A6).
Best fit parameters: k-A1= 2.10.045·106 s-1; kA3= 1.540.06·106 s-1; kA4= 8.480.3·106 s-1; kA5=
1.80.025·106 s-1; kA6= 0.120.002·106 s-1; kA9= 7.40.12·106 s-1.
Association constants were determined as Ka = kon/koff = kA1/k-A1 and Kacs = k-A6/kA6.
B) Simulation of flash-induced absorption changes in presence of MV2+ (Fig. 2)
In presence of high concentrations of MV2+ ([MV2+] >> [Ru2+]) formation of association complexes
between Ru2+ and LAC3 can be neglected. The simulation is based on the following reaction scheme
starting with the flash-induced charge-separated state Ru3+ / MV●+ (initial concentrations 1.52 µM):
B1) RuIII + MV●+ Ru + MV2+ charge recombination
B2) MV●+ + Lox MV2+ + Lred LAC3 reduction
B3) RuIII + Lred Ru + Lox back electron transfer from reduced LAC3 to Ru3+
Best fit parameters: kB1= 3.10.01·109 M-1s-1; kB2 = 0.380.002·109 M-1s-1; kB3 = 0.460.004·109 M-1s-1.
When O2 was present (Fig. S11) the following reaction steps were added:
B4) MV●+ + O2 MV + O2●– oxidation of MV●+ radical by O2
B5) RuIII + O2●– Ru + O2 charge recombination between RuIII + O2
●–
With kB4= 0.7·109 M-1s-1; kB5 = 5·109 M-1s-1.
C) Simulation of anaerobic photoreduction of laccase (Fig. 3)
A simplified reaction scheme was used including the following reaction sequence:
C1) RuL + light RuL* excitation in association complex
C2) RuL* RuL intrinsic excited state decay
C3) RuL* + T1oxTNC0 RuIII + T1redTNC0
C4) RuL*+ T1oxTNC1 RuIII + T1redTNC1 effective reduction of laccase from
C5) RuL* + T1oxTNC2 RuIII+ T1redTNC2 the ruthenium excited state
C6) RuL* + T1oxTNC3 RuIII + T1redTNC3
C7) Ru III + D Ru + D+
C8) Rufree + light = Rufree* excitation of free chromophore
C9) Rufree* = Rufree intrinsic excited state decay
C10) Rufree*+ MV2+ RuIIIfree + MV●+ excitation and effective charge separation
C11) MV●+ + T1oxTNC0 MV2+ + T1redTNC0
C12) MV●+ + T1oxTNC1 MV2+ + T1redTNC1 Laccase reduction by MV●+
C13) MV●+ + T1oxTNC2 MV2+ + T1redTNC2
C14) MV●+ + T1oxTNC3 MV2+ + T1redTNC3
C15) MV2+ + T1redTNC3 MV2+:T1redTNC3 interaction of reduced MV with fully
reduced laccase
C16) RuIII + MV●+ RuII + MV2+ charge recombination
C17) T1redTNC0 T1oxTNC1
C18) T1redTNC1 T1oxTNC2 internal ET from T1 to TNC
C19) T1redTNC2 T1oxTNC3
C20) RuIIIfree + D Rufree + D+ oxidation of electron donor (EDTA)
C21) Rufree* + MV●+ Rufree + MV●+ quenching of ruthenium excited state by
energy transfer to MV●+
where:
- Ru, Ru*, and RuIII stand for the ground state, triplet excited state, and oxidized state of the
[Ru(bpy)3]2+ chromophore
- RuL is the fraction of chromophores in an association complex with laccase
- D and D+ are the reduced and oxidized states of the sacrificial electron donor (EDTA)
- MV2+ and MV●+ are the oxidized and reduced states of the methyl viologen electron relay
- T1 and TNC are the type 1 Cu ion site, and the trinuclear Cu catalytic center in the LAC3 enzyme
- The LAC3 enzyme is described by its redox state from fully oxidized (T1oxTNC0) to the fully
reduced form (T1redTNC3) with TNCx, x = number of electrons on the TNC
- Reactions 3-6: the successive reductions of T1 by the excited state of the sensitizer in the
preformed association complex
- Reactions 11-14: the successive reductions of T1 by MV●+
- Reaction 15 accounts for a hypothetical interaction of MV2+ with the fully reduced enzyme.
- Reactions 17-19: internal electron transfer reactions from T1 to the TNC in the laccase
- Reaction 21 accounts for energy transfer from Ru* to MV●+ having a broad absorption around
600 nm
Initial concentrations of chromophore-laccase association complexes (RuL) and free chromophore (Rufree)
were chosen according to the parameters determined before (Scheme 1). Other initial concentrations are
those used in the experiment. Reaction 10 takes into account the escape yield (Sun et al., 1994). For
computational reasons, effective electron transfer in association complexes between Ru and LAC3 were
simulated by apparent rates for electron transfer (reactions 3-6) in competition with the other deactivation
pathway for decay of the Ru excited state (reaction 2) and relative excitation rate (reaction 1). Potential
charge recombination between RuIIIfree and T1red was neglected. All reactions except intramolecular ET in
the laccase (17-19) and binding of MV2+ to fully reduced laccase (reaction 15) is considered irreversible.
For some reactions, rate constants are known from independent laser flash kinetic measurements.
Fixed rate constants used: intrinsic excited state decay of Ru*free: kC9= 1.6·106 s-1; oxidation of EDTA by
RuIII: kC7,C20 = 1.2·106 M-1s-1; energy transfer quenching of Ru*free by MV●+: kC21 = 8·109 M-1s-1. Forward
rate constants for IET were fixed to kC17-C19 = 1 s-1 (not limiting).
The essential result of the fit to the data is that, under the anaerobic conditions of this experiment where
the fully oxidized form of the laccase enzyme corresponds to the resting oxidized form (Solomon, 2016),
the third reduction of the TNC (reaction 19) is energetically uphill by about 200 meV. Values for rate
constants for internal electron transfer in the laccase derived from the simulation: k-C17=0.02 s-1,
k-C18=0.85 s-1, k-C19 ≈4500 s-1.
Other fitted rate constants: kC10 = 0.30.19·109 M-1s-1, kC16 = 0.70.6·109 M-1s-1. Large standard errors
like here indicate dependence between some of the parameters.
The traces in Fig. S10 were produced by plotting the flux integrals for reactions C7 and C20.
Simulations of a typical anaerobic photoreduction experiment to visualize the sensitivity of the absorption
changes at 610 nm on rate constants for internal electron transfer from T1 to the TNC (reactions C17-
C19) are shown in Fig. S15.
D) Simulation of O2 consumption (Fig. 5, Fig. S12, Fig. S13):
We consider the following simplified reaction scheme with photoproduction of MV●+ via the Ru excited
state as above, including charge recombination between RuIII and MV●+ and reduction of RuIII by the
sacrificial electron donor EDTA. As under aerobic conditions all internal electron transfer steps are fast,
we use the simplified representation of the five redox states of laccase L0 - L4 with L0 the fully oxidized
and L4 the fully (4 e-) reduced form. Protonation equilibrium of superoxide is assumed to be fast and is
not explicitly considered.
D1) Ru + light Ru* excitation and
D2) Ru*+ MV2+ RuIII + MV●+ effective charge separation
D3) RuIII + D RuII + D+ oxidation of electron donor

D4) RuIII + MV●+ RuII + MV2+ charge recombination
D5) MV●+ + L0 MV2+ + L1
D6) MV●+ + L1 MV2+ + L2 Laccase reduction by MV●+
D7) MV●+ + L2 MV2+ + L3
D8) MV●+ + L3 MV2+ + L4
D9) O2●– + L0 O2 + L1
D10) O2●– + L1 O2 + L2 Laccase reduction by O2
●–
D11) O2●– + L2 O2 + L3
D12) O2●– + L3 O2 + L4
D13) L4 + O2 L0 + 2 H2O 4-electron reduction of O2 by laccase
D14) MV●++ O2 MV2+ + O2●– O2 reduction by MV●+
D15) O2●– + O2
●– + 2 H+ H2O2 + O2 superoxide disproportionation
D16) H2O2 + H2O2 O2 + 2 H2O H2O2 disproportionation
Initial concentrations were: [light] = 1 µM (constant), [Ru] = 30 µM, [D] = 1 mM, [MV2+] = 1 mM, [L0] = 0,
16 µM, [O2] = 253 µM.
Fixed rate constants used: kD2 = 0.3·109 M-1s-1, kD3 = 1.28·106 M-1s-1, kD4 = 1.27·109 M-1s-1, kD5-D8 =
0.5·109 M-1s-1, kD14 = 0.67·109 M-1s-1, kD15 = 1·106 M-1s-1, kD16 = 17 M-1s-1.
Rate constants determined by global fit of the O2 consumption kinetics in Fig. 5:
kD1 = 0.0260.00002 s-1, kD9-D12 = 0.03-0.3·106 M-1s-1, kD13 = >103 M-1s-1,
Reaction 4 is essentially not operating due to the low steady-state concentrations of RuIII and MV●+. At
the high concentration of MV2+ used in the experiment laccase reduction directly from Ru* can be safely
neglected.
Simulation of O2 consumption with adduct (Fig. 5):
Same scheme as above with eqs D9-D12 replaced by:
D9a) O2●– + L0 O2
●–:L0
D9b) O2●–:L0 O2 + L1
D10a) O2●– + L1 O2
●–:L1
D10b) O2●–:L1 O2 + L2 Laccase : O2
●– adduct formation followed by
D11a) O2●– + L2 O2
●–:L2 laccase reduction
D11b) O2●–:L2 O2 + L3
D12a) O2●– + L3 O2
●–:L3
D12b) O2●–:L3 O2 + L4
Fixed rate constants used: kD9a-12a = 0.5·109 M-1s-1.
Rate constants determined by global fit of the O2 consumption kinetics in Fig. 5: k-D9a--D12a = 0.90.8·106
M-1s-1, kD9b = 2.60.6·106 s-1, kD10b = 0.380.05·106 s-1, kD11b = 0.080.08·106 s-1, kD12b = 0.230.5·106 s-1.
Other rate constants as before.
Calculation of energy and electron transfer rates
Förster-type resonance energy transfer:
To investigate the competition between energy transfer quenching and photo-induced electro transfer
quenching of the ruthenium excited state it is useful to simulate the distance-dependence of both
processes. The rate of oscillating dipole energy transfer between a donor and acceptor molecule can
be deduced from equation (1) proposed by Förster (Főrster, 1959, Lakowicz, 2006)
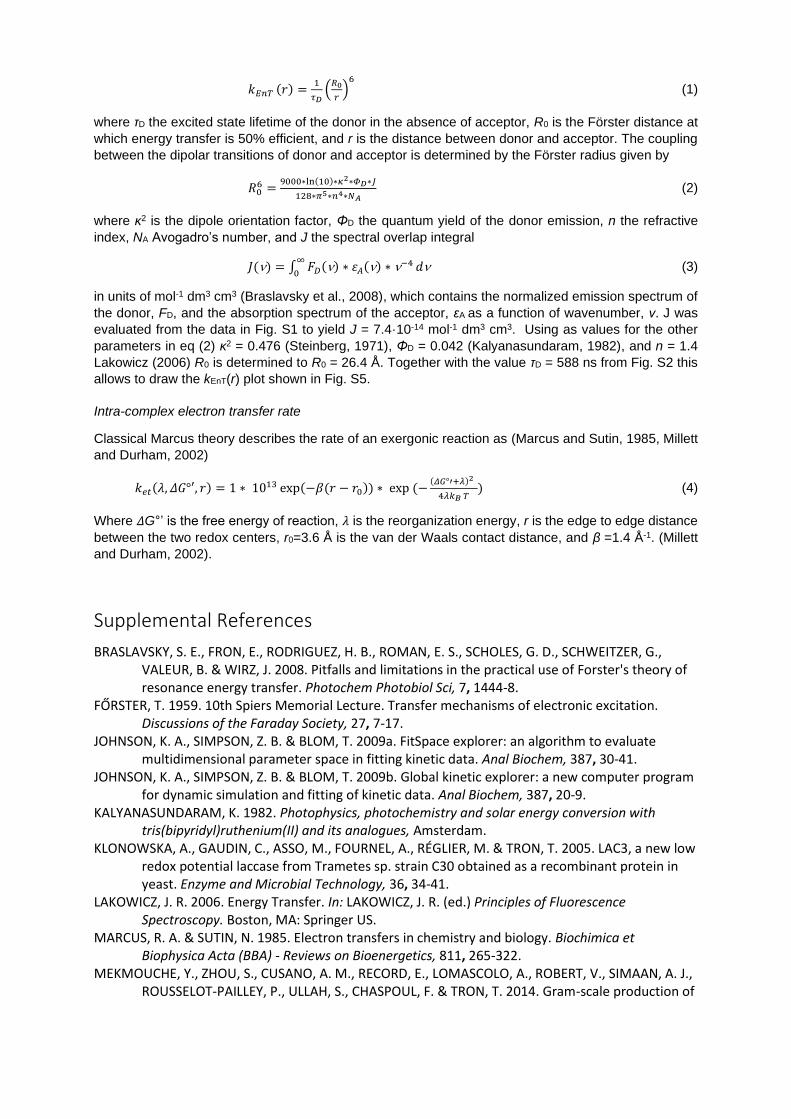
𝑘𝐸𝑛𝑇 (𝑟) =1
𝜏𝐷(
𝑅0
𝑟)
6
(1)
where τD the excited state lifetime of the donor in the absence of acceptor, R0 is the Förster distance at
which energy transfer is 50% efficient, and r is the distance between donor and acceptor. The coupling
between the dipolar transitions of donor and acceptor is determined by the Förster radius given by
𝑅06 =
9000∗ln(10)∗𝜅2∗𝛷𝐷∗𝐽
128∗𝜋5∗𝑛4∗𝑁𝐴 (2)
where κ2 is the dipole orientation factor, ΦD the quantum yield of the donor emission, n the refractive
index, NA Avogadro’s number, and J the spectral overlap integral
𝐽() = ∫ 𝐹𝐷() ∗ 𝜀𝐴() ∗ −4 𝑑∞
0 (3)
in units of mol-1 dm3 cm3 (Braslavsky et al., 2008), which contains the normalized emission spectrum of
the donor, FD, and the absorption spectrum of the acceptor, εA as a function of wavenumber, ν. J was
evaluated from the data in Fig. S1 to yield J = 7.4·10-14 mol-1 dm3 cm3. Using as values for the other
parameters in eq (2) κ2 = 0.476 (Steinberg, 1971), ΦD = 0.042 (Kalyanasundaram, 1982), and n = 1.4
Lakowicz (2006) R0 is determined to R0 = 26.4 Å. Together with the value τD = 588 ns from Fig. S2 this
allows to draw the kEnT(r) plot shown in Fig. S5.
Intra-complex electron transfer rate
Classical Marcus theory describes the rate of an exergonic reaction as (Marcus and Sutin, 1985, Millett
and Durham, 2002)
𝑘𝑒𝑡(𝜆, 𝛥𝐺°′, 𝑟) = 1 ∗ 1013 exp(−𝛽(𝑟 − 𝑟0)) ∗ exp (−(𝛥𝐺°′+𝜆)2
4𝜆𝑘𝐵 𝑇) (4)
Where 𝛥G°’ is the free energy of reaction, 𝜆 is the reorganization energy, r is the edge to edge distance
between the two redox centers, r0=3.6 Å is the van der Waals contact distance, and β =1.4 Å-1. (Millett
and Durham, 2002).
Supplemental References
BRASLAVSKY, S. E., FRON, E., RODRIGUEZ, H. B., ROMAN, E. S., SCHOLES, G. D., SCHWEITZER, G., VALEUR, B. & WIRZ, J. 2008. Pitfalls and limitations in the practical use of Forster's theory of resonance energy transfer. Photochem Photobiol Sci, 7, 1444-8.
FŐRSTER, T. 1959. 10th Spiers Memorial Lecture. Transfer mechanisms of electronic excitation. Discussions of the Faraday Society, 27, 7-17.
JOHNSON, K. A., SIMPSON, Z. B. & BLOM, T. 2009a. FitSpace explorer: an algorithm to evaluate multidimensional parameter space in fitting kinetic data. Anal Biochem, 387, 30-41.
JOHNSON, K. A., SIMPSON, Z. B. & BLOM, T. 2009b. Global kinetic explorer: a new computer program for dynamic simulation and fitting of kinetic data. Anal Biochem, 387, 20-9.
KALYANASUNDARAM, K. 1982. Photophysics, photochemistry and solar energy conversion with tris(bipyridyl)ruthenium(II) and its analogues, Amsterdam.
KLONOWSKA, A., GAUDIN, C., ASSO, M., FOURNEL, A., RÉGLIER, M. & TRON, T. 2005. LAC3, a new low redox potential laccase from Trametes sp. strain C30 obtained as a recombinant protein in yeast. Enzyme and Microbial Technology, 36, 34-41.
LAKOWICZ, J. R. 2006. Energy Transfer. In: LAKOWICZ, J. R. (ed.) Principles of Fluorescence Spectroscopy. Boston, MA: Springer US.
MARCUS, R. A. & SUTIN, N. 1985. Electron transfers in chemistry and biology. Biochimica et Biophysica Acta (BBA) - Reviews on Bioenergetics, 811, 265-322.
MEKMOUCHE, Y., ZHOU, S., CUSANO, A. M., RECORD, E., LOMASCOLO, A., ROBERT, V., SIMAAN, A. J., ROUSSELOT-PAILLEY, P., ULLAH, S., CHASPOUL, F. & TRON, T. 2014. Gram-scale production of
a basidiomycetous laccase in Aspergillus niger. Journal of Bioscience and Bioengineering, 117, 25-27.
MILLETT, F. & DURHAM, B. 2002. Design of photoactive ruthenium complexes to study interprotein electron transfer. Biochemistry, 41, 11315-24.
SOLOMON, E. I. 2016. Dioxygen Binding, Activation, and Reduction to H2O by Cu Enzymes. Inorg Chem, 55, 6364-75.
STEINBERG, I. Z. 1971. Long-range nonradiative transfer of electronic excitation energy in proteins and polypeptides. Annu Rev Biochem, 40, 83-114.
SUN, H., YOSHIMURA, A. & HOFFMAN, M. Z. 1994. Oxidative Quenching of the Excited-State of Tris(2,2'-Bipyridine)Ruthenium(2+) Ion by Methylviologen - Variation of Solution Medium and Temperature. Journal of Physical Chemistry, 98, 5058-5064.
WILSON, G. J., LAUNIKONIS, A., SASSE, W. H. F. & MAU, A. W. H. 1998. Chromophore-Specific Quenching of Ruthenium Trisbipyridine−Arene Bichromophores by Methyl Viologen. The Journal of Physical Chemistry A, 102, 5150-5156.


![Synthesis and Structure of trans-[O2(Im)4Tc]Cl•2H,O, trans-[O2(1-meIm1)4Tc]Cl•3H2O and Related Compounds](https://static.fdokumen.com/doc/165x107/63398ee975188717130476f6/synthesis-and-structure-of-trans-o2im4tccl2ho-trans-o21-meim14tccl3h2o.jpg)