Advances of RRAM Devices: Resistive Switching Mechanisms ...
ORIGINAL ARTICLE
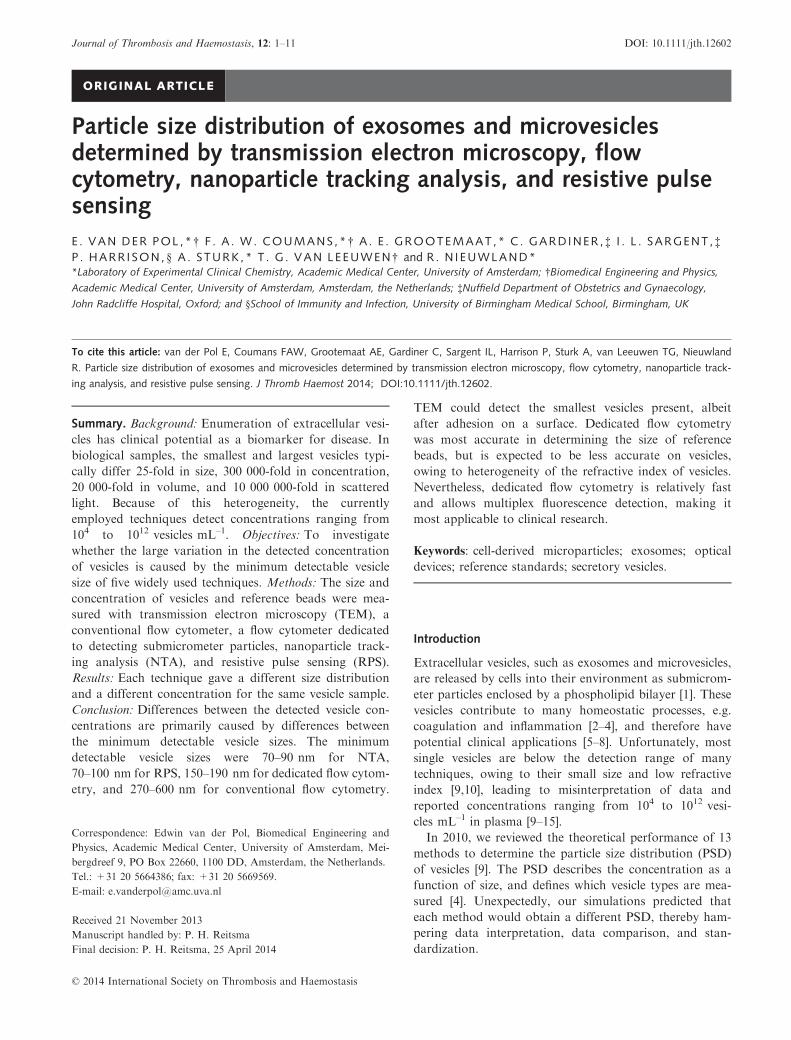
Particle size distribution of exosomes and microvesiclesdetermined by transmission electron microscopy, flowcytometry, nanoparticle tracking analysis, and resistive pulsesensing
E . VAN DER POL ,*† F . A . W. COUMANS ,*† A. E . GROOTEMAAT ,* C . GARDINER ,‡ I . L . SARGENT ,‡
P . HARR ISON,§ A. STURK ,* T . G . VAN LEEUWEN† and R . N IEUWLAND**Laboratory of Experimental Clinical Chemistry, Academic Medical Center, University of Amsterdam; †Biomedical Engineering and Physics,
Academic Medical Center, University of Amsterdam, Amsterdam, the Netherlands; ‡Nuffield Department of Obstetrics and Gynaecology,
John Radcliffe Hospital, Oxford; and §School of Immunity and Infection, University of Birmingham Medical School, Birmingham, UK
To cite this article: van der Pol E, Coumans FAW, Grootemaat AE, Gardiner C, Sargent IL, Harrison P, Sturk A, van Leeuwen TG, Nieuwland
R. Particle size distribution of exosomes and microvesicles determined by transmission electron microscopy, flow cytometry, nanoparticle track-
ing analysis, and resistive pulse sensing. J Thromb Haemost 2014; DOI:10.1111/jth.12602.
Summary. Background: Enumeration of extracellular vesi-
cles has clinical potential as a biomarker for disease. In
biological samples, the smallest and largest vesicles typi-
cally differ 25-fold in size, 300 000-fold in concentration,
20 000-fold in volume, and 10 000 000-fold in scattered
light. Because of this heterogeneity, the currently
employed techniques detect concentrations ranging from
104 to 1012 vesicles mL–1. Objectives: To investigate
whether the large variation in the detected concentration
of vesicles is caused by the minimum detectable vesicle
size of five widely used techniques. Methods: The size and
concentration of vesicles and reference beads were mea-
sured with transmission electron microscopy (TEM), a
conventional flow cytometer, a flow cytometer dedicated
to detecting submicrometer particles, nanoparticle track-
ing analysis (NTA), and resistive pulse sensing (RPS).
Results: Each technique gave a different size distribution
and a different concentration for the same vesicle sample.
Conclusion: Differences between the detected vesicle con-
centrations are primarily caused by differences between
the minimum detectable vesicle sizes. The minimum
detectable vesicle sizes were 70–90 nm for NTA,
70–100 nm for RPS, 150–190 nm for dedicated flow cytom-
etry, and 270–600 nm for conventional flow cytometry.
TEM could detect the smallest vesicles present, albeit
after adhesion on a surface. Dedicated flow cytometry
was most accurate in determining the size of reference
beads, but is expected to be less accurate on vesicles,
owing to heterogeneity of the refractive index of vesicles.
Nevertheless, dedicated flow cytometry is relatively fast
and allows multiplex fluorescence detection, making it
most applicable to clinical research.
Keywords: cell-derived microparticles; exosomes; optical
devices; reference standards; secretory vesicles.
Introduction
Extracellular vesicles, such as exosomes and microvesicles,
are released by cells into their environment as submicrom-
eter particles enclosed by a phospholipid bilayer [1]. These
vesicles contribute to many homeostatic processes, e.g.
coagulation and inflammation [2–4], and therefore have
potential clinical applications [5–8]. Unfortunately, most
single vesicles are below the detection range of many
techniques, owing to their small size and low refractive
index [9,10], leading to misinterpretation of data and
reported concentrations ranging from 104 to 1012 vesi-
cles mL–1 in plasma [9–15].In 2010, we reviewed the theoretical performance of 13
methods to determine the particle size distribution (PSD)
of vesicles [9]. The PSD describes the concentration as a
function of size, and defines which vesicle types are mea-
sured [4]. Unexpectedly, our simulations predicted that
each method would obtain a different PSD, thereby ham-
pering data interpretation, data comparison, and stan-
dardization.
Correspondence: Edwin van der Pol, Biomedical Engineering and
Physics, Academic Medical Center, University of Amsterdam, Mei-
bergdreef 9, PO Box 22660, 1100 DD, Amsterdam, the Netherlands.
Tel.: +31 20 5664386; fax: +31 20 5669569.
E-mail: [email protected]
Received 21 November 2013
Manuscript handled by: P. H. Reitsma
Final decision: P. H. Reitsma, 25 April 2014
© 2014 International Society on Thrombosis and Haemostasis
Journal of Thrombosis and Haemostasis, 12: 1–11 DOI: 10.1111/jth.12602

In this study, we performed an experimental evalua-
tion of five of the 13 methods. We selected the most
widely used methods capable of detecting single vesicles:
transmission electron microscopy (TEM), a conventional
flow cytometer, a flow cytometer dedicated to detecting
submicrometer particles, nanoparticle tracking analy-
sis (NTA), and resistive pulse sensing (RPS). The PSDs
of a standard population of reference beads and a
standard population of vesicles were measured with all
methods.
Materials and methods
PSD
Throughout this article, we define ‘size’ as the diameter of
a particle, and the PSD as the histogram of particle sizes,
providing the mean number of particles per milliliter per
10-nm bin [16]. Data processing and representation were
performed with ORIGINPRO (v8.0724; OriginLab Corpora-
tion, Northampton, MA, USA).
Reference beads
To create a reference sample with a known PSD, a mixture
of traceable polystyrene beads (Nanosphere; Thermo
Fisher, Waltham, MA, USA) was prepared in de-ionized
water. RPS measurements require a conductive medium;
therefore, the beads were suspended in electrolyte buffer
(Izon, Christchurch, New Zealand). The size and concen-
tration of the reference beads were selected to resemble
those of previously reported vesicle PSDs [9,11–13,15,17].Table 1 shows the size of the reference beads according to
TEM data of the manufacturer. The concentration
(beads mL�1) was derived from the specifications. Fig-
ure 1A shows the PSD of the reference beads under
the assumption that each subpopulation has a Gaussian
distribution. The reference sample contained five subpopu-
lations, among which larger beads have lower concentra-
tions. The total concentration was 3.1 9 109 beads mL�1.
Prior to analysis, the reference sample was sonicated for
10 s and vortexed for 10 s. Table 2 lists the diameters of
silica beads (Silica Oxide Size Standards [Corpuscular,
Cold Spring, NY, USA]; Plain Silica [Kisker, Steinfurt,
Germany]) used to calibrate the flow cytometers and NTA
instrument.
Vesicle standard
As isolation of vesicles from blood is challenging [18], we
selected urinary vesicles for our biological standard sam-
ple. Urine contains a relatively high concentration of vesi-
cles with low contamination [9]. Urine from five healthy
male individuals was collected, pooled, and centrifuged
twice (8 9 50 mL, 10 min, 180 9 g, 4 °C; and 20 min,
1550 9 g) to remove cells. Cell-free urine aliquots (12 mL)
were frozen in liquid nitrogen and stored at – 80 °C. Priorto analysis, samples were thawed on melting ice for 1 h,
centrifuged (10 min, 1550 9 g, 4 °C) to remove precipi-
tated salts, and diluted in 0.2-lm-filtered (MilliPore, Biller-
ica, MA, USA) phosphate-buffered saline.
TEM
Data from the manufacturer were used to create the PSD
of reference beads by TEM. For analysis of the vesicle
standard by TEM (CM-10; Philips, Eindhoven, The
Netherlands), vesicles were prepared and analyzed as
described in Data S1. To obtain the vesicle concentration,
we multiplied the mean number of vesicles per surface
area by the grid area, divided by the sample volume.
Here, we assumed that all vesicles adhered to the grid
and were distributed uniformly.
Conventional flow cytometry
A flow cytometer (FACSCalibur; BD, Franklin Lakes,
NJ, USA) with a 15-mW 488-nm laser was used to detect
Table 1 Catalog numbers, diameters and concentrations of the subpopulations of polystyrene reference beads as determined by five methods
Catalog number 3050A 3100A 3200A 3400A 3600A
Diameter (nm)
TEM 46 � 7 102 � 5 203 � 5 400 � 7 596 � 8
Conventional flow cytometer – – 209 � 8 427 � 33 592 � 20
Dedicated flow cytometer – 105 � 4 193 � 4 399 � 6 589 � 7
NTA 49 � 11 93 � 21 189 � 23 380 � 64 607 � 27
RPS – 104 � 10 200 � 10 418 � 31 623 � 36
Concentration (beads mL�1)
Prepared 2.0 9 109 1.0 9 109 1.0 9 108 1.0 9 107 1.0 9 106
Conventional flow cytometer 1.0 9 108 1.0 9 107 0.7 9 106
Dedicated flow cytometer 0.5 9 109 0.8 9 108 0.8 9 107 0.9 9 106
NTA 0.1 9 109 1.0 9 109 1.2 9 108 2.5 9 107 1.0 9 106
RPS 1.1 9 109 1.2 9 108 1.0 9 107 1.0 9 106
NTA, nanoparticle tracking analysis; RPS, resistive pulse sensing; TEM, transmission electron microscopy. Diameter is expressed as
mean � standard deviation.
© 2014 International Society on Thrombosis and Haemostasis
2 E. van der Pol et al

A
C
G
E
Diameter (nm)
TEM
Conventional flow cytometry
Dedicated flow cytometry
NTA Gain 650; shutter 26.67 ms Gain 100; shutter 1.67 ms
RPS NP100 NP400
Diameter (nm)
I
Vesicle standardReference beads
1010
108
106
104
1010
108
106
104
1010
108
106
104
1010
108
106
104
1010
108
106
104
1010
108
106
104
1010
108
106
104
1010
108
106
104
1010
108
106
104
1010
108
106
104
0 200 400 600 800 0 200 400 600 800
0 200 400 600 800 0 200 400 600 800
Sum 154 000 g fraction 18 900 g fraction
Diameter (nm)
TEM
Conventional flow cytometry
Dedicated flow cytometry
Con
cent
ratio
n (p
artic
les
mL–
1 )
Con
cent
ratio
n (p
artic
les
mL–
1 )
NTA Gain 650; shutter 26.67 ms Gain 400; shutter 26.67 ms
NP100 NP400
RPS
Diameter (nm)
B
D
H
F
J
Fig. 1. Particle size distribution (PSD). Concentrations (on a logarithmic scale) of the reference beads (left) and the vesicle standard (right)
detected by (A, B) transmission electron microscopy (TEM), (C, D) conventional flow cytometry, (E, F) dedicated flow cytometry, (G, H)
nanoparticle tracking analysis (NTA) and (I, J) resistive pulse sensing (RPS) are shown. The bin width is 10 nm. PSDs of the reference beads
(black line) were fitted by a sum of Gaussian functions (dotted red line). PSDs of the vesicle standard (black line) were fitted by a power-law
function (dashed green line). The PSD of the reference beads determined by TEM is based on data from the manufacturer. PSDs given by
NTA and RPS originate from two measurements with relatively high-sensitivity (black) and low-sensitivity (blue) settings.
© 2014 International Society on Thrombosis and Haemostasis
Particle size distribution of vesicles 3

side-scattered light (SSC) for 10 min at a flow rate of
~ 60 lL min�1. The detector settings are described in
Data S1. To calculate the particle concentration, the flow
rate was determined by weighting the sample volume
aspirated during 10 min. To prevent swarm detection
[15], the reference beads and vesicle standard were diluted
1000-fold (1.7 9 105 counts vs. 1.0 9 105 background
counts) and 100-fold (2.6 9 105 counts vs. 1.5 9 105
background counts), respectively. The absence of swarm
detection was confirmed by serial dilutions.
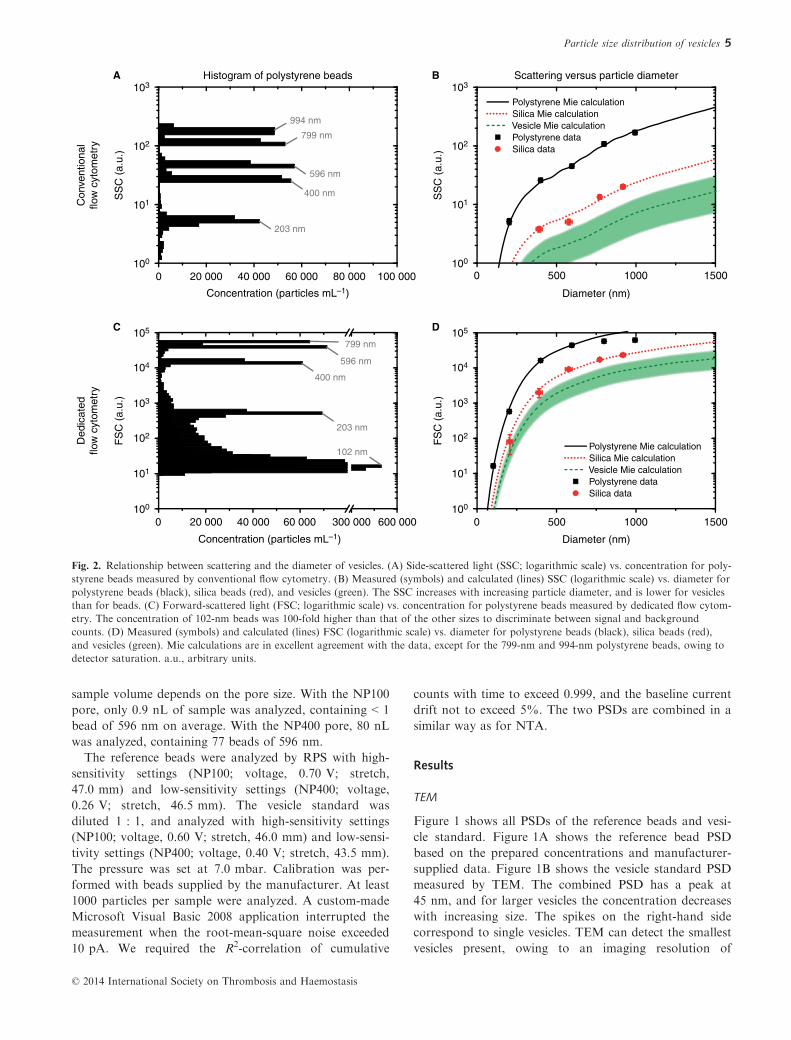
To relate SSC to a particle size, we calibrated the flow
cytometer with beads of known size and refractive index.
Figure 2A shows the SSC histogram of polystyrene beads.
Figure 2B shows the SSC of polystyrene and silica beads
vs. their size. The data were fitted by Mie theory, incor-
porating the size and refractive index of the beads and
the optical configuration of the instrument [19]. Mie cal-
culations were performed with the scripts of M€atzler [20]
in MATLAB (v7.9.0.529). The solid curve in Fig. 2B was
used to relate SSC to the size of the polystyrene reference
beads with a refractive index of 1.61 [15]. The dashed
curve in Fig. 2B was used to relate SSC to vesicle size,
with the assumption that vesicles are spheres with a
refractive index of 1.40, which was previously estimated
[14] and corresponds to the refractive index of cells
[21,22].
Dedicated flow cytometry
Throughout this article, we use ‘dedicated flow cytome-
try’ as a generic term for flow cytometers dedicated to
detecting submicrometer particles. A flow cytometer
(A50-Micro; Apogee, Hemel Hempstead, UK) with a
20-mW 488-nm laser was used to detect forward-scat-
tered light (FSC) and SSC. The detector settings are
described in Data S1. The sample volume injected by
the internal microsyringe was used to calculate the con-
centration of particles. In total, 1.4 9 105 reference
beads and 0.8 9 105 vesicles were analyzed. Analo-
gously to our approach for conventional flow cytome-
try, we related FSC to the vesicle size by using beads
and Mie theory, as illustrated for dedicated flow cytom-
etry in Fig. 2C,D.
NTA
A dark-field microscope (NS500; Nanosight, Amesbury,
UK) with a 45-mW 405-nm laser and an electron multi-
plying charge-coupled device (EMCCD) was used to
determine the PSD by tracking the Brownian motion of
single particles [12,23]. Measurements were performed
with two dilutions and two detection settings to increase
the effective size range, which is needed because light
scattered from the smallest and the largest beads differs
by five orders of magnitude, whereas the dynamic range
of the EMCCD is only approximately three orders of
magnitude. Consequently, settings suitable for detecting
46-nm beads would result in extreme saturation for 596-
nm beads. Two dilutions are needed, because a 50-fold
dilution is required to detect the smallest beads [23], but
at this dilution the probability of detecting a 596-nm bead
is < 0.5%.
Reference beads were analyzed with high-sensitivity set-
tings (diluted 1 : 50; shutter, 26.67 ms; gain, 650; thresh-
old, 22; 1.8 9 103 beads tracked) and low-sensitivity
settings (undiluted; shutter, 1.67 ms; gain, 100; threshold,
10; 1.1 9 104 beads tracked). We multiplied the concen-
tration as provided by the NTA software by the ratio
between the expected and measured concentrations of cal-
ibration beads [23]. This concentration calibration was
performed with 102-nm and 203-nm polystyrene beads
with concentrations of 2 9 107 and 1 9 108 beads mL�1
for the high-sensitivity and low-sensitivity settings, respec-
tively. The vesicle standard was analyzed with high-sensi-
tivity settings (diluted 1 : 500; shutter, 26.67 ms; gain,
650; threshold, 19; 1.0 9 103 vesicles tracked) and low-
sensitivity settings (diluted 1 : 100; shutter, 26.67 ms;
gain, 400; threshold, 10; 1.1 9 103 vesicles tracked). Con-
centration calibration was performed with 105-nm and
206-nm silica beads with a concentration of 1 9 108
beads mL�1 for both the high-sensitivity and low-sensitiv-
ity settings [23], as the refractive indices of silica and vesi-
cles are close.
Per sample, 20 videos of 30 s were captured at 22.0 °Cand analyzed by NTA v2.3.0.17 (Nanosight), assuming a
medium viscosity of 0.95 cP. To obtain the overall PSD
O(d), the PSDs obtained with high-sensitivity settings, H
(d), and low-sensitivity settings, L(d), were combined at
the size d0, where the concentrations were similar
[H(d0) � L(d0), O(d) = H(d) for all d ≤ d0; O(d) = L(d)
for all d > d0].
RPS
RPS (qNano; Izon) determines the PSD from resistance
pulses caused by particles moving through a pore. Mea-
surements were performed with two pore sizes, for two
reasons. First, for a single pore, the detectable size range
is at best five-fold, whereas our smallest and largest refer-
ence beads differ 12-fold in size. Second, the analyzed
Table 2 Manufacturers, catalog numbers and diameters of silica
beads obtained by imaging at least 500 beads with transmission elec-
tron microscopy
Manufacturer Catalog number Diameter (nm)
Corpuscular 147020-10 105 � 21
Kisker Psi-0.2 206 � 18
Psi-0.4 391 � 18
Psi-0.6 577 � 20
Psi-0.8 772 � 21
Psi-1.0 918 � 14
Diameter is expressed as mean � standard deviation.
© 2014 International Society on Thrombosis and Haemostasis
4 E. van der Pol et al
sample volume depends on the pore size. With the NP100
pore, only 0.9 nL of sample was analyzed, containing < 1
bead of 596 nm on average. With the NP400 pore, 80 nL
was analyzed, containing 77 beads of 596 nm.
The reference beads were analyzed by RPS with high-
sensitivity settings (NP100; voltage, 0.70 V; stretch,
47.0 mm) and low-sensitivity settings (NP400; voltage,
0.26 V; stretch, 46.5 mm). The vesicle standard was
diluted 1 : 1, and analyzed with high-sensitivity settings
(NP100; voltage, 0.60 V; stretch, 46.0 mm) and low-sensi-
tivity settings (NP400; voltage, 0.40 V; stretch, 43.5 mm).
The pressure was set at 7.0 mbar. Calibration was per-
formed with beads supplied by the manufacturer. At least
1000 particles per sample were analyzed. A custom-made
Microsoft Visual Basic 2008 application interrupted the
measurement when the root-mean-square noise exceeded
10 pA. We required the R2-correlation of cumulative
counts with time to exceed 0.999, and the baseline current
drift not to exceed 5%. The two PSDs are combined in a
similar way as for NTA.
Results
TEM
Figure 1 shows all PSDs of the reference beads and vesi-
cle standard. Figure 1A shows the reference bead PSD
based on the prepared concentrations and manufacturer-
supplied data. Figure 1B shows the vesicle standard PSD
measured by TEM. The combined PSD has a peak at
45 nm, and for larger vesicles the concentration decreases
with increasing size. The spikes on the right-hand side
correspond to single vesicles. TEM can detect the smallest
vesicles present, owing to an imaging resolution of
BA
SS
C (
a.u.
)
Diameter (nm)
Polystyrene Mie calculation Silica Mie calculation Vesicle Mie calculation Polystyrene data Silica data
Concentration (particles mL–1)
203 nm
400 nm
596 nm
799 nm
994 nm
100
101
102
103
100
101
102
103
100
101
102
103
105
104
100
101
102
103
105
104
SS
C (
a.u.
)
DC
Histogram of polystyrene beads Scattering versus particle diameterC
onve
ntio
nal
flow
cyt
omet
ryD
edic
ated
flow
cyt
omet
ry
Polystyrene Mie calculation Silica Mie calculation Vesicle Mie calculation Polystyrene data Silica data
FS
C (
a.u.
)
0 500 1000 1500
Diameter (nm)
0 500 1000 1500
0 20 000 40 000 60 000 80 000 100 000
0 20 000 40 000 60 000 300 000 600 000
Concentration (particles mL–1)
203 nm
400 nm
596 nm
799 nm
102 nm
FS
C (
a.u.
)
Fig. 2. Relationship between scattering and the diameter of vesicles. (A) Side-scattered light (SSC; logarithmic scale) vs. concentration for poly-
styrene beads measured by conventional flow cytometry. (B) Measured (symbols) and calculated (lines) SSC (logarithmic scale) vs. diameter for
polystyrene beads (black), silica beads (red), and vesicles (green). The SSC increases with increasing particle diameter, and is lower for vesicles
than for beads. (C) Forward-scattered light (FSC; logarithmic scale) vs. concentration for polystyrene beads measured by dedicated flow cytom-
etry. The concentration of 102-nm beads was 100-fold higher than that of the other sizes to discriminate between signal and background
counts. (D) Measured (symbols) and calculated (lines) FSC (logarithmic scale) vs. diameter for polystyrene beads (black), silica beads (red),
and vesicles (green). Mie calculations are in excellent agreement with the data, except for the 799-nm and 994-nm polystyrene beads, owing to
detector saturation. a.u., arbitrary units.
© 2014 International Society on Thrombosis and Haemostasis
Particle size distribution of vesicles 5

~ 1 nm. However, sample preparation may cause a reduc-
tion in vesicle size [18,24,25]. In addition, limited and
non-uniform adhesion of vesicles on the surface may
affect the PSD.
Conventional flow cytometry
Figure 1C shows that the smallest polystyrene bead
detected by conventional flow cytometry was 203 nm,
and that the peaks were broadened as compared with the
reference bead PSD. Figure 1D shows that the first bin of
the vesicle standard PSD corresponds to 340 nm, which is
140 nm larger than the smallest detected polystyrene
bead, owing to refractive index differences. The detected
concentration was 1.8 9 107 vesicles mL�1.
Dedicated flow cytometry
Dedicated flow cytometry is capable of detecting single
102-nm polystyrene beads, as shown in Fig. 1E. The width
of the peaks is comparable to the reference bead PSD.
Figure 1F shows that the first bin of the vesicle standard
PSD corresponds to 160 nm. Consequently, dedicated flow
cytometry detected approximately twice as small and
thereby 18-fold more vesicles than conventional flow
cytometry. The detected concentration was 3.3 9 108 vesi-
cles mL�1. Figure 1D,F was produced on the assumption
of a vesicle refractive index of 1.40 [14,21,22].
NTA
Figure 1G shows the reference bead PSD as detected by
NTA. By combining two measurements with different set-
tings, NTA detected all reference bead sizes, although
only 5% of the 46-nm beads were detected. Tracking of
46-nm beads was hindered by the presence of larger beads
that saturated the camera. Figure 1G also shows that the
peaks overlap because of broadening, which we attribute
to the uncertainty in the measured diffusion coefficient,
resulting from a limited track length and the uncertainty
in the particle position. Figure 1H shows the vesicle stan-
dard PSD obtained by combining two different settings.
The peak at 95 nm is broad as compared with other
vesicle PSDs. The smallest detectable vesicles appear to
be 10 nm, which we attribute to broadening of the PSD.
Using identical settings, we could detect only 5% of the
46-nm polystyrene beads, which have comparable light
scattering to a 70–90-nm vesicle.
RPS
Figure 1I shows the reference bead PSD as detected by
RPS. Through combination of measurements with an
NP100 and NP400 pore, beads of 102 nm and larger were
detected. The peaks are broadened as compared with the
reference bead PSD, which may be caused by particle
aggregation, electronic noise, and a varying pore dimen-
sion during the measurement. Figure 1J shows the vesicle
standard PSD with a peak at 75 nm.
Power-law function to describe the PSD of vesicles
The PSDs of vesicles are fitted by a mathematical func-
tion to enable quantitative comparison. To select the
most appropriate function, we fitted the vesicle standard
PSD with six empirical functions that are frequently used
to describe PSDs of particles in suspension [16], and per-
formed goodness-of-fit tests (Data S1). The Gamma func-
tion, Weibull distribution and power-law function
resulted in the best fits. Of these functions, we selected
the power-law function, as it is least susceptible to mini-
mum detectable vesicle size. The right panels of Fig. 1
show PSDs of the vesicle standards fitted by the power-
law function (dashed lines).
Measurement error and coefficient of variation (CV) of the
reference beads
The measured reference bead PSDs in Fig. 1 were fitted
by a sum of Gaussian functions (dotted lines) to derive
the mean and standard deviation of the size and the con-
centration for each subpopulation of beads (Table 1).
The symbols in Fig. 3A indicate the relative measurement
error of the size as the percentage difference between the
measurement and the manufacturer specification. Because
TEM data were used as reference, its relative size error is
set at 0%. The relative size error of the other methods
was < 9%. Dedicated flow cytometry had the lowest error
in sizing beads, followed by RPS, conventional flow
cytometry, and NTA. We attribute the low error of flow
cytometry to the homogeneous refractive index of poly-
styrene and the strong relationship between size and scat-
tering power (Fig. 2). The error of RPS was limited
because of specific measurement restrictions, as described
in Materials and methods. We attribute the relatively
large error of NTA to the uncertainty in the measured
diffusion coefficient.
The error bars in Fig. 3A indicate the CV, which is the
percentage ratio between the standard deviation and the
mean size, and is thus a measure of the width of the
peaks in Fig. 1. Owing to the high resolution of TEM as
compared with the measured standard deviation of the
bead sizes, this standard deviation is a close approxima-
tion of the actual size of the beads. The lowest CVs were
obtained by dedicated flow cytometry, followed by
conventional flow cytometry, RPS, and NTA.
Figure 3B shows the relative measurement error in
determining the concentration of subpopulations of refer-
ence beads. RPS was most accurate in determining the
concentration of beads, followed by conventional flow
cytometry, dedicated flow cytometry, and NTA. The error
of RPS was limited because of specific measurement
© 2014 International Society on Thrombosis and Haemostasis
6 E. van der Pol et al

restrictions. With flow cytometry, the concentration was
derived from the flow rate, which has an uncertainty of
10%. Dedicated flow cytometry underestimated the
concentration of 102-nm beads, as these beads were close
to the detection threshold. NTA was the least accurate
method for determining the concentration of beads, possi-
bly because of broadening of the PSD and crosstalk
between 203-nm beads and 400-nm beads. The concentra-
tion of 46-nm beads was underestimated, as tracking of
46-nm beads was hindered by the presence of larger beads
that saturated the camera.
Concentration of vesicles
Figure 4 shows the detected concentration of vesicles per
technique. As compared with RPS and NTA, conven-
tional flow cytometry underestimates the concentration of
vesicles almost 300-fold, whereas the more sensitive
dedicated flow cytometer underestimates the vesicle
concentration 15-fold. With TEM, the detected concentra-
tion was affected by sample preparation losses.
Discussion and conclusion
In this study, we compared the abilities of five commonly
used methods to determine the PSD of vesicles in suspen-
sion. A reference mixture of polystyrene beads with
known PSD (Fig. 1A) and a vesicle standard from urine
(Fig. 1B) were measured by each method. In agreement
with our theoretical review [9], each technique gives a dif-
ferent PSD for the same sample. By comparing the vesicle
PSDs and combining these results with the knowledge
obtained from reference beads, however, many differences
are now explained.
–40
–20
0
20
40
RPSNTA
RPSNTA
Dedicatedflow cytometry
Conventionalflow cytometry
TEM
–100
0
100
200
Rel
ativ
e co
ncen
trat
ion
erro
r (%
)R
elat
ive
size
err
or ±
CV
(%
)
46 n
m10
2 nm
203
nm40
0 nm
Specified
596
nm
46 n
m10
2 nm
203
nm40
0 nm
596
nm
Conventionalflow cytometry
Dedicatedflow cytometry
A
B
Fig. 3. Relative error (symbols) and coefficient of variation (CV) (error bars) in determining the size (A) and concentration (B) of TEM, con-
ventional flow cytometry, dedicated flow cytometry, nanoparticle tracking analysis (NTA) and resistive pulse sensing (RPS) for 46-nm beads
(black), 102-nm beads (red), 203-nm beads (blue), 400-nm beads (green) and 596-nm beads (brown) from the reference mixture. Subpopulations
that could not be detected are indicated by red crosses.
© 2014 International Society on Thrombosis and Haemostasis
Particle size distribution of vesicles 7

Throughout the Results section, we have discussed the
requirements and assumptions involved in the measured
PSDs. Table 3 summarizes these requirements and
assumptions, and also lists the minimum detectable vesicle
size, the measurement times, and the capabilities to obtain
functional information, such as fluorescence. In the next
section, we will discuss our approach and the results in
more detail.
TEM
To obtain the size of the reference beads (Fig. 1A), we
used traceable TEM measurements of the manufacturer.
Traceability means that the measurement result is related
to SI units through an unbroken chain of comparisons
with known uncertainties [26,27]. To characterize beads,
TEM is particularly useful, as beads are not affected by
sample preparation, and the resolution of TEM is higher
than the size of the beads. For comparison purposes, we
set the relative size error of TEM to 0 (Fig. 3A). How-
ever, the relative size error of the reference beads ranges
from 1.0% for the 596-nm beads to 4.3% for the 46-nm
beads. The TEM data also provide the CV of the beads,
which is a measure of the spread in bead sizes. Conse-
quently, the error bars in Fig. 3A represent not only the
imprecision of the instrument, i.e. the broadening of the
reference bead PSD caused by the instrument, but also
the CV of the reference beads.
We derived the reference bead concentrations from the
manufacturer-specified mass concentration, density and
size of the beads. Note that the concentration of submi-
crometer beads is not traceable, as uncertainties in the
mass concentration and density of the beads are
unknown. The mass concentration is often provided with
single-digit precision, and the density of silica beads may
range from 1.8 to 2.5 g cm�3. Consequently, the bead
concentration and error thereof are unknown, and the rel-
ative concentration errors can only be mutually compared
(Fig. 3B).
TEM analysis of vesicles involves two centrifugation
steps and extensive sample preparation. To quantify the
influence of these preanalytic variables on the obtained
PSD (Fig. 1B), we overlapped the power-law functions of
TEM and RPS, which required horizontal and vertical
stretching of the RPS data with factors of 0.88 and 0.21,
respectively. Considering RPS to be the most reliable
method for determining the PSD of vesicles, we hypothe-
size that vesicles shrink by 12%, owing to fixation and
dehydration, and that 21% of the vesicles are recovered
after centrifugation and binding to the formvar coating.
Table 3 Assessed capabilities of techniques for the detection of single vesicles in suspension
Method
Minimum detectable
vesicle size (nm)
Size requirements
and/or assumptions
Concentration
requirements and/or
assumptions
Additional
features
Measurement
time
TEM ~ 1 No shrinkage
Equivalent circular size
100% surface binding
No centrifugation losses
Immunogold
labeling
H
Conventional
flow cytometry
270–600 Calibration with beads
Spherical particle,
n = 1.40 � 0.02
Q Fluorescence S
Dedicated flow
cytometry
150–190 Calibration with beads
Spherical particle,
n = 1.40 � 0.02
Q Fluorescence S
NTA 70–90 T, g, DDSpherical particle
Calibration with beads
Iv(d,n) = Ib
Zeta potential
Fluorescence
M
RPS 70–100 Calibration with beads
Spherical particle,
rv � rm
Calibration with beads
Q dominated by QP
Zeta potential M
NTA, nanoparticle tracking analysis; RPS, resistive pulse sensing; TEM, transmission electron microscopy. For each technique, the minimum
detectable vesicle size, ability to measure the size and concentration and the requirements for this, ability to detect additional features, and
measurement time are estimated. We derived the minimum detectable vesicle size of RPS from six measurements performed with different
NP100 pores. d is the vesicle diameter, DD is the uncertainty in the diffusion coefficient, Iv and Ib are the scattering intensities of a vesicle and
a calibration bead, respectively, g is the viscosity of the solvent, n is the vesicle refractive index, Q is the flow rate, QP is the flow rate caused
by external pressure, rv are rm are the electrical conductivities of a vesicle and the medium, respectively, and T is the temperature of the sol-
vent. The measurement time is indicated by S, M, and H, meaning < 1 min, between 1 min and 1 h, and > 1 h, respectively.
TEM Conventionalflow
cytometry
Dedicatedflow
cytometry
NTA RPS104
106
108
1010C
once
ntra
tion
(par
ticle
s m
L–1)
Fig. 4. Total detected concentration (logarithmic scale) of vesicles
detected by transmission electron microscopy (TEM), conventional
flow cytometry, dedicated flow cytometry, nanoparticle tracking
analysis (NTA), and resistive pulse sensing (RPS).
© 2014 International Society on Thrombosis and Haemostasis
8 E. van der Pol et al

Flow cytometry
To relate the measured light scattering to a particle size,
we calibrated flow cytometers by using beads and Mie
theory (Fig. 2), assuming spherical particles of known
refractive index. As beads meet these criteria, Mie theory
can be used to determine their PSD (Fig. 1C,E), resulting
in dedicated flow cytometry being the most accurate in
sizing beads (Fig. 3A). However, the refractive index of
vesicles is probably heterogeneous and not exactly known
[28], thereby affecting the PSD of vesicles obtained by
flow cytometry (Fig. 1D,F). For example, under the
assumption that the vesicle refractive index is
1.40 � 0.02, the minimum detectable vesicle sizes are
270–600 nm for conventional flow cytometry and 150–190 nm for dedicated flow cytometry (Table 3). We attri-
bute the high concentration of vesicles > 340 nm obtained
by conventional flow cytometry relative to other tech-
niques to background counts. An advantage of flow
cytometry is knowledge of the analyzed sample volume,
such that the particle concentration can be determined
without calibration with beads.
NTA
The PSD of beads determined by NTA shows extensive
broadening as compared with the other techniques
(Figs. 1G and 3A). In addition, the determined concen-
tration of vesicles requires careful interpretation. The
manufacturer or user calibrates the instrument with beads
to relate the mean number of scatterers in the field-of-
view to the concentration [23]. This calibration is valid
for a vesicle size that scatters the same amount of light
as the calibration beads. The concentration of smaller
vesicles is underestimated, whereas the concentration of
larger vesicles is overestimated. Moreover, the concentra-
tion of beads is not traceable. To obtain the minimum
detectable vesicle size of 70–90 nm, we related the scatter-
ing of 46-nm polystyrene beads, which were at the limit
of detection, to the diameter of vesicles by using Mie the-
ory.
Software often applies unknown and undesired opera-
tions to the data. For example, Fig. 5 shows the reference
bead PSD detected by NTA with the low-sensitivity set-
tings and processed by NTA v2.3.5.16 (Nanosight). Analy-
sis of the videos with this newer software results in a
PSD (blue line) different from that in Fig. 1G (blue line).
The software generates a batch summary file, wherein a
rolling average is applied to the raw data, resulting in a
smoother but less correct representation of the data (gray
line). Application of finite track length adjustment
(FTLA) results in narrower peaks, a decreased accuracy
of the determined mean diameters, and the presence of an
additional peak at 445 nm (brown line). As FTLA intro-
duces artefacts, the application of FTLA to polydisperse
samples is not recommended.
RPS
Accurate sizing of vesicles by RPS requires that the elec-
trical conductivity of a particle is negligible as compared
with the conductivity of the electrolyte [16,29]. As poly-
styrene beads, cells and intact vesicles meet this require-
ment [30], we believe that the detected vesicle size is
representative for urinary vesicles (Fig. 1J). However, our
measurement restrictions made the RPS measurements
impractical. The major concerns with RPS are pore
clogging and pore stability. In the case of pore clogging,
we reversed the pressure or temporarily applied a high
pressure with a plunger. As the pores are stretchable,
plunging may change the pore dimensions, as observed
by a change in the baseline current. If the baseline current
changed by > 5%, we repeated the measurement and cali-
bration, resulting in a measurement time of several hours.
The concentration is obtained by calibration with beads
[29], which is inaccurate, because the concentration of
used beads is not traceable. As the flow rate is mainly
determined by pressure across the pore, and not by elec-
tro-osmosis or electrophoresis, the differences between the
zeta potentials of vesicles and calibration beads are negli-
gible. Consequently, the accuracy in determining the vesi-
cle concentration is expected to be comparable to that for
the mixture of beads.
Single-vesicle detection as a biomarker
A biomarker based on vesicle enumeration should deter-
mine the concentration of a specific vesicle type. For this
determination, the technique must obtain biochemical
0 200 400 600 800104
106
108
NTA v.2.3.5 build 16
Con
cent
ratio
n (p
artic
les
mL–
1 )
Diameter (nm)
Raw data Rolling average FTLA
Fig. 5. Particle size distribution (PSD) of the reference beads
detected by nanoparticle tracking analysis (NTA) with low-sensitivity
settings and processed by NTA v2.3.5.16 software (Nanosight). The
bin width is 10 nm. The software provides raw data (blue line), a
rolling average of the data (gray line), and data processed with the
finite track length adjustment (FTLA) algorithm (brown line), result-
ing in different PSDs. The FTLA algorithm results in a peak (brown
arrow) that is absent in the rolling average of the data.
© 2014 International Society on Thrombosis and Haemostasis
Particle size distribution of vesicles 9
information to identify specific vesicles, and the measure-
ment time should not exceed several minutes. Further-
more, size accuracy and precision are important, e.g. to
distinguish vesicles from platelets. Our findings demon-
strate that any reported concentration needs to be accom-
panied by the minimum detectable vesicle size. For
example, the shaded area in Fig. 1J shows that a decrease
in the minimum detectable vesicle size from 80 nm to
60 nm would result in a 2.4-fold increase in the obtained
concentration. Therefore, we propose daily monitoring of
the minimum detectable vesicle size, as day-to-day varia-
tion is expected for each instrument. Alternatively, a
power-law fit may be applied to compare concentrations
obtained with different minimum detectable vesicle sizes.
An additional requirement for comparison of concentra-
tions is traceable determination of both size and concen-
tration, which is problematic for techniques that calibrate
the concentration with untraceable beads.
In conclusion, each technique gave a different PSD for
the same vesicle sample. Differences between the detected
vesicle concentrations are primarily caused by differences
between the minimum detectable vesicle sizes. The mini-
mum detectable vesicle sizes were 70–90 nm for NTA,
70–100 nm for RPS, 150–190 nm for dedicated flow
cytometry, and 270–600 nm for conventional flow cytom-
etry. TEM could detect the smallest vesicles present,
albeit after adhesion on a surface. Dedicated flow cytome-
try was most accurate in determining the size of reference
beads, but is expected to be less accurate on vesicles,
owing to heterogeneity of the refractive index of vesicles.
A reliable estimate of the vesicle refractive index is
required to convert the optical scatter signal detected by
flow cytometry to size. Nevertheless, dedicated flow
cytometry is relatively fast and allows multiplex fluores-
cence detection, making it most applicable to clinical
research.
Addendum
E. van der Pol, R. Nieuwland, and T. G. van Leeuwen con-
ceived and designed the research. E. van der Pol and A. E.
Grootemaat acquired the data. C. Gardiner, E. van der
Pol, F. A. Coumans, R. Nieuwland, and T. G. van Leeu-
wen interpreted the data. E. van der Pol, F. A. Coumans,
and R. Nieuwland wrote the manuscript. All authors
reviewed and made critical revisions to the manuscript.
Acknowledgements
The authors would like to acknowledge E. van der Pol,
Wageningen University, the Netherlands, for statistical
support. Part of this work was funded by the EMRP
(European Metrology Research Programme) under the
Joint Research Project HLT02 (www.metves.eu). The
EMRP is jointly funded by the EMRP participating
countries within the European Association of National
Metrology Institutes and the European Union.
Disclosure of Conflict of Interests
The authors state that they have no conflict of interest.
Supporting Information
Additional Supporting Information may be found in the
online version of this article:
Data S1. Methods and mathematical function to fit the
particle size distribution of vesicles.
REFERENCES
1 Conde-Vancells J, Rodriguez-Suarez E, Embade N, Gil D, Matt-
hiesen R, Valle M, Elortza F, Lu SC, Mato JM, Falcon-Perez JM.
Characterization and comprehensive proteome profiling of exo-
somes secreted by hepatocytes. J Proteome Res 2008; 7: 5157–66.2 Ratajczak J, Wysoczynski M, Hayek F, Janowska-Wieczorek A,
Ratajczak MZ. Membrane-derived microvesicles: important and
underappreciated mediators of cell-to-cell communication. Leuke-
mia 2006; 20: 1487–95.3 Simons M, Raposo G. Exosomes – vesicular carriers for intercel-
lular communication. Curr Opin Cell Biol 2009; 21: 575–81.4 van der Pol E, B€oing AN, Harrison P, Sturk A, Nieuwland R.
Classification, functions and clinical relevance of extracellular
vesicles. Pharmacol Rev 2012; 64: 676–705.5 Berckmans RJ, Sturk A, Schaap MC, Nieuwland R. Cell-derived
vesicles exposing coagulant tissue factor in saliva. Blood 2011;
117: 3172–80.6 Manly DA, Wang JG, Glover SL, Kasthuri R, Liebman HA,
Key NS, Mackman N. Increased microparticle tissue factor
activity in cancer patients with venous thromboembolism.
Thromb Res 2010; 125: 511–12.7 Rautou PE, Leroyer AS, Ramkhelawon B, Devue C, Duflaut D,
Vion AC, Nalbone G, Castier Y, Leseche G, Lehoux S, Tedgui
A, Boulanger CM. Microparticles from human atherosclerotic
plaques promote endothelial ICAM-1-dependent monocyte adhe-
sion and transendothelial migration. Circ Res 2011; 108: 335–43.8 EL Andaloussi S, Maeger I, Breakefield XO, Wood MJA. Extra-
cellular vesicles: biology and emerging therapeutic opportunities.
Nat Rev Drug Discovery 2013; 12: 348–58.9 van der Pol E, Hoekstra AG, Sturk A, Otto C, van Leeuwen
TG, Nieuwland R. Optical and non-optical methods for detec-
tion and characterization of microparticles and exosomes. J
Thromb Haemost 2010; 8: 2596–607.10 van der Pol E, Coumans F, Varga Z, Krumrey M, Nieuwland
R. Innovation in detection of microparticles and exosomes. J
Thromb Haemost 2013; 11: 36–45.11 de Vrij J, Maas SL, van Nispen M, Sena-Esteves M, Limpens
RW, Koster AJ, Leenstra S, Lamfers ML, Broekman ML.
Quantification of nanosized extracellular membrane vesicles with
scanning ion occlusion sensing. Nanomedicine 2013; 1–16.12 Dragovic RA, Gardiner C, Brooks AS, Tannetta DS, Ferguson
DJP, Hole P, Carr B, Redman CWG, Harris AL, Dobson PJ,
Harrison P, Sargent IL. Sizing and phenotyping of cellular vesi-
cles using nanoparticle tracking analysis. Nanomedicine 2011; 7:
780–8.13 Yuana Y, Oosterkamp TH, Bahatyrova S, Ashcroft B, Garcia
RP, Bertina RM, Osanto S. Atomic force microscopy: a novel
© 2014 International Society on Thrombosis and Haemostasis
10 E. van der Pol et al

approach to the detection of nanosized blood microparticles. J
Thromb Haemost 2010; 8: 315–23.14 Konokhova AI, Yurkin MA, Moskalensky AE, Chernyshev AV,
Tsvetovskaya GA, Chikova ED, Maltsev VP. Light-scattering
flow cytometry for identification and characterization of blood
microparticles. J Biomed Opt 2012; 17: 0570061–8.15 van der Pol E, van Gemert MJC, Sturk A, Nieuwland R, van
Leeuwen TG. Single versus swarm detection of microparticles
and exosomes by flow cytometry. J Thromb Haemost 2012; 10:
919–30.16 Jonasz M, Fournier GR. Light Scattering by Particles in Water,
1st edn. London: Academic Press, 2007.
17 Nieuwland R, van der Pol E, Gardiner C, Sturk A. Platelet-
derived microparticles. In: Michelson AD, ed. Platelets, 3rd edn.
San Diego, CA: Academic Press, 2012: 453–67.18 Yuana Y, Bertina RM, Osanto S. Pre-analytical and analytical
issues in the analysis of blood microparticles. Thromb Haemost
2011; 105: 396–408.19 Bohren CF, Huffman DR. Absorption and Scattering of Light by
Small Particles. New York, NY: Wiley, 1983.
20 M€atzler C. MATLAB functions for Mie scattering and absorp-
tion. 2002–11. 2002. Institut f€ur Angewandte Physik.
21 van Manen HJ, Verkuijlen P, Wittendorp P, Subramaniam V,
van den Berg TK, Roos D, Otto C. Refractive index sensing of
green fluorescent proteins in living cells using fluorescence life-
time imaging microscopy. Biophys J 2008; 94: L67–9.22 Beuthan J, Minet O, Helfmann J, Herrig M, Muller G. The spa-
tial variation of the refractive index in biological cells. Phys Med
Biol 1996; 41: 369–82.
23 Gardiner C, Ferreira YJ, Dragovic RA, Redman CWG, Sargent
IL. Extracellular vesicle sizing and enumeration by nanoparticle
tracking analysis. J Extracell Vesicles 2013; 2: 1–11.24 Th�ery C, Amigorena S, Raposo G, Clayton A. Isolation and
characterization of exosomes from cell culture supernatants
and biological fluids. Curr Protoc Cell Biol 2006; 30: 3.22.1–22.29.
25 Jensen OA, Prause JU, Laursen H. Shrinkage in preparatory
steps for SEM – a study on rabbit corneal endothelium. Albrecht
Von Graefes Arch Klin Exp Ophthalmol 1981; 215: 233–42.26 Meli F, Klein T, Buhr E, Frase CG, Gleber G, Krumrey M,
Duta A, Duta S, Korpelainen V, Bellotti R, Picotto GB, Boyd
RD, Cuenat A. Traceable size determination of nanoparticles, a
comparison among European metrology institutes. Meas Sci
Technol 2012; 23: 125005.
27 Varga Z, Yuana Y, Grootemaat AE, van der Pol E, Gollwitzer
C, Krumrey M, Nieuwland R. Towards traceable size determina-
tion of extracellular vesicles. J Extracell Vesicles 2014; 3: 1–10.28 Issman L, Brenner B, Talmon Y, Aharon A. Cryogenic transmis-
sion electron microscopy nanostructural study of shed micropar-
ticles. PLoS One 2013; 8: e83680.
29 Kachel V. Electrical resistance pulse sizing: Coulter sizing. In:
Hoffman RA, ed. Flow Cytometry and Sorting, 2nd edn. New
York, NY: Wiley-Liss, 1990: 45–80.30 Montesinos E, Esteve I, Guerrero R. Comparison between direct
methods for determination of microbial cell-volume – electron-
microscopy and electronic particle sizing. Appl Environ Microbiol
1983; 45: 1651–8.
© 2014 International Society on Thrombosis and Haemostasis
Particle size distribution of vesicles 11
Copyright © 2022 FDOKUMEN