Alternative Fillers for the Production of Bituminous Mixtures
Upload
independentCategory
view
0download
0
C A R B O N 4 7 ( 2 0 0 9 ) 9 8 1 – 9 9 7
. sc iencedi rec t . com
ava i lab le a t wwwjournal homepage: www.elsevier .com/ locate /carbon
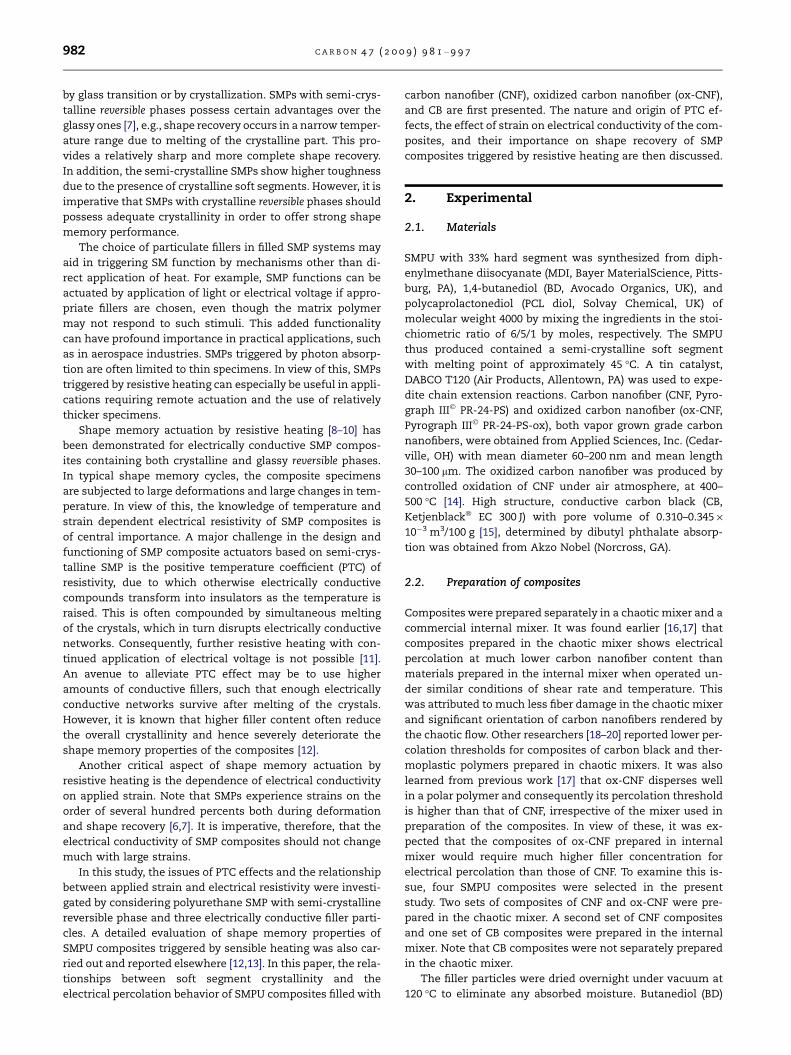
Carbonaceous fillers for shape memory actuationof polyurethane composites by resistive heating
I. Sedat Gunes, Guillermo A. Jimenez1, Sadhan C. Jana*
Department of Polymer Engineering, The University of Akron, 250 South Forge Street, Akron, OH 44325-0301, United States
A R T I C L E I N F O
Article history:
Received 4 August 2008
Accepted 28 November 2008
Available online 11 December 2008
0008-6223/$ - see front matter � 2008 Elsevidoi:10.1016/j.carbon.2008.11.053
* Corresponding author: Fax: +1 330 258 2339E-mail address: [email protected] (S.C. Ja
1 Present address: Laboratory of Polymers
A B S T R A C T
The effectiveness of carbonaceous, electrically conductive fillers in shape memory actua-
tion of polyurethane composites by resistive heating was evaluated. Specifically, the depen-
dence of electrical resistivity on specimen temperature and imposed tensile strains
encountered in shape memory test cycles was determined for shape memory polyurethane
(SMPU) composites of carbon nanofiber (CNF), oxidized carbon nanofiber (ox-CNF), and car-
bon black (CB). The SMPU composites with crystalline soft segments were synthesized from
diphenylmethane di-isocyanate, 1,4-butanediol, and poly(caprolactone)diol in a low-shear
chaotic mixer and in an internal mixer. The materials synthesized in the chaotic mixer
showed higher soft segment crystallinity and lower electrical percolation threshold. A
reduction in soft segment crystallinity was observed in the presence of CNF and ox-CNF;
the reduction was smaller in the case of ox-CNF. Only the composites of CB showed pro-
nounced positive temperature coefficient (PTC) effects. The observed PTC effects bore a
close relationship with non-linear thermal expansion during heating. The composites of
CNF and ox-CNF did not show PTC effects due to low levels of soft segment crystallinity.
The resistivity of composites of CB increased by several orders of magnitude with imposed
tensile strain while composites of CNF and ox-CNF showed weak dependence on strain.
� 2008 Elsevier Ltd. All rights reserved.
1. Introduction
Freeman Dyson, a famous physicist and popular science wri-
ter envisioned in 1986 the concept of ‘space butterfly’, a new
generation of micro-spacecraft with morphing antennae or
wing-like structures [1]. The antennae can be stored in com-
pact form, readily deployed in flight, and their orientation
and length span can be easily controlled by electric current
generating devices. This vision is now close to reality due to
recent advances in the area of electrically triggered shape
memory polymers (SMP) and SMP nanocomposites [2]. SMPs
are a class of stimuli responsive materials, which recover the
original shapes from large deformation when subjected to
an external stimulus [3]. SMPs are commonly multi-phase
er Ltd. All rights reserved
.na).
(POLIUNA), School of Che
materials comprised of a fixed phase and a reversible phase.
The fixed phases are usually formed by thermally stable
‘cross-link’ points such as crystals, glassy domains, chain
entanglements, or chemical cross-links that prevent ‘free’
flow of surrounding polymer chains upon application of stress
even at elevated temperatures. The reversible phase, on the
other hand, undergoes deformation and shrinkage in a shape
memory cycle and is responsible for elasticity in the materials
[4]. A basic mechanism of shape recovery involves ‘shrinkage’
of oriented, extended chains of the reversible phase triggered,
for example, by melting or glass transition [5]. SMPs undergo-
ing shape recovery by shrinkage of oriented chains are classi-
fied as rubberlike SMP [6]. In rubberlike SMPs, the deformation
of chains and chain segments is preserved due to vitrification
.mistry, Universidad Nacional, Heredia, Costa Rica.
982 C A R B O N 4 7 ( 2 0 0 9 ) 9 8 1 – 9 9 7
by glass transition or by crystallization. SMPs with semi-crys-
talline reversible phases possess certain advantages over the
glassy ones [7], e.g., shape recovery occurs in a narrow temper-
ature range due to melting of the crystalline part. This pro-
vides a relatively sharp and more complete shape recovery.
In addition, the semi-crystalline SMPs show higher toughness
due to the presence of crystalline soft segments. However, it is
imperative that SMPs with crystalline reversible phases should
possess adequate crystallinity in order to offer strong shape
memory performance.
The choice of particulate fillers in filled SMP systems may
aid in triggering SM function by mechanisms other than di-
rect application of heat. For example, SMP functions can be
actuated by application of light or electrical voltage if appro-
priate fillers are chosen, even though the matrix polymer
may not respond to such stimuli. This added functionality
can have profound importance in practical applications, such
as in aerospace industries. SMPs triggered by photon absorp-
tion are often limited to thin specimens. In view of this, SMPs
triggered by resistive heating can especially be useful in appli-
cations requiring remote actuation and the use of relatively
thicker specimens.
Shape memory actuation by resistive heating [8–10] has
been demonstrated for electrically conductive SMP compos-
ites containing both crystalline and glassy reversible phases.
In typical shape memory cycles, the composite specimens
are subjected to large deformations and large changes in tem-
perature. In view of this, the knowledge of temperature and
strain dependent electrical resistivity of SMP composites is
of central importance. A major challenge in the design and
functioning of SMP composite actuators based on semi-crys-
talline SMP is the positive temperature coefficient (PTC) of
resistivity, due to which otherwise electrically conductive
compounds transform into insulators as the temperature is
raised. This is often compounded by simultaneous melting
of the crystals, which in turn disrupts electrically conductive
networks. Consequently, further resistive heating with con-
tinued application of electrical voltage is not possible [11].
An avenue to alleviate PTC effect may be to use higher
amounts of conductive fillers, such that enough electrically
conductive networks survive after melting of the crystals.
However, it is known that higher filler content often reduce
the overall crystallinity and hence severely deteriorate the
shape memory properties of the composites [12].
Another critical aspect of shape memory actuation by
resistive heating is the dependence of electrical conductivity
on applied strain. Note that SMPs experience strains on the
order of several hundred percents both during deformation
and shape recovery [6,7]. It is imperative, therefore, that the
electrical conductivity of SMP composites should not change
much with large strains.
In this study, the issues of PTC effects and the relationship
between applied strain and electrical resistivity were investi-
gated by considering polyurethane SMP with semi-crystalline
reversible phase and three electrically conductive filler parti-
cles. A detailed evaluation of shape memory properties of
SMPU composites triggered by sensible heating was also car-
ried out and reported elsewhere [12,13]. In this paper, the rela-
tionships between soft segment crystallinity and the
electrical percolation behavior of SMPU composites filled with
carbon nanofiber (CNF), oxidized carbon nanofiber (ox-CNF),
and CB are first presented. The nature and origin of PTC ef-
fects, the effect of strain on electrical conductivity of the com-
posites, and their importance on shape recovery of SMP
composites triggered by resistive heating are then discussed.
2. Experimental
2.1. Materials
SMPU with 33% hard segment was synthesized from diph-
enylmethane diisocyanate (MDI, Bayer MaterialScience, Pitts-
burg, PA), 1,4-butanediol (BD, Avocado Organics, UK), and
polycaprolactonediol (PCL diol, Solvay Chemical, UK) of
molecular weight 4000 by mixing the ingredients in the stoi-
chiometric ratio of 6/5/1 by moles, respectively. The SMPU
thus produced contained a semi-crystalline soft segment
with melting point of approximately 45 �C. A tin catalyst,
DABCO T120 (Air Products, Allentown, PA) was used to expe-
dite chain extension reactions. Carbon nanofiber (CNF, Pyro-
graph III� PR-24-PS) and oxidized carbon nanofiber (ox-CNF,
Pyrograph III� PR-24-PS-ox), both vapor grown grade carbon
nanofibers, were obtained from Applied Sciences, Inc. (Cedar-
ville, OH) with mean diameter 60–200 nm and mean length
30–100 lm. The oxidized carbon nanofiber was produced by
controlled oxidation of CNF under air atmosphere, at 400–
500 �C [14]. High structure, conductive carbon black (CB,
Ketjenblack� EC 300 J) with pore volume of 0.310–0.345 ·10�3 m3/100 g [15], determined by dibutyl phthalate absorp-
tion was obtained from Akzo Nobel (Norcross, GA).
2.2. Preparation of composites
Composites were prepared separately in a chaotic mixer and a
commercial internal mixer. It was found earlier [16,17] that
composites prepared in the chaotic mixer shows electrical
percolation at much lower carbon nanofiber content than
materials prepared in the internal mixer when operated un-
der similar conditions of shear rate and temperature. This
was attributed to much less fiber damage in the chaotic mixer
and significant orientation of carbon nanofibers rendered by
the chaotic flow. Other researchers [18–20] reported lower per-
colation thresholds for composites of carbon black and ther-
moplastic polymers prepared in chaotic mixers. It was also
learned from previous work [17] that ox-CNF disperses well
in a polar polymer and consequently its percolation threshold
is higher than that of CNF, irrespective of the mixer used in
preparation of the composites. In view of these, it was ex-
pected that the composites of ox-CNF prepared in internal
mixer would require much higher filler concentration for
electrical percolation than those of CNF. To examine this is-
sue, four SMPU composites were selected in the present
study. Two sets of composites of CNF and ox-CNF were pre-
pared in the chaotic mixer. A second set of CNF composites
and one set of CB composites were prepared in the internal
mixer. Note that CB composites were not separately prepared
in the chaotic mixer.
The filler particles were dried overnight under vacuum at
120 �C to eliminate any absorbed moisture. Butanediol (BD)
C A R B O N 4 7 ( 2 0 0 9 ) 9 8 1 – 9 9 7 983
and PCL diol were also dried overnight under vacuum at 45 �C;
nuclear magnetic resonance (NMR) and thermogravimetric
analysis (TGA) of dried BD and PCL diol specimens indicated
the absence of detectable residual water. All composites were
prepared using a two-step bulk polymerization method. The
prepolymer was synthesized from MDI and PCL diol and
chain extended with BD in the presence of tin catalyst. The
prepolymer was synthesized by allowing MDI and PCL diol
to react at 80 �C for 2 h under nitrogen with mechanical stir-
ring. The composites of CB and CNF with 1, 3, and 5 wt% fill-
ers were prepared in Brabender Plasticorder internal mixer
(model EPL 7752). For this purpose, the chain extension reac-
tion of prepolymer with BD was carried out at 110 �C for 2 min
in the presence of 9.8 · 10�4 mol/L tin catalyst. Filler particles
were then mixed with chain extended polymer for another
5 min with a set temperature of 140 �C. The temperature in
the mixer rose to 165 �C with the addition of filler particles
and then stabilized at 160 �C. The ox-CNF composites and a
second set of CNF composites were prepared in a chaotic mix-
er with mixing chamber volume of 70 cm3 and a gap of
12.5 mm between two circular rotors [21–23]. In this case,
approximately 80 g of molten prepolymer was hand-mixed
at 60 �C with proper amounts of CNF or ox-CNF followed by
mixing with 6.5 g of BD. The mixture was poured in the cha-
otic mixer preheated at 110 �C and mixed for 5 min. The circu-
lar rotors with a diameter of 12.7 mm were co-rotated in a
sinusoidal fashion (Eq. (1)) at peak angular speed (X, Eq. (1))
of 65 rpm, which generated a peak shear rate of 9.5 and
5.4 s�1 at the rotor surface and at the mixing chamber walls.
The time-averaged mean shear rate was 3.8 s�1. In Eq. (1),
X1 and X2 represent the angular speeds of rotors 1 and 2,
respectively, t is time, and T is the time-period
X1 ¼ X 1þ cos2ptT
� �; X2 ¼ X 1� cos
2ptT
� �; 0 6 t 6 T ð1Þ
The angular displacement of rotors in a time-period, h (�XT)
was 8p radians in order to produce wide-spread chaotic mix-
ing [22]. After synthesis, the composites were compression
molded at a pressure of 25 MPa and temperature of 220 �C into
specimens of 0.5 mm thickness. The total time for compres-
sion molding was 3 min, which prevented thermal degrada-
tion of the materials. The molded specimens were cold
compressed at room temperature for 15 min at a pressure of
25 MPa to produce flat, smooth specimen.
2.3. Characterization
The electrical resistivity of the composites was measured
using a four-probe Keithley 8009 resistivity tester and a Keith-
ley 487 picoammeter/voltage source obtained from Keithley
(Cleveland, OH). The dependence of electrical resistivity on
temperature was determined by measuring the electrical
resistivity while heating the composite specimens to desired
temperatures in a compression molder at a pressure of
5 MPa. It was confirmed that a minimum of 5 MPa pressure
was required for good mechanical contact. This was deter-
mined by measuring resistivity at various pressures up to
25 MPa. The susceptibility of electrical resistivity to imposed
tensile strain was determined by subjecting the composite
specimens to desired tensile strain at 60 �C in a tensile tester
(Instron 4204, Norwood, MA) fitted with a heating chamber.
The electrical resistivity of the specimen was simultaneously
measured. A layer of silver paste was applied on the compos-
ite specimens to obtain good electrical contact between the
specimen and the electrodes. Note that the conductive com-
posite specimens were stretched in a tensile tester at 60 �Cto produce specimens for shape memory tests.
The quality of filler dispersion in composite specimens
was examined by electron microscopy techniques. Approxi-
mately 70 nm thick specimens were microtomed under
cryogenic conditions using Reichert Ultracut S/FC S ultrami-
crotome (Leica, Germany) for transmission electron micros-
copy (TEM) using TEM device JEM-1200EXII (JEOL, Japan) at
120 kV. The scanning electron microscopy (SEM) images were
taken with SEM S-2150 microscope (Hitachi, Japan) at 20 kV
after sputter coating the cryogenically fractured specimens
with silver using a K575x sputter coater (Emitech, UK) under
argon atmosphere. The crystallinity and glass transition
temperature (Tg) of the soft segment phase were determined
using a differential scanning calorimetry (DSC) device, TA
instruments DSC-29210 (New Castle, DE) under nitrogen
atmosphere at a heating rate of 10 �C per minute in the
range �100 to 230 �C. During the first thermal scan, the spec-
imens were heated at a scanning rate of 10 �C/min to 230 �Cand then quenched to �100 �C at an average cooling rate of
70 �C/min using liquid nitrogen. The sample was subjected
to second thermal scan over a temperature range of �100
to 230 �C with a heating rate of 10 �C/min. The first thermal
scan was relatively more representative of the actual shape
memory testing cycle. The second thermal scan was per-
formed to gain further insight on crystallization behavior
of the composites. The DSC traces from the first and second
thermal scans were used to obtain the heat of fusion. The
percentage of crystallinity was determined by comparing
the heat of fusion obtained from DSC with the heat of fusion
of 100% crystalline PCL diol, 136 J/g [24]. PCL diol and BD
samples were examined for residual water after drying un-
der vacuum using TGA and NMR. A TGA equipment (TA
Instruments 2050, New Castle, DE) was used for this pur-
pose. A typical specimen of 6 mg weight was subjected to
analysis under nitrogen at a heating rate of 5�C/min, over
a temperature interval of 25–250 �C. The 1H NMR spectra
were recorded at room temperature with a Varian Mercury
300 MHz spectrometer (Varian Inc., Palo Alto, CA) with di-
methyl sulfoxide as the solvent. Thermal stability of poly-
urethane specimens was investigated using TGA with
typical specimens weighing approximately 6 mg subjected
to thermal scans from room temperature up to 1000 �C, un-
der nitrogen atmosphere, and at a scan rate of 20 �C/min.
The temperature at the onset of thermal degradation or 5%
mass loss, T1, was estimated from the specimen mass versus
temperature curves. The temperature at the maximum loss
rate, T2, was obtained from the plot of the first derivative
of the mass loss versus temperature curves. It was suggested
that the thermal degradation of PU occurred in two consec-
utive stages [25]. First, the degradation of hard segments
took place by dissociation of urethane groups to the initial
alcohol and isocyanate groups [25]. Further heating caused
depolymerization and degradation of soft segments [25].
984 C A R B O N 4 7 ( 2 0 0 9 ) 9 8 1 – 9 9 7
Hence, the temperature T1 represented degradation behavior
of the hard segments, whereas the temperature T2 repre-
sented degradation of the soft segments. The molecular
weights (MW) of polymers were determined with gel perme-
ation chromatography method (GPC) using Waters 510 sys-
tem (Milford, MA) with triple detection scheme and a
polystyrene standard. The polydispersity index of the sam-
ple was determined from the ratio of weight average molec-
ular weight to the number average molecular weight. The
extent of hydrogen bonding in composite specimens, cast
as films from solution in dimethylformamide, was deter-
mined using Fourier-transform infrared spectroscopy
(FT-IR). For this purpose, the hydrogen bonding index, R
was determined as the ratio of areas of deconvoluted peaks
due to hydrogen bonded (�1700 cm�1) and free (�1730 cm�1)
carbonyl groups that appeared in infrared spectrum of
SMPU. The FT-IR spectra were recorded using Nicolet 4700
FT-IR Spectrometer with TGS Detector (Thermo Scientific,
Waltham, MA) in micro-attenuated total reflectance (micro-
ATR) mode. A micro-ATR fixture with a diamond crystal
and single bounce (SensIR Technologies, DuraScope, Dan-
bury, CT) was used for this purpose and scans were taken
at a resolution of 4 cm�1. The coefficient of thermal expan-
sion (CTE) of specimens was determined using a PerkinElmer
Pyris Diamond Dynamic Mechanical Analyzer (DMA, Wal-
tham, MA) in F-control mode. Note that the DMA fixtures
also underwent expansion and contraction, respectively,
during heating and cooling steps. The extent of such expan-
sion and contraction was determined by calibrating the DMA
set up using strips of copper with 99.999% purity. The heat-
ing rate was kept at 5 �C/min and at least 3 different repli-
cates for each condition were tested over the temperature
range of �60 to 120 �C. It was found that the CTE of DMA fix-
ture was 7.6 · 10�6/�C with a standard deviation of about 15%
[26]. The experimental data on composite specimens were
corrected using this value. It was reported elsewhere [26]
that the CTE of composite specimens included in this work
was approximately an order of magnitude higher than that
of the DMA fixture. The specimens were annealed at 90 �Cfor 48 h under vacuum before any testing was done. This
eliminated any potential chain orientation originated from
compression molding of the specimen. It was recognized
that residual chain orientation would have triggered shape
recovery as the test temperature approached the crystalline
melting region. Therefore, the values reported in this work
were not influenced by shape recovery of oriented chains.
Also note that the annealing temperature of 90 �C was se-
lected well below the onset temperature of thermal degrada-
tion of SMPU, �300 �C under nitrogen (Section 3.2). It was
also found that annealing under vacuum did not influence
the thermal and mechanical properties of the specimens.
The nature of surface functional groups on CB particles
was determined using X-ray photoelectron spectroscopy
(XPS) method. The XPS spectra were obtained using a Kratos
Model ES3000 spectrometer (Manchester, UK) under high
vacuum conditions with a pressure of 10�8 Torr, an alumi-
num anode, and a resolution of 1 eV. The assignment of
peak locations and corresponding fitting of XPS spectra were
performed with a curve fitting and data analysis software,
Fityk 0.7.7 (http://www.unipress.waw.pl/fityk).
3. Results and discussion
3.1. Morphology and surface characteristics of fillers
The morphology, graphitic content, and chemical nature of
surfaces of graphitic carbonaceous fillers bear close relation-
ship with the values of electrical resistivity. Typical resistivity
value of conductive CB is 0.5 X cm [27], carbon fiber (CF) is
0.001 X cm [28], multi-wall carbon nanotubes (MWCNT) is
50–100 · 10�6 X cm [29], and single-wall carbon nanotubes
[30] and graphite single crystals [31] is 40 · 10�6 X cm, in
increasing order of graphitic content. The resistivity of CNF
used in this work was reported to be 55 · 10�6 X cm by the
supplier. The single fiber resistivity data on ox-CNF was not
available, although it was expected to be lower than that of
CNF due to the presence of non-conductive oxygen contain-
ing functional groups on the fiber surfaces [17]. The single
fibers of CNF and ox-CNF differed in morphology as seen from
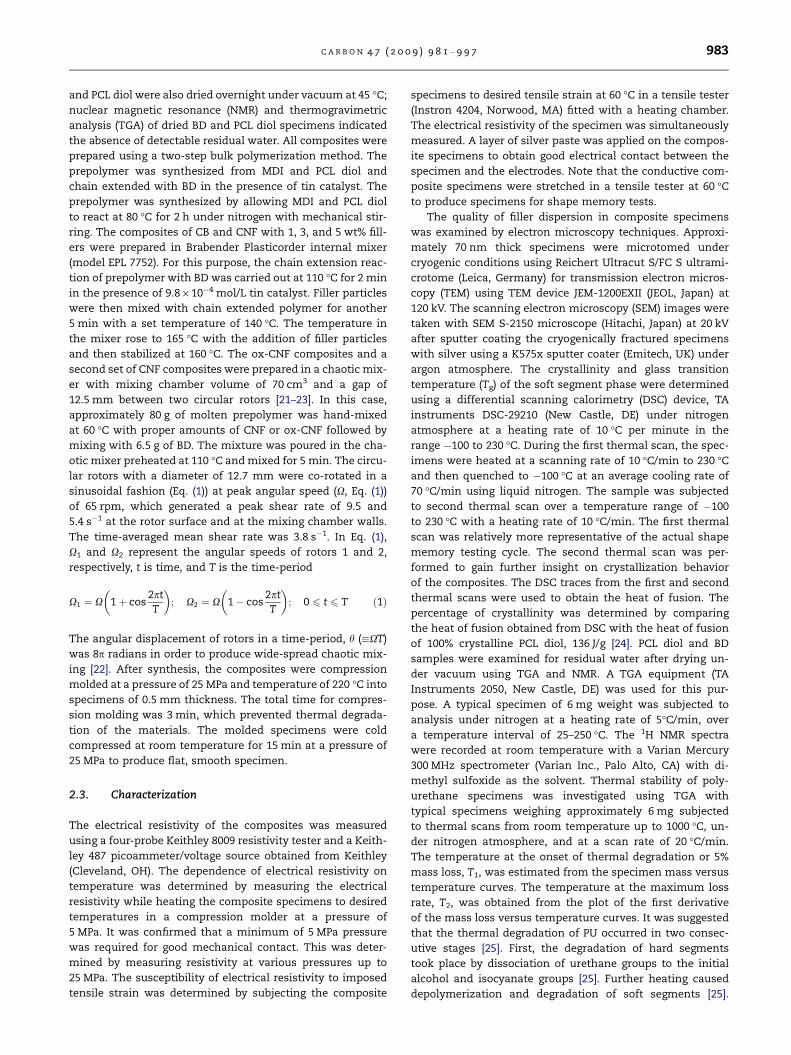
the TEM images in Fig. 1. Fig. 1a presents the cross-sectional
view of CNF which bears resemblance to the typical stacked
morphology of MWCNT [32]. It is evident from Fig. 1a that
CNF consisted of a number of concentric tubes, although like
MWCNT, many of them ceased to grow up to the very end of
the single fiber. A carbon nanotube is seen on the CNF surface
in Fig. 1a, purportedly grown from an occasional catalyst par-
ticle left on the nanofiber surface. Unlike the smooth surfaces
of CNF in Fig. 1a, the surfaces of ox-CNF particles contained
imperfections, as revealed from Fig. 1b. These imperfections
were generated at the time of oxidation of the nanofibers
and conversion of graphitic carbon into polar, organic func-
tional groups as was observed in the case of oxidized
MWCNTs by other researchers [33]. The conversion of gra-
phitic carbon in turn caused an increase of electrical resistiv-
ity of the oxidized fibers.
The polar, organic functional groups, such as ether, ester,
and carboxylic acid groups were identified on ox-CNF sur-
faces using XPS [17]. It was found that these polar functional
groups significantly improved the dispersion of ox-CNF parti-
cles in polar polymers, such as polyurethanes and polymeth-
ylmethacrylate (PMMA) [17]. In view of this, the CB particles
were also analyzed by XPS to determine the presence of polar,
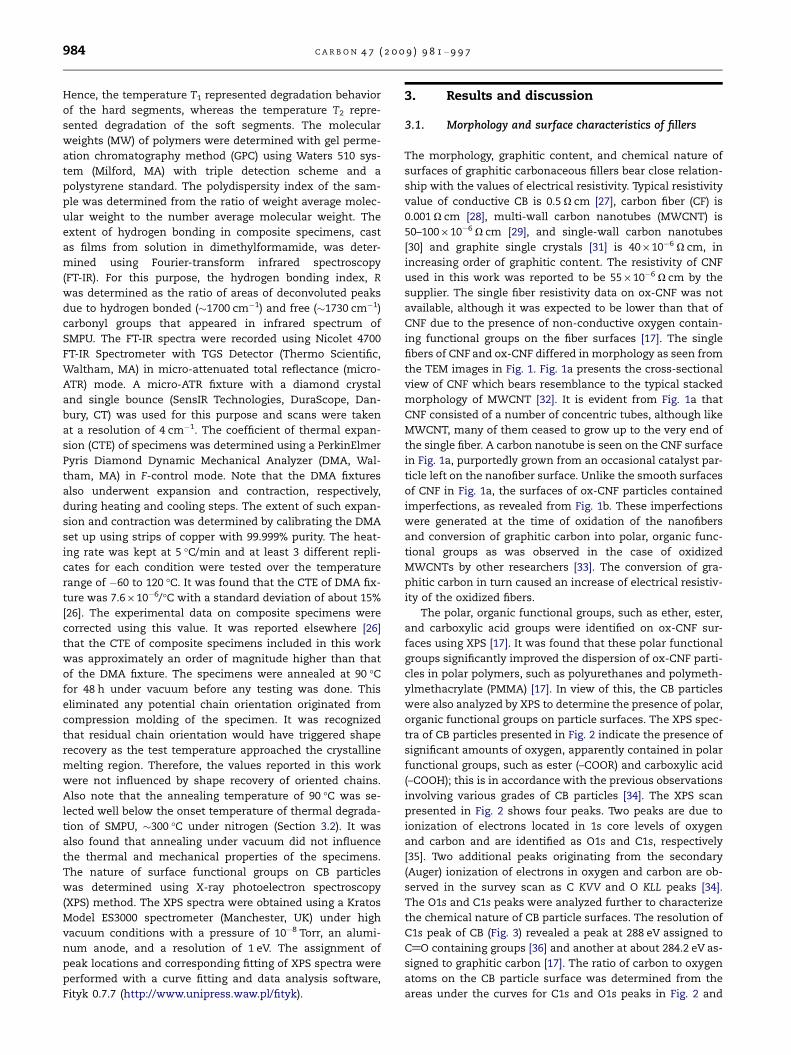
organic functional groups on particle surfaces. The XPS spec-
tra of CB particles presented in Fig. 2 indicate the presence of
significant amounts of oxygen, apparently contained in polar
functional groups, such as ester (–COOR) and carboxylic acid
(–COOH); this is in accordance with the previous observations
involving various grades of CB particles [34]. The XPS scan
presented in Fig. 2 shows four peaks. Two peaks are due to
ionization of electrons located in 1s core levels of oxygen
and carbon and are identified as O1s and C1s, respectively
[35]. Two additional peaks originating from the secondary
(Auger) ionization of electrons in oxygen and carbon are ob-
served in the survey scan as C KVV and O KLL peaks [34].
The O1s and C1s peaks were analyzed further to characterize
the chemical nature of CB particle surfaces. The resolution of
C1s peak of CB (Fig. 3) revealed a peak at 288 eV assigned to
C@O containing groups [36] and another at about 284.2 eV as-
signed to graphitic carbon [17]. The ratio of carbon to oxygen
atoms on the CB particle surface was determined from the
areas under the curves for C1s and O1s peaks in Fig. 2 and
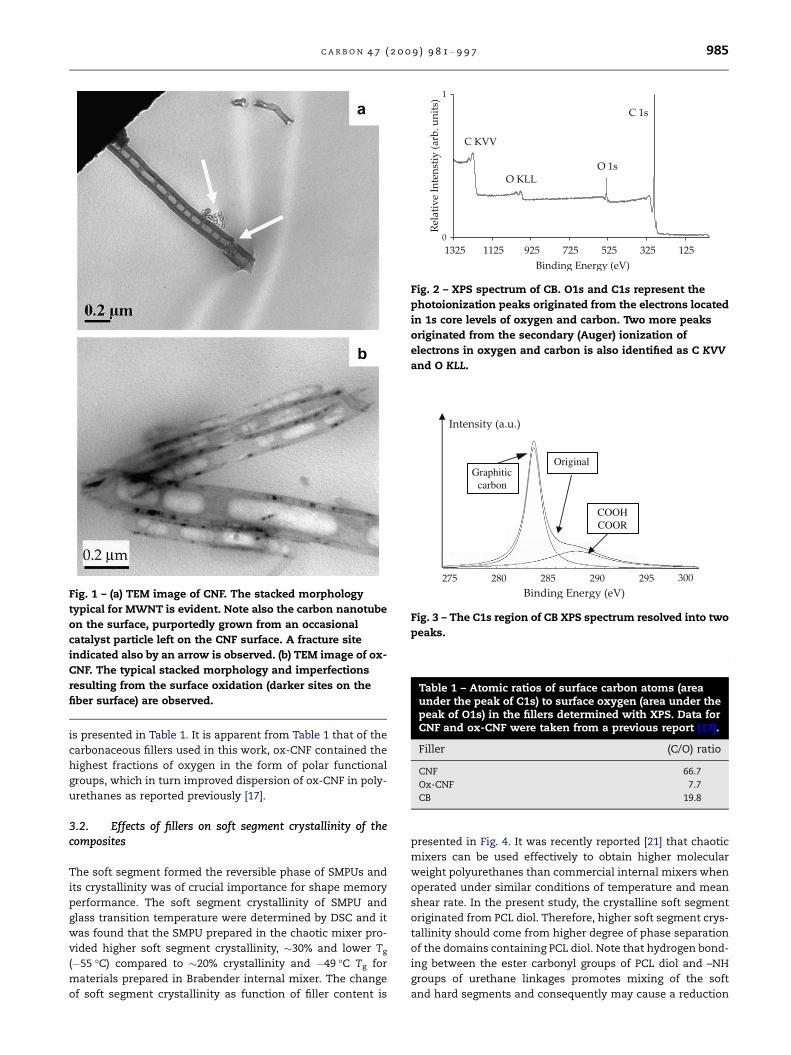
Original Graphitic
carbon
COOH COOR
Fig. 3 – The C1s region of CB XPS spectrum resolved into two
peaks.
Fig. 1 – (a) TEM image of CNF. The stacked morphology
typical for MWNT is evident. Note also the carbon nanotube
on the surface, purportedly grown from an occasional
catalyst particle left on the CNF surface. A fracture site
indicated also by an arrow is observed. (b) TEM image of ox-
CNF. The typical stacked morphology and imperfections
resulting from the surface oxidation (darker sites on the
fiber surface) are observed.
Fig. 2 – XPS spectrum of CB. O1s and C1s represent the
photoionization peaks originated from the electrons located
in 1s core levels of oxygen and carbon. Two more peaks
originated from the secondary (Auger) ionization of
electrons in oxygen and carbon is also identified as C KVV
and O KLL.
Table 1 – Atomic ratios of surface carbon atoms (areaunder the peak of C1s) to surface oxygen (area under thepeak of O1s) in the fillers determined with XPS. Data forCNF and ox-CNF were taken from a previous report [17].
Filler (C/O) ratio
CNF 66.7
Ox-CNF 7.7
CB 19.8
C A R B O N 4 7 ( 2 0 0 9 ) 9 8 1 – 9 9 7 985
is presented in Table 1. It is apparent from Table 1 that of the
carbonaceous fillers used in this work, ox-CNF contained the
highest fractions of oxygen in the form of polar functional
groups, which in turn improved dispersion of ox-CNF in poly-
urethanes as reported previously [17].
3.2. Effects of fillers on soft segment crystallinity of thecomposites
The soft segment formed the reversible phase of SMPUs and
its crystallinity was of crucial importance for shape memory
performance. The soft segment crystallinity of SMPU and
glass transition temperature were determined by DSC and it
was found that the SMPU prepared in the chaotic mixer pro-
vided higher soft segment crystallinity, �30% and lower Tg
(�55 �C) compared to �20% crystallinity and �49 �C Tg for
materials prepared in Brabender internal mixer. The change
of soft segment crystallinity as function of filler content is
presented in Fig. 4. It was recently reported [21] that chaotic
mixers can be used effectively to obtain higher molecular
weight polyurethanes than commercial internal mixers when
operated under similar conditions of temperature and mean
shear rate. In the present study, the crystalline soft segment
originated from PCL diol. Therefore, higher soft segment crys-
tallinity should come from higher degree of phase separation
of the domains containing PCL diol. Note that hydrogen bond-
ing between the ester carbonyl groups of PCL diol and –NH
groups of urethane linkages promotes mixing of the soft
and hard segments and consequently may cause a reduction
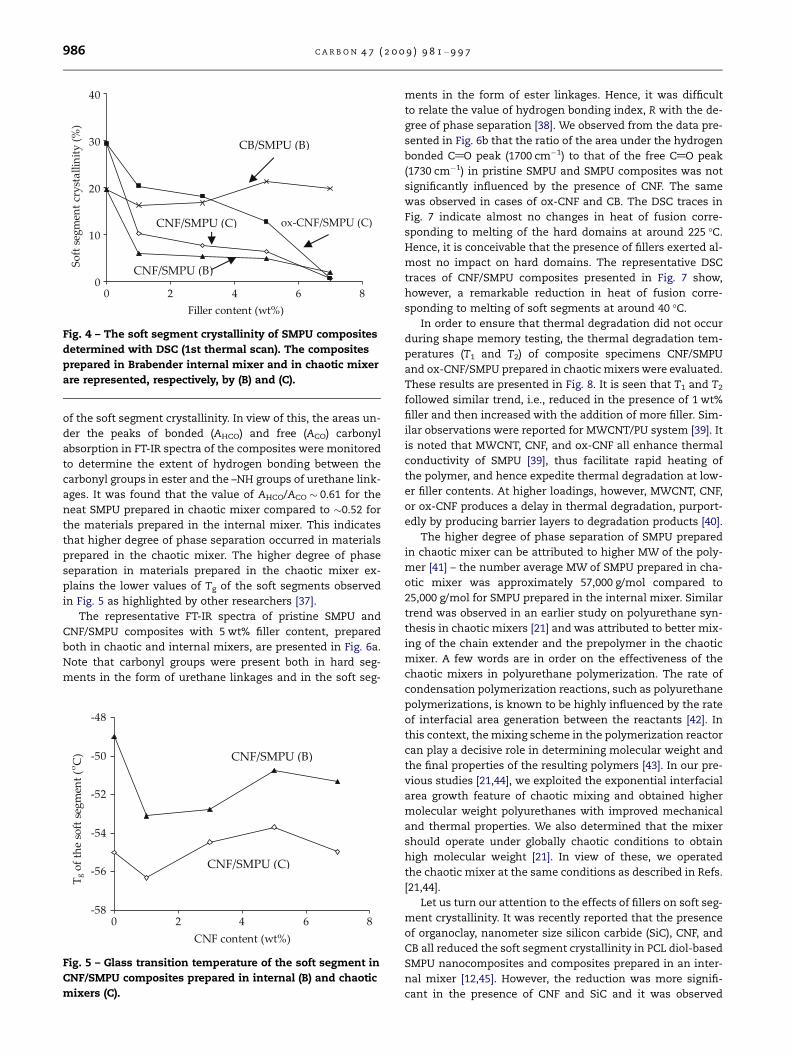
Fig. 4 – The soft segment crystallinity of SMPU composites
determined with DSC (1st thermal scan). The composites
prepared in Brabender internal mixer and in chaotic mixer
are represented, respectively, by (B) and (C).
986 C A R B O N 4 7 ( 2 0 0 9 ) 9 8 1 – 9 9 7
of the soft segment crystallinity. In view of this, the areas un-
der the peaks of bonded (AHCO) and free (ACO) carbonyl
absorption in FT-IR spectra of the composites were monitored
to determine the extent of hydrogen bonding between the
carbonyl groups in ester and the –NH groups of urethane link-
ages. It was found that the value of AHCO/ACO � 0.61 for the
neat SMPU prepared in chaotic mixer compared to �0.52 for
the materials prepared in the internal mixer. This indicates
that higher degree of phase separation occurred in materials
prepared in the chaotic mixer. The higher degree of phase
separation in materials prepared in the chaotic mixer ex-
plains the lower values of Tg of the soft segments observed
in Fig. 5 as highlighted by other researchers [37].
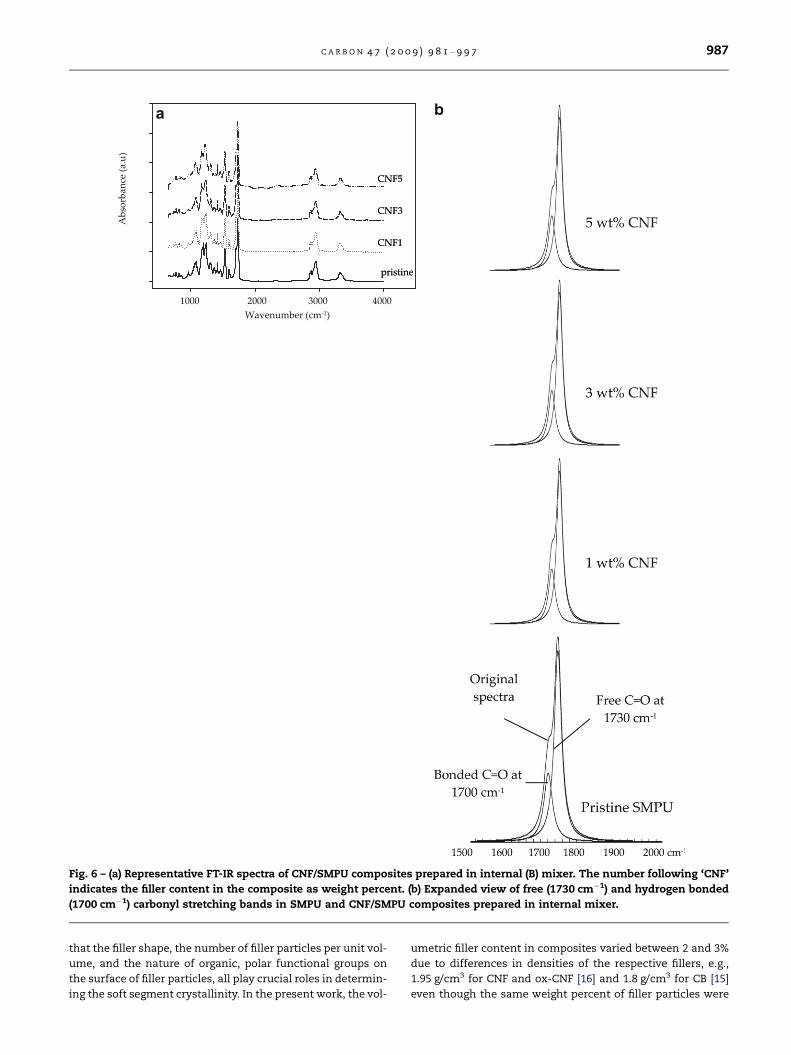
The representative FT-IR spectra of pristine SMPU and
CNF/SMPU composites with 5 wt% filler content, prepared
both in chaotic and internal mixers, are presented in Fig. 6a.
Note that carbonyl groups were present both in hard seg-
ments in the form of urethane linkages and in the soft seg-
Fig. 5 – Glass transition temperature of the soft segment in
CNF/SMPU composites prepared in internal (B) and chaotic
mixers (C).
ments in the form of ester linkages. Hence, it was difficult
to relate the value of hydrogen bonding index, R with the de-
gree of phase separation [38]. We observed from the data pre-
sented in Fig. 6b that the ratio of the area under the hydrogen
bonded C@O peak (1700 cm�1) to that of the free C@O peak
(1730 cm�1) in pristine SMPU and SMPU composites was not
significantly influenced by the presence of CNF. The same
was observed in cases of ox-CNF and CB. The DSC traces in
Fig. 7 indicate almost no changes in heat of fusion corre-
sponding to melting of the hard domains at around 225 �C.
Hence, it is conceivable that the presence of fillers exerted al-
most no impact on hard domains. The representative DSC
traces of CNF/SMPU composites presented in Fig. 7 show,
however, a remarkable reduction in heat of fusion corre-
sponding to melting of soft segments at around 40 �C.
In order to ensure that thermal degradation did not occur
during shape memory testing, the thermal degradation tem-
peratures (T1 and T2) of composite specimens CNF/SMPU
and ox-CNF/SMPU prepared in chaotic mixers were evaluated.
These results are presented in Fig. 8. It is seen that T1 and T2
followed similar trend, i.e., reduced in the presence of 1 wt%
filler and then increased with the addition of more filler. Sim-
ilar observations were reported for MWCNT/PU system [39]. It
is noted that MWCNT, CNF, and ox-CNF all enhance thermal
conductivity of SMPU [39], thus facilitate rapid heating of
the polymer, and hence expedite thermal degradation at low-
er filler contents. At higher loadings, however, MWCNT, CNF,
or ox-CNF produces a delay in thermal degradation, purport-
edly by producing barrier layers to degradation products [40].
The higher degree of phase separation of SMPU prepared
in chaotic mixer can be attributed to higher MW of the poly-
mer [41] – the number average MW of SMPU prepared in cha-
otic mixer was approximately 57,000 g/mol compared to
25,000 g/mol for SMPU prepared in the internal mixer. Similar
trend was observed in an earlier study on polyurethane syn-
thesis in chaotic mixers [21] and was attributed to better mix-
ing of the chain extender and the prepolymer in the chaotic
mixer. A few words are in order on the effectiveness of the
chaotic mixers in polyurethane polymerization. The rate of
condensation polymerization reactions, such as polyurethane
polymerizations, is known to be highly influenced by the rate
of interfacial area generation between the reactants [42]. In
this context, the mixing scheme in the polymerization reactor
can play a decisive role in determining molecular weight and
the final properties of the resulting polymers [43]. In our pre-
vious studies [21,44], we exploited the exponential interfacial
area growth feature of chaotic mixing and obtained higher
molecular weight polyurethanes with improved mechanical
and thermal properties. We also determined that the mixer
should operate under globally chaotic conditions to obtain
high molecular weight [21]. In view of these, we operated
the chaotic mixer at the same conditions as described in Refs.
[21,44].
Let us turn our attention to the effects of fillers on soft seg-
ment crystallinity. It was recently reported that the presence
of organoclay, nanometer size silicon carbide (SiC), CNF, and
CB all reduced the soft segment crystallinity in PCL diol-based
SMPU nanocomposites and composites prepared in an inter-
nal mixer [12,45]. However, the reduction was more signifi-
cant in the presence of CNF and SiC and it was observed
Wavenumber (cm-1)
1000 2000 3000 4000
Abs
orba
nce
0.0
0.2
0.4
0.6
0.8
1.0
1.2
pristineCNF1CNF3CNF5
Wavenumber (cm-1)
1000 2000 3000 4000
Abs
orba
nce
0.0
0.2
0.4
0.6
0.8
1.0
1.2
pristineCNF1CNF3CNF5
a
Fig. 6 – (a) Representative FT-IR spectra of CNF/SMPU composites prepared in internal (B) mixer. The number following ‘CNF’
indicates the filler content in the composite as weight percent. (b) Expanded view of free (1730 cm�1) and hydrogen bonded
(1700 cm�1) carbonyl stretching bands in SMPU and CNF/SMPU composites prepared in internal mixer.
C A R B O N 4 7 ( 2 0 0 9 ) 9 8 1 – 9 9 7 987
that the filler shape, the number of filler particles per unit vol-
ume, and the nature of organic, polar functional groups on
the surface of filler particles, all play crucial roles in determin-
ing the soft segment crystallinity. In the present work, the vol-
umetric filler content in composites varied between 2 and 3%
due to differences in densities of the respective fillers, e.g.,
1.95 g/cm3 for CNF and ox-CNF [16] and 1.8 g/cm3 for CB [15]
even though the same weight percent of filler particles were
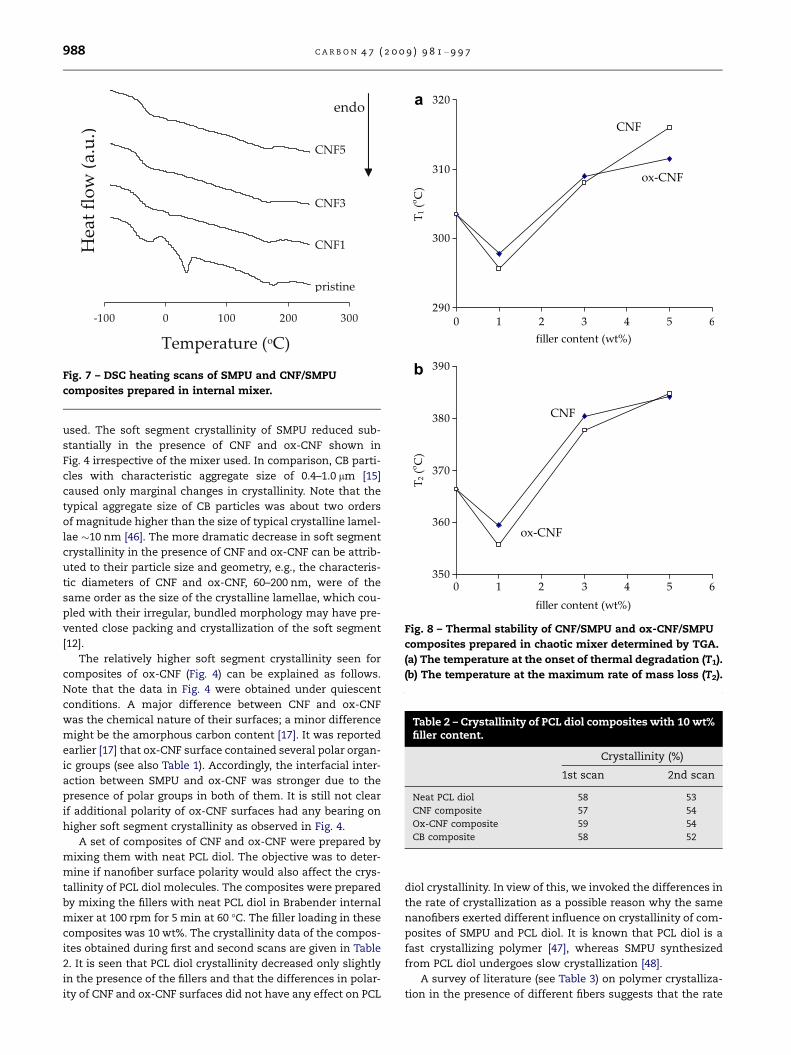
Fig. 7 – DSC heating scans of SMPU and CNF/SMPU
composites prepared in internal mixer.
a
b
Fig. 8 – Thermal stability of CNF/SMPU and ox-CNF/SMPU
composites prepared in chaotic mixer determined by TGA.
(a) The temperature at the onset of thermal degradation (T1).
(b) The temperature at the maximum rate of mass loss (T2).
Table 2 – Crystallinity of PCL diol composites with 10 wt%filler content.
Crystallinity (%)
1st scan 2nd scan
Neat PCL diol 58 53
CNF composite 57 54
Ox-CNF composite 59 54
CB composite 58 52
988 C A R B O N 4 7 ( 2 0 0 9 ) 9 8 1 – 9 9 7
used. The soft segment crystallinity of SMPU reduced sub-
stantially in the presence of CNF and ox-CNF shown in
Fig. 4 irrespective of the mixer used. In comparison, CB parti-
cles with characteristic aggregate size of 0.4–1.0 lm [15]
caused only marginal changes in crystallinity. Note that the
typical aggregate size of CB particles was about two orders
of magnitude higher than the size of typical crystalline lamel-
lae �10 nm [46]. The more dramatic decrease in soft segment
crystallinity in the presence of CNF and ox-CNF can be attrib-
uted to their particle size and geometry, e.g., the characteris-
tic diameters of CNF and ox-CNF, 60–200 nm, were of the
same order as the size of the crystalline lamellae, which cou-
pled with their irregular, bundled morphology may have pre-
vented close packing and crystallization of the soft segment
[12].
The relatively higher soft segment crystallinity seen for
composites of ox-CNF (Fig. 4) can be explained as follows.
Note that the data in Fig. 4 were obtained under quiescent
conditions. A major difference between CNF and ox-CNF
was the chemical nature of their surfaces; a minor difference
might be the amorphous carbon content [17]. It was reported
earlier [17] that ox-CNF surface contained several polar organ-
ic groups (see also Table 1). Accordingly, the interfacial inter-
action between SMPU and ox-CNF was stronger due to the
presence of polar groups in both of them. It is still not clear
if additional polarity of ox-CNF surfaces had any bearing on
higher soft segment crystallinity as observed in Fig. 4.
A set of composites of CNF and ox-CNF were prepared by
mixing them with neat PCL diol. The objective was to deter-
mine if nanofiber surface polarity would also affect the crys-
tallinity of PCL diol molecules. The composites were prepared
by mixing the fillers with neat PCL diol in Brabender internal
mixer at 100 rpm for 5 min at 60 �C. The filler loading in these
composites was 10 wt%. The crystallinity data of the compos-
ites obtained during first and second scans are given in Table
2. It is seen that PCL diol crystallinity decreased only slightly
in the presence of the fillers and that the differences in polar-
ity of CNF and ox-CNF surfaces did not have any effect on PCL
diol crystallinity. In view of this, we invoked the differences in
the rate of crystallization as a possible reason why the same
nanofibers exerted different influence on crystallinity of com-
posites of SMPU and PCL diol. It is known that PCL diol is a
fast crystallizing polymer [47], whereas SMPU synthesized
from PCL diol undergoes slow crystallization [48].
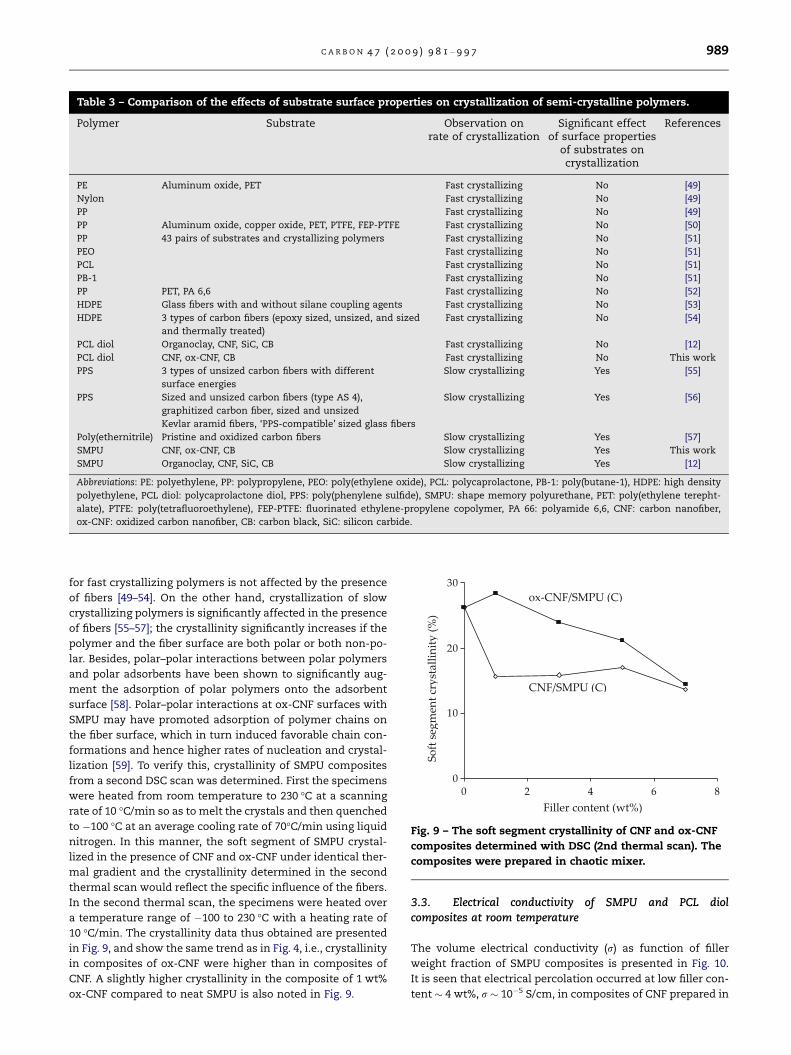
A survey of literature (see Table 3) on polymer crystalliza-
tion in the presence of different fibers suggests that the rate
filler wt%
soft
seg
men
t cr
ysta
llini
ty (
%)
Fig. 9 – The soft segment crystallinity of CNF and ox-CNF
composites determined with DSC (2nd thermal scan). The
composites were prepared in chaotic mixer.
Table 3 – Comparison of the effects of substrate surface properties on crystallization of semi-crystalline polymers.
Polymer Substrate Observation onrate of crystallization
Significant effectof surface properties
of substrates oncrystallization
References
PE Aluminum oxide, PET Fast crystallizing No [49]
Nylon Fast crystallizing No [49]
PP Fast crystallizing No [49]
PP Aluminum oxide, copper oxide, PET, PTFE, FEP-PTFE Fast crystallizing No [50]
PP 43 pairs of substrates and crystallizing polymers Fast crystallizing No [51]
PEO Fast crystallizing No [51]
PCL Fast crystallizing No [51]
PB-1 Fast crystallizing No [51]
PP PET, PA 6,6 Fast crystallizing No [52]
HDPE Glass fibers with and without silane coupling agents Fast crystallizing No [53]
HDPE 3 types of carbon fibers (epoxy sized, unsized, and sized
and thermally treated)
Fast crystallizing No [54]
PCL diol Organoclay, CNF, SiC, CB Fast crystallizing No [12]
PCL diol CNF, ox-CNF, CB Fast crystallizing No This work
PPS 3 types of unsized carbon fibers with different
surface energies
Slow crystallizing Yes [55]
PPS Sized and unsized carbon fibers (type AS 4),
graphitized carbon fiber, sized and unsized
Kevlar aramid fibers, ‘PPS-compatible’ sized glass fibers
Slow crystallizing Yes [56]
Poly(ethernitrile) Pristine and oxidized carbon fibers Slow crystallizing Yes [57]
SMPU CNF, ox-CNF, CB Slow crystallizing Yes This work
SMPU Organoclay, CNF, SiC, CB Slow crystallizing Yes [12]
Abbreviations: PE: polyethylene, PP: polypropylene, PEO: poly(ethylene oxide), PCL: polycaprolactone, PB-1: poly(butane-1), HDPE: high density
polyethylene, PCL diol: polycaprolactone diol, PPS: poly(phenylene sulfide), SMPU: shape memory polyurethane, PET: poly(ethylene terepht-
alate), PTFE: poly(tetrafluoroethylene), FEP-PTFE: fluorinated ethylene-propylene copolymer, PA 66: polyamide 6,6, CNF: carbon nanofiber,
ox-CNF: oxidized carbon nanofiber, CB: carbon black, SiC: silicon carbide.
C A R B O N 4 7 ( 2 0 0 9 ) 9 8 1 – 9 9 7 989
for fast crystallizing polymers is not affected by the presence
of fibers [49–54]. On the other hand, crystallization of slow
crystallizing polymers is significantly affected in the presence
of fibers [55–57]; the crystallinity significantly increases if the
polymer and the fiber surface are both polar or both non-po-
lar. Besides, polar–polar interactions between polar polymers
and polar adsorbents have been shown to significantly aug-
ment the adsorption of polar polymers onto the adsorbent
surface [58]. Polar–polar interactions at ox-CNF surfaces with
SMPU may have promoted adsorption of polymer chains on
the fiber surface, which in turn induced favorable chain con-
formations and hence higher rates of nucleation and crystal-
lization [59]. To verify this, crystallinity of SMPU composites
from a second DSC scan was determined. First the specimens
were heated from room temperature to 230 �C at a scanning
rate of 10 �C/min so as to melt the crystals and then quenched
to �100 �C at an average cooling rate of 70�C/min using liquid
nitrogen. In this manner, the soft segment of SMPU crystal-
lized in the presence of CNF and ox-CNF under identical ther-
mal gradient and the crystallinity determined in the second
thermal scan would reflect the specific influence of the fibers.
In the second thermal scan, the specimens were heated over
a temperature range of �100 to 230 �C with a heating rate of
10 �C/min. The crystallinity data thus obtained are presented
in Fig. 9, and show the same trend as in Fig. 4, i.e., crystallinity
in composites of ox-CNF were higher than in composites of
CNF. A slightly higher crystallinity in the composite of 1 wt%
ox-CNF compared to neat SMPU is also noted in Fig. 9.
3.3. Electrical conductivity of SMPU and PCL diolcomposites at room temperature
The volume electrical conductivity (r) as function of filler
weight fraction of SMPU composites is presented in Fig. 10.
It is seen that electrical percolation occurred at low filler con-
tent � 4 wt%, r � 10�5 S/cm, in composites of CNF prepared in
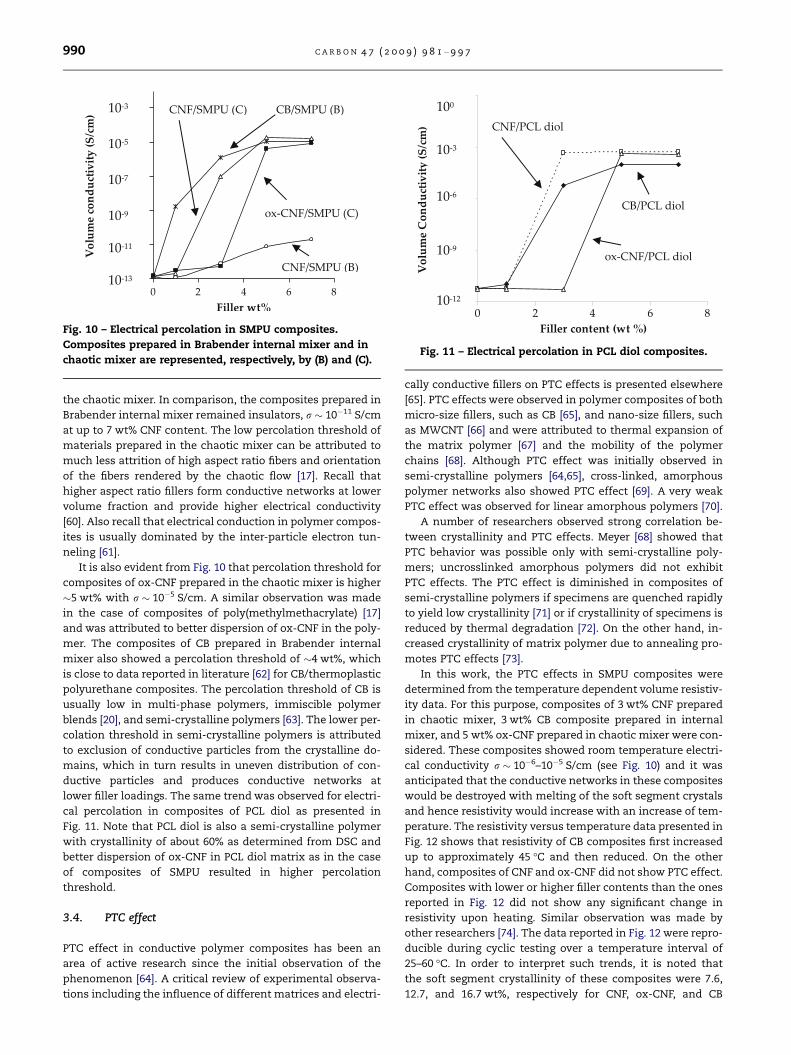
Fig. 10 – Electrical percolation in SMPU composites.
Composites prepared in Brabender internal mixer and in
chaotic mixer are represented, respectively, by (B) and (C).
1.00E-12
1.00E-09
1.00E-06
1.00E-03
1.00E+00
Fig. 11 – Electrical percolation in PCL diol composites.
990 C A R B O N 4 7 ( 2 0 0 9 ) 9 8 1 – 9 9 7
the chaotic mixer. In comparison, the composites prepared in
Brabender internal mixer remained insulators, r � 10�11 S/cm
at up to 7 wt% CNF content. The low percolation threshold of
materials prepared in the chaotic mixer can be attributed to
much less attrition of high aspect ratio fibers and orientation
of the fibers rendered by the chaotic flow [17]. Recall that
higher aspect ratio fillers form conductive networks at lower
volume fraction and provide higher electrical conductivity
[60]. Also recall that electrical conduction in polymer compos-
ites is usually dominated by the inter-particle electron tun-
neling [61].
It is also evident from Fig. 10 that percolation threshold for
composites of ox-CNF prepared in the chaotic mixer is higher
�5 wt% with r � 10�5 S/cm. A similar observation was made
in the case of composites of poly(methylmethacrylate) [17]
and was attributed to better dispersion of ox-CNF in the poly-
mer. The composites of CB prepared in Brabender internal
mixer also showed a percolation threshold of �4 wt%, which
is close to data reported in literature [62] for CB/thermoplastic
polyurethane composites. The percolation threshold of CB is
usually low in multi-phase polymers, immiscible polymer
blends [20], and semi-crystalline polymers [63]. The lower per-
colation threshold in semi-crystalline polymers is attributed
to exclusion of conductive particles from the crystalline do-
mains, which in turn results in uneven distribution of con-
ductive particles and produces conductive networks at
lower filler loadings. The same trend was observed for electri-
cal percolation in composites of PCL diol as presented in
Fig. 11. Note that PCL diol is also a semi-crystalline polymer
with crystallinity of about 60% as determined from DSC and
better dispersion of ox-CNF in PCL diol matrix as in the case
of composites of SMPU resulted in higher percolation
threshold.
3.4. PTC effect
PTC effect in conductive polymer composites has been an
area of active research since the initial observation of the
phenomenon [64]. A critical review of experimental observa-
tions including the influence of different matrices and electri-
cally conductive fillers on PTC effects is presented elsewhere
[65]. PTC effects were observed in polymer composites of both
micro-size fillers, such as CB [65], and nano-size fillers, such
as MWCNT [66] and were attributed to thermal expansion of
the matrix polymer [67] and the mobility of the polymer
chains [68]. Although PTC effect was initially observed in
semi-crystalline polymers [64,65], cross-linked, amorphous
polymer networks also showed PTC effect [69]. A very weak
PTC effect was observed for linear amorphous polymers [70].
A number of researchers observed strong correlation be-
tween crystallinity and PTC effects. Meyer [68] showed that
PTC behavior was possible only with semi-crystalline poly-
mers; uncrosslinked amorphous polymers did not exhibit
PTC effects. The PTC effect is diminished in composites of
semi-crystalline polymers if specimens are quenched rapidly
to yield low crystallinity [71] or if crystallinity of specimens is
reduced by thermal degradation [72]. On the other hand, in-
creased crystallinity of matrix polymer due to annealing pro-
motes PTC effects [73].
In this work, the PTC effects in SMPU composites were
determined from the temperature dependent volume resistiv-
ity data. For this purpose, composites of 3 wt% CNF prepared
in chaotic mixer, 3 wt% CB composite prepared in internal
mixer, and 5 wt% ox-CNF prepared in chaotic mixer were con-
sidered. These composites showed room temperature electri-
cal conductivity r � 10�6–10�5 S/cm (see Fig. 10) and it was
anticipated that the conductive networks in these composites
would be destroyed with melting of the soft segment crystals
and hence resistivity would increase with an increase of tem-
perature. The resistivity versus temperature data presented in
Fig. 12 shows that resistivity of CB composites first increased
up to approximately 45 �C and then reduced. On the other
hand, composites of CNF and ox-CNF did not show PTC effect.
Composites with lower or higher filler contents than the ones
reported in Fig. 12 did not show any significant change in
resistivity upon heating. Similar observation was made by
other researchers [74]. The data reported in Fig. 12 were repro-
ducible during cyclic testing over a temperature interval of
25–60 �C. In order to interpret such trends, it is noted that
the soft segment crystallinity of these composites were 7.6,
12.7, and 16.7 wt%, respectively for CNF, ox-CNF, and CB
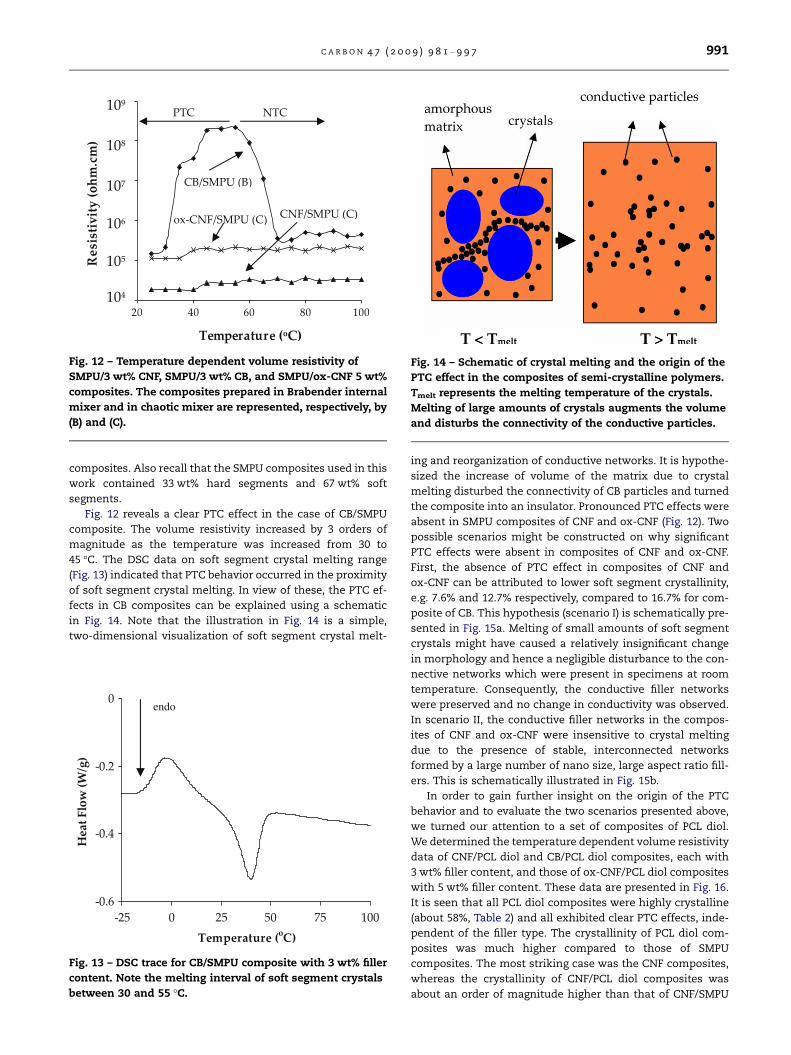
Fig. 12 – Temperature dependent volume resistivity of
SMPU/3 wt% CNF, SMPU/3 wt% CB, and SMPU/ox-CNF 5 wt%
composites. The composites prepared in Brabender internal
mixer and in chaotic mixer are represented, respectively, by
(B) and (C).
Fig. 14 – Schematic of crystal melting and the origin of the
PTC effect in the composites of semi-crystalline polymers.
Tmelt represents the melting temperature of the crystals.
Melting of large amounts of crystals augments the volume
and disturbs the connectivity of the conductive particles.
C A R B O N 4 7 ( 2 0 0 9 ) 9 8 1 – 9 9 7 991
composites. Also recall that the SMPU composites used in this
work contained 33 wt% hard segments and 67 wt% soft
segments.
Fig. 12 reveals a clear PTC effect in the case of CB/SMPU
composite. The volume resistivity increased by 3 orders of
magnitude as the temperature was increased from 30 to
45 �C. The DSC data on soft segment crystal melting range
(Fig. 13) indicated that PTC behavior occurred in the proximity
of soft segment crystal melting. In view of these, the PTC ef-
fects in CB composites can be explained using a schematic
in Fig. 14. Note that the illustration in Fig. 14 is a simple,
two-dimensional visualization of soft segment crystal melt-
endo
Fig. 13 – DSC trace for CB/SMPU composite with 3 wt% filler
content. Note the melting interval of soft segment crystals
between 30 and 55 �C.
ing and reorganization of conductive networks. It is hypothe-
sized the increase of volume of the matrix due to crystal
melting disturbed the connectivity of CB particles and turned
the composite into an insulator. Pronounced PTC effects were
absent in SMPU composites of CNF and ox-CNF (Fig. 12). Two
possible scenarios might be constructed on why significant
PTC effects were absent in composites of CNF and ox-CNF.
First, the absence of PTC effect in composites of CNF and
ox-CNF can be attributed to lower soft segment crystallinity,
e.g. 7.6% and 12.7% respectively, compared to 16.7% for com-
posite of CB. This hypothesis (scenario I) is schematically pre-
sented in Fig. 15a. Melting of small amounts of soft segment
crystals might have caused a relatively insignificant change
in morphology and hence a negligible disturbance to the con-
nective networks which were present in specimens at room
temperature. Consequently, the conductive filler networks
were preserved and no change in conductivity was observed.
In scenario II, the conductive filler networks in the compos-
ites of CNF and ox-CNF were insensitive to crystal melting
due to the presence of stable, interconnected networks
formed by a large number of nano size, large aspect ratio fill-
ers. This is schematically illustrated in Fig. 15b.
In order to gain further insight on the origin of the PTC
behavior and to evaluate the two scenarios presented above,
we turned our attention to a set of composites of PCL diol.
We determined the temperature dependent volume resistivity
data of CNF/PCL diol and CB/PCL diol composites, each with
3 wt% filler content, and those of ox-CNF/PCL diol composites
with 5 wt% filler content. These data are presented in Fig. 16.
It is seen that all PCL diol composites were highly crystalline
(about 58%, Table 2) and all exhibited clear PTC effects, inde-
pendent of the filler type. The crystallinity of PCL diol com-
posites was much higher compared to those of SMPU
composites. The most striking case was the CNF composites,
whereas the crystallinity of CNF/PCL diol composites was
about an order of magnitude higher than that of CNF/SMPU
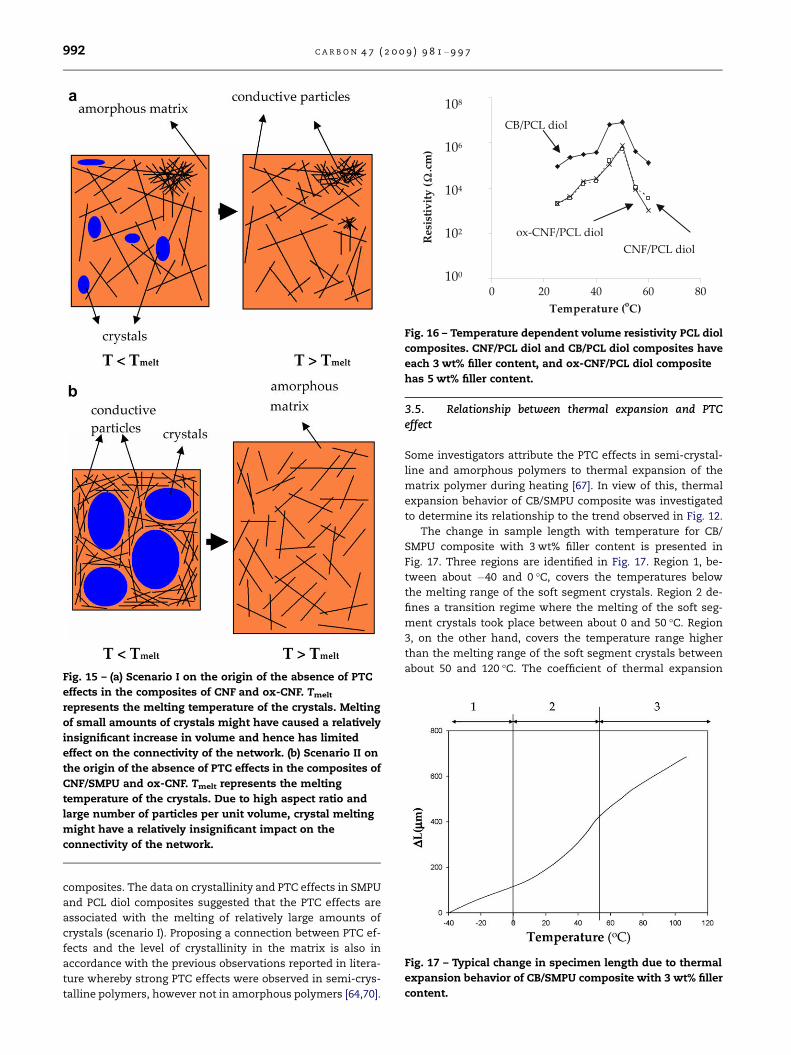
Fig. 15 – (a) Scenario I on the origin of the absence of PTC
effects in the composites of CNF and ox-CNF. Tmelt
represents the melting temperature of the crystals. Melting
of small amounts of crystals might have caused a relatively
insignificant increase in volume and hence has limited
effect on the connectivity of the network. (b) Scenario II on
the origin of the absence of PTC effects in the composites of
CNF/SMPU and ox-CNF. Tmelt represents the melting
temperature of the crystals. Due to high aspect ratio and
large number of particles per unit volume, crystal melting
might have a relatively insignificant impact on the
connectivity of the network.
Ω
Fig. 16 – Temperature dependent volume resistivity PCL diol
composites. CNF/PCL diol and CB/PCL diol composites have
each 3 wt% filler content, and ox-CNF/PCL diol composite
has 5 wt% filler content.
Fig. 17 – Typical change in specimen length due to thermal
expansion behavior of CB/SMPU composite with 3 wt% filler
content.
992 C A R B O N 4 7 ( 2 0 0 9 ) 9 8 1 – 9 9 7
composites. The data on crystallinity and PTC effects in SMPU
and PCL diol composites suggested that the PTC effects are
associated with the melting of relatively large amounts of
crystals (scenario I). Proposing a connection between PTC ef-
fects and the level of crystallinity in the matrix is also in
accordance with the previous observations reported in litera-
ture whereby strong PTC effects were observed in semi-crys-
talline polymers, however not in amorphous polymers [64,70].
3.5. Relationship between thermal expansion and PTCeffect
Some investigators attribute the PTC effects in semi-crystal-
line and amorphous polymers to thermal expansion of the
matrix polymer during heating [67]. In view of this, thermal
expansion behavior of CB/SMPU composite was investigated
to determine its relationship to the trend observed in Fig. 12.
The change in sample length with temperature for CB/
SMPU composite with 3 wt% filler content is presented in
Fig. 17. Three regions are identified in Fig. 17. Region 1, be-
tween about �40 and 0 �C, covers the temperatures below
the melting range of the soft segment crystals. Region 2 de-
fines a transition regime where the melting of the soft seg-
ment crystals took place between about 0 and 50 �C. Region
3, on the other hand, covers the temperature range higher
than the melting range of the soft segment crystals between
about 50 and 120 �C. The coefficient of thermal expansion
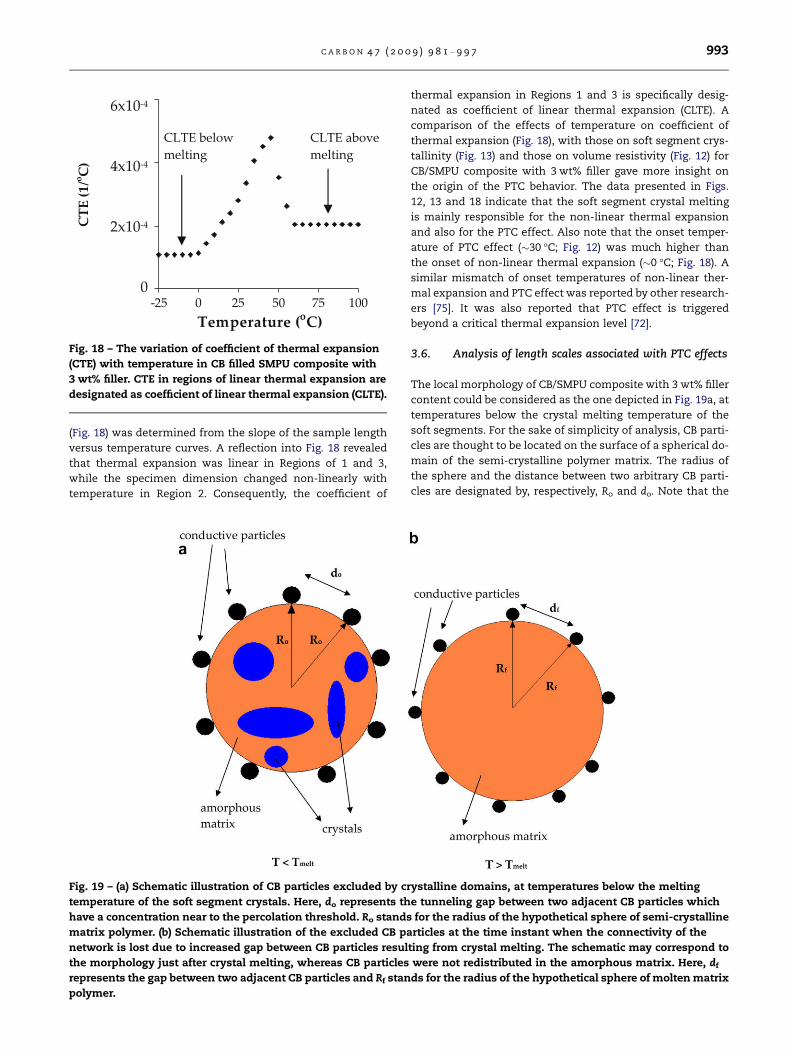
Fig. 18 – The variation of coefficient of thermal expansion
(CTE) with temperature in CB filled SMPU composite with
3 wt% filler. CTE in regions of linear thermal expansion are
designated as coefficient of linear thermal expansion (CLTE).
C A R B O N 4 7 ( 2 0 0 9 ) 9 8 1 – 9 9 7 993
(Fig. 18) was determined from the slope of the sample length
versus temperature curves. A reflection into Fig. 18 revealed
that thermal expansion was linear in Regions of 1 and 3,
while the specimen dimension changed non-linearly with
temperature in Region 2. Consequently, the coefficient of
Fig. 19 – (a) Schematic illustration of CB particles excluded by cr
temperature of the soft segment crystals. Here, do represents th
have a concentration near to the percolation threshold. Ro stands
matrix polymer. (b) Schematic illustration of the excluded CB pa
network is lost due to increased gap between CB particles resul
the morphology just after crystal melting, whereas CB particles
represents the gap between two adjacent CB particles and Rf stan
polymer.
thermal expansion in Regions 1 and 3 is specifically desig-
nated as coefficient of linear thermal expansion (CLTE). A
comparison of the effects of temperature on coefficient of
thermal expansion (Fig. 18), with those on soft segment crys-
tallinity (Fig. 13) and those on volume resistivity (Fig. 12) for
CB/SMPU composite with 3 wt% filler gave more insight on
the origin of the PTC behavior. The data presented in Figs.
12, 13 and 18 indicate that the soft segment crystal melting
is mainly responsible for the non-linear thermal expansion
and also for the PTC effect. Also note that the onset temper-
ature of PTC effect (�30 �C; Fig. 12) was much higher than
the onset of non-linear thermal expansion (�0 �C; Fig. 18). A
similar mismatch of onset temperatures of non-linear ther-
mal expansion and PTC effect was reported by other research-
ers [75]. It was also reported that PTC effect is triggered
beyond a critical thermal expansion level [72].
3.6. Analysis of length scales associated with PTC effects
The local morphology of CB/SMPU composite with 3 wt% filler
content could be considered as the one depicted in Fig. 19a, at
temperatures below the crystal melting temperature of the
soft segments. For the sake of simplicity of analysis, CB parti-
cles are thought to be located on the surface of a spherical do-
main of the semi-crystalline polymer matrix. The radius of
the sphere and the distance between two arbitrary CB parti-
cles are designated by, respectively, Ro and do. Note that the
ystalline domains, at temperatures below the melting
e tunneling gap between two adjacent CB particles which
for the radius of the hypothetical sphere of semi-crystalline
rticles at the time instant when the connectivity of the
ting from crystal melting. The schematic may correspond to
were not redistributed in the amorphous matrix. Here, df
ds for the radius of the hypothetical sphere of molten matrix
994 C A R B O N 4 7 ( 2 0 0 9 ) 9 8 1 – 9 9 7
distance do is the minimum required gap distance between
two adjacent conductive filler particles necessary for electron
tunneling, since the filler content in the composite is at about
the percolation threshold. Although the schematic presented
in Fig. 19a is a greatly simplified view of the true morphology
of CB composites, it is not unrealistic. The tunneling conduc-
tivity occurs almost exclusively between two neighboring par-
ticles and any contribution from a particle which is not
nearest neighbor is negligible, as illustrated by the strong
exponential dependence of tunneling current on the gap dis-
tance [67]. Fig. 19b illustrates the change in local morphology
depicted in Fig. 19a just at the moment of crystal melting. The
volume of the specimen increases upon crystal melting and
the distance between two adjacent particles increases. At this
point, the connectivity is lost and the composite turns to an
insulator. Note that at longer elapsed time after crystal melt-
ing, the filler particles may be redistributed in the matrix.
Using the geometry considered in Fig. 19a and b and the
CTE values presented in Fig. 18, the relation between do and
df can be approximated as do = 1.004df.
A separate calculation can also be made using the volume
change upon melting. The specific volume of a polymer in
amorphous state is generally about 10% higher than that of
the same polymer in crystalline state [76]. This is also true
for PCL diol, which has an amorphous state density of
1.094 g/cm3 and a crystalline density of 1.187 g/cm3 [77]. Using
these density data and the geometry considered in Fig. 19a
and b, and noting that the soft segments are only partially
crystalline in SMPU, the relation between do and df can be also
determined as do = 1.004df. Hence, the results of two separate
calculations, one with CTE presented in Fig. 18 and, one with
the density values reported in literature coincide closely with
each other. These results support the reasoning that the crys-
tal melting causes the pronounced thermal expansion. Thus,
the origin of PTC effects in our system could not be attributed
only to crystal melting or only to thermal expansion, but a
combination of the two.
Now let us turn our attention to the length scales associ-
ated with PTC effects. The tunneling gap (do) in carbon black
filled elastomers was estimated to be in the range of about 2–
10 nm by different researchers [78–80]. In view of this value
for do and the expression that we obtained for the relation-
ship between do and df, the necessary increase in tunneling
distance to convert the conductor to an insulator should be
on the order of 0.1–0.5 A. Both Voet [65] and Medalia [67] pre-
dicted that only small changes in relative positions of carbon
black particles would result in break down of connectivity and
could lead to strong PTC effects. The calculations of Sherman
et al. [81] also showed that the conductivity is extremely sen-
sitive to the changes in the tunneling distance. Our relatively
simple calculations on the length scale associated with PTC
effects agree with the previous predictions.
3.7. Negative temperature coefficient (NTC) effect incomposites
A few words are in order on the negative temperature coeffi-
cient (NTC) effect that we observed in both SMPU and PCL diol
composites. NTC effect is characterized by the restoration of
electrical conductivity upon further heating of the specimens
[82]. It is thought to be related to filler mobility and filler redis-
tribution with continued heating. Cross-linked polymer net-
works usually do not show NTC due to reduced filler
mobility, although the reasons for this decreased mobility
were not elaborated [65]. It may originate solely from the phys-
ical confinement of filler particles in a thermally stable, cross-
linked network or possibly from the chemical bonding of the
filler particles with the polymer network [83]. Our data in Figs.
12 and 16, respectively, above 52 and 48 �C, indicate that both
SMPU and PCL diol composites showed NTC effect. This was
expected since both materials were comprised of linear ther-
moplastic polymer chains and did not possess any thermally
stable network to hinder mobility of the conductive fillers.
3.8. Changes in electrical resistance induced by tensilestrain
A critical issue in actuating SMP composites by resistive heat-
ing is the stability of electrical conductivity as the materials
undergo large strain – as high as several hundred percents –
in typical shape memory cycles. The effects of uniaxial tensile
strain on electrical conductivity were widely investigated in
the context of CB filled conductive elastomers [84–86]. A sig-
nificant strain induced increase in resistance was observed
in CB filled elastomers, especially at filler concentrations
around the percolation threshold. This increase was attrib-
uted to disruption of conductive filler networks upon applica-
tion of strain [84]. Elastomeric composites of carbon fiber
showed an opposite behavior [87]; in this case, the magnitude
of change in resistivity and the rate of the change showed
weak dependence on strains. This was attributed to weak
interfacial bonding between carbon fiber and the polymer;
the interfacial bonding was much stronger in CB filled com-
posites [87].
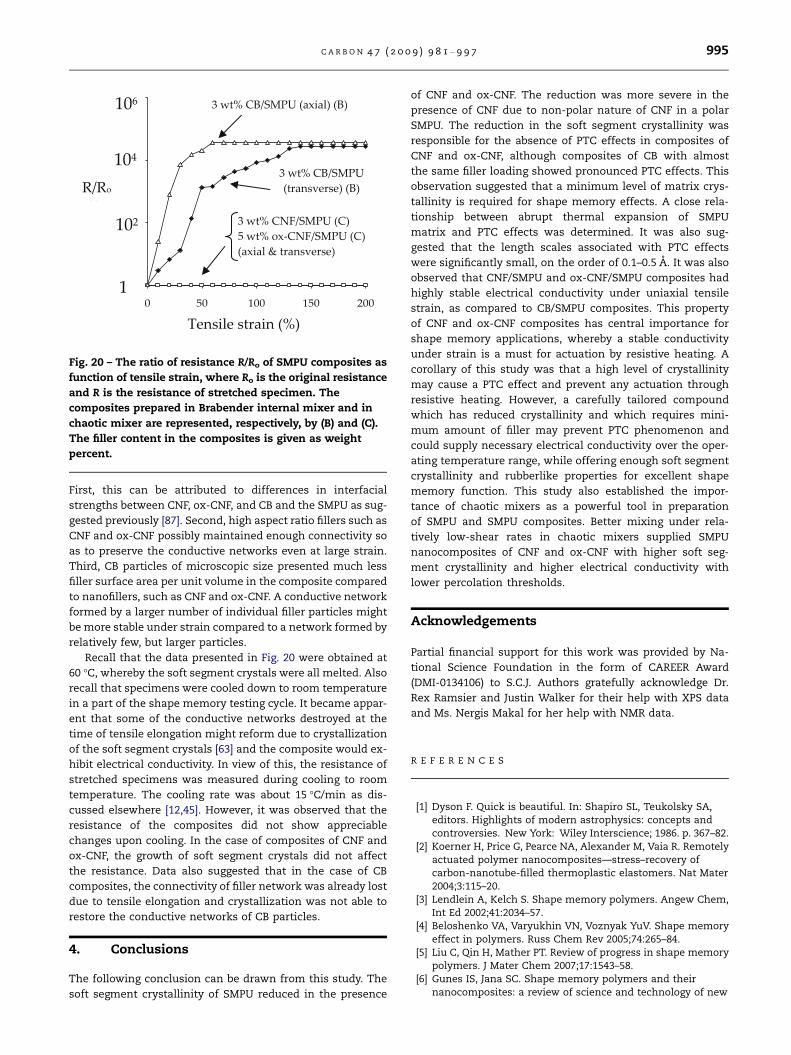
The resistance of composites prepared in chaotic mixer
and in Brabender internal mixer as function of uniaxial ten-
sile strain is presented in Fig. 20. The measurements were
performed at 60 �C, the stretching temperature of specimens.
In addition, the soft segment crystals were all melted at 60 �C.
The composites with filler content approximately at the per-
colation threshold were considered in Fig. 20. Composites
with lower or higher filler contents did not show any signifi-
cant change in resistance upon tensile deformation, as re-
ported previously by other researchers [86]. It was observed
that CB/SMPU composites with 5 wt% or higher CB content
failed beyond 10% elongation and, therefore was not consid-
ered. It is noted from Fig. 20 that the resistance in both axial
and transverse directions of CB/SMPU composite containing
3 wt% CB increased linearly with strain up to 50% strain,
although the changes in resistance in axial and transverse
directions were different (Fig. 20); similar observation were re-
ported by other researchers [88]. The difference between
resistance in axial and transverse directions was attributed
to preferred orientation of carbon black particles in the strain
direction [84]. However, the resistance of CNF/SMPU and ox-
CNF/SMPU composites did not change significantly with
strain. Paik et al. [8] also reported marginal changes in resis-
tance of MWCNT/SMPU composite with 3 wt% filler content.
Several factors contribute to such differences in resistance
vs. strain behavior of composites of CNF, ox-CNF, and CB.
1.00E+00
1.00E+02
1.00E+04
1.00E+06
Fig. 20 – The ratio of resistance R/Ro of SMPU composites as
function of tensile strain, where Ro is the original resistance
and R is the resistance of stretched specimen. The
composites prepared in Brabender internal mixer and in
chaotic mixer are represented, respectively, by (B) and (C).
The filler content in the composites is given as weight
percent.
C A R B O N 4 7 ( 2 0 0 9 ) 9 8 1 – 9 9 7 995
First, this can be attributed to differences in interfacial
strengths between CNF, ox-CNF, and CB and the SMPU as sug-
gested previously [87]. Second, high aspect ratio fillers such as
CNF and ox-CNF possibly maintained enough connectivity so
as to preserve the conductive networks even at large strain.
Third, CB particles of microscopic size presented much less
filler surface area per unit volume in the composite compared
to nanofillers, such as CNF and ox-CNF. A conductive network
formed by a larger number of individual filler particles might
be more stable under strain compared to a network formed by
relatively few, but larger particles.
Recall that the data presented in Fig. 20 were obtained at
60 �C, whereby the soft segment crystals were all melted. Also
recall that specimens were cooled down to room temperature
in a part of the shape memory testing cycle. It became appar-
ent that some of the conductive networks destroyed at the
time of tensile elongation might reform due to crystallization
of the soft segment crystals [63] and the composite would ex-
hibit electrical conductivity. In view of this, the resistance of
stretched specimens was measured during cooling to room
temperature. The cooling rate was about 15 �C/min as dis-
cussed elsewhere [12,45]. However, it was observed that the
resistance of the composites did not show appreciable
changes upon cooling. In the case of composites of CNF and
ox-CNF, the growth of soft segment crystals did not affect
the resistance. Data also suggested that in the case of CB
composites, the connectivity of filler network was already lost
due to tensile elongation and crystallization was not able to
restore the conductive networks of CB particles.
4. Conclusions
The following conclusion can be drawn from this study. The
soft segment crystallinity of SMPU reduced in the presence
of CNF and ox-CNF. The reduction was more severe in the
presence of CNF due to non-polar nature of CNF in a polar
SMPU. The reduction in the soft segment crystallinity was
responsible for the absence of PTC effects in composites of
CNF and ox-CNF, although composites of CB with almost
the same filler loading showed pronounced PTC effects. This
observation suggested that a minimum level of matrix crys-
tallinity is required for shape memory effects. A close rela-
tionship between abrupt thermal expansion of SMPU
matrix and PTC effects was determined. It was also sug-
gested that the length scales associated with PTC effects
were significantly small, on the order of 0.1–0.5 A. It was also
observed that CNF/SMPU and ox-CNF/SMPU composites had
highly stable electrical conductivity under uniaxial tensile
strain, as compared to CB/SMPU composites. This property
of CNF and ox-CNF composites has central importance for
shape memory applications, whereby a stable conductivity
under strain is a must for actuation by resistive heating. A
corollary of this study was that a high level of crystallinity
may cause a PTC effect and prevent any actuation through
resistive heating. However, a carefully tailored compound
which has reduced crystallinity and which requires mini-
mum amount of filler may prevent PTC phenomenon and
could supply necessary electrical conductivity over the oper-
ating temperature range, while offering enough soft segment
crystallinity and rubberlike properties for excellent shape
memory function. This study also established the impor-
tance of chaotic mixers as a powerful tool in preparation
of SMPU and SMPU composites. Better mixing under rela-
tively low-shear rates in chaotic mixers supplied SMPU
nanocomposites of CNF and ox-CNF with higher soft seg-
ment crystallinity and higher electrical conductivity with
lower percolation thresholds.
Acknowledgements
Partial financial support for this work was provided by Na-
tional Science Foundation in the form of CAREER Award
(DMI-0134106) to S.C.J. Authors gratefully acknowledge Dr.
Rex Ramsier and Justin Walker for their help with XPS data
and Ms. Nergis Makal for her help with NMR data.
R E F E R E N C E S
[1] Dyson F. Quick is beautiful. In: Shapiro SL, Teukolsky SA,editors. Highlights of modern astrophysics: concepts andcontroversies. New York: Wiley Interscience; 1986. p. 367–82.
[2] Koerner H, Price G, Pearce NA, Alexander M, Vaia R. Remotelyactuated polymer nanocomposites—stress–recovery ofcarbon-nanotube-filled thermoplastic elastomers. Nat Mater2004;3:115–20.
[3] Lendlein A, Kelch S. Shape memory polymers. Angew Chem,Int Ed 2002;41:2034–57.
[4] Beloshenko VA, Varyukhin VN, Voznyak YuV. Shape memoryeffect in polymers. Russ Chem Rev 2005;74:265–84.
[5] Liu C, Qin H, Mather PT. Review of progress in shape memorypolymers. J Mater Chem 2007;17:1543–58.
[6] Gunes IS, Jana SC. Shape memory polymers and theirnanocomposites: a review of science and technology of new
996 C A R B O N 4 7 ( 2 0 0 9 ) 9 8 1 – 9 9 7
multifunctional materials. J Nanosci Nanotechnol2008;8:1616–37.
[7] Hayashi S, Kondo S, Kapadia P, Ushioda E. Roomtemperature-functional shape memory polymers. Plast Eng1995;51:29–31.
[8] Paik IH, Goo NS, Yoon KJ, Jung YC, Cho JW. Electric resistanceproperty of a conducting shape memory polyurethaneactuator. Key Eng Mater 2005;297–300:1539–44.
[9] Leng J, Lv H, Liu Y, Du S. Electroactive shape memory polymerfilled with nanocarbon particles and short carbon fibers. ApplPhys Lett 2007;91:144105-1–3.
[10] Leng JS, Huang WM, Lan X, Liu YJ, Du SY. Significantlyreducing electrical resistivity by forming conductive Nichains in a polyurethane shape-memory polymer/carbon-black composite. Appl. Phys. Lett. 2008;92:204101-1–3.
[11] Norman RH. Conductive rubbers and plastics: theirproduction, application, and testmethods. Elsevier: Amsterdam; 1970 [chapter 10].
[12] Gunes IS, Cao F, Jana SC. Evaluation of nanoparticulate fillersfor development of shape memory polyurethanenanocomposites. Polymer 2008;49:2223–34.
[13] Jimenez GA, Jana SC. Polyurethane–carbon nanofibercomposites for shape memory effects. In: Proceedings of 65thANTEC (Cincinnati, USA). Society of Plastics Engineers; 2007.p. 18–22.
[14] Higgins BA. Carbon nanofiber–polymer composites forelectronic applications. PhD Thesis. The University of Akron,OH; 2006.
[15] Verhelst WF, Wolthuis KG, Voet A, Ehrburger P, Donnet JB. Therole of morphology and structure of carbon blacks in theelectrical conductance of vulcanizates. Rubber ChemTechnol 1977;50:735–46.
[16] Jimenez GA, Jana SC. Electrically conductive polymernanocomposites of polymethylmethacrylate and carbonnanofibers prepared by chaotic mixing. Compos Part A – ApplSci Manuf 2007;38:983–93.
[17] Jimenez GA, Jana SC. Oxidized carbon nanofiber/polymercomposites prepared by chaotic mixing. Carbon2007;45:2079–91.
[18] Danescu RI, Zumbrunnen DA. Production of electricallyconducting plastic composites by three-dimensional chaoticmixing of melts and powder additives. J Vinyl Addit Technol2000;6:26–33.
[19] Chougule VA, Zumbrunnen DA. In situ assembly using a co-continuous chaotic advection blending process of electricallyconducting networks in carbon black–thermoplasticextrusions. Chem Eng Sci 2005;60:2459–67.
[20] Dharaiya D, Jana SC, Lyuksyutov S. Production of electricallyconductive networks in immiscible polymer blends bychaotic mixing. Polym Eng Sci 2006;46:19–28.
[21] Jung CD, Gunes IS, Jana SC. Time scales of mixing andchemical reactions in synthesis of thermoplasticpolyurethanes in chaotic mixers. Ind Eng Chem Res2007;46:2413–22.
[22] Sau M, Jana SC. A study on the effects of chaotic mixer designand operating conditions on morphology development inimmiscible polymer systems. Polym Eng Sci 2004;44:407–22[Errata ‘‘A study on the effects of chaotic mixer design andoperating conditions on morphology development inimmiscible polymer systems’’. Polym. Eng. Sci. 2004;44:1403].
[23] Sau M, Jana SC. Effect of waveforms on morphologydevelopment in chaotic mixing of polymers. AIChE J2004;50:2346–58.
[24] Li FK, Hou JN, Zhu W, Zhang X, Xu M, Luo XL, et al.Crystallinity and morphology of segmented polyurethaneswith different soft segment length. J Appl Polym Sci1996;62:631–8.
[25] Petrovich ZS, Zavargo Z, Flynn JH, Macknight WJ. Thermaldegradation of segmented polyurethanes. J Appl Polym Sci1994;51:1087–95.
[26] Gunes IS, Cao F, Jana SC. Effect of thermal expansion onshape memory behavior of polyurethane and itsnanocomposites. J Polym Sci Part B: Polym Phys2008;46:1437–49.
[27] Probst N, Grivei E. Structure and electrical properties ofcarbon black. Carbon 2002;40:201–5.
[28] Bacon R, Schalamon WA. Physical properties of high modulusgraphite fibers made from a rayon precursor. Appl PolymSymp 1969;9:285–92.
[29] Langer L, Bayot V, Grivei E, Issi J-P, Heremans JP, Olk CH, et al.Quantum transport in a multiwalled carbon nanotube. PhysRev Lett 1996;76:479–82.
[30] Fischer JE, Dai H, Thess A, Lee R, Hanjani NM, Dehaas DL,et al. Metallic resistivity in crystalline ropes of single-wallcarbon nanotubes. Phys Rev B 1997;55:R4921–4.
[31] Jenkins GM, Kawamura K. Polymeric carbons – carbon fiber,glass and char. Cambridge: Cambridge University Press;1976. p. 86–7.
[32] Ajayan PM [Structure and morphology of carbon nanotubes].In: Ebbesen TW, editor. Carbon nanotubes: preparation andproperties. Boca Raton: CRC Press; 1997 [chapter 3].
[33] Jia Z, Wang Z, Liang J, Wei B, Wu D. Production of short multi-walled carbon nanotubes. Carbon 1999;37:903–6.
[34] Medalia AI, Rivin D. Carbon blacks. In: Parfitt GD, Sing KSW,editors. Characterization of powder surfaces: with specialreference to pigments and fillers. London: Academic Press;1976. p. 279–351.
[35] Briggs D. Polymer surface characterization by XPS and SIMS.In: Spells SJ, editor. Characterization of solid polymers: newtechniques and developments. London: Chapman & Hall;1994 [chapter 8].
[36] Boehm HP. Surface oxides on carbon and their analysis: acritical assessment. Carbon 2002;40:145–9.
[37] Schneider NS, Paik Sung CS. Transition behavior and phasesegregation in TDI polyurethanes. Polym Eng Sci1977;17:73–80.
[38] Van Bogart JWC, Gibson PE, Cooper SL. Structure–propertyrelationships in polycaprolactone–polyurethanes. J PolymSci: Polym Phys 1983;21:65–95.
[39] Mondal S, Hu JL. Thermal degradation study offunctionalized MWCNT reinforced segmented polyurethanemembrane. J Elast Plast 2006;38:261–71.
[40] Kashiwagi T, Grulke E, Hilding J, Groth K, Harris R, Butler K,et al. Thermal and flammability properties of polypropylene/carbon nanotube nanocomposites. Polymer 2004;45:4227–39.
[41] Manson JA, Sperling LH. Polymer blends andcomposites. New York: Plenum Press; 1976. p. 59–62.
[42] Yang IK, Lin JD. Effects of flow on polymeric reactions. PolymEng Sci 2002;42:753–9.
[43] Ottino JM. Mixing and chemical reactions: a tutorial. ChemEng Sci 1994;49:4005–27.
[44] Jana SC, Jung C. Exploiting chaos: should polymerizationreactors be chaotic? ACS Polym Prep 2008;49:767–8.
[45] Cao F, Jana SC. Nanoclay-tethered shape memorypolyurethane nanocomposites. Polymer 2007;48:3790–800.
[46] Donth E-J. Relaxation and thermodynamics in polymers:glass transition. Berlin: Akademie Verlag; 1992. p. 25–7.
[47] Phillips PJ, Rensch GJ, Taylor KD. Crystallization studies ofpoly(e-caprolactone). I. Morphology and kinetics. J Polym SciPart B: Polym Phys 1987;25:1725–40.
[48] Ping P, Wang W, Chen X, Jing X. The influence of hard-segments on two-phase structure and shape memoryproperties of PCL-based segmented polyurethanes. J PolymSci Part B: Polym Phys 2007;45:557–70.
C A R B O N 4 7 ( 2 0 0 9 ) 9 8 1 – 9 9 7 997
[49] Fitchmun D, Newman S. Surface morphology in semi-crystalline polymers. J Polym Sci: Polym Lett Ed 1969;7:301–5.
[50] Fitchmun DR, Newman S. Surface crystallization ofpolypropylene. J Polym Sci Part A-2 1970;8:1545–64.
[51] Chatterjee AM, Price FP, Newman S. Heterogeneousnucleation of crystallization of high polymers from the melt.I. Substrate-induced morphologies. J Polym Sci: Polym Phys1975;13:2369–83.
[52] Campbell D, Qayyum MM. Melt crystallization ofpolypropylene: effect of contact with fiber substrates. J PolymSci: Polym Phys 1980;18:83–93.
[53] Mironov VS, Park M, Choe C, Kim J, Lim S, Ko H. Influence ofcarbon fiber surface treatments on the structure andproperties of conductive carbon fiber/polyethylene films. JAppl Polym Sci 2002;84:2040–8.
[54] Zhang Y, Chen R, Hui Z. Effects of interfacial stress-inducedcrystallization on the matrix crystalline morphology and themechanical properties of glass fiber reinforced high densitypolyethylene composites. J Adhesion Sci Technol2000;14:1405–21.
[55] Lopez LC, Wilkes GL. Some aspects of carbon fiber type andits surface treatment on the nucleation behavior of poly(p-phenylene sulfide) based composites. J Thermoplast ComposMater 1991;4:58–71.
[56] Desio GP, Rebenfeld L. Crystallization of fiber reinforcedpoly(phenylene sulfide) composites. I. Experimental studiesof crystallization rates and morphology. J Appl Polym Sci1992;44:1989–2001.
[57] Itoi M, Yamada Y, Pipes RB. Effect of surface treatment ofpitch-based carbon fiber on mechanical properties ofpolyethernitrile composites. Polym Compos 1992;13:15–29.
[58] Fowkes FM, Mostafa MA. Acid–base interactions in polymeradsorption. Ind Eng Chem Prod Res Dev 1978;17:3–7.
[59] Lipatov YuS, Sergeeva LM. Adsorption of polymers. NewYork: Wiley; 1974 [chapter 4].
[60] Weber M, Kamal MR. Microstructure and volume resistivity ofcomposites of isotactic polypropylene reinforced withelectrically conductive fibers. Polym Compos 1997;18:726–40.
[61] Balberg I, Azulay D, Toker D, Millo O. Percolation andtunneling in composite materials. Int J Mod Phys B2004;18:2091–121.
[62] Segal E, Tchoudakov R, Narkis M, Siegmann A. Thermoplasticpolyurethane–carbon black compounds: structure, electricalconductivity and sensing of liquids. Polym Eng Sci2002;42:2430–9.
[63] Hong CM, Kim DJ, Jana SC. Shear-induced migration ofconductive fillers in injection molding. Polym Eng Sci2004;44:2101–9.
[64] Frydman E. Improvements in or relating to resistanceelements having positive temperature/resistancecharacteristics. UK Patent GB604,695; 1948.
[65] Voet A. Temperature effect of electrical resistivity of carbonblack filled polymers. Rubber Chem Technol 1981;54:42–50.
[66] He XJ, Du JH, Ying Z, Cheng HM, He XJ. Positive temperaturecoefficient effect in multiwalled carbon nanotube/high-density polyethylene composites. Appl Phys Lett2005;86:062112-1–3.
[67] Medalia AI. Electrical conduction in carbon black composites.Rubber Chem Technol 1986;59:432–54.
[68] Meyer J. Glass transition temperature as a guide to selectionof polymers suitable for PTC materials. Polym Eng Sci1973;13:462–8.
[69] Amin M, Hassan HH, Abdel-Bary EM. Conductivity of carbonblack loaded styrene–butadiene rubber. J Polym Sci: PolymChem 1974;12:2651–7.
[70] Klason C, Kubat J. Anomalous behavior of electricalconductivity and thermal noise in carbon black containingpolymers at Tg and Tm. J Appl Polym Sci 1975;19:831–45.
[71] Ohe K, Naito Y. A new resistor having an anomalously largepositive temperature coefficient. Jpn J Appl Phys1971;10:99–108.
[72] Meyer J. Stability of polymer composites as positive-temperature-coefficient resistors. Polym Eng Sci1974;14:706–16.
[73] Luo Y, Wang G, Zhang B, Zhang Z. The influence of crystallineand aggregate structure on PTC characteristic of conductivepolyethylene/carbon black composite. Eur Polym J1998;34:1221–7.
[74] Wolfer D. An examination of conductive silicone elastomers.Eur Rubber J 1977(April):16–23.
[75] Hindermann-Bischoff M, Ehrburger-Dolle F. Electricalconductivity of carbon black–polyethylene composites:experimental evidence of the change of cluster connectivityin the PTC effect. Carbon 2001;39:375–82.
[76] Robertson RE. Polymer order and polymer density. J PhysChem 1965;69:1575–8.
[77] Hubbell DS, Cooper SL. Segmental orientation in blends ofpoly (e-caprolactone) with poly(vinyl chloride) andnitrocellulose. J Polym Sci Part B: Polym Phys 1977;15:1143–61.
[78] Sheng P, Sichel EK, Gittleman JI. Fluctuation-inducedtunneling conduction in carbon–polyvinylchloridecomposites. Phys Rev Lett 1978;40:1197–200.
[79] Meier JG, Mani JW, Kluppel M. Analysis of carbon blacknetworking in elastomers by dielectric spectroscopy. PhysRev B 2007;75:054202-1–054202-10.
[80] Voet A, Whitten Jr WmN, Cook FR. Electron tunneling incarbon blacks. Kolloid Z 1965;201:39–46.
[81] Sherman RD, Middleman LM, Jacobs SM. Electron transportprocesses in conductor-filled polymers. Polym Eng Sci1983;23:36–46.
[82] Narkis M, Ram A, Stein Z. Electrical properties of carbonblack filled cross-linked polyethylene. Polym Eng Sci1981;21:1049–54.
[83] Kraus G. Interactions of elastomers and reinforcing fillers.Rubber Chem Technol 1965;38:1070–114.
[84] Bulgin D. Electrically conductive rubber. Rubber ChemTechnol 1946;19:667–95.
[85] Voet A, Sircar AK, Mullens TJ. Electrical properties ofstretched carbon black loaded vulcanizates. Rubber ChemTechnol 1969;42:874–91.
[86] Knite M, Teteris V, Kiploka A. The effect of plasticizing agenton strain induced change of electric resistivity of carbonpolyisoprene nanocomposites. Mater Sci Eng C2003;23:787–90.
[87] Pramanik PK, Khastgir D, Saha TN. Effect of extensionalstrain on the resistivity of electrically conductive nitrilerubber composites filled with carbon filler. J Mater Sci1993;28:3539–46.
[88] Sau KP, Chaki TK, Khastgir D. The change in conductivity of arubber–carbon black composite subjected to different modesof pre-strain. Compos Part A – Appl Sci Manuf 1998;29:363–70.
Copyright © 2022 FDOKUMEN