Tracing the links between science and technology: An exploratory analysis of scientists’ and...
13
Research Policy 39 (2010) 14–26 Contents lists available at ScienceDirect Research Policy journal homepage: www.elsevier.com/locate/respol Tracing the links between science and technology: An exploratory analysis of scientists’ and inventors’ networks Stefano Breschi a,∗ , Christian Catalini a,b a KITeS-Cespri, Università L. Bocconi, Milan, Italy b Rotman School of Management, University of Toronto, Canada article info Article history: Received 25 September 2007 Received in revised form 9 November 2009 Accepted 22 November 2009 Available online 30 December 2009 JEL classification: O31 D85 Keywords: Science-technology Research networks Knowledge transfer abstract The paper provides an exploratory analysis of the research networks linking scientists working in an open science environment, and researchers involved in the private technology domain. The study combines data on scientific co-authorship with data on patent co-invention, at the level of individual researchers, for three science-intensive technology fields, i.e. lasers, semiconductors and biotechnology, in order to assess the extent of the overlap between the two communities and to identify the role of key individuals in the process of knowledge transfer. Our findings reveal that the extent of the connectedness among scientists and inventors is rather large, and that particular individuals, i.e. authors-inventors, who act as gatekeepers and bridge the boundaries between the two domains, are fundamental to ensuring this connectivity. These individuals tend to occupy prominent positions in the scientific and the technological networks. However, our results also show maintaining a very central position in the scientific network may come at the expense of being able to fill a similarly central position in a technological network (and vice versa). Finally, preliminary analysis of the institutional origins of authors-inventors shows that one characteristic, distinctive of Europe compared to the United States, is associated with the relatively lower involvement of corporate scientists at the intersection between the two worlds of science and technology. © 2009 Elsevier B.V. All rights reserved. 1. Introduction The relationships between science and technology have long been and continue to be the subject of intense debate both within academia and in the society. The idea that science and technology co-evolve and interact in rather complex ways has replaced the old linear model in which the progress of science was essentially exogenous and technological advances were merely the outcomes of applied research and development (R&D) efforts. Much of the empirical evidence collected since the mid 1980s supports this new thinking in documenting a tightening of the links between techno- logical innovation and scientific research. Moreover, the perception that technological developments and scientific advancements are increasingly interdependent is affecting the design of public poli- cies. Many governments around the world are looking for ways to encourage technology transfer from university to industry, through measures and instruments aimed at supporting academic scientists to assume more entrepreneurial attitudes, particularly through the enforcement of intellectual property rights over their discoveries. ∗ Corresponding author at: KITeS-CESPRI, Department of Economics, Università L. Bocconi, Via Sarfatti 25, 20136 Milan, Italy. Tel.: +39 02 58363365. E-mail address: [email protected] (S. Breschi). Against this background, the development of new empir- ical approaches to capture the complex set of interactions between science and technology seems particularly important. Notwithstanding recent advances in the measurement of science- technology linkages, the extent of the connectivity between the communities of scientists and technologists has not been explored in detail. Although scientific and technological research networks represent distinctive social structures responding to different norms of behaviour and different reward systems, it has been noted that they can co-exist and interconnect in various ways (Dasgupta and David, 1994; David et al., 1999). In this respect, mapping the structure of these networks and assessing the degree of overlap between them may contribute greatly to our understanding of the processes underlying knowledge transfer and to the design of better policy instruments to support them. In spite of the recur- rent use of network metaphors in much of the ongoing debate on university–industry relationships, there is a need for more system- atic empirical analyses of the networks linking scientists working in the realm of open science and researchers involved in the pri- vate technology domain. The objective of this paper is to provide an exploratory analysis of the intersection and overlap between these networks and the simultaneous embeddedness of an individual researcher within them. We exploit a large scale data set containing full bibliographic information taken from patent applications and 0048-7333/$ – see front matter © 2009 Elsevier B.V. All rights reserved. doi:10.1016/j.respol.2009.11.004
Transcript of Tracing the links between science and technology: An exploratory analysis of scientists’ and...
Ts
Sa
b
a
ARRAA
JOD
KSRK
1
bacoeoetlticemte
L
0d
Research Policy 39 (2010) 14–26
Contents lists available at ScienceDirect
Research Policy
journa l homepage: www.e lsev ier .com/ locate / respol
racing the links between science and technology: An exploratory analysis ofcientists’ and inventors’ networks
tefano Breschia,∗, Christian Catalinia,b
KITeS-Cespri, Università L. Bocconi, Milan, ItalyRotman School of Management, University of Toronto, Canada
r t i c l e i n f o
rticle history:eceived 25 September 2007eceived in revised form 9 November 2009ccepted 22 November 2009vailable online 30 December 2009
EL classification:3185
a b s t r a c t
The paper provides an exploratory analysis of the research networks linking scientists working in an openscience environment, and researchers involved in the private technology domain. The study combinesdata on scientific co-authorship with data on patent co-invention, at the level of individual researchers,for three science-intensive technology fields, i.e. lasers, semiconductors and biotechnology, in order toassess the extent of the overlap between the two communities and to identify the role of key individualsin the process of knowledge transfer. Our findings reveal that the extent of the connectedness amongscientists and inventors is rather large, and that particular individuals, i.e. authors-inventors, who actas gatekeepers and bridge the boundaries between the two domains, are fundamental to ensuring this
eywords:cience-technologyesearch networksnowledge transfer
connectivity. These individuals tend to occupy prominent positions in the scientific and the technologicalnetworks. However, our results also show maintaining a very central position in the scientific networkmay come at the expense of being able to fill a similarly central position in a technological network (andvice versa). Finally, preliminary analysis of the institutional origins of authors-inventors shows that onecharacteristic, distinctive of Europe compared to the United States, is associated with the relatively lowerinvolvement of corporate scientists at the intersection between the two worlds of science and technology.
. Introduction
The relationships between science and technology have longeen and continue to be the subject of intense debate both withincademia and in the society. The idea that science and technologyo-evolve and interact in rather complex ways has replaced theld linear model in which the progress of science was essentiallyxogenous and technological advances were merely the outcomesf applied research and development (R&D) efforts. Much of thempirical evidence collected since the mid 1980s supports this newhinking in documenting a tightening of the links between techno-ogical innovation and scientific research. Moreover, the perceptionhat technological developments and scientific advancements arencreasingly interdependent is affecting the design of public poli-ies. Many governments around the world are looking for ways to
ncourage technology transfer from university to industry, througheasures and instruments aimed at supporting academic scientistso assume more entrepreneurial attitudes, particularly through thenforcement of intellectual property rights over their discoveries.
∗ Corresponding author at: KITeS-CESPRI, Department of Economics, Università. Bocconi, Via Sarfatti 25, 20136 Milan, Italy. Tel.: +39 02 58363365.
E-mail address: [email protected] (S. Breschi).
048-7333/$ – see front matter © 2009 Elsevier B.V. All rights reserved.oi:10.1016/j.respol.2009.11.004
© 2009 Elsevier B.V. All rights reserved.
Against this background, the development of new empir-ical approaches to capture the complex set of interactionsbetween science and technology seems particularly important.Notwithstanding recent advances in the measurement of science-technology linkages, the extent of the connectivity between thecommunities of scientists and technologists has not been exploredin detail. Although scientific and technological research networksrepresent distinctive social structures responding to differentnorms of behaviour and different reward systems, it has been notedthat they can co-exist and interconnect in various ways (Dasguptaand David, 1994; David et al., 1999). In this respect, mapping thestructure of these networks and assessing the degree of overlapbetween them may contribute greatly to our understanding ofthe processes underlying knowledge transfer and to the design ofbetter policy instruments to support them. In spite of the recur-rent use of network metaphors in much of the ongoing debate onuniversity–industry relationships, there is a need for more system-atic empirical analyses of the networks linking scientists workingin the realm of open science and researchers involved in the pri-
vate technology domain. The objective of this paper is to provide anexploratory analysis of the intersection and overlap between thesenetworks and the simultaneous embeddedness of an individualresearcher within them. We exploit a large scale data set containingfull bibliographic information taken from patent applications and
search
stWlcinstrmeS
2
2
eslidoMaosrP
ciUpamb1aeevAespei
aamgFoipiotic2
vative output than firm-level scientific capabilities, measured bythe volume and quality of scientific publications.2 The crucial roleof corporate scientists in enabling flows of external knowledgeto corporate researchers is emphasised by Furukawa and Goto
1 A further motivation for European researchers to collect data on individualresearchers is related to the institutional peculiarities of the academic system inEurope compared to the US. In particular, given the absence until recently of specificlegislation promoting university patenting, and the general lack of administrativeoffices in European universities capable of handling patent applications, inventionsby academic scientists are often produced in collaboration with and patented byprivate companies. Thus, the only way to assess the extent of academic patenting
S. Breschi, C. Catalini / Re
cientific publications cited in patents, for three science-intensiveechnology fields, i.e. lasers, semiconductors and biotechnology.
e examine co-authorship and co-invention data, using the ana-ytical tools of social network analysis, to assess the extent ofonnectedness among the two communities of researchers and tonvestigate the position of individual scientists in these researchetworks. The paper is organised as follows. Section 2 provides ahort review of the empirical literature which attempts to tracehe linkages between science and technology, with a focus on theole of patenting-publishing scientists. Section 3 describes the basicethodological framework and the strategy adopted to collect the
mpirical data. Section 4 illustrates and discusses the main findings,ection 5 concludes.
. Background literature
.1. Tracing the links between science and technology
The increasing interdependencies and interactions between sci-nce and technology have been measured and documented ineveral studies with the use of different empirical indicators. Aine of research pioneered by Francis Narin and colleagues exploitsnformation on references to scientific articles contained in patentocuments, which shows an increasing reliance of private technol-gy on public science (Narin and Noma, 1985; Narin et al., 1997;cMillan et al., 2000; Hicks et al., 2001; Tijssen, 2001; Branstetter
nd Ogura, 2005). A related line of enquiry investigates the patternsf scientific paper co-authorship among academic and corporatecientists, and provides evidence of increasing levels of collabo-ation across organisational boundaries (Hicks, 1995; Calvert andatel, 2003; Tijssen, 2004).
A different stream of research attempts to assess the directontribution of universities to the development of technology andndustry competitiveness. In the wake of the Bayh-Dole Act, severalS scholars have attempted to estimate the volume of academicatenting showing its impressive growth. The number of patentpplications from universities yearly to the US Patent and Trade-ark Office (USPTO) has grown much faster than applications from
usiness companies and individuals, from less than 100 in the960s to more than 3000 at the end of the 1990s (Henderson etl., 1998; Mowery et al., 2001; Sampat et al., 2003). From a differ-nt perspective and using a different methodology, some authorsxplore the contribution of university research to industrial inno-ation more directly, via interviews or surveys (Mansfield, 1995;grawal and Henderson, 2002). Alongside inter-industry differ-nces in the relationship between university and industry, thesetudies generally show that industry respondents rate academicatents and licences as one of the least effective sources of knowl-dge, compared to scientific publications, conferences and informalnteractions with academic researchers.
In recent times, the focus on university–industry relationshipsnd knowledge transfer seems to have shifted somewhat frommacro (i.e. organisational and institutional) level research to aore micro (i.e. individual) level of analysis. In addition to the
reater availability of data, there are two main reasons for this shift.irst, there is increased concern over the adoption internationallyf legislation emulating the Bayh-Dole Act and the accompany-ng need to test the effect of academic patenting on the scientificroductivity of researchers. Second, scholars are becoming increas-
ngly aware that an exclusive focus in technology transfer studies,
n institutional characteristics, may preclude new insights intohe channels through which knowledge flows from university tondustry and the individual characteristics that may affect thehoice to patent (Owen-Smith and Powell, 2001; D’Este and Patel,007).Policy 39 (2010) 14–26 15
On the first point, since the Bayh-Dole Act was passed in 1980,many observers have raised concerns about the potentially nega-tive effects of the commercialisation of scientific discoveries for theconduct of academic research. It has been argued that the financialincentives from patenting and licensing could shift the orienta-tion of scientists away from basic and towards applied researchand could undermine their commitment to the norms of open sci-ence, thereby leading to secrecy and publication delays. In order toaddress these issues, many scholars have begun to compile largedata sets matching inventor names with scientific author names,and to collect data on individual researchers’ patenting and publi-cation performance (Azagra-Caro et al., 2006; Azoulay et al., 2006;Van Looy et al., 2006; Breschi et al., 2007, 2008; Calderini et al.,2007; Fabrizio and Di Minin, 2008).1 Although no consensus hasbeen reached, there is evidence that there is no apparent trade-offbetween patenting and either quantity or quality of research out-put. Not only do scientists with better patenting performance tendto exhibit superior publication scores with no decrease in the qual-ity of output, but also the most productive scientists are those mostlikely to become inventors.
A related stream of research focuses on the role of individ-ual scientists in relation to knowledge spillovers from academicresearch and knowledge transfer from university to industry morebroadly. The need for a better understanding of the mechanismsof knowledge flows has sparked several attempts to trace per-sonal links between academic researchers and private firms. In thiscontext, Cockburn and Henderson (1998) argue that the extentof connectedness to the community of open science is a keyfactor explaining the ability of firms to tap into scientific develop-ments. Establishing linkages with the community of open sciencemay crucially affect their capacity to recognise and effectivelyexploit upstream developments in basic research. Using qualita-tive information and data on scientific co-authorship, Cockburnand Henderson show that firms strive to develop this capacity byrecruiting and rewarding researchers based on their ranking inthe hierarchy of public-sector science and their ability to engagewith the academic community. Along similar lines, Zucker et al.(1998, 2002) suggest that the most successful biotech companiesare those that engage in co-authorship with university professorsand show that their commercial success, in terms of numbers ofproducts developed and commercialised, is positively related tothe eminence of the researchers with shareholdings and scien-tific board membership. Gittelman and Kogut (2003) show thecrucial importance to biotechnology firms of maintaining tieswith the open science community via boundary-spanning ‘gate-keepers’ who facilitate access to socially embedded knowledge.Integrating scientific research at the level of individual scien-tists, i.e. including publishing scientists in teams of inventors,seems to have more of an impact on the quality of the inno-
in Europe is to match the names of inventors listed in patent documents to the listsof academic researchers (Balconi et al., 2004; Lissoni et al., 2008).
2 The results in Cassiman et al. (2008) are slightly different and show thatinvention-specific science linkages, as measured by citations in patents to scien-tific publications, are less important for the quality of innovation output than thefirm’s closeness to science, captured by the volume of scientific publications.
1 search
(robdc
moStik(eecpht
2
mecnPesaoaitwTbdetointsi2
seriflSsTvsd
atte
6 S. Breschi, C. Catalini / Re
2006). Their results show that core scientists, defined as corpo-ate researchers whose scientific papers are frequently cited inther papers, while not responsible for a significantly higher num-er of patent applications than their fellow company researchers,o have a positive impact on the innovative productivity of theiro-inventors.
Finally, another line of research has focused on the contractualechanisms and individual motivations behind the involvement
f academic scientists in collaborations with private companies.tern (2004) suggests that there might be a labour cost advantageo firms hiring scientists as long as these individuals are will-ng to accept a lower wage in exchange for the opportunity toeep abreast of high quality basic research. Audretsch and Stephan1996, 1999) and Jensen and Thursby (2001) argue that since sci-ntists’ knowledge is characterised by high degrees of naturalxcludability and, in many cases, academic inventions are dis-losed at a proof-of-concept stage, firms need to recruit them asartners or stakeholders in order to gain access to the knowledgeeld by these individuals and to develop successful licensed inven-ions.
.2. Networks of scientists and inventors
There is a long tradition in scientometrics of exploiting infor-ation on co-authorship of scientific papers to analyse knowledge
xchange among researchers, both within and across individualompanies and academic research groups, and to investigate socialetworks of academic scientists (e.g. Kretschmer, 1994; Melin andersson, 1996; Persson and Beckmann, 1995). The most recentfforts in this tradition draw extensively on graph theory andocial network analysis techniques, to show that the scientific co-uthorship network is characterised by the structural propertiesf small world networks (Newman, 2000, 2001, 2004; Wagnernd Leydesdorff, 2005). Broadly speaking, a small world networks represented by a graph where the nodes are grouped aroundightly linked local cliques, but a relatively small number of stepsill connect every node in the network to every other node.
his type of structure is thought to be particularly important foroth the generation and the diffusion of knowledge. The highegree of density and redundancy of the links within local cliquesnsures the formation of a common language and communica-ion codes that enhance reciprocal trust and support the sharingf complex and tacit knowledge among actors; the short cuts link-ng local cliques to different and weakly connected parts of theetwork ensure rapid diffusion and recombination of new ideashroughout the network and allow a degree of openness to newources of knowledge, mitigating the risk of lock-in that could arisen the context of densely connected cliques (Cowan and Jonard,004).
Following the renewed interest in networks of collaboration,ome studies examine the properties of networks of co-inventionxploiting information contained in patent data. An importantesult from these studies is that social proximity among inventorsn collaboration networks is a fundamental driver of knowledgeows, captured by patent citations (Breschi and Lissoni, 2004, 2005;ingh, 2005). At the same time, the co-invention network does noteem to exhibit the structural properties of a small world graph.he largest connected component in the network accounts for aery small fraction of the nodes and the network appears globallyparse, i.e. nodes are scattered across a relatively large number ofisconnected components (Fleming et al., 2007).
Another approach taken by some scholars is to combine co-uthorship and co-invention data in order investigate the extento which the two communities – of academic scientists and indus-rial researchers – are linked. In an in-depth case study of tissuengineering, Murray (2002) proposes a novel methodology based
Policy 39 (2010) 14–26
on patent-publication pairs in order to analyse the co-evolution ofthe co-patenting and co-publishing network. Her results show thatthe scientific and technical networks remain distinctive and there islittle overlap between them. Nevertheless, the contribution of keyscientists to both domains is crucial through the creation of net-works of co-inventors and co-authors and engagement in a widerange of activities, such as advising, consulting, licensing and estab-lishing new firms. Bonaccorsi and Thoma (2007) investigate teamsof inventors in the field of nano-technology, distinguishing amongonly-inventor patents, i.e. inventors with no scientific publicationrecord, only-author patents, i.e. patents where all inventors haveat least one scientific publication, and author-inventor patents,i.e. those named on the patent include inventors with no pub-lications and publishing scientists. Bonaccorsi and Thoma showthat author-inventor patents tend to outperform those in the othertwo categories in terms of patent quality. They interpret this find-ing as evidence that patenting teams with higher institutionaland human capital complementarities are also the most effec-tive at realising and exploiting interactions between science andtechnology.
Co-authorship and co-invention data should be interpretedwith some caution since the rules determining authorship andinventorship can differ (Ducor, 2000). While the status of authorof a scientific article is the result of a negotiation process per-haps involving numerous members of a research team and mayvary according to the rules prevailing in the specific disciplinaryfield, the notion of inventorship, at least in principle, has a moreprecise legal meaning. At the same time, the number of authornames on a scientific article is frequently higher than the num-ber of inventors listed in a corresponding patent: Lissoni andMontobbio (2008) analyse this phenomenon empirically, examin-ing 681 patent-publication pairs across different disciplinary fields.Their results show that the first and last named authors have a rela-tively lower probability of being excluded from the list of inventorson a patent and that senior researchers are also more likely to beretained in the team of inventors.
2.3. Scope of this study
Building on the literature reviewed above, we provide anexploratory analysis of the simultaneous embeddedness ofresearchers in scientific and technological networks. First, we iden-tify the set of scientific papers relevant to a given technologicalfield by exploiting information on citations to the scientific litera-ture contained in patent documents; second, we use co-authorshipand co-invention data to investigate the connectivity between thescientific and technological research networks. While most stud-ies have focused on biotechnology and pharmaceuticals, or arelimited to a specific national or institutional environment (i.e.academic inventors), the methodology proposed here allows usto generalise some of the previous findings to other, less wellexplored science-based industries, such as lasers and semiconduc-tors, and to the global set of organisations. We also investigate thestructural positions of patenting-publishing scientists in the sci-entific and technological networks. Given the importance of therole played by these scientists in connecting the two realms, itis crucial to understand their location in the overall web of rela-tions. Are these individuals central in both types of networks, orare they prominent in only one (or none) of the two? How dopatenting-publishing scientists compare with their non-patentingnon-publishing peers in terms of their network locations? To what
extent do patenting scientists play the role of knowledge brokersby spanning across structural holes between disconnected teamsof corporate researchers? What are the institutional origins ofpatenting-publishing scientists? These questions are addressed inthe succeeding sections.
search
3
3
rtpondytndetfiOpt
itpasawadsi
sacctfoa
Ght
issb
StrwssihTtoniscr
but just 4.5% of all inventors in semiconductors. And the fraction ofall scientific authors that also patent is 24% for lasers and 13% forbiotechnology.8
S. Breschi, C. Catalini / Re
. Data and methodology
.1. Data sources and matching procedures
The empirical analysis in this paper relies on a large, complexelational data set that combines information on the lists of inven-ors on patent documents and the lists of authors of the scientificublications cited in those patents. We use social network analysisf co-authorship and co-invention ties to test the degree of con-ectedness between the two communities. The construction of ourata set started with the selection of technological fields for anal-sis of network links between scientists and inventors. We chosehree technological fields, i.e. lasers, semiconductors and biotech-ology, which are characterised by a strong reliance on scientificevelopments and, therefore (at least potentially) involve high lev-ls of interaction among the individuals involved in science andhose involved in industrial research. For each of these technologyelds, we extracted all patent applications to the European Patentffice (EPO) registered in the period 1990–2003, on the basis of therimary International Patent Classification (IPC) code reported inhe patent documents.3
For every patent application in these three technology fields, wedentified and extracted citations to the so-called non-patent litera-ure (NPL citations). These references derive from the search reportsroduced by patent examiners to assess the novelty of inventionsnd delimit the scope of their claims. NPL citations can includecientific articles/journals, books, technical bulletins and manu-ls or indeed any dated, written disclosure or publication whichas made publicly available prior to a patent application (Michel
nd Bettels, 2001). Although the number of NPL citations in patentocuments varies greatly across technology fields, the presence ofuch references may be taken as an indication of the knowledgendebtedness of the invention to the cited research.4
Given that NPL references can include items that are not con-idered scientific output, we implemented a procedure to identifynd select the subset of NPL citations that refer to scientific arti-les. We used a matching algorithm to pair each NPL citation to theorresponding (if any) scientific article recorded in the Science Cita-
ion Index (SCI) data set.5 Table 1 presents some summary statisticsrom the resulting data set. It should be noted that the percentagef patents citing scientific literature, and science intensity – defineds the ratio between total number of citations and total number of3 The selected IPC codes are: H01S for lasers, H01L for semiconductors and C12Q,01N33 (/53,54,55,57,68,74,76,78,88,92) for biotechnology. For this last field, weave followed the definition in OECD (2005) which includes biotechnology applica-ions for measuring, testing and diagnostics.
4 Also, the average number of NPL references is sometimes seen as a fairly reliablendicator of the extent to which a technology field depends upon or is related to thecientific developments. Schmoch (1993) provides a detailed discussion of the rea-ons for citing scientific literature in patents. Meyer (2000) discusses the differencesetween scientific and patent citations.5 The SCI data set is a multidisciplinary database, produced by the Institute for
cientific Information (ISI-Thomson), that covers the most important journals inhe natural and life sciences, providing information based on more than 5700 peer-eviewed international journals across 178 subject fields. For the present analysis,e used the online version of the database (www.isiknowledge.com/). Notwith-
tanding some limitations (for a detailed analysis see Callaert et al., 2006) thecientific publications recorded in this database are a satisfactory representation ofnternationally accepted high-quality “mainstream” basic and applied research, andave become a standard reference for most studies of science-technology linkages.he matching algorithm is rather complex and is decomposed in various stages. Inhe first stage, we implemented a parsing algorithm in order to separate the stringf text containing the NPL reference into appropriate fields (i.e. article title, jour-al title, author names, etc.). In the second stage, we took the journal titles thus
dentified and matched them to the list of journal titles covered by SCI. In the thirdtage, all NPL references in the patents were matched with the source article (if any)ontained in the SCI. For each technology field we considered only journals that hadeceived at least 5 patent citations over the period 1990–2003.
Policy 39 (2010) 14–26 17
citing patents – differ across the three technology fields. Whereasapproximately four in ten patents in lasers and biotechnology citeSCI papers, in the case of semiconductors the percentage is only13.5%. This difference is probably due to the higher propensity fortechnical inventions in semiconductors to rely on types of codifiedknowledge (i.e. technical bulletins, standards, etc.), which are nottypically considered to be ‘science’. While citations to the scientificliterature represent a relatively large fraction of all NPL citationsin the case of lasers and biotechnology (respectively, 53% and 45%),only some 20% of NPL citations in semiconductors refer to scientificarticles.
For the set of patent applications and scientific articles describedabove, we compared the list of inventor names in the patent docu-ment with the list of authors on the cited scientific publicationsand matched them to identify individuals responsible for botha patented invention and a cited scientific publication.6 In thisrespect, we had to deal with a major problem related to the fact thatpatent data report inventors’ first names and last names, whereasthe ISI-SCI data set records last name and initials of authors. There isa risk, therefore, in performing a simple matching by surname andfirst initial, of identifying different individuals as the same person,which could lead to an overestimation of the number of publishing-patenting scientists. To resolve this, we first standardised inventorand author names and surnames and conducted desktop researchinvolving a lot of manual checking and the use of several sourcesof information. The primary source was author affiliation recordedon the publication and inventor affiliation recorded in the patentdocument. We also used sources such as SCOPUS,7 the Internet,and university and company websites. We adopted a conservativeapproach, only matching two individuals (i.e. author and inventor)if we were reasonably confident that they were the same person.Table 2 reports the total number of inventors, scientific authorsand author-inventors (i.e. publishing and patenting scientists) inour data set. Patenting-publishing scientists represent around 21%and 18% of all inventors in lasers and biotechnology respectively,
6 It should be noted that we used citations in patents to scientific articles to delimitthe boundaries of the scientific community relevant to a certain technology field.Previous studies adopt different approaches to delimiting the set of scientific papersand authors to be associated to a given technology field. These include keywordsearch strategies (e.g. Meyer, 2006a,b; Bonaccorsi and Thoma, 2007), lexicographicapproaches to pairing patents and publications (e.g. Bassecoulard and Zitt, 2004),and hybrid methods to match the titles of patents and scientific publications (e.g.Leydesdorff, 2004). The approach used in this paper is rather conservative. On theone hand, it could exclude a few authors and papers, which, although not citedin patents, have contributed to the generation of the patented technical inven-tions. On the other hand, by including only authors and papers cited in patents,we avoid the risk of considering authors and papers not related to the technologyfields in question. We also conducted a benchmarking analysis in order to determinewhether publications cited in patents are cited more widely, i.e. are also (highly)cited by other scientific articles. We compared the average number of citations topublications cited in patents from other publications, with the corresponding aver-age for publications not cited in patents, controlling for publication year, journaltitle and subject field. Our results show that scientific publications cited in patentsbelonging to the three technology fields analysed, on average, receive a far largernumber of citations from other scientific publications than articles that are not citedin patents. Overall, we believe this result validates our methodology by ensuringthat we do not analyse a random and unchecked sample of publications, and arefocusing upon probably the most important publications (and authors) in each field.Results of the benchmarking analysis are available at http://ec.europa.eu/invest-in-research/pdf/download en/final report hcp.pdf.
7 The SCOPUS database produced by Elsevier provides detailed information oninstitutional affiliations and full first names and last names of authors of scien-tific publications. It covers around 15,000 peer-reviewed journals, including mostof those included in the SCI.
8 It is worth remarking once again that these fractions should be interpretedin the light of the methodology described above in the text. In particular, it is
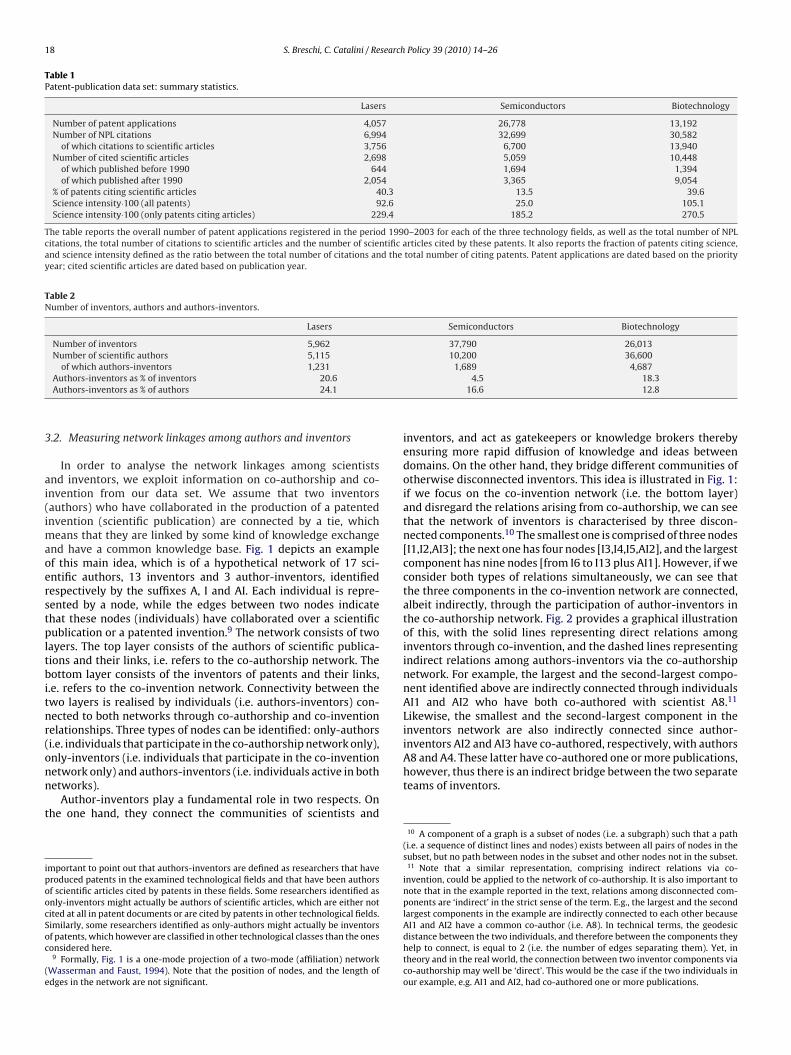
18 S. Breschi, C. Catalini / Research Policy 39 (2010) 14–26
Table 1Patent-publication data set: summary statistics.
Lasers Semiconductors Biotechnology
Number of patent applications 4,057 26,778 13,192Number of NPL citations 6,994 32,699 30,582
of which citations to scientific articles 3,756 6,700 13,940Number of cited scientific articles 2,698 5,059 10,448
of which published before 1990 644 1,694 1,394of which published after 1990 2,054 3,365 9,054
% of patents citing scientific articles 40.3 13.5 39.6Science intensity·100 (all patents) 92.6 25.0 105.1Science intensity·100 (only patents citing articles) 229.4 185.2 270.5
The table reports the overall number of patent applications registered in the period 1990–2003 for each of the three technology fields, as well as the total number of NPLcitations, the total number of citations to scientific articles and the number of scientific articles cited by these patents. It also reports the fraction of patents citing science,and science intensity defined as the ratio between the total number of citations and the total number of citing patents. Patent applications are dated based on the priorityyear; cited scientific articles are dated based on publication year.
Table 2Number of inventors, authors and authors-inventors.
Lasers Semiconductors Biotechnology
Number of inventors 5,962 37,790 26,013Number of scientific authors 5,115 10,200 36,600
of which authors-inventors 1,231 1,689 4,687
3
ai(imaoerstpltbitnr(onn
t
ipoocSoc
(e
A8 and A4. These latter have co-authored one or more publications,
Authors-inventors as % of inventors 20.6Authors-inventors as % of authors 24.1
.2. Measuring network linkages among authors and inventors
In order to analyse the network linkages among scientistsnd inventors, we exploit information on co-authorship and co-nvention from our data set. We assume that two inventorsauthors) who have collaborated in the production of a patentednvention (scientific publication) are connected by a tie, which
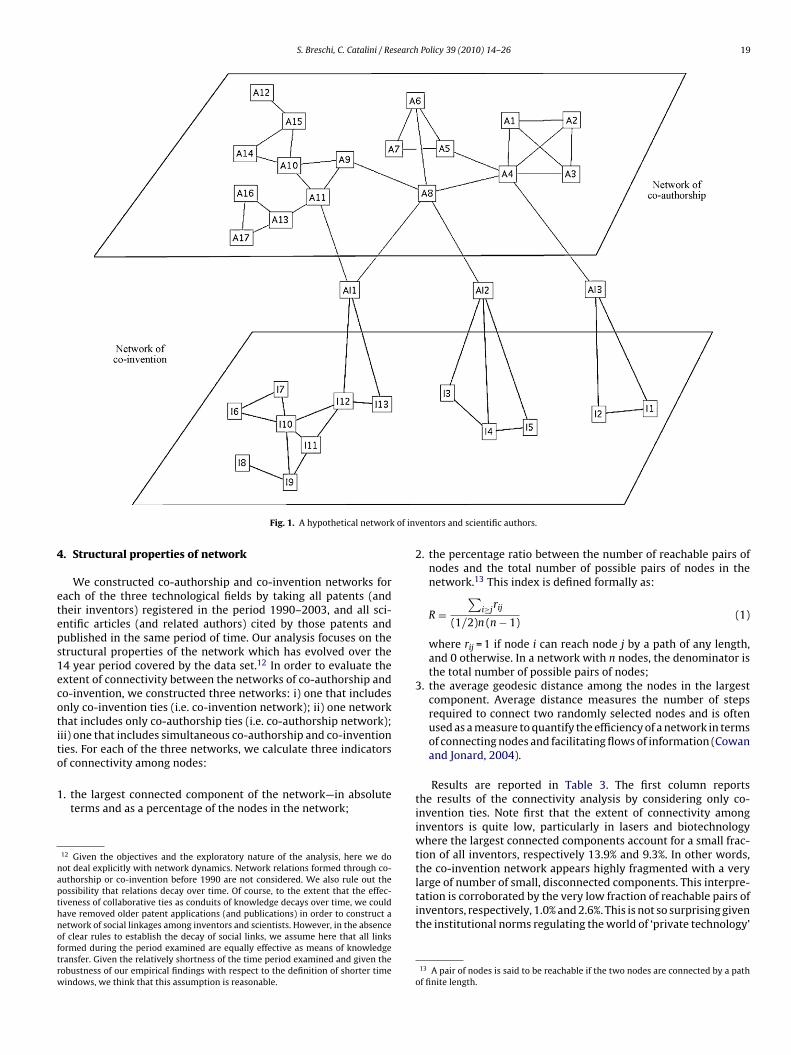
eans that they are linked by some kind of knowledge exchangend have a common knowledge base. Fig. 1 depicts an examplef this main idea, which is of a hypothetical network of 17 sci-ntific authors, 13 inventors and 3 author-inventors, identifiedespectively by the suffixes A, I and AI. Each individual is repre-ented by a node, while the edges between two nodes indicatehat these nodes (individuals) have collaborated over a scientificublication or a patented invention.9 The network consists of two
ayers. The top layer consists of the authors of scientific publica-ions and their links, i.e. refers to the co-authorship network. Theottom layer consists of the inventors of patents and their links,
.e. refers to the co-invention network. Connectivity between thewo layers is realised by individuals (i.e. authors-inventors) con-ected to both networks through co-authorship and co-inventionelationships. Three types of nodes can be identified: only-authorsi.e. individuals that participate in the co-authorship network only),nly-inventors (i.e. individuals that participate in the co-invention
etwork only) and authors-inventors (i.e. individuals active in bothetworks).Author-inventors play a fundamental role in two respects. Onhe one hand, they connect the communities of scientists and
mportant to point out that authors-inventors are defined as researchers that haveroduced patents in the examined technological fields and that have been authorsf scientific articles cited by patents in these fields. Some researchers identified asnly-inventors might actually be authors of scientific articles, which are either notited at all in patent documents or are cited by patents in other technological fields.imilarly, some researchers identified as only-authors might actually be inventorsf patents, which however are classified in other technological classes than the onesonsidered here.
9 Formally, Fig. 1 is a one-mode projection of a two-mode (affiliation) networkWasserman and Faust, 1994). Note that the position of nodes, and the length ofdges in the network are not significant.
4.5 18.316.6 12.8
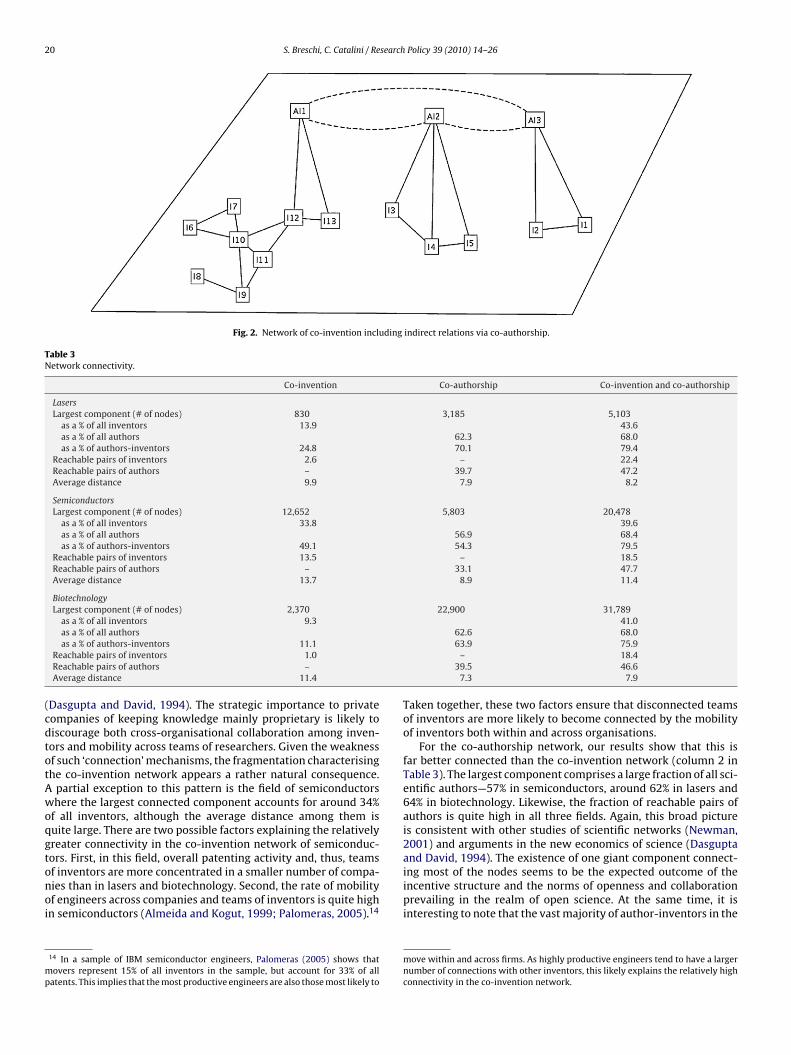
inventors, and act as gatekeepers or knowledge brokers therebyensuring more rapid diffusion of knowledge and ideas betweendomains. On the other hand, they bridge different communities ofotherwise disconnected inventors. This idea is illustrated in Fig. 1:if we focus on the co-invention network (i.e. the bottom layer)and disregard the relations arising from co-authorship, we can seethat the network of inventors is characterised by three discon-nected components.10 The smallest one is comprised of three nodes[I1,I2,AI3]; the next one has four nodes [I3,I4,I5,AI2], and the largestcomponent has nine nodes [from I6 to I13 plus AI1]. However, if weconsider both types of relations simultaneously, we can see thatthe three components in the co-invention network are connected,albeit indirectly, through the participation of author-inventors inthe co-authorship network. Fig. 2 provides a graphical illustrationof this, with the solid lines representing direct relations amonginventors through co-invention, and the dashed lines representingindirect relations among authors-inventors via the co-authorshipnetwork. For example, the largest and the second-largest compo-nent identified above are indirectly connected through individualsAI1 and AI2 who have both co-authored with scientist A8.11
Likewise, the smallest and the second-largest component in theinventors network are also indirectly connected since author-inventors AI2 and AI3 have co-authored, respectively, with authors
however, thus there is an indirect bridge between the two separateteams of inventors.
10 A component of a graph is a subset of nodes (i.e. a subgraph) such that a path(i.e. a sequence of distinct lines and nodes) exists between all pairs of nodes in thesubset, but no path between nodes in the subset and other nodes not in the subset.
11 Note that a similar representation, comprising indirect relations via co-invention, could be applied to the network of co-authorship. It is also important tonote that in the example reported in the text, relations among disconnected com-ponents are ‘indirect’ in the strict sense of the term. E.g., the largest and the secondlargest components in the example are indirectly connected to each other becauseAI1 and AI2 have a common co-author (i.e. A8). In technical terms, the geodesicdistance between the two individuals, and therefore between the components theyhelp to connect, is equal to 2 (i.e. the number of edges separating them). Yet, intheory and in the real world, the connection between two inventor components viaco-authorship may well be ‘direct’. This would be the case if the two individuals inour example, e.g. AI1 and AI2, had co-authored one or more publications.
S. Breschi, C. Catalini / Research Policy 39 (2010) 14–26 19
of in
4
eteps1ecotito
1
napthnoftrw
Fig. 1. A hypothetical network
. Structural properties of network
We constructed co-authorship and co-invention networks forach of the three technological fields by taking all patents (andheir inventors) registered in the period 1990–2003, and all sci-ntific articles (and related authors) cited by those patents andublished in the same period of time. Our analysis focuses on thetructural properties of the network which has evolved over the4 year period covered by the data set.12 In order to evaluate thextent of connectivity between the networks of co-authorship ando-invention, we constructed three networks: i) one that includesnly co-invention ties (i.e. co-invention network); ii) one networkhat includes only co-authorship ties (i.e. co-authorship network);ii) one that includes simultaneous co-authorship and co-inventionies. For each of the three networks, we calculate three indicators
f connectivity among nodes:. the largest connected component of the network—in absoluteterms and as a percentage of the nodes in the network;
12 Given the objectives and the exploratory nature of the analysis, here we doot deal explicitly with network dynamics. Network relations formed through co-uthorship or co-invention before 1990 are not considered. We also rule out theossibility that relations decay over time. Of course, to the extent that the effec-iveness of collaborative ties as conduits of knowledge decays over time, we couldave removed older patent applications (and publications) in order to construct aetwork of social linkages among inventors and scientists. However, in the absencef clear rules to establish the decay of social links, we assume here that all linksormed during the period examined are equally effective as means of knowledgeransfer. Given the relatively shortness of the time period examined and given theobustness of our empirical findings with respect to the definition of shorter timeindows, we think that this assumption is reasonable.
ventors and scientific authors.
2. the percentage ratio between the number of reachable pairs ofnodes and the total number of possible pairs of nodes in thenetwork.13 This index is defined formally as:
R =∑
i≥jrij
(1/2)n (n − 1)(1)
where rij = 1 if node i can reach node j by a path of any length,and 0 otherwise. In a network with n nodes, the denominator isthe total number of possible pairs of nodes;
3. the average geodesic distance among the nodes in the largestcomponent. Average distance measures the number of stepsrequired to connect two randomly selected nodes and is oftenused as a measure to quantify the efficiency of a network in termsof connecting nodes and facilitating flows of information (Cowanand Jonard, 2004).
Results are reported in Table 3. The first column reportsthe results of the connectivity analysis by considering only co-invention ties. Note first that the extent of connectivity amonginventors is quite low, particularly in lasers and biotechnologywhere the largest connected components account for a small frac-tion of all inventors, respectively 13.9% and 9.3%. In other words,the co-invention network appears highly fragmented with a very
large of number of small, disconnected components. This interpre-tation is corroborated by the very low fraction of reachable pairs ofinventors, respectively, 1.0% and 2.6%. This is not so surprising giventhe institutional norms regulating the world of ‘private technology’13 A pair of nodes is said to be reachable if the two nodes are connected by a pathof finite length.
20 S. Breschi, C. Catalini / Research Policy 39 (2010) 14–26
Fig. 2. Network of co-invention including indirect relations via co-authorship.
Table 3Network connectivity.
Co-invention Co-authorship Co-invention and co-authorship
LasersLargest component (# of nodes) 830 3,185 5,103
as a % of all inventors 13.9 43.6as a % of all authors 62.3 68.0as a % of authors-inventors 24.8 70.1 79.4
Reachable pairs of inventors 2.6 – 22.4Reachable pairs of authors – 39.7 47.2Average distance 9.9 7.9 8.2
SemiconductorsLargest component (# of nodes) 12,652 5,803 20,478
as a % of all inventors 33.8 39.6as a % of all authors 56.9 68.4as a % of authors-inventors 49.1 54.3 79.5
Reachable pairs of inventors 13.5 – 18.5Reachable pairs of authors – 33.1 47.7Average distance 13.7 8.9 11.4
BiotechnologyLargest component (# of nodes) 2,370 22,900 31,789
as a % of all inventors 9.3 41.0as a % of all authors 62.6 68.0
(cdtotAwoqgtonoi
mp
as a % of authors-inventors 11.1Reachable pairs of inventors 1.0Reachable pairs of authors –Average distance 11.4
Dasgupta and David, 1994). The strategic importance to privateompanies of keeping knowledge mainly proprietary is likely toiscourage both cross-organisational collaboration among inven-ors and mobility across teams of researchers. Given the weaknessf such ‘connection’ mechanisms, the fragmentation characterisinghe co-invention network appears a rather natural consequence.
partial exception to this pattern is the field of semiconductorshere the largest connected component accounts for around 34%
f all inventors, although the average distance among them isuite large. There are two possible factors explaining the relativelyreater connectivity in the co-invention network of semiconduc-ors. First, in this field, overall patenting activity and, thus, teams
f inventors are more concentrated in a smaller number of compa-ies than in lasers and biotechnology. Second, the rate of mobilityf engineers across companies and teams of inventors is quite highn semiconductors (Almeida and Kogut, 1999; Palomeras, 2005).1414 In a sample of IBM semiconductor engineers, Palomeras (2005) shows thatovers represent 15% of all inventors in the sample, but account for 33% of all
atents. This implies that the most productive engineers are also those most likely to
63.9 75.9– 18.4
39.5 46.67.3 7.9
Taken together, these two factors ensure that disconnected teamsof inventors are more likely to become connected by the mobilityof inventors both within and across organisations.
For the co-authorship network, our results show that this isfar better connected than the co-invention network (column 2 inTable 3). The largest component comprises a large fraction of all sci-entific authors—57% in semiconductors, around 62% in lasers and64% in biotechnology. Likewise, the fraction of reachable pairs ofauthors is quite high in all three fields. Again, this broad pictureis consistent with other studies of scientific networks (Newman,2001) and arguments in the new economics of science (Dasguptaand David, 1994). The existence of one giant component connect-
ing most of the nodes seems to be the expected outcome of theincentive structure and the norms of openness and collaborationprevailing in the realm of open science. At the same time, it isinteresting to note that the vast majority of author-inventors in themove within and across firms. As highly productive engineers tend to have a largernumber of connections with other inventors, this likely explains the relatively highconnectivity in the co-invention network.
search
fiopc
ncoulfstbtoaklobbw2rseeat
bncaaafFaatablctttbt
4
wwti
enia
from node i. The index captures the proximity of an actor to all otheractors in the network and can be interpreted as a measure of howlong it takes for information to spread from a given node to otherreachable nodes in the network (and vice versa). The value of the
S. Breschi, C. Catalini / Re
elds examined are included in the largest connected componentf the co-authorship network, thereby indicating that patenting-ublishing scientists are well integrated within the open scienceommunity.
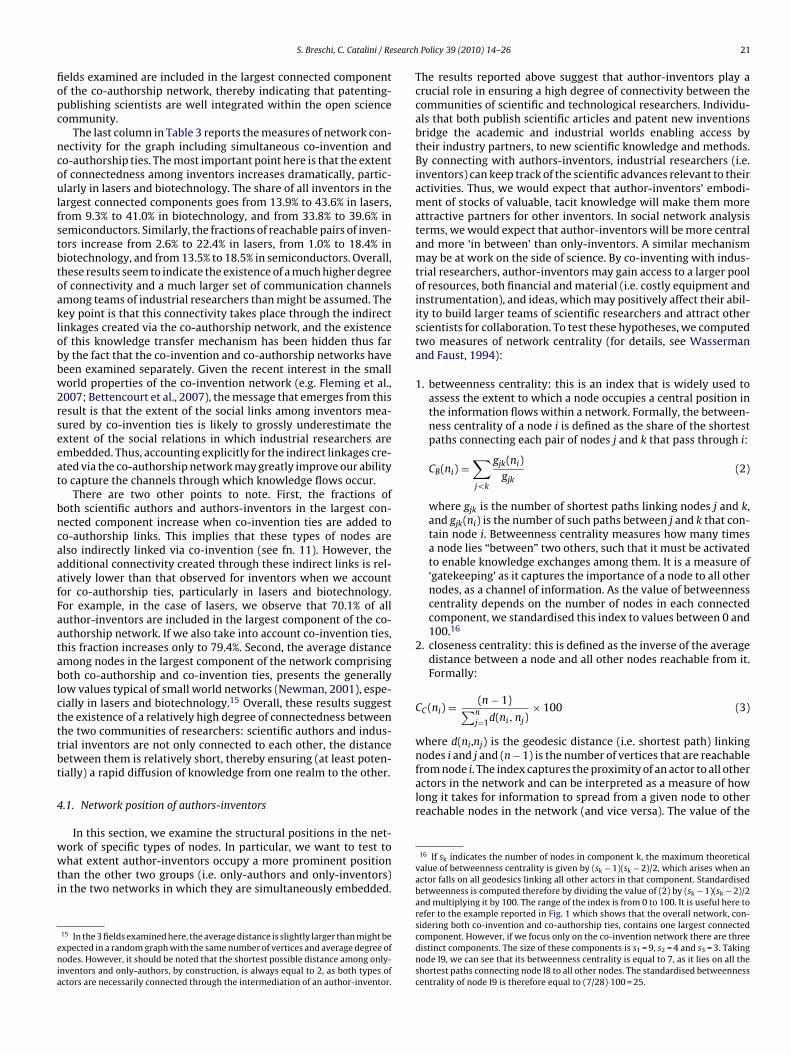
The last column in Table 3 reports the measures of network con-ectivity for the graph including simultaneous co-invention ando-authorship ties. The most important point here is that the extentf connectedness among inventors increases dramatically, partic-larly in lasers and biotechnology. The share of all inventors in the
argest connected components goes from 13.9% to 43.6% in lasers,rom 9.3% to 41.0% in biotechnology, and from 33.8% to 39.6% inemiconductors. Similarly, the fractions of reachable pairs of inven-ors increase from 2.6% to 22.4% in lasers, from 1.0% to 18.4% iniotechnology, and from 13.5% to 18.5% in semiconductors. Overall,hese results seem to indicate the existence of a much higher degreef connectivity and a much larger set of communication channelsmong teams of industrial researchers than might be assumed. Theey point is that this connectivity takes place through the indirectinkages created via the co-authorship network, and the existencef this knowledge transfer mechanism has been hidden thus fary the fact that the co-invention and co-authorship networks haveeen examined separately. Given the recent interest in the smallorld properties of the co-invention network (e.g. Fleming et al.,
007; Bettencourt et al., 2007), the message that emerges from thisesult is that the extent of the social links among inventors mea-ured by co-invention ties is likely to grossly underestimate thextent of the social relations in which industrial researchers arembedded. Thus, accounting explicitly for the indirect linkages cre-ted via the co-authorship network may greatly improve our abilityo capture the channels through which knowledge flows occur.
There are two other points to note. First, the fractions ofoth scientific authors and authors-inventors in the largest con-ected component increase when co-invention ties are added too-authorship links. This implies that these types of nodes arelso indirectly linked via co-invention (see fn. 11). However, thedditional connectivity created through these indirect links is rel-tively lower than that observed for inventors when we accountor co-authorship ties, particularly in lasers and biotechnology.or example, in the case of lasers, we observe that 70.1% of alluthor-inventors are included in the largest component of the co-uthorship network. If we also take into account co-invention ties,his fraction increases only to 79.4%. Second, the average distancemong nodes in the largest component of the network comprisingoth co-authorship and co-invention ties, presents the generally
ow values typical of small world networks (Newman, 2001), espe-ially in lasers and biotechnology.15 Overall, these results suggesthe existence of a relatively high degree of connectedness betweenhe two communities of researchers: scientific authors and indus-rial inventors are not only connected to each other, the distanceetween them is relatively short, thereby ensuring (at least poten-ially) a rapid diffusion of knowledge from one realm to the other.
.1. Network position of authors-inventors
In this section, we examine the structural positions in the net-
ork of specific types of nodes. In particular, we want to test tohat extent author-inventors occupy a more prominent positionhan the other two groups (i.e. only-authors and only-inventors)n the two networks in which they are simultaneously embedded.
15 In the 3 fields examined here, the average distance is slightly larger than might bexpected in a random graph with the same number of vertices and average degree ofodes. However, it should be noted that the shortest possible distance among only-
nventors and only-authors, by construction, is always equal to 2, as both types ofctors are necessarily connected through the intermediation of an author-inventor.
Policy 39 (2010) 14–26 21
The results reported above suggest that author-inventors play acrucial role in ensuring a high degree of connectivity between thecommunities of scientific and technological researchers. Individu-als that both publish scientific articles and patent new inventionsbridge the academic and industrial worlds enabling access bytheir industry partners, to new scientific knowledge and methods.By connecting with authors-inventors, industrial researchers (i.e.inventors) can keep track of the scientific advances relevant to theiractivities. Thus, we would expect that author-inventors’ embodi-ment of stocks of valuable, tacit knowledge will make them moreattractive partners for other inventors. In social network analysisterms, we would expect that author-inventors will be more centraland more ‘in between’ than only-inventors. A similar mechanismmay be at work on the side of science. By co-inventing with indus-trial researchers, author-inventors may gain access to a larger poolof resources, both financial and material (i.e. costly equipment andinstrumentation), and ideas, which may positively affect their abil-ity to build larger teams of scientific researchers and attract otherscientists for collaboration. To test these hypotheses, we computedtwo measures of network centrality (for details, see Wassermanand Faust, 1994):
1. betweenness centrality: this is an index that is widely used toassess the extent to which a node occupies a central position inthe information flows within a network. Formally, the between-ness centrality of a node i is defined as the share of the shortestpaths connecting each pair of nodes j and k that pass through i:
CB(ni) =∑
j<k
gjk(ni)gjk
(2)
where gjk is the number of shortest paths linking nodes j and k,and gjk(ni) is the number of such paths between j and k that con-tain node i. Betweenness centrality measures how many timesa node lies “between” two others, such that it must be activatedto enable knowledge exchanges among them. It is a measure of‘gatekeeping’ as it captures the importance of a node to all othernodes, as a channel of information. As the value of betweennesscentrality depends on the number of nodes in each connectedcomponent, we standardised this index to values between 0 and100.16
2. closeness centrality: this is defined as the inverse of the averagedistance between a node and all other nodes reachable from it.Formally:
CC (ni) = (n − 1)∑nj=1d(ni, nj)
× 100 (3)
where d(ni,nj) is the geodesic distance (i.e. shortest path) linkingnodes i and j and (n − 1) is the number of vertices that are reachable
16 If sk indicates the number of nodes in component k, the maximum theoreticalvalue of betweenness centrality is given by (sk − 1)(sk − 2)/2, which arises when anactor falls on all geodesics linking all other actors in that component. Standardisedbetweenness is computed therefore by dividing the value of (2) by (sk − 1)(sk − 2)/2and multiplying it by 100. The range of the index is from 0 to 100. It is useful here torefer to the example reported in Fig. 1 which shows that the overall network, con-sidering both co-invention and co-authorship ties, contains one largest connectedcomponent. However, if we focus only on the co-invention network there are threedistinct components. The size of these components is s1 = 9, s2 = 4 and s3 = 3. Takingnode I9, we can see that its betweenness centrality is equal to 7, as it lies on all theshortest paths connecting node I8 to all other nodes. The standardised betweennesscentrality of node I9 is therefore equal to (7/28)·100 = 25.
22 S. Breschi, C. Catalini / Research Policy 39 (2010) 14–26
Table 4Betweenness and closeness centrality in co-invention and co-authorship networks.
Authors-inventors Only inventors Only authors Wilcoxon–Mann–Whitney z-score
LasersCo-invention Betweenness 7.95 (0.00) 2.53 (0.00) – 10.387
Closeness 45.31 (39.61) 38.48 (36.44) – 4.592
Co-authorship Betweenness 1.02 (0.002) – 0.33 (0.00) 15.669Closeness 20.58 (13.88) – 17.22 (13.18) 6.334
SemiconductorsCo-invention Betweenness 4.10 (0.006) 0.58 (0.00) – 17.627
Closeness 27.86 (9.18) 12.55 (7.91) – 13.044
Co-authorship Betweenness 1.84 (0.00) – 0.47 (0.00) 9.432Closeness 31.12 (12.94) – 18.75 (12.20) 7.826
BiotechnologyCo-invention Betweenness 7.54 (0.00) 1.94 (0.00) – 18.892
Closeness 58.18 (57.14) 42.48 (36.79) – 21.405Co-authorship Betweenness 1.15 (0.00) – 0.16 (0.00) 33.005
–
T of thea
ii(hd
aitacwnno
nocrwtlvatc
itiicdciaact
n
most central nodes in each network, the author-inventors occupy-ing these positions in the two networks are different. To test thisidea, we computed a simple rank correlation coefficient of authors-inventors according to the value of betweenness and closeness
Table 5Authors-inventors in the top percentiles of the centrality distribution.
p75 p90 p95
LasersCo-invention Betweenness 1.47 1.70 1.94
Closeness 1.41 1.44 1.42Co-authorship Betweenness 1.00 1.92 2.03
Closeness 1.31 1.48 1.49
SemiconductorsCo-invention Betweenness 1.82 2.58 3.43
Closeness 1.86 2.96 3.96Co-authorship Betweenness 1.00 1.54 1.95
Closeness 1.49 2.22 2.36
Closeness 23.53 (14.47)
he table reports average values for betweenness and closeness centrality for eachre reported in parentheses.
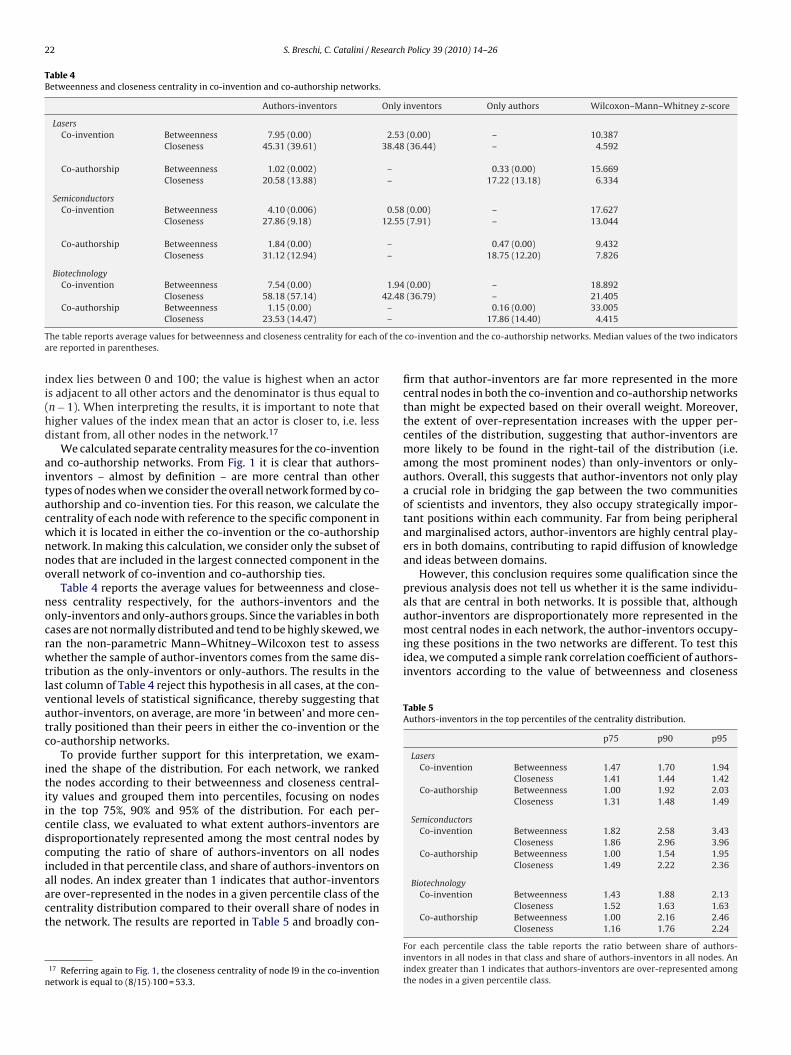
ndex lies between 0 and 100; the value is highest when an actors adjacent to all other actors and the denominator is thus equal ton − 1). When interpreting the results, it is important to note thatigher values of the index mean that an actor is closer to, i.e. lessistant from, all other nodes in the network.17
We calculated separate centrality measures for the co-inventionnd co-authorship networks. From Fig. 1 it is clear that authors-nventors – almost by definition – are more central than otherypes of nodes when we consider the overall network formed by co-uthorship and co-invention ties. For this reason, we calculate theentrality of each node with reference to the specific component inhich it is located in either the co-invention or the co-authorshipetwork. In making this calculation, we consider only the subset ofodes that are included in the largest connected component in theverall network of co-invention and co-authorship ties.
Table 4 reports the average values for betweenness and close-ess centrality respectively, for the authors-inventors and thenly-inventors and only-authors groups. Since the variables in bothases are not normally distributed and tend to be highly skewed, wean the non-parametric Mann–Whitney–Wilcoxon test to assesshether the sample of author-inventors comes from the same dis-
ribution as the only-inventors or only-authors. The results in theast column of Table 4 reject this hypothesis in all cases, at the con-entional levels of statistical significance, thereby suggesting thatuthor-inventors, on average, are more ‘in between’ and more cen-rally positioned than their peers in either the co-invention or theo-authorship networks.
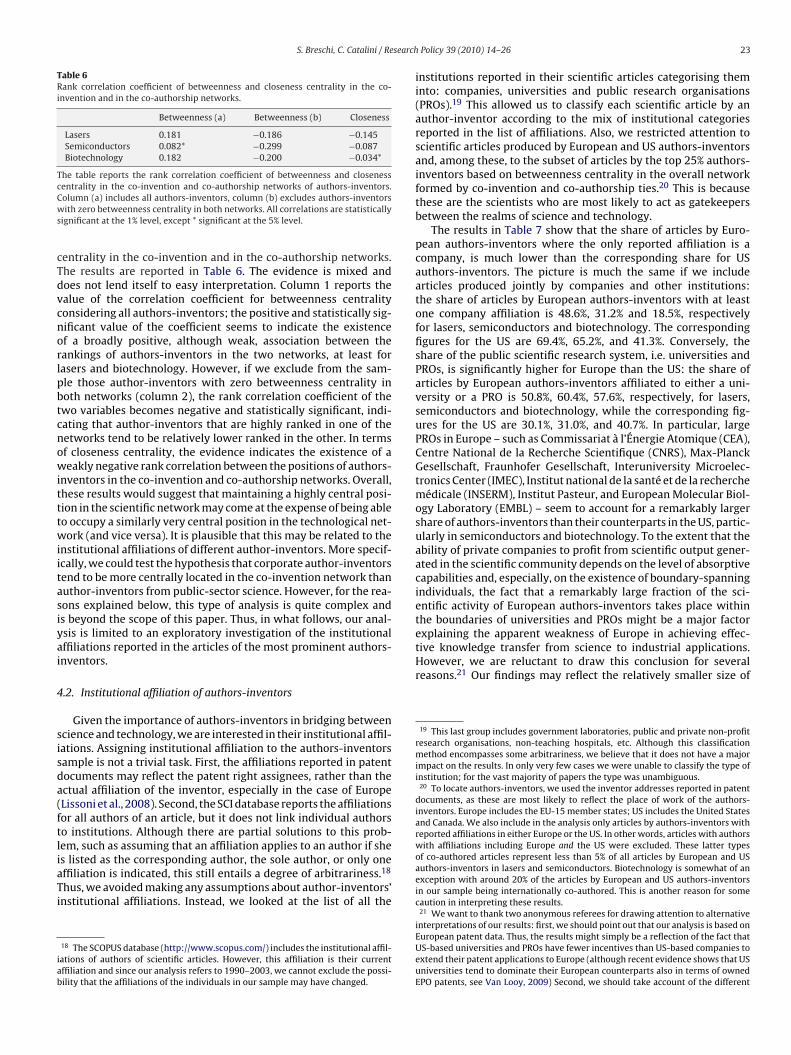
To provide further support for this interpretation, we exam-ned the shape of the distribution. For each network, we rankedhe nodes according to their betweenness and closeness central-ty values and grouped them into percentiles, focusing on nodesn the top 75%, 90% and 95% of the distribution. For each per-entile class, we evaluated to what extent authors-inventors areisproportionately represented among the most central nodes byomputing the ratio of share of authors-inventors on all nodesncluded in that percentile class, and share of authors-inventors on
ll nodes. An index greater than 1 indicates that author-inventorsre over-represented in the nodes in a given percentile class of theentrality distribution compared to their overall share of nodes inhe network. The results are reported in Table 5 and broadly con-17 Referring again to Fig. 1, the closeness centrality of node I9 in the co-inventionetwork is equal to (8/15)·100 = 53.3.
17.86 (14.40) 4.415
co-invention and the co-authorship networks. Median values of the two indicators
firm that author-inventors are far more represented in the morecentral nodes in both the co-invention and co-authorship networksthan might be expected based on their overall weight. Moreover,the extent of over-representation increases with the upper per-centiles of the distribution, suggesting that author-inventors aremore likely to be found in the right-tail of the distribution (i.e.among the most prominent nodes) than only-inventors or only-authors. Overall, this suggests that author-inventors not only playa crucial role in bridging the gap between the two communitiesof scientists and inventors, they also occupy strategically impor-tant positions within each community. Far from being peripheraland marginalised actors, author-inventors are highly central play-ers in both domains, contributing to rapid diffusion of knowledgeand ideas between domains.
However, this conclusion requires some qualification since theprevious analysis does not tell us whether it is the same individu-als that are central in both networks. It is possible that, althoughauthor-inventors are disproportionately more represented in the
BiotechnologyCo-invention Betweenness 1.43 1.88 2.13
Closeness 1.52 1.63 1.63Co-authorship Betweenness 1.00 2.16 2.46
Closeness 1.16 1.76 2.24
For each percentile class the table reports the ratio between share of authors-inventors in all nodes in that class and share of authors-inventors in all nodes. Anindex greater than 1 indicates that authors-inventors are over-represented amongthe nodes in a given percentile class.
S. Breschi, C. Catalini / Research
Table 6Rank correlation coefficient of betweenness and closeness centrality in the co-invention and in the co-authorship networks.
Betweenness (a) Betweenness (b) Closeness
Lasers 0.181 −0.186 −0.145Semiconductors 0.082* −0.299 −0.087Biotechnology 0.182 −0.200 −0.034*
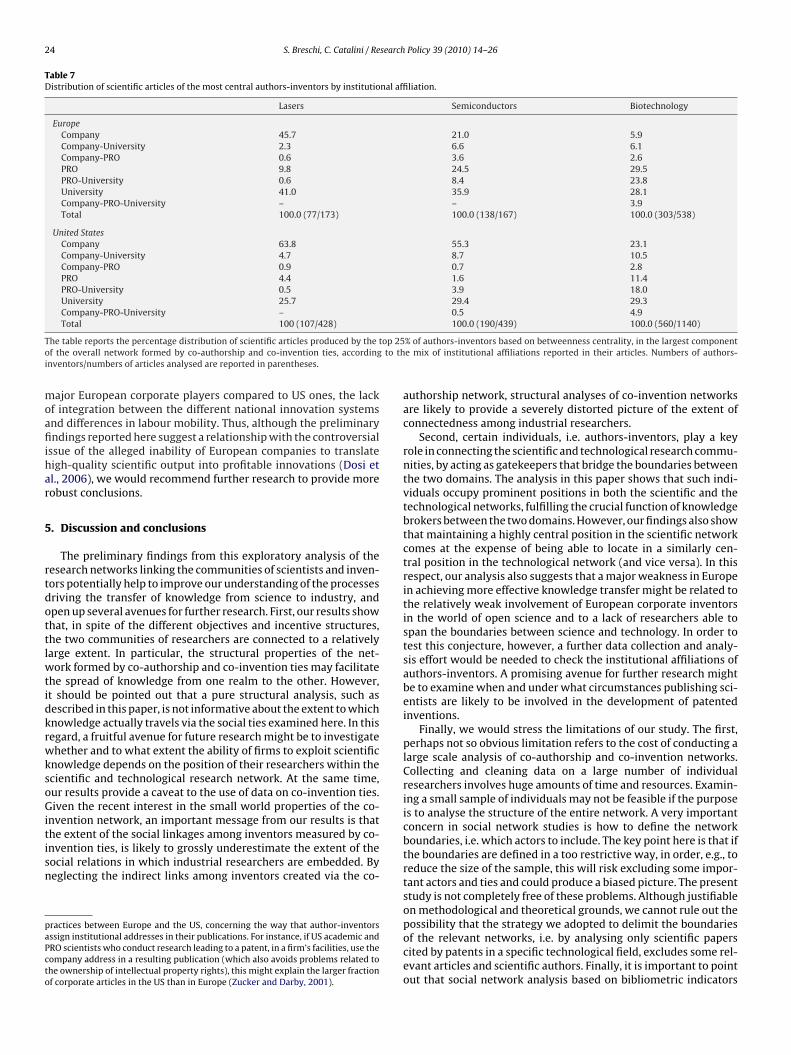
The table reports the rank correlation coefficient of betweenness and closenesscentrality in the co-invention and co-authorship networks of authors-inventors.Cws
cTdvcnorlpbtcnowitttwiitasiyai
4
sisda(ftliaTi
iab
explaining the apparent weakness of Europe in achieving effec-tive knowledge transfer from science to industrial applications.However, we are reluctant to draw this conclusion for severalreasons.21 Our findings may reflect the relatively smaller size of
19 This last group includes government laboratories, public and private non-profitresearch organisations, non-teaching hospitals, etc. Although this classificationmethod encompasses some arbitrariness, we believe that it does not have a majorimpact on the results. In only very few cases we were unable to classify the type ofinstitution; for the vast majority of papers the type was unambiguous.
20 To locate authors-inventors, we used the inventor addresses reported in patentdocuments, as these are most likely to reflect the place of work of the authors-inventors. Europe includes the EU-15 member states; US includes the United Statesand Canada. We also include in the analysis only articles by authors-inventors withreported affiliations in either Europe or the US. In other words, articles with authorswith affiliations including Europe and the US were excluded. These latter types
olumn (a) includes all authors-inventors, column (b) excludes authors-inventorsith zero betweenness centrality in both networks. All correlations are statistically
ignificant at the 1% level, except * significant at the 5% level.
entrality in the co-invention and in the co-authorship networks.he results are reported in Table 6. The evidence is mixed andoes not lend itself to easy interpretation. Column 1 reports thealue of the correlation coefficient for betweenness centralityonsidering all authors-inventors; the positive and statistically sig-ificant value of the coefficient seems to indicate the existencef a broadly positive, although weak, association between theankings of authors-inventors in the two networks, at least forasers and biotechnology. However, if we exclude from the sam-le those author-inventors with zero betweenness centrality inoth networks (column 2), the rank correlation coefficient of thewo variables becomes negative and statistically significant, indi-ating that author-inventors that are highly ranked in one of theetworks tend to be relatively lower ranked in the other. In termsf closeness centrality, the evidence indicates the existence of aeakly negative rank correlation between the positions of authors-
nventors in the co-invention and co-authorship networks. Overall,hese results would suggest that maintaining a highly central posi-ion in the scientific network may come at the expense of being ableo occupy a similarly very central position in the technological net-ork (and vice versa). It is plausible that this may be related to the
nstitutional affiliations of different author-inventors. More specif-cally, we could test the hypothesis that corporate author-inventorsend to be more centrally located in the co-invention network thanuthor-inventors from public-sector science. However, for the rea-ons explained below, this type of analysis is quite complex ands beyond the scope of this paper. Thus, in what follows, our anal-sis is limited to an exploratory investigation of the institutionalffiliations reported in the articles of the most prominent authors-nventors.
.2. Institutional affiliation of authors-inventors
Given the importance of authors-inventors in bridging betweencience and technology, we are interested in their institutional affil-ations. Assigning institutional affiliation to the authors-inventorsample is not a trivial task. First, the affiliations reported in patentocuments may reflect the patent right assignees, rather than thectual affiliation of the inventor, especially in the case of EuropeLissoni et al., 2008). Second, the SCI database reports the affiliationsor all authors of an article, but it does not link individual authorso institutions. Although there are partial solutions to this prob-em, such as assuming that an affiliation applies to an author if she
s listed as the corresponding author, the sole author, or only oneffiliation is indicated, this still entails a degree of arbitrariness.18hus, we avoided making any assumptions about author-inventors’nstitutional affiliations. Instead, we looked at the list of all the
18 The SCOPUS database (http://www.scopus.com/) includes the institutional affil-ations of authors of scientific articles. However, this affiliation is their currentffiliation and since our analysis refers to 1990–2003, we cannot exclude the possi-ility that the affiliations of the individuals in our sample may have changed.
Policy 39 (2010) 14–26 23
institutions reported in their scientific articles categorising theminto: companies, universities and public research organisations(PROs).19 This allowed us to classify each scientific article by anauthor-inventor according to the mix of institutional categoriesreported in the list of affiliations. Also, we restricted attention toscientific articles produced by European and US authors-inventorsand, among these, to the subset of articles by the top 25% authors-inventors based on betweenness centrality in the overall networkformed by co-invention and co-authorship ties.20 This is becausethese are the scientists who are most likely to act as gatekeepersbetween the realms of science and technology.
The results in Table 7 show that the share of articles by Euro-pean authors-inventors where the only reported affiliation is acompany, is much lower than the corresponding share for USauthors-inventors. The picture is much the same if we includearticles produced jointly by companies and other institutions:the share of articles by European authors-inventors with at leastone company affiliation is 48.6%, 31.2% and 18.5%, respectivelyfor lasers, semiconductors and biotechnology. The correspondingfigures for the US are 69.4%, 65.2%, and 41.3%. Conversely, theshare of the public scientific research system, i.e. universities andPROs, is significantly higher for Europe than the US: the share ofarticles by European authors-inventors affiliated to either a uni-versity or a PRO is 50.8%, 60.4%, 57.6%, respectively, for lasers,semiconductors and biotechnology, while the corresponding fig-ures for the US are 30.1%, 31.0%, and 40.7%. In particular, largePROs in Europe – such as Commissariat à l’Énergie Atomique (CEA),Centre National de la Recherche Scientifique (CNRS), Max-PlanckGesellschaft, Fraunhofer Gesellschaft, Interuniversity Microelec-tronics Center (IMEC), Institut national de la santé et de la recherchemédicale (INSERM), Institut Pasteur, and European Molecular Biol-ogy Laboratory (EMBL) – seem to account for a remarkably largershare of authors-inventors than their counterparts in the US, partic-ularly in semiconductors and biotechnology. To the extent that theability of private companies to profit from scientific output gener-ated in the scientific community depends on the level of absorptivecapabilities and, especially, on the existence of boundary-spanningindividuals, the fact that a remarkably large fraction of the sci-entific activity of European authors-inventors takes place withinthe boundaries of universities and PROs might be a major factor
of co-authored articles represent less than 5% of all articles by European and USauthors-inventors in lasers and semiconductors. Biotechnology is somewhat of anexception with around 20% of the articles by European and US authors-inventorsin our sample being internationally co-authored. This is another reason for somecaution in interpreting these results.
21 We want to thank two anonymous referees for drawing attention to alternativeinterpretations of our results: first, we should point out that our analysis is based onEuropean patent data. Thus, the results might simply be a reflection of the fact thatUS-based universities and PROs have fewer incentives than US-based companies toextend their patent applications to Europe (although recent evidence shows that USuniversities tend to dominate their European counterparts also in terms of ownedEPO patents, see Van Looy, 2009) Second, we should take account of the different
24 S. Breschi, C. Catalini / Research Policy 39 (2010) 14–26
Table 7Distribution of scientific articles of the most central authors-inventors by institutional affiliation.
Lasers Semiconductors Biotechnology
EuropeCompany 45.7 21.0 5.9Company-University 2.3 6.6 6.1Company-PRO 0.6 3.6 2.6PRO 9.8 24.5 29.5PRO-University 0.6 8.4 23.8University 41.0 35.9 28.1Company-PRO-University – – 3.9Total 100.0 (77/173) 100.0 (138/167) 100.0 (303/538)
United StatesCompany 63.8 55.3 23.1Company-University 4.7 8.7 10.5Company-PRO 0.9 0.7 2.8PRO 4.4 1.6 11.4PRO-University 0.5 3.9 18.0University 25.7 29.4 29.3Company-PRO-University – 0.5 4.9Total 100 (107/428) 100.0 (190/439) 100.0 (560/1140)
T op 25o to thi
moafiihar
5
rtdottlwtidkrwksoGitisn
paPcto
he table reports the percentage distribution of scientific articles produced by the tf the overall network formed by co-authorship and co-invention ties, accordingnventors/numbers of articles analysed are reported in parentheses.
ajor European corporate players compared to US ones, the lackf integration between the different national innovation systemsnd differences in labour mobility. Thus, although the preliminaryndings reported here suggest a relationship with the controversial
ssue of the alleged inability of European companies to translateigh-quality scientific output into profitable innovations (Dosi etl., 2006), we would recommend further research to provide moreobust conclusions.
. Discussion and conclusions
The preliminary findings from this exploratory analysis of theesearch networks linking the communities of scientists and inven-ors potentially help to improve our understanding of the processesriving the transfer of knowledge from science to industry, andpen up several avenues for further research. First, our results showhat, in spite of the different objectives and incentive structures,he two communities of researchers are connected to a relativelyarge extent. In particular, the structural properties of the net-
ork formed by co-authorship and co-invention ties may facilitatehe spread of knowledge from one realm to the other. However,t should be pointed out that a pure structural analysis, such asescribed in this paper, is not informative about the extent to whichnowledge actually travels via the social ties examined here. In thisegard, a fruitful avenue for future research might be to investigatehether and to what extent the ability of firms to exploit scientific
nowledge depends on the position of their researchers within thecientific and technological research network. At the same time,ur results provide a caveat to the use of data on co-invention ties.iven the recent interest in the small world properties of the co-
nvention network, an important message from our results is that
he extent of the social linkages among inventors measured by co-nvention ties, is likely to grossly underestimate the extent of theocial relations in which industrial researchers are embedded. Byeglecting the indirect links among inventors created via the co-ractices between Europe and the US, concerning the way that author-inventorsssign institutional addresses in their publications. For instance, if US academic andRO scientists who conduct research leading to a patent, in a firm’s facilities, use theompany address in a resulting publication (which also avoids problems related tohe ownership of intellectual property rights), this might explain the larger fractionf corporate articles in the US than in Europe (Zucker and Darby, 2001).
% of authors-inventors based on betweenness centrality, in the largest componente mix of institutional affiliations reported in their articles. Numbers of authors-
authorship network, structural analyses of co-invention networksare likely to provide a severely distorted picture of the extent ofconnectedness among industrial researchers.
Second, certain individuals, i.e. authors-inventors, play a keyrole in connecting the scientific and technological research commu-nities, by acting as gatekeepers that bridge the boundaries betweenthe two domains. The analysis in this paper shows that such indi-viduals occupy prominent positions in both the scientific and thetechnological networks, fulfilling the crucial function of knowledgebrokers between the two domains. However, our findings also showthat maintaining a highly central position in the scientific networkcomes at the expense of being able to locate in a similarly cen-tral position in the technological network (and vice versa). In thisrespect, our analysis also suggests that a major weakness in Europein achieving more effective knowledge transfer might be related tothe relatively weak involvement of European corporate inventorsin the world of open science and to a lack of researchers able tospan the boundaries between science and technology. In order totest this conjecture, however, a further data collection and analy-sis effort would be needed to check the institutional affiliations ofauthors-inventors. A promising avenue for further research mightbe to examine when and under what circumstances publishing sci-entists are likely to be involved in the development of patentedinventions.
Finally, we would stress the limitations of our study. The first,perhaps not so obvious limitation refers to the cost of conducting alarge scale analysis of co-authorship and co-invention networks.Collecting and cleaning data on a large number of individualresearchers involves huge amounts of time and resources. Examin-ing a small sample of individuals may not be feasible if the purposeis to analyse the structure of the entire network. A very importantconcern in social network studies is how to define the networkboundaries, i.e. which actors to include. The key point here is that ifthe boundaries are defined in a too restrictive way, in order, e.g., toreduce the size of the sample, this will risk excluding some impor-tant actors and ties and could produce a biased picture. The presentstudy is not completely free of these problems. Although justifiableon methodological and theoretical grounds, we cannot rule out the
possibility that the strategy we adopted to delimit the boundariesof the relevant networks, i.e. by analysing only scientific paperscited by patents in a specific technological field, excludes some rel-evant articles and scientific authors. Finally, it is important to pointout that social network analysis based on bibliometric indicators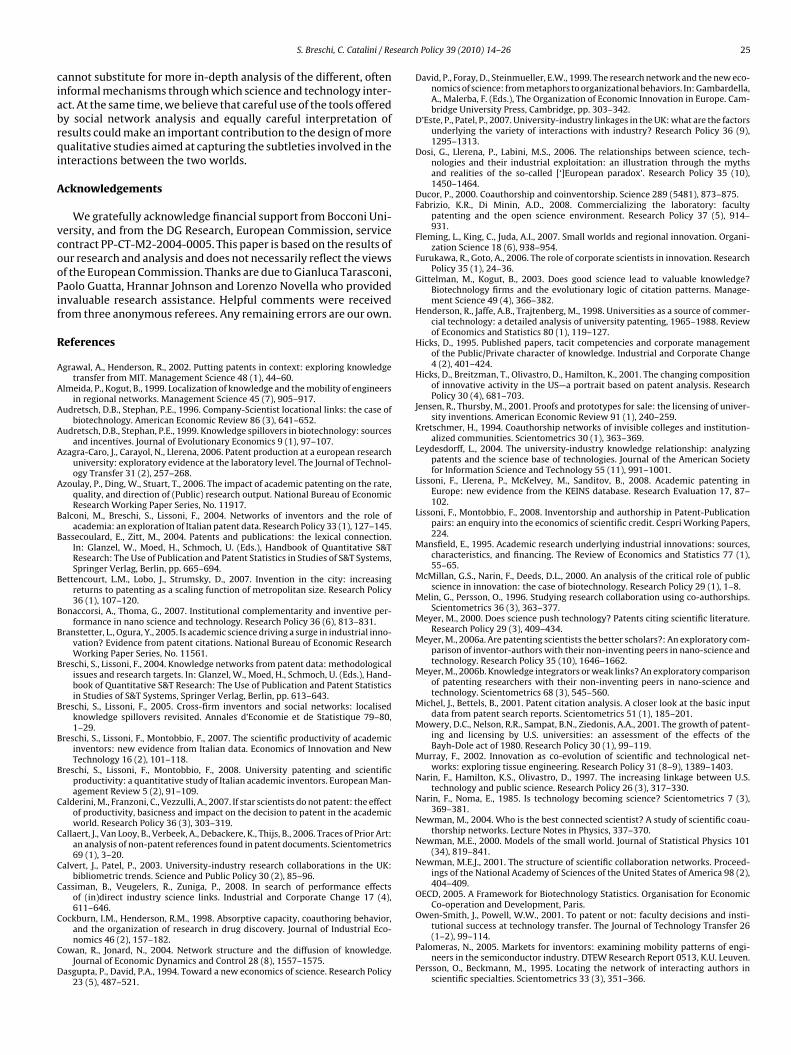
search
ciabrqi
A
vcooPif
R
A
A
A
A
A
A
B
B
B
B
B
B
B
B
B
C
C
C
C
C
C
D
S. Breschi, C. Catalini / Re
annot substitute for more in-depth analysis of the different, oftennformal mechanisms through which science and technology inter-ct. At the same time, we believe that careful use of the tools offeredy social network analysis and equally careful interpretation ofesults could make an important contribution to the design of moreualitative studies aimed at capturing the subtleties involved in the
nteractions between the two worlds.
cknowledgements
We gratefully acknowledge financial support from Bocconi Uni-ersity, and from the DG Research, European Commission, serviceontract PP-CT-M2-2004-0005. This paper is based on the results ofur research and analysis and does not necessarily reflect the viewsf the European Commission. Thanks are due to Gianluca Tarasconi,aolo Guatta, Hrannar Johnson and Lorenzo Novella who providednvaluable research assistance. Helpful comments were receivedrom three anonymous referees. Any remaining errors are our own.
eferences
grawal, A., Henderson, R., 2002. Putting patents in context: exploring knowledgetransfer from MIT. Management Science 48 (1), 44–60.
lmeida, P., Kogut, B., 1999. Localization of knowledge and the mobility of engineersin regional networks. Management Science 45 (7), 905–917.
udretsch, D.B., Stephan, P.E., 1996. Company-Scientist locational links: the case ofbiotechnology. American Economic Review 86 (3), 641–652.
udretsch, D.B., Stephan, P.E., 1999. Knowledge spillovers in biotechnology: sourcesand incentives. Journal of Evolutionary Economics 9 (1), 97–107.
zagra-Caro, J., Carayol, N., Llerena, 2006. Patent production at a european researchuniversity: exploratory evidence at the laboratory level. The Journal of Technol-ogy Transfer 31 (2), 257–268.
zoulay, P., Ding, W., Stuart, T., 2006. The impact of academic patenting on the rate,quality, and direction of (Public) research output. National Bureau of EconomicResearch Working Paper Series, No. 11917.
alconi, M., Breschi, S., Lissoni, F., 2004. Networks of inventors and the role ofacademia: an exploration of Italian patent data. Research Policy 33 (1), 127–145.
assecoulard, E., Zitt, M., 2004. Patents and publications: the lexical connection.In: Glanzel, W., Moed, H., Schmoch, U. (Eds.), Handbook of Quantitative S&TResearch: The Use of Publication and Patent Statistics in Studies of S&T Systems,Springer Verlag, Berlin, pp. 665–694.
ettencourt, L.M., Lobo, J., Strumsky, D., 2007. Invention in the city: increasingreturns to patenting as a scaling function of metropolitan size. Research Policy36 (1), 107–120.
onaccorsi, A., Thoma, G., 2007. Institutional complementarity and inventive per-formance in nano science and technology. Research Policy 36 (6), 813–831.
ranstetter, L., Ogura, Y., 2005. Is academic science driving a surge in industrial inno-vation? Evidence from patent citations. National Bureau of Economic ResearchWorking Paper Series, No. 11561.
reschi, S., Lissoni, F., 2004. Knowledge networks from patent data: methodologicalissues and research targets. In: Glanzel, W., Moed, H., Schmoch, U. (Eds.), Hand-book of Quantitative S&T Research: The Use of Publication and Patent Statisticsin Studies of S&T Systems, Springer Verlag, Berlin, pp. 613–643.
reschi, S., Lissoni, F., 2005. Cross-firm inventors and social networks: localisedknowledge spillovers revisited. Annales d’Economie et de Statistique 79–80,1–29.
reschi, S., Lissoni, F., Montobbio, F., 2007. The scientific productivity of academicinventors: new evidence from Italian data. Economics of Innovation and NewTechnology 16 (2), 101–118.
reschi, S., Lissoni, F., Montobbio, F., 2008. University patenting and scientificproductivity: a quantitative study of Italian academic inventors. European Man-agement Review 5 (2), 91–109.
alderini, M., Franzoni, C., Vezzulli, A., 2007. If star scientists do not patent: the effectof productivity, basicness and impact on the decision to patent in the academicworld. Research Policy 36 (3), 303–319.
allaert, J., Van Looy, B., Verbeek, A., Debackere, K., Thijs, B., 2006. Traces of Prior Art:an analysis of non-patent references found in patent documents. Scientometrics69 (1), 3–20.
alvert, J., Patel, P., 2003. University-industry research collaborations in the UK:bibliometric trends. Science and Public Policy 30 (2), 85–96.
assiman, B., Veugelers, R., Zuniga, P., 2008. In search of performance effectsof (in)direct industry science links. Industrial and Corporate Change 17 (4),611–646.
ockburn, I.M., Henderson, R.M., 1998. Absorptive capacity, coauthoring behavior,
and the organization of research in drug discovery. Journal of Industrial Eco-nomics 46 (2), 157–182.owan, R., Jonard, N., 2004. Network structure and the diffusion of knowledge.Journal of Economic Dynamics and Control 28 (8), 1557–1575.
asgupta, P., David, P.A., 1994. Toward a new economics of science. Research Policy23 (5), 487–521.
Policy 39 (2010) 14–26 25
David, P., Foray, D., Steinmueller, E.W., 1999. The research network and the new eco-nomics of science: from metaphors to organizational behaviors. In: Gambardella,A., Malerba, F. (Eds.), The Organization of Economic Innovation in Europe. Cam-bridge University Press, Cambridge, pp. 303–342.
D’Este, P., Patel, P., 2007. University-industry linkages in the UK: what are the factorsunderlying the variety of interactions with industry? Research Policy 36 (9),1295–1313.
Dosi, G., Llerena, P., Labini, M.S., 2006. The relationships between science, tech-nologies and their industrial exploitation: an illustration through the mythsand realities of the so-called [‘]European paradox’. Research Policy 35 (10),1450–1464.
Ducor, P., 2000. Coauthorship and coinventorship. Science 289 (5481), 873–875.Fabrizio, K.R., Di Minin, A.D., 2008. Commercializing the laboratory: faculty
patenting and the open science environment. Research Policy 37 (5), 914–931.
Fleming, L., King, C., Juda, A.I., 2007. Small worlds and regional innovation. Organi-zation Science 18 (6), 938–954.
Furukawa, R., Goto, A., 2006. The role of corporate scientists in innovation. ResearchPolicy 35 (1), 24–36.
Gittelman, M., Kogut, B., 2003. Does good science lead to valuable knowledge?Biotechnology firms and the evolutionary logic of citation patterns. Manage-ment Science 49 (4), 366–382.
Henderson, R., Jaffe, A.B., Trajtenberg, M., 1998. Universities as a source of commer-cial technology: a detailed analysis of university patenting, 1965–1988. Reviewof Economics and Statistics 80 (1), 119–127.
Hicks, D., 1995. Published papers, tacit competencies and corporate managementof the Public/Private character of knowledge. Industrial and Corporate Change4 (2), 401–424.
Hicks, D., Breitzman, T., Olivastro, D., Hamilton, K., 2001. The changing compositionof innovative activity in the US—a portrait based on patent analysis. ResearchPolicy 30 (4), 681–703.
Jensen, R., Thursby, M., 2001. Proofs and prototypes for sale: the licensing of univer-sity inventions. American Economic Review 91 (1), 240–259.
Kretschmer, H., 1994. Coauthorship networks of invisible colleges and institution-alized communities. Scientometrics 30 (1), 363–369.
Leydesdorff, L., 2004. The university-industry knowledge relationship: analyzingpatents and the science base of technologies. Journal of the American Societyfor Information Science and Technology 55 (11), 991–1001.
Lissoni, F., Llerena, P., McKelvey, M., Sanditov, B., 2008. Academic patenting inEurope: new evidence from the KEINS database. Research Evaluation 17, 87–102.
Lissoni, F., Montobbio, F., 2008. Inventorship and authorship in Patent-Publicationpairs: an enquiry into the economics of scientific credit. Cespri Working Papers,224.
Mansfield, E., 1995. Academic research underlying industrial innovations: sources,characteristics, and financing. The Review of Economics and Statistics 77 (1),55–65.
McMillan, G.S., Narin, F., Deeds, D.L., 2000. An analysis of the critical role of publicscience in innovation: the case of biotechnology. Research Policy 29 (1), 1–8.
Melin, G., Persson, O., 1996. Studying research collaboration using co-authorships.Scientometrics 36 (3), 363–377.
Meyer, M., 2000. Does science push technology? Patents citing scientific literature.Research Policy 29 (3), 409–434.
Meyer, M., 2006a. Are patenting scientists the better scholars?: An exploratory com-parison of inventor-authors with their non-inventing peers in nano-science andtechnology. Research Policy 35 (10), 1646–1662.
Meyer, M., 2006b. Knowledge integrators or weak links? An exploratory comparisonof patenting researchers with their non-inventing peers in nano-science andtechnology. Scientometrics 68 (3), 545–560.
Michel, J., Bettels, B., 2001. Patent citation analysis. A closer look at the basic inputdata from patent search reports. Scientometrics 51 (1), 185–201.
Mowery, D.C., Nelson, R.R., Sampat, B.N., Ziedonis, A.A., 2001. The growth of patent-ing and licensing by U.S. universities: an assessment of the effects of theBayh-Dole act of 1980. Research Policy 30 (1), 99–119.
Murray, F., 2002. Innovation as co-evolution of scientific and technological net-works: exploring tissue engineering. Research Policy 31 (8–9), 1389–1403.
Narin, F., Hamilton, K.S., Olivastro, D., 1997. The increasing linkage between U.S.technology and public science. Research Policy 26 (3), 317–330.
Narin, F., Noma, E., 1985. Is technology becoming science? Scientometrics 7 (3),369–381.
Newman, M., 2004. Who is the best connected scientist? A study of scientific coau-thorship networks. Lecture Notes in Physics, 337–370.
Newman, M.E., 2000. Models of the small world. Journal of Statistical Physics 101(34), 819–841.
Newman, M.E.J., 2001. The structure of scientific collaboration networks. Proceed-ings of the National Academy of Sciences of the United States of America 98 (2),404–409.
OECD, 2005. A Framework for Biotechnology Statistics. Organisation for EconomicCo-operation and Development, Paris.
Owen-Smith, J., Powell, W.W., 2001. To patent or not: faculty decisions and insti-
tutional success at technology transfer. The Journal of Technology Transfer 26(1–2), 99–114.Palomeras, N., 2005. Markets for inventors: examining mobility patterns of engi-neers in the semiconductor industry. DTEW Research Report 0513, K.U. Leuven.
Persson, O., Beckmann, M., 1995. Locating the network of interacting authors inscientific specialties. Scientometrics 33 (3), 351–366.

2 search
S
S
S
S
T
T
V
Journal of Technology Transfer 26 (1–2), 37–58.Zucker, L.G., Darby, M.R., Armstrong, J., 1998. Geographically localized knowledge:
6 S. Breschi, C. Catalini / Re
ampat, B.N., Mowery, D.C., Ziedonis, A.A., 2003. Changes in university patent qualityafter the Bayh-Dole act: a re-examination. International Journal of IndustrialOrganization 21 (9), 1371–1390.
chmoch, U., 1993. Tracing the knowledge transfer from science to technology asreflected in patent indicators. Scientometrics 26 (1), 193–211.
ingh, J., 2005. Collaborative networks as determinants of knowledge diffusion pat-terns. Management Science 51 (5), 756–770.
tern, S., 2004. Do scientists pay to be scientists? Management Science 50 (6),835–853.
ijssen, R.J.W., 2001. Global and domestic utilization of industrial relevant sci-ence: patent citation analysis of science-technology interactions and knowledgeflows. Research Policy 30 (1), 35–54.
ijssen, R.J.W., 2004. Is the commercialisation of scientific research affecting the pro-duction of public knowledge? Global trends in the output of corporate researcharticles. Research Policy 33 (5), 709–733.
an Looy, B., Callaert, J., Debackere, K., 2006. Publication and patent behavior ofacademic researchers: conflicting, reinforcing or merely co-existing? ResearchPolicy 35 (4), 596–608.
Policy 39 (2010) 14–26
Van Looy, B., 2009. The role of entrepreneurial universities within innovation sys-tems: an overwiev and assessment. Review of Business and Economics 54 (1),62–81.
Wagner, C.S., Leydesdorff, L., 2005. Network structure, self-organization, and thegrowth of international collaboration in science. Research Policy 34 (10),1608–1618.
Wasserman, S., Faust, K., 1994. Social Network Analysis: Methods and Applications.Cambridge University Press, Cambridge.
Zucker, L.G., Darby, M.R., 2001. Capturing technological opportunity via Japan’s starscientists: evidence from Japanese firms’ biotech patents and products. The
spillovers or markets? Economic Inquiry 36 (1), 65–86.Zucker, L.G., Darby, M.R., Armstrong, J.S., Armstrong, J.S., 2002. Commercializing
knowledge: university science, knowledge capture, and firm performance inbiotechnology. Management Science 48 (1), 138–153.