
Topographic independent component analysis based on fractal theory and morphology applied to texture...
12
Signal Processing 87 (2007) 1966–1977 Topographic independent component analysis based on fractal theory and morphology applied to texture segmentation Klaus F. Coˆco, Evandro O.T. Salles, Mario Sarcinelli-Filho Department of Electrical Engineering, Federal University of Espirito Santo, Av. Fernando Ferrari, 514 29075 910 Vito´ria, ES Brazil Received 31 July 2006; received in revised form 4 December 2006; accepted 26 January 2007 Available online 11 February 2007 Abstract Texture analysis and segmentation is an important area in image processing. One can employ texture segmentation for quality control in processes related to skin-leather, textile or marble/granite industries, for example. In such a context, the topographic independent component analysis (TICA) is presented as a technique for texture segmentation in which the image base is obtained from the mixture matrix of the model by implementing a bank of statistical filters, which are capable to capture the inherent properties of each texture. Indeed, using the energy as topographic criterion, the TICA filter bank exhibits results that are similar to the independent component analysis (ICA) model, as it has been already shown in the literature. In this paper, we show that using energy and morphologic fractal texture descriptors as topographic criterion those results are improved, in the sense that the segmentation error and the amount of filters are reduced, for the same textures. r 2007 Elsevier B.V. All rights reserved. Keywords: TICA; Fractals; Texture segmentation; Morphology 1. Introduction Image-processing techniques have deserved spe- cial attention in the literature reporting scientific research. Texture segmentation, in particular, is an attractive problem in image-processing research, in spite of its inherent difficulties, and a meaningful effort has been dedicated to improve the results associated to the segmentation of natural and even artificial textures. About the 1960s, Julesz, according to a citation in [1], tried to determine the parameters of textures with perceptive importance for human beings. His research got the conclusion that the human vision system allows to distinguish textures possessing differences only in terms of first- and second-order statistics. Other studies, like the one published by Pratt and Faugeras [1], complemented such results showing that the human vision system is also sensitive to the correlation between pairs of textures, besides being sensitive to differences in the mean and in the variance. Moreover, recent results suggest that the human brain may be modeled by multi-channel frequency analysis and is invariant to image rotation [2]. This was verified by Daugman [3], who has shown that ARTICLE IN PRESS www.elsevier.com/locate/sigpro 0165-1684/$ - see front matter r 2007 Elsevier B.V. All rights reserved. doi:10.1016/j.sigpro.2007.01.027 Corresponding author. Tel.: +55 27 4009 2684. Fax:+55 27 4009 2737. E-mail address: [email protected] (M. Sarcinelli-Filho).
-
Upload
independent -
Category
Documents
-
view
4 -
download
0
Transcript of Topographic independent component analysis based on fractal theory and morphology applied to texture...
ARTICLE IN PRESS
0165-1684/$ - se
doi:10.1016/j.si
�CorrespondFax:+5527 400
E-mail addr
(M. Sarcinelli-F
Signal Processing 87 (2007) 1966–1977
www.elsevier.com/locate/sigpro
Topographic independent component analysis based on fractaltheory and morphology applied to texture segmentation
Klaus F. Coco, Evandro O.T. Salles, Mario Sarcinelli-Filho�
Department of Electrical Engineering, Federal University of Espirito Santo, Av. Fernando Ferrari, 514 29075 910 Vitoria, ES Brazil
Received 31 July 2006; received in revised form 4 December 2006; accepted 26 January 2007
Available online 11 February 2007
Abstract
Texture analysis and segmentation is an important area in image processing. One can employ texture segmentation for
quality control in processes related to skin-leather, textile or marble/granite industries, for example. In such a context, the
topographic independent component analysis (TICA) is presented as a technique for texture segmentation in which the
image base is obtained from the mixture matrix of the model by implementing a bank of statistical filters, which are
capable to capture the inherent properties of each texture. Indeed, using the energy as topographic criterion, the TICA
filter bank exhibits results that are similar to the independent component analysis (ICA) model, as it has been already
shown in the literature. In this paper, we show that using energy and morphologic fractal texture descriptors as
topographic criterion those results are improved, in the sense that the segmentation error and the amount of filters are
reduced, for the same textures.
r 2007 Elsevier B.V. All rights reserved.
Keywords: TICA; Fractals; Texture segmentation; Morphology
1. Introduction
Image-processing techniques have deserved spe-cial attention in the literature reporting scientificresearch. Texture segmentation, in particular, is anattractive problem in image-processing research, inspite of its inherent difficulties, and a meaningfuleffort has been dedicated to improve the resultsassociated to the segmentation of natural and evenartificial textures.
e front matter r 2007 Elsevier B.V. All rights reserved
gpro.2007.01.027
ing author. Tel.: +55 27 4009 2684.
9 2737.
ess: [email protected]
ilho).
About the 1960s, Julesz, according to a citation in[1], tried to determine the parameters of textureswith perceptive importance for human beings. Hisresearch got the conclusion that the human visionsystem allows to distinguish textures possessingdifferences only in terms of first- and second-orderstatistics. Other studies, like the one published byPratt and Faugeras [1], complemented such resultsshowing that the human vision system is alsosensitive to the correlation between pairs oftextures, besides being sensitive to differences inthe mean and in the variance.
Moreover, recent results suggest that the humanbrain may be modeled by multi-channel frequencyanalysis and is invariant to image rotation [2]. Thiswas verified by Daugman [3], who has shown that
.
ARTICLE IN PRESS
Nomenclature
IðxÞ imagefhiðxÞg filter coefficientsf ðxÞ characteristic vectorsi independent componentsSðf Þ power spectrum of the image contrastg spectral parameterX mixtureAM�P mixture matrixSP�M independent component matrix~x m-dimensional random variablef ð~xÞ space transformation~s transformed n-dimensional random vari-
ableW P�M pseudo-inverse of AM�P
qið�Þ pdf of independent sourcesqð~sÞ joint pdf of independent sourceswT
i a column of W P�M
hði; jÞ neighborhood functionG, j(.) monotonic nonlinear transformation
uk statistical high-order nonnegative inde-pendent components
� scale factorY � morphological structure elementf ði; jÞ gray level of a pixelb form factorm� local natural measureIðq; �Þ q-order measurement in scaleLq LMME windowLqði; jÞ LMME gridekðx; yÞ normalized nonlinear image (character-
istic image)Ik kth filtered imageW(a,b) Gaussian windowf0 estimated dominant spatial frequencys standard deviationOr characteristic image regionsRSSkr residual sum of squaresmkr mean value of the characteristic regionRSSkT sum of RSSkr
Fk F-test result
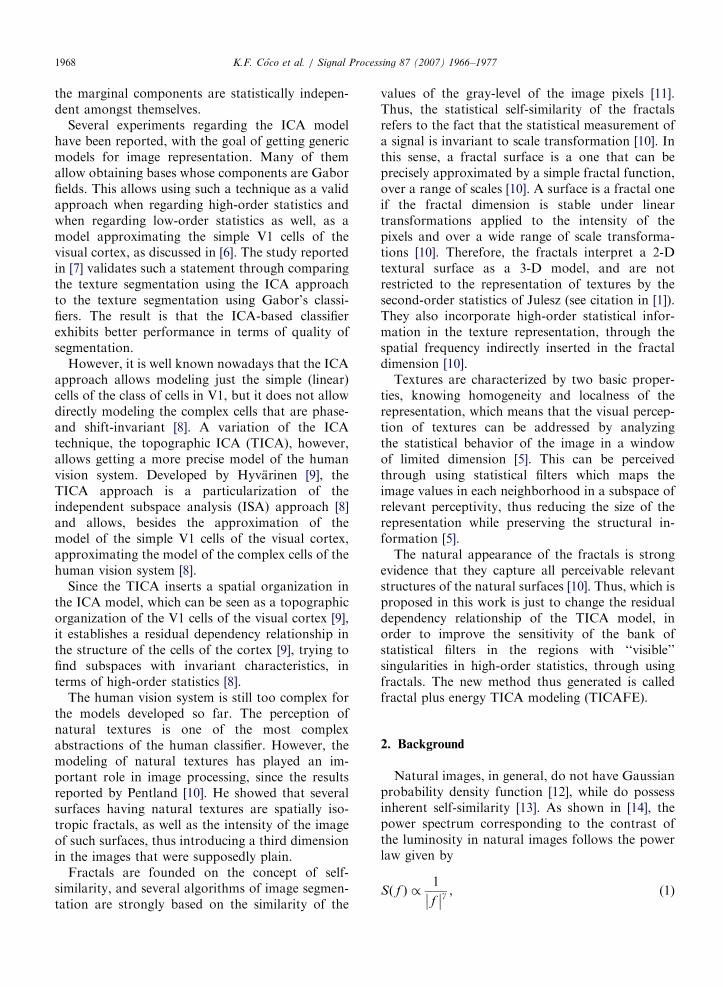
Fig. 1. ICA model for image representation. The image is
obtained by the sum of the products of the independent
components by the components of the base, obtained from the
mixture matrix.
K.F. Coco et al. / Signal Processing 87 (2007) 1966–1977 1967
the 2-D receptive fields measured for simple cells ofthe cortex of a cat, the V1 cells, can be approxi-mated by Gabor fields represented in multiplefrequencies with information of phase and localiza-tion. During a certain period, such results motivatedother researchers to model textures by using Gaborfunctions, which, in principle, would allow imple-menting classifiers covering the entire capability ofthe human perception by modeling our visionsystem. However, according to a citation by Pratt[1], Gagalowicz had already shown that themodel of the human vision system is not suitableto classify textures, since it does not allow distin-guishing textures that are different only in high-order statistics.
In such a context, several approaches haveadopted models regarding high-order statistics, likethe independent component analysis (ICA) and thefractal analysis. The ICA is a technique thatperforms blind source separation by using high-order statistics to obtain a linear system of statisti-cally independent components. On the other hand,fractals are characterized by fulfilling the property ofstatistical self-similarity, whenever the self-similarityfunction is defined over the statistic momentum ofthe image under analysis, or Euclidean self-similarity,whenever such a function is defined over the form ofthe visual objects in the image [4].
The ICA model is expressed as a balancedsummation of independent components associatedto an image, as illustrated in Fig. 1. There, eachimage cell represents a filter of the texture base, andthe independent components si, i ¼ 1,y, N, repre-sent the set of marginal pdf ’s. This way, for animage I(x) and a set {hi(x)} of N filters, the vectorf ðxÞ ¼ ½ f 1ðxÞ ¼ I � h1ðxÞ; . . . ; f N ðxÞ ¼ I � hN ðxÞ� isthe representation of the image characteristics in thepoint x [5]. An assumption is made, in this case: thetexture is fully represented by the joint pdf of thevector of characteristics f(x) (which, for beingstationary, is independent of x) [5].
The representation of texture by marginal statis-tics is a simple and attractive approximation inwhich a given set of marginal pdf ’s represents thejoint statistical description of a characteristic of thetexture [5]. Regarding the ICA case, the joint pdf isobtained as the product of the marginal pdf ’s, since
ARTICLE IN PRESSK.F. Coco et al. / Signal Processing 87 (2007) 1966–19771968
the marginal components are statistically indepen-dent amongst themselves.
Several experiments regarding the ICA modelhave been reported, with the goal of getting genericmodels for image representation. Many of themallow obtaining bases whose components are Gaborfields. This allows using such a technique as a validapproach when regarding high-order statistics andwhen regarding low-order statistics as well, as amodel approximating the simple V1 cells of thevisual cortex, as discussed in [6]. The study reportedin [7] validates such a statement through comparingthe texture segmentation using the ICA approachto the texture segmentation using Gabor’s classi-fiers. The result is that the ICA-based classifierexhibits better performance in terms of quality ofsegmentation.
However, it is well known nowadays that the ICAapproach allows modeling just the simple (linear)cells of the class of cells in V1, but it does not allowdirectly modeling the complex cells that are phase-and shift-invariant [8]. A variation of the ICAtechnique, the topographic ICA (TICA), however,allows getting a more precise model of the humanvision system. Developed by Hyvarinen [9], theTICA approach is a particularization of theindependent subspace analysis (ISA) approach [8]and allows, besides the approximation of themodel of the simple V1 cells of the visual cortex,approximating the model of the complex cells of thehuman vision system [8].
Since the TICA inserts a spatial organization inthe ICA model, which can be seen as a topographicorganization of the V1 cells of the visual cortex [9],it establishes a residual dependency relationship inthe structure of the cells of the cortex [9], trying tofind subspaces with invariant characteristics, interms of high-order statistics [8].
The human vision system is still too complex forthe models developed so far. The perception ofnatural textures is one of the most complexabstractions of the human classifier. However, themodeling of natural textures has played an im-portant role in image processing, since the resultsreported by Pentland [10]. He showed that severalsurfaces having natural textures are spatially iso-tropic fractals, as well as the intensity of the imageof such surfaces, thus introducing a third dimensionin the images that were supposedly plain.
Fractals are founded on the concept of self-similarity, and several algorithms of image segmen-tation are strongly based on the similarity of the
values of the gray-level of the image pixels [11].Thus, the statistical self-similarity of the fractalsrefers to the fact that the statistical measurement ofa signal is invariant to scale transformation [10]. Inthis sense, a fractal surface is a one that can beprecisely approximated by a simple fractal function,over a range of scales [10]. A surface is a fractal oneif the fractal dimension is stable under lineartransformations applied to the intensity of thepixels and over a wide range of scale transforma-tions [10]. Therefore, the fractals interpret a 2-Dtextural surface as a 3-D model, and are notrestricted to the representation of textures by thesecond-order statistics of Julesz (see citation in [1]).They also incorporate high-order statistical infor-mation in the texture representation, through thespatial frequency indirectly inserted in the fractaldimension [10].
Textures are characterized by two basic proper-ties, knowing homogeneity and localness of therepresentation, which means that the visual percep-tion of textures can be addressed by analyzingthe statistical behavior of the image in a windowof limited dimension [5]. This can be perceivedthrough using statistical filters which maps theimage values in each neighborhood in a subspace ofrelevant perceptivity, thus reducing the size of therepresentation while preserving the structural in-formation [5].
The natural appearance of the fractals is strongevidence that they capture all perceivable relevantstructures of the natural surfaces [10]. Thus, which isproposed in this work is just to change the residualdependency relationship of the TICA model, inorder to improve the sensitivity of the bank ofstatistical filters in the regions with ‘‘visible’’singularities in high-order statistics, through usingfractals. The new method thus generated is calledfractal plus energy TICA modeling (TICAFE).
2. Background
Natural images, in general, do not have Gaussianprobability density function [12], while do possessinherent self-similarity [13]. As shown in [14], thepower spectrum corresponding to the contrast ofthe luminosity in natural images follows the powerlaw given by
Sð f Þ /1
f�� ��g , (1)
ARTICLE IN PRESSK.F. Coco et al. / Signal Processing 87 (2007) 1966–1977 1969
where g is the spectral parameter. Although thevalue of g can exhibit great fluctuations [13], such alaw determines the class of functions 1/f thatoriginates the fractal distributions with statisticalself-similarities [15].
Thus, natural images are well represented by non-Gaussian distributions, extracted through TICA,and by statistical fractals. Joining these twomathematical models has been the inspiration forthe proposal of the technique presented in thispaper, whose final aim is to generate a powerfulmethod to perform texture-segmentation tasks.
2.1. ICA
In the ICA model, the mixture, X, is the only apriori information available, and is formed by N
random windows of the image, represented as thecolumn vectors ~x ¼ ½x1; � � � ;xM �
T of the matrix X.Mathematically speaking, the model is written as
X M�N ¼ AM�PSP�N , (2)
where AM�P is the mixture matrix and SP�N is thematrix of statistically independent components (asindependent as possible). If there is no reduction inthe dimensionality in the process of whitening toobtain the ICA model, then P ¼M.
The ICA consists in the problem of finding thefunction f ð~xÞ, in which ~x is an m-dimensionalrandom variable, so that the transformed n-dimen-sional ~s ¼ ðs1; s2; � � � ; snÞ
T, defined as ~s ¼ f ð~xÞ, ex-hibits some desired properties [6]. In most cases, theICA is done through a linear transformation ofobserved variables, in which ~x is a mixture to beseparated, ~s are the components to be separated(unknown) and W is the separation matrix (theinverse of the mixture matrix), to be determinedthrough the linear model~s ¼W~x. It is assumed thatthe columns of W are linearly independent, since W
is invertible [16]. In such a technique, the only apriori information available is the vector ofmixtures ~x. The hypothesis of the problem is thatthe mixture components, ~s, are statistically inde-pendent amongst themselves. Therefore, the ICAtechnique is applied as a blind source separation inwhich each component of ~s is a signal sourcecomposing the mixture ~x, under the suppositionthat the number of sources is defined a priori [6].
The blind source separation can be accomplished byoptimizing the ‘‘contrast function,’’ i.e., a scalarmeasure of some property of the distribution of thevariable~s [16]. The contrast functions are based in the
entropy, in the mutual independency, in the absence ofhigh-order correlation, or in the divergence betweenthe joint distribution of ~s and some models, forexample [16]. Notice that such an approach isessentially spatial: one ‘‘looks’’ to the structure throughthe sensors, not along time. A consequence of ignoringany time structure is that the information contained inthe data analyzed is exhaustively represented by thesamples of the mixture matrix distribution [16].
The probability density function associated to theindependent sources, denoted by qi( � ), is unknown apriori, although having zero mean and unity varianceper component. The joint distribution, qð~s Þ, is givenby the product of the marginal distributions of eachindependent source, which means that
qð~sÞ ¼ q1ðs1Þ � q2ðs2Þ � � � � � qnðsnÞ ¼Y
i¼1;n
qiðsiÞ.
(3)
Algorithms for getting the ICA model and thedifferent approaches for statistical independency arebeyond the scope of this paper, but any interestedreader is guided to Refs. [6] and [9].
2.2. TICA
The TICA model is similar to the ICA oneaddressed in the previous subsection. The differenceis the algorithm used to get the model. Regarding theICA approach using maximum likelihood estimation,the adaptation of the TICA method is expressed as [6]
ICA case:
logLðW Þ ¼XT
t¼1
Xn
i¼1
log pi ~wTi ~xðtÞ
� �þ T log detWj j,
(4)
TICA case (energy criterion):
log LðW Þ ¼XT
t¼1
Xn
j¼1
GXn
i¼1
hði; jÞ ~wTi ~xðtÞ
� �2 !
þ T log detWj j, ð5Þ
where G is a non-linear monotonic transformationof real positive numbers, h(i,j) is the neighborhoodfunction, and ~wT
i ~xðtÞ� �2
is the energy of the high-order non-negative independent components. Theproperties of the TICA model are described in [9],where its statistical order is defined as
si ¼ jXn
k¼1
hði; kÞuk
!, (6)
ARTICLE IN PRESSK.F. Coco et al. / Signal Processing 87 (2007) 1966–19771970
where j(.) is another non-linear monotonic trans-formation of positive real numbers, h(i,k) is theneighborhood function once more, and uk are thenon-negative independent components of highstatistical order used to generate the statisticalcomponent of the model.
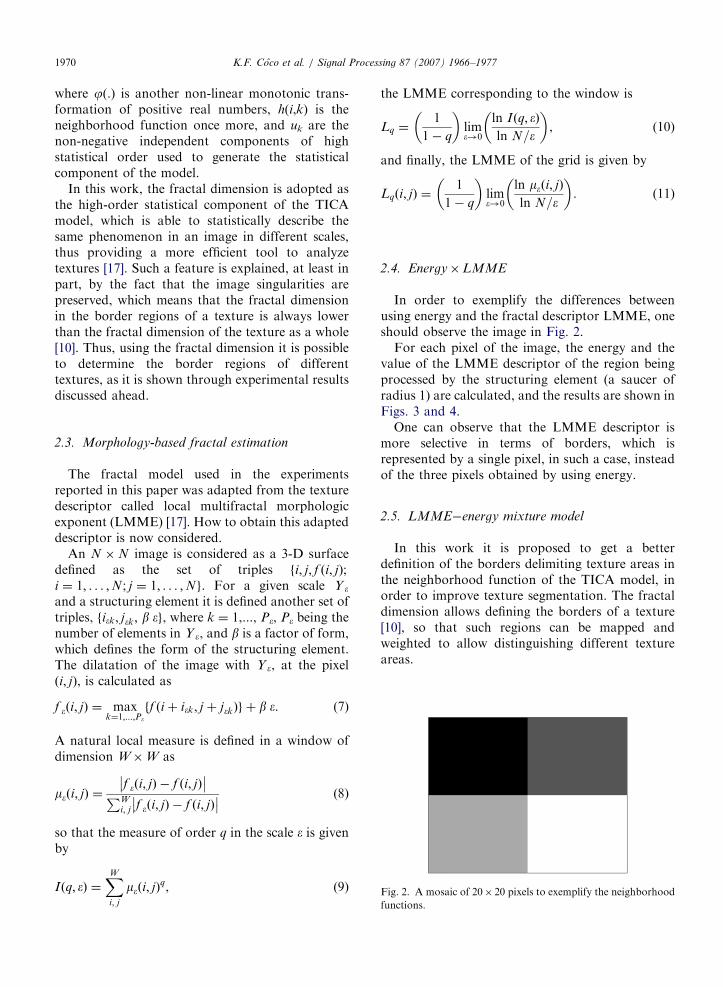
In this work, the fractal dimension is adopted asthe high-order statistical component of the TICAmodel, which is able to statistically describe thesame phenomenon in an image in different scales,thus providing a more efficient tool to analyzetextures [17]. Such a feature is explained, at least inpart, by the fact that the image singularities arepreserved, which means that the fractal dimensionin the border regions of a texture is always lowerthan the fractal dimension of the texture as a whole[10]. Thus, using the fractal dimension it is possibleto determine the border regions of differenttextures, as it is shown through experimental resultsdiscussed ahead.
Fig. 2. A mosaic of 20� 20 pixels to exemplify the neighborhood
functions.
2.3. Morphology-based fractal estimation
The fractal model used in the experimentsreported in this paper was adapted from the texturedescriptor called local multifractal morphologicexponent (LMME) [17]. How to obtain this adapteddescriptor is now considered.
An N �N image is considered as a 3-D surfacedefined as the set of triples fi; j; f ði; jÞ;i ¼ 1; . . . ;N; j ¼ 1; . . . ;Ng. For a given scale Y �
and a structuring element it is defined another set oftriples, fi�k; j�k; b �g, where k ¼ 1,..., Pe, Pe being thenumber of elements in Y �, and b is a factor of form,which defines the form of the structuring element.The dilatation of the image with Y �, at the pixelði; jÞ, is calculated as
f �ði; jÞ ¼ maxk¼1;...;P�
ff ði þ i�k; j þ j�kÞg þ b �. (7)
A natural local measure is defined in a window ofdimension W�W as
m�ði; jÞ ¼f �ði; jÞ � f ði; jÞ�� ��PWi; j f �ði; jÞ � f ði; jÞ�� �� (8)
so that the measure of order q in the scale e is givenby
Iðq; �Þ ¼XWi; j
m�ði; jÞq, (9)
the LMME corresponding to the window is
Lq ¼1
1� q
� �lim�!0
ln Iðq; �Þ
ln N=�
� �, (10)
and finally, the LMME of the grid is given by
Lqði; jÞ ¼1
1� q
� �lim�!0
ln m�ði; jÞln N=�
� �. (11)
2.4. Energy�LMME
In order to exemplify the differences betweenusing energy and the fractal descriptor LMME, oneshould observe the image in Fig. 2.
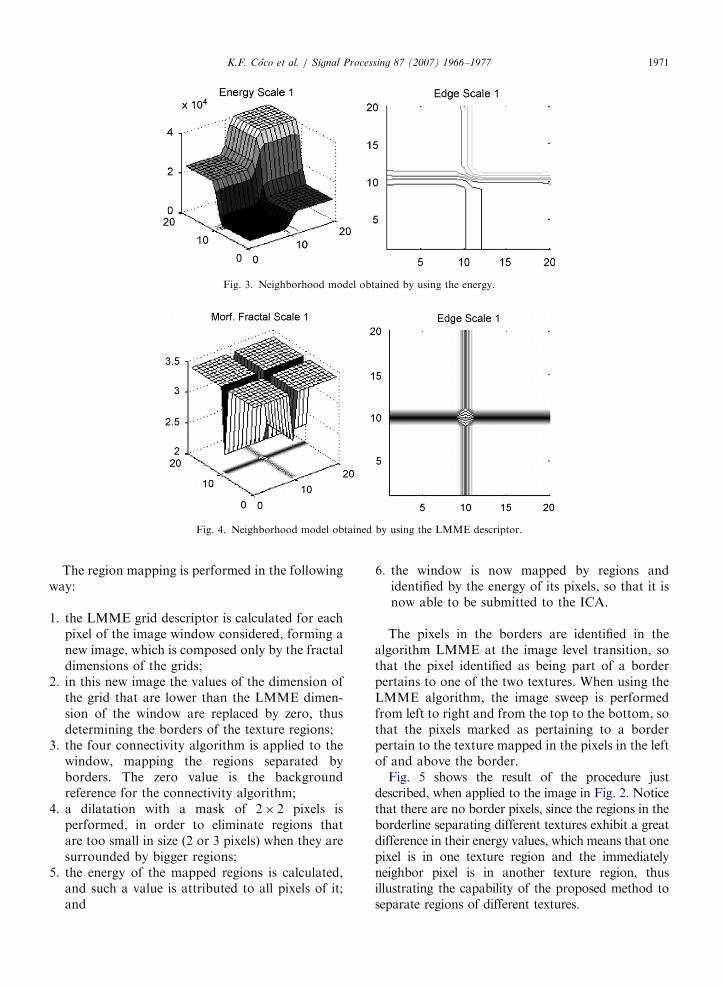
For each pixel of the image, the energy and thevalue of the LMME descriptor of the region beingprocessed by the structuring element (a saucer ofradius 1) are calculated, and the results are shown inFigs. 3 and 4.
One can observe that the LMME descriptor ismore selective in terms of borders, which isrepresented by a single pixel, in such a case, insteadof the three pixels obtained by using energy.
2.5. LMME�energy mixture model
In this work it is proposed to get a betterdefinition of the borders delimiting texture areas inthe neighborhood function of the TICA model, inorder to improve texture segmentation. The fractaldimension allows defining the borders of a texture[10], so that such regions can be mapped andweighted to allow distinguishing different textureareas.
ARTICLE IN PRESS
Fig. 3. Neighborhood model obtained by using the energy.
Fig. 4. Neighborhood model obtained by using the LMME descriptor.
K.F. Coco et al. / Signal Processing 87 (2007) 1966–1977 1971
The region mapping is performed in the followingway:
1.
the LMME grid descriptor is calculated for eachpixel of the image window considered, forming anew image, which is composed only by the fractaldimensions of the grids;2.
in this new image the values of the dimension ofthe grid that are lower than the LMME dimen-sion of the window are replaced by zero, thusdetermining the borders of the texture regions;3.
the four connectivity algorithm is applied to thewindow, mapping the regions separated byborders. The zero value is the backgroundreference for the connectivity algorithm;4.
a dilatation with a mask of 2� 2 pixels isperformed, in order to eliminate regions thatare too small in size (2 or 3 pixels) when they aresurrounded by bigger regions;5.
the energy of the mapped regions is calculated,and such a value is attributed to all pixels of it;and6.
the window is now mapped by regions andidentified by the energy of its pixels, so that it isnow able to be submitted to the ICA.The pixels in the borders are identified in thealgorithm LMME at the image level transition, sothat the pixel identified as being part of a borderpertains to one of the two textures. When using theLMME algorithm, the image sweep is performedfrom left to right and from the top to the bottom, sothat the pixels marked as pertaining to a borderpertain to the texture mapped in the pixels in the leftof and above the border.
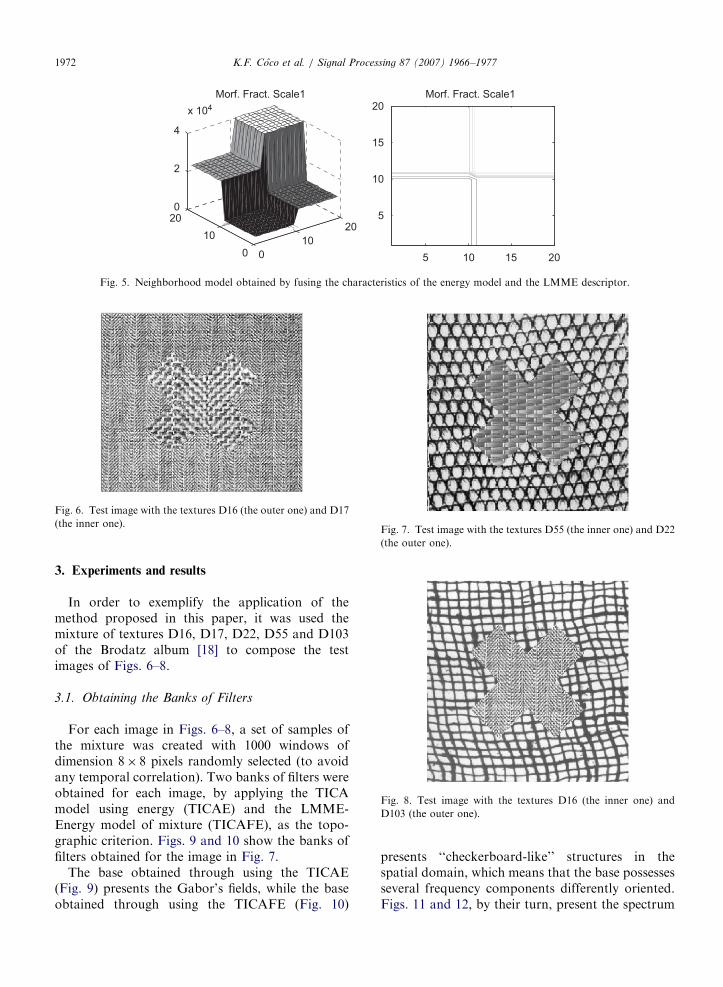
Fig. 5 shows the result of the procedure justdescribed, when applied to the image in Fig. 2. Noticethat there are no border pixels, since the regions in theborderline separating different textures exhibit a greatdifference in their energy values, which means that onepixel is in one texture region and the immediatelyneighbor pixel is in another texture region, thusillustrating the capability of the proposed method toseparate regions of different textures.
ARTICLE IN PRESS
Morf. Fract. Scale1
0
10
20
0
10
200
2
4
x 104
Morf. Fract. Scale1
5 10 15 20
5
10
15
20
Fig. 5. Neighborhood model obtained by fusing the characteristics of the energy model and the LMME descriptor.
Fig. 6. Test image with the textures D16 (the outer one) and D17
(the inner one).Fig. 7. Test image with the textures D55 (the inner one) and D22
(the outer one).
Fig. 8. Test image with the textures D16 (the inner one) and
D103 (the outer one).
K.F. Coco et al. / Signal Processing 87 (2007) 1966–19771972
3. Experiments and results
In order to exemplify the application of themethod proposed in this paper, it was used themixture of textures D16, D17, D22, D55 and D103of the Brodatz album [18] to compose the testimages of Figs. 6–8.
3.1. Obtaining the Banks of Filters
For each image in Figs. 6–8, a set of samples ofthe mixture was created with 1000 windows ofdimension 8� 8 pixels randomly selected (to avoidany temporal correlation). Two banks of filters wereobtained for each image, by applying the TICAmodel using energy (TICAE) and the LMME-Energy model of mixture (TICAFE), as the topo-graphic criterion. Figs. 9 and 10 show the banks offilters obtained for the image in Fig. 7.
The base obtained through using the TICAE(Fig. 9) presents the Gabor’s fields, while the baseobtained through using the TICAFE (Fig. 10)
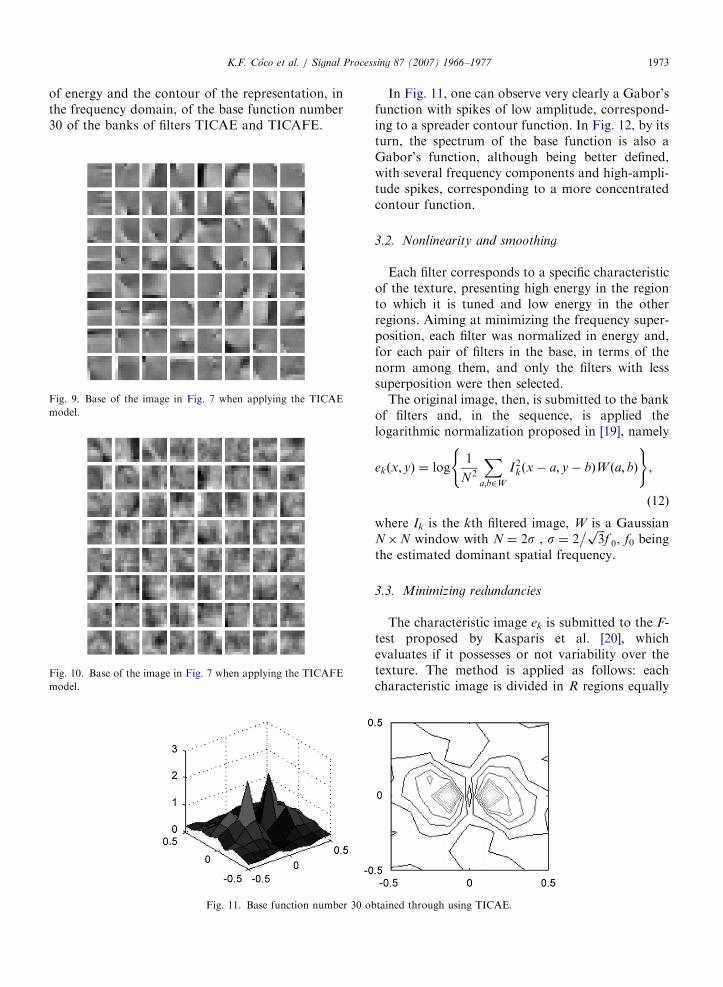
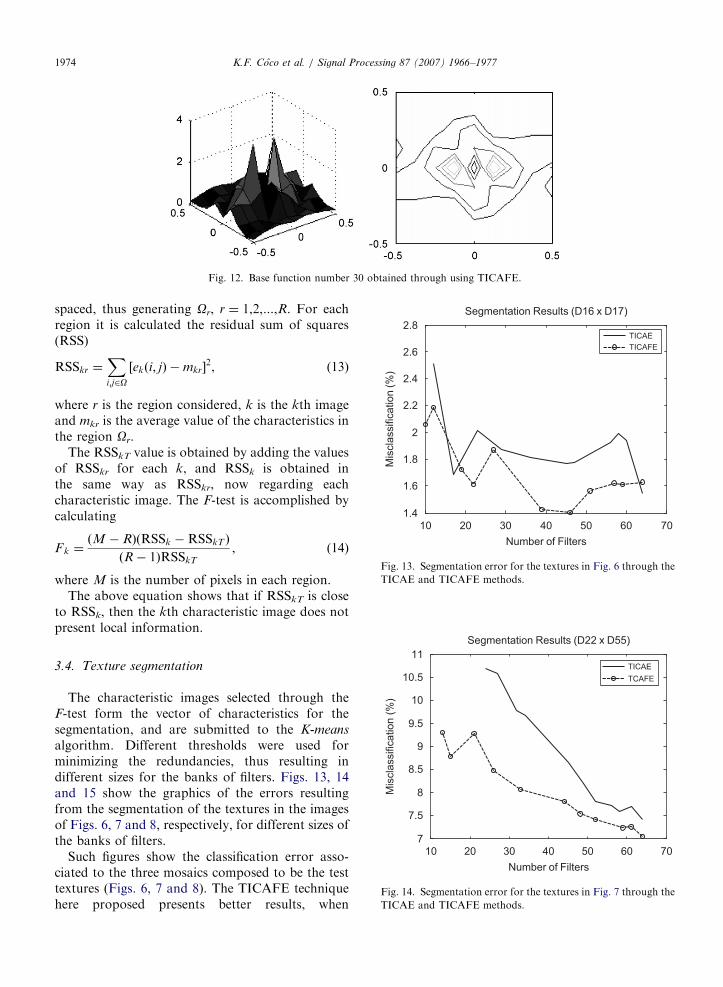
presents ‘‘checkerboard-like’’ structures in thespatial domain, which means that the base possessesseveral frequency components differently oriented.Figs. 11 and 12, by their turn, present the spectrum
ARTICLE IN PRESSK.F. Coco et al. / Signal Processing 87 (2007) 1966–1977 1973
of energy and the contour of the representation, inthe frequency domain, of the base function number30 of the banks of filters TICAE and TICAFE.
Fig. 9. Base of the image in Fig. 7 when applying the TICAE
model.
Fig. 10. Base of the image in Fig. 7 when applying the TICAFE
model.
Fig. 11. Base function number 30 ob
In Fig. 11, one can observe very clearly a Gabor’sfunction with spikes of low amplitude, correspond-ing to a spreader contour function. In Fig. 12, by itsturn, the spectrum of the base function is also aGabor’s function, although being better defined,with several frequency components and high-ampli-tude spikes, corresponding to a more concentratedcontour function.
3.2. Nonlinearity and smoothing
Each filter corresponds to a specific characteristicof the texture, presenting high energy in the regionto which it is tuned and low energy in the otherregions. Aiming at minimizing the frequency super-position, each filter was normalized in energy and,for each pair of filters in the base, in terms of thenorm among them, and only the filters with lesssuperposition were then selected.
The original image, then, is submitted to the bankof filters and, in the sequence, is applied thelogarithmic normalization proposed in [19], namely
ekðx; yÞ ¼ log1
N2
Xa;b2W
I2kðx� a; y� bÞW ða; bÞ
( ),
(12)
where Ik is the kth filtered image, W is a GaussianN�N window with N ¼ 2s , s ¼ 2
� ffiffiffi3p
f 0, f0 beingthe estimated dominant spatial frequency.
3.3. Minimizing redundancies
The characteristic image ek is submitted to the F-test proposed by Kasparis et al. [20], whichevaluates if it possesses or not variability over thetexture. The method is applied as follows: eachcharacteristic image is divided in R regions equally
tained through using TICAE.
ARTICLE IN PRESS
Fig. 12. Base function number 30 obtained through using TICAFE.
10 20 30 40 50 60 701.4
1.6
1.8
2
2.2
2.4
2.6
2.8
Segmentation Results (D16 x D17)
Number of Filters
Mis
cla
ssific
ation (
%)
TICAE
TICAFE
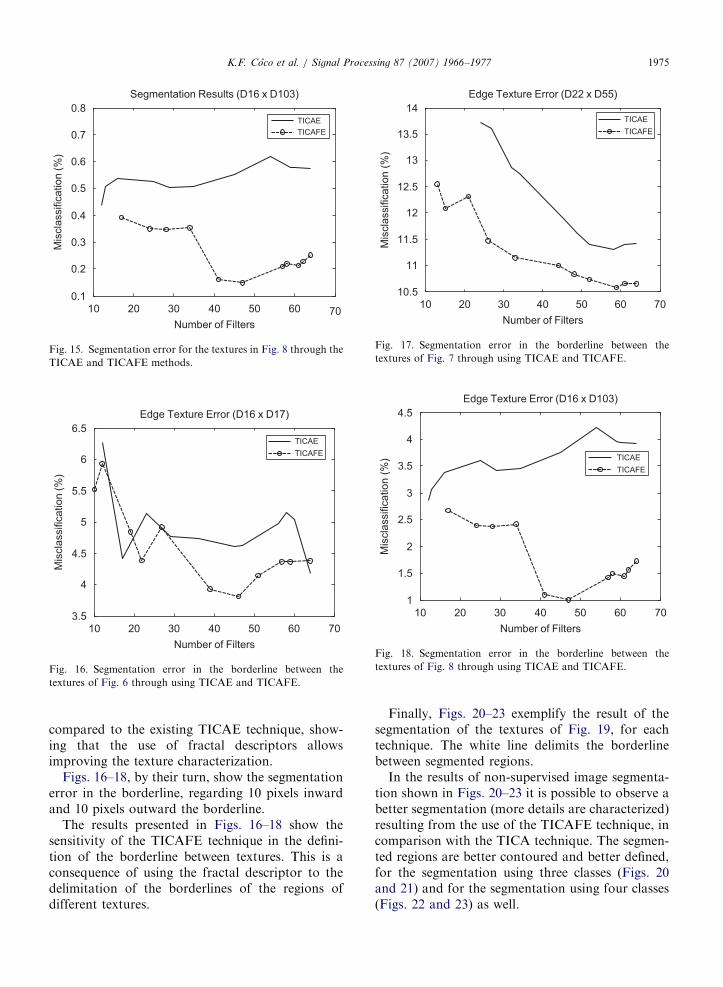
Fig. 13. Segmentation error for the textures in Fig. 6 through the
TICAE and TICAFE methods.
K.F. Coco et al. / Signal Processing 87 (2007) 1966–19771974
spaced, thus generating Or, r ¼ 1,2,...,R. For eachregion it is calculated the residual sum of squares(RSS)
RSSkr ¼Xi;j2O
ekði; jÞ �mkr½ �2, (13)
where r is the region considered, k is the kth imageand mkr is the average value of the characteristics inthe region Or.
The RSSkT value is obtained by adding the valuesof RSSkr for each k, and RSSk is obtained inthe same way as RSSkr, now regarding eachcharacteristic image. The F-test is accomplished bycalculating
Fk ¼M � Rð Þ RSSk �RSSkTð Þ
ðR� 1ÞRSSkT
, (14)
where M is the number of pixels in each region.The above equation shows that if RSSkT is close
to RSSk, then the kth characteristic image does notpresent local information.
10 20 30 40 50 60 707
7.5
8
8.5
9
9.5
10
10.5
11
Segmentation Results (D22 x D55)
Number of Filters
Mis
cla
ssific
ation (
%)
TICAE
TCAFE
Fig. 14. Segmentation error for the textures in Fig. 7 through the
TICAE and TICAFE methods.
3.4. Texture segmentation
The characteristic images selected through theF-test form the vector of characteristics for thesegmentation, and are submitted to the K-means
algorithm. Different thresholds were used forminimizing the redundancies, thus resulting indifferent sizes for the banks of filters. Figs. 13, 14and 15 show the graphics of the errors resultingfrom the segmentation of the textures in the imagesof Figs. 6, 7 and 8, respectively, for different sizes ofthe banks of filters.
Such figures show the classification error asso-ciated to the three mosaics composed to be the testtextures (Figs. 6, 7 and 8). The TICAFE techniquehere proposed presents better results, when
ARTICLE IN PRESS
10 20 30 40 50 60 70
0.1
0.2
0.3
0.4
0.5
0.6
0.7
0.8
Segmentation Results (D16 x D103)
Number of Filters
Mis
cla
ssific
ation (
%)
TICAE
TICAFE
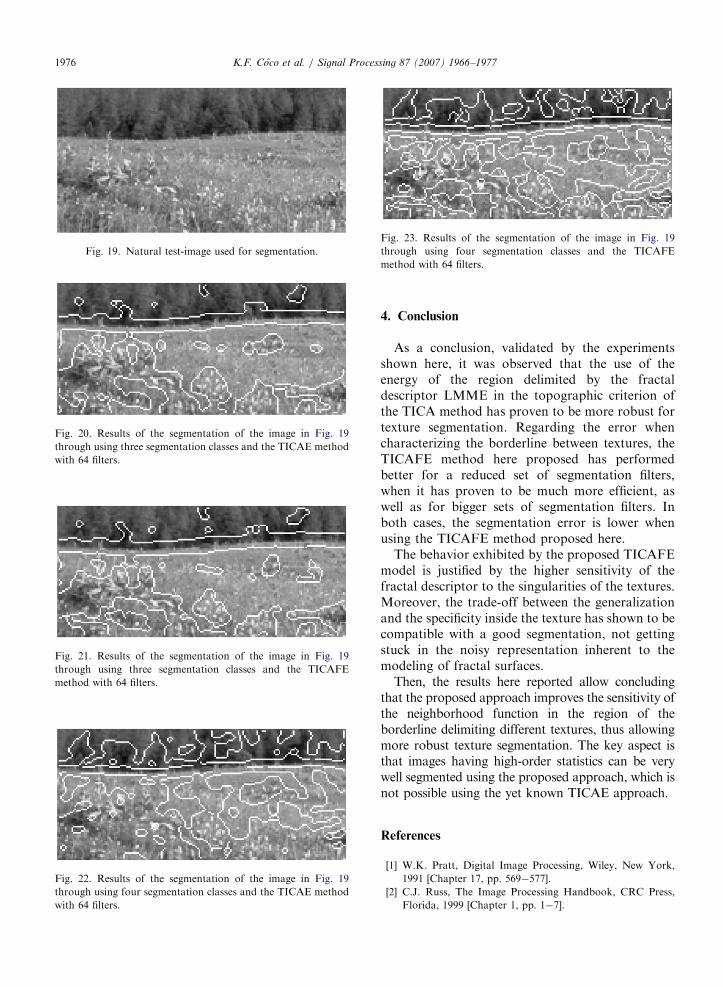
Fig. 15. Segmentation error for the textures in Fig. 8 through the
TICAE and TICAFE methods.
10 20 30 40 50 60 703.5
4
4.5
5
5.5
6
6.5
Edge Texture Error (D16 x D17)
Number of Filters
Mis
cla
ssific
ation (
%)
TICAE
TICAFE
Fig. 16. Segmentation error in the borderline between the
textures of Fig. 6 through using TICAE and TICAFE.
10 20 30 40 50 60 7010.5
11
11.5
12
12.5
13
13.5
14
Edge Texture Error (D22 x D55)
Number of Filters
Mis
cla
ssific
ation (
%)
TICAE
TICAFE
Fig. 17. Segmentation error in the borderline between the
textures of Fig. 7 through using TICAE and TICAFE.
10 20 30 40 50 60 701
1.5
2
2.5
3
3.5
4
4.5
Edge Texture Error (D16 x D103)
Number of Filters
Mis
cla
ssific
ation (
%) TICAE
TICAFE
Fig. 18. Segmentation error in the borderline between the
textures of Fig. 8 through using TICAE and TICAFE.
K.F. Coco et al. / Signal Processing 87 (2007) 1966–1977 1975
compared to the existing TICAE technique, show-ing that the use of fractal descriptors allowsimproving the texture characterization.
Figs. 16–18, by their turn, show the segmentationerror in the borderline, regarding 10 pixels inwardand 10 pixels outward the borderline.
The results presented in Figs. 16–18 show thesensitivity of the TICAFE technique in the defini-tion of the borderline between textures. This is aconsequence of using the fractal descriptor to thedelimitation of the borderlines of the regions ofdifferent textures.
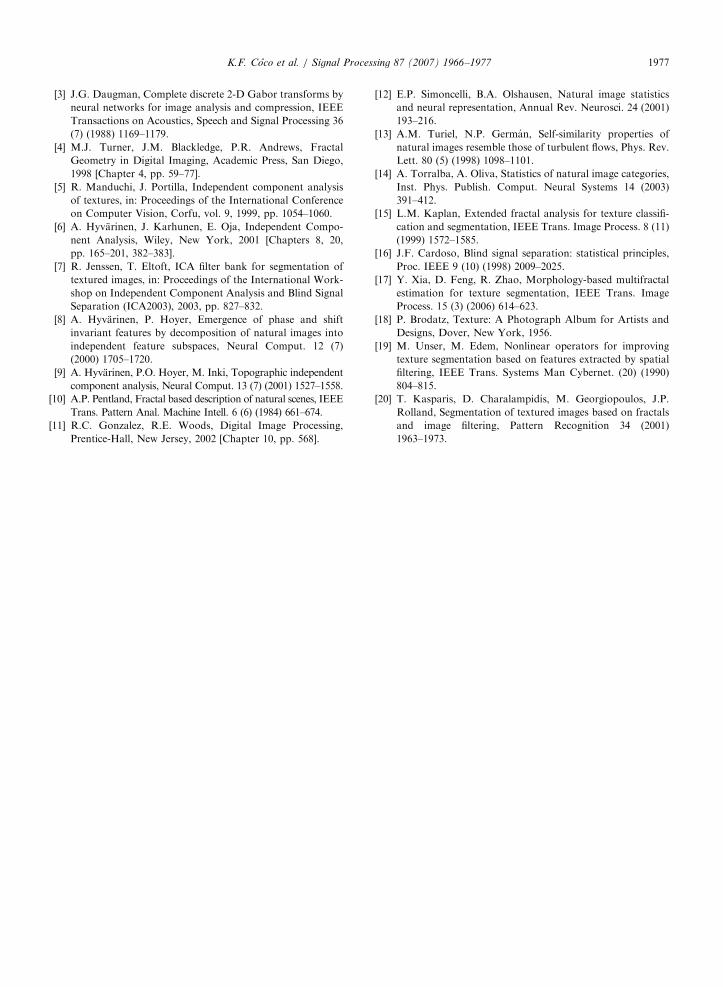
Finally, Figs. 20–23 exemplify the result of thesegmentation of the textures of Fig. 19, for eachtechnique. The white line delimits the borderlinebetween segmented regions.
In the results of non-supervised image segmenta-tion shown in Figs. 20–23 it is possible to observe abetter segmentation (more details are characterized)resulting from the use of the TICAFE technique, incomparison with the TICA technique. The segmen-ted regions are better contoured and better defined,for the segmentation using three classes (Figs. 20and 21) and for the segmentation using four classes(Figs. 22 and 23) as well.
ARTICLE IN PRESS
Fig. 19. Natural test-image used for segmentation.
Fig. 20. Results of the segmentation of the image in Fig. 19
through using three segmentation classes and the TICAE method
with 64 filters.
Fig. 21. Results of the segmentation of the image in Fig. 19
through using three segmentation classes and the TICAFE
method with 64 filters.
Fig. 22. Results of the segmentation of the image in Fig. 19
through using four segmentation classes and the TICAE method
with 64 filters.
Fig. 23. Results of the segmentation of the image in Fig. 19
through using four segmentation classes and the TICAFE
method with 64 filters.
K.F. Coco et al. / Signal Processing 87 (2007) 1966–19771976
4. Conclusion
As a conclusion, validated by the experimentsshown here, it was observed that the use of theenergy of the region delimited by the fractaldescriptor LMME in the topographic criterion ofthe TICA method has proven to be more robust fortexture segmentation. Regarding the error whencharacterizing the borderline between textures, theTICAFE method here proposed has performedbetter for a reduced set of segmentation filters,when it has proven to be much more efficient, aswell as for bigger sets of segmentation filters. Inboth cases, the segmentation error is lower whenusing the TICAFE method proposed here.
The behavior exhibited by the proposed TICAFEmodel is justified by the higher sensitivity of thefractal descriptor to the singularities of the textures.Moreover, the trade-off between the generalizationand the specificity inside the texture has shown to becompatible with a good segmentation, not gettingstuck in the noisy representation inherent to themodeling of fractal surfaces.
Then, the results here reported allow concludingthat the proposed approach improves the sensitivity ofthe neighborhood function in the region of theborderline delimiting different textures, thus allowingmore robust texture segmentation. The key aspect isthat images having high-order statistics can be verywell segmented using the proposed approach, which isnot possible using the yet known TICAE approach.
References
[1] W.K. Pratt, Digital Image Processing, Wiley, New York,
1991 [Chapter 17, pp. 569�577].
[2] C.J. Russ, The Image Processing Handbook, CRC Press,
Florida, 1999 [Chapter 1, pp. 1�7].
ARTICLE IN PRESSK.F. Coco et al. / Signal Processing 87 (2007) 1966–1977 1977
[3] J.G. Daugman, Complete discrete 2-D Gabor transforms by
neural networks for image analysis and compression, IEEE
Transactions on Acoustics, Speech and Signal Processing 36
(7) (1988) 1169–1179.
[4] M.J. Turner, J.M. Blackledge, P.R. Andrews, Fractal
Geometry in Digital Imaging, Academic Press, San Diego,
1998 [Chapter 4, pp. 59–77].
[5] R. Manduchi, J. Portilla, Independent component analysis
of textures, in: Proceedings of the International Conference
on Computer Vision, Corfu, vol. 9, 1999, pp. 1054–1060.
[6] A. Hyvarinen, J. Karhunen, E. Oja, Independent Compo-
nent Analysis, Wiley, New York, 2001 [Chapters 8, 20,
pp. 165–201, 382–383].
[7] R. Jenssen, T. Eltoft, ICA filter bank for segmentation of
textured images, in: Proceedings of the International Work-
shop on Independent Component Analysis and Blind Signal
Separation (ICA2003), 2003, pp. 827–832.
[8] A. Hyvarinen, P. Hoyer, Emergence of phase and shift
invariant features by decomposition of natural images into
independent feature subspaces, Neural Comput. 12 (7)
(2000) 1705–1720.
[9] A. Hyvarinen, P.O. Hoyer, M. Inki, Topographic independent
component analysis, Neural Comput. 13 (7) (2001) 1527–1558.
[10] A.P. Pentland, Fractal based description of natural scenes, IEEE
Trans. Pattern Anal. Machine Intell. 6 (6) (1984) 661–674.
[11] R.C. Gonzalez, R.E. Woods, Digital Image Processing,
Prentice-Hall, New Jersey, 2002 [Chapter 10, pp. 568].
[12] E.P. Simoncelli, B.A. Olshausen, Natural image statistics
and neural representation, Annual Rev. Neurosci. 24 (2001)
193–216.
[13] A.M. Turiel, N.P. German, Self-similarity properties of
natural images resemble those of turbulent flows, Phys. Rev.
Lett. 80 (5) (1998) 1098–1101.
[14] A. Torralba, A. Oliva, Statistics of natural image categories,
Inst. Phys. Publish. Comput. Neural Systems 14 (2003)
391–412.
[15] L.M. Kaplan, Extended fractal analysis for texture classifi-
cation and segmentation, IEEE Trans. Image Process. 8 (11)
(1999) 1572–1585.
[16] J.F. Cardoso, Blind signal separation: statistical principles,
Proc. IEEE 9 (10) (1998) 2009–2025.
[17] Y. Xia, D. Feng, R. Zhao, Morphology-based multifractal
estimation for texture segmentation, IEEE Trans. Image
Process. 15 (3) (2006) 614–623.
[18] P. Brodatz, Texture: A Photograph Album for Artists and
Designs, Dover, New York, 1956.
[19] M. Unser, M. Edem, Nonlinear operators for improving
texture segmentation based on features extracted by spatial
filtering, IEEE Trans. Systems Man Cybernet. (20) (1990)
804–815.
[20] T. Kasparis, D. Charalampidis, M. Georgiopoulos, J.P.
Rolland, Segmentation of textured images based on fractals
and image filtering, Pattern Recognition 34 (2001)
1963–1973.