Spatial shaping of cochlear innervation by temporally regulated neurotrophin expression
Upload
independentCategory
view
1download
0
Tonotopic Organization of Vertical Cells in the DorsalCochlear Nucleus of the CBA/J Mouse
Michael A. Muniak,1,2* and David K. Ryugo1,2,3,4
1Department of Neuroscience, Johns Hopkins University, Baltimore, Maryland 212052Hearing Research Program, Garvan Institute of Medical Research, Sydney, New South Wales 2010, Australia3Deparment of Otolaryngology-Head and Neck Surgery, Johns Hopkins University, Baltimore, Maryland 212054School of Medical Sciences, University of New South Wales, Sydney, New South Wales 2052, Australia
ABSTRACTThe systematic and topographic representation of fre-
quency is a first principle of organization throughout
the auditory system. The dorsal cochlear nucleus (DCN)
receives direct tonotopic projections from the auditory
nerve (AN) as well as secondary and descending projec-
tions from other sources. Among the recipients of AN
input in the DCN are vertical cells (also called tubercu-
loventral cells), glycinergic interneurons thought to pro-
vide on- or near-best-frequency feed-forward inhibition
to principal cells in the DCN and various cells in the
anteroventral cochlear nucleus (AVCN). Differing lines
of physiological and anatomical evidence suggest that
vertical cells and their projections are organized with
respect to frequency, but this has not been conclusively
demonstrated in the intact mammalian brain. To
address this issue, we retrogradely labeled vertical cells
via physiologically targeted injections in the AVCN of
the CBA/J mouse. Results from multiple cases were
merged with a normalized 3D template of the cochlear
nucleus (Muniak et al. [2013] J. Comp. Neurol.
521:1510–1532) to demonstrate quantitatively that the
arrangement of vertical cells is tonotopic and aligned to
the innervation pattern of the AN. These results suggest
that vertical cells are well positioned for providing
immediate, frequency-specific inhibition onto cells of
the DCN and AVCN to facilitate spectral processing.
J. Comp. Neurol. 522:937–949, 2014.
VC 2013 Wiley Periodicals, Inc.
INDEXING TERMS: 3D reconstruction; auditory nerve; frequency organization; interneuron; tuberculoventral; type II
The dorsal cochlear nucleus (DCN) receives direct
projections from the auditory nerve (AN) and is thought
to play a vital role in spectral feature processing and
sound localization (Young and Oertel, 2003). This pri-
mary auditory input is strictly organized by frequency
(Fekete et al., 1984; Ryugo and May, 1993; Muniak
et al., 2013), whereas secondary projections represent
multiple different modalities that include ascending
somatosensory, vestibular, and reticular inputs (Itoh
et al., 1987; Weinberg and Rustioni, 1987; Burian and
Gstoettner, 1988; Young et al., 1995; Wright and
Ryugo, 1996; Kanold and Young, 2001; Ohlrogge et al.,
2001; Haenggeli et al., 2005; Zhan and Ryugo, 2007)
as well as descending projections from auditory cortex
(Weedman and Ryugo, 1996; Meltzer and Ryugo, 2006)
and the inferior colliculus (Caicedo and Herbert, 1993;
Malmierca et al., 1996). The DCN of mammals is a lay-
ered structure containing a number of identifiable cell
types, each with unique morphology (Osen, 1969;
Brawer et al., 1974; Lorente de N�o, 1981; Webster and
Trune, 1982), response properties (Evans and Nelson,
1973; Young and Brownell, 1976; Davis et al., 1996;
Ma and Brenowitz, 2012), and ascending connections
(Osen, 1972; Ryugo et al., 1981; Malmierca et al.,
2002). Among these are local circuit interneurons
called vertical cells (Lorente de N�o, 1981).
Additional Supporting Information may be found in the online versionof this article.
Grant sponsor: National Institutes of Health/National Institute onDeafness and Other Communication Disorders (NIDCD); Grant number:DC00023; Grant number: DC00143; Grant number: DC00232; Grantnumber: DC04395; Grant number: DC05211; Grant number: DC05909;Grant sponsor: National Health and Medical Research Council(NHMRC) of Australia; Grant number: 1009482; Grant sponsor: GarnettPasse and Rodney Williams Memorial Foundation; Grant sponsor: Fair-fax Foundation; Grant sponsor: Life Science Research Award from theNew South Wales Office of Science and Medical Research.
*CORRESPONDENCE TO: Michael A. Muniak, Hearing Research Pro-gram, Garvan Institute of Medical Research, 384 Victoria Street, Sydney,New South Wales 2010, Australia. E-mail: [email protected]
Received May 20, 2013; Revised July 30, 2013;Accepted August 16, 2013.DOI 10.1002/cne.23454Published online August 24, 2013 in Wiley Online Library(wileyonlinelibrary.com)VC 2013 Wiley Periodicals, Inc.
The Journal of Comparative Neurology | Research in Systems Neuroscience 522:937–949 (2014) 937
RESEARCH ARTICLE
Vertical cells, also named tuberculoventral cells,
reside within the deep layer of the DCN and have small,
elongate cell bodies (Lorente de N�o, 1981). They are
glycinergic (Wenthold, 1987; Saint Marie et al., 1991;
Wickesberg et al., 1994) and exhibit smooth dendritic
trees that are oriented within the plane of an isofre-
quency sheet along with their locally terminating axonal
collaterals (Osen, 1983; Zhang and Oertel, 1993). Verti-
cal cells are the presumed source of the type II electro-
physiological response in the DCN, characterized as
having a “V”-shaped excitatory area flanked by inhibi-
tory sidebands, low rates of spontaneous activity, non-
monotonic rate-level functions, poor responses to
broadband noise stimuli, and robust responses to tones
near their best frequency (BF; Evans and Nelson, 1973;
Young and Brownell, 1976; Young and Voigt, 1982;
Davis et al., 1996; Spirou et al., 1999; Rhode, 1999).
There is strong evidence to suggest that type II neurons
provide feed-forward inhibition to principal cells of the
DCN, partially shaping their type IV response (Voigt and
Young, 1980, 1990; Nelken and Young, 1994; Spirou
et al., 1999; Davis and Young, 2000). Indeed, functional
synapses between vertical cells and pyramidal cells (a
type of principal cell) have recently been demonstrated
(Kuo et al., 2012).
Vertical cells are known to send projections to the
anteroventral cochlear nucleus (AVCN; Young, 1980;
Feng and Vater, 1985; Wickesberg and Oertel, 1988;
Saint Marie et al., 1991; Zhang and Oertel, 1993) via
the tuberculoventral tract (Lorente de N�o, 1981), pro-
viding a source of inhibitory signaling to bushy and stel-
late cells in the AVCN (Wickesberg and Oertel, 1990).
Physiological evidence suggests that inhibition on these
AVCN cells arrives from cells at or near the same BF
(Caspary et al., 1994), although the source of this inhi-
bition has not been conclusively demonstrated. Further-
more, anatomical studies in slice preparations have
shown that vertical cells receive the same AN input as
the cells in the AVCN to which they are targeting (Wick-
esberg and Oertel, 1988). Collectively, these indirect
lines of evidence imply that vertical cells of the DCN
are tonotopically organized. There is, however, scant
direct evidence to support this conclusion in the intact
mammalian brain (Feng and Vater, 1985). To investigate
this idea, we labeled vertical cells via physiologically
targeted injections in the AVCN and demonstrate, by
merging the results of multiple experimental cases to a
single model (Muniak et al., 2013), that their arrange-
ment is tonotopic in three dimensions. In addition, com-
parisons are made with a quantitative model of
frequency representation in the cochlear nucleus (CN;
Muniak et al., 2013) to show that this tonotopic
arrangement is well aligned to the cochleotopic organi-
zation of the DCN.
MATERIALS AND METHODS
AnimalsTwenty-one adult CBA/J mice (2 male, 19 female;
Jackson Laboratories, Bar Harbor, ME) were used in
this study. Mice ranged in age from 2.5 to 4 months
(mean 12 6 1.3 weeks) and weighed between 17 and
30 g (mean 23.4 6 3.6 g). Other results from these
animals have been reported elsewhere (Muniak et al.,
2013). All procedures were in accordance with National
Institutes of Health (NIH) guidelines and were approved
by the Animal Care and Use Committee of the Johns
Hopkins University School of Medicine. All data are
reported as mean 6 standard deviation (SD).
SurgeryMice were prepared for recordings using aseptic sur-
gical techniques. Anesthesia was induced via an intra-
peritoneal (IP) injection containing a mixture of
ketamine (100 mg/kg), xylazine (10 mg/kg), and
14.25% ethanol. Atropine (0.1–0.2 mg/kg, intramuscu-
larly [IM]) and dexamethasone (0.6 mg/kg, IM) were
administered to reduce oral secretions and brain swel-
ling, respectively. When the animal was areflexic, it was
secured in a stereotaxic frame (Stoelting, Wood Dale,
IL). Body temperature was maintained at 37�C with a
temperature-feedback-controlled heating pad. Through a
midline incision, a craniotomy overlying the inferior col-
liculus was made 2 mm lateral and 2 mm caudal to
lambda, after which the dura was opened. Upon conclu-
sion of the experiment, gelfoam was placed over the
skull opening and the soft tissue pulled back up and
closed with nylon sutures. Postsurgical treatment
included a topical antibiotic and administration of lac-
tated Ringer’s (�0.25 ml, IP), doxapram (10 mg/kg, IM)
to stimulate respiration, and butorphanol (5 mg/kg,
subcutaneous) for postsurgical analgesia.
ElectrophysiologyRecordings were carried out in a heated, double-
walled, sound-attenuated chamber (IAC, Bronx, NY).
Custom MatLab (Mathworks, Natick, MA) routines were
used for stimulus delivery and neural recording.
Abbreviations
AN auditory nerveAVCN anteroventral cochlear nucluesBF best frequencyCN cochlear nucleusDCN dorsal cochlear nucleusMRA multiple regression analysisPVCN posteroventral cochlear nucleusVCN ventral cochlear nucleus
M.A. Muniak and D.K. Ryugo
938 The Journal of Comparative Neurology |Research in Systems Neuroscience
Acoustic stimuli were generated by manually adjusting
an analog test oscillator during search (4200B; Krohn-
Hite, Brockton, MA) or via computer-controlled hard-
ware (RP2, SM5; Tucker-Davis Technologies [TDT], Ala-
chua, FL). Signals were amplified (D-75A; Crown,
Elkhart, IN), attenuated (PA5; TDT), and delivered by a
calibrated free-field speaker (40-5036 or Super
Tweeter; Radio Shack, Fort Worth, TX) placed directly in
front of the animal.
Single- and multiunit recordings were performed with
glass micropipettes (1.2 mm outer diameter) containing
fluorescein dextran (MW 10,000; D-1820; Molecular
Probes/Invitrogen, Carlsbad, CA) or tetramethylrhod-
amine dextran (MW 10,000; D-1817; Molecular Probes),
each diluted to 10% w/v in a solution of 0.5 M Tris
buffer, pH 7.6, and 3 M NaCl. The inner diameter of
the pipette tip was 10 lm, and the pipettes had 2–4-
MX impedances. Signals were amplified (1800; A-M
Systems, Carlsborg, WA), filtered (3202; Krohn-Hite),
and digitized for analysis (PCI-6602; National Instru-
ments, Austin, TX).
Broadband noise or sinusoidal tone bursts (200 msec
duration, 5 msec rise/fall) were delivered as the
recording electrode was advanced into the brain using
a motorized hydraulic micromanipulator (650; Kopf
Instruments, Tujunga, CA). A 16� posterior angle was
used to approach the CN, guided by atlas coordinates
(Franklin and Paxinos, 1997). Arrival into the nucleus
was heralded by the presence of sound-evoked spike
discharges. BF and threshold were estimated audiovisu-
ally and then confirmed using an automated tuning
curve protocol that measured responses to a four-
octave (oct.) frequency sweep centered on the test fre-
quency at 20 dB above threshold, sampling every 1/25
oct. At selected locations, fluorescent dextran tracer
was injected iontophoretically using a high-voltage,
constant-current source (CS 3; Midgard/Stoelting) set
at 5 lA of positive current (50% duty cycle) for 6–10
minutes. The pipette remained in position for 5 minutes
before being withdrawn. An injection at a second fre-
quency region in the CN using a different fluorescent
tracer was attempted in most animals.
Preparation of tissue for microscopyTwo weeks following dye injection, animals were
deeply anesthetized with a lethal dose of sodium pento-
barbital (100 mg/kg, IP) and perfused transcardially with
3% paraformaldehyde in 0.1 M phosphate buffer, pH 7.3.
The brainstem was dissected from the skull and post-
fixed overnight in the 3% paraformaldehyde solution. On
the next day, it was embedded in gelatin-albumin hard-
ened with 4% paraformaldehyde, cut in the transverse
plane using a vibrating microtome (Vibratome, Bannock-
burn, IL) at 50 lm thickness, mounted, and coverslipped
in Krystalon (Harleco, Philadelphia, PA).
CN reconstructionBrain sections were photographed and reconstructed
following methods described previously (Muniak et al.,
2013). Briefly, serial-section digital light micrographs
were collected and registered along the anterior–poste-
rior axis in Photoshop (Adobe Systems, San Jose, CA)
and exported to Amira (Visage Imaging, San Diego, CA),
where the CN border was outlined with a graphics tab-
let (Cintiq 12WX; Wacom, Vancouver, WA). This collec-
tion of outlines was used to generate a 3D surface of
the CN. Cases were normalized by independently align-
ing each surface to a template CN surface (Muniak
et al., 2013) using an iterative routine in Amira that
produced an affine transformation matrix. All imported
image data from a single animal were confined to the
same bounding box so that the transformation matrix
was consistent across that case.
Vertical cell analysisFluorescent micrographs were taken alongside bright-
field micrographs and subjected to alignment and export
manipulations in Photoshop identical to those described
above. Images were collected using appropriate filter
sets for red (rhodamine) and green (fluorescein) wave-
length emissions and stored in separate color channels
of a document, even if only one injection was made. This
procedure facilitated the extraction of labeled features
from endogenous background signals that appeared in
both channels. In some cases, level adjustments and
color enhancements were applied to bring out weak sig-
nals and to balance the overall amount of background
signal across channels. Because our analysis focused on
the location of labeled pixels but not pixel luminance,
these manipulations did not alter our findings.
Micrographs were imported into Neurolucida (Micro-
BrightField, Williston, VT) to identify the locations of ret-
rogradely labeled cells in the DCN. The location of each
cell was registered with respect to its x-, y-, and z-
coordinates and exported to MatLab for analysis. Cell
coordinates were normalized by applying the transforma-
tion matrix, and their spatial representation was visual-
ized in 3D by generating small, uniformly sized spheres.
RESULTS
ElectrophysiologyIn total 26 recording sites were characterized. BFs
ranged from 6.2 to 56 kHz, with thresholds ranging
from 8.6 to 37.6 dB SPL (Table 1). Iontophoretic tracer
injections were made at each recording site.
Tonotopic organization of vertical cells in the DCN
The Journal of Comparative Neurology |Research in Systems Neuroscience 939
Retrogradely labeled vertical cellsAll recordings and injections were confined to the
AVCN and produced discrete deposits (Fig. 1). Injection
sites were characterized by a dense accumulation of
dye that varied from approximately 50 to 400 lm in
width. Fibers emanate away from the injection site in a
pattern that forms three groupings. The main group is
formed by numerous AN fibers that preserve their rela-
tive spatial trajectory within the nucleus as they pro-
gress posteriorly and topographically through the
posteroventral CN (PVCN) and into the DCN (Muniak
et al., 2013). A second group of fibers courses ventro-
medially from the injection site and can be followed to
enter the trapezoid body. The third, relatively small
group of fibers rises dorsally as it passes caudally
through the ventral CN (VCN). This smaller bundle cor-
responds to the tuberculoventral tract described by Lor-
ente de N�o (1981). Its trajectory crosses with AN fibers
at the VCN–DCN junction and can be followed to its
origin in the DCN (Fig. 2).
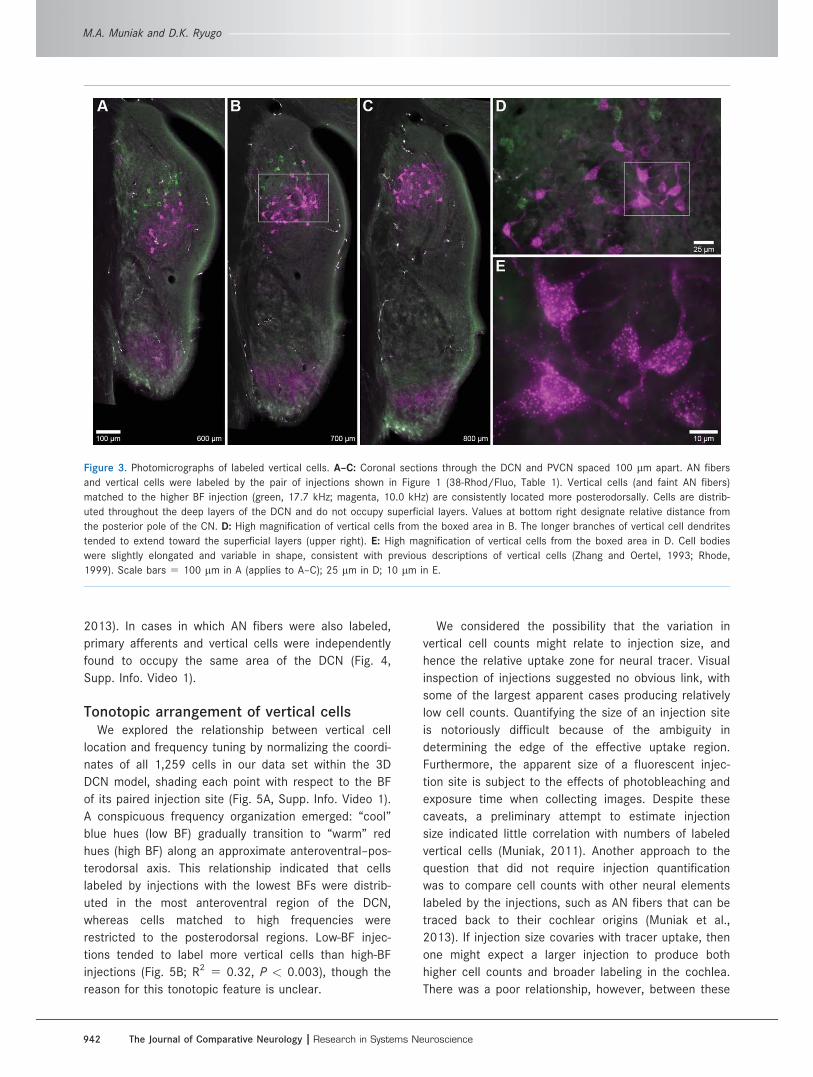
Retrogradely labeled cells were identified in the DCN
following each AVCN injection (Fig. 3). The cells were
limited to the deep layers of the DCN and were dis-
persed throughout its depth. Labeled cell bodies appear
flecked with fluorescent tracer, exhibiting a variable
number of primary dendritic stalks (and possibly the
axon; Fig. 3D,E). Our retrograde fills were insufficient to
reveal the full dendritic arborization of each neuron, so
morphological characterizations had to be based pri-
marily on the soma and primary processes. Cell bodies
appear slightly elongated but are quite variable in
shape. Somatic diameters fall within the range of 10–
25 lm. Each cell body gave rise to approximately one
to four primary dendrites that were often oriented
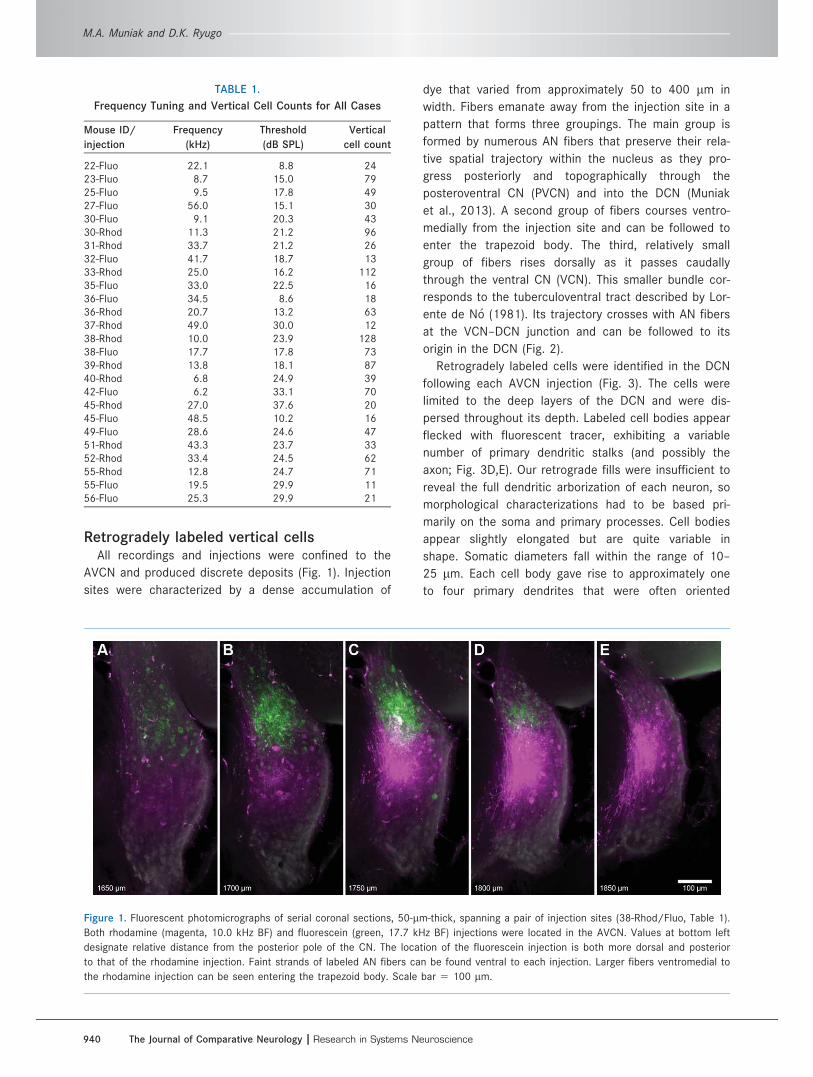
Figure 1. Fluorescent photomicrographs of serial coronal sections, 50-lm-thick, spanning a pair of injection sites (38-Rhod/Fluo, Table 1).
Both rhodamine (magenta, 10.0 kHz BF) and fluorescein (green, 17.7 kHz BF) injections were located in the AVCN. Values at bottom left
designate relative distance from the posterior pole of the CN. The location of the fluorescein injection is both more dorsal and posterior
to that of the rhodamine injection. Faint strands of labeled AN fibers can be found ventral to each injection. Larger fibers ventromedial to
the rhodamine injection can be seen entering the trapezoid body. Scale bar 5 100 lm.
TABLE 1.
Frequency Tuning and Vertical Cell Counts for All Cases
Mouse ID/
injection
Frequency
(kHz)
Threshold
(dB SPL)
Vertical
cell count
22-Fluo 22.1 8.8 2423-Fluo 8.7 15.0 7925-Fluo 9.5 17.8 4927-Fluo 56.0 15.1 3030-Fluo 9.1 20.3 4330-Rhod 11.3 21.2 9631-Rhod 33.7 21.2 2632-Fluo 41.7 18.7 1333-Rhod 25.0 16.2 11235-Fluo 33.0 22.5 1636-Fluo 34.5 8.6 1836-Rhod 20.7 13.2 6337-Rhod 49.0 30.0 1238-Rhod 10.0 23.9 12838-Fluo 17.7 17.8 7339-Rhod 13.8 18.1 8740-Rhod 6.8 24.9 3942-Fluo 6.2 33.1 7045-Rhod 27.0 37.6 2045-Fluo 48.5 10.2 1649-Fluo 28.6 24.6 4751-Rhod 43.3 23.7 3352-Rhod 33.4 24.5 6255-Rhod 12.8 24.7 7155-Fluo 19.5 29.9 1156-Fluo 25.3 29.9 21
M.A. Muniak and D.K. Ryugo
940 The Journal of Comparative Neurology |Research in Systems Neuroscience
toward the pial surface of the nucleus. For each cell,
the collective dendritic arborization formed a “spatial
envelope” that conformed to an isofrequency sheet
defined by the incoming auditory nerve fibers. Shorter
dendritic branches extended in other directions as well
but were largely confined to the planar sheet that also
contained the labeled cell body. These features were
consistent with previous morphological descriptions of
vertical cells (Lorente de N�o, 1981; Webster and Trune,
1982; Saint Marie et al., 1991; Zhang and Oertel, 1993;
Rhode, 1999).
Each injection produced from 11 to 128 labeled vertical
cells (mean 48.4 6 33.1 cells; Table 1). In each instance,
labeled elements were concentrated within a restricted
region of the DCN, forming a distinct group (Fig. 3A–C).
When these sections were aligned and placed in serial
order, the separate groupings of cells collectively formed
discrete “sheets” along the anterior–posterior axis.
We visualized the arrangement of labeled cells within
a 3D CN model by normalizing their positions according
to their computed transformation matrices (Fig. 4,
Supp. Info. Video 1; see Materials and Methods).
Grouped by injection, cells from any single case were
clearly restricted to just a portion of the DCN. Cell
groups from paired injections were easily distinguished
from one another, with cells matched to higher BFs sit-
uated more toward the dorsoposterior tip of the DCN.
The Euclidian distance between cells from any particu-
lar group ranged from 7.6 to 535.6 lm (mean 168.5 6
83.4 lm; 43,555 unique pairs). The majority of this var-
iation in distance lay within the imaginary “sheet” or
plane occupied by each cell group. Far less physical
separation of cells was observed orthogonal to this
plane. The trajectory of this plane is quite similar to the
path taken by descending AN fibers as they terminate
within the deep layers of the DCN (Muniak et al.,
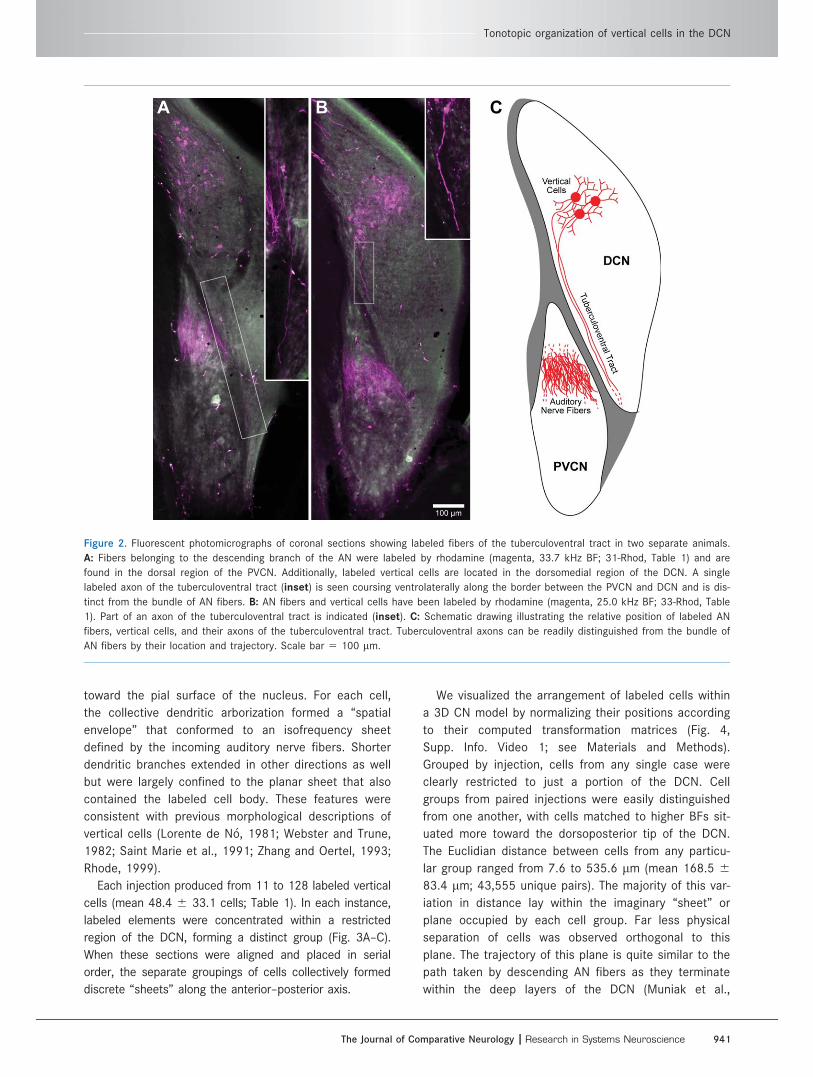
Figure 2. Fluorescent photomicrographs of coronal sections showing labeled fibers of the tuberculoventral tract in two separate animals.
A: Fibers belonging to the descending branch of the AN were labeled by rhodamine (magenta, 33.7 kHz BF; 31-Rhod, Table 1) and are
found in the dorsal region of the PVCN. Additionally, labeled vertical cells are located in the dorsomedial region of the DCN. A single
labeled axon of the tuberculoventral tract (inset) is seen coursing ventrolaterally along the border between the PVCN and DCN and is dis-
tinct from the bundle of AN fibers. B: AN fibers and vertical cells have been labeled by rhodamine (magenta, 25.0 kHz BF; 33-Rhod, Table
1). Part of an axon of the tuberculoventral tract is indicated (inset). C: Schematic drawing illustrating the relative position of labeled AN
fibers, vertical cells, and their axons of the tuberculoventral tract. Tuberculoventral axons can be readily distinguished from the bundle of
AN fibers by their location and trajectory. Scale bar 5 100 lm.
Tonotopic organization of vertical cells in the DCN
The Journal of Comparative Neurology |Research in Systems Neuroscience 941
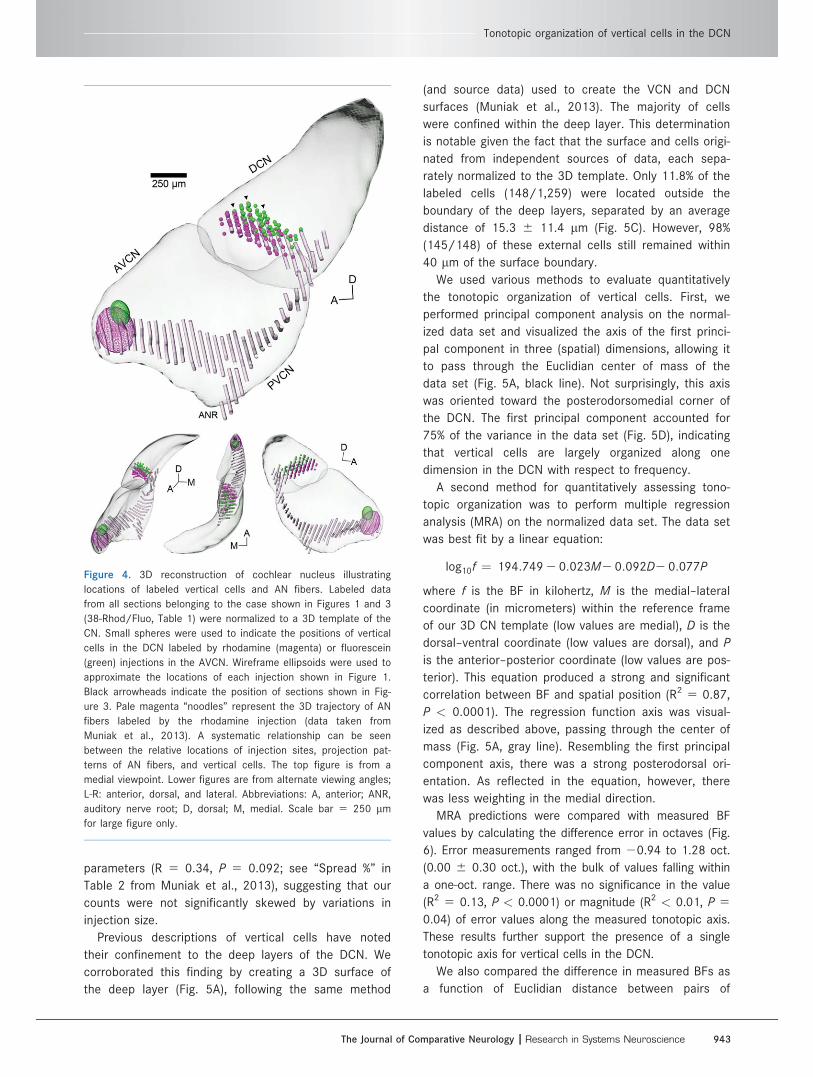
2013). In cases in which AN fibers were also labeled,
primary afferents and vertical cells were independently
found to occupy the same area of the DCN (Fig. 4,
Supp. Info. Video 1).
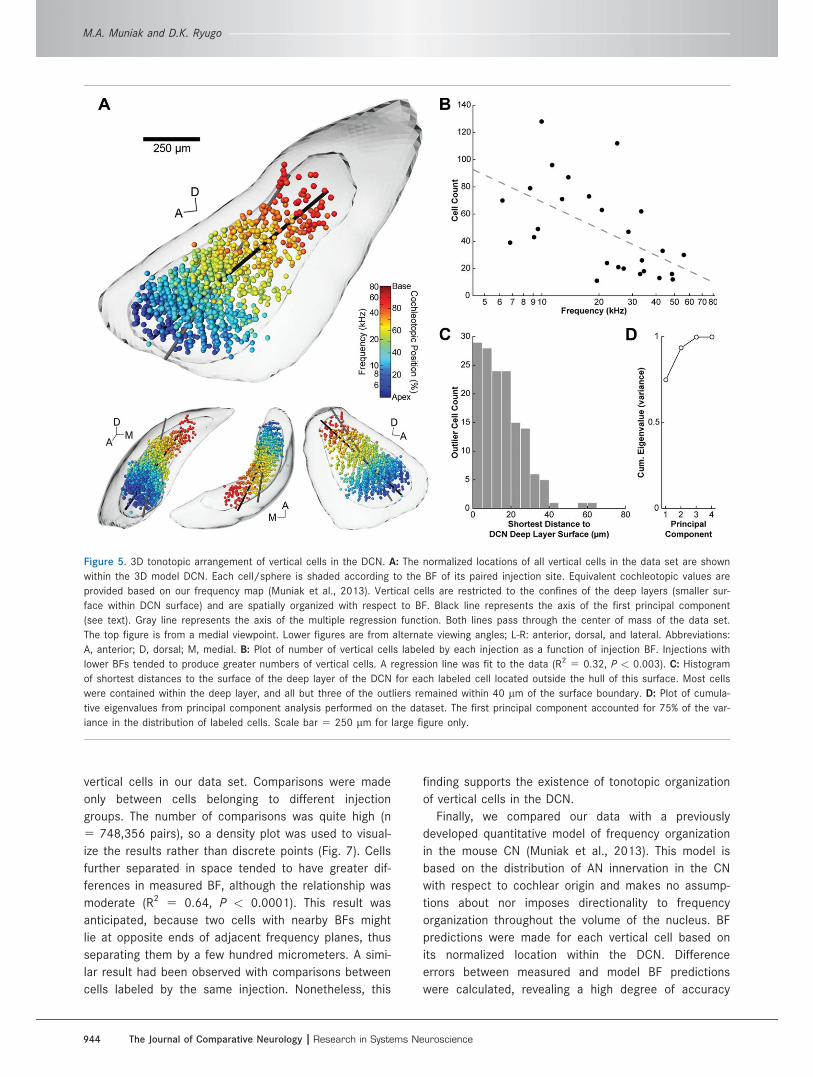
Tonotopic arrangement of vertical cellsWe explored the relationship between vertical cell
location and frequency tuning by normalizing the coordi-
nates of all 1,259 cells in our data set within the 3D
DCN model, shading each point with respect to the BF
of its paired injection site (Fig. 5A, Supp. Info. Video 1).
A conspicuous frequency organization emerged: “cool”
blue hues (low BF) gradually transition to “warm” red
hues (high BF) along an approximate anteroventral–pos-
terodorsal axis. This relationship indicated that cells
labeled by injections with the lowest BFs were distrib-
uted in the most anteroventral region of the DCN,
whereas cells matched to high frequencies were
restricted to the posterodorsal regions. Low-BF injec-
tions tended to label more vertical cells than high-BF
injections (Fig. 5B; R2 5 0.32, P < 0.003), though the
reason for this tonotopic feature is unclear.
We considered the possibility that the variation in
vertical cell counts might relate to injection size, and
hence the relative uptake zone for neural tracer. Visual
inspection of injections suggested no obvious link, with
some of the largest apparent cases producing relatively
low cell counts. Quantifying the size of an injection site
is notoriously difficult because of the ambiguity in
determining the edge of the effective uptake region.
Furthermore, the apparent size of a fluorescent injec-
tion site is subject to the effects of photobleaching and
exposure time when collecting images. Despite these
caveats, a preliminary attempt to estimate injection
size indicated little correlation with numbers of labeled
vertical cells (Muniak, 2011). Another approach to the
question that did not require injection quantification
was to compare cell counts with other neural elements
labeled by the injections, such as AN fibers that can be
traced back to their cochlear origins (Muniak et al.,
2013). If injection size covaries with tracer uptake, then
one might expect a larger injection to produce both
higher cell counts and broader labeling in the cochlea.
There was a poor relationship, however, between these
Figure 3. Photomicrographs of labeled vertical cells. A–C: Coronal sections through the DCN and PVCN spaced 100 lm apart. AN fibers
and vertical cells were labeled by the pair of injections shown in Figure 1 (38-Rhod/Fluo, Table 1). Vertical cells (and faint AN fibers)
matched to the higher BF injection (green, 17.7 kHz; magenta, 10.0 kHz) are consistently located more posterodorsally. Cells are distrib-
uted throughout the deep layers of the DCN and do not occupy superficial layers. Values at bottom right designate relative distance from
the posterior pole of the CN. D: High magnification of vertical cells from the boxed area in B. The longer branches of vertical cell dendrites
tended to extend toward the superficial layers (upper right). E: High magnification of vertical cells from the boxed area in D. Cell bodies
were slightly elongated and variable in shape, consistent with previous descriptions of vertical cells (Zhang and Oertel, 1993; Rhode,
1999). Scale bars 5 100 lm in A (applies to A–C); 25 lm in D; 10 lm in E.
M.A. Muniak and D.K. Ryugo
942 The Journal of Comparative Neurology |Research in Systems Neuroscience
parameters (R 5 0.34, P 5 0.092; see “Spread %” in
Table 2 from Muniak et al., 2013), suggesting that our
counts were not significantly skewed by variations in
injection size.
Previous descriptions of vertical cells have noted
their confinement to the deep layers of the DCN. We
corroborated this finding by creating a 3D surface of
the deep layer (Fig. 5A), following the same method
(and source data) used to create the VCN and DCN
surfaces (Muniak et al., 2013). The majority of cells
were confined within the deep layer. This determination
is notable given the fact that the surface and cells origi-
nated from independent sources of data, each sepa-
rately normalized to the 3D template. Only 11.8% of the
labeled cells (148/1,259) were located outside the
boundary of the deep layers, separated by an average
distance of 15.3 6 11.4 lm (Fig. 5C). However, 98%
(145/148) of these external cells still remained within
40 lm of the surface boundary.
We used various methods to evaluate quantitatively
the tonotopic organization of vertical cells. First, we
performed principal component analysis on the normal-
ized data set and visualized the axis of the first princi-
pal component in three (spatial) dimensions, allowing it
to pass through the Euclidian center of mass of the
data set (Fig. 5A, black line). Not surprisingly, this axis
was oriented toward the posterodorsomedial corner of
the DCN. The first principal component accounted for
75% of the variance in the data set (Fig. 5D), indicating
that vertical cells are largely organized along one
dimension in the DCN with respect to frequency.
A second method for quantitatively assessing tono-
topic organization was to perform multiple regression
analysis (MRA) on the normalized data set. The data set
was best fit by a linear equation:
log10f ¼ 194:749 2 0:023M2 0:092D2 0:077P
where f is the BF in kilohertz, M is the medial–lateral
coordinate (in micrometers) within the reference frame
of our 3D CN template (low values are medial), D is the
dorsal–ventral coordinate (low values are dorsal), and P
is the anterior–posterior coordinate (low values are pos-
terior). This equation produced a strong and significant
correlation between BF and spatial position (R2 5 0.87,
P < 0.0001). The regression function axis was visual-
ized as described above, passing through the center of
mass (Fig. 5A, gray line). Resembling the first principal
component axis, there was a strong posterodorsal ori-
entation. As reflected in the equation, however, there
was less weighting in the medial direction.
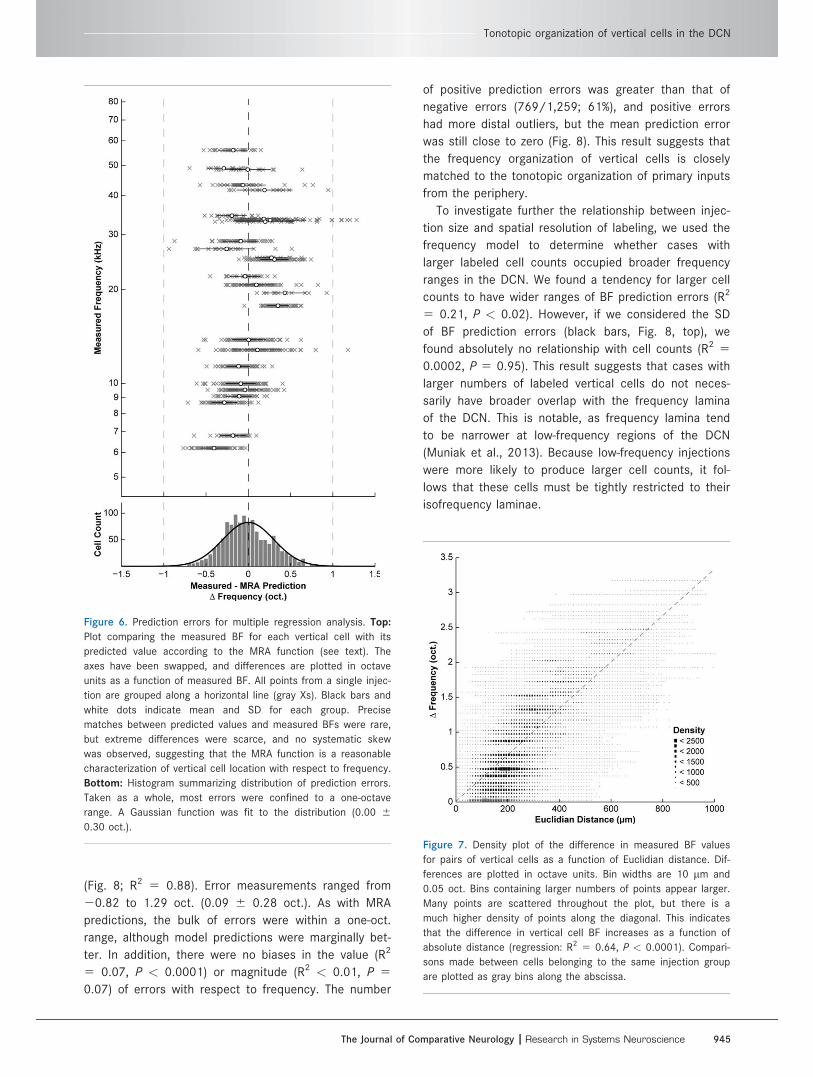
MRA predictions were compared with measured BF
values by calculating the difference error in octaves (Fig.
6). Error measurements ranged from 20.94 to 1.28 oct.
(0.00 6 0.30 oct.), with the bulk of values falling within
a one-oct. range. There was no significance in the value
(R2 5 0.13, P < 0.0001) or magnitude (R2 < 0.01, P 5
0.04) of error values along the measured tonotopic axis.
These results further support the presence of a single
tonotopic axis for vertical cells in the DCN.
We also compared the difference in measured BFs as
a function of Euclidian distance between pairs of
Figure 4. 3D reconstruction of cochlear nucleus illustrating
locations of labeled vertical cells and AN fibers. Labeled data
from all sections belonging to the case shown in Figures 1 and 3
(38-Rhod/Fluo, Table 1) were normalized to a 3D template of the
CN. Small spheres were used to indicate the positions of vertical
cells in the DCN labeled by rhodamine (magenta) or fluorescein
(green) injections in the AVCN. Wireframe ellipsoids were used to
approximate the locations of each injection shown in Figure 1.
Black arrowheads indicate the position of sections shown in Fig-
ure 3. Pale magenta “noodles” represent the 3D trajectory of AN
fibers labeled by the rhodamine injection (data taken from
Muniak et al., 2013). A systematic relationship can be seen
between the relative locations of injection sites, projection pat-
terns of AN fibers, and vertical cells. The top figure is from a
medial viewpoint. Lower figures are from alternate viewing angles;
L-R: anterior, dorsal, and lateral. Abbreviations: A, anterior; ANR,
auditory nerve root; D, dorsal; M, medial. Scale bar 5 250 lm
for large figure only.
Tonotopic organization of vertical cells in the DCN
The Journal of Comparative Neurology |Research in Systems Neuroscience 943
vertical cells in our data set. Comparisons were made
only between cells belonging to different injection
groups. The number of comparisons was quite high (n
5 748,356 pairs), so a density plot was used to visual-
ize the results rather than discrete points (Fig. 7). Cells
further separated in space tended to have greater dif-
ferences in measured BF, although the relationship was
moderate (R2 5 0.64, P < 0.0001). This result was
anticipated, because two cells with nearby BFs might
lie at opposite ends of adjacent frequency planes, thus
separating them by a few hundred micrometers. A simi-
lar result had been observed with comparisons between
cells labeled by the same injection. Nonetheless, this
finding supports the existence of tonotopic organization
of vertical cells in the DCN.
Finally, we compared our data with a previously
developed quantitative model of frequency organization
in the mouse CN (Muniak et al., 2013). This model is
based on the distribution of AN innervation in the CN
with respect to cochlear origin and makes no assump-
tions about nor imposes directionality to frequency
organization throughout the volume of the nucleus. BF
predictions were made for each vertical cell based on
its normalized location within the DCN. Difference
errors between measured and model BF predictions
were calculated, revealing a high degree of accuracy
Figure 5. 3D tonotopic arrangement of vertical cells in the DCN. A: The normalized locations of all vertical cells in the data set are shown
within the 3D model DCN. Each cell/sphere is shaded according to the BF of its paired injection site. Equivalent cochleotopic values are
provided based on our frequency map (Muniak et al., 2013). Vertical cells are restricted to the confines of the deep layers (smaller sur-
face within DCN surface) and are spatially organized with respect to BF. Black line represents the axis of the first principal component
(see text). Gray line represents the axis of the multiple regression function. Both lines pass through the center of mass of the data set.
The top figure is from a medial viewpoint. Lower figures are from alternate viewing angles; L-R: anterior, dorsal, and lateral. Abbreviations:
A, anterior; D, dorsal; M, medial. B: Plot of number of vertical cells labeled by each injection as a function of injection BF. Injections with
lower BFs tended to produce greater numbers of vertical cells. A regression line was fit to the data (R2 5 0.32, P < 0.003). C: Histogram
of shortest distances to the surface of the deep layer of the DCN for each labeled cell located outside the hull of this surface. Most cells
were contained within the deep layer, and all but three of the outliers remained within 40 lm of the surface boundary. D: Plot of cumula-
tive eigenvalues from principal component analysis performed on the dataset. The first principal component accounted for 75% of the var-
iance in the distribution of labeled cells. Scale bar 5 250 lm for large figure only.
M.A. Muniak and D.K. Ryugo
944 The Journal of Comparative Neurology |Research in Systems Neuroscience
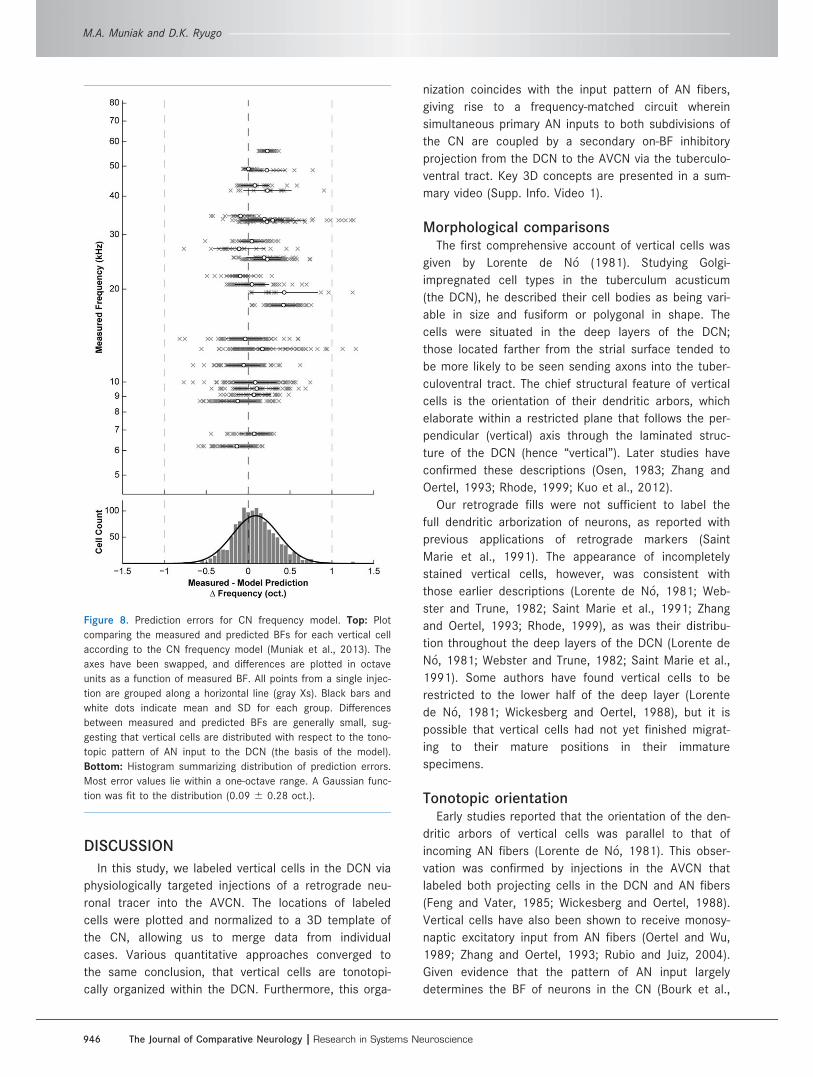
(Fig. 8; R2 5 0.88). Error measurements ranged from
20.82 to 1.29 oct. (0.09 6 0.28 oct.). As with MRA
predictions, the bulk of errors were within a one-oct.
range, although model predictions were marginally bet-
ter. In addition, there were no biases in the value (R2
5 0.07, P < 0.0001) or magnitude (R2 < 0.01, P 5
0.07) of errors with respect to frequency. The number
of positive prediction errors was greater than that of
negative errors (769/1,259; 61%), and positive errors
had more distal outliers, but the mean prediction error
was still close to zero (Fig. 8). This result suggests that
the frequency organization of vertical cells is closely
matched to the tonotopic organization of primary inputs
from the periphery.
To investigate further the relationship between injec-
tion size and spatial resolution of labeling, we used the
frequency model to determine whether cases with
larger labeled cell counts occupied broader frequency
ranges in the DCN. We found a tendency for larger cell
counts to have wider ranges of BF prediction errors (R2
5 0.21, P < 0.02). However, if we considered the SD
of BF prediction errors (black bars, Fig. 8, top), we
found absolutely no relationship with cell counts (R2 5
0.0002, P 5 0.95). This result suggests that cases with
larger numbers of labeled vertical cells do not neces-
sarily have broader overlap with the frequency lamina
of the DCN. This is notable, as frequency lamina tend
to be narrower at low-frequency regions of the DCN
(Muniak et al., 2013). Because low-frequency injections
were more likely to produce larger cell counts, it fol-
lows that these cells must be tightly restricted to their
isofrequency laminae.
Figure 6. Prediction errors for multiple regression analysis. Top:
Plot comparing the measured BF for each vertical cell with its
predicted value according to the MRA function (see text). The
axes have been swapped, and differences are plotted in octave
units as a function of measured BF. All points from a single injec-
tion are grouped along a horizontal line (gray Xs). Black bars and
white dots indicate mean and SD for each group. Precise
matches between predicted values and measured BFs were rare,
but extreme differences were scarce, and no systematic skew
was observed, suggesting that the MRA function is a reasonable
characterization of vertical cell location with respect to frequency.
Bottom: Histogram summarizing distribution of prediction errors.
Taken as a whole, most errors were confined to a one-octave
range. A Gaussian function was fit to the distribution (0.00 6
0.30 oct.).
Figure 7. Density plot of the difference in measured BF values
for pairs of vertical cells as a function of Euclidian distance. Dif-
ferences are plotted in octave units. Bin widths are 10 lm and
0.05 oct. Bins containing larger numbers of points appear larger.
Many points are scattered throughout the plot, but there is a
much higher density of points along the diagonal. This indicates
that the difference in vertical cell BF increases as a function of
absolute distance (regression: R2 5 0.64, P < 0.0001). Compari-
sons made between cells belonging to the same injection group
are plotted as gray bins along the abscissa.
Tonotopic organization of vertical cells in the DCN
The Journal of Comparative Neurology |Research in Systems Neuroscience 945
DISCUSSION
In this study, we labeled vertical cells in the DCN via
physiologically targeted injections of a retrograde neu-
ronal tracer into the AVCN. The locations of labeled
cells were plotted and normalized to a 3D template of
the CN, allowing us to merge data from individual
cases. Various quantitative approaches converged to
the same conclusion, that vertical cells are tonotopi-
cally organized within the DCN. Furthermore, this orga-
nization coincides with the input pattern of AN fibers,
giving rise to a frequency-matched circuit wherein
simultaneous primary AN inputs to both subdivisions of
the CN are coupled by a secondary on-BF inhibitory
projection from the DCN to the AVCN via the tuberculo-
ventral tract. Key 3D concepts are presented in a sum-
mary video (Supp. Info. Video 1).
Morphological comparisonsThe first comprehensive account of vertical cells was
given by Lorente de N�o (1981). Studying Golgi-
impregnated cell types in the tuberculum acusticum
(the DCN), he described their cell bodies as being vari-
able in size and fusiform or polygonal in shape. The
cells were situated in the deep layers of the DCN;
those located farther from the strial surface tended to
be more likely to be seen sending axons into the tuber-
culoventral tract. The chief structural feature of vertical
cells is the orientation of their dendritic arbors, which
elaborate within a restricted plane that follows the per-
pendicular (vertical) axis through the laminated struc-
ture of the DCN (hence “vertical”). Later studies have
confirmed these descriptions (Osen, 1983; Zhang and
Oertel, 1993; Rhode, 1999; Kuo et al., 2012).
Our retrograde fills were not sufficient to label the
full dendritic arborization of neurons, as reported with
previous applications of retrograde markers (Saint
Marie et al., 1991). The appearance of incompletely
stained vertical cells, however, was consistent with
those earlier descriptions (Lorente de N�o, 1981; Web-
ster and Trune, 1982; Saint Marie et al., 1991; Zhang
and Oertel, 1993; Rhode, 1999), as was their distribu-
tion throughout the deep layers of the DCN (Lorente de
N�o, 1981; Webster and Trune, 1982; Saint Marie et al.,
1991). Some authors have found vertical cells to be
restricted to the lower half of the deep layer (Lorente
de N�o, 1981; Wickesberg and Oertel, 1988), but it is
possible that vertical cells had not yet finished migrat-
ing to their mature positions in their immature
specimens.
Tonotopic orientationEarly studies reported that the orientation of the den-
dritic arbors of vertical cells was parallel to that of
incoming AN fibers (Lorente de N�o, 1981). This obser-
vation was confirmed by injections in the AVCN that
labeled both projecting cells in the DCN and AN fibers
(Feng and Vater, 1985; Wickesberg and Oertel, 1988).
Vertical cells have also been shown to receive monosy-
naptic excitatory input from AN fibers (Oertel and Wu,
1989; Zhang and Oertel, 1993; Rubio and Juiz, 2004).
Given evidence that the pattern of AN input largely
determines the BF of neurons in the CN (Bourk et al.,
Figure 8. Prediction errors for CN frequency model. Top: Plot
comparing the measured and predicted BFs for each vertical cell
according to the CN frequency model (Muniak et al., 2013). The
axes have been swapped, and differences are plotted in octave
units as a function of measured BF. All points from a single injec-
tion are grouped along a horizontal line (gray Xs). Black bars and
white dots indicate mean and SD for each group. Differences
between measured and predicted BFs are generally small, sug-
gesting that vertical cells are distributed with respect to the tono-
topic pattern of AN input to the DCN (the basis of the model).
Bottom: Histogram summarizing distribution of prediction errors.
Most error values lie within a one-octave range. A Gaussian func-
tion was fit to the distribution (0.09 6 0.28 oct.).
M.A. Muniak and D.K. Ryugo
946 The Journal of Comparative Neurology |Research in Systems Neuroscience
1981; Fekete et al., 1984; Spirou et al., 1993; Ryugo
and May, 1993), it is reasonable to conclude that the
arrangement of vertical cell BFs would follow suit. We
did note that high-BF injections tended to produce
slightly greater numbers of cells in lower frequency
regions within the model. This result, however, likely is
due to the labeling of axons of passage: the trajectory
of low-BF vertical cell axons passes through high-
frequency regions in the AVCN (Cao et al., 2008).
Our results demonstrate that vertical cells are
arranged tonotopically and send projections to matched
frequency regions of the AVCN. When the locations of
labeled vertical cells were normalized in 3D, we quanti-
tatively confirmed that their arrangement was highly
organized. Cells labeled by AVCN injections at low fre-
quencies were located more anteroventrally in the
DCN, whereas those labeled by injections at progres-
sively higher frequencies were located progressively
more posterodorsally. Furthermore, comparisons with a
frequency model of the CN (Muniak et al., 2013) dem-
onstrated that the BF of each cell, inferred from the
AVCN recording site, closely matched that of AN input.
Functional implicationsVertical cells are thought to be the source of type II
responses in the DCN, categorized by their narrowly
tuned responses to tones, low spontaneous activity,
nonmonotonic rate-level functions, inhibitory sidebands,
and weak responses to broadband noise (Evans and
Nelson, 1973; Young and Brownell, 1976; Young and
Voigt, 1982; Davis et al., 1996; Spirou et al., 1999;
Rhode, 1999). Type II units can be antidromically driven
from the VCN, but not by stimulation of fibers in the
dorsal acoustic stria (Young, 1980). These results imply
that neurons with type II characteristics project within,
but not out of, the CN, consistent with anatomical
reports that vertical cells lack ascending projections
but do send local axons to the VCN (Lorente de N�o,
1981). Definitive evidence comes from intracellular
recordings and fills of neurons producing type II
responses, which reveal cells matching the morphologi-
cal descriptions of vertical cells (Rhode, 1999).
The tonotopic organization of vertical cells is consist-
ent with the cochleotopic projections of the AN into the
DCN (Ryugo and May, 1993; Muniak et al., 2013), the
presence of AN synapses onto their dendrites (Rubio
and Juiz, 2004), and excitatory synaptic inputs from
auditory nerve fibers (Kuo et al., 2012). The result
would be a tonotopic projection to AVCN neurons that
are matched in BF (Wickesberg and Oertel, 1988;
Muniak et al., 2013). This conclusion is consistent with
reports of on-BF inhibition of bushy and stellate cells in
the AVCN (Wickesberg and Oertel, 1990), in which the
blocking of inhibitory amino acid inputs to the AVCN
resulted in on-BF rate increases with little to no
increase in off-BF spiking (Caspary et al., 1994). It has
been proposed that this connection may be a disynap-
tic pathway for echo suppression (Wickesberg and Oer-
tel, 1990; Wickesberg, 1996), with the timing of the
inhibitory projection to the AVCN offset by the axon
conduction velocity and a single synaptic delay. Recent
evidence has also suggested that glycinergic inhibition
is necessary to improve the temporal precision of spike
timing in bushy and T-stellate cells, albeit on different
time scales, in order to refine the encoding of the fine
structure and envelope cues, respectively, of the acous-
tic signal (Xie and Manis, 2013). This local circuit
between the DCN and the VCN might, therefore, be
one mechanism for enhancing the fidelity of CN output.
Type II units are considered the source of near-BF
narrowband inhibition on type IV responses (Voigt and
Young, 1980, 1990). This inhibition helps to shape the
spectral tuning of DCN principal cells (Nelken and
Young, 1994; Spirou et al., 1999; Davis and Young,
2000). Recent work has shown functional synapses
from vertical cells to pyramidal cells within in vitro
slices (Kuo et al., 2012). The tonotopic distribution of
vertical cells demonstrated in the present study fits
well with this picture, and the 3D grouping of cells
associated with the same BF affirms the idea that cell
types united by a common frequency in the DCN are
organized into slabs (Spirou et al., 1993). Recon-
structed axons of at least some vertical cells are con-
strained in sheets, much like their dendrites (Rhode,
1999). Thus, the near-BF inhibition of type IV units
(pyramidal cells) by type II units is a result of the local
ramification of vertical cell axons within an isofrequency
slab. Such inhibition patterns emerge from either
narrowband stimuli or spectral notches, i.e., in narrow
frequency variations of an ongoing sound. Because
many natural sounds, including communication signals,
are characterized by distinct, time-varying changes in
their spectral peaks, the type II–type IV circuitry could
facilitate the detection of spectral features embedded
within these sounds (Nelken and Young, 1996). Overall,
these results suggest that vertical cells provide rapid
on- or near-BF inhibition to cells of both the DCN and
the AVCN, although more data are needed to
understand the function of these neurons better.
Our results suggest that there are greater absolute
numbers of low-BF vertical cells than high-BF cells. This
observation is not easily explained by injection size in
the AVCN; we found a poor relationship between the
degree of labeling in the cochlea (Muniak et al., 2013)
and vertical cell counts. If anything, one might expect
high-BF injections to produce more cells because of
Tonotopic organization of vertical cells in the DCN
The Journal of Comparative Neurology |Research in Systems Neuroscience 947
contamination of projecting axons from low-BF vertical
cells. Another explanation might be the physical expan-
sion of the low-frequency end of the DCN. In this
region, the deep layer is thicker, allowing more room
for vertical cells to proliferate. However, despite this
change in shape, our frequency model (Muniak et al.,
2013) posits roughly equal proportions of DCN volume
per cochlear segment. Hence, if vertical cells are evenly
distributed across frequencies, we should not see a
change in absolute counts, although the 3D arrange-
ment of these cells would shift from sheets to clusters
along the frequency axis. Instead, we observed both
types of change in our data.
If our uneven vertical cell counts reflect normal DCN
organization, how might this be explained functionally?
Recent work showed that the output of a single vertical
cell onto a pyramidal cell is relatively weak and that the
coordination of multiple vertical cells may be needed to
inhibit principal cell spiking (Kuo et al., 2012). There is a
tendency for type II units to have lower BFs than the
type IV units that they are suppressing (Voigt and Young,
1990), a trend also seen when glycinergic neurotransmis-
sion is blocked (Davis and Young, 2000); this result is
not surprising given the low-frequency tails of AN tuning
curves (Kiang and Moxon, 1974). The addition of more
vertical cells could be one way to adapt to greater func-
tional demands at the low end of the frequency spec-
trum, but other probable adaptive scenarios include
revised innervation patterns and/or modifications to pre-
and postsynaptic machinery.
An alternative, though not mutually exclusive, possi-
bility for the tonotopic variation in cell counts arises
from a hypothesized role of vertical cell projections to
the VCN. The tuberculoventral projection might reduce
or reverse the effects of spectral changes to complex
sounds caused by the acoustical transfer function of
the pinnae (Rice et al., 1992; Nelken and Young, 1996).
In this scenario, vertical cells may weakly inhibit VCN
neurons outside the range of spectral notches in order
to “rebalance” the sound field to its original spectral
shape. With the mouse ear, spectral notches are
observed largely in the >20-kHz range (Lauer et al.,
2011), which is where our vertical cell counts are the
lowest. Furthermore, the transfer function of the mouse
ear shows overall gains in the 10–20-kHz range (Lauer
et al., 2011), where our cell counts are higher. Hence,
the distribution of vertical cell numbers might relate to
the overall inhibitory requirements in the CN with
respect to frequency.
ACKNOWLEDGMENTSThe data in the present report have not been previously
published but did originate from tissue used in a study of
AN organization in the cochlea and cochlear nucleus
(Muniak et al., 2013). We thank Karen Montey, Alejandro
Rivas, Brad May, and Howard Francis who participated in
the original experiments. Some of the data were included
as part of a dissertation submitted in partial fulfillment of
a PhD degree in Neuroscience to the Johns Hopkins Uni-
versity (Muniak, 2011).
CONFLICT OF INTEREST STATEMENT
The authors have no conflicts of interest to report.
ROLE OF AUTHORS
Both authors had full access to all the data in the
study and take responsibility for the integrity of the
data and the accuracy of data analysis. Study concept
and design: MAM, DKR. Data acquisition, analyses, and
interpretation: MAM with guidance from DKR. Drafting
of the manuscript: MAM, DKR.
LITERATURE CITEDBourk TR, Mielcarz JP, Norris BE. 1981. Tonotopic organization
of the anteroventral cochlear nucleus of the cat. HearRes 4:215–241.
Brawer JR, Morest DK, Kane EC. 1974. The neuronal architec-ture of the cochlear nucleus of the cat. J Comp Neurol155:251–300.
Burian M, Gstoettner W. 1988. Projection of primary vestibu-lar afferent fibers to the cochlear nucleus in the guineapig. Neurosci Lett 84:13–17.
Caicedo A, Herbert H. 1993. Topography of descending pro-jections from the inferior colliculus to auditory brainstemnuclei in the rat. J Comp Neurol 328:377–392.
Cao XJ, McGinley MJ, Oertel D. 2008. Connections and synap-tic function in the posteroventral cochlear nucleus ofdeaf jerker mice. J Comp Neurol 510:297–308.
Caspary DM, Backoff PM, Finlayson PG, Palombi PS. 1994.Inhibitory inputs modulate discharge rate within fre-quency receptive fields of anteroventral cochlear nucleusneurons. J Neurophysiol 72:2124–2133.
Davis KA, Young ED. 2000. Pharmacological evidence of inhib-itory and disinhibitory neuronal circuits in dorsal cochlearnucleus. J Neurophysiol 83:926–940.
Davis KA, Ding J, Benson TE, Voigt HF. 1996. Response proper-ties of units in the dorsal cochlear nucleus of unanesthe-tized decerebrate gerbil. J Neurophysiol 75:1411–1431.
Evans EF, Nelson PG. 1973. The responses of single neuronesin the cochlear nucleus of the cat as a function of theirlocation and the anaesthetic state. Exp Brain Res 17:402–427.
Fekete DM, Rouiller EM, Liberman MC, Ryugo DK. 1984. Thecentral projections of intracellularly labeled auditorynerve fibers in cats. J Comp Neurol 229:432–450.
Feng AS, Vater M. 1985. Functional organization of the coch-lear nucleus of rufous horseshoe bats (Rhinolophusrouxi): frequencies and internal connections are arrangedin slabs. J Comp Neurol 235:529–553.
Franklin KBJ, Paxinos G. 1997. The mouse brain in stereotaxiccoordinates. San Diego: Academic Press.
Haenggeli CA, Pongstaporn T, Doucet JR, Ryugo DK. 2005. Pro-jections from the spinal trigeminal nucleus to the cochlearnucleus in the rat. J Comp Neurol 484:191–205.
M.A. Muniak and D.K. Ryugo
948 The Journal of Comparative Neurology |Research in Systems Neuroscience
Itoh K, Kamiya H, Mitani A, Yasui Y, Takada M, Mizuno N.1987. Direct projections from the dorsal column nucleiand the spinal trigeminal nuclei to the cochlear nuclei inthe cat. Brain Res 400:145–150.
Kanold PO, Young ED. 2001. Proprioceptive information fromthe pinna provides somatosensory input to cat dorsalcochlear nucleus. J Neurosci 21:7848–7858.
Kiang NY, Moxon EC. 1974. Tails of tuning curves of auditory-nerve fibers. J Acoust Soc Am 55:620–630.
Kuo SP, Lu HW, Trussell LO. 2012. Intrinsic and synapticproperties of vertical cells of the mouse dorsal cochlearnucleus. J Neurophysiol 108:1186–1198.
Lauer AM, Slee SJ, May BJ. 2011. Acoustic basis of directionalacuity in laboratory mice. J Assoc Res Otolaryngol 12:633–645.
Lorente de N�o R. 1981. The primary acoustic nuclei. NewYork: Raven Press.
Ma WL, Brenowitz SD. 2012. Single-neuron recordings fromunanesthetized mouse dorsal cochlear nucleus. J Neuro-physiol 107:824–835.
Malmierca MS, Le Beau FE, Rees A. 1996. The topographicalorganization of descending projections from the centralnucleus of the inferior colliculus in guinea pig. Hear Res93:167–180.
Malmierca MS, Merchan MA, Henkel CK, Oliver DL. 2002.Direct projections from cochlear nuclear complex to audi-tory thalamus in the rat. J Neurosci 22:10891–10897.
Meltzer NE, Ryugo DK. 2006. Projections from auditory cortex tocochlear nucleus: a comparative analysis of rat and mouse.Anat Rec A Discov Mol Cell Evol Biol 288:397–408.
Muniak MA. 2011. Anatomical and physiological bases of fre-quency organization in the mouse auditory brainstem.Baltimore: Johns Hopkins University.
Muniak MA, Rivas A, Montey KL, May BJ, Francis HW, RyugoDK. 2013. 3D model of frequency representation in thecochlear nucleus of the CBA/J mouse. J Comp Neurol521:1510–1532.
Nelken I, Young ED. 1994. Two separate inhibitory mecha-nisms shape the responses of dorsal cochlear nucleustype IV units to narrowband and wideband stimuli. J Neu-rophysiol 71:2446–2462.
Nelken I, Young ED. 1996. Why do cats need a dorsal coch-lear nucleus? J Basic Clin Physiol Pharmacol 7:199–220.
Oertel D, Wu SH. 1989. Morphology and physiology of cells inslice preparations of the dorsal cochlear nucleus ofmice. J Comp Neurol 283:228–247.
Ohlrogge M, Doucet JR, Ryugo DK. 2001. Projections of thepontine nuclei to the cochlear nucleus in rats. J CompNeurol 436:290–303.
Osen KK. 1969. Cytoarchitecture of the cochlear nuclei in thecat. J Comp Neurol 136:453–484.
Osen KK. 1972. Projection of the cochlear nuclei on the infe-rior colliculus in the cat. J Comp Neurol 144:355–372.
Osen KK. 1983. Orientation of dendritic arbors studied inGolgi sections of the cat dorsal cochlear nucleus. In:Webster WR, Aitkin LM, editors. Mechanisms of hearing.Clayton, Australia: Monash University Press. p 83–89.
Rhode WS. 1999. Vertical cell responses to sound in cat dor-sal cochlear nucleus. J Neurophysiol 82:1019–1032.
Rice JJ, May BJ, Spirou GA, Young ED. 1992. Pinna-basedspectral cues for sound localization in cat. Hear Res 58:132–152.
Rubio ME, Juiz JM. 2004. Differential distribution of synapticendings containing glutamate, glycine, and GABA in therat dorsal cochlear nucleus. J Comp Neurol 477:253–272.
Ryugo DK, May SK. 1993. The projections of intracellularlylabeled auditory nerve fibers to the dorsal cochlearnucleus of cats. J Comp Neurol 329:20–35.
Ryugo DK, Willard FH, Fekete DM. 1981. Differential afferentprojections to the inferior colliculus from the cochlearnucleus in the albino mouse. Brain Res 210:342–349.
Saint Marie RL, Benson CG, Ostapoff EM, Morest DK. 1991.Glycine immunoreactive projections from the dorsal tothe anteroventral cochlear nucleus. Hear Res 51:11–28.
Spirou GA, May BJ, Wright DD, Ryugo DK. 1993. Frequencyorganization of the dorsal cochlear nucleus in cats. JComp Neurol 329:36–52.
Spirou GA, Davis KA, Nelken I, Young ED. 1999. Spectral inte-gration by type II interneurons in dorsal cochlearnucleus. J Neurophysiol 82:648–663.
Voigt HF, Young ED. 1980. Evidence of inhibitory interactionsbetween neurons in dorsal cochlear nucleus. J Neurophy-siol 44:76–96.
Voigt HF, Young ED. 1990. Cross-correlation analysis of inhibi-tory interactions in dorsal cochlear nucleus. J Neurophy-siol 64:1590–1610.
Webster DB, Trune DR. 1982. Cochlear nuclear complex ofmice. Am J Anat 163:103–130.
Weedman DL, Ryugo DK. 1996. Pyramidal cells in primaryauditory cortex project to cochlear nucleus in rat. BrainRes 706:97–102.
Weinberg RJ, Rustioni A. 1987. A cuneocochlear pathway inthe rat. Neuroscience 20:209–219.
Wenthold RJ. 1987. Evidence for a glycinergic pathway con-necting the two cochlear nuclei: an immunocytochemicaland retrograde transport study. Brain Res 415:183–187.
Wickesberg RE. 1996. Rapid inhibition in the cochlear nuclearcomplex of the chinchilla. J Acoust Soc Am 100:1691–1702.
Wickesberg RE, Oertel D. 1988. Tonotopic projection from thedorsal to the anteroventral cochlear nucleus of mice. JComp Neurol 268:389–399.
Wickesberg RE, Oertel D. 1990. Delayed, frequency-specificinhibition in the cochlear nuclei of mice: a mechanismfor monaural echo suppression. J Neurosci 10:1762–1768.
Wickesberg RE, Whitlon D, Oertel D. 1994. In vitro modulationof somatic glycine-like immunoreactivity in presumed gly-cinergic neurons. J Comp Neurol 339:311–327.
Wright DD, Ryugo DK. 1996. Mossy fiber projections from thecuneate nucleus to the cochlear nucleus in the rat. JComp Neurol 365:159–172.
Xie X, Manis PB. 2013. Target-specific IPSC kinetics promotetemporal processing in auditory parallel pathways. J Neu-rosci 33:1598–1614.
Young ED. 1980. Identification of response properties ofascending axons from dorsal cochlear nucleus. Brain Res200:23–37.
Young ED, Brownell WE. 1976. Responses to tones and noiseof single cells in dorsal cochlear nucleus of unanesthe-tized cats. J Neurophysiol 39:282–300.
Young ED, Oertel D. 2003. The cochlear nucleus. In: ShepherdGM, editor. The synaptic organization of the brain, 5thed. New York: Oxford University Press. p 125–163.
Young ED, Voigt HF. 1982. Response properties of type II andtype III units in dorsal cochlear nucleus. Hear Res 6:153–169.
Young ED, Nelken I, Conley RA. 1995. Somatosensory effectson neurons in dorsal cochlear nucleus. J Neurophysiol73:743–765.
Zhan X, Ryugo DK. 2007. Projections of the lateral reticularnucleus to the cochlear nucleus in rats. J Comp Neurol504:583–598.
Zhang S, Oertel D. 1993. Tuberculoventral cells of the dorsalcochlear nucleus of mice: intracellular recordings in sli-ces. J Neurophysiol 69:1409–1421.
Tonotopic organization of vertical cells in the DCN
The Journal of Comparative Neurology |Research in Systems Neuroscience 949
Copyright © 2022 FDOKUMEN