Distillation Decoupling: A New Procedure For Two Point Composition Control
HUMAN NEUROSCIENCEORIGINAL RESEARCH ARTICLE
published: 13 September 2013doi: 10.3389/fnhum.2013.00579
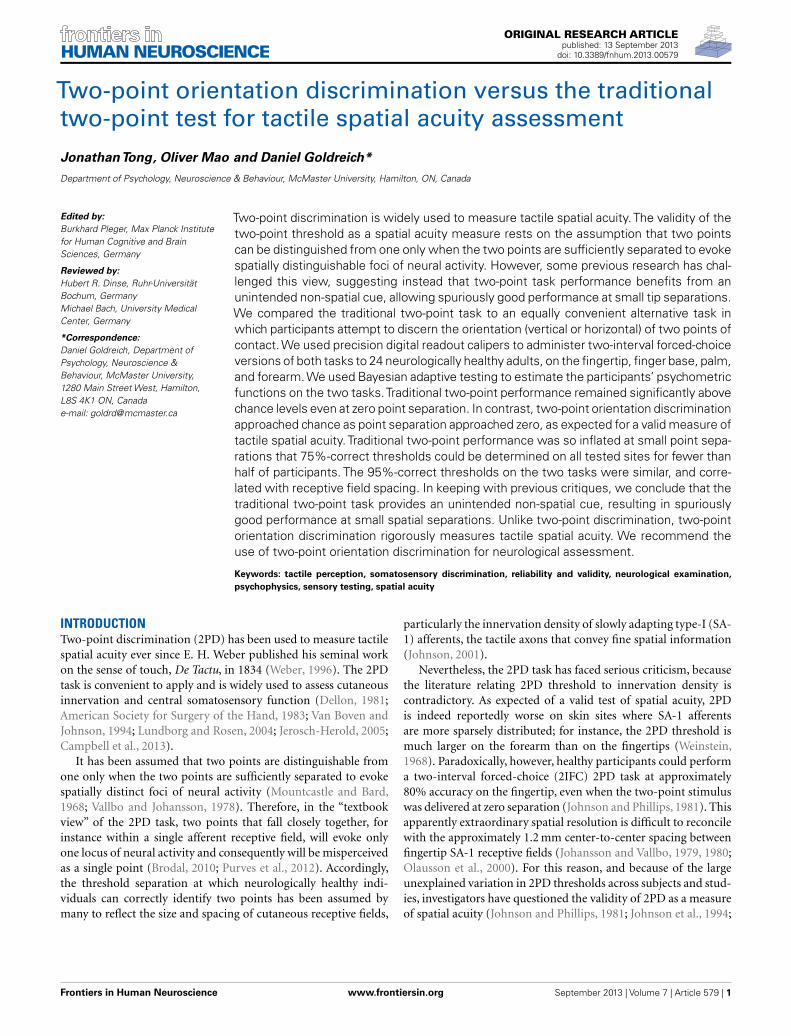
Two-point orientation discrimination versus the traditionaltwo-point test for tactile spatial acuity assessmentJonathanTong, Oliver Mao and Daniel Goldreich*
Department of Psychology, Neuroscience & Behaviour, McMaster University, Hamilton, ON, Canada
Edited by:Burkhard Pleger, Max Planck Institutefor Human Cognitive and BrainSciences, Germany
Reviewed by:Hubert R. Dinse, Ruhr-UniversitätBochum, GermanyMichael Bach, University MedicalCenter, Germany
*Correspondence:Daniel Goldreich, Department ofPsychology, Neuroscience &Behaviour, McMaster University,1280 Main Street West, Hamilton,L8S 4K1 ON, Canadae-mail: [email protected]
Two-point discrimination is widely used to measure tactile spatial acuity.The validity of thetwo-point threshold as a spatial acuity measure rests on the assumption that two pointscan be distinguished from one only when the two points are sufficiently separated to evokespatially distinguishable foci of neural activity. However, some previous research has chal-lenged this view, suggesting instead that two-point task performance benefits from anunintended non-spatial cue, allowing spuriously good performance at small tip separations.We compared the traditional two-point task to an equally convenient alternative task inwhich participants attempt to discern the orientation (vertical or horizontal) of two points ofcontact. We used precision digital readout calipers to administer two-interval forced-choiceversions of both tasks to 24 neurologically healthy adults, on the fingertip, finger base, palm,and forearm.We used Bayesian adaptive testing to estimate the participants’ psychometricfunctions on the two tasks.Traditional two-point performance remained significantly abovechance levels even at zero point separation. In contrast, two-point orientation discriminationapproached chance as point separation approached zero, as expected for a valid measure oftactile spatial acuity.Traditional two-point performance was so inflated at small point sepa-rations that 75%-correct thresholds could be determined on all tested sites for fewer thanhalf of participants. The 95%-correct thresholds on the two tasks were similar, and corre-lated with receptive field spacing. In keeping with previous critiques, we conclude that thetraditional two-point task provides an unintended non-spatial cue, resulting in spuriouslygood performance at small spatial separations. Unlike two-point discrimination, two-pointorientation discrimination rigorously measures tactile spatial acuity. We recommend theuse of two-point orientation discrimination for neurological assessment.
Keywords: tactile perception, somatosensory discrimination, reliability and validity, neurological examination,psychophysics, sensory testing, spatial acuity
INTRODUCTIONTwo-point discrimination (2PD) has been used to measure tactilespatial acuity ever since E. H. Weber published his seminal workon the sense of touch, De Tactu, in 1834 (Weber, 1996). The 2PDtask is convenient to apply and is widely used to assess cutaneousinnervation and central somatosensory function (Dellon, 1981;American Society for Surgery of the Hand, 1983; Van Boven andJohnson, 1994; Lundborg and Rosen, 2004; Jerosch-Herold, 2005;Campbell et al., 2013).
It has been assumed that two points are distinguishable fromone only when the two points are sufficiently separated to evokespatially distinct foci of neural activity (Mountcastle and Bard,1968; Vallbo and Johansson, 1978). Therefore, in the “textbookview” of the 2PD task, two points that fall closely together, forinstance within a single afferent receptive field, will evoke onlyone locus of neural activity and consequently will be misperceivedas a single point (Brodal, 2010; Purves et al., 2012). Accordingly,the threshold separation at which neurologically healthy indi-viduals can correctly identify two points has been assumed bymany to reflect the size and spacing of cutaneous receptive fields,
particularly the innervation density of slowly adapting type-I (SA-1) afferents, the tactile axons that convey fine spatial information(Johnson, 2001).
Nevertheless, the 2PD task has faced serious criticism, becausethe literature relating 2PD threshold to innervation density iscontradictory. As expected of a valid test of spatial acuity, 2PDis indeed reportedly worse on skin sites where SA-1 afferentsare more sparsely distributed; for instance, the 2PD threshold ismuch larger on the forearm than on the fingertips (Weinstein,1968). Paradoxically, however, healthy participants could performa two-interval forced-choice (2IFC) 2PD task at approximately80% accuracy on the fingertip, even when the two-point stimuluswas delivered at zero separation (Johnson and Phillips, 1981). Thisapparently extraordinary spatial resolution is difficult to reconcilewith the approximately 1.2 mm center-to-center spacing betweenfingertip SA-1 receptive fields (Johansson and Vallbo, 1979, 1980;Olausson et al., 2000). For this reason, and because of the largeunexplained variation in 2PD thresholds across subjects and stud-ies, investigators have questioned the validity of 2PD as a measureof spatial acuity (Johnson and Phillips, 1981; Johnson et al., 1994;
Frontiers in Human Neuroscience www.frontiersin.org September 2013 | Volume 7 | Article 579 | 1

Tong et al. Two-point orientation discrimination
Stevens and Patterson, 1995; Craig and Johnson, 2000; Lundborgand Rosen, 2004).
One plausible explanation for a measured 2PD threshold thatfalls well under the receptor spacing is that participants are able toexploit a non-spatial cue to perform the 2PD task (Craig and John-son, 2000). Indeed, two closely spaced points elicit fewer actionpotentials in the underlying SA-1 afferents than does a single pointof equal indentation (Vega-Bermudez and Johnson, 1999). For thisreason, perhaps the brain need not discern the spatial profile ofthe neural activity evoked by a stimulus, but rather only the overallresponse magnitude (e.g., total number of action potentials in theafferent population), in order to reliably perform the task. If thiswere the case, participants would be able to infer whether a stimu-lus consisted of two closely spaced points or one without actuallyperceiving two distinct points pressing against the skin. As a con-sequence, the 2PD task would be prone to yield spuriously goodspatial acuity measurements, and some sensory deficits would goundetected, underestimated, or inaccurately quantified by 2PDtesting, as reported (Van Boven and Johnson, 1994; van Nes et al.,2008).
As others have noted, the continuing popularity of 2PD testingowes largely to the absence of an equally convenient but rigorousalternative task (Lundborg and Rosen, 2004). Here, we investigatedone such alternative task, two-point orientation discrimination(2POD), in which the participant must discriminate the orienta-tion (horizontal vs. vertical) of two points of contact. Because theparticipant is stimulated always with two points, we hypothesizedthat neural magnitude cues would be absent from this task. The2POD task would therefore force the participant to rely entirelyon the perceived spatial profile of the evoked neural activity, pro-viding a pure measure of spatial acuity. To test our hypothesis,we measured the performance of the same participants on two-interval forced-choice versions of both tasks, on four body sites:fingertip, finger base, palm, and forearm.
MATERIALS AND METHODSPARTICIPANTSTwenty-four neurologically healthy participants (18–26 years old,median age 21 years,14 men,22 right-handed) were recruited fromthe McMaster University community. Participants were screenedby survey to ensure they did not have conditions that couldadversely affect their tactile sensitivity (e.g., diabetes, carpal tun-nel syndrome, calluses, or injuries on tested skin areas) or per-ceptual processing (dyslexia, attention deficit disorder, learningdisability, central nervous system disorders) (Grant et al., 1999).Signed, informed consent was obtained from each participant.The McMaster University Research Ethics Board approved allprocedures.
SENSORY TESTINGThe participant’s right hand and forearm rested comfortably on atowel spread over a desktop, with the palm facing upwards. A par-tially open box with a cutout for the arm obscured the participant’sview while leaving the arm visible and accessible to the experi-menter. The tactile stimuli were the tip(s) of an Absolute Digimaticcalipers (Mitutoyo Corp.) (Figure 1A). The width of each tip wasapproximately 0.25 mm and the thickness approximately 0.5 mm;
FIGURE 1 | Calipers. (A) The calipers used in the study, opened to a tipseparation of 4.5 mm. (B) Magnified images of the caliper tips above ascale with marks at 0.5 mm intervals. Top: closed caliper tips (0 mmseparation); bottom: tips opened to 2.0 mm separation.
thus, when fully closed, the caliper tips formed a 0.5 mm by 0.5 mmsquare contact surface on the skin (Figure 1B). The experimenterlightly pressed the caliper against the skin, ensuring visually thatthe skin did not indent so much as to contact the edge of thecaliper jaw; estimated skin indentation was ≤2 mm. The partici-pants did not report any discomfort with the application of stimuli.We purposefully used hand-held calipers, rather than automatedequipment, in order to reproduce the manual application typicallyused in clinics.
We tested the participants on four skin sites on the right handand arm: index fingertip pad, index finger base pad, palm (thenareminence), and volar surface of the forearm (Figure 2A). Eachparticipant was tested with both the 2IFC 2PD task (Figure 2B)and the 2IFC 2POD task (Figure 2C) on every skin site (twotasks× four skin sites= 8 testing blocks of 50-trials each, for atotal of 400 trials per participant). One of the 24 possible skin-siteorders (four-factorial) was randomly assigned to each of the par-ticipants. Following the assigned order, the participant was testedsequentially on the four skin sites, first with one task (testing blocks1–4), then again in the same order with the other task (testingblocks 5–8). Twelve of the participants were tested first with the2PD task, and the other 12 first with the 2POD task.
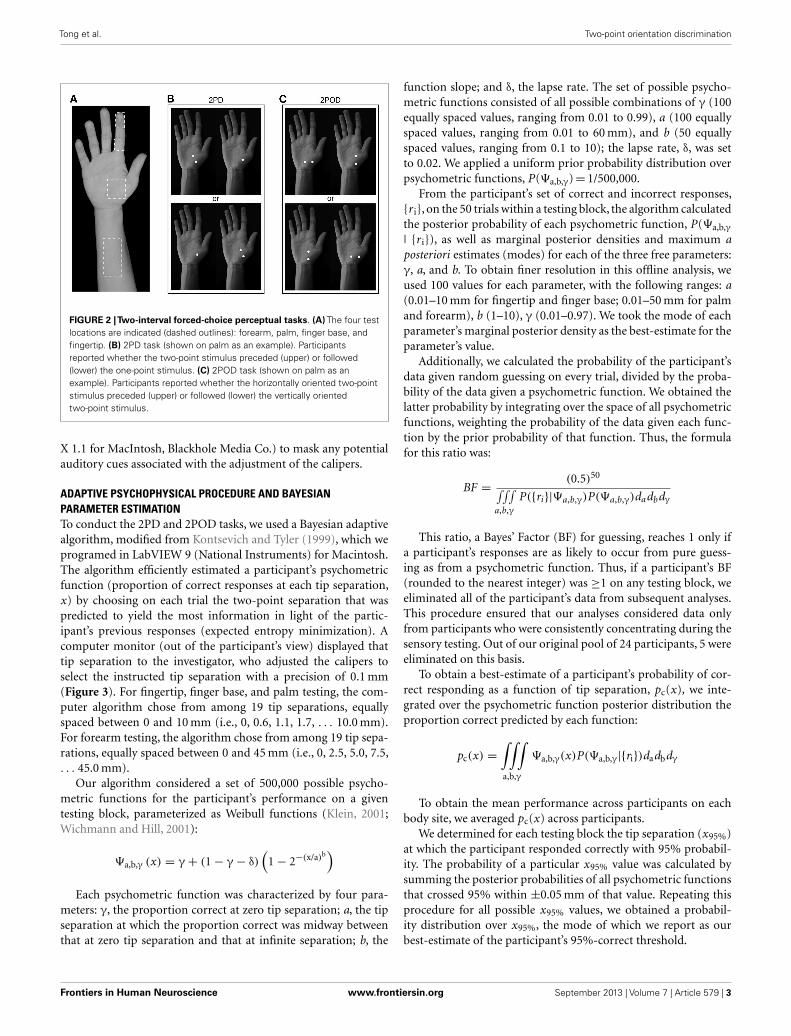
In the 2PD task (Figure 2B), on each trial we indented thecalipers approximately 2 mm into the skin surface, once with justone tip (the one-point stimulus) and once with both tips (the two-point stimulus), in randomized order. The two-point stimulus wasoriented diagonally (i.e., at±45-degrees relative to the long axis ofthe arm, with equal probability). Participants indicated whetherthey perceived the two-point stimulus before or after the one-pointstimulus.
In the 2POD task (Figure 2C), on each trial we indented thecalipers approximately 2 mm into the skin surface, once with twopoints oriented parallel (vertical) and once with two points ori-ented perpendicular (horizontal) to the long axis of the arm,in randomized order. Participants indicated whether they per-ceived the horizontally oriented points before or after the verticallyoriented points.
In all tests, participants registered their responses by press-ing one of two buttons on a wireless remote (Kensington, model33374) held with the left hand. Feedback was not provided. Dur-ing all tests, pink noise was played over computer speakers (Noise
Frontiers in Human Neuroscience www.frontiersin.org September 2013 | Volume 7 | Article 579 | 2
Tong et al. Two-point orientation discrimination
FIGURE 2 |Two-interval forced-choice perceptual tasks. (A) The four testlocations are indicated (dashed outlines): forearm, palm, finger base, andfingertip. (B) 2PD task (shown on palm as an example). Participantsreported whether the two-point stimulus preceded (upper) or followed(lower) the one-point stimulus. (C) 2POD task (shown on palm as anexample). Participants reported whether the horizontally oriented two-pointstimulus preceded (upper) or followed (lower) the vertically orientedtwo-point stimulus.
X 1.1 for MacIntosh, Blackhole Media Co.) to mask any potentialauditory cues associated with the adjustment of the calipers.
ADAPTIVE PSYCHOPHYSICAL PROCEDURE AND BAYESIANPARAMETER ESTIMATIONTo conduct the 2PD and 2POD tasks, we used a Bayesian adaptivealgorithm, modified from Kontsevich and Tyler (1999), which weprogramed in LabVIEW 9 (National Instruments) for Macintosh.The algorithm efficiently estimated a participant’s psychometricfunction (proportion of correct responses at each tip separation,x) by choosing on each trial the two-point separation that waspredicted to yield the most information in light of the partic-ipant’s previous responses (expected entropy minimization). Acomputer monitor (out of the participant’s view) displayed thattip separation to the investigator, who adjusted the calipers toselect the instructed tip separation with a precision of 0.1 mm(Figure 3). For fingertip, finger base, and palm testing, the com-puter algorithm chose from among 19 tip separations, equallyspaced between 0 and 10 mm (i.e., 0, 0.6, 1.1, 1.7, . . . 10.0 mm).For forearm testing, the algorithm chose from among 19 tip sepa-rations, equally spaced between 0 and 45 mm (i.e., 0, 2.5, 5.0, 7.5,. . . 45.0 mm).
Our algorithm considered a set of 500,000 possible psycho-metric functions for the participant’s performance on a giventesting block, parameterized as Weibull functions (Klein, 2001;Wichmann and Hill, 2001):
Ψa,b,γ (x) = γ+ (1− γ− δ)(
1− 2−(x/a)b)
Each psychometric function was characterized by four para-meters: γ, the proportion correct at zero tip separation; a, the tipseparation at which the proportion correct was midway betweenthat at zero tip separation and that at infinite separation; b, the
function slope; and δ, the lapse rate. The set of possible psycho-metric functions consisted of all possible combinations of γ (100equally spaced values, ranging from 0.01 to 0.99), a (100 equallyspaced values, ranging from 0.01 to 60 mm), and b (50 equallyspaced values, ranging from 0.1 to 10); the lapse rate, δ, was setto 0.02. We applied a uniform prior probability distribution overpsychometric functions, P(Ψa,b,γ)= 1/500,000.
From the participant’s set of correct and incorrect responses,{r i}, on the 50 trials within a testing block, the algorithm calculatedthe posterior probability of each psychometric function, P(Ψa,b,γ
| {r i}), as well as marginal posterior densities and maximum aposteriori estimates (modes) for each of the three free parameters:γ, a, and b. To obtain finer resolution in this offline analysis, weused 100 values for each parameter, with the following ranges: a(0.01–10 mm for fingertip and finger base; 0.01–50 mm for palmand forearm), b (1–10), γ (0.01–0.97). We took the mode of eachparameter’s marginal posterior density as the best-estimate for theparameter’s value.
Additionally, we calculated the probability of the participant’sdata given random guessing on every trial, divided by the proba-bility of the data given a psychometric function. We obtained thelatter probability by integrating over the space of all psychometricfunctions, weighting the probability of the data given each func-tion by the prior probability of that function. Thus, the formulafor this ratio was:
BF =(0.5)50∫∫∫
a,b,γ
P({ri}|Ψa,b,γ)P(Ψa,b,γ)dadbdγ
This ratio, a Bayes’ Factor (BF) for guessing, reaches 1 only ifa participant’s responses are as likely to occur from pure guess-ing as from a psychometric function. Thus, if a participant’s BF(rounded to the nearest integer) was ≥1 on any testing block, weeliminated all of the participant’s data from subsequent analyses.This procedure ensured that our analyses considered data onlyfrom participants who were consistently concentrating during thesensory testing. Out of our original pool of 24 participants, 5 wereeliminated on this basis.
To obtain a best-estimate of a participant’s probability of cor-rect responding as a function of tip separation, pc(x), we inte-grated over the psychometric function posterior distribution theproportion correct predicted by each function:
pc(x) =
∫∫∫a,b,γ
Ψa,b,γ(x)P(Ψa,b,γ|{ri})dadbdγ
To obtain the mean performance across participants on eachbody site, we averaged pc(x) across participants.
We determined for each testing block the tip separation (x95%)at which the participant responded correctly with 95% probabil-ity. The probability of a particular x95% value was calculated bysumming the posterior probabilities of all psychometric functionsthat crossed 95% within ±0.05 mm of that value. Repeating thisprocedure for all possible x95% values, we obtained a probabil-ity distribution over x95%, the mode of which we report as ourbest-estimate of the participant’s 95%-correct threshold.
Frontiers in Human Neuroscience www.frontiersin.org September 2013 | Volume 7 | Article 579 | 3

Tong et al. Two-point orientation discrimination
FIGURE 3 | Bayesian adaptive testing procedure. Plots illustrate thetrial-by-trial performance (upper) and gamma parameter posterior density(lower) for experiments done on the finger base of one participant. (A) 2PDtask. (B) 2POD task. Crosses represent incorrect responses; circles, correctresponses. Note that, at zero mm tip separation, this participant answered
correctly on 21/25=84% of 2PD trials, compared to 6/13=46% of 2PODtrials. The Bayesian adaptive procedure does not follow a preset stimulussequence or simple staircase algorithm, but rather selects the separation oneach trial that is expected to provide the most information regarding theshape of the participant’s psychometric function.
FIGURE 4 | Mean performance by task and body site. Proportion correct versus caliper tip separation on (A) 2PD and (B) 2POD. Data points are meansacross all participants. For illustration purposes, all curves have been extended to 40 mm on the x -axis.
DATA ANALYSISAnalyses of variance (ANOVA), t -tests, chi-square tests, and corre-lations were performed with SPSS v20 (IBM Corp.) for MacIntosh,using an alpha-level of 0.05. We report two-tailed p-values. TheANOVA model was full-factorial type III sum-of-squares.
RESULTS2POD BUT NOT 2PD APPROACHED 50%-CORRECT AT ZERO TIPSEPARATIONThe mean performance for each task at each body site is shownin Figure 4. In accord with our prediction, the psychometric
functions for the two tasks clearly differed in their percent-correctperformance at zero tip separation, with performance being closeto chance (50%-correct) for the 2POD but not the 2PD task.
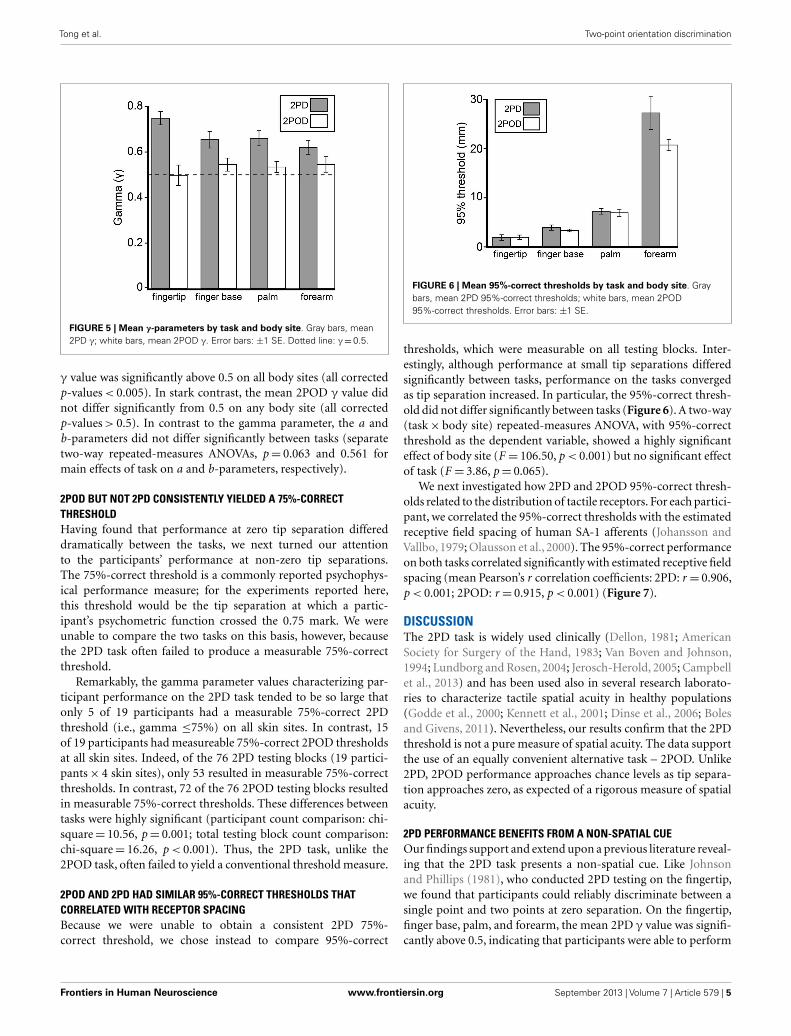
This observation was confirmed by an analysis of the psy-chometric function gamma parameter (performance at zero tipseparation) (Figure 5). A two-way (task× body site) repeated-measures ANOVA, with γ as the dependent variable, revealed ahighly significant effect of task (F = 26.35, p < 0.001) with no sig-nificant effect of body site (F = 0.60, p= 0.618) or task-by-bodysite interaction (F = 2.52, p= 0.068). Four post hoc one-samplet-tests with Bonferroni correction revealed that the mean 2PD
Frontiers in Human Neuroscience www.frontiersin.org September 2013 | Volume 7 | Article 579 | 4
Tong et al. Two-point orientation discrimination
FIGURE 5 | Mean γ-parameters by task and body site. Gray bars, mean2PD γ; white bars, mean 2POD γ. Error bars: ±1 SE. Dotted line: γ=0.5.
γ value was significantly above 0.5 on all body sites (all correctedp-values < 0.005). In stark contrast, the mean 2POD γ value didnot differ significantly from 0.5 on any body site (all correctedp-values > 0.5). In contrast to the gamma parameter, the a andb-parameters did not differ significantly between tasks (separatetwo-way repeated-measures ANOVAs, p= 0.063 and 0.561 formain effects of task on a and b-parameters, respectively).
2POD BUT NOT 2PD CONSISTENTLY YIELDED A 75%-CORRECTTHRESHOLDHaving found that performance at zero tip separation differeddramatically between the tasks, we next turned our attentionto the participants’ performance at non-zero tip separations.The 75%-correct threshold is a commonly reported psychophys-ical performance measure; for the experiments reported here,this threshold would be the tip separation at which a partic-ipant’s psychometric function crossed the 0.75 mark. We wereunable to compare the two tasks on this basis, however, becausethe 2PD task often failed to produce a measurable 75%-correctthreshold.
Remarkably, the gamma parameter values characterizing par-ticipant performance on the 2PD task tended to be so large thatonly 5 of 19 participants had a measurable 75%-correct 2PDthreshold (i.e., gamma ≤75%) on all skin sites. In contrast, 15of 19 participants had measureable 75%-correct 2POD thresholdsat all skin sites. Indeed, of the 76 2PD testing blocks (19 partici-pants× 4 skin sites), only 53 resulted in measurable 75%-correctthresholds. In contrast, 72 of the 76 2POD testing blocks resultedin measurable 75%-correct thresholds. These differences betweentasks were highly significant (participant count comparison: chi-square= 10.56, p= 0.001; total testing block count comparison:chi-square= 16.26, p < 0.001). Thus, the 2PD task, unlike the2POD task, often failed to yield a conventional threshold measure.
2POD AND 2PD HAD SIMILAR 95%-CORRECT THRESHOLDS THATCORRELATED WITH RECEPTOR SPACINGBecause we were unable to obtain a consistent 2PD 75%-correct threshold, we chose instead to compare 95%-correct
FIGURE 6 | Mean 95%-correct thresholds by task and body site. Graybars, mean 2PD 95%-correct thresholds; white bars, mean 2POD95%-correct thresholds. Error bars: ±1 SE.
thresholds, which were measurable on all testing blocks. Inter-estingly, although performance at small tip separations differedsignificantly between tasks, performance on the tasks convergedas tip separation increased. In particular, the 95%-correct thresh-old did not differ significantly between tasks (Figure 6). A two-way(task× body site) repeated-measures ANOVA, with 95%-correctthreshold as the dependent variable, showed a highly significanteffect of body site (F = 106.50, p < 0.001) but no significant effectof task (F = 3.86, p= 0.065).
We next investigated how 2PD and 2POD 95%-correct thresh-olds related to the distribution of tactile receptors. For each partici-pant, we correlated the 95%-correct thresholds with the estimatedreceptive field spacing of human SA-1 afferents (Johansson andVallbo, 1979; Olausson et al., 2000). The 95%-correct performanceon both tasks correlated significantly with estimated receptive fieldspacing (mean Pearson’s r correlation coefficients: 2PD: r = 0.906,p < 0.001; 2POD: r = 0.915, p < 0.001) (Figure 7).
DISCUSSIONThe 2PD task is widely used clinically (Dellon, 1981; AmericanSociety for Surgery of the Hand, 1983; Van Boven and Johnson,1994; Lundborg and Rosen, 2004; Jerosch-Herold, 2005; Campbellet al., 2013) and has been used also in several research laborato-ries to characterize tactile spatial acuity in healthy populations(Godde et al., 2000; Kennett et al., 2001; Dinse et al., 2006; Bolesand Givens, 2011). Nevertheless, our results confirm that the 2PDthreshold is not a pure measure of spatial acuity. The data supportthe use of an equally convenient alternative task – 2POD. Unlike2PD, 2POD performance approaches chance levels as tip separa-tion approaches zero, as expected of a rigorous measure of spatialacuity.
2PD PERFORMANCE BENEFITS FROM A NON-SPATIAL CUEOur findings support and extend upon a previous literature reveal-ing that the 2PD task presents a non-spatial cue. Like Johnsonand Phillips (1981), who conducted 2PD testing on the fingertip,we found that participants could reliably discriminate between asingle point and two points at zero separation. On the fingertip,finger base, palm, and forearm, the mean 2PD γ value was signifi-cantly above 0.5, indicating that participants were able to perform
Frontiers in Human Neuroscience www.frontiersin.org September 2013 | Volume 7 | Article 579 | 5
Tong et al. Two-point orientation discrimination
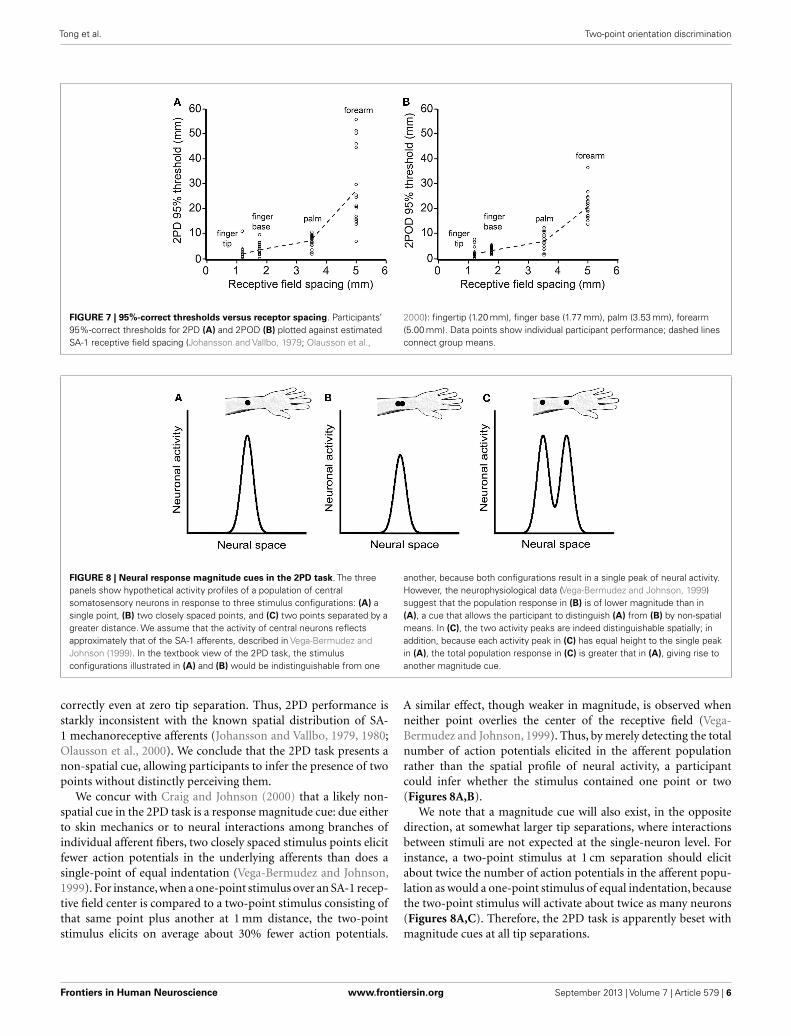
FIGURE 7 | 95%-correct thresholds versus receptor spacing. Participants’95%-correct thresholds for 2PD (A) and 2POD (B) plotted against estimatedSA-1 receptive field spacing (Johansson and Vallbo, 1979; Olausson et al.,
2000): fingertip (1.20 mm), finger base (1.77 mm), palm (3.53 mm), forearm(5.00 mm). Data points show individual participant performance; dashed linesconnect group means.
FIGURE 8 | Neural response magnitude cues in the 2PD task. The threepanels show hypothetical activity profiles of a population of centralsomatosensory neurons in response to three stimulus configurations: (A) asingle point, (B) two closely spaced points, and (C) two points separated by agreater distance. We assume that the activity of central neurons reflectsapproximately that of the SA-1 afferents, described in Vega-Bermudez andJohnson (1999). In the textbook view of the 2PD task, the stimulusconfigurations illustrated in (A) and (B) would be indistinguishable from one
another, because both configurations result in a single peak of neural activity.However, the neurophysiological data (Vega-Bermudez and Johnson, 1999)suggest that the population response in (B) is of lower magnitude than in(A), a cue that allows the participant to distinguish (A) from (B) by non-spatialmeans. In (C), the two activity peaks are indeed distinguishable spatially; inaddition, because each activity peak in (C) has equal height to the single peakin (A), the total population response in (C) is greater that in (A), giving rise toanother magnitude cue.
correctly even at zero tip separation. Thus, 2PD performance isstarkly inconsistent with the known spatial distribution of SA-1 mechanoreceptive afferents (Johansson and Vallbo, 1979, 1980;Olausson et al., 2000). We conclude that the 2PD task presents anon-spatial cue, allowing participants to infer the presence of twopoints without distinctly perceiving them.
We concur with Craig and Johnson (2000) that a likely non-spatial cue in the 2PD task is a response magnitude cue: due eitherto skin mechanics or to neural interactions among branches ofindividual afferent fibers, two closely spaced stimulus points elicitfewer action potentials in the underlying afferents than does asingle-point of equal indentation (Vega-Bermudez and Johnson,1999). For instance,when a one-point stimulus over an SA-1 recep-tive field center is compared to a two-point stimulus consisting ofthat same point plus another at 1 mm distance, the two-pointstimulus elicits on average about 30% fewer action potentials.
A similar effect, though weaker in magnitude, is observed whenneither point overlies the center of the receptive field (Vega-Bermudez and Johnson, 1999). Thus, by merely detecting the totalnumber of action potentials elicited in the afferent populationrather than the spatial profile of neural activity, a participantcould infer whether the stimulus contained one point or two(Figures 8A,B).
We note that a magnitude cue will also exist, in the oppositedirection, at somewhat larger tip separations, where interactionsbetween stimuli are not expected at the single-neuron level. Forinstance, a two-point stimulus at 1 cm separation should elicitabout twice the number of action potentials in the afferent popu-lation as would a one-point stimulus of equal indentation, becausethe two-point stimulus will activate about twice as many neurons(Figures 8A,C). Therefore, the 2PD task is apparently beset withmagnitude cues at all tip separations.
Frontiers in Human Neuroscience www.frontiersin.org September 2013 | Volume 7 | Article 579 | 6

Tong et al. Two-point orientation discrimination
An additional non-spatial cue that might sometimes accom-pany the 2PD task is a temporal cue: if the investigator fails toapply the two points simultaneously, the participant may perceivetwo contacts that are distinct in time. In this case, the participantcould infer that two points touched the skin, even when unable todistinguish the points spatially. A limitation of any manual stimu-lus application method is that exact simultaneity is not achievable.Because humans are able to distinguish temporal delays betweentactile stimuli of approximately 10 ms (Gescheider, 1967; Geschei-der et al., 2003), any delay of this duration or longer between thetwo points of contact could produce a perceptible temporal cue.We note, however, that even when the 2PD task was conducted withan automated apparatus that touched the two tips against the skinwith less than 2 ms delay, performance was approximately 80%-correct at zero tip separation (Johnson and Phillips, 1981). Thus,a temporal cue, while plausibly facilitating 2PD task performanceunder manual stimulus delivery, is unlikely to account for theextraordinary performance of participants at zero tip separation.
An alternate explanation for above-chance 2PD performance atzero tip separation, put forth by Stevens and Patterson (1995), isthat participants make use of a length cue: two apposed pointsmight feel longer than a single point. However, we believe itunlikely that our participants could detect the 0.25 mm differencein length between our single-point stimulus and the two apposedpoints. In a length discrimination experiment using raised edgesof either 0.5 or 5 mm baseline length, Stevens and Patterson (1995)reported that on the fingertip the average adult participant coulddistinguish with 71% accuracy edges that differed by 0.8–0.9 mmin length. This length discrimination threshold is consistent withthe estimated SA-1 receptive field spacing on the fingertip ofapproximately 1 mm (Johansson and Vallbo, 1979, 1980; Olaus-son et al., 2000). The implication of this finding is that the 2PDtask would present a perceptual length cue at zero tip separation onthe fingertip whenever the individual points have a size of approx-imately 0.8 mm or more. This would seem to rule out a length cuein the present study, as our point stimulus had a width of approxi-mately 0.25 mm. Furthermore, to be detectable on the finger base,palm, and forearm, which have lower receptor densities than thefingertip, the length difference would presumably need to be muchlarger than 0.8 mm. Nevertheless, our participants performed sig-nificantly above chance at zero tip separation on those body sitesas well.
2PD PERFORMANCE REFLECTS BOTH SPATIAL AND NON-SPATIALINFORMATIONBecause it is contaminated by one or more non-spatial cues, the2PD task is prone to yield spuriously good performance. Con-sequently, tactile spatial deficits – particular if not severe – maybe undetected or underestimated by 2PD testing. For instance,van Nes et al. (2008) reported that 2PD testing detected mildpolyneuropathy caused by diabetes mellitus, chronic inflamma-tory demyelinating polyneuropathy, Guillain-Barré syndrome,uremia, and other causes, with a sensitivity of only 28%. Simi-larly, Van Boven and Johnson (1994) found that following electivemandibular surgery that injured but did not transect the infe-rior alveolar nerve, 2PD on the lip returned to normal levelsmuch earlier in the course of recovery than did grating orientation
performance, a rigorous measure of spatial acuity (see below). Theauthors argue that, owing to the presence of non-spatial cues, 2PDgrossly overestimated the initial recovery of tactile spatial function.
Despite the presence of non-spatial cues, it would be an overlycritical indictment to conclude that 2PD conveys no informationregarding a patient’s spatial acuity. It seems clear that spatial as wellas non-spatial cues influence 2PD task performance, particularlyat larger tip separations. Presumably for this reason, more severeinjuries, such as nerve transections, do result in lasting elevationof 2PD thresholds despite the return of tactile sensitivity as mea-sured by monofilament testing (Rosen et al., 2000; Jerosch-Herold,2003). Nerve transection, unlike nerve crush, is thought to resultin the misdirection of sensory axons during re-innervation; theshuffling of these axons causes severe deficits in spatial acuity (VanBoven and Johnson, 1994; Rosen et al., 2000), thereby elevatingthe 2PD threshold.
Among the neurologically healthy participants tested here,fewer than half had measurable 75%-correct 2PD thresholds onthe four skin sites; due presumably to non-spatial cues, perfor-mance did not consistently drop below 75%-correct even at zerotip separation. Nevertheless, the 2PD performance of all partici-pants did fall below 95%-correct at small tip separations. Analyz-ing participants’ 95%-correct thresholds on the four body sites, wefound that they correlated with mean receptive field spacing. Thisresult is in keeping with previous reports that 2PD performanceworsens on skin areas with sparser receptor distribution (Wein-stein, 1968). Furthermore, the 95%-correct thresholds on the 2PDtask did not differ significantly from those on the 2POD task. Pre-sumably, at larger tip separations when distinct points are morereliably perceptible, participants do make use of the spatial patternof the afferent population discharge.
For researchers who wish to use the 2IFC 2PD task, theseresults might suggest the adoption of the 95%-correct thresholdas a valid performance measure. Nevertheless, we caution that theaccurate estimation of a 95%-correct threshold is difficult. Con-ducting computer simulations of sensory tests using the methodof limits, for instance, we found that the test-retest variance of the95%-correct threshold estimate was consistently – and often con-siderably – greater than that of the 75%-correct threshold estimate.This difference owes to the shallower slopes of the psychometricfunctions (Figure 4) as they near the upper asymptote, whichtranslates into a greater uncertainty in the x-axis value of the esti-mate, caused by any uncertainty in the %-correct measurement(Zuberbühler, 2002). Rather than attempting to estimate a 95%-correct threshold, we suggest that clinicians and researchers simplyset aside the 2PD task and replace it with one that ensures a morepurely spatial measure of acuity.
In this study, we conducted a 2IFC version of the 2PD task inorder to most accurately assess the presence of non-spatial cues. Inthe 2IFC version, because a single-point and a two-point stimulusare presented on each trial, the participants are able to directlycompare the neural responses that occur in the two configura-tions. Participants may therefore rather quickly become aware ofnon-spatial cues in this version of the task. A commonly usedalternative version of the task employs single-interval trials. In eachtrial, the participant is stimulated just once, with either one or two-points, and asked to identify the configuration. This single-interval
Frontiers in Human Neuroscience www.frontiersin.org September 2013 | Volume 7 | Article 579 | 7

Tong et al. Two-point orientation discrimination
version of the task, though subject to the effects of response cri-teria (Gescheider, 1997; MacMillan and Creelman, 2005), may infact be preferable to the 2IFC version, because with appropriateinstruction the participant can be encouraged to respond “two”only when two distinct points are clearly perceived (Kalisch et al.,2007). The single-interval task may therefore mitigate the effect ofneural magnitude cues on performance, thereby yielding a morepurely spatial measure of acuity. In this regard, we note that theaverage single-interval 2PD 50% correct threshold obtained byKalisch et al. (2007) from the right index fingers of untrainedparticipants was approximately 1.6 mm, a tip separation that pre-sented in our 2IFC 2PD task would yield on average 85% correctperformance (see Figure 4A). Based on our finding that the 2PDand 2POD tasks yield similar performance at large tip separations,we suspect that the thresholds measured by Kalisch et al. (2007)indeed reflect primarily the participant’s spatial acuity. In general,the single-interval 2PD task, combined with instructions to partic-ipants to adopt an appropriately conservative response criterion,may produce the most reliable spatial acuity data achievable withthe 2PD task.
2POD IS A RIGOROUS AND CONVENIENT MEASURE OF TACTILESPATIAL ACUITYUnlike the 2PD task, the 2POD task involves the spatial discrimi-nation of orientation, with two points always presented. Thus, wereasoned that the 2POD task would avoid the non-spatial cues thatplague the 2PD task: the neural population response magnitudeshould be the same, on average, for the two orientations, and a tem-poral delay between the two points of contact, if present, wouldnot compromise the task; to perform successfully, the participantwould still need to discern the orientation of the points. Therefore,we predicted that 2POD performance would approach chance asthe tip separation approached zero. Our results confirmed thisprediction.
To our knowledge, we are the first to propose the exact versionof the 2POD task described here, though Stevens and colleaguesused similar tasks (Stevens and Patterson,1995; Stevens et al.,1996)and Weber himself explored two-point perception in the horizon-tal compared to the vertical orientation (Weber, 1996). In Stevensand Patterson (1995), a pair of longitudinal two-point stimuli anda pair of two-point stimuli of non-matching orientations (longitu-dinal and transverse) were presented on every trial; the participantwas asked to identify which interval had the non-matching pairs.In Stevens et al. (1996), a single two-point stimulus was given ineither longitudinal or transverse orientation, and the participantwas asked to identify the orientation. Some participants in Stevensand Patterson (1995) performed correctly at zero tip separation,perhaps because relatively large caliper tips (0.44 mm each) per-mitted the perception of orientation even when fully closed. Toprevent this, we recommend that the 2POD task be performedwith caliper tips of approximately 0.25 mm diameter.
The 2POD task that we have used combines the rigor of a goldstandard in tactile spatial acuity testing, the grating orientationtask, with the convenience of the 2PD task. In the grating orienta-tion task, participants attempt to discern the orientation (typically,horizontal or vertical) of square-wave gratings with equal ridgeand groove width. Groove width is reduced to make the task more
difficult, or increased to make it easier. Acuity is measured as thegroove width whose orientation the participant can discern witha particular probability (e.g., 75%-correct). Whether a grating isapplied horizontally or vertically, it is expected to elicit on aver-age the same afferent population discharge magnitude; only thespatial structure of the population discharge varies. Therefore, toperform the task correctly the participant must discern the spatialpattern of afferent activity, rendering this a rigorous test of tactilespatial acuity (Johnson and Phillips, 1981; Gibson and Craig, 2002,2006). The similarity to the 2POD task is clear.
While tactile research laboratories such as ours make exten-sive use of the grating orientation task (Goldreich and Kanics,2003; Goldreich et al., 2009; Peters et al., 2009; Wong et al.,2011a,b, 2013), we recognize that the task has certain practicaldisadvantages, particularly as concerns the clinical setting. Amongthese is that each grating must be prefabricated; consequently, thevariable of interest, groove width, cannot be adjusted outside a pre-determined range. This is particularly problematic if one wishesto test patients who may have atypical spatial acuity due to neuro-logical damage. The 2POD task does not suffer from this practicalinconvenience. Rather, like the 2PD task, the 2POD task is remark-ably flexible in requiring only a single tool (calipers) that is easilyadjustable during testing.
RECOMMENDATIONS FOR FUTURE STUDIES AND FOR CLINICALPRACTICEIn conclusion, our data confirm that the 2IFC 2PD task is contam-inated by one or more unintended non-spatial cues that result ininflated spatial acuity reports. An alternative task, 2POD, providesa rigorous measure of spatial acuity. The advantage of 2POD over2PD as a measure of spatial acuity is summarized in Figure 9.
We have performed the 2POD task using vertically and hor-izontally (i.e., longitudinally and transversely) oriented stimuli.One recommendation for future studies and for clinical practicewould be to use oblique (e.g., ±45-degree) orientations. The useof oblique stimuli would offer two practical advantages. First, itwould permit greater tip separations. On the digits and limbs, themaximum tip separation in the vertical-horizontal 2POD task islimited to the width of the body part, a constraint that is overcomeby the use of oblique stimuli. Second, the use of oblique stimuliwould prevent magnitude cues that might arise from receptivefield anisotropy. A majority of receptive fields on the fingers andpalm reportedly are elongated rather than circular; furthermore,roughly two-thirds of the elongated fields are oriented longitu-dinally with respect to the arm (Johansson and Vallbo, 1980).Perhaps for this reason, performance anisotropy has been reportedon several body areas, in a variety of tactile acuity tests (Essocket al., 1992; Stevens and Patterson, 1995; Gibson and Craig, 2005),beginning with the report by Weber himself that 2PD acuity wasbetter when the tips were aligned transversely (Weber, 1996). Theuse of oblique stimuli should prevent performance anisotropycaused by alignment of the two-point configuration in parallelor orthogonal to the average receptive field orientation.
Given its evident advantages,we recommend that 2POD replace2PD testing in the clinic and in research settings. Additionalstudies should be carried out to further validate the 2PODtask by measuring inter-rater and test-retest reliability and by
Frontiers in Human Neuroscience www.frontiersin.org September 2013 | Volume 7 | Article 579 | 8
Tong et al. Two-point orientation discrimination
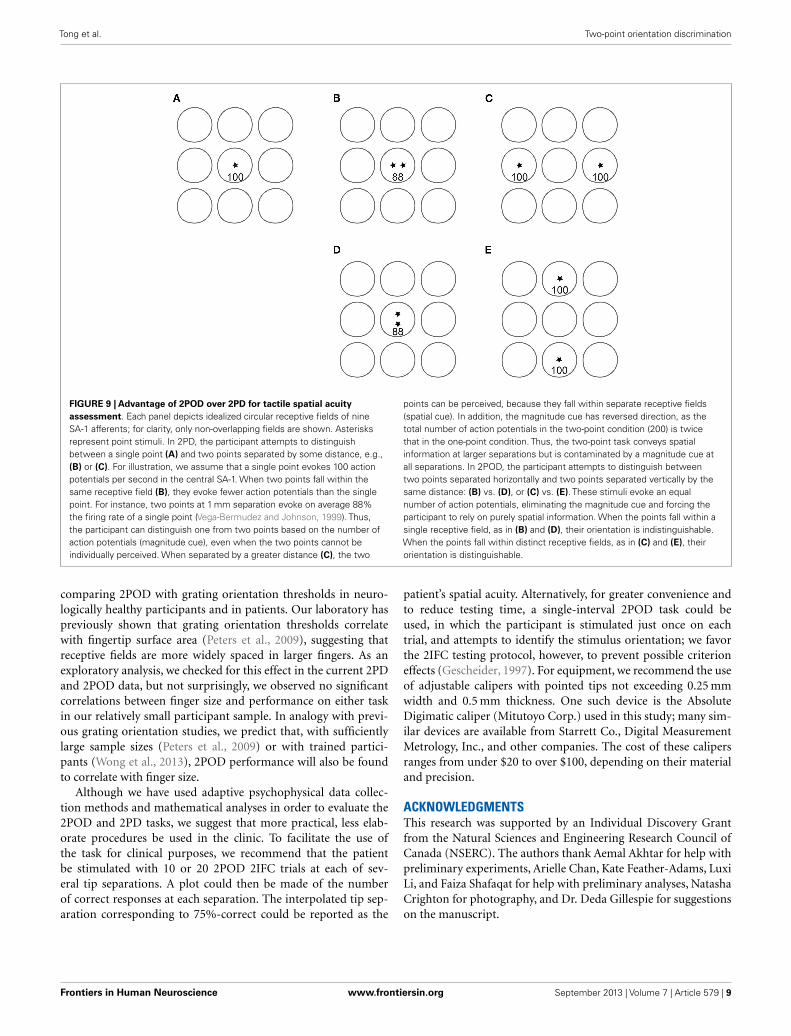
FIGURE 9 | Advantage of 2POD over 2PD for tactile spatial acuityassessment. Each panel depicts idealized circular receptive fields of nineSA-1 afferents; for clarity, only non-overlapping fields are shown. Asterisksrepresent point stimuli. In 2PD, the participant attempts to distinguishbetween a single point (A) and two points separated by some distance, e.g.,(B) or (C). For illustration, we assume that a single point evokes 100 actionpotentials per second in the central SA-1. When two points fall within thesame receptive field (B), they evoke fewer action potentials than the singlepoint. For instance, two points at 1 mm separation evoke on average 88%the firing rate of a single point (Vega-Bermudez and Johnson, 1999). Thus,the participant can distinguish one from two points based on the number ofaction potentials (magnitude cue), even when the two points cannot beindividually perceived. When separated by a greater distance (C), the two
points can be perceived, because they fall within separate receptive fields(spatial cue). In addition, the magnitude cue has reversed direction, as thetotal number of action potentials in the two-point condition (200) is twicethat in the one-point condition. Thus, the two-point task conveys spatialinformation at larger separations but is contaminated by a magnitude cue atall separations. In 2POD, the participant attempts to distinguish betweentwo points separated horizontally and two points separated vertically by thesame distance: (B) vs. (D), or (C) vs. (E). These stimuli evoke an equalnumber of action potentials, eliminating the magnitude cue and forcing theparticipant to rely on purely spatial information. When the points fall within asingle receptive field, as in (B) and (D), their orientation is indistinguishable.When the points fall within distinct receptive fields, as in (C) and (E), theirorientation is distinguishable.
comparing 2POD with grating orientation thresholds in neuro-logically healthy participants and in patients. Our laboratory haspreviously shown that grating orientation thresholds correlatewith fingertip surface area (Peters et al., 2009), suggesting thatreceptive fields are more widely spaced in larger fingers. As anexploratory analysis, we checked for this effect in the current 2PDand 2POD data, but not surprisingly, we observed no significantcorrelations between finger size and performance on either taskin our relatively small participant sample. In analogy with previ-ous grating orientation studies, we predict that, with sufficientlylarge sample sizes (Peters et al., 2009) or with trained partici-pants (Wong et al., 2013), 2POD performance will also be foundto correlate with finger size.
Although we have used adaptive psychophysical data collec-tion methods and mathematical analyses in order to evaluate the2POD and 2PD tasks, we suggest that more practical, less elab-orate procedures be used in the clinic. To facilitate the use ofthe task for clinical purposes, we recommend that the patientbe stimulated with 10 or 20 2POD 2IFC trials at each of sev-eral tip separations. A plot could then be made of the numberof correct responses at each separation. The interpolated tip sep-aration corresponding to 75%-correct could be reported as the
patient’s spatial acuity. Alternatively, for greater convenience andto reduce testing time, a single-interval 2POD task could beused, in which the participant is stimulated just once on eachtrial, and attempts to identify the stimulus orientation; we favorthe 2IFC testing protocol, however, to prevent possible criterioneffects (Gescheider, 1997). For equipment, we recommend the useof adjustable calipers with pointed tips not exceeding 0.25 mmwidth and 0.5 mm thickness. One such device is the AbsoluteDigimatic caliper (Mitutoyo Corp.) used in this study; many sim-ilar devices are available from Starrett Co., Digital MeasurementMetrology, Inc., and other companies. The cost of these calipersranges from under $20 to over $100, depending on their materialand precision.
ACKNOWLEDGMENTSThis research was supported by an Individual Discovery Grantfrom the Natural Sciences and Engineering Research Council ofCanada (NSERC). The authors thank Aemal Akhtar for help withpreliminary experiments, Arielle Chan, Kate Feather-Adams, LuxiLi, and Faiza Shafaqat for help with preliminary analyses, NatashaCrighton for photography, and Dr. Deda Gillespie for suggestionson the manuscript.
Frontiers in Human Neuroscience www.frontiersin.org September 2013 | Volume 7 | Article 579 | 9

Tong et al. Two-point orientation discrimination
REFERENCESAmerican Society for Surgery of the
Hand. (1983). The Hand: Examina-tion and Diagnosis. Edinburgh, NY:Churchill Livingstone.
Boles, D. B., and Givens, S. M.(2011). Laterality and sex dif-ferences in tactile detection andtwo-point thresholds modified bybody surface area and body fatratio. Somatosens. Mot. Res. 28,102–109. doi:10.3109/08990220.2011.627068
Brodal, P. (ed.). (2010). “Peripheralparts of the somatosensory sys-tem,” in The Central Nervous Sys-tem: Structure and Function, 4th Edn.New York: Oxford University Press,165–189.
Campbell, W. W., Dejong, R. N., andHaerer, A. F. (2013). DeJong’s TheNeurologic Examination. Philadel-phia: Wolters Kluwer/LippincottWilliams & Wilkins.
Craig, J. C., and Johnson, K. O. (2000).The two-point threshold: not ameasure of tactile spatial reso-lution. Curr. Dir. Psychol. Sci. 9,29–32. doi:10.1111/1467-8721.00054
Dellon,A. L. (1981). Evaluation of Sensi-bility and Re-Education of Sensationin the Hand. Baltimore: Williams &Wilkins.
Dinse, H. R., Kleibel, N., Kalisch, T.,Ragert, P., Wilimzig, C., and Tegen-thoff, M. (2006). Tactile coactivationresets age-related decline of humantactile discrimination. Ann. Neurol.60, 88–94. doi:10.1002/ana.20862
Essock, E. A., Krebs, W. K., and Prather,J. R. (1992). An anisotropy of humantactile sensitivity and its relationto the visual oblique effect. Exp.Brain Res. 91, 520–524. doi:10.1007/BF00227848
Gescheider, G. A. (1967). Auditoryand cutaneous temporal resolutionof successive brief stimuli. J. Exp.Psychol. 75, 570–572. doi:10.1037/h0025113
Gescheider, G. A. (1997). Psychophysics:The Fundamentals. Mahwah, NJ: L.Erlbaum Associates.
Gescheider, G. A., Bolanowski, S.J., and Chatterton, S. K. (2003).Temporal gap detection in tac-tile channels. Somatosens. Mot.Res. 20, 239–247. doi:10.1080/08990220310001622960
Gibson, G. O., and Craig, J. C. (2002).Relative roles of spatial and inten-sive cues in the discriminationof spatial tactile stimuli. Percept.Psychophys. 64, 1095–1107. doi:10.3758/BF03194759
Gibson, G. O., and Craig, J.C. (2005). Tactile spatial
sensitivity and anisotropy. Per-cept. Psychophys. 67, 1061–1079.doi:10.3758/BF03193632
Gibson, G. O., and Craig, J. C. (2006).The effect of force and conformanceon tactile intensive and spatialsensitivity. Exp. Brain Res. 170,172–181. doi:10.1007/s00221-005-0200-1
Godde, B., Stauffenberg, B., Spen-gler, F., and Dinse, H. R. (2000).Tactile coactivation-inducedchanges in spatial discrimina-tion performance. J. Neurosci. 20,1597–1604.
Goldreich, D., and Kanics, I. M. (2003).Tactile acuity is enhanced in blind-ness. J. Neurosci. 23, 3439–3445.
Goldreich, D., Wong, M., Peters, R. M.,and Kanics, I. M. (2009). A tac-tile automated passive-finger stimu-lator (TAPS). J. Vis. Exp. 28:e1374.doi:10.3791/1374
Grant, A. C., Zangaladze, A., Thia-garajah, M. C., and Sathian, K.(1999). Tactile perception in devel-opmental dyslexia: a psychophysi-cal study using gratings. Neuropsy-chologia 37,1201–1211. doi:10.1016/S0028-3932(99)00013-5
Jerosch-Herold, C. (2003). A studyof the relative responsiveness offive sensibility tests for assessmentof recovery after median nerveinjury and repair. J. Hand Surg.Br. 28, 255–260. doi:10.1016/S0266-7681(03)00017-2
Jerosch-Herold, C. (2005). Assessmentof sensibility after nerve injury andrepair: a systematic review of evi-dence for validity, reliability andresponsiveness of tests. J. Hand Surg.Br. 30, 252–264. doi:10.1016/j.jhsb.2004.12.006
Johansson, R. S., and Vallbo, A. B.(1979). Detection of tactile stim-uli. Thresholds of afferent unitsrelated to psychophysical thresholdsin the human hand. J. Physiol. 297,405–422.
Johansson, R. S., and Vallbo, A.B. (1980). Spatial properties ofthe population of mechanorecep-tive units in the glabrous skinof the human hand. Brain Res.184, 353–366. doi:10.1016/0006-8993(80)90804-5
Johnson, K. O. (2001). The roles andfunctions of cutaneous mechanore-ceptors. Curr. Opin. Neurobiol.11, 455–461. doi:10.1016/S0959-4388(00)00234-8
Johnson, K. O., and Phillips, J. R. (1981).Tactile spatial resolution. I. Two-point discrimination, gap detec-tion, grating resolution, and let-ter recognition. J. Neurophysiol. 46,1177–1192.
Johnson, K. O., Van Boven, R. W.,and Hsiao, S. S. (1994). “Theperception of two points is notthe spatial resolution threshold,” inTouch, Temperature, and Pain inHealth and Disease: Mechanisms andAssessments: a Wenner-Gren CenterInternational Symposium, 1st Edn,eds J. Boivie, P. Hansson, andU. Lindblom (Seattle: IASP Press),389–404.
Kalisch, T., Tegenthoff, M., and Dinse,H. R. (2007). Differential effectsof synchronous and asynchro-nous multifinger coactivation onhuman tactile performance. BMCNeurosci. 8:58. doi:10.1186/1471-2202-8-58
Kennett, S., Taylor-Clarke, M., andHaggard, P. (2001). Noninformativevision improves the spatial resolu-tion of touch in humans. Curr. Biol.11, 1188–1191. doi:10.1016/S0960-9822(01)00327-X
Klein, S. A. (2001). Measuring, esti-mating, and understanding the psy-chometric function: a commentary.Percept. Psychophys. 63, 1421–1455.doi:10.3758/BF03194552
Kontsevich, L. L., and Tyler, C. W.(1999). Bayesian adaptive esti-mation of psychometric slopeand threshold. Vision Res. 39,2729–2737. doi:10.1016/S0042-6989(98)00285-5
Lundborg, G., and Rosen, B. (2004).The two-point discrimination test –time for a re-appraisal? J. Hand Surg.Br. 29, 418–422. doi:10.1016/j.jhsb.2004.02.008
MacMillan, N. A., and Creelman, C. D.(2005). Detection Theory: A User’sGuide. Mahwah: Lawrence ErlbaumAssociates.
Mountcastle, V. B., and Bard, P. (1968).“Neural mechanisms in somesthe-sia,” in Medical Physiology, 12th Edn,ed. V. B. Mountcaslte (St. Louis:Mosby), 1372–1423.
Olausson, H., Wessberg, J., and Kakuda,N. (2000). Tactile directionalsensibility: peripheral neuralmechanisms in man. Brain Res.866, 178–187. doi:10.1016/S0006-8993(00)02278-2
Peters, R. M., Hackeman, E., andGoldreich, D. (2009). Diminutivedigits discern delicate details:fingertip size and the sex dif-ference in tactile spatial acuity.J. Neurosci. 29, 15756–15761.doi:10.1523/JNEUROSCI.3684-09.2009
Purves, D., Augustine, G. J., Fitzpatrick,D., Hall, W. C., LaMantia, A., andWhite, L. E. (eds). (2012). “Thesomatic sensory system: touch andproprioception,”in Neuroscience, 5th
Edn (Sunderland: Sinauer Asso-ciates), 189–208.
Rosen, B., Dahlin, L. B., and Lundborg,G. (2000). Assessment of functionaloutcome after nerve repair in alongitudinal cohort. Scand. J. Plast.Reconstr. Surg. Hand Surg. 34, 71–78.doi:10.1080/02844310050160204
Stevens, J. C., Foulke, E., and Patter-son, M. Q. (1996). Tactile acuity,aging, and braille reading in long-term blindness. J. Exp. Psychol. Appl.2, 91–106. doi:10.1037/1076-898X.2.2.91
Stevens, J. C., and Patterson, M. Q.(1995). Dimensions of spatial acu-ity in the touch sense: changesover the life span. Somatosens.Mot. Res. 12, 29–47. doi:10.3109/08990229509063140
Vallbo, A. B., and Johansson, R. S.(1978). “The tactile sensory inner-vation of the glabrous skin ofthe human hand,” in Active Touch,the Mechanism of Recognition ofObjects by Manipulation, ed. G. Gor-don (Oxford: Pergamon Press Ltd),29–54.
Van Boven, R. W., and Johnson, K. O.(1994). A psychophysical study ofthe mechanisms of sensory recoveryfollowing nerve injury in humans.Brain 117(Pt 1), 149–167. doi:10.1093/brain/117.1.149
van Nes, S. I., Faber, C. G., Hamers,R. M., Harschnitz, O., Bakkers, M.,Hermans, M. C., et al. (2008).Revising two-point discriminationassessment in normal aging andin patients with polyneuropathies.J. Neurol. Neurosurg. Psychiatr.79, 832–834. doi:10.1136/jnnp.2007.139220
Vega-Bermudez, F., and Johnson, K. O.(1999). Surround suppression in theresponses of primate SA1 and RAmechanoreceptive afferents mappedwith a probe array. J. Neurophysiol.81, 2711–2719.
Weber, E. H. (1996). E. H. Weber on theTactile Senses. Hove: Erlbaum (UK)Taylor & Francis.
Weinstein, S. (1968). “Intensive andextensive aspects of tactile sensitiv-ity as a function of body part, sexand laterality,” in The Skin Senses,1st Edn, ed. D. R. Kenshalo (Spring-field, IL: Charles C. Thomas),195–222.
Wichmann, F. A., and Hill, N. J. (2001).The psychometric function: I. Fit-ting, sampling, and goodness of fit.Percept. Psychophys. 63, 1293–1313.doi:10.3758/BF03194544
Wong, M., Gnanakumaran, V., andGoldreich, D. (2011a). Tac-tile spatial acuity enhance-ment in blindness: evidence for
Frontiers in Human Neuroscience www.frontiersin.org September 2013 | Volume 7 | Article 579 | 10

Tong et al. Two-point orientation discrimination
experience-dependent mecha-nisms. J. Neurosci. 31, 7028–7037.doi:10.1523/JNEUROSCI.6461-10.2011
Wong, M., Hackeman, E., Hurd, C., andGoldreich, D. (2011b). Short-termvisual deprivation does not enhancepassive tactile spatial acuity. PLoSONE 6:e25277. doi:10.1371/journal.pone.0025277
Wong, M., Peters, R. M., and Goldre-ich, D. (2013). A physical constrainton perceptual learning: tactile spa-tial acuity improves with training
to a limit set by finger size. J.Neurosci. 33, 9345–9352. doi:10.1523/JNEUROSCI.0514-13.2013
Zuberbühler, H. J. (2002). Rapid Eval-uation of Perceptual Thresholds: TheBest-Pest Calculator: a Web-basedApplication for Non-expert Users.Zurich: Swiss Federal Institute ofTechnology Zurich (ETHZ), Insti-tute for Hygiene and Applied Physi-ology (IHA).
Conflict of Interest Statement: Theauthors declare that the research was
conducted in the absence of anycommercial or financial relationshipsthat could be construed as a potentialconflict of interest.
Received: 03 May 2013; accepted: 28August 2013; published online: 13 Sep-tember 2013.Citation: Tong J, Mao O and Goldre-ich D (2013) Two-point orientation dis-crimination versus the traditional two-point test for tactile spatial acuity assess-ment. Front. Hum. Neurosci. 7:579. doi:10.3389/fnhum.2013.00579
This article was submitted to the journalFrontiers in Human Neuroscience.Copyright © 2013 Tong , Mao and Gol-dreich. This is an open-access article dis-tributed under the terms of the CreativeCommons Attribution License (CC BY).The use, distribution or reproduction inother forums is permitted, provided theoriginal author(s) or licensor are cred-ited and that the original publication inthis journal is cited, in accordance withaccepted academic practice. No use, dis-tribution or reproduction is permittedwhich does not comply with these terms.
Frontiers in Human Neuroscience www.frontiersin.org September 2013 | Volume 7 | Article 579 | 11
Copyright © 2022 FDOKUMEN