
Simultaneous measurement of two-point-spread functions at different locations across the human fovea
11
Simultaneous measurement of two-point-spread functions at different locations across the human fovea Pablo Artal and Rafael Navarro An experimental system for measuring simultaneously the retinal images of two-point tests has been developed. In particular we present one experiment in which one of the points is located at the center of the fovea and the other one is at 1 deg of eccentricity. At these two foveal locations the optical image quality is expected to be approximately the same, while the structure of the retina is known to be quite different. Our results of aerial images show small but systematic differences between the two-point- spread functions that are measured at 0 and 1 deg of eccentricity. The image quality is always slightly better in the center of the fovea with the differences more marked in the nasal and inferior orientations. That could be explained by a small but noticeable contribution of the retinal thickness to the optical aberrations of the eye. The possible increment of scattering caused by the increase in retinal thickness at 1 deg was barely measurable in our experiment. An indirect consequence is that retinal reflection has little practical influence on our particular double-pass measurements of the eye's image quality. Introduction The measurement of the optical image quality in the human eye has been a subject of interest during the last decades, and even now several questions remain. Apart from many practical and clinical applications, the eye's image quality is also a matter of basic research. In particular, since the optical system of the eye is the first step in the information gathering and processing that are performed by the human visual system, the eye's image quality is the necessary departure point in many spatial vision experiments and models. A variety of techniques, either subjective or objec- tive, have been applied to assess the eye's image quality. They range from studies of optical aberra- tions' to measurements of the optical transfer func- tion (OTF). 2 At present objective methods based on the double pass of the light through the ocular media seem to be more convenient for measuring the image forming properties of the human eye, because they present several advantages. Bidimensional complete information can be obtained in a straightforward manner by a fast procedure in addition to the advan- The authors are with the Instituto de Optica, Consejo Superior de Investigaciones Cientificas, Serrano 121, Madrid 28006, Spain. Received 24 June 1991. 0003-6935/92/193646-11$05.00/0. © 1992 Optical Society of America. tages that are derived from the objective nature of the method. However, some scepticism remains concern- ing the double-pass technique mainly because of the lack of a complete understanding and agreement on the nature of fundus reflection. Since the early work of Flamant 3 many authors have measured the OTF of the human eye from aerial images of lines, edges, or gratings formed by a double pass through the optical media of the eye. 2 ' 4 Among the different tests the one that consists of one point is the most appropriate, because it yields complete bidimensional information. It also avoids the possible influence of anisoplanatism when using an extended test. Based on the double-pass method of Arnulf et al. 5 for the cinematographic recording of the aerial image of a point tests, we developed an experimental system 6 that permits for the first time we believe the measurement of the retinal point spread function (PSF) and also the bidimensional OTF. This method is based on the recording of short-exposure aerial retinal images of a point source. The OTF is obtained by averaging a set of these images and then comput- ing the square root of its Fourier transform, includ- ing the modulus [modulation transfer function (MTF)] and phase (phase transfer function). 7 The methodol- ogy was also extended to compute the wave aberra- tion function from the experimental PSF by using a phase retrieval procedure. 9 Since then we have contin- ued working in two directions: on the one hand, 3646 APPLIED OPTICS / Vol. 31, No. 19 / 1 July 1992
Transcript of Simultaneous measurement of two-point-spread functions at different locations across the human fovea
Simultaneous measurement of two-point-spreadfunctions at different locations across thehuman fovea
Pablo Artal and Rafael Navarro
An experimental system for measuring simultaneously the retinal images of two-point tests has beendeveloped. In particular we present one experiment in which one of the points is located at the center ofthe fovea and the other one is at 1 deg of eccentricity. At these two foveal locations the optical imagequality is expected to be approximately the same, while the structure of the retina is known to be quitedifferent. Our results of aerial images show small but systematic differences between the two-point-spread functions that are measured at 0 and 1 deg of eccentricity. The image quality is always slightlybetter in the center of the fovea with the differences more marked in the nasal and inferior orientations.That could be explained by a small but noticeable contribution of the retinal thickness to the opticalaberrations of the eye. The possible increment of scattering caused by the increase in retinal thickness at 1deg was barely measurable in our experiment. An indirect consequence is that retinal reflection has littlepractical influence on our particular double-pass measurements of the eye's image quality.
Introduction
The measurement of the optical image quality in thehuman eye has been a subject of interest during thelast decades, and even now several questions remain.Apart from many practical and clinical applications,the eye's image quality is also a matter of basicresearch. In particular, since the optical system of theeye is the first step in the information gathering andprocessing that are performed by the human visualsystem, the eye's image quality is the necessarydeparture point in many spatial vision experimentsand models.
A variety of techniques, either subjective or objec-tive, have been applied to assess the eye's imagequality. They range from studies of optical aberra-tions' to measurements of the optical transfer func-tion (OTF).2 At present objective methods based onthe double pass of the light through the ocular mediaseem to be more convenient for measuring the imageforming properties of the human eye, because theypresent several advantages. Bidimensional completeinformation can be obtained in a straightforwardmanner by a fast procedure in addition to the advan-
The authors are with the Instituto de Optica, Consejo Superiorde Investigaciones Cientificas, Serrano 121, Madrid 28006, Spain.
Received 24 June 1991.0003-6935/92/193646-11$05.00/0.© 1992 Optical Society of America.
tages that are derived from the objective nature of themethod. However, some scepticism remains concern-ing the double-pass technique mainly because of thelack of a complete understanding and agreement onthe nature of fundus reflection.
Since the early work of Flamant3 many authorshave measured the OTF of the human eye from aerialimages of lines, edges, or gratings formed by a doublepass through the optical media of the eye.2'4 Amongthe different tests the one that consists of one point isthe most appropriate, because it yields completebidimensional information. It also avoids the possibleinfluence of anisoplanatism when using an extendedtest. Based on the double-pass method of Arnulf etal.
5 for the cinematographic recording of the aerialimage of a point tests, we developed an experimentalsystem6 that permits for the first time we believe themeasurement of the retinal point spread function(PSF) and also the bidimensional OTF. This methodis based on the recording of short-exposure aerialretinal images of a point source. The OTF is obtainedby averaging a set of these images and then comput-ing the square root of its Fourier transform, includ-ing the modulus [modulation transfer function (MTF)]and phase (phase transfer function).7 The methodol-ogy was also extended to compute the wave aberra-tion function from the experimental PSF by using aphase retrieval procedure.9 Since then we have contin-ued working in two directions: on the one hand,
3646 APPLIED OPTICS / Vol. 31, No. 19 / 1 July 1992

improving the experimental setup including bettercomponents and implementing much more accurateprocessing of the data.'" This allows us to obtaintwo-dimensional OTF's with a higher signal-to-noiseratio, which permits the extension of a reliable rangeof measurement as far as the cutoff frequency andwith an easier and more comfortable procedure." Onthe other hand, we have been interested in designingnew experiments based on the double-pass method inorder to understand better the role of the retinalthickness on the eye's image quality and also itsinfluence on double-pass measurements. In particu-lar the fundamental question for our double-passmethod is: how close is the correlation between thereal retinal image, which is effective for the visualprocess, and that which we obtain by a double passthrough the optical media?
We present a modified version of the double-passexperimental system, which has been implemented toobtain retinal images of a multiple test, which con-sists of an array of points. In particular we presentresults that correspond to aerial images of couples oftwin points that are simultaneously recorded. In thisparticular experiment one point is located at thecenter of the fovea and the second one at 1 deg ofretinal eccentricity. We have collected data from thefour principal orientations (nasal, temporal, inferior,and superior). The simultaneous recording of theaerial image of the two points guarantees that theexperimental conditions (i.e., pupil size, accommoda-tion, eye position) are exactly the same, permittingthe detection of quite small differences. At thesefoveal locations, with eccentricity that is this small,the image quality corresponding to the eye's opticalsystem should be practically the same as in the fovealcenter, while the thickness and structure of the retinaare at 1 deg substantially different from those of thecenter of the fovea. Consequently the possible differ-ences between the two retinal images should beprimarily attributed to the effect of a different retinalthickness and structure at each location. Results thatshow small differences between both images of acouple (at the foveal center and at 1 deg) indirectlymean that the effect of retinal reflection also has littleinfluence. An indirectly derived consequence is rele-vant for our double-pass method. The results ofimage quality are highly correlated to the retinalimage that is effective for the visual process.
We first describe the modified double-pass system;then we explain the experiment, which consists of thesimultaneous measurement of two aerial PSF's, in-cluding a brief analysis of the results. We also discussthe contribution of the retina to the optical aberra-tions and scattering of the eye and its consequence ondouble-pass measurements of the eye's image quality.Finally we present the conclusions.
Retinal Aerial Images of Twin Points
In the particular experiment presented here the setupwas modified by introducing an array generator intothe optical path that splits the incoming light beam
into its different diffraction orders to form an array ofpoints. This modification of the system permits thesimultaneous recording of the retinal images of thetwo point sources separated by a given angulardistance across the fovea.
Description of the Experimental System
The apparatus that is used to record the retinalimages of the two point sources in the fovea isdepicted in Fig. 1. A He-Ne laser with nominal powerof 10 mW is used as the light source. The beam firstpasses through an optional neutral low-density filter(ODF) that is used to match the beam intensity to theoptimum CCD camera sensitivity range for eachparticular experimental condition (pupil size, imagequality, etc.). A second, high-density, filter (DF), withD = 4, attached to a rotary solenoid (R) attenuatesthe intensity of the beam allowing the subject to lookat the point source comfortably. During the shortexposure time this filter is removed and synchronizedwith the camera by acting as a flash shutter. Thebeam is expanded by a 20x microscope objective (M)and filtered by a 10-[um pinhole (P), which acts as theprimary test object (0). The diverging beam is colli-mated by lens L (f ' = 200 mm).
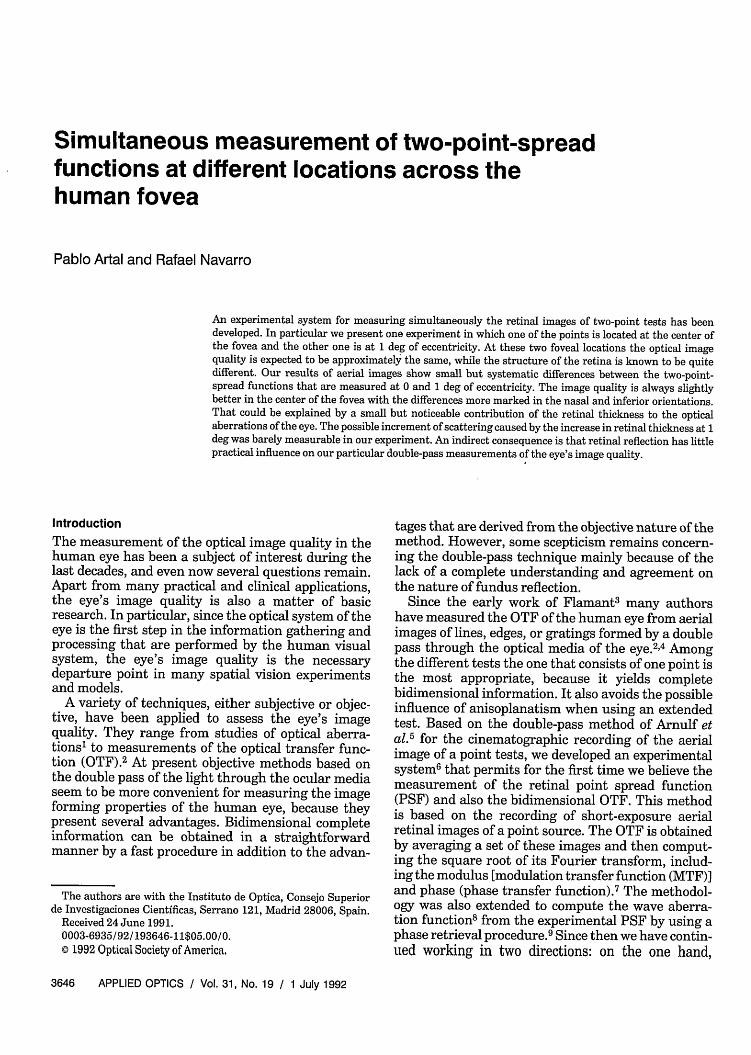
The generation of the array of points, which is usedas the final object test, is carried out by placing anoptical Fourier plane array generator in front of thecollimator. Figure 2 shows the principle of this sys-tem: a phase diffraction grating splits the incomingbeam into a series of diffraction orders, and a lens
DISPLAY
CAMERA|
C T k W E~~~~~C~ONTROALL
LT if U I 'oam
BS2 cC\ l ~CAMERA DISPLAY
(Pupil size control)
d 0;
Fig 1. Experimental setup for recording simultaneously theretinal images of two point sources (Of' and 02'): ODF, optionalneutral low-density density filter; DF, high-density filter; R, rotarysolenoid; M, objective microscope; P, pinhole; DG, phase diffractiongrating; BS1, BS2, pellicle beam splitters; C, spot; II, imageintensifier system; Z, zoom lens; LT, light trapping; 0, primary testobject; L,, L,, lenses; D,
1 July 1992 / Vol. 31, No. 19 / APPLIED OPTICS 3647
Phase diffraction fgrating Fourier lens Array of spots
Fig 2. Schematic plot of a Fourier plane array generator that isbased on a Foucault phase diffraction grating.
performs the Fourier transform by focusing theorders to an array of points. When necessary, as, forexample, in far vision, the eye can be used as theFourier lens, although this particular experiment wasperformed in near vision. After the diffraction grating(DG) and reflection in a pellicle beam splitter (BS1),lens L (f' = 300 mm) forms a set of points in theaccommodation plane, which is 3 diopters away fromthe eye. The diffractive component, a Foucault phasediffraction grating, was made as follows: a binarymask (rectangular grating) was plotted with a laserprinter and photoreduced to obtain the requiredspatial frequency. The diffractive element was thenconstructed in bichromated gelatin to obtain a highdiffraction efficiency and designed to generate anarray of points with approximately the same intensityin the three central peaks. In the setup a field stopselects only two points on the array in the accommo-dation plane (C): the central (zero-order) point andone of two points that correspond to the first order.The diffraction grating is mounted on a rotary systemto select the arrangement of the point couples (hori-zontal or vertical). During the measurement processthe subject's eye is at a viewing distance of 3 diopters,forming the retinal images of both points 01 and 02on his (or her) retina. While one of the points (k' ) isused as a fixation test, with its image in the center ofthe fovea, the position of the second point (2') is setto 1 deg of the retinal eccentricity with variableorientation.
A small fraction of the incident light is reflected inthe fundus and passes again through the ocularmedia, lens L, and the beam splitters. The zoom lensZ (f' = 60-300 mm) forms the aerial images 01", 02"of the retinal 0,', 0,' on the CCD camera. The zoomlens permits a change in the magnification of thesystem from 3.6 x to 18 x (the ratio between the eyeand the zoom focals). The aerial retinal images aredigitized and stored on an AT computer by means of aframe grabber-image processing board (Matrox MV-AT). This system was previously calibrated with ahorizontal pixel size of 13.2 m and a vertical pixelsize of 11.3 [um. Since the aspect ratio is not equal toone, it must be corrected during the posterior imageprocessing procedure. The aerial images 0," and 02"
are oversampled by more than twice the Nyquistfrequency to avoid aliasing, since the interlaced scanof the camera causes the real vertical resolution to behalf of the theoretical value.
The pupil size of this experiment was 4 mm. Thispupil corresponds to a typical indoor reading situa-tion, which assures a normal eye's image quality andpermits a comfortable recording. Since the subject isin natural viewing conditions, including pupil andaccommodation, it is necessary to control the pupilsize during each short exposure. For this purpose anadditional pellicle beam splitter (BS2) has been incor-porated into the system permitting us to monitor thepupil in real time by an intensified camera [i.e., animage intensifier tube (II) together with a CCDcamera]. The mean pupil size in the experiment was 4mm with a standard deviation of 0.2 mm. Thehigh-density filter is removed from the beam at thesame time that the short-exposure images are grabbed.The actual duration of the laser exposure is 100 ms,and the maximum laser power irradiance in the eyepupil plane is 0.1 mW/cm' in these particular experi-mental conditions. When taking into account the areaof the PSF on the retina and the duration of thesnapshot, the laser exposure is at least 1 order ofmagnitude below the American National StandardsInstitute laser safety standards.'3 (For direct viewinginto a He-Ne laser beam the ANSI value is above 1mW/cm' for an exposure time of 0.1 s.)
Experimental Procedure and Image Processing
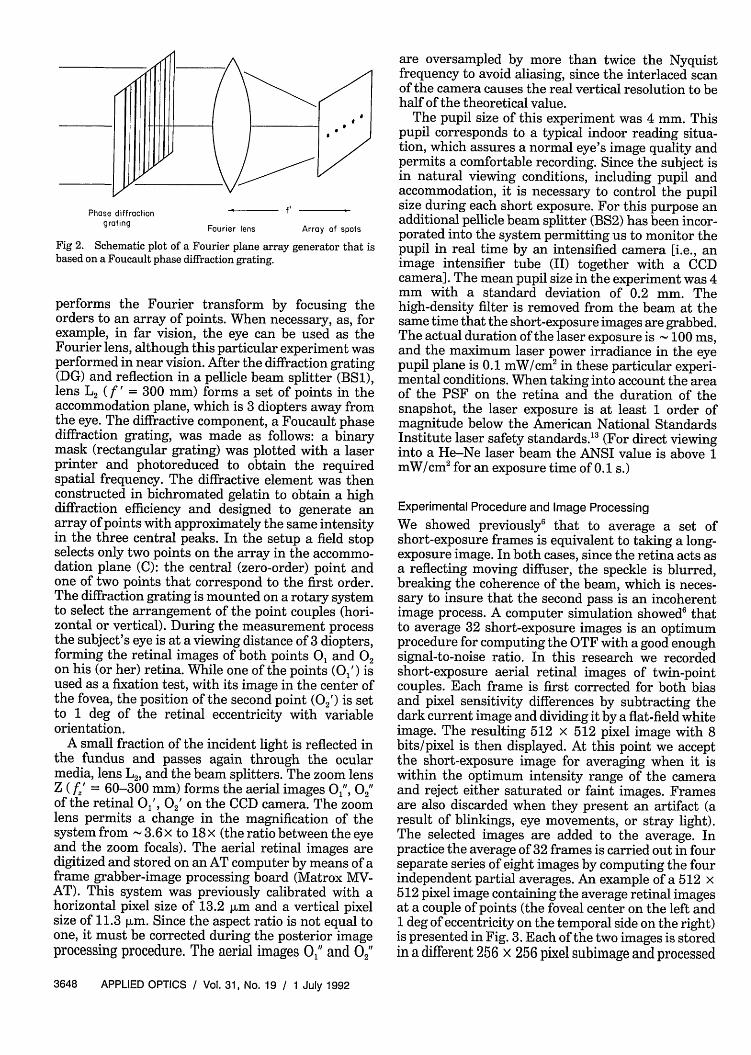
We showed previously6 that to average a set ofshort-exposure frames is equivalent to taking a long-exposure image. In both cases, since the retina acts asa reflecting moving diffuser, the speckle is blurred,breaking the coherence of the beam, which is neces-sary to insure that the second pass is an incoherentimage process. A computer simulation showed6 thatto average 32 short-exposure images is an optimumprocedure for computing the OTF with a good enoughsignal-to-noise ratio. In this research we recordedshort-exposure aerial retinal images of twin-pointcouples. Each frame is first corrected for both biasand pixel sensitivity differences by subtracting thedark current image and dividing it by a flat-field whiteimage. The resulting 512 x 512 pixel image with 8bits/pixel is then displayed. At this point we acceptthe short-exposure image for averaging when it iswithin the optimum intensity range of the cameraand reject either saturated or faint images. Framesare also discarded when they present an artifact (aresult of blinkings, eye movements, or stray light).The selected images are added to the average. Inpractice the average of 32 frames is carried out in fourseparate series of eight images by computing the fourindependent partial averages. An example of a 512 x512 pixel image containing the average retinal imagesat a couple of points (the foveal center on the left and1 deg of eccentricity on the temporal side on the right)is presented in Fig. 3. Each of the two images is storedin a different 256 x 256 pixel subimage and processed
3648 APPLIED OPTICS / Vol. 31, No. 19 / 1 July 1992
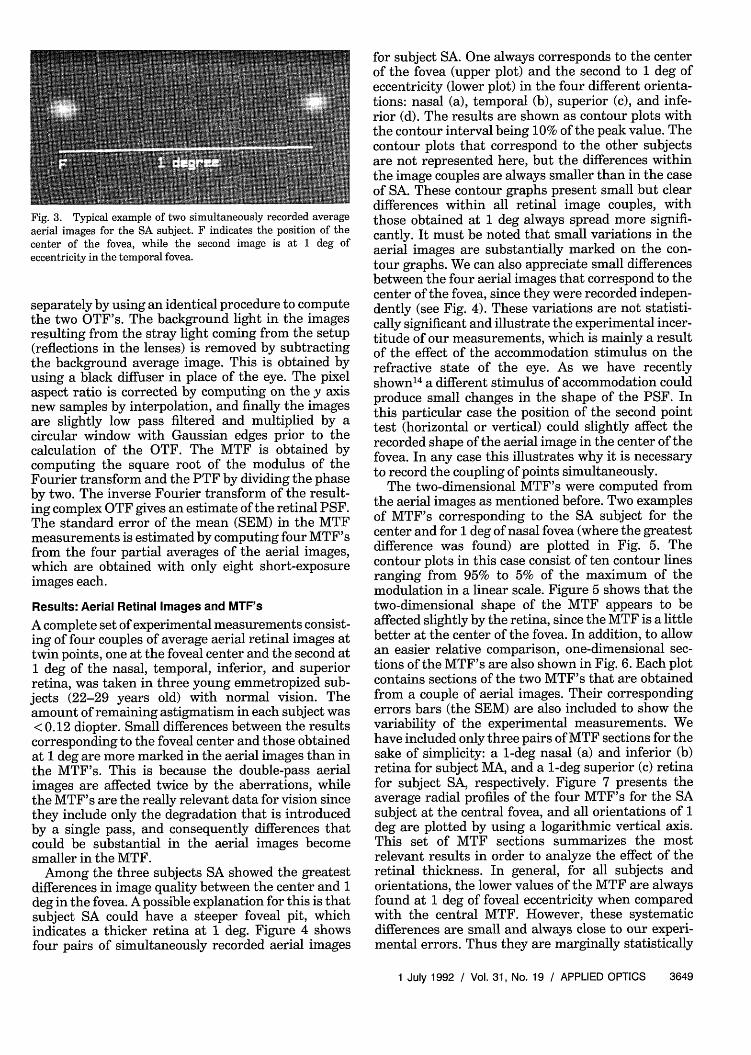
Fig. 3. Typical example of two simultaneously recorded averageaerial images for the SA subject. F indicates the position of thecenter of the fovea, while the second image is at 1 deg ofeccentricity in the temporal fovea.
separately by using an identical procedure to computethe two OTF's. The background light in the imagesresulting from the stray light coming from the setup(reflections in the lenses) is removed by subtractingthe background average image. This is obtained byusing a black diffuser in place of the eye. The pixelaspect ratio is corrected by computing on the y axisnew samples by interpolation, and finally the imagesare slightly low pass filtered and multiplied by acircular window with Gaussian edges prior to thecalculation of the OTF. The MTF is obtained bycomputing the square root of the modulus of theFourier transform and the PTF by dividing the phaseby two. The inverse Fourier transform of the result-ing complex OTF gives an estimate of the retinal PSF.The standard error of the mean (SEM) in the MTFmeasurements is estimated by computing four MTF'sfrom the four partial averages of the aerial images,which are obtained with only eight short-exposureimages each.
Results: Aerial Retinal Images and MTF's
A complete set of experimental measurements consist-ing of four couples of average aerial retinal images attwin points, one at the foveal center and the second at1 deg of the nasal, temporal, inferior, and superiorretina, was taken in three young emmetropized sub-jects (22-29 years old) with normal vision. Theamount of remaining astigmatism in each subject was< 0.12 diopter. Small differences between the resultscorresponding to the foveal center and those obtainedat 1 deg are more marked in the aerial images than inthe MTF's. This is because the double-pass aerialimages are affected twice by the aberrations, whilethe MTF's are the really relevant data for vision sincethey include only the degradation that is introducedby a single pass, and consequently differences thatcould be substantial in the aerial images becomesmaller in the MTF.
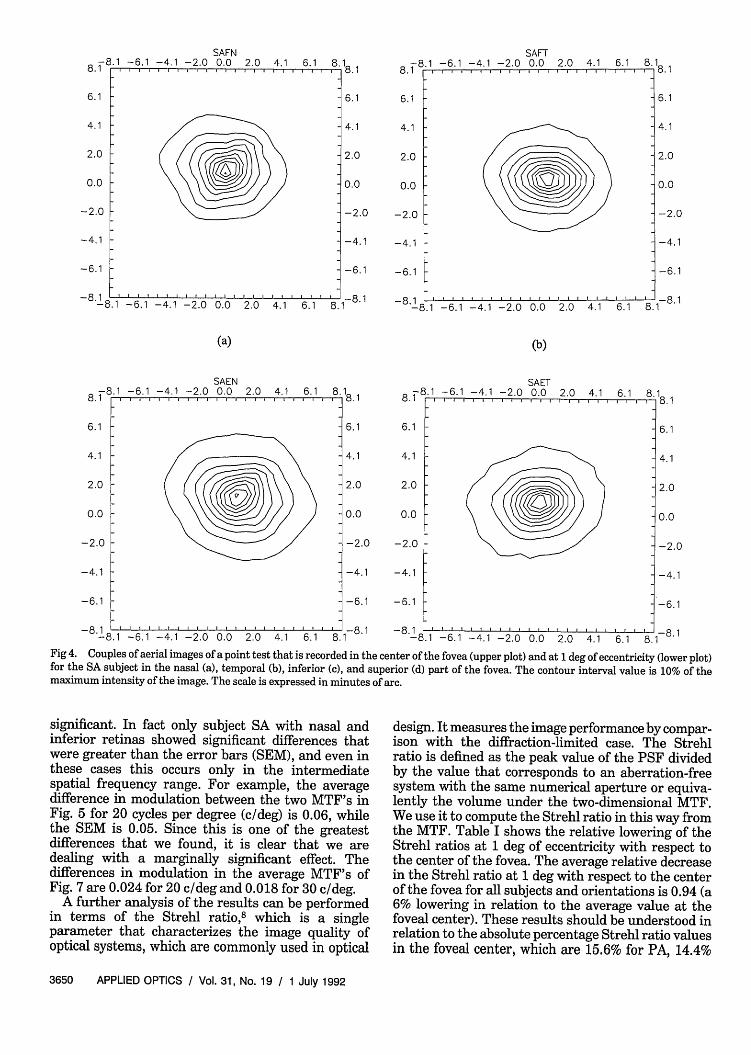
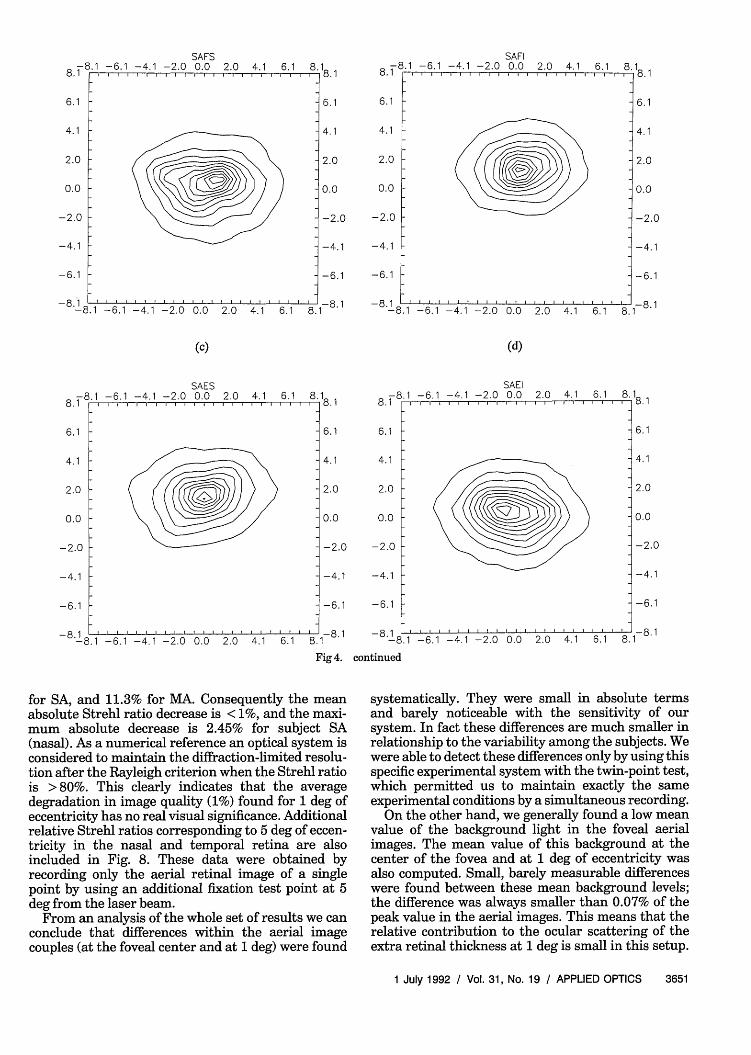
Among the three subjects SA showed the greatestdifferences in image quality between the center and 1deg in the fovea. A possible explanation for this is thatsubject SA could have a steeper foveal pit, whichindicates a thicker retina at 1 deg. Figure 4 showsfour pairs of simultaneously recorded aerial images
for subject SA. One always corresponds to the centerof the fovea (upper plot) and the second to 1 deg ofeccentricity (lower plot) in the four different orienta-tions: nasal (a), temporal (b), superior (c), and infe-rior (d). The results are shown as contour plots withthe contour interval being 10% of the peak value. Thecontour plots that correspond to the other subjectsare not represented here, but the differences withinthe image couples are always smaller than in the caseof SA. These contour graphs present small but cleardifferences within all retinal image couples, withthose obtained at 1 deg always spread more signifi-cantly. It must be noted that small variations in theaerial images are substantially marked on the con-tour graphs. We can also appreciate small differencesbetween the four aerial images that correspond to thecenter of the fovea, since they were recorded indepen-dently (see Fig. 4). These variations are not statisti-cally significant and illustrate the experimental incer-titude of our measurements, which is mainly a resultof the effect of the accommodation stimulus on therefractive state of the eye. As we have recentlyshown14 a different stimulus of accommodation couldproduce small changes in the shape of the PSF. Inthis particular case the position of the second pointtest (horizontal or vertical) could slightly affect therecorded shape of the aerial image in the center of thefovea. In any case this illustrates why it is necessaryto record the coupling of points simultaneously.
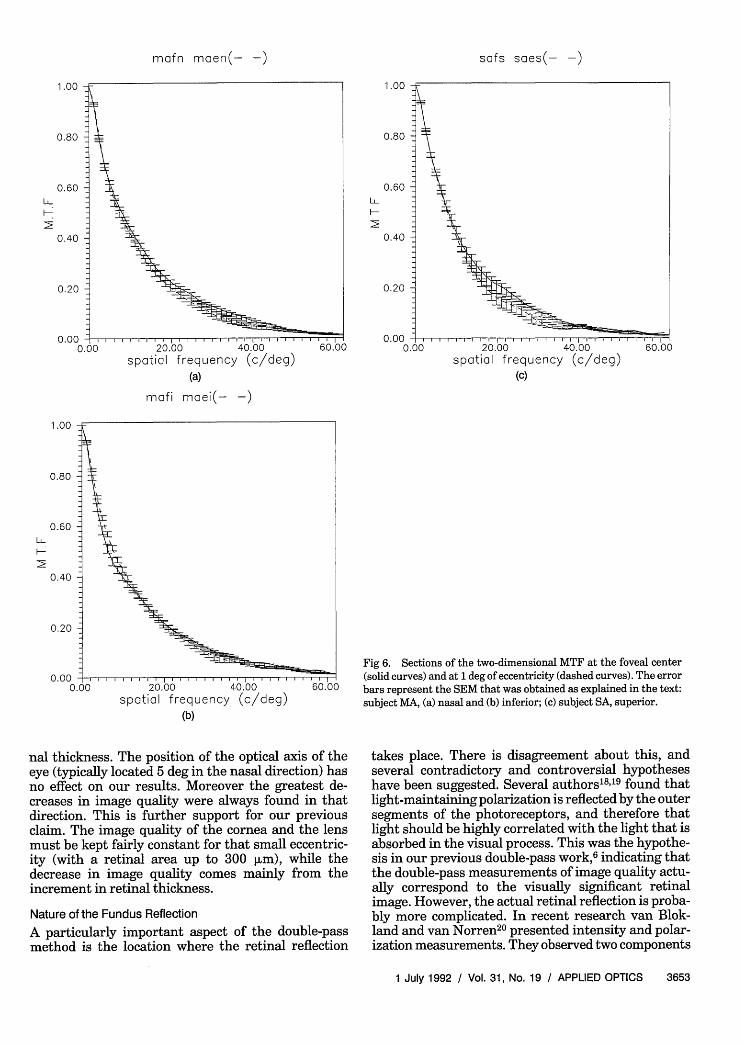
The two-dimensional MTF's were computed fromthe aerial images as mentioned before. Two examplesof MTF's corresponding to the SA subject for thecenter and for 1 deg of nasal fovea (where the greatestdifference was found) are plotted in Fig. 5. Thecontour plots in this case consist of ten contour linesranging from 95% to 5% of the maximum of themodulation in a linear scale. Figure 5 shows that thetwo-dimensional shape of the MTF appears to beaffected slightly by the retina, since the MTF is a littlebetter at the center of the fovea. In addition, to allowan easier relative comparison, one-dimensional sec-tions of the MTF's are also shown in Fig. 6. Each plotcontains sections of the two MTF's that are obtainedfrom a couple of aerial images. Their correspondingerrors bars (the SEM) are also included to show thevariability of the experimental measurements. Wehave included only three pairs of MTF sections for thesake of simplicity: a 1-deg nasal (a) and inferior (b)retina for subject MA, and a 1-deg superior (c) retinafor subject SA, respectively. Figure 7 presents theaverage radial profiles of the four MTF's for the SAsubject at the central fovea, and all orientations of 1deg are plotted by using a logarithmic vertical axis.This set of MTF sections summarizes the mostrelevant results in order to analyze the effect of theretinal thickness. In general, for all subjects andorientations, the lower values of the MTF are alwaysfound at 1 deg of foveal eccentricity when comparedwith the central MTF. However, these systematicdifferences are small and always close to our experi-mental errors. Thus they are marginally statistically
1 July 1992 / Vol. 31, No. 19 / APPLIED OPTICS 3649
SAFN-6.1 -4.1 -2.0 0.0 2.0 4.1 6.1 8
-6.1 -4.1 -2.0 0.0 2.0 4.1 6.1 8.
8.1 .1
6.1 6.1
4.1 4.1
2.0 2.0
0.0 0.0
-2.0
-4.1
-6.1
-8.1
-2.0
-4.1
-6.1
-8.1 ~-8.I-
(a)
SAFT-6.1 -4.1 -2.0 0.0 2.0 4.1 6.1 8.1W i | I,,,,, 8.1
-6.1 -4.1 -2.0 0.0 2.0 4.1 6.1 8
6.1
4.1
2.0
0.0
-2.0
-4.1
-6.1
. 1
(b)
-6.1 -4.1 -2.0SAEN0.0
-6.1 -4.1 -2.0 0.0
2.0 4.1 6.1 8 1i I i I . . .i, . ,i|8.1 8.- 8 l
6.1 6.1
4.1 4.1
2.0 2.0
0.0 0.0
-2.0
-4.1
-6.1
-2.0
-4.1
-6.1
, I | 1-8.1 - 81 L2.0 4.1 6.1 8.1 -8.1
SAET-6.1 -4.1 -2.0 0.0 2.0 4.1 6.1
-6.1 -4.1 -2.0 0.0 2.0
6.1
4.1
2.0
0.0
-2.0
-4.1
-6.1
4.1 6.1 8.1' 3
Fig 4. Couples of aerial images of a point test that is recorded in the center of the fovea (upper plot) and at 1 deg of eccentricity (lower plot)for the SA subject in the nasal (a), temporal (b), inferior (c), and superior (d) part of the fovea. The contour interval value is 10% of themaximum intensity of the image. The scale is expressed in minutes of arc.
significant. In fact only subject SA with nasal andinferior retinas showed significant differences thatwere greater than the error bars (SEM), and even inthese cases this occurs only in the intermediatespatial frequency range. For example, the averagedifference in modulation between the two MTF's inFig. 5 for 20 cycles per degree (c/deg) is 0.06, whilethe SEM is 0.05. Since this is one of the greatestdifferences that we found, it is clear that we aredealing with a marginally significant effect. Thedifferences in modulation in the average MTF's ofFig. 7 are 0.024 for 20 c/deg and 0.018 for 30 c/deg.
A further analysis of the results can be performedin terms of the Strehl ratio,8 which is a singleparameter that characterizes the image quality ofoptical systems, which are commonly used in optical
design. It measures the image performance by compar-ison with the diffraction-limited case. The Strehlratio is defined as the peak value of the PSF dividedby the value that corresponds to an aberration-freesystem with the same numerical aperture or equiva-lently the volume under the two-dimensional MTF.We use it to compute the Strehl ratio in this way fromthe MTF. Table I shows the relative lowering of theStrehl ratios at 1 deg of eccentricity with respect tothe center of the fovea. The average relative decreasein the Strehl ratio at 1 deg with respect to the centerof the fovea for all subjects and orientations is 0.94 (a6% lowering in relation to the average value at thefoveal center). These results should be understood inrelation to the absolute percentage Strehl ratio valuesin the foveal center, which are 15.6% for PA, 14.4%
3650 APPLIED OPTICS / Vol. 31, No. 19 / 1 July 1992
-88.1r
6.1
4.1
2.0
0.0
-2.0
-4.1
-6.1
.1
-8.1 .-8.
8.1 r--.
E
6.1
4.1
2.0
0.0
-2.0
-4.1
-6.1
-8. 13.1
- . . . . . . . . . . . . . . . .~~~~~~~~~~~~~~~~~~~~~~~~~~~~~~~~~~~~~~~~~~~~~~~~~~~..... . . .. .... .
. . I . I . . I . . I I . . . . . . . . . . .
.1. . . . . I . . . . . . . . . . . . . . .
.. . . . . . . . . . . . . . .
l l l l l l l l l l l l l . . . . . . . . . . . . . . .
l
i 18.1
I
8. 1 I . I. I . I
. I I . IQ 1I I
SAFS-6.1 -4.1 -2.0 0.0 2.0 4.1 6.1
-6.1 -4.1 -2.0 0.0 2.0 4.1 6.1
(c)
1 8. 8.1
6.1
4.1
2.0
0.0
-2.C
-4.1
-6.1
-81
8.1
6.1
4.1
2.0
0.0
.9 n
-4.1
-6.1
-8.1 -8.
SAFI-6.1 -4.1 -2.0 0.0 2.0 4.1
-6.1 -4.1 -2.0 0.0 2.0 4.1
(d)
-6.1 -4.1 -2.0SAES0.0 2.0 4.1 6.1 8
-6.1 -4.1 -2.0 0.0 2.0 4.1 6.1 8.
3 18.1 8.1 l
6.1 6.1
4.1 4.1
2.0 2.0
0.0 0.0
-2.0
-4.1
-6.1
-8.1
-2.0
-4.1
-6.1 -4.1 -2.0SAEI0.0 2.0 4.1 6.1
-6.1
-8.1 l..-8.1 -6.1 -4.1 -2.0 0.0 2.0 4.1
Fig 4. continued
for SA, and 11.3% for MA. Consequently the meanabsolute Strehl ratio decrease is < 1%, and the maxi-mum absolute decrease is 2.45% for subject SA(nasal). As a numerical reference an optical system isconsidered to maintain the diffraction-limited resolu-tion after the Rayleigh criterion when the Strehl ratiois > 80%. This clearly indicates that the averagedegradation in image quality (1%) found for 1 deg ofeccentricity has no real visual significance. Additionalrelative Strehl ratios corresponding to 5 deg of eccen-tricity in the nasal and temporal retina are alsoincluded in Fig. 8. These data were obtained byrecording only the aerial retinal image of a singlepoint by using an additional fixation test point at 5deg from the laser beam.
From an analysis of the whole set of results we canconclude that differences within the aerial imagecouples (at the foveal center and at 1 deg) were found
systematically. They were small in absolute termsand barely noticeable with the sensitivity of oursystem. In fact these differences are much smaller inrelationship to the variability among the subjects. Wewere able to detect these differences only by using thisspecific experimental system with the twin-point test,which permitted us to maintain exactly the sameexperimental conditions by a simultaneous recording.
On the other hand, we generally found a low meanvalue of the background light in the foveal aerialimages. The mean value of this background at thecenter of the fovea and at 1 deg of eccentricity wasalso computed. Small, barely measurable differenceswere found between these mean background levels;the difference was always smaller than 0.07% of thepeak value in the aerial images. This means that therelative contribution to the ocular scattering of theextra retinal thickness at 1 deg is small in this setup.
1 July 1992 / Vol. 31, No. 19 / APPLIED OPTICS 3651
-8 18.1 .
6.1
4.1
2.0
0.0
-2.0
-4.1
-6.1
-8 .'1I -8.1
6.1 8.1l~r 8.1
6.1
4.1
2.0
0.0
-2.0
-4.1
-6.1
6.1 8.1
8.8.1
6.1
4.1
2.0
0.0
-2.0
-4.1
-6.1
-8. 1 -8.
6.1
4.1
2.0
0.0
-2.0
-4.1
-6.1
6.1 8.10
.... I.... ...........
I I I I . I I I I I I I I I I I I I I~~~~~~
,.1
I I l I I I I I l l l I . I I. . I I I
.1
l l l l l l l l l l l l l l l l l l l l l l l
-I
T .11 '. . . .
I I I I IQ 1
,1
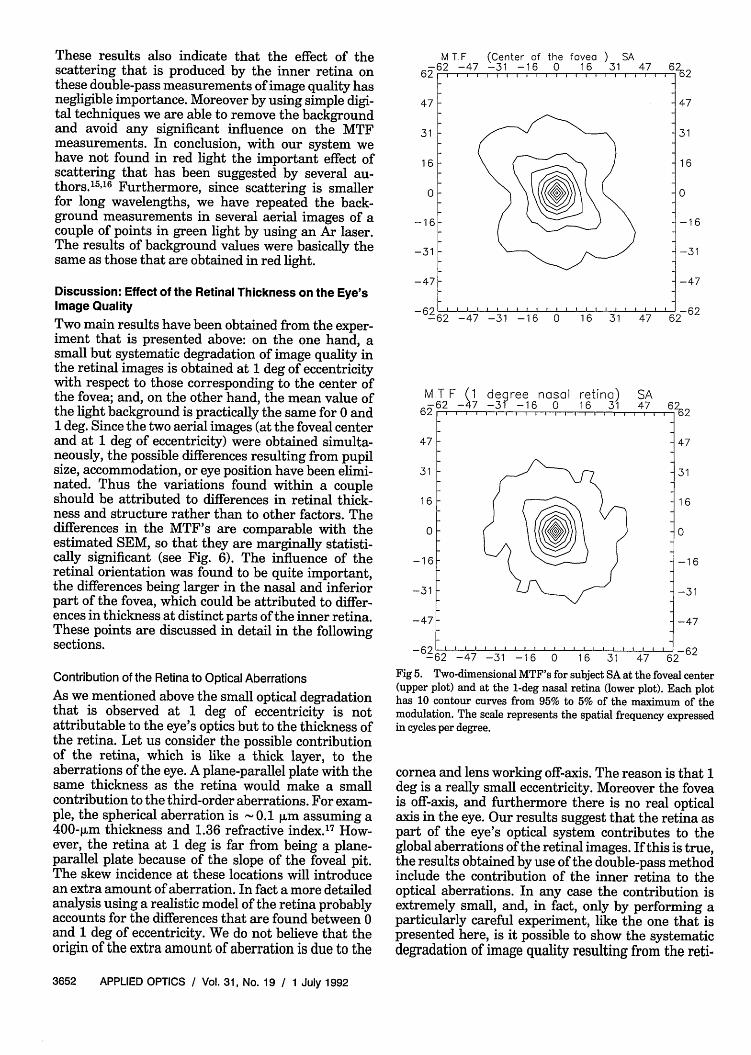
These results also indicate that the effect of thescattering that is produced by the inner retina onthese double-pass measurements of image quality hasnegligible importance. Moreover by using simple digi-tal techniques we are able to remove the backgroundand avoid any significant influence on the MTFmeasurements. In conclusion, with our system wehave not found in red light the important effect ofscattering that has been suggested by several au-thors.15 16 Furthermore, since scattering is smallerfor long wavelengths, we have repeated the back-ground measurements in several aerial images of acouple of points in green light by using an Ar laser.The results of background values were basically thesame as those that are obtained in red light.
Discussion: Effect of the Retinal Thickness on the Eye'sImage Quality
Two main results have been obtained from the exper-iment that is presented above: on the one hand, asmall but systematic degradation of image quality inthe retinal images is obtained at 1 deg of eccentricitywith respect to those corresponding to the center ofthe fovea; and, on the other hand, the mean value ofthe light background is practically the same for 0 and1 deg. Since the two aerial images (at the foveal centerand at 1 deg of eccentricity) were obtained simulta-neously, the possible differences resulting from pupilsize, accommodation, or eye position have been elimi-nated. Thus the variations found within a coupleshould be attributed to differences in retinal thick-ness and structure rather than to other factors. Thedifferences in the MTF's are comparable with theestimated SEM, so that they are marginally statisti-cally significant (see Fig. 6). The influence of theretinal orientation was found to be quite important,the differences being larger in the nasal and inferiorpart of the fovea, which could be attributed to differ-ences in thickness at distinct parts of the inner retina.These points are discussed in detail in the followingsections.
Contribution of the Retina to Optical Aberrations
As we mentioned above the small optical degradationthat is observed at 1 deg of eccentricity is notattributable to the eye's optics but to the thickness ofthe retina. Let us consider the possible contributionof the retina, which is like a thick layer, to theaberrations of the eye. A plane-parallel plate with thesame thickness as the retina would make a smallcontribution to the third-order aberrations. For exam-ple, the spherical aberration is - 0.1 ium assuming a400-pm thickness and 1.36 refractive index. 7 How-ever, the retina at 1 deg is far from being a plane-parallel plate because of the slope of the foveal pit.The skew incidence at these locations will introducean extra amount of aberration. In fact a more detailedanalysis using a realistic model of the retina probablyaccounts for the differences that are found between 0and 1 deg of eccentricity. We do not believe that theorigin of the extra amount of aberration is due to the
M -62
62
47
31
16
0
-16
-31
-47
- 62 -'--62
MT F-6262 r--r-
47
31
16
0
-16
-31
-47
T. F (Center of the fovea ) SA-47 -31 -16 0 16 31 47
-47 -31 -16
47
31
16
0
-16
-31
-47
' -620 1 6 31 47 62
-1 deyree nasal retina)7 -3 -16 0 1 6 31
SA47 62)
47
31
16
0
-16
-31
-47
-62 1 . . . . . . . . . . . . . .' -62-62 -47 -31 -16 0 1 6 31 47 62
Fig 5. Two-dimensional MTF's for subject SA at the foveal center(upper plot) and at the 1-deg nasal retina (lower plot). Each plothas 10 contour curves from 95% to 5% of the maximum of themodulation. The scale represents the spatial frequency expressedin cycles per degree.
cornea and lens working off-axis. The reason is that 1deg is a really small eccentricity. Moreover the foveais off-axis, and furthermore there is no real opticalaxis in the eye. Our results suggest that the retina aspart of the eye's optical system contributes to theglobal aberrations of the retinal images. If this is true,the results obtained by use of the double-pass methodinclude the contribution of the inner retina to theoptical aberrations. In any case the contribution isextremely small, and, in fact, only by performing aparticularly careful experiment, like the one that ispresented here, is it possible to show the systematicdegradation of image quality resulting from the reti-
3652 APPLIED OPTICS / Vol. 31, No. 19 / 1 July 1992
l l l l l l l l l l l .l l
6262
I Wo. I . . I .
mafn maen(- -)
U-I-
(a)
mafi maei(- -)
1.00
0.80
0.60U-
I-
0.40
0.20
0.0020.00 40.00
spatial frequency (c/deg)(b)
nal thickness. The position of the optical axis of theeye (typically located 5 deg in the nasal direction) hasno effect on our results. Moreover the greatest de-creases in image quality were always found in thatdirection. This is further support for our previousclaim. The image quality of the cornea and the lensmust be kept fairly constant for that small eccentric-ity (with a retinal area up to 300 [um), while thedecrease in image quality comes mainly from theincrement in retinal thickness.
Nature of the Fundus Reflection
A particularly important aspect of the double-passmethod is the location where the retinal reflection
spatial frequency(c)
Fig 6. Sections of the two-dimensional MTF at the foveal center(solid curves) and at 1 deg of eccentricity (dashed curves). The errorbars represent the SEM that was obtained as explained in the text:subject MA, (a) nasal and (b) inferior; (c) subject SA, superior.
takes place. There is disagreement about this, andseveral contradictory and controversial hypotheseshave been suggested. Several authors' 8"19 found thatlight-maintaining polarization is reflected by the outersegments of the photoreceptors, and therefore thatlight should be highly correlated with the light that isabsorbed in the visual process. This was the hypothe-sis in our previous double-pass work,6 indicating thatthe double-pass measurements of image quality actu-ally correspond to the visually significant retinalimage. However, the actual retinal reflection is proba-bly more complicated. In recent research van Blok-land and van Norren20 presented intensity and polar-ization measurements. They observed two components
1 July 1992 / Vol. 31, No. 19 / APPLIED OPTICS 3653
1 .00
0.80
0.60IU-
0.40
0.20
safs sces(- -)

I-
l- 0.1
0.01).60
0
a,
Q)
V,
0Q)
Q:
20.00 40.00 60.00spatial frequency (c/deg)
Fig 7. Radial profiles of the average of four MTF's that corre-spond to the SA subject for the central fovea (solid curve) and 1 degof eccentricity in all orientations (dashed curve). The vertical axis isa logarithmic scale to permit a better comparison.
in the retinal reflection: a wide scattering halo and aspecular component, which suggest that the reflec-tion takes place mainly at the pigment epithelium. Inaddition the models that they propose to explain theresults in spectral reflectance measurements 2 22 incor-porate a multilayer contribution to the reflectionincluding layers that are distant from such photore-ceptors as the sclera. Snodderly and Weinhaus23
suggested that retinal blood vessels contribute to theoptical image quality, although this should not affectthe fovea. Gorrand and Bacin15"16 carried out a seriesof experiments to study the retinal reflection charac-teristics, particularly to evaluate the optical quality ofthe inner retina and the effect of retinal scattering ondouble-pass methods. From those experiments theyconcluded that the double-pass method in generalunderestimates the image quality of the eye.
At this point we must first consider one importantcharacteristic of our experimental setup, i.e., the highmagnification that implies a small depth of focus.Throughout this experiment we used a 200-mm focallength in the zoom (although 300 mm is a moretypical value for single-point foveal experiments).This corresponds to a magnification of 12.5 x, andthen the depth of field is - 50 ,um for the 4-mm pupilsize, which is shorter than the length of the foveal
Table I. Strehl Ratio Relative Lowering at 1 Deg of Retinal Eccentricitywith Respect to the Center of the Fovea
Subjects
Fovea Part SA MA PA
Nasal 0.83 0.95Temporal 0.97 0.99Superior 0.94 1.00 0.98Inferior 0.84 0.94 0.93
MA SA (- -) PA (...)
1.0
0.9 -
0.8
0.7 -
0.6 -
0.5-5T
-3 -1 1 3retinal location (degrees)
5N
Fig 8. Relative Strehl ratio with respect to that of the center ofthe fovea in the horizontal meridian from 5 deg temporal (T) to 5deg nasal (N). Solid curve, subject SA; dashed curve, subject MA;dotted curve, subject PA.
cones [typically 70 ,um (Ref. 24)]. This means that, inour double-pass system, light coming from a layerdistant from the focusing plane should not contributeto the aerial image except with a diffuse background.This argument especially concerns the amount oflight that could possibly be reflected by the sclera orblood vessels, which we could not detect in ourmeasuring apparatus.
The results that are presented here are additionaldata to be added to the scattered set of evidence forunderstanding the nature of retinal reflection. Inparticular we mention briefly a recent experiment byNavarro and Williams25 that consists of a comparisonof subjective versus objective best focus positions inthe fovea and near periphery. The focus differenceswere not statistically significant and never greaterthan the length of the outer segment of the fovealcones.
The model for the foveal reflection that fits with theresults is as follows: the optical image is focused ontothe plane of the photoreceptors, probably close to theouter segments, the light is waveguided and reflectedby the pigment epithelium; it returns (initially guidedalso by the outer segments) and then becomes adiverging beam until it is refocused by the eye'soptical system. Many previous experimental re-sults,20'2 ' the focusing experiment, and all the find-ings from this study are in agreement with thissimple model, and in the next section we discuss moreevidence for this.
Breaking the Coherence. Retinal Reflection: Diffuse orSpecular?We discuss at this point that which is crucial andsometimes misunderstood concerning the double-
3654 APPLIED OPTICS / Vol. 31, No. 19 / 1 July 1992
Averaged radia profile favea\ Averaged radial profile 1 degree
/// ..-
/ ,- *
/'"
1 rs1
l l

pass measurement. It is common to read in theliterature that the second pass can be consideredincoherent if the retina acts as a perfectly diffusingsurface. This is not exactly correct, since to break thespatial coherence it is necessary to pass the coherentbeam through a moving diffuser with the movementbeing faster than the measurement time. In ourparticular method the coherence is broken by averag-ing short-exposure images, which are equivalent toobtaining a long-exposure image. The coherence is infact broken by the ocular movements, while theretina acts as a diffuser. That diffuser is far fromperfect (Lambertian); it is composed of many smallwaveguides (cones) with high directionality. Camp-bell and Gubisch2 investigated the reflection proper-ties of the retina from the measurements that weremade by using their particular setup with white light.They found a power of 4 dependence of the totalreflected flux on the pupil diameter d4. This corre-sponds to a completely diffuse component, while apower of 2 dependence d2 indicates a specular reflec-tion. Posterior researchers18'2 6 did not find that d4
dependence, but this question remains unclear be-cause of a general understanding that diffuse reflec-tion is a necessary and sufficient condition for obtain-ing the ocular MTF as the square root of the double-pass MTF. To continue on this point, we measuredthe aerial retinal image of a point using the sameexperimental setup as depicted in Fig. 1 but includingdifferent artificial pupils by using an additional afocalsystem consisting of two identical lenses. With thesame incident irradiance the relative reflected totalintensity of the aerial images was computed as afunction of the pupil diameter. We repeated themeasurements by placing an artificial eye consistingof a lens and a perfect diffuser in its focal plane. Theresults from studing one subject and the artificial eyeare plotted in Fig. 9 along with the two theoreticalcurves d2 (specular) and d4 (diffuse). Our data, thatwere obtained with a monochromatic red light, arenear but below the d2 curve. The lower values thatare found for large pupils are a clear consequence ofthe retinal waveguiding by the cones, which gives ahighly directional beam, which can be interpreted asthe effect of a smaller (apodizing) effective pupil size.These results along with other experimental clueslead us to believe that in our double-pass configura-tion the recorded aerial images correspond not only toa specular component but to a highly directional one.This is further support for the previously proposedmodel. The reflection in the retina produces a high-contrast speckle in the aerial images, but it appearsthat the retina is not a perfect diffuser at all. On thecontrary one could think of an array of small andshort optical fibers in front of a rough black screen.The speckle is produced by phase differences result-ing from the distinct fiber length and position andalso by the roughness of the black screen. Theaverage of short-exposure images achieves speckleblurring, and then the second pass can be consideredincoherent. It must be noted that even with a perfect
0,
0 -E 60-
. -0 -. -
C 40-
C- -
>C -
C) -a 20-
. _
C
n,
>l
4 5 6pupil diameter (mm)
7
Fig 9. Experimental results of the relative reflected flux in theaerial image for subject PA (*) and for an artificial eye with aperfect diffuser (+) as a function of pupil diameter d. The solidcurve shows the d2 dependence and the dashed curve the d4
dependence.
diffuser the short-exposure images would be perfectlycoherent, and only when the diffuser is moving is thespeckle removed and the coherence broken.
The effect of directionality on reflection is anotherrelated detail to be considered briefly, although it isthe subject of a recent paper.27 In that work thedirectionality of the retinal reflection was simulatedby an apodizing pupil, and then the aerial imageswere recomputed from the wave aberration. Thedirectionality of the retinal reflection causes thedouble-pass MTF to be slightly worse than the actualMTF. However, when the Stiles-Crawford effect isincluded in the calculation of the postreceptor MTF ittends to compensate finally for the effect of retinaldirectionality.
Conclusions
We have presented an experimental system based onone that was previously developed to measure thePSF of the eye, which allows the simultaneous record-ing of the double-pass aerial images of a couple oftwin points, one placed at the foveal center and thesecond at 1 deg of eccentricity at different retinalorientations. With that system we performed anexperiment in which we try to evaluate the contribu-tion of retinal thickness to the optical aberrations ofthe eye and its influence on the image quality measure-ments that were obtained by the double-pass method.The small differences observed in the aerial imagesmust arise exclusively from the thickness variationsacross the foveal pit, while other possible experimen-tal variable factors have been avoided with thisparticular procedure. In this way we have been able tofind a small but systematic degradation in 1-degaerial images with respect to those that correspond tothe foveal center, which is more marked in the nasal
1 July 1992 / Vol. 31, No. 19 / APPLIED OPTICS 3655
+
I *
ofllls~~~Illlllllllllllllll
v
and inferior retina for all subjects that have beenmeasured so far. These differences are marginallystatistically significant, since they are comparablewith the SEM of the MTF's. These differences can beexplained by considering the inner retina as part ofthe optical system of the eye with a small contributionto the optical aberrations. In any case this contribu-tion is so small that it cannot be considered relevantto vision. In addition we found no truly importantcontribution of the retinal scattering to our measure-ments. The nature of retinal reflection was alsoconsidered. We measured the reflected flux in theaerial images as a function of the pupil diameter andobtained a result near but below a d2 dependence,which corresponds to a specular reflection in theretina. Our results fit those obtained in an array ofwaveguides with high directionality. The aerial im-ages show a high-contrast speckled structure, butwhen averaging the frames the speckle is blurred,which leads to an effective break in the coherence.This allows the computation of the ocular MTF as thesquare root of the external MTF. A model of thefoveal reflection fit with the data consists of consider-ing first that the optical image is focused on a planethat is close to the cone's outer segments. The light isguided by the cones, and after reflection in thepigment epithelium it is guided back again throughthe photoreceptors.
As a final and indirect conclusion the results pre-sented here are additional evidence supporting thereliability of the double-pass method for assessing theimage quality of the human eye.
The authors thank A. Arribas, S. Bafia, and C.Martinez for help as observers and also with the dataprocessing. The diffractive elements were made at theInstitut d'Optique, Orsay, France with the advice andhelp of Pierre Chavel. Continued discussions withDavid Williams from the University of Rochesterwere also useful. This work was supported by theComisi6n Interministrial de Ciencia y Tecnologia(CICYT), Spain, under grant PRONTIC-P18-88/88-0198.
References1. A. Ivanoff, Les aberrations de l'Oeil (Editions de la Revue
d'Optique, Paris, 1953).2. F. W. Campbell and R. W. Gubisch, "Optical performance of
the human eye," J. Physiol (London) 186, 558-578 (1966).3. M. F. Flamant, "Etude de la repartition de lumiere dans
l'image retinienne de'une fente," Rev. Opt. 34, 433-459(1955).
4. J. Krauskopf, "Light distribution in human retinal images," J.Opt. Soc. Am. 52, 1046-1050 (1962).
5. A. Arnulf, J. Santamaria, and J. Besc6s, "A cinematographicmethod for the dynamic study of the image formation by thehuman eye. Microfluctuations of the accommodation," J. Opt.12, 123-128 (1981).
6. J. Santamarfa, P. Artal, and J. Besc6s, "Determination of the
point-spread function of the human eye using a hybrid opticaldigital method," J. Opt. Soc. Am. A 4, 1109-1114 (1987).
7. P. Artal, J. Santamarfa, and J. Besc6s, "Phase transferfunction of the human eyes and its influence on the pointspread function and wave aberration," J. Opt. Soc. Am. A, 5,1791-1795 (1988).
8. M. Born and E. Wolf, Principles of Optics (Pergamon, Oxford,1970).
9. P. Artal, J. Santamarfa, and J. Besc6s, "Retrieval of the waveaberration function of the human eyes from actual point-spread functions," J. Opt. Soc. Am. A 5, 1201-1206 (1988).
10. P. Artal, "Calculations of two-dimensional foveal retinal im-ages in real eyes," J. Opt. Soc. Am. A 7, 1374-1381 (1990).
11. P. Artal and R. Navarro, "Image quality and photoreceptordistribution," in Ophthalmic and Visual Optics (Optical Soci-ety of America, Washington, D.C., 1991), Vol. 2, pp.10- 13 .
12. N. Streibl, "Beam shaping with optical array generators," JMod. Opt. 36, 1559-1573 (1989).
13. D. Sliney and M. Wolbarsht, Safety with Lasers and OtherOptical Sources (Plenum, New York, 1980).
14. R. Navarro, M. A. Losada, D. Geslin, and P. Artal, "The effectof visual stimulus on the eye's refractive state monitored withthe aerial retinal image," in Ophthalmic and Visual Optics(Optical Society of America, Washington, D.C., 1991), Vol. 2,pp 38-41.
15. J. M. Gorrand and F. Bacin, "Use of reflecto-modulometry tostudy the optical quality of the inner retina," Ophthalmol.Physiol. Opt. 9, 198-204 (1989).
16. J. M. Gorrand, "Reflection characteristics of the human foveaassessed by reflectomodulometry," Ophthalmol. Physiol. Opt.9, 53-60 (1989).
17. W. J. Smith, Modern Optical Engineering (McGraw-Hill, NewYork, 1966).
18. R. Rholer, U. Miller, and M. Alberl, "Zur Messung derModulationbsubertragunsfuncktion des lebenden menschli-chen Auges im reflektierten Licht," Vision Res. 9, 407-428(1969).
19. D. O'Leary and M. Millodot, "The discrepancy between retin-oscopy and subjective refraction: effect of light polarization,"Am. J. Optom. Physiol. Opt. 55, 553-556 (1978).
20. G. J. van Blokland and D. van Norren, "Intensity and polariza-tion of light scattered at small angles from the human fovea,"Vision Res. 26, 485-494 (1986).
21. D. van Norren and L. F. Tiemeier, "Spectral reflectance of thehuman eye," Vision Res. 26, 313-320 (1986).
22. F. C. Delori and K. P. Pflibsen, "Spectral reflectivity of thehuman ocular fundus," Appl. Opt. 28, 1061-1077 (1989).
23. D. Max Snodderly and R. S. Weinhaus, "Retinal vasculature ofthe fovea of the squirrel monkey, Saimiri sciureus: Three-dimensional architecture, visual screening, and relationshipsto the neuronal layers," J. Comp. Neurol. 297, 145-163(1990).
24. R. W. Rodieck, The Vertebrate Retina (Freeman, San Fran-cisco, Calif., 1973).
25. R. Navarro, Instituto de Optica, Madrid, Spain, and D. R.Williams, University of Rochester, Rochester, New York 14627(personal communication, 1991).
26. W. N. Charman and J. A. M. Jennings, "Objective measure-ments of the longitudinal chromatic aberration of the humaneye," Vision Res. 16, 999-1006 (1976).
27. P. Artal, "Incorporation of directional effects of the retina intothe computations of the optical transfer function of humaneyes," J. Opt. Soc. Am. A 6, 1941-1944 (1989).
3656 APPLIED OPTICS / Vol. 31, No. 19 / 1 July 1992