
Toll and Bridge: Risk Assessment Framework update - UBS
15
Toll and Bridge: Risk Assessment Framework update Municipal Credit View | 4 December 2019 Chief Investment Office GWM Ted Galgano, Sr. Municipal Credit Strategist Americas, [email protected]; Sudip Mukherjee, Sr. Municipal Credit Strategist Americas, [email protected]; Jeannine Lennon, Municipal Credit Strategist Americas, [email protected]; Thomas McLoughlin, Head Americas Fixed Income, [email protected] • This is an update to the Toll road and Bridge risk framework Our credit framework covers toll roads owned and operated by the public sector. This is an important distinction, and one that is often overlooked by private investors. Privatization of assets has occurred in isolated instances but the US has generally favored public stewardship over private management of toll roads. The financial performance of new toll roads in the US has been plagued by faulty revenue forecasts. Heavy debt burdens have occasionally overwhelmed the ability of start-up toll roads to meet their financial obligations. We believe that well-established publicly owned toll roads with a long operating history (20+ years) are suitable investments for most municipal bond investors. Conversely, new toll roads are likely to exhibit higher revenue volatility, and will pose higher risk. The toll road and bridge sector, in general, are assigned lower CIO risk scores compared to some sectors. However, this sector tends to provide greater stability during economic downturns compared to the Healthcare and General Obligation sectors. Established tolled assets tend to demonstrate proven revenue generating capabilities as well as a history of expenditure control during recessionary periods. Since our last review, the sector has performed in line with long- term trends. Vehicle miles traveled ("VMT") increased in 2019 and crude oil prices declined, which typically are positive indicators for tolling assets. VMT is closely correlated with US gross domestic product ("GDP") and a reasonably good indicator for overall sector performance. CIO's outlook, for 2020, is for slow growth in GDP and inflation. We expect the revenue and expense dynamic to remain stable and credit quality to remain sound. Fig. 1: No. of obligors by CIO Risk Category . 1 11 11 5 1- Lowest 2- Low 3- Moderate 4- High 5- Highest Source:UBS, 2 December 2019 Overall, 22 of our 28 obligors fall in CIO Risk Category 2 and 3. Fig. 2: CIO framework includes 28 toll road and bridges in 16 states . VA ME NH NY OH OK TX PA FL IL CA CO DC MD DE NJ Source:UBS, 2 December 2019 This report has been prepared by UBS Financial Services Inc. (UBS FS). Please see important disclaimers and disclosures that begin on page 12.
-
Upload
khangminh22 -
Category
Documents
-
view
0 -
download
0
Transcript of Toll and Bridge: Risk Assessment Framework update - UBS

Toll and Bridge: RiskAssessment FrameworkupdateMunicipal Credit View | 4 December 2019
Chief Investment Office GWMTed Galgano, Sr. Municipal Credit Strategist Americas, [email protected]; Sudip Mukherjee, Sr. Municipal Credit Strategist Americas,
[email protected]; Jeannine Lennon, Municipal Credit Strategist Americas, [email protected]; Thomas McLoughlin, Head
Americas Fixed Income, [email protected]
• This is an update to the Toll road and Bridge risk framework
Our credit framework covers toll roads owned and operated bythe public sector. This is an important distinction, and one that isoften overlooked by private investors. Privatization of assets hasoccurred in isolated instances but the US has generally favoredpublic stewardship over private management of toll roads.
The financial performance of new toll roads in the US has beenplagued by faulty revenue forecasts. Heavy debt burdens haveoccasionally overwhelmed the ability of start-up toll roads to meettheir financial obligations. We believe that well-established publiclyowned toll roads with a long operating history (20+ years) aresuitable investments for most municipal bond investors. Conversely,new toll roads are likely to exhibit higher revenue volatility, and willpose higher risk.
The toll road and bridge sector, in general, are assigned lower CIOrisk scores compared to some sectors. However, this sector tendsto provide greater stability during economic downturns comparedto the Healthcare and General Obligation sectors. Established tolledassets tend to demonstrate proven revenue generating capabilitiesas well as a history of expenditure control during recessionaryperiods.
Since our last review, the sector has performed in line with long-term trends. Vehicle miles traveled ("VMT") increased in 2019 andcrude oil prices declined, which typically are positive indicators fortolling assets. VMT is closely correlated with US gross domesticproduct ("GDP") and a reasonably good indicator for overall sectorperformance. CIO's outlook, for 2020, is for slow growth in GDPand inflation. We expect the revenue and expense dynamic toremain stable and credit quality to remain sound.
Fig. 1: No. of obligors by CIO Risk Category
.
1
11
11
5 1- Lowest
2- Low
3- Moderate
4- High
5- Highest
Source:UBS, 2 December 2019
Overall, 22 of our 28 obligors fall in CIO RiskCategory 2 and 3.
Fig. 2: CIO framework includes 28 toll road andbridges in 16 states
.
VA
ME
NHNY
OH
OK
TX
PA
FL
IL
CA
CO DC
MD
DE
NJ
Source:UBS, 2 December 2019
This report has been prepared by UBS Financial Services Inc. (UBS FS). Please see important disclaimers and disclosuresthat begin on page 12.
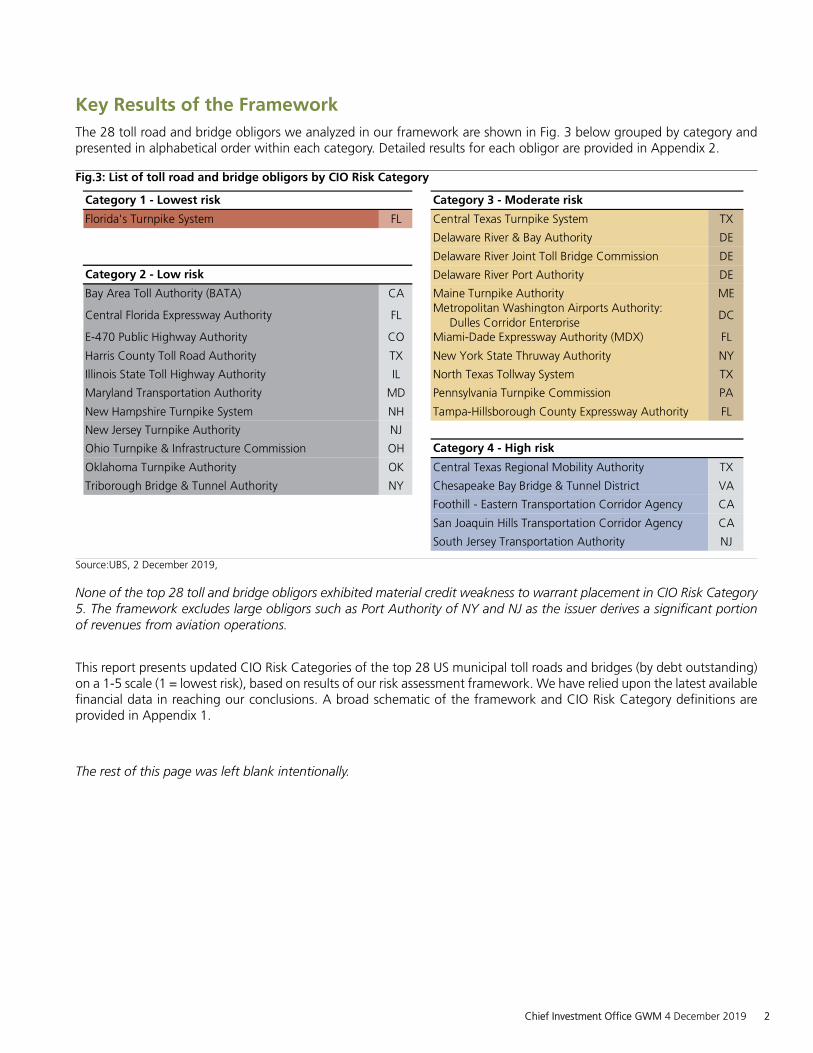
Key Results of the FrameworkThe 28 toll road and bridge obligors we analyzed in our framework are shown in Fig. 3 below grouped by category andpresented in alphabetical order within each category. Detailed results for each obligor are provided in Appendix 2.
Fig.3: List of toll road and bridge obligors by CIO Risk Category
.
Florida's Turnpike System FL Central Texas Turnpike System TX
Delaware River & Bay Authority DE
Delaware River Joint Toll Bridge Commission DE
Delaware River Port Authority DE
Bay Area Toll Authority (BATA) CA Maine Turnpike Authority ME
Central Florida Expressway Authority FLMetropolitan Washington Airports Authority:
Dulles Corridor EnterpriseDC
E-470 Public Highway Authority CO Miami-Dade Expressway Authority (MDX) FL
Harris County Toll Road Authority TX New York State Thruway Authority NY
Illinois State Toll Highway Authority IL North Texas Tollway System TX
Maryland Transportation Authority MD Pennsylvania Turnpike Commission PA
New Hampshire Turnpike System NH Tampa-Hillsborough County Expressway Authority FL
New Jersey Turnpike Authority NJ
Ohio Turnpike & Infrastructure Commission OH
Oklahoma Turnpike Authority OK Central Texas Regional Mobility Authority TX
Triborough Bridge & Tunnel Authority NY Chesapeake Bay Bridge & Tunnel District VA
Foothill - Eastern Transportation Corridor Agency CA
San Joaquin Hills Transportation Corridor Agency CA
South Jersey Transportation Authority NJ
Category 2 -Low risk
Category 4 -High risk
Category 1 -Lowest risk Category 3 -Moderate risk
Source:UBS, 2 December 2019,
None of the top 28 toll and bridge obligors exhibited material credit weakness to warrant placement in CIO Risk Category5. The framework excludes large obligors such as Port Authority of NY and NJ as the issuer derives a significant portionof revenues from aviation operations.
This report presents updated CIO Risk Categories of the top 28 US municipal toll roads and bridges (by debt outstanding)on a 1-5 scale (1 = lowest risk), based on results of our risk assessment framework. We have relied upon the latest availablefinancial data in reaching our conclusions. A broad schematic of the framework and CIO Risk Category definitions areprovided in Appendix 1.
The rest of this page was left blank intentionally.
Chief Investment Office GWM 4 December 2019 2

Risk Framework – Metrics and Key AssumptionsThe metrics we use to compute the quantitative risk assessment along with key assumptions are presented in the tablebelow. Metric data was provided by Merritt Research Inc. Metric definitions and their impact on the credit risk profile oftoll roads and bridges are provided in Appendix 3.
Fig. 4: Key metrics and framework assumptions
.
Risk DriverMetric
Weight-Roads
MetricWeight-Bridges
Direction ofInfluence
ThresholdScore 1
ThresholdScore 10
5.0% 5.0% Higher is better 135% 75%
12.5% 12.5% Higher is better 300,000 30,000
7.5% 7.5% Higher is better 10% -5%
10.0% 10.0% Higher is better 0% -15%
7.5% 10.0% Higher is better 10% -2%
12.5% 15.0% Higher is better 1,400 100
10.0% 12.5% Higher is better 85% 25%
7.5% 0.0% Lower is better 5 25
5.0% 0.0% Lower is better 1,000 10,000
10.0% 15.0% Lower is better 4.0 20.0
12.5% 12.5% Higher is better 3.0 0.5
Total 100%
Service Area & Market
Weight: 35%
Toll rate (cents per mile)
Metric
Median Household Income (% of US)
Traffic- number of vehicles
Growth in traffic (3 years %)
Great Recession traffic decline (%)
Leverage & Coverage
Weight: 27.5%
Total debt per lane mile
Total debt per EBIDA
Debt service coverage ratio
Revenue growth - expense growth (5 years)
Liquidity (Days Cash on hand)
EBIDA margin (2 year average)
Financial Performance
Weight: 37.5%
Source:UBS, 2 December 2019
Metrics are categorized under three broad risk drivers, Service Area & Market, Financial Performance and Leverage& Coverage that collectively determine the credit risk profile of a toll road and bridge obligor. The weight of a metric(determined by subjective and collective judgment of CIO analysts) reflects its relative importance in the computation ofthe Quantitative Risk Assessment. The direction of influence for a particular metric indicates if a higher or lower value ispreferable. For e.g. higher debt service coverage ratio is better as it leads to a lower risk profile on that metric.
Individual metrics are scored on 1-10 scale for each obligor. Threshold Score 1 and Threshold score 10 reflect the cut-off values for an obligor on that metric. The thresholds are set using a combination of subjective judgment and basicanalysis of median and the range of metric data. The scores in between 1 and 10 are assigned using an interpolationmethodology that fits a normal or lognormal distribution to the data as appropriate and in cases where a good fit is notobserved, a linear interpolation is used. The metric weights and scores are used to compute the weighted average riskscore for each obligor. Finally, some quantitative adjustments based on preset criteria are applied to determine the finalrisk score of an obligor that is compared to a preset risk score scale to determine the Quantitative Risk Assessment ona 1-5 scale (1 = lowest risk). For more details on the framework scoring methodology please refer to our Toll Road andBridge Obligors Risk Assessment Framework from last year.
We have made some changes to the framework (since our last publication) with regard to the calculation of a few met-rics, associated thresholds, weighting and interpolation computations. These changes are described in Appendix 4. Thetable above reflects current assumptions.
Since our last publication we made two mid-cycle CIO Risk Category adjustments (Illinois Toll Road and Miami-DadeExpressway) and we determined that not all sector frameworks will use the same risk score scale. The health care andstate frameworks use different risk score scales as discussed in each of those respective framework publications.
Chief Investment Office GWM 4 December 2019 3
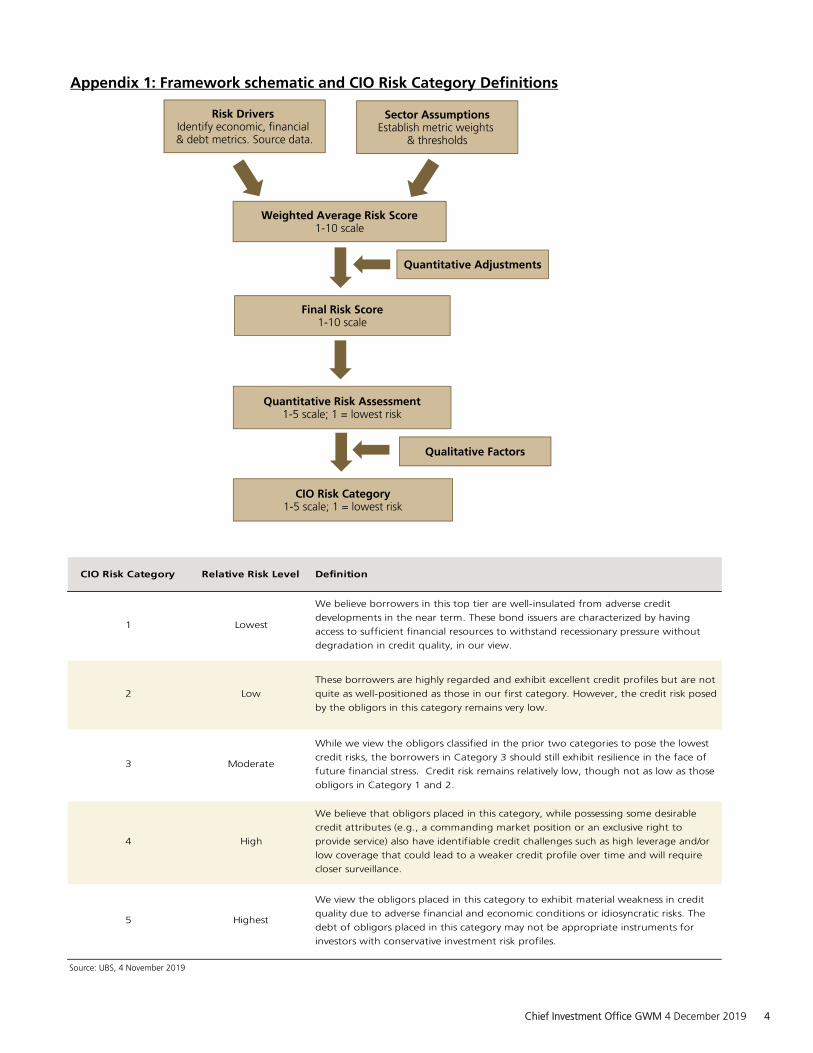
Appendix 1: Framework schematic and CIO Risk Category Definitions
Source: UBS, 4 November 2019
Risk Drivers Identify economic, financial & debt metrics. Source data.
Final Risk Score1-10 scale
Quantitative Risk Assessment1-5 scale; 1 = lowest risk
CIO Risk Category1-5 scale; 1 = lowest risk
Quantitative Adjustments
Weighted Average Risk Score1-10 scale
Sector AssumptionsEstablish metric weights
& thresholds
Qualitative Factors
CIO Risk Category Relative Risk Level Definition
1 Lowest
We believe borrowers in this top tier are well-insulated from adverse credit
developments in the near term. These bond issuers are characterized by having
access to sufficient financial resources to withstand recessionary pressure without
degradation in credit quality, in our view.
2 Low
These borrowers are highly regarded and exhibit excellent credit profiles but are not
quite as well-positioned as those in our first category. However, the credit risk posed
by the obligors in this category remains very low.
3 Moderate
While we view the obligors classified in the prior two categories to pose the lowest
credit risks, the borrowers in Category 3 should still exhibit resilience in the face of
future financial stress. Credit risk remains relatively low, though not as low as those
obligors in Category 1 and 2.
4 High
We believe that obligors placed in this category, while possessing some desirable
credit attributes (e.g., a commanding market position or an exclusive right to
provide service) also have identifiable credit challenges such as high leverage and/or
low coverage that could lead to a weaker credit profile over time and will require
closer surveillance.
5 Highest
We view the obligors placed in this category to exhibit material weakness in credit
quality due to adverse financial and economic conditions or idiosyncratic risks. The
debt of obligors placed in this category may not be appropriate instruments for
investors with conservative investment risk profiles.
Chief Investment Office GWM 4 December 2019 4

Appendix 2Note: Service Area & Market, Financial Performance and Leverage & Coverage scores are individual Risk Drivers which are used to compute the Quantitative Risk Assessment.
Obligor / Base Cusip State Obligor Description Total Debt
Outstanding(in USD mn)
Service Area &
Market
Financial Performance
Leverage & Coverage
Quantitative Risk
Assessment
CIO Risk
Category
Bay Area Toll Authority 072024
CA
The Bay Area Toll Authority (BATA) was created by an act of the state legislature in 1997and began operations in January 1998 as the successor agency to the CaliforniaTransportation Commission's northern and southern units of the San Francisco Bay Bridges.BATA's mandate is to manage the tolling system on seven Bay Area bridges. It is governedby a board of directors that consists of 18 members, 15 of which are appointed by publicentities in the Bay Area, and by three non-voting members appointed by state and federalagencies. In July 2005, BATA received independent toll-setting authority.
9,643 1 1 4 2 2
Central Florida Expressway Authority 153476
FL
The Central Florida Expressway Authority (CFX) was created in 2014 and assumed thegovernance and control of the former Orlando-Orange County Expressway Authority(OCX), which was established in 1963. The authority operates and maintains an integratedsystem of seven expressway toll roads spanning 118 miles of roadway in and around theCity of Orlando. The Authority is governed by ten board members whose most recentlyadopted policy in 2017 states that toll rates will be automatically adjusted at the higher ofCIP or 1.5% with differential prices for cash versus transponders.
2,894 1 2 3 2 2
Central Texas Regional Mobility Authority 155498
TX
Travis and Williamson Counties jointly filed a petition in 2002 to form the Central TexasRegional Mobility Authority (CTRMA or the "Authority") to construct, operate andmaintain transportation networks within the counties surrounding the rapidly growingAustin MSA. The Authority operates the 183 South Project, the Manor Expressway Project,183A Turnpike Project, 290E and SH71 and may include future road projects, bridges,tunnels upon Authority's board approval.
1,748 5 2 5 4 4
Central Texas Turnpike System 88283K
TX
The Central Texas Turnpike System (CTTS) is a network of three toll roads in the Austinarea owned and operated by the Texas Department of Transportation system. Full tolledoperation began in September 2008 for all 3 roads with 2009 constituting the first full yearof operation. A fourth toll road was subsequently added to the system in September 2012.
2,974 4 1 5 3 3
Chesapeake Bay Bridge & Tunnel District 16514P
VA
The Chesapeake Bay Bridge & Tunnel District (CBBTD or the "District") was created in1954 and includes the cities of Virginia Beach, Norfolk, Portsmouth, Chesapeake,Hampton, Newport News, and the counties of Northampton and Accomack. The District isgoverned by the Chesapeake Bay Bridge and Tunnel Commission who is authorized toestablish, construct, maintain, repair and operate a bridge or tunnel within the District tofacilitate the flow of traffic in the vicinity or to connect such project with a highway systemin the state. The Chesapeake Bay Bridge-Tunnel is the Commissions largest asset at 17.6miles long as well as various other tunnels, including one parallel tunnel currently underconstruction. The construction of the new Thimble Shoal Tunnel is under the ThimbleShoals Channel in the Chesapeake Bay and has increased the District's debt drastically.
Comment: The Chesapeake Bay Bridge & Tunnel District CIO Risk Category has again beenadjusted downward from its Quantitative Risk Assessment reflecting a higher risk profiledue to a large Capital Improvement Program which is being undertaken to expand thetunnel system. The project is currently running behind schedule and debt service isbackloaded relying upon traffic growth and/or toll increases. We does not foreseechanging the CIO Risk Category until significant construction progress has been made.
369 5 1 2 2 4
Delaware River & Bay Authority 246317
DE
The Delaware River & Bay Authority (the "Authority") was created in 1962 by a compactbetween the state of Delaware and the state of New Jersey for the purpose of operatingcrossings of the Delaware River and Delaware Bay between the two states. The Authorityowns and operates the twin spans of the Delaware Memorial Bridge, the Cape May- LewesFerry and the Delaware City- Salem Ferry. The first span of the bridge was opened to trafficin 1951 with the second span opening to traffic in 1968. The bridge links Route I-295 andthe New Jersey Turnpike and the Delaware Turnpike. The Authority has broad generalpowers of planning, financing, developing, maintaining and operating the Authority'sfacilities.
348 4 3 2 3 3
Chief Investment Office GWM 4 December 2019 5

Obligor / Base Cusip State Obligor Description Total Debt
Outstanding(in USD mn)
Service Area &
Market
Financial Performance
Leverage & Coverage
Quantitative Risk
Assessment
CIO Risk
Category
Delaware River Joint Toll Bridge Commission 246343
PA
The Delaware River Joint Toll Bridge Commission (the "Commission) has the full financialresponsibility for the cost of operation and maintenance of the toll-supported bridgeswithin its jurisdiction and control since 1984. The Commission has the power to acquire,construct, maintain and operate bridges across the Delaware River between Pennsylvaniaand New Jersey. The bridge system currently owns and operates twenty-one bridges, eightof which are tolled. The Commission may increase tolls after holding public meetings forcommunication purposes.
746 3 2 3 3 3
Delaware River Port Authority 246352
NJ
The Delaware River Port Authority (the "Authority") is a public state instrumentality of bothPennsylvania and New Jersey created in 1931. The Authority owns, controls and operatesthe collection of tolls for the small regional network of four bridges crossing the DelawareRiver in the greater Philadelphia metropolitan area.
1,417 4 2 2 3 3
E-470 Public Highway Authority 26822L
CO
In 1988, Adams County, Arapahoe County and Douglas County entered into anagreement to create the E-470 Public Highway Authority as a separate political subdivisionof the state for the purpose of financing and constructing beltways and othertransportation improvements. The first segment of the highway opened in 1991 with theremaining additions opening in 2003. The toll road is a 47-mile, limited-access commuterbeltway that feeds into the metropolitan Denver and provides a bypass around congestedareas.
1,465 3 2 3 2 2
Florida Turnpike System 343137
FL
The Department of Transportation is a decentralized agency authorized to acquire,construct, maintain and operate the Florida Turnpike System. The Turnpike is anestablished multi-asset, statewide system that has a long history of effective tollingoperations. It provides key transportation links between southern and central Florida. Rateincreases are subject to approval by the Florida Secretary of Transportation.
Comment: Even though Florida Turnpike System's Quantitative Risk Assessment moveddownward one category (from a 1 to a 2), we have kept its CIO Risk Category unchangedas a 1 given the movement was primarily driven by an increase in expenses which weexpect to be non-recurring.
2,575 2 2 1 2 1
Foothill/Eastern Transportation Corridor Agency 345105
CA
The Foothill Eastern Transportation Corridor Agency (FETCA or the "Agency") is a jointexercise of powers agency created in 1986 by Orange County and certain cities within theCounty. The corridor consists of 36 miles of high speed, electronically tolled, four-to-sixlane roads. The two toll roads that make up the corridor were partially opened in 1995 andfully completed in February 1999. Upon completion, the Foothill/Eastern System wasdeeded to the California Department of Transportation (Caltrans) who is responsible forpaying operation and maintenance costs of the system. The toll roads run through thecities of Anaheim and Santa Ana in Orange County, an affluent area of the state.
2,437 5 2 5 4 4
Harris County Toll Road Authority 414005
TX
The Harris County Toll Road Authority (HCTRA or the "Authority") was created in 1983and functions as a department of county government. The Authority exists for the purposeof implementing toll road projects, and not generally have responsibilities with respect toother non-toll road projects. The Authority operates approximately 127 miles of roadway inthe Houston / Harris County metropolitan area. The system connects with 12 miles of tollroads in Ft. Bend County, Brazoria, and Montgomery Counties, for a total of 139 miles.
2,463 3 2 1 2 2
Illinois State Toll Highway Authority 452252
IL
The Illinois State Toll Highway Authority (ISTHA) operates a tollway system that consists ofapproximately 296 miles of limited access highway in twelve counties in the northern partof Illinois, including the greater Chicago area. The large integrated system of toll roadsserves as an essential component of Chicago area’s transportation network and exhibitsstrong inelastic demand. ISTHA is governed by an 11-member Board of Directors thatincludes the Governor of Illinois and the Secretary of the Illinois Department ofTransportation. The Authority has by statute the autonomous right to set and collect tolls.
Comment: Illinois State Toll Highway Authority's CIO Risk Category was adjusted in a mid-cycle review on 14 May 2019. The lower risk score reflects a higher risk profile due tolegislation passed in January 2019 which decreases the autonomy of the Tollway Authorityfrom the state.
6,444 1 2 1 1 2
Maine Turnpike Authority 560551
ME
The Maine Turnpike Authority (the "Authority") was created in 1941 to operate andmaintain the turnpike system. The Maine Turnpike opened in 1947 and extends 109 milesfrom the Piscataqua River Bridge at the New Hampshire border to Augusta, Maine, thestate capital.
544 2 4 2 3 3
Chief Investment Office GWM 4 December 2019 6

Obligor / Base Cusip State Obligor Description Total Debt
Outstanding(in USD mn)
Service Area &
Market
Financial Performance
Leverage & Coverage
Quantitative Risk
Assessment
CIO Risk
Category
Maryland Transportation Authority 574300
MD
The Maryland Transportation Authority (MDTA) was created in 1971 and is responsible forthe supervision, financing, construction, operation and repair of certain revenue-producingtransportation facilities. The designated Transportation Facilities Projects under the TrustAgreement include seven asset that are essential to central Maryland's highway, bridgeand tunnel network, including interstate 95. The authority is comprised of the Chairmanand eight members appointed by the Governor of Maryland who are empowered to fix,revise, charge and collect rentals, rates, fees, tolls and other charges for transportationwithout specific legislative action.
2,186 1 3 2 2 2
Metropolitan Washington Airports Authority:Dulles Corridor Enterprise 592643
DC
The Metropolitan Washington Airports Authority was established in 1986 with the consentof Congress by legislation adopted by the District of Columbia and the Commonwealth ofVirginia. The Airports Authority is independent of DC, Virginia and the federal governmentand has independent toll setting ability. The Airports Authority assumed responsibility ofoperating the Dulles Toll Road in November 2008 from the Virginia Department ofTransportation. The toll road was constructed by VDOT and opened to traffic in 1984 andcurrently includes 112 total lane miles. It provides access to the rapidly growing northernVirginia region around the Dulles International Airport.
3,255 2 2 5 3 3
Miami-Dade Expressway Authority (MDX) 59334K
FL
The Miami-Dade County Expressway Authority was created in 1994 to establish localcontrol over toll revenues and to ease traffic congestion on five major expressways inMiami-Dade County. The passage of state legislation in 1996 enabled the Authority to takeover complete operational and financial control of the five expressways that comprise thesystem from the Florida Department of Transportation. The System's five urbanexpressways total 33.6 miles and connects the Miami International Airport with downtownMiami and Miami Beach. The system also serves a large commuter base in the Miami MSAproviding direct links to the Florida Turnpike.
Comment: Miami-Dade Expressway Authority (MDX) CIO Risk Category was adjusted in amid-cycle review on 25 April 2019. The adjustment reflects a higher risk profile due topolitical challenges between the Agency and the state which threatens to further restrictits ability to operate as a separate entity, inclusive of its ability to control its revenues andmaintain debt service coverage.
1,530 1 2 3 2 3
New Hampshire Turnpike System 644693
NH
The New Hampshire Turnpike System (the "System") began its operations in 1950 andconstitutes a bureau within the New Hampshire Department of Transportation (NHDOT).NHDOT is responsible for operating and maintaining the system. Consisting of three limitedaccess highways and 170 bridges, the System primarily serves the major cities located insouthern New Hampshire. The regional network includes 89 miles of limited accessconnects New Hampshire to Boston and Maine.
381 2 2 1 2 2
New Jersey Turnpike Authority 646140
NJ
The New Jersey Turnpike system consists of the New Jersey Turnpike and the Garden StateParkway. The turnpike is a limited access toll road that serves as part of the I–95 corridorlinking the major economic centers of the East Coast. Its connections to a major seaport inNewark and Elizabeth and Newark International airport make it an important route forboth commercial and passenger vehicles while also servicing New Jersey commuterstravelling to and from the areas surrounding Philadelphia and New York City.
11,332 1 3 3 2 2
New York State Thruway Authority 650010
NY
The New York State Thruway Authority (NYSTA) is a public corporation, created in 1950 bythe New York State Thruway Authority Act. This act empowered the authority to constructand maintain a 570-mile highway system which serves the nine largest cities in New YorkState and connects to major highways in Connecticut, Massachusetts, and New Jersey. Inaddition to the roadway, the Thruway operates 809 bridges including the Mario CuomoBridge (formerly known as Tappan Zee) and 384 buildings. The authority is governed by aboard of seven members appointed by the New York State governor with the board havingindependent authority to raise toll rates after a public hearing process.
5,858 1 3 5 3 3
North Texas Tollway System 66285W
TX
The North Texas Tollway Authority (NTTA) is a regional tollway authority established in1997, as the successor to the Texas Turnpike Authority, a state agency created in 1953.The system's assets include two bridges, one tunnel and four highways, approximately 150miles in length. The well-established tollway system serves the sizeable Dallas-Fort WorthMSA.
10,157 2 2 5 3 3
Chief Investment Office GWM 4 December 2019 7
Obligor / Base Cusip State Obligor Description Total Debt
Outstanding(in USD mn)
Service Area &
Market
Financial Performance
Leverage & Coverage
Quantitative Risk
Assessment
CIO Risk
Category
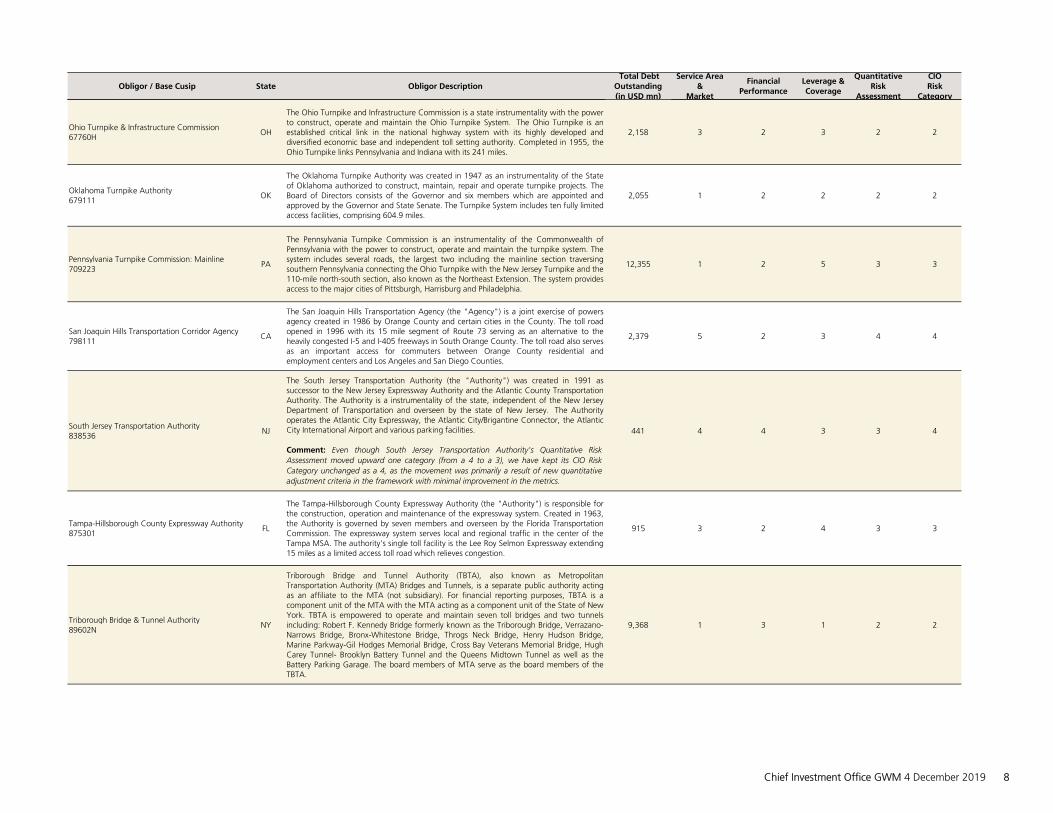
Ohio Turnpike & Infrastructure Commission 67760H
OH
The Ohio Turnpike and Infrastructure Commission is a state instrumentality with the powerto construct, operate and maintain the Ohio Turnpike System. The Ohio Turnpike is anestablished critical link in the national highway system with its highly developed anddiversified economic base and independent toll setting authority. Completed in 1955, theOhio Turnpike links Pennsylvania and Indiana with its 241 miles.
2,158 3 2 3 2 2
Oklahoma Turnpike Authority 679111
OK
The Oklahoma Turnpike Authority was created in 1947 as an instrumentality of the Stateof Oklahoma authorized to construct, maintain, repair and operate turnpike projects. TheBoard of Directors consists of the Governor and six members which are appointed andapproved by the Governor and State Senate. The Turnpike System includes ten fully limitedaccess facilities, comprising 604.9 miles.
2,055 1 2 2 2 2
Pennsylvania Turnpike Commission: Mainline 709223
PA
The Pennsylvania Turnpike Commission is an instrumentality of the Commonwealth ofPennsylvania with the power to construct, operate and maintain the turnpike system. Thesystem includes several roads, the largest two including the mainline section traversingsouthern Pennsylvania connecting the Ohio Turnpike with the New Jersey Turnpike and the110-mile north-south section, also known as the Northeast Extension. The system providesaccess to the major cities of Pittsburgh, Harrisburg and Philadelphia.
12,355 1 2 5 3 3
San Joaquin Hills Transportation Corridor Agency 798111
CA
The San Joaquin Hills Transportation Agency (the "Agency") is a joint exercise of powersagency created in 1986 by Orange County and certain cities in the County. The toll roadopened in 1996 with its 15 mile segment of Route 73 serving as an alternative to theheavily congested I-5 and I-405 freeways in South Orange County. The toll road also servesas an important access for commuters between Orange County residential andemployment centers and Los Angeles and San Diego Counties.
2,379 5 2 3 4 4
South Jersey Transportation Authority 838536
NJ
The South Jersey Transportation Authority (the "Authority") was created in 1991 assuccessor to the New Jersey Expressway Authority and the Atlantic County TransportationAuthority. The Authority is a instrumentality of the state, independent of the New JerseyDepartment of Transportation and overseen by the state of New Jersey. The Authorityoperates the Atlantic City Expressway, the Atlantic City/Brigantine Connector, the AtlanticCity International Airport and various parking facilities.
Comment: Even though South Jersey Transportation Authority's Quantitative RiskAssessment moved upward one category (from a 4 to a 3), we have kept its CIO RiskCategory unchanged as a 4, as the movement was primarily a result of new quantitativeadjustment criteria in the framework with minimal improvement in the metrics.
441 4 4 3 3 4
Tampa-Hillsborough County Expressway Authority 875301
FL
The Tampa-Hillsborough County Expressway Authority (the "Authority") is responsible forthe construction, operation and maintenance of the expressway system. Created in 1963,the Authority is governed by seven members and overseen by the Florida TransportationCommission. The expressway system serves local and regional traffic in the center of theTampa MSA. The authority's single toll facility is the Lee Roy Selmon Expressway extending15 miles as a limited access toll road which relieves congestion.
915 3 2 4 3 3
Triborough Bridge & Tunnel Authority 89602N
NY
Triborough Bridge and Tunnel Authority (TBTA), also known as MetropolitanTransportation Authority (MTA) Bridges and Tunnels, is a separate public authority actingas an affiliate to the MTA (not subsidiary). For financial reporting purposes, TBTA is acomponent unit of the MTA with the MTA acting as a component unit of the State of NewYork. TBTA is empowered to operate and maintain seven toll bridges and two tunnelsincluding: Robert F. Kennedy Bridge formerly known as the Triborough Bridge, Verrazano-Narrows Bridge, Bronx-Whitestone Bridge, Throgs Neck Bridge, Henry Hudson Bridge,Marine Parkway-Gil Hodges Memorial Bridge, Cross Bay Veterans Memorial Bridge, HughCarey Tunnel- Brooklyn Battery Tunnel and the Queens Midtown Tunnel as well as theBattery Parking Garage. The board members of MTA serve as the board members of theTBTA.
9,368 1 3 1 2 2
Chief Investment Office GWM 4 December 2019 8
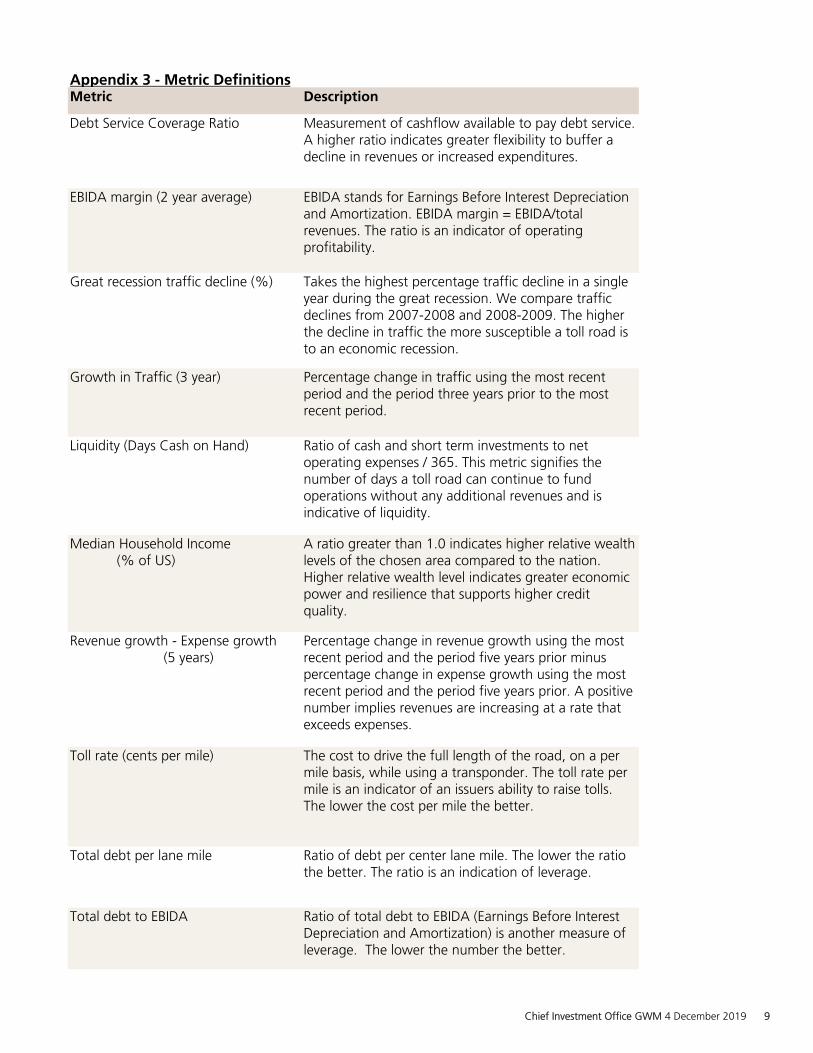
Metric Description
Debt Service Coverage Ratio Measurement of cashflow available to pay debt service. A higher ratio indicates greater flexibility to buffer a decline in revenues or increased expenditures.
EBIDA margin (2 year average) EBIDA stands for Earnings Before Interest Depreciation and Amortization. EBIDA margin = EBIDA/total revenues. The ratio is an indicator of operating profitability.
Great recession traffic decline (%) Takes the highest percentage traffic decline in a single year during the great recession. We compare traffic declines from 2007-2008 and 2008-2009. The higher the decline in traffic the more susceptible a toll road is to an economic recession.
Growth in Traffic (3 year) Percentage change in traffic using the most recent period and the period three years prior to the most recent period.
Liquidity (Days Cash on Hand) Ratio of cash and short term investments to net operating expenses / 365. This metric signifies the number of days a toll road can continue to fund operations without any additional revenues and is indicative of liquidity.
Median Household Income (% of US)
A ratio greater than 1.0 indicates higher relative wealth levels of the chosen area compared to the nation. Higher relative wealth level indicates greater economic power and resilience that supports higher credit quality.
Revenue growth - Expense growth (5 years)
Percentage change in revenue growth using the most recent period and the period five years prior minus percentage change in expense growth using the most recent period and the period five years prior. A positive number implies revenues are increasing at a rate that exceeds expenses.
Toll rate (cents per mile) The cost to drive the full length of the road, on a per mile basis, while using a transponder. The toll rate per mile is an indicator of an issuers ability to raise tolls. The lower the cost per mile the better.
Total debt per lane mile Ratio of debt per center lane mile. The lower the ratio the better. The ratio is an indication of leverage.
Total debt to EBIDA Ratio of total debt to EBIDA (Earnings Before Interest Depreciation and Amortization) is another measure of leverage. The lower the number the better.
Appendix 3 - Metric Definitions
Chief Investment Office GWM 4 December 2019 9

Appendix 4 - Changes to the Toll Road and Bridge Risk Framework
This note outlines the few changes that were made to the risk framework. While the basic framework
methodology, metric selection, and the overall risk score thresholds remain mostly unchanged from last
year, the following items were adjusted to improve the framework's quality of output:
1. Metric weight – The framework will use 11 metrics, down from 12 as shown in page 3 of the report.
The weighting of two metrics was changed (shown in table below) to account for the reduction in
metrics from 12 to 11 (see #2 below for metric change).
2. Metric change - One metric threshold was changed and one was removed. First, CIO changed the
Revenue growth/Expense growth metric to Revenue growth – Expense growth. The original metric
would give a counterintuitive result when expenses declined over the 5 year period.
Secondly, we have removed the local personal income metric from the framework as it is fairly
correlated to traffic levels and due to a change in the format of the data by our data provider.
3. Metric score interpolation
The interpolation formula to calculate metric scores between 1 and 10 was corrected for a minor
error. The effect of this change is that the bands from score 2-9 for each metric are generally a little
wider than in the previous version.
4. Quantitative adjustment criteria
The framework uses specified criteria that are used to make certain quantitative adjustments to the
risk scores for individual obligors, the intent being to capture outlier risk. We have changed our
quantitative adjustment due to unintended consequences it created. Therefore, we have
discontinued adding .50 points to the quantitative risk score if current debt service coverage
exceeded maximum annual debt service coverage by 1.25 or greater.
Metric Current Weight Prior Weight
Number of vehicles 12.5% 10.0%
Total debt to EBIDA 10.0% 7.5%
Local personal income 0.0% 5.0%
Revenue Growth-Expense Growth (5 years) 7.5% 10% -2%
Score 1
Threshold
Score 10
ThresholdMetric Weight
Chief Investment Office GWM 4 December 2019 10

The original intent of the test was to capture issuers that have high current debt service coverage
but required consistent growth in traffic and or revenue to provide coverage of maximum annual
debt service (MADS). We found a couple of instances where issuers required very little growth in
net revenues available for debt service and yet they were being penalized.
If a credit has acceptable current debt service
coverage (DSCR) but low maximum annual debt
service (MADS) coverage, it has a somewhat
increased reliance on traffic growth / greater risk
on future coverage
DSCR >=1.1 And MADS
coverage <=0.8 Or difference
between DSCR and MADS
>=1.25
DSCR >= 1.25
And MADS
coverage
<=.90
Risk score
raised by 0.5
implying
higher risk
Reason for Adjustment Prior Criteria New CriteriaRisk score
Adjustment
Chief Investment Office GWM 4 December 2019 11

Municipal Credit View
Appendix
Required Disclosures
Analyst Certification
Each research analyst primarily responsible for the content of this research report, in whole or in part, certifies thatwith respect to each security or issuer that the analyst covered in this report: (1) all of the views expressed accuratelyreflect his or her personal views about those securities or issuers; and (2) no part of his or her compensation was, is,or will be, directly or indirectly, related to the specific recommendations or views expressed by that research analystin the research report.
Statement of Risk
Municipal bonds - Although historical default rates are very low, all municipal bonds carry credit risk, with the degreeof risk largely following the particular bond’s sector. Additionally, all municipal bonds feature valuation, return, andliquidity risk. Valuation tends to follow internal and external factors, including the level of interest rates, bond ratings,supply factors, and media reporting. These can be difficult or impossible to project accurately. Also, most municipalbonds are callable and/or subject to earlier than expected redemption, which can reduce an investor’s total return.Because of the large number of municipal issuers and credit structures, not all bonds can be easily or quickly sold onthe open market.Disclaimer of Liability - This may contain information obtained from third parties, including ratings from credit ratingsagencies such as Standard & Poor's. Reproduction and distribution of third party content in any form is prohibitedexcept with the prior written permission of the related third party. Third party content providers do not guaranteethe accuracy, completeness, timeliness or availability of any information, including ratings, and are not responsible forany errors or omissions (negligent or otherwise), regardless of the cause, or for the results obtained from the use ofsuch content. THIRD PARTY CONTENT PROVIDERS GIVE NO EXPRESS OR IMPLIED WARRANTIES, INCLUDING, BUT NOTLIMITED TO, ANY WARRANTIES OF MERCHANTABILITY OR FITNESS FOR A PARTICULAR PURPOSE OR USE. THIRD PARTYCONTENT PROVIDERS SHALL NOT BE LIABLE FOR ANY DIRECT, INDIRECT, INCIDENTAL, EXEMPLARY, COMPENSATORY,PUNITIVE, SPECIAL OR CONSEQUENTIAL DAMAGES, COSTS, EXPENSES, LEGAL FEES, OR LOSSES (INCLUDING LOSTINCOME OR PROFITS AND OPPORTUNITY COSTS) IN CONNECTION WITH ANY USE OF THEIR CONTENT, INCLUDINGRATINGS. Credit ratings are statements of opinions and are not statements of fact or recommendations to purchase,hold or sell securities. They do not address the suitability of securities or the suitability of securities for investmentpurposes, and should not be relied on as investment advice.
UBS does and seeks to do business with issuers covered in its research reports. As a result, investors should be awarethat the firm may have a conflict of interest that could affect the objectivity of UBS research reports.Municipal Credit Views General Methodology DescriptionThe following are the key steps underlying the general methodology of the framework:■ Identify Risk Drivers: Identify broad factors that impact credit quality in a given sector (Risk Drivers). For example,
the Local Government framework utilizes three Risk Drivers; Economy & Tax Base, Financial Performance, and Long-term Liabilities whereas the Airport framework uses Service Area and Market, Financial Performance and Leverage& Coverage.
■ Select metrics (usually ratios and growth rates) that best represent each Risk Driver (typically 3-5 metrics per RiskDriver).
■ Assign a weight to each metric representing its relative importance. The sum of all metric weights equals 100%.■ Source relevant economic and financial data (from 3rd parties) and calculate each metric for each covered obligor
in the sector.■ Score each metric for each covered obligor on 1-10 scale (1 representing lowest risk). This involves the following:
a) Setting appropriate metric thresholds corresponding to a score of 1 and 10, b) Use basic statistical techniques tointerpolate for values in between 1 and 10.
■ Calculate a weighted average risk score for each covered obligor using individual metric weights and scores. Thisweighted average score also lies between 1 and 10.
■ Compute a final risk score for each covered obligor by making quantitative adjustments to the weighted averagescore (per specified criteria) to reflect "outlier risk": a) Reward/penalty for very strong or very adverse performanceon any Risk Driver, b) This typically affects a small number of covered obligors in a sector.
Chief Investment Office GWM 4 December 2019 12

Municipal Credit View
Appendix
■ Compare the risk score (1-10) for each covered credit to a pre-specified scale to assign a Quantitative RiskAssessment to each obligor. The Quantitative Risk Assessment is a number from 1-5.
■ Assign a CIO Risk Category (1-5) to each obligor reflecting CIO s overall view of the obligor. The respectivedefinitions are shown in the next section. The CIO Risk Category is: a) based on Quantitative Risk Assessment +Qualitative factors, b) the same as the Quantitative Risk Assessment for the vast majority of covered obligors.
■ Prepare a table of key results of the framework. For each covered obligor the table shows: a) A description on howit performed on each risk driver, b) The Quantitative Risk Assessment, c) The CIO Risk Category, d) An explanationif the CIO Risk Category differs from the Quantitative Risk Assessment.
CIO Risk Category DefinitionsCategory 1 (Lowest): We believe borrowers in this top tier are well-insulated from adverse credit developments inthe near term. These bond issuers are characterized by having access to sufficient financial resources to withstandrecessionary pressure without degradation in credit quality, in our view.Category 2 (Low): These borrowers are highly regarded and exhibit excellent credit profiles but are not quite as well-positioned as those in our first category. However, the credit risk posed by the obligors in this category remains very low.Category 3 (Moderate): While we view the obligors classified in the prior two categories to pose the lowest creditrisks, the borrowers in Category 3 should still exhibit resilience in the face of future financial stress. Credit risk remainsrelatively low, though not as low as those obligors in Category 1 and 2.Category 4 (High): We believe that obligors placed in this category, while possessing some desirable credit attributes(e.g., a commanding market position or an exclusive right to provide service) also have identifiable credit challengessuch as high leverage and/or low coverage that could lead to a weaker credit profile over time and will require closersurveillance.Category 5 (Highest): We view the obligors placed in this category to exhibit material weakness in credit quality due toadverse financial and economic conditions or idiosyncratic risks. The debt of obligors placed in this category may notbe appropriate instruments for investors with conservative investment risk profiles.
Rating Agencies Credit Ratings
S&P Moody's Fitch/IBCA Definition
AAA Aaa AAA Issuers have exceptionally strong credit quality. AAA is the best credit quality.
AA+
AA
AA-
Aa1
Aa2
Aa3
AA+
AA
AA-
Issuers have very strong credit quality.
A+
A
A-
A1
A2
A3
A+
A
A-
Issuers have high credit quality.
BBB+
BBB
BBB-
Baa1
Baa2
Baa3
BBB+
BBB
BBB-
Issuers have adequate credit quality. This is the lowest Investment Grade category.
Investment
Grade
BB+
BB
BB-
Ba1
Ba2
Ba3
BB+
BB
BB-
Issuers have weak credit quality. This is the highest Speculative Grade category.
B+
B
B-
B1
B2
B3
B+
B
B-
Issuers have very weak credit quality.
CCC+
CCC
CCC-
Caa1
Caa2
Caa3
CCC+
CCC
CCC-
Issuers have extremely weak credit quality.
CC
C
Ca CC+
CC
CC-
Issuers have very high risk of default.
Non-Investment
Grade D C DDD Obligor failed to make payment on one or more of its financial commitments. this is the lowest quality of the Speculative Grade
category.
Chief Investment Office GWM 4 December 2019 13

Municipal Credit View
Appendix
UBS Chief Investment Office's ("CIO") investment views are prepared and published by the Global Wealth Managementbusiness of UBS Switzerland AG (regulated by FINMA in Switzerland) or its affiliates ("UBS").The investment views have been prepared in accordance with legal requirements designed to promote theindependence of investment research.Instrument/issuer-specific investment research – Risk information:This publication is for your information only and is not intended as an offer, or a solicitation of an offer, to buy or sellany investment or other specific product. The analysis contained herein does not constitute a personal recommendationor take into account the particular investment objectives, investment strategies, financial situation and needs of anyspecific recipient. It is based on numerous assumptions. Different assumptions could result in materially different results.Certain services and products are subject to legal restrictions and cannot be offered worldwide on an unrestrictedbasis and/or may not be eligible for sale to all investors. All information and opinions expressed in this document wereobtained from sources believed to be reliable and in good faith, but no representation or warranty, express or implied, ismade as to its accuracy or completeness (other than disclosures relating to UBS). All information and opinions as well asany forecasts, estimates and market prices indicated are current as of the date of this report, and are subject to changewithout notice. This publication is not intended to be a complete statement or summary of the securities, marketsor developments referred to in the report. Opinions expressed herein may differ or be contrary to those expressed byother business areas or divisions of UBS as a result of using different assumptions and/or criteria.In no circumstances may this document or any of the information (including any forecast, value, index or othercalculated amount ("Values")) be used for any of the following purposes (i) valuation or accounting purposes; (ii) todetermine the amounts due or payable, the price or the value of any financial instrument or financial contract; or (iii)to measure the performance of any financial instrument including, without limitation, for the purpose of tracking thereturn or performance of any Value or of defining the asset allocation of portfolio or of computing performance fees.By receiving this document and the information you will be deemed to represent and warrant to UBS that you willnot use this document or otherwise rely on any of the information for any of the above purposes. UBS and any of itsdirectors or employees may be entitled at any time to hold long or short positions in investment instruments referredto herein, carry out transactions involving relevant investment instruments in the capacity of principal or agent, orprovide any other services or have officers, who serve as directors, either to/for the issuer, the investment instrumentitself or to/for any company commercially or financially affiliated to such issuers. At any time, investment decisions(including whether to buy, sell or hold securities) made by UBS and its employees may differ from or be contrary to theopinions expressed in UBS research publications. Some investments may not be readily realizable since the market inthe securities is illiquid and therefore valuing the investment and identifying the risk to which you are exposed may bedifficult to quantify. UBS relies on information barriers to control the flow of information contained in one or more areaswithin UBS, into other areas, units, divisions or affiliates of UBS. Futures and options trading is not suitable for everyinvestor as there is a substantial risk of loss, and losses in excess of an initial investment may occur. Past performance ofan investment is no guarantee for its future performance. Additional information will be made available upon request.Some investments may be subject to sudden and large falls in value and on realization you may receive back lessthan you invested or may be required to pay more. Changes in foreign exchange rates may have an adverse effect onthe price, value or income of an investment. The analyst(s) responsible for the preparation of this report may interactwith trading desk personnel, sales personnel and other constituencies for the purpose of gathering, synthesizing andinterpreting market information.Research publications from CIO are written by UBS Global Wealth Management. UBS Global Research is writtenby UBS Investment Bank. Except for economic forecasts, the research process of CIO is independent of UBSGlobal Research. As a consequence research methodologies applied and assumptions made by CIO and UBSGlobal Research may differ, for example, in terms of investment horizon, model assumptions, and valuationmethods. Therefore investment recommendations independently provided by the two UBS research organizationscan be different. The compensation of the analyst(s) who prepared this report is determined exclusively by researchmanagement and senior management (not including investment banking). Analyst compensation is not based oninvestment banking, sales and trading or principal trading revenues, however, compensation may relate to the revenuesof UBS as a whole, of which investment banking, sales and trading and principal trading are a part.Tax treatment depends on the individual circumstances and may be subject to change in the future. UBS does notprovide legal or tax advice and makes no representations as to the tax treatment of assets or the investment returnsthereon both in general or with reference to specific client's circumstances and needs. We are of necessity unable totake into account the particular investment objectives, financial situation and needs of our individual clients and we
Chief Investment Office GWM 4 December 2019 14

Municipal Credit View
Appendix
would recommend that you take financial and/or tax advice as to the implications (including tax) of investing in anyof the products mentioned herein.This material may not be reproduced or copies circulated without prior authority of UBS. Unless otherwise agreedin writing UBS expressly prohibits the distribution and transfer of this material to third parties for any reason. UBSaccepts no liability whatsoever for any claims or lawsuits from any third parties arising from the use or distributionof this material. This report is for distribution only under such circumstances as may be permitted by applicablelaw. For information on the ways in which CIO manages conflicts and maintains independence of its investmentviews and publication offering, and research and rating methodologies, please visit www.ubs.com/research. Additionalinformation on the relevant authors of this publication and other CIO publication(s) referenced in this report; and copiesof any past reports on this topic; are available upon request from your client advisor.Important Information About Sustainable Investing Strategies: Sustainable investing strategies aim to considerand incorporate environmental, social and governance (ESG) factors into investment process and portfolio construction.Strategies across geographies and styles approach ESG analysis and incorporate the findings in a variety of ways.Incorporating ESG factors or Sustainable Investing considerations may inhibit the portfolio manager’s ability toparticipate in certain investment opportunities that otherwise would be consistent with its investment objective andother principal investment strategies. The returns on a portfolio consisting primarily of sustainable investments maybe lower or higher than portfolios where ESG factors, exclusions, or other sustainability issues are not considered bythe portfolio manager, and the investment opportunities available to such portfolios may differ. Companies may notnecessarily meet high performance standards on all aspects of ESG or sustainable investing issues; there is also noguarantee that any company will meet expectations in connection with corporate responsibility, sustainability, and/orimpact performance.Distributed to US persons by UBS Financial Services Inc. or UBS Securities LLC, subsidiaries of UBS AG. UBS SwitzerlandAG, UBS Europe SE, UBS Bank, S.A., UBS Brasil Administradora de Valores Mobiliarios Ltda, UBS Asesores Mexico,S.A. de C.V., UBS Securities Japan Co., Ltd, UBS Wealth Management Israel Ltd and UBS Menkul Degerler AS areaffiliates of UBS AG. UBS Financial Services Incorporated of Puerto Rico is a subsidiary of UBS Financial Services Inc.UBS Financial Services Inc. accepts responsibility for the content of a report prepared by a non-US affiliatewhen it distributes reports to US persons. All transactions by a US person in the securities mentioned inthis report should be effected through a US-registered broker dealer affiliated with UBS, and not througha non-US affiliate. The contents of this report have not been and will not be approved by any securitiesor investment authority in the United States or elsewhere. UBS Financial Services Inc. is not acting as amunicipal advisor to any municipal entity or obligated person within the meaning of Section 15B of theSecurities Exchange Act (the "Municipal Advisor Rule") and the opinions or views contained herein are notintended to be, and do not constitute, advice within the meaning of the Municipal Advisor Rule.External Asset Managers / External Financial Consultants: In case this research or publication is provided toan External Asset Manager or an External Financial Consultant, UBS expressly prohibits that it is redistributed by theExternal Asset Manager or the External Financial Consultant and is made available to their clients and/or third parties.For country disclosures, click here.Version 06/2019. CIO82652744© UBS 2019. The key symbol and UBS are among the registered and unregistered trademarks of UBS. All rights reserved.
Chief Investment Office GWM 4 December 2019 15