2022 M&A and Capital Markets Outlook | UBS
18
Q1 2022 UBS Private Markets OneBank Coverage 2022 M&A and Capital Markets Outlook
-
Upload
khangminh22 -
Category
Documents
-
view
0 -
download
0
Transcript of 2022 M&A and Capital Markets Outlook | UBS
Q1 2022
UBS Private Markets OneBank Coverage
2022 M&A and Capital Markets Outlook

1
Experienced team with holistic client focus
• Fully dedicated senior investment banking team aligned closely with UBS Private Wealth Management
• Provide bespoke solutions to meet corporate investment banking and individual wealth management objectives
• Deep execution experience across a wide range of prominent transactions, including M&A (Mergers & Acquisitions), private capital raises and IPOs
Capabilities suitable for private companies and owners, coupled with deep, global sector expertise
• Long track record of working with family owned and entrepreneur led businesses
• Integrated team that will leverage sector experts across UBS’ global footprint
• Strong understanding of sector trends and ongoing dialogue with key industry constituents
M&A is core business focus for UBS
• Strong expertise selling mid-sized private companies
• Deep knowledge of global buyer universe
• Dedicated private markets M&A team with significant execution expertise and proven track record
Access to both traditional and alternative capital pools
• Long-term expertise in negotiating, structuring, and distributing private capital transactions makes UBS ideally positioned to access relevant pools of demand
• Significant distribution partners include family offices, UHNW (Ultra High Net Worth) and long-term horizon investors
Introduction To UBS OneBank Coverage
UBS Global Banking Solutions for Wealth Management Clients
Delivering M&A and Capital Markets Advisory to Corporates, Founders,
Entrepreneurs, Families, and Ultra High Net Worth Individuals
US$55bnMarket Capitalization
150+Year heritage serving private, institutional and corporate clients worldwide
50+Countries
US$4.4tnInvested Assets (WM & GAM)
60,000+Employees
Source: Company Information as of 3Q2021

2
OneBank Coverage brings UBS Global Banking capabilities to Wealth Management Clients
UBS OneBank Coverage: Solutions
Global Industrials Group
Technology, Media, and Telecom
Financial Institutions Group
Consumer Products & Retail, Healthcare, Real Estate & Leisure
UBS Global Banking Capabilities and Sector Coverage
Alternative Capital Group(including coverage of Financial Sponsors, Sovereign Wealth
Funds and Pension Funds) and Private Funds Group
Public Capital Markets
• Providing independent capital markets advice, capital placement and underwriter across all capital markets
• Includes debt and equity solutions
PrivateFinancing Markets
• Advising managers of private assets seeking to raise capital, recapitalize, or liquidate their assets through privately negotiated transactions
M&A
• Providing strategic and tactical advice and global deal execution

3
2022 “Big Picture” Investment Themes Drive Activity
Technology, economic recovery, and ESG are expected to shape market activity
Next Generation Internet Healthcare InnovationDigital Economy
• Acceleration of e-commerce
• Digital customer experiences
• Innovation / disruptive financial technology, platforms, and wellness
• DTC brands
• Ongoing shift to cloud computing, software continues run but big data and AI will be massive
• Cybersecurity is critical
• 5G connectivity driving “Internet of Things” and the Edge
• Evolution of Web 3.0 and Metaverse, albeit years away
• Digital transforming healthcare with cost-effective, patient centered care
• Next generation genomics, life sciences, tools and diagonisis further become industrialized
• Renewed consumer wellness and nutrition focus
Industrial Technology & Renewables
• Continued focus on alternative transportation with EV market taking form
• Net-zero carbon transition: Greentech, Clean energy and carbon reduction
• Logistics technology, warehouse and freight automation, digitalization of supply chain
Services and Experiences over Goods
• Consumer spending shift as pandemic eases
• Return of travel, leisure, live entertainment, and sports
Shifting Real Estate Landscape
• Multi-family, single-family rental, life sciences, industrial / logistics leading REIT verticals as pandemic reshapes urban centers and work / life environments
• Digitilization of real estate services and property technology continues to expand
Tech / AI / Data Covid Recovery / Reopening Environmental, Social, Governance
4
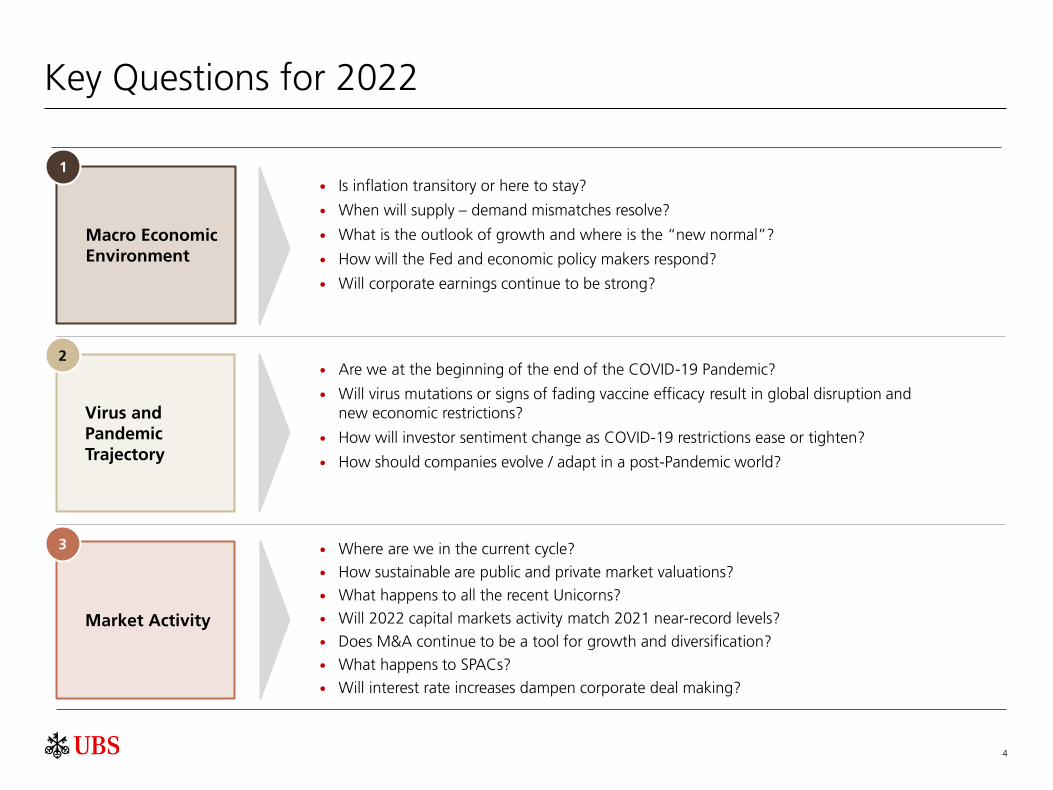
Key Questions for 2022
Is inflation transitory or here to stay?
When will supply – demand mismatches resolve?
What is the outlook of growth and where is the “new normal”?
How will the Fed and economic policy makers respond?
Will corporate earnings continue to be strong?
Are we at the beginning of the end of the COVID-19 Pandemic?
Will virus mutations or signs of fading vaccine efficacy result in global disruption and new economic restrictions?
How will investor sentiment change as COVID-19 restrictions ease or tighten?
How should companies evolve / adapt in a post-Pandemic world?
Where are we in the current cycle?
How sustainable are public and private market valuations?
What happens to all the recent Unicorns?
Will 2022 capital markets activity match 2021 near-record levels?
Does M&A continue to be a tool for growth and diversification?
What happens to SPACs?
Will interest rate increases dampen corporate deal making?
Virus and Pandemic Trajectory
2
Market Activity
3
Macro Economic Environment
1
5
2,200
2,700
3,200
3,700
4,200
4,700
5,200
Jan-20 Jun-20 Dec-20 Jun-21 Dec-21
S&
P 5
00
-0.2%
0.8%
1.8%
2.8%
3.8%
4.8%
5.8%
6.8%
Dec-14 Dec-16 Dec-18 Dec-20
12-m % change
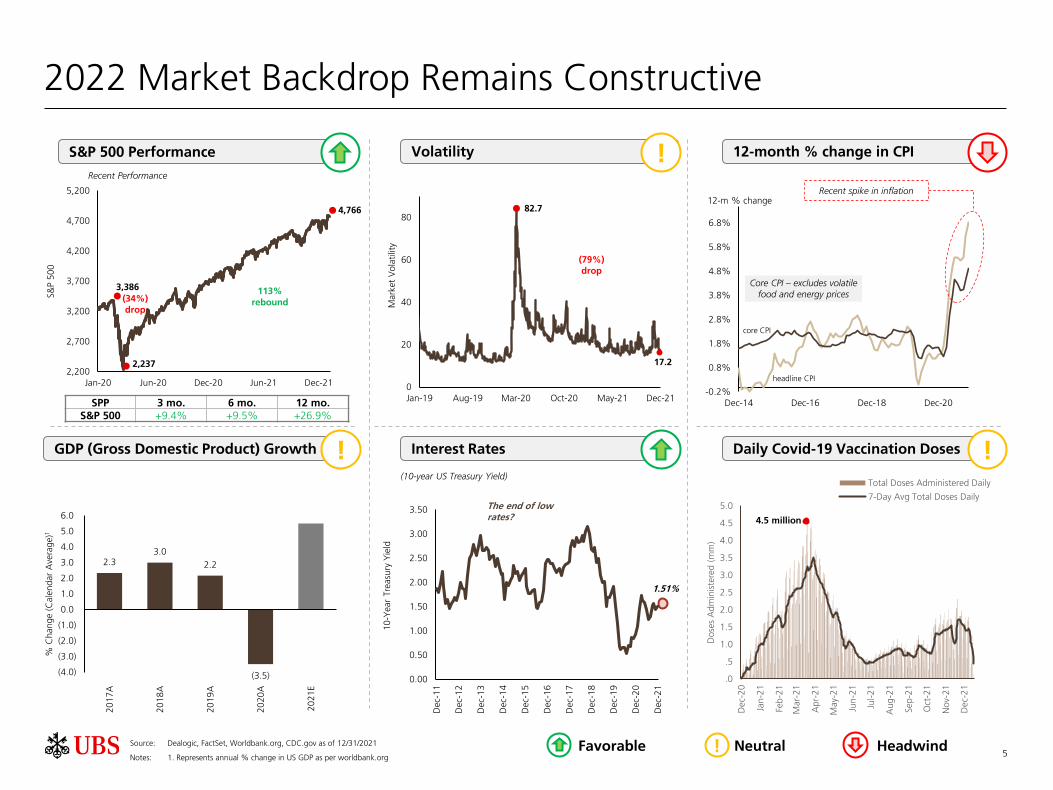
2022 Market Backdrop Remains Constructive
GDP (Gross Domestic Product) Growth Interest Rates
Volatility
(10-year US Treasury Yield)
12-month % change in CPI S&P 500 Performance
Recent Performance
Source: Dealogic, FactSet, Worldbank.org, CDC.gov as of 12/31/2021
Notes: 1. Represents annual % change in US GDP as per worldbank.org
Daily Covid-19 Vaccination Doses
1.51%
The end of low rates?
!
!
2.3 3.0
2.2
(3.5)(4.0)
(3.0)
(2.0)
(1.0)
0.0
1.0
2.0
3.0
4.0
5.0
6.0
20
17
A
20
18
A
20
19
A
20
20
A
20
21
E
% C
hange (
Cale
ndar
Ave
rage)1
(34%) drop
113% rebound
3,386
4,766
2,237
SPP 3 mo. 6 mo. 12 mo.S&P 500 +9.4% +9.5% +26.9%
Core CPI – excludes volatile food and energy prices
!
HeadwindFavorable Neutral!
Recent spike in inflation
0.00
0.50
1.00
1.50
2.00
2.50
3.00
3.50
Dec-
11
Dec-
12
Dec-
13
Dec-
14
Dec-
15
Dec-
16
Dec-
17
Dec-
18
Dec-
19
Dec-
20
Dec-
21
10-Y
ear
Tre
asu
ry Y
ield
core CPI
headline CPI0
20
40
60
80
Jan-19 Aug-19 Mar-20 Oct-20 May-21 Dec-21M
ark
et
Vola
tilit
y
82.7
17.2
(79%) drop
.0
.5
1.0
1.5
2.0
2.5
3.0
3.5
4.0
4.5
5.0
Dec-
20
Jan-2
1
Feb
-21
Mar-
21
Apr-
21
May-
21
Jun-2
1
Jul-2
1
Aug
-21
Sep
-21
Oct
-21
Nov-
21
Dec-
21
Dose
s A
dm
inis
tere
d (
mm
)
Total Doses Administered Daily
7-Day Avg Total Doses Daily
4.5 million
6
48%
42%
33% 33%
25% 24% 24% 21% 19%
16% 14%
Energy Real Estate Technology Financials Materials Healthcare ConsumerDiscretionary
Telecom Industrials ConsumerStaples
Utilities
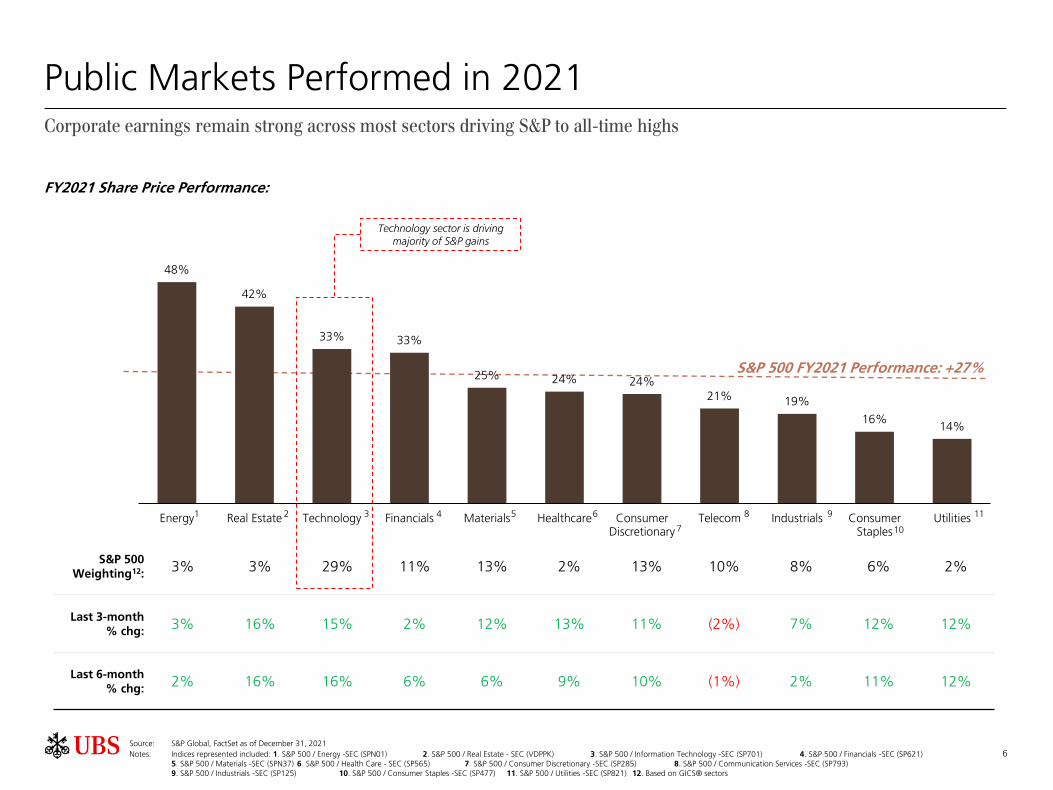
Public Markets Performed in 2021Corporate earnings remain strong across most sectors driving S&P to all-time highs
S&P 500 Weighting12:
3% 3% 29% 11% 13% 2% 13% 10% 8% 6% 2%
Last 3-month % chg:
3% 16% 15% 2% 12% 13% 11% (2%) 7% 12% 12%
Last 6-month% chg:
2% 16% 16% 6% 6% 9% 10% (1%) 2% 11% 12%
S&P 500 FY2021 Performance: +27%
Source: S&P Global, FactSet as of December 31, 2021
Notes: Indices represented included: 1. S&P 500 / Energy -SEC (SPN01) 2. S&P 500 / Real Estate - SEC (VDPPK) 3. S&P 500 / Information Technology -SEC (SP701) 4. S&P 500 / Financials -SEC (SP621)5. S&P 500 / Materials -SEC (SPN37) 6. S&P 500 / Health Care - SEC (SP565) 7. S&P 500 / Consumer Discretionary -SEC (SP285) 8. S&P 500 / Communication Services -SEC (SP793)9. S&P 500 / Industrials -SEC (SP125) 10. S&P 500 / Consumer Staples -SEC (SP477) 11. S&P 500 / Utilities -SEC (SP821) 12. Based on GICS® sectors
10
98
7
653 421 11
Technology sector is driving majority of S&P gains
FY2021 Share Price Performance:
7
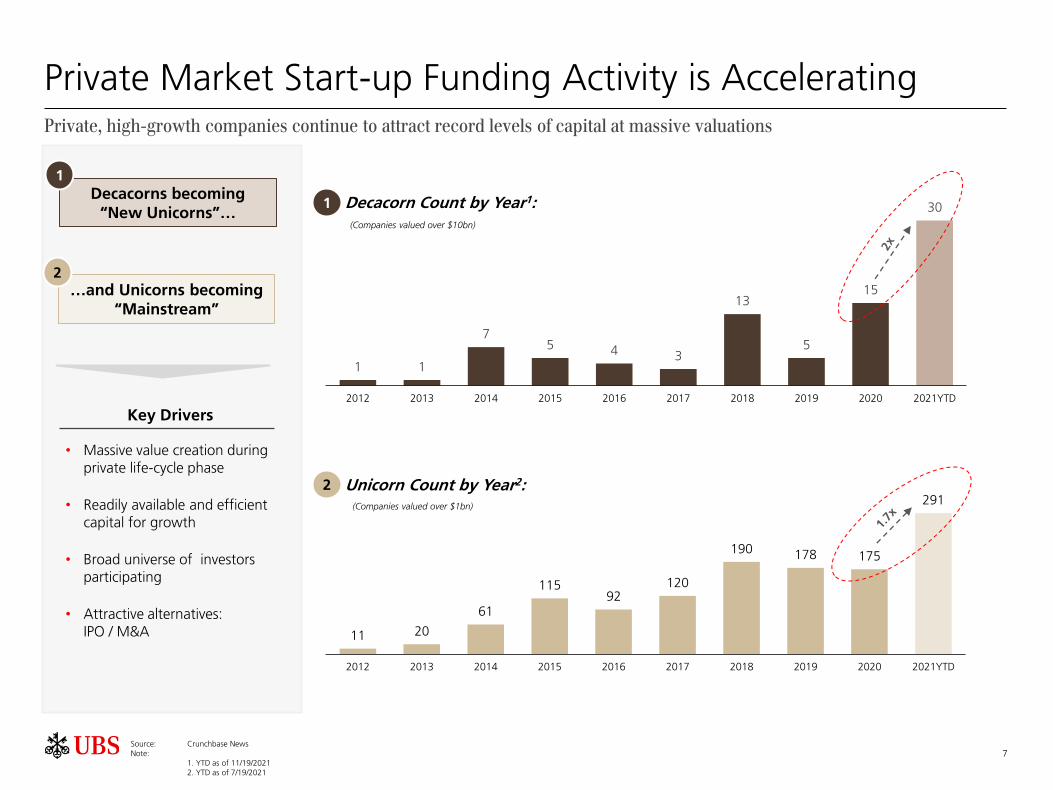
Private Market Start-up Funding Activity is Accelerating Private, high-growth companies continue to attract record levels of capital at massive valuations
• Massive value creation during private life-cycle phase
• Readily available and efficient capital for growth
• Broad universe of investors participating
• Attractive alternatives: IPO / M&A
1 1
75 4 3
13
5
15
30
2012 2013 2014 2015 2016 2017 2018 2019 2020 2021YTD
11 20
61
11592
120
190 178 175
291
2012 2013 2014 2015 2016 2017 2018 2019 2020 2021YTD
Decacorns becoming “New Unicorns”…
Source: Crunchbase NewsNote:
1. YTD as of 11/19/20212. YTD as of 7/19/2021
Key Drivers
Decacorn Count by Year1:
Unicorn Count by Year2:
1
…and Unicorns becoming “Mainstream”
2
1
2
(Companies valued over $10bn)
(Companies valued over $1bn)

8
Family Offices are a Significant Source of Capital
Health Tech
SmartMobility
Green Tech
Digital
Transformation
Automation
and Robotics
Investment priorities in the next 2–3 years
Key Considerations:
• Family Offices are institutional
• Portfolios are broadly diversified across a range of asset classes, including alternatives
• Despite economic turbulence and strains in international relations, family offices retain a risk-on frame of mind
• Family offices are investing in themes that will dominate the global economy in 2022
Strategic Asset Allocation
NetIncrease / decrease Increase
Fixed income developed markets -18%
Fixed income developing markets 3%
Equities developed markets 35%
Equities developing markets 56%
Private equity direct investments 42%
Private equity funds / funds of funds 26%
Hedge Funds 16%
Real estate 22%
Infrastructure 23%
Gold/precious metals 10%
Commodities 9%
Cash (or cash equivalent) -18%
Art and antiques 8% 10%
11%
14%
16%
24%
36%
25%
37%
53%
60%
48%
22%
17%
Planned changes to asset allocation in the next 5 years
Source: UBS GFO Report 2021, UBS Evidence Lab

9
Elevated M&A Activity Expected to Continue in 2022
US M&A volumes continue to set records
• Americas M&A volume of $2.0tn1 for 2021 (as of Dec 31st, 2021), represents an increase of nearly 2x vs.2020 Americas M&A volume of $1.1tn1
• Technology M&A continued its post COVID boom; activity broadened out across industry sectors
• SPAC M&A continuing at strong pace
Attractive market backdrop for M&A going forward
• Continued positive impact of fiscal and monetary policy (low interest rates and increased government spending)
• Significant available capital in both public and private markets
• Attractive valuation levels; strong performing companies at a premium to pre-Covid levels
• Increasing regulatory scrutiny of large transactions, particularly in the technology sector, may push buyers to focus on smaller targets
Corporates and Sponsors utilizing M&A to evolve and drive growth as economy recovers
• Overall return to risk-taking as many feel the worst is behind us, despite Omicron variant
• Opportunity to build scale, drive growth or enter adjacent markets in light of Covid-19 impact on traditional business models
• Significant value being placed on digital, technology-enabled and disruptive businesses that are well-positioned in the post-Covid world
• Appetite remains for high quality, resilient businesses as recovery builds
Sellers looking to capitalize on current valuations
• Sellers looking to capitalize on valuations that are at near or all-time highs across most sectors
• Corporates shedding non-core assets and Sponsors opportunistically monetizing portfolio companies
Note:1 All deals with disclosed deal value, excluding minority stake purchases, repurchases, spinoffs or withdrawn deals and deals less than $50 million
Source: Refinitiv—SDC Platinum as of 12/31/21

10
45 66 133
197 210
245 393 371 293 204
215 287
384 621
825
1,198
2,058
2,708 2,605
1,295
920
1,008
1,568
2,051
2,850
3,112
1,751
1,331
1,781 1,734 1,715
1,646
2,577
3,301
2,746
2,460
2,933 2,852
2,566
4,079
0
800
1,600
2,400
3,200
4,000
4,800
1/29/1900 2/2/1900 2/5/1900 2/9/1900 2/12/1900
0
700
1,400
2,100
2,800
3,500
4,200
1982
1983
1984
1985
1986
1987
1988
1989
1990
1991
1992
1993
1994
1995
1996
1997
1998
1999
2000
2001
2002
2003
2004
2005
2006
2007
2008
2009
2010
2011
2012
2013
2014
2015
2016
2017
2018
2019
2020
2021
S&
P 5
00 In
dex
Deal V
alu
e ($
bn
)
Global M&A Deal Value by Year1
2002–20071982–1989
CAGR 35% CAGR 28%
1991–2000
CAGR 33%
Source: Refinitiv—SDC Platinum as of 12/31/21
2009–2021
CAGR 10%
Notes:1 All deals with disclosed deal value, excluding minority stake purchases, repurchases, spinoffs or withdrawn deals and deals less than $50 million; as of 12/31/2021
New record level
Value (US$bn)
45 66 133 197 210 245 393 371 293 204 215 287 384 621 825 1,198 2,058 2,708 2,605 1,295 920 1,008 1,568 2,051 2,850 3,112 1,751 1,331 1,781 1,734 1,715 1,646 2,577 3,301 2,746 2,460 2,933 2,852 2,566 4,079
% Y/Y Change
(45%) 48% 101% 48% 7% 17% 60% (6%) (21%)(30%) 5% 34% 34% 62% 33% 45% 72% 32% (4%) (50%)(29%) 10% 56% 31% 39% 9% (44%)(24%) 34% (3%) (1%) (4%) 57% 28% (17%)(10%) 19% (3%) (10%) 59%

11
Global Private Equity “Dry Powder” Continues to Build
Source: Pitchbook as of 12/31/2021
Note: 1. Other consists of Fund of Funds, Secondaries, and Co-investment fund categories
Global Private Equity Dry Powder ($bn):
Investors are sitting on $1.4 Trillion of uninvested capital, slightly below record levels seen in 2020. Capital is readily available to invest in companies across various size, sectors, and geographies
1
167 176 171 194 266
447 483 555 541
472 484 514 585 572
625 670
763
894
1,010 1,053
1,009
6 8 86
6
810
11 10
12 97
6 5
87
7
6
811
9
2 3 43
7
7
24
19 22
25 2931
38 43
51
61
79
79
90
102
87
2 4 87
12
39
62
73 67
77 8983
119 151
164149
159
185
186
195
186
2 1 13
2
8
10
1212
1117
18
1919
3439
37
61
69
74
66
179 193 192 213
293
508
589
671 651
597 627
653
767 790
883 926
1,044
1,225
1,364
1,435
1,357
2001 2002 2003 2004 2005 2006 2007 2008 2009 2010 2011 2012 2013 2014 2015 2016 2017 2018 2019 2020 2021
Private Equity Venture Capital Private Debt Real Assets Other

12
Attractive M&A Valuation Multiples and Shifting Buyer Mix
Valuations are at the Highest Levels in Almost a Decade
10.7
11.7
12.3 12.4
12.1
12.6 12.5
11.6 11.5
12.8
2012 2013 2014 2015 2016 2017 2018 2019 2020 2021
EV
/ E
BIT
DA
(x)
85%80% 83% 84% 86%
80% 80% 83% 82%79%
16% 20% 17% 16% 14%20% 20% 17% 18% 22%
2012 2013 2014 2015 2016 2017 2018 2019 2020 2021
Strategic Sponsor
Source: Refinitiv—SDC Platinum, Dealogic, as of 12/31/2021
Notes: 1 Represents buy-side deals with disclosed deal value, excluding minority stake purchases, repurchases, spinoffs or withdrawn deals and deals less than $50mm
Significant Uptick in Sponsor Activity¹
Percentage of Transactions between Sponsor and Strategic Buyers:
Sponsor activity increased in 2021

13Source: FactSet, Dealogic
Note: VIX and Forward P/E represent average value in a given year; size of bubbles represents IPO issuance in US$ as of 12/31/2021
10
13
15
18
20
23
25
10 15 20 25 30
S&
P 5
00 F
orw
ard
P/E
(va
luation)
2017
2013
2014
2012
20212020
20182019
2015
2016
VIX (market volatility)
The US IPO Market is Open & ActiveThe IPO window has shifted to higher valuations as volatility continues to moderate
2021
Annual IPO Issuance: 2012 to 2021
IPO Volume and Offer to 1-Day Performance
341827 68 52 80 94No. of IPOs
76 57
Pricing vs. Range
(by count) (by volume)
Healthcare41%
TMT37%
Consumer11%
Industrial6%
Finance3%
Real Estate2%
Energy1%
TMT46%
Healthcare21%
Industrial16%
Consumer11%
Finance4%
Real Estate1% Energy
1%
2021 Issuance by Sector
8 41 6 2 10 10 11 13
1711
15 26 2538
64 4533
23
18 36 25 3220 20 11
0%
20%
40%
60%
80%
100%
Q4 '19 Q1' 20 Q2'20 Q3'20 Q4'20 Q1'21 Q2'21 Q3'21 Q4'21
Prici
ng v
s. R
ange
Below In Range Above
9.1
23.2
43.0 45.1 47.0
32.2
21.3 17.2
13.3
6.0 7.1
16.9
31.2 29.3
42.4 43.8
30.0 34.7
0.0
12.5
25.0
37.5
50.0
Q4 '19 Q1' 20 Q2'20 Q3'20 Q4'20 Q1'21 Q2'21 Q3'21 Q4'21% C
hange O
ffer
to 1
-Day
Offer-1 Day Proceeds ($bn)
14
48%
42%
33%
33%
27%
25%
24%
24%
21%
19%
16%
14%
Energy
Real Estate
Technology
Financials
S&P 500
Materials
Healthcare
Con. Discretionary
Telecom
Industrials
Con. Staples
Utilities
70
95
120
145
170
195
220
245
Jan-19 Oct-19 Jul-20 Apr-21 Dec-21
Indexe
d P
rice
Perf
orm
ance
(%
)NASDAQ Dow Jones S&P 500 Russell 2000
12
15
19
22
25
Jan-19 Oct-19 Jul-20 Apr-21 Dec-21
S&
P 5
00 N
TM
P/E
(x)
0
20
40
60
80
Jan-19 Aug-19 Mar-20 Oct-20 May-21 Dec-21
Mark
et
Vo
latilit
y
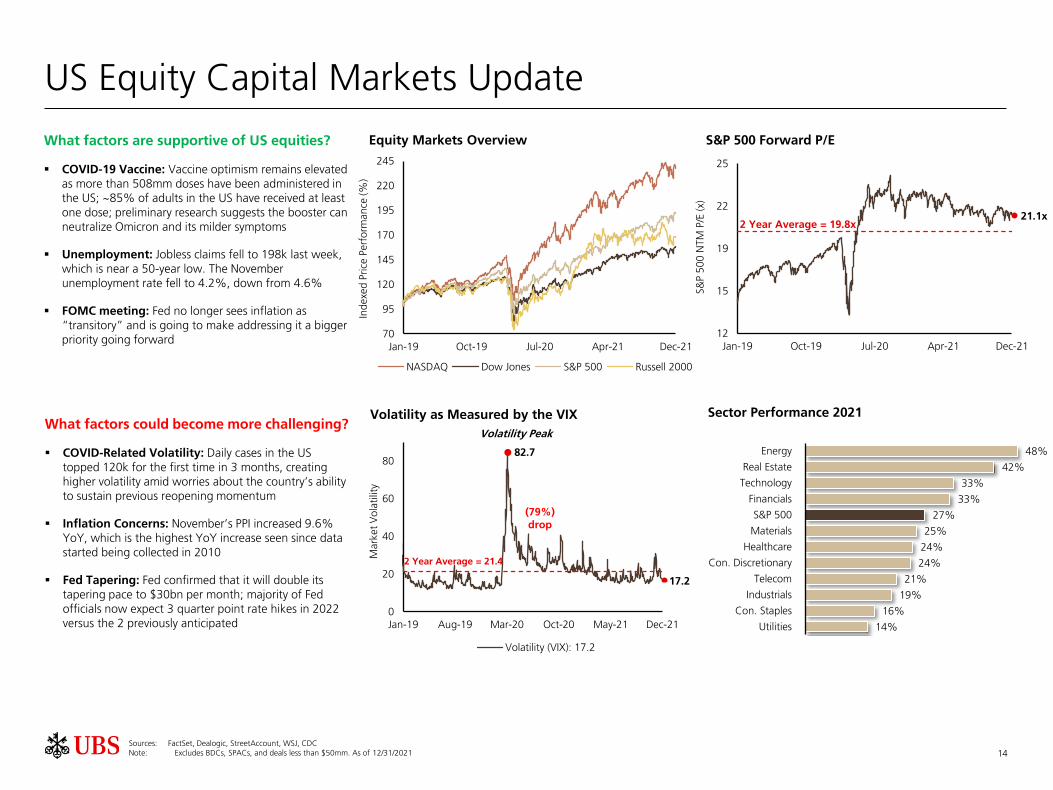
Volatility (VIX): 17.2
Sector Performance 2021Volatility as Measured by the VIX
S&P 500 Forward P/EEquity Markets Overview
US Equity Capital Markets Update
What factors are supportive of US equities?
▪ COVID-19 Vaccine: Vaccine optimism remains elevated as more than 508mm doses have been administered in the US; ~85% of adults in the US have received at least one dose; preliminary research suggests the booster can neutralize Omicron and its milder symptoms
▪ Unemployment: Jobless claims fell to 198k last week, which is near a 50-year low. The November unemployment rate fell to 4.2%, down from 4.6%
▪ FOMC meeting: Fed no longer sees inflation as “transitory” and is going to make addressing it a bigger priority going forward
What factors could become more challenging?
▪ COVID-Related Volatility: Daily cases in the US topped 120k for the first time in 3 months, creating higher volatility amid worries about the country’s ability to sustain previous reopening momentum
▪ Inflation Concerns: November’s PPI increased 9.6% YoY, which is the highest YoY increase seen since data started being collected in 2010
▪ Fed Tapering: Fed confirmed that it will double its tapering pace to $30bn per month; majority of Fed officials now expect 3 quarter point rate hikes in 2022 versus the 2 previously anticipated
2 Year Average = 19.8x
82.7
17.2
21.1x
Sources: FactSet, Dealogic, StreetAccount, WSJ, CDCNote: Excludes BDCs, SPACs, and deals less than $50mm. As of 12/31/2021
2 Year Average = 21.4
(79%) drop
Volatility Peak
15
11.1
11.6
12
.2
15
.2
16
.7
16
.6
18
.0
19
.4
21.6
21.5
22
.8
28
.8 59
.7 87
.4
17
7.8
17
7.9
16
8.0
18
4.4
3Q
'17
4Q
'17
1Q
'18
2Q
'18
3Q
'18
4Q
'18
1Q
'19
2Q
'19
3Q
'19
4Q
'19
1Q
'20
2Q
'20
3Q
'20
4Q
'20
1Q
'21
2Q
'21
3Q
'21
4Q
'21
10.0 10.8 13.6
83.0
160.6
0
20
40
60
80
100
120
140
160
2017 2018 2019 2020 2021YTD
($m
m)
60634 46 59 248
262295 234 230 335
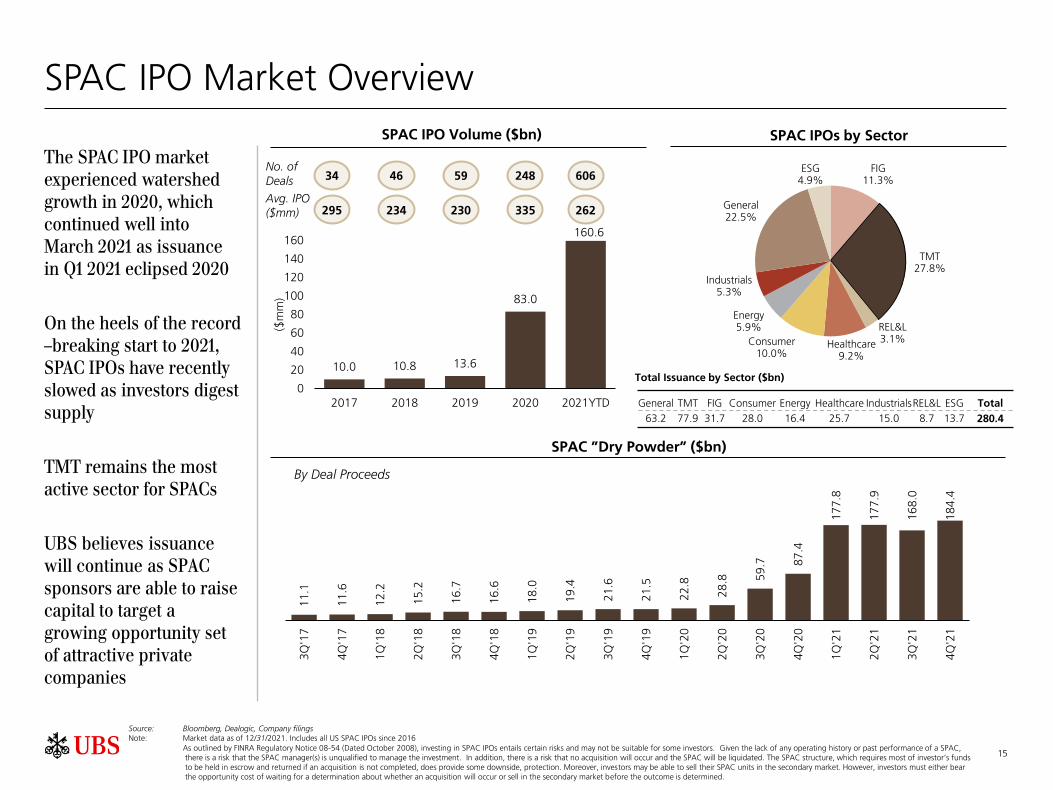
SPAC IPO Market Overview
Source: Bloomberg, Dealogic, Company filingsNote: Market data as of 12/31/2021. Includes all US SPAC IPOs since 2016
As outlined by FINRA Regulatory Notice 08-54 (Dated October 2008), investing in SPAC IPOs entails certain risks and may not be suitable for some investors. Given the lack of any operating history or past performance of a SPAC, there is a risk that the SPAC manager(s) is unqualified to manage the investment. In addition, there is a risk that no acquisition will occur and the SPAC will be liquidated. The SPAC structure, which requires most of investor’s funds to be held in escrow and returned if an acquisition is not completed, does provide some downside, protection. Moreover, investors may be able to sell their SPAC units in the secondary market. However, investors must either bear the opportunity cost of waiting for a determination about whether an acquisition will occur or sell in the secondary market before the outcome is determined.
The SPAC IPO market experienced watershed growth in 2020, which continued well into March 2021 as issuance in Q1 2021 eclipsed 2020
On the heels of the record –breaking start to 2021, SPAC IPOs have recently slowed as investors digest supply
TMT remains the most active sector for SPACs
UBS believes issuance will continue as SPAC sponsors are able to raise capital to target a growing opportunity set of attractive private companies
No. of Deals
SPAC IPO Volume ($bn)
Avg. IPO ($mm)
SPAC IPOs by Sector
SPAC ”Dry Powder” ($bn)
By Deal Proceeds
Total Issuance by Sector ($bn)
General TMT FIG Consumer Energy Healthcare IndustrialsREL&L ESG Total
63.2 77.9 31.7 28.0 16.4 25.7 15.0 8.7 13.7 280.4
FIG11.3%
TMT27.8%
REL&L3.1%Healthcare
9.2%
Consumer10.0%
Energy5.9%
Industrials5.3%
General22.5%
ESG4.9%
16
Recent SPAC M&A Trends
Source: Bloomberg, Dealogic, Company filingsNote: Market data as of 12/31/2021. Unless otherwise stated, includes US SPAC IPOs ≥$50m since 2016
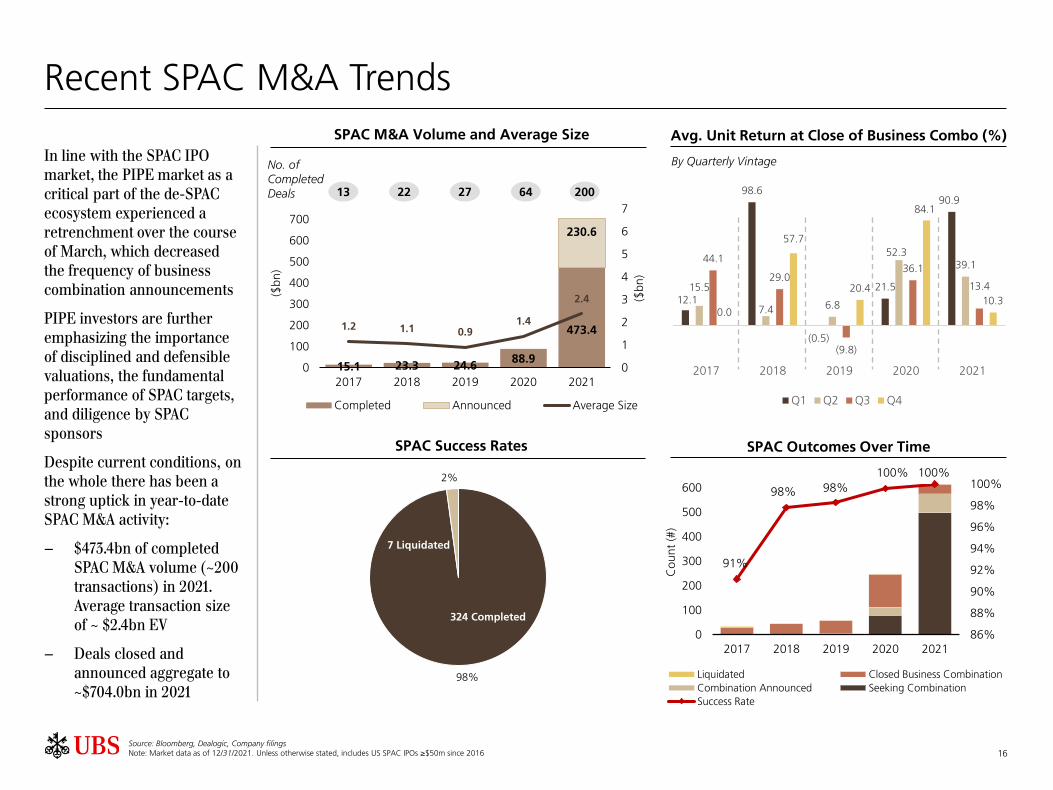
In line with the SPAC IPO market, the PIPE market as a critical part of the de-SPAC ecosystem experienced a retrenchment over the course of March, which decreased the frequency of business combination announcements
PIPE investors are further emphasizing the importance of disciplined and defensible valuations, the fundamental performance of SPAC targets, and diligence by SPAC sponsors
Despite current conditions, on the whole there has been a strong uptick in year-to-date SPAC M&A activity:
− $473.4bn of completed SPAC M&A volume (~200 transactions) in 2021. Average transaction size of ~ $2.4bn EV
− Deals closed and announced aggregate to ~$704.0bn in 2021
SPAC M&A Volume and Average Size Avg. Unit Return at Close of Business Combo (%)
SPAC Success Rates SPAC Outcomes Over Time
No. of Completed Deals
By Quarterly Vintage
15.1 23.3 24.6 88.9
473.4
230.6
1.2 1.1 0.91.4
2.4
0
1
2
3
4
5
6
7
0
100
200
300
400
500
600
700
2017 2018 2019 2020 2021
($b
n)
($b
n)
Completed Announced Average Size
13 22 27 64 200
98%
2%
7 Liquidated
324 Completed
91%
98% 98%
100% 100%
86%
88%
90%
92%
94%
96%
98%
100%
0
100
200
300
400
500
600
2017 2018 2019 2020 2021
Co
un
t (#
)Liquidated Closed Business Combination
Combination Announced Seeking Combination
Success Rate
12.1
98.6
(0.5)
21.5
90.9
15.5
7.4 6.8
52.3 39.1
44.1
29.0
(9.8)
36.1
13.4
0.0
57.7
20.4
84.1
10.3
2017 2018 2019 2020 2021
Q1 Q2 Q3 Q4
17
UBS Securities LLC1285 Avenue Of The AmericasNew York NY 10019Tel. +1-212-713 2000
www.ubs.com
The information in this discussion has been prepared by, and reflects the opinions and various investment views of, the speaker. UBS Financial Services Inc. has not independently verified such information and does not guarantee its accuracy or completeness. This information is being provided to you for your information purposes only and does not constitute a recommendation or an endorsement by UBS Financial Services Inc. of the author, the securities or views stated herein. Any specific securities discussed should not be considered a recommendation or solicitation to buy or sell any particular security. You should not assume that any investment in any of the securities was or will be profitable.
By accepting this presentation, the recipient agrees to be bound by the following obligations and limitations.
Purpose. This presentation has been prepared by UBS Securities LLC ("UBS") for the exclusive use of the party to whom UBS delivers this presentation (together with its subsidiaries and affiliates, hereinafter the "Recipient").
No independent verification. The information in this presentation has been obtained from the Recipient and/or other publicly available sources and has not been independently verified by UBS Group AG and/or its subsidiaries, branches or affiliates (together, the "UBS Group") or any of their respective directors, officers, employees, agents, representatives or advisors (the "Representatives") or any other person.
No representation or warranty. No representation, warranty, or undertaking, either express or implied, is or will be given by UBS Group or its Representatives as to or in relation to the accuracy, completeness, reliability or sufficiency of the information contained in this presentation or as to the reasonableness of any assumption contained in this presentation.
No liability. By accepting receipt of this presentation, the Recipient acknowledges and agrees that to the maximum extent permitted by law, each of UBS Group and its Representatives expressly disclaims any and all liability that may arise from this presentation, or any other written or oral information provided in connection with this presentation, and any errors contained therein and/or omissions therefrom, or from relying on or any use of the contents of this presentation or otherwise in connection with this presentation.
Forecasts. The valuations, projections, estimates, forecasts, targets, prospects, returns and/or opinions (including, without limitation, projections of revenue, expense, net income and stock performance) contained herein involve elements of subjective judgment and analysis. Any opinions expressed in this presentation are subject to change without notice and may differ from or be contrary to opinions expressed by other business areas or groups of UBS Group as a result of using different assumptions and criteria. This presentation may contain forward-looking statements. UBS Group gives no undertaking and is under no obligation to update these forward-looking statements for events or circumstances that occur subsequent to the date of this presentation. Nothing contained herein is, or shall be relied upon as, a promise or representation as to the past or future, or that any of the estimates or projections contained herein will be achieved.
No duty to update. This presentation speaks as at the date hereof (unless an earlier date is otherwise indicated in the presentation) and in furnishing this presentation, no obligation is undertaken nor is any representation or undertaking given by UBS Group or its Representatives to provide the Recipient with additional information or to update, revise or reaffirm the information in this presentation or to correct any inaccuracies therein which may become apparent.
Information only. This presentation has been prepared solely for informational or educational purposes and does not suggest taking or refraining from any action. It does not constitute or contain an invitation, recommendation, solicitation or an offer to buy or sell any securities or related financial instruments or any of the assets, business, or undertakings described herein, and it does not constitute, and should not be construed as, a proposal, a commitment or an offer to arrange, underwrite, syndicateor otherwise provide any financing or any other transaction.
No advice given. The Recipient should not construe the contents of this presentation as legal, tax, accounting or investment advice or a recommendation. The Recipient should consult its own counsel, tax and financial advisors as to legal and related matters concerning any transaction described herein. This presentation does not purport to be all-inclusive or to contain all of the information that the Recipient may require or request upon due diligence if it wishes to proceed further. By providing thispresentation, none of UBS or its Representatives has the responsibility or authority to provide or has provided investment advice to the Recipient in a fiduciary capacity or otherwise with regard to the matters contained herein. This presentation does not express an opinion as to whether any Recipient should enter into any swap or swap trading strategy that has been described herein by UBS. UBS is not undertaking to act in the best interests of the Recipient or to act as the advisor to any Recipientthat is a Special Entity as defined under Section 23.440(a) of the Commodity Exchange Act. No investment, divestment or other financial decisions or actions should be based on the information in this presentation. This presentation should not be viewed as an investment recommendation because it is provided as part of the general marketing and advertising activities of UBS.
No distribution. This presentation has been prepared on a confidential basis solely for your use and benefit; provided that you and any of your employees, representatives, or other agents may disclose to any and all persons, without limitation of any kind, the tax treatment and tax structure of the transaction and all materials of any kind (including opinions or other tax analyses) that are provided to you relating to such tax treatment and tax structure. Distribution of this presentation to any personother than you and those persons retained to advise you, who agree to maintain the confidentiality of this material and be bound by the limitations outlined herein, is unauthorized.
Role of UBS. By accepting this presentation, the Recipient acknowledges and agrees that UBS is acting, and will at all times act, as an independent contractor on an arm’s length basis and is not acting, and will not act, in any other capacity, including in a fiduciary capacity, with respect to the Recipient. UBS may only be regarded by the Recipient as acting on Recipient's behalf as financial adviser or otherwise following the execution of appropriate documentation between us on mutually satisfactory terms.
Conflicts of Interest. UBS Group may from time to time, as principal or agent, be involved in a wide range of commercial banking and investment banking activities globally (including investment advisory, asset management, research, securities issuance, trading (customer and proprietary) and brokerage), have long or short positions in, or may trade or make a market in any securities, currencies, financial instruments or other assets underlying the transaction to which this presentation relates. UBS Group’s banking, trading and/or hedging activities may have an impact on the price of the underlying asset and may give rise to conflicting interests or duties. UBS Group may provide services to any member of the same group as the Recipient or any other entity or person (a “Third Party”), engage in any transaction (on its own account or otherwise) with respect to the Rec ipient or a Third Party, or act in relation to any matter for itself or any Third Party, notwithstanding that such services, transactions or actions may be adverse to the Recipient or any member of its group, and UBS Group may retain for its own benefit any related remuneration or profit.
Research. This presentation may contain references to research produced by UBS Group. Research is produced for the benefit of the firm’s investing clients. The primary objectives of each analyst in the research department are: to analyze the securities, companies, industries and countries they cover and forecast their financial and economic performance; as a result, to form opinions on the value and future behavior of securities issued by the companies they cover; and to convey that information to UBS Group’s investing clients. Each issuer is covered by the Research Department at its sole discretion. The Research Department produces research independently of other business areas and groups of UBS Group.
UBS specifically prohibits the redistribution or reproduction of this presentation in whole or in part without the prior written permission of UBS and UBS accepts no liability whatsoever for the actions of third parties in this respect.
© UBS 2022. The key symbol and UBS are among the registered and unregistered trademarks of UBS. All rights reserved.
UBS Securities LLC and UBS Financial Services Inc. are subsidiaries of UBS AG. Member FINRA/SIPC
As a firm providing wealth management services to clients, UBS Financial Services Inc. offers investment advisory services in its capacity as an SEC-registered investment adviser and brokerage services in its capacity as an SEC-registered broker-dealer. Investment advisory services and brokerage services are separate and distinct, differ in material ways and are governed by different laws and separate arrangements. It is important that clients understand the ways in which we conduct business, that they carefully read the agreements and disclosures that we provide to them about the products or services we offer. A small number of our financial advisors are not permitted to offer advisory services to you, and can only work with you directly as UBS broker-dealer representatives. Your financial advisor will let you know if this is the case and, if you desire advisory services, will be happy to refer you to another financial advisor who can help you. Our agreements and disclosures will inform you about whether we and our financial advisors are acting in our capacity as an investment adviser or broker-dealer. For more information, please review the PDF document at ubs.com/relationshipsummary.
Disclaimer & Contact Information