Self-organized composites of multiwalled carbon nanotubes and nematic liquid crystal 5CB: optical...
12
arXiv:0911.0808v1 [cond-mat.mes-hall] 4 Nov 2009 Self-organized composites of multiwalled carbon nanotubes and nematic liquid crystal 5CB: Optical singularities and percolation behavior in electrical conductivity V.V Ponevchinsky, V.I. Vasil’ev, and M.S. Soskin * Institute of Physics, NAS of Ukraine, 46 Prospect Nauki, Kyiv 03650, Ukraine A.I. Goncharuk and N.I. Lebovka † Institute of Biocolloidal Chemistry named after F. Ovcharenko, NAS of Ukraine, 42 Vernadskii Prosp., Kyiv 03142, Ukraine (Dated: November 4, 2009) This work discusses optical singularities and electrical conductivity behavior in a thin electroop- tical cell filled with composites including multi-walled carbon nanotubes (MWCNTs) and nematic liquid crystal (LC). The MWCNTs with high aspect ratio L/d ≈ 300 ÷ 1000 and nematic LC 5CB (4-pentyl-4-0-cyanobiphenyl) were used. The composites were prepared by introduction of MWC- NTs (0.0001 ÷ 0.1 % wt) into LC solvent with subsequent sonication. The increase of MWCNT concentration (between 0.005 ÷ 0.05 % wt) resulted in self-organization of MWCNTs and formation of micron-sized aggregates with fractal boundaries. The visually observed formation of spanning MWCNT networks near the percolation threshold at 0.025 % wt was accompanied with transi- tion from non-conductive to conductive state and generation of optical singularities. The observed effects were explained by the strong interactions between MWCNTs and LC medium and planar orientation of 5CB molecules near the lateral surface of MWCNTs. It was speculated that optical singularities arose as a results of interaction of an incident laser beam with LC perturbed interfacial shells covering the MWCNT clusters. Behavior of the interfacial shell thickness in external electric field and in the vicinity of the nematic to isotropic transition was discussed. PACS numbers: 02.40.-k, 42.25.Ja, 42.30.Ms, 61.30.-v, 61.46.-w, 73.63.Fg, 73.22.-f I. INTRODUCTION Nanoscience and nanotechnology are popular slogans of modern science and technique. Nowadays, the most ’hot points’ are related mainly to development of com- posites including carbon nanotubes (CNTs). The typi- cal CNTs have nanometer scale diameter and very high aspect ratio (length-to-diameter ratio) a 1000. During the last decade, a great interest was also attracted by the liquid crystalline (LC) composites doped with CNTs [1, 2, 3, 4, 5] . These materials display many unique prop- erties and integrate the rod-like particles (LC and CNTs) with huge difference in aspect ratios. The CNT+LC nanocomposites are very attractive as objects for inves- tigation because the highly anisotropic excluded-volume interactions may result in unique self-organization and new unexpected effects. The introduction of CNTs inside LC media may pro- duce many unexpected effects [6, 7, 8], influence the phase transitions in LC [9, 10] and enhance the align- ment of LC [11]. Enhancement of CNT ordering in- side LC media [12, 13, 14] and sensible responses of CNTs+LC composites to the shear, external electric or magnetic field, were also reported [15, 16, 17, 18, 19]. It allowed construction of promising electrically or magnet- * Electronic address: [email protected] † Electronic address: [email protected] ically steered switches [11, 13]. Nowadays, the interest to the electro-optical properties of CNT+LC composites is continuously growing [7, 20]. The CNTs essentially af- fect the spatial distribution of charges inside LC cells and, as a result, change their electro-optic response [21, 22]. Different time scales, associated with reorientation of the LC texture (the short timescale) and with reorientation of the carbon nanotubes (the long timescale), were iden- tified in the external electric fields [19]. The electrical conductivity and the dielectric constant of LCs doped with carbon nanotubes demonstrate extraordinary large changes in electric and magnetic field driven reorienta- tion experiments [19, 23]. However, in spite of these vast investigations, the main mechanism governing structure formation and op- tical and physical properties of LC+CNTs composites remained unclear. Particularly, the typical micrometer scale length of isolated CNTs (or their aggregates) dis- persed in LC cells is a subject of classical optics. Con- trary, the nm-scale diameter of CNTs belongs to the area of nanooptics. The nano- and micro-heterogeneities in CNT+LC composites can produce optical singularities and drastically chance optical properties of these sys- tems. The optical singularities exist in variety of natural systems and appear as excellent tool for investigation of their basic properties [24, 25]. From other side, self- organization in CNT + LC composites at different con- centrations of CNTs can be easily monitored by means of different experimental techniques, including singular optics and polarization microscopy methods and mea-
Transcript of Self-organized composites of multiwalled carbon nanotubes and nematic liquid crystal 5CB: optical...

arX
iv:0
911.
0808
v1 [
cond
-mat
.mes
-hal
l] 4
Nov
200
9
Self-organized composites of multiwalled carbon nanotubes and
nematic liquid crystal 5CB:
Optical singularities and percolation behavior in electrical conductivity
V.V Ponevchinsky, V.I. Vasil’ev, and M.S. Soskin∗
Institute of Physics, NAS of Ukraine, 46 Prospect Nauki, Kyiv 03650, Ukraine
A.I. Goncharuk and N.I. Lebovka†
Institute of Biocolloidal Chemistry named after F. Ovcharenko,
NAS of Ukraine, 42 Vernadskii Prosp., Kyiv 03142, Ukraine
(Dated: November 4, 2009)
This work discusses optical singularities and electrical conductivity behavior in a thin electroop-tical cell filled with composites including multi-walled carbon nanotubes (MWCNTs) and nematicliquid crystal (LC). The MWCNTs with high aspect ratio L/d ≈ 300 ÷ 1000 and nematic LC 5CB(4-pentyl-4-0-cyanobiphenyl) were used. The composites were prepared by introduction of MWC-NTs (0.0001 ÷ 0.1 % wt) into LC solvent with subsequent sonication. The increase of MWCNTconcentration (between 0.005÷ 0.05 % wt) resulted in self-organization of MWCNTs and formationof micron-sized aggregates with fractal boundaries. The visually observed formation of spanningMWCNT networks near the percolation threshold at 0.025 % wt was accompanied with transi-tion from non-conductive to conductive state and generation of optical singularities. The observedeffects were explained by the strong interactions between MWCNTs and LC medium and planarorientation of 5CB molecules near the lateral surface of MWCNTs. It was speculated that opticalsingularities arose as a results of interaction of an incident laser beam with LC perturbed interfacialshells covering the MWCNT clusters. Behavior of the interfacial shell thickness in external electricfield and in the vicinity of the nematic to isotropic transition was discussed.
PACS numbers: 02.40.-k, 42.25.Ja, 42.30.Ms, 61.30.-v, 61.46.-w, 73.63.Fg, 73.22.-f
I. INTRODUCTION
Nanoscience and nanotechnology are popular slogansof modern science and technique. Nowadays, the most’hot points’ are related mainly to development of com-posites including carbon nanotubes (CNTs). The typi-cal CNTs have nanometer scale diameter and very highaspect ratio (length-to-diameter ratio) a 1000. Duringthe last decade, a great interest was also attracted bythe liquid crystalline (LC) composites doped with CNTs[1, 2, 3, 4, 5] . These materials display many unique prop-erties and integrate the rod-like particles (LC and CNTs)with huge difference in aspect ratios. The CNT+LCnanocomposites are very attractive as objects for inves-tigation because the highly anisotropic excluded-volumeinteractions may result in unique self-organization andnew unexpected effects.
The introduction of CNTs inside LC media may pro-duce many unexpected effects [6, 7, 8], influence thephase transitions in LC [9, 10] and enhance the align-ment of LC [11]. Enhancement of CNT ordering in-side LC media [12, 13, 14] and sensible responses ofCNTs+LC composites to the shear, external electric ormagnetic field, were also reported [15, 16, 17, 18, 19]. Itallowed construction of promising electrically or magnet-
∗Electronic address: [email protected]†Electronic address: [email protected]
ically steered switches [11, 13]. Nowadays, the interestto the electro-optical properties of CNT+LC compositesis continuously growing [7, 20]. The CNTs essentially af-fect the spatial distribution of charges inside LC cells and,as a result, change their electro-optic response [21, 22].Different time scales, associated with reorientation of theLC texture (the short timescale) and with reorientationof the carbon nanotubes (the long timescale), were iden-tified in the external electric fields [19]. The electricalconductivity and the dielectric constant of LCs dopedwith carbon nanotubes demonstrate extraordinary largechanges in electric and magnetic field driven reorienta-tion experiments [19, 23].
However, in spite of these vast investigations, themain mechanism governing structure formation and op-tical and physical properties of LC+CNTs compositesremained unclear. Particularly, the typical micrometerscale length of isolated CNTs (or their aggregates) dis-persed in LC cells is a subject of classical optics. Con-trary, the nm-scale diameter of CNTs belongs to the areaof nanooptics. The nano- and micro-heterogeneities inCNT+LC composites can produce optical singularitiesand drastically chance optical properties of these sys-tems. The optical singularities exist in variety of naturalsystems and appear as excellent tool for investigation oftheir basic properties [24, 25]. From other side, self-organization in CNT + LC composites at different con-centrations of CNTs can be easily monitored by meansof different experimental techniques, including singularoptics and polarization microscopy methods and mea-
2
surements of electrical conductivity.This work studies optical and electro-physical prop-
erties of multiwalled carbon nanotubes (MWCNTs) andnematic LC 5CB composites in the concentration range Cbetween 0.0001 and 0.1 % wt of MWCNTs. The behaviorof optical singularities, percolation threshold from non-conductive to conductive state and electric field driveneffects, are also investigated and discussed in details.
II. MATERIALS AND EXPERIMENTAL
TECHNIQUES
A. Liquid crystal
The commercially available nematic LC, 5CB (Merck,Germany) was used as a LC host matrix. An 5CBmolecule consists of a rigid moiety of linked two benzenerings: C5H11-Ø-Ø-C≡ N. It has a considerable dipole mo-ment, µ ≈ 4.76 D concentrated on C≡N group, polariz-ability α ≈ 33.1, positive dielectric anisotropy ∆ε ≈ 11.7,and exists in nematic phase within the temperature rangefrom 295.5 to 308.5 K [26]. In the nematic and isotropicphases 5CB molecules form dipole -dipole bound dimersabout 2.3 nm long and 0.5 nm thick [27]. The deepintegration between CNTs and nematic LC and stronganchoring of LC molecules to the lateral surface of theCNTs [28, 29] is expected owing to the to strong ?-stacking hexagon-hexagon interactions between benzenerings and hexagon cells of carbon lattice [30].
B. Multiwalled carbon nanotubes
The MWCNTs were produced from ethylene by CVDmethod, involving using of FeAlMo as a catalyst (Spec-Mash Ltd., Ukraine, Fax: 380 44 5010620) [31]. TheMWCNTs were further treated by alkaline and acidicsolutions and washed by distilled water until reachingof distilled water pH in the filtrate. The residual masscontent of the mineral additives was 0.1%. The specificsurface area S of the tubes was 190 m2/g.
Fig. 1 shows the scanning electron microscopy (SEM)images of the MWCNTs in the powder state. Highresolution environmental SEM images were obtained atroom temperature using an XL30 ESEM-FEG instru-ment (Philips International, Inc., Washington, USA), op-erating at the voltage of 15 kV and the pressure of 1.4-3.0Torr.
Typically, such MWCNTs have a mean outer diame-ter of d ≈ 20 nm and a length l = 5 ÷ 10 µm [31]. TheMWCNTs are presumably metallic-like due to their largediameters. The specific electric conductivity σ of a pow-der of compressed MWCNTs (at a pressure 15 of TPa) isabout 10 S.cm−1 along the axis of compression. As wewill see, this influences essentially the optical propertiesand electroconductivity of MWCNT+5CB composites.
FIG. 1: Scanning electron microscopy images of MWCNTs.
C. Preparation of MWCNT+5CB composites
The MWCNT+5CB composites were obtained by ad-dition of the relevant quantities of MWCNTs to liquid5CB (T=298 K). The weight concentration of MWC-NTs C varied within 0.0001 ÷ 0.1 % wt. Ultrasonica-tion was used for preparation of homogeneous mixture ofMWNTs. The MWNT suspensions were sonicated for 5min at a frequency of 22 kHz and an output power of 150W using ultrasonic disperser UZDN-2T. Ultrasonicationis an accepted technique for dispersing the highly en-tangled or aggregated nanotube samples [32], but longertimes of high-energy sonication can introduce defects anddecrease the lengths of nanotubes [33].
D. Sandwich-type LC cells
The various techniques were previously used for char-acterization of the physical properties of a CNT+LC sys-tem [3]. in a sandwich-like LC cell, including electricalconductivity [7], optical [8] and electrooptical [8, 34]measurements. In this work, the sandwich-type cells withdifferent thickness were used in optical and electrical con-ductivity measurement experiments. The thickness of acell for optical/electrooptical measurements h was typ-ically 20 and 100 µm to obtain the high quality opti-cal images in the investigated range of weight concentra-tion of MWCNTs (0.0001 ÷ 0.1 % wt). Construction ofthe used sandwich-type electro-optical LC cell for opticalmeasurements is shown (Fig.2).
The interfacial shell, formed by 5CB molecules cov-ering the MWCNT surface is shown schematically. Theconductive TiO2 layers, covered by polyimide, were used.The thickness of the cells was set by glass spacers. Thepolyimide SE150 (Nissan, Japan) layers were rubbed bya fleecy cloth in order to provide a uniform planar align-ment of LC in the field-out state. The cells were filledby MWCNT+5CB composite, assembled so that the rub-bing directions of the opposite aligning layers were anti

3
FIG. 2: Sandwich-type cell for optical/electrooptical measure-ments, thickness h is 20 or 100 µm.
parallel, and then sealed.
Measurement unit
h=0.5 mm
d=14.0 mm
Thermal insulation Spacer
Sample
Top metal plate
Bottom metal plate
Flow of heated water
FIG. 3: Unit for electrical conductivity measurements.
Contrary, large 500 µm gold-covered cells were used forelectrical conductivity measurements (Fig.3). The largethickness of a cell allows to eliminate direct electrical con-tacts between the electrodes through the MWCNT com-pact bungles and clusters. Moreover, in the thin cells(h ≃ 100 µm), the size of the compact clusters is com-parable with the size of the cell. Therefore, electricalconductivity and percolation characteristics can reflectthe crossover 2d− 3d behavior [35]. No special orientingagents were used in experiments with thick cells, becausethey can influence the accuracy of electrical conductiv-ity measurements. We did not use capillarity method forfilling the cell, because this method may result in sizeselectivity of MWCNT clusters and unpredictability ofMWCNT concentration inside the cell.
E. Optical microscopy investigations
The polarization microscope BX51 (Olympus, USA)was used in optical microscopy investigations. It wasequipped by modern compound microobjectives withmicro size focal area and long enough effective focallength, permitting high-resolution measurements of op-
tical structure inside a LC cell through 1 mm thickglass cover sheet. The microscope construction admit-ted translation of microscope stage along the optical axiswith precision up to 1 micrometer. This has allowed pre-cise choosing of the best plane for optical measurements.Moreover, it is useful for testing the interfacial micro-size shells surrounding MWCNT aggregates and their 3dstructures. The structure of interfacial shells, surround-ing the aggregates, was studied in the quasi monochro-matic regime using the interference filters with 10 nmFWHM (full width at half maximum). The AC voltageU (up to 11V) at frequency f of 10 kHz was applied toelectrooptical cells (Fig.2). The 10 kHz AC was used toprevent undesired polarization phenomena near the elec-trodes.
F. Optical singularities
Ramified structure of LC interfacial shells is promis-ing for appearance of optical singularities, born in zero-amplitude points of a light field full destructive interfer-ence [24, 25]. Singularities appear in a natural way inoptical speckle fields with random amplitude and phasedistribution [36, 37].
It was reasonable to search for them in speckles createdin a laser beam propagating through MWCNT +5CBcell. There are two types of optical singularities: opti-cal vortices (OVs) in scalar fields and polarization sin-gularities [24, 25]. Main polarization singularities areC-points.
The arbitrary polarized elliptic light fields possess si-multaneously three kinds of actual OVs:
(i) the Stokes vortices S12 located in the intersectionpoint of Stokes zero lines S1 and S2;
(ii) the opposite circularly polarized ordinary vortexunderlying each C-point; and
(iii) the component vortices of any scalar componentof the field.
It was reasonable to search for C-points in the specklestructure created in a laser beam propagating through5CB +MWCNT. Their appearance was checked by thetwo-arm scheme (Fig.4a).
The beam was projected on the subsidiary CCD1 cam-era. A needed fragment of MWCNT structure was chosenby transverse translation of the cell. The 5x microobjec-tive projected the laser beam transmitted through thecell to the camera CCD2, and Stokes components weremeasured.
Optical vortices were detected by the usual two-beamscheme with plane reference beam (Fig.4b) [25]. MirrorM2 was inclined at a small angle to the beam axis for cre-ation of interference pattern between the reference beamand the object beam. OVs were detected by well known”fork fringes” [25].
4
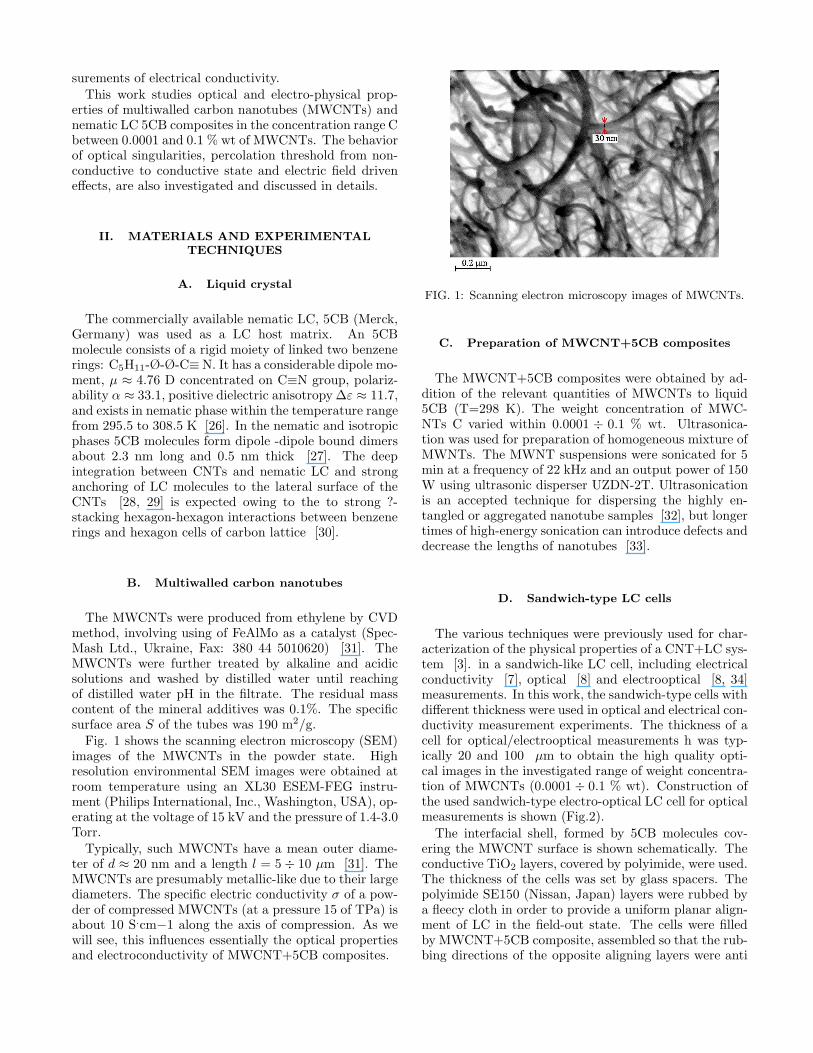
FIG. 4: The far-field microscopy scheme for detection andmetrology of polarization singularities (a) and optical vortices(b).
G. Electrical conductivity measurements
The electrical conductivity was measured for unalignedsamples by the inductance, capacitance and resistance(LCR) meter 819 (Instek, 12 Hz-100 kHz) in a cell (Fig.2) equipped with two horizontal gold electrodes (diame-ter d = 12 mm, inter-electrode space h = 500 µm). Theapplied external voltage was U = 1.275 V. The measur-ing frequency f was chosen within 1÷ 105 Hz. In typicalexperiments, the voltage and frequency dependences atMWCNT concentrations below the percolation threshold(< 0.02 % wt) (tunneling/hopping regime) and above it(multiple contacts regime) were investigated.
H. Computer assisted image analysis of
multiwalled carbon nanotubes
The binary images were analysed using the box-counting method, with the help of the image analysissoftware. The ’capacity’ fractal dimension df was ob-tained from dependence of the number N of boxes nec-essary to cover the boundary of an aggregate versus thebox size L, [38, 39]. The estimated fractal dimensiondf depicts the morphology of a checked aggregate in 2dprojection. Its value varies between 1 (correspondingto a linear aggregate) and 2 (corresponding to a com-pact aggregate). The fractal dimension correspondingto three-dimensional aggregates df3 can be estimated asdf3 = df + 1 [38].
I. Statistical analysis
Each measurement was repeated, at least, five timesto calculate the mean value of the experimental data.
III. RESULTS AND DISCUSSIONS
A. Aggregation of MWCNTs
Typically, the concentration of MWCNTs C in investi-gated composites varied in a wide interval from 10−9 upto few % wt [1]. Ultrasonication allowed good dispersionof MWCNTs to the isolated small bundles.
The strong aggregation tendency of MWCNTs, relatedto van der Waals attraction, increases with increase of C.The typical micro photos of MWCNT+5CB compositesat different MWCNT concentrations C between 0.005 ÷
0.05 % wt., along with data of fractal analysis, are shownin Fig. 5.
FIG. 5: Typical micro photos of MWCNT+5CB compositesat different concentrations of MWCNTs and fractal analysisof MWCNT aggregates using the box-counting method. Thedata were obtained in h = 20 µm cell, 4x, , T = 297 K; thepolarizer was oriented along direction of director for planaroriented 5CB molecules; the analyzer was crossed.
At small concentrations of MWCNTs (C = 0.005 %wt), the separated islands of aggregates in a ”sea” ofnematic 5CB are realized. These aggregates becomethicker and capture sometimes small nematic ”lakes”when weight percentage grows (See pattern for C =0.01% in Fig.5). The mean aggregate size and distancebetween aggregates are of order of ∼ 200 µm. They aredistributed randomly in space, which corresponds to therandom distribution of aggregation seeds, formed in ini-tially homogeneous composite.
Taking into account 3d structure of these aggregatesand dimensions of individual MWCNT, d ≈ 20 nm andl = 5 ÷ 10 µm, each aggregate contains in average upto the million of nanotubes. At percolation threshold,visually observed near the concentration C ≈ 0.025%the aggregates formed the span network. At larger con-centration of MWCNTs (See pattern for C = 0.05 %wt in Fig.5), the individual aggregates disappeared andMWCNTs formed dense networks with inner isolated5CB ”lakes”. Borders of aggregates were extremely ram-ified and fractal analysis of 2d contours of the aggregates

5
was made (Fig.5). It was performed on twenty randomfragments for each concentration of nanotubes. The mostsmooth and most fractal (the highest fractal dimensiondf ≃ 1.7) were inner borders of 5CB ”lakes” inside nan-otube networks at largest concentration of MWCNTs,C = 0.05 wt %. However, the fractal dimension df de-creased with decrease of C: df ≃ 1.57 and df ≃ 1.42for aggregates at concentrations of 0.01 and 0.005 wt %,respectively.
0 0.01 0.02 0.03 0.04 0.05
0
20
40
60
80
Are
a oc
cupi
ed b
y ag
greg
ates
, S %
Concentration of MWCNT, C % wt
FIG. 6: Projected area S, occupied by MWCNT aggregates,versus concentration of nanotubes C in MWCNT+5CB com-posites. The data were obtained from analysis of micro photosin h = 20 µm cell, 4x,, T = 297 K; the polarizer was orientedalong direction of director for planar oriented 5CB molecules;the analyzer was crossed.
Fig.6 presents projected area S versus the concentra-tion C of MWCNTs in 20 µm cells, where the solid linecorresponds to the least square fitting of the experimen-tal points (filled gradients, H) to the power function, i.e.,S ∝ Cβ , with β ≈ 0.34. Note, that for pure 2d filling,the linear dependence between S and C should be fulfilledboth for fractal and compact objects, i.e., β = 1. For 2dprojection of unconfined 3d compact objects, β = 2/3,while empirical estimates give β ≈ 1 for fractal objects;as example, for soot aggregates df = 1.82 ± 0.08 andβ = 0.92 ± 0.02 [40]. The observed anomalous behaviorwith β ≈ 0.34 < 1, possibly, reflects the effects of spatialconfinements in small 20 µm cells. The slow growth ofS with increasing C (β < 1) reflects formation of stackedcompact aggregates in lateral direction to the cell wallwith small projected area.
Fig.7 compares the aggregate structures formed in thecells with small (h = 20 µm) and large (h = 500 µm)thickness. Note that aggregate dimensions can reachmultimicrometer size even at small concentration C ofMWCNTs, below the percolation threshold. For exam-ple, at C = 0.005 % wt, the linear dimensions of aggre-gates exceed 200 µm (Fig.5). So, even at small concen-tration of MWCNTs, the spatial confinements in a smallthickness cell, h = 20 µm, can seriously affect the ag-gregate structure and bring to formation of a stacked
FIG. 7: Micro photos of aggregates at different concentrationsof MWCNTs in sandwich-like cells with small (h=20 m) andlarge (h = 500 µm) thickness. a - h = 20 µm, C = 0.005 wt%;b - h = 20 µm, C = 0.05 wt%; c - h = 500 µm, C = 0.005wt%; d - h = 500 µm, C = 0.05 wt%, , T = 297 K.
compact aggregate. For larger cell with thickness ofh = 500 µ m, such effects become weaker. Nevertheless,difference in a visual perception of the structure of aggre-gates for C = 0.005 % wt in both cells was not very sig-nificant. The important difference in the structure of ag-gregates, formed in the cells with small (d = 20 µm) andlarge (d = 500 µm) thickness, was observed at large con-centration of MWCNTs C = 0.05 % wt that exceeded thepercolation threshold. The clusters were visually thickerin a cell with small thickness, h = 20 µm.
B. Induced polarization singularities and optical
vortices
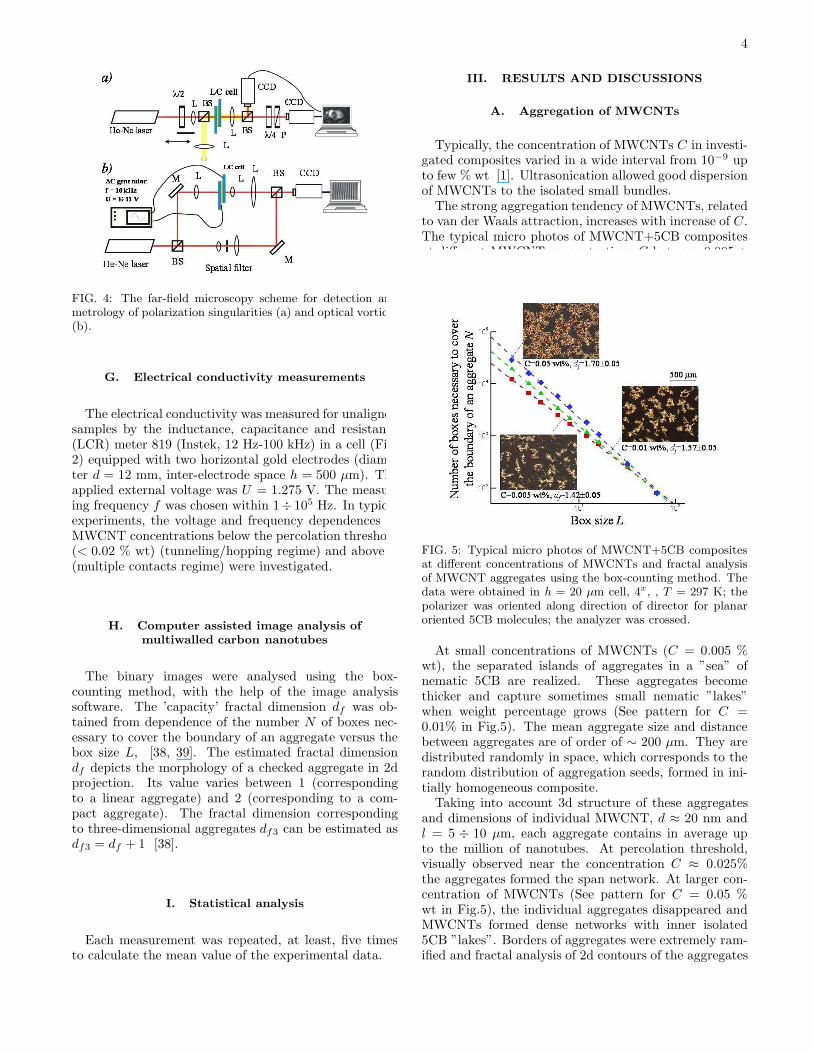
Fig.8 shows two qualitatively different examples ofnear- and far-field structures: mainly clean laser beamcore area (Fig.8a) and pronounced nanotube aggregates(Fig.8c).
As expected, no singularities exist in the clean area(Fig.8b) in contrary to the pair of C-points appearing ontwo interception points of the Stokes S1 and S2 zero-lineson slopes of the intensity distribution [36] (Fig.8d).
The induced optical vortices in MWCNT+5CB cells(Fig.9) at different concentrations C were checked us-ing the far-field microscopy scheme (Fig.4b). At verysmall concentration of MWCNTs C < 10−4 wt %, theoptical vortices were absent. They started to appear atC ≈ 10−3 wt% in the periphery of a beam core (Fig.9b).Further increase of C in the interval between 0.01 and0.05 wt% resulted in more speckle structuring of thebeam core and generation of new optical vortices be-tween them (Fig.9c,d). Enhanced generation of opticalvortices in the vicinity of percolation threshold reflectsappearance of spanning networks. Evidently, such fractalstructure of MWCNT aggregates and highly anisotropicrandom structure of LC interfacial shells initiate compli-cated polarization microstructure of a propagating light
6
FIG. 8: Generation optical vortices, induced inside the laserbeam core at different concentrations C of nanotubes inMWCNT+5CB composites. Negative and positive opticalvortices are marked by white circle and black cross, respec-tively (h = 100 µm); a - C = 10−4 wt%; b - C = 10−3 wt%;c - C = 0.01 wt%, d - C = 0.1 wt%, T = 297 K.
FIG. 9: The induced circularly polarized singular C points inMWCNT+5CB composite (0.01 % wt, h = 20 µm, T = 297K). The near-field structure of a laser beam passed throughcell when contours of MWCNT aggregates: are mainly out (a)and within (c) the beam core. The laser beam core doesn’tcontain singularities (b) in contrary, a pair of C points iscreated (d). White (dark) grey curves are S1 (S2) zero lines.
beam. However, direct relation between concentrationof optical vortexes and percolation characteristics is stillunclear and requires more thorough study in future.
C. Percolation behavior of electrical conductivity
The electrical conductivity of MWCNT+5CB compos-ites σ was within 2−3.10−9 S/cm at small concentrationof MWCNTs C (below 0.01 % wt) and was close to the
electrical conductivity of pure 5CB ( 10−9 S/cm). Withincrease of MWCNT concentration C within 0.01 and0.1%, an abrupt growth of by several orders of magni-tude was observed. It evidently reflected the percolationtransition from non-conducting to conducting state atthe percolation threshold concentration Cc ≈ 0.025 %wt.
Formation of the percolating structures at Cc ≈ 0.025% wt was supported also by the observed optical mi-croscopy images. Namely, at this concentration of nan-otubes, the MWCNT aggregates start to touch and for-mation of the spanning networks occurs. This demon-strates close relation between direct optical observationsand behavior of electrical conductivity in MWCNT+5CBcomposites.
10-3 10-2 10-1 100
10-8
10-7
10-6
10-5
Concentration of MWCNTs, C wt %
Ele
ctri
cal c
ondu
ctiv
ity, σ
, S/c
m
f=100 Hz
Cc≈0.025 % wtVoltage u, V
0.1 V1.0 V
d=500 µm
FIG. 10: The percolation behavior of electrical conductivityfor MWCNT+5CB composites at C = 0.001÷ 0.1 % wt. d =500 µm, f = 100 Hz, T = 297 K.
101 102 103 104 10510-9
10-8
10-7
10-6
10-5
10-4
Frequency f, Hz
Ele
ctri
cal c
ondu
ctiv
ity, σ
, S/c
m
C=0.1 % wt
0.05 % wt
0.01 % wt
d=500 µmc
Voltage u, V
0.1 V1.0 V
ft(0.1 V)
ft(1.0 V)
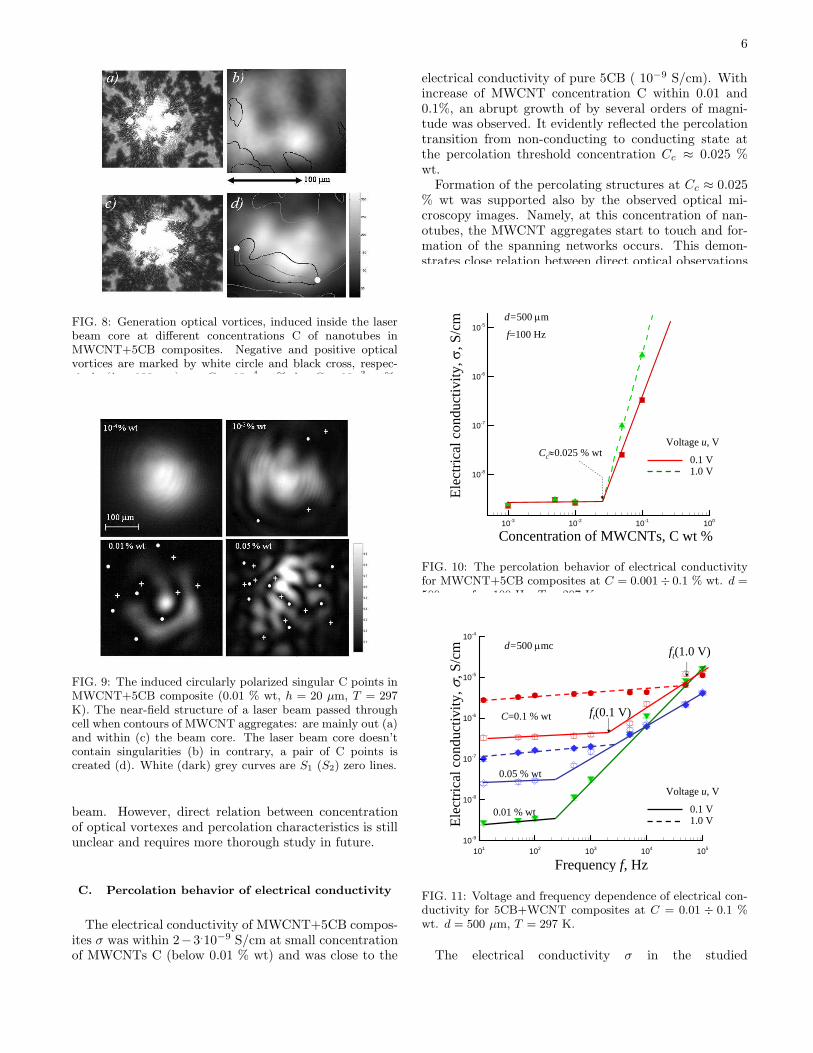
FIG. 11: Voltage and frequency dependence of electrical con-ductivity for 5CB+WCNT composites at C = 0.01 ÷ 0.1 %wt. d = 500 µm, T = 297 K.
The electrical conductivity σ in the studied

7
MWCNT+5CB composites was the increasing functionof applied voltage and frequency (Fig.10). The non-ohmic behavior was also observed in current-voltagecharacteristics of MWCNT+EBBA composites [7]. Itcan be explained on the basis of hopping-tunnelingmodel of transport disruption across the insulating LCregions between the MWCNTs [41].
An increase of σ with f increase evidenced capacitivenature of electric conductivity. It is specific for behav-ior of the electrical conductivity of a MWCNT compos-ite. Note that the frequency dependence of σ becameessential above some transition frequency value, f > ft,where the scaling law of σ ∝ fm type was observed. Thevalue of ft was an increasing function of MWCNT con-centrations C. The observed scaling law of σ ∝ fm
type evidenced the presence of the hopping/tunnelingmechanism of charge transfer for high frequencies abovef > ft. Above percolation threshold at C > Cc ≈ 0.025% wt, dependence of ft vs the applied voltage U wasalso observed (Fig.11). For example, ft(0.1V ) ≈ 200Hz and ft(1.0V ) ≈ 3.103 Hz at C = 0.05 % wt andft(0.1V ) ≈ 2.103 Hz and ft(1.0V ) ≈ 4.104Hz at C = 0.1% wt.
FIG. 12: Effect of applied voltage on behavior of electricalconductivity of CNT+5CB composites. C=0.05 % wt, d =500 µm, f = 10 kHz, T = 297 K.
D. Electric field driven effects
The demonstrated dependence of ft versus the appliedvoltage U (Fig.11) evidences the presence of field con-tribution to the conductivity mechanism, related withthe structure of LC medium between different MWC-NTs. The presence of such electric field driven effect tothe electrical conductivity is supported by the observedtransient behavior of electrical conductivity after abruptchanging of the applied voltage.
Fig.12 shows time dependence of electrical conductiv-ity in the experiments with abrupt increase of voltage U
FIG. 13: Effect of applied voltage abrupt increasing on behav-ior of electrical conductivity of MWCNT+5CB composites.C=0.05 % wt, d = 500 µm, f = 10 kHz, T = 297 K.
from initial value 0.2 V up to 0.5 (voltageup mode) dur-ing the time of exposure ≈ 600 ÷ 1000 s, followed by itabrupt decrease to the initial value of 0.2 V (voltagedownmode) during the time of exposure ≈ 600 ÷ 1000 s andfurther cyclic voltage increase up to the final value of3.5 V in the last up-down voltage cycle. The electri-cal conductivity continually increased and the transientbehavior was observed after each such up-down voltagecycle.
Fig.13 demonstrates such transient behavior of electri-cal conductivity in the scaled coordinates (σ− σi)/(σf −
σi) vs t, where σi is the initial conductivity (beforeabrupt change of voltage), σf is the final conductivityafter exposure time of ≈ 600 s, and time t is countedafter the abrupt change of voltage.
It is interesting, that for all the studied processeswith jumps to different values of U during the sepa-rate up− down voltage cycles, the transition curves werefalling into the universal master curves for voltage up andvoltage down modes, and the curves were smoother forvoltage up mode than for voltage down mode. Two dif-ferent time processes were evidently present for the stud-ied system: the faster (at t < tt ≈100 s) and slower powerlaw process at long exposure times: σ ∝ tα with α =0.042±0.004 for voltage up mode and α = 0.03±0.01 forvoltage down mode. The fast process, possibly, reflectsthe time relaxation evolving 5CB and MWCNT coupling,and the slow process may be related with structural reor-ganization of MWCNT networks driven by electric field.The presence of such changes is supported by the ob-served irreversible increase of electrical conductivity afterthe voltage on/off circles.
The explanation of the electric field driven transient ef-fect requires the appropriated physical model. The simi-lar transient behavior in response of electrical conductiv-ity to on/off switching of the electric field was previouslyobserved in suspensions of MWCNTs in distilled water,ethanol, and isopropanol [42]. The observed electric fielddriven effects can be related to migration of CNTs and

8
FIG. 14: Micro photos of 0.05 % wt MWCNT+5CB compos-ite at different applied voltages. The data were obtained forh = 20 µm cell, 4x microobjective; the polarizer was orientedalong direction of director for planar oriented 5CB molecules;the analyzer was crossed. a - 0 V; b - 5 V; c - 10.9 V, T = 297K.
their alignment by electric fields [43, 44, 45, 46, 47].The AC electric charging induces MWCNTs movementin gradient directions of electric intensity, well known asdielectrophoresis electrokinetic flow. Consequently, theCNTs can be rotated and aligned in the LC media bydielectrophoretic force. This phenomenon occurs, whenthe complex permittivity of the suspended CNTs differs
from that of the medium.
The strong electric field gradient is also expected nearthe surface of ramified MWCNT aggregates. So, dielec-trophoresis mechanism may be appropriate for explana-tion of the observed transient phenomena. It was previ-ously shown that MWCNTs were not only aligned alongthe field, but they were also migrating laterally, addingthickness to MWCNT shells, and these processes werethe function of magnitude, frequency, and time of elec-tric field application [48].
The strong electric field gradient near the surfaceof MWCNT aggregates can noticeably perturb theLC structure in the interfacial shells surrounding theMWCNT aggregates. This effect can be directly demon-strated by analyzing the optical microscopy images ofaggregates at different values of applied voltage U .
The examples of such images for 0.05 % MWCNT+5CB composite at different U are presented in Fig.14.The presence of enlightenment shells near the surface ofMWCNT aggregates clearly reflected the strong anchor-ing of 5CB molecules to the surface of MWCNTs [49].The strong anchoring between 5CBs and lateral surfaceof MWCNTs is the result of the similarity of carbonhexagons in 5CB and MWCNTs. The observed enlight-enment shells can be explained by the presence of com-plicated 3d fields of elasticity strength inside the layersof anchored 5CBs that results, in turn, in perturbationof refractive index distribution near the surface of MWC-NTs. The thickness of interfacial shells, surrounding theMWCNT aggregates, was dramatically dependent uponthe applied voltage U (Fig.15).
0,01 wt%
0,005 wt%∫=S
int II
Appled voltage, U, V
I/I o
FIG. 15: Relative integral intensity I/Io versus appliedvoltage U for 0.005 % wt (1) and C = 0.01 % wt (2)MWCNT+5CB composites. The data obtained for h = 20 µmcell, 4x, T = 297 K; the polarizer was oriented along directionof director for planar oriented 5CB molecules; the analyzerwas crossed.
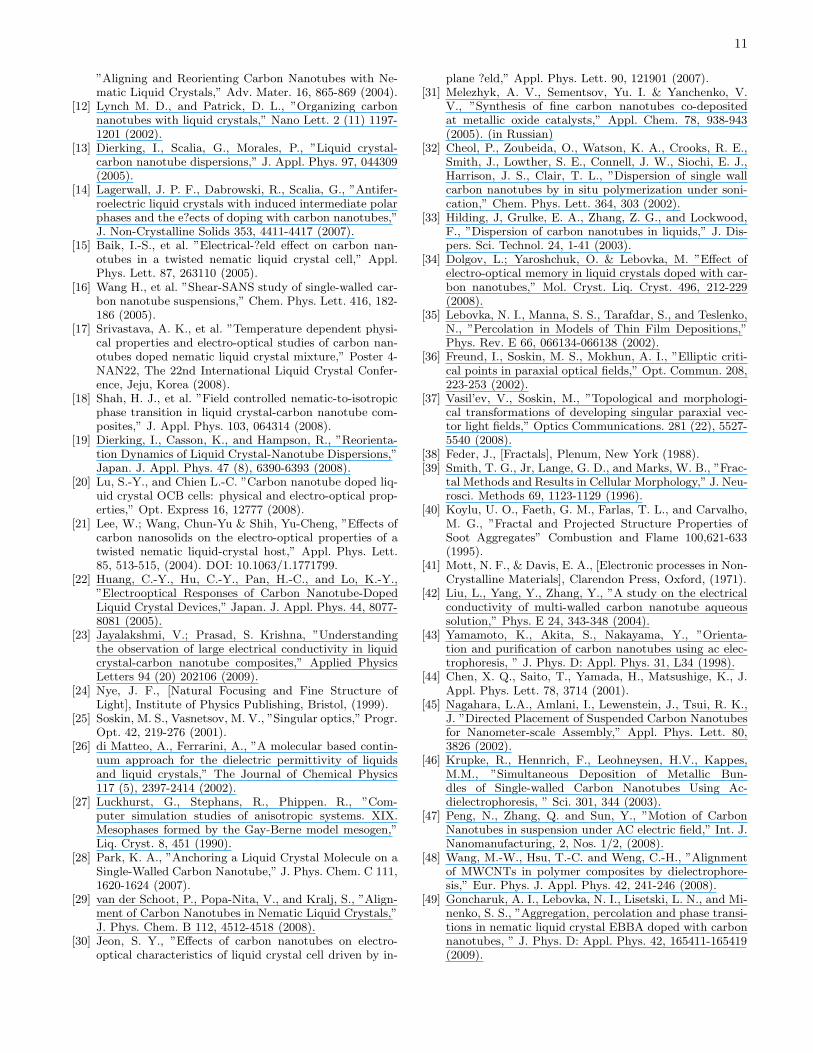
In order to quantify this effect, the integral image in-tensity I was calculated by integration of the local image
9
intensity I90(x, y) over the whole image area:
I =
∫I90(x, y)dxdy
. Fig.15 presents dependence of I/I0 for twoMWCNT+5CB composites. The value of I/Io reachedthe maximum near some threshold value of U ≈ 5 V,and at high voltages it decreased insignificantly. Thequalitatively similar dependences were observed also forother investigated concentrations of MWCNTs C in thevicinity of the percolation threshold. The observed effectof the field on the thickness of interfacial LC shells sur-rounding the MWCNT aggregates, possibly, reflects theelectric field driven enhancement of LC structure pertur-bation in the interfacial shells and influence of MWCNTloading on the Frederick’s transition inside nematic ma-trix [50].
E. Nematic to isotropic phase transition driven
effects
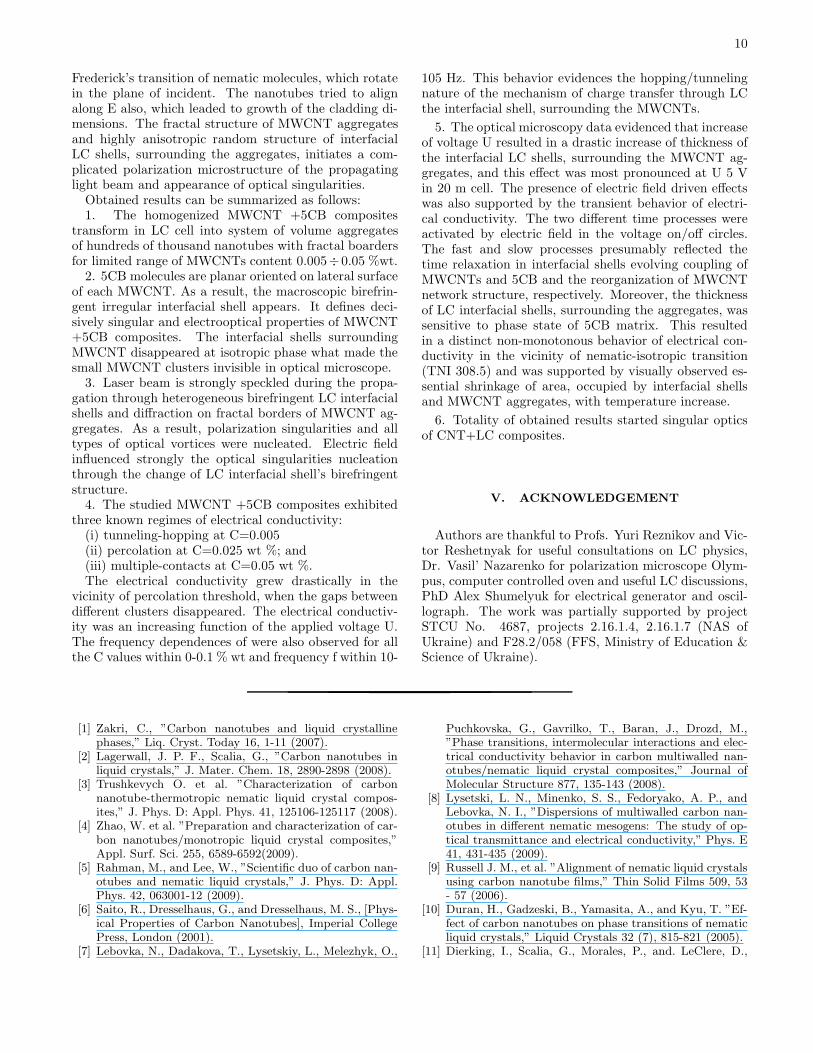
The phase state of LC matrix may play essential role indetermination of the structure of the interfacial LC shellssurrounding the MWCNT aggregates, their thickness andelectrophysical properties of MWCNT+5CB composites.
3 0 0 3 1 0
2 .0 x 1 0 -0 5
3 .0 x 1 0 -0 5
4 .0 x 1 0 -0 5
f = 104 Гц
0.1% wt
U = 1 В
TN-I≈308.5 K
Ele
ctri
cal c
ondu
ctiv
ity,σ
, S/c
m
Temperature, T, K
FIG. 16: Electrical conductivity σ versus temperature T for0.1 % wt MWCNT+5CB composites. The data obtained inh = 500 µm cell, U=1 V, f = 104 Hz for un-oriented sample.The arrows show directions of temperature increase (→) anddecrease (←).
Fig. 16 presents the electrical conductivity σ versusthe temperature T for 0.1 % wt MWCNT+5CB compos-ites. The temperature was initially increased up to 330K and then decreased to the room temperature. Theelectrical conductivity data demonstrated the presenceof distinct non-monotonous behavior in the vicinity ofnematic-isotropic transition (TNI ≃ 308.5K) for boththermal heating and cooling regimes. The electrical con-ductivity was dropped to lower level at transition fromnematic to isotropic state, and it evidently reflects theeffects of interfacial LC shells, surrounding the MWCNTaggregates.
It is expected that thickness of interfacial LC shellscan noticeably decrease in the vicinity of phase transition
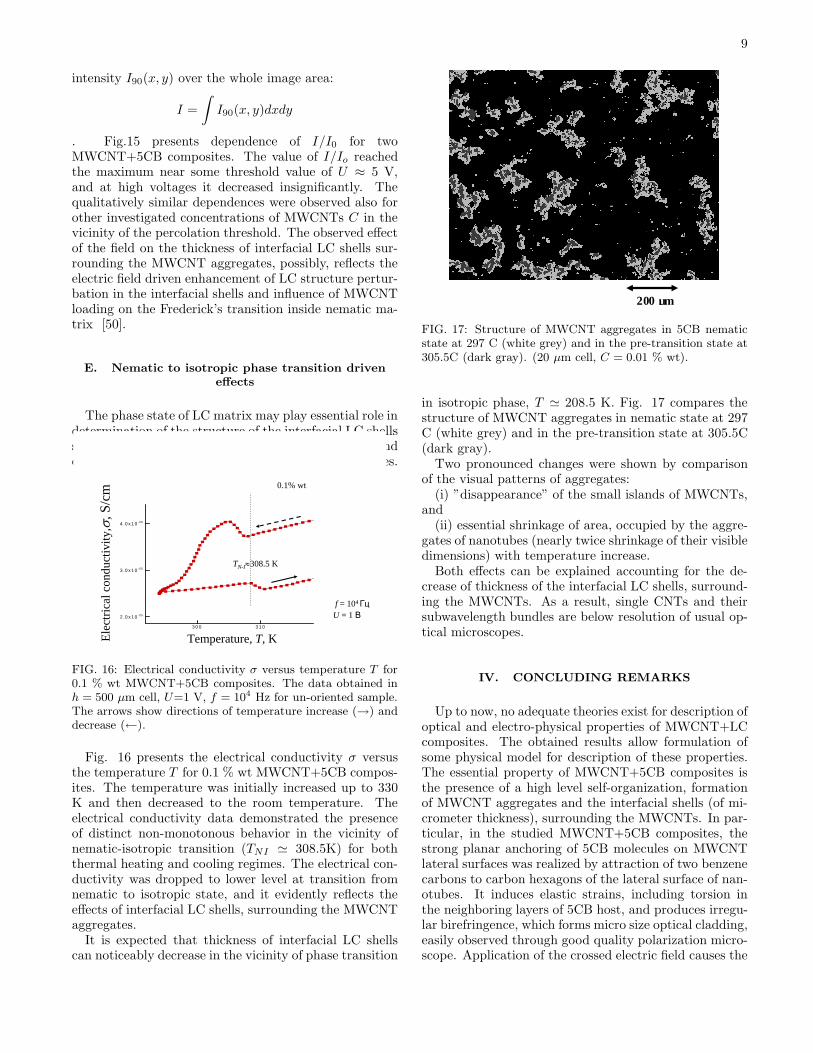
200 µm
FIG. 17: Structure of MWCNT aggregates in 5CB nematicstate at 297 C (white grey) and in the pre-transition state at305.5C (dark gray). (20 µm cell, C = 0.01 % wt).
in isotropic phase, T ≃ 208.5 K. Fig. 17 compares thestructure of MWCNT aggregates in nematic state at 297C (white grey) and in the pre-transition state at 305.5C(dark gray).
Two pronounced changes were shown by comparisonof the visual patterns of aggregates:
(i) ”disappearance” of the small islands of MWCNTs,and
(ii) essential shrinkage of area, occupied by the aggre-gates of nanotubes (nearly twice shrinkage of their visibledimensions) with temperature increase.
Both effects can be explained accounting for the de-crease of thickness of the interfacial LC shells, surround-ing the MWCNTs. As a result, single CNTs and theirsubwavelength bundles are below resolution of usual op-tical microscopes.
IV. CONCLUDING REMARKS
Up to now, no adequate theories exist for description ofoptical and electro-physical properties of MWCNT+LCcomposites. The obtained results allow formulation ofsome physical model for description of these properties.The essential property of MWCNT+5CB composites isthe presence of a high level self-organization, formationof MWCNT aggregates and the interfacial shells (of mi-crometer thickness), surrounding the MWCNTs. In par-ticular, in the studied MWCNT+5CB composites, thestrong planar anchoring of 5CB molecules on MWCNTlateral surfaces was realized by attraction of two benzenecarbons to carbon hexagons of the lateral surface of nan-otubes. It induces elastic strains, including torsion inthe neighboring layers of 5CB host, and produces irregu-lar birefringence, which forms micro size optical cladding,easily observed through good quality polarization micro-scope. Application of the crossed electric field causes the
10
Frederick’s transition of nematic molecules, which rotatein the plane of incident. The nanotubes tried to alignalong E also, which leaded to growth of the cladding di-mensions. The fractal structure of MWCNT aggregatesand highly anisotropic random structure of interfacialLC shells, surrounding the aggregates, initiates a com-plicated polarization microstructure of the propagatinglight beam and appearance of optical singularities.
Obtained results can be summarized as follows:1. The homogenized MWCNT +5CB composites
transform in LC cell into system of volume aggregatesof hundreds of thousand nanotubes with fractal boardersfor limited range of MWCNTs content 0.005÷0.05 %wt.
2. 5CB molecules are planar oriented on lateral surfaceof each MWCNT. As a result, the macroscopic birefrin-gent irregular interfacial shell appears. It defines deci-sively singular and electrooptical properties of MWCNT+5CB composites. The interfacial shells surroundingMWCNT disappeared at isotropic phase what made thesmall MWCNT clusters invisible in optical microscope.
3. Laser beam is strongly speckled during the propa-gation through heterogeneous birefringent LC interfacialshells and diffraction on fractal borders of MWCNT ag-gregates. As a result, polarization singularities and alltypes of optical vortices were nucleated. Electric fieldinfluenced strongly the optical singularities nucleationthrough the change of LC interfacial shell’s birefringentstructure.
4. The studied MWCNT +5CB composites exhibitedthree known regimes of electrical conductivity:
(i) tunneling-hopping at C=0.005(ii) percolation at C=0.025 wt %; and(iii) multiple-contacts at C=0.05 wt %.The electrical conductivity grew drastically in the
vicinity of percolation threshold, when the gaps betweendifferent clusters disappeared. The electrical conductiv-ity was an increasing function of the applied voltage U.The frequency dependences of were also observed for allthe C values within 0-0.1 % wt and frequency f within 10-
105 Hz. This behavior evidences the hopping/tunnelingnature of the mechanism of charge transfer through LCthe interfacial shell, surrounding the MWCNTs.
5. The optical microscopy data evidenced that increaseof voltage U resulted in a drastic increase of thickness ofthe interfacial LC shells, surrounding the MWCNT ag-gregates, and this effect was most pronounced at U 5 Vin 20 m cell. The presence of electric field driven effectswas also supported by the transient behavior of electri-cal conductivity. The two different time processes wereactivated by electric field in the voltage on/off circles.The fast and slow processes presumably reflected thetime relaxation in interfacial shells evolving coupling ofMWCNTs and 5CB and the reorganization of MWCNTnetwork structure, respectively. Moreover, the thicknessof LC interfacial shells, surrounding the aggregates, wassensitive to phase state of 5CB matrix. This resultedin a distinct non-monotonous behavior of electrical con-ductivity in the vicinity of nematic-isotropic transition(TNI 308.5) and was supported by visually observed es-sential shrinkage of area, occupied by interfacial shellsand MWCNT aggregates, with temperature increase.
6. Totality of obtained results started singular opticsof CNT+LC composites.
V. ACKNOWLEDGEMENT
Authors are thankful to Profs. Yuri Reznikov and Vic-tor Reshetnyak for useful consultations on LC physics,Dr. Vasil’ Nazarenko for polarization microscope Olym-pus, computer controlled oven and useful LC discussions,PhD Alex Shumelyuk for electrical generator and oscil-lograph. The work was partially supported by projectSTCU No. 4687, projects 2.16.1.4, 2.16.1.7 (NAS ofUkraine) and F28.2/058 (FFS, Ministry of Education &Science of Ukraine).
[1] Zakri, C., ”Carbon nanotubes and liquid crystallinephases,” Liq. Cryst. Today 16, 1-11 (2007).
[2] Lagerwall, J. P. F., Scalia, G., ”Carbon nanotubes inliquid crystals,” J. Mater. Chem. 18, 2890-2898 (2008).
[3] Trushkevych O. et al. ”Characterization of carbonnanotube-thermotropic nematic liquid crystal compos-ites,” J. Phys. D: Appl. Phys. 41, 125106-125117 (2008).
[4] Zhao, W. et al. ”Preparation and characterization of car-bon nanotubes/monotropic liquid crystal composites,”Appl. Surf. Sci. 255, 6589-6592(2009).
[5] Rahman, M., and Lee, W., ”Scientific duo of carbon nan-otubes and nematic liquid crystals,” J. Phys. D: Appl.Phys. 42, 063001-12 (2009).
[6] Saito, R., Dresselhaus, G., and Dresselhaus, M. S., [Phys-ical Properties of Carbon Nanotubes], Imperial CollegePress, London (2001).
[7] Lebovka, N., Dadakova, T., Lysetskiy, L., Melezhyk, O.,
Puchkovska, G., Gavrilko, T., Baran, J., Drozd, M.,”Phase transitions, intermolecular interactions and elec-trical conductivity behavior in carbon multiwalled nan-otubes/nematic liquid crystal composites,” Journal ofMolecular Structure 877, 135-143 (2008).
[8] Lysetski, L. N., Minenko, S. S., Fedoryako, A. P., andLebovka, N. I., ”Dispersions of multiwalled carbon nan-otubes in different nematic mesogens: The study of op-tical transmittance and electrical conductivity,” Phys. E41, 431-435 (2009).
[9] Russell J. M., et al. ”Alignment of nematic liquid crystalsusing carbon nanotube films,” Thin Solid Films 509, 53- 57 (2006).
[10] Duran, H., Gadzeski, B., Yamasita, A., and Kyu, T. ”Ef-fect of carbon nanotubes on phase transitions of nematicliquid crystals,” Liquid Crystals 32 (7), 815-821 (2005).
[11] Dierking, I., Scalia, G., Morales, P., and. LeClere, D.,
11
”Aligning and Reorienting Carbon Nanotubes with Ne-matic Liquid Crystals,” Adv. Mater. 16, 865-869 (2004).
[12] Lynch M. D., and Patrick, D. L., ”Organizing carbonnanotubes with liquid crystals,” Nano Lett. 2 (11) 1197-1201 (2002).
[13] Dierking, I., Scalia, G., Morales, P., ”Liquid crystal-carbon nanotube dispersions,” J. Appl. Phys. 97, 044309(2005).
[14] Lagerwall, J. P. F., Dabrowski, R., Scalia, G., ”Antifer-roelectric liquid crystals with induced intermediate polarphases and the e?ects of doping with carbon nanotubes,”J. Non-Crystalline Solids 353, 4411-4417 (2007).
[15] Baik, I.-S., et al. ”Electrical-?eld effect on carbon nan-otubes in a twisted nematic liquid crystal cell,” Appl.Phys. Lett. 87, 263110 (2005).
[16] Wang H., et al. ”Shear-SANS study of single-walled car-bon nanotube suspensions,” Chem. Phys. Lett. 416, 182-186 (2005).
[17] Srivastava, A. K., et al. ”Temperature dependent physi-cal properties and electro-optical studies of carbon nan-otubes doped nematic liquid crystal mixture,” Poster 4-NAN22, The 22nd International Liquid Crystal Confer-ence, Jeju, Korea (2008).
[18] Shah, H. J., et al. ”Field controlled nematic-to-isotropicphase transition in liquid crystal-carbon nanotube com-posites,” J. Appl. Phys. 103, 064314 (2008).
[19] Dierking, I., Casson, K., and Hampson, R., ”Reorienta-tion Dynamics of Liquid Crystal-Nanotube Dispersions,”Japan. J. Appl. Phys. 47 (8), 6390-6393 (2008).
[20] Lu, S.-Y., and Chien L.-C. ”Carbon nanotube doped liq-uid crystal OCB cells: physical and electro-optical prop-erties,” Opt. Express 16, 12777 (2008).
[21] Lee, W.; Wang, Chun-Yu & Shih, Yu-Cheng, ”Effects ofcarbon nanosolids on the electro-optical properties of atwisted nematic liquid-crystal host,” Appl. Phys. Lett.85, 513-515, (2004). DOI: 10.1063/1.1771799.
[22] Huang, C.-Y., Hu, C.-Y., Pan, H.-C., and Lo, K.-Y.,”Electrooptical Responses of Carbon Nanotube-DopedLiquid Crystal Devices,” Japan. J. Appl. Phys. 44, 8077-8081 (2005).
[23] Jayalakshmi, V.; Prasad, S. Krishna, ”Understandingthe observation of large electrical conductivity in liquidcrystal-carbon nanotube composites,” Applied PhysicsLetters 94 (20) 202106 (2009).
[24] Nye, J. F., [Natural Focusing and Fine Structure ofLight], Institute of Physics Publishing, Bristol, (1999).
[25] Soskin, M. S., Vasnetsov, M. V., ”Singular optics,” Progr.Opt. 42, 219-276 (2001).
[26] di Matteo, A., Ferrarini, A., ”A molecular based contin-uum approach for the dielectric permittivity of liquidsand liquid crystals,” The Journal of Chemical Physics117 (5), 2397-2414 (2002).
[27] Luckhurst, G., Stephans, R., Phippen. R., ”Com-puter simulation studies of anisotropic systems. XIX.Mesophases formed by the Gay-Berne model mesogen,”Liq. Cryst. 8, 451 (1990).
[28] Park, K. A., ”Anchoring a Liquid Crystal Molecule on aSingle-Walled Carbon Nanotube,” J. Phys. Chem. C 111,1620-1624 (2007).
[29] van der Schoot, P., Popa-Nita, V., and Kralj, S., ”Align-ment of Carbon Nanotubes in Nematic Liquid Crystals,”J. Phys. Chem. B 112, 4512-4518 (2008).
[30] Jeon, S. Y., ”Effects of carbon nanotubes on electro-optical characteristics of liquid crystal cell driven by in-
plane ?eld,” Appl. Phys. Lett. 90, 121901 (2007).[31] Melezhyk, A. V., Sementsov, Yu. I. & Yanchenko, V.
V., ”Synthesis of fine carbon nanotubes co-depositedat metallic oxide catalysts,” Appl. Chem. 78, 938-943(2005). (in Russian)
[32] Cheol, P., Zoubeida, O., Watson, K. A., Crooks, R. E.,Smith, J., Lowther, S. E., Connell, J. W., Siochi, E. J.,Harrison, J. S., Clair, T. L., ”Dispersion of single wallcarbon nanotubes by in situ polymerization under soni-cation,” Chem. Phys. Lett. 364, 303 (2002).
[33] Hilding, J, Grulke, E. A., Zhang, Z. G., and Lockwood,F., ”Dispersion of carbon nanotubes in liquids,” J. Dis-pers. Sci. Technol. 24, 1-41 (2003).
[34] Dolgov, L.; Yaroshchuk, O. & Lebovka, M. ”Effect ofelectro-optical memory in liquid crystals doped with car-bon nanotubes,” Mol. Cryst. Liq. Cryst. 496, 212-229(2008).
[35] Lebovka, N. I., Manna, S. S., Tarafdar, S., and Teslenko,N., ”Percolation in Models of Thin Film Depositions,”Phys. Rev. E 66, 066134-066138 (2002).
[36] Freund, I., Soskin, M. S., Mokhun, A. I., ”Elliptic criti-cal points in paraxial optical fields,” Opt. Commun. 208,223-253 (2002).
[37] Vasil’ev, V., Soskin, M., ”Topological and morphologi-cal transformations of developing singular paraxial vec-tor light fields,” Optics Communications. 281 (22), 5527-5540 (2008).
[38] Feder, J., [Fractals], Plenum, New York (1988).[39] Smith, T. G., Jr, Lange, G. D., and Marks, W. B., ”Frac-
tal Methods and Results in Cellular Morphology,” J. Neu-rosci. Methods 69, 1123-1129 (1996).
[40] Koylu, U. O., Faeth, G. M., Farlas, T. L., and Carvalho,M. G., ”Fractal and Projected Structure Properties ofSoot Aggregates” Combustion and Flame 100,621-633(1995).
[41] Mott, N. F., & Davis, E. A., [Electronic processes in Non-Crystalline Materials], Clarendon Press, Oxford, (1971).
[42] Liu, L., Yang, Y., Zhang, Y., ”A study on the electricalconductivity of multi-walled carbon nanotube aqueoussolution,” Phys. E 24, 343-348 (2004).
[43] Yamamoto, K., Akita, S., Nakayama, Y., ”Orienta-tion and purification of carbon nanotubes using ac elec-trophoresis, ” J. Phys. D: Appl. Phys. 31, L34 (1998).
[44] Chen, X. Q., Saito, T., Yamada, H., Matsushige, K., J.Appl. Phys. Lett. 78, 3714 (2001).
[45] Nagahara, L.A., Amlani, I., Lewenstein, J., Tsui, R. K.,J. ”Directed Placement of Suspended Carbon Nanotubesfor Nanometer-scale Assembly,” Appl. Phys. Lett. 80,3826 (2002).
[46] Krupke, R., Hennrich, F., Leohneysen, H.V., Kappes,M.M., ”Simultaneous Deposition of Metallic Bun-dles of Single-walled Carbon Nanotubes Using Ac-dielectrophoresis, ” Sci. 301, 344 (2003).
[47] Peng, N., Zhang, Q. and Sun, Y., ”Motion of CarbonNanotubes in suspension under AC electric field,” Int. J.Nanomanufacturing, 2, Nos. 1/2, (2008).
[48] Wang, M.-W., Hsu, T.-C. and Weng, C.-H., ”Alignmentof MWCNTs in polymer composites by dielectrophore-sis,” Eur. Phys. J. Appl. Phys. 42, 241-246 (2008).
[49] Goncharuk, A. I., Lebovka, N. I., Lisetski, L. N., and Mi-nenko, S. S., ”Aggregation, percolation and phase transi-tions in nematic liquid crystal EBBA doped with carbonnanotubes, ” J. Phys. D: Appl. Phys. 42, 165411-165419(2009).

12
[50] Blinov, L. M. and Chigrinov, V. G., [Electrooptic Effectsin Liquid Crystal Materials] Springer, Singapore, (1994).