Tissue-specific variation in DNA methylation levels along human chromosome 1
21
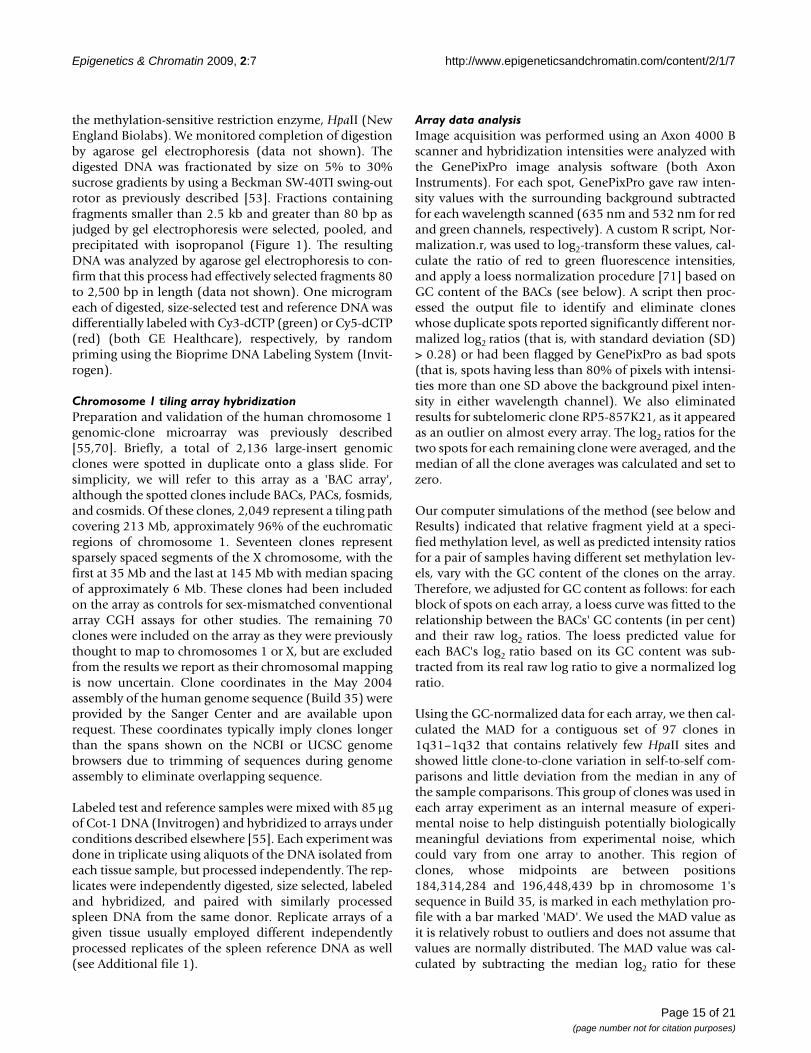
BioMed Central Page 1 of 21 (page number not for citation purposes) Epigenetics & Chromatin Open Access Research Tissue-specific variation in DNA methylation levels along human chromosome 1 Cecilia De Bustos †1,8 , Edward Ramos †2,3,9 , Janet M Young †2 , Robert K Tran 4,10 , Uwe Menzel 1 , Cordelia F Langford 5 , Evan E Eichler 3,6 , Li Hsu 7 , Steve Henikoff 4,6 , Jan P Dumanski 1 and Barbara J Trask* 2,3 Address: 1 Department of Genetics and Pathology, Rudbeck Laboratory, Uppsala University, Uppsala, Sweden, 2 Division of Human Biology, Fred Hutchinson Cancer Research Center, Seattle, Washington, USA, 3 Department of Genome Sciences, University of Washington, Seattle, Washington, USA, 4 Division of Basic Sciences, Fred Hutchinson Cancer Research Center, Seattle, Washington, USA, 5 The Wellcome Trust Sanger Institute, Wellcome Trust Genome Campus, Hinxton, Cambridge, UK, 6 Howard Hughes Medical Institute, Seattle, Washington, USA, 7 Division of Public Health Sciences, Fred Hutchinson Cancer Research Center, Seattle, Washington, USA, 8 Current address: United Nations World Food Programme, Lima, Peru, 9 Current address: National Institutes of Health, Bethesda Maryland, USA and 10 Current address: Genome Center, University of California at Davis, Davis, California, USA Email: Cecilia De Bustos - [email protected]; Edward Ramos - [email protected]; Janet M Young - [email protected]; Robert K Tran - [email protected]; Uwe Menzel - [email protected]; Cordelia F Langford - [email protected]; Evan E Eichler - [email protected]; Li Hsu - [email protected]; Steve Henikoff - [email protected]; Jan P Dumanski - [email protected]; Barbara J Trask* - [email protected] * Corresponding author †Equal contributors Abstract Background: DNA methylation is a major epigenetic modification important for regulating gene expression and suppressing spurious transcription. Most methods to scan the genome in different tissues for differentially methylated sites have focused on the methylation of CpGs in CpG islands, which are concentrations of CpGs often associated with gene promoters. Results: Here, we use a methylation profiling strategy that is predominantly responsive to methylation differences outside of CpG islands. The method compares the yield from two samples of size-selected fragments generated by a methylation-sensitive restriction enzyme. We then profile nine different normal tissues from two human donors relative to spleen using a custom array of genomic clones covering the euchromatic portion of human chromosome 1 and representing 8% of the human genome. We observe gross regional differences in methylation states across chromosome 1 between tissues from the same individual, with the most striking differences detected in the comparison of cerebellum and spleen. Profiles of the same tissue from different donors are strikingly similar, as are the profiles of different lobes of the brain. Comparing our results with published gene expression levels, we find that clones exhibiting extreme ratios reflecting low relative methylation are statistically enriched for genes with high expression ratios, and vice versa, in most pairs of tissues examined. Conclusion: The varied patterns of methylation differences detected between tissues by our methylation profiling method reinforce the potential functional significance of regional differences in methylation levels outside of CpG islands. Published: 8 June 2009 Epigenetics & Chromatin 2009, 2:7 doi:10.1186/1756-8935-2-7 Received: 8 December 2008 Accepted: 8 June 2009 This article is available from: http://www.epigeneticsandchromatin.com/content/2/1/7 © 2009 De Bustos et al; licensee BioMed Central Ltd. This is an Open Access article distributed under the terms of the Creative Commons Attribution License (http://creativecommons.org/licenses/by/2.0 ), which permits unrestricted use, distribution, and reproduction in any medium, provided the original work is properly cited.
-
Upload
independent -
Category
Documents
-
view
6 -
download
0
Transcript of Tissue-specific variation in DNA methylation levels along human chromosome 1

BioMed CentralEpigenetics & Chromatin
ss
Open AcceResearchTissue-specific variation in DNA methylation levels along human chromosome 1Cecilia De Bustos†1,8, Edward Ramos†2,3,9, Janet M Young†2, Robert K Tran4,10, Uwe Menzel1, Cordelia F Langford5, Evan E Eichler3,6, Li Hsu7, Steve Henikoff4,6, Jan P Dumanski1 and Barbara J Trask*2,3Address: 1Department of Genetics and Pathology, Rudbeck Laboratory, Uppsala University, Uppsala, Sweden, 2Division of Human Biology, Fred Hutchinson Cancer Research Center, Seattle, Washington, USA, 3Department of Genome Sciences, University of Washington, Seattle, Washington, USA, 4Division of Basic Sciences, Fred Hutchinson Cancer Research Center, Seattle, Washington, USA, 5The Wellcome Trust Sanger Institute, Wellcome Trust Genome Campus, Hinxton, Cambridge, UK, 6Howard Hughes Medical Institute, Seattle, Washington, USA, 7Division of Public Health Sciences, Fred Hutchinson Cancer Research Center, Seattle, Washington, USA, 8Current address: United Nations World Food Programme, Lima, Peru, 9Current address: National Institutes of Health, Bethesda Maryland, USA and 10Current address: Genome Center, University of California at Davis, Davis, California, USA
Email: Cecilia De Bustos - [email protected]; Edward Ramos - [email protected]; Janet M Young - [email protected]; Robert K Tran - [email protected]; Uwe Menzel - [email protected]; Cordelia F Langford - [email protected]; Evan E Eichler - [email protected]; Li Hsu - [email protected]; Steve Henikoff - [email protected]; Jan P Dumanski - [email protected]; Barbara J Trask* - [email protected]
* Corresponding author †Equal contributors
AbstractBackground: DNA methylation is a major epigenetic modification important for regulating geneexpression and suppressing spurious transcription. Most methods to scan the genome in differenttissues for differentially methylated sites have focused on the methylation of CpGs in CpG islands,which are concentrations of CpGs often associated with gene promoters.
Results: Here, we use a methylation profiling strategy that is predominantly responsive tomethylation differences outside of CpG islands. The method compares the yield from two samplesof size-selected fragments generated by a methylation-sensitive restriction enzyme. We thenprofile nine different normal tissues from two human donors relative to spleen using a custom arrayof genomic clones covering the euchromatic portion of human chromosome 1 and representing8% of the human genome. We observe gross regional differences in methylation states acrosschromosome 1 between tissues from the same individual, with the most striking differencesdetected in the comparison of cerebellum and spleen. Profiles of the same tissue from differentdonors are strikingly similar, as are the profiles of different lobes of the brain. Comparing ourresults with published gene expression levels, we find that clones exhibiting extreme ratiosreflecting low relative methylation are statistically enriched for genes with high expression ratios,and vice versa, in most pairs of tissues examined.
Conclusion: The varied patterns of methylation differences detected between tissues by ourmethylation profiling method reinforce the potential functional significance of regional differencesin methylation levels outside of CpG islands.
Published: 8 June 2009
Epigenetics & Chromatin 2009, 2:7 doi:10.1186/1756-8935-2-7
Received: 8 December 2008Accepted: 8 June 2009
This article is available from: http://www.epigeneticsandchromatin.com/content/2/1/7
© 2009 De Bustos et al; licensee BioMed Central Ltd. This is an Open Access article distributed under the terms of the Creative Commons Attribution License (http://creativecommons.org/licenses/by/2.0), which permits unrestricted use, distribution, and reproduction in any medium, provided the original work is properly cited.
Page 1 of 21(page number not for citation purposes)

Epigenetics & Chromatin 2009, 2:7 http://www.epigeneticsandchromatin.com/content/2/1/7
BackgroundDNA methylation is a major epigenetic modification thatis vital to mammalian development [1]. Methylation iscarried out by DNA methyltransferases [2] and can sup-press the initiation of transcription of a locus [3]. Methyl-ation plays a significant role in genomic imprinting, X-inactivation, and silencing of parasitic sequences [4-7].Acquired DNA methylation differences might account forsome phenotypic differences between monozygotic twins[8]. Aberrant methylation can cause various syndromes[9-14] and contribute to tumorigenesis by decreasingactivity of tumor suppressor genes [15], activating proto-oncogenes [16], or overall methylation imbalance [17](reviewed in [18]).
In mammals, methylation occurs preferentially atcytosines that are followed by guanine (CpG). CpG dinu-cleotides are relatively infrequent in the human genome,except in CpG islands, which are small (0.2 to 2 kb)regions highly enriched in CpGs. Approximately 50 to60% of gene promoters lie in CpG islands [19-21]. Meth-ylation can inhibit binding of transcription factors tothese sequences directly by altering the structure of therecognition site, or indirectly by recruiting repressive pro-teins with methyl-binding domains [22-25].
However, methylation of CpG island promoters does notalways correlate with gene expression levels. Most inactivepromoters are not methylated [3,26]. The CpG islands ofsome tissue-specific genes remain unmethylated in tissueswhere the gene is not expressed (such as MyoD in non-muscle tissues) [27-29]. Intriguingly, while promoters areless methylated on the active X than on the inactive X, theopposite is true for CpGs in the bodies of genes on the Xchromosome [30]. Highly expressed autosomal geneswere also found to have hypomethylated promoters andhypermethylated gene bodies in a recent genome-wideanalysis [31]. Moreover, clusters of hypomethylatedregions not limited to CpG islands or promoters havebeen found interspersed in stretches of methylated CpGs[32]. CpG methylation outside of CpG islands is thoughtto suppress transcription of transposable elements andother parasitic sequences [26,33] and/or to suppress spu-rious initiation of transcription elsewhere, includingwithin infrequently transcribed genes [34,35]. Clearlymore information on the state of methylation in and out-side of CpG islands and across different tissues is neededto clarify the role methylation plays in transcriptional reg-ulation.
Several approaches have been developed recently to scangenomes for sites of DNA methylation that might beimportant for tissue-specific gene regulation. Theseapproaches include large-scale sampling of DNAsequences after bisulfite conversion of unmethylatedcytosines to uracil [31,33,36-38], a variety of techniques
measuring the differential sensitivity of methylated andunmethylated sequences to certain restriction enzymes(for example, RLGS, RDA, HELP, MCAM, and MSCC)[31,32,39-48], and quantitative analyses of promotersequences immunoprecipitated with antibodies thatenrich for methylated cytosines [26,49,50] (reviewed in[51]). Differences in methylation have been detectedamong somatic tissues at up to 15% of the loci analyzedin these studies [26,31,33,36,45,48,52].
Here, we employ a methylation profiling technique and atiling microarray for human chromosome 1 to detectregional differences in the methylation state between tis-sues from the same individual. Our approach relies on amethylation-sensitive restriction enzyme to generate dif-ferently sized fragments from methylated versus non-methylated genomic DNA. Sample differences in frag-ment yield within a specified size range (80 to 2,500 bp)are detected by competitive hybridization of size-selectedfragments to a tiling array of genomic clones. Thisapproach has been used successfully to characterize meth-ylation patterns in Arabidopsis methylation mutants[53,54]. We have combined this technique with a customchromosome 1 microarray with a resolution of approxi-mately 100 kb [55].
Below, we first describe simulation experiments that showthat log ratios measured by the array are a complex func-tion of the methylation level of the hybridizing DNA andthe GC-content of the array clones. We also predict fromsimulations that the array will be more responsive tomethylation changes at dispersed CpG sites than tochanges in CpG islands. We then use the array to profilechromosome 1 methylation in several tissues from twohuman donors, demonstrating that the technique yieldshighly reproducible results. The methylation profiles weobtain vary between different human tissues, but profilesof the same tissue from two different individuals are sim-ilar. We then describe our use of bisulfite sequencing toconfirm an array finding of hypomethylation in heartDNA around the RYR2 gene and to confirm predictionsfrom our simulations that observed log ratios areimpacted by methylation differences outside of CpGislands. We analyze published data on the relative expres-sion levels of genes and detect significantly differentexpression ratios for genes residing in regions exhibitingextremely high versus low methylation ratios in all six ofthe tissue comparisons analyzed.
ResultsSimulations predict impact of GC content and CpG distribution on fragment yieldIn our methylation-profiling technique (Figure 1), DNAsobtained from test and reference samples are digestedwith a methylation-sensitive restriction enzyme, HpaII,which cleaves CCGG sites that are not modified by meth-
Page 2 of 21(page number not for citation purposes)

Epigenetics & Chromatin 2009, 2:7 http://www.epigeneticsandchromatin.com/content/2/1/7
ylation. Therefore, the methylation status for each sampleinfluences the size distribution of restriction fragments:unmethylated DNA is cut into smaller pieces than ishighly methylated DNA. After digestion, fragments longerthan approximately 80 bp and shorter than approximately2.5 kb are isolated by sucrose-gradient fractionation, andtest and reference DNAs are differentially labeled withfluorochromes by random priming. Thus, size fractiona-tion is the primary determinant for distinguishingbetween two differentially methylated samples.
These samples are allowed to competitively hybridize to2,136 genomic clones (bacterial artificial chromosomes(BACs), P1-derived artificial chromosomes (PACs), fos-mids, cosmids) on a microarray in the presence of Cot1
DNA to suppress repetitive sequences. The array contains2,049 clones that cover most of the euchromatic portionsof human chromosome 1, 17 clones that are distributedsparsely on chromosome X, and 70 other clones. Averagelog2 ratios of test-to-reference fluorescence intensities aregenerated from the duplicate spots for each clone whosemeasurements pass quality control tests (see Methods).Since the median size of the genomic inserts of the cloneson the array is 159 kb, the signal ratio for a given clone isa complex function of the methylation states of HpaII sitesin the sample and reference (which might both be hetero-geneous mixtures of cells with different methylation pat-terns) and the cumulative length (minus repeats) of theresulting HpaII fragments within the size range of approx-
Schematic of methylation profiling techniqueFigure 1Schematic of methylation profiling technique. DNA is harvested from samples (1) and digested with methylation-sensi-tive enzyme, HpaII, which cuts at its CCGG target site only if the CpG is not methylated (2). The DNA is then size-fraction-ated on a sucrose gradient, followed by determination of fragment size by agarose gel electrophoresis in order to choose fractions containing fragments > approximately 80 bp and < approximately 2.5 kb; in this example, fractions represented by lanes numbered 3 to 10 (3). Test and reference samples are then differentially labeled (4) and competitively hybridized to a clone-based microarray containing 2,049 clones for chromosome 1, 17 clones for the X chromosome, and 70 other clones (5). The signal intensities of each fluorescence channel are expressed as a ratio, log2 transformed, and then loess normalized on the percent GC content of clone sequences (6).
Harvest DNA from test & reference samples
1
Competitively hybridize, suppressing repeats, to array of ~2100 large-insert clones covering euchromatic portionsof chromosome 1
ReferenceDNA w/ Cy5
label
Test DNA w/ Cy3 label
Differentially label test and reference
Analyze relative fluorescence intensities
Digest each to completion with methylation-sensitive HpaII
Size fractionate on sucrose gradient
pool fractions containing 80-2500 bp fragments
2
4
5
6
M 3 5 8 10 11
~2.5 kbp
1 2 3 …… 10 11
3
~80 bp
…
Page 3 of 21(page number not for citation purposes)

Epigenetics & Chromatin 2009, 2:7 http://www.epigeneticsandchromatin.com/content/2/1/7
imately 80 to 2,500 bp in the genomic interval covered bythe clone.
We used simulations to understand how methylation dif-ferences between samples might influence the relative flu-orescence ratios measured for large-insert clones on thearray. In order for the amount of hybridizing material gen-erated from two samples to differ, the methylation state ofthe sample must yield, after HpaII digestion, a signifi-cantly higher or lower amount of material in fragmentswithin the size range 80 to 2,500 bp from the test samplecompared with the reference. Methylation can impact theamount of product in two opposing ways (Figure 2A). Forexample, consider two neighboring HpaII fragments, eacharound 2 kb in size. If the HpaII site between them ismethylated, then the fragments remain joined and exceedthe upper size cut-off (2.5 kb). Here, methylation reducesfragment yield through the size filter (fragments adjoiningsites marked "a" in Figure 2A). Conversely, methylationcould increase fragment yield through the size filter forother regions, such as CpG islands, which have a highdensity of HpaII sites (fragments adjoining sites marked"c" in Figure 2A). HpaII fragments derived from unmeth-ylated CpG islands could be excluded due to their smallsize (<80 bp), whereas HpaII's inability to cut the sameregions when methylated could generate fragments thatpass the size filter. In yet other cases, methylation mighthave no effect on the amount of size-selected hybridizingmaterial (sites marked "b" in Figure 2A).
In order to simulate the relative fragment yield for anentire BAC at different methylation levels, we wrote aPERL script to randomly assign each HpaII site in a BAC'ssequence to be methylated or unmethylated, so as toachieve various user-specified average overall levels ofmethylation. The script performed in silico HpaII digestionof the resulting partially methylated sequence and thesize-fractionation step. It also masked the sequences usingRepeatMasker [56], which mimics the Cot1 repeat-sup-pression step necessary to achieve specificity in arrayhybridization. The output is total unmasked base pairs infragments passing the size filter, which simulates labelingby random priming [57].
Our simulations show that yield of total unmasked basepairs passing the size filter from the region correspondingto any given clone on the array decreases approximatelylinearly with increasing average per cent methylation. Fig-ure 2B shows the results across a range of methylation lev-els for BAC RP11-47A4 (AL391809), an outlying clone inthe heart-versus-spleen comparisons and the object ofexperimental validation below. This negative slope indi-cates that the array response is dominated by methylationstatus at HpaII sites between larger fragments whereincreased methylation would reduce yield through the
size filter (sites of type a in Figure 2A), and that smallerHpaII fragments like those in CpG islands (sites of type cin Figure 2A) have a negligible effect on the yield of size-selected fragments corresponding to any array clone. Sim-ulations for all clones on the array show a similar negativecorrelation between fragment yield through the size filterand methylation level. Figure 2C and 2D display resultsfor two selected methylation levels, demonstrating that asample uniformly methylated at 40% of sites (Figure 2C,black contours) yields more hybridizing material for allarray BACs than a sample with 80% methylation (Figure2C, gray contours) and positive predicted log ratios for allarray BACs (Figure 2D). A caveat of our simulations is thatwe assumed that all CpG dinucleotides had an equalchance of being methylated. More sophisticated simula-tions might model local heterogeneity, such as thatobserved in our bisulfite sequencing analyses (seeResults), or the differences between CpG islands andother regions, but would need a good model to describehow methylation is distributed across sites. Additionalsimulations show that the relationship between fragmentyield and methylation level would have a positive slopeonly if CpG islands comprise more than 30% of a clone'ssequence (data not shown), and that is not the case forany clone on the array. Thus, signal intensity differencesbetween clones or samples are likely to be predominatedby methylation differences at CpGs outside of CpGislands.
Simulations also demonstrate a strong relationshipbetween fragment yield and the percentage of bases thatare either G or C (GC%) in the probed sequence. Figure2A helps explain how GC content can affect measuredlog2 ratios. In this schematic example, HpaII sites are rela-tively frequent in BAC 1, so that many fragments pass thesize filter in both samples 1 and 2. The increased methyl-ation of sample 2 causes a relatively modest reduction inhybridizing material for BAC 1. In contrast, BAC 2 haslower GC content and thus larger HpaII fragments, onaverage, and therefore the same increased methylationlevel in sample 2 has a much more dramatic effect,entirely preventing any material passing the 80 to 2,500bp size filter. This more dramatic effect would result in amore extreme measured log ratio for BAC 2 than BAC 1despite the fact that both BACs measure the same pair ofsamples with the same ratio of methylation levels. Figure2C shows the positive relationship between total basepairs in HpaII fragments predicted to pass our size filterand GC% for the regions represented by the clones on ourarray. This positive relationship is seen at all simulatedmethylation levels (40% and 80% are shown in Figure2C), except at the extreme of 100% methylation, when theDNA would not be cut at all. Moreover, the log2 ratio ofyield for two samples simulated to have different overallmethylation levels (test low, reference high) is positive for
Page 4 of 21(page number not for citation purposes)

Epigenetics & Chromatin 2009, 2:7 http://www.epigeneticsandchromatin.com/content/2/1/7
Page 5 of 21(page number not for citation purposes)
Fragment yield simulationsFigure 2Fragment yield simulations. (A). The same methylation ratio (1:2) can give different measured ratios for BACs of different GC content. Horizontal lines represent the genomic region of a BAC in a single hybridizing sample. Sample 2 is twice as meth-ylated as sample 1. The upper two rows represent a BAC of higher GC content than the lower rows. Vertical ticks represent unmethylated (digestable) HpaII sites; check marks denote HpaII fragments passing the size filter. HpaII sites methylated in sam-ple 2 but not sample 1 are marked with letters (see text). (B) Simulations based on BAC RP11-47A4. The amount of hybridiz-ing material decreases with increasing methylation. (C) Simulation results for all array BACs. Contour plots summarize the amount of hybridizing material for all BACs at 40% methylation (black contours) and 80% (gray). (D) Predicted ratios when samples of 40% (test) and 80% (reference) methylation are co-hybridized. (E) A more complex scenario results in an opposite relationship between GC content and ratio. In this scenario, each BAC is simulated to report cross-hybridizing material in both test and reference channels equal to 5% of the number of bases of repetitive DNA it contains. (F) Real data for a selected array (male liver:spleen) show that, as predicted, the amount of hybridizing material is higher for higher GC content BACs (liver intensities, black contours; spleen, gray). (G) Measured ratios from the same array (liver:spleen) also have a strong relationship with GC content, as predicted if samples have different overall methylation levels. (H) GC-content-normalized ratios for the same array.

Epigenetics & Chromatin 2009, 2:7 http://www.epigeneticsandchromatin.com/content/2/1/7
all clones on the array, but the ratios are negatively corre-lated with clone GC content, even though simulatedmethylation levels were uniform (Figure 2D). The slope ofthis relationship between log2 ratio and GC% is influ-enced by choice of overall methylation levels simulatedfor the two samples, relative simulated levels of back-ground signals on the array spots (for example, a fixedamount of non-specific signals or signals due to incom-pletely suppressed repetitive elements), and allowance forvariation of actual methylation levels with GC%. In fact,some combinations of these variables can yield a gener-ally positive (but curved) slope in the relationshipbetween log2 ratio and GC% (Figure 2E). To demonstratethis effect, we simulated adding cross-hybridizing signalproportional to each BAC's repeat content to both test andreference channels. The predicted ratio for BACs of lowGC content is greatly reduced, because the cross-hybridiz-ing material (equal for test and reference) outweighs thesmall amount of specific hybridizing material. BACs ofhigher GC content receive much more specific hybridizingmaterial, so the cross-hybridizing material has less effectand the ratios are much closer to those predicted withoutcross-hybridization (compare Figures 2D and 2E).
Experimental data confirm a dependency on GC content.Note that we do not know the overall average levels ofmethylation for any of the samples we used, but any over-all difference in methylation levels between the two sam-ples being compared would result in a correlationbetween GC content and measured log ratio. In the exam-ple provided in Figure 2F, a comparison of liver andspleen tissue from the same donor, both test (liver) andreference (spleen) signal intensities for clones on the arrayincrease with increasing clone GC content, and theobserved log2 ratios decrease with clone GC content (Fig-ure 2G). This plot shows raw ratios, but ratios normalizedby intensity, a common normalization method, show asimilar relationship (not shown). Because much of thevariance in log2 ratios across the genome is accounted forby variation in GC content, we normalized log2 ratios foreach clone based on its GC% using a loess fit of the rela-tionship between log2 ratio and GC% measured for eacharray experiment. All subsequent plots and analyses useGC-normalized values. Note that this normalization,while necessary to correct for clone-to-clone differences inmeasured ratios due to differences in GC content,excludes an ability to detect any true variation in methyl-ation levels that might correlate with GC content. The GC-normalized log2 ratios allow us to identify potential differ-ences in relative methylation levels for clones with similarGC content (Figure 2H).
Tissue differences in methylationWe next used the profiling method to detect methylationdifferences between tissues from the same individual. Weevaluated lung, heart, liver, four regions of the brain (cer-
ebellum, medulla oblongata, occipital lobe and pons),each from two individuals, as well as testis or ovary fromsingle individuals. Each tissue was directly compared withspleen from the same individual to control for any inter-individual variation in genomic content (for example,segmental copy number variants and/or restriction frag-ment length polymorphisms). We also conducted con-ventional array-comparative genomic hybridization(CGH) analyses on the tissue samples to verify that no sig-nificant somatic differences in copy number existedwithin the same individual for sequences represented byour clone array (data not shown). The female lung samplewas excluded from further analyses, because it had anunusually noisy genomic copy-number profile, suggestiveof random genome instability, with relative copy numbercorrelating strongly with methylation profile ratios (datanot shown).
To test the reproducibility of the method, we performedeach tissue comparison in triplicate using tissues fromeach of two donors. The test replicates were taken fromthe same tissue DNA preparation and independentlydigested, size-selected, labeled, and hybridized to thearray with similarly processed, but differentially labeled,spleen DNA. Replicate arrays for a given tissue compari-son also usually employed different, independently proc-essed replicates of the donor's spleen reference DNA (seeAdditional file 1). The log2 ratios for the replicates, bothwithin and between donors, correlate very well for all tis-sue comparisons except those involving the male lung(Figure 3, Additional files 2, 3, 4, 5; summarized in Table1). The poor correlation of replicate values of the threemale lung-versus-spleen arrays (Pearson R2 of 0.22 to0.59) is likely because almost all of these values are closeto zero, and variation is therefore predominantly experi-mental noise. Apart from lung, we find high Pearson cor-relation coefficients (R2) for within-donor replicates(median 0.88, range 0.61 to 0.95, n = 42) (Table 1). Thus,profiles are robustly conserved across technical replicatesof both test and reference DNA. Correlation coefficientsare also high when ratio values for the same tissue fromdifferent donors are compared (median 0.66, range 0.30to 0.86, n = 54) (Table 1). Figure 3 shows as examples thehigh correlation of log2 ratios from the cerebellum-versus-spleen arrays obtained using tissues from two individuals,one male and one female (Pearson R2 = 0.92 comparingreplicates from the same donor, and R2 = 0.86 comparingsamples across donors).
Tissues show distinctly different methylation patternsalong chromosome 1 (Figures 4 and 5). In each plot, wehave highlighted clones that deviate from the overallmedian by >4.88 median absolute deviation (MAD)units, with MAD calculated using the data for clones in aregion of 1q that showed the least biological variationwithin and across experiments (see Methods). At one
Page 6 of 21(page number not for citation purposes)

Epigenetics & Chromatin 2009, 2:7 http://www.epigeneticsandchromatin.com/content/2/1/7
extreme, cerebellum shows a large variation in intensityratios from region to region when compared with spleenfor both donors. Regions with the greatest dynamic rangein GC-normalized ratios are distributed across the chro-mosome, but tend to be GC- and gene-rich regions abun-dant in HpaII sites (Additional file 6). Thesecharacteristics could potentially contribute to a greaterdynamic range of measured ratios than possible in otherregions of chromosome 1. At the other extreme, lung andspleen are very similar, with the profiles showing only afew sites of significant difference (Figure 4).
The methylation profiles of the various lobes of the brainmap are highly correlated, with many of the peaks andvalleys in the profile landscapes mapping to the samechromosomal domains (Figure 5). This similarity is bestappreciated in the XY-plots provided in Additional files 2,3, 4, their correlation coefficients summarized in Table 1,and the hierarchical cluster plots in Additional file 5.These pronounced common differences might be thecumulative result of many genes in these regions that areregulated in a tissue-specific manner, in this case brain- orspleen-specific. The median Pearson correlation coeffi-cient of ratios measured for the four different brain por-tions (each compared with spleen) from the same donoris 0.45 (range 0.27 to 0.93, n = 108). This level of correla-tion approaches what we observed when comparing thesame tissue taken from different individuals (see above).
In sharp contrast to the similarity of the brain tissue pro-files, we observe gross differences between the methyla-tion profiles of other tissues, perhaps reflecting regions
that are differentially regulated between tissues (Figure 4,Additional file 4). The correlation coefficients are notablylow when ratios measured for different organs (each rela-tive to spleen) of the same donor are compared (medianR2 = 0.1, range 0 to 0.44 excluding lung and including aonly single brain part (cerebellum) in these comparisons,n = 108) (Table 1). Thus, methylation profiles of the sametissue in different individuals correlate more strongly thando those of different tissues from the same individual.
The heart-versus-spleen methylation profiles identify anintermediate number of clones that deviate reproduciblyand significantly from the median ratio in independentcomparisons (Figure 4, Additional files 2 and 7). Many ofthese clones were not identified as outliers in other tissuecomparisons, suggesting a real difference in the methyla-tion status between heart and spleen in these genomicregions. Below, we focus our bisulfite sequencing assays ofmethylation state on two of these clones with outlyingvalues.
Bisulfite confirmation of methylation differences outside of CpG islandsWe conducted bisulfite sequence analyses to confirm meth-ylation differences between heart and spleen for sequencerepresented by RP11-47A4 (AL391809), which showedvery high heart-versus-spleen log2 ratios in all replicates ofboth donors (Additional files 8 and 9). These very high rel-ative heart:spleen ratios are predicted to reflect significantlyless methylation of CpGs, and thus more frequent cuttingwith HpaII, in heart than spleen in this locus comparedwith other regions of chromosome 1 after accounting for
Intra- and inter-individual reproducibility of methylation profiling methodFigure 3Intra- and inter-individual reproducibility of methylation profiling method. A very strong correlation is observed between cerebellum:spleen log2 ratios measured using samples from the same donor (A, Pearson R2 = 0.92) and from different donors (B, Pearson R2 = 0.86). See also Additional files 2, 3, 4 and 5.
Page 7 of 21(page number not for citation purposes)

Epigenetics & Chromatin 2009, 2:7 http://www.epigeneticsandchromatin.com/content/2/1/7
fluctuations in GC content. This clone contains part of aheart-specific gene, RYR2, making it an interesting candi-date for confirmation of this prediction by bisulfitesequencing. These analyses also confirm our simulations,which predict that the method is most responsive to meth-ylation differences outside of CpG islands.
RP11-47A4 encompasses the first exon and part of the firstintron of the RYR2 cardiac receptor gene and this gene'sCpG island (Figure 6, Additional file 8); it contains noother known gene. This clone gave a high ratio only inarrays for heart versus spleen (>9 MAD units above themedian) and cerebellum versus spleen (4 to 8 MAD unitsabove median). RYR2 is expressed at high levels only inthe heart and to a much lesser extent in some parts of thebrain, albeit not cerebellum [58]; its disruption causesheart defects in humans [59-61]. We characterized themethylation state in heart and spleen of 27 CpGs distrib-uted across this clone's sequence outside of the CpGisland (Figure 6, top; Additional file 9). Seven of theseCpGs are in HpaII recognition sites. These HpaII sites wereselected for analysis from among the 174 predicted HpaIIsites in AL391809, because a change in their methylationstatus would have a large impact on yield in our proce-dure. The methylation state of these HpaII sites woulddetermine whether or not a fragment of 500 to 2,000 bpcontaining ≥ 50% unique sequence would pass the sizefilter (when unmethylated) or be left joined to a largeflanking fragment and not contribute to the hybridization
signal (when methylated). We treated DNA samples withbisulfite, amplified regions of interest by PCR using prim-ers designed to complement bisulfite-converted sequence,and sequenced cloned amplicons from heart and spleen,respectively. Our analyses of clones of bisulfite-convertedDNA show that, indeed, all but one of these seven dis-persed HpaII sites in AL391890 are hypomethylated inheart compared with spleen, with overall average methyl-ation per site of 38% in heart compared with 71% inspleen (Figure 6, top; Additional file 9). Similar resultswere found for 20 nearby CpGs in the sequenced ampli-cons that are not part of HpaII sites (Figure 6, top; Addi-tional file 9)
Although our simulations predict that the differencesbetween heart and spleen detected by the array are domi-nated by methylation differences such as those outside ofCpG islands, we nevertheless examined the methylationstate of RYR2's CpG island, which contains regulatory ele-ments, GC boxes essential for transcription of this gene,and spans a total of 181 CpGs. We successfully amplifiedtwo portions of the CpG island, containing a total of 53CpGs. Overall, CpGs in the island were less methylatedthan CpGs distributed outside of the island in both heartand spleen. CpGs in the first 251-bp CpG island amplicon(P1) just upstream of the GC-boxes are approximately3.5-fold less often methylated on average in heart thanspleen, but the second 303-bp amplicon (P2) containing35 CpGs, including five HpaII sites just downstream of the
Table 1: Pearson correlation coefficients, R2.
n median min max n median min max
Same tissue, Same individual Same tissue, Different individualAll, except lung 42 0.88 0.61 0.95 All, except T & O 54 0.66 0.30 0.86
cerebellum 6 0.93 0.86 0.95 cerebellum 9 0.84 0.82 0.86pons 6 0.92 0.89 0.93 pons 9 0.67 0.64 0.71
medulla 6 0.92 0.90 0.94 medulla 9 0.66 0.62 0.68occipital 6 0.87 0.61 0.89 occipital 9 0.66 0.52 0.70
liver 6 0.85 0.68 0.88 liver 9 0.54 0.30 0.70heart 6 0.77 0.74 0.79 heart 9 0.51 0.39 0.56testis 3 0.84 0.83 0.85ovary 3 0.90 0.87 0.91 testis vs ovary 9 0.19 0.14 0.26
lung, male 3 0.31 0.22 0.59
Different tissue, Same individualAll*, except lung 108 0.10 0.00 0.44 *only cerebellum represented from brain
heart vs. ovary 9 0.40 0.38 0.44heart vs. testis 9 0.23 0.20 0.29
heart vs. cerebellum 18 0.10 0.08 0.14heart vs. liver 18 0.06 0.01 0.19liver vs. ovary 9 0.02 0.00 0.07liver vs. testis 9 0.09 0.05 0.13
liver vs. cerebellum 18 0.03 0.00 0.05cerebellum vs. ovary 9 0.11 0.09 0.14cerebellum vs. testis 9 0.16 0.13 0.18
All four brain parts 108 0.45 0.27 0.93
Page 8 of 21(page number not for citation purposes)

Epigenetics & Chromatin 2009, 2:7 http://www.epigeneticsandchromatin.com/content/2/1/7
Page 9 of 21(page number not for citation purposes)
Methylation profiles of multiple tissues show striking differencesFigure 4Methylation profiles of multiple tissues show striking differences. Cerebellum, heart, liver, lung, testis, and ovary are each profiled relative to spleen. With the exception of the ovary:spleen comparison, these representative plots were obtained using tissues from the same male donor. The log2 ratios for chromosome 1 clones are indicated at their relative genomic posi-tion, with the large gap representing the centromere and pericentromeric repeats in 1p11–1q21. The horizontal scale for the X chromosome is compressed; the 17 chromosome X clones on the array are actually distributed over 110 Mb. Clones high-lighted in black have log2 ratios that deviate from the overall median, set here to 0, in either direction by >4.88 median absolute deviation (MAD) units, where MAD units are calculated using the data for the clones in the region of 1q marked 'MAD' (posi-tion 184 to 197 Mb), which showed the least biological variation within and across experiments. High log2 ratios are expected for regions hypomethylated relative to clones of similar GC content in the test tissue relative to spleen, whereas low log2 ratios are expected to represent relatively hypermethylated regions. In the heart-versus-spleen profile, bacterial artificial chro-mosome (BAC) RP11-47A4, containing part of the RYR2 gene, is highlighted in red and BAC RP11-90O23, containing part of ATP2B4, is highlighted in blue.

Epigenetics & Chromatin 2009, 2:7 http://www.epigeneticsandchromatin.com/content/2/1/7
Page 10 of 21(page number not for citation purposes)
Methylation profiles of four lobes of the brain are similarFigure 5Methylation profiles of four lobes of the brain are similar. (A) Methylation profiles of four different brain regions from a female donor, each measured using the same individual's spleen as a reference. Clones highlighted in black have log2 ratios that deviate in either direction from the median (set at 0) by >4.88 median absolute deviation (MAD) units calculated from the region in 1q marked 'MAD'. See Figure 4 for additional details. (B and C) X-Y scatter plots illustrating the positive correlation between log2 ratios measured for different brain parts from female donor (each relative to her spleen). (B) Plot displaying a comparison of occipital lobe-versus-spleen and cerebellum-versus-spleen ratios from the female donor (F1 replicates in all cases); (C)Plot showing a comparison of pons-versus-spleen and cerebellum-versus-spleen ratios; (D)Plot showing a comparison of medulla-versus-spleen and cerebellum-versus-spleen ratios. Pearson correlation coefficients (R2) are 0.43, 0.31 and 0.29 for B, C and D, respectively, and indicate significant association at the P < 10-15 level.

Epigenetics & Chromatin 2009, 2:7 http://www.epigeneticsandchromatin.com/content/2/1/7
GC boxes, was almost entirely unmethylated in both heartand spleen (Figure 6, bottom; Additional file 9). Only 0%and 0.5% of assayed CpGs in P2 were methylated in heartand spleen, respectively. Thus, if these combined resultsapply to the entire CpG island, methylation differencesoutside of the CpG island must account for most of thehigh signal ratio reported by this clone.
We also find no significant methylation differencesbetween heart and spleen in the CpG island of ATP2B4,which is partially contained in RP11-90O23, anotherclone exhibiting a high log2 ratio in the heart-versus-spleenarray comparisons (Additional file 7). ATP2B4 (PMCA4b)is involved in calcium homeostasis and has a role in con-trolling cardiac hypertrophy in response to increased loadon the heart [62]. We compared the methylation status of27 CpGs representing approximately 80% of the CpG
island of ATP2B4 in heart and spleen using bisulfitesequence analysis. The 27 CpGs were similarly unmethyl-ated in heart and spleen (data not shown). We found aver-age methylation levels per site of only 0.41% and 1.0% inheart and spleen, respectively. Thus, methylation differ-ences in the region in and around ATP2B4 must accountfor RP11-90O23's observed high log2 ratio in the heart-versus-spleen comparison, as we find no methylation dif-ferences in ATP2B4's CpG island.
Regions with outlying methylation ratios contain genes with outlying expression ratiosIn order to examine the possible biological significance ofthe methylation ratios measured by our arrays, we com-pared relative methylation levels with relative expressionlevels of corresponding genes. In all six of the tissue com-parisons examined, we found that BACs with apparent
Summary of bisulfite sequencing analyses of male heart (H) and spleen (S) DNA in the RYR2 gene sequence represented by BAC clone RP11-47A4 (AL391809)Figure 6Summary of bisulfite sequencing analyses of male heart (H) and spleen (S) DNA in the RYR2 gene sequence represented by BAC clone RP11-47A4 (AL391809). More striking methylation differences between these tissues are observed at dispersed CpGs outside of the CpG island (top) than in the island (bottom). Each CpG analyzed by bisulfite sequencing is represented by a fraction in which the denominator is the total number of sequenced clones of PCR products amplified from bisulfite-converted DNA, and the numerator is the number of times methylation was detected at that site. Data for CpGs contained within HpaII sites (CCGG) are shaded gray. The results for distributed CpG sites not included in CpG islands are indicated along the top, with their relative positions in the AL391809 sequence indicated. Vertical bars separate the sites on different PCR amplicons. The CpG island is highlighted by the gray vertical bar in the schematic of the AL391809 sequence and expanded below to indicate the position of exon 1 of RYR2 gene (white) and the GC boxes (dark gray). Two PCR products (P1 and P2) containing multiple CpGs within this CpG island were analyzed by bisulfite sequencing, and the results are indicated at the bottom of the figure. Boxes contain overall average methylation levels for heart (H) and spleen (S) for CpGs sampled outside of the CpG island (top) and for CpGs sampled within the CpG island (bottom).
Page 11 of 21(page number not for citation purposes)

Epigenetics & Chromatin 2009, 2:7 http://www.epigeneticsandchromatin.com/content/2/1/7
high relative levels of methylation (that is, low arrayratios) tended to contain genes that were expressed atlower relative levels than BACs with lower methylationlevels. This relationship is expected if regional methyla-tion assayed by our array, like promoter methylation, isassociated with suppression of transcriptional initiation[3]. In detail, we compared our results (averaged acrossarrays representing the same tissue comparison) withexpression data obtained by Ge et al. [58], who hybridizedRNA from each of 36 normal human tissues singly toAffymetrix oligonucleotide microarrays to determineexpression levels of around 20,000 human genes (seeMethods). For each gene, we calculated a ratio of expres-sion levels for six of the tissue pairs evaluated in our meth-ylation studies, with spleen as the reference tissue in eachcase (Ge et al. did not generate expression data for mem-bers of the remaining tissue pairs). We compared themethylation array ratios of BAC-sized genomic regionswith the expression ratios of genes whose 5' ends mappedwithin those genomic regions, recognizing that such ananalysis likely ignores facets of the complex cause-and-effect relationships between the methylation levels in dif-ferent parts of a gene (promoter, body of gene, and so on)with that gene's expression levels.
While the ratios reported by our methylation-sensitivearrays and expression ratios show little overall correlation(data not shown), we noticed a relationship in theextremes of the distributions: BACs reporting lower levelsof methylation in the test sample than in the reference(that is, those having very high array ratios relative to oth-ers on chromosome 1 with similar GC content) tended tocontain genes whose probe sets report higher expressionratios than average, and that BACs having higher impliedrelative methylation levels (low methylation array ratios)tended to contain genes of lower-than-average expressionratios. In order to display and test the significance of thisobservation, we conservatively classified the BACs intothree categories reporting 'High', 'Mid' or 'Low' impliedmethylation levels, using the MAD-based thresholds dis-cussed above, and examined the expression ratios of genesmapping to each of those three categories of BACs (Figure7). Statistical tests that account for the complex many-to-many relationships in these data (see Methods) indicatethat the observed increases in relative expression levelwith decreased relative methylation are statistically signif-icant in most cases (Figure 7). When less conservative cri-teria are used for categorizing BAC methylation ratios,statistically significant relationships are seen for all six tis-sues comparisons (Additional file 10); the more signifi-cant results are due in part to a greater number of BACs(and therefore genes) now in the High and Low groups.
DiscussionDNA methylation is widely recognized as an epigeneticmodification that plays a key role in specifying which por-
tions of the genome are utilized at any given time or placein eukaryotic organisms, from plants to humans. There-fore, determining where those marks are made in thegenome and how these marks are interpreted by the pro-teins that transcribe genes, prevent transcription of othersequences, package chromatin in the nucleus, or performother functions on DNA, has become an important goal.We have generated chromosome-wide methylation pro-files of different tissues using an approach that relies onthe action of a methylation-sensitive restriction endonu-clease and measurement of differences in the relative yieldof size-selected fragments between two samples. Hybridi-zation of these fragments to a tiling array of large-insertclones reports coarse regional relative differences in meth-ylation state. Hybridization to high-resolution oligomerarrays can reveal much finer-scale fluctuations in methyl-ation levels along the chromosome (our unpublisheddata).
We obtained very different methylation profiles from dif-ferent organs, suggesting the existence of tissue-specificepigenetic modification patterns across chromosome 1.These patterns are conserved across individuals, as the val-ues measured for the same tissue obtained from differentdonors were strongly correlated. As one might expectgiven the high inter-individual similarity in methylationprofiles for a given tissue, replicate analyses of the sametissue from the same donor were even more strongly cor-related, demonstrating that our technique gives highlyreproducible results. We find that methylation profiles ofthe same tissue correlate better across individuals than doprofiles of different tissues from the same individual. Thisresult corroborates findings of other studies that usedalternative techniques to measure relative methylationlevels [31,33,63].
While most organ profiles were dissimilar, there werenotable exceptions. Interestingly, the profiles for the vari-ous lobes of the brain were strongly correlated, suggestingthat the shared methylation pattern of these tissues wasestablished in a shared developmental precursor cell typeand/or that the functions of these cells are sufficientlysimilar to be reflected in a similar pattern of epigeneticmodifications. We also observe that some sites stand outas deviating from the median in multiple tissues. Forexample, some clones show similar relative log2 values inbrain profiles and either testis or ovary profiles (Addi-tional file 4). These similarities might represent spleen-specific methylation changes (spleen was used as a com-mon reference sample) or changes common to these otherorgans. Other deviant sites are not shared by these differ-ent organs, such that, in fact, testis and ovary profiles arepoorly correlated with each other.
Our simulations indicate that significant deviations of sig-nal ratios from the median are influenced predominantly
Page 12 of 21(page number not for citation purposes)

Epigenetics & Chromatin 2009, 2:7 http://www.epigeneticsandchromatin.com/content/2/1/7
Page 13 of 21(page number not for citation purposes)
Expression levels are higher for genes in less methylated regionsFigure 7Expression levels are higher for genes in less methylated regions. Each pair of plots shows ratio data for a particular tissue compared with spleen, on two different y-axis scales to help illustrate expression differences. For each tissue compari-son, we divided bacterial artificial chromosome (BACs) into three categories of implied relative methylation levels ('High', 'Mid' and 'Low') using median absolute deviation-based thresholds recalculated after averaging ratios across three technical repli-cates and two donors, if available. Note that low measured array ratios in a BAC-sized genomic region likely reflect more methylation in the test tissue than in spleen, relative to other regions of chromosome 1 with similar GC content, and are therefore labeled as 'High', and vice versa. The boxplots show the distribution of expression ratios reported by Ge et al. [58] for genes whose 5' ends are in BACs of each category. On each plot, the symbol within the bracket represents the P value obtained in a test of the null hypothesis that there is no difference in expression ratios of genes in BACs with 'Low' implied rel-ative methylation levels versus BACs with 'High' relative methylation levels (***, 0 <P < 0.001; **, 0.001 <P < 0.01; *, 0.01 <P < 0.05; ns, P > 0.1, see Methods). The symbol next to the arrow represents the P value obtained in a trend test of whether expression ratios are linearly related to methylation category (coding 'High', 'Mid' and 'Low' categories as -1, 0 and 1, respec-tively).

Epigenetics & Chromatin 2009, 2:7 http://www.epigeneticsandchromatin.com/content/2/1/7
by methylation differences in CpG dinucleotides in HpaIIsites outside of CpG islands. Thus, this method comple-ments approaches that focus on the methylation states ofCpG dinucleotides in CpG islands. Our bisulfite sequenc-ing results support the predictions of these simulations.For example, many more of the significant methylationdifferences that might explain the high heart:spleen signalratio observed for the RYR2 locus, a gene with heart-spe-cific function, were found outside of CpG islands than inthem. An important conclusion from these results is thatCpG islands and flanking DNA can have different methyl-ation patterns, and that tissue-specific genes can be differ-entially methylated in regions other than their CpGislands. This conclusion is similar to that drawn fromother studies which found that both the bodies and pro-moters of highly expressed genes are differentially methyl-ated compared with inactive genes [30,31,38,50].
Together, our observations point to strikingly differentpatterns of methylation at HpaII sites outside of CpGislands in various tissues. Methylation differences in thenon-CpG-island compartment of the genome are largelyunappreciated and merit further study to understand theirpossible functional consequence(s). Of all the tissues ana-lyzed, cerebellum showed the greatest fluctuations in rel-ative fragment yield along the chromosome, perhapsreflecting gross variation in the density of brain-expressedgenes across the chromosome. In contrast, the profiles forliver, heart and lung showed much less regional variationwith respect to spleen, suggesting a more even distribu-tion (or lack) of genes expressed specifically in these tis-sues and associated tissue-specific epigeneticmodifications.
Our findings are consistent with recent studies that havefound a comparatively low frequency of tissue-specific dif-ferentially methylated regions associated with CpG-islandpromoters [33], while differences have been detected inCpG-poor promoters [26], outside CpG-dense promoters[36], and in CpG islands far from any known transcrip-tion start site [64]. Our data also reinforce the conclusionsof Khulan et al. [32], who used a different approach(HELP) on mouse tissue samples to find that tissue-spe-cific differentially methylated regions are frequent and notconfined to gene promoter regions. Applying yet anothermethylation profiling method (RLGS), two groups founda highly significant enrichment of differentially methyl-ated NotI sites away from CpG islands in mouse tissues[48,65]. Interestingly, a study by Oakes et al. found 8-foldmore hypomethylated NotI sites (among 2,600 analyzed)in testis than somatic tissues, and found relatively fewbrain-specific differentially methylated sites [65]. In con-trast, we detect many more apparently differentially meth-ylated regions in cerebellum and other brain parts thantestes when both are compared with spleen.
These observations raise the possibility that hypomethyl-ation of CpGs outside of CpG islands might correlate withtissue-specific transcriptional activity of genes or the greatmany non-canonical transcripts increasingly being recog-nized [66]. Indeed, when we compare our measures of rel-ative methylation of genomic clones on the chromosome1 array and relative expression levels of constituent genesmeasured for the same tissue types in other individuals byGe et al. [58], we find that the subsets of array clones withlog2 values above or below our MAD-defined thresholds(implying relatively low or high methylation, respec-tively) tend to include genes with higher or lower relativeexpression levels, respectively. It is worth noting that thedirection of this trend is similar to that found for promot-ers, not gene bodies, according to recent large-scale stud-ies that found gene bodies to be more highly methylatedin highly expressed genes than in inactive genes[31,38,50]. The regional methylation differences weobserve here might correlate with the density of othermarks of active/inactive chromatin as proposed by Eck-hardt et al. [33] and/or reflect (or influence) regional com-partmentalization within the nucleus [67]. Alternatively,methylation of dispersed CpGs might serve to suppressspurious transcription from cryptic promoters (as pro-posed for Arabidopsis [54,68]), raising the interestingquestion as to why the relative level of protection bymethylation might vary among tissues.
In conclusion, the methylation landscapes that we havegenerated for various tissues suggest a complex pattern of,and possible function for, methylation differences outsideof CpG islands. Future studies of regional methylation,regional transcriptional activity, and large-scale organiza-tion of the nucleus will help further our understanding ofthese regional epigenetic differences.
Materials and methodsTissue samplesTwo sets of nine tissues derived from two phenotypicallynormal adult individuals, one female and one male, wereprovided by the NCI-funded Cooperative Human TissueNetwork http://chtn.nci.nih.gov[69] (CHTN-32364 andCHTN-32505, respectively).
Digestion, size-fractionation, and labeling of DNA samplesWe used spleen as the reference in all tissue comparisonsto keep the denominator for each clone's ratio roughlyconstant across our experiments. Spleen DNA was used asreference for the intra-individual tissue comparisonsbecause it was the tissue for which DNA was most abun-dant for both donors. Phenol- and chloroform-extractedand then isopropanol-precipitated DNA derived from testand reference tissue samples were divided into tubes (20to 60 μg per tube) and independently processed and ana-lyzed. Each DNA sample was digested to completion with
Page 14 of 21(page number not for citation purposes)
Epigenetics & Chromatin 2009, 2:7 http://www.epigeneticsandchromatin.com/content/2/1/7
the methylation-sensitive restriction enzyme, HpaII (NewEngland Biolabs). We monitored completion of digestionby agarose gel electrophoresis (data not shown). Thedigested DNA was fractionated by size on 5% to 30%sucrose gradients by using a Beckman SW-40TI swing-outrotor as previously described [53]. Fractions containingfragments smaller than 2.5 kb and greater than 80 bp asjudged by gel electrophoresis were selected, pooled, andprecipitated with isopropanol (Figure 1). The resultingDNA was analyzed by agarose gel electrophoresis to con-firm that this process had effectively selected fragments 80to 2,500 bp in length (data not shown). One microgrameach of digested, size-selected test and reference DNA wasdifferentially labeled with Cy3-dCTP (green) or Cy5-dCTP(red) (both GE Healthcare), respectively, by randompriming using the Bioprime DNA Labeling System (Invit-rogen).
Chromosome 1 tiling array hybridizationPreparation and validation of the human chromosome 1genomic-clone microarray was previously described[55,70]. Briefly, a total of 2,136 large-insert genomicclones were spotted in duplicate onto a glass slide. Forsimplicity, we will refer to this array as a 'BAC array',although the spotted clones include BACs, PACs, fosmids,and cosmids. Of these clones, 2,049 represent a tiling pathcovering 213 Mb, approximately 96% of the euchromaticregions of chromosome 1. Seventeen clones representsparsely spaced segments of the X chromosome, with thefirst at 35 Mb and the last at 145 Mb with median spacingof approximately 6 Mb. These clones had been includedon the array as controls for sex-mismatched conventionalarray CGH assays for other studies. The remaining 70clones were included on the array as they were previouslythought to map to chromosomes 1 or X, but are excludedfrom the results we report as their chromosomal mappingis now uncertain. Clone coordinates in the May 2004assembly of the human genome sequence (Build 35) wereprovided by the Sanger Center and are available uponrequest. These coordinates typically imply clones longerthan the spans shown on the NCBI or UCSC genomebrowsers due to trimming of sequences during genomeassembly to eliminate overlapping sequence.
Labeled test and reference samples were mixed with 85 μgof Cot-1 DNA (Invitrogen) and hybridized to arrays underconditions described elsewhere [55]. Each experiment wasdone in triplicate using aliquots of the DNA isolated fromeach tissue sample, but processed independently. The rep-licates were independently digested, size selected, labeledand hybridized, and paired with similarly processedspleen DNA from the same donor. Replicate arrays of agiven tissue usually employed different independentlyprocessed replicates of the spleen reference DNA as well(see Additional file 1).
Array data analysisImage acquisition was performed using an Axon 4000 Bscanner and hybridization intensities were analyzed withthe GenePixPro image analysis software (both AxonInstruments). For each spot, GenePixPro gave raw inten-sity values with the surrounding background subtractedfor each wavelength scanned (635 nm and 532 nm for redand green channels, respectively). A custom R script, Nor-malization.r, was used to log2-transform these values, cal-culate the ratio of red to green fluorescence intensities,and apply a loess normalization procedure [71] based onGC content of the BACs (see below). A script then proc-essed the output file to identify and eliminate cloneswhose duplicate spots reported significantly different nor-malized log2 ratios (that is, with standard deviation (SD)> 0.28) or had been flagged by GenePixPro as bad spots(that is, spots having less than 80% of pixels with intensi-ties more than one SD above the background pixel inten-sity in either wavelength channel). We also eliminatedresults for subtelomeric clone RP5-857K21, as it appearedas an outlier on almost every array. The log2 ratios for thetwo spots for each remaining clone were averaged, and themedian of all the clone averages was calculated and set tozero.
Our computer simulations of the method (see below andResults) indicated that relative fragment yield at a speci-fied methylation level, as well as predicted intensity ratiosfor a pair of samples having different set methylation lev-els, vary with the GC content of the clones on the array.Therefore, we adjusted for GC content as follows: for eachblock of spots on each array, a loess curve was fitted to therelationship between the BACs' GC contents (in per cent)and their raw log2 ratios. The loess predicted value foreach BAC's log2 ratio based on its GC content was sub-tracted from its real raw log ratio to give a normalized logratio.
Using the GC-normalized data for each array, we then cal-culated the MAD for a contiguous set of 97 clones in1q31–1q32 that contains relatively few HpaII sites andshowed little clone-to-clone variation in self-to-self com-parisons and little deviation from the median in any ofthe sample comparisons. This group of clones was used ineach array experiment as an internal measure of experi-mental noise to help distinguish potentially biologicallymeaningful deviations from experimental noise, whichcould vary from one array to another. This region ofclones, whose midpoints are between positions184,314,284 and 196,448,439 bp in chromosome 1'ssequence in Build 35, is marked in each methylation pro-file with a bar marked 'MAD'. We used the MAD value asit is relatively robust to outliers and does not assume thatvalues are normally distributed. The MAD value was cal-culated by subtracting the median log2 ratio for these
Page 15 of 21(page number not for citation purposes)

Epigenetics & Chromatin 2009, 2:7 http://www.epigeneticsandchromatin.com/content/2/1/7
selected clones from each clone's log2 ratio to give a devi-ation value; the MAD value is the median of the absolutevalues of these deviations. The SD of a normal distribu-tion can be estimated to be 1.48 times the MAD value. Weidentified clones anywhere on chromosome 1 whoseaverage log2 ratio values deviated below or above the over-all median by >4.88 MAD units (that is, >3.29 times theSD), which would correspond to deviations with statisti-cal significance at the predictive value of 0.001 based on anormal distribution with two-sided P value. In the self-to-self comparisons, we also used all clones to calculate theMAD and identify outliers beyond the P < 0.001 cutoff.
These outlying values, marked in each methylation profile,should include loci having true methylation differencesbetween samples, since only 0.1% of the ratios drawn froma normal distribution (that is, two false-positive clones perarray) are expected to deviate from the median by >4.88MAD units. However, this threshold does not exclude allfalse positives due to experimental variation. The 97-cloneregion of 1q31–32 shows less experimental variation thanthe rest of the chromosome even in direct comparisons ofthe same tissue sample (for example, female medulla inAdditional file 11). Only 0.5% of the ratios in this directcomparison deviate from the median by >4.88 MAD unitswhen MAD is calculated over the entire array, whereas 2.2%do when MAD is calculated over the 97-clone region.
To control for potential genomic copy number differencesbetween test and reference genomes, we also competi-tively hybridized 1 μg each of sonicated test and referencetotal DNA, mixed with 100 μg of Cot1 DNA (Invitrogen),to replicas of the same microarrays using the same condi-tions as described above [55]. No significant deviations incopy number were observed across chromosome 1 in anytissue sample relative to the spleen sample from the samedonor in these conventional array-based comparativegenomic hybridization (array CGH) assays, except thefemale lung sample (data not shown). Because log2 ratiosfor the methylation-profiling array correlated verystrongly with the wildly varying log2 ratios from the con-ventional CGH array for this sample (in isolation, eachprofile appeared to have large random noise), we elimi-nated this sample from further analysis. Genomic contentabnormalities were noted for this lung sample in anotherstudy [72].
Note that it is not possible using this comparative methodalone to determine what ratio represents an equivalentmethylation state in test and reference DNA, as is possiblewith some sequencing-based methods (for example,[36,49]). Thus, while a normalized log2 ratio of 0 (themedian) might represent equivalent actual levels of meth-ylation in a comparison of two normal tissue samples, itprobably would not in a comparison of cells deficient inDNA methyltransferase activity and control cells.
Methylation simulationIn order to understand the response of our array to differ-ently methylated genomes, we developed a PERL script,METHBATCHSIM, to simulate methylation states for asequence of interest, such as a particular clone on thearray, and the corresponding yield of fragments throughour methylation-profiling procedure. First, we generated alist of HpaII restriction sites on the sequence and usedRepeatMasker [56] to generate a repeat-masked sequencefile. METHBATCHSIM reads in the HpaII and masked-sequence files and randomly designates which restrictionsites in each clone contain methylated CpGs and whichare unmethylated, for a specified overall methylation pro-portion. Specifically, we used the rbinom function of theR package [73] to randomly assign methylation status ofeach site, using the desired overall methylation fraction(between 0% and 100%, in steps of 1%) as the 'prob'parameter, the number of restriction sites in the BAC asthe 'n' parameter, and the 'size' parameter set at 1. Thesequence is then virtually digested with HpaII based onthe assigned methylation states, and we determine whichof the resulting fragments are within the specified sizerange (80 to 2,500 bp). We simulated labeling by randompriming by summing the total unmasked base pairs in allfragments meeting the size-range criterion. The final out-put summarizes these totals, averaged over 1,000 simula-tion runs. We repeated this simulation using the sequenceof each clone on the array.
Other bioinformatic analysesCpG island coordinates were taken from the UCSCGenome Browser http://genome.ucsc.edu[74] CpG Islandtrack, where CpG islands are defined as regions of >200bp with GC content ≥ 50% and a ratio >0.6 of observednumber of CG dinucleotides to expected number on thebasis of the numbers of Gs and Cs in the segment. Genecoordinates were obtained from the UCSC's RefSeq track.
Expression analysisIn order to test whether the relative methylation levels wemeasured relate to transcription levels, we compared ourresults with expression data obtained by Ge et al. [58],who hybridized RNA from each of 36 normal human tis-sues singly to Affymetrix oligonucleotide microarrays todetermine expression levels of approximately 20,000human genes. No RNA was available to study expressionlevels in samples from the same donors used for ourmethylation studies, but because methylation array ratioswere highly correlated between the two donors we stud-ied, it seemed reasonable to assume that methylationstates would be similar in the tissues of donors used by Geet al. and, therefore, reasonable to think that if any con-sistent correlation between regional methylation andexpression levels exists, it might be observed even if differ-ent tissue donors are used for the methylation and expres-sion arrays. We averaged methylation array ratios for the
Page 16 of 21(page number not for citation purposes)

Epigenetics & Chromatin 2009, 2:7 http://www.epigeneticsandchromatin.com/content/2/1/7
same tissue comparisons (that is, across sets of six arraysfor each of cerebellum, heart and liver, and across sets ofthree arrays for each of lung, testis and ovary, comparedwith spleen in all cases). We used these cross-array aver-ages to recalculate the MAD-based thresholds used to clas-sify BACs as having outlying methylation array values.
Starting with Ge et al.'s raw probe-level expression-arraydata (GEO series GSE2361), we applied standard back-ground adjustment, normalization and log-transforma-tion methods using the robust multi-array averagealgorithm from Bioconductor's affy package [75] toobtain expression levels for each probe set (a probe set isa set of around 20 oligonucleotide probes that togetherrepresent a portion of a single gene). For each of the six tis-sue comparisons made (Figure 7, Additional file 10), wecombined normalized expression results for the relevanttissue types to obtain log2 expression ratios. A table ofAffymetrix probe set names, their corresponding genesymbols, and genomic coordinates of those genes in Build35 of the human genome assembly was obtained from theSCGAP Hematopoietic Stem Cells Project [76]. We thenplotted the expression ratios of probe sets correspondingto genes whose 5' ends mapped in BACs of each threeimplied categories of implied relative methylation levels:'High', 'Mid' or 'Low'. These conservative classificationscorrespond to BACs with ratios on the methylation-sensi-tive arrays that exceed MAD-based thresholds discussedabove (that is, for Figure 7, 4.88 MAD units from themedian, a threshold chosen such that we would expectapproximately 0.05% of BACs on the array to fall in eachof the Low or High categories by chance). In each boxplot,the median is indicated by the thick line, the box spansthe middle two quartiles of the distribution, the small cir-cles are outliers, and the whiskers extend to the mostextreme data point which is no more than 1.5 times thelength of the box away from the box.
In order to test the statistical significance of the observeddifferences in relative expression ratios between genes inBACs of different methylation ratio categories, we neededto account for the many-to-many relationships that existbetween BACs, genes and probe sets. A BAC can containmore than one gene, a gene's 5' end can be present inmore than one overlapping BAC, and some genes are rep-resented on the expression array by more than one probeset (located in different parts of the gene). We thereforefitted generalized estimating equations to the data (usingR's geeglm function from the geepack package [77]), treat-ing datapoints from the same BAC as groups. We also gaveeach BAC-probe set datapoint a weight equal to the recip-rocal of the number of times its gene symbol appeared inthe table of all BAC-probe set pairs (that is, a gene repre-sented by three probe sets and whose 5' end is in two over-lapping BACs would receive a weight of 1/6 for each of itssix datapoints). For each tissue comparison, we performed
two statistical tests: (a) a test of whether expression ratiosdiffer between BACs in the 'High' and 'Low' methylationcategories (P values on square brackets, Figure 7 and Addi-tional file 10); (b) a trend test for whether expressionratios are linearly related to methylation category, whenmethylation levels are coded as -1 (for low array ratio and'High' implied relative methylation level), 0 ('Mid'), or 1(for high array ratio and 'Low' implied relative methyla-tion level) (P values on arrows, Figure 7 and Additionalfile 10). In each test, we used the 'Gaussian' family tomodel variation in expression ratios and 'independence'as the correlation structure.
PCR, cloning and sequencing of bisulfite-modified DNATotal genomic DNA was extracted from male heart and spleensamples, and unmethylated cytosines were converted to uracilby bisulfite treatment according to published protocols [78].Briefly, each DNA sample was first digested with BamH1, theenzyme was removed by phenol and chloroform extraction,and the DNA was subsequently ethanol precipitated andresuspended in H2O. NaOH was added to each DNA sampleto a final concentration of 0.3 M, and the DNA was denaturedfor 2 min at 97°C followed by incubation for 30 min at 39°C.A solution of sodium bisulfite and hydroquinone was imme-diately added to 3.3 M and 0.67 mM final concentrations,respectively, and samples were incubated for 16 h at 55°Cwith 95°C spikes for 5 min every 3 h. Samples were desaltedusing QIAquick PCR Purification columns (Qiagen) accord-ing to the manufacturer's instructions. NaOH was added toeach converted sample to a final concentration of 0.3 M, andthe samples were incubated at 37°C for 15 min to removeexcess sodium bisulfite. DNA samples were then ethanol pre-cipitated and resuspended in 100 μl H2O.
Primers for selected regions were designed using theBiSearch Web Server [79] and are provided upon request.Each amplification was done with touchdown PCR using2 μl Ex-Taq enzyme (Takara Mirus Bio) and 0.5 μl of 50μM primers in a total volume of 25 μl with the followingconditions: 95°C for 2 min, 30 cycles of 95°C for 30s,66°C for 30s (stepping down 2°C every 2 cycles until56°C), and 72°C for 1 min, followed by 72°C for 10 min.
Amplified products from converted DNA were gel-puri-fied with QIAquick Gel Extraction columns (Qiagen)according to the manufacturer's instructions and subse-quently cloned into the pCR2.1 plasmid vector using theTOPO TA Cloning Kit (Invitrogen). Clones with insertswere identified by PCR amplification using M13 reverseand T7 forward primers using TOPO cloning instructions.Amplified M13-T7 products were purified with SephacrylS-300 (Amersham BioSciences). Seven to thirty-twoclones were then sequenced successfully from each PCRproduct using the same primers on an ABI 3730 (AppliedBiosystems). Sequences were aligned and analyzed usingPhredPhrap and Consed [80-82].
Page 17 of 21(page number not for citation purposes)

Epigenetics & Chromatin 2009, 2:7 http://www.epigeneticsandchromatin.com/content/2/1/7
All array data relevant to this manuscript have been sub-mitted to the Gene Expression Omnibus (GEO) underaccession number GSE12925.
AbbreviationsATP2B4: Ca-transporting plasma membrane ATPase iso-form 4; BAC: bacterial artificial chromosome; CGH: com-parative genomic hybridization; MAD: median absolutedeviation; PAC: P1-derived artificial chromosome; RYR2,ryanodine cardiac receptor 2; SD: standard deviation.
Competing interestsThe authors declare that they have no competing interests.
Authors' contributionsCDB, ER, and RKT carried out the methylation profilingexperiments. CDB, ER, JMY, UM and BJT analyzed thearray data. ER carried out the bisulfite sequencing, and ERand JMY analyzed the data. CFL was responsible for BACarray design and fabrication. EEE contributed tissue sam-ples. LH participated in the statistical analysis. JMY per-formed simulation studies. JPD, SH, EEE, and BJTparticipated in the overall design and coordination of thestudy. CDB, ER, JMY, and BJT wrote the manuscript. Allauthors read and approved the final manuscript.
Additional material
Additional File 1Table S1. Replicates of test and spleen reference paired for each array.Click here for file[http://www.biomedcentral.com/content/supplementary/1756-8935-2-7-S1.xls]
Additional File 2Figure S1. Scatter plots are displayed above the diagonal to illustrate pair-wise comparisons between results of different methylation profiling micro-array experiments. The corresponding Pearson R2 correlation coefficients are shown below the diagonal. This figure includes three replicate arrays each for various tissue samples from each of two donors. Female lung is excluded due to observed genomic copy number deviations. Only cerebel-lum is included in this set as a representative brain part due to space con-siderations. The reference tissue in each array is spleen, from the same donor as the test tissue. The red dashed line in each plot indicates the lin-ear regression fit. Cells along the diagonal provide tissue and replicate information. Abbreviation: Cere, Cerebellum. Replicates are indicated by the suffix following the underscore: M1, M2, and M3 are replicates from the male donor; F1, F2, F3 are replicates from the female donor. Most rep-licate arrays for a given tissue employed different replicates of the spleen reference (see Additional file 1).Click here for file[http://www.biomedcentral.com/content/supplementary/1756-8935-2-7-S2.jpeg]
Additional File 3Figure S2. Scatter plots are displayed above the diagonal to illustrate pairwise comparisons between results of different methylation profiling microarray experiments performed using various brain tissue samples. The corresponding Pearson R2 correlation coefficients are shown below the diagonal. This figure includes three replicate arrays for each tissue sample from each of two donors. Abbreviations: Cere, Cerebellum; Occi, Occipital Lobe; Med, Medulla. See Additional file 2 legend for additional details. Plots comparing F1 brain sam-ples are also shown in Figures 5B, 5C, and 5D.Click here for file[http://www.biomedcentral.com/content/supplementary/1756-8935-2-7-S3.jpeg]
Additional File 4Figure S3. Scatter plots are displayed above the diagonal to illustrate pair-wise comparisons between results of different methylation profiling micro-array experiments performed using various tissues from two donors. Here one representative replicate of each tissue from each donor is included in the pairwise comparison dataset. The corresponding Pearson R2 correla-tion coefficients are shown below the diagonal. See Additional file 2 leg-end for additional details.Click here for file[http://www.biomedcentral.com/content/supplementary/1756-8935-2-7-S4.jpeg]
Additional File 5Figure S4. Hierarchical clustering of methylation profiles from 45 frac-tionated DNA samples from 15 tissue samples. GC-normalized ratios were clustered using Manhattan distances and the Ward method of hier-archical clustering using R's hclust function. The dendrogram demon-strates that there is tight correlation within each set of triplicate samples and between samples from the same tissue in different individuals. Abbre-viations: Med, Medulla; Cere, Cerebellum; Occi, Occipital Lobe.Click here for file[http://www.biomedcentral.com/content/supplementary/1756-8935-2-7-S5.pdf]
Additional File 6Figure S5. Chromosome 1 G-banding, GC%, gene density, and HpaII site distribution. The G-banding pattern of chromosome 1 is aligned to plots of (1) of the percentage of G or C nucleotides in each array clone as a function of the clone's position along the chromosome, (2) of the number of start sites of RefSeq genes in non-overlapping windows of 1 Mbp along the chromosome (obtained from the UCSC Genome Browser RefSeq track), and (3) the number of possible HpaII fragments in the 80 to 2,500 bp size range in each array clone as a function of the clone's posi-tion along the chromosome. The thick black bar indicates the region of 97 clones used to calculate median absolute deviation values in all experi-ments.Click here for file[http://www.biomedcentral.com/content/supplementary/1756-8935-2-7-S6.pdf]
Page 18 of 21(page number not for citation purposes)

Epigenetics & Chromatin 2009, 2:7 http://www.epigeneticsandchromatin.com/content/2/1/7
AcknowledgementsWe thank Sean McGrath and Arkadiusz Piotrowski for technical assistance with tissue and cell samples, Jeff Delrow and Cassie Neal in the FHCRC Genomics facility for technical assistance, and Peter Ellis for printing the BAC arrays. This work was supported in part by a graduate fellowship from the Department of Education, Universities and Research of the Basque Government (to CDB), a Ford Foundation Predoctoral Diversity Fellow-ship (to ER), an NIH training grant fellowship T32-CA09657 (to RKT), the Wellcome Trust (to CFL), the Howard Hughes Medical Institute (to EEE and SH), NIH RO1 HD0435679 (to EEE), the Swedish Cancer Society, Swedish Children's Cancer Foundation, and the US Army Medical Research and Materiel Command award No. W81XWH-04-1-0269 (to JPD), and the Fred Hutchinson Cancer Research Center. This manuscript is based on work completed while ER was employed at the University of Washington. The opinions expressed here are the author's own and do not reflect the views of the Department of Health and Human Services.
Additional File 7Figure S6. Reproducibility of methylation profiles across three experiments in which heart DNA is compared with spleen using tissue from the male donor. DNA was extracted from a single heart and single spleen tissue sample, and each DNA preparation was then divided into aliquots that were independently processed through HpaII digestion, size selection, labeling, and array hybridiza-tion. Replicates are identified as M1, M2, and M3 for heart, and M1, M6, and M7 for spleen, where M denotes the male donor. (A) Profiles of log2 ratios as function of genomic position. Clones highlighted in black, red, or blue have log2
ratios that deviate from the median by >4.88 median absolute deviation, which was calculated over the region indicated with a wide bar. The clone whose value is indicated in red is RP11-47A4, which contains part of the RYR2 gene; the value in blue is for clone RP11-90O23, which contains ATP2B4. Sequences encompassed by these clones are the subject of our bisulfite sequencing analyses. (B) Correlations of log2 ratios measured in the three pairs of experiments. Scat-terplots are shown above the diagonal; values below the diagonal are the corre-sponding Pearson correlation coefficients (R2).Click here for file[http://www.biomedcentral.com/content/supplementary/1756-8935-2-7-S7.pdf]
Additional File 8Figure S7. Enlarged view of clones on the array around the region containing the ryanodine cardiac receptor 2 gene (RYR2). Relative positions of bacterial artificial chromosomes (BACs) covering the region flanking RP11-47A4 (AL391809) and their corresponding mean log2 ratios (dotted lines are at ± 1 standard error of the mean) in six heart-versus-spleen methylation profiles (three using DNA prepared from tissue from the female donor, and three uti-lizing DNA from tissue from the male donor). RP11-47A4 has the highest mean log2 ratio value of the five BACs shown here. The relative positions of RYR2 exons are indicated by black dots (size not to scale) and the RYR2 CpG island, which coincides with RYR2's first exon is indicated. RYR2 extends approximately 340 kb beyond the region shown.Click here for file[http://www.biomedcentral.com/content/supplementary/1756-8935-2-7-S8.pdf]
Additional File 9Figure S8. Methylation status of CpGs in RP11-47A4 (AL391809), which contains the RYR2 gene, as determined by sequencing of PCR products ampli-fied after bisulfite conversion of unmethylated cytosines to uracil. These data are summarized in Figure 6. Here, the raw data are provided for each sequenced amplicon from heart or spleen. Filled squares represent methylated CpG dinu-cleotides, open squares unmethylated CpGs, and gray background shading denotes CpGs that are part of HpaII restriction sites.Click here for file[http://www.biomedcentral.com/content/supplementary/1756-8935-2-7-S9.pdf]
Additional File 10Figure S9. Expression ratios tend to be higher for genes whose 5' ends fall in regions of lower methylation (that is, in bacterial artificial chromo-somes (BACs) with higher methylation array ratios) than those in regions of higher methylation. Data are presented as in Figure 7, but here BACs are classified in the 'High' and 'Low' categories using a less conservative methylation array ratio threshold. This less conservative threshold is defined as 2.91 * median absolute deviation (MAD) units below and above the median value. At the 2.91 * MAD threshold, we expect approx-imately 2.5% of BACs on the array to fall into each of the 'High' and 'Low' categories purely by chance (that is, an overall false-positive rate of 5% of array BACs). Figure 7 conservatively uses 4.88 * MAD, such that the false-positive rate is expected to be only around 0.1% of the BACs on the array. The increased number of BACs in the 'High' and 'Low' catego-ries using this less conservative approach likely gives the statistical tests greater power, explaining the greater significance of most P values shown here as compared with Figure 7.Click here for file[http://www.biomedcentral.com/content/supplementary/1756-8935-2-7-S10.pdf]
Additional File 11Figure S10. Methylation profile in which two independently processed aliquots of DNA isolated from medulla tissue from the same female donor are directly compared. The log2 ratios for chromosome 1 clones are indi-cated at their relative genomic position, with the large gap representing the centromere and pericentromeric repeats in 1p11–1q21. The horizontal scale for the X chromosome is compressed; the 17 chromosome X clones on the array are distributed over 110 Mb. Clones highlighted in black or red have log2 ratios that deviate from the overall median, set here to 0, in either direction by >4.88 median absolute deviation (MAD) units, where MAD units are calculated using the data for the clones in the region of 1q marked 'MAD', which showed the least biological variation within and across experiments. Clones highlighted in red deviate from the overall median by ± 4.88 MAD, calculated using all values.Click here for file[http://www.biomedcentral.com/content/supplementary/1756-8935-2-7-S11.pdf]
Page 19 of 21(page number not for citation purposes)

Epigenetics & Chromatin 2009, 2:7 http://www.epigeneticsandchromatin.com/content/2/1/7
References1. Li E, Bestor TH, Jaenisch R: Targeted mutation of the DNA
methyltransferase gene results in embryonic lethality. Cell1992, 69:915-926.
2. Goll MG, Bestor TH: Eukaryotic cytosine methyltransferases.Annu Rev Biochem 2005, 74:481-514.
3. Bird A: DNA methylation patterns and epigenetic memory.Genes Dev 2002, 16:6-21.
4. Pfeifer GP, Tanguay RL, Steigerwald SD, Riggs AD: In vivo footprintand methylation analysis by PCR-aided genomic sequencing:comparison of active and inactive X chromosomal DNA atthe CpG island and promoter of human PGK-1. Genes Dev1990, 4:1277-1287.
5. Li E, Beard C, Jaenisch R: Role for DNA methylation in genomicimprinting. Nature 1993, 366:362-365.
6. Yoder JA, Walsh CP, Bestor TH: Cytosine methylation and theecology of intragenomic parasites. Trends Genet 1997,13:335-340.
7. Martienssen RA, Colot V: DNA methylation and epigeneticinheritance in plants and filamentous fungi. Science 2001,293:1070-1074.
8. Fraga MF, Ballestar E, Paz MF, Ropero S, Setien F, Ballestar ML, Heine-Suner D, Cigudosa JC, Urioste M, Benitez J, Boix-Chornet M,Sanchez-Aguilera A, Ling C, Carlsson E, Poulsen P, Vaag A, Stephan Z,Spector TD, Wu YZ, Plass C, Esteller M: Epigenetic differencesarise during the lifetime of monozygotic twins. Proc Natl AcadSci USA 2005, 102:10604-10609.
9. Amir RE, Veyver IB Van den, Wan M, Tran CQ, Francke U, ZoghbiHY: Rett syndrome is caused by mutations in X-linkedMECP2, encoding methyl-CpG-binding protein 2. Nat Genet1999, 23:185-188.
10. Brannan CI, Bartolomei MS: Mechanisms of genomic imprinting.Curr Opin Genet Dev 1999, 9:164-170.
11. Hansen RS, Wijmenga C, Luo P, Stanek AM, Canfield TK, WeemaesCM, Gartler SM: The DNMT3B DNA methyltransferase geneis mutated in the ICF immunodeficiency syndrome. Proc NatlAcad Sci USA 1999, 96:14412-14417.
12. Okano M, Bell DW, Haber DA, Li E: DNA methyltransferasesDnmt3a and Dnmt3b are essential for de novo methylationand mammalian development. Cell 1999, 99:247-257.
13. Nicholls RD, Knepper JL: Genome organization, function, andimprinting in Prader-Willi and Angelman syndromes. AnnuRev Genomics Hum Genet 2001, 2:153-175.
14. Sparago A, Cerrato F, Vernucci M, Ferrero GB, Silengo MC, Riccio A:Microdeletions in the human H19 DMR result in loss of IGF2imprinting and Beckwith-Wiedemann syndrome. Nat Genet2004, 36:958-960.
15. Paz MF, Wei S, Cigudosa JC, Rodriguez-Perales S, Peinado MA, HuangTH, Esteller M: Genetic unmasking of epigenetically silencedtumor suppressor genes in colon cancer cells deficient inDNA methyltransferases. Hum Mol Genet 2003, 12:2209-2219.
16. Rideout WM 3rd, Eversole-Cire P, Spruck CH 3rd, Hustad CM,Coetzee GA, Gonzales FA, Jones PA: Progressive increases in themethylation status and heterochromatinization of the myoDCpG island during oncogenic transformation. Mol Cell Biol1994, 14:6143-6152.
17. Laird PW, Jaenisch R: The role of DNA methylation in cancergenetics and epigenetics. Annu Rev Genet 1996, 30:441-464.
18. Esteller M: Cancer epigenomics: DNA methylomes and his-tone-modification maps. Nat Rev Genet 2007, 8:286-298.
19. Larsen F, Gundersen G, Lopez R, Prydz H: CpG islands as genemarkers in the human genome. Genomics 1992, 13:1095-1107.
20. Wang Y, Leung FC: An evaluation of new criteria for CpGislands in the human genome as gene markers. Bioinformatics2004, 20:1170-1177.
21. Ioshikhes IP, Zhang MQ: Large-scale human promoter mappingusing CpG islands. Nat Genet 2000, 26:61-63.
22. Prendergast GC, Ziff EB: Methylation-sensitive sequence-spe-cific DNA binding by the c-Myc basic region. Science 1991,251:186-189.
23. Ohlsson R, Renkawitz R, Lobanenkov V: CTCF is a uniquely ver-satile transcription regulator linked to epigenetics and dis-ease. Trends Genet 2001, 17:520-527.
24. Chen C, Yang MC, Yang TP: Evidence that silencing of the HPRTpromoter by DNA methylation is mediated by critical CpGsites. J Biol Chem 2001, 276:320-328.
25. Jaenisch R, Bird A: Epigenetic regulation of gene expression:how the genome integrates intrinsic and environmental sig-nals. Nat Genet 2003, 33(Suppl):245-254.
26. Weber M, Hellmann I, Stadler MB, Ramos L, Pääbo S, Rebhan M,Schübeler D: Distribution, silencing potential and evolutionaryimpact of promoter DNA methylation in the humangenome. Nat Genet 2007, 39:457-466.
27. Bird AP, Taggart MH, Nicholls RD, Higgs DR: Non-methylatedCpG-rich islands at the human alpha-globin locus: implica-tions for evolution of the alpha-globin pseudogene. EMBO J1987, 6:999-1004.
28. Jones PA, Wolkowicz MJ, Rideout WM 3rd, Gonzales FA, MarziaszCM, Coetzee GA, Tapscott SJ: De novo methylation of theMyoD1 CpG island during the establishment of immortal celllines. Proc Natl Acad Sci USA 1990, 87:6117-6121.
29. McKeon C, Ohkubo H, Pastan I, de Crombrugghe B: Unusual meth-ylation pattern of the alpha 2 (l) collagen gene. Cell 1982,29:203-210.
30. Hellman A, Chess A: Gene body-specific methylation on theactive X chromosome. Science 2007, 315:1141-1143.
31. Ball MP, Li JB, Gao Y, Lee JH, LeProust EM, Park IH, Xie B, Daley GQ,Church GM: Targeted and genome-scale strategies revealgene-body methylation signatures in human cells. Nat Biotech-nol 2009, 27:361-368.
32. Khulan B, Thompson RF, Ye K, Fazzari MJ, Suzuki M, Stasiek E,Figueroa ME, Glass JL, Chen Q, Montagna C, Hatchwell E, Selzer RR,Richmond TA, Green RD, Melnick A, Greally JM: Comparativeisoschizomer profiling of cytosine methylation: the HELPassay. Genome Res 2006, 16:1046-1055.
33. Eckhardt F, Lewin J, Cortese R, Rakyan VK, Attwood J, Burger M, Bur-ton J, Cox TV, Davies R, Down TA, Haefliger C, Horton R, Howe K,Jackson DK, Kunde J, Koenig C, Liddle J, Niblett D, Otto T, Pettett R,Seemann S, Thompson C, West T, Rogers J, Olek A, Berlin K, Beck S:DNA methylation profiling of human chromosomes 6, 20and 22. Nat Genet 2006, 38:1378-1385.
34. Suzuki MM, Kerr AR, De Sousa D, Bird A: CpG methylation is tar-geted to transcription units in an invertebrate genome.Genome Res 2007, 17:625-631.
35. Weber M, Schübeler D: Genomic patterns of DNA methyla-tion: targets and function of an epigenetic mark. Curr Opin CellBiol 2007, 19:273-280.
36. Meissner A, Mikkelsen TS, Gu H, Wernig M, Hanna J, Sivachenko A,Zhang X, Bernstein BE, Nusbaum C, Jaffe DB, Gnirke A, Jaenisch R,Lander ES: Genome-scale DNA methylation maps of pluripo-tent and differentiated cells. Nature 2008, 454:766-770.
37. Lister R, O'Malley RC, Tonti-Filippini J, Gregory BD, Berry CC, MillarAH, Ecker JR: Highly integrated single-base resolution maps ofthe epigenome in Arabidopsis. Cell 2008, 133:523-536.
38. Deng J, Shoemaker R, Xie B, Gore A, LeProust EM, Antosiewicz-Bourget J, Egli D, Maherali N, Park IH, Yu J, Daley GQ, Eggan K,Hochedlinger K, Thomson J, Wang W, Gao Y, Zhang K: Targetedbisulfite sequencing reveals changes in DNA methylationassociated with nuclear reprogramming. Nat Biotechnol 2009,27:353-360.
39. Kawai J, Hirotsune S, Hirose K, Fushiki S, Watanabe S, Hayashizaki Y:Methylation profiles of genomic DNA of mouse develop-mental brain detected by restriction landmark genomicscanning (RLGS) method. Nucleic Acids Res 1993, 21:5604-5608.
40. Ushijima T, Morimura K, Hosoya Y, Okonogi H, Tatematsu M, Sug-imura T, Nagao M: Establishment of methylation-sensitive-rep-resentational difference analysis and isolation of hypo- andhypermethylated genomic fragments in mouse liver tumors.Proc Natl Acad Sci USA 1997, 94:2284-2289.
41. Gonzalgo ML, Liang G, Spruck CH 3rd, Zingg JM, Rideout WM 3rd,Jones PA: Identification and characterization of differentiallymethylated regions of genomic DNA by methylation-sensi-tive arbitrarily primed PCR. Cancer Res 1997, 57:594-599.
42. Toyota M, Ho C, Ahuja N, Jair KW, Li Q, Ohe-Toyota M, Baylin SB,Issa JP: Identification of differentially methylated sequences incolorectal cancer by methylated CpG island amplification.Cancer Res 1999, 59:2307-2312.
43. Yan PS, Chen CM, Shi H, Rahmatpanah F, Wei SH, Huang TH: Appli-cations of CpG island microarrays for high-throughput anal-ysis of DNA methylation. J Nutr 2002, 132:2430S-2434S.
44. Chen CM, Chen HL, Hsiau TH, Hsiau AH, Shi H, Brock GJ, Wei SH,Caldwell CW, Yan PS, Huang TH: Methylation target array forrapid analysis of CpG island hypermethylation in multipletissue genomes. Am J Pathol 2003, 163:37-45.
Page 20 of 21(page number not for citation purposes)
http://www.ncbi.nlm.nih.gov/entrez/query.fcgi?cmd=Retrieve&db=PubMed&dopt=Abstract&list_uids=1606615
http://www.ncbi.nlm.nih.gov/entrez/query.fcgi?cmd=Retrieve&db=PubMed&dopt=Abstract&list_uids=1606615
http://www.ncbi.nlm.nih.gov/entrez/query.fcgi?cmd=Retrieve&db=PubMed&dopt=Abstract&list_uids=2227409
http://www.ncbi.nlm.nih.gov/entrez/query.fcgi?cmd=Retrieve&db=PubMed&dopt=Abstract&list_uids=2227409
http://www.ncbi.nlm.nih.gov/entrez/query.fcgi?cmd=Retrieve&db=PubMed&dopt=Abstract&list_uids=2227409
http://www.ncbi.nlm.nih.gov/entrez/query.fcgi?cmd=Retrieve&db=PubMed&dopt=Abstract&list_uids=8247133
http://www.ncbi.nlm.nih.gov/entrez/query.fcgi?cmd=Retrieve&db=PubMed&dopt=Abstract&list_uids=8247133
http://www.ncbi.nlm.nih.gov/entrez/query.fcgi?cmd=Retrieve&db=PubMed&dopt=Abstract&list_uids=9260521
http://www.ncbi.nlm.nih.gov/entrez/query.fcgi?cmd=Retrieve&db=PubMed&dopt=Abstract&list_uids=9260521
http://www.ncbi.nlm.nih.gov/entrez/query.fcgi?cmd=Retrieve&db=PubMed&dopt=Abstract&list_uids=8065347
http://www.ncbi.nlm.nih.gov/entrez/query.fcgi?cmd=Retrieve&db=PubMed&dopt=Abstract&list_uids=8065347
http://www.ncbi.nlm.nih.gov/entrez/query.fcgi?cmd=Retrieve&db=PubMed&dopt=Abstract&list_uids=8065347
http://www.ncbi.nlm.nih.gov/entrez/query.fcgi?cmd=Retrieve&db=PubMed&dopt=Abstract&list_uids=8982461
http://www.ncbi.nlm.nih.gov/entrez/query.fcgi?cmd=Retrieve&db=PubMed&dopt=Abstract&list_uids=8982461
http://www.ncbi.nlm.nih.gov/entrez/query.fcgi?cmd=Retrieve&db=PubMed&dopt=Abstract&list_uids=1505946
http://www.ncbi.nlm.nih.gov/entrez/query.fcgi?cmd=Retrieve&db=PubMed&dopt=Abstract&list_uids=1505946
http://www.ncbi.nlm.nih.gov/entrez/query.fcgi?cmd=Retrieve&db=PubMed&dopt=Abstract&list_uids=1987636
http://www.ncbi.nlm.nih.gov/entrez/query.fcgi?cmd=Retrieve&db=PubMed&dopt=Abstract&list_uids=1987636
http://www.ncbi.nlm.nih.gov/entrez/query.fcgi?cmd=Retrieve&db=PubMed&dopt=Abstract&list_uids=3595568
http://www.ncbi.nlm.nih.gov/entrez/query.fcgi?cmd=Retrieve&db=PubMed&dopt=Abstract&list_uids=3595568
http://www.ncbi.nlm.nih.gov/entrez/query.fcgi?cmd=Retrieve&db=PubMed&dopt=Abstract&list_uids=3595568
http://www.ncbi.nlm.nih.gov/entrez/query.fcgi?cmd=Retrieve&db=PubMed&dopt=Abstract&list_uids=2385586
http://www.ncbi.nlm.nih.gov/entrez/query.fcgi?cmd=Retrieve&db=PubMed&dopt=Abstract&list_uids=2385586
http://www.ncbi.nlm.nih.gov/entrez/query.fcgi?cmd=Retrieve&db=PubMed&dopt=Abstract&list_uids=2385586
http://www.ncbi.nlm.nih.gov/entrez/query.fcgi?cmd=Retrieve&db=PubMed&dopt=Abstract&list_uids=7105182
http://www.ncbi.nlm.nih.gov/entrez/query.fcgi?cmd=Retrieve&db=PubMed&dopt=Abstract&list_uids=7105182
http://www.ncbi.nlm.nih.gov/entrez/query.fcgi?cmd=Retrieve&db=PubMed&dopt=Abstract&list_uids=8284204
http://www.ncbi.nlm.nih.gov/entrez/query.fcgi?cmd=Retrieve&db=PubMed&dopt=Abstract&list_uids=8284204
http://www.ncbi.nlm.nih.gov/entrez/query.fcgi?cmd=Retrieve&db=PubMed&dopt=Abstract&list_uids=8284204
http://www.ncbi.nlm.nih.gov/entrez/query.fcgi?cmd=Retrieve&db=PubMed&dopt=Abstract&list_uids=9122186
http://www.ncbi.nlm.nih.gov/entrez/query.fcgi?cmd=Retrieve&db=PubMed&dopt=Abstract&list_uids=9122186
http://www.ncbi.nlm.nih.gov/entrez/query.fcgi?cmd=Retrieve&db=PubMed&dopt=Abstract&list_uids=9044832
http://www.ncbi.nlm.nih.gov/entrez/query.fcgi?cmd=Retrieve&db=PubMed&dopt=Abstract&list_uids=9044832
Epigenetics & Chromatin 2009, 2:7 http://www.epigeneticsandchromatin.com/content/2/1/7
45. Song F, Smith JF, Kimura MT, Morrow AD, Matsuyama T, Nagase H,Held WA: Association of tissue-specific differentially methyl-ated regions (TDMs) with differential gene expression. ProcNatl Acad Sci USA 2005, 102:3336-3341.
46. Frigola J, Song J, Stirzaker C, Hinshelwood RA, Peinado MA, Clark SJ:Epigenetic remodeling in colorectal cancer results in coordi-nate gene suppression across an entire chromosome band.Nat Genet 2006, 38:540-549.
47. Shen L, Kondo Y, Guo Y, Zhang J, Zhang L, Ahmed S, Shu J, Chen X,Waterland RA, Issa JP: Genome-wide profiling of DNA methyl-ation reveals a class of normally methylated CpG island pro-moters. PLoS Genet 2007, 3:2023-2036.
48. Sakamoto H, Suzuki M, Abe T, Hosoyama T, Himeno E, Tanaka S,Greally JM, Hattori N, Yagi S, Shiota K: Cell type-specific methyl-ation profiles occurring disproportionately in CpG-lessregions that delineate developmental similarity. Genes Cells2007, 12:1123-1132.
49. Down TA, Rakyan VK, Turner DJ, Flicek P, Li H, Kulesha E, Graf S,Johnson N, Herrero J, Tomazou EM, Thorne NP, Backdahl L, Her-berth M, Howe KL, Jackson DK, Miretti MM, Marioni JC, Birney E,Hubbard TJ, Durbin R, Tavare S, Beck S: A Bayesian deconvolu-tion strategy for immunoprecipitation-based DNA methyl-ome analysis. Nat Biotechnol 2008, 26:779-785.
50. Rauch TA, Wu X, Zhong X, Riggs AD, Pfeifer GP: A human B cellmethylome at 100-base pair resolution. Proc Natl Acad Sci USA2009, 106:671-678.
51. Beck S, Rakyan VK: The methylome: approaches for globalDNA methylation profiling. Trends Genet 2008, 24:231-237.
52. Shiota K, Kogo Y, Ohgane J, Imamura T, Urano A, Nishino K, TanakaS, Hattori N: Epigenetic marks by DNA methylation specificto stem, germ and somatic cells in mice. Genes Cells 2002,7:961-969.
53. Tompa R, McCallum CM, Delrow J, Henikoff JG, van Steensel B,Henikoff S: Genome-wide profiling of DNA methylationreveals transposon targets of CHROMOMETHYLASE3. CurrBiol 2002, 12:65-68.
54. Tran RK, Henikoff JG, Zilberman D, Ditt RF, Jacobsen SE, Henikoff S:DNA methylation profiling identifies CG methylation clus-ters in Arabidopsis genes. Curr Biol 2005, 15:154-159.
55. Buckley PG, Jarbo C, Menzel U, Mathiesen T, Scott C, Gregory SG,Langford CF, Dumanski JP: Comprehensive DNA copy numberprofiling of meningioma using a chromosome 1 tiling pathmicroarray identifies novel candidate tumor suppressor loci.Cancer Res 2005, 65:2653-2661.
56. RepeatMasker Open-3.0 [http://www.repeatmasker.org]57. Feinberg AP, Vogelstein B: A technique for radiolabeling DNA
restriction endonuclease fragments to high specific activity.Anal Biochem 1983, 132:6-13.
58. Ge X, Yamamoto S, Tsutsumi S, Midorikawa Y, Ihara S, Wang SM,Aburatani H: Interpreting expression profiles of cancers bygenome-wide survey of breadth of expression in normal tis-sues. Genomics 2005, 86:127-141.
59. Laitinen PJ, Brown KM, Piippo K, Swan H, Devaney JM, Brahmbhatt B,Donarum EA, Marino M, Tiso N, Viitasalo M, Toivonen L, StephanDA, Kontula K: Mutations of the cardiac ryanodine receptor(RyR2) gene in familial polymorphic ventricular tachycardia.Circulation 2001, 103:485-490.
60. Wehrens XH, Lehnart SE, Huang F, Vest JA, Reiken SR, Mohler PJ, SunJ, Guatimosim S, Song LS, Rosemblit N, D'Armiento JM, NapolitanoC, Memmi M, Priori SG, Lederer WJ, Marks AR: FKBP12.6 defi-ciency and defective calcium release channel (ryanodinereceptor) function linked to exercise-induced sudden cardiacdeath. Cell 2003, 113:829-840.
61. Morita H, Seidman J, Seidman CE: Genetic causes of human heartfailure. J Clin Invest 2005, 115:518-526.
62. Wu X, Chang B, Blair NS, Sargent M, York AJ, Robbins J, Shull GE,Molkentin JD: Plasma membrane Ca2+-ATPase isoform 4antagonizes cardiac hypertrophy in association with cal-cineurin inhibition in rodents. J Clin Invest 2009, 119:976-985.
63. Ladd-Acosta C, Pevsner J, Sabunciyan S, Yolken RH, Webster MJ,Dinkins T, Callinan PA, Fan JB, Potash JB, Feinberg AP: DNA meth-ylation signatures within the human brain. Am J Hum Genet2007, 81:1304-1315.
64. Illingworth R, Kerr A, Desousa D, Jorgensen H, Ellis P, Stalker J, Jack-son D, Clee C, Plumb R, Rogers J, Humphray S, Cox T, Langford C,
Bird A: A novel CpG island set identifies tissue-specific meth-ylation at developmental gene loci. PLoS Biol 2008, 6:e22.
65. Oakes CC, La Salle S, Smiraglia DJ, Robaire B, Trasler JM: A uniqueconfiguration of genome-wide DNA methylation patterns inthe testis. Proc Natl Acad Sci USA 2007, 104:228-233.
66. Kapranov P, Cheng J, Dike S, Nix DA, Duttagupta R, Willingham AT,Stadler PF, Hertel J, Hackermuller J, Hofacker IL, Bell I, Cheung E,Drenkow J, Dumais E, Patel S, Helt G, Ganesh M, Ghosh S, PiccolboniA, Sementchenko V, Tammana H, Gingeras TR: RNA maps revealnew RNA classes and a possible function for pervasive tran-scription. Science 2007, 316:1484-1488.
67. Branco MR, Pombo A: Intermingling of chromosome territo-ries in interphase suggests role in translocations and tran-scription-dependent associations. PLoS Biol 2006, 4:e138.
68. Zilberman D, Gehring M, Tran RK, Ballinger T, Henikoff S: Genome-wide analysis of Arabidopsis thaliana DNA methylationuncovers an interdependence between methylation andtranscription. Nat Genet 2007, 39:61-69.
69. Cooperative Human Tissue Network [http://chtn.nci.nih.gov]70. Fiegler H, Carr P, Douglas EJ, Burford DC, Hunt S, Scott CE, Smith J,
Vetrie D, Gorman P, Tomlinson IP, Carter NP: DNA microarraysfor comparative genomic hybridization based on DOP-PCRamplification of BAC and PAC clones. Genes Chromosomes Can-cer 2003, 36:361-374.
71. Cleveland WS, Grosse E, Shyu WM: Local Regression Models. InStatistical Models Edited by: Chambers JM, Hastie TJ. Pacific Grove,CA: S. Wadsworth & Brooks/Cole; 1992.
72. Locke DP, Sharp AJ, McCarroll SA, McGrath SD, Newman TL, ChengZ, Schwartz S, Albertson DG, Pinkel D, Altshuler DM, Eichler EE:Linkage disequilibrium and heritability of copy-number pol-ymorphisms within duplicated regions of the humangenome. Am J Hum Genet 2006, 79:275-290.
73. Ihaka R, Gentleman RR: R: a language for data analysis andgraphics. J Comput Graph Stat 1996, 5:299-314.
74. UCSC Genome Browser [http://genome.ucsc.edu]75. Irizarry RA, Hobbs B, Collin F, Beazer-Barclay YD, Antonellis KJ,
Scherf U, Speed TP: Exploration, normalization, and summa-ries of high density oligonucleotide array probe level data.Biostatistics 2003, 4:249-264.
76. SCGAP Hematopoietic Stem Cells Project [http://www.cbil.upenn.edu/SCGAP/resources.html]
77. Halekoh U, Højsgaard S, Yan J: The R package geepack for gen-eralized estimating equations. J Stat Softw 2005, 15:1-11.
78. Lorincz MC, Schübeler D, Goeke SC, Walters M, Groudine M, MartinDI: Dynamic analysis of proviral induction and De Novo meth-ylation: implications for a histone deacetylase-independent,methylation density-dependent mechanism of transcrip-tional repression. Mol Cell Biol 2000, 20:842-850.
79. Tusnady GE, Simon I, Varadi A, Aranyi T: BiSearch: primer-designand search tool for PCR on bisulfite-treated genomes. NucleicAcids Res 2005, 33:e9.
80. Ewing B, Green P: Base-calling of automated sequencer tracesusing phred. II. Error probabilities. Genome Res 1998,8:186-194.
81. Ewing B, Hillier L, Wendl MC, Green P: Base-calling of automatedsequencer traces using phred. I. Accuracy assessment.Genome Res 1998, 8:175-185.
82. Gordon D, Abajian C, Green P: Consed: a graphical tool forsequence finishing. Genome Res 1998, 8:195-202.
Page 21 of 21(page number not for citation purposes)
http://www.ncbi.nlm.nih.gov/entrez/query.fcgi?cmd=Retrieve&db=PubMed&dopt=Abstract&list_uids=6312838
http://www.ncbi.nlm.nih.gov/entrez/query.fcgi?cmd=Retrieve&db=PubMed&dopt=Abstract&list_uids=6312838
http://www.ncbi.nlm.nih.gov/entrez/query.fcgi?cmd=Retrieve&db=PubMed&dopt=Abstract&list_uids=9521922
http://www.ncbi.nlm.nih.gov/entrez/query.fcgi?cmd=Retrieve&db=PubMed&dopt=Abstract&list_uids=9521922
http://www.ncbi.nlm.nih.gov/entrez/query.fcgi?cmd=Retrieve&db=PubMed&dopt=Abstract&list_uids=9521921
http://www.ncbi.nlm.nih.gov/entrez/query.fcgi?cmd=Retrieve&db=PubMed&dopt=Abstract&list_uids=9521921