Time Use in Rural Areas: A Case Study in Turkey
24
Economic Research Center Middle East Technical University Ankara 06531 Turkey www.erc.metu.edu.tr ERC Working Papers in Economics 06/02 January 2006 Time Use in Rural Areas: A Case Study in Turkey Erkan Erdil Ozan Eruygur Zehra Kasnakolu Department of Economics Middle East Technical University Ankara 06531, Turkey
Transcript of Time Use in Rural Areas: A Case Study in Turkey

Economic Research Center Middle East Technical University Ankara 06531 Turkey www.erc.metu.edu.tr
ERC Working Papers in Economics 06/02 January 2006
Time Use in Rural Areas: A Case Study in Turkey
Erkan Erdil Ozan Eruygur
Zehra Kasnako�lu Department of Economics
Middle East Technical University Ankara 06531, Turkey

Time Use in Rural Areas: A Case Study in Turkey Erkan ERDIL - Ozan ERUYGUR - Zehra KASNAKOGLU*
Abstract This study aims to analyze rural household work and leisure time and how it is allocated among various activities and by socio-economic characteristics of individuals. The analysis is based on a survey carried out in two central Anatolian villages. Three time use questionnaires are administered between May-October 2003 during two different days of the week, an ordinary weekday and the day of the local bazaar. 138 household members from these two villages have participated in the survey. It is found that on the average, the villagers spend over half of their non-sleeping time on non-economic activities including personal development. The remaining time spent on agricultural and non-agricultural economic activities is about the same. Males on the average spend more time on all activities than females except for personal development. The results show that, time use patterns change during different days of the week and months of the year. It is also found that, there is a high correlation between time use patterns and socio-economic characteristics of the households. In general there are statistically significant differences in the average time devoted to activities by education and age groups. Finally, significant differences are observed in the time use patterns rather than magnitudes by gender. As expected, differentiation in men’s and women’s roles is observed in agricultural activities. Keywords: Time Use surveys, rural households, agricultural activities. JEL Codes: D13, J16, Q12.
1. Introduction
Time use surveys are conducted i) to measure and analyse time spent within daily and
between daily activities to gain more insight on the productive and leisure activities of
household members, ii) to obtain information on the division of both paid and unpaid
labour between women and men and other groupings, iii) to learn more about the
productive activities such as subsistence work, casual work and work in the informal sector
and iv) to provide data to improve significantly the estimated contributions, to GDP and
employment, of domestic services of household industry.
Therefore, time use survey data provide vital inputs to policy analysis. These data supply
valuable information on the allocation of time to household production for the market as
well household’s own consumption, and hence on the allocation of time to leisure
activities. This information is generally not available in the databases of household income
and expenditure surveys.
____________________________________________ *Department of Economics, Middle East Technical University, Ankara. Authors would like to acknowledge the support from METU Research Fund and the assistance from students who have participated in the field work and the data entry phases of the project.

1
The economic analysis is in principal based on models of individual and household
behavior that relate welfare to consumption and leisure. Without access to information on
the nature of time use outside the market, the models are not able to distinguish between
the real leisure time of family members and the time spent by family members on
household activities for other family members.
The literature on the urban households though limited are not scarce, yet the number of
studies on the rural households is very limited in number and scope. The roles of women
and children in agriculture have generally been neglected by the researchers as their
contributions to production activities take place outside the market. The relationship
between labor use, the leisure time and the time spent on income-generating activities in
rural households is frequently represented as an implicit trade-off. However, such
relationships significantly contribute to the shaping of agrarian economies. While the main
interest of traditional economic analysis is to scrutinize the hours supplied to income-
earning activities, the labor supply of individuals cannot be fully understood without taking
into account the hours allocated to other non-market activities.
Time use (allocation) studies have also been used to investigate the links between work
patterns and environmental degradation and change (UNDP, 1995: 92-3); to compare the
amount of leisure which individuals and societies enjoy as a measure of welfare at both
micro and macro levels (Acharya, 1999); to provide a more accurate picture of activities in
rural areas where non-market work is prevalent (Acharya and Bennett, 1981, cited in ibid.),
and more recently to assess the extent of involvement in unpaid labour by gender and age.
Time use data provide an important input into the process of valuing non-market work in
national accounts, and also allow for analysis of the effects of changes in public spending
on time use.
Time use surveys can be based on observation, recall or diary keeping, or a combination of
these methods (see UNDP 1995, pp. 88-96 for a summary of studies in 31 countries). Time
use surveys have been conducted in Canada (since 1978) and Norway as parts of their
official data collection systems. Time use surveys and studies are very limited and
confined to few for the urban areas in Turkey (Kasnako�lu, et al, 1996; SIS,1996;
Kasnako�lu and Dayıo�lu 2002). This study is a first attempt to analyze the time use
relations in rural Turkey. The coverage is confined to two villages in the Central Anatolia
2
region. Although, the results are not representative of all rural Turkey, they nevertheless
provide interesting observations leading to important conclusions which could contribute
to further and more comprehensive studies in different regions of rural Turkey.
In this study, emphasis is placed on rural household work and leisure time and how time is
allocated among various activities and between genders. In the first section, the literature
on the rural household time use surveys will be reviewed. The second section will discuss
the methodological issues and describe the data collected in this study. The third section
will provide results of the analysis carried out with compiled data. The last part will be
devoted to the concluding remarks.
2. Time Allocation in Rural Households: A Review on Developing Countries
The gender based division of labour remains strong in industrialised and urban societies as
well as agricultural and rural communities. Worldwide, most women and men work in
jobs that are done predominantly by one sex. It is reported that while women make up 41
percent of the non-agricultural labour force in OECD countries, they form 62 percent of
service workers compared to only 15 percent of production workers (Elson, 1999). For
specific professions, such as nursing, the proportion of female employees can rise to as
high as 82 percent. This degree of job segregation by sex (and the related uneven
distribution of the labour force across broad sectors) makes job comparison across the
sexes difficult, and contributes to ghettoisation of women in low-paid occupations and
sectors (Elson, 1999).
The critical role of children and women in agricultural activities for the developing
countries is increasingly emphasized in many studies over the last decade. In most of the
studies of the peasantry, the family farm is used as the basic unit of production and
consumption. The production and reproduction take place in the family farm. It is
generally assumed that family farms are synonymous with male-headed households with
respect to agricultural activities and men are the main farmers subordinated by women and
children (Deere, 1995). However, many studies have challenged this assumption claiming
that distinction between male and female led farming systems is not to be overlooked
(Boserup, 1970; Deere and León, 1982; Stephens, 1991; Guyer, 1991; Deere, 1995;
Whitehead, 1999; Bachman, 2000; and Kim and Zepeda, 2004). The studies in this

3
tradition differentiate the family-based agricultural activities by gender division of labor
not only in terms agricultural activities but also with respect to other tasks performed.
The “gender division of labour” refers to the allocation of different jobs or types of work to
men and women, usually by tradition and custom (Alexander and Baden, 2000). Collier
(1993), demonstrated that adoption of tea cultivation in Kenya was hampered by the
prevalent gender division of labour. Tibaijuka (1994) used a linear programming model
and input-output data for a one-year period for Tanzania to show that by liberalising sex
roles in production of coffee and banana for export, villagers would increase their cash
incomes by up to 10 percent, while the productivity of labour and capital would improve
by 15 percent and 44 percent respectively. However, she found that barriers to such a
change were significant. In a study of Sahelian households, Turner (2000) stated that men
and women tended to assign greater secondary responsibility below the household head to
their own gender. He further pointed to the general adherence to Islamic provisioning
across gender and seniority categories.
Ruben and Ruiter (2002) presents an empirical assessment of time allocation of labour and
the composition of farm household income in a sample of peasant households located in
different types of agrarian settlements in the Atlantic Zone of Costa Rica. They found that
small farms in organized settlements rely on labour-intensive cropping systems that
guarantee higher incomes at the expense of leisure, while farms in spontaneous and more
remote settlements still maintain labour-extensive production with reliance on wage
labour. Empirical evidence points towards a clear trade-off between leisure-time and
marginal income as well as possibilities for substitution of family labour by hired labour to
increase leisure. Personal characteristics (i.e. education, age, work attitudes) and farm
characteristics (i.e. location, farm size, lifetime) are identified as relevant factors to explain
leisure choice (ibid., 201).
In a study of rural Burkina Faso, Thorsen (2002) addresses the intrahousehold division of
responsibilities. The majority of women maintain that they only help their areas of
responsibility and keep within norms of showing respect for the husband. However at the
same time, they may put pressure on their husbands to fulfill their obligations. Kevane and
Wydick (2001) suggest that major determinants of allocation of women’s time are social
norms that regulate the economic activities of women. Again employing data from Burkina
4
Faso, it is found that social norms significantly explain differences in patterns of time
allocation. In an interesting study showing the impact of social norms on time use, Rose
(2000) examines the impact of a child’s gender on time allocation of rural household for
rural Indian households. The study concludes that women work less subsequent to the birth
of a boy relative to a girl which can be interpreted as a gender bias.
Apps (2003) analyses South African and Nicaraguan time use surveys and finds that
women work longer than men do and that there is a high degree of specialization in
domestic work and care activities by females. Moreover, market and domestic work
become closer substitutes as per capita consumption increases.
For Zambian rural households, Whitehead (1999) shows that time-use surveys may provide
inadequate understandings of women`s and men`s work, in the absence of an
understanding of the significance of the local context in which the work is done, including
the relationship between farm and off-farm work, and of labour markets. Whitehead (1999)
argues that many rural African women have heavy workloads; in some accounts, this is
contrasted with apparently light work burdens for men. The study further claims that in
making women’s work visible, where once it was not, it is possible to slip into thinking of
African rural men as not doing very much at all.
Deere (1995) claims there is sufficient evidence to suggest that, over time, rather than
decreasing, women's participation in peasant agriculture in a number of Latin American
countries have been increasing - a product of growing land shortage and male migration in
search of wage work, and women's lower opportunity cost in the labor market, among
other factors. Research in Latin America uncovered not only a heterogeneous gender
division of labor in agriculture and heterogeneous family farming systems, but also drew
attention to the existence in rural areas of female-headed households that do not have an
adult male in permanent or even temporary residence. Rural female-headed households and
female managed farming systems were found to be a historical feature of some regions,
such as the English-speaking Caribbean, while associated with capitalist development,
proletarianization and male migration into other areas (Deere, 1995; 55-56).
Jacoby (1993) analyzes Peruvian farm households and develops a general methodology for
estimating structural time-allocation models for agricultural households whose members

5
do not work for wages. The study finds significant gender differences in shadow wages
and peasant family labor supply.
For Guatemalan rural households, Pagán (1998) analyzes the causes and the consequences
of male-female differences in labour force participation and self-employment. Substantial
differences are observed in the labor force participation rate of men and women and in
self-employment. The empirical results suggest that external constraints (i.e., demand-
driven structural factors) explain almost all of the observed gender gap in employment.
Gender differences in individual endowments and human capital contribute to increasing
the male-female self-employment gap; while, structural factors help to reduce gender
differences in rural entrepreneurship.
Cain (1991) analyzes the time use of elderly in rural Bangladesh. Comparing total hours
worked by the elderly in different economic classes, an interesting pattern emerges, where
total hours worked by men decline with increasing wealth, while for women the situation is
reversed. This reversal reflects, on the one hand, cultural restrictions on women's
employment (poor women, including the able-bodied elderly, would undoubtedly seek
more paid employment if such restrictions did not exist), and, on the other hand, that
increasing household wealth does not free women from drudgery to the same extent that it
frees men (ibid., 197). The findings confirm that the specialization by men on income-
earning work and women on home-based work is preserved across age and class. In
general, class-specific patterns of time-use are preserved by the elderly. Older men from
households owning land spend proportionately more time in crop production and animal
husbandry than land-poor elderly, who, like their younger counterparts, are engaged in
wage work and trading to a larger extent (ibid., 198). The major difference is that the
elderly do less of everything than the young. A more detailed accounting of time spent by
women in home production activities leads to a similar conclusion: within economic status
groups. The distribution of time for the elderly between activities is not very different from
the younger reference group; the main difference between young and old is that the old do
less of everything. Interestingly, this extends to child care, which is often assumed to be an
activity in which the elderly specialize. A small exception to this among the relatively poor
is firewood collection, to which older women devote as much, or more time as younger
women (ibid., 198-99).
6
Reardon (1997) utilizes data on 18 African countries to investigate the household income
diversification for rural nonfarm labor. The examples of interhousehold differentiation
show that initial endowments that create differential capacity to enter the nonfarm labor
market can affect household and gender income differentiation over time. On the one hand,
income from nonfarm jobs can be spent to buy more land, where there is a land market and
other assets, which gives further advantage in farm productivity and in the nonfarm labor
market. By consequence, over the generations the local nonfarm sector becomes more
concentrated and dominated by a subset of local families. Such a situation has significant
implications on time use in terms of gender. Men stay in nonfarm jobs while the women
tend to stay in farming activities.
Time budget surveys have revealed the failure of conventional labour statistics to capture
the extent, range and complexity of activities in which individuals engage, particularly in
developing countries, and particularly among women, for whom multi-tasking is common.
For example, the 1971 Census in Nepal gave an activity rate for women of 35 percent
compared to 83 percent for men. By contrast, time use surveys conducted in Nepal found
that women worked 4.62 hours a day compared to 5.81 hours per day for men, including
only those activities which fall under conventional definition of employment. Overall,
men worked 7.51 hours per day compared to 10.81 by women. (Acharya, 1999, pp.5, 12).
Time use surveys across a range of developing countries have revealed that the overall
burden of work varies greatly, with a much higher work burden in rural than urban areas.
In general, though, in all places women work more hours than men, whilst women spend
far less time in market work (around one third) than men (about three quarters) (UNDP,
1995: 91-2).
In a time-use study of Norwegian peri-urban areas, Eikeland (1999) considers a case what
is termed as post-ruralism in the context of new rural pluriactivity. Eikeland (1999) found
that for a majority of households running enterprises in peri-urban areas, their incomes are
pooled from managing several enterprises concurrently and earnings from paid
employment. The analysis also demonstrates that practices carried out by the households
are based on clearly defined gender specific patterns. Men in the pluractive households
develop and run the new speciality enterprises. Eikland (1999) comment on this
observation that perhaps rural women have managed to break free from pluractive
7
adaptations and have realized the ‘dream’ of a job of their own?....or is the sexual division
of labouring these households a response to the entry of women into the labour market?..
3. Time Use in Rural Turkey: A Survey in Two Anatolian Villages
To administer the time use surveys, two central Anatolian villages, namely Karacaören
(Ankara) and Hacıömerli (Kır�ehir) are chosen,. In the first village, Karacaören cereals and
vegetables constitute the main production activities, while in Hacıömerli the main
production activities are cereals and sunflower. In what follows, we present the survey
methodology, questionnaire design and data collection . The next section describes the
main socio-economic characteristics of these villages.
3.1 Methodology and Data Collection
The questionnaire employed in this study consists of two main parts.1 The first part
concentrates on the socio-economics status of the household. This part is also divided into
two subsections. The questions in the first subsection attempt to obtain a general picture of
the household’s socio-economic situation and are addressed to the head of the household.
The questions such as the household size, the number of income earners in the household,
household’s assets, ownership of land and livestock, type of agricultural product produced
are requested to be answered by the head of the household. The second subsection focuses
on the socioeconomic status of the members of the household who are above 12 years of
age. The questions in this subsection are directed to obtain information on the sex, age,
education, occupation, employment status of the household members. This subsection
further investigates the social and cultural habits of household members like reading
newspaper and watching TV and the status of their residence.
The second part of the questionnaire targets the time use patterns of the household
members. A time use table is asked to be completed by each household member containing
information on the type of the activity he or she performs, the duration of the activity, the
place of the activity, for and with whom the activity is performed, and if relevant the
second activity performed simultaneously. Moreover, each respondent is asked to complete
1 Questionnaire is available from the authors upon request.
8
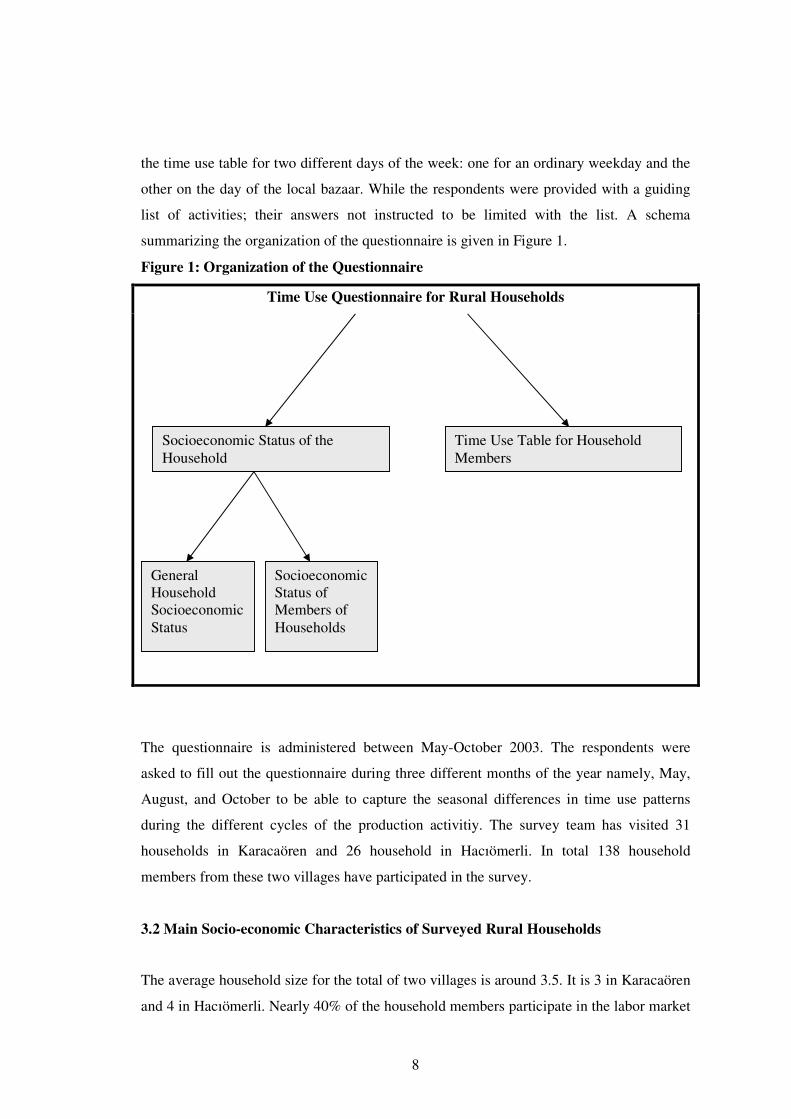
the time use table for two different days of the week: one for an ordinary weekday and the
other on the day of the local bazaar. While the respondents were provided with a guiding
list of activities; their answers not instructed to be limited with the list. A schema
summarizing the organization of the questionnaire is given in Figure 1.
Figure 1: Organization of the Questionnaire
Time Use Questionnaire for Rural Households
The questionnaire is administered between May-October 2003. The respondents were
asked to fill out the questionnaire during three different months of the year namely, May,
August, and October to be able to capture the seasonal differences in time use patterns
during the different cycles of the production activitiy. The survey team has visited 31
households in Karacaören and 26 household in Hacıömerli. In total 138 household
members from these two villages have participated in the survey.
3.2 Main Socio-economic Characteristics of Surveyed Rural Households
The average household size for the total of two villages is around 3.5. It is 3 in Karacaören
and 4 in Hacıömerli. Nearly 40% of the household members participate in the labor market
Socioeconomic Status of the Household
Time Use Table for Household Members
General Household Socioeconomic Status
Socioeconomic Status of Members of Households

9
as income earners. Furthermore, 93% of the households own their dwellings. The
percentage of house ownership is relatively higher in Karacaören. (Table 1).
Table 1: Summary Statistics of Households Karacaören Hacıömerli Overall
Average
Household Size
3.09
(1.82)
4.08
(1.36)
3.53
(2.04)
Average Number of
Income Earners
1.43
(1.07)
1.36
(0.70)
1.40
(0.90)
Ownership of Dwellings 97% 88% 93%
Note: Numbers in brackets are standard deviations.
Tables 2a - 2e describe the agricultural activities of the households.in the two villages
visited. On the average an household owns 3 bovines, 7 ovines and 9 chickens. The most
frequently owned livestock are cattle, sheep, and poultry. Higher values of standard
deviations relative to means indicate that ownership of livestock is distributed unequally
among the villagers (Table 2a).
Table 2a: Average Ownership of Livestock by Households (#)
Karacaören Hacıömerli Overall Cattle-Domestic 0.91
(0.96)
1.00
(2.02)
0.95
(1.50) Cattle-Culture 0.97
(2.31)
3.12
(3.83)
1.91
(3.23) Buffalo 0.00
(0.00)
0.12
(0.43)
0.05
(0.29) Sheep 6.22
(19.25)
6.40
(22.89)
6.30
(20.73) Goat 0.47
(2.65)
0.32
(1.60)
0.40
(2.23) Poultry 4.97
(7.40)
14.68
(14.42)
9.23
(11.96) Bee (hives) 0.88
(2.39)
0.00
(0.00)
0.49
(1.83) Note: Numbers in brackets are standard deviations.
Tables 2b-2c show that the main agricultural products in the survey area are wheat, barley,
chickpeas and rye. More than half of the households produce either wheat and/or barley
which together constitute nearly two thirds of the cultivated crop area. Average farm size
over 50 hectares and significantly larger than the national average for Turkey. Again the

10
standard deviations are high as compared to the averages, especially in the case of wheat,
indicating unequal distribution in ownership.
Table 2b: Average Area Cultivated/Household (decares) Karacaören Hacıömerli Overall
Wheat 6.81
(17.77)
168.64
(246.57)
77.79
(181.09) Barley 5.34
(26.46)
156.44
(169.71)
71.61
(135.84) Rye 0 16.00
(43.01)
7.02
(29.28) Chickpeas 3.00
(10.27)
38.00
(53.7)
18.37
(42.09) Lentil 0 3.60
(13.19)
1.58
(8.82) Note: Numbers in brackets are standard deviations.
Table 2c: Households Producing Sselected Cereals and Sshares in Ccultivated Cereal Area
% of
Cultivated
Cereal area
% of
Household
Producing
% of
Cultivated
Cereal area
% of
Household
Producing
% of
Cultivated
Cereal area
% of
Household
Producing
Karacaören Karacören Hacıömerli Hacıömerli Overall Overall
Wheat 44 44 44 64 44 53
Barley 35 16 41 68 41 39
Rye 0 0 4 20 4 9
Chickpea 22 16 10 44 10 28
Lentil 0 0 1 8 1 4
Note: Numbers in brackets are standard deviations.
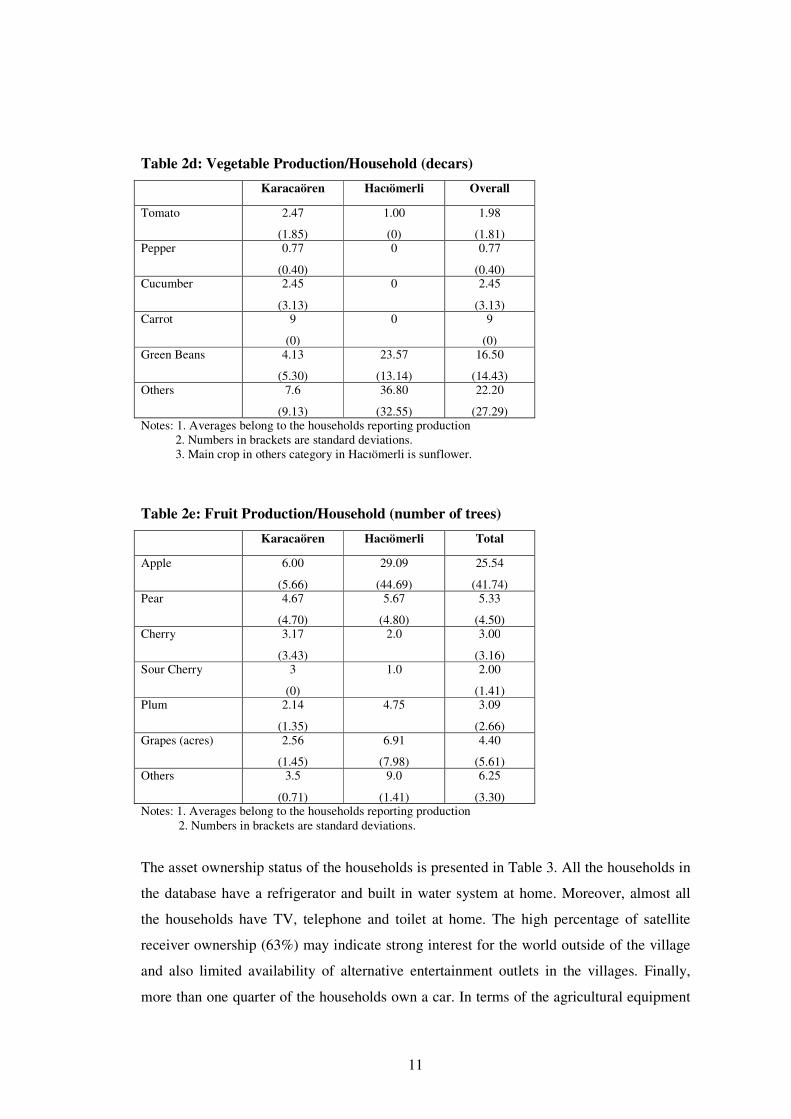
Vegetable production is an important economic activity in the two villages. The main
vegetables cultivated are green beans, tomato and cucumbers (Table 2d). Apple is the main
perennial crop, but the average number of apple trees in households growing apples is only
25. The remainder of the fruit trees range between 2-6 per household and are for self-
consumption.(Table 2e). In Hacıömerli, sunflower constitutes an important place among
non-cereal production.
11
Table 2d: Vegetable Production/Household (decars) Karacaören Hacıömerli Overall
Tomato 2.47
(1.85)
1.00
(0)
1.98
(1.81) Pepper 0.77
(0.40)
0 0.77
(0.40) Cucumber 2.45
(3.13)
0 2.45
(3.13) Carrot 9
(0)
0 9
(0) Green Beans 4.13
(5.30)
23.57
(13.14)
16.50
(14.43) Others 7.6
(9.13)
36.80
(32.55)
22.20
(27.29) Notes: 1. Averages belong to the households reporting production 2. Numbers in brackets are standard deviations. 3. Main crop in others category in Hacıömerli is sunflower.
Table 2e: Fruit Production/Household (number of trees) Karacaören Hacıömerli Total
Apple 6.00
(5.66)
29.09
(44.69)
25.54
(41.74) Pear 4.67
(4.70)
5.67
(4.80)
5.33
(4.50) Cherry 3.17
(3.43)
2.0 3.00
(3.16) Sour Cherry 3
(0)
1.0 2.00
(1.41) Plum 2.14
(1.35)
4.75 3.09
(2.66) Grapes (acres) 2.56
(1.45)
6.91
(7.98)
4.40
(5.61) Others 3.5
(0.71)
9.0
(1.41)
6.25
(3.30) Notes: 1. Averages belong to the households reporting production 2. Numbers in brackets are standard deviations.
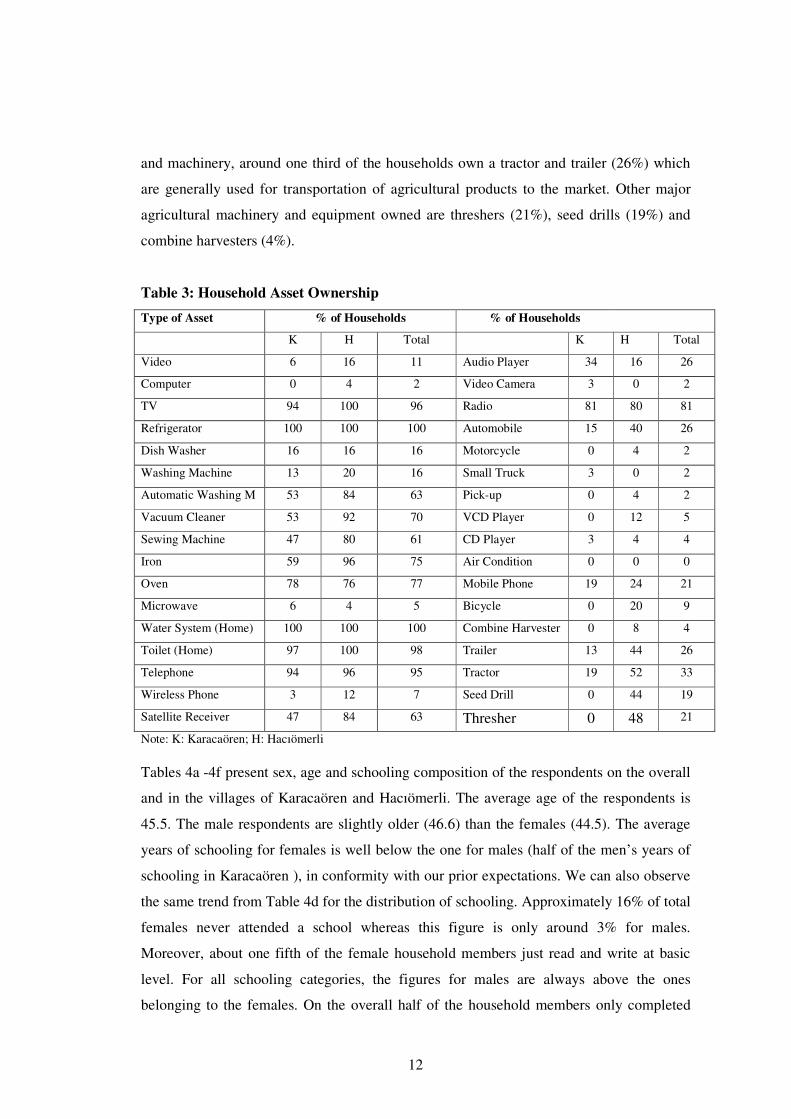
The asset ownership status of the households is presented in Table 3. All the households in
the database have a refrigerator and built in water system at home. Moreover, almost all
the households have TV, telephone and toilet at home. The high percentage of satellite
receiver ownership (63%) may indicate strong interest for the world outside of the village
and also limited availability of alternative entertainment outlets in the villages. Finally,
more than one quarter of the households own a car. In terms of the agricultural equipment
12
and machinery, around one third of the households own a tractor and trailer (26%) which
are generally used for transportation of agricultural products to the market. Other major
agricultural machinery and equipment owned are threshers (21%), seed drills (19%) and
combine harvesters (4%).
Table 3: Household Asset Ownership
Type of Asset % of Households % of Households
K H Total K H Total
Video 6 16 11 Audio Player 34 16 26
Computer 0 4 2 Video Camera 3 0 2
TV 94 100 96 Radio 81 80 81
Refrigerator 100 100 100 Automobile 15 40 26
Dish Washer 16 16 16 Motorcycle 0 4 2
Washing Machine 13 20 16 Small Truck 3 0 2
Automatic Washing M 53 84 63 Pick-up 0 4 2
Vacuum Cleaner 53 92 70 VCD Player 0 12 5
Sewing Machine 47 80 61 CD Player 3 4 4
Iron 59 96 75 Air Condition 0 0 0
Oven 78 76 77 Mobile Phone 19 24 21
Microwave 6 4 5 Bicycle 0 20 9
Water System (Home) 100 100 100 Combine Harvester 0 8 4
Toilet (Home) 97 100 98 Trailer 13 44 26
Telephone 94 96 95 Tractor 19 52 33
Wireless Phone 3 12 7 Seed Drill 0 44 19
Satellite Receiver 47 84 63 Thresher 0 48 21
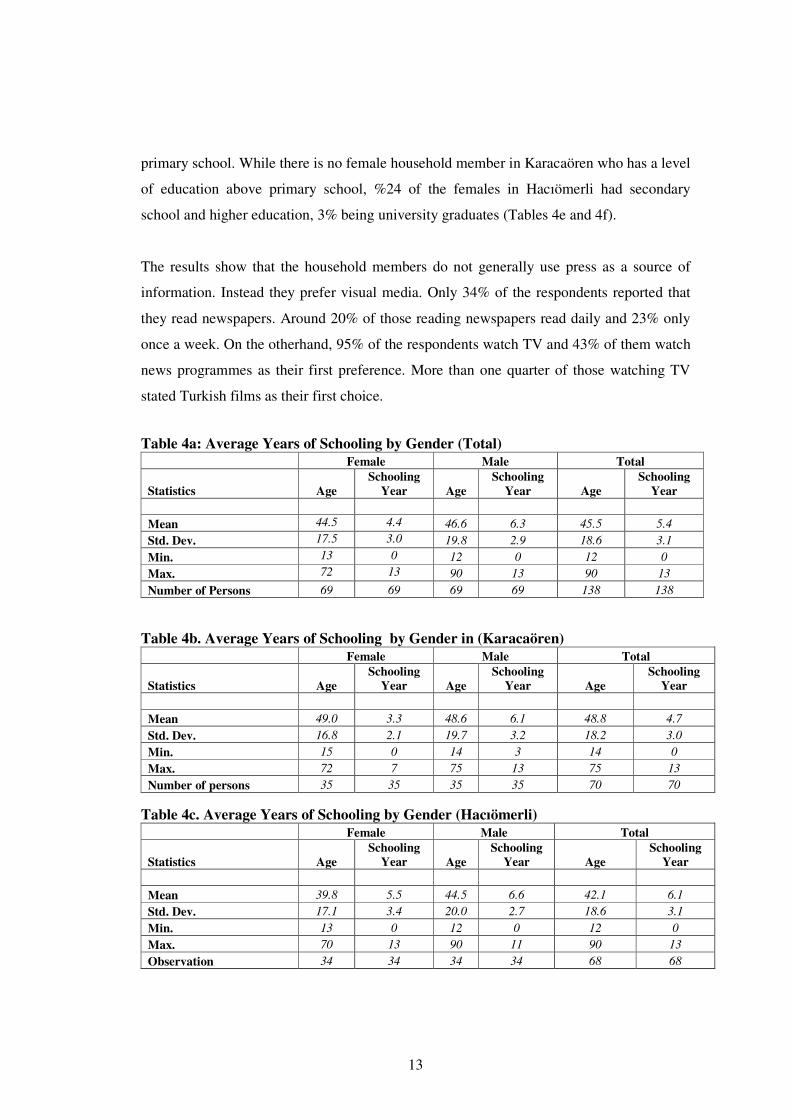
Note: K: Karacaören; H: Hacıömerli Tables 4a -4f present sex, age and schooling composition of the respondents on the overall
and in the villages of Karacaören and Hacıömerli. The average age of the respondents is
45.5. The male respondents are slightly older (46.6) than the females (44.5). The average
years of schooling for females is well below the one for males (half of the men’s years of
schooling in Karacaören ), in conformity with our prior expectations. We can also observe
the same trend from Table 4d for the distribution of schooling. Approximately 16% of total
females never attended a school whereas this figure is only around 3% for males.
Moreover, about one fifth of the female household members just read and write at basic
level. For all schooling categories, the figures for males are always above the ones
belonging to the females. On the overall half of the household members only completed
13
primary school. While there is no female household member in Karacaören who has a level
of education above primary school, %24 of the females in Hacıömerli had secondary
school and higher education, 3% being university graduates (Tables 4e and 4f).
The results show that the household members do not generally use press as a source of
information. Instead they prefer visual media. Only 34% of the respondents reported that
they read newspapers. Around 20% of those reading newspapers read daily and 23% only
once a week. On the otherhand, 95% of the respondents watch TV and 43% of them watch
news programmes as their first preference. More than one quarter of those watching TV
stated Turkish films as their first choice.
Table 4a: Average Years of Schooling by Gender (Total) Female Male Total
Statistics Age Schooling
Year Age Schooling
Year Age Schooling
Year Mean 44.5 4.4 46.6 6.3 45.5 5.4 Std. Dev. 17.5 3.0 19.8 2.9 18.6 3.1 Min. 13 0 12 0 12 0 Max. 72 13 90 13 90 13 Number of Persons 69 69 69 69 138 138
Table 4b. Average Years of Schooling by Gender in (Karacaören)
Female Male Total
Statistics Age Schooling
Year Age Schooling
Year Age Schooling
Year Mean 49.0 3.3 48.6 6.1 48.8 4.7 Std. Dev. 16.8 2.1 19.7 3.2 18.2 3.0 Min. 15 0 14 3 14 0 Max. 72 7 75 13 75 13 Number of persons 35 35 35 35 70 70
Table 4c. Average Years of Schooling by Gender (Hacıömerli)
Female Male Total
Statistics Age Schooling
Year Age Schooling
Year Age Schooling
Year
Mean 39.8 5.5 44.5 6.6 42.1 6.1 Std. Dev. 17.1 3.4 20.0 2.7 18.6 3.1 Min. 13 0 12 0 12 0 Max. 70 13 90 11 90 13 Observation 34 34 34 34 68 68

14
Table 4d: Schooling Profiles (Total) Percentage Schooling Grade Female Male Total No Schooling 15.9 2.9 9.4 Only Read & Write 20.3 8.7 14.5 Primary School 52.2 52.2 52.2 Secondary School 5.8 21.7 13.8 Public High School 2.9 5.8 4.3 Technical School 1.4 7.2 4.3 University 1.4 1.4 1.4
Table 4e: Schooling Profiles (Karacaören)
Percentage Schooling Grade Female Male Total No Schooling 14.3 0.0 7.1 Only Read & Write 40.7 17.1 28.6 Primary School 45.7 54.3 50.0 Secondary School 0.0 11.4 5.7 Public High School 0.0 8.6 4.3 Technical School 0.0 5.7 2.9 University 0.0 2.9 1.4
Table 4f. Schooling Profile (Haciömerli)
Percentage Schooling Grade Female Male Total No Schooling 17.6 5.9 11.8 Only Read & Write 0.0 0.0 0.0 Primary School 58.8 50.0 54.4 Secondary School 11.8 32.4 22.1 Public High School 5.9 2.9 4.4 Technical School 2.9 8.8 5.9 University 2.9 0.0 1.5
In summary, the socio-economic characteristic of households can be summarized as
follows:
• Average household size is 3.5 and the average number of workers is 1.4.
• Dominant livestock activities are cattle, sheep, and poultry.
• The main agricultural products are barley, wheat and chickpeas.
• Both land and livestock ownerships are unequally distributed
• Males are more educated than females.
• Main information channel is visual media.
15
3.3 Findings on Time Use Patterns
In this section, we turn our focus to the time use patterns of household and their
relationship with the socio-economic characteristics of the households.
The study classifies activities taking place during a given period as agricultural economic
activities, non-agricultural economic activities, activities for personal development, and
other activities. A detailed list of these activities is presented in Annex A. This
classification of activities is used to derive the descriptive statistics and also for testing the
differences in time use patterns by socioeconomic characteristics of household members.
The differences in time use patterns are tested using one-way ANOVA analysis for sex,
age and education. Furthermore, differences between the villages for a given day as well as
differences between bazaar days and ordinary days for a given village are also tested. The
aggregated tables presented below are constructed by employing all the observations from
the two villages and treating each visit as an independent observation.2
Figure 2 illustrates the average time use patterns for males, females and the total. On the
average, the villagers spend over half of their non-sleeping time on non-economic
activities including personal development. The time spent on agricultural and non-
agricultural economic activities is about the same and constitute little less than half of their
time spent. The males on the average spend more time on all activities than females except
for personal development which is contrary to our expectations regarding the schooling by
gender.
Table 5 presents the average times devoted to different activities by gender and the day
(bazaar or ordinary). As it is evident from this table, there are no significant differences for
average times spend on different activities between the days if gender groups are treated
individually. The only exception is non-agricultural economic activities for females. In the
case of females, there are statistically significant differences for mean time spent on non-
agricultural economic activities between the two days in which the activity is realized.
However, once the gender groups are aggregated the results change. The last column of the
2 The detailed ANOVA tests and descriptive statistics for each activity, for each month, in different villages, for different days are available from the authors upon request.

16
table indicates that there are significant differences in average time devoted to both
agricultural and non-agricultural economic activities between an ordinary and bazaar day.
Figure 2: Summary of Time Use Patterns by Gender and Activity
0
200
400
600
800
1000
1200
1400
Min
utes
Male Female Total Male Female Total
Bazaar Day Ordinary Day
TIME USE BY GENDER AND ACTIVITY
PersonalDevelopmentActivities
Non-EconomicActivities
Non-AgriculturalEconomicActivities
AgriculturalEconomicActivities
0%
20%
40%
60%
80%
100%
%
Male Female Total Male Female Total
Bazaar Day Ordinary Day
TIME USE BY GENDER AND ACTIVITY
PersonalDevelopmentActivities
Non-EconomicActivities
Non-AgriculturalEconomicActivities
AgriculturalEconomicActivities
Table 6 introduces average time spent on different activities by gender and age groups. For
all age intervals, average time spend on activities is higher for males, apart from “less than
25” and “more than 50” age groups for non-agricultural economic activities. For males,
there are statistically significant differences in average time spent on all activities by age
groups. On the other hand, the situation is slightly different for females. We do not observe
any statistically significant differences between age groups in the case of agricultural
economic activities. In otherwords females devote their time more or less equally on the
agricultural economic activities independent of age. Finally, when all the observations are
combined, a statistically significant differences for each activity category is observed by
age groups.

17
Table 5: Average Time Devoted to Activities by Gender and Day (Bazaar or Ordinary)*
(Minutes) Male Female Total
Activities Baz
aar
Oth
er D
ay
Prob
.>F
Baz
aar
Oth
er D
ay
Prob
>F
Baz
aar
Oth
er d
ay
Prob
>F
Agricultural Economic Activities 363 416 0.14 227 265 0.13 288 332 0.05 Non-Agricultural Economic Activities 322 315 0.89 300 252 0.02 309 272 0.09 Non-Economic Activities 487 490 0.92 418 424 0.77 452 457 0.80 Personal Development Activities 90 120 0.90 240 238 0.99 215 221 0.94 *Prob>F column reports the probability values that there is no differences in means. Hence, a 0.00 value implies that the means are not equal statistically. Note: Averages are based on the persons reporting that activity and the numbers of activities in the groups vary.
Table 6: Average Time Devoted to Activities by Gender and Age Groups* (Minutes)
Male Female Total
Activities 25-4
9
<25
>50
Prob
>F
25-4
9
<25
>50
Prob
>F
25-4
9
<25
>50
Prob
>F
Agricultural Economic Activities 423 447 339 0.04 263 257 225 0.34 333 350 276 0.02 Non-Agricultural Economic Activities 419 297 231 0.00 295 301 240 0.03 341 300 236 0.00 Non-Economic Activities 396 404 601 0.00 396 356 486 0.00 396 374 548 0.00 Personal Development Activities 105 239 218 *Prob>F column reports the probability values that there is no differences in means. Hence, a 0.00 value implies that the means are not equal statistically. Note: Averages are based on the persons reporting that activity. and the numbers of activities in the groups vary. Next we look at the time use patterns by level of education, namely less than primary
school, primary school and more than primary school (Table 7). In all categories, except
less than primary case for non agricultural economic activities, the averages of time spent
by males are higher than those of females. In case of male education groups, we only find
statistically significant differences for non-economic activities. For females, the analysis
produces statistically significant results for non-agricultural economic and other non-
economic activities. However, when all activities are summed by gender, we notice that
there are statistically significant differences in the average time devoted to activities by
education groups except for personal development activities..

18
Table 7: Average Time Devoted to Activities by Gender and Education Groups* (Minutes)
Male Female All
Activities Les
s tha
n Pr
imar
y M
ore
than
Pr
imar
y
Prim
ary
Prob
>F
Les
s tha
n Pr
imar
y M
ore
than
Pr
imar
y
Prim
ary
Prob
>F
Les
s tha
n Pr
imar
y M
ore
than
Pr
imar
y
Prim
ary
Prob
>F
Agricultural Economic Activities 289 393 409 0.13 245 163 259 0.14 253 348 324 0.01 Non-Agricultural Economic Activities 215 334 333 0.27 241 313 286 0.05 237 325 303 0.01 Non-Economic Activities 623 415 510 0.00 447 344 429 0.01 492 394 469 0.00 Personal Development Activities 105 285 117 0.08 249 117 0.15 *Prob>F column reports the probability values that there is no differences in means. Hence, a 0.00 value implies that the means are not equal statistically. Note: Averages are based on the persons reporting that activity. and the numbers of activities in the groups vary. Furthermore, the following generalizations can be drawn from detailed results3 which are
also based on the averages of the persons reporting a specific activity:
• In Karacaören, there are statistically significant differences in the average time
spend between males and females for agricultural economic activities on the
bazaar day in October and August. Males tend to devote more time on those
activities in October and August. Only females are engaged in agricultural
economic activities on the bazaar day in May.
• In Hacıömerli, more or less the same trend is observed, but the periods of the year
change. We only observe statistically significant differences for agricultural
economic activities on the bazaar day in October and May.
• In Hacıömerli statistically significant differences in time use for agricultural
economic activities exist in October and August like in Karacaören.
• Both during the bazaar day and the ordinary day, no statistically significant
differences exist among the males or females of the two different villages, except
for non-economic activities in bazaar day in August.
____________________ 3 Detailed tables are available from the authors upon request
19
4. Concluding Remarks and Directions for Further Research
The generalizations above are based on the averages reporting the activity in questions. In
a following paper, we will consider the average time use based on the total persons in the
sample and we will try to test the following further hypothesis suggested by the findings of
this paper:
� Time use patterns change during different days of the week and months of the year:
The differences in time use patterns between the bazaar day and an ordinary day has
been clearly demonstrated by the findings of this study which are based on average
time use of the persons reporting the activity in question.
� Time use patterns change by socio-economic characteristics of the household and by
age, gender, and education of the individuals.
� Time use patterns show variations between regions both in terms of economic activities
and in terms of socio-economic characteristics.
� Time use patterns differ by the type of activity and the time use for different activities
differ by household and individual characteristics.
� Significant differences exist in the time use patterns of different genders rather than
time spent magnitudes.
� Women contrary to expectations do not spend more time in agricultural economic
activities although differentiation of men’s and women’s roles is observed in
agriculture.
To the best of our knowledge, this is the first attempt to study rural time use behavior in
Turkey. The methodology proposed in this study can be applied in the future to different
regions of Turkey to gather a larger set of time use data to draw a clearer picture of
regional differences in time use patterns together with different socio-economic
characteristics of each region. Such a study might provide valuable insights in the
formulating regional as well as national policies.

20
References
Acharya, M., and Bennett, L. 1981, “The Rural Women of Nepal. The Status of Women in
Nepal”, Vol. II: Field Studies, part 9. Tribhuvan University, Centre for Economic
Development and Administration, Kathmandu. Nepal.
Acharya M., 1999, “Time-Budget Studies for Measurement of Human Welfare”,
Integrating paid and unpaid work into national policies: Selected papers, UNDP.
Alexander, P. and Baden, S., 2000, “Glossary on Macroeconomics from a Gender
Perspective”, BRIDGE report no. 48, Brighton, U.K.: Institute of Development
Studies.
Apps, P. 2003, “Gender, Time Use and Models of the Household”, IZA Discussion Paper,
no.796.
Bachman, S.L., 2000, “A New Economics of Child Labor: Searching for Answers Behind
the Headlines”, Journal of International Affairs, 53, 545-72.
Boserup, E, 1970, Women’s Role in Economic Development, London: Allen&Unwin.
Cain, M.T., 1991, “The Activities of the Elderly in Rural Bangladesh”, Population Studies,
45, 189-202.
Collier, P., 1993, "The Impact of Adjustment on Women" in Demery, L., Ferroni M.and
Grootaert C.(eds.) Understanding the Effects of Policy Reform, The World Bank,
Washington D.C.
Deere, C.D., 1995, “What Difference Does Gender Make? Rethinking Peasant Studies”,
Feminist Economics, 1, 53-72.
Deere, C. D. and León, M., 1982, Women in Andean Agricultura: Peasant Production and
Rural Wage Employment in Colombia and Peru. Geneva: International Labour
Office.
Eikeland, S., 1999, “New Rural Productivity? Household Strategies and Rural Renewal in
Norway”, Sociologica Ruralis, 39, 359-76.
Elson, D., 1999, “Labour Markets as Gendered Institutions: Equality, Efficiency and
Empowerment”, World Development, 27, 611-27.
Guyer, J., 1991, “Female Farming in Anthropology and African History”, in M.di
Leonardo (ed.) Gender at the Crossroads of Knowledge: Feminist Anthropology in
the Postmodern Era. Berkeley: University of California Press.
Jacoby, H.G., 1993, “Shadow Wages and Peasant Family Labor Supply: An Econometric
Application to the Peruvian Sierra”, Review of Economic Studies, 60, 903-22.
Kasnako�lu, Z., Dayıo�lu, M., and Erdil, E., 1996, “Time Use and Estimation of Value of
21
Household Production”, ERC Working Papers, no. 96/07.
Kasnakoglu, Z. And Dayioglu, M., 2002, “Measuring the Value of Home Production in
Turkey” in T. Bulutay (ed.), New Developments in National Accounts , 73-97.
Kevane, M. And Wydick, B., 2001, “Social Norms and the Time Allocation of Women’s
Labor in Burkina Faso”, Review of Development Economics, 5, 199-29.
Kim J. And Zepeda L., 2004, “When the Work is Never Done: Time Allocation in US
Family Farm Households”, Feminist Eonomics, 10, 115-39.
Pagán, J.A, 1998, “Gender Differences in Labor Market Decisions in Rural Guatemala”,
Unpublished Manuscript, The University of Texas Pan-American.
Reardon, T., 1997, “Using Evidence of Household Income Diversification to Inform:Study
of the Rural Non Farm Labor Market in Africa”, World Development, 25, 735-47.
Rose, E., 2000, “Gender Bias, Credit Constraints and Time Allocation in Rural India”, The
Economic Journal, 110, 738-58.
Ruben, R. and Ruiter A. De, 2002, “Labor, Leisure and Household Income in Rural
Settlements: An Empirical Assessment in the Atlantic Zone of Costa Rica”, Leisure
Studies, 21, 201-20.
SIS, 1996, Time Use Pilot Study Report.
Stephens, L., 1991, Zapotec Women, Austin: University of Texas Press.
Thorsen, D., 2002, “’We Help our Husbands!’ Negotiating the Household Budget in Rural
Burkina Faso”, Development and Change, 33, 129-46.
Tibaijuka, A., 1994. “The Cost of Differential Gender Roles in African Agriculture: A
Case Study of Smallholder Banana-Coffee Farms in the Kagera Region, Tanzania,”
Journal of Agricultural Economics, 45, 69-81.
Turner, M.D., 2000, “Drought, Domestic Budgeting and Wealth Distribution in Sahelian
Households”, Development and Change, 31, 1009-35.
UNDP, 1995, Platform for Action, Report from the Fourth World Conference on Women,
Beijing, United Nations.
Whitehead, A, 1999, “’Lazy Men’, Time Use, and Rural Development in Zambia”, Gender
and Development, 7, 49-61.

22
ANNEX A
Classification of Activities
AGRICULTURAL ECONOMIC ACTIVITIES Land Preparation Fertilizing Sowing Planting Pruning Hoeing Chemical Application Irrigation Greenhouse Work Harvesting, Tractor Driving Fruits and Vegetables Harvesting Packaging Transporting Vegetables and Fruits Transportation of Wheat Marketing and Selling Gardening Weeding Beekeeping Animal care Grazing Animals Milking Processing Products NON-AGRICULTURAL ECONOMIC ACTIVITIES Cooking, Food Cooking Bread Washing Dishes Knitting Washing Child Care Child Training Repairing and Maintenance Shopping (Durables) Shopping ( Food and Clothing) Cleaning, Painting Construction Cutting Firewood, Preparing Fuels Fetching Water Ironing Domestic Animal and Flower Care PERSONAL DEVELOPMENT ACTIVITIES Studying OTHER NON-ECONOMIC ACTIVITIES Transportation Social Visits Religious Activities Eating Watching Television Other Cultural Activities Personal Care Daytime Sleeping