Eco-Industrial Clusters in Urban-Rural Fringe Areas - Institute ...
Upload
khangminh22Category
view
1download
0
Emergency
Food Security
Assessment
in Rural Areas
of Tajikistan
A Joint Food Security, Livelihoods, Agriculture and Nutrition Assessment
April/May 2008
WFP
FAO
UNICEF
Government of Tajikistan

Rural Tajikistan Emergency Food Security Assessment Joint Food Security, Livelihoods, Agriculture and Nutrition Assessment
April/May 2008 Page 1
ACKNOWLEDGEMENTS
This report on the Joint Food Security, Livelihoods, Agriculture and Nutrition assessment is based on the findings of a country wide household survey conducted in April 2008.
The World Food Programme is grateful to all the people who participated in the assessment, including the rural population, interviewers, and data entry operators. We express our gratitude to the Government of Tajikistan, especially the State Statistical Committee and the Ministry of Agriculture for their support in addition to our partners who provided feedback and comments throughout the process.
We would like to thank in particular the Department for International Development in the United Kingdom for the financial support to undertake this assessment.
The assessment process was managed by Agnès Dhur (WFP, Rome), Nassim Jawad (FAO Consultant) and Gregory Scarborough (UNICEF Consultant). Training, sampling and field data collection were ensured by Perrine Geniez (WFP Consultant), Cédric Charpentier (WFP, Rome), Malohat Shabanova (WFP, Tajikistan), Azam Bahorov (WFP, Tajikistan), Tolibjon Hakimov (FAO, Tajikistan) and Azam Salimov (FAO, Tajikistan). Chiara Brunelli (WFP Consultant) and Simon Renk (WFP, Rome) supported the data analysis.
Rural Tajikistan Emergency Food Security Assessment Joint Food Security, Livelihoods, Agriculture and Nutrition Assessment
April/May 2008 Page 2
TABLE OF CONTENTS
1 SUMMARY ....................................................................................................... 5
2 BACKGROUND AND OBJECTIVES OF THE ASSESSMENT............................. 11
2.1 Background .............................................................................................................................. 11
2.2 Objectives of the assessment .................................................................................................. 12
3 ASSESSMENT METHODOLOGY ..................................................................... 13
3.1 Guiding Principles..................................................................................................................... 13
3.2 Village, Key Informants, Households and Traders’ sample ..................................................... 13
3.3 Data collection .......................................................................................................................... 15
3.4 Limitations ................................................................................................................................ 16
4 MARKETS ....................................................................................................... 17
4.1 Local markets physical access and traders’ profile.................................................................. 17
4.2 Local markets food availability ................................................................................................. 17
4.3 Levels and trends of market food prices .................................................................................. 17
4.4 Main constraints to trade and Government response to high food prices................................ 20
5 HOUSEHOLD FOOD SECURITY SITUATION.................................................... 22
5.1 Analysis of household food security ......................................................................................... 22
5.2 Livelihood characteristics of the food insecure households ..................................................... 24
5.3 Coping mechanisms ................................................................................................................. 34
6 NUTRITIONAL STATUS OF CHILDREN UNDER 5 YEARS OF AGE ................... 37
6.1 Rates of malnutrition................................................................................................................. 37
6.2 Factors associated with child malnutrition................................................................................ 39
6.3 Access to nutrition programmes............................................................................................... 42
7 MAIN PROBLEMS & PRIORITIES OF HOUSEHOLDS AND KEY INFORMANTS 43
7.1 Main problems .......................................................................................................................... 43
7.2 Priorities.................................................................................................................................... 43
8 CONCLUSIONS ON THE SEVERITY OF THE NUTRITION AND FOOD SECURITY
SITUATION ..................................................................................................... 44
8.1 Summary of the situation analysis of nutrition and household food security ........................... 44
8.2 Groups most affected by food insecurity and at risk for their lives and livelihoods.................. 44
8.3 Location of the food insecure and at risk households .............................................................. 46
9 SCENARIO AND RESPONSE OPTIONS.......................................................... 50
9.1 Forecast and scenario for the next 12 months June 2008-June 2009..................................... 50
9.2 Response options in the short- and medium-term ................................................................... 51
9.3 Analysis of response options: Strengths, Weaknesses, Opportunities and Threats ............... 53
Rural Tajikistan Emergency Food Security Assessment Joint Food Security, Livelihoods, Agriculture and Nutrition Assessment
April/May 2008 Page 3
10 RECOMMENDATIONS................................................................................... 57
10.1 Immediate interventions (July-October 2008) .......................................................................... 57
10.2 Short- and medium-term interventions (November 2008-June 2009)...................................... 58
10.3 Monitoring and Evaluation........................................................................................................ 59
LIST OF FIGURES
Figure 1 – Wheat flour 1st grade real prices 2002-2008 in 5 main markets .......................................... 18
Figure 2 – Potato real prices 2002-2008 in 5 main markets ................................................................. 19
Figure 3 – Beef meat real prices 2002-2008 in 5 main markets ........................................................... 19
Figure 4 – Vegetable oil real prices 2002-2008 in 5 main markets....................................................... 20
Figure 5 – Comparison average price of wheat, beef meat, potato and oil between January and May
2002-2007 and current year (2008)....................................................................................................... 20
Figure 6 – Main reasons for not attending school in villages with problem of non attendance............. 24
Figure 7 – Household land ownership and use per zone...................................................................... 25
Figure 8 – Percentage of households owning animals ......................................................................... 28
Figure 9 – Percentage of household reporting death of an animal in the past 12 months ................... 29
Figure 10 – Main reasons for animal losses reported by farmers ......................................................... 29
Figure 11 – Main source of income of rural households in Tajikistan ................................................... 30
Figure 12 – Main interventions in place according to Key Informants .................................................. 34
Figure 13 – Coping strategies detrimental for the health and nutritional status of households members
by food security status........................................................................................................................... 35
Figure 14 – Synthesis of 5-year trend of stunting and wasting rates in Tajikistan ................................ 37
Figure 15 – Main diseases for children under 5 years of age (2 weeks before survey) ....................... 39
Figure 16 – Main reason for not taking children to health centre by food security group ..................... 40
Figure 17 – Main difficulties this year compared to last year according to households........................ 43
Figure 18 – Distribution of households according to food security status in rural areas....................... 47
Figure 19 – Classification of zones according to factors affecting nutrition, food security and livelihoods
............................................................................................................................................................... 49
LIST OF TABLES
Table 1 – Estimated losses in the agricultural production..................................................................... 26
Table 2 – Estimated losses in the animal production............................................................................ 28
Table 3 – Targeting criteria to identify food insecure households......................................................... 46
Table 4 – Estimated numbers of food insecure people by Zone and region......................................... 46
LIST OF BOXES
Box 1 – Main constraints for potato and wheat cultivation according to food security status ............... 26
Box 2 – Coping strategies more frequently associated with food insecurity ......................................... 36
Box 3 – Assessment nutritional status results and comparison with 2005/06 MICS (rural areas)........ 38

Rural Tajikistan Emergency Food Security Assessment Joint Food Security, Livelihoods, Agriculture and Nutrition Assessment
April/May 2008 Page 4
Box 4 – Association between child feeding practices and nutritional status ......................................... 41
Box 5 – Main structural and conjectural factors contributing to food insecurity in rural areas .............. 48
Box 6 – Methodology to order zones according to factors affecting nutrition, food security and
livelihoods.............................................................................................................................................. 48
LIST OF MAPS
Map 1 – Zoning rural assessment ........................................................................................................... 5
Map 2 – Severe food insecurity in rural Tajikistan................................................................................... 8
Map 3 – Overall food insecurity in rural Tajikistan................................................................................... 9
Map 4 – Representative Jamoats.......................................................................................................... 14
Map 5 – Household market dependency in pre-harvest season........................................................... 32
Map 6 – Household market dependency in post-harvest season ......................................................... 32
LIST OF ACRONYMS
CFSVA Comprehensive Food Security and Vulnerability Assessment
CFW Cash For Work
CI Chronically Ill
CIS Commonwealth of Independent States
DOTS Directly Observed Treatment, Short Course
DRD Direct Rule Districts
FFE Food For Education
FFW Food For Work
FG Focus Group
FSMS Food Security Monitoring System
GAM Global Acute Malnutrition
GBAO Gorno Badakhshan Autonomous Oblast
GCM Global Chronic Malnutrition
GDP Gross Domestic Product
GoT Government of Tajikistan
H/A Height for Age
HH Household
IMF International Monetary Fund
IPC Integrated Phase Classification
KI Key Informant
MICS Multi-Indicator Cluster Survey
MoA Ministry of Agriculture
MUAC Mid-Upper Arm Circumference
ORS Oral Re-hydration Salts
SWOT Strengths, Weaknesses, Opportunities and Threats
UNICEF United Nations Children’s Fund
W/H Weight for Height
WFP World Food Programme
WHO World Health Organisation

Rural Tajikistan Emergency Food Security Assessment Joint Food Security, Livelihoods, Agriculture and Nutrition Assessment
April/May 2008 Page 5
1 SUMMARY
Method and sources of information
The joint food security, livelihoods, agriculture and nutrition assessment was conducted at the end of April, early May 2008 and covered all rural areas in Tajikistan, divided into 19 Zones according to agro-ecological characteristics and exposure to shocks likely to affect food security (see Map 1).
Map 1 – Zoning rural assessment
In each Zone, one sub-District (jamoat) was randomly selected1, and in each jamoat 6 villages were
randomly selected. In each of the 113 villages sampled, interviews were conducted with village leaders and other key informants on access to some key services and infrastructures, main sources of food and income of the villagers, main difficulties and current responses to them. Focus group discussions with men and women separately were also organized to enquire more about seasonal patterns of food and income access, livelihood strategies and main problems.
Within each village 7 households were randomly visited and questions asked about their living conditions, food consumption, income sources, basic expenditure, and coping strategies. The weight and height of all under-5 year old children living in the households were measured to assess the nutritional status. A total of 798 households and 559 children were included. About 126 village shop-keepers and traders at the nearest local markets provided information on food supplies and demand, prices and main trade-related difficulties. Complementary information on the agricultural situation was obtained from 295 collective (Dekhan) and private farms located within the selected villages.
The multiplication of information sources enabled a comprehensive analysis and triangulation of findings. However, while some general patterns emerged at global level, large variations were observed between Zones in terms of proportions of food insecure people and malnourished children, types of livelihoods, coping strategies and main problems.
1 Jamoats randomly selected: Zone 1: Panj – Zone 2: Avzikent - Zone 5: Hiloli – Zone 9: Tanobchi- Zone 13: Yakhakyust –
Zone 17: Alga/Dombrachi/Qashot – Zone 18: Jilikul -Zone 19: Balkhobi

Rural Tajikistan Emergency Food Security Assessment Joint Food Security, Livelihoods, Agriculture and Nutrition Assessment
April/May 2008 Page 6
Furthermore, it is felt that for Gorno-Badakhshan (GBAO), the sampling approach and indicators chosen to identify food insecurity masked the level of chronic poverty observed in many of the villages scattered within this very wide region.
How many are food insecure?
The time of the assessment corresponded to the peak of the difficult season just before the winter wheat harvest. At that time, an estimated 12% of households were severely food insecure, 22% moderately food insecure, and 66% food secure. The numbers amount to almost 600,000 severely food insecure people and 1.1 million moderately food insecure.
Who are the food insecure?
While the characteristics of food insecure households differ between Zones due to diverse agro-ecological and socio-economic contexts and varying intensities of the last winter season with related damage to crops, orchards and livestock, some general features can be described.
Severely food insecure households consume a poor diet consisting of wheat or potatoes, oil and sugar, with minimal consumption of vegetables 3 days a week and minimal consumption of animal products, pulses and vegetables. This diet is unlikely to cover the energy requirements particularly of individuals with specific needs such as children, pregnant and lactating women, and does not provide the necessary minerals and vitamins for a healthy life. Almost 30% of these households rely either on self-employment or on remittances for their income. About 20% depend on agricultural wage labour, 15% on pensions/allowances and 10% on non-agricultural wage labour.
Most of the severely food insecure households are chronically food insecure, i.e., food insecure even in ‘normal’ times, but their situation was made worse by the conjunction of the harsh winter and high food and fuel prices (hence the need for immediate relief besides longer-term interventions). They typically lack assets and rely heavily on external sources for their cash income and food (gifts, borrowing, purchase on credit). They include elderly living alone and families with a small number of income-earning members who do not benefit from reliable and significant remittances. Some of these families are women-headed households.
Moderately food insecure households consume a slightly more varied diet with consumption of vegetables 5 days a week and pulses and dairy products once a week. While the quality of this diet is better, it still fails to cover the nutritional requirements of vulnerable household members, contributing to increased risk of disease and malnutrition. Almost 40% of these households obtain their main income from remittances. Less than 20% rely on self-employed activities, 14% on the sales of wheat/potato and 13% on agricultural wage labour. For this group, although difficult to ascertain, remittances are likely to be more regular and in higher amounts than for the severely food insecure.
Moderately food insecure households are a mix of:
1. Households transitorily food insecure, i.e. ‘usually’ at the brink of food insecurity and who often face difficulties with securing a proper diet throughout the year and with building assets, but whose situation deteriorated this year as a result of the negative consequences of the winter and high prices. These households may not rely much on remittances and earn an income through self-employment and wage labour. The low level of remuneration received does not enable them to withstand economic shocks, but they may be able to ‘recover’ if the difficulties do not last too long and if they can receive assistance to replenish their assets (e.g. animals) and reimburse their debts.
2. Poor households who are moderately food insecure on a chronic basis but who can benefit
from some support from migrants or close relatives. Typically they would include non-isolated families hosting elderly or chronically sick or disabled members, and families depending on Dekhan lands for their crops and income.
Food secure households consume a better quality diet including vegetables almost 6 times a week, meat 4 days a week, and dairy products and pulses once a week. Some 40% of these households also depend on remittances as their main source of income, a similar proportion as the moderately food insecure households. However, here again the level and frequency of remittances are expected
Rural Tajikistan Emergency Food Security Assessment Joint Food Security, Livelihoods, Agriculture and Nutrition Assessment
April/May 2008 Page 7
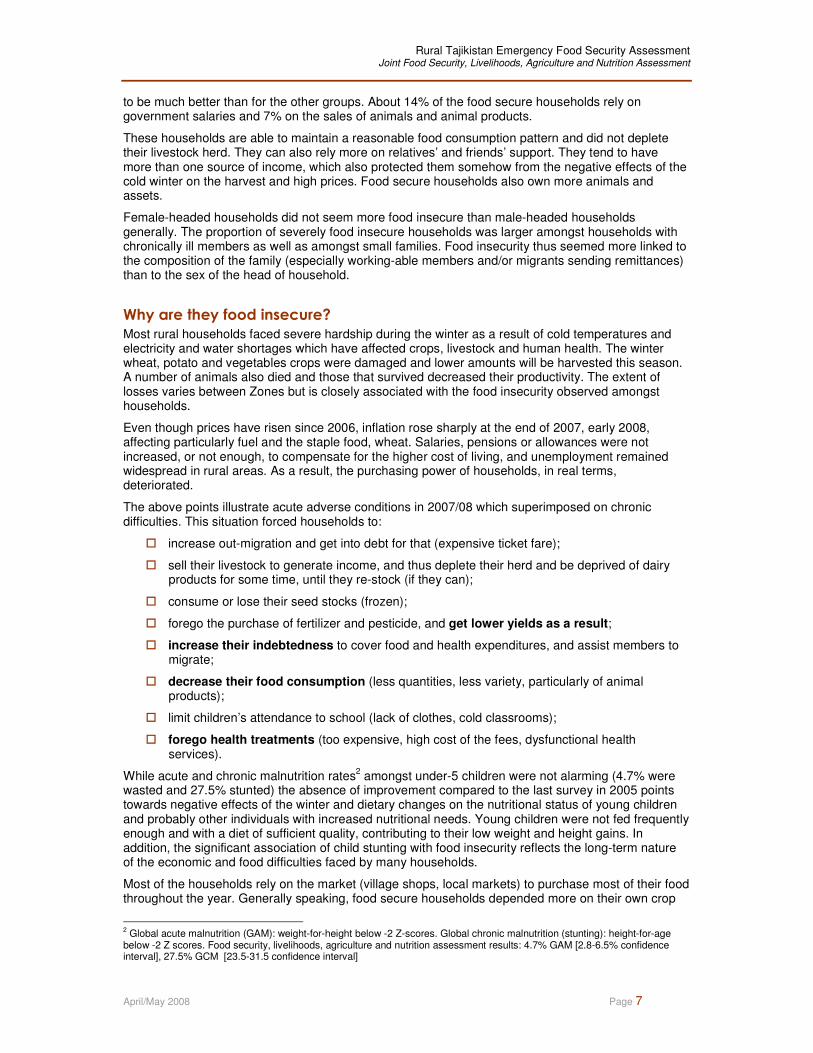
to be much better than for the other groups. About 14% of the food secure households rely on government salaries and 7% on the sales of animals and animal products.
These households are able to maintain a reasonable food consumption pattern and did not deplete their livestock herd. They can also rely more on relatives’ and friends’ support. They tend to have more than one source of income, which also protected them somehow from the negative effects of the cold winter on the harvest and high prices. Food secure households also own more animals and assets.
Female-headed households did not seem more food insecure than male-headed households generally. The proportion of severely food insecure households was larger amongst households with chronically ill members as well as amongst small families. Food insecurity thus seemed more linked to the composition of the family (especially working-able members and/or migrants sending remittances) than to the sex of the head of household.
Why are they food insecure?
Most rural households faced severe hardship during the winter as a result of cold temperatures and electricity and water shortages which have affected crops, livestock and human health. The winter wheat, potato and vegetables crops were damaged and lower amounts will be harvested this season. A number of animals also died and those that survived decreased their productivity. The extent of losses varies between Zones but is closely associated with the food insecurity observed amongst households.
Even though prices have risen since 2006, inflation rose sharply at the end of 2007, early 2008, affecting particularly fuel and the staple food, wheat. Salaries, pensions or allowances were not increased, or not enough, to compensate for the higher cost of living, and unemployment remained widespread in rural areas. As a result, the purchasing power of households, in real terms, deteriorated.
The above points illustrate acute adverse conditions in 2007/08 which superimposed on chronic difficulties. This situation forced households to:
� increase out-migration and get into debt for that (expensive ticket fare);
� sell their livestock to generate income, and thus deplete their herd and be deprived of dairy products for some time, until they re-stock (if they can);
� consume or lose their seed stocks (frozen);
� forego the purchase of fertilizer and pesticide, and get lower yields as a result;
� increase their indebtedness to cover food and health expenditures, and assist members to migrate;
� decrease their food consumption (less quantities, less variety, particularly of animal products);
� limit children’s attendance to school (lack of clothes, cold classrooms);
� forego health treatments (too expensive, high cost of the fees, dysfunctional health services).
While acute and chronic malnutrition rates2 amongst under-5 children were not alarming (4.7% were
wasted and 27.5% stunted) the absence of improvement compared to the last survey in 2005 points towards negative effects of the winter and dietary changes on the nutritional status of young children and probably other individuals with increased nutritional needs. Young children were not fed frequently enough and with a diet of sufficient quality, contributing to their low weight and height gains. In addition, the significant association of child stunting with food insecurity reflects the long-term nature of the economic and food difficulties faced by many households.
Most of the households rely on the market (village shops, local markets) to purchase most of their food throughout the year. Generally speaking, food secure households depended more on their own crop
2 Global acute malnutrition (GAM): weight-for-height below -2 Z-scores. Global chronic malnutrition (stunting): height-for-age below -2 Z scores. Food security, livelihoods, agriculture and nutrition assessment results: 4.7% GAM [2.8-6.5% confidence interval], 27.5% GCM [23.5-31.5 confidence interval]
Rural Tajikistan Emergency Food Security Assessment Joint Food Security, Livelihoods, Agriculture and Nutrition Assessment
April/May 2008 Page 8
production for their consumption (20% of their food), while food insecure households borrowed food from friends, relatives or neighbours and received food gifts to complement their market purchase and limited own food production.
The vast majority of households cannot cover their requirements with their own wheat, potato or vegetable crops. The forecast duration of the current wheat harvest for households’ own consumption is 2.5 months, slightly less than “usual” (3 months), and 3 months for the current potato harvest. While 75% of households own at least 1 or 2 cattle, less than half own sheep, goats or poultry.
As a result of low self-sufficiency, the majority of expenditures dedicated to the coverage of basic needs (food, health, energy, education, transportation) must go to food purchases (81%). However, mean food expenditures during the week preceding the survey were very low (20 somoni
3/capita/week), meaning that very few resources were left to cover non-food requirements.
Food insecure households were more likely to adopt strategies that jeopardize their nutritional status, health and future livelihoods, particularly spending entire days without eating, limiting portion size at meals and reducing number of meals and taking children out of school.
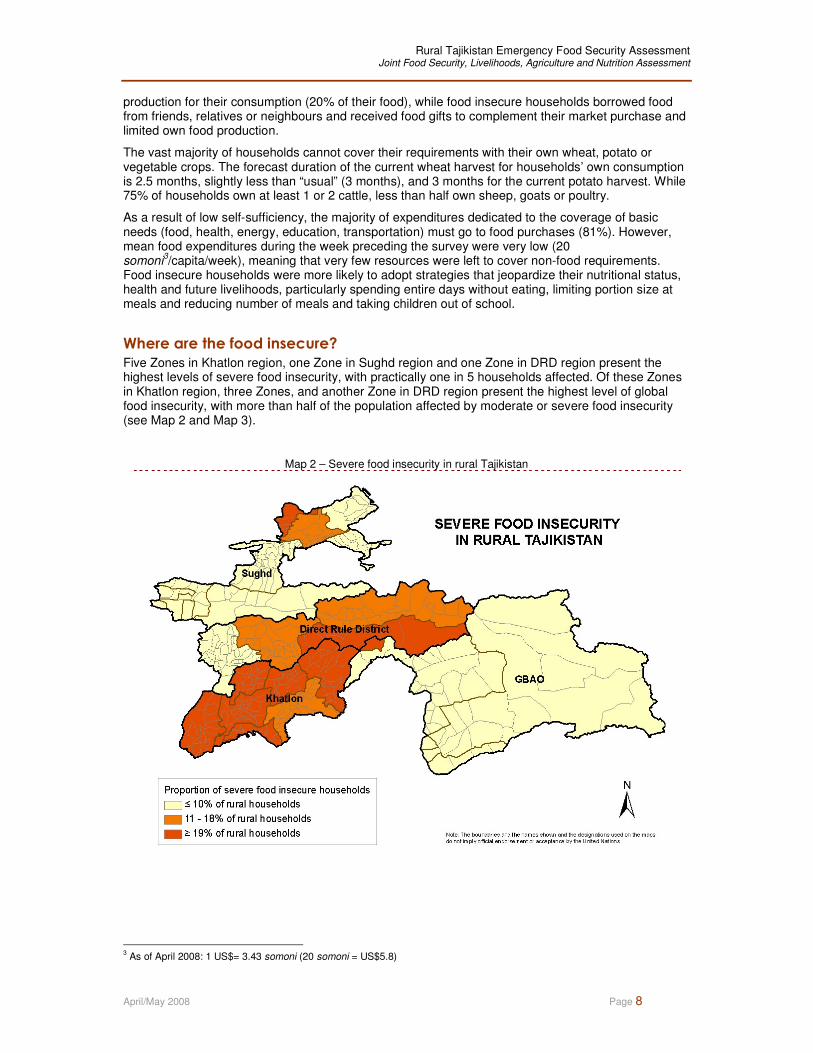
Where are the food insecure?
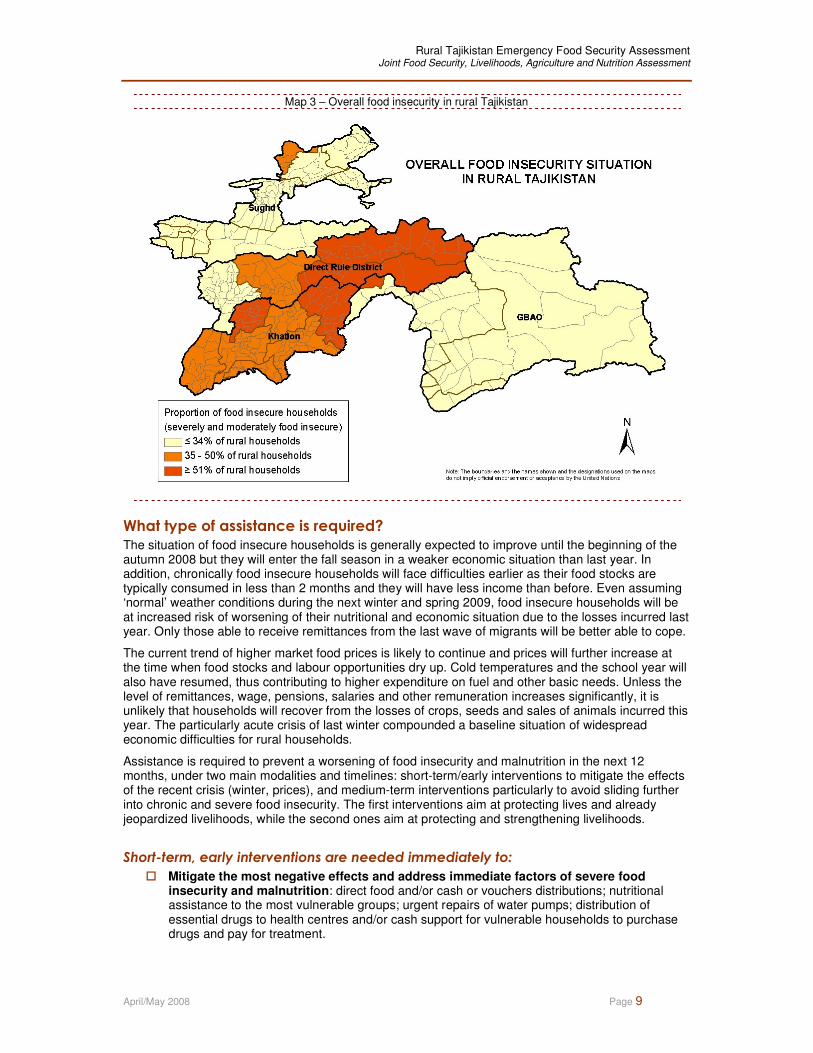
Five Zones in Khatlon region, one Zone in Sughd region and one Zone in DRD region present the highest levels of severe food insecurity, with practically one in 5 households affected. Of these Zones in Khatlon region, three Zones, and another Zone in DRD region present the highest level of global food insecurity, with more than half of the population affected by moderate or severe food insecurity (see Map 2 and Map 3).
Map 2 – Severe food insecurity in rural Tajikistan
3 As of April 2008: 1 US$= 3.43 somoni (20 somoni = US$5.8)
Rural Tajikistan Emergency Food Security Assessment Joint Food Security, Livelihoods, Agriculture and Nutrition Assessment
April/May 2008 Page 9
Map 3 – Overall food insecurity in rural Tajikistan
What type of assistance is required?
The situation of food insecure households is generally expected to improve until the beginning of the autumn 2008 but they will enter the fall season in a weaker economic situation than last year. In addition, chronically food insecure households will face difficulties earlier as their food stocks are typically consumed in less than 2 months and they will have less income than before. Even assuming ‘normal’ weather conditions during the next winter and spring 2009, food insecure households will be at increased risk of worsening of their nutritional and economic situation due to the losses incurred last year. Only those able to receive remittances from the last wave of migrants will be better able to cope.
The current trend of higher market food prices is likely to continue and prices will further increase at the time when food stocks and labour opportunities dry up. Cold temperatures and the school year will also have resumed, thus contributing to higher expenditure on fuel and other basic needs. Unless the level of remittances, wage, pensions, salaries and other remuneration increases significantly, it is unlikely that households will recover from the losses of crops, seeds and sales of animals incurred this year. The particularly acute crisis of last winter compounded a baseline situation of widespread economic difficulties for rural households.
Assistance is required to prevent a worsening of food insecurity and malnutrition in the next 12 months, under two main modalities and timelines: short-term/early interventions to mitigate the effects of the recent crisis (winter, prices), and medium-term interventions particularly to avoid sliding further into chronic and severe food insecurity. The first interventions aim at protecting lives and already jeopardized livelihoods, while the second ones aim at protecting and strengthening livelihoods.
Short-term, early interventions are needed immediately to:
� Mitigate the most negative effects and address immediate factors of severe food insecurity and malnutrition: direct food and/or cash or vouchers distributions; nutritional assistance to the most vulnerable groups; urgent repairs of water pumps; distribution of essential drugs to health centres and/or cash support for vulnerable households to purchase drugs and pay for treatment.
Rural Tajikistan Emergency Food Security Assessment Joint Food Security, Livelihoods, Agriculture and Nutrition Assessment
April/May 2008 Page 10
� Prepare for the next winter season to avoid shortages and cuts of fuel, electricity, water and food for the most food insecure, as well as disruption of school and health facilities: provision and/or cash support for the procurement of fuel and build up of fuel stocks at village level; repair/extension of electricity networks; repairs/enhancement of school and health centre buildings to minimize cold and ensure continuous functioning; provision of drugs to health centres.
Medium-term interventions are required at the same time to:
� Encourage planting for the next winter wheat, potato and vegetables season: distribution or vouchers for farmers to procure quality seeds, fertilizer, and agricultural machinery services and fuel; repair of irrigation systems, possibly using food- and/or cash-for-work modalities; protecting seeds from being consumed by distributing a food ration at the same time.
� Set up or strengthen safety nets for chronically food insecure households who cannot ensure an adequate food access even in normal times: direct food, cash, vouchers or a combination of food and cash distributions; this assistance may be conditional to attendance at school or at health services in some cases; increased pensions and allowances (particularly to match the inflation rates);
� Facilitate access to, and retain children at school: school feeding programmes, including a ration for the whole household and assistance for teachers as well; repairs and winterization of school buildings, possibly using food- or cash-for-work modalities; cash or winter clothes distribution to families with a large number of school-age children.
� Improve access to, and functioning of health centres: repairs and winterization of health facilities, possibly using food- or cash-for-work modalities; provision of essential drugs; cash or vouchers for the poorest households and individuals to pay for drugs, treatment and transportation to health facilities.
� Improve access to, and performance of local markets. Both traders and customers can be targeted directly and indirectly through: credit and/or vouchers for fuel and transportation of commodities, and/or support to create associations that can pool the transport and storage of goods; repair of roads and bridges, possibly using food- or cash-for-work modalities; cash and/or vouchers to households to restore the demand and subsequent supply response by traders.
In addition, the nutritional, food security and agricultural situation needs to be closely monitored to adjust the recommended interventions as appropriate. A formal food security and nutrition monitoring system, integrating information on climatic conditions, agriculture, livestock, markets, food consumption, health and nutrition would fit this purpose.
Rural Tajikistan Emergency Food Security Assessment Joint Food Security, Livelihoods, Agriculture and Nutrition Assessment
April/May 2008 Page 11
2 BACKGROUND AND OBJECTIVES OF THE ASSESSMENT
2.1 Background
Tajikistan is the poorest country in Central Asia, with 64% of the population living below the poverty line of $2/person/day
4. It is a country of diverse geographic and ecological systems and accompanying
production systems. This landlocked country ranks 122nd of 177 on the UN Human Development Index. The unofficial unemployment rate is estimated at 33%, and remittances from labour migration are a major source of household income. Tajikistan has also, compared to other central Asian countries, the highest numbers of female-headed households due to this migration. This factor exacerbates already existing gender inequalities and puts additional burdens on women who are also disproportionately affected by poverty and discrimination.
Aside from labour, the country has relatively few exports (the most significant being cotton and aluminium), limited domestic industry and is a net food importer. The country was wrecked by a civil war which began shortly after independence in 1991 and ended in 1997. Relief programmes that had become a semi-permanent part of assistance to Tajikistan post-independence began to phase out in 2006-2007, and assistance efforts have increasingly shifted to long-term development. At the same time, natural disasters such as earthquakes, landslides, mudflows, avalanches, floods and other disasters happen annually in Tajikistan.
In early January 2007, heavy snowfall and avalanches blocked several areas of the country, limiting access and causing several casualties, while the cold spell throughout the country during most of January, reached temperatures of -15°C during daytime and -25°C at night. An energy crisis started in December 2007 and has been progressively worsening since, whereby most rural areas have been cut off from electricity supplies. As of June 2008, the Nurek hydroelectric dam had not regained the capacity necessary to cover electricity needs for a large part of the country and most rural areas were still left without power for lighting and water supply systems. Energy supplies from neighbouring Kyrgyzstan and Uzbekistan have been suppressed, resulting in further shortages of gas and electricity, with a knock-on effect on food supplies and prices.
The country has also experienced a variety of economic and social shocks since 2006 that have caused severe setback to the agricultural sector, reducing both the use of land and its productivity particularly in rural mountainous areas with limited or no access to irrigation systems. Nationally, the absence of adequate land, water management and sustainable use of the natural resources represent some of the major challenges in the agriculture sector. Lack of appropriate agriculture sector policies and strategies and unresolved land reform issues have further contributed to the current setbacks.
The food security situation of rural populations markedly deteriorated due to rising fuel costs, which have in turn led to higher transportation and food costs across the country. Continued drought in the spring and summer of 2007, as well as a locust invasion, further stretched the capacities of rural households and resulted in higher than usual labour migration rates in search for labour. Since the end of 2007 and the beginning of 2008, the prices of oil, bread and wheat-based products doubled. Prices remain high despite several government efforts to stabilize them.
The UN launched a Flash Appeal for Tajikistan5 in February 2008 in response to the crisis. The Appeal
recommended an increase in food supplies through direct assistance and a support to economic means to acquire food as well as crop and animal production.
In this context, a joint assessment reviewing the food security, agriculture and nutritional situation was undertaken by WFP, FAO, UNICEF and the Government of Tajikistan. Findings were expected to guide short- and medium-term interventions to alleviate the impact of low temperatures, agricultural damage and unaffordable prices of food and fuel.
4 In July 2008 the World Bank presented the updated poverty data following the Tajikistan Living Standard Survey in November
2007. The preliminary results indicate that 53% of the population lives below the poverty line of US$ 1.33 per day whilst food poverty at US$ 0.85 per day is affecting 17% of the population 5 To be found at http://www.untj.org/files/React/UN_Appeal_TJ_FINAL_ENG.pdf
Rural Tajikistan Emergency Food Security Assessment Joint Food Security, Livelihoods, Agriculture and Nutrition Assessment
April/May 2008 Page 12
2.2 Objectives of the assessment
The main objective was to update the knowledge base on the food security, livelihoods, agriculture and nutrition situation in rural Tajikistan at household level in order to better inform priorities and programming decisions on food and non-food assistance, taking into account the recent natural and economic shocks experienced by the population.
Specific objectives included:
� Describe the profile of households and individuals affected by food insecurity and/or malnutrition, including their location and socio-economic characteristics;
� Elucidate the causes of food insecurity and malnutrition, including a distinction between chronic and transitory food insecurity;
� Identify geographical areas of higher prevalence of food insecurity and/or malnutrition and their main characteristics;
� Forecast the evolution of the food security and nutrition situation in the next 12-24 months, and describe the groups most likely to be food insecure and/or malnourished in that period who would need assistance;
� Review current and planned food, agricultural and other interventions and unmet needs;
� Recommend food, agriculture and non-food interventions for the next 12-24 months to meet unmet needs, including indications of the type of interventions, amounts/contents (as much as possible), and targeting criteria;
� Suggest community, household, market and other indicators that should be monitored to follow-up the evolution of the food security, agriculture and nutrition situation.
Rural Tajikistan Emergency Food Security Assessment Joint Food Security, Livelihoods, Agriculture and Nutrition Assessment
April/May 2008 Page 13
3 ASSESSMENT METHODOLOGY
3.1 Guiding Principles
The joint rural food security, livelihoods, agriculture and nutrition assessment was designed in such a way as to:
� cover the whole country;
� focus the analysis on households, communities and local markets (rather than macro-economic issues);
� follow a purposive sampling approach based on well-defined criteria that enable valid extrapolation of results at geographical levels relevant for decision-making and programming (i.e. sub-District jamoat level); the approach privileged the estimation of varying levels of severity for comparison and targeting purposes, and the understanding of processes contributing to food insecurity, over obtaining statistically representative data;
� pay particular attention to the relationship between household food insecurity and (i) child malnutrition (chronic and acute), and (ii) access and performance of local markets.
A combination of purposive and random sampling was applied. Secondary data review enabled the identification of Zones as homogeneous as possible from a food security and agriculture perspective. Primary data collection was done in randomly selected sub-Districts from these Zones. Within each sub-District, multiple sources of information, data collection techniques (interviews, discussions) and tools (questionnaires, checklists) were used to make sure that the data collected was reliable and reflected the true situation on the ground.
3.2 Village, Key Informants, Households and Traders’ sample
3.2.1 Zoning
Zoning was done to regroup sub-districts (jamoats) into areas representing homogeneous characteristics. A total of 19 homogeneous Zones covering the whole country were defined using four key indicators/information that influence livelihoods in Tajikistan: agro-climatic characteristics, elevation, slopes and level of flood risk. The four criteria were overlapped on a map to define the zones limits
6.
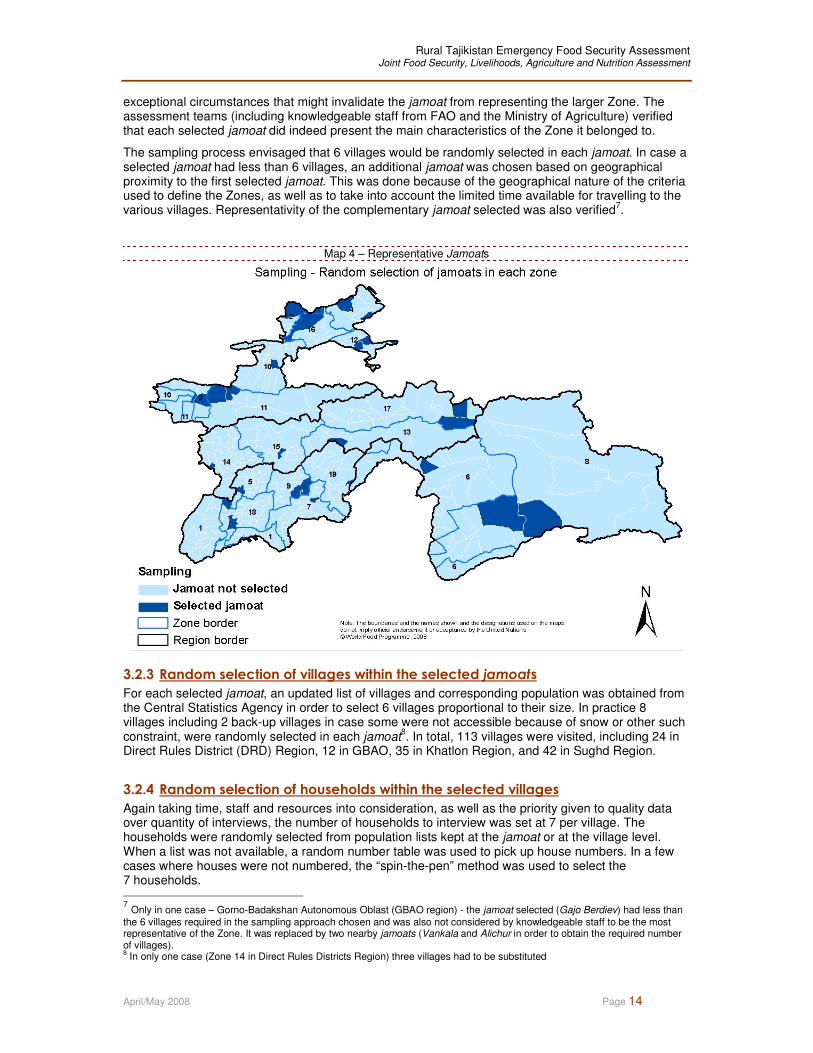
3.2.2 Random selection of sub-districts (jamoats) by zone
Because time and resources were not sufficient to visit every jamoat in each Zone, and because the process of defining the Zones assumed that all the jamoats within each Zone were homogeneous, it was decided to randomly select one jamoat per Zone to collect the household, village and market information. The steps followed were:
Random selection of one jamoat by Zone
In each of the 19 Zones defined, one jamoat was randomly selected to represent the Zone. There was no adjustment for the population size of the jamoats, each one had an equal chance to be selected. Map 4 on the next page shows the selected jamoat.
Verification of the representativity of the selected jamoat
Because of the “qualitative” nature of the criteria used to define the Zone and re-group the jamoats, it was felt important to verify the characteristics of the randomly selected jamoat, to rule out any
6 Sources of information included: • Agro climatic map (source FAO, based on Russian map of Tajikistan from 1977) • Slope and elevation overlaid maps leading to the Vertical classification (source WFP Integrated Phase Classification report,
March 2008) • Flood risk map (source Tajikistan Shelter/Non Food Items cluster, 2008)
Rural Tajikistan Emergency Food Security Assessment Joint Food Security, Livelihoods, Agriculture and Nutrition Assessment
April/May 2008 Page 14
exceptional circumstances that might invalidate the jamoat from representing the larger Zone. The assessment teams (including knowledgeable staff from FAO and the Ministry of Agriculture) verified that each selected jamoat did indeed present the main characteristics of the Zone it belonged to.
The sampling process envisaged that 6 villages would be randomly selected in each jamoat. In case a selected jamoat had less than 6 villages, an additional jamoat was chosen based on geographical proximity to the first selected jamoat. This was done because of the geographical nature of the criteria used to define the Zones, as well as to take into account the limited time available for travelling to the various villages. Representativity of the complementary jamoat selected was also verified
7.
Map 4 – Representative Jamoats
3.2.3 Random selection of villages within the selected jamoats
For each selected jamoat, an updated list of villages and corresponding population was obtained from the Central Statistics Agency in order to select 6 villages proportional to their size. In practice 8 villages including 2 back-up villages in case some were not accessible because of snow or other such constraint, were randomly selected in each jamoat
8. In total, 113 villages were visited, including 24 in
Direct Rules District (DRD) Region, 12 in GBAO, 35 in Khatlon Region, and 42 in Sughd Region.
3.2.4 Random selection of households within the selected villages
Again taking time, staff and resources into consideration, as well as the priority given to quality data over quantity of interviews, the number of households to interview was set at 7 per village. The households were randomly selected from population lists kept at the jamoat or at the village level. When a list was not available, a random number table was used to pick up house numbers. In a few cases where houses were not numbered, the “spin-the-pen” method was used to select the 7 households. 7 Only in one case – Gorno-Badakshan Autonomous Oblast (GBAO region) - the jamoat selected (Gajo Berdiev) had less than
the 6 villages required in the sampling approach chosen and was also not considered by knowledgeable staff to be the most representative of the Zone. It was replaced by two nearby jamoats (Vankala and Alichur in order to obtain the required number of villages). 8 In only one case (Zone 14 in Direct Rules Districts Region) three villages had to be substituted

Rural Tajikistan Emergency Food Security Assessment Joint Food Security, Livelihoods, Agriculture and Nutrition Assessment
April/May 2008 Page 15
3.3 Data collection
Enumerators from the Ministry of Agriculture, State Statistical Committee, FAO and WFP were trained during 5 days (in English with simultaneous translation in Tajik) including 2 field pilots in villages close to Dushanbe. Eight teams of 5 enumerators were formed to cover the 4 Regions of DRD, GBAO, Khatlon and Sughd. In each team, two enumerators administered the household interviews (including specific training on anthropometric measurements for nutritional assessments), two enumerators interviewed the village leader and led Focus Group discussions, one enumerator visited village shops and the nearest local market, and one enumerator visited the nearest Dekhan farm and collected other agricultural data from village informants.
The household survey, village Key Informants’ survey, village Focus Group discussions, traders’ survey and Dekhan farm interviews (see below) aimed at complementing each other and to enable triangulation (cross-checks), in order to control as much as possible potential bias and lack of statistical representativity inherent in the sampling approach that had been adopted (zoning based on quantitative and qualitative data, limited number of households interviewed).
3.3.1 Household survey
A standard questionnaire covering some demographic information, crop and animal productions, income and food sources, food consumption and expenditures, coping strategies and assistance received was developed (in English, translated in Tajik – see Annexes 2a and 2f). The nutritional status of all under-5 children living in the selected households was also measured by taking height and weight measurements. Specific questions on the child’s health and food consumption were also asked to the mother or child care-taker. A total of 798 household questionnaires (including 168 in DRD, 84 in GBAO, 252 in Khatlon and 294 in Sughd) were obtained, including valid anthropometric data on 549 under-5 children.
3.3.2 Village-level Key Informants interviews
In each village, a short questionnaire was administered to the village head to enquire about main sources of income and food of the villagers, access to primary school, health services and markets, market food availability, and main difficulties, typical sources of food, coping strategies (see Annexes 2a and 2f). A total of 113 “village-forms” were filled in.
3.3.3 Village Focus Group discussions (FGDs)
Discussions took place with groups of 6-12 men in half of the villages, and 6-12 women in the other half. Participants were selected through the village leader and were expected to “represent” the average households in the village. A checklist of topics on seasonal sources of food and income, labour opportunities, market food availability and prices, main difficulties and coping strategies, social assistance and networks, health and education was used to guide the discussions (see Annexes 2e and 2k). A total of 113 FGDs were transcribed.
3.3.4 Traders and shop-keepers interviews
To add and check information obtained on food sources, availability and prices, a dedicated enumerator visited one or two shops in each village as well as the nearest local market. A questionnaire was used to collect data on food and prices, changes in supply and demand, access to credit, main trade-related problems, and capacity to supply more food if demand was increased (see Annexes 2d and 2j). A total of 126 shop-keepers/traders were interviewed, including 38 in DRD, 29 in GBAO, 109 in Khatlon and 60 in Sughd.
3.3.5 Dekhan farm interviews
A dedicated enumerator in each team visited the Dekhan farms located within or closest to the selected village and collected information on crops, livestock, fisheries, tree nurseries, debts and inputs, using a specifically developed questionnaire (see Annexes 2b and 2g). In some cases, private farmers were also interviewed. A total of 295 Dekhan and private farms were surveyed.
Rural Tajikistan Emergency Food Security Assessment Joint Food Security, Livelihoods, Agriculture and Nutrition Assessment
April/May 2008 Page 16
3.4 Limitations
� Although the selection of the jamoats and households was random, the initial zoning of the rural areas was based on qualitative criteria and judgement. For this reason, the homogeneity and comparability of each of the jamoats within each Zone cannot be fully guaranteed. Extrapolation of the data of the jamoat sampled to the whole Zone must thus be done with caution.
� A small number of villages (6) and households (42) were randomly selected in each jamoat. Because of this small sample, some results present a large margin of variation and cannot be deemed representative. For example, when none of the households presents a given characteristic in a jamoat, this may be due to the small number of household interviews rather than reflecting the total absence of the characteristic in any household living in the whole jamoat or in the whole Zone. To avoid drawing misleading conclusions, each of the various pieces of information obtained from the different sources (households, Key Informants, Focus Group discussions, traders and farm responsible) and secondary data were carefully used in order to form as complete a picture as possible for each jamoat and each Zone, without relying exclusively on any one of them.
� Leading and taking notes during Focus Group discussions were not familiar tasks for most enumerators. Although intensive training and two field pilots took place, the discussions were not always conducted as openly as they should have been and could have provided richer information.

Rural Tajikistan Emergency Food Security Assessment Joint Food Security, Livelihoods, Agriculture and Nutrition Assessment
April/May 2008 Page 17
4 MARKETS
4.1 Local markets physical access and traders’ profile
Some 68% of village Key Informants (KIs) indicated that there was a daily market in the village. A weekly market was available in the rest of the villages. More than half of the traders interviewed were serving more than 1 village. Some Focus Group participants mentioned difficulties during the past winter to reach markets, due to road cuts (snow, avalanches) and increased transportation fares, however generally speaking physical access to markets did not seem a concern.
In GBAO almost half of the traders interviewed were women, one third were women amongst interviewed traders in Sughd region and about 18% were women in DRD and Khatlon regions. Slightly less than half of the traders had other income generating activities besides trade, such as government salary (22%) and pensions (8%). The household survey found a low proportion of households relying on trade as their main (first) source of income. However, when petty trade was a second source of income, its contribution to total income was significant (about 40%). Some Focus Group participants requested support with credit (at low interest rate) to launch small businesses, thus identifying this type of activity as a potentially valuable source of income. However it is also known that a number of structural constraints would need to be addressed to make small business a viable activity.
4.2 Local markets food availability
Most of the traders/shop-keepers were selling sugar, oil and processed foods. About half were selling imported wheat and 44% potatoes. Less than 25% traded bread, milk or meat, indicating that households who consumed them rather accessed them from their own production. The main source of commodities sold was other traders (generally bigger ones), very little was purchased from local producers (and very few producers were indeed selling). This reflects the general under-development of business in the country.
Some food commodities are typically not available, or in small quantities, in local rural markets at certain periods of the year. Generally speaking, almost 60% of KIs indicated that local wheat was in short supply in winter. About half KIs mentioned shortages of milk/dairy products throughout the year and around 30% KIs mentioned shortages of fruits and vegetables in winter. However, shortage of commodities and periods varied quite significantly between Zones (see Annex 4, Table 3). One Zone in GBAO region, one in Khatlon region and one in Sughd region clearly faced supply difficulties regularly and more than other areas.
The current average volume of commodities sold was 2,330 kg per week. Assuming a rough average of 0.6 kg of various food commodities consumed per capita per day and an average family size of 7.5 persons (i.e. 31.5 kg per week), the volume sold would approximately correspond to 74 consumers per week per trader, reflecting a rather low coverage and trade intensity.
According to traders, the volume sold currently was 25% less than ‘usual’, as a result of lower households’ demand occasioned by the high food prices. Decreased demand affected imported wheat more than other commodities (minus 31% of sales in value compared to ‘usually’ at this time of the year). None of the households interviewed nor Focus Group participants mentioned food availability as a constraint to their consumption. Rather, high prices limited their access (see section 7).
4.3 Levels and trends of market food prices
Some inaccuracies were noted in the prices collected on local markets during the assessments and the data could not be used. However, WFP has monitored food prices on 5 main markets throughout the country since 2002. The graphs below illustrate the sharp increase in market nominal prices since the end of 2006. Consumer prices
9 increased by 11.9% in 2006, and inflation rose sharply since
September 2007 (6.3% that month, 10.2% for food items), representing an increase of 18% compared to September 2006. However, price increases have taken place earlier for some commodities and seasonal variations also occur (not visible on the graphs):
9 IMF, International Financial Statistics - Economic Intelligence Unit Tajikistan Country Profile, 2007

Rural Tajikistan Emergency Food Security Assessment Joint Food Security, Livelihoods, Agriculture and Nutrition Assessment
April/May 2008 Page 18
� wheat flour (1st grade) prices increased first in 2003, then sharply at the end of 2006 until now;
between 2006 and 2008, bread real prices increased by 39% and wheat flour by 37%;
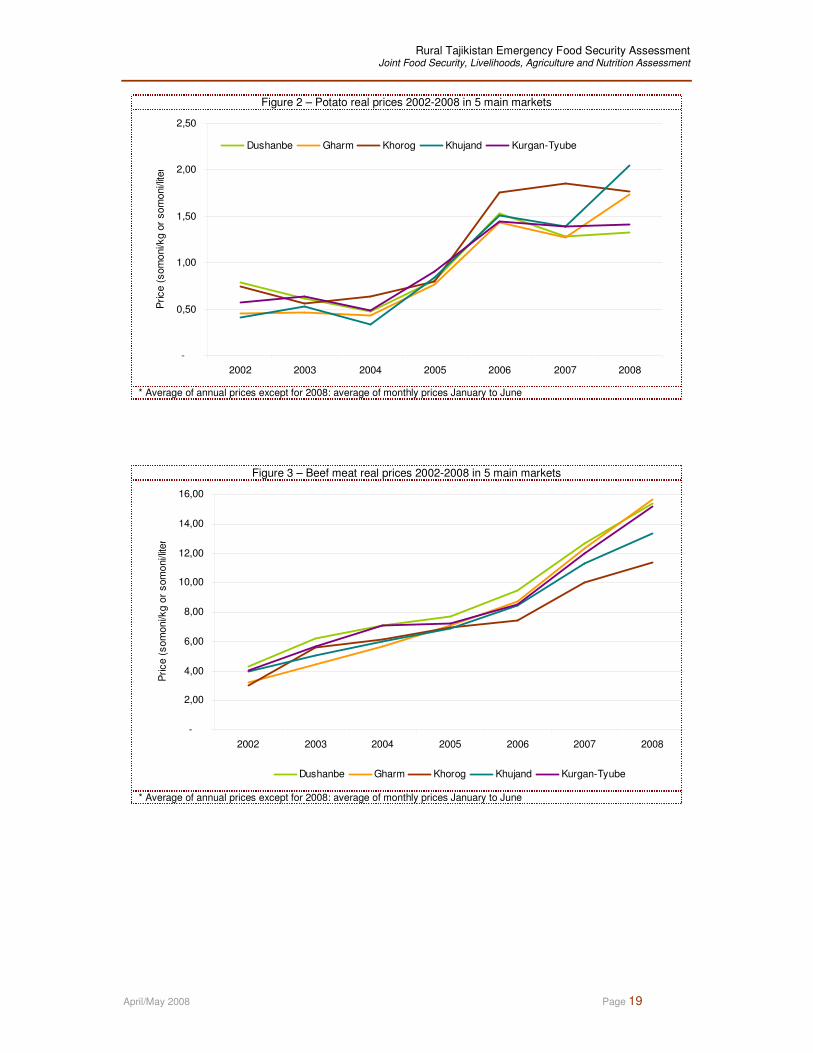
� potato nominal prices increased since 2004, with a peak in 2006 explained by the poor harvest that year; changes in potato real prices are difficult to interpret as they are very much related to seasonal variations in the volumes supplied to the markets (i.e. harvest times), which blur the effect of other possible factors on potato prices;
� meat prices increased beginning the end of 2006 by 26-28% in real terms (both chicken and beef);
� oil real prices rose by 51% between 2006 and 2008;
� the only exception to the trends was sugar, with a decrease in real prices of 22% between 2006 and 2008; international prices for sugar also tended to decrease in 2007-08 compared to other commodities.
Prices are typically higher in Khorog due to higher transportation costs. A Market Profile10
conducted by WFP in 2005 indicated that, if anything, prices on local markets would be expected to be higher given the additional transportation costs from urban markets to rural, often isolated, areas.
Figure 1 – Wheat flour 1st grade real prices 2002-2008 in 5 main markets
-
0,50
1,00
1,50
2,00
2,50
3,00
2002 2003 2004 2005 2006 2007 2008*
Price (
som
oni/k
g o
r som
oni/l
iter)
Dushanbe Khujand Khorog Kurgan Gharm
* Average of annual prices except for 2008: average of monthly prices January to June
10 Tajikistan: Market Profile for Emergency Food Security Assessments. WFP (ODAN), December 2005
Rural Tajikistan Emergency Food Security Assessment Joint Food Security, Livelihoods, Agriculture and Nutrition Assessment
April/May 2008 Page 19
Figure 2 – Potato real prices 2002-2008 in 5 main markets
-
0,50
1,00
1,50
2,00
2,50
2002 2003 2004 2005 2006 2007 2008
Price (
som
oni/k
g o
r som
oni/l
iter
Dushanbe Gharm Khorog Khujand Kurgan-Tyube
* Average of annual prices except for 2008: average of monthly prices January to June
Figure 3 – Beef meat real prices 2002-2008 in 5 main markets
-
2,00
4,00
6,00
8,00
10,00
12,00
14,00
16,00
2002 2003 2004 2005 2006 2007 2008
Price (
som
oni/k
g o
r som
oni/l
iter
Dushanbe Gharm Khorog Khujand Kurgan-Tyube
* Average of annual prices except for 2008: average of monthly prices January to June

Rural Tajikistan Emergency Food Security Assessment Joint Food Security, Livelihoods, Agriculture and Nutrition Assessment
April/May 2008 Page 20
Figure 4 – Vegetable oil real prices 2002-2008 in 5 main markets
-
1,00
2,00
3,00
4,00
5,00
6,00
7,00
8,00
9,00
10,00
2002 2003 2004 2005 2006 2007 2008
Price (
som
oni/k
g o
r som
oni/l
iter
Dushanbe Gharm Khorog Khujand Kurgan-Tyube
* Average of annual prices except for 2008: average of monthly prices January to June
Figure 5 – Comparison average price of wheat, beef meat, potato and oil between January and May 2002-2007 and current year (2008)
0
2
4
6
8
10
12
14
16
Meat - beef Potato Wheat f lour 1st grade Vegetable Oil
Price (
som
oni)
January-May
2002-2007
January-May
2008
4.4 Main constraints to trade and Government response to high food prices
The main difficulties mentioned by traders and shop-keepers were the higher cost of transportation and commodities at the source (which they passed on to consumers as higher market prices). This indicates that higher international prices are passing through local markets, reflecting indeed the high dependence of Tajikistan on imports, particularly wheat flour and processed foods such as oil and sugar. Tajikistan has the highest rate of inflation amongst the countries of the Commonwealth of Independent States (CIS), rising to 28% in January, February 2008 up from 12% in September 2007 and 23% in December 2007.
The Government formed a special Commission to address the price crisis and price controls have been imposed on flour and other major staples
11. Decisions apparently taken include exemption of
11 Economic Intelligence Unit ViewsWire, December 2007

Rural Tajikistan Emergency Food Security Assessment Joint Food Security, Livelihoods, Agriculture and Nutrition Assessment
April/May 2008 Page 21
grain and flour imports from the 20% value-added tax12
, and increased funding for flour and grain purchases with the view to replenish State supplies of basic food and other products
13. It was
mentioned that the budget for the agricultural sector was also increased by 220% for 2008, tentatively for small and medium-sized loans to farmers. Considering that the share of agriculture out of total Gross Domestic Product (GDP) is estimated at 23.6%, out of a total GDP of to US$ 1,187 million
14, the
planned budget increase would bring substantial amounts of funding to the sector if it materializes. While the above decisions have the potential to mitigate price increases, it is not clear whether they are indeed being implemented. Furthermore, the impact of these macro-policy decisions on impoverished households is also not fully clear.
Access to credit did not appear to have changed in the past 6-12 months; in contrast, some traders mentioned an increase in interest rates. The average interest rate varied from 1.33% per month in DRD region to 2.26% per month in Sughd region. The main sources of credit were other traders or formal banks. On the other hand, traders indicated that a larger number of households were asking for credit compared to usual. Although delayed payment of food by households is usual, most Focus Group participants indicated that households’ debts increased as a result of higher food and fuel prices. When asked if they would be able to increase their supplies if households’ demand increased (for instance through cash or voucher transfers), traders generally replied positively. However, additional investigations will be required before such interventions are launched to ascertain local traders’ storage and cash flow capacities, as well as their true ability to mobilize commodities which are regularly in short supply at given times of the year. On the other hand, traders/shop-keepers did not express concerns over potential food aid delivery and how it might impact on their sales. However, the answers were given in a context where volumes of food aid distributed at the moment are very low.
12 Whether this decision is being implemented in practice needs to be checked 13 The extent to which this is happening also needs to be checked 14 Tajikistan – The World Factbook, Central Intelligence Agency, March 2008
Rural Tajikistan Emergency Food Security Assessment Joint Food Security, Livelihoods, Agriculture and Nutrition Assessment
April/May 2008 Page 22
5 HOUSEHOLD FOOD SECURITY SITUATION
Rural households’ food security was assessed in a context of a long and particularly cold winter (coldest in 40 years according to some Focus Group participants), compounded by high food and fuel prices and drought conditions in the spring. Results indicate that the negative health and economic consequences of these combined factors, superimposed on a background of chronic poverty, explain the widespread and, for some groups, severe food insecurity observed in various rural areas of the country.
5.1 Analysis of household food security
To estimate the proportion of food insecure households, describe their profile and determine the role played by cold-related factors during the past 6 months and specific and longer-term factors, the following analytical process was applied:
1. Food insecurity was determined by the combination of households’ current (past 7 day) food consumption and their main source of income. Food consumption patterns gave an idea of the adequacy of the diet at household level, while income sources informed on food access capacity;
2. The human, social, financial, physical and natural assets of the households were described in
order to characterise their livelihoods and identify the main factors associated with food insecurity, including a distinction between ‘transitory’ (recent) and ‘chronic’ factors.
5.1.1 Food consumption patterns
Food consumption patterns were assessed by examining the frequency and diversity of consumption of 12 different food groups in the household during the 7 days prior to the survey. A score was obtained and compared to two thresholds
15 indicative of ‘poor’, ‘borderline’ or ‘acceptable’ food
consumption. Overall, 14% of households had poor food consumption, 23% borderline and 63% acceptable. These proportions differed according to Zones (see Annex 4, table 4). Most of the households in Khatlon region had unsatisfactory dietary patterns.
A poor diet (14%) consisted of daily consumption of wheat or potatoes, oil and sugar, with low consumption of vegetables (3 days a week) and minimal consumption of animal products, pulses and vegetables. This diet may not cover the energy requirements of individuals with specific needs such as growing children, pregnant and lactating women, and does not provide the necessary minerals and vitamins for a healthy life for anyone, especially if consumed over several weeks,
The borderline diet (23%) was slightly more varied with consumption of vegetables 5 days a week and pulses and dairy products once a week. While the quality of this diet is better, it still fails to cover the nutritional requirements of vulnerable household members and others if consumed for more than a few weeks and months, contributing to increased risk of disease and malnutrition. The acceptable diet (68%) was of better quality, including vegetables almost 6 times a week, meat 4 days a week, and dairy products and pulses once a week.
5.1.2 Food access
Several food access indicators were examined in the context of rural Tajikistan. Ideally, Zone-specific access indicators would have been used to reflect the variety of income and food sources of the households. However, this would have complicated comparisons between Zones, and a single indicator or combination of indicators was preferred for the whole sample
16.
15 The calculation of the Food Consumption Score followed the standard WFP guidance as of April 2008 (see Comprehensive Food Security and Vulnerability Assessment (CFSVA) Guidelines, draft June 2008). The thresholds retained to define the 3 food consumption groups took into account the widespread consumption of sugar and oil by all households. For the two Zones in GBAO, the consumption of meat and fish were eliminated from the count as amounts typically consumed were very low (mainly condiments). 16 Among possible access indicators, some were ruled out because of their distribution in the sample or because data were not considered reliable enough: • food sources were essentially divided into own production and market purchases; both were considered “good” sources in
terms of autonomy and acceptability, and thus not discriminatory enough for the whole sample;

Rural Tajikistan Emergency Food Security Assessment Joint Food Security, Livelihoods, Agriculture and Nutrition Assessment
April/May 2008 Page 23
Eventually, sources of income were considered the best proxy indicator of sources of food, access to land and animals, and access to cash. Access groups were defined as ‘poor’, ‘average’ and ‘good’ on the basis of the level of income obtained (using secondary data, Key Informants and Focus Group discussions), reliability/regularity, independence/sustainability, and acceptability of the various sources of income
17:
� ‘poor’ 1st income sources: pensions/allowances – sale of handicraft;
� ‘average’ 1st income sources: wage labour – self-employment – sale of cotton - remittances
� ‘good’ 1st income sources: sale of wheat/potatoes – sale vegetables/fruits – sale
animals/products – government employment – petty trade
On this basis, 4% households had a poor source of income, 70% average and 26% good. Differences were noted between Zones (see Annex 4, table 5), reflecting their agro-ecological conditions (crops, livestock, exposure to natural hazards), roads and access to market, proximity to border countries (migration) and toll of the past civil war (e.g. households with disabled members, widows etc.).
5.1.3 Food security groups
Household food security groups were determined by crossing food consumption groups with food access groups, as follows:
Poor Borderline Acceptable
Poor 1% 1% 2% 4%
Average 10% 17% 44% 70%
Good 4% 5% 17% 26%
Total 14% 23% 63% 100%
Food Consumption Groups (thresholds FCS 28, 42)Sources Total
The results indicate that one third of the rural population is food insecure, and out of three food insecure households, one is severely food insecure.
Food Security Groups Percent
Severely Food Insecure 12%
Moderately Food Insecure 22%
Food Secure 66%
Total 100%
Large differences were noted between Zones (Annex 4, table 6) due to the varying combinations of food and income sources. The highest proportion of severely food insecure households (19% and above) is found in 5 out of 6 Zones in Khatlon region, one Zone in Sughd region, and one Zone in DRD region. The highest proportion of total food insecure households (more than half of the population severely or moderately food insecure) is found in half of the Zones in Khatlon and in one Zone in DRD.
• food expenditures data were not considered very accurate and were also collected for the past week only, thus not
considered a sufficiently reliable indicator of food access over the past few months16; • the share of food expenditures out of total basic expenditures (food, health, education, transportation, cooking fuel) was high
for the vast majority of households, thus not discriminatory enough; • duration of food stocks varied quite a lot but its interpretation depended on sources of income (if cash flow is sufficient, food
stocks are not needed); in addition, as the assessment took place just before the harvest, many households had low stocks anyway;
• ownership of assets, including animals, was not varied enough to be discriminatory in terms of access. 17 Results showed while slightly more than half of the households had more than 1 source of income, the first source of income provided at least 80% of total revenues. For this reason, the first source of income was retained as food access indicator.

Rural Tajikistan Emergency Food Security Assessment Joint Food Security, Livelihoods, Agriculture and Nutrition Assessment
April/May 2008 Page 24
5.2 Livelihood characteristics of the food insecure households
5.2.1 Human assets
Size of households and gender of the head of household
The size of the households was slightly associated with food insecurity, with smaller families (7.1 members) more likely to be severely food insecure than large families (7.7 to 7.9 members). This result differs from previous surveys as well as from Focus Group discussions which systematically mentioned ‘big families’ amongst the most vulnerable groups. However the discrepancy may be explained by the fact that it is the absence of working-able and income-earning members which is the main determinant of food insecurity, rather than just the size of the households. As such, large families including 1 or 2 income-earning members and/or receiving remittances regularly and in large amounts may be better-off than small families with an under-employed adult member. The small number of households interviewed in each Zone may also explain the result.
The majority of Focus Group participants identified the following groups as the ones facing the most difficulties, including not only food but also health:
� large families/ families with many young children: this reflects a perception (not backed by the household data collected) of heightened vulnerability of these households as food, clothing and schooling expenditures are felt to contribute to food and economic insecurity;
� other families with a high dependency ratio, including households hosting elderly, sick or disabled individuals, as well as women-headed/widow households;
� elderly living alone: relying only on pensions for their survival;
� families depending on farming (‘Dekhan’ households): the toll of the winter on crops and trees, as well as harvest losses due to the drought in the spring, contributed to their hardship.
Household interviews did not reveal a higher proportion of food insecure amongst women-headed households. As mentioned, the source of income mattered more than the gender of the head of households (for example the fact of having at least one income-earning member in the household, or receiving remittances). The small sample size may also explain this result.
Attendance at school
Figure 6 – Main reasons for not attending school in villages with problem of non attendance
0%
10%
20%
30%
40%
50%
60%
70%
80%
90%
100%
13 14 15 17 6 8 1 5 7 9 18 19 2 3 4 10 11 12 16
DRD GBAO Khatlon Sughd
sickness/handicap Cannot afford transportation/school far away
Cannot pay school fees, uniforms, textbooks Poor school facilities
Household chores/ Child work Other reasons
Results extracted from Key Informant interviews

Rural Tajikistan Emergency Food Security Assessment Joint Food Security, Livelihoods, Agriculture and Nutrition Assessment
April/May 2008 Page 25
About 19% of households had boys and 15% had girls of the relevant age not attending primary school, while 6% had boys and 14% had girls not attending secondary school.
The main reasons for not attending primary school was the young age of the child (more than 90% mentioned it, as primary school starts at age 7 in Tajikistan) or sickness. Economic reasons fared more prominently for non-attendance to secondary school: 13% for boys and 29% for girls. Help with household chores was an additional reason mentioned for girls (10%), while 13% of the households mentioned poor quality of teaching for boys. The various proportions of non-attendance at school and reasons differed between Zones (Annex 4, table 7).
Focus Group participants indicated a decrease in school attendance due to the cold temperatures this winter (unheated classrooms, increased child illness) and lack of money to procure warm clothing. High food and fuel prices also forced households to dedicate most of their income to food, thus decreasing expenditures for clothes, shoes and educational materials, with negative effects on children’s attendance. Long distance was an issue in some villages and building of a new school was a priority intervention requested in these cases.
Health status
Focus Group participants identified households with disabled or sick members among the most vulnerable and some relationship between the presence of a chronically ill (CI) individual in the household and food insecurity was noted from the household data as well. The proportion of severely food insecure households was higher (16% with a CI, 8% without) and the proportion of food secure lower (61% with CI, 70% without). However, the situation varied quite a lot between Zones, highlighting the role of other contextual factors besides chronic sickness.
5.2.2 Natural assets
Recent reports and statistics indicate that only 515,000 ha of the total arable land were in use in 2006, or only 60% of available arable land. The main natural asset of households is their land, but land in itself is not ‘real estate’, it is only as valuable as the harvest of wheat, potato, vegetables and fruits to be obtained. Even in ‘normal’ times, only 2% of the households cultivate more than 0.2 ha of wheat per capita, an acreage which could theoretically cover their consumption requirements for the whole year (assuming average climatic conditions and yields). No more than 7% of the households were potentially self-sufficient in wheat for more than 6 months.
Figure 7 – Household land ownership and use per zone
0
0,25
0,5
0,75
1
1,25
1,5
13
14
15
17 6 8 1 5 7 9
18
19 2 3 4
10
11
12
16
TO
TA
L
DRD GBAO Khatlon Sughd
Acre
s
Total acres cultivated Acres of kitchen garden cultivated Acres of dekhan farm cultivated
Acres of presidential land cultivated Acres of rented land cultivated
Rural Tajikistan Emergency Food Security Assessment Joint Food Security, Livelihoods, Agriculture and Nutrition Assessment
April/May 2008 Page 26
Severely food insecure households tended to plant a larger acreage of potatoes and wheat, than other households. This may reflect both their efforts to minimize reliance on markets and the lack of opportunity to earn an income for obtaining processed foods. However, results indicate that food insecure households depend more on markets for their food consumption, than other households. One reason may be that yields obtained are low. For instance, severely food insecure households faced more problems with access to seeds and manpower to cultivate, compared to others (see Box 1). Another reason may be that food insecure households must sell a higher share of their harvest than other households to obtain cash that in turn allows purchase of other basic needs.
Box 1 – Main constraints for potato and wheat cultivation according to food security status
• Main constraints for potato cultivation: � lack seeds: 28% of the severely food insecure HHs, 25% of the moderately food insecure HHs and 16% of the food secure HHs � lack manpower: 11% of the severely food insecure HHs, 1-2% other HHs � lack machinery: none of the severely food insecure HHs, 5% of the moderately food insecure HHs, 13% of the food secure HHs
• Main constraints for wheat cultivation: � lack seeds: 17% of the severely food insecure HHs,7- 9% of the other HHs � lack pesticides: 13% of the severely food insecure HHs, 1-3% of the other HHs
• � lack machinery: 10% of the severely food insecure HHs, 16% of the moderately food insecure HHs, 26% of the food secure HHs
The assessment highlighted not only the significant losses suffered in the crop sector, but also the complexity and multidimensional causes of the losses. As the population keeps growing, there is more demand for land, often resulting in deforestation and overgrazing, especially on hills near settlements, causing erosion, landslides and other damage, sometimes with devastating impact on the communities. Over the last decade, both the government and the farming communities themselves have put more emphasis on expanding cotton, potato and wheat production, thus neglecting Tajikistan’s main cash crop sub-sector, the horticulture sub-sector. The deterioration of orchards and vineyards caused by infestation and inadequate chemicals has had serious consequences on the production of quality fruit products. The traditional export fruits can no longer respond to the needs of regional markets. The Soviet-era processing facilities have been badly maintained and in many areas they have even vanished. Access to seeds and fertilizer is limited for many farmers and where they are available, it is beyond the reach of ordinary small-scale farmers.
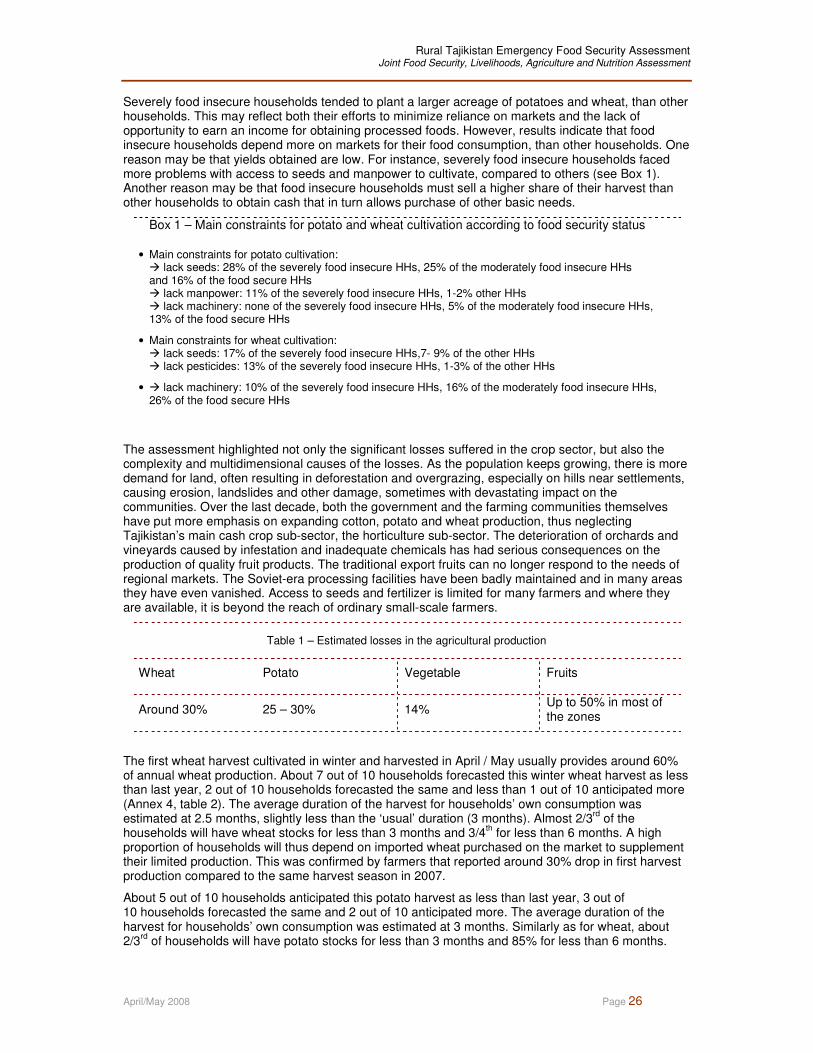
Table 1 – Estimated losses in the agricultural production
Wheat Potato Vegetable Fruits
Around 30% 25 – 30% 14% Up to 50% in most of the zones
The first wheat harvest cultivated in winter and harvested in April / May usually provides around 60% of annual wheat production. About 7 out of 10 households forecasted this winter wheat harvest as less than last year, 2 out of 10 households forecasted the same and less than 1 out of 10 anticipated more (Annex 4, table 2). The average duration of the harvest for households’ own consumption was estimated at 2.5 months, slightly less than the ‘usual’ duration (3 months). Almost 2/3
rd of the
households will have wheat stocks for less than 3 months and 3/4th for less than 6 months. A high
proportion of households will thus depend on imported wheat purchased on the market to supplement their limited production. This was confirmed by farmers that reported around 30% drop in first harvest production compared to the same harvest season in 2007.
About 5 out of 10 households anticipated this potato harvest as less than last year, 3 out of 10 households forecasted the same and 2 out of 10 anticipated more. The average duration of the harvest for households’ own consumption was estimated at 3 months. Similarly as for wheat, about 2/3
rd of households will have potato stocks for less than 3 months and 85% for less than 6 months.
Rural Tajikistan Emergency Food Security Assessment Joint Food Security, Livelihoods, Agriculture and Nutrition Assessment
April/May 2008 Page 27
Potatoes will be purchased for the rest of the time although they are sometimes scarce on local markets. Farmers surveyed reported 35% drop in first harvest production, with most potato seeds frozen in winter and with little seed potato provided so far for the second and third harvest making up the other 50% of the annual potato production.
Severely food insecure households (see Section 8) will be less likely to benefit from wheat and potato stocks than moderately food insecure and food secure households:
� 90% of severely food insecure households will have less than 3 months of wheat stocks, compared to 72% of moderately food insecure and 63% of food secure households;
� 22% of severely food insecure households will have less than 1 month of potato stocks, compared to 13% of moderately food insecure and 9% of food secure households.
Over the last decade, both the government and the farming communities themselves have put more emphasis on expanding cotton, potato and wheat production, thus neglecting Tajikistan’s main cash crop sub-sector, the horticulture sub-sector. The deterioration of orchards and vineyards caused by infestation and inadequate chemicals has had serious consequences on the production of quality fruit products. The traditional export fruits can no longer respond to the needs of regional markets. The Soviet-era processing facilities have been badly maintained and in many areas they have even vanished. Access to seeds and fertiliser is limited for many farmers and where they are available; it is beyond the reach of ordinary small-scale farmers.
The assessment findings estimate the vegetable losses as a result of the harsh winter at around 14% at national level. In fact, slightly more than 4 out of 10 households anticipated a vegetables and fruit harvest as less than last year, 5 out 10 forecasted the same and 1 out of 10 anticipated more. Stocks are anticipated to last for about 3 months of households’ consumption (Annex 4, table 8). Most vegetables are grown on household plots and have an important role in subsidizing household diet, but are also considered a cash crop, as most households sell a proportion of the harvest in the local market. During the assessment in the field, it was observed that only few households had managed to replace their vegetable fields with alternative crops, such as pulses and legumes; most did not seem to have the resources and access to seeds to do so. Therefore, while 14% loss at national level is not very significant, it is significant for the affected households in terms of diet and income.
The assessment findings also show an average of 40% losses in fruit trees and production, except for the zones situated in GBAO, where the loss has been reported as much lower. The losses are mainly related to vineyards, pomegranates and kaki fruit, while all other trees have survived. While vineyards were observed during the fieldwork to have produced new branches, most of pomegranates and kaki fruits have not survived the harsh winter and might have been permanently lost.
5.2.3 Physical assets
The physical assets of rural households can be divided into animals and domestic/productive assets.
Animals
Livestock has decreased since independence. In the period 1999-2003, it was estimated that the livestock population – both cattle and sheep and goats - decreased by about 27%. Given the general lack and degradation of pasture in the country, the assessment found the health levels of the surviving animals low. As large-scale animal husbandry in state and collective farms has disappeared, so have most of animal husbandry services, vaccination, artificial insemination and fodder production. After the civil war, as more land was utilised to grow crops, fodder production reduced substantially. Local pastures are overgrazed and issue of access to remote summer pastures remains unresolved. Consequently, lack of access to adequate animal husbandry services and fodder has weakened the livestock population.
In 2006 around 90% of livestock (standard head) was located in household plots of the population – as opposed to 62% in 1990. Livestock farming is an important economic factor for rural communities in Tajikistan. It is a substantial source of income as well as an important contribution to dietary quality and variety over the course of the year.
On average, 75% of households owned cattle, 48% sheep or goats, and 46% poultry. The average numbers of animals among the owners were 2 cattle, 7 sheep/goats and 5 poultry.

Rural Tajikistan Emergency Food Security Assessment Joint Food Security, Livelihoods, Agriculture and Nutrition Assessment
April/May 2008 Page 28
Few households owned more than 2 cattle (16%), more than 5 sheep/goats (21%) or more than 5 poultry (15%).
Even though variations were observed between Zones (Annex 4, table 9), food insecure households were less likely to own animals (74-78%) than food secure households (92%), and they owned a lower number of each species:
� 1.4 cattle, 7.2 sheep/goats, 4.3 poultry for severely food insecure households;
� 1.8 cattle, 5.2 sheep/goats, 4.6 poultry for moderately food insecure households;
� 2.3 cattle, 7.9 sheep/goats, 5.6 poultry for food secure households.
Figure 8 – Percentage of households owning animals
0
2
4
6
8
10
12
14
16
18
20
13
14
15
17 6 8 1 5 7 9
18
19 2 3
DRD GBAO Khatlon Sughd
Avera
ge n
um
ber
of
heads
cattle currently ow ened
sheep/goat currently ow ened
poultry currently ow ened
Ownership of animals made a difference in the response capacity of households to their economic difficulties, as they used the proceeds of sales to purchase food, cover health expenditures, and pay for migrants’ ticket fare (see below). However, this was done at the cost of decreasing access to dairy products for family (particularly children) consumption and to income from sales of these products.
As mentioned above, the cold winter also put a toll on the animals and many died due to the low temperatures (73% of farmers attributed the loss of cattle to severe cold conditions) and decreased resistance to diseases. Thirty percent of the farmers surveyed reported cattle losses as a result of the harsh winter. For example, almost 60% of the surveyed farmers reported loss of one or two sheep or goats during the recent winter, twice as many as those reporting loss in cattle (54% for poultry). Similarly, farmers reported many abortion cases during the winter, indicating that animals were too weak to carry pregnancies to term.
The assessment indicated a 2% loss in the cattle population at national level, estimated at 28,000 heads.
Table 2 – Estimated losses in the animal production
Cattle Sheep/goat Poultry
2% loss in the cattle population at national level, estimated at 28,000 heads
estimated 4% loss of animals at the national level
around 5% at national level
The impact of these losses on households’ diet and income is significant. Animal deaths added to the need to sell animals in order to obtain cash due to higher food and fuel prices, decreased the consumption of dairy products and the income raised by sales. The extent of animal deaths differed according to the Zones (Figure 9 and Annex 4, table 1).
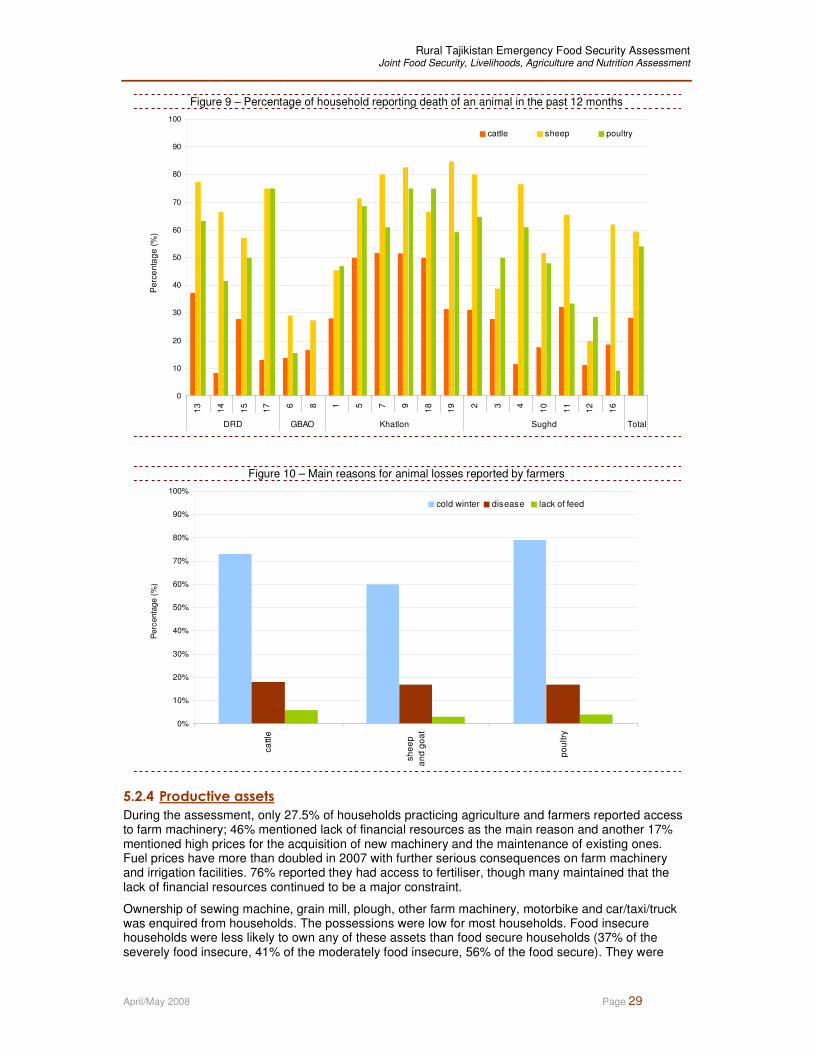
Rural Tajikistan Emergency Food Security Assessment Joint Food Security, Livelihoods, Agriculture and Nutrition Assessment
April/May 2008 Page 29
Figure 9 – Percentage of household reporting death of an animal in the past 12 months
0
10
20
30
40
50
60
70
80
90
100
13
14
15
17 6 8 1 5 7 9
18
19 2 3 4
10
11
12
16
DRD GBAO Khatlon Sughd Total
Pe
rce
nta
ge
(%
)
cattle sheep poultry
Figure 10 – Main reasons for animal losses reported by farmers
0%
10%
20%
30%
40%
50%
60%
70%
80%
90%
100%
ca
ttle
sh
ee
p
an
d g
oa
t
po
ultry
Perc
enta
ge (
%)
cold winter disease lack of feed
5.2.4 Productive assets
During the assessment, only 27.5% of households practicing agriculture and farmers reported access to farm machinery; 46% mentioned lack of financial resources as the main reason and another 17% mentioned high prices for the acquisition of new machinery and the maintenance of existing ones. Fuel prices have more than doubled in 2007 with further serious consequences on farm machinery and irrigation facilities. 76% reported they had access to fertiliser, though many maintained that the lack of financial resources continued to be a major constraint.
Ownership of sewing machine, grain mill, plough, other farm machinery, motorbike and car/taxi/truck was enquired from households. The possessions were low for most households. Food insecure households were less likely to own any of these assets than food secure households (37% of the severely food insecure, 41% of the moderately food insecure, 56% of the food secure). They were

Rural Tajikistan Emergency Food Security Assessment Joint Food Security, Livelihoods, Agriculture and Nutrition Assessment
April/May 2008 Page 30
also less likely to own two assets (2% of the severely, 7% of the moderately and 16% of the food secure households).
5.2.5 Domestic assets
Households, Focus Group participants and village Key Informants reported sales of domestic belongings as a response of households to their difficulties in the past 6 months but the practice was not widespread compared to other coping mechanisms (see Section 5.3).
5.2.6 Economic assets: income sources including remittances, expenditures and
debts
Income sources
Remittances are by far the main source of income for rural households, with 37% of households depending on them. The next most important sources of income are self-employment (14%), agricultural wage labour (11%), government employment (10%), non-agricultural wage labour (7%) and sale of wheat/potato (6%). Second sources of income for about half of the households provide a minor share of total income generally: no more than 20%, except for petty trade which can provide up to 40% (but very few households were engaged in it) and remittances, sale of wheat/potato, and self-employment which can each provide about 30% of total income. Second sources include agricultural wage labour (28% of households), pensions/allowances (24%), government employment (13%), and sale of animals/products (8%).
Compared to the average, severely food insecure households relied more on self-employment (30%) and slightly less on remittances (30%) for their income. They depended more on agricultural wage labour (20%) and pensions/allowances (15%). Most of these sources do not provide large income and are irregular throughout the year.
Figure 11 – Main source of income of rural households in Tajikistan
11%
37%
14%
10%5%3%
7%
6%
3%
2%2%
Sale of wheat or potato production
Sale of vegetable or fruit
Agricultural wage labour
Non-agricultural wage labour
Self-employed (carpenter, driver, etc)
Government employee salary
Sale of animal/ animal production
Petty trade
Pension, allowances
Remittances
Other
Moderately food insecure households were more likely to rely on remittances for their main income (40% of these households) and a large proportion was engaged in self-employment activities (almost 20%). They were also likely to depend on sales of wheat/potato (14%) and agricultural wage labour (13%). For this group, although difficult to ascertain, remittances are likely to be more regular and in higher amounts than for the severely food insecure.
Rural Tajikistan Emergency Food Security Assessment Joint Food Security, Livelihoods, Agriculture and Nutrition Assessment
April/May 2008 Page 31
Remittances were also the main source of income for some 40% of the food secure households. However, for them as well the level and frequency of remittances are expected to be much better than for the other groups. About 14% of the food secure households rely on government salaries and 7% on the sales of animals/products.
Overall, one third of the households had at least one member actively looking for work (proxy to under/unemployment) at the time of the survey. This proportion could reach more than half of the households in some Zones (Annex 4, table 10). In addition, severely food insecure households were more likely to have members looking for work, than other households (43% versus 32-37%).
Changes in income sources during the past 6 months
According to the households interviewed, the various income sources and the household members engaged in income generation activities did not change in any significant way in the past 6 months. However:
� Focus Group participants often mentioned increased sales of livestock to meet the additional food and fuel expenditures occasioned by the high prices, as well as, for some of them, to contribute to the payment of migrants’ ticket fare (see below). One of the negative consequences of these sales was the lack of milk and yoghurt for family consumption, particularly for children. Overall, 16% of the households reported to have sold animals in the past 6 months, but out of these, 40% sold a higher number than usual. Furthermore, most of those who sold animals did so because they needed to buy food. As food insecure households were less likely to own animals and owned a lower number, they could rely less on this strategy to increase their income.
� 26% of households reported that one member migrated during the previous 6 months. Focus Group participants and Key Informants unanimously reported an increase in the number of migrants during the period. However, remittances did not appear to contribute more to households’ income compared to before. One explanation for this is that it will take time before new migrants can send remittances back to the households and change the balance between income sources. Furthermore, most FG participants reported that households got indebted to pay for the migrants’ ticket fare, which was more expensive now. Part of remittances received will thus have to be used to reimburse this debt.
� A number of Focus Group participants mentioned lower gains from potato and fruit sales due to cold temperatures (frozen seeds and trees) as well as, in some instances, competition with imported potatoes.
Migration and remittances
There is no doubt that increased migration has been the overwhelming response of households to the recent difficulties and remains the preferred option of most households to increase their income. According to village Key Informants, remittances are the first income source of almost 60% of the households, a higher figure than the estimation made from the household interviews (37%).
However, migration does not bring the same benefits to all households. Many have to incur debts in order to enable members to migrate, some 20% of migrants are not sending remittances back, and others do not do so regularly or in high amounts. Furthermore, about ¾ of the migrants were engaged in crop production activities and more than half were earning an income before they left. Even though on average 80% of the migrants are sending remittances back, the extent to which this income compensates for the lost manpower and past earnings is difficult to know. Some families which are severely food insecure despite the fact that remittances represent their main source of income are probably in an unfavourable situation in that respect. The Annex 4, table 11 shows Zones where migrants were more or less likely to send back remittances.
Sources of food, dependence on markets and food expenditures
The vast majority of households are highly dependent on markets for most of their food throughout the year. Map 5 and Map 6 show the market dependency pre- and post-harvest. Even in post- winter wheat harvest time, only 20% of the households obtain more than half of their food from their own production.
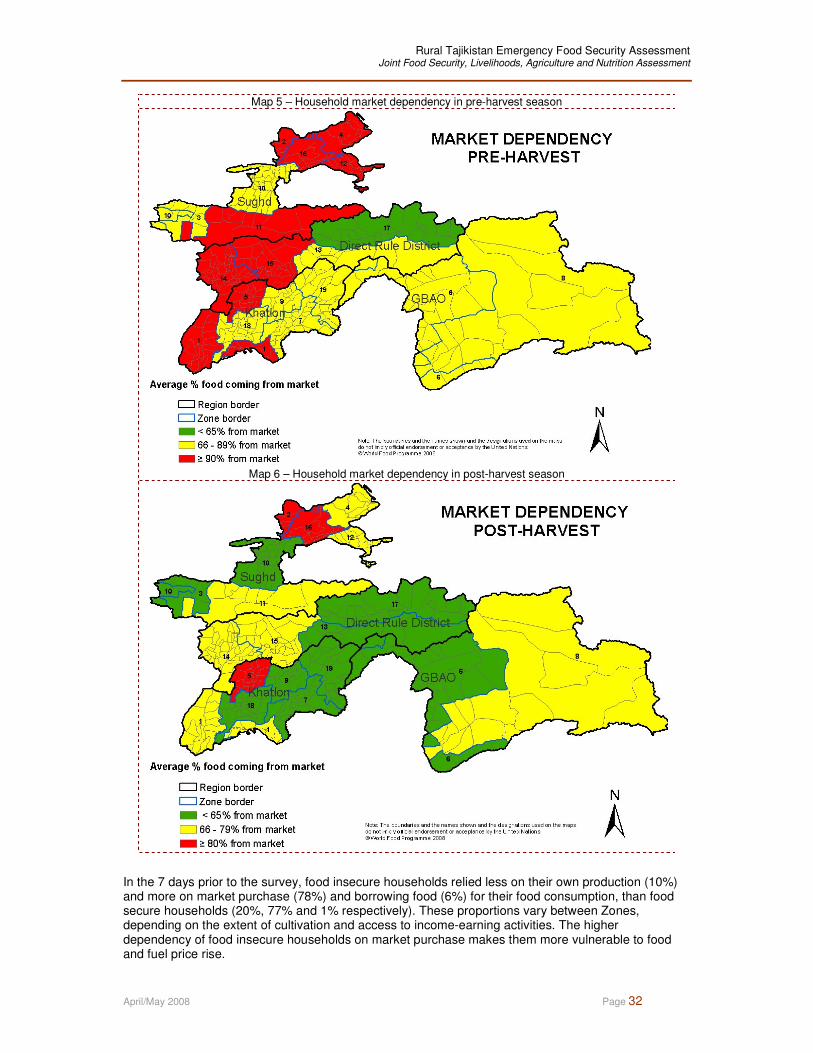
Rural Tajikistan Emergency Food Security Assessment Joint Food Security, Livelihoods, Agriculture and Nutrition Assessment
April/May 2008 Page 32
Map 5 – Household market dependency in pre-harvest season
Map 6 – Household market dependency in post-harvest season
In the 7 days prior to the survey, food insecure households relied less on their own production (10%) and more on market purchase (78%) and borrowing food (6%) for their food consumption, than food secure households (20%, 77% and 1% respectively). These proportions vary between Zones, depending on the extent of cultivation and access to income-earning activities. The higher dependency of food insecure households on market purchase makes them more vulnerable to food and fuel price rise.
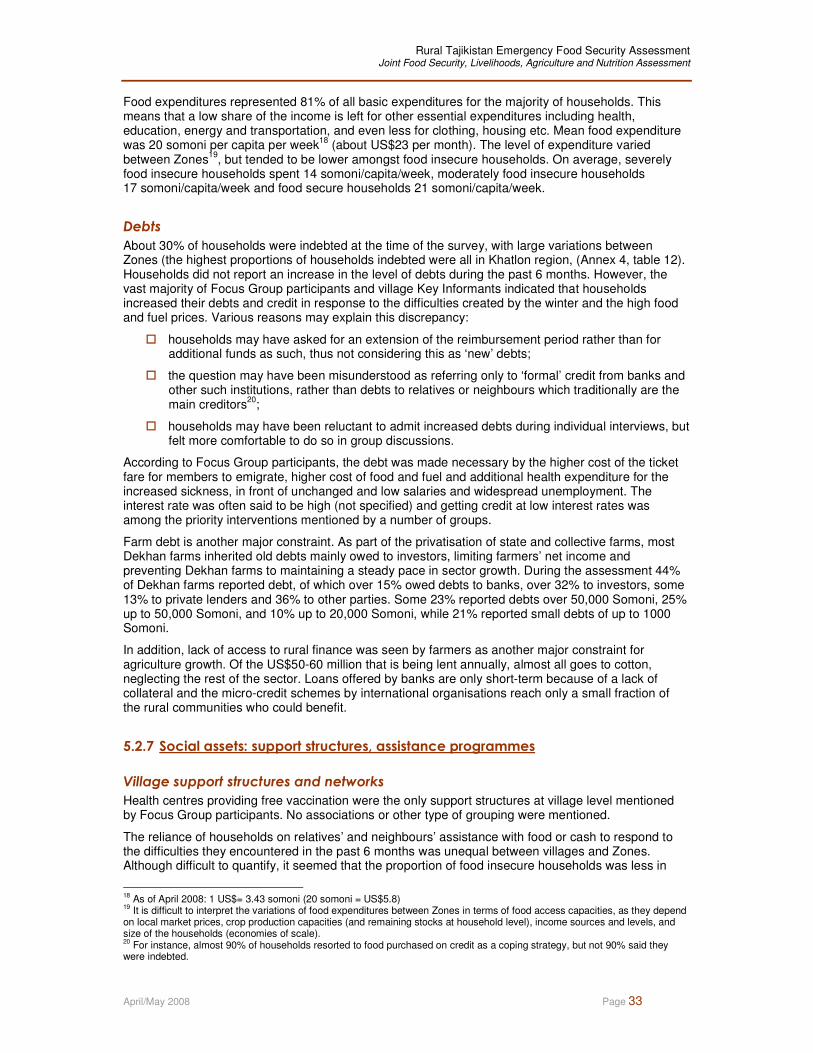
Rural Tajikistan Emergency Food Security Assessment Joint Food Security, Livelihoods, Agriculture and Nutrition Assessment
April/May 2008 Page 33
Food expenditures represented 81% of all basic expenditures for the majority of households. This means that a low share of the income is left for other essential expenditures including health, education, energy and transportation, and even less for clothing, housing etc. Mean food expenditure was 20 somoni per capita per week
18 (about US$23 per month). The level of expenditure varied
between Zones19
, but tended to be lower amongst food insecure households. On average, severely food insecure households spent 14 somoni/capita/week, moderately food insecure households 17 somoni/capita/week and food secure households 21 somoni/capita/week.
Debts
About 30% of households were indebted at the time of the survey, with large variations between Zones (the highest proportions of households indebted were all in Khatlon region, (Annex 4, table 12). Households did not report an increase in the level of debts during the past 6 months. However, the vast majority of Focus Group participants and village Key Informants indicated that households increased their debts and credit in response to the difficulties created by the winter and the high food and fuel prices. Various reasons may explain this discrepancy:
� households may have asked for an extension of the reimbursement period rather than for additional funds as such, thus not considering this as ‘new’ debts;
� the question may have been misunderstood as referring only to ‘formal’ credit from banks and other such institutions, rather than debts to relatives or neighbours which traditionally are the main creditors
20;
� households may have been reluctant to admit increased debts during individual interviews, but felt more comfortable to do so in group discussions.
According to Focus Group participants, the debt was made necessary by the higher cost of the ticket fare for members to emigrate, higher cost of food and fuel and additional health expenditure for the increased sickness, in front of unchanged and low salaries and widespread unemployment. The interest rate was often said to be high (not specified) and getting credit at low interest rates was among the priority interventions mentioned by a number of groups.
Farm debt is another major constraint. As part of the privatisation of state and collective farms, most Dekhan farms inherited old debts mainly owed to investors, limiting farmers’ net income and preventing Dekhan farms to maintaining a steady pace in sector growth. During the assessment 44% of Dekhan farms reported debt, of which over 15% owed debts to banks, over 32% to investors, some 13% to private lenders and 36% to other parties. Some 23% reported debts over 50,000 Somoni, 25% up to 50,000 Somoni, and 10% up to 20,000 Somoni, while 21% reported small debts of up to 1000 Somoni.
In addition, lack of access to rural finance was seen by farmers as another major constraint for agriculture growth. Of the US$50-60 million that is being lent annually, almost all goes to cotton, neglecting the rest of the sector. Loans offered by banks are only short-term because of a lack of collateral and the micro-credit schemes by international organisations reach only a small fraction of the rural communities who could benefit.
5.2.7 Social assets: support structures, assistance programmes
Village support structures and networks
Health centres providing free vaccination were the only support structures at village level mentioned by Focus Group participants. No associations or other type of grouping were mentioned.
The reliance of households on relatives’ and neighbours’ assistance with food or cash to respond to the difficulties they encountered in the past 6 months was unequal between villages and Zones. Although difficult to quantify, it seemed that the proportion of food insecure households was less in
18 As of April 2008: 1 US$= 3.43 somoni (20 somoni = US$5.8) 19 It is difficult to interpret the variations of food expenditures between Zones in terms of food access capacities, as they depend on local market prices, crop production capacities (and remaining stocks at household level), income sources and levels, and size of the households (economies of scale). 20 For instance, almost 90% of households resorted to food purchased on credit as a coping strategy, but not 90% said they were indebted.
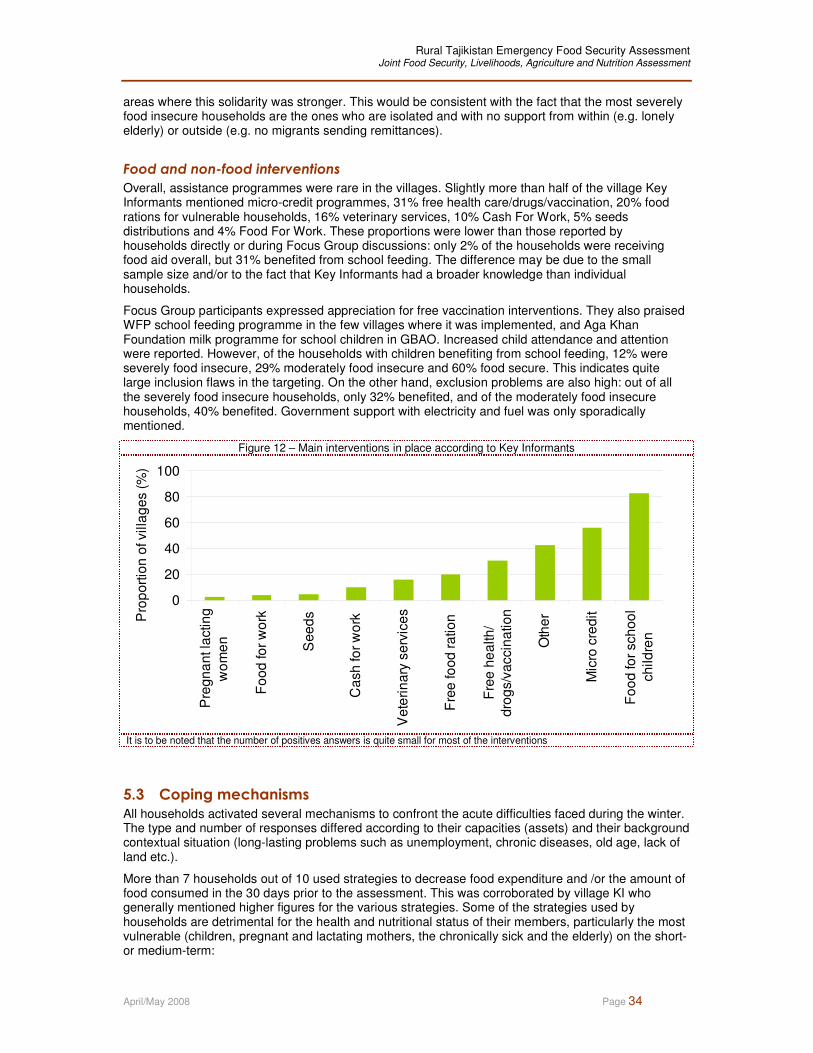
Rural Tajikistan Emergency Food Security Assessment Joint Food Security, Livelihoods, Agriculture and Nutrition Assessment
April/May 2008 Page 34
areas where this solidarity was stronger. This would be consistent with the fact that the most severely food insecure households are the ones who are isolated and with no support from within (e.g. lonely elderly) or outside (e.g. no migrants sending remittances).
Food and non-food interventions
Overall, assistance programmes were rare in the villages. Slightly more than half of the village Key Informants mentioned micro-credit programmes, 31% free health care/drugs/vaccination, 20% food rations for vulnerable households, 16% veterinary services, 10% Cash For Work, 5% seeds distributions and 4% Food For Work. These proportions were lower than those reported by households directly or during Focus Group discussions: only 2% of the households were receiving food aid overall, but 31% benefited from school feeding. The difference may be due to the small sample size and/or to the fact that Key Informants had a broader knowledge than individual households.
Focus Group participants expressed appreciation for free vaccination interventions. They also praised WFP school feeding programme in the few villages where it was implemented, and Aga Khan Foundation milk programme for school children in GBAO. Increased child attendance and attention were reported. However, of the households with children benefiting from school feeding, 12% were severely food insecure, 29% moderately food insecure and 60% food secure. This indicates quite large inclusion flaws in the targeting. On the other hand, exclusion problems are also high: out of all the severely food insecure households, only 32% benefited, and of the moderately food insecure households, 40% benefited. Government support with electricity and fuel was only sporadically mentioned.
Figure 12 – Main interventions in place according to Key Informants
0
20
40
60
80
100
Pre
gn
ant la
ctin
g
wo
me
n
Fo
od
fo
r w
ork
See
ds
Ca
sh
fo
r w
ork
Vete
rin
ary
serv
ice
s
Fre
e fo
od
ratio
n
Fre
e h
ea
lth/
dro
gs/v
accin
ation
Oth
er
Mic
ro c
red
it
Fo
od fo
r sch
oo
l
ch
ild
ren
Pro
port
ion
of villa
ges (%
)
It is to be noted that the number of positives answers is quite small for most of the interventions
5.3 Coping mechanisms
All households activated several mechanisms to confront the acute difficulties faced during the winter. The type and number of responses differed according to their capacities (assets) and their background contextual situation (long-lasting problems such as unemployment, chronic diseases, old age, lack of land etc.).
More than 7 households out of 10 used strategies to decrease food expenditure and /or the amount of food consumed in the 30 days prior to the assessment. This was corroborated by village KI who generally mentioned higher figures for the various strategies. Some of the strategies used by households are detrimental for the health and nutritional status of their members, particularly the most vulnerable (children, pregnant and lactating mothers, the chronically sick and the elderly) on the short- or medium-term:
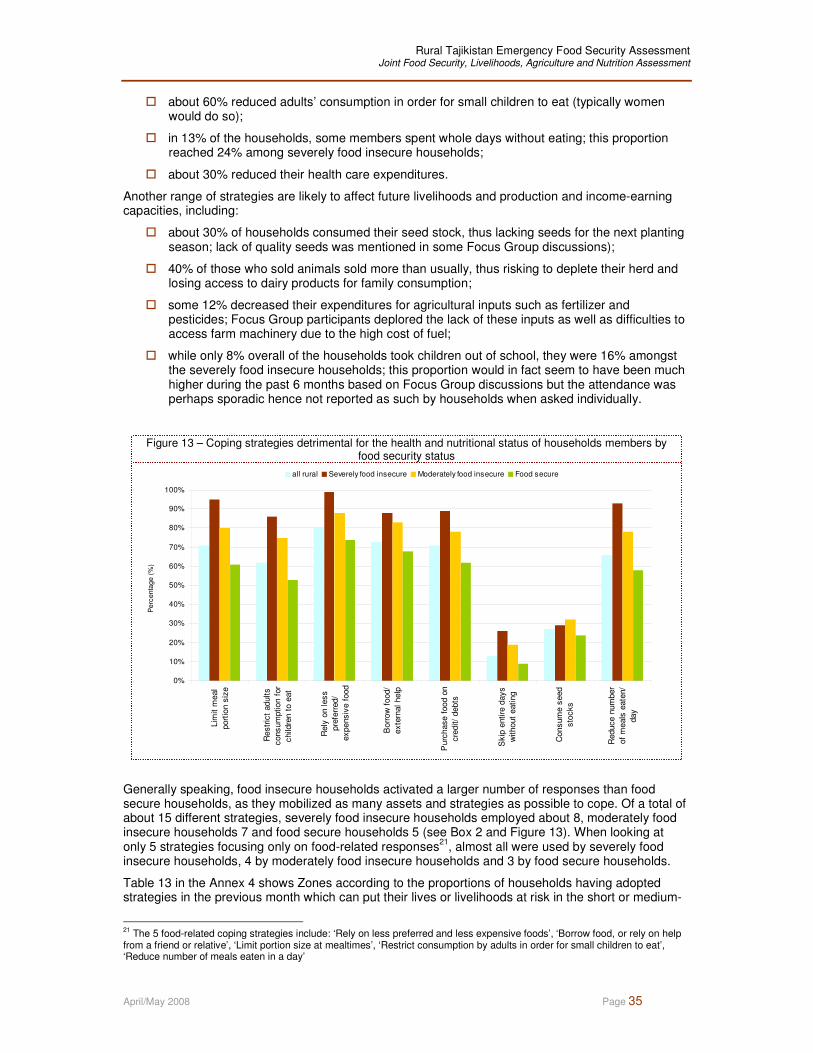
Rural Tajikistan Emergency Food Security Assessment Joint Food Security, Livelihoods, Agriculture and Nutrition Assessment
April/May 2008 Page 35
� about 60% reduced adults’ consumption in order for small children to eat (typically women would do so);
� in 13% of the households, some members spent whole days without eating; this proportion reached 24% among severely food insecure households;
� about 30% reduced their health care expenditures.
Another range of strategies are likely to affect future livelihoods and production and income-earning capacities, including:
� about 30% of households consumed their seed stock, thus lacking seeds for the next planting season; lack of quality seeds was mentioned in some Focus Group discussions);
� 40% of those who sold animals sold more than usually, thus risking to deplete their herd and losing access to dairy products for family consumption;
� some 12% decreased their expenditures for agricultural inputs such as fertilizer and pesticides; Focus Group participants deplored the lack of these inputs as well as difficulties to access farm machinery due to the high cost of fuel;
� while only 8% overall of the households took children out of school, they were 16% amongst the severely food insecure households; this proportion would in fact seem to have been much higher during the past 6 months based on Focus Group discussions but the attendance was perhaps sporadic hence not reported as such by households when asked individually.
Figure 13 – Coping strategies detrimental for the health and nutritional status of households members by food security status
0%
10%
20%
30%
40%
50%
60%
70%
80%
90%
100%
Lim
it m
eal
port
ion s
ize
Restr
ict
adults
consum
ption f
or
child
ren t
o e
at
Rely
on less
pre
ferr
ed/
expensiv
e f
ood
Borr
ow
food/
exte
rnal help
Purc
hase f
ood o
n
cre
dit/
debts
Skip
entire
days
without
eating
Consum
e s
eed
sto
cks
Reduce n
um
ber
of
meals
eate
n/
day
Perc
enta
ge (
%)
all rural Severely food insecure Moderately food insecure Food secure
Generally speaking, food insecure households activated a larger number of responses than food secure households, as they mobilized as many assets and strategies as possible to cope. Of a total of about 15 different strategies, severely food insecure households employed about 8, moderately food insecure households 7 and food secure households 5 (see Box 2 and Figure 13). When looking at only 5 strategies focusing only on food-related responses
21, almost all were used by severely food
insecure households, 4 by moderately food insecure households and 3 by food secure households.
Table 13 in the Annex 4 shows Zones according to the proportions of households having adopted strategies in the previous month which can put their lives or livelihoods at risk in the short or medium-
21 The 5 food-related coping strategies include: ‘Rely on less preferred and less expensive foods’, ‘Borrow food, or rely on help from a friend or relative’, ‘Limit portion size at mealtimes’, ‘Restrict consumption by adults in order for small children to eat’, ‘Reduce number of meals eaten in a day’
Rural Tajikistan Emergency Food Security Assessment Joint Food Security, Livelihoods, Agriculture and Nutrition Assessment
April/May 2008 Page 36
term, compared to the average sample. The results must be interpreted with caution, as a low proportion of households adopting negative strategies can reflect their inability to do more and the exhaustion of their capacities, rather than a true choice.
Box 2 – Coping strategies more frequently associated with food insecurity
With some variations between Zones, food insecurity was associated with:
• rely on less preferred/less expensive foods (99% severely food insecure HHs, 88% moderately, 74% food secure HHs)
• spend entire days without eating (26% severely food insecure HHs, 19% moderately food insecure HHs, 9% food secure HHs)
• borrow food (12-17% food insecure HHs, 32% food secure HHs) • purchase food on credit (11% severely food insecure HHs, 22% moderately, 38% food secure HHs) • limit portion size at meals (95% severely food insecure HHs, 80% moderately, 61% food secure) • restrict adults’ consumption in order for small children to eat (86% severely food insecure, 75%
moderately, 53% food secure) • reduce number of meals per day (93% severely food insecure HHs, 78% moderately, 58% food secure) • take children out of school (12-13% food insecure HHs, 6% food secure HHs)
increase labour migration (52% severely food insecure HHs, 36% moderately food insecure HHs, 28% food secure HHs)
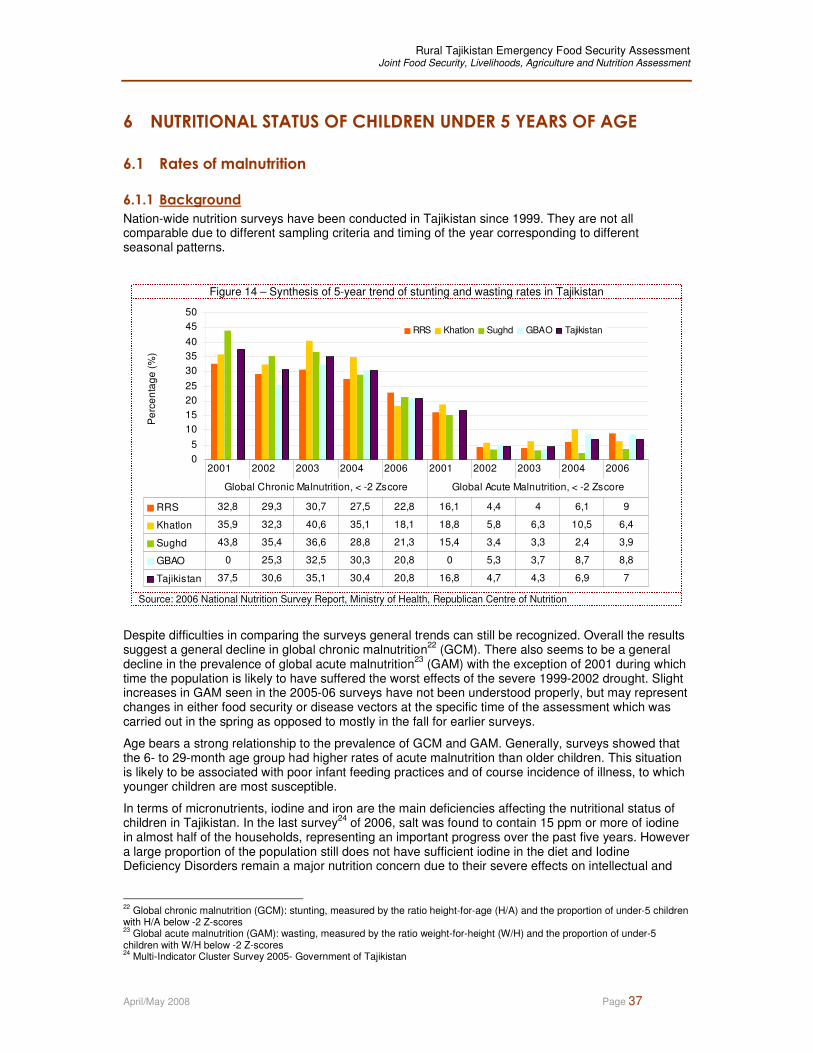
Rural Tajikistan Emergency Food Security Assessment Joint Food Security, Livelihoods, Agriculture and Nutrition Assessment
April/May 2008 Page 37
6 NUTRITIONAL STATUS OF CHILDREN UNDER 5 YEARS OF AGE
6.1 Rates of malnutrition
6.1.1 Background
Nation-wide nutrition surveys have been conducted in Tajikistan since 1999. They are not all comparable due to different sampling criteria and timing of the year corresponding to different seasonal patterns.
Figure 14 – Synthesis of 5-year trend of stunting and wasting rates in Tajikistan
0
5
10
15
20
25
30
35
40
45
50
Pe
rce
nta
ge
(%
)
RRS Khatlon Sughd GBAO Tajikistan
RRS 32,8 29,3 30,7 27,5 22,8 16,1 4,4 4 6,1 9
Khatlon 35,9 32,3 40,6 35,1 18,1 18,8 5,8 6,3 10,5 6,4
Sughd 43,8 35,4 36,6 28,8 21,3 15,4 3,4 3,3 2,4 3,9
GBAO 0 25,3 32,5 30,3 20,8 0 5,3 3,7 8,7 8,8
Tajikistan 37,5 30,6 35,1 30,4 20,8 16,8 4,7 4,3 6,9 7
2001 2002 2003 2004 2006 2001 2002 2003 2004 2006
Global Chronic Malnutrition, < -2 Zscore Global Acute Malnutrition, < -2 Zscore
Source: 2006 National Nutrition Survey Report, Ministry of Health, Republican Centre of Nutrition
Despite difficulties in comparing the surveys general trends can still be recognized. Overall the results suggest a general decline in global chronic malnutrition
22 (GCM). There also seems to be a general
decline in the prevalence of global acute malnutrition23
(GAM) with the exception of 2001 during which time the population is likely to have suffered the worst effects of the severe 1999-2002 drought. Slight increases in GAM seen in the 2005-06 surveys have not been understood properly, but may represent changes in either food security or disease vectors at the specific time of the assessment which was carried out in the spring as opposed to mostly in the fall for earlier surveys.
Age bears a strong relationship to the prevalence of GCM and GAM. Generally, surveys showed that the 6- to 29-month age group had higher rates of acute malnutrition than older children. This situation is likely to be associated with poor infant feeding practices and of course incidence of illness, to which younger children are most susceptible.
In terms of micronutrients, iodine and iron are the main deficiencies affecting the nutritional status of children in Tajikistan. In the last survey
24 of 2006, salt was found to contain 15 ppm or more of iodine
in almost half of the households, representing an important progress over the past five years. However a large proportion of the population still does not have sufficient iodine in the diet and Iodine Deficiency Disorders remain a major nutrition concern due to their severe effects on intellectual and
22 Global chronic malnutrition (GCM): stunting, measured by the ratio height-for-age (H/A) and the proportion of under-5 children with H/A below -2 Z-scores 23 Global acute malnutrition (GAM): wasting, measured by the ratio weight-for-height (W/H) and the proportion of under-5 children with W/H below -2 Z-scores 24 Multi-Indicator Cluster Survey 2005- Government of Tajikistan

Rural Tajikistan Emergency Food Security Assessment Joint Food Security, Livelihoods, Agriculture and Nutrition Assessment
April/May 2008 Page 38
physical development. A nation-wide survey conducted in 2003 survey reported iron deficiency as a major cause of anaemia among children 6-59 months.
6.1.2 Assessment Results
The assessment used a sampling approach based on 19 agro-ecological Zones, while most of the previous national nutrition surveys selected clusters along the 4 administrative regions. Comparison at rural level can be done however, but comparison at regional level is not directly possible. Also, the very small number of children under 59 months of age included in the assessment sample in each jamoat does not permit to extrapolate the results at Zone level.
Amongst the 559 children measured, 4.7% were wasted and 27.5% stunted (see Box 3). As per international references at population level, the wasting rate is ‘acceptable’ (although close to the upper reference limit of 5% defining a ‘poor’ level) and the stunting rate is ‘poor’. These results are not significantly different from the rates of 7.5% and 27.3% respectively obtained in 2005/06 in rural areas at the same time of the year, thus showing no improvement in the past 3 years.
The proportion of children acutely malnourished was higher in Khatlon region, followed by DRD, GBAO and Sughd. The same order was noted in 2005/06. Chronic malnutrition was more frequently observed among children in DRD, followed by GBAO, Sughd and Khatlon. This contrasts with the results of 2005/06 when chronic malnutrition was found less frequent in DRD than in other regions.
Box 3 – Assessment nutritional status results and comparison with 2005/06 MICS (rural areas)
All rural area April 2008 rural food security, livelihoods, agriculture and nutrition assessment: a. 4.7% [2.8-6.5] global acute malnutrition, including 0.5% [Confidence Interval 0-1.1] severe and 4.1%
[2.4-5.8] moderate b. 27.5% [23.5-31.5] global chronic malnutrition, including 9.4% [6.7-12.1 ]severe and 18.1% [15.2-21]
moderate
2005 MICS rural areas (different sampling approach): • 7.1% [5.8%-8.4%] global acute malnutrition, including 1.3% severe and 5.8% moderate • 27.3% [25.0-29.6%] global chronic malnutrition, including 9.1% severe and 18.2% moderate
By Region April 2008 rural food security, livelihoods, agriculture and nutrition assessment acute malnutrition (all confidence intervals overlap): 1) Khatlon: 7% [4.3-9.7] including 1.4% [-0.3-3.1] severe, 5.6% [3.6-7.7] moderate 2) DRD: 5.4% [0.9-9.9], all moderate 3) GBAO: 4% [-3.1-11.1], all moderate 4) Sughd: 1.9% [-1.2-5.0], all moderate
2005 MICS acute malnutrition: 1) Khatlon: 9.3% [7.0-11.0], including 2.6% severe, 6.7% moderate 2) DRD: 7.8% [5.8-9.8], including 1.4% severe, 6.4% moderate 3) GBAO: 5.2% [3.2-7.2], including 1.1% severe, 4.1% moderate 4) Sughd: 4.0% [2.4-5.5], including 0.3% severe, 3.7% moderate
April 2008 rural food security, livelihoods, agriculture and nutrition assessment chronic malnutrition (all confidence intervals overlap): 1) DRD: 33.3% [18.4-48.2], including 9% [-2.5-20.5] severe, 24.3% [19.5-29.1] moderate 2) GBAO: 28% [10.7-45.3], including 16% [3.8-28.2] severe, 12% [6.9-17.1] moderate 3) Sughd: 27.1% [22.2-32.0], including 11.7% [9.0-14.3] severe, 15.4% [12.0-18.8] moderate 4) Khatlon: 25.1% [18.9-31.4], including 8.8% [7.5-10.2] severe, 16.3% [10.9-21.7] moderate
2005 MICS chronic malnutrition: 1) GBAO: 29.7% [24.3-35.1], including 11.6% severe, 18.1% moderate 2) Khatlon: 29% [25.8-32.2], including 10% severe, 19% moderate 3) Sughd:28.9% [25.0-32.7], including 9.7% severe, 19.2% moderate 4) DRD: 22.9% [19.2-26.5], including 6.5% severe, 16.4% moderate
April 2008 rural food security livelihoods, agriculture and nutrition assessment mid-upper arm circumference (MUAC):
• 2% under-5 children between 11-12.5 cm
none below 11 cm

Rural Tajikistan Emergency Food Security Assessment Joint Food Security, Livelihoods, Agriculture and Nutrition Assessment
April/May 2008 Page 39
Results by Zone present very large variations and differences are not statistically significant. Table 14 in Annex 4 indicates Zones with the ‘highest’ and ‘lowest’ average proportions of under-5 children wasted. Most are concentrated in Khatlon region, while a few are scattered in DRD, GBAO and Sughd regions.
6.2 Factors associated with child malnutrition
6.2.1 Household food consumption and food security
The rate of stunting among under-5 children was significantly correlated with household food consumption and food security status:
� 38% of children in households consuming a poor diet were stunted, compared to 28% in households with a borderline diet and 24% in those with an acceptable diet;
� 24% of children in food insecure households were stunted, compared to 14% in food secure households.
These results confirm the chronic and long-lasting nature of food insecurity and the role of inadequate quality and/or quantity of food on child’s growth. There was a negative but not statistically significant relationship between acute malnutrition and household food security. This shows that while poor food intake is likely to contribute to loss of weight in children, other factors than food also play an important role, particularly feeding practices (see below).
6.2.2 Water
Generally speaking, about 60% of the households used a safe source of water25
for drinking and almost 40% of the households boiled their water before drinking. There were no relations between acute or chronic child malnutrition and the type of water source used by households to drink, nor with the fact of boiling or not the water before drinking. However, in a majority of villages, Focus Group participants reported severe water shortages during the previous 6 months, due to the cold winter and related electricity cuts. Households consumed ‘dirty’ water with negative consequences on their health (see next paragraph) and water for irrigation was not available, contributing to low yields.
Access to safe water sources differed between Zones, with three Zones (1, 5 and 9) in Khatlon region and two Zones (4 and 12) in Sughd region showing less access than other Zones (Annex 4, table 15).
6.2.3 Health status
Some 31% under-5 children had been sick during the 2 weeks prior to the survey, a quite large proportion. Of these, 59% had fever, 15% difficulties breathing, 14% diarrhoea and 2% measles. The proportion of sick children and type of sickness differed between Zones, with four Zones (1, 7, 18 and 19) in Khatlon, and two Zones (3 and 12) in Sughd showing the highest levels (Annex 4, table 16). With caution due to the low number of children concerned, fever seemed less frequent and cough/breathing difficulties and measles more frequent in GBAO than in other regions.
25 Safe sources of water were defined as: piped water, public tape, tube well/borehole, protected well, protected spring water, rain water, bottle water. Unsafe sources of water: river, unprotected well, spring water, canal. The proportions found are similar to those of the 2005/06 MICS survey.
Figure 15 – Main diseases for children under 5 years of age (2 weeks before survey)
Diarrhoea
16%
Cough/ breathing
difficulties
11%
Fever
62%
Measles
1%
Other
10%

Rural Tajikistan Emergency Food Security Assessment Joint Food Security, Livelihoods, Agriculture and Nutrition Assessment
April/May 2008 Page 40
Nutritional status was not associated with past 2-week child sickness nor with treatment at a health centre. This does not mean that diarrhoea and other diseases are not affecting the nutritional status of children, but rather that other factors, in addition to diseases, are also contributing to malnutrition.
Recent child sickness was also not associated with household food security, although sick children in severely food insecure households were less likely to be taken to a health service (37%) than other sick children in other households (47-63%). For severely food insecure households, the main reasons for not taking sick children to health services were more likely to be lack of money (75%) or use of alternative treatments (25%), than other households.
Figure 16 – Main reason for not taking children to health centre by food security group
0%
10%
20%
30%
40%
50%
60%
70%
80%
Not serious Far aw ay/ lack of
transport
Lack of money Other source of
treatment
Perc
en
tage (
%)
severely food insecure moderately food insecure food secure
Children who suffered from diarrhoea in severely food insecure households were less likely to be given Oral Re-hydration Salts (ORS) than other diarrheic children (42% versus 51-64%).
About 60% of children had received vitamin A in the previous 6 months, without differences between household food security groups.
6.2.4 Morbidity and access to health services
The recent bouts of sickness among young children in the 2 weeks prior to the assessment do not reflect the widespread increase in the proportion of sickness among adults and children during the past 6 months, as reported by an overwhelming majority of Focus Group participants and village Key Informants. Increased diseases were directly attributed to the cold winter and to the increase of food and fuel prices, through a series of inter-connected consequences:
� as temperatures were low and fuel expensive, people shared houses and rooms in order to benefit from heating, and infectious diseases were more easily transmitted;
� food intake, both in terms of quantity and nutritional value, decreased, contributing to decreased resistance to infection;
� electricity cuts and low temperatures prevented the use of water pumps and ‘dirty’ water was widely consumed, contributing to diarrhoea and other faecal-transmitted diseases such as typhoid
� shortages of water also affected hygiene as they constrained personal washing and domestic cleanliness
� even though the majority of village Key Informants (KIs) mentioned that a health service was attached to the village (78%) or accessible at an average time of less than 30 minutes, access to health services was at times interrupted because roads were impassable (snow, avalanches);
Rural Tajikistan Emergency Food Security Assessment Joint Food Security, Livelihoods, Agriculture and Nutrition Assessment
April/May 2008 Page 41
� use of health services decreased because: (i) transportation fares increased, (ii) most of the income was dedicated to food, leaving very little to cover health and other non-food expenditures, (iii) health services themselves functioned poorly due to electricity and water cuts, and shortage of drugs;
� medical treatment of sick individuals was inadequate, as households lacked income to pay for the whole treatment.
Amongst the most frequent diseases in the villages, a mix of infectious and chronic pathologies was generally mentioned. Within the former, diarrhoea, typhoid, tuberculosis and brucellosis were frequent, related to the consumption of ‘dirty’ water, overcrowding (people sharing same rooms to benefit from limited heating) and non pasteurized milk. Brucellosis itself increased amongst livestock, both because of weakened conditions of the animals during the winter (lack of fodder) and no/limited vaccinations (lack of income, lack of veterinary services). Of chronic pathologies, high blood pressure was the most frequent. Diabetes and other older-age ailments (rheumatism, arthritis) were also mentioned.
Access to health services is unequal between Zones, as shown in the Annex 4, table 17. Furthermore, as mentioned many health services are not providing satisfactory services because of lack of drugs, water and electricity shortages, and many households do not benefit from adequate treatment due to their inability to pay for it or even for transportation to the health centre. It is worth noting that the Government is undertaking reforms to address these structural difficulties.
6.2.5 Child feeding practices
The low number of children in relevant age categories limits the analysis of child feeding practices and results must be taken with caution. Results confirm inadequate complementary feeding practices with insufficient frequency and diversity of foods fed to young children:
� Less than two thirds of children aged 6-8.9 months (n=41) had received complementary food (solid, semi-solid or soft) the day before the survey.
� Almost 80% of children aged 12-15.9 months (n=40) had been breastfed the day before26
;
� Most of the children aged 6-23.9 months (n=211) had received less than 4 different food groups the day before. Of those still breastfed (n=89), only 26% had received other foods at least 3 times the day before, and of those non breastfed (n=67), 27% had received foods at least 4 times.
Overall, there was a negative, but not statistically significant (given the small sample size), association between breastfeeding - for children below 9 months - and receipt of complementary food and a sufficient number of different food groups - for older children - on the one hand, and acute malnutrition on the other hand (see Box 4). The absence of association of these factors with stunting, compared to the association found with household-level food consumption suggests that inappropriate and/or insufficient food given to the child is playing an important role in acute loss of weight, while inadequate diet over the longer term in the family as a whole contributes to delayed growth.
Box 4 – Association between child feeding practices and nutritional status
• Children 6-8.9 months (N=36) who received solid, semi-solid or soft foods the day before were less likely to be wasted (R=-0.304) or with low MUAC (R=-0.304) than children who did not receive, but not statistically significant (p=0.07)
• Children 12-15.9 months (N=38) breastfed the day before were less likely to be stunted than non breastfed children (R=-0.298), but not statistically significant (p= 0.07)
• Similar, though weaker, relationship with low MUAC (R=-0.122, p=0.467)
• No relationship between breastfeeding status of children 12-15.9 months and wasting (R=-0.085, p=0.612)
• For children 6-23.9 months (N=202), no relationship between consumption of at least 4 food groups the day and nutritional status
• Breastfed children 6-23.9 months (N=88) who consumed at least 3 times solid, semi-solid or soft foods the day before were slightly less likely to be wasted than breastfed children who did not consumed at
26 75% in the 2005/06 MICS survey
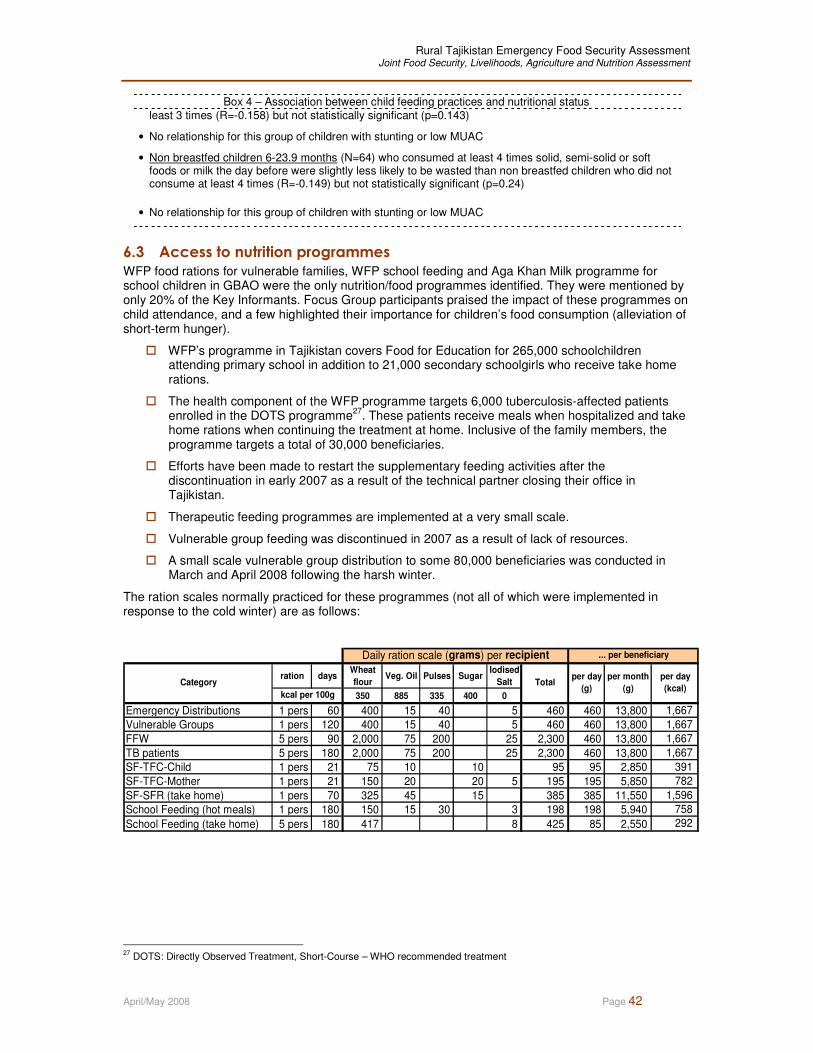
Rural Tajikistan Emergency Food Security Assessment Joint Food Security, Livelihoods, Agriculture and Nutrition Assessment
April/May 2008 Page 42
Box 4 – Association between child feeding practices and nutritional status least 3 times (R=-0.158) but not statistically significant (p=0.143)
• No relationship for this group of children with stunting or low MUAC
• Non breastfed children 6-23.9 months (N=64) who consumed at least 4 times solid, semi-solid or soft foods or milk the day before were slightly less likely to be wasted than non breastfed children who did not consume at least 4 times (R=-0.149) but not statistically significant (p=0.24)
• No relationship for this group of children with stunting or low MUAC
6.3 Access to nutrition programmes
WFP food rations for vulnerable families, WFP school feeding and Aga Khan Milk programme for school children in GBAO were the only nutrition/food programmes identified. They were mentioned by only 20% of the Key Informants. Focus Group participants praised the impact of these programmes on child attendance, and a few highlighted their importance for children’s food consumption (alleviation of short-term hunger).
� WFP’s programme in Tajikistan covers Food for Education for 265,000 schoolchildren attending primary school in addition to 21,000 secondary schoolgirls who receive take home rations.
� The health component of the WFP programme targets 6,000 tuberculosis-affected patients enrolled in the DOTS programme
27. These patients receive meals when hospitalized and take
home rations when continuing the treatment at home. Inclusive of the family members, the programme targets a total of 30,000 beneficiaries.
� Efforts have been made to restart the supplementary feeding activities after the discontinuation in early 2007 as a result of the technical partner closing their office in Tajikistan.
� Therapeutic feeding programmes are implemented at a very small scale.
� Vulnerable group feeding was discontinued in 2007 as a result of lack of resources.
� A small scale vulnerable group distribution to some 80,000 beneficiaries was conducted in March and April 2008 following the harsh winter.
The ration scales normally practiced for these programmes (not all of which were implemented in response to the cold winter) are as follows:
ration daysWheat
flour Veg. Oil Pulses Sugar
Iodised
Salt
350 885 335 400 0
Emergency Distributions 1 pers 60 400 15 40 5 460 460 13,800 1,667
Vulnerable Groups 1 pers 120 400 15 40 5 460 460 13,800 1,667
FFW 5 pers 90 2,000 75 200 25 2,300 460 13,800 1,667
TB patients 5 pers 180 2,000 75 200 25 2,300 460 13,800 1,667
SF-TFC-Child 1 pers 21 75 10 10 95 95 2,850 391
SF-TFC-Mother 1 pers 21 150 20 20 5 195 195 5,850 782
SF-SFR (take home) 1 pers 70 325 45 15 385 385 11,550 1,596
School Feeding (hot meals) 1 pers 180 150 15 30 3 198 198 5,940 758
School Feeding (take home) 5 pers 180 417 8 425 85 2,550 292
... per beneficiary
per day
(kcal)
per month
(g)
Daily ration scale (grams) per recipient
Category
kcal per 100g
Totalper day
(g)
27 DOTS: Directly Observed Treatment, Short-Course – WHO recommended treatment

Rural Tajikistan Emergency Food Security Assessment Joint Food Security, Livelihoods, Agriculture and Nutrition Assessment
April/May 2008 Page 43
7 MAIN PROBLEMS & PRIORITIES OF HOUSEHOLDS AND KEY
INFORMANTS
7.1 Main problems
Virtually all households, Focus Group participants and village Key Informants reported that they had more difficulties this year than last year or during previous crises.
The main difficulties identified by village Key Informants were price rise (48%), cold temperatures (33%), drought in the spring (9%) and unemployment (4%). The proportions varied between Zones, depending on their markets, severity of the winter this year, and reliance on agricultural production.
Households were much more unanimous to blame high food prices (98%) and high fuel prices (85%) as their main problems. These were followed by decreased income (78%), loss of job (62%), human sickness (62%), increased indebtedness (61%), harvest failure due to climatic problems (56%), animal diseases (44%), shortage of water and electricity (22%) and loss of assets due to natural disasters (17%).
Figure 17 – Main difficulties this year compared to last year according to households
0%
10%
20%
30%
40%
50%
60%
70%
80%
90%
100%
Incre
ased f
ood
price
Incre
ased c
ost
of
fuel
Decre
ased
incom
e
Loss o
f jo
b
Incre
ased d
ebt
Hum
an
sic
kness
Harv
est
failu
re
due t
o n
atu
ral
hazard
Anim
al dis
ease
Loss o
f assets
due t
o d
isaste
r
Wate
r and /
or
ele
ctr
icity
short
age
Pe
rce
nta
ge
(%
)
severely food insecure moderately food insecure food secure all rural
Food insecure households were more likely to mention decreased income as a problem, as well as loss of job, increased debt, human sickness and shortage of water and electricity, compared to food secure households.
7.2 Priorities
Focus Group participants were invited to mention their three main priorities for interventions to alleviate their difficulties. There was quite a large variation in the answers provided between the Zones and between the Groups inside a same Zone, rendering difficult the identification of priorities overall. Table 18 in the Annex 4 summarizes the results by Zone and region.
Generally speaking, infrastructure (roads, bridges, schools, health centres), services and supplies (including water, fuel, electricity, school feeding, credit at favourable interest rates) and employment (particularly for women) received prominence over short-term responses such as food rations, except in the Zones with the higher proportions of food insecure households. However food aid was regularly mentioned. It must also be noted that besides free rations, food aid can be used as a vehicle to transfer resources and contribute to the development of infrastructures and services, as well as in the framework of public work programmes (see Section 9).

Rural Tajikistan Emergency Food Security Assessment Joint Food Security, Livelihoods, Agriculture and Nutrition Assessment
April/May 2008 Page 44
8 CONCLUSIONS ON THE SEVERITY OF THE NUTRITION AND FOOD
SECURITY SITUATION
8.1 Summary of the situation analysis of nutrition and household food
security
1. Most households faced severe hardship during the winter as a result of cold temperatures and electricity and water shortages which have affected crops (frozen seeds and trees, irrigation interrupted), livestock (lack of fodder, diseases) and human health (poor hygiene and water-borne diseases, respiratory infections);
2. The winter wheat, potato and vegetables crops were affected and lower amounts will be
harvested this season. A number of animals also died and those that survived decreased their productivity. The extent of losses varies between Zones but is closely associated with the food insecurity observed amongst households;
3. Even though prices have risen since 2006, inflation rose sharply at the end of 2007/early 2008,
affecting particularly fuel and the staple food, wheat; 4. Salaries, pensions or allowances were not increased, or not enough, to compensate for the higher
cost of living, and unemployment remained widespread in rural areas. As a result, the purchasing power of households, in real terms, deteriorated;
5. The above points illustrate acute adverse conditions in 2007/08 which superimposed on chronic
difficulties. This situation forced households to:
� increase out-migration and get into debt for that (expensive ticket fare);
� sell their livestock to generate income, and thus deplete their herd and be deprived of dairy products for some time, until they re-stock (if they can);
� consume or lose their seed stocks (frozen);
� forego the purchase of fertilizer and pesticide, and get lower yields as a result;
� increase their indebtedness to cover food and health expenditures, and assist members to migrate;
� decrease their food consumption (less quantities, less variety, particularly of animal products);
� limit children’s attendance to school (lack of clothes, cold classrooms);
� forego health treatments (too expensive, high cost of the fees, dysfunctional health services).
6. While acute malnutrition rates amongst under-5 children were not alarming, the absence of improvement compared to the last survey in 2005 points towards negative effects of the winter and dietary changes on the nutritional status of young children and probably other individuals with increased nutritional needs (elderly, sick, pregnant and lactating women). Young children were not fed frequently enough and with a diet of sufficient quality, contributing to their low weight and height gains. In addition, the significant association of child stunting with food insecurity reflects the long-term nature of the economic and food difficulties faced by many households.
8.2 Groups most affected by food insecurity and at risk for their lives and
livelihoods
8.2.1 Summary characteristics of food insecure households
Most of the severely food insecure households are chronically food insecure, i.e. food insecure even in ‘normal’ times, but their plea was made worse by the conjunction of the harsh winter and high food
Rural Tajikistan Emergency Food Security Assessment Joint Food Security, Livelihoods, Agriculture and Nutrition Assessment
April/May 2008 Page 45
and fuel prices (hence the need for immediate relief besides longer-term interventions). They typically lack assets (including animals and land) and rely heavily on external sources for their cash income (such as pensions) and food (gifts, borrowing, purchase on credit). These households include elderly living alone and families with a high dependency ratio (i.e. with a small number of income-earning members) and pursuing low income-earning activities, which do not benefit from reliable and significant remittances. Some of these families are women-headed households.
Moderately food insecure households are a mix of:
Households transitorily food insecure, i.e. ‘usually’ at the brink of food insecurity and who often face difficulties with securing a proper diet throughout the year and with building assets (livestock, savings for education and health expenses), but whose situation deteriorated this year as a result of the negative consequences of the winter and high prices. These households may not rely much on remittances and earn an income through self-employment and wage labour. The low level of remuneration received does not enable them to withstand economic shocks, but they may be able to recover (back to a fragile ‘food secure’ situation) if the difficulties do not last too long and if they can receive assistance to replenish their assets (e.g. animals) and reimburse their debts.
Poor households who are moderately food insecure on a chronic basis but who can benefit from some support from migrants or close relatives. Typically they would include non-isolated families hosting elderly or chronically sick or disabled members, and families depending on Dekhan lands for their crops and income.
The more resilient, food secure, households are those able to maintain a reasonable food consumption pattern and who did not deplete their livestock herd. They can also rely more on relatives’ and friends’ support. They tend to have more than one source of income, which also protected them somehow from the negative effects of the cold winter on the harvest and high prices. Compared to other households, government employment is more often mentioned as the main or second source of income. Although salaries may not be high, their relative regularity and in-kind advantages contribute to their better economic situations. These households also own more animals (e.g. more than 2 cattle, more than 5 sheep/goats) and assets (including some farm machinery and vehicles).
8.2.2 Distinction between chronic and transitory food insecurity
The separation of households who are transitory food insecure as a result of recent past events (winter, price rise) from households who are food insecure on a more permanent basis (chronically), is notoriously difficult and Tajikistan is no exception. It can be safely stated that most of the severely food insecure households are in addition chronically food insecure, due to the structural factors associated with their situation (age, family size, lack of land and animals, high unemployment). The severity of food insecurity compounds its duration, making relief support necessary and urgent.
It can be hypothesized that 30 to 40% of the moderately food insecure households are also chronically food insecure, using as a basis for this estimate: the proportion of stunting (almost 30%), the proportion of households with chronically sick members (23% are moderately food insecure), the proportion of households who rely on pensions or sale of own production for their income (about 21%). The remaining 60-70% of the moderately food insecure would thus represent those who have been affected by the high food and fuel prices, loss of harvest and animals during the winter, sicknesses and indebtedness, but who have some potential to recover if these difficulties do not persist and if they receive the right assistance on time.
In sum, amongst the 34% food insecure households in rural areas, the proportion of transitory food insecure households is tentatively estimated at 14-16% while 18-20% would be chronically food insecure, including 11% severely and 7%-9% moderately.
8.2.3 Tentative targeting criteria to identify food insecure households
Based on the above, some criteria can be proposed to identify food insecure households who may be targeted for interventions.

Rural Tajikistan Emergency Food Security Assessment Joint Food Security, Livelihoods, Agriculture and Nutrition Assessment
April/May 2008 Page 46
Table 3 – Targeting criteria to identify food insecure households
Severely food insecure (chronic) Moderately food insecure (chronic) Moderately food secure (transitory)
• Elderly living alone and not receiving significant or reliable support (remittances), predominantly Russian or non-Tajik ethnic groups
• Large families with only one able-working member and not receiving significant or reliable support (remittances) – Include women-headed households
• Additional screening: - no cattle, less than 3 sheep/goats and less than 3 poultry - limited/no cultivation - limited/no assets
• Families hosting elderly, chronically sick or disabled members and receiving some support (remittances, relatives nearby)
• Families not owning private land and relying on Dekhan farming and agricultural wage as their main source of income
• Additional screening: - no more than 1 cattle, no more than 5 sheep/goats and 5 poultry - no/limited vegetables and fruits production (for sale) - limited assets
• Families with relying on self-employment or wage labour as their main source of income, with high dependency ratio - Include women-headed households
• Additional screening: - no more than 1 cattle, no more than 5 sheep/goats and 5 poultry - no/limited vegetables and fruits production (for sale)
8.2.4 Estimated numbers of food insecure people in rural areas
Based on population data provided by the Institute of Statistics and other authorities, the number of food insecure individuals is estimated at 1.69 million, of which 581,698 are severely food insecure. A breakdown by Zone and regions is shown in Table 4 below. Based on a 14%-16% estimate, there would be from 694,000 to 793,000 transitory food insecure persons.
Table 4 – Estimated numbers of food insecure people by Zone and region
13 2,057 94,843 19% 18,020 33% 31,298 52% 49,318
14 106,395 711,578 5% 35,579 19% 135,200 24% 170,779
15 43,080 357,963 10% 35,796 29% 103,809 39% 139,606
17 30,140 192,893 12% 23,147 62% 119,594 74% 142,741
6 13,166 84,434 5% 4,222 14% 11,821 19% 16,042
8 7,386 41,095 2% 822 14% 5,753 16% 6,575
1 67,534 410,143 22% 90,231 17% 69,724 39% 159,956
5 45,066 314,729 20% 62,946 41% 129,039 61% 191,985
7 51,006 432,047 17% 73,448 17% 73,448 34% 146,896
9 18,351 138,492 19% 26,313 31% 42,933 50% 69,246
18 73,618 523,260 19% 99,419 29% 151,745 48% 251,165
19 22,835 180,413 20% 36,083 34% 61,340 54% 97,423
2 11,982 77,652 20% 15,530 23% 17,860 43% 33,390
3 26,187 116,665 5% 5,833 5% 5,833 10% 11,667
4 26,266 110,672 3% 3,320 15% 16,601 18% 19,921
10 100,864 531,843 2% 10,637 7% 37,229 9% 47,866
11 18,640 90,519 8% 7,242 18% 16,293 26% 23,535
12 58,980 271,166 2% 5,423 7% 18,982 9% 24,405
16 50,933 276,858 10% 27,686 21% 58,140 31% 85,826
774,486 4,957,265 12% 581,698 22% 1,106,643 34% 1,688,341
Su
gh
d
Region Households People
DR
D
(*) Zone 17: Number of households calculated as average of the other Zones (6.4 members)
Severely food insecureModerately food
insecureTotal food insecure
Zone
Number of People
Total
GB
AO
Kh
atl
on
8.3 Location of the food insecure and at risk households
8.3.1 Depth and magnitude of food insecurity
Five Zones in Khatlon region (1, 5, 9, 18 and 19), one Zone in Sughd region (2) and one Zone in DRD region (13) present the highest levels of severe food insecurity, with practically one out of 5 households affected. Of these Zones in Khatlon region, three Zones (5, 9 and 19), and another Zone in DRD region (17) present the highest level of global food insecurity, with more than half of the population affected by moderate or severe food insecurity).

Rural Tajikistan Emergency Food Security Assessment Joint Food Security, Livelihoods, Agriculture and Nutrition Assessment
April/May 2008 Page 47
Figure 18 – Distribution of households according to food security status in rural areas
0%
10%
20%
30%
40%
50%
60%
70%
80%
90%
100%
13
14
15
17 6 8 1 5 7 9
18
19 2 3 4
10
11
12
16
DRD GBAO Khatlon Sughd Total
Perc
enta
ge (
%)
severely food insecure moderately food insecure food secure
8.3.2 The case of Gorno-Badakshan Autonomous Oblast (GBAO)
GBAO is notoriously a region of high deprivation and malnutrition, and it is widely contended that its inhabitants are amongst the poorest in the whole country. However, this assessment as well as another food security survey done in 2005, have failed to demonstrate a poorer food consumption, access, livelihoods and coping strategies of GBAO households compared to others.
While the sampling approach chosen may explain some of this discrepancy (the jamoats randomly selected in the two Zones of the GBAO region may have not adequately represented the situation of the majority of the other areas, and the small number of households interviewed may have not provided a correct picture of the wider population), another possible explanation is the inadequacy of the data collection tools which have been used for this particular type of context. Closed-questions in a standard questionnaire do not enable an understanding of the multiple strategies, trade-offs and choices that households make on a daily basis to secure their living. Focus Group discussions, while appropriate for that, may have been done in too limited a timeframe to establish relationships of trust between the facilitators and the participants and be enlightened on the true conditions of the households.
Another hypothesis is that households did not report drastic changes in their food consumption patterns or coping strategies simply because they had already reached a stage where any further change would directly jeopardize their individual or household survival. Having been in a stage of deprivation for many years already, the hardship of this particular winter and high prices may not have affected them more than any of the previous shocks they had to face before.
The implication of this finding is that a follow-up assessment is recommended in GBAO using different data collection instruments and procedures. Discussions with local and international organizations having worked for a long time in the region, are needed to design the tools and identify indicators (quantitative and qualitative) which best reflect the nutritional, food and economic situation of these households.
8.3.3 Main factors associated with food insecurity and risks for lives and livelihoods
Food insecurity among rural households is the result of both structural and conjectural factors. Box 5 lists the main ones and shows (in a rather simplistic way) how they contribute to chronic and transitory, severe and moderate, food insecurity.
These factors should guide response options (see Section 9). However, further fine-tuning is possible by examining the combination of contextual factors influencing nutrition and livelihoods in the various Zones. This review is useful in order to:
� confirm or fine-tune the selection of priority Zones, and
� identify the main sectors requiring interventions, such as health, water, education, agriculture, employment etc.
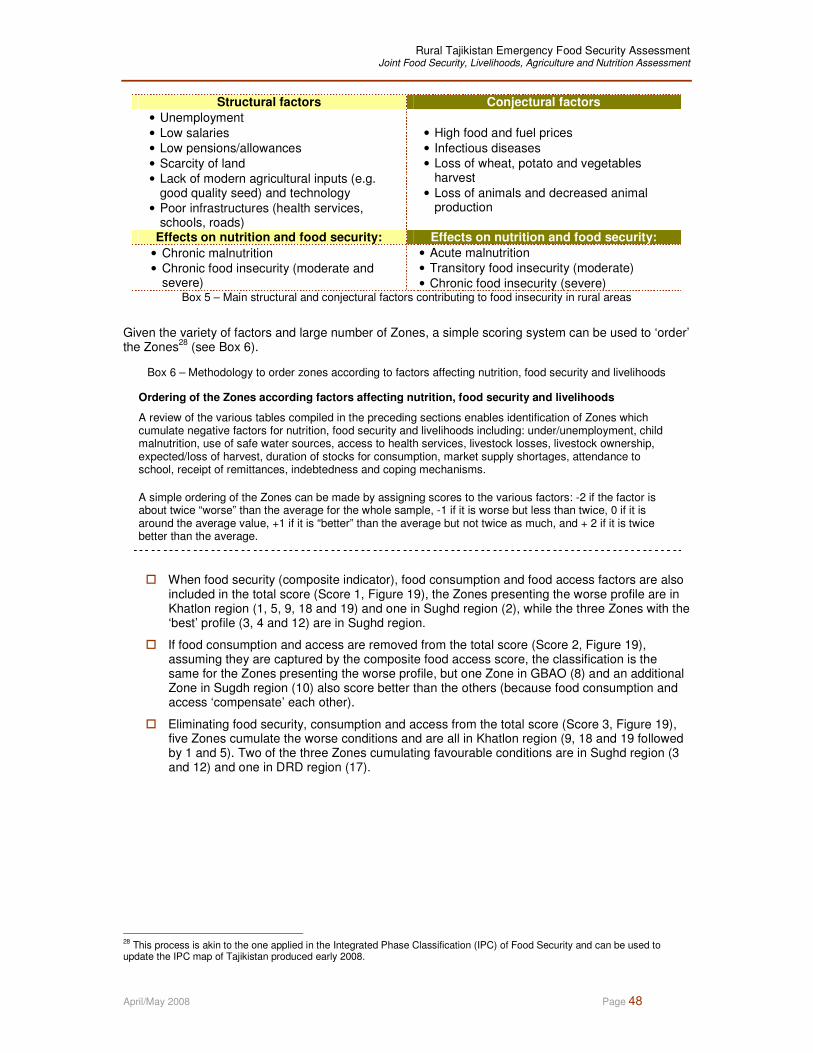
Rural Tajikistan Emergency Food Security Assessment Joint Food Security, Livelihoods, Agriculture and Nutrition Assessment
April/May 2008 Page 48
Structural factors Conjectural factors
• Unemployment • Low salaries • Low pensions/allowances • Scarcity of land • Lack of modern agricultural inputs (e.g.
good quality seed) and technology • Poor infrastructures (health services,
schools, roads)
• High food and fuel prices • Infectious diseases • Loss of wheat, potato and vegetables
harvest • Loss of animals and decreased animal
production
Effects on nutrition and food security: Effects on nutrition and food security:
• Chronic malnutrition • Chronic food insecurity (moderate and
severe)
• Acute malnutrition • Transitory food insecurity (moderate) • Chronic food insecurity (severe)
Box 5 – Main structural and conjectural factors contributing to food insecurity in rural areas
Given the variety of factors and large number of Zones, a simple scoring system can be used to ‘order’ the Zones
28 (see Box 6).
Box 6 – Methodology to order zones according to factors affecting nutrition, food security and livelihoods
Ordering of the Zones according factors affecting nutrition, food security and livelihoods
A review of the various tables compiled in the preceding sections enables identification of Zones which cumulate negative factors for nutrition, food security and livelihoods including: under/unemployment, child malnutrition, use of safe water sources, access to health services, livestock losses, livestock ownership, expected/loss of harvest, duration of stocks for consumption, market supply shortages, attendance to school, receipt of remittances, indebtedness and coping mechanisms.
A simple ordering of the Zones can be made by assigning scores to the various factors: -2 if the factor is about twice “worse” than the average for the whole sample, -1 if it is worse but less than twice, 0 if it is around the average value, +1 if it is “better” than the average but not twice as much, and + 2 if it is twice better than the average.
� When food security (composite indicator), food consumption and food access factors are also included in the total score (Score 1, Figure 19), the Zones presenting the worse profile are in Khatlon region (1, 5, 9, 18 and 19) and one in Sughd region (2), while the three Zones with the ‘best’ profile (3, 4 and 12) are in Sughd region.
� If food consumption and access are removed from the total score (Score 2, Figure 19), assuming they are captured by the composite food access score, the classification is the same for the Zones presenting the worse profile, but one Zone in GBAO (8) and an additional Zone in Sugdh region (10) also score better than the others (because food consumption and access ‘compensate’ each other).
� Eliminating food security, consumption and access from the total score (Score 3, Figure 19), five Zones cumulate the worse conditions and are all in Khatlon region (9, 18 and 19 followed by 1 and 5). Two of the three Zones cumulating favourable conditions are in Sughd region (3 and 12) and one in DRD region (17).
28 This process is akin to the one applied in the Integrated Phase Classification (IPC) of Food Security and can be used to update the IPC map of Tajikistan produced early 2008.

Rural Tajikistan Emergency Food Security Assessment Joint Food Security, Livelihoods, Agriculture and Nutrition Assessment
April/May 2008 Page 49
Figure 19 – Classification of zones according to factors affecting nutrition, food security and livelihoods
-19
-14
-9
-4
1
6
11
16
13
14
15
17 6 8 1 5 7 9
18
19 2 3 4
10
11
12
16
DRD GBAO Khatlon Sughd
Score 1 (min =-32 / max =+32 ) Score 2 (min= -28/ max= +28) Score 3 (min= -26/ max= +36)
These scores are relative to the context of Tajikistan in the framework of this particular assessment and are not based on international standards
The main factors explaining the poor situation of the Zones in Khatlon are:
� Poor access to safe water sources;
� High level of wheat, potato and vegetables damage due to the winter and dry spring;
� Low proportion of households apparently receiving remittances from their migrant members;
� High proportion of households indebted;
� High proportion of households having adopted severe, negative coping mechanisms;
� In Zone 19, widespread shortages of food supplies on markets also contributed to the low scoring.
In Zone 2, the households’ situation in terms of receipt of remittances and indebtedness was better, but access to health services was worse and child malnutrition rates tended to be higher.
In Zone 13 in DRD region, besides poor access to health services and tendency towards higher child malnutrition, the widespread adoption of negative coping mechanisms justify the consideration of this Zone for possible interventions.
Rural Tajikistan Emergency Food Security Assessment Joint Food Security, Livelihoods, Agriculture and Nutrition Assessment
April/May 2008 Page 50
9 SCENARIO AND RESPONSE OPTIONS
9.1 Forecast and scenario for the next 12 months June 2008-June 2009
Structural factors of food insecurity and malnutrition are not expected to change in the near future, with the exception perhaps of salary and pension levels if a government decision is made to index them to the inflation rates (unlikely). As a result, the situation of the majority of the chronically food insecure households is not expected to improve in the next 12 months, in the absence of external assistance.
For the 14%-16% transitory (moderately) food insecure households, the evolution of their situation in the next 12 months depends essentially of the conjectural factors which contributed to food insecurity at the time of the assessment, including high food and fuel prices, high prevalence of diseases and associated health expenditures, low wheat, potato and vegetables harvest, and decreased livestock herds and animal production. The next paragraphs describe the most likely scenario envisaged for the next 12 months.
9.1.1 In the next 4-5 months (up to October 2008)
� The wheat and potato harvested in June/July, though lower than usual, should contribute to ease the food consumption and access situation of households for 1 to 3 months. This also assumes ‘normal’ second season harvests of wheat and potatoes. Nonetheless, the assessment show that the gap in annual wheat production will be around 18%, assuming the second and third harvests, making up the other 40% of annual wheat production, will correspond to average annual yield, which given the unusually dry conditions may not be the case. In the same time, the gap in annual potato production will remain at around 25-30%.In addition to the loss of spring potato harvest; some 54% of the seed potato was frozen during the winter.
� Some seasonal labour in agriculture should be accessible for those able to work.
� However, temperatures will begin to fall as the autumn approaches, increasing the need for fuel expenditures. Education expenditures will also be required when the school period resumes.
� Given the typical income sources of moderately food insecure households, it seems unlikely that they will be able to replenish their animal herds and reimburse the additional debts incurred this year, as the new migrants may not be in a position to find a job and send remittances quickly enough.
� Food availability and access will tighten again as households’ stocks are exhausted, prices of imported food are high on local markets (no decrease is expected, given the international market perspectives and the high dependence of Tajikistan on imports). Local market supplies will also become more erratic for some commodities, particularly animal products, vegetables and fruits.
9.1.2 From November 2008 to June/July 2009
� The food security and nutritional situation will depend on climatic conditions and natural disasters (avalanches, landslides). A resumption of cold temperatures will once again increase fuel expenditures, risks of electricity and water shortages (and subsequent human diseases as well as negative impact on irrigated crops), and affect animal production and survival.
� Access to seeds and agricultural inputs will also be constrained by the poor preceding harvests and losses of income of the households in 2007/08. As a result, the acreage planted may be lower. Opportunities for agricultural wage labour will shrink accordingly.
� In this post-harvest period, most households purchase their food on local shops and markets. The expected persistence of high food and fuel prices (pass-through from the international markets), in the absence of increased levels of wages and pensions, will render food access always more difficult. Households will continue to switch to less nutritious, less expensive

Rural Tajikistan Emergency Food Security Assessment Joint Food Security, Livelihoods, Agriculture and Nutrition Assessment
April/May 2008 Page 51
foods (e.g. staples rather than minerals- and vitamins-rich meat, dairy products and fresh products), reduce portions or skip meals. While efforts are clearly being made to shield children from these restrictions, the combination of less diverse diet with increased infectious diseases in winter times, will continue to prevent improvements of their nutritional status on the short-term (wasting) and longer-term (stunting).
� The scope for activating non-erosive coping strategies, such as out-migration, will be limited as many will already have migrated the year before and funds to pay for the ticket fare will be exhausted. Therefore households will have to resort again to damaging strategies such as reducing the amount and quality of food consumed, foregoing health treatments, selling their already reduced livestock, and taking children out of school for more or less extended periods of time.
� Provided they can guarantee repayment (perhaps through the additional migrants), some households may increase the level of their debts or negotiate longer grace periods for reimbursement. This will however affect their future livelihoods, as much of the income received will go towards debt repayment instead of being invested for productive activities or contributing to better diet and health treatment.
In sum:
1. The situation of food insecure households can be expected to improve for a short while until the beginning of the autumn 2008 but they will enter the fall season in a weaker economic situation than last year. Chronically food insecure households will face difficulties earlier (as from August) as their food stocks are typically consumed in less than 2 months and they will have less income than before (lack of animals, debts, remittances absent or insufficient).
2. Even assuming ‘normal’ weather conditions during the next winter and spring 2009, food insecure households will be at increased risk of worsening of their nutritional and economic situation due to the losses incurred last year. Given their high dependence on markets for their food access, increased non-food expenditures for heating and clothing, and use of negative coping capacities, the severity of food insecurity will deepen and some of the transitory food insecure households will fall into chronic food insecurity. Only those able to receive remittances from the last wave of migrants will be better able to cope.
9.2 Response options in the short- and medium-term
The situation analysis and forecasting indicate that assistance is required to prevent a worsening of food insecurity and malnutrition in the next 12 months, under two main modalities and timelines: short-term/early interventions, and medium-term interventions. The first ones aim at protecting lives and already jeopardized livelihoods, while the second ones aim at protecting and strengthening livelihoods.
9.2.1 Short-term, early interventions are needed to:
� Mitigate the most negative effects and address immediate factors of severe food insecurity and malnutrition, namely a poor diet, consumption of dirty water and lack of health care. Interventions may include:
� direct food and/or cash or vouchers distributions; � nutritional assistance to the most vulnerable groups � urgent repairs of water pumps; � distribution of essential drugs to health centres and/or cash support for vulnerable
households to purchase drugs and pay for treatment.
� Prepare for the next winter season to avoid shortages and cuts of fuel, electricity, water and food for the most food insecure, as well as disruption of school and health facilities. Interventions range from:
� provision and/or cash support for the procurement of fuel and build up of fuel stocks at village level;
� repair/extension of electricity networks; � repairs/enhancement of school and health centre buildings to minimize cold and ensure
continuous functioning;

Rural Tajikistan Emergency Food Security Assessment Joint Food Security, Livelihoods, Agriculture and Nutrition Assessment
April/May 2008 Page 52
� provision of drugs to health centres.
These actions should be launched immediately given that:
� the severely food insecure are unlikely to benefit from any wheat, potato or vegetable harvests and/or animal products even now, and are already jeopardizing their health and nutritional status;
� preparedness activities should take place before it is too late to mobilize commodities and funding.
9.2.2 Medium-term interventions are required at the same time to:
� Encourage planting for the next winter wheat, potato and vegetables season. Assistance may include:
� distribution or vouchers for farmers to procure quality seeds, fertilizer, and agricultural machinery services and fuel;
� repair of irrigation systems, possibly using food- and/or cash-for-work modalities � protecting seeds from being consumed by distributing a food ration at the same time.
� Set up or strengthen safety nets for chronically food insecure households who cannot ensure an adequate food access even in normal times. Activities may range from:
� direct food, cash, vouchers or a combination of food and cash distributions; this assistance may be conditional to attendance at school or at health services in some cases;
� increased pensions and allowances (particularly to match the inflation rates);
� Facilitate access to, and retain children at school. Interventions include:
� school feeding programmes, including a ration for the whole household and assistance for teachers as well (many Focus Group participants reported teachers to be among the last wave of migrants given the poor living conditions in the villages);
� repairs and winterization of school buildings, possibly using food- or cash-for-work modalities (Key informants and discussions with school directors showed the need sharing awareness on existing regional and international programs providing grants in that purpose);
� cash or winter clothes distribution to families with a large number of school-age children.
� Improve access to, and functioning of health centres. Assistance in this sector may range from:
� repairs and winterization of health facilities, possibly using food- or cash-for-work modalities;
� provision of essential drugs; � cash or vouchers for the poorest households and individuals to pay for drugs, treatment
and transportation to health facilities.
� Improve access to, and performance of local markets. In this area, both traders and customers can be targeted directly and indirectly through:
� credit and/or vouchers for fuel and transportation of commodities, and/or support to create associations that can pool the transport and storage of goods (if this does not exist already);
� repair of roads and bridges, possibly using food- or cash-for-work modalities; � cash and/or vouchers to households to restore the demand and subsequent supply
response by traders.
Unemployment is a major factor of food insecurity as it deprives households from the income needed to cover their food and other needs. The interventions above cannot address this fundamental problem, but several of them can use food- or cash-for-work modalities similar to public works programmes. They should be launched at periods of low labour demand for agricultural and non-agricultural works. The seasonal calendars developed during Focus Group participants can be used for this purpose (see Annex 3n).

Rural Tajikistan Emergency Food Security Assessment Joint Food Security, Livelihoods, Agriculture and Nutrition Assessment
April/May 2008 Page 53
9.3 Analysis of response options: Strengths, Weaknesses, Opportunities and
Threats
To help prioritize and eventually recommend interventions among the various options mentioned previously, a SWOT analysis of the main ones is presented below.
9.3.1 SWOT analysis of food distributions (targeted food rations)
Strengths Weaknesses
• Enhance nutritional value of the diet consumed by beneficiaries, especially if fortified commodities are included and if distributions coincide with times of shortages of fresh food supplies on local markets
• Maintain access to food despite higher prices • Provide economic transfer (cash saved for other
essential needs) and decrease need to sell assets such as animals or to migrate
• Protect against seeds consumption if distributions coincide with seed distributions or planting time
• Timing of food distributions must be fine-tuned
and pre-positioning may be required to ensure distributions during winter times in inaccessible areas;
• Potential disincentive to local traders (more ‘at risk’ than local producers given the very limited amount of local produce sold on markets normally)
• No guarantee that target beneficiaries within the household (e.g. malnourished children, elderly, sick, pregnant and lactating women) benefit from a fair share of the ration
• Do not address the basic causes of food insecurity
Opportunities Threats
• WFP has experience in food aid distributions in
several areas of the country • Food aid respond to priorities of households, even
if not always mentioned at the top of the list; • At the time of the assessment, food aid procured
and delivered by WFP remained cheaper than the cost of food bought by households directly;
• Can be combined with seeds distributions (protection ration) in collaboration with FAO and others
• Decreasing resources for food aid generally (not only for WFP and for Tajikistan)

Rural Tajikistan Emergency Food Security Assessment Joint Food Security, Livelihoods, Agriculture and Nutrition Assessment
April/May 2008 Page 54
9.3.2 SWOT analysis of supplementary feeding for vulnerable individuals
Strengths Weaknesses
• Directly improves the diet of individuals most at risk for their nutritional status (moderately malnourished children, under-3 children in chronically food insecure households, elderly, chronically sick, pregnant and lactating women)
• Can use existing village infrastructures (health
centres, schools) as a support for distributions
• Supplementary rations may be shared with other
household members and thus not benefit fully the target individuals
• Need resources (staff, time, funds) to target and monitor beneficiaries
• Distributions must be carefully planned to avoid disruptions of supplies and subsequent loss of benefits for the nutritional status
• Sustainability is not ensured as Government health services may not have the capacity and funding to provide regular nutritional support to vulnerable individuals
• Does not address the basic causes of malnutrition
Opportunities Threats
• Combines supplementary rations with household food rations for the chronically severely and moderately food insecure households
• Attracts target individuals to health centres to benefit from other services
• Poor health infrastructures and resources unable
to provide services needed by beneficiaries • Care-takers lack time to take children or other
dependent individuals to health services and/or to attend specific sessions
9.3.3 SWOT analysis of school feeding
Strengths Weaknesses
• Encourages child attendance at school, thus contributing to strengthen future livelihoods
• Provides economic transfer to households (cash
saved for other basic needs), provided the ration is of sufficient size and economic value
• As target schools are likely to be located in
remote areas, this programme can be resources- and staff-intensive to administer and monitor
• Sustainability is not ensured, as transfer to the Government may not be possible in the near future given the economic and budgetary situation
• Distributions are suspended during the school holidays season, while food assistance may still be required by the most vulnerable households with school-age children
• Do not address other causes of poor school attendance including inability to pay for clothes, school materials and transportation
Opportunities Threats
• WFP has experience in school feeding
programmes in several areas of the country • School feeding is highly appreciated by
households • Tajik population has a tradition of being educated
and values education for both boys and girls • Can be combined with school garden activities to
further enhance children’s diet and possibly teachers’ income (with due caution on modalities), in collaboration with FAO and others
• Many teachers were reported to have emigrated as a result of the harsh winter and economic difficulties (high prices, low salaries)
• Poor school infrastructure (cold classrooms in
particular) is a strong disincentive for children to attend

Rural Tajikistan Emergency Food Security Assessment Joint Food Security, Livelihoods, Agriculture and Nutrition Assessment
April/May 2008 Page 55
9.3.4 SWOT Analysis for Cash transfers
Strengths Weaknesses
• Enable beneficiaries to decide on their priorities, including food and non-food needs
• Reduce the need for assets depletion (e.g. sale of
livestock), excess out-migration and indebtedness • Restore households’ demand for food on local
markets, hence encourage local economy • May facilitate access to formal credit and bank
institutions
• Transfers need constant adjustments to keep up
with inflation and maintain the same economic value
• Can contribute to higher prices on local markets if traders cannot increase their supplies in a timely manner or adopt speculative behaviours
• Traders may over-estimate their capacity to increase supplies, particularly in remote areas
• Target beneficiaries may be the less likely to have a bank account and/or to be able to travel to the next village where cash transfers are effected
Sustainability of transfers to chronically food insecure (e.g. lonely elderly) is not guaranteed given the lack of government budget
Opportunities Threats
• Can use existing systems for pensions and salary
transfers, and possibly be combined with them (e.g. ‘extra’ allowance to the most vulnerable pensioners)
• Population is literate, thus facilitating communication on, and understanding of the programme
• Can be conditional to the use of services such as health centres and schools
• Donors are increasingly interested in non-food responses to crises, particularly cash transfers
• Implementing partners with experience in cash
transfers and Tajikistan difficult to find although some have recently implemented these following the winter crisis
• If transfers are conditional to health and/or school
attendance, services may not be able to respond to the demand (infrastructures, supplies, staff)
• Persistent and large price increases may render
the programme less cost-effective than food aid
9.3.5 SWOT Analysis for Vouchers transfers
Strengths Weaknesses
• A fixed bundle of commodities (food and/or non-
food) or services (e.g. access to health services) is guaranteed in physical or monetary terms (but beneficiaries still have more choices than with a food ration for instance)
• Vouchers redemption can be staged along time to coincide with periods of shortages or high prices
• Traders can programme their supplies and local economy is stimulated
• Restrict beneficiaries’ choice to the commodities or services authorized by the voucher
• If expressed in monetary terms, must be constantly adjusted to keep up with inflation and maintain the same economic value
• Can be heavy to administer and monitor • Can exclude some traders who cannot advance
the funds until they redeem the vouchers
Opportunities Threats
• Vouchers can be conditional to attendance to services (e.g. health)
• Population is literate thus facilitating communication on, and understanding of the programme
• Donors are increasingly interested in alternatives to food aid in-kind
• Implementing partners with experience in voucher
transfers and Tajikistan difficult to find • If vouchers are conditional to health and/or school
attendance, services may not be able to respond to the demand (infrastructures, supplies, staff)
• If expressed in monetary terms, large price increased may render the programme less cost-effective than food aid
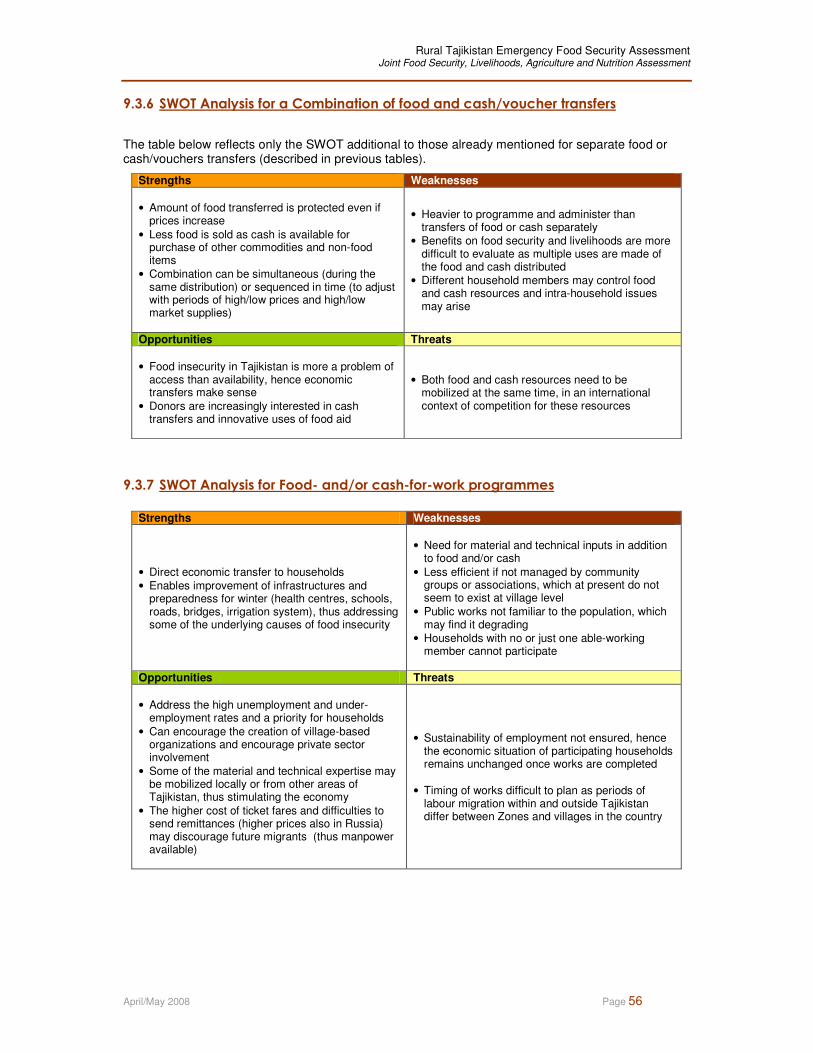
Rural Tajikistan Emergency Food Security Assessment Joint Food Security, Livelihoods, Agriculture and Nutrition Assessment
April/May 2008 Page 56
9.3.6 SWOT Analysis for a Combination of food and cash/voucher transfers
The table below reflects only the SWOT additional to those already mentioned for separate food or cash/vouchers transfers (described in previous tables).
Strengths Weaknesses
• Amount of food transferred is protected even if
prices increase • Less food is sold as cash is available for
purchase of other commodities and non-food items
• Combination can be simultaneous (during the same distribution) or sequenced in time (to adjust with periods of high/low prices and high/low market supplies)
• Heavier to programme and administer than transfers of food or cash separately
• Benefits on food security and livelihoods are more difficult to evaluate as multiple uses are made of the food and cash distributed
• Different household members may control food and cash resources and intra-household issues may arise
Opportunities Threats • Food insecurity in Tajikistan is more a problem of
access than availability, hence economic transfers make sense
• Donors are increasingly interested in cash transfers and innovative uses of food aid
• Both food and cash resources need to be mobilized at the same time, in an international context of competition for these resources
9.3.7 SWOT Analysis for Food- and/or cash-for-work programmes
Strengths Weaknesses
• Direct economic transfer to households • Enables improvement of infrastructures and
preparedness for winter (health centres, schools, roads, bridges, irrigation system), thus addressing some of the underlying causes of food insecurity
• Need for material and technical inputs in addition
to food and/or cash • Less efficient if not managed by community
groups or associations, which at present do not seem to exist at village level
• Public works not familiar to the population, which may find it degrading
• Households with no or just one able-working member cannot participate
Opportunities Threats
• Address the high unemployment and under-
employment rates and a priority for households • Can encourage the creation of village-based
organizations and encourage private sector involvement
• Some of the material and technical expertise may be mobilized locally or from other areas of Tajikistan, thus stimulating the economy
• The higher cost of ticket fares and difficulties to send remittances (higher prices also in Russia) may discourage future migrants (thus manpower available)
• Sustainability of employment not ensured, hence the economic situation of participating households remains unchanged once works are completed
• Timing of works difficult to plan as periods of
labour migration within and outside Tajikistan differ between Zones and villages in the country
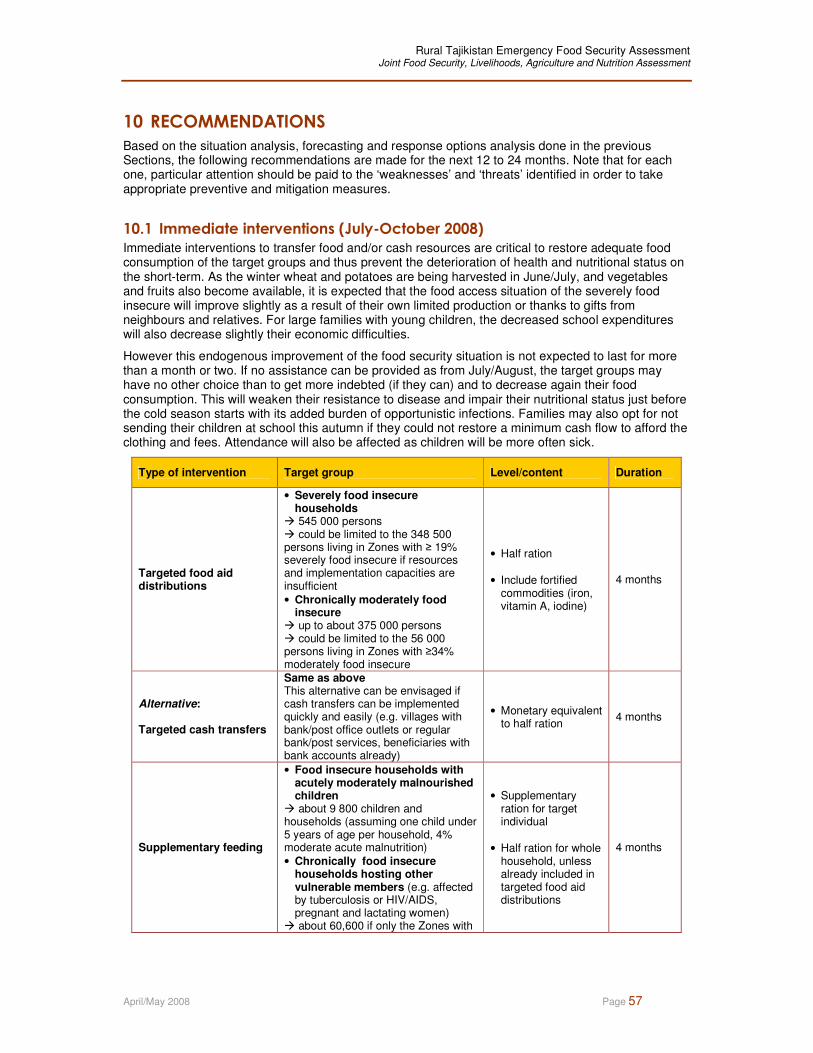
Rural Tajikistan Emergency Food Security Assessment Joint Food Security, Livelihoods, Agriculture and Nutrition Assessment
April/May 2008 Page 57
10 RECOMMENDATIONS
Based on the situation analysis, forecasting and response options analysis done in the previous Sections, the following recommendations are made for the next 12 to 24 months. Note that for each one, particular attention should be paid to the ‘weaknesses’ and ‘threats’ identified in order to take appropriate preventive and mitigation measures.
10.1 Immediate interventions (July-October 2008)
Immediate interventions to transfer food and/or cash resources are critical to restore adequate food consumption of the target groups and thus prevent the deterioration of health and nutritional status on the short-term. As the winter wheat and potatoes are being harvested in June/July, and vegetables and fruits also become available, it is expected that the food access situation of the severely food insecure will improve slightly as a result of their own limited production or thanks to gifts from neighbours and relatives. For large families with young children, the decreased school expenditures will also decrease slightly their economic difficulties.
However this endogenous improvement of the food security situation is not expected to last for more than a month or two. If no assistance can be provided as from July/August, the target groups may have no other choice than to get more indebted (if they can) and to decrease again their food consumption. This will weaken their resistance to disease and impair their nutritional status just before the cold season starts with its added burden of opportunistic infections. Families may also opt for not sending their children at school this autumn if they could not restore a minimum cash flow to afford the clothing and fees. Attendance will also be affected as children will be more often sick.
Type of intervention Target group Level/content Duration
Targeted food aid distributions
• Severely food insecure households
� 545 000 persons � could be limited to the 348 500 persons living in Zones with ≥ 19% severely food insecure if resources and implementation capacities are insufficient • Chronically moderately food
insecure � up to about 375 000 persons � could be limited to the 56 000 persons living in Zones with ≥34% moderately food insecure
• Half ration • Include fortified
commodities (iron, vitamin A, iodine)
4 months
Alternative: Targeted cash transfers
Same as above This alternative can be envisaged if cash transfers can be implemented quickly and easily (e.g. villages with bank/post office outlets or regular bank/post services, beneficiaries with bank accounts already)
• Monetary equivalent to half ration
4 months
Supplementary feeding
• Food insecure households with acutely moderately malnourished children
� about 9 800 children and households (assuming one child under 5 years of age per household, 4% moderate acute malnutrition) • Chronically food insecure
households hosting other vulnerable members (e.g. affected by tuberculosis or HIV/AIDS, pregnant and lactating women)
� about 60,600 if only the Zones with
• Supplementary ration for target individual
• Half ration for whole
household, unless already included in targeted food aid distributions
4 months

Rural Tajikistan Emergency Food Security Assessment Joint Food Security, Livelihoods, Agriculture and Nutrition Assessment
April/May 2008 Page 58
Type of intervention Target group Level/content Duration
≥ 19% severe food insecurity are targeted
29 (considering that 15% food
insecure households host a chronically sick member)
School feeding
• Villages in Zones with ≥ 50% food insecure households
• Chronically food insecure households with primary school-aged children
• Ration for school child
• Half ration for the
whole household, unless already included in targeted food aid distributions
2 months (beginning of school year)
Food-for-work
• Food insecure households with able-working members in Zones with ≥ 50% food insecure
� up to 26,000 households (based on 86 000 food insecure households in these Zones and about 30% participation rate)
• Full ration per working member per day
• Priority activities: � winterization of schools, health centres � repair water pumps � repair irrigation systems � roads
3 months (after harvests)
Alternative/combination: Cash-for-work
Same as above This alternative can be envisaged if cash transfers can be implemented quickly and easily (e.g. villages with bank/post office outlets or regular bank/post services, beneficiaries with bank account already)
• Monetary equivalent of full ration per working member per day
3 months (after harvests)
Education package
• Villages in Zones with ≥ 50% food insecure
• Chronically food insecure households with school-age children
• School materials • Clothing
One-off
Health centre support pre-winter
Villages in Zones with ≥ 50% food insecure
• Drugs • Repair water
system • Winterization
One-off
10.2 Short- and medium-term interventions (November 2008-June 2009)
While the timing of these interventions follows the above assistance, preparations and mobilization of resources should start at the same time.
Type of intervention
Target group Level/content Duration
Targeted food aid and/or cash transfers
• Severely food insecure households
� 545 000 persons � could be limited to the 348 500 persons living in Zones with ≥ 19% severely food insecure if resources and implementation capacities are insufficient
• Half ration or equivalent in monetary terms
• If food aid: include
fortified commodities (iron, vitamin A, iodine)
8 months Combine the assistance with seeds distributions, if any
Supplementary feeding
• Food insecure households with acutely moderately malnourished children (residual caseload)
• Supplementary ration for target individual
4 months
29 Currently WFP in Tajikistan assists 30,000 individuals affected by tuberculosis

Rural Tajikistan Emergency Food Security Assessment Joint Food Security, Livelihoods, Agriculture and Nutrition Assessment
April/May 2008 Page 59
Type of intervention
Target group Level/content Duration
� about 7 400 children and households (assuming one child under 5 years of age per household, assuming a decrease in moderate acute malnutrition to 3%) • Chronically food insecure
households hosting other vulnerable members (e.g. affected by tuberculosis or HIV/AIDS, pregnant and lactating women)
� about 50,000 (assuming a progressive decrease in the caseload)
• Half ration for whole household, unless already included in targeted food aid distributions
School feeding
• Villages in Zones with ≥ 50% food insecure households
• Chronically food insecure
households with primary school-aged children
• Ration for school child • Half ration or equivalent
in cash for the whole household, unless already included in targeted food aid/ cash distributions
8 months (school year)
Food- or cash-for-work (combined or sequenced)
• Food insecure households with able-working members in Zones with ≥ 50% food insecure
� up to 26,000 households (based on 86 000 food insecure households in these Zones and about 30% participation rate)
• Full ration or monetary equivalent per working member per day
• Priorities: � building schools, health centres (if future staff and supplies are ensured) � extend irrigation systems � roads
3 months (after harvests and during slow labour times)
Micro-credit • Villages in Zones with ≥ 50% food
insecure
• Food insecure households
• Level to adjust on a case-by-case basis
• Priorities: � Purchase agricultural inputs � Small businesses and traders
To adjust on a case-by-case basis
In-kind distribution or vouchers for agricultural inputs, animal feed, veterinary services
• Villages in Zones with highest losses during 2007/08 winter and 2008 spring
• Food insecure households with access to land and manpower
• Content to adjust. • May include: � quality seeds (in-kind or vouchers) � fertilizer (in-kind or vouchers) � fuel (voucher) � agricultural machinery (voucher) � fodder/feed (in-kind or vouchers) � veterinary services (vouchers)
One-off, prior to planting season Combine with food/cash transfers
10.3 Monitoring and Evaluation
The nutritional, food security and agricultural situation needs to be closely monitored to adjust the recommended interventions as appropriate. A formal food security and nutrition monitoring system, integrating information on climatic conditions, agriculture, livestock, markets, food consumption, health and nutrition would fit this purpose. Building on what the Government of Tajikistan already has in place, the system could be set up in two phases:
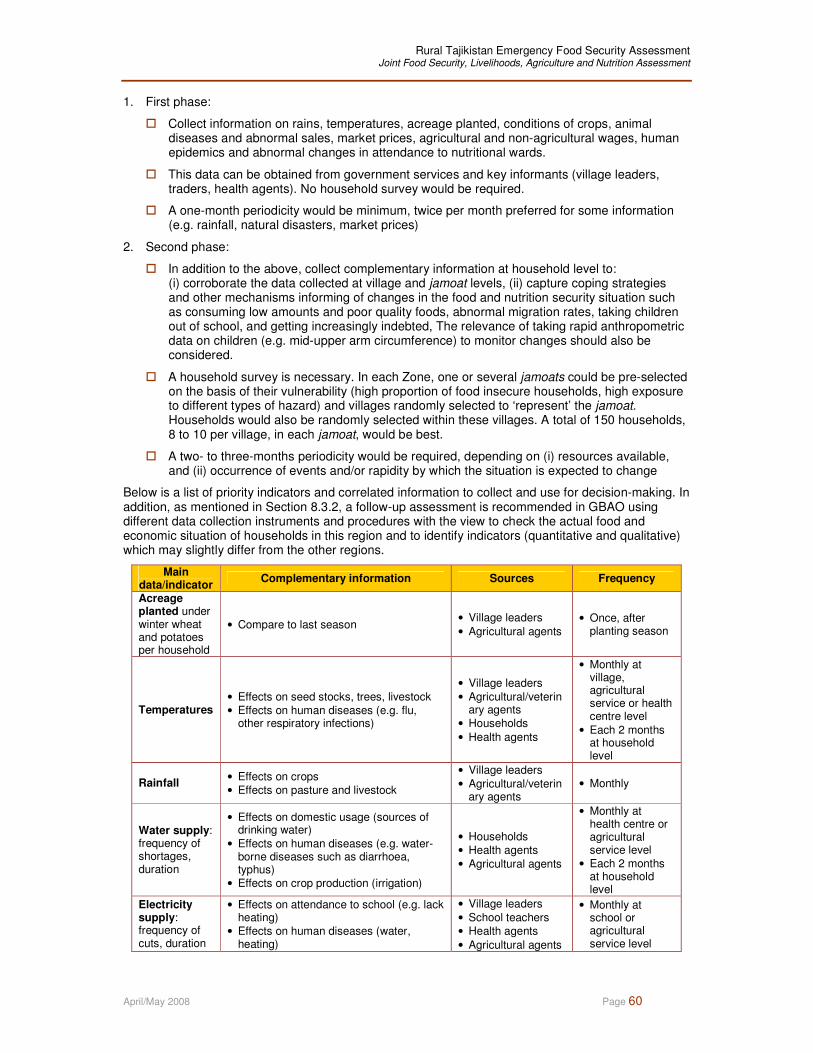
Rural Tajikistan Emergency Food Security Assessment Joint Food Security, Livelihoods, Agriculture and Nutrition Assessment
April/May 2008 Page 60
1. First phase:
� Collect information on rains, temperatures, acreage planted, conditions of crops, animal diseases and abnormal sales, market prices, agricultural and non-agricultural wages, human epidemics and abnormal changes in attendance to nutritional wards.
� This data can be obtained from government services and key informants (village leaders, traders, health agents). No household survey would be required.
� A one-month periodicity would be minimum, twice per month preferred for some information (e.g. rainfall, natural disasters, market prices)
2. Second phase:
� In addition to the above, collect complementary information at household level to: (i) corroborate the data collected at village and jamoat levels, (ii) capture coping strategies and other mechanisms informing of changes in the food and nutrition security situation such as consuming low amounts and poor quality foods, abnormal migration rates, taking children out of school, and getting increasingly indebted, The relevance of taking rapid anthropometric data on children (e.g. mid-upper arm circumference) to monitor changes should also be considered.
� A household survey is necessary. In each Zone, one or several jamoats could be pre-selected on the basis of their vulnerability (high proportion of food insecure households, high exposure to different types of hazard) and villages randomly selected to ‘represent’ the jamoat. Households would also be randomly selected within these villages. A total of 150 households, 8 to 10 per village, in each jamoat, would be best.
� A two- to three-months periodicity would be required, depending on (i) resources available, and (ii) occurrence of events and/or rapidity by which the situation is expected to change
Below is a list of priority indicators and correlated information to collect and use for decision-making. In addition, as mentioned in Section 8.3.2, a follow-up assessment is recommended in GBAO using different data collection instruments and procedures with the view to check the actual food and economic situation of households in this region and to identify indicators (quantitative and qualitative) which may slightly differ from the other regions.
Main data/indicator
Complementary information Sources Frequency
Acreage planted under winter wheat and potatoes per household
• Compare to last season • Village leaders • Agricultural agents
• Once, after planting season
Temperatures • Effects on seed stocks, trees, livestock • Effects on human diseases (e.g. flu,
other respiratory infections)
• Village leaders • Agricultural/veterin
ary agents • Households • Health agents
• Monthly at village, agricultural service or health centre level
• Each 2 months at household level
Rainfall • Effects on crops • Effects on pasture and livestock
• Village leaders • Agricultural/veterin
ary agents • Monthly
Water supply: frequency of shortages, duration
• Effects on domestic usage (sources of drinking water)
• Effects on human diseases (e.g. water-borne diseases such as diarrhoea, typhus)
• Effects on crop production (irrigation)
• Households • Health agents • Agricultural agents
• Monthly at health centre or agricultural service level
• Each 2 months at household level
Electricity supply: frequency of cuts, duration
• Effects on attendance to school (e.g. lack heating)
• Effects on human diseases (water, heating)
• Village leaders • School teachers • Health agents • Agricultural agents
• Monthly at school or agricultural service level
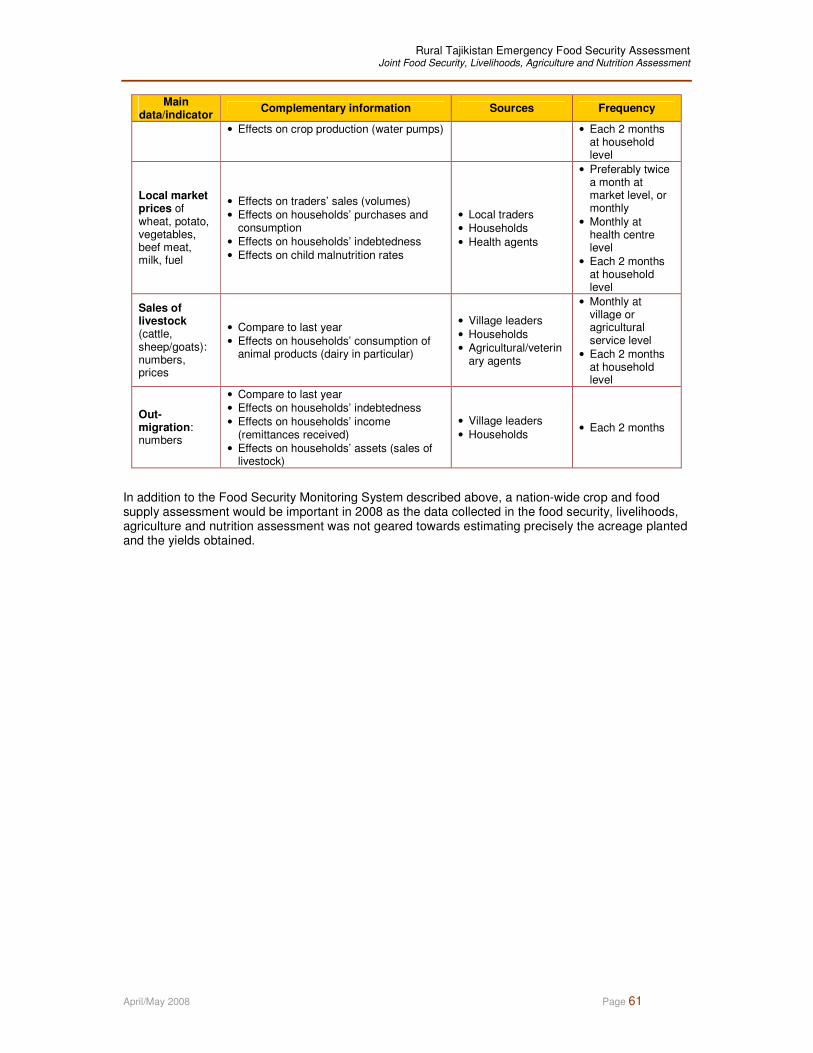
Rural Tajikistan Emergency Food Security Assessment Joint Food Security, Livelihoods, Agriculture and Nutrition Assessment
April/May 2008 Page 61
Main data/indicator
Complementary information Sources Frequency
• Effects on crop production (water pumps) • Each 2 months at household level
Local market prices of wheat, potato, vegetables, beef meat, milk, fuel
• Effects on traders’ sales (volumes) • Effects on households’ purchases and
consumption • Effects on households’ indebtedness • Effects on child malnutrition rates
• Local traders • Households • Health agents
• Preferably twice a month at market level, or monthly
• Monthly at health centre level
• Each 2 months at household level
Sales of livestock (cattle, sheep/goats): numbers, prices
• Compare to last year • Effects on households’ consumption of
animal products (dairy in particular)
• Village leaders • Households • Agricultural/veterin
ary agents
• Monthly at village or agricultural service level
• Each 2 months at household level
Out-migration: numbers
• Compare to last year • Effects on households’ indebtedness • Effects on households’ income
(remittances received) • Effects on households’ assets (sales of
livestock)
• Village leaders • Households
• Each 2 months
In addition to the Food Security Monitoring System described above, a nation-wide crop and food supply assessment would be important in 2008 as the data collected in the food security, livelihoods, agriculture and nutrition assessment was not geared towards estimating precisely the acreage planted and the yields obtained.

Rural Tajikistan Emergency Food Security Assessment Joint Food Security, Livelihoods, Agriculture and Nutrition Assessment
April/May 2008 Page 62
REFERENCES
� Reports of Food Price Increases in The Tajik Press, October 2007, European commission “Support to the Development Implementation and Evaluation of Agricultural Policy of Tajikistan” project. PSU experts.
� Preliminary results of rapid health assessments of hospital facilities in Tajikistan (Dushanbe, Rudaki, Soghd regions).
� Quick Situation Report, January 17th, 2008, March 05th, 2008, Situation of typhoid in Kulyab town, Oxfam.
� Community Situation Indicators, Oxfam, European Union.
� Report of the Tajikistan, Emergency Agriculture and Livestock Rapid Assessment, (8 – 15 February 2008) Draft, Dushanbe, 06 March 2008. Food and Agriculture Organisation of the United Nations (FAO), Ministry of Agriculture and Nature Protection of the Republic of Tajikistan.
� Country Profile 2007, The Economist Intelligence Unit, United Kingdom.
� Market Profile for Emergency Food Security Assessments, December 2005, ODAN; World Food Programme, European Commission Humanitarian Office. Abdolreza Abassian. Francine Pickup and Alla Kuvatova.
� Business Environment in Tajikistan as seen by Small and Medium Enterprises, 2006. International Finance Corporation, World Bank.
� IMF, Country Report No. 07/144, International Monetary Fund, April 2007
� Child Research Digest, No2 Quality Survey on Issues in Gils’ Education in Tajikistan. UNICEF.
� Multiple Indicator Cluster Survey (MICS), 2005, UNICEF, Tajikistan, State Committee on Statistics, 2006 Oct. 68 p
� Initial Rapid Health Assessment, WHO, 2008.
� Tajikistan Market Profile, June 2007. World Food Programme/ODC, Thomas Beuter.
� Overview of Mother and Child Health Care in the Republic of Tajikistan, January-February, 2008 (as based on the data provided by the medical-information statistical centre of the Ministry of Health of Tajikistan) WHO country office in Tajikistan.
� A Study on International Migrants’ Remittances in Central Asia and South Caucasus, 20 November 2007. Asian Development Bank, Country Report. Muhammadi Boboev.
� Migration, Remittances, and Living Standards in Tajikistan. A Report Based on Khatlon Remittances and Living. Standards Measurement Survey (KLSS 2005). International Organization for Migration (IOM) Abdul-Ghaffar Mughal.
� Research on demand for processed foodstuffs in Dushanbe, Tajikistan. Report on the results of the research. April 2007. ICCO-Helvetas. M-Vektor Consulting Agency.
� Labour Migration from Tajikistan, July 2003. International Organization for Migrations In cooperation with the Sharq Scientific Research Centre. Saodat Olimova and Igor Bosc.
� Republic of Tajikistan Health Sector Note Main Report June 30, 2004 Human Development Unit Europe and Central Asia Region.
� Support to Animal Health Sector in Tajikistan. Mission Report. 24 Nov 2007. Garry Cummins. FAO.
� Percent distribution of household population according to main source of drinking water, Tajikistan, 2005
� Intestinal parasites, Tajikistan; Survey data, 2004. Yon Fleerackers, Karimov Saifiddin Saitodjevich and Abganov Zigovuddin Tulforovich.Ministry of Health Tajikistan, WFP and UNICEF.
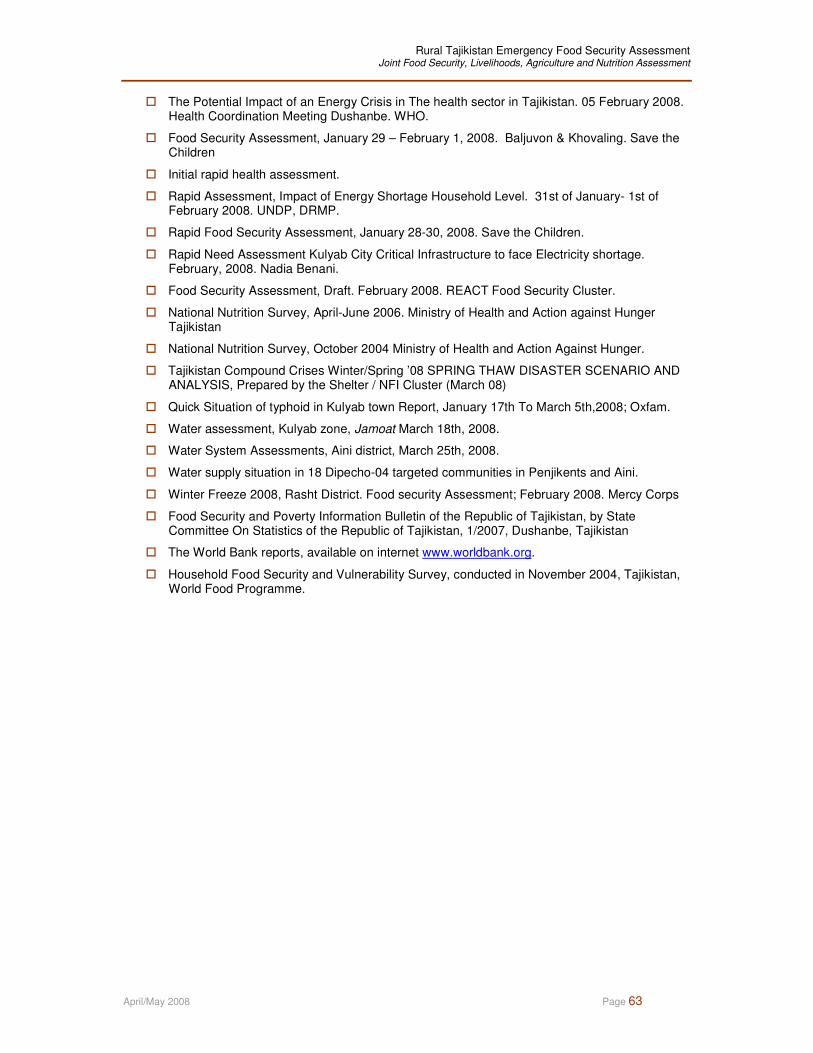
Rural Tajikistan Emergency Food Security Assessment Joint Food Security, Livelihoods, Agriculture and Nutrition Assessment
April/May 2008 Page 63
� The Potential Impact of an Energy Crisis in The health sector in Tajikistan. 05 February 2008. Health Coordination Meeting Dushanbe. WHO.
� Food Security Assessment, January 29 – February 1, 2008. Baljuvon & Khovaling. Save the Children
� Initial rapid health assessment.
� Rapid Assessment, Impact of Energy Shortage Household Level. 31st of January- 1st of February 2008. UNDP, DRMP.
� Rapid Food Security Assessment, January 28-30, 2008. Save the Children.
� Rapid Need Assessment Kulyab City Critical Infrastructure to face Electricity shortage. February, 2008. Nadia Benani.
� Food Security Assessment, Draft. February 2008. REACT Food Security Cluster.
� National Nutrition Survey, April-June 2006. Ministry of Health and Action against Hunger Tajikistan
� National Nutrition Survey, October 2004 Ministry of Health and Action Against Hunger.
� Tajikistan Compound Crises Winter/Spring ’08 SPRING THAW DISASTER SCENARIO AND ANALYSIS, Prepared by the Shelter / NFI Cluster (March 08)
� Quick Situation of typhoid in Kulyab town Report, January 17th To March 5th,2008; Oxfam.
� Water assessment, Kulyab zone, Jamoat March 18th, 2008.
� Water System Assessments, Aini district, March 25th, 2008.
� Water supply situation in 18 Dipecho-04 targeted communities in Penjikents and Aini.
� Winter Freeze 2008, Rasht District. Food security Assessment; February 2008. Mercy Corps
� Food Security and Poverty Information Bulletin of the Republic of Tajikistan, by State Committee On Statistics of the Republic of Tajikistan, 1/2007, Dushanbe, Tajikistan
� The World Bank reports, available on internet www.worldbank.org.
� Household Food Security and Vulnerability Survey, conducted in November 2004, Tajikistan, World Food Programme.

Rural Tajikistan Emergency Food Security Assessment Joint Food Security, Livelihoods, Agriculture and Nutrition Assessment
April/May 2008 Page 64
ANNEXES
All annexes listed below are available on a separate CD-Rom and on the following website: www.untj.org/library
Annex 1 – Maps
Map 1 – Zoning
Map 2 – Selected Jamoats
Map 3 – Overall food insecurity
Map 4 – Severe food insecurity
Map 5 – Market dependency post-harvest
Map 6 – Market dependency pre-harvest
Annex 2 - Questionnaires English and Tajik
Annex 2a – Questionnaire household - Rural assessment English
Annex 2b – Questionnaire Crop & Livestock - Rural assessment English
Annex 2c – Questionnaire Key Informants - Rural assessment English
Annex 2d – Checklist Traders - Rural assessment English
Annex 2e – Checklist Village Discussions - Rural assessment English
Annex 2f – Questionnaire household – Rural assessment Tajik
Annex 2g – Questionnaire Crop & Livestock - Rural assessment Tajik
Annex 2h – Questionnaire Key Informants - Rural assessment Tajik
Annex 2i – Checklist Traders - Rural assessment Tajik
Annex 2k – Checklist Village Discussions - Rural assessment Tajik
Annex 3 - Synthesis of results
Annex 3a – Synthesis by Zones-Animals
Annex 3b – Synthesis by Zones-Children & Nutrition
Annex 3c – Synthesis by Zones-Coping & Strategies
Annex 3d – Synthesis by Zones-Demographic
Annex 3e – Synthesis by Zones-Focus Groups
Annex 3f – Synthesis by Zones-Food Security
Annex 3g – Synthesis by Zones-Food Consumption & Sources of food
Annex 3h – Synthesis by Zones-Forecast & Scenarios
Annex 3i – Synthesis by Zones- Income & Expenditures
Annex 3j – Synthesis by Zones-Income sources
Annex 3k – Synthesis by Zones-Presentation
Annex 3l – Synthesis by Zones-Traders
Annex 3m – Synthesis by Zones-Key Informants Interviews
Annex 3n – Seasonal calendars from Focus Group discussions

Rural Tajikistan Emergency Food Security Assessment Joint Food Security, Livelihoods, Agriculture and Nutrition Assessment
April/May 2008 Page 65
Annex 4: Tables 1 to 18 – zone and region information
Table 1 – Zones and regions according to livestock deaths compared to average for the whole sample
Table 2 – Zones and regions according to the level of the winter wheat, potato and vegetables harvests compared to the average for the whole sample
Table 3 – Main commodities and periods of short or regular supplies on local markets, compared to average sample
Table 4 – Zones and Regions with high/low proportions of households with poor or borderline food consumption compared to the average sample
Table 5 – Zones and Regions with high/low proportions of households with poor/average food access compared to the average sample
Table 6 – Zones and regions according to the proportions of food insecure households, compared to the average sample
Table 7 – Zones and regions according to proportions of children not attending primary and secondary school, compared to average sample
Table 8 – Zones with shorter and longer durations of wheat, potatoes and vegetables/fruits stocks for households’ own consumption compared to average for the whole sample (this season)
Table 9 – Zones and regions with high/low proportion of households owning animals, compared to the average sample
Table 10 – Zones and regions according to the proportion of households with members actively looking for work, compared to the average sample
Table 11 – Zones and regions according to the proportion of households receiving remittances from migrants, compared to average sample
Table 12 – Zones and regions according to the proportion of households indebted, compared to the average sample
Table 13 – Zones and regions with high/low proportions of households having adopted negative coping strategies in the previous month, compared to the average sample
Table 14 – Zones with relatively ‘high’ or ‘low’ proportions of wasted and stunted children compared to the average proportions for the whole sample
Table 15 – Zones with poor and good access to safe water sources compared to average
Table 16 – Zones with high and low proportions of sick children compared to average
Table 17 – Zones with high and low access to health services compared to average
Table 18 – Zones and regions according to the main priorities identified by Focus Group participants
Annex 5 - Analysis results & tables
Annex 5a –Tajikistan Rural assessment - Results - all tables
Annex 5b – Key informants results tables
Annex 5c – Household results tables
Copyright © 2022 FDOKUMEN