Classification of rural areas in Europe using social sustainability indicators
14
________________________________________________________________________________________________ ________________________________________________________________________________________________ Classification of rural areas in Europe using social sustainability indicators Chatzinikolaou P. 1 , Manos B. 1 and Bournaris T. 1 1 Department of Agricultural Economics, Aristotle University of Thessaloniki, 54124 Thessaloniki, Greece [email protected] Paper prepared for presentation at the 1 st AIEAA Conference ‘Towards a Sustainable Bio-economy: Economic Issues and Policy Challenges’ 4-5 June, 2012 Trento, Italy Summary Social sustainability is “one of the three legs of the sustainability stool” (the other two are environmental and economic. There is limited literature that focuses on social sustainability to the extent that a comprehensive study of this concept is still missing. As a result, there have been very few attempts to define social sustainability as an independent dimension of sustainable development. Social sustainability is related to social capital, social inclusion, social exclusion and social cohesion in rural economies, terms that are measured by relevant social sustainability indicators. This paper aims to measure these indicators and to compare them. In order to measure these indicators, a household survey carried out in the context of the research project CAP-IRE. This survey included eleven case study areas in nine case study areas of the European Union. From the results of this survey we measured a set of economic and social sustainability indicators. We have selected the main social sustainability indicators on which we based on to proceed to the ranking of the eleven European rural areas. Keywords: ranking; rural areas; indicators; multicriteria analysis; social sustainability
Transcript of Classification of rural areas in Europe using social sustainability indicators

________________________________________________________________________________________________
________________________________________________________________________________________________
Classification of rural areas in Europe using social sustainability
indicators
Chatzinikolaou P.1, Manos B.
1 and Bournaris T.
1
1 Department of Agricultural Economics, Aristotle University of Thessaloniki, 54124 Thessaloniki, Greece
Paper prepared for presentation at the 1st AIEAA Conference
‘Towards a Sustainable Bio-economy: Economic Issues and Policy Challenges’
4-5 June, 2012
Trento, Italy
Summary
Social sustainability is “one of the three legs of the sustainability stool” (the other two are environmental and
economic. There is limited literature that focuses on social sustainability to the extent that a comprehensive study of this
concept is still missing. As a result, there have been very few attempts to define social sustainability as an independent
dimension of sustainable development. Social sustainability is related to social capital, social inclusion, social
exclusion and social cohesion in rural economies, terms that are measured by relevant social sustainability indicators.
This paper aims to measure these indicators and to compare them. In order to measure these indicators, a household
survey carried out in the context of the research project CAP-IRE. This survey included eleven case study areas in nine
case study areas of the European Union. From the results of this survey we measured a set of economic and social
sustainability indicators. We have selected the main social sustainability indicators on which we based on to proceed to
the ranking of the eleven European rural areas.
Keywords: ranking; rural areas; indicators; multicriteria analysis; social sustainability
1st AIEAA Conference – Towards a Sustainable Bio-economy: Economic Issues and Policy Challenges Trento, 4-5 June 2012
________________________________________________________________________________________________
________________________________________________________________________________________________
1
Classification of rural areas in Europe using social sustainability
indicators
Chatzinikolaou P.1, Manos B.
1 and Bournaris T.
1
1 Department of Agricultural Economics, Aristotle University of Thessaloniki, 54124 Thessaloniki, Greece
1. INTRODUCTION
Common Agricultural Policy (CAP) continues to play a major role in affecting agriculture and
agricultural production, and the farming population. The overall economic contribution of farm-households
in rural areas depends on the weight of agriculture in each area. In CAP reform, the focus on non-protected
national markets and the enlargement of the European Union are creating a new reality for agriculture and
rural areas in general. The policies of the European Union (EU) highlight the multi-functional role of the
rural areas, which extends beyond the role of agriculture to also include other activities. Additionally, the
issue of maintaining economically vital rural communities, particularly in disadvantaged regions where
alternative income opportunities were limited, is a traditional argument connected to Common Agricultural
Policy (CAP) (Manos, Bournaris and Chatzinikolaou, 2011).
A Communication about the CAP post 2013 (COM 672, 2010) suggests three main objectives for the
future CAP. The third objective “Balanced territorial development” aims to support rural employment and
maintaining the social fabric of rural areas, to improve the rural economy and promote diversification to
enable local actors to unlock their potential and to optimize the use of additional local resources and finally
to allow for structural diversity in the farming systems, improve the conditions for small farms and develop
local markets.
In order to assess agricultural sustainability, many methodological approaches have been proposed
(Caballero, Gil and Fernandez-Santos, 2008; Haughton et al., 2009); however the majority of studies
analyzing sustainability indicators focuses on environmental sustainability and omits socio-economic aspects
(Dantsis et al., 2010). The term ‘sustainable development’ is not clearly defined, and instead a multitude of
definitions are available (COM, 2001). However, the commonality of most definitions is a reference to at
least three dimensions of sustainability - ecological, economic, and social dimensions. (Sattler et al., 2010)
There is a major difficulty in formulating CAP policy is the diversity of farming in member states in
terms of the structure, the size of farms and households and the social sustainability of population.
In the context of the research project entitled CAP-IRE (Assessing the multiple Impacts of the
Common Agricultural Policy on Rural Economies), which is a European FP7 funded project; there was an
attempt to assess the multiple impacts of the CAP in eleven European rural areas. Also the assessment of
present trends on social sustainability and the social impacts of policy change of the CAP in rural areas were
presented. More specifically, there was an attempt to group and rank the selected case study areas using a set
of social sustainability indicators (SSI).
In order to measure these SSI, a household survey carried out, in order to collect empirical information
about present and future trends of changes in farms and the effects of the CAP and its reform on such
1st AIEAA Conference – Towards a Sustainable Bio-economy: Economic Issues and Policy Challenges Trento, 4-5 June 2012
________________________________________________________________________________________________
________________________________________________________________________________________________
2
changes. The survey provided the data for the statistical/econometric analysis, in order to study social
sustainability in rural areas. The survey included a questionnaire submitted to a large sample of farm
households and requested information related to both farm and non-farm activities.
In this paper (a) we briefly outline the core concept of the CAP-IRE approach for the assess of the
social impacts, and (b) for the remainder of the paper focus on the application of Multicriteria Analysis
PROMETHEE II, in order to classify the case study areas according to the 24 proposed SSI. Social
sustainability classification is a proposed method to help decision makers to interpret local perceptions to
establish priorities or simply compare a mixture of different information which otherwise would be more
difficult to interpret.
The structure of the paper is as follows: Section 2 describes briefly the methodology that has been
applied, in Section 3, the case studies and the data are presented. In Section 4, the PROMETHEE method
was applied for the ranking of the 11 case studies and the results are presented and, finally in Section 5, we
discuss the differences between the case studies, according to the selected SSI. The final section summarizes
the paper and suggests potential future directions in the implementation of social policy measures.
2. METHODOLOGY
This paper deals with a comparison of social impacts in rural areas, and multiple criteria have to been
considered in this process. Several Multicriteria methods are available in the literature, but out ranking
method is suitable for this concept, since the concept should be based on the pair wise comparison of the
study areas. In the present study, PROMETHEE II, an outranking method is used as a MCDM method for
the ranking of the study areas. Since the mathematical model in PROMETHEE is relatively easy for the
decision makers to understand and, it can easily find out the preferences among multiple decisions,
PROMETHEE methods occupies an significant place among the outranking methods. (Vinodh and Girubha,
2012).
The PROMETHEE I (partial ranking) and PROMETHEE II (complete ranking) were developed by
J.P. Brans and presented for the first time in 1982 at a conference organized by R. Nadeau and M. Landry at
the Université Laval, Québec, Canada (L’Ingéniérie de la Décision. Elaboration d’instruments d’Aide à la
Décision). The same year several applications using this methodology were already treated by G. Davignon
in the field of Heath care. A few years later J.P. Brans and B. Mareschal developed PROMETHEE III
(ranking based on intervals) and PROMETHEE IV (continuous case) (Brans and Mareschal, 1991). In 1992
and 1994, J.P. Brans and B. Mareschal further suggested two nice extensions: PROMETHEE V (MCDA
including segmentation constraints) and PROMETHEE VI (representation of the human brain).
A considerable number of successful applications has been treated by the PROMETHEE methodology
in various fields such as Banking, Industrial Location, Manpower planning, Water resources, Investments,
Medicine, Chemistry, Health care, Tourism and Dynamic management. More specifically, Albadvi, (2004)
applied PROMETHEE II, in order to formulate national information technology strategies; Albadvi et al.
(2007) applied this method for decision making in stock trading. Andreopoulou et al. (2008, 2009) applied
Promethee for the assessment and optimization of e-commerce websites. Moreover, Siskos and Grigoroudis
(2002) used Promethee II in order to evaluate the criteria of the venture capital investment activity.
In the context of Agriculture, several publications have used multicriteria analysis PROMETHEE
(Behzadian et al., 2010). Wolfslehner et. al, (2011) based on a PROMETHEE II algorithm, calculated
relative sustainability impact rating. Koutroumanidis, Papathanasiou and Manos (2002) apllied Promethee II
1st AIEAA Conference – Towards a Sustainable Bio-economy: Economic Issues and Policy Challenges Trento, 4-5 June 2012
________________________________________________________________________________________________
________________________________________________________________________________________________
3
in order to perform comparison of productivity and ranking of agricultural regions of Greece. Morever,
Madlenera et. al, (2007) used PROMETHEE method to compare and rank different energy scenarios
according to 16 economic, social, environmental, and technological criteria. Brans, Vinke and Mareschal,
(1986) considered the following multicriteria problem:
(1)
where K is a finite set of actions and , are k criteria to be maximized.
The PROMETHEE methods include two phases (Roy, 1968) (Roy, 1996):
• the construction of an outranking relation on k,
• the exploitation of this relation in order to give an answer to (1).
In the first phase, a valued outranking relation based on a generalization of the notion of criterion is
considered: a preference index is defined and a valued outranking graph, representing the preferences of the
decision maker, is obtained (Roy, 1991). The exploitation of the outranking relation is realized by
considering for each action a positive and a negative flow in the valued outranking graph: a partial preorder
(PROMETHEE I) or a complete preorder (PROMETHEE II) on the set of possible actions can be proposed
to the decision maker in order to achieve the decision problem. Only a few parameters are to be fixed in
these methods and the most of them have an economic signification so that the decision maker is able to
determine their values easily. Furthermore, some small deviations in the determination of these values do not
often induce important modifications of the obtained rankings.
The preference structure of PROMETHEE is based on pair wise comparisons. In this case the
deviation between the evaluations of two alternatives on a particular criterion is considered. The preference
index for each pair of alternatives , ranges between 0 and 1. The higher it is (closer to 1) the higher
the strength of the preference for a over b is. The function P represents the intensity of preference of action a
with regard to action b and such that:
• means an indifference between a and b, or no preference of a over b;
• means weak preference of a over b;
• means strong preference of a a over b;
• means strict preference of a over b.
For each criterion f we consider a generalized criterion defined by f and a corresponding preference
function P.
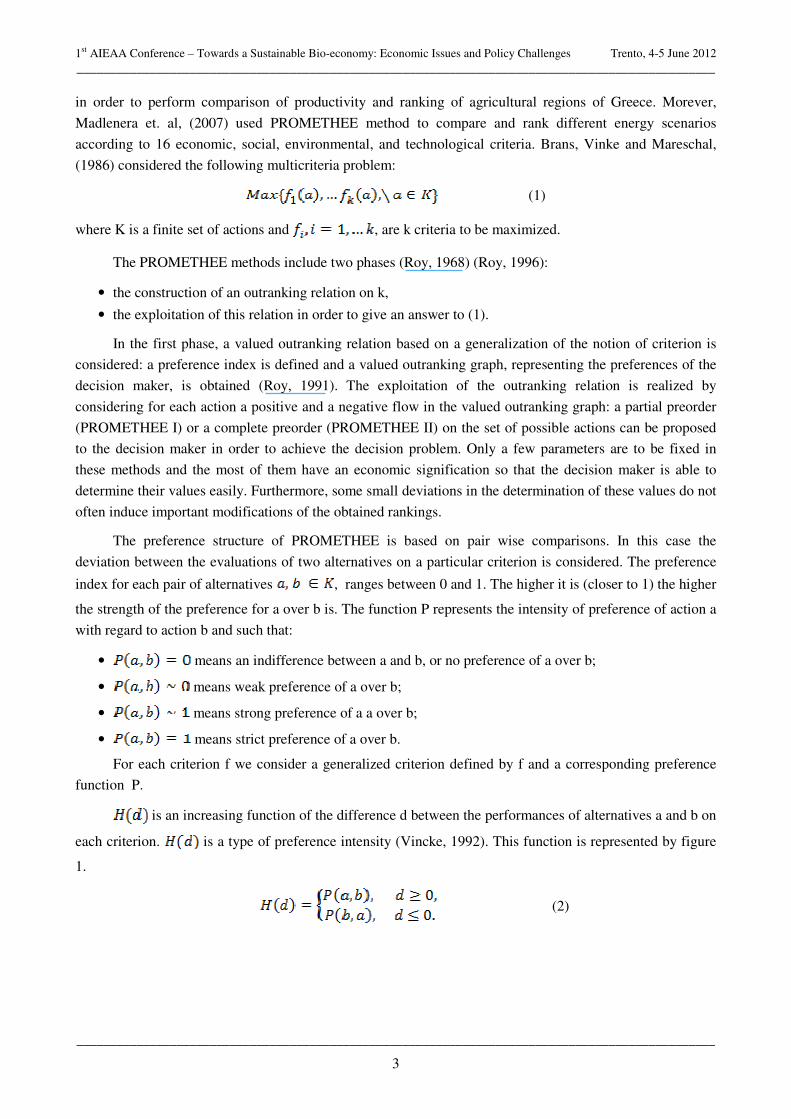
is an increasing function of the difference d between the performances of alternatives a and b on
each criterion. is a type of preference intensity (Vincke, 1992). This function is represented by figure
1.
(2)
1st AIEAA Conference – Towards a Sustainable Bio-economy: Economic Issues and Policy Challenges Trento, 4-5 June 2012
________________________________________________________________________________________________
________________________________________________________________________________________________
4
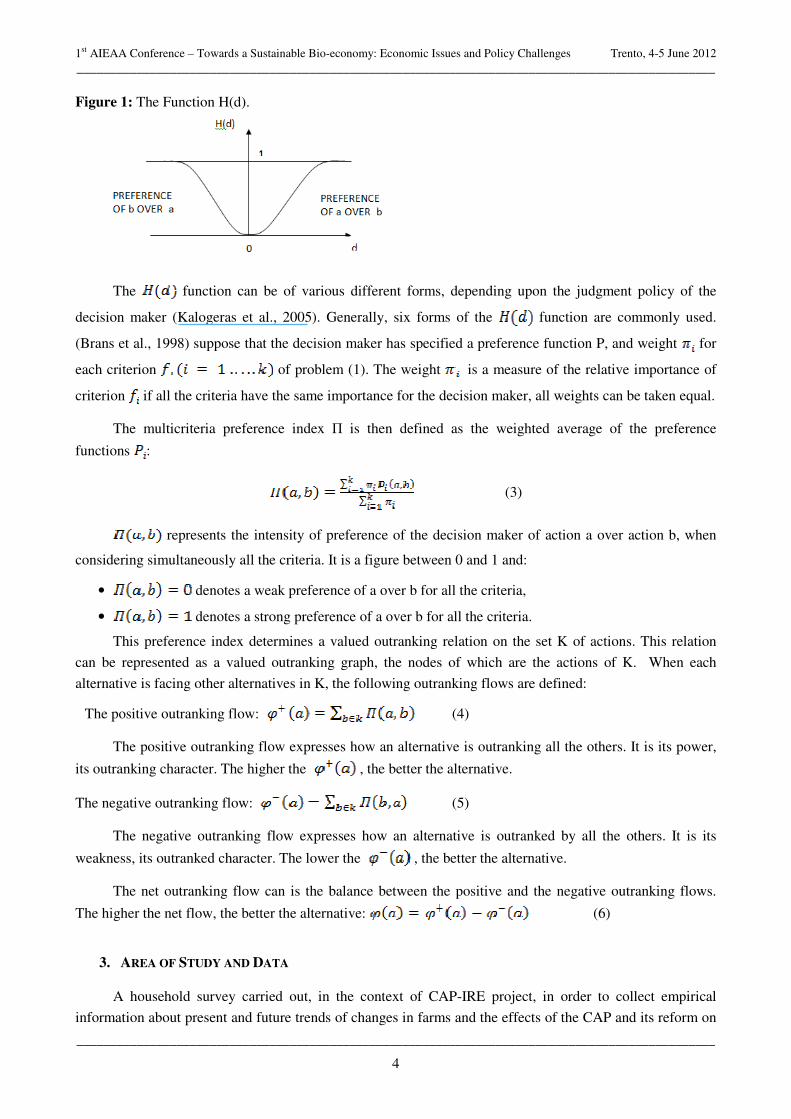
Figure 1: The Function H(d).
The function can be of various different forms, depending upon the judgment policy of the
decision maker (Kalogeras et al., 2005). Generally, six forms of the function are commonly used.
(Brans et al., 1998) suppose that the decision maker has specified a preference function P, and weight for
each criterion of problem (1). The weight is a measure of the relative importance of
criterion if all the criteria have the same importance for the decision maker, all weights can be taken equal.
The multicriteria preference index Π is then defined as the weighted average of the preference
functions :
(3)
represents the intensity of preference of the decision maker of action a over action b, when
considering simultaneously all the criteria. It is a figure between 0 and 1 and:
• denotes a weak preference of a over b for all the criteria,
• denotes a strong preference of a over b for all the criteria.
This preference index determines a valued outranking relation on the set K of actions. This relation
can be represented as a valued outranking graph, the nodes of which are the actions of K. When each
alternative is facing other alternatives in K, the following outranking flows are defined:
The positive outranking flow: (4)
The positive outranking flow expresses how an alternative is outranking all the others. It is its power,
its outranking character. The higher the , the better the alternative.
The negative outranking flow: (5)
The negative outranking flow expresses how an alternative is outranked by all the others. It is its
weakness, its outranked character. The lower the , the better the alternative.
The net outranking flow can is the balance between the positive and the negative outranking flows.
The higher the net flow, the better the alternative: (6)
3. AREA OF STUDY AND DATA
A household survey carried out, in the context of CAP-IRE project, in order to collect empirical
information about present and future trends of changes in farms and the effects of the CAP and its reform on
1st AIEAA Conference – Towards a Sustainable Bio-economy: Economic Issues and Policy Challenges Trento, 4-5 June 2012
________________________________________________________________________________________________
________________________________________________________________________________________________
5
such changes. The survey provided the data for the statistical/econometric analysis, in order to study social
sustainability in rural areas. The data for this paper came from the results of this survey for the 11 case study
areas (table 4, Appendix). The survey included a questionnaire submitted to a large sample of farm
households and requested information related to both farm and non-farm activities. Eurostat uses many
indicators in order to describe social sustainability by measuring social phenomena such as demographic
changes, employment, social cohesion, social inclusion and social capital. Social sustainability is related to
social capital, social inclusion, social exclusion and social cohesion in rural economies, terms that are
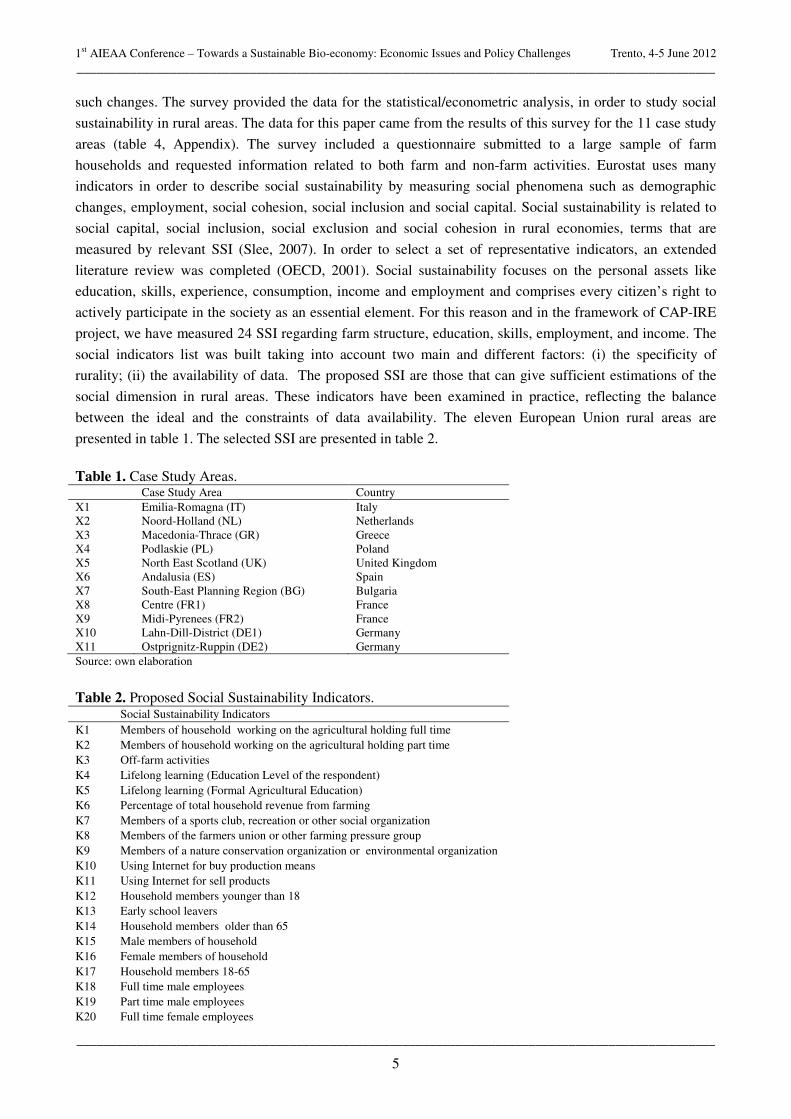
measured by relevant SSI (Slee, 2007). In order to select a set of representative indicators, an extended
literature review was completed (OECD, 2001). Social sustainability focuses on the personal assets like
education, skills, experience, consumption, income and employment and comprises every citizen’s right to
actively participate in the society as an essential element. For this reason and in the framework of CAP-IRE
project, we have measured 24 SSI regarding farm structure, education, skills, employment, and income. The
social indicators list was built taking into account two main and different factors: (i) the specificity of
rurality; (ii) the availability of data. The proposed SSI are those that can give sufficient estimations of the
social dimension in rural areas. These indicators have been examined in practice, reflecting the balance
between the ideal and the constraints of data availability. The eleven European Union rural areas are
presented in table 1. The selected SSI are presented in table 2.
Table 1. Case Study Areas. Case Study Area Country
X1 Emilia-Romagna (IT) Italy
X2 Noord-Holland (NL) Netherlands
X3 Macedonia-Thrace (GR) Greece
X4 Podlaskie (PL) Poland
X5 North East Scotland (UK) United Kingdom
X6 Andalusia (ES) Spain
X7 South-East Planning Region (BG) Bulgaria
X8 Centre (FR1) France
X9 Midi-Pyrenees (FR2) France
X10 Lahn-Dill-District (DE1) Germany
X11 Ostprignitz-Ruppin (DE2) Germany
Source: own elaboration
Table 2. Proposed Social Sustainability Indicators. Social Sustainability Indicators
K1 Members of household working on the agricultural holding full time
K2 Members of household working on the agricultural holding part time
K3 Off-farm activities
K4 Lifelong learning (Education Level of the respondent)
K5 Lifelong learning (Formal Agricultural Education)
K6 Percentage of total household revenue from farming
K7 Members of a sports club, recreation or other social organization
K8 Members of the farmers union or other farming pressure group
K9 Members of a nature conservation organization or environmental organization
K10 Using Internet for buy production means
K11 Using Internet for sell products
K12 Household members younger than 18
K13 Early school leavers
K14 Household members older than 65
K15 Male members of household
K16 Female members of household
K17 Household members 18-65
K18 Full time male employees
K19 Part time male employees
K20 Full time female employees
1st AIEAA Conference – Towards a Sustainable Bio-economy: Economic Issues and Policy Challenges Trento, 4-5 June 2012
________________________________________________________________________________________________
________________________________________________________________________________________________
6
K21 Part time female employees
K22 Employees who are citizens from other EU countries
K23 Employees who are citizens from non EU countries
K24 Long term Unemployment
Source: own elaboration
4. RESULTS
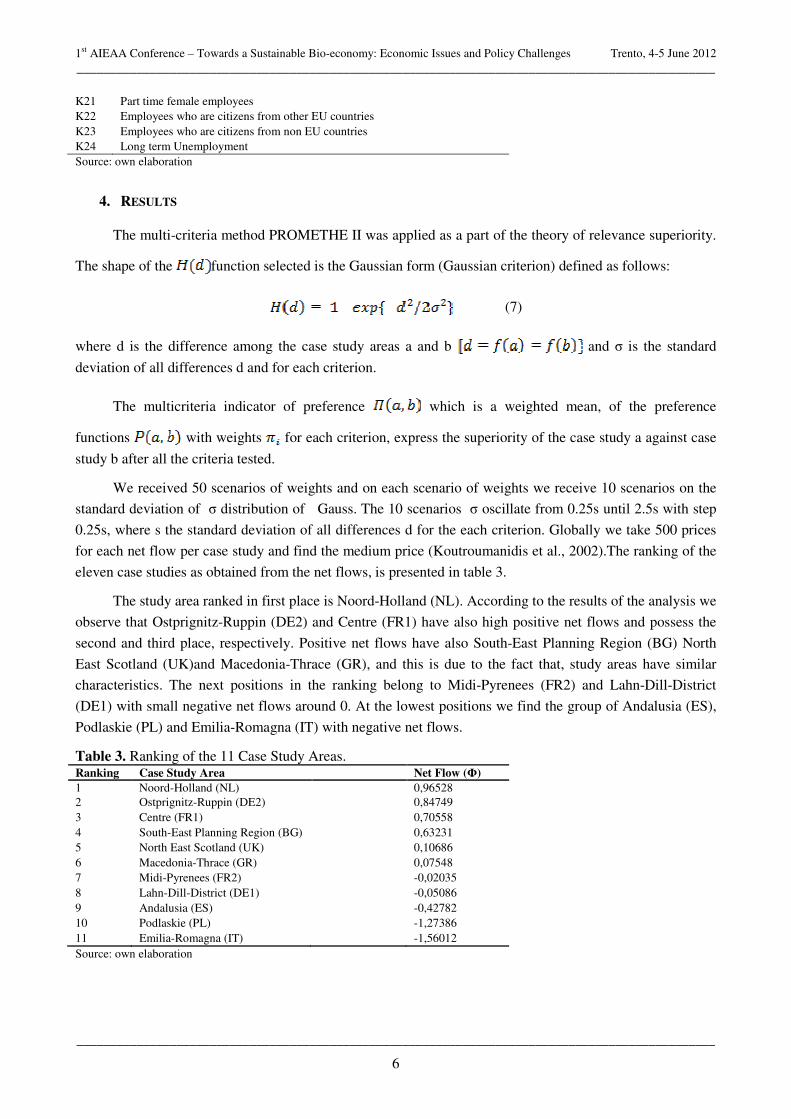
The multi-criteria method PROMETHE II was applied as a part of the theory of relevance superiority.
The shape of the function selected is the Gaussian form (Gaussian criterion) defined as follows:
(7)
where d is the difference among the case study areas a and b and σ is the standard
deviation of all differences d and for each criterion.
The multicriteria indicator of preference which is a weighted mean, of the preference
functions with weights for each criterion, express the superiority of the case study a against case
study b after all the criteria tested.
We received 50 scenarios of weights and on each scenario of weights we receive 10 scenarios on the
standard deviation of σ distribution of Gauss. The 10 scenarios σ oscillate from 0.25s until 2.5s with step
0.25s, where s the standard deviation of all differences d for the each criterion. Globally we take 500 prices
for each net flow per case study and find the medium price (Koutroumanidis et al., 2002).The ranking of the
eleven case studies as obtained from the net flows, is presented in table 3.
The study area ranked in first place is Noord-Holland (NL). According to the results of the analysis we
observe that Ostprignitz-Ruppin (DE2) and Centre (FR1) have also high positive net flows and possess the
second and third place, respectively. Positive net flows have also South-East Planning Region (BG) North
East Scotland (UK)and Macedonia-Thrace (GR), and this is due to the fact that, study areas have similar
characteristics. The next positions in the ranking belong to Midi-Pyrenees (FR2) and Lahn-Dill-District
(DE1) with small negative net flows around 0. At the lowest positions we find the group of Andalusia (ES),
Podlaskie (PL) and Emilia-Romagna (IT) with negative net flows.
Table 3. Ranking of the 11 Case Study Areas. Ranking Case Study Area Net Flow (Φ)
1 Noord-Holland (NL) 0,96528
2 Ostprignitz-Ruppin (DE2) 0,84749
3 Centre (FR1) 0,70558
4 South-East Planning Region (BG) 0,63231
5 North East Scotland (UK) 0,10686
6 Macedonia-Thrace (GR) 0,07548
7 Midi-Pyrenees (FR2) -0,02035
8 Lahn-Dill-District (DE1) -0,05086
9 Andalusia (ES) -0,42782
10 Podlaskie (PL) -1,27386
11 Emilia-Romagna (IT) -1,56012
Source: own elaboration
1st AIEAA Conference – Towards a Sustainable Bio-economy: Economic Issues and Policy Challenges Trento, 4-5 June 2012
________________________________________________________________________________________________
________________________________________________________________________________________________
7
5. DISCUSSION
Most of the rural development policies still keep a marked influence in rural areas. This paper taking
into account the issues raised by the Communication 272/2010: the CAP towards 2020, in which one of the
main recommended strategic aims is: to maintain viable rural communities, for whom farming is an
important economic activity; this delivers multiple economic, social, environmental and territorial benefits.
Within CAP-IRE project, the focus was on the effects of CAP policy on social sustainability, by measuring
SSI such as demographic changes, employment, social cohesion, social inclusion and social capital. The
main idea was to collect information about future trends and the effects of the CAP through stated/intended
behaviour, following some examples available in the literature. The focus was also on the future of rural
households and farms, and how this would be affected my major changes in the Common Agricultural
Policy. The Survey that carried out in the context of the project provided the data for the
statistical/econometric analysis, in order to study social sustainability in rural areas. More specifically this
paper used the data from this survey A to study the effects of household behavior by measuring the proposed
SSI, demographic changes, employment, social cohesion, social inclusion and social capital. Multicriteria
Method PROMETHEE II was applied for the comparison and ranking of the eleven case study areas based
on the selected SSI. This ranking permits to point out some specific problems that characterize rural areas
and determine specific problems for the rural population. This set of problems includes several difficulties
linked to demography, remoteness, education, and to some special features of the labour market.
As can be seen from the results of the PROMETHEE II we observe that Noord-Holland (NL) is first in
the ranking of the case study areas concerning the proposed SSI. Ostprignitz-Ruppin (DE2) and Centre
(FR1) possess respectively the second and third place, and South-East Planning Region (BG) possesses the
fourth place. These case study areas possess the first places in the ranking because they have the higher rates
in the most indicators. More specifically, Noord-Holland (NL) has the highest rate in off farm activities,
participation to nature conservation organizations or other environmental organizations, using internet for
buying production means and household members younger than 18. Ostprignitz-Ruppin (DE2) has the
highest rate in education level of the respondent and in full time female employees. Centre (FR1) has the
highest rate in formal agricultural education, in using internet for selling products and the lowest rate in
household members older than 65. Furthermore, South-East Planning Region (BG) has the highest rate in full
time male employees and the second higher rate in full time female employees. Moreover, North East
Scotland (UK) possesses the fifth place in the ranking, and has high rates in the most of the indicators and
the lowest rate in early school leavers, which is an indicator with negative impact. It is lower in the ranking
because of the low rate in using internet for buying production means or for selling products.
Macedonia and Thrace (GR) has the highest rate in members of the household working in the
agricultural holding. Also, has the highest rate in percentage of the total household revenue that comes from
farming and in part time male employees. The sixth place in the ranking is due to the highest rate in early
school leavers and the lowest rate in education level of the respondent. Macedonia and Thrace has also low
rates in participation to any social networks and in using internet. Podlaskie (PL) possesses the tenth place in
the ranking, while it has the lowest rate by far in participation to farmers union or other farming pressure
group, in participation to sports club, or other social organizations, or to environmental organizations, in
using internet for buying production means in male employees working full time and in part time male or
female employees. Podlaskie (PL) has also the second higher rate in household members older than 65 and
the third lower rate in off-farm activities.
1st AIEAA Conference – Towards a Sustainable Bio-economy: Economic Issues and Policy Challenges Trento, 4-5 June 2012
________________________________________________________________________________________________
________________________________________________________________________________________________
8
Midi-Pyrenees (FR2) and Lahn-Dill-District (DE1) present negative net flows and possess the seventh
and eighth place respectively.
Finally, Andalusia (ES) and Emilia-Romagna (IT) possess lower places on the ranking. Andalusia
(ES) possesses the ninth place in the ranking, and it has the lowest rate by far in off-farm activities, and the
highest rate by far in long term unemployment rate. Moreover, Emilia-Romagna (IT) possesses the eleventh
place in the ranking, because it has low rates in most of the selected SSI. It has the lowest rate in many
indicators, such as formal agricultural education, percentage of the total household revenue that comes from
farming, using internet for selling products, household members younger than 18 and household members
older than 65. Moreover, Emilia-Romagna (IT) has the second lower rate in some indicators (off- farm
activities, education level of the respondent and using internet for buying production means) and the second
higher rate in early school leavers.
To conclude, the results show that in rural areas the relevance of agriculture is still significant in terms
of employment and labour opportunities. On the contrary, many of rural areas have become increasingly
driven by factors outside agriculture due to diversification of the socio-economic structure (European
Commission, 2008), (Chandrasekera and Wijayaratna 2002), (European Commission, 2003). Moreover, for
many rural areas agriculture will be certain factor in labor market dynamics and will be able to play an
important role regarding the themes of social sustainability. The methodology applied in this study may have
shortcomings in measuring all the dimensions of social sustainability but it could be a tool for policy makers
in policy design. According to Mattas et. al (2008), despite remarkable differences among rural areas, it has
been shown that the effective implementation of social policy measures becomes important for regions
characterized by rural diversities (OECD, 2011), (Vasilescu, 2008), (Meijerink and Roza, 2007). The
contribution of this study helps the policy makers to define these diversities in order to apply their policies.
These policies should be distinguished relative to different circumstances and specifically they should be
more flexible taking into account the social particularities affecting the specific contexts they are applied.
6. ACKNOWLEDGEMENTS
The authors would like to thank the anonymous reviewers for their encouraging and constructive comments.
7. REFERENCES
Albadvi, A. (2004). Formulating national information technology strategies: A preference ranking
model usin PROMETHEE method. European Journal of Operational Research 153 : 290-296.
Albadvi, A., Chaharsooghi, S.K. and Esfahanipour, A. (2007). Decision making in stock trading:
An application of PROMETHEE. European Journal of European Research 177 : 673-683.
Andreopoulou, Z., Koutroumanidis, T. and Manos, B. (2009). The adoption of e-commerce for
wood enterprises. International Journal of Business Information Systems 4 : 440-459.
Andreopoulou, Z., Tsekouropoulos, G., Koutroumanidis, T., Vlachopoulou, M. and Manos, B.
(2008). Typology for e-business activities in the agricultural sector. IJBIS, International Journal of
Business Information Systems 3 : 231-251.
Behzadian, M., Kazemzadeh, R.B., Albadvi, A. and Aghdasi, M. (2010). PROMETHEE: A
comprehensive literature review on methodologies and applications. European Journal of
Operational Research 200 no.1 : 198-215.
Brans, J.P., Macharis, C., Kunsch, P.L., Chevalier, A. and Schwaninger, M. (1998). Combining
multicriteria decision aid and system dynamics for the control of socio-economic processes. An
iterative real-time procedure. European Journal of Operational Research 109 no. 2 : 428-441.
1st AIEAA Conference – Towards a Sustainable Bio-economy: Economic Issues and Policy Challenges Trento, 4-5 June 2012
________________________________________________________________________________________________
________________________________________________________________________________________________
9
Brans, J.P. and Mareschal, B. (1991). BANKADVISER: An industrial evaluation system. European
Journal of Operational Research 54 no. 3 : 318-324.
Brans, J.P., Vincke, P. and Mareschal, B. (1986). How to select and how to rank projects: The
PROMETHEE method. European Journal of Operational Research 24 : 228-238.
Brans, J.P. and Vinke, P. (1985). A preference ranking organization method: The PROMETHEE
method for multiple criteria decision making. Management Science 31 no. 6 : 647–656.
Caballero, R., Gil, A. and Fernandez-Santos, X. (2008). An experts survey on sustainability across
twenty-seven extensive European systems of grassland management. Environmental Management
42 no. 2 : 190-199.
CAP-IRE Project (2010) [Online] www.cap-ire.eu.
Chandrasekera, M. and Wijayaratna, M. (2002). Role of Local Communities and Institutions in
Integrated Rural Development, Report of the APO, Iran, 15-20 June (ICD-SE-3-01).
EC COM (2001). A Sustainable Europe for a Better World: A European Union Strategy for
Sustainable Development.
EC COM 672 (2010). The CAP towards 2020: Meeting the food, natural resources and territorial
challenges of the future, 18 November 2010, Brussels
European Commission, Directorate-General for Research, (2003). The future of Europe's rural
periphery, the role of Entrepreneurship in responding to employment problems and social
marginalization (FERP) Final report, HPSE-CT-1999-00013
European Commission, Directorate-General for Employment, Social Affairs and Equal
Opportunities (2008). Poverty and Social Exclusion in rural areas, Executive Summary.
Dantsis, T., Douma, C., Giourga, C., Loumou, A. and Polychronaki, E.A. (2010). A methodological
approach to assess and compare the sustainability level of agricultural plant production systems.
Ecological Indicators 10 no. 2 : 256-263.
Haughton, A.J., Bond, A.J., Lovett, A.A., Dockerty, T., Sunnenberg, G., Clark, S.J., Bohan, D.A.,
Sage, R.B., Mallott, M.D., Mallott, V.E., Cunningham, M.D., Riche, A.B., Shield, I.F., Finch, J.W.,
Turner, M.M. and Karp, A. (2009). A novel, integrated approach to assessing social, economic and
environmental implications of changing rural land-use: A case study of perennial biomass crops.
Journal of Applied Ecology 46 no. 2 : 315-322.
Kalogeras, N., Baourakis, G., Zopounidis, C. and Dijk, G.v. (2005). Evaluating the financial
performance of agri-food firms : a multicriteria decision-aid approach. Journal of Food Engineering
70 no. 3 : 365-371.
Koutroumanidis, T., Nicola Giata, M., Papathanasiou, J. and Manos, B. (2002). Multi criteria
analysis of efficiency of agricultural sector in Balkan countries, 6th Balkan Conference on
Operational Research 22-25 May, Thessaloniki.
Koutroumanidis, T., Papathanasiou, J. and Manos, B. (2002). A Multicriteria analysis of
productivity of agricultural regions of Greece. Operational Research. An International Journal 2
no. 3 : 339-346.
Madlenera,R., Kowalskib, K., Staglb, S. (2007). New ways for the integrated appraisal of national
energy scenarios: The case of renewable energy use in Austria. Energy Policy 35 : 6060–6074.
Manos, B., Bournaris, T. and Chatzinikolaou, P. (2011). Impact assessment of CAP policies on
social sustainability in rural areas: an application in Northern Greece. Operational Research. An
International Journal 11 : 77-92.
Mattas, K., Arfinib, F., Midmorec, P., Schmitzd, M. and Surrye, Y. (2008). Impacts of CAP reform
on rural employment: A multimodeling cross country approach. 109th EAAE Seminar " The CAP
after the fischler reform: National implementations, impact assessment and the Agenda for future
reforms". Viterbo, Italy.
Meijerink, G. and Roza, P. (2007). The role of agriculture in economic development. Markets,
Chains and Sustainable Development Strategy & Policy papers. ISBN 978-90-8585-151-6.
OECD (2011). Economic Crisis and Beyond: Social Policies for the Recovery, Background
Document, Ministerial Meeting on Social Policy.
1st AIEAA Conference – Towards a Sustainable Bio-economy: Economic Issues and Policy Challenges Trento, 4-5 June 2012
________________________________________________________________________________________________
________________________________________________________________________________________________
10
OECD (2001). Environmental Indicators for Agriculture. Methods and Results.
Roy, B. (1968). Classement et choix en presence de points de vue multiple, (La methode
ELECTRE), RIRO 55-57.
Roy, B. (1991). The outranking approach and the foundations of ELECTRE methods. Theory and
Decision 31 : 49–73.
Roy, B. (1996). Multicriteria Methodology for Decision Aiding Dordrecht. Kluwer.
Sattler, C., Nagel, U.J., Werner, A. and Zadler, P. (2010). Integrated assessment of agricultural
production practices to enhance sustainable development in agricultural landscapes. Ecological
Indicators 10 no. 1 : 49-61.
Siskos, Y. and Grigoroudis, E. (2002). Measurement Customer satisfaction for various services
using multicriteria analysis. Aiding decisions with multiple criteria. Kluwer Academic Publishers.
Slee, B. (2007). Social sustainability indicators of multifunctional rural land use: The case of
forestry in the UK. Agriculture, Ecosystems and Environment 120 no. 1 : 31-40.
Vasilescu L., G. (2008). Agricultural Development in European Union: Drivers, Challenges and
Perspectives. The Pakistan Development Review. 47 no. 4 :. 565–580.
Vincke, P. (1992). Multicriteria Decision Aid. New York: John Wiley & Sons Ltd.
Vinodh, S. and Girubha R. J. (2012). PROMETHEE based sustainable concept selection. Applied
Mathematical Modelling (in press)
Wolfslehner, B., Brüchert, F., Fischbach, J., Rammer, W., Becker, G., Linder, M. and Lexer, M.J.
(2011). Exploratory multi-criteria analysis in sustainability impact assessment of forest-wood
chains: the example of a regional case study in Baden-Württemberg. European Journal of Forest
Research : 1-10.
1st AIEAA Conference – Towards a Sustainable Bio-economy: Economic Issues and Policy Challenges Trento, 4-5 June 2012
________________________________________________________________________________________________
________________________________________________________________________________________________
11

1st AIEAA Conference – Towards a Sustainable Bio-economy: Economic Issues and Policy Challenges Trento, 4-5 June 2012
________________________________________________________________________________________________
________________________________________________________________________________________________
1
8. APPENDIX
Table 4. Multicriteria table (rates)
K1 K2 K3 K4 K5 K6 K7 K8 K9 K10 K11 K12 K13 K14 K15 K16 Κ17 Κ18 Κ19 Κ20 Κ21 Κ22 Κ23 Κ24
X1 80,7 39,7 9,0 36,4 22,7 40,8 89,7 19,0 5,3 4,0 0,7 12,1 -63,3 -29,7 53,4 46,6 58,2 9,4 11,5 3,7 7,5 4,3 4,7 3,4
X2 88,7 66,0 45,3 75,0 74,3 74,9 78,7 50,0 31,7 38,7 12,0 44,0 -22,3 -6,2 53,8 46,2 49,8 17,7 25,0 2,7 12,7 7,3 0,7 0,1
X3 100 57,7 12,0 21,7 47,3 94,7 53,3 22,7 1,7 8,0 3,3 16,8 -78,0 -5,3 50,5 49,5 77,9 32,0 57,3 3,0 4,7 12,7 63,7 4,3
X4 95,6 47,8 10,0 85,1 93,2 86,4 7,6 0,8 0,0 2,4 0,8 26,7 -14,9 -23,6 51,1 48,9 49,7 6,4 2,4 2,4 0,8 0,0 0,0 0,1
X5 86,9 47,6 36,9 92,2 43,5 73,7 52,4 45,8 12,5 17,3 4,2 16,6 -1,2 -14,6 56,0 44,0 68,8 25,7 17,5 1,8 1,8 2,4 1,2 0,4
X6 51,7 60,7 3,0 44,3 23,9 48,4 55,7 13,9 2,0 4,5 2,0 28,4 -55,2 -10,8 51,1 48,9 60,8 13,4 66,5 1,0 47,5 15,9 4,0 9,0
X7 89,4 39,2 13,7 92,3 45,4 74,5 23,4 1,5 1,5 25,3 19,8 16,8 -7,7 -9,7 51,4 48,6 73,5 52,4 29,5 22,8 7,2 0,0 0,0 3,9
X8 95,7 18,6 24,3 78,6 97,1 70,3 72,1 63,6 7,1 20,0 24,3 24,4 -21,4 -1,0 56,4 43,6 74,6 18,2 11,7 4,4 3,6 0,0 0,0 0,3
X9 93,5 25,8 21,9 60,6 90,3 71,5 69,0 69,0 10,3 15,5 10,3 24,2 -39,4 -8,1 55,8 44,2 67,7 10,3 23,2 1,9 10,3 0,6 1,9 0,8
X10 21,4 85,5 10,7 70,7 25,6 11,2 76,1 76,1 21,4 28,2 2,6 19,4 -27,6 -10,9 53,4 46,6 69,7 8,2 19,8 3,2 8,4 3,4 0,0 0,0
X11 66,3 40,0 35,7 95,1 84,4 46,5 48,1 48,1 10,6 29,4 15,6 17,4 -3,1 -12,3 50,1 49,9 70,3 34,6 17,6 23,3 16,4 5,0 1,3 3,0
1st AIEAA Conference – Towards a Sustainable Bio-economy: Economic Issues and Policy Challenges Trento, 4-5 June 2012
________________________________________________________________________________________________
________________________________________________________________________________________________
1