Benchmarking sustainability in cities: The role of indicators and future scenarios
10
Benchmarking sustainability in cities: The role of indicators and future scenarios Christopher T. Boyko a, *, Mark R. Gaterell b , Austin R.G. Barber c , Julie Brown c , John R. Bryson d , David Butler e , Silvio Caputo b , Maria Caserio f , Richard Coles f , Rachel Cooper a , Gemma Davies g , Raziyeh Farmani e , James Hale d , A. Chantal Hales d , C. Nicholas Hewitt g , Dexter V.L. Hunt h , Lubo Jankovic f , Ian Jefferson h , Joanne M. Leach h , D. Rachel Lombardi h , A. Robert MacKenzie g , Fayyaz A. Memon e , Thomas A.M. Pugh g , John P. Sadler d , Carina Weingaertner h , J. Duncan Whyatt g , Christopher D.F. Rogers h a ImaginationLancaster, Lancaster Institute for the Contemporary Arts, Lancaster University, Lancaster LA1 4YW, United Kingdom b Department of the Built Environment, Design Hub, Coventry University Technology Park, Puma Way, Coventry CV1 2TT, United Kingdom c Centre for Urban and Regional Studies, University of Birmingham, Birmingham B15 2TT, United Kingdom d School of Geography, Earth and Environmental Science, University of Birmingham, Birmingham B15 2TT, United Kingdom e Centre for Water Systems, College of Engineering, Mathematics and Physical Sciences, University of Exeter, Exeter EX4 4QF, United Kingdom f Birmingham Institute of Art and Design, Birmingham City University, Birmingham B4 7DX, United Kingdom g The Lancaster Environment Centre, Lancaster University, Lancaster LA1 4YW, United Kingdom h School of Civil Engineering, University of Birmingham, Birmingham B15 2TT, United Kingdom 1. Introduction Urban regeneration may be defined as a comprehensive and integrated action that attempts to address urban problems via economic, social, environmental and physical improvements in an area (Roberts and Sykes, 2000). In particular, improving the physical environment is a large-scale process that, at least in the UK, has involved the state to some degree (e.g., the introduction of Single Regeneration Budgets and Urban Regeneration Companies) (Jones and Evans, 2008). American cities, such as Chicago (via Millennium Park) and San Diego (via Downtown San Diego), have tried to regenerate their urban centres by strategic investments and sensitive planning (see Southworth and Ruggeri, 2011). Malmo ¨, Sweden, has become an exemplar city with regard to sustainable development because of key regeneration projects (e.g., the BO01 housing development) that have transformed the area’s post-industrial legacy (see Qvistro ¨m and Saltzman, 2006; Ka ¨ rrholm, 2011). Seoul, South Korea, used nature to revitalise an urban area by uncovering an important stream, Cheonggyecheon, that runs through the city, utilising the stream as a focus for urban redevelopment (see Shin and Lee, 2006; Kang and Cervero, 2009). The Docklands in Melbourne, Australia, have taken advantage of disused space near the city’s waterfront and regenerated the area through heritage conservation, public art, business creation and tourism in a bid to expand the Central Business District (Dovey and Sandercock, 2002; Wood, 2009). Finally, Temple Bar in Dublin, Global Environmental Change xxx (2011) xxx–xxx A R T I C L E I N F O Article history: Received 15 November 2010 Received in revised form 27 September 2011 Accepted 10 October 2011 Available online xxx Keywords: Urban Futures Regeneration Sustainability Scenarios Indicators Toolkit A B S T R A C T Scenarios are a useful tool to help think about and visualise the future and, as such, are utilised by many policymakers and practitioners. Future scenarios have not been used to explore the urban context in much depth, yet have the potential to provide valuable insights into the robustness of decisions being made today in the name of sustainability. As part of a major research project entitled Urban Futures, a toolkit has been developed in the UK to facilitate the use of scenarios in any urban context and at any scale relevant to that context. The toolkit comprises two key components, namely, (i) a series of indicators comprising both generic and topic area-specific indicators (e.g., air quality, biodiversity, density, water) that measure sustainability performance and (ii) a list of characteristics (i.e., 1–2- sentence statements about a feature, issue or small set of issues) that describe four future scenarios. In combination, these two components enable us to measure the performance of any given sustainability indicator, and establish the relative sensitivity or vulnerability of that indicator to the different future scenarios. An important aspect of the methodology underpinning the toolkit is that it is flexible enough to incorporate new scenarios, characteristics and indicators, thereby allowing the long-term performance of our urban environments to be considered in the broadest possible sense. ß 2011 Elsevier Ltd. All rights reserved. * Corresponding author. Tel.: +44 01524 592339; fax: +44 01524 594900. E-mail address: [email protected] (C.T. Boyko). G Model JGEC-951; No. of Pages 10 Please cite this article in press as: Boyko, C.T., et al., Benchmarking sustainability in cities: The role of indicators and future scenarios. Global Environ. Change (2011), doi:10.1016/j.gloenvcha.2011.10.004 Contents lists available at SciVerse ScienceDirect Global Environmental Change jo ur n al h o mep ag e: www .elsevier .co m /loc ate/g lo envc h a 0959-3780/$ – see front matter ß 2011 Elsevier Ltd. All rights reserved. doi:10.1016/j.gloenvcha.2011.10.004
Transcript of Benchmarking sustainability in cities: The role of indicators and future scenarios

Global Environmental Change xxx (2011) xxx–xxx
G Model
JGEC-951; No. of Pages 10
Benchmarking sustainability in cities: The role of indicators and future scenarios
Christopher T. Boyko a,*, Mark R. Gaterell b, Austin R.G. Barber c, Julie Brown c, John R. Bryson d,David Butler e, Silvio Caputo b, Maria Caserio f, Richard Coles f, Rachel Cooper a, Gemma Davies g,Raziyeh Farmani e, James Hale d, A. Chantal Hales d, C. Nicholas Hewitt g, Dexter V.L. Hunt h,Lubo Jankovic f, Ian Jefferson h, Joanne M. Leach h, D. Rachel Lombardi h, A. Robert MacKenzie g,Fayyaz A. Memon e, Thomas A.M. Pugh g, John P. Sadler d, Carina Weingaertner h, J. Duncan Whyatt g,Christopher D.F. Rogers h
a ImaginationLancaster, Lancaster Institute for the Contemporary Arts, Lancaster University, Lancaster LA1 4YW, United Kingdomb Department of the Built Environment, Design Hub, Coventry University Technology Park, Puma Way, Coventry CV1 2TT, United Kingdomc Centre for Urban and Regional Studies, University of Birmingham, Birmingham B15 2TT, United Kingdomd School of Geography, Earth and Environmental Science, University of Birmingham, Birmingham B15 2TT, United Kingdome Centre for Water Systems, College of Engineering, Mathematics and Physical Sciences, University of Exeter, Exeter EX4 4QF, United Kingdomf Birmingham Institute of Art and Design, Birmingham City University, Birmingham B4 7DX, United Kingdomg The Lancaster Environment Centre, Lancaster University, Lancaster LA1 4YW, United Kingdomh School of Civil Engineering, University of Birmingham, Birmingham B15 2TT, United Kingdom
A R T I C L E I N F O
Article history:
Received 15 November 2010
Received in revised form 27 September 2011
Accepted 10 October 2011
Available online xxx
Keywords:
Urban Futures
Regeneration
Sustainability
Scenarios
Indicators
Toolkit
A B S T R A C T
Scenarios are a useful tool to help think about and visualise the future and, as such, are utilised by many
policymakers and practitioners. Future scenarios have not been used to explore the urban context in
much depth, yet have the potential to provide valuable insights into the robustness of decisions being
made today in the name of sustainability. As part of a major research project entitled Urban Futures, a
toolkit has been developed in the UK to facilitate the use of scenarios in any urban context and at any
scale relevant to that context. The toolkit comprises two key components, namely, (i) a series of
indicators comprising both generic and topic area-specific indicators (e.g., air quality, biodiversity,
density, water) that measure sustainability performance and (ii) a list of characteristics (i.e., 1–2-
sentence statements about a feature, issue or small set of issues) that describe four future scenarios. In
combination, these two components enable us to measure the performance of any given sustainability
indicator, and establish the relative sensitivity or vulnerability of that indicator to the different future
scenarios. An important aspect of the methodology underpinning the toolkit is that it is flexible enough
to incorporate new scenarios, characteristics and indicators, thereby allowing the long-term
performance of our urban environments to be considered in the broadest possible sense.
� 2011 Elsevier Ltd. All rights reserved.
Contents lists available at SciVerse ScienceDirect
Global Environmental Change
jo ur n al h o mep ag e: www .e lsev ier . co m / loc ate /g lo envc h a
1. Introduction
Urban regeneration may be defined as a comprehensive andintegrated action that attempts to address urban problems viaeconomic, social, environmental and physical improvements in anarea (Roberts and Sykes, 2000). In particular, improving thephysical environment is a large-scale process that, at least in theUK, has involved the state to some degree (e.g., the introduction ofSingle Regeneration Budgets and Urban Regeneration Companies)(Jones and Evans, 2008). American cities, such as Chicago (viaMillennium Park) and San Diego (via Downtown San Diego), have
* Corresponding author. Tel.: +44 01524 592339; fax: +44 01524 594900.
E-mail address: [email protected] (C.T. Boyko).
Please cite this article in press as: Boyko, C.T., et al., Benchmarking suGlobal Environ. Change (2011), doi:10.1016/j.gloenvcha.2011.10.004
0959-3780/$ – see front matter � 2011 Elsevier Ltd. All rights reserved.
doi:10.1016/j.gloenvcha.2011.10.004
tried to regenerate their urban centres by strategic investmentsand sensitive planning (see Southworth and Ruggeri, 2011).Malmo, Sweden, has become an exemplar city with regard tosustainable development because of key regeneration projects(e.g., the BO01 housing development) that have transformed thearea’s post-industrial legacy (see Qvistrom and Saltzman, 2006;Karrholm, 2011). Seoul, South Korea, used nature to revitalise anurban area by uncovering an important stream, Cheonggyecheon,that runs through the city, utilising the stream as a focus for urbanredevelopment (see Shin and Lee, 2006; Kang and Cervero, 2009).The Docklands in Melbourne, Australia, have taken advantage ofdisused space near the city’s waterfront and regenerated the areathrough heritage conservation, public art, business creation andtourism in a bid to expand the Central Business District (Dovey andSandercock, 2002; Wood, 2009). Finally, Temple Bar in Dublin,
stainability in cities: The role of indicators and future scenarios.
1 Urban Futures is a 4-year, UK Research Council (EPSRC)-funded project that
seeks to establish and test alternative future scenarios, providing insights into the
potential sustainability impact of today’s UK urban regeneration decisions (see
www.urban-futures.org for more information).
C.T. Boyko et al. / Global Environmental Change xxx (2011) xxx–xxx2
G Model
JGEC-951; No. of Pages 10
Ireland, has used culture to lead regeneration in the city (Bryson,2007), as have Barcelona (1992 Summer Olympics, UNESCOCultural Forum 2004), Seville (EXPO 1992) and Bilbao (Guggen-heim Museum), all in Spain (Evans, 2005).
Although urban regeneration is seen as providing a stimulus toailing cities, regions and countries, it is a big and costly endeavourfor governments who often bear the brunt of fiscal responsibility.For example, the UK government planned to spend over £13 billionin regeneration programmes between 2007 and 2011 (DCLG,2009). A further £1.5 billion was being set aside for a WorkingNeighbourhoods Fund to support people living in the mostdeprived areas in finding work, while a further £80 million wasearmarked for transforming hostels and homelessness servicesinto centres of excellence. Prior to this, £1.87 billion was spent overa 5-year period to assist England’s 88 most deprived areas via theNeighbourhood Renewal Fund. The previous UK governmentstated that, by spending this money, they could help reduce the£5.8 billion used annually to subsidise residents in deprived areasand help to directly transform their lives (DCLG, 2009).
To guarantee value for its regeneration money, the previous UKgovernment also had established policies, plans and planningrequirements that prioritised the reversal of economic, social andphysical decline in deprived areas. Policies and plans, such asSustainable Development: The UK Strategy (DoE, 1994), PlanningPolicy Statement 1 (ODPM, 2005a), the Sustainable Communitiesinitiative (ODPM, 2005b) and Securing the Future (ODPM, 2006),and planning requirements, including Section 106 agreements andthe soon-to-be-established Community Infrastructure Levy,helped lay the ‘‘foundations for flourishing, empowered commu-nities, contributing to the Government’s objectives for sustainabledevelopment’’ (DCLG, 2009, p. 11). In creating these foundationsfor sustainable development, the built environment takes centrestage.
The buildings, spaces and supporting physical infrastructuresproduced by today’s urban regeneration projects may have verylong asset lives, lasting hundreds of years in some cases. Forexample, the water and wastewater infrastructure in some of theUK’s major cities still relies on assets that were constructed in the19th century. Such assets have continued largely to be effective inspite of changes to the context within which they operate thatcould not have been foreseen at the time of their initial design(Bradford et al., 2010; Halliday, 2001). In contrast, although thesocial or worker housing built in the UK and the USA in the post-war period was designed to address many of the perceivedshortcomings of the housing it replaced, much has been eitherdemolished or substantially redeveloped before the end of itsdesign life (Bullock, 2002; Wolfe, 1981).
Examples such as these highlight the potential for significant,unintended outcomes for assets within the urban environment.Designing and developing the built environment now in what webelieve to be a sustainable way, even when evidently avoiding pastmistakes, does not guarantee the long-term resilience of thatenvironment (i.e., that it will continue to meet the needs of societyfor the duration of its lifespan). Changing attitudes, policyemphases and technologies, amongst other things, may meanthat what decision-makers implement today for the sake of asustainable regeneration project will not necessarily contribute tothe development of a sustainable future. Investments in sustain-able urban regeneration need to be informed by an appreciation ofdifferent technologies, but also of behavioural change linked toglobal environmental change, demographic change—including, indeveloped countries, an ageing population—and economic restruc-turing. Because the urban environment, and in particular,regeneration in that environment (Catney and Lerner, 2009),involves the management of many different forms of expertisefrom decision-makers with very different disciplinary and
Please cite this article in press as: Boyko, C.T., et al., Benchmarking suGlobal Environ. Change (2011), doi:10.1016/j.gloenvcha.2011.10.004
professional backgrounds, this becomes a difficult task (Evansand Marvin, 2006; Petts et al., 2008). Finding a way to harnessinsights about plausible futures offers decision-makers involved inplanning, design, ecology, engineering, transport, education, healthand so forth a method for working together to assess thesustainability of today’s solutions (i.e., decisions, methods, tools,techniques, instruments, designs, policies, guidance etc. imple-mented today in the name of sustainability).
Future scenarios are ‘‘plausible, challenging and relevant storiesabout how the future might unfold, which can be told in bothwords and numbers’’ (Raskin et al., 2005, p. 36). These storiesprovide insight into the present through an identification of driversof change, the potential outcomes of current trajectories andopportunities for engagement and exploitation (Raskin et al.,1998). That is, scenario-building is not aimed at predicting thefuture, but at better understanding uncertainties so that decisionsare robust under a wide range of possible futures (Schwartz, 1996;Moss et al., 2010). Future scenarios have been applied to the global(e.g., Nakicenovic and Swart, 2000; Moss et al., 2010), European(e.g., Rotmans et al., 2000), national (e.g., DTI, 2002) and city-region(Ravetz, 2000) scales. However, if what is learned from futurescenarios is going to be applicable to the context of today’sregeneration projects and impact on public and private sectordecisions (Berkhout and van Drunen, 2007), then strategies arerequired that tailor large-scale futures-thinking to local contexts(Hunt et al., 2008).
Through the description of a broad strategy to use futuresthinking in sustainable urban regeneration—in this case, thestrategy is a toolkit, developed by the Urban Futures (UF) project1—this paper aims to answer the following research question: How
can the impact of uncertain futures on the performance of different
indicators for sustainability in an urban regeneration context be
systematically quantified and qualified? The UF toolkit has two keycomponents: (1) a series of generic and topic area-specificindicators that reflect current best practice for measuringsustainability performance; and (2) a list of characteristics thatdescribe four different futures, derived from the existing scenariosliterature. For the purposes of this paper, an indicator is a variablethat represents an attribute of a system. It may be used to assessconditions and trends, compare across places and situations,provide early warning information and anticipate future condi-tions and trends (Gallopin, 1997; see also Hunt et al., 2008;Tunstall, 1992, 1994). A characteristic is a 1–2-sentence statementabout an issue or small set of issues, used to describe scenarios. Thetoolkit, which represents a broad strategy, method or process fordecision-makers and stakeholders to better understand theirdecisions made today, assesses the performance of individualindicators in different future scenarios and can be applied globallyand at different scales. Finally, it allows a range of different,plausible futures to be explored systematically. The paperconcludes with a discussion of how to adapt the toolkit to newscenarios (and to new characteristics for existing scenarios) andnew indicators.
2. Assessing performance in the urban environment
2.1. Using indicators to assess performance
A range of discipline-specific activities is required to assess theperformance of sustainable urban environments, such as under-standing commercial rental rates and business cycles (economics);
stainability in cities: The role of indicators and future scenarios.

C.T. Boyko et al. / Global Environmental Change xxx (2011) xxx–xxx 3
G Model
JGEC-951; No. of Pages 10
measuring particulate matter to identify air pollution (chemistry)and; designing, monitoring and managing sub-surface infrastruc-ture (engineering). These activities can be translated into topicarea-specific indicators that highlight progress in crucial areas forsustainable development that may assist in identifying how, whenand where action may be required (DEFRA, 2009; see alsoHammond et al., 1995; Pagina, 2000). Such indicators also canhelp to identify past trends; evaluate policy actions (Rydin et al.,2003; van der Heijden, 1997); guide and mould policy decisions(Hezri and Dovers, 2006; Rydin et al., 2003); add to the process ofgovernance (Rydin et al., 2003); communicate with localcommunities about activities undertaken by organisations thatare using indicators (Gahin et al., 2003; Rydin et al., 2003); betterunderstand views on sustainable development (Hezri and Dovers,2006; Rydin et al., 2003); influence people and their behaviour(Sommer, 2000; Vedung and van der Doelen, 1998); and create apractical and reasonable evidence base to improve policymakers’decisions at a variety of scales relating to sustainability (Alberti,1996; Pannell and Schilizzi, 1999; Pannell and Glenn, 2000).
Indicator measures may be either quantitative (e.g., distance inmetres to the nearest school, general practitioner or transport linkto assess accessibility) or qualitative (e.g., subjective perception ofcrowding to assess cultural values associated with density). Theymay be associated with benchmarks (e.g., specific standards statethat people living in towns and cities should have an accessiblenatural greenspace of at least 2 ha in size, no more than 300 m,5 min walk, from home; Natural England, 2008), best practiceguidance (e.g., Urban Design Compendium, Llewelyn-Davies,2000), typical guidance and even ‘sustainability ranges’, whichare minimum and maximum threshold values for sustainabilityindicators (Wiek and Binder, 2005). The Audit Commission (2000,2009), Audit Commission and IDeA (2002) and the DETR (1999) inthe UK provide examples of these approaches.
Although indicators are being used increasingly to assessperformance of sustainability and urban regeneration, some issuesarise that call into question their universal acceptance. Somescholars are sceptical that a clear relationship exists betweenindicator development and real change in decision-making andpolicy (see Gahin et al., 2003; Innes and Booher, 1999; Maclaren,1996; Rydin et al., 2003). This could be due to a paucity of strong,evaluative research and monitoring on indicators (Imrie andThomas, 1995), as well as an over-emphasis on quantitativeassessment at the expense of qualitative measurement (Turok,1989; Burns, 2000; Hakim, 2000; Wong, 2002). Moreover, therehas been little investigation of benchmarking ‘good sustainabilitypractice’ in urban regeneration due to the relative infancy ofsustainable urban regeneration (Hemphill et al., 2004b). To combatthese issues, UF has used a mixture of qualitative and quantitativeindicators that reflect the multidisciplinary issues beingresearched on the project. Indicators also have been appropriatedfrom a variety of ‘good sustainability practice’ sources, includinggovernmental (e.g., DCLG, DoE) and non-governmental organisa-tions (e.g., CABE) as well as the private sector (e.g., Water UK).
2.2. Using indicators in the toolkit
The first stage of the UF toolkit was for each topic arearepresented in the project to ask key, topic area-specific questionsthat would help identify indicators.2 For example, those involvedin Water and Waste Water asked, ‘‘How clean is the drinking water?’’,
2 Topic areas represented in the UF project include: biodiversity; air quality;
water and waste water; sub-surface built environment, infrastructure and utility
services; surface built environment and open spaces; density and design decision-
making; organisational behaviour and innovation; and social needs, aspirations and
planning policy.
Please cite this article in press as: Boyko, C.T., et al., Benchmarking suGlobal Environ. Change (2011), doi:10.1016/j.gloenvcha.2011.10.004
which led to water researchers on the UF team identifying a Water
Quality indicator. Through its eight topic areas, the UF project hastried to represent a diversity of issues that are found within theurban environment, examining them from below ground (e.g.,sub-surface infrastructure, tree roots), at ground level (e.g.,buildings and open spaces, urban density, attitudes of citizensabout their local government) and from above (e.g., air pollution,bird and bat corridors). Moreover, where possible and whereexpertise allowed, additional indicators have been incorporatedthat speak to issues not directly related to the topic areas, yet areinherently important to sustainable urban regeneration (e.g.,transportation, health).
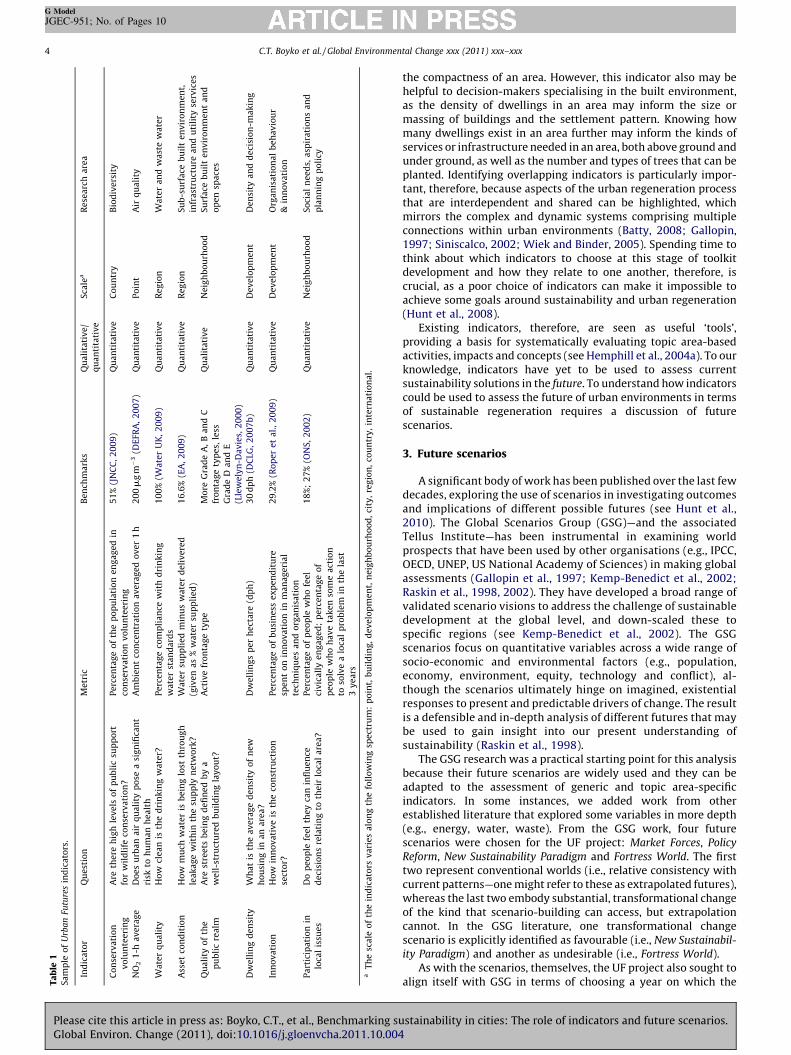
Once indicators and key questions were asked, metrics for eachindicator were selected—for Water Quality, one metric was:Percentage compliance of drinking water standards. The final partof this first stage entailed finding an appropriate benchmark foreach indicator, which compares indicator performance against aclearly defined, fixed and accepted norm (Audit Commission,2000), as seen in Table 1. For UF, benchmarks could be currentguidelines (i.e., what is required), current best practice (i.e., what isachievable), current typical practice or behaviour (i.e., what iscurrently done), or the current situation (i.e., what is happeningnow as a result of what has happened in the past; an average). WithWater Quality, the benchmark was 100% potable water, which isconsidered best practice, as defined by Water UK (2009). Table 1also shows whether each sample indicator is quantitative orqualitative, at what scale the indicator is used and to what researcharea the indicator belongs.
For many disciplines, professions and research areas involved inthe process of urban regeneration, comprehensive lists ofindicators and benchmarks for what can be considered ‘bestpractice’ performance already exist (see Hemphill et al., 2004b, foran evaluation of six urban regeneration schemes in Europe). Forexample, at a building scale, tools such as The Code for Sustainable
Homes in the UK, Leadership in Energy and Environmental Design inthe US, Green Star in Australia and the Comprehensive Assessment
System for Built Environment Efficiency in Japan provide detailedguidance on the performance of issues such as energy and waterconsumption (DCLG, 2008; Green Building Council of Australia,2010; Japan Sustainable Building Consortium, 2010; U.S. GreenBuilding Council, 2010). Similarly, at an urban scale, the Urban
Design Compendium in the UK offers guidance on issues such as themix of densities for a range of housing types, locations and levels ofcar parking provision (Llewelyn-Davies, 2000). As such, the list ofindicators and associated information is based on existingknowledge and expertise.
The end result of this first stage in the development of the UFtoolkit was a matrix of more than 120 indicators and associatedbenchmarks, spread across the eight topic areas represented in theproject. Working across different topic areas in this respectunderscores the potential differences in scale between indicatorsand the changing nature of the types of data required to quantify orqualify performance. For example, decision-makers wishing toconsider percentage tree cover as a quantitative indicator of oneaspect of a sustainable urban regeneration site relating to wildlifeconnectivity would need to look at a larger scale, beyond just thesite, to fully understand the sustainability benefits of those trees.Although the indicators are focussed on different scales and takedifferent forms (i.e., qualitative, quantitative), the informationgleaned from their performance can be used by decision-makers tomake more informed and holistic decisions about the sustainabili-ty of urban regeneration sites and areas. Furthermore, workingacross different topic areas, as has been done in the UF toolkit,helps identify potential areas of overlap between aspects ofsustainability. For example, dwelling density, as measured by thenumber of dwellings per hectare, may be used as one indicator of
stainability in cities: The role of indicators and future scenarios.
Ta
ble
1S
am
ple
of
Urb
an
Futu
res
ind
ica
tors
.
Ind
ica
tor
Qu
est
ion
Me
tric
Be
nch
ma
rks
Qu
ali
tati
ve
/
qu
an
tita
tiv
e
Sca
lea
Re
sea
rch
are
a
Co
nse
rva
tio
n
vo
lun
tee
rin
g
Are
the
reh
igh
lev
els
of
pu
bli
csu
pp
ort
for
wil
dli
feco
nse
rva
tio
n?
Pe
rce
nta
ge
of
the
po
pu
lati
on
en
ga
ge
din
con
serv
ati
on
vo
lun
tee
rin
g
51
%(J
NC
C,
20
09
)Q
ua
nti
tati
ve
Co
un
try
Bio
div
ers
ity
NO
21
-ha
ve
rag
eD
oe
su
rba
na
irq
ua
lity
po
sea
sig
nifi
can
t
risk
toh
um
an
he
alt
h
Am
bie
nt
con
cen
tra
tio
na
ve
rag
ed
ov
er
1h
20
0m
gm�
3(D
EFR
A,
20
07
)Q
ua
nti
tati
ve
Po
int
Air
qu
ali
ty
Wa
ter
qu
ali
tyH
ow
cle
an
isth
ed
rin
kin
gw
ate
r?P
erc
en
tag
eco
mp
lia
nce
wit
hd
rin
kin
g
wa
ter
sta
nd
ard
s
10
0%
(Wa
ter
UK
,2
00
9)
Qu
an
tita
tiv
eR
eg
ion
Wa
ter
an
dw
ast
ew
ate
r
Ass
et
con
dit
ion
Ho
wm
uch
wa
ter
isb
ein
glo
stth
rou
gh
lea
ka
ge
wit
hin
the
sup
ply
ne
two
rk?
Wa
ter
sup
pli
ed
min
us
wa
ter
de
liv
ere
d
(giv
en
as
%w
ate
rsu
pp
lie
d)
16
.6%
(EA
,2
00
9)
Qu
an
tita
tiv
eR
eg
ion
Su
b-s
urf
ace
bu
ilt
en
vir
on
me
nt,
infr
ast
ruct
ure
an
du
tili
tyse
rvic
es
Qu
ali
tyo
fth
e
pu
bli
cre
alm
Are
stre
ets
be
ing
de
fin
ed
by
a
we
ll-s
tru
ctu
red
bu
ild
ing
lay
ou
t?
Act
ive
fro
nta
ge
typ
eM
ore
Gra
de
A,
Ba
nd
C
fro
nta
ge
typ
es,
less
Gra
de
Da
nd
E
(Lle
we
lyn
-Da
vie
s,2
00
0)
Qu
ali
tati
ve
Ne
igh
bo
urh
oo
dS
urf
ace
bu
ilt
en
vir
on
me
nt
an
d
op
en
spa
ces
Dw
ell
ing
de
nsi
tyW
ha
tis
the
av
era
ge
de
nsi
tyo
fn
ew
ho
usi
ng
ina
na
rea
?
Dw
ell
ing
sp
er
he
cta
re(d
ph
)3
0d
ph
(DC
LG,
20
07
b)
Qu
an
tita
tiv
eD
ev
elo
pm
en
tD
en
sity
an
dd
eci
sio
n-m
ak
ing
Inn
ov
ati
on
Ho
win
no
va
tiv
eis
the
con
stru
ctio
n
sect
or?
Pe
rce
nta
ge
of
bu
sin
ess
ex
pe
nd
itu
re
spe
nt
on
inn
ov
ati
on
inm
an
ag
eri
al
tech
niq
ue
sa
nd
org
an
isa
tio
n
29
.2%
(Ro
pe
re
ta
l.,
20
09
)Q
ua
nti
tati
ve
De
ve
lop
me
nt
Org
an
isa
tio
na
lb
eh
av
iou
r
&in
no
va
tio
n
Pa
rtic
ipa
tio
nin
loca
lis
sue
s
Do
pe
op
lefe
el
the
yca
nin
flu
en
ce
de
cisi
on
sre
lati
ng
toth
eir
loca
la
rea
?
Pe
rce
nta
ge
of
pe
op
lew
ho
fee
l
civ
ica
lly
en
ga
ge
d;
pe
rce
nta
ge
of
pe
op
lew
ho
ha
ve
tak
en
som
ea
ctio
n
toso
lve
alo
cal
pro
ble
min
the
last
3y
ea
rs
18
%;
27
%(O
NS
,2
00
2)
Qu
an
tita
tiv
eN
eig
hb
ou
rho
od
So
cia
ln
ee
ds,
asp
ira
tio
ns
an
d
pla
nn
ing
po
licy
aT
he
sca
leo
fth
ein
dic
ato
rsv
ari
es
alo
ng
the
foll
ow
ing
spe
ctru
m:
po
int,
bu
ild
ing
,d
ev
elo
pm
en
t,n
eig
hb
ou
rho
od
,ci
ty,
reg
ion
,co
un
try
,in
tern
ati
on
al.
C.T. Boyko et al. / Global Environmental Change xxx (2011) xxx–xxx4
G Model
JGEC-951; No. of Pages 10
Please cite this article in press as: Boyko, C.T., et al., Benchmarking suGlobal Environ. Change (2011), doi:10.1016/j.gloenvcha.2011.10.004
the compactness of an area. However, this indicator also may behelpful to decision-makers specialising in the built environment,as the density of dwellings in an area may inform the size ormassing of buildings and the settlement pattern. Knowing howmany dwellings exist in an area further may inform the kinds ofservices or infrastructure needed in an area, both above ground andunder ground, as well as the number and types of trees that can beplanted. Identifying overlapping indicators is particularly impor-tant, therefore, because aspects of the urban regeneration processthat are interdependent and shared can be highlighted, whichmirrors the complex and dynamic systems comprising multipleconnections within urban environments (Batty, 2008; Gallopin,1997; Siniscalco, 2002; Wiek and Binder, 2005). Spending time tothink about which indicators to choose at this stage of toolkitdevelopment and how they relate to one another, therefore, iscrucial, as a poor choice of indicators can make it impossible toachieve some goals around sustainability and urban regeneration(Hunt et al., 2008).
Existing indicators, therefore, are seen as useful ‘tools’,providing a basis for systematically evaluating topic area-basedactivities, impacts and concepts (see Hemphill et al., 2004a). To ourknowledge, indicators have yet to be used to assess currentsustainability solutions in the future. To understand how indicatorscould be used to assess the future of urban environments in termsof sustainable regeneration requires a discussion of futurescenarios.
3. Future scenarios
A significant body of work has been published over the last fewdecades, exploring the use of scenarios in investigating outcomesand implications of different possible futures (see Hunt et al.,2010). The Global Scenarios Group (GSG)—and the associatedTellus Institute—has been instrumental in examining worldprospects that have been used by other organisations (e.g., IPCC,OECD, UNEP, US National Academy of Sciences) in making globalassessments (Gallopin et al., 1997; Kemp-Benedict et al., 2002;Raskin et al., 1998, 2002). They have developed a broad range ofvalidated scenario visions to address the challenge of sustainabledevelopment at the global level, and down-scaled these tospecific regions (see Kemp-Benedict et al., 2002). The GSGscenarios focus on quantitative variables across a wide range ofsocio-economic and environmental factors (e.g., population,economy, environment, equity, technology and conflict), al-though the scenarios ultimately hinge on imagined, existentialresponses to present and predictable drivers of change. The resultis a defensible and in-depth analysis of different futures that maybe used to gain insight into our present understanding ofsustainability (Raskin et al., 1998).
The GSG research was a practical starting point for this analysisbecause their future scenarios are widely used and they can beadapted to the assessment of generic and topic area-specificindicators. In some instances, we added work from otherestablished literature that explored some variables in more depth(e.g., energy, water, waste). From the GSG work, four futurescenarios were chosen for the UF project: Market Forces, Policy
Reform, New Sustainability Paradigm and Fortress World. The firsttwo represent conventional worlds (i.e., relative consistency withcurrent patterns—one might refer to these as extrapolated futures),whereas the last two embody substantial, transformational changeof the kind that scenario-building can access, but extrapolationcannot. In the GSG literature, one transformational changescenario is explicitly identified as favourable (i.e., New Sustainabil-
ity Paradigm) and another as undesirable (i.e., Fortress World).As with the scenarios, themselves, the UF project also sought to
align itself with GSG in terms of choosing a year on which the
stainability in cities: The role of indicators and future scenarios.
C.T. Boyko et al. / Global Environmental Change xxx (2011) xxx–xxx 5
G Model
JGEC-951; No. of Pages 10
future scenarios could be based: 2050. This date was far enough inadvance of today that descriptions of the future could be differentfrom how we would describe the present, yet they were not tooadvanced that decisions being made now in the name ofsustainability could not be reasonably assessed via a current setof indicators. Furthermore, because 2050 was chosen as the yearthat the project ‘dropped into’, rather than the year that we movedtowards, it meant that UF was not concerned with backcasting, orhow particular designs, policies and so forth developed or evolvedfrom today to 2050. ‘Dropping in’ allowed the UF project to viewwhat was happening in particular scenarios without having toidentify plausible pathways for getting there beyond those alreadyestablished by GSG (Raskin et al., 1998).
In terms of the development of the scenarios, they weredescribed first in long paragraph form from the GSG literature,comprising hundreds of pages. To assess and compare theperformance of the selected indicators in any significant way,however, requires the scenarios to be more accessible for analysis.To this end, the UF project separated scenario paragraphs intocharacteristics. The characteristics allow an issue or small set ofissues to be written in a bite-sized format for each scenario. Forexample, we were able to isolate information about populationgrowth in the New Sustainability Paradigm scenario by writingabout the issue in one sentence. Using GSG’s words: ‘Populationgrowth slows, stabilizing at relatively low levels through voluntaryreductions in family size in countries with fast growing popula-tions.’ This statement, versus a larger paragraph, helps keepcharacteristics clear, concise and more useful when comparingissues across the scenarios.
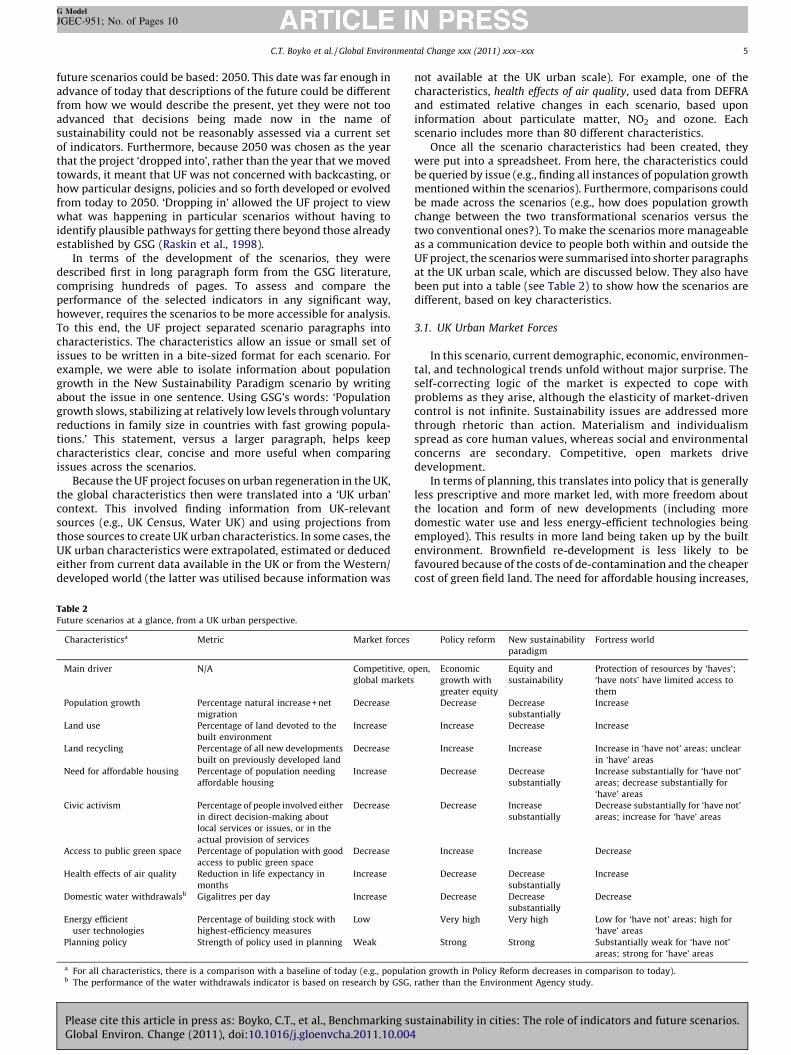
Because the UF project focuses on urban regeneration in the UK,the global characteristics then were translated into a ‘UK urban’context. This involved finding information from UK-relevantsources (e.g., UK Census, Water UK) and using projections fromthose sources to create UK urban characteristics. In some cases, theUK urban characteristics were extrapolated, estimated or deducedeither from current data available in the UK or from the Western/developed world (the latter was utilised because information was
Table 2Future scenarios at a glance, from a UK urban perspective.
Characteristicsa Metric Market forces
Main driver N/A Competitive, o
global markets
Population growth Percentage natural increase + net
migration
Decrease
Land use Percentage of land devoted to the
built environment
Increase
Land recycling Percentage of all new developments
built on previously developed land
Decrease
Need for affordable housing Percentage of population needing
affordable housing
Increase
Civic activism Percentage of people involved either
in direct decision-making about
local services or issues, or in the
actual provision of services
Decrease
Access to public green space Percentage of population with good
access to public green space
Decrease
Health effects of air quality Reduction in life expectancy in
months
Increase
Domestic water withdrawalsb Gigalitres per day Increase
Energy efficient
user technologies
Percentage of building stock with
highest-efficiency measures
Low
Planning policy Strength of policy used in planning Weak
a For all characteristics, there is a comparison with a baseline of today (e.g., populatb The performance of the water withdrawals indicator is based on research by GSG,
Please cite this article in press as: Boyko, C.T., et al., Benchmarking suGlobal Environ. Change (2011), doi:10.1016/j.gloenvcha.2011.10.004
not available at the UK urban scale). For example, one of thecharacteristics, health effects of air quality, used data from DEFRAand estimated relative changes in each scenario, based uponinformation about particulate matter, NO2 and ozone. Eachscenario includes more than 80 different characteristics.
Once all the scenario characteristics had been created, theywere put into a spreadsheet. From here, the characteristics couldbe queried by issue (e.g., finding all instances of population growthmentioned within the scenarios). Furthermore, comparisons couldbe made across the scenarios (e.g., how does population growthchange between the two transformational scenarios versus thetwo conventional ones?). To make the scenarios more manageableas a communication device to people both within and outside theUF project, the scenarios were summarised into shorter paragraphsat the UK urban scale, which are discussed below. They also havebeen put into a table (see Table 2) to show how the scenarios aredifferent, based on key characteristics.
3.1. UK Urban Market Forces
In this scenario, current demographic, economic, environmen-tal, and technological trends unfold without major surprise. Theself-correcting logic of the market is expected to cope withproblems as they arise, although the elasticity of market-drivencontrol is not infinite. Sustainability issues are addressed morethrough rhetoric than action. Materialism and individualismspread as core human values, whereas social and environmentalconcerns are secondary. Competitive, open markets drivedevelopment.
In terms of planning, this translates into policy that is generallyless prescriptive and more market led, with more freedom aboutthe location and form of new developments (including moredomestic water use and less energy-efficient technologies beingemployed). This results in more land being taken up by the builtenvironment. Brownfield re-development is less likely to befavoured because of the costs of de-contamination and the cheapercost of green field land. The need for affordable housing increases,
Policy reform New sustainability
paradigm
Fortress world
pen, Economic
growth with
greater equity
Equity and
sustainability
Protection of resources by ‘haves’;
‘have nots’ have limited access to
them
Decrease Decrease
substantially
Increase
Increase Decrease Increase
Increase Increase Increase in ‘have not’ areas; unclear
in ‘have’ areas
Decrease Decrease
substantially
Increase substantially for ‘have not’
areas; decrease substantially for
‘have’ areas
Decrease Increase
substantially
Decrease substantially for ‘have not’
areas; increase for ‘have’ areas
Increase Increase Decrease
Decrease Decrease
substantially
Increase
Decrease Decrease
substantially
Decrease
Very high Very high Low for ‘have not’ areas; high for
‘have’ areas
Strong Strong Substantially weak for ‘have not’
areas; strong for ‘have’ areas
ion growth in Policy Reform decreases in comparison to today).
rather than the Environment Agency study.
stainability in cities: The role of indicators and future scenarios.

3 NIMBY is an acronym for Not In My Back Yard, and refers to ‘‘protectionist
attitudes of and oppositional tactics adopted by community groups facing an
unwelcome development in their neighborhood’’ (Dear, 1992, p. 288).
C.T. Boyko et al. / Global Environmental Change xxx (2011) xxx–xxx6
G Model
JGEC-951; No. of Pages 10
as attention is focussed on more niche markets (e.g., luxury flats forcouples with no children) at the expense of equality. Access topublic green space also will suffer, as such land uses may beconverted for development purposes, or may become private orsemi-private spaces. Less access to a city’s ‘green lungs’ across thepopulation may lead to poorer respiratory health overall. Suchdeficiencies, coupled with more individualistic attitudes, mayresult in low civic activism.
3.2. UK Urban Policy Reform
In this scenario, co-ordinated and comprehensive governmentaction is initiated to reduce poverty and social conflict whileenhancing environmental sustainability; market forces are ‘en-couraged’ to produce socially desirable outcomes, but by no meansare they silent. Strong policies and growing environmental andsocial consciousness emerge to support some changes in consumerbehaviour. Such policies also slow, but do not reverse, trendstowards high distributional inequity that the market alone woulddo little to address. Tensions still exist between the continueddominance of conventional ideologies and values and the keysustainability goals espoused in the World Commission onEnvironment and Development (1987) report.
Planning policy is strong in this scenario, with greaterregulation of development proposals and a more regional focusthan today. This means more land recycling, a stabilisation (orslight increase) of land for built environment purposes, a decreasein the need for affordable housing, greater overall access to publicgreen space, very high uptake of energy efficient user technologyand a decrease in the negative health effects from air pollution.Moreover, global population growth decreases, lower domesticwater withdrawals. In addition, despite government action to bemore sustainable, people are less actively involved in decision-making about local services because policymaking remains top-down and decisions are still made by key, influential people, ratherthan by a larger majority.
3.3. UK Urban New Sustainability Paradigm
In this scenario, new socio-economic arrangements andfundamental alterations in societal values change the characterof civilisation. The conventional notion of progress via economicgrowth is openly challenged, such that sustainability becomesembedded in decision-makers’ thinking about how society grows,and the search for a deeper basis for human happiness andfulfilment is sought. An ethos of ‘one planet living’ pervades,facilitating a shared vision for a more equitable and sustainedquality of life, now and in the future.
Planning policies are highly regulated, emphasising ecologicalimperatives, regional planning and sustainability. This results in anincrease in active land recycling and a decrease in land devoted tothe built environment. In addition, there is almost no need foraffordable housing, as the urban underclass is eliminated and societyis more equitable, and access to public green space is high. Because ofstrong ecological imperatives, strong regulation and a push for muchmore renewable energy generation, there is a very high uptake ofenergy-efficient user technology. In addition, domestic waterwithdrawals decrease substantially as well as the negative healtheffects from air pollution. Finally, in line with the idea of ‘one planetliving’, global population growth decreases substantially and civicactivism in making areas more liveable increases substantially.
3.4. UK Urban Fortress World
In this scenario, powerful actors organise themselves intoalliances in an effort to safeguard their own interests and
Please cite this article in press as: Boyko, C.T., et al., Benchmarking suGlobal Environ. Change (2011), doi:10.1016/j.gloenvcha.2011.10.004
resources. The world divides into two groups: an authoritarianelite who live in interconnected, protected enclaves controllingaccess to resources (called the ‘haves’), and an impoverishedmajority outside (called the ‘have nots’).
Planning policies serve to protect the resources and quality oflife of the ‘haves’ and effectively segregate the ‘haves’ from the‘have nots’. The built environment sprawls, with the ‘haves’gobbling up land for low-density, single-use developments andareas, and the ‘have nots’ using leftover land to create high-density, mixed-use areas out of necessity. Re-use of land andinfrastructure is predominantly by the ‘have nots’ and ischaracterised by low-tech recycling and repair rather thanremediation and regeneration. Affordable housing is much-needed for ‘have nots’, but of little or no need for the ‘haves’,who live in relative luxury. The impoverished majority also aredenied access, by spatial and financial patterns, to public greenspace. In terms of the negative health effects of air pollution,there is a general reduction in life expectancy, as emissions fromtraffic and other sources cannot be contained to one area.Although NIMBYism drives strong enforcement inside theenclaves and newer technology keeps emissions close topresent-day levels, emissions outside the enclaves increaseand spread due to poor vehicle maintenance and outdatedtechnology.3 Furthermore, energy-efficient user technologies arereadily adopted in ‘haves’ areas because they are affordable tothis group; the ‘have nots’, on the other hand, do not use suchtechnologies because they cost too much. Interestingly, eventhough population growth increases, domestic water with-drawals decrease. This may be due in small part to the use ofmore energy-efficient technologies by the ‘haves’ and therestriction of water use for the ‘have nots’. Finally, civic activismis not high on the ‘have nots’ agenda, as their opinions and ideasare not considered in this scenario. However, the ‘haves’ aremore active in civic decision-making, although many of thedecisions and policies attempt to exclude the ‘have nots’ fromareas, activities and services.
By identifying a common set of characteristics from thesedescriptions, it is possible to recognise the direct effect of eachscenario on the resulting urban environment. It is important torecognise that the scenarios summarised above represent simply anumber of plausible alternative futures and are not linked tocurrent policy or practice. They are not intended to be exhaustive,and no individual scenario is thought to be more probable than anyother. Descriptions of the scenarios also may emphasise differentperspectives, scales or lenses, depending on what researchers areinterested in exploring (e.g., developing world, Africa, Lagos). In theUF project, we were interested in describing the UK context; thus,our scenarios reflect this scale. Finally, scenarios enable theperformance of a wide range of indicators to be assessed against avariety of futures that exhibit very different characteristics,thereby allowing the relative vulnerability of any given indicatorto be identified.
4. Assessing performance against the future scenarios
Once each of the four scenarios has been described in terms of aset of characteristics as outlined in Section 3 and Table 2, they canbe used to assess the relative performance of any givensustainability indicator and to highlight areas of potentialvulnerability to different futures. This involves looking back oneach set of scenario characteristics and then making assumptionsand deductions about the progress towards attainment of the
stainability in cities: The role of indicators and future scenarios.

Table 3Sample of Urban Futures indicators and their performance across the scenarios.
Indicator Question Metric Benchmarks Baseline MFa PR NSP FW ‘haves’ FW ‘have
nots’
Solar access Are dwellings maximising access to
direct sun in winter months so as
to reduce space heating demand?
Winter possible
sunlight hoursb
5% (BSI, 1992) Varies with
location.
#c " " " #
NO2 1-h average Does urban air quality pose a
significant risk to human health?
Ambient
concentration
averaged over 1 h
200 mg m�3 Varies with
location.
" # ## " "
a MF: market forces; PR: policy reform; NSP: new sustainability paradigm; FW ‘haves’: fortress world elite; FW ‘have nots’: fortress world impoverished.b Percentage of probable sunlight hours received over the winter months, between 23 September and 21 March (British Standards, 1992).c (") Increasing in comparison to baseline (today); ("") increasing a lot in comparison to baseline; (–) no change in comparison to baseline; (#) decreasing in comparison to
baseline; (##) decreasing a lot in comparison to baseline.
C.T. Boyko et al. / Global Environmental Change xxx (2011) xxx–xxx 7
G Model
JGEC-951; No. of Pages 10
indicators in each scenario. To standardise the evaluations acrossscenarios, current conditions are used as a baseline (i.e., UF usesthe latest available data from a variety of sources relevant to eachtopic area). It is important to recognise that, in this analysis, thesame indicators are used across the scenarios and the performanceof any given indicator in each scenario is judged relative to itsbaseline. For example, when considering Solar Access (SA) asdescribed in Table 3, against the scenario descriptions for Planning
Policy in Table 2, the likelihood of meeting the benchmarkconditions for an important element of that indicator, Winter
Possible Sunlight Hours (WPSH), will vary across each of thescenarios. This is because the ability to meet such particularrequirements will be largely dictated by planning policy, thestrength of which will vary both between and within scenarios.
In the UK Urban Market Forces scenario, planning policy isexpected to weaken (see Table 2), being driven by the power of themarket. Under such conditions the need for the relationshipbetween proximal buildings to be managed to provide SA duringwinter months, when sun angles are low, is likely to be supersededby a market that seeks to maximise profits from land values,possibly by increasing building densities. Consequently, a devel-opment constructed today, whose performance is based on SAcould be vulnerable under the Market Forces scenario. Conversely,under UK Urban Policy Reform and UK Urban New SustainabilityParadigm scenarios, planning policy is likely to strengthen (seeTable 2) and SA principles are likely to be protected or evenprivileged. Therefore, a development constructed today, whoseperformance is based on SA could be resilient under UK UrbanPolicy Reform and UK Urban New Sustainability Paradigmscenarios. Under the UK Urban Fortress World scenario, therelative vulnerability of SA varies between the ‘haves’ and ‘havenots’. For the ‘haves’, planning policy will strengthen (see Table 2)and could possibly protect or even privilege the adoption of SA and,hence, access to winter sun. However, for the ‘have nots’, SA isunlikely to be a conscious feature of the urban environment.Consequently, the resilience of a development constructed today,whose performance is based on SA would vary in a UK UrbanFortress World scenario.
By completing this analysis for all of the identified indicators ineach of the scenarios, a broad picture of those aspects of urbanregeneration that are particularly vulnerable to changing futureconditions can be established. This analysis then can be used toconsider how the regeneration process not only can help to deliveractions that are sustainable under today’s conditions, but also howthey can be made more resilient to help maintain their performancein the future (see Lombardi et al., submitted for publication; Rogerset al., in press, for more information about the resilience ofsolutions). Using the example from above, it is likely that the abilityto maintain the desired SA is going to vary across different scenarios(see Table 3). Consequently, to ensure that the reduction of energydemand through the provision of SA is a robust solution, measures
Please cite this article in press as: Boyko, C.T., et al., Benchmarking suGlobal Environ. Change (2011), doi:10.1016/j.gloenvcha.2011.10.004
need to be adopted today that help ensure it is maintained in thefuture. Such measures could include covenants on particularbuildings or sites to ensure the spacing between buildings andtheir relative heights are protected and managed in perpetuity.
In some instances, it is relatively straightforward to deduceperformance from the characteristics. However, in other cases thescenarios literature does not provide sufficient depth to describeand, in particular, analyse the characteristics comprehensively. Thisimplies that the scenarios are ‘under-characterised’, and newcharacteristics, created from topic area-specific literature, arerequired before the scenarios can be assessed at the necessary scale.
For example, in trying to assess the performance of twoindicators, traffic levels and emissions from traffic, the initialscenario characteristics were insufficient. Further assumptions hadto be made, which were, themselves, derived from the scenariocharacteristics to ensure consistency. Examining UK Urban NewSustainability Paradigm, the following characteristics were noted:
� Public preferences and prices shift to new sustainabilitytechnologies.� A revised tax system and other market signals to discourage
environmental ‘‘bads’’ and certain types of consumption.� The polluter pays principle is universally implemented.� Integrated settlement patterns place home, work, shops and
leisure activity in closer proximity.� Automobile dependence is reduced radically and a sense of
community and connectedness is re-established.� Lifestyles become less energy intensive while renewable energy
resources and highly efficient energy using equipment becomethe norm.� Chemical pollution is virtually eliminated with the gradual
phase-in of clean production processes.� Dispersed small towns also become popular as communication
and information technologies allow for the decentralisation ofactivities.� The migration from rural to urban areas reverses as many opt for
the lower stress level and increased contact with nature.
Based on these scenario characteristics, a new characteristicwas created that could be used to assess the indicators’performance in the scenario: Traffic levels decrease and emissions
from traffic decrease substantially. A narrative to accompany thisnew characteristic was also added: People are driving less due to
integrated settlement patterns—what driving they do has lower
emissions per mile due to new sustainability technologies and fines for
emissions. This exercise of using established characteristics,creating new characteristics and making assumptions about theperformance of the indicator was repeated for each scenario. Doingso ensures that the characteristics are relevant to a specific,developed world context and are internally consistent.
stainability in cities: The role of indicators and future scenarios.

C.T. Boyko et al. / Global Environmental Change xxx (2011) xxx–xxx8
G Model
JGEC-951; No. of Pages 10
5. Further development potential
One of the main benefits of using a toolkit such as the onedeveloped above is its flexibility. Although UF explored fourscenarios, new scenarios could be added to Table 3 in an effort toinvestigate more robustly how today’s sustainability solutionsperform across a broader range of futures (e.g., including GSG’sBreakdown or Eco-communalism variants, Raskin et al., 2002;adding the four scenarios from DTI, 2002).
New characteristics can be added to create a richer picture ofthe scenarios and so assess the sustainability performance of thescenarios more comprehensively. New characteristics also can befound within the existing scenario characteristics text (e.g., therewas information about crop yields in each of the GSG scenarios thatwas less useful to UF and so left out of the characteristics lists), ordeduced from the existing characteristics (e.g., traffic levelsillustrated in the previous section).
There also is the option of adding new indicators to the toolkit,again creating a more robust set that could be used to assess thescenarios. The UF indicator set was guided primarily by theproject’s key topic areas. However, this set could be expanded toinclude other topic areas pertinent to urban regeneration andsustainability, such as climate change and wellbeing, thusestablishing a more holistic and dynamic set of sustainabilityand regeneration indicators (Bossel, 1999; Robert, 2002; Wiek andBinder, 2005; Yli-Viikari, 2009). Moreover, the set of indicatorsshould reflect local priorities, which includes an understanding ofthe local community and culture, as community participation inthe development and monitoring of indicators is becoming animportant issue in the evaluation of indicator effectiveness (Gahinet al., 2003; Rydin et al., 2003). Thus, the toolkit not only helps toassess the performance of today’s sustainability solutions in thefuture, but is capable of being enlarged to suit the needs ofresearchers, ultimately giving decision-makers a better evidencebase with which to support their sustainable urban regenerationdecisions.
6. Conclusions
Urban regeneration has always played an important role innational, regional and local economic development, and is often atthe heart of delivering targets for sustainable development.However, much of the built environment that results fromregeneration programmes has long asset lives, some lastinghundreds of years. Historically, the likely implications of veryuncertain future conditions have not been integrated systemati-cally into the design and development processes for regeneration.In some cases, such an omission has not compromised the long-term performance of particular built assets that have continued tofunction effectively in spite of considerable change. However, inother cases, the failure to adequately consider uncertain futureconditions has led to assets prematurely reaching the end of theiruseful life. Given that urban regeneration plays such a key role insustainable development policy, it is important to recognise thatdesigning and developing the built environment now, in what webelieve to be a sustainable way, does not guarantee the long-termresilience of that environment. Consequently, there is an urgentrequirement for tools that enable planners and designers toincrease the resilience of urban regeneration investments withoutincorporating unnecessary redundancy into their designs.
Scenarios are recognised as a useful tool to help think about andvisualise the future, yet their potential use in exploring the urbancontext has not been realised to examine just how ‘sustainable’ ourhighly-acclaimed current designs and practices truly are. Throughanswering the following research question, ‘How can the impact of
uncertain futures on the performance of different indicators for
Please cite this article in press as: Boyko, C.T., et al., Benchmarking suGlobal Environ. Change (2011), doi:10.1016/j.gloenvcha.2011.10.004
sustainability in an urban regeneration context be systematically
quantified and qualified?’, this paper has discussed a toolkit,developed from the UF project, through which the relativevulnerability or resilience of a range of sustainability solutionscan be tested systematically against a number of different futures.Current best-practice guidance, assessment tools and designguides enable all disciplines engaged in the regeneration processto identify the key quantitative or qualitative indicators by whichperformance of their own solutions can be measured. Such sourcesalso allow the performance of these indicators to be measuredrelative to best practice targets or intended policy outcomes, butthey offer very little in terms of measuring future performance orsensitivity to change. However, by developing the existingscenarios-based literature, it is possible to describe a range ofdifferent futures in terms of a number of common characteristicsthat portray the resulting urban environment and that enabledifferences between these futures to be compared directly. Thesecharacterisations then can be used to consider how the perfor-mance of each indicator might be affected by the changes inindividual characteristics across all of the futures. Such an analysisprovides both an insight into which aspects of performance arevulnerable to change and a feedback mechanism through whichsolutions currently being implemented can be reconsidered toreduce their vulnerability, making them more resilient in the faceof future uncertainty.
An important aspect of the UF methodology underpinning thetoolkit is that it is flexible enough to enable new scenarios,characteristics and indicators to be evaluated systematically. Newcharacteristics could be added that create a richer picture of thescenarios and, therefore, have the potential to provide moreaccuracy when assessing the performance of the scenarios. Thesenew characteristics could be found within the already-existingscenario characteristics text or deduced and assumed from anarray of established characteristics. Also, new indicators could beadded, thereby creating a more holistic and dynamic evaluationthat is sensitive to the local context. Thus, the toolkit not only helpsto assess the performance of today’s sustainability solutions in thefuture, but is capable of being enlarged to suit the needs of differentresearch or decision-making perspectives.
The role of the funding source
Funding for the Urban Futures project was made possiblethrough the UK Engineering and Physical Sciences ResearchCouncil’s Sustainable Urban Environments 2 programme (EP/F007426/1).
References
Alberti, M., 1996. Measuring Urban Sustainability. Environmental Impact Assess-ment Review 16 (4–6), 381–424.
Audit Commission, 2000. Getting Better All the Time: Making Benchmarking Work.HMSO, London.
Audit Commission, 2009. Best Value Performance Indicators 2007/2008. HMSO,London.
Audit Commission and Improvement and Development Agency (IDeA), 2002. Actingof Facts: Using Performance Measurement to Improve Local Authority Services.HMSO, London.
Batty, M., 2008. The size, scale, and shape of cities. Sciences 319, 769–771.Berkhout, F., van Drunen, M., 2007. Socio-economic Scenarios in Climate Change
Research: A Review (Report W-07/07). VU University Amsterdam, Institute forEnvironmental Studies, Amsterdam.
Bossel, H., 1999. Indicators for Sustainable Development: Theory, Methods, Appli-cations. International Institute for Sustainable Development, Winnipeg,Canada.
Bradford, W., Bridgeman, J., Gaterell, M.R., 2010. A Review of the 1892 waterdemand forecast for Birmingham. Engineering History and Heritage 163 (1),39–49.
British Standards Institution (BSI), 1992. BS 8206-2: 1992. Lighting for Buildings.Code of Practice for Daylighting. BSI, London.
stainability in cities: The role of indicators and future scenarios.

C.T. Boyko et al. / Global Environmental Change xxx (2011) xxx–xxx 9
G Model
JGEC-951; No. of Pages 10
Bryson, J.R., 2007. Arts, dance, cultural infrastructure, and city regeneration:knowledge, audience development, and conventions, and the relocation of aroyal ballet company from London to Birmingham. Norwegian Journal ofGeography 61 (3), 98–110.
Bullock, N., 2002. Building the Post-war World: Modern Architecture and Recon-struction in Britain. Routledge, London.
Burns, R.B., 2000. Introduction to research methods. Sage, London.Catney, P., Lerner, D.N., 2009. Managing multidisciplinarity: lessons from SUBR:IM.
Interdisciplinary Science Reviews 34 (4), 290–308.Dear, M., 1992. Understanding and overcoming the NIMBY syndrome. Journal of the
American Planning Association 58 (3), 288–300.Department for Communities and Local Government (DCLG), 2007b. Planning
Policy Statement 3 (PPS3): Housing. HMSO, London.Department for Communities and Local Government (DCLG), 2008. The Code for
Sustainable Homes: Setting the Standard in Sustainability for New Homes.HMSO, London.
Department for Communities and Local Government (DCLG), 2009. TransformingPlaces; Changing Lives. A Framework for Regeneration. HMSO, London.
Department for Environment, Food and Rural Affairs (DEFRA), 2007. The Air QualityStrategy for England, Scotland, Wales and Northern Ireland, vol. 1. DEFRA,London.
Department for Environment, Food and Rural Affairs (DEFRA), 2009. SustainableDevelopment Indicators for Your Pocket 2009. DEFRA, London.
Department of the Environment (DoE), 1994. Sustainable Development: The UKStrategy. HMSO, London.
Department of the Environment, Transport and the Regions (DETR), 1999. Sustain-ability Strategy for the UK: A Better Quality of Life. HMSO, London.
Department of Trade and Industry (DTI), 2002. Future Foresight 2020: RevisedScenarios and Guidance. Office and Science and Technology, DTI, London.
Dovey, K., Sandercock, L., 2002. Hype and hope. Imagining: Melbourne’s docklands.City 6 (1), 83–101.
Environment Agency, 2009. Water Resources Strategy for England and Wales.Environment Agency, Bristol.
Evans, G., 2005. Measure for measure: evaluating the evidence of culture’s contri-bution to regeneration. Urban Studies 42 (5/6), 959–983.
Evans, R., Marvin, S., 2006. Researching the sustainable city: three modes ofinterdisciplinarity. Environment and Planning A 38, 1009–1028.
Gahin, R., Veleva, V., Hart, M., 2003. Do indicators help create sustainablecommunities? Local Environment 8 (6), 661–666.
Gallopin, G.C., 1997. Indicators and their use: information for decision-making. In:Moldan, B., Billharz, S. (Eds.), Sustainability Indicators: Report of the Project onIndicators of Sustainable Development. Wiley, London.
Gallopin, G., Hammond, A., Raskin, P., Swart, R., 1997. Branch Points: GlobalScenarios and Human Choice. Stockholm Environment Institute, Stockholm.
Green Building Council of Australia, 2010. Green Star. Available at http://www.gbca.org.au/green-star/ (Accessed 09.09.10).
Hakim, C., 2000. Research Design: Successful Designs for Social and EconomicResearch. Routledge, London.
Halliday, S., 2001. The Great Stink of London: Sir Joseph Bazalgette and theCleansing of the Victorian Metropolis. Sutton, Stroud.
Hammond, A., Adriaane, A., Rodenburg, E., Bryant, D., Woodward, R., 1995. Envi-ronmental Indicators: A Systematic Approach to Measuring and Reporting onEnvironmental Policy Performance in the Context of Sustainable Development.World Resources Institute, Washington, DC.
van der Heijden, K., 1997. Scenarios, Strategies and the Strategy Process. NijenrodeResearch Paper Series (No. 1997-01) Nijenrode University, Breukelen, NL.
Hemphill, L., Berry, J., McGreal, S., 2004a. An indicator-based approach to measuringsustainable urban regeneration performance: part 1, conceptual foundationsand methodological framework. Urban Studies 41 (4), 725–755.
Hemphill, L., Berry, J., McGreal, S., 2004b. An indicator-based approach to measuringsustainable urban regeneration performance: part 2, empirical evaluation andcase-study analysis. Urban Studies 41 (4), 757–772.
Hezri, A.A., Dovers, S.R., 2006. Sustainability indicators, policy and governance:issues for ecological economics. Ecological Economics 60 (1), 86–89.
Hunt, D.V.L., Lombardi, D.R., Rogers, C.D.F., Jefferson, I., 2008. Application of sus-tainability indicators in decision-making processes for urban regenerationprojects. Engineering Sustainability, Proceedings of the Institution of CivilEngineers 161 (1), 77–91.
Hunt, D.V.L., Lombardi, D.R., Atkinson, S., Barber, A., Barnes, M., Boyko, C., Brown, J.,Bryson, J., Butler, D., Caputo, S., Caserio, M., Coles, R., Farmani, R., Gaterell, M.,Hale, J., Hales, C., Hewitt, N., Jankovic, L., Jefferson, I., MacKenzie, R., Memon, F.,Pugh, T., Rogers, C.D.F., Smith, D., Whyatt, C., Weingaertner, C., 2010. UsingScenarios to Explore Urban UK Futures: A Review of Futures Literature from1997–2010. Urban Futures Working Paper Series (No. 1) University of Birming-ham, Birmingham.
Imrie, R., Thomas, H., 1995. changes in local governance and their implications forurban policy evaluation. In: Hambleton, R., Thomas, H. (Eds.), Urban PolicyEvaluation: Challenge and Change. Paul Chapman Publishing, London, pp.123–138.
Innes, J., Booher, D., 1999. Metropolitan development as a complex system: a newapproach to sustainability. Economic Development Quarterly 13 (2), 141–156.
Japan Sustainable Building Consortium, 2010. CASBEE. Available at http://www.ibec.or.jp/CASBEE/english/index.htm (Accessed 09.09.10).
Joint Nature Conservation Committee, 2009. Conservation Volunteering. Availableat http://jncc.defra.gov.uk/page-4253 (Accessed 23.09.09).
Jones, P., Evans, J., 2008. Urban Regeneration in the UK. London, Sage.
Please cite this article in press as: Boyko, C.T., et al., Benchmarking suGlobal Environ. Change (2011), doi:10.1016/j.gloenvcha.2011.10.004
Kang, C.D., Cervero, R., 2009. From elevated freeway to urban greenway: landvalue impacts of the CGC project in Seoul, Korea. Urban Studies 46 (13),2771–2794.
Karrholm, M., 2011. The scaling of sustainable urban form: a case of scale-relatedissues and sustainable planning in Malmo, Sweden. European Planning Studies19 (1), 97–112.
Kemp-Benedict, E., Heaps, C., Raskin, P., 2002. Global Scenarios Group Futures:Technical Notes. Stockholm Environment Institute, Stockholm.
Llewelyn-Davies, 2000. Urban Design Compendium, 2nd ed. Llewelyn-Davies,London.
Lombardi, D.R., Hale, J., Rogers, C.D.F. Testing the future resilience of a sustainabilitysolution: mixed-use development. Planning, Theory and Practice, resubmittedfor publication.
Maclaren, V., 1996. Urban sustainability reporting. Journal of the American PlanningAssociation 62 (2), 184–202.
Moss, R.H., Edmonds, J.A., Hibbard, K.A., Manning, M.R., Rose, S.K., van Vuuren, D.P.,Carter, T.R., Emori, S., Kainuma, M., Kram, T., Meehl, G.A., Mitchell, J.F.B.,Nakicenovic, N., Riahl, K., Smith, S.J., Stouffer, R.J., Thomson, A.M., Weyant,J.P., Wilbanks, T.J., 2010. The next generation of scenarios for climate changeresearch and assessment. Nature 463 (7282), 747–756.
Nakicenovic, N., Swart, R. (Eds.), 2000. Special Report on Emissions Scenarios (forthe Intergovernmental Panel on Climate Change). Cambridge University Press,Cambridge.
Natural England, 2008. Understanding the Relevance and Application of the Accessto Natural Green Space Standard. Natural England, London.
Office of National Statistics (ONS), 2002. People’s Perceptions of their Neighbour-hood and Community Involvement. Results from the Social Capital Module ofthe General Household Survey 2000. The Stationery Office, London.
Office of the Deputy Prime Minister (ODPM), 2005a. Planning Policy Statement 1:Delivering Sustainable Development. HMSO, London.
Office of the Deputy Prime Minister (ODPM), 2005b. Sustainable Communities:People, Places and Prosperity. HMSO, London.
Office of the Deputy Prime Minister (ODPM), 2006. Securing the Future: DeliveringUK Sustainable Development Strategy. HMSO, London.
Pagina, W., 2000. Measurement and Indicators for Sustainable Development. In-ternational Institute for Sustainable Development, Winnipeg, Canada.
Pannell, D.J., Glenn, N.A., 2000. A framework for the economic evaluation andselection of sustainability indicators for agriculture. Ecological Economics 33(1), 135–149.
Pannell, D.J., Schilizzi, S., 1999. Sustainable agriculture: a question of ecology,equity, economic efficiency or expedience? Journal of Sustainable Agriculture13 (4), 57–66.
Petts, J., Owens, S., Bulkeley, H., 2008. Crossing boundaries: interdisciplinarity in thecontext of urban environments. Geoforum 39, 593–601.
Qvistrom, M., Saltzman, K., 2006. Exploring landscape dynamics at the edge of thecity: spatial plans and everyday places at the inner urban fringe of Malmo,Sweden. Landscape Research 31 (1), 21–41.
Raskin, P., Gallopin, G., Gutman, P., Hammond, A., Swart, R., 1998. Bending theCurve: Toward Global Sustainability. Stockholm Environment Institute,Stockholm.
Raskin, P., Banuri, T., Gallopin, G., Gutman, P., Hammond, A., Kates, R., Swart, R.,2002. Great Transitions: The Promise and Lure of the Times Ahead. StockholmEnvironment Institute, Stockholm.
Raskin, P., Monks, F., Ribeiro, T., van Vuuren, D., Zurek, M., 2005. Global scenarios inhistorical perspective. In: Carpenter, S.R., Pingali, P.L., Bennett, E.M., Zurek, M.(Eds.), Scenarios (for the Millennium Ecosystem Assessment). Ecosystems andHuman Well-being, vol. 2. Island Press, Washington, DC, pp. 35–44.
Ravetz, J., 2000. City Region 2020: Integrating Planning for a Sustainable Environ-ment. Earthscan, London.
Robert, K.H., 2002. The Natural Step Story: Seeding a Quiet Revolution. New SocietyPublishers, Gabriola Island, Canada.
Roberts, P., Sykes, H., 2000. Urban Regeneration: A Handbook. Sage, London.Rogers, C.D.F., Lombardi, D.R., Leach, J.M., Cooper, R.F.D., Inman, J., accepted, 2012.
The urban futures methodology applied to urban regeneration. EngingeeringSustainability164, ES4.
Roper, S., Hales, C., Bryson, J.R., Love, J., 2009. Measuring Sectoral InnovationCapability in Nine Areas of the UK Economy. NESTA, London.
Rotmans, J., van Asselt, M., Anastasi, C., Greeuw, S., Mellors, J., Peters, S., Rothman, D.,Rijkens, N., 2000. Visions for a sustainable Europe. Futures 32 (9–10), 809–831.
Rydin, Y., Holman, N., Wolff, E., 2003. Local sustainability indicators. Local Environ-ment 8 (6), 581–589.
Schwartz, P., 1996. The Art of the Long View: Planning for the Future in an UncertainWorld. Doubleday, New York.
Shin, J-H., Lee, I-K., 2006. Cheong Gye Cheon restoration in Seoul, Korea. CivilEngineering 159 (4), 162–170.
Siniscalco, D., 2002. Chair’s Conclusions. In: Organization for Economic Co-opera-tion and Development (OECD) (Eds.), Towards Sustainable Development.Indicators to Measure Progress. Proceedings of the OECD Rome Conference.OECD, Paris, pp. 13–16.
Sommer, F., 2000. Monitoring and evaluating outcomes of community involvement:the LITMUS experience. Local Environment 5 (4), 483–491.
Southworth, M., Ruggeri, D., 2011. Beyond placelessness: place identity and theglobal city. In: Banerjee, T., Loukaitou-Sideris, A. (Eds.), Companion to UrbanDesign. Routledge, Oxon, Oxford, pp. 495–509.
Tunstall, D., 1992. Developing Environmental Indicators: Definitions Frameworkand Issues. Background Materials for the World Resources Institute
stainability in cities: The role of indicators and future scenarios.

C.T. Boyko et al. / Global Environmental Change xxx (2011) xxx–xxx10
G Model
JGEC-951; No. of Pages 10
Workshop on Global Environmental Indicators. World Resources Institute,Washington, DC.
Tunstall, D., 1994. Developing and Using Indicators of Sustainable Development inAfrica: An Overview. In: Proceedings from the Network for Environment andSustainable Development in Africa (NESDA). NESDA, Banjul, The Gambia.
Turok, I., 1989. Evaluation and understanding in local economic policy. UrbanStudies 26 (6), 587–606.
U.S. Green Building Council, 2010. LEED. Available at http://www.usgbc.org/DisplayPage.aspx?CategoryID=19 (Accessed 09.09.10).
Vedung, E., van der Doelen, F.C.J., 1998. The sermon: information programs in thepublic policy process—choice, effects, and evaluation. In: Bemelmans-Videc, M.-L., Rist, R.C., Vedung, E. (Eds.), Carrots, Sticks & Sermons: Policy Instrumentsand their Evaluation. Transaction Publishers, New Brunswick, NJ, pp. 103–128.
Please cite this article in press as: Boyko, C.T., et al., Benchmarking suGlobal Environ. Change (2011), doi:10.1016/j.gloenvcha.2011.10.004
Water UK, 2009. Sustainability Indicators 2008/9. Water UK, London.Wiek, A., Binder, C., 2005. Solution spaces for decision-making—a sustainability
assessment tool for city-regions. Environmental Impact Assessment Review 25,589–608.
Wood, S., 2009. Desiring docklands: deleuze and urban planning discourse. Plan-ning Theory 8 (2), 191–216.
Wolfe, T., 1981. From Bauhaus to Our House. Bantam Books, New York.World Commission on Environment and Development (WCED), 1987. Our Common
Future. Oxford University Press, Oxford.Wong, C., 2002. Developing indicators to inform economic development in England.
Urban Studies 39 (10), 1833–1863.Yli-Viikari, A., 2009. Confusing messages of sustainability indicators. Local
Environment 14 (10), 891–903.
stainability in cities: The role of indicators and future scenarios.