Social Sustainability and its Indicators through a disability studies lens
Upload
khangminh22Category
view
0download
0
Study of EHS indicators for sustainability and its effectiveness for Cement
Industries in India
A thesis submitted to the
University of Petroleum and Energy Studies
For the Award of
Doctor of Philosophy
In
Environment Health and Safety Engineering
By
Shraddha Mishra
Oct 2020
Supervisors
Dr. Nihal Anwar Siddiqui
Dr. Ashutosh Gautam
Department of Health Safety & Environment Engineering
University of Petroleum and Energy Studies
Dehradun, Uttarakhand
Study of EHS indicators for sustainability and its effectiveness for
Cement Industries in India
A thesis submitted to the
University of Petroleum and Energy Studies
For the Award of
Doctor of Philosophy
In
Environment Health and Safety Engineering
By
Shraddha Mishra
(SAP ID: 500033597)
Oct 2020
Internal Supervisor
Dr. Nihal Anwar Siddiqui
Professor & Head,
Department of Health Safety & Environment Engineering
External Supervisor
Dr. Ashutosh Gautam
HOD – Environment, India Glycols Ltd
A-1, Industrial Area, Bazpur Road
Kashipur- 244713, Uttarakhand
Department of Health Safety & Environment Engineering
University of Petroleum and Energy Studies
Dehradun, Uttarakhand
Page | 2
Dedication
This thesis is dedicated to my beloved Grandparents who blessed me eternally.
I also dedicate this work to my Parents who have always stood by me and
encouraged me to accomplish my Ph.D. work successfully.
Page | 3
Oct 2020
DECLARATION
I declare that the thesis entitled “Study of EHS indicators for sustainability and its
effectiveness for Cement Industries in India” has been prepared by me under the
guidance of Dr. Nihal Anwar Siddiqui, Professor & Head, Department of Health Safety
& Environment Engineering, University of Petroleum & Energy Studies, Dehradun,
India and Dr. Ashutosh Gautam. HOD – Environment, India Glycol Ltd A-1, Industrial
Area, Bazpur Road Kashipur- 244713, Uttarakhand. No part of this thesis has formed
the basis for the award of any degree or fellowship previously.
Shraddha Mishra
Environment Health and Safety Engineering,
University of Petroleum and Energy Studies
Dehradun, Uttarakhand
DATE: 01.10.2020
Page | 4
Page | 5
Page | 6
Page | 7
ABSTRACT
In the current era infrastructure is the key to development specially for developing
countries. Simultaneously Infrastructure development is quite relevant to Sustainable
development goals. When we talk about infrastructure the key material for construction
i.e. concrete comes to our mind as an essential building block. It is cement which is
used to make concrete and when such material is integral to structure and societal
development, it becomes important to analyze its detailed impact of environment health
and safety considering the sustainable choice for sustainable infrastructure and
sustainable societies.
Sustainable and strong infrastructure has a significant role in preventing pollution,
preserving resources, safe material sourcing and social inclusiveness. Remarkably,
cement as an infrastructure basic building material has a very strong impact across all
aspects of sustainability – economic (profits), social (people) and environmental
(Planet) performance. The climate change threat in the near future puts more emphasis
to address challenge with environment health and safety.
Globally multiple issues got prime focus as a critical issue in terms of sustainability for
the cement industry and these issues require need to be addressed immediately. These
issues included aspects of Health, safety and environment, like reducing energy
consumption, reducing carbon emissions and other airborne pollutants, improving
employee health and safety promoting the efficient consumption of fuels and effective
use of raw materials, optimizing resource conservation and abating impacts of
operations at local level.
In India, the raw materials for cement production are majorly mined locally, crushed
and checked for chemical composition and sent to kiln for further processing. All the
steps from kiln to cement bag result in huge energy consumption, large carbon emission
during processing along with emission of other pollutant especially particulate matters.
Some other factors are also playing key role such as health and safety of cement factory
workers and the communities residing around the manufacturing units. Environment
health and safety (EHS) aspects are taken care by the manufacturing industries in India
due to legal mandates and stringent requirements set and given at the time of
environment Impact Assessment (EIA). Majority of the manufacturing units opt for the
certification for environment and occupational health and safety but still there are some
gaps which left unaddressed to achieve the overall sustainability of manufacturing
process in terms of EHS.
This thesis studies and reviews the various environment health and safety indicators
which are significant for sustainability of cement industries. EHS performance of
cement industries in India have been reviewed critically to identify the sustainability
criteria and various scenarios as per the existing practices adopted. Considering the
Page | 8
criteria and scenario, an index has been developed to evaluate the sustainability
effectiveness basis the current performance. The index helps in evaluating the focus
EHS areas for effective sustainability basis the comparative study of EHS indicators
and sub indicators.
EHS and sustainability are reviewed to establish the fact that both are adopted for the
same set of improvements. In order to achieve the sustainability and EHS performance
improvement the sustainability index had been developed to assist in linking EHS
management system and sustainability. It has been tested and worked as missing
linkage between EHS and sustainability.
The study has showcased the linkage to embed sustainability in EHS management
system for improving effectiveness of the system. It has evaluated the defined set of
environment health and safety indicators and resulted in defining the precise gap in
EHS performance against industry performance. The study has also found effective in
ISO and OHSAS Audits for showcasing the change points in upgraded version of
IS014001:2015 requirements and hence helping in increasing company’s revenue,
improving brand image and also effectively managing business risks. Additionally, it
also helps in strategic betterment of workplace culture which results in raising
employee’s morale.
Page | 9
ACKNOWLEDGEMENT
First of all, I express my deepest gratitude to ‘Almighty God’ for showring divine
blessings and giving me inspiration and strength to accomplish the work.
I express my sincere thanks to my thesis supervisors Dr. N A Siddiqui and Dr.
Ashutosh Gautam for their inspiring guidance, valuable suggestions, constant
encouragement and moral support, which were of great help in enabling me to complete
my PhD study.
I am grateful to Dr. Kamal Bansal, Dr. Dr S. M. Tauseef, Dr Bikarama Prasad Yadav,
Dr Kanchan Deoli and other senior faculty members in UPES for their critical reviews
and guidance on my research work at various stages.
I express my gratitude to Mr. Amit Singha (Jt President – Corporate Affairs BIL) for
industry segment support, guidance and encouragement.
I express my thanks to Mr. Abhishek Nandan, UPES HSE department and my fellow
PhD scholars who helped me during this period.
I appreciate Dr. Rakhi Ruhal, and Mr. S. S Farmer for their support in PhD program
and UPES administrative matters.
May be inadvertently I have missed mentioning few names, still I am grateful to all
who have supported me directly or indirectly in completion of my research work.
I am especially grateful to my mother Mrs. Meera Mishra and my father Mr. Ravindra
Nath Mishra for their trust and care, for which I shall remain indebted to them
throughout the life. I am thankful to my sister Ms. Shalini Mishra for continuously
encouraging me to pursue research work. I am thankful to my husband Mr. Vineet
Tiwari and my lovely daughter Aarya Tiwari for their co-operation and support during
the course of my research, as their support cannot be traced on piece of paper and they
absolutely deserve more than a written acknowledgement.
Shraddha Mishra
Date-1st Oct 2020
Page | 10
TABLE OF CONTENTS
Chapter 1
1. Introduction
1.1 Title of thesis
1.2 Statement of the proposal
1.2.1 Problem Statement
1.2.2 Background
1.2.3 Motivation/ Need of research
1.3 Scope
1.4 Objectives
1.5 Limitation
Chapter 2
2. Literature review
2.1 Overview of cement industries sustainability Measures
2.2 Inferences from literature survey
CHAPTER 3
3. Overview
3.1. Brief on Cement Manufacturing process and its EHS aspects
3.1.1 Manufacturing process
3.1.2 Mining & Crushing
3.1.3 Mixing of raw material
3.1.4 Preheating
3.1.5 Coal grinding/ kiln fuel preparation
3.1.6 Precalcination
3.1.7 Clinkerisation
3.1.8 Grinding of Clinkers
3.1.9 Storage and packaging
3.2 Study of various sustainability and EHS frameworks and standards for
identification of EHS indicators
3.2.1 Cement sustainability initiatives (CSI)
3.2.2 Global reporting initiatives (GRI)
3.2.3 International Finance Corporation (IFC)
3.2.4 sustainable development goal (SDG)
3.2.5 Environmental Management System (EMS) and Occupational Health and safety
management system (OHSMS)
3.2.6 Business responsibility Report (BRR)
3.3 EHS Indicators for Sustainability
CHAPTER 4
4. Research Methodology
4.1 Theoretical framework
4.2 Sampling and Source of Data
Page | 11
4.3 Statistical tools
4.4 Research framework
4.5 EHS Indicators for Sustainability and their performance trend
4.6 Comparative study of the impacts of key EHS indicators for sustainability based
on measures adopted by the industries.
CHAPTER 5
5. Emerging sustainability criteria and various scenarios in sustainability practices
5.1 Sustainability criteria concept
5.2 Identifying sustainability criteria under the EHS Indicator and sub indicators
5.3 Defining sustainable practices scenarios
5.4 Developing a Sustainability Index
5.4.1 Prioritizing EHS indicators and sub indicators for defining Sustainability
maturity Level
5.4.2 Formulating Sustainability Index using EHS indicator rating and criteria for
assessing sustainability effectiveness
5.4.3 Validation of the effectiveness of developed sustainability index
CHAPTER 6
6. Result and Discussion
6.1 Water Performance analysis
6.2 Energy Performance analysis
6.3 Emission Performance analysis
6.4 Recycle material Performance analysis
6.5 Health and Safety Performance analysis
6.6 CSR Performance analysis
CHAPTER 7
7. Summary and conclusions
7.1 Main contribution from the research
CHAPTER 8
8. Scope of Future Work
Page | 12
References
Appendix
I. Sample Cement Companies details
II. Environmental Data Collection
III. Health and safety Data Consideration
IV Social EHS Data Consideration
V. EHS Indicator prioritization
VI. EHS Key criteria table
VII. Index Implementation Plant-1 Scores
VIII. Index Implementation Plant-2 Scores
IX. Summary of EHS Index- Maturity Rating
X. Published Paper
XI: Curriculum Vitae
Page | 13
LIST OF TABLES:
List of Tables
Table-1 Inferences from literature survey
Table-2 Key performance indicators (KPIs) developed by CSI
Table-3 Key performance indicators (KPIs) developed by GRI
Table-4 Key performance indicators (KPIs) developed by IFC
Table-5 Key performance indicators (KPIs) as per SDG
Table-6 Key performance indicators (KPIs) as per ISO 14001 and OHSAS
18001
Table-7 Production
Table-8 Set of Indicator prepared for this Study
Table-9 Pair-wise comparison scale for AHP ranking
Table-10 Indicators Priority List
Table-11 Environment indicators priority list
Table-12 Occupational Health and Safety indicators priority list
Table-13 Community EHS Projects indicators priority list
Table-14 Sustainability Index format
Table-15 EHS Index for Sustainability
Table-16 Sample Cement Companies details
Table-17 Production details
Table-18 key EHS indicators
Table-19 Direct energy consumption (GJ)
Table-20 Renewable energy consumed (GJ)
Table-21 Indirect Energy Consumed (GJ)
Table-22 Specific Direct energy consumption (GJ/tonne of cement)
Table-23 Specific indirect energy consumption (GJ/tonne of cement)
Table-24 Direct CO2 (thousand t CO2/year)
Table-25 Indirect CO2 (thousand t CO2/year)
Table-26 Specific CO2 emission (kg/tonnes of cement)
Table-27 Total water withdrawal (Million M3)
Table-28 water recycled % of water withdrawal
Table-29 Specific water consumption (lit/tonnes of cement)
Table-30 Natural raw material used (Million Tonnes)
Table-31 Recycled material used (thousand tonnes)
Table-32 LTIFR
Table-33 Social EHS Projects details A, B, C, D, E
Table-34 EHS Indicator, Sub indicators and criteria

Page | 14
Table-35 Plant-1 Rating for sustainability
Table-36 Maturity Rating
Page | 15
LIST OF FIGURES:
Figure 1 Direct Energy (GJ)
Figure 2 Indirect Energy (GJ)
Figure 3 Renewable Energy (GJ)
Figure 4 Direct CO2 (Thousand t CO2/ Year)
Figure 5 Indirect CO2 (Thousand t CO2/ Year)
Figure 6 total water withdrawal (Million M3)
Figure 7 % Water Recycled of total water withdrawal
Figure 8 Natural Raw Material (Million Tonnes)
Figure 9 Recycled Material (thousand tonnes)
Figure 10 LTIFR
Figure 11 CSR Expenditure
Figure 12 Direct Energy Consumption (GJ)
Figure 13 Specific Direct Energy Consumption (GJ/ tonnes of
cement)
Figure 14 Indirect Energy Consumption (GJ)
Figure 15 Specific Indirect Energy Consumption (GJ/ tonnes of
cement)
Figure 16 Renewable Energy Consumed (GJ)
Figure 17 Direct CO2 (Thousand t CO2/ Year)
Figure 18 Indirect CO2 (Thousand t CO2/ Year)
Figure 19 Specific CO2 Emission (Kg/tonnes of cement)
Figure 20 total water withdrawal (Million M3)
Figure 21 Specific Water Consumption (Lt/tonnes of cement)
Figure 22 Water recycled %of water withdrawal
Figure 23 Natural Raw Material used (Million Tonnes)
Figure 24 Recycled Material Used (thousand tonnes)
Figure 25 LTIFR
Figure 26 Expenditure on Environment Under CSR
Figure 27 P-1 Water Sub Indicator rating
Figure 28 P-1 Energy Sub Indicator rating
Figure 29 P-1 Raw Material Sub Indicator rating
Figure 30 P-1 Emission Sub Indicator rating
Figure 31 P-1 Occupational Health Sub Indicator rating
Figure 32 P-1 Safety Sub Indicator rating
Figure 33 P-I Community EHS Sub Indicator rating
Page | 16
Figure 34 P-2 Water Sub Indicator rating
Figure 35 P-2 Energy Sub Indicator rating
Figure 36 P-2 Raw Material Sub Indicator rating
Figure 37 P-2 Emission Sub Indicator rating
Figure 38 P-2 Occupational health Sub Indicator rating
Figure 39 P-2 Safety Sub Indicator rating
Figure 40 P-2 Community EHS Sub Indicator rating
Page | 17
Abbreviation
Acronym Full Form
AIDS Acquired Immunodeficiency Syndrome
AIA Aspect Impact Analysis
BBS Behavior Based Safety
CO Carbon Monoxide
CR Consistency Ratio
EHS Environment, Health and Safety
ERM Enterprise Risk Management
FR Frequency Rate
HCl Hydrogen Chloride
IPCC Intergovernmental Panel on Climate Change
PAT Perform, Achieve and Trade
PBFS Portland Blast Furnace Slag Cement
PCRA Petroleum Conservation Research Association
PPC Portland Pozzolana Cement
RPO Renewable Purchase Obligation
SR Severity Rate
TDF Tire Derived Fuel
VRM Vertical Roller Mills
MT Million Tonnes
AAQ Ambient Air Quality
AHP Analytic Hierarchy Process
BRR Business Responsibility Report
BS Biological Sludge
CDP Carbon Disclosure Project
CEA Central Electricity Authority
CFD Computational Fluid Dynamics
CM Centimeters
CO2, Carbon Dioxide
CSI Cement Sustainability Initiative
CSR Corporate Social Responsibility
EIA Environmental Assessment
EMS Environmental Management System
ESCerts Energy Savings Certificates
ESG Environmental, Social, And Governance
Page | 18
GDP Gross Domestic Product
GHG Greenhouse Gas Emission
GJ Gigajoule
GRI Global Reporting Initiative
GW Gigawatt
HF Hydrogen Fluoride
HIRA Hazard Identification Risk Assessment
HIV Human Immunodeficiency Virus
HPGR High-Pressure Grinding Rollers
HSD High Speed Diesel
IFC International Finance Corporation
ISO International Standards Organization
KG Kilo Gram
KPI Key Performance Indicators
LCA Life Cycle Assessment
LTIFR Lost Time Injury Frequency Rate
M3 Cubic Meter
MCDM Multiple-Criteria Decision-Making
MW Megawatt
NCV Net Calorific Value
NGO Non-Governmental Organizations
NOx Oxides of Nitrogen
NVG National Voluntary Guidelines
OECD The Organisation For Economic Co-Operation and
Development
OH Occupational Health
OHSAS Occupational Health and Safety Assessment Series
OHSMS Health and Safety Management System
OPC Ordinary Portland Cement
PM Particulate Matter
PV Photovoltaic
RDF Refuse Derived Fuel
SASB Sustainability Accounting Standards Board
SDG Sustainable Development Goal
SEC Specific Energy Consumption
SOx Sulfur Oxide
t CO2 Tonnes Of Carbon Dioxide
TBL Triple Bottom Line
Page | 19
TOC Total Organic Compounds
UN United Nations
UNGC United Nations Global Compact
VFD Variable Frequency Drives
VOC Volatile Organic Compounds
WBCSD World Business Council for Sustainable Development
WHRS Waste Heat Recovery System
YOY Year on Year
Page | 20
Chapter 1
1. INTRODUCTION:
Cement is a very significant construction material which is used for infrastructure
development. At present, cement production is considered as a key factor to economic
growth. As we know that economic growth is linked to infrastructure, so these days
majority of developing countries are continuously focusing on infrastructure
development which is directly associated with demand of cement resulting in huge
increase cement production.
As a growing concern across globe climate change and resource conservation are
among key environmental issues, it is the need of the hour to create systems to avoid
risks and create net positive corporate impacts. Today, companies are looking for
growth across geographies and at the same time also owning their responsibilities
towards the environment and society. Stakeholders are expecting that companies should
own their responsibilities to protect the environment and the planet by conserving
resources for our future generations while making profits. Investors are increasingly
demanding that businesses must focus on social and environmental responsibilities
effectively. While evaluating sustainability of the organizations, stakeholders are not
only focusing on the financials of the company but also the EHS and social performance
are increasingly requested by stakeholders, such as NGOs, customers, suppliers and
new recruits. In last decade, it has been observed that environmental awareness has
improved significantly among all the stakeholders and all are looking at sustainable
business models.
Sustainability has been explained in different literatures and frames with similar core.
It can also be described as “being able to continue over a period of time with causing
little or no damage to the environment and therefore able to continue for a long run.”
Sustainability reporting has been explained by GRI Guidelines which talks about the
practices of measuring the sustainability performance against defined performance
indicators and disclosing sustainability data in the sustainability reports. It enables
stakeholders to understand the organizations’ sustainability performance and its
impacts. The Sustainability reporting is designed in such a manner that it shows the
clear link between financial and non-financial performance of the company. Companies
have started realizing the need of publishing the sustainability reports covering the
environment, social and governance aspects of sustainability.
There are three pillars of Corporate sustainability which are also referred as 3 Ps:
Profits/financial performance, People/Social performance, Planet/Environment
performance. All the pillars are significant for sustainability of the organization. These
can’t be ranked, however in terms of importance Environment is the most vital pillar,
as human existence on this planet is highly dependent on environment conditions.
Page | 21
Organizations knows the importance of Environment performance as indirectly social
performance is link to it.
Companies are required to participate actively and have to own the responsibility
towards the environment as they using environment and its resources for making
profits, whereas all humans need the environment for fulfilling their basic needs. It is
need of the hour that natural resources like land, water and air should be utilized in such
a manner that we are not overshooting the rate of replenishment so that we should not
harm the needs of future generations. It is high time that corporates have to adopt
methodologies that integrate environmental health and safety measures in providing
business leaders with a useful decision-making tool to identify risk and opportunity.
With reference to sustainable development, there are some key issues related to the
cement which are seeking attention at globally. Various stakeholder groups are
increasingly raising their concerns about the effects of cement production activities like
quarrying, energy consumption, CO2, NOx and SOx emissions, dust, noise, health and
safety, pollution control etc. The cement industry is considered for largest air pollution
and Greenhouse Gas emission (GHG) emission due to specific features of the
production. It is also one of the largest users of natural resources, including limestone
as raw material and fuel for producing heat and energy. Cement industry has many
impacts on environment and health safety. Solving problems pertaining to environment
health and safety requires industry to adopt concept of sustainable development.
To ensure the long-term business survival in global markets, cement manufacturing
companies have adopted sustainability as a strategic lever. In the pursuit of
sustainability Cement industries are working on the broad range of sustainability factors
covering Environment, Social and Governance. This research specifically focuses on
the EHS indicators for sustainability to address environment health and safety
performance of the industry.
Although industries get certified to ISO 14001 for environment management system
and OHSAS 18001 for health and safety Management System which helps in setting
up the targets for industry to improve EHS performance. At the same time industry also
needs an index to benchmark and set a target for sustainable EHS performance. This
research focuses on developing a sustainability index for cement industry in sync with
EHS indicators by integrating environment health and safety management system with
sustainable development. This index takes input from Cement Company’s EHS
performance as well as compare the performance against the industry performance.
1.1 Title of thesis:
“Study of EHS indicators for sustainability and its effectiveness for Cement Industries in
India”

Page | 22
1.2 Statement of the proposal:
1.2.1 Problem Statement
Cement is the key material needed for global infrastructure development and it will
remain a key to economic growth. Due to huge demand in global market the cement
industry is facing budding challenges in material conservation, saving energy resources,
and reducing its emissions. Continually cement sector is endeavoring to reduce their
environment footprint. In order to achieve the environment footprint reduction,
industries are adopting state of the art technologies to curb adverse environmental
impact.
This study is considering environment health and safety sustainability measures
undertaken for reducing environment footprints and improving health and safety
performance, including community project activities for sustainability.
Under ISO 14001 and OHSAS 18001 Environment Aspect and Impact & Hazard
identification and Risk assessment are carried out for identifying the significant aspects
for EHS to work upon. But this approach works within the boundaries of the company
to improve the EHS performance. Considering the EHS indicators for sustainability, it
is required to compare performance with industry benchmark. So, a study needs to be
carried out to quantify & assess the impact of sustainability measures on environment
health and safety performance and to provide an index to compare the EHS performance
with industry bench bark to becoming sustainable.
1.2.2 Background
Today, the industrial operations are responsible for potential environmental threats and
the quality of life around it. It is generally accepted that industrial operations influence
the quality of the environment. Unsustainable use of natural resource is considered to
be the main cause of environmental damage due to increasing emissions, effluent
discharge, waste generation and GHG emissions. Additionally, the communities around
operations are facing health problems due to industrial operations affecting the quality
of their life.
In India, there are 188 large cement plant which together represents 97% of the total
installed capacity in the country, while other 365 small plants come under 3%. Out of
the total 188 large cement plants in India, 77 plants are located in Rajasthan, Tamil
Nadu and Andra Pradesh. After China, the Indian cement industry is the 2nd largest in
global cement production which is approx. 8% of the total cement production globally.
It had a total capacity of about 347 million tonnes (MT) as of financial year 2012-13.
The total cement production in the country was 366 MT in financial year 2014-15,
which is further expected to reach 550 MT by 2020.
Today, sustainability has been considered as an integral part of business strategies in
various industry operations. Sustainability has many definitions and interpretations.
World Commission on Environment and Development (1987) has defined
Page | 23
sustainability as the “development that meets the needs of the present without
compromising the ability of future generations to meet their own needs”. Basically, it
can be explained as a process that aims for a better future and planet for generations to
come. The “triple bottom line” approach coined by John Elkington (1994) describes
three pillars of sustainability - environmental, economic and social. Industries are
adopting sustainability concept for preservation of environment, resource planning,
economic equality, and social justice. The implications of these actions are considered
to ensure that environment sustainability for the generations to come.
Majorly companies are adopting sustainability practices to reduce environment related
risk and maintaining competitive business environment. Therefore, a focused research
on sustainability practices in cement sector and its impact on reduction of environment
foot print will appraise the industry sector to understand the effectiveness of current
practices and improvement areas for sustainable future.
The Cement sector plays vital role in the economic growth of the country. Cement is a
cyclical commodity with a high correlation with Gross Domestic Product (GDP).
Growing demand of cement is directly related to the environmental health and safety
performance of the industry. Due to climate change, environmental performance has
become an imperative globally.
The Government of India is strongly focusing on infrastructure development to boost
economic growth and aiming for 100 smart cities. It has been planned to increase
investment in infrastructure in 12th five-year plan. To meet the rise in demand, cement
companies are expected to add 56 MT capacities over the next three years. The
country’s per capita consumption stands at around 190 kg.
So, the cement manufacturing sustainability is greatly depending on environmental
health and safety performance of the cement industry. World business council of
sustainable development has identified critical environmental health and safety issues
of cement industry, which are significant to climate change and business sustainability.
It was observed in recent studies that the companies are working for sustainability are
largely certified to ISO 14001 and OHSAS 18001. But companies are driving
sustainability and EHS management system in parallel. These two systems need to be
integrated to obtain better results. Therefore, this research focuses to study
environmental health and safety indicators and its performance to understand their
importance as stainability quantifiers.
1.2.3 Motivation/ Need of research
The researcher has worked on sustainability and EHS profile of cement industry. It has
been observed that the linkage between EHS and Sustainable development is still
needing to be worked upon. Companies are working for sustainability and EHS as well
but as a different vertical which actually needs to be integrated. The current
sustainability reporting practices and importance of the subject matter in coming future
Page | 24
has motivated the researcher to do a research work in the field of sustainability,
especially focusing on environmental health and safety factors.
1.3 Scope
The Scope of the research is environment, health, safety performance of cement
manufacturing industries in India including Community Environment Health and
Safety initiatives. Therefore, a comprehensive literature survey was undertaken to
review EHS indicators for sustainability specific to cement industry.
In order to develop Sustainability Index, relevant EHS indicators for cement industry
which comprises of - Water Consumption and Conservation, Energy Consumption and
Conservation, Raw material consumption and recycling, GHG and other Emission
reduction, Occupational Health and Safety, Community Environment Health and Safety
initiatives for Water and Energy Resources conservation, Green Belt development &
Community Healthcare sustainability reports were studied in detail. Several
sustainability initiatives were studied in line with ISO and OHSAS target and objectives
to analyze gap areas in assessing sustainability maturity level. In parallel the methods
of developing sustainability index were reviewed to select the right approach to
formulate the sustainability maturity index.
Sustainability index requires EHS performance year on year trend data. EHS
performance data is compared with industry benchmark from several data sources and
were analyzed to identify sustainability maturity level criteria. In summary it required
inter-disciplinary research and data from many sources to understand the application of
sustainability index to assess maturity level and effectiveness of measures.
1.4 Objectives
This study is focused on environmental health and safety indicators for sustainability
including social initiatives. The objective of this study are as follows:
1. To study the key EHS indicators for sustainability and analyze their performance
trend.
2. To make a comparative study of the impacts of key EHS indicators for sustainability
based on measures adopted by the industries.
3. To identify emerging sustainability criteria and various scenarios in sustainability
practices.
4. To develop a Sustainability Index to measure the sustainability effectiveness.
5. To implement selective indicators in the industry to validate the effectiveness of
developed sustainability index.
Page | 25
1.5 Limitation
As sustainability is itself a huge subject and contains various parameters which are
correlated and applicable to all industries irrespective of nature. Cement sector is one
of the growing and highly energy intensive and polluting industries. So, this study is
limited to environment health safety indicators.

Page | 26
CHAPTER 2
2. LITERATURE REVIEW:
A comprehensive literature survey was undertaken to understand work already done in
the area of research. Research Papers, review papers, books on sustainability and
cement company’s sustainability reports were studied. Broadly the literature review for
is broadly classified into following areas:
A) Environment, Health and Safety (EHS) impacts of cement
manufacturing
B) Study of EHS indicators under various standards and sustainability
framework
C) Linkage of EHS and Sustainable development
2.1 Overview of cement industries sustainability Measures
It is difficult to visualize a cutting-edge existence without concrete. Concrete is a critical
development material utilized for lodging and foundation improvement and a key to
monetary development. Concrete interest is straightforwardly related to financial
development and many developing economies are taking a stab at quick foundation
improvement which underlines the colossal development in concrete creation
(WBCSD-2014). The concrete business assumes a significant part in improving
expectation for everyday comforts everywhere on over the world by making direct work
and giving different falling financial advantages to related enterprises. Notwithstanding
its prevalence and gainfulness, the concrete business faces numerous difficulties
because of ecological concerns and manageability issues (Potgieter Johannes H. 2012).
The concrete business is a vitality concentrated and critical supporter of environmental
change. The significant condition wellbeing and security issues related with concrete
creation are emanations to air and vitality use. Concrete assembling requires colossal
measure of non-inexhaustible assets like crude material and petroleum derivatives.
The findings of prior studies suggest that organizations pursuing ISO 14001 and
OHSAS 18001 certification in response to pressure from stakeholders are focused on
reputational risk. Although other underlying motives for the adoption of these
certifications are performance improvements. But currently these performance
improvements are not aligned to triple bottom line (TBL). The possible mechanism to
enable the organization for sustainable development is that one should take into
consideration the link between sustainability and EHS indicators.
Hazard Identification Risk Assessment (HIRA) and Aspect Impact Analysis (AIA)
identify significant issues related to environment and non-tolerable risk under ISO
14001 and OHSAS. It also helps us identifying opportunities to improve environmental
and safety performance. HIRA and AIA are restricted to identification of issues and

Page | 27
identifying opportunities. There is no further matrix used for identifying the focus areas
for sustainable performance under EHS indicators (Matjaž Maletic, Manja Podpečan,
Damjan Maletic, (2015).
The absolute biggest organizations are revealing their reasonable execution in their
sustainability reports. These reports are generally founded on the GRI structure, where
the key parts of social and ecological exercises are secured. The World Business
Council for Sustainable Development (WBCSD), the International Standards
Organization (ISO), and the Global Reporting Initiative (GRI) were the key drivers for
execution of sustainability rehearses in the industries. Despite the fact that there are
various sustainability indicators which are assorted in nature and have been grown
willfully with the end goal of supportable strategic policies (M.Z. Majdalani 2016).
GRI standard model talks about labour practices, decent work, human rights, product
responsibility, society, energy and emissions, water and effluent, waste management
and conservation mechanism etc. under Social and environment section. Which are
further categorized to drill down the various sub indicators under each set of social and
environment indicators. Whereas United Nations (UN) framework considers equity,
health, education, security, population, atmosphere, land, ocean, fresh water and
biodiversity under social and environment section. The Organization for Economic Co-
operation and Development (OECD) has phrased its requirements of social and
environment with defining input and output of operations, which includes water
intensity, energy intensity, renewable energy proportion, GHG intensity etc.
Sustainability practices and Environment, word related wellbeing and safety (EHS) are
the two united ideas which are likewise considered as fundamental components in
maintaining an effective business with the capacity and competency to get by in the
market (Center for Safety and Health Sustainability report-2013). There are several
papers discussing the connection among sustainable development, economic
performance, environment, people, supply chain, society, stakeholder engagement etc.
but the role of occupational health, workplace safety, EHS focused community
initiatives not widely considered for sustainable development (Amponsah-Tawiah,
Kwesi.2013).
Page | 28
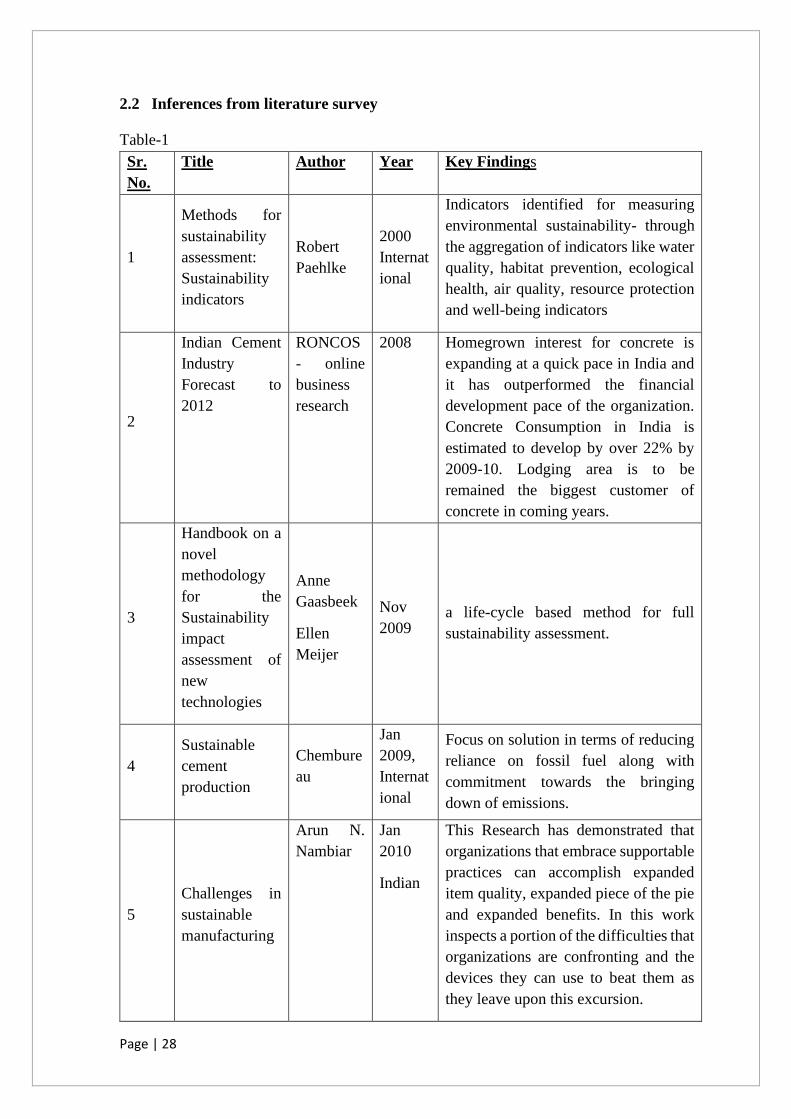
2.2 Inferences from literature survey
Table-1
Sr.
No.
Title Author Year Key Findings
1
Methods for
sustainability
assessment:
Sustainability
indicators
Robert
Paehlke
2000
Internat
ional
Indicators identified for measuring
environmental sustainability- through
the aggregation of indicators like water
quality, habitat prevention, ecological
health, air quality, resource protection
and well-being indicators
2
Indian Cement
Industry
Forecast to
2012
RONCOS
- online
business
research
2008 Homegrown interest for concrete is
expanding at a quick pace in India and
it has outperformed the financial
development pace of the organization.
Concrete Consumption in India is
estimated to develop by over 22% by
2009-10. Lodging area is to be
remained the biggest customer of
concrete in coming years.
3
Handbook on a
novel
methodology
for the
Sustainability
impact
assessment of
new
technologies
Anne
Gaasbeek
Ellen
Meijer
Nov
2009 a life-cycle based method for full
sustainability assessment.
4
Sustainable
cement
production
Chembure
au
Jan
2009,
Internat
ional
Focus on solution in terms of reducing
reliance on fossil fuel along with
commitment towards the bringing
down of emissions.
5
Challenges in
sustainable
manufacturing
Arun N.
Nambiar
Jan
2010
Indian
This Research has demonstrated that
organizations that embrace supportable
practices can accomplish expanded
item quality, expanded piece of the pie
and expanded benefits. In this work
inspects a portion of the difficulties that
organizations are confronting and the
devices they can use to beat them as
they leave upon this excursion.
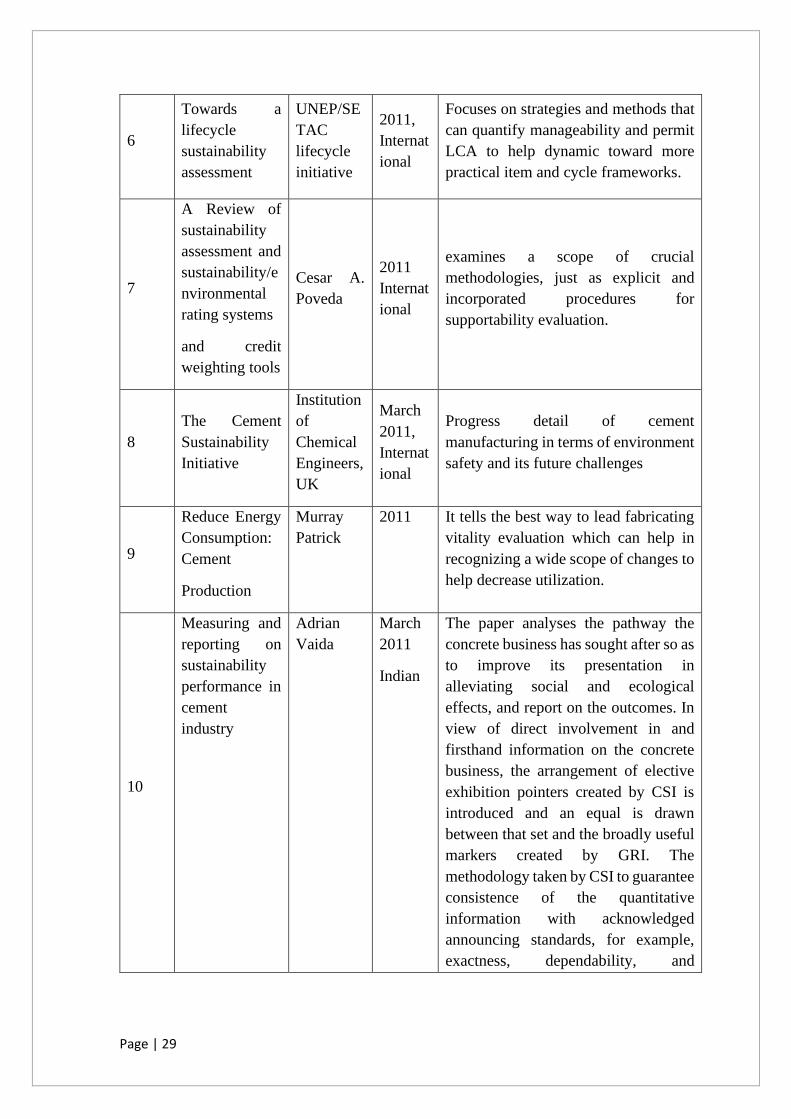
Page | 29
6
Towards a
lifecycle
sustainability
assessment
UNEP/SE
TAC
lifecycle
initiative
2011,
Internat
ional
Focuses on strategies and methods that
can quantify manageability and permit
LCA to help dynamic toward more
practical item and cycle frameworks.
7
A Review of
sustainability
assessment and
sustainability/e
nvironmental
rating systems
and credit
weighting tools
Cesar A.
Poveda
2011
Internat
ional
examines a scope of crucial
methodologies, just as explicit and
incorporated procedures for
supportability evaluation.
8
The Cement
Sustainability
Initiative
Institution
of
Chemical
Engineers,
UK
March
2011,
Internat
ional
Progress detail of cement
manufacturing in terms of environment
safety and its future challenges
9
Reduce Energy
Consumption:
Cement
Production
Murray
Patrick
2011 It tells the best way to lead fabricating
vitality evaluation which can help in
recognizing a wide scope of changes to
help decrease utilization.
10
Measuring and
reporting on
sustainability
performance in
cement
industry
Adrian
Vaida
March
2011
Indian
The paper analyses the pathway the
concrete business has sought after so as
to improve its presentation in
alleviating social and ecological
effects, and report on the outcomes. In
view of direct involvement in and
firsthand information on the concrete
business, the arrangement of elective
exhibition pointers created by CSI is
introduced and an equal is drawn
between that set and the broadly useful
markers created by GRI. The
methodology taken by CSI to guarantee
consistence of the quantitative
information with acknowledged
announcing standards, for example,
exactness, dependability, and
Page | 30
equivalence is likewise nitty gritty and
remarked on.
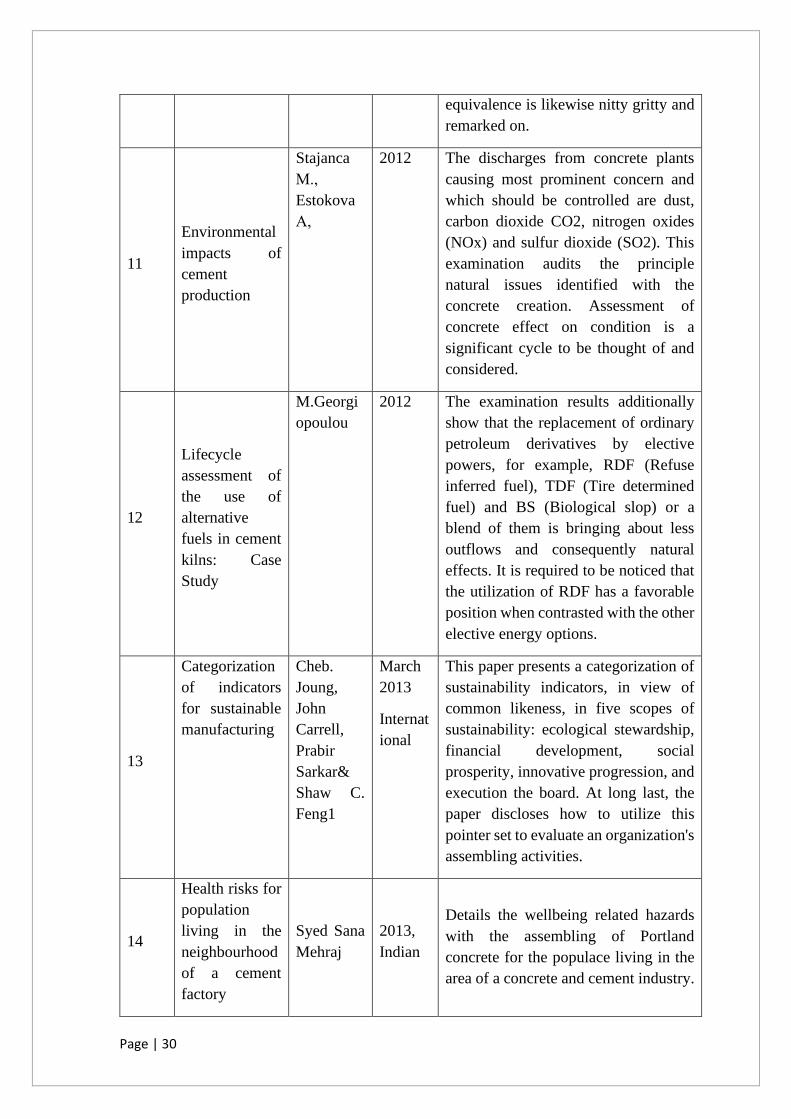
11
Environmental
impacts of
cement
production
Stajanca
М.,
Estokova
А,
2012 The discharges from concrete plants
causing most prominent concern and
which should be controlled are dust,
carbon dioxide CO2, nitrogen oxides
(NOx) and sulfur dioxide (SO2). This
examination audits the principle
natural issues identified with the
concrete creation. Assessment of
concrete effect on condition is a
significant cycle to be thought of and
considered.
12
Lifecycle
assessment of
the use of
alternative
fuels in cement
kilns: Case
Study
M.Georgi
opoulou
2012 The examination results additionally
show that the replacement of ordinary
petroleum derivatives by elective
powers, for example, RDF (Refuse
inferred fuel), TDF (Tire determined
fuel) and BS (Biological slop) or a
blend of them is bringing about less
outflows and consequently natural
effects. It is required to be noticed that
the utilization of RDF has a favorable
position when contrasted with the other
elective energy options.
13
Categorization
of indicators
for sustainable
manufacturing
Cheb.
Joung,
John
Carrell,
Prabir
Sarkar&
Shaw C.
Feng1
March
2013
Internat
ional
This paper presents a categorization of
sustainability indicators, in view of
common likeness, in five scopes of
sustainability: ecological stewardship,
financial development, social
prosperity, innovative progression, and
execution the board. At long last, the
paper discloses how to utilize this
pointer set to evaluate an organization's
assembling activities.
14
Health risks for
population
living in the
neighbourhood
of a cement
factory
Syed Sana
Mehraj
2013,
Indian
Details the wellbeing related hazards
with the assembling of Portland
concrete for the populace living in the
area of a concrete and cement industry.
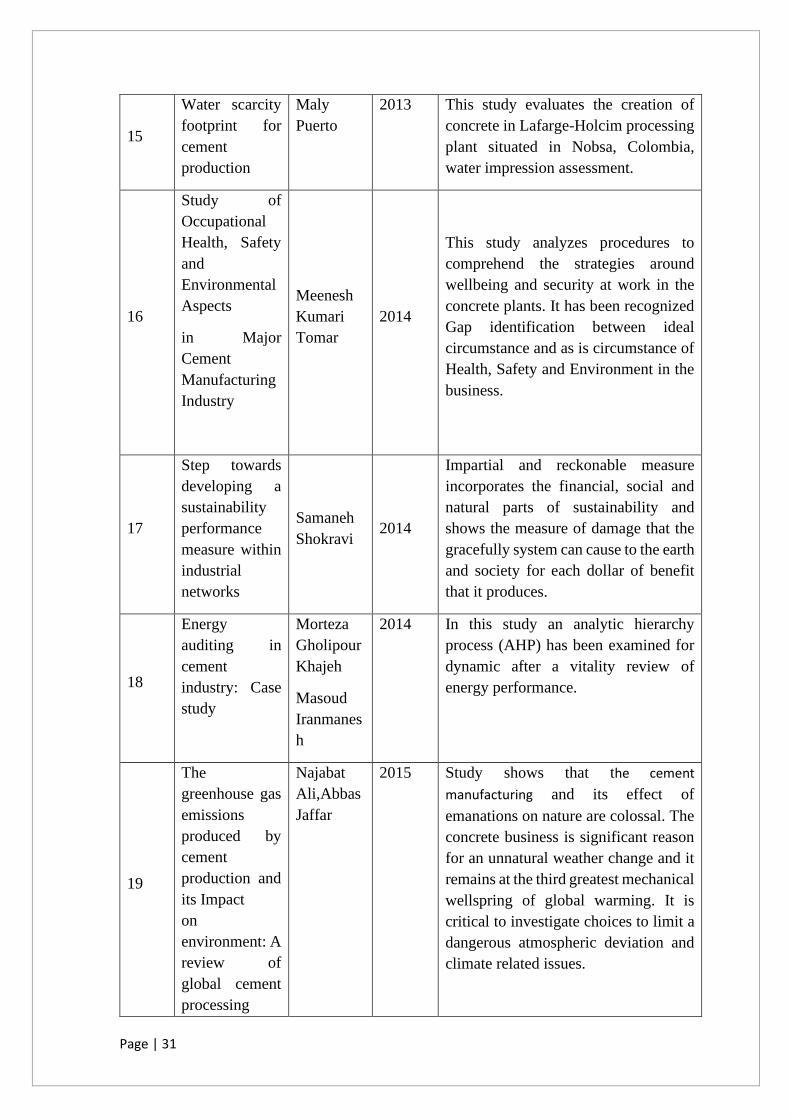
Page | 31
15
Water scarcity
footprint for
cement
production
Maly
Puerto
2013 This study evaluates the creation of
concrete in Lafarge-Holcim processing
plant situated in Nobsa, Colombia,
water impression assessment.
16
Study of
Occupational
Health, Safety
and
Environmental
Aspects
in Major
Cement
Manufacturing
Industry
Meenesh
Kumari
Tomar
2014
This study analyzes procedures to
comprehend the strategies around
wellbeing and security at work in the
concrete plants. It has been recognized
Gap identification between ideal
circumstance and as is circumstance of
Health, Safety and Environment in the
business.
17
Step towards
developing a
sustainability
performance
measure within
industrial
networks
Samaneh
Shokravi 2014
Impartial and reckonable measure
incorporates the financial, social and
natural parts of sustainability and
shows the measure of damage that the
gracefully system can cause to the earth
and society for each dollar of benefit
that it produces.
18
Energy
auditing in
cement
industry: Case
study
Morteza
Gholipour
Khajeh
Masoud
Iranmanes
h
2014 In this study an analytic hierarchy
process (AHP) has been examined for
dynamic after a vitality review of
energy performance.
19
The
greenhouse gas
emissions
produced by
cement
production and
its Impact
on
environment: A
review of
global cement
processing
Najabat
Ali,Abbas
Jaffar
2015 Study shows that the cement
manufacturing and its effect of
emanations on nature are colossal. The
concrete business is significant reason
for an unnatural weather change and it
remains at the third greatest mechanical
wellspring of global warming. It is
critical to investigate choices to limit a
dangerous atmospheric deviation and
climate related issues.

Page | 32
20
Impact of
safety health
environment on
employee
retention in
pharmaceutical
industry:
mediating role
of job
satisfaction
And
Motivation
Saad
Salman
2016 This study confirms that employee
retention is a huge result of wellbeing
condition. Also, the degrees of
occupation fulfillment and worker
inspiration similarly intervene the
connection between security wellbeing
condition and employee retention.
21
Corporate
social
responsibility
in cement
industry
Ashok
Sharma,
Anupam
Jain
2017 This study estimates the commitment
of Cement businesses towards CSR
exercises according to New Companies
Act, 2013. It has been discovered that
the harmony between the financial
advantages and social and ecological
commitments should be relooked.
22
Proposal of a
sustainable
circular index
for
manufacturing
companies
Susana
Garrido
Azevedo,
Radu
Godina &
Joao
Carlos de
Oliveira
Matias
2017 Research says that the corporate e
sustainability has been assessed by
joining financial, natural, and social
pointers which are not sufficiently
incorporated for directing sustainable
choices.
23
Sustainable-
ERP system: A
preliminary
study on
sustainability
indicators
M.S.
Hasan, Z
Ebrahim,
W.H Wan
Mahmood
& M.N.
Rahman
2017 It is basic for a manufacturing
organization to implant the
sustainability angles identified with the
monetary, social, and condition into
their exhibition pointers so as to be
sustainable. Chosen indicators
additionally need to be checked from
businesses specialists. a few standards
to be defined which can be utilized in
examining information to finish the
sustainability indicators.
24 Advanced
manufacturing
Ankur
Goyal,
2017 Research proposes that no single
technique is sufficient to fulfil the need
Page | 33
management
system for
environmental
sustainability:
A review of
select literature
Rajat
Agrawal
of environmental concerns, results
enable industries to adopt right
combination of techniques from a
complete set of manufacturing
techniques. There is no universal
implementation strategy for all type of
industries, it depends on industry
specific approach to develop a bridge
between engineering and management
view.
25
Sustainability
performance
evaluation-
Literature
review &future
directions
Gulcin
Buyukozk
an,
Yagmur
Karabulut
2018 This audit spurs specialists to make
sustainability execution assessment
systems to help evaluation and think
about the level of sustainability,
prompting more feasible strategic
policies.
26
Indian cement
industry on
path of
environment
sustainability
through
innovation and
resource
optimization
Sandeep
Kudtarkar
2018 This study talks about the sustainability
reporting patterns of cement
organizations and distinguishes the
sustainability challenges and their
effects and probable measures. It
expresses that cement organizations
need to zero in additional on vitality
and water preservation, scant crude
material and reusing and decrease in
carbon emissions.
27
Multi-criteria
Decision
Analysis-
framework for
sustainable
manufacturing
in automotive
industry
Stella
Stoycheva
, Dayton
Marches,
Cameron
Paul
2018 In the event that various kinds of
devices are remembered for the
dynamic cycle close by MCDA, there
is likelihood that successful
sustainability choices can be taken, and
advantage the business. It proposed
that future works may build up the
model by choosing unique or more
explicit other options, utilizing scores
and weightage framework upheld by
industry research.
28
Organizational
sustainability
practices: A
study of the
Alamo
Alexandre
da Silva
Batista
2018 This paper examines sustainable
practices performed by big corporates.
The outcomes show that inclusion of
the infra, work environment, HR and so
Page | 34
firms listed by
the corporate
sustainability
index
and
Antonio
Carlos de
Francisco
on in vital arranging are basic to set
targets and baselines for usage of
sustainability rehearses.
29
Transportation
sustainability
index in dairy
industry e
fuzzy logic
approach
Ilija
Djekic,
NadaSmig
ic, Ruzica
Glavan
2018 The research paper gives an
understanding on investigation of
transportation sustainability execution
by utilizing interlinked rationale to
assess two dairy conveyance
frameworks. It has recommended the
said approach has capacity to be
repeated to different areas.
30
A sustainability
assessment
framework for
cement
industry-case
study
Kuldip
Singh,
Vikrant
Bhakar,
Abhijeet
Digalwa
2018 This expounds the conversation on the
current structures which shows that
sustainability evaluation does not have
an incorporated appraisal comprising
item life cycle, assets, basic variables
(item, cycle and strategy), KPIs and
their interrelationship with
sustainability measurements. It
additionally grandstands the writing
survey which infers that these
strategies are utilized for association
explicit conditions and managing
restricted markers of manageability.
This examination likewise talked about
different kind of practices for
maintainability evaluation and
improvement. It likewise the proposes
the future examination heading to build
up a marker archive for sustainability
appraisal of manufacturing segment.
31
"Developing a
sustainability
index for
auritian
manufacturing
companies."
Ecological
Indicators 96
Beekaroo,
Dickcha,
Devkumar
S.
Callychur
n, and
Dinesh
Kumar
2019 The results show that sustainability
issues are on the priority agenda of
most manufacturing companies.
Sustainability issues, which are
important but are not of prime concern
because of the difficulty in assessing
the impact of sustainability. It
identifies this as a main hurdle towards
the implementation of sustainable
manufacturing practices in the
Page | 35
Hurreeram
.
companies. It demonstrates that there is
a need for developing the appropriate
metrics for sustainable practices for
evaluation.
32
Safety and
sustainability
nexus:a review
and appraisal
Waqas
Nawaz,
Patrick
Linke,
Muammer
Koc
2019 It proposed the total range of safety
regarding hierarchical prerequisites to
feature the zones where enhancement
can bring about more reasonable
results. It can profit to analyst to set
better sustainability and for industry it
recommends enhancements for
defining up the reasonable objectives.
33
An analysis
compliance
level of Global
reporting
initiatives in
Indian scenario
M
Shivalinge
gowda,
Abhishek
Nanjundas
2019 This study intends to analyze how
cement companies of India are
agreeing to Global reporting activities
rules in revealing ESG boundaries. It
results that the cement organizations of
India are not appropriately uncovering
area indicated principles of GRI
especially identifying with ecological
perspectives.
34
Energy
environmental
performance of
Thai cement
industry
Natanee
Vorayosa,
Nat
Vorayosa,
Tassawan
Jaitiangb
2019 This examination paper subtleties the
cement business development where
the expansion of concrete creation will
bring about CO2 outflow in excess of 3
billion ton yearly. Since the cement
business assumes a significant part in
financial, vitality and ecological
frameworks of numerous nations
including Thailand, to accomplish the
reasonable advancement objective, it is
states that it gets important to build up
the marker that can be applied at
organization level. These indicators
ought to mirror the energy management
as well as need to consolidate the
natural exhibition just as identified
with the monetary perspective.
35 Identification
& evaluation of
Rohit
Singh,
2019 This paper acknowledges sustainable
manufacturing is a basic worldwide
Page | 36
determinants of
sustainable
manufacturing:
case of Indian
cement
manufacturing
Sachin
Modgil,
Amit
Tiwari
concern due to emission levels. It has
investigated that manufacturing
businesses are taking a few measures to
actualize it however the surviving
writing is unpredictable in clarifying
the for sustainability. This examination
has utilized just thirteen indicators of
sustainability. It infers that the pointers
like water, infra, land, machines,
innovations utilized and so forth for the
cement creation, can likewise be
considered in future investigations.
36
Sustainability
assessment in
Cuban cement
sector: a
methodological
approach
S Sanchez,
Y Cancio,
IR
Sanchez,
JF
Martirena,
ER Rosa
& G
Habert
2019 The aftereffects of this investigation
characterize that the financial, social
and ecological assessments have the
positive effects on low carbon cement.
It recognizes that the fundamental
effects are related with the decrease of
emanations of ozone harming
substances and particulate issue, which
are connected with word related
wellbeing. It likewise accentuation that
the sparing of vitality that outcomes in
the decrease of the expense of creation.
It shows that it is expected to build up
the way toward incorporating
monetary, social and ecological
markers. The consequences of this
paper shows that the Life Cycle
Sustainability Assessment is related
with nature, wellbeing and security,
which thus impacts the decrease of
ailments, the vitality sparing that is
converted into cost decrease.
37
Measuring
industrial
sustainability
performance-
empirical
evidence from
Italian and
German
Andrea
Trianni,
Enrico
Cagno,
Alessandr
a Neri,
Mickey
Howard
2019 Here it distinguishes an examination
gap area, regarding absence of proof on
how manufacturing measure
Sustainability execution, select pointer
to their particular needs, and
furthermore questions if the created
Sustainability execution estimation
frameworks really suit.
Page | 37
manufacturing
small and
medium
enterprises
Sustainability estimation is a
significant issue and furthermore
essential for setting Sustainability
goals in the manufacturing industry.
Regularly enterprises are ignorant of
their importance and need
maintainability execution estimation
frameworks to adequately quantify
execution. It expresses that it is earnest
to consider UN maintainability
advancement objectives which offers
center to both natural and social issues
as a lot of Sustainability pointers.
38
A holistic
approach to
corporate
sustainability
assessment-
Incorporating
sustainable
development
goals into
sustainable
manufacturing
performance
evaluation
Anastasiia
Moldavs,
Torgeir
Welo
2019 This paper perceives the coordinated
thought of the social, financial, and
natural issues as a fundamental
necessity of sustainability. It expresses
that critical endeavors have been made
to coordinated and address the parts of
sustainability. It shows that number of
inadequacies, difficulties, and gaps
have been recognized regardless of the
advancement in the field.
It distinguishes the Corporate
Sustainability Assessment as an
instrument that immediate the
association toward economical
practices and adds to a worldwide
Sustainable Development by detailing
maintainability technique and
recognize objectives and targets.
Page | 38
39
Rethinking the
way of doing
business- A
reframe of
management
structures for
developing
corporate
sustainability
Thais
Vieir
Nunhes,
Merce
Bernardo
& Otavio
Jose de
Oliveira
2020 This paper reviews the financial,
ecological and social regions for
Sustainability. It expresses that there
are no precise audits happened which
are centered around the joint
examination of viewpoints that make
up the incorporated administration of
condition and sustainability zones. It
proposes to make a structure that unites
the framework previously being
utilized in organizations with
sustainability execution to help and
support the combination of
sustainability in business measures.
This also suggests that future
investigations ought to incorporate the
investigation of the central bases of
economical administration and add
new components together to make a
comprehensive structure.
40
Fuzzy multi
criteria
approach for
sustainable
maintenance
performance
evaluation in
cement
industry
Elita
Amrina,
Insannul
Kamil,
Dhova
Aridharma
2020 This paper identifies the new
difficulties of Sustainable support for
organizations which helps in executing
a sustainable advancement approach.
This exploration has set up an
assessment model for reasonable
upkeep execution in the concrete
business with sixteen KPIs determined
indicators of financial angle social
viewpoint, and natural perspective. It
expresses that Future investigations are
needed to build up the supportable
execution assessment instrument for
the concrete business.
It has been identified in the detailed literature survey that the environment, health and
safety indicators have key role to play in sustainability. It has been determined by the
past studies that there is a need of comprehensive assessment for prioritizing the
indicators for long term business sustainability. It gives insights that social indicators
require same weightage as do the indicators mapped against nature focused aspects
based on climate change scenario. Considering the efforts and progress made on
achieving sustainability in last decade recognizes that EHS has been marked as a critical
Page | 39
to sustainability goals. The way globally industries have set their targets to align their
businesses to achieve the sustainable development goals, India has to go long way.
Specifically manufacturing sector has a major footprints and social impacts has to be
steered responsibly to run sustainably. For cement industry it becomes imperative to
focus on key indicators for sustainability considering in inherent nature of industry
which is creating significant footprints in terms of climate change scenario. A change
has been started towards the integrated reporting which shows the economic value
creation in sync with sustainability performance of the organization. The identified key
indicators have been assessed and selected for this research to improvise the
sustainability approach to bridge the gap.
Page | 40
CHAPTER 3
3. OVERVIEW
3.1. Brief on Cement Manufacturing process and its EHS aspects
3.1.1 Cement Manufacturing process
India is the second-biggest manufacturer of cement globally and it is manufacturing
502 million tons of cement every year. China is the biggest manufacturer of cement,
representing nearly 60% of worldwide production, trailed by India at 7%. There are 210
huge cement plants manufacturing 410 million tons of cement each year and 350 small
cement plants delivering 92 million tons of cement for every year. While installed limit
became quickly in the course of the last seven years (2010-17), cement manufacturing
in the nation has seen a steadier increment, from 217 Mt (2010) to 280 Mt (2017).
Hence, the cement businesses share a significant part in the Indian economy.
3.1.2 Mining & Crushing
The cement manufacturing begins with the mining of raw material. Limestone mines
and coal mines are a significant source in providing the raw materials utilized in cement
industry. Limestone the significant raw material utilized in the cement production
which is found in the sedimentary stone. Limestone mining removes 203,224 million
tons of limestone that is significantly utilized in cement production ventures. The main
thought in vitality effectiveness is frequently to find cement plants near the wellspring
of raw material. In any case the raw materials are provided to cement plants by rail and
by truck. States like Andhra Pradesh, Karnataka, Madhya Pradesh, Rajasthan, Gujrat,
Meghalaya, Telangana have a significant store of limestone. Another significant raw
material is coal that is utilized as a vitality source in the cement production. Coal is
utilized for warming the raw materials at 1450 degrees centigrade to transform into
clinker. Limestone is quarried from open cast mines and afterward this limestone is
squashed and is stacked in longitudinal reserves. Limestone is taken out askew from
these reserves for granulating in raw mill plant. Coal is utilized as a fuel to heat the raw
materials in the cement production process.
After the raw material is mined and shipped to the cement factories, the initial step is
to take care of it through the crushers, which separates it into pieces, roughly 10
centimeters (cm) in size.
3.1.3 Mixing of raw material
After crushing into pieces, the limestone is then processed together and creates a
mixture which is called as raw meal. This raw meal is then granulated in Pre
homogenization cycle by which raw materials are blended to acquire the concoction
synthesis required for the end utilization of a given type of cement. Small quantities of
additional materials, for example, iron metal, bauxite, shale, mud or sand might be
expected to give additional iron oxide, alumina and silica to adjust the compound
arrangement of the crude blend to the cycle and item prerequisites of cement
production. To guarantee high cement quality, the composition of the raw materials and
Page | 41
raw meal is continuously checked and controlled. Two sorts of blending method are
there to produce cement - Dry cycle and Wet cycle.
In dry cycle the finely crushed material is put away in hopper post screening. Then these
powdered minerals are blended in expected extent to get dry raw blend which is then
put away in silos and kept prepared to be sent into rotary kiln. Presently the raw
materials are blended in explicit extents with the goal that the normal synthesis of the
last item is looked after appropriately. In the Wet cycle the raw materials are initially
squashed and made into powdered structure and put away in silos. The clay is then
washed in washing factories to eliminate impurities found in earth. The powdered
limestone and water cleaned clay are sent to stream in the channels and move to
pounding factories where they are totally blended and the glue is shaped, i.e., known as
slurry.
3.1.4 Preheating
To improve the productivity of the cycle it is needed to pre-heat the raw meal before it
enters the furnace, which animates quicker substance responses. A pre-heater is a
progression of vertical cyclones through which the raw meal is passed, coming into
contact with twirling hot gases moving the other way. These hot gases are exhaust gases
delivered from the kilns, which helps in vitality effectiveness by utilizing heat created
by one creation cycle to give vitality to another cycle. Contingent upon the dampness
substance of the crude material, an oven may have up to six phases of cyclones with
higher temperatures acquired through heat recovery.
3.1.5 Coal grinding and Fuel preparation for kiln
Coal is grounded into fine powder to empower it to feed into the kiln as a fuel, to
produce the necessary heat for calcination.
3.1.6 Precalcination Process
Calcination is the deterioration of limestone to lime. The necessary reactions, which
likewise need heat vitality inputs, are invigorated at two focuses in the cement
manufacturing cycle: inside the "precalciner", a burning chamber at the base of the pre-
heater over the furnace, and inside the Kiln. This is the primary purpose of the
manufacturing cycle at which outflows are delivered: the chemical disintegration of
limestone normally represents 60% to 65% of absolute emissions. The fuel burning
expected to create heat in the precalciner likewise delivers emissions, representing
about 65% of the rest of absolute emissions.
3.1.7 Clinkerisation Process
The fine powder of limestone is heated at a very high temperature, approx. at 1450
degrees Celsius for clinkerisation. Coal is being used to heat this fine powder at high-
temperature in clinkerisation process. The burning of limestone process is undertaken
in the rotary kilns, in which at 1-3rpm the raw materials is being rotated at its
longitudinal axis. These rotating kilns are fabricated of steel pipes having with the
diameter of approx. 2.5-7.0 meter and the length varies from 90-300meter. The internal
Page | 42
section of the kiln is lined with intractable bricks. The kiln is reinforced on the columns
of concrete and fixed on roller bearing in slight inclined situation. The raw mix is
inserted from the upper end into the kiln. Fuel is fired right into the kiln as the kiln
rotates, along with rotation the material slides and shifted towards the flame, in
gradually hotter zones of the kiln.
As of now there are two types of kilns are in use. Older version which was quite
ineffective were “wet” kilns which makes raw materials into a slurry before processing,
whereas dry kilns make raw ingredients in powder form and utilize about 25% lesser
energy in comparison to wet kilns. Powdered coal and sometimes oil and hot gases are
being used to heat the kiln. The kiln is placed inclined and it rotates very slowly, the
material fed from upper end starts moving towards lower end at the rate of approx.
15m/hr.
Water in the mixture/ slurry is evaporated at approx. 400 degree Celsius in the upper
part of kiln and this zone is called Drying Zone. Calcination zone, which is the central
part where the temperature is about 1000-degree Celsius, where decomposition of lime
stone happens by converting the limestone/ calcium carbonate into lime/ calcium oxide
and carbon dioxide and this reaction is called calcination. The residual material is left
in the form of small lumps which are called nodules, it generates after the CO2 is
separated. The clinkering zone of the kiln which is the lower part have temperature
approx. 1500-1700 degree Celsius, where the calcium oxide reacts with the other raw
materials and lime and clay are forming calcium aluminates and calcium silicates. This
aluminates and silicates of calcium mixed together to form pellets which are known as
clinkers. The size of the clinker varies from 5-10mm in size. The clinker which comes
from the burning zone are quite hot. Air is admitted to bring down the temperature of
clinkers, in counter current direction inside the base of the rotary kiln. The air-cooled
clinkers are accumulated in small trolleys.
CaCO3_=_CaO + CO2
2CaO_+_SiO2 =_Ca2SiO4
3CaO_+_SiO2 =_Ca3SiO5
3CaO_+_Al2O3 =_Ca3Al2O6
4CaO_+_Al2O3 + Fe2O3 =_Ca4Al2Fe2O10
3.1.8 Grinding of Clinkers
A regular cement plant has clinker storerooms between clinker production and the plant
parts that handle mixing as well as granulating. The last phase of cement manufacturing
is that of grinding the clinker and the other crude materials in ball mills. Generally,
cement plants utilized "ball mills" for grinding. Today, more productive advances –
including roller presses and vertical mills – are utilized in numerous cutting-edge plants.
More extensive arrangement could additionally improve productivity of the business in
general. The cooled clinkers are gotten from the cooling dish and sent into mills. The
clinkers are granulated finely into powder in ball factory or ball mills. Powdered
gypsum is included around 2-5% as impeding operator during conclusive crushing to
help the setting time, stockpiling, and usefulness of the concrete. It frames a fine dark
powder and the last acquired item is called cement.
Page | 43
3.1.9 Storage and packaging
The crushed cement is kept in silos, from which it is transported either in bags and
dispatched in the market for sale and purchased. The Portland cement is also used for
ready mix plants and precast, where it is blended with aggregates and water to make
concrete.
3.2 Study of various sustainability and EHS frameworks and standards for
identification of EHS indicators
3.2.1 Cement sustainability initiatives (CSI)
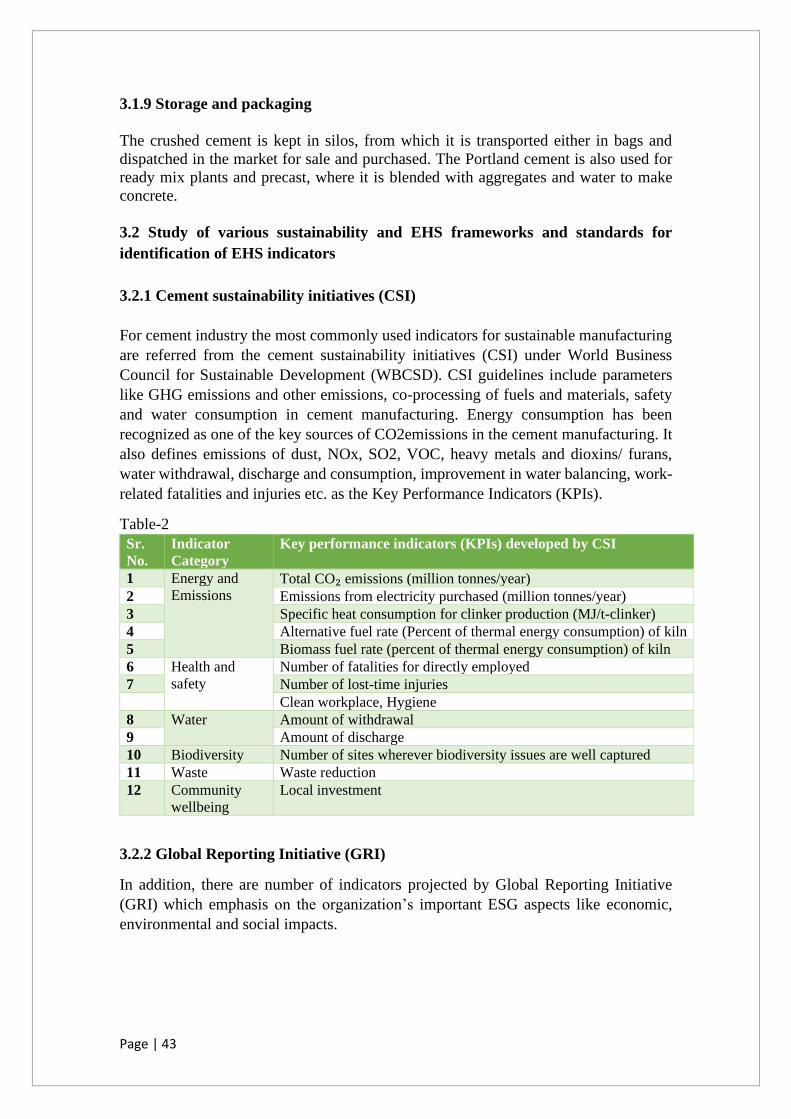
For cement industry the most commonly used indicators for sustainable manufacturing
are referred from the cement sustainability initiatives (CSI) under World Business
Council for Sustainable Development (WBCSD). CSI guidelines include parameters
like GHG emissions and other emissions, co-processing of fuels and materials, safety
and water consumption in cement manufacturing. Energy consumption has been
recognized as one of the key sources of CO2emissions in the cement manufacturing. It
also defines emissions of dust, NOx, SO2, VOC, heavy metals and dioxins/ furans,
water withdrawal, discharge and consumption, improvement in water balancing, work-
related fatalities and injuries etc. as the Key Performance Indicators (KPIs).
Table-2
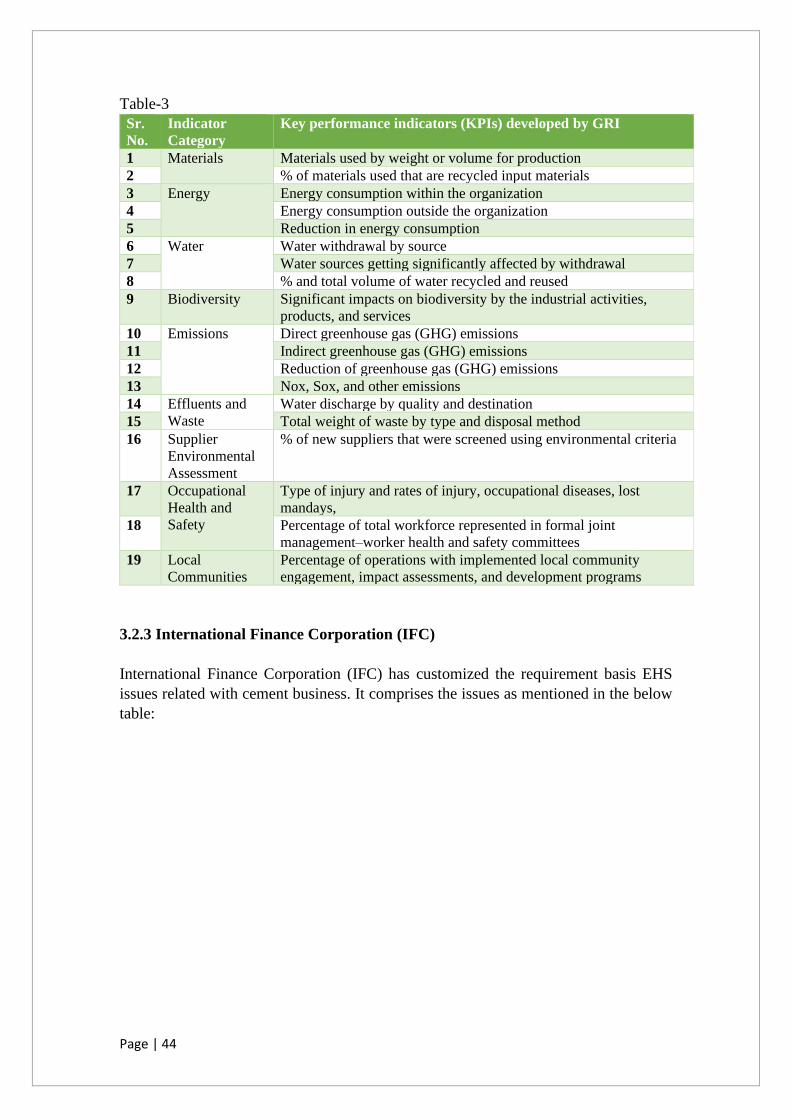
3.2.2 Global Reporting Initiative (GRI)
In addition, there are number of indicators projected by Global Reporting Initiative
(GRI) which emphasis on the organization’s important ESG aspects like economic,
environmental and social impacts.
Sr.
No.
Indicator
Category
Key performance indicators (KPIs) developed by CSI
1 Energy and
Emissions Total CO₂ emissions (million tonnes/year)
2 Emissions from electricity purchased (million tonnes/year)
3 Specific heat consumption for clinker production (MJ/t-clinker)
4 Alternative fuel rate (Percent of thermal energy consumption) of kiln
5 Biomass fuel rate (percent of thermal energy consumption) of kiln
6 Health and
safety
Number of fatalities for directly employed
7 Number of lost-time injuries
Clean workplace, Hygiene
8 Water Amount of withdrawal
9 Amount of discharge
10 Biodiversity Number of sites wherever biodiversity issues are well captured
11 Waste Waste reduction
12 Community
wellbeing
Local investment
Page | 44
Table-3
3.2.3 International Finance Corporation (IFC)
International Finance Corporation (IFC) has customized the requirement basis EHS
issues related with cement business. It comprises the issues as mentioned in the below
table:
Sr.
No.
Indicator
Category
Key performance indicators (KPIs) developed by GRI
1 Materials Materials used by weight or volume for production
2 % of materials used that are recycled input materials
3 Energy Energy consumption within the organization
4 Energy consumption outside the organization
5 Reduction in energy consumption
6 Water Water withdrawal by source
7 Water sources getting significantly affected by withdrawal
8 % and total volume of water recycled and reused
9 Biodiversity Significant impacts on biodiversity by the industrial activities,
products, and services
10 Emissions Direct greenhouse gas (GHG) emissions
11 Indirect greenhouse gas (GHG) emissions
12 Reduction of greenhouse gas (GHG) emissions
13 Nox, Sox, and other emissions
14 Effluents and
Waste
Water discharge by quality and destination
15 Total weight of waste by type and disposal method
16 Supplier
Environmental
Assessment
% of new suppliers that were screened using environmental criteria
17 Occupational
Health and
Safety
Type of injury and rates of injury, occupational diseases, lost
mandays,
18 Percentage of total workforce represented in formal joint
management–worker health and safety committees
19 Local
Communities
Percentage of operations with implemented local community
engagement, impact assessments, and development programs
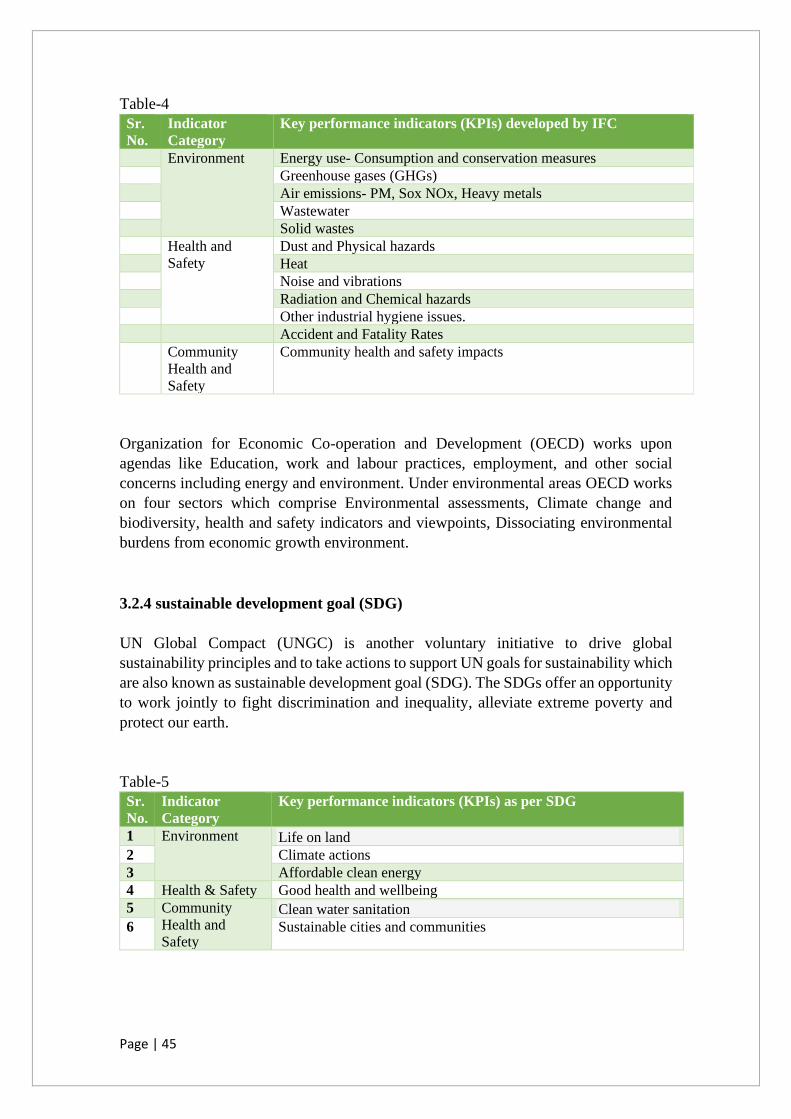
Page | 45
Table-4
Organization for Economic Co-operation and Development (OECD) works upon
agendas like Education, work and labour practices, employment, and other social
concerns including energy and environment. Under environmental areas OECD works
on four sectors which comprise Environmental assessments, Climate change and
biodiversity, health and safety indicators and viewpoints, Dissociating environmental
burdens from economic growth environment.
3.2.4 sustainable development goal (SDG)
UN Global Compact (UNGC) is another voluntary initiative to drive global
sustainability principles and to take actions to support UN goals for sustainability which
are also known as sustainable development goal (SDG). The SDGs offer an opportunity
to work jointly to fight discrimination and inequality, alleviate extreme poverty and
protect our earth.
Table-5
Sr.
No.
Indicator
Category
Key performance indicators (KPIs) developed by IFC
Environment Energy use- Consumption and conservation measures
Greenhouse gases (GHGs)
Air emissions- PM, Sox NOx, Heavy metals
Wastewater
Solid wastes
Health and
Safety
Dust and Physical hazards
Heat
Noise and vibrations
Radiation and Chemical hazards
Other industrial hygiene issues.
Accident and Fatality Rates
Community
Health and
Safety
Community health and safety impacts
Sr.
No.
Indicator
Category
Key performance indicators (KPIs) as per SDG
1 Environment Life on land
2 Climate actions
3 Affordable clean energy
4 Health & Safety Good health and wellbeing
5 Community
Health and
Safety
Clean water sanitation
6 Sustainable cities and communities
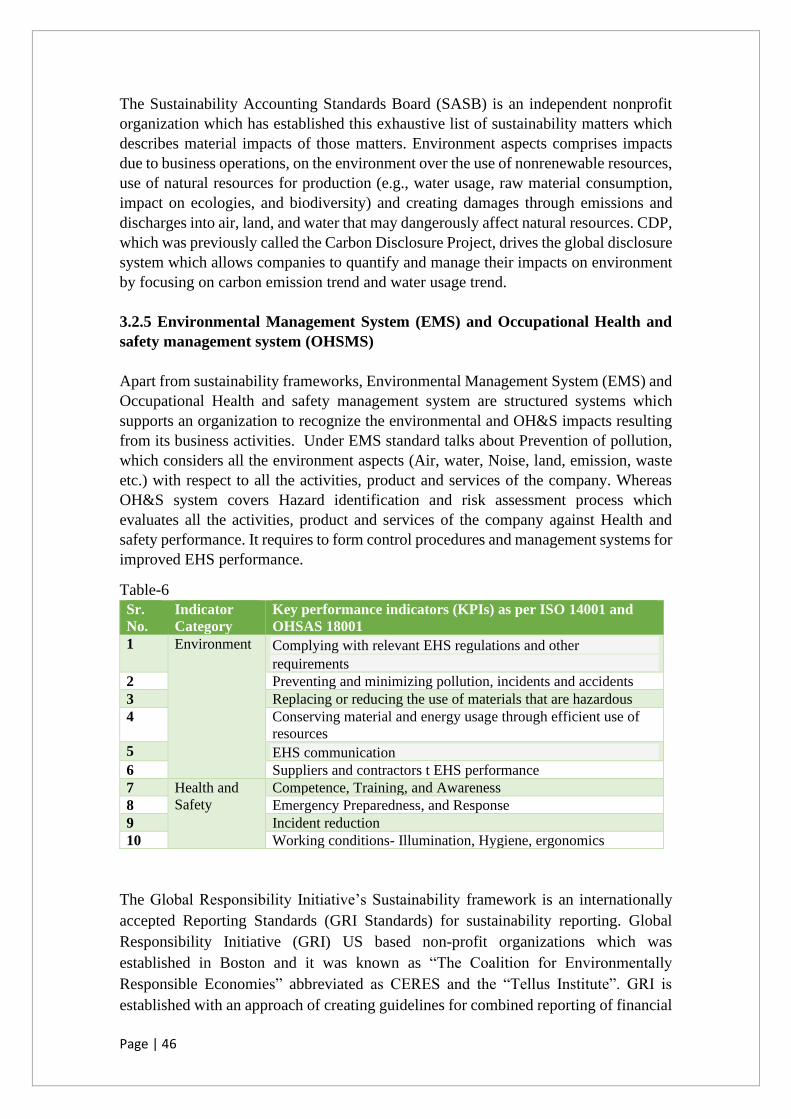
Page | 46
The Sustainability Accounting Standards Board (SASB) is an independent nonprofit
organization which has established this exhaustive list of sustainability matters which
describes material impacts of those matters. Environment aspects comprises impacts
due to business operations, on the environment over the use of nonrenewable resources,
use of natural resources for production (e.g., water usage, raw material consumption,
impact on ecologies, and biodiversity) and creating damages through emissions and
discharges into air, land, and water that may dangerously affect natural resources. CDP,
which was previously called the Carbon Disclosure Project, drives the global disclosure
system which allows companies to quantify and manage their impacts on environment
by focusing on carbon emission trend and water usage trend.
3.2.5 Environmental Management System (EMS) and Occupational Health and
safety management system (OHSMS)
Apart from sustainability frameworks, Environmental Management System (EMS) and
Occupational Health and safety management system are structured systems which
supports an organization to recognize the environmental and OH&S impacts resulting
from its business activities. Under EMS standard talks about Prevention of pollution,
which considers all the environment aspects (Air, water, Noise, land, emission, waste
etc.) with respect to all the activities, product and services of the company. Whereas
OH&S system covers Hazard identification and risk assessment process which
evaluates all the activities, product and services of the company against Health and
safety performance. It requires to form control procedures and management systems for
improved EHS performance.
Table-6
The Global Responsibility Initiative’s Sustainability framework is an internationally
accepted Reporting Standards (GRI Standards) for sustainability reporting. Global
Responsibility Initiative (GRI) US based non-profit organizations which was
established in Boston and it was known as “The Coalition for Environmentally
Responsible Economies” abbreviated as CERES and the “Tellus Institute”. GRI is
established with an approach of creating guidelines for combined reporting of financial
Sr.
No.
Indicator
Category
Key performance indicators (KPIs) as per ISO 14001 and
OHSAS 18001
1 Environment Complying with relevant EHS regulations and other
requirements
2 Preventing and minimizing pollution, incidents and accidents
3 Replacing or reducing the use of materials that are hazardous
4 Conserving material and energy usage through efficient use of
resources
5 EHS communication
6 Suppliers and contractors t EHS performance
7 Health and
Safety
Competence, Training, and Awareness
8 Emergency Preparedness, and Response
9 Incident reduction
10 Working conditions- Illumination, Hygiene, ergonomics
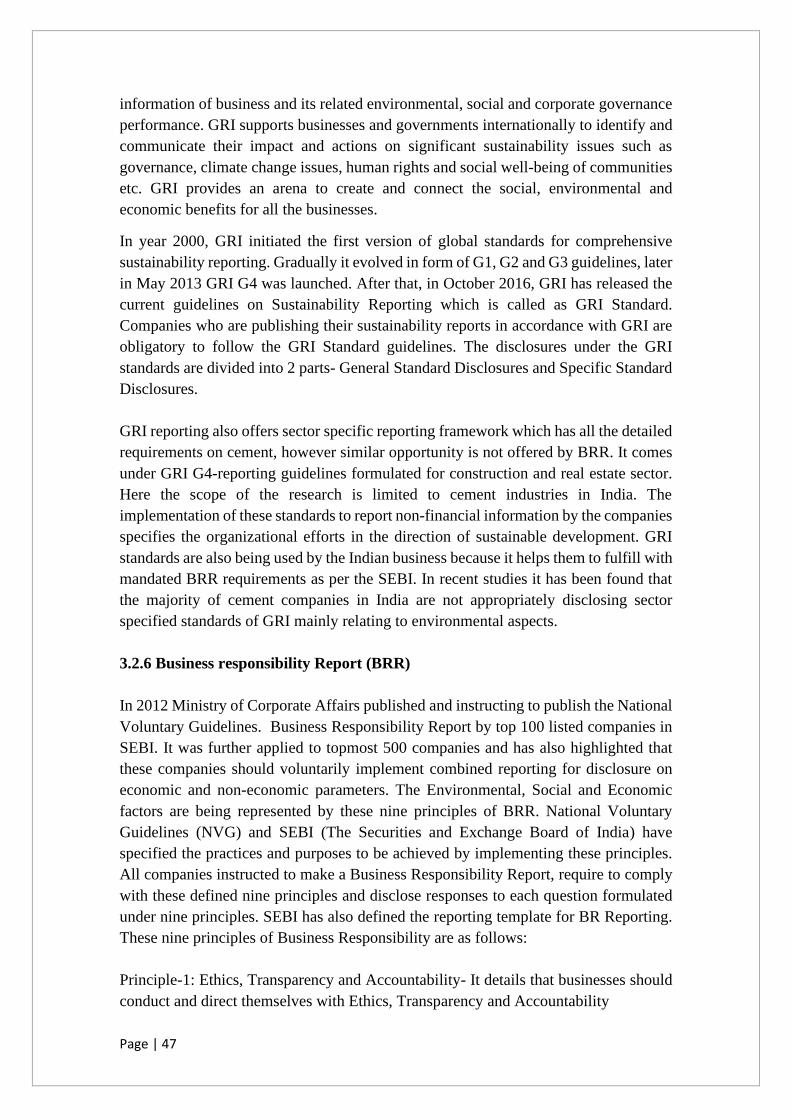
Page | 47
information of business and its related environmental, social and corporate governance
performance. GRI supports businesses and governments internationally to identify and
communicate their impact and actions on significant sustainability issues such as
governance, climate change issues, human rights and social well-being of communities
etc. GRI provides an arena to create and connect the social, environmental and
economic benefits for all the businesses.
In year 2000, GRI initiated the first version of global standards for comprehensive
sustainability reporting. Gradually it evolved in form of G1, G2 and G3 guidelines, later
in May 2013 GRI G4 was launched. After that, in October 2016, GRI has released the
current guidelines on Sustainability Reporting which is called as GRI Standard.
Companies who are publishing their sustainability reports in accordance with GRI are
obligatory to follow the GRI Standard guidelines. The disclosures under the GRI
standards are divided into 2 parts- General Standard Disclosures and Specific Standard
Disclosures.
GRI reporting also offers sector specific reporting framework which has all the detailed
requirements on cement, however similar opportunity is not offered by BRR. It comes
under GRI G4-reporting guidelines formulated for construction and real estate sector.
Here the scope of the research is limited to cement industries in India. The
implementation of these standards to report non-financial information by the companies
specifies the organizational efforts in the direction of sustainable development. GRI
standards are also being used by the Indian business because it helps them to fulfill with
mandated BRR requirements as per the SEBI. In recent studies it has been found that
the majority of cement companies in India are not appropriately disclosing sector
specified standards of GRI mainly relating to environmental aspects.
3.2.6 Business responsibility Report (BRR)
In 2012 Ministry of Corporate Affairs published and instructing to publish the National
Voluntary Guidelines. Business Responsibility Report by top 100 listed companies in
SEBI. It was further applied to topmost 500 companies and has also highlighted that
these companies should voluntarily implement combined reporting for disclosure on
economic and non-economic parameters. The Environmental, Social and Economic
factors are being represented by these nine principles of BRR. National Voluntary
Guidelines (NVG) and SEBI (The Securities and Exchange Board of India) have
specified the practices and purposes to be achieved by implementing these principles.
All companies instructed to make a Business Responsibility Report, require to comply
with these defined nine principles and disclose responses to each question formulated
under nine principles. SEBI has also defined the reporting template for BR Reporting.
These nine principles of Business Responsibility are as follows:
Principle-1: Ethics, Transparency and Accountability- It details that businesses should
conduct and direct themselves with Ethics, Transparency and Accountability
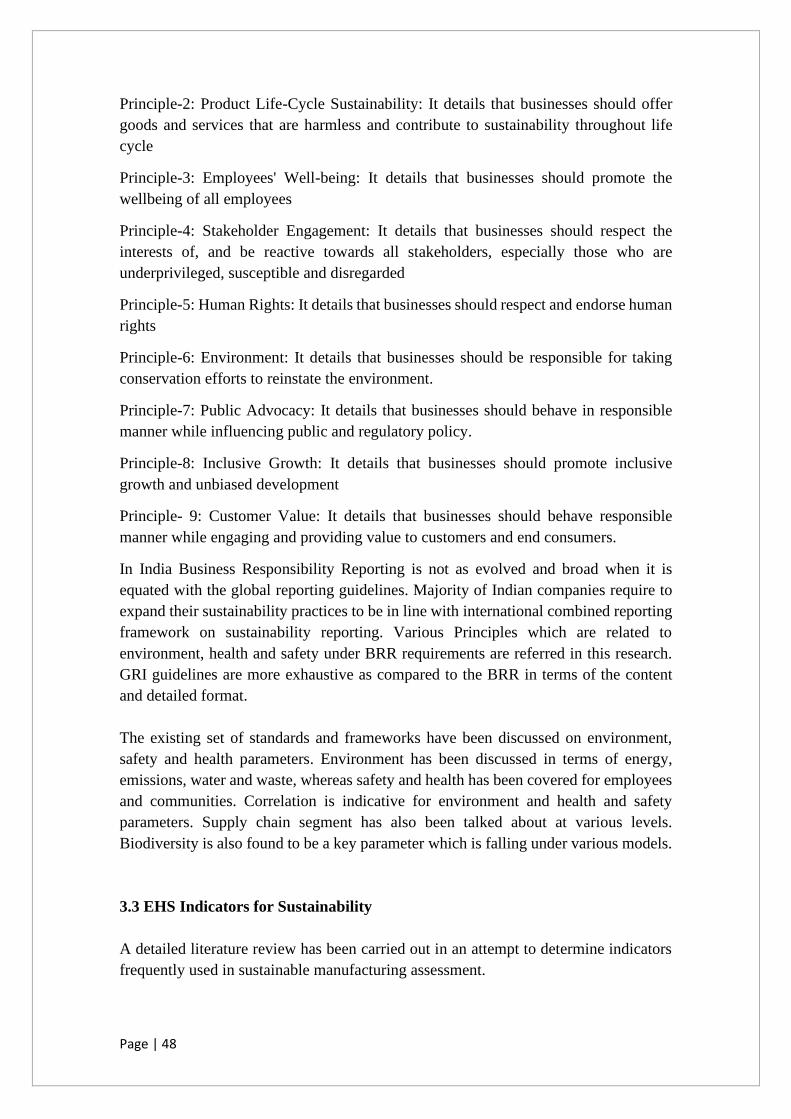
Page | 48
Principle-2: Product Life-Cycle Sustainability: It details that businesses should offer
goods and services that are harmless and contribute to sustainability throughout life
cycle
Principle-3: Employees' Well-being: It details that businesses should promote the
wellbeing of all employees
Principle-4: Stakeholder Engagement: It details that businesses should respect the
interests of, and be reactive towards all stakeholders, especially those who are
underprivileged, susceptible and disregarded
Principle-5: Human Rights: It details that businesses should respect and endorse human
rights
Principle-6: Environment: It details that businesses should be responsible for taking
conservation efforts to reinstate the environment.
Principle-7: Public Advocacy: It details that businesses should behave in responsible
manner while influencing public and regulatory policy.
Principle-8: Inclusive Growth: It details that businesses should promote inclusive
growth and unbiased development
Principle- 9: Customer Value: It details that businesses should behave responsible
manner while engaging and providing value to customers and end consumers.
In India Business Responsibility Reporting is not as evolved and broad when it is
equated with the global reporting guidelines. Majority of Indian companies require to
expand their sustainability practices to be in line with international combined reporting
framework on sustainability reporting. Various Principles which are related to
environment, health and safety under BRR requirements are referred in this research.
GRI guidelines are more exhaustive as compared to the BRR in terms of the content
and detailed format.
The existing set of standards and frameworks have been discussed on environment,
safety and health parameters. Environment has been discussed in terms of energy,
emissions, water and waste, whereas safety and health has been covered for employees
and communities. Correlation is indicative for environment and health and safety
parameters. Supply chain segment has also been talked about at various levels.
Biodiversity is also found to be a key parameter which is falling under various models.
3.3 EHS Indicators for Sustainability
A detailed literature review has been carried out in an attempt to determine indicators
frequently used in sustainable manufacturing assessment.
Page | 49
List of key EHS Indicators for Sustainability
For identifying the various framework and standards diverse range of EHS topics were
identified which are considered for sustainability. It is correspondingly very significant
to recognize EHS aspects of cement manufacturing process.
Cement is referred as glue as it is the key ingredient in making concrete. The material
is the foundation of infrastructure development which is utilized to make shelters for
billions of people around the world. It fortifies our buildings in natural disaster and
helps in building our lifeline structures for transport, healthcare, education, industry and
energy. It combines with water to bind crushed stone and gravel called as aggregates
and sand. Cement has significant value in our day-to-day life through numerous varied
applications and practices because of its resourcefulness, strength, and robustness to
build structures like schools, hospitals, roads, tunnels, bridges, runways, dams, marine
structures, industrial plants and housing projects etc. When a material turns out to be as
fundamental to the structure and extremely used then it becomes very imperative to
evaluate its health safety and environmental impacts to realize the sustainability aspect
in long run.
When sustainability is examined the following aspects need to be addressed like Energy
and water required to produce the material, CO2 and other emissions resulting from the
material’s manufacture, impact of product on health and safety while manufacturing,
lifecycle of the material and its probable reuse and recycle opportunities etc.
In 1824 Portland cement was patented by British bricklayer Joseph Aspdin which is
now captures around more than 95% of the cement market. It is made from calcium
carbonate (mainly from locally quarried limestone or chalk), silicon, aluminum, and
iron from clay, sand, and a variety of other materials. Portland cement is composed
mainly of calcium silicate minerals. The other raw material mixed are clinker, the
primary component of Portland cement, Lime Limestone, shells, chalk, Silica Sand, fly
ash, Alumina Clay, shale, fly ash, Iron oxide Iron ores.
Manufacturing the portland cement is energy intensive process and releases huge
amounts of carbon dioxide (CO2) as well as many other pollutants. Cement sector is
one of the eight reported energy intensive sectors. The world’s approximately 5% of
the anthropogenic CO2 emissions comes from the manufacturing of portland cement
worldwide. In cement manufacturing approx. half of the carbon dioxide emits from
burning of coal and other carbon-laden fuels which are used as a heat source in kilns
and approx. half of its carbon releases from calcining limestone, which emits CO2 due
to the chemical reaction involved in the process. The production of cement includes the
consumption of huge amounts of raw materials, energy and heat. Cement production
results in exhausting natural resources and the release of a substantial number of
gaseous emissions in the environment. The manufacturing process is very multifaceted,
involving a large number of raw materials, wet and dry kiln pyro processing techniques,
Page | 50
preheating, recirculation and fuel sources like coal, HSD, natural gas, waste tires,
industrial hazardous wastes, petroleum coke etc.
In India there is a massive demand of cement post the government of India has initiated
the smart cities projects and related schemes to boost infrastructure development,
highway constructions, housing societies etc. to enhance the Indian economy. Another
key demand driver is the real estate sector and it consumes approx. 65% of the total
consumption in India.
In recent years the concern has increased over the impact of anthropogenic carbon
emissions on the global climate due to growing awareness on global warming. The
cement manufacturing industry is under radar of government agencies due to its hostile
environmental and health impacts and being energy intensive and attributed with the
large volumes of CO2 emissions. Consumption of raw materials and huge energy use
and emissions to air are the main environmental issues associated with cement
production.
In cement manufacturing there is no as such impact on water resource as waste water
discharge is usually restricted to surface run off and cooling water only and causes no
significant influence to water pollution. The storage and handling of fuels are a possible
source of pollution of soil and groundwater. The key pollutants emitted to air are dust,
carbon oxides nitrogen oxides (NOx) and sulphur dioxide (SO2). While cement
handling, storage, operation of kiln, clinker coolers etc. are the main sources for air
emissions in a cement industry. Particulate Matter emissions (PM) has greatest effects
on health of workers of cement and lime manufacturing. Particulate Matter emissions
created from crushing and grinding of raw materials and also in handling and storage
of solid fuels. The type and quantity of air pollution be subject to different parameters
like the raw materials and fuels used and the type of manufacturing process
implemented. In the cement industry the most frequently used fuel is pulverized coal
(Black coal and lignite) and petroleum coke (Pet-coke). Coal and pet-coke produce
higher emissions of greenhouse gases in comparison to fuel oil and natural gas. In
cement manufacturing approx. 40%-50% of total production costs are from electric
energy and fuel.
Below is the broad category of the key EHS indicators for sustainability have been
filtered out for the research purpose basis coverage in multiple frameworks and aspects
involved in manufacturing process.
Environment:
• Energy Consumption and Conservation:
• GHG and other Air Emissions
• Water Consumption and Conservation
• Raw material consumption and recycling
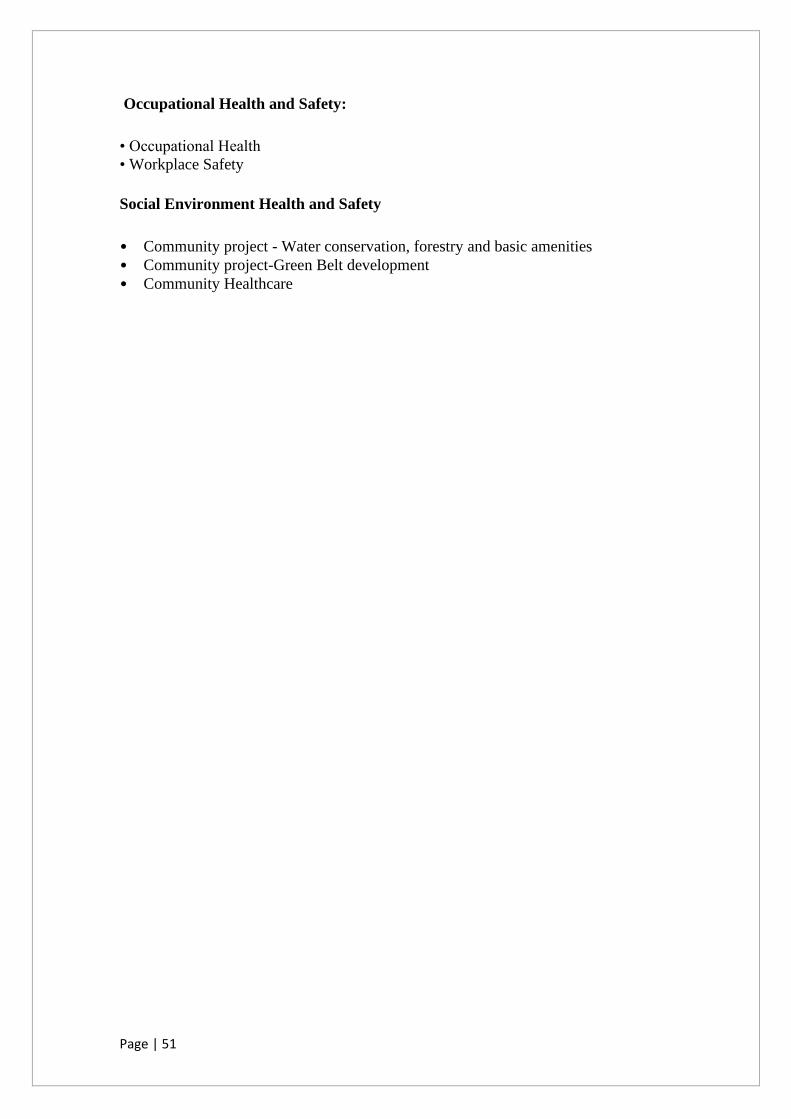
Page | 51
Occupational Health and Safety:
• Occupational Health
• Workplace Safety
Social Environment Health and Safety
• Community project - Water conservation, forestry and basic amenities
• Community project-Green Belt development
• Community Healthcare
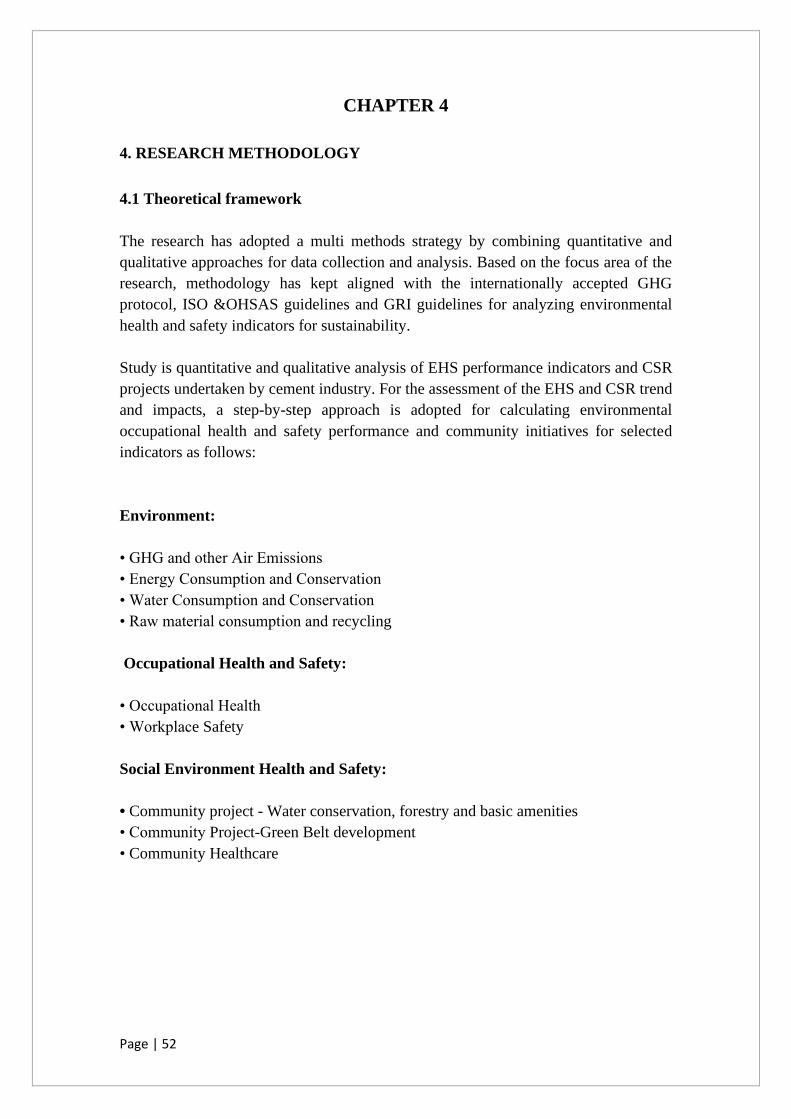
Page | 52
CHAPTER 4
4. RESEARCH METHODOLOGY
4.1 Theoretical framework
The research has adopted a multi methods strategy by combining quantitative and
qualitative approaches for data collection and analysis. Based on the focus area of the
research, methodology has kept aligned with the internationally accepted GHG
protocol, ISO &OHSAS guidelines and GRI guidelines for analyzing environmental
health and safety indicators for sustainability.
Study is quantitative and qualitative analysis of EHS performance indicators and CSR
projects undertaken by cement industry. For the assessment of the EHS and CSR trend
and impacts, a step-by-step approach is adopted for calculating environmental
occupational health and safety performance and community initiatives for selected
indicators as follows:
Environment:
• GHG and other Air Emissions
• Energy Consumption and Conservation
• Water Consumption and Conservation
• Raw material consumption and recycling
Occupational Health and Safety:
• Occupational Health
• Workplace Safety
Social Environment Health and Safety:
• Community project - Water conservation, forestry and basic amenities
• Community Project-Green Belt development
• Community Healthcare

Page | 53
4.2 Sampling and Source of Data
To analyze the performance trend of EHS indicators for cement companies, the sample
companies were selected. While selecting the samples it was considered that mix of
companies to be considered basis old and new plants, large and small capacity of
production. Total 5 Indian cement companies were studied to understand the
performance trend of EHS indicators for sustainable development. These companies
have multiple plants across India which are mostly certified to ISO 14001 and ISO
18001 for environment management system and occupational health and safety. These
companies are reporting as per various standards as GRI, ISO, UNGC, WBCSD etc.
which includes numbers of indicators for sustainability. Out of several indicators of
sustainability few are relevant to EHS. For research purpose, the identified set of EHS
indicators data was collected form the sample companies. The production for each of
the company varies year to year which is summarized below in the below table.
Table-7
The cement industries located in India are selected for this study. The sample companies
for the study are given as follows which includes ACC Ltd, JK cement, Ambuja Cement
Ltd, Shree Cement Ltd and Ultra Tech Ltd. Total 5 cement company’s EHS and social
initiatives performance have been studied for the selected set of sustainability parameter
for three financial year (2013-14, 2014-15, 2015-16) data. These are selected from top
10 largest cement companies based on their production size in India. Four years’
sustainability performance from 2014 to 2017 are taken for the research purpose.
Various data and information on the given parameters of sustainability for the study
were collected from the website of the companies, public disclosures, mandatory
reports and submissions. As the data has been used from actual performance of industry
for research purpose. So, the names of the companies have been kept confidential while
analyzing performance and the selected sample companies have been coded as follows:
1. Cement Industry-A, 2. Cement Industry-B, 3. Cement Industry-C, 4. Cement
Industry-D, 5. Cement Industry-E (Names have not been disclosed due to
confidentiality reasons). (Refer Appendix I)
Company A B C D E
unit mllion tonnes mllion tonnes mllion tonnes mllion tonnes mllion tonnes
2012-13 42.59 23.13 22.31 12.33 5.68
2013-14 43.6 24.24 22.31 14.2 5.34
2014-15 43.88 23.84 21.54 16.2 5.3
2015-16 35.51 23.18 12.06 18.50 5.3
2016-17 33.99 26.56 11.92 19.42 5.72
Production
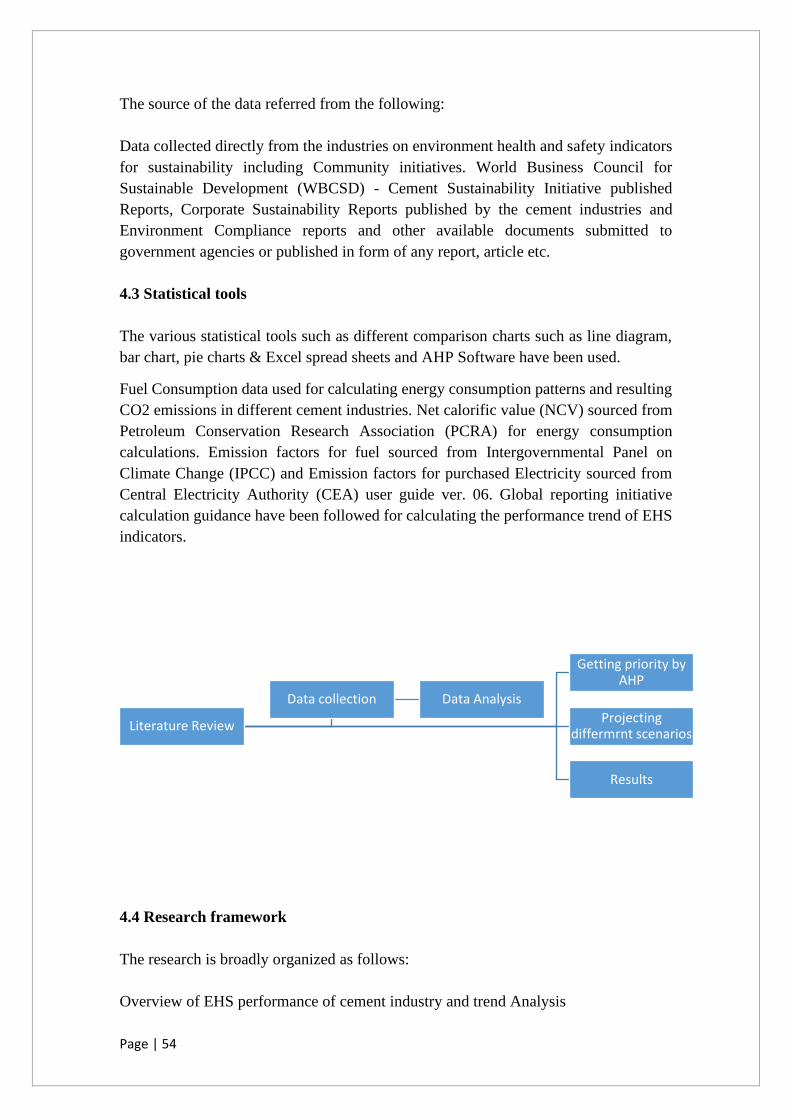
Page | 54
The source of the data referred from the following:
Data collected directly from the industries on environment health and safety indicators
for sustainability including Community initiatives. World Business Council for
Sustainable Development (WBCSD) - Cement Sustainability Initiative published
Reports, Corporate Sustainability Reports published by the cement industries and
Environment Compliance reports and other available documents submitted to
government agencies or published in form of any report, article etc.
4.3 Statistical tools
The various statistical tools such as different comparison charts such as line diagram,
bar chart, pie charts & Excel spread sheets and AHP Software have been used.
Fuel Consumption data used for calculating energy consumption patterns and resulting
CO2 emissions in different cement industries. Net calorific value (NCV) sourced from
Petroleum Conservation Research Association (PCRA) for energy consumption
calculations. Emission factors for fuel sourced from Intergovernmental Panel on
Climate Change (IPCC) and Emission factors for purchased Electricity sourced from
Central Electricity Authority (CEA) user guide ver. 06. Global reporting initiative
calculation guidance have been followed for calculating the performance trend of EHS
indicators.
4.4 Research framework
The research is broadly organized as follows:
Overview of EHS performance of cement industry and trend Analysis
Literature Review
Getting priority by AHP
Projecting differmrnt scenarios
Results
Data collection Data Analysis
Page | 55
Collection of data on Environment health and safety & Community initiatives for
sustainability.
Outlining sustainability emerging criteria and various scenarios in sustainability
practices for rating.
Development of Sustainability Index for measuring sustainability effectiveness and
maturity level.
4.5 EHS Indicators for Sustainability and their performance trend
Environment:
Energy Consumption and Conservation:
For the construction industry cement is one of the key crucial material. Cement
production is an energy intensive process, and largely dependent on the primary energy
sources (direct energy- fuels like coal, pet coke, diesel etc.) and secondary energy
sources (Indirect Energy- grid electricity). The major direct demand of fuels in cement
industry is towards operating the pre-heater and kiln facilities. The 90 percent of the
cement manufacturing energy is consumed in kiln process and rest 10 percent is used
up in almost equal quantities by activities associated to fuel and raw materials
preparation, crushing of clinker and the amalgamation of materials to make the finished
cement product.
The cement industry heavily depends on fossil fuels which are carbon-intensive. Coal
(including Lignite, Petcock), Furnace Oil, Agro Waste and High-Speed Diesel (HSD)
are the major primary fuels used across cement manufacturing units in India. To burn
raw mix, coal and petroleum coke products are generally used as primary fuel. During
start-up of the kiln HSD is generally used whereas to reduce the consumption, coal, tire
fuels, municipal solid waste, liquid waste and other alternative energy sources are also
being used.
During raw material extraction, grinding, finished grinding and packaging, electricity
is mainly needed. Electricity is also used for conveyors, compressors, fans in different
production stages. The trend shows that direct energy consumption has been increasing
year on year (although there is dip in 2015-16, which is due to one of the sample
company’s some of the plant was not operational for 3 months). Whereas the purchased
electricity (grid electricity) has been reducing from 2014-15 to 2016-17. At the same
time Renewable energy share has been increased tenfold in 2016-17 in comparison to
2013-14.

Page | 56
Figure-1
Figure-2
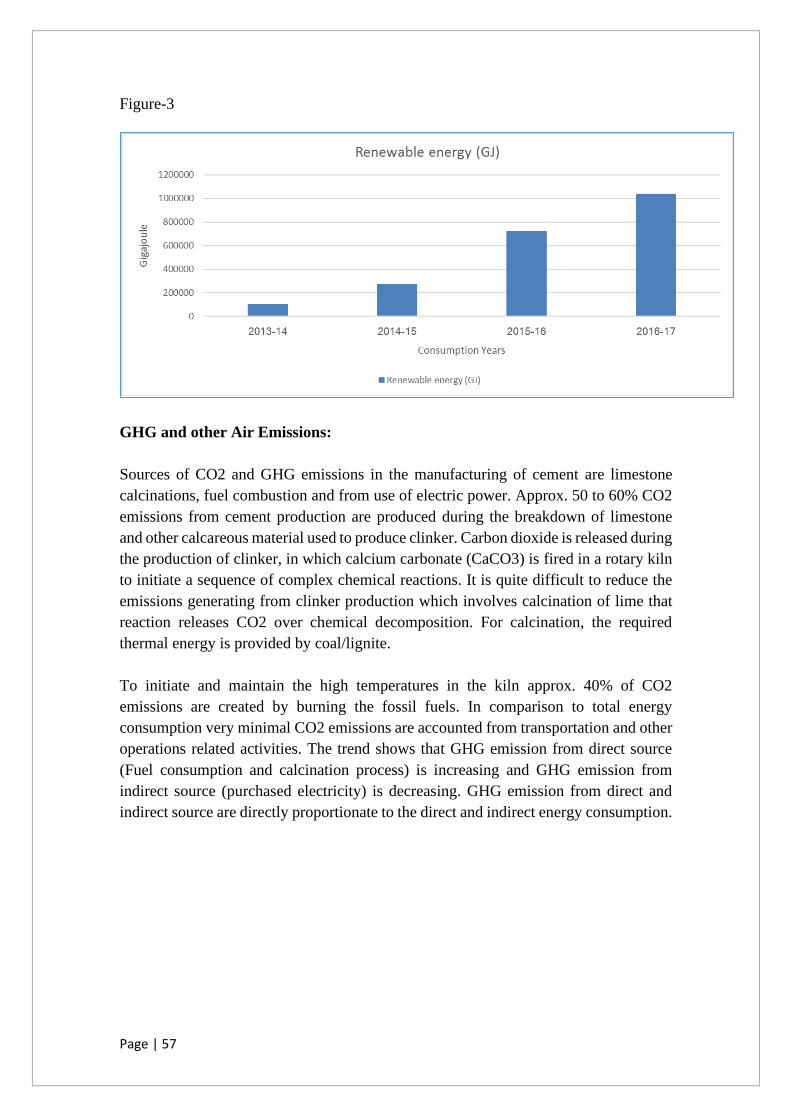
Page | 57
Figure-3
GHG and other Air Emissions:
Sources of CO2 and GHG emissions in the manufacturing of cement are limestone
calcinations, fuel combustion and from use of electric power. Approx. 50 to 60% CO2
emissions from cement production are produced during the breakdown of limestone
and other calcareous material used to produce clinker. Carbon dioxide is released during
the production of clinker, in which calcium carbonate (CaCO3) is fired in a rotary kiln
to initiate a sequence of complex chemical reactions. It is quite difficult to reduce the
emissions generating from clinker production which involves calcination of lime that
reaction releases CO2 over chemical decomposition. For calcination, the required
thermal energy is provided by coal/lignite.
To initiate and maintain the high temperatures in the kiln approx. 40% of CO2
emissions are created by burning the fossil fuels. In comparison to total energy
consumption very minimal CO2 emissions are accounted from transportation and other
operations related activities. The trend shows that GHG emission from direct source
(Fuel consumption and calcination process) is increasing and GHG emission from
indirect source (purchased electricity) is decreasing. GHG emission from direct and
indirect source are directly proportionate to the direct and indirect energy consumption.
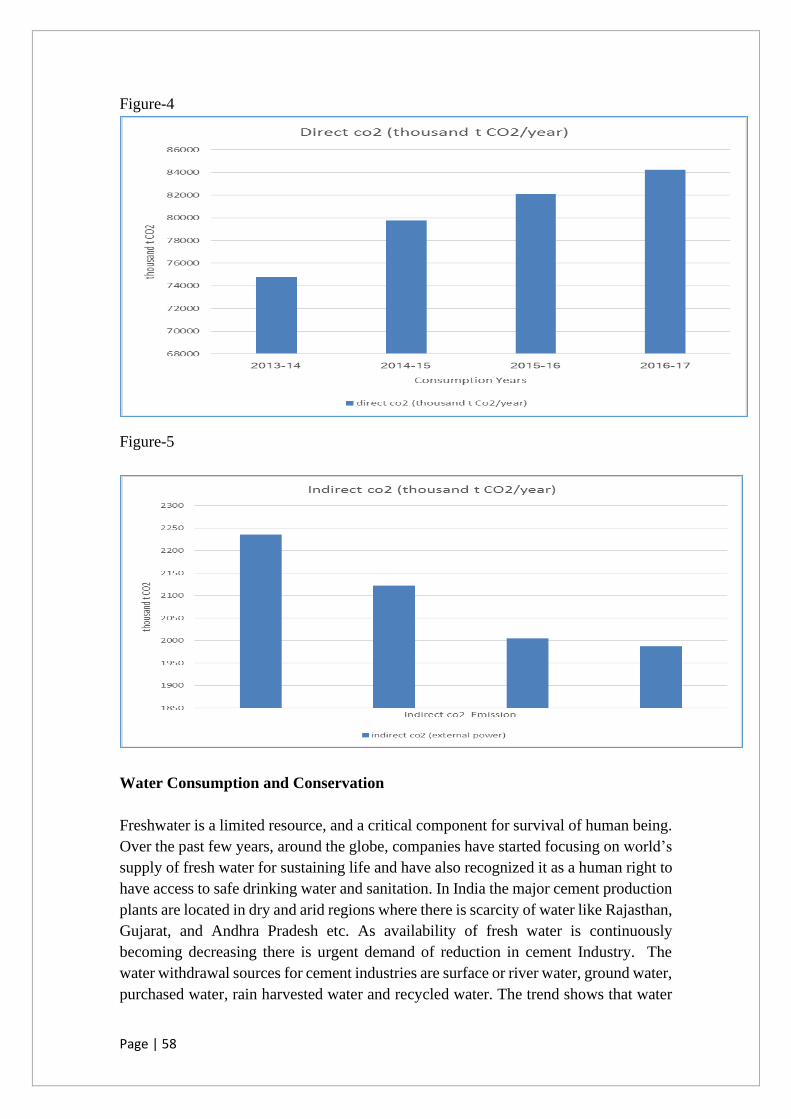
Page | 58
Figure-4
Figure-5
Water Consumption and Conservation
Freshwater is a limited resource, and a critical component for survival of human being.
Over the past few years, around the globe, companies have started focusing on world’s
supply of fresh water for sustaining life and have also recognized it as a human right to
have access to safe drinking water and sanitation. In India the major cement production
plants are located in dry and arid regions where there is scarcity of water like Rajasthan,
Gujarat, and Andhra Pradesh etc. As availability of fresh water is continuously
becoming decreasing there is urgent demand of reduction in cement Industry. The
water withdrawal sources for cement industries are surface or river water, ground water,
purchased water, rain harvested water and recycled water. The trend shows that water
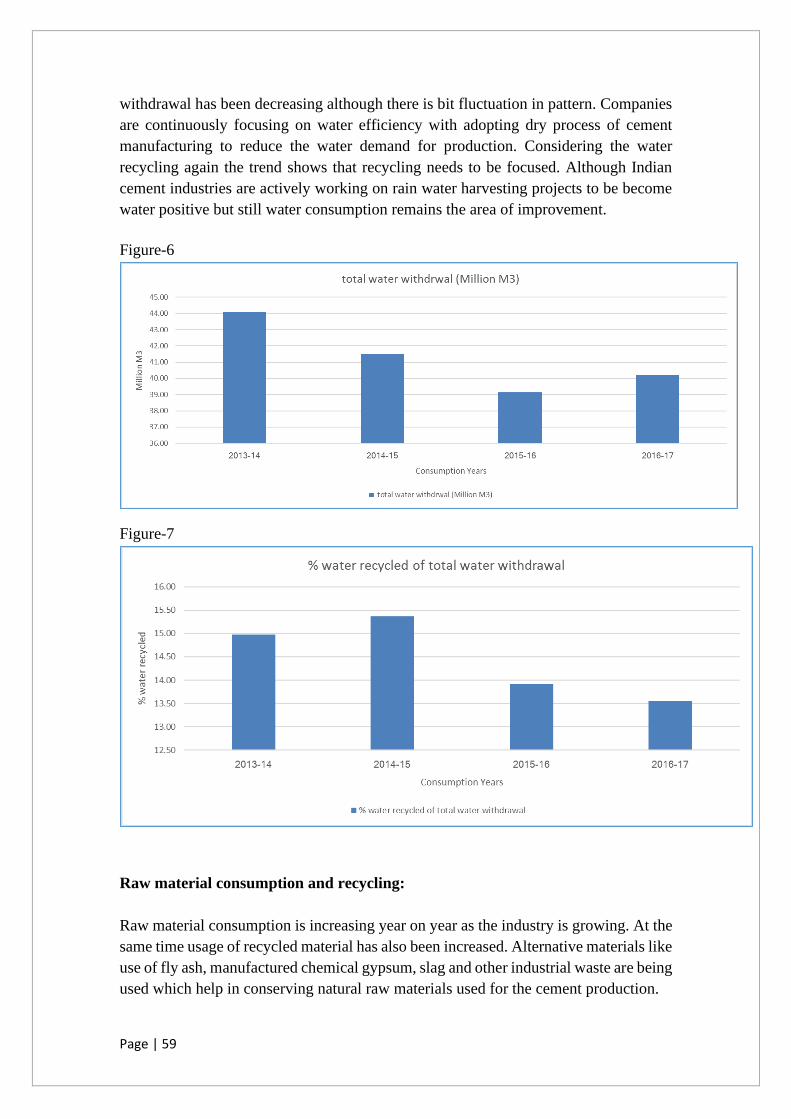
Page | 59
withdrawal has been decreasing although there is bit fluctuation in pattern. Companies
are continuously focusing on water efficiency with adopting dry process of cement
manufacturing to reduce the water demand for production. Considering the water
recycling again the trend shows that recycling needs to be focused. Although Indian
cement industries are actively working on rain water harvesting projects to be become
water positive but still water consumption remains the area of improvement.
Figure-6
Figure-7
Raw material consumption and recycling:
Raw material consumption is increasing year on year as the industry is growing. At the
same time usage of recycled material has also been increased. Alternative materials like
use of fly ash, manufactured chemical gypsum, slag and other industrial waste are being
used which help in conserving natural raw materials used for the cement production.
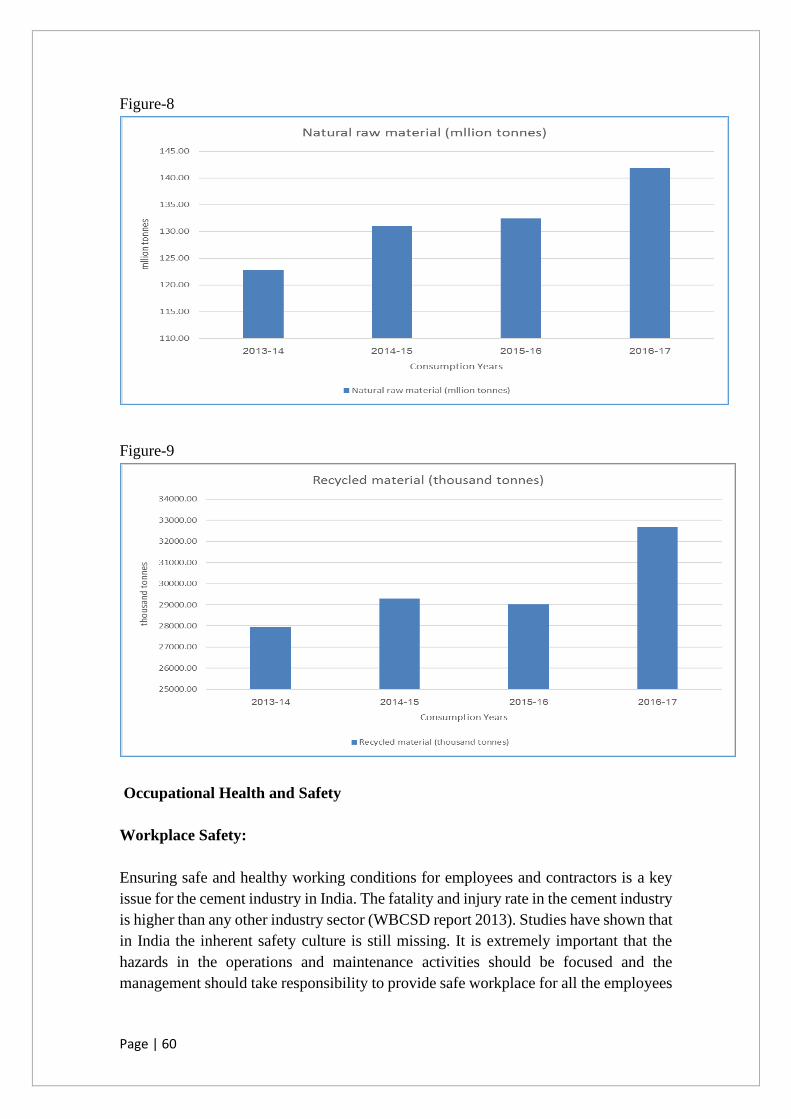
Page | 60
Figure-8
Figure-9
Occupational Health and Safety
Workplace Safety:
Ensuring safe and healthy working conditions for employees and contractors is a key
issue for the cement industry in India. The fatality and injury rate in the cement industry
is higher than any other industry sector (WBCSD report 2013). Studies have shown that
in India the inherent safety culture is still missing. It is extremely important that the
hazards in the operations and maintenance activities should be focused and the
management should take responsibility to provide safe workplace for all the employees
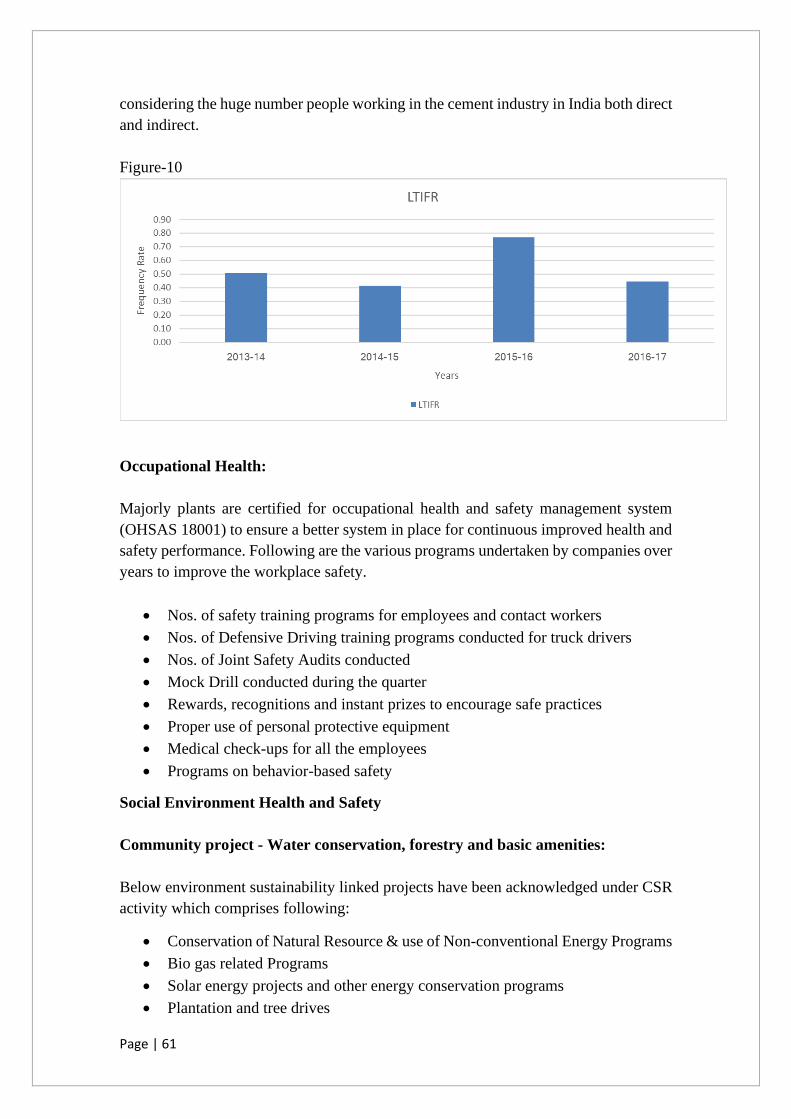
Page | 61
considering the huge number people working in the cement industry in India both direct
and indirect.
Figure-10
Occupational Health:
Majorly plants are certified for occupational health and safety management system
(OHSAS 18001) to ensure a better system in place for continuous improved health and
safety performance. Following are the various programs undertaken by companies over
years to improve the workplace safety.
• Nos. of safety training programs for employees and contact workers
• Nos. of Defensive Driving training programs conducted for truck drivers
• Nos. of Joint Safety Audits conducted
• Mock Drill conducted during the quarter
• Rewards, recognitions and instant prizes to encourage safe practices
• Proper use of personal protective equipment
• Medical check-ups for all the employees
• Programs on behavior-based safety
Social Environment Health and Safety
Community project - Water conservation, forestry and basic amenities:
Below environment sustainability linked projects have been acknowledged under CSR
activity which comprises following:
• Conservation of Natural Resource & use of Non-conventional Energy Programs
• Bio gas related Programs
• Solar energy projects and other energy conservation programs
• Plantation and tree drives
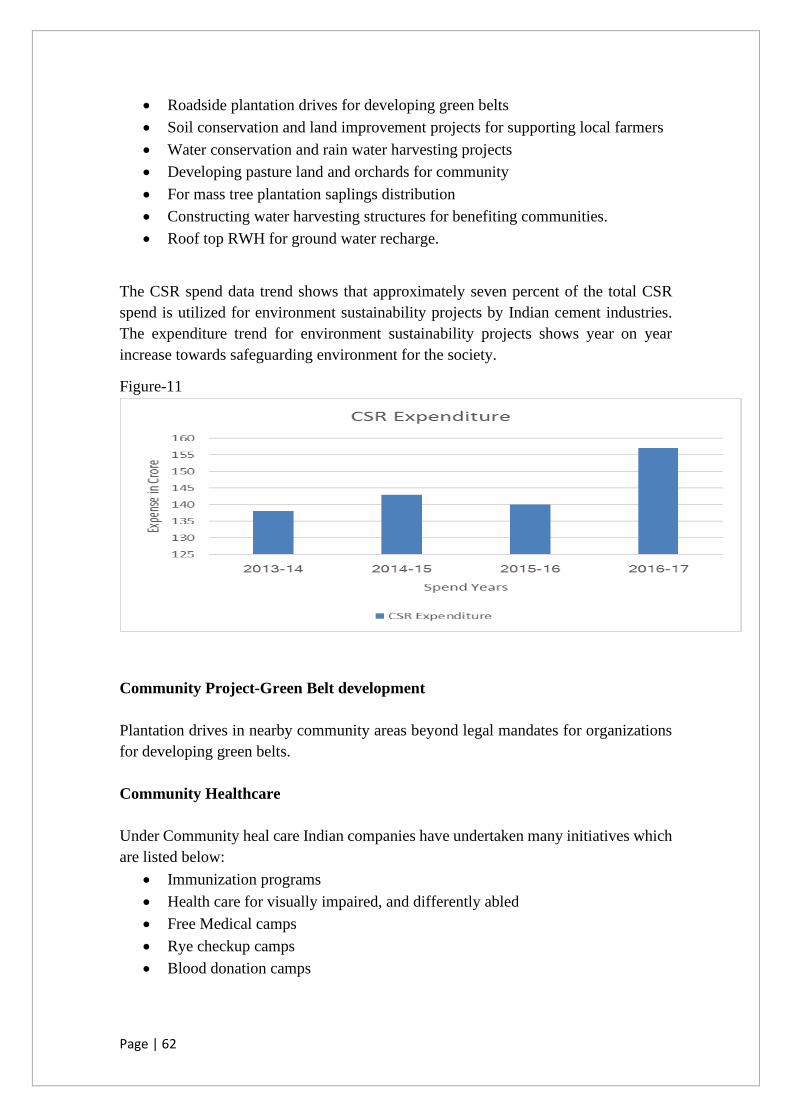
Page | 62
• Roadside plantation drives for developing green belts
• Soil conservation and land improvement projects for supporting local farmers
• Water conservation and rain water harvesting projects
• Developing pasture land and orchards for community
• For mass tree plantation saplings distribution
• Constructing water harvesting structures for benefiting communities.
• Roof top RWH for ground water recharge.
The CSR spend data trend shows that approximately seven percent of the total CSR
spend is utilized for environment sustainability projects by Indian cement industries.
The expenditure trend for environment sustainability projects shows year on year
increase towards safeguarding environment for the society.
Figure-11
Community Project-Green Belt development
Plantation drives in nearby community areas beyond legal mandates for organizations
for developing green belts.
Community Healthcare
Under Community heal care Indian companies have undertaken many initiatives which
are listed below:
• Immunization programs
• Health care for visually impaired, and differently abled
• Free Medical camps
• Rye checkup camps
• Blood donation camps
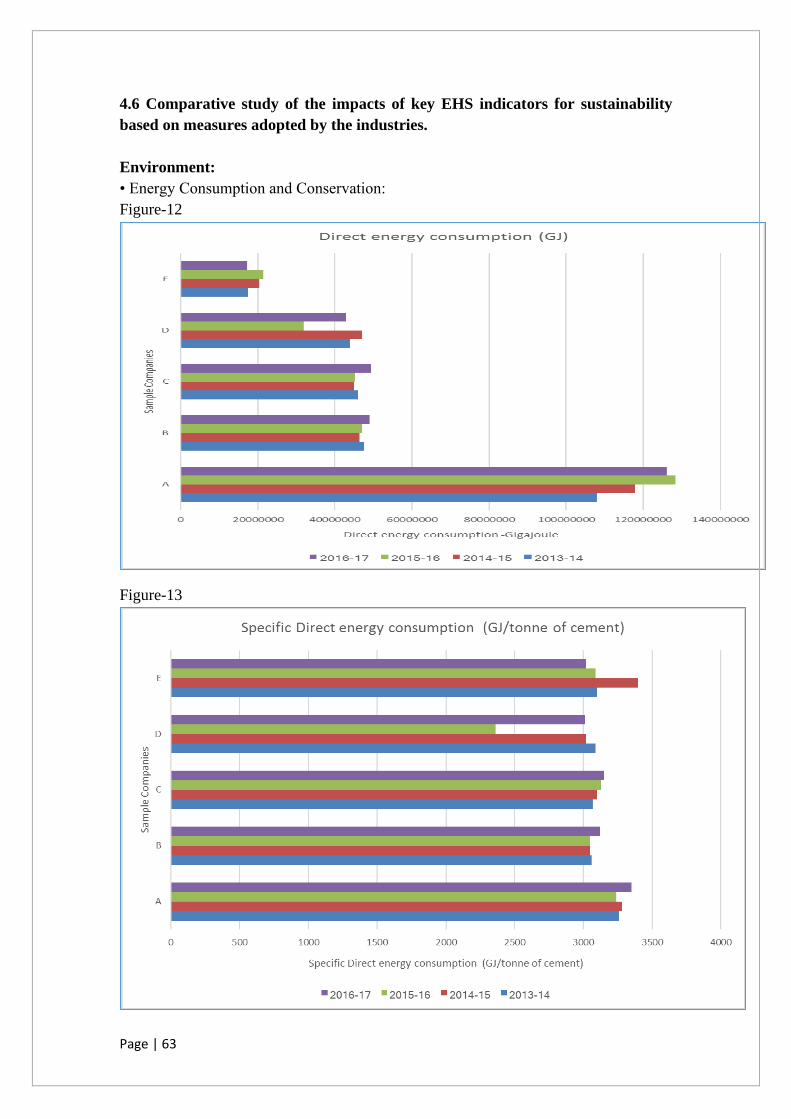
Page | 63
4.6 Comparative study of the impacts of key EHS indicators for sustainability
based on measures adopted by the industries.
Environment:
• Energy Consumption and Conservation:
Figure-12
Figure-13
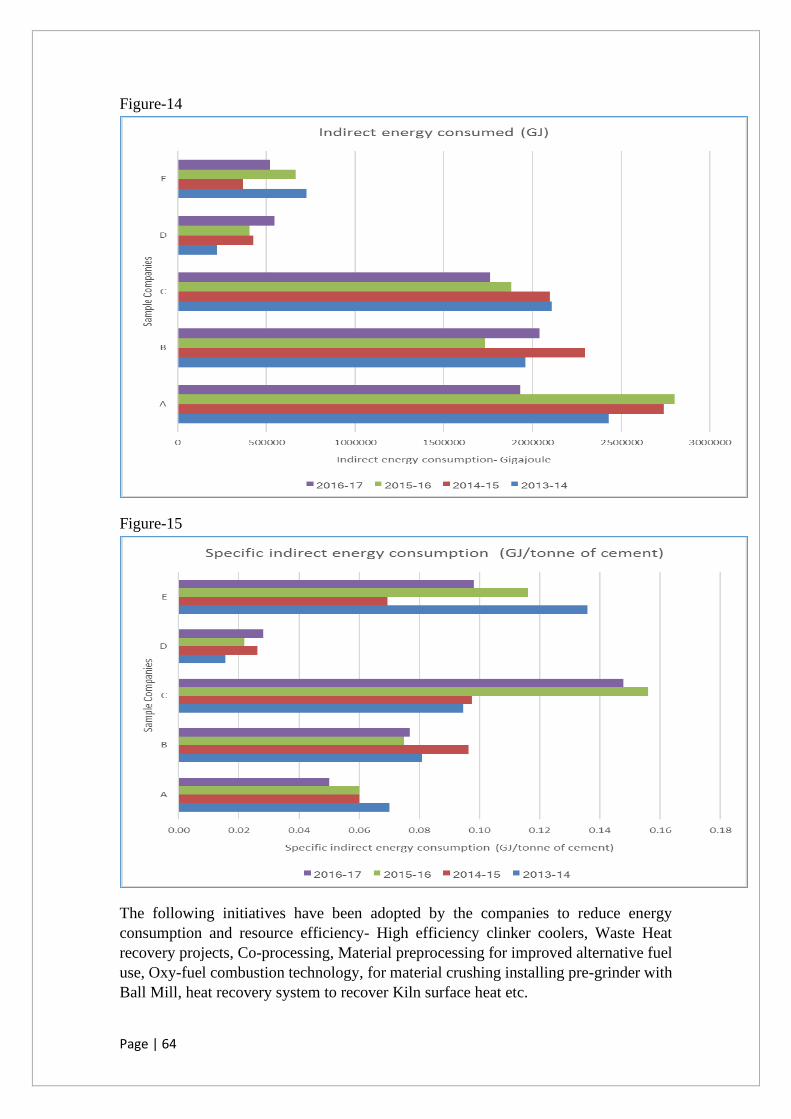
Page | 64
Figure-14
Figure-15
The following initiatives have been adopted by the companies to reduce energy
consumption and resource efficiency- High efficiency clinker coolers, Waste Heat
recovery projects, Co-processing, Material preprocessing for improved alternative fuel
use, Oxy-fuel combustion technology, for material crushing installing pre-grinder with
Ball Mill, heat recovery system to recover Kiln surface heat etc.
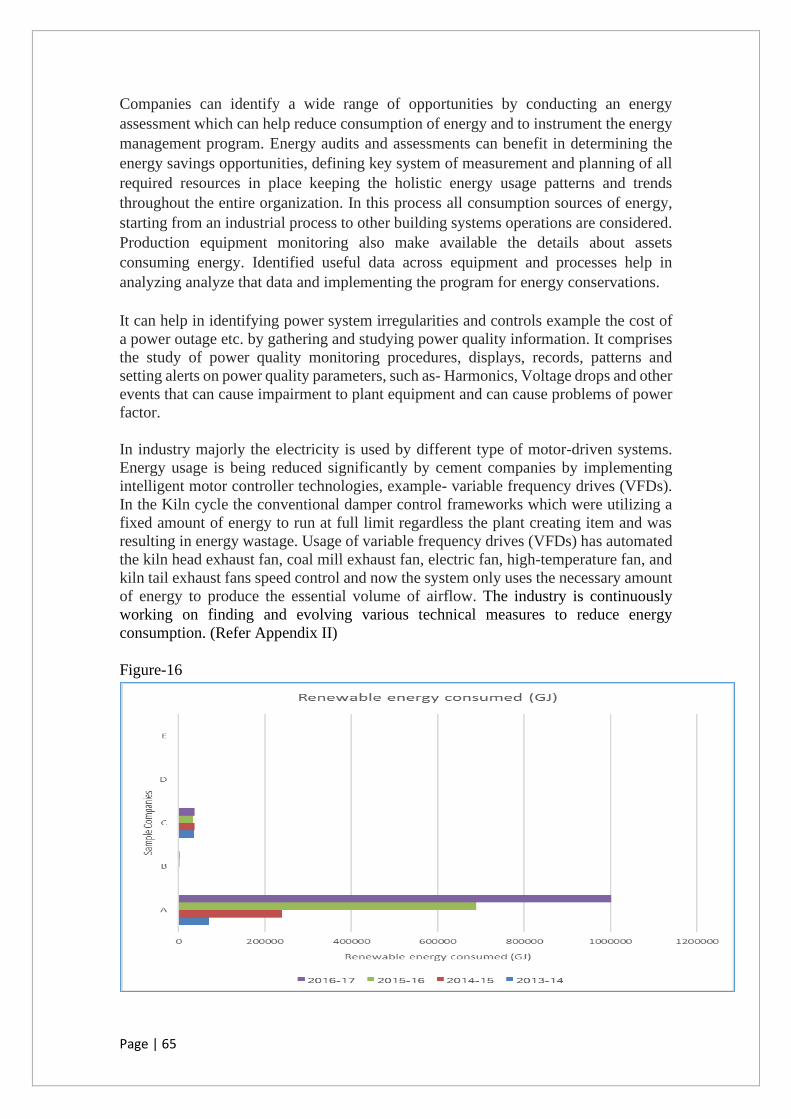
Page | 65
Companies can identify a wide range of opportunities by conducting an energy
assessment which can help reduce consumption of energy and to instrument the energy
management program. Energy audits and assessments can benefit in determining the
energy savings opportunities, defining key system of measurement and planning of all
required resources in place keeping the holistic energy usage patterns and trends
throughout the entire organization. In this process all consumption sources of energy,
starting from an industrial process to other building systems operations are considered.
Production equipment monitoring also make available the details about assets
consuming energy. Identified useful data across equipment and processes help in
analyzing analyze that data and implementing the program for energy conservations.
It can help in identifying power system irregularities and controls example the cost of
a power outage etc. by gathering and studying power quality information. It comprises
the study of power quality monitoring procedures, displays, records, patterns and
setting alerts on power quality parameters, such as- Harmonics, Voltage drops and other
events that can cause impairment to plant equipment and can cause problems of power
factor.
In industry majorly the electricity is used by different type of motor-driven systems.
Energy usage is being reduced significantly by cement companies by implementing
intelligent motor controller technologies, example- variable frequency drives (VFDs).
In the Kiln cycle the conventional damper control frameworks which were utilizing a
fixed amount of energy to run at full limit regardless the plant creating item and was
resulting in energy wastage. Usage of variable frequency drives (VFDs) has automated
the kiln head exhaust fan, coal mill exhaust fan, electric fan, high-temperature fan, and
kiln tail exhaust fans speed control and now the system only uses the necessary amount
of energy to produce the essential volume of airflow. The industry is continuously
working on finding and evolving various technical measures to reduce energy
consumption. (Refer Appendix II)
Figure-16
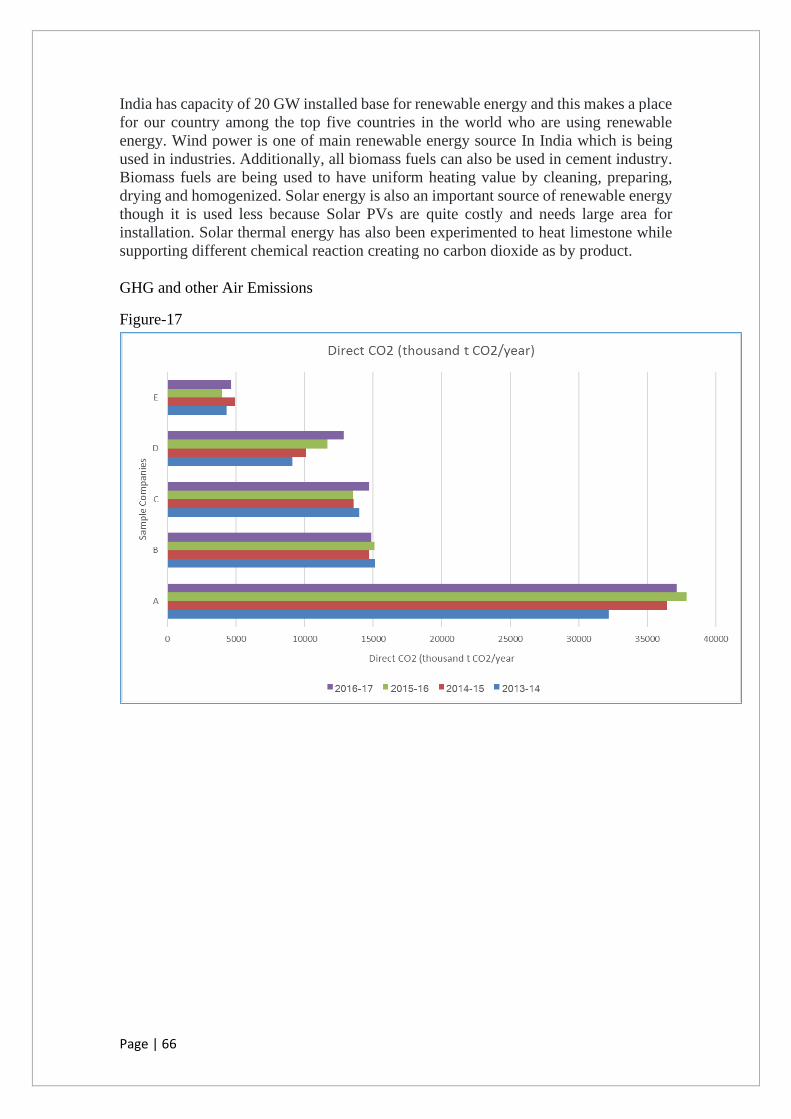
Page | 66
India has capacity of 20 GW installed base for renewable energy and this makes a place
for our country among the top five countries in the world who are using renewable
energy. Wind power is one of main renewable energy source In India which is being
used in industries. Additionally, all biomass fuels can also be used in cement industry.
Biomass fuels are being used to have uniform heating value by cleaning, preparing,
drying and homogenized. Solar energy is also an important source of renewable energy
though it is used less because Solar PVs are quite costly and needs large area for
installation. Solar thermal energy has also been experimented to heat limestone while
supporting different chemical reaction creating no carbon dioxide as by product.
GHG and other Air Emissions
Figure-17
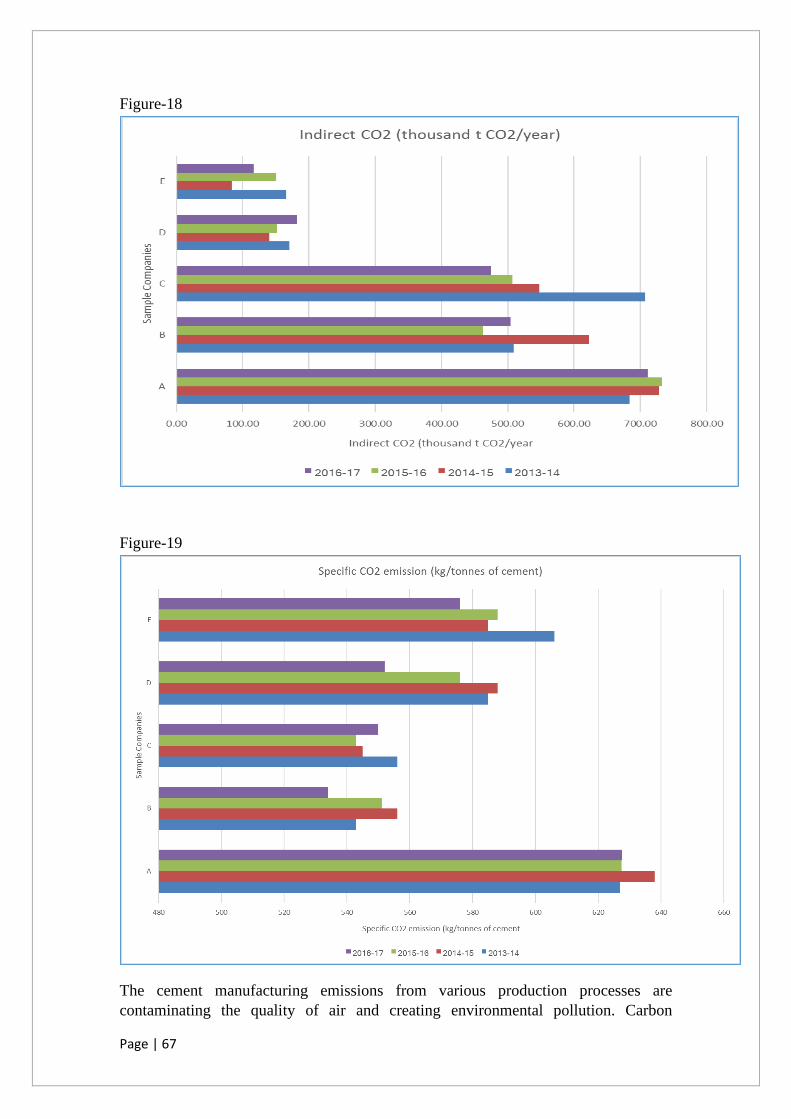
Page | 67
Figure-18
Figure-19
The cement manufacturing emissions from various production processes are
contaminating the quality of air and creating environmental pollution. Carbon

Page | 68
emissions are an important environmental issue for the cement industry. Carbon dioxide
is one of several greenhouse gases that are triggering global warming by trapping the
Sun’s radiant energy in our atmosphere, called as greenhouse effect.
Around half of the emissions from cement manufacturing process arise from the
reaction where calcium carbonate is fired and dissociated to calcium oxide and emits
carbon dioxide, resulting as CO2 release and it cannot be eradicated by shifting fuel or
increasing productivity. Other than energy-related emissions, which comes from clinker
production and results in CO2 emissions would be difficult to restrict as these emissions
are an integral part of the decarbonization process for clinker formulation. Additional
40% of carbon emissions come from burning of fossil fuels in the kilns at the high
temperatures for calcination process. Operating mining equipment for taking out the
raw materials and transportation of the raw materials to the cement plant and other
manufacturing process emit comparatively small quantities of CO2. Rest ten percent of
emissions come from fuels required for transporting the raw materials. There are many
aspects which impacts the emissions like type of fuel used and equipment efficiency.
Water Consumption and Conservation
Figure-20
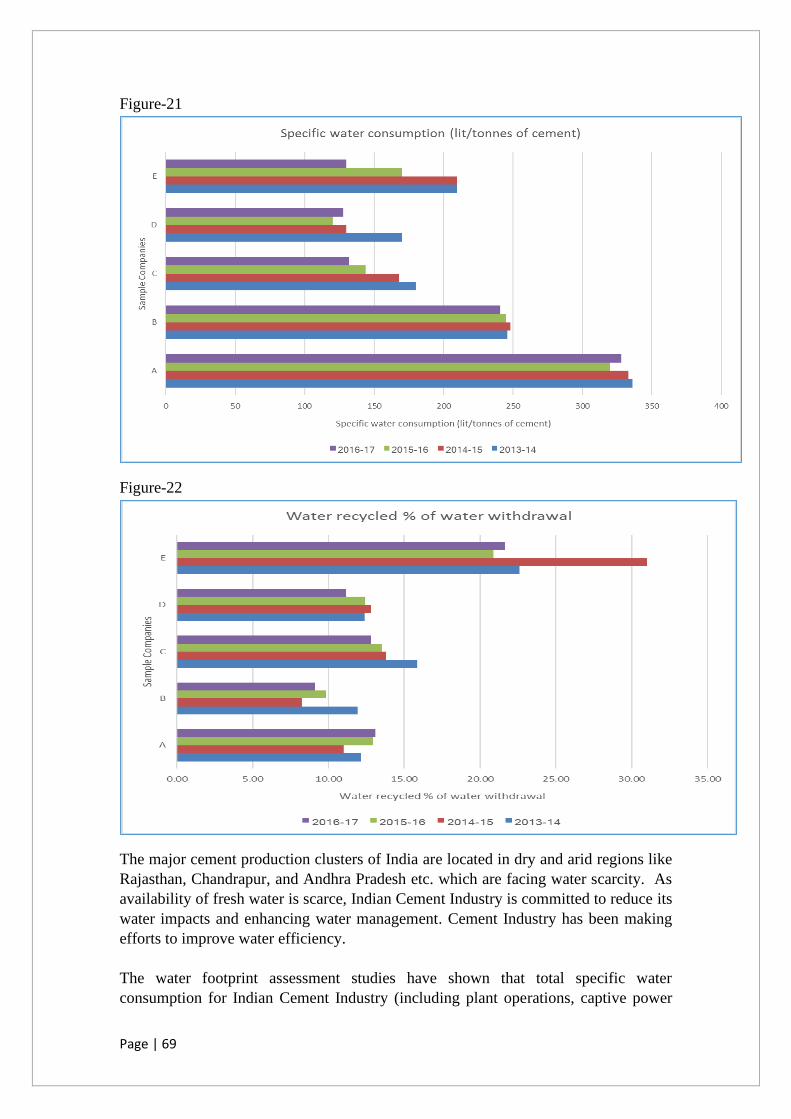
Page | 69
Figure-21
Figure-22
The major cement production clusters of India are located in dry and arid regions like
Rajasthan, Chandrapur, and Andhra Pradesh etc. which are facing water scarcity. As
availability of fresh water is scarce, Indian Cement Industry is committed to reduce its
water impacts and enhancing water management. Cement Industry has been making
efforts to improve water efficiency.
The water footprint assessment studies have shown that total specific water
consumption for Indian Cement Industry (including plant operations, captive power

Page | 70
plant, colony and mines operation) varies and average consumption is approx. 0.21
m3/tonne of cement for dry process-based cement plants. The average specific water
consumption for plant operations comes out to be 0.14 m3/tonne of cement for dry
process-based cement plants and 0.92 m3/tonne of equivalent OPC for wet process-
based cement plant.
Raw material consumption and recycling
Figure-23
Figure-24
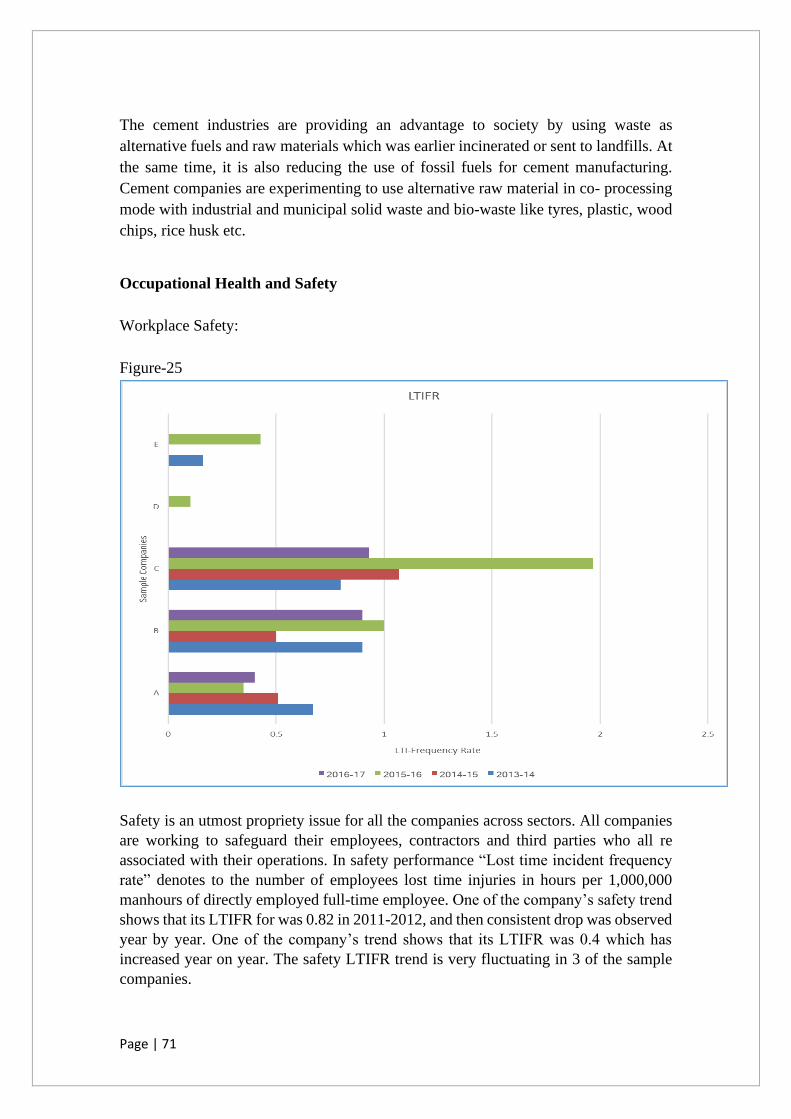
Page | 71
The cement industries are providing an advantage to society by using waste as
alternative fuels and raw materials which was earlier incinerated or sent to landfills. At
the same time, it is also reducing the use of fossil fuels for cement manufacturing.
Cement companies are experimenting to use alternative raw material in co- processing
mode with industrial and municipal solid waste and bio-waste like tyres, plastic, wood
chips, rice husk etc.
Occupational Health and Safety
Workplace Safety:
Figure-25
Safety is an utmost propriety issue for all the companies across sectors. All companies
are working to safeguard their employees, contractors and third parties who all re
associated with their operations. In safety performance “Lost time incident frequency
rate” denotes to the number of employees lost time injuries in hours per 1,000,000
manhours of directly employed full-time employee. One of the company’s safety trend
shows that its LTIFR for was 0.82 in 2011-2012, and then consistent drop was observed
year by year. One of the company’s trend shows that its LTIFR was 0.4 which has
increased year on year. The safety LTIFR trend is very fluctuating in 3 of the sample
companies.
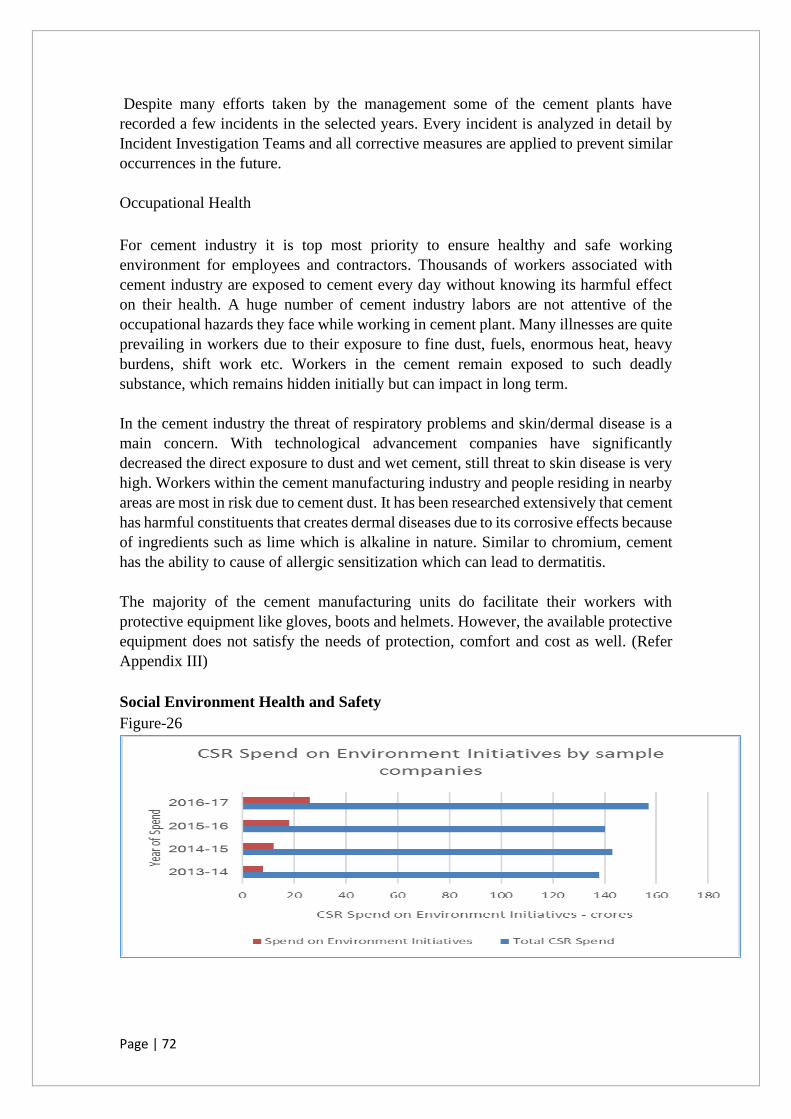
Page | 72
Despite many efforts taken by the management some of the cement plants have
recorded a few incidents in the selected years. Every incident is analyzed in detail by
Incident Investigation Teams and all corrective measures are applied to prevent similar
occurrences in the future.
Occupational Health
For cement industry it is top most priority to ensure healthy and safe working
environment for employees and contractors. Thousands of workers associated with
cement industry are exposed to cement every day without knowing its harmful effect
on their health. A huge number of cement industry labors are not attentive of the
occupational hazards they face while working in cement plant. Many illnesses are quite
prevailing in workers due to their exposure to fine dust, fuels, enormous heat, heavy
burdens, shift work etc. Workers in the cement remain exposed to such deadly
substance, which remains hidden initially but can impact in long term.
In the cement industry the threat of respiratory problems and skin/dermal disease is a
main concern. With technological advancement companies have significantly
decreased the direct exposure to dust and wet cement, still threat to skin disease is very
high. Workers within the cement manufacturing industry and people residing in nearby
areas are most in risk due to cement dust. It has been researched extensively that cement
has harmful constituents that creates dermal diseases due to its corrosive effects because
of ingredients such as lime which is alkaline in nature. Similar to chromium, cement
has the ability to cause of allergic sensitization which can lead to dermatitis.
The majority of the cement manufacturing units do facilitate their workers with
protective equipment like gloves, boots and helmets. However, the available protective
equipment does not satisfy the needs of protection, comfort and cost as well. (Refer
Appendix III)
Social Environment Health and Safety
Figure-26
Page | 73
The cement manufacturing uses huge amount of natural resources and leaves a
substantial ecological impression and yet these ventures are additionally contributing
towards the societies and environment condition in India. The CSR initiatives which
have been taken by the cement companies are associated with multiple community
wellbeing, environment conservation, basic infrastructure progress, health and
cleanliness, education etc. Environment sustainability projects have shown the positive
drift with CSR funds allocation for such projects but the effect of these projects has not
yet been measured. While numerous environmental factors and aspects are measured
and reported in BRR and corporate sustainability reports in terms of initiatives
undertaken for environment protection such as energy management and related
emission decrease and others.
Most of the major cement companies in India are having their own Society/Foundation
through which they are implementing CSR activities. The cement companies are
determined to uplift the local community wherever they are operating. Majority of the
companies have well-structured development programs for children education and
women empowerment around their operation sites. Education, health, greenbelt &
infrastructure development are four prime areas where the four cement companies are
focusing. These social initiatives and actions are more on health care and family welfare
programs, basic infrastructure progress, education, environment, social wellbeing, and
sustainable living. (Refer Appendix IV)
Cement manufacturing companies are undertaking social initiatives as suggested under
the Environment Clearance obligation under Environment Impact assessment which
comprises compliance to the environmental conservation measures and protection of
environment. Activities such as measures for wellbeing of public residing nearby the
project area are also ordered to carry out under eco development activities. As per the
Company’s Act obligation initiatives and projects have been undertaken which
comprises Health care initiatives, access to safe drinking water for nearby people,
providing support to farmers for agriculture upliftment, promoting educational
initiatives including customer awareness, employment programs and skill development
trainings, Women upliftment and capacity building, providing basic facilities, safety
and medical amenities to aged individuals, Tree plantation drives, environment
protection of including Biogas, Solar, tree plantation, Watershed management and
Water Resources preservation, animal wellbeing, Support to community and other
activities coordination with the CSR policy, sports Promotions, rural infrastructure
development etc. Environment sustainability related plans have been recognized as per
CSR activity which comprises:
Community project - Water conservation, forestry and basic amenities
➢ Water harvesting structures construction in villages for benefiting
communities.
➢ Harvesting the rainwater from the roof tops and to recharge the ground water
Page | 74
➢ Undertaking water conservation projects and harvesting rain water
➢ Supporting farmers in soil conservation t projects and land improvement,
➢ Programs linked to preservation of Natural Resource
➢ Providing Support to programs associated with organic farming.
➢ Solar energy associated and other energy preservation projects
Community project-Green Belt development
➢ Developing pasture land and orchards for community
➢ Saplings supply for mass tree plantation in nearby villages,
➢ Promoting tree plantation drives
➢ Developing green belt along roadside
Community Healthcare
Some Cement Plants have focused on providing medical facilities to the villages in
its vicinity. They have conducted mega medical camps with specialist doctors and
free treatment and medicine distribution in the villages. In Some of the companies.
a Medical Centre inside the Plant are open to all villagers during the day with an
ambulance moving around the clock. Patients recommended for surgery in the
medical camps have been sponsored for treatment in the hospitals. The companies
have organized medical camps, immunization programs, sanitization programs.
Page | 75
CHAPTER 5
5. EMERGING SUSTAINABILITY CRITERIA AND VARIOUS SCENARIOS
IN SUSTAINABILITY PRACTICES
Sample cement companies’ data have been studied for the identified key EHS indicators
for sustainability. Performance trend of each of the indicators was analyzed and
comparative assessment was done to determine how the performance demonstrate the
sustainability year on year. The measures adopted for the sustainability were also
studied to understand the emerging criteria and scenarios for sustainability practices.
5.1 Sustainability criteria concept
In the field of health safety and environment for the sustainable development it stresses
for defining the sustainability criteria for each EHS indicator. The availability of
sustainability criteria supports in articulating action plans for sustainability in the long
viewpoint.
The basis for defining sustainability criteria is the concept of sustainable development
and EHS performance role in sustainability. In 1987, first time the term ‘’Sustainable
development’’ was described by the Brundtland Commission as ‘development that
fulfills the requirements of the present generation without compromising the capacity
of upcoming generations to fulfill their own requirements’. An all-encompassing
concept of the sustainable development is founded on the three-pillar method-
environmental, social, and economic dimensions for sustainable growth. The
environmental dimension addresses all the basics which are affecting the ecological and
climate processes and talks about the feasibility of natural environmental systems for
existence of human race. While the social segment encompasses all the basics related
to human resources practices like employee focused policies, human rights issues,
health and safety of all employees and stakeholders, supply chain sustainability etc.
Economic dimension has been covering the different outlook for directing business with
inclusive progress. It evaluates the business economic performance in synchronization
with the facets of distribution revenues for inclusive progress by including local people
in business.
The studies have emphasized that sustainability criteria can be of a qualitative or
measurable nature as the social dimensions, it is complex to evaluate the measures. It
has also focused on the fact that sustainability criteria are not always stationary, they
often require constant assessment and adjustment time to time. It has highlighted that
sustainability criteria can assists in sensing unjustifiable tendencies and effects, thus
recognizing unsustainable methods. Sustainability criteria can establish a boundary for
each component of indicator ex. the usage of natural resources and can also offer
direction for future activities. [Goldschmidt].
Page | 76
This research has been highlighted on the environment and social dimension with
reference to health & safety and societal initiatives. The organized criteria are
articulated for EHS Indicators for sustainability seeing the cement industry processes.
5.2 Identifying sustainability criteria under the EHS Indicator and sub indicators
Environment:
Energy Consumption and Conservation:
The cement production entails very enormous quantity of energy. For cement
manufacturing conventional fuel and electricity are highly demanded. Energy cost
portions around forty percent of total production expenses happen in manufacturing of
one tonne of cement. Electrical energy is essentially required while extraction of raw
material, raw material crushing, clinker crushing and packaging. Electricity is also used
on Conveyors, compressors, fans and pumps operation for production of cement.
Depending on size and design of plant, raw materials characteristic and content of
moisture in it, fuel’s specific caloric values, output of kiln, type of clinker and other
such factors are the deciding factors for specific energy consumption which varies case
to case. Majorly Indian cement plants are operating the dry process cycle for cement
which requires nine percent less power than the conventional wet process for cement
manufacturing.
PAT
The Indian cement industry is producing numerous types of cement such as Ordinary
Portland Cement also called as OPC, Portland Pozzolana Cement or PPC, Portland
Blast Furnace Slag Cement abbreviated as PBFS etc. Under the National Action Plan
on Climate Change, the National Mission for Enhanced Energy Efficiency is one of the
eight national missions which have been adopted for combating climate chance. In lieu
of this Bureau of Energy Efficiency initiated the PAT scheme, The Perform, Achieve
and Trade by the under the Ministry of Power. It provides an opportunity to the business
to improve its energy efficiency and energy consumption reduction which is resulting
in long term financial profits with exchange of Energy Savings Certificates (ESCerts).
PAT is formulated as a governing tool to decrease specific energy consumption (SEC)
in energy exhaustive industries. It is related to a market-based mechanism which
augments cost efficiency by certifying the additional energy savings achieved, which
could be used for trading of ESCerts. Under National mission for energy efficiency the
main focus is on PAT scheme. It is mandatory to achieve specific energy efficiency
improvements targets for the highly energy exhaustive businesses which are
additionally incentivized for achieving better energy efficiency advances. Those
industries who overachieves their targets are being issued Energy Savings Certificate
(ESCerts) for the units beyond the given target. It is mandatory to purchase ESCerts for
compliance for those companies which do not achieve their target as obligatory. They
can also be liable or to be penalized for not meeting the PAT requirements. Power
exchanges are the platform for trading of ESCerts.
Page | 77
Waste heat recovery system (WHRS)
In WHRS system installations, it has been observed in last seven years till 2017 that
there is triple upsurge, from 110 Megawatt in 2010 to 344 Megawatt in 2017. In
installed capacity, there is a surge of more than 230 Megawatt. Rising costs of coal and
grid electricity, have been played a major role in opting WHRS to reduce energy in
cement manufacturing. In India, the WHRS contributes to long-term energy security in
India and it offers several benefits to Indian cement plants, such as neutralizing
emissions of greenhouse gas and achieving targets as defined under PAT scheme.
To increase the overall efficiency of a plant is one of the most cost-effective ways is
WHRS and during production it is reducing fuel requirement and at the same time it
reduces GHG emissions. Studies shows that co-generation of energy using waste heat
recovery method meets approx. one fourth percent of total cement plant power
requirements. In coming future, it has been projected that there is the potential to
generate 800 Megawatt through co-generation of power using WHR. The significant
limitation in choosing WHRS installation is the requirement of huge investment. It has
been explored to get the WHRS under the Renewable Purchase Obligation (RPO)
scheme as a policy initiative, which will give it a significant speed to meet the
requirements.
In last few years it has been observed that cement sector has given key focus to
improvement initiatives related to electrical and fuel energy-efficiency. Industries have
completed numerous improvements in cement plant in preheaters and kilns. Initiatives
like upgradation in feeding systems for alternative fuel, waste heat recovery from
cement kiln, installation of energy-efficient blowers in kiln and coal feeding systems,
heating raw meal at the pre-mixing stage of fuel with improved heat transfer which has
also reduced Nox. Other modifications are also being undertaken to increases Specific
Energy Consumption. The main improvements done are the installation of high-
efficiency fans and Variable frequency drives (VFD), undertaking grinding by use high-
pressure grinding rollers in the place of vertical roller mills for cement crushing.
In Cement manufacturing, emission has been lowered by using alternative fuels
resources like biomass or municipal waste in place of coal. Use of alternative fuels and
raw material have reduced the demand for fossil fuels like coal and pet coke
requirement for cement production. Alternative fuels are also adding value by reducing
CO2 emissions at plant level.
• ISO 50001/SS 564 management system certification
• Energy consumption pattern- Direct Energy (fuel) (YOY)
• Energy consumption pattern- Indirect Energy (grid electricity) (YOY)
• Energy consumption pattern for supply chain/ employee commute not under
direct control of company (YOY)
• Company conducts Environment and Energy Audit
• Energy Efficiency Initiatives
Page | 78
• Alternate fuels Usage as a percentage of total energy (YOY)
• Renewable energy usage as a percentage of total energy (in a given year)
• PAT implementation and status
• Renewable purchase obligation status
GHG and other Air Emissions
Cement is produced from a blend of natural minerals - calcium for the most part from
limestone or calcium carbonate, silicon, iron, aluminum and modest quantities of
different input materials. These all-crude materials are warmed in a huge oven called
kiln to over 1500° C to change over the crude materials into clinker. Clinker is the
primary segment in many sorts of cements which is when ground and blended in with
4% to 5% gypsum, it responds with water and solidifies. Organizations have begun
manufacturing mixed cement that consolidate other industrial by products that have
cementitious properties, accordingly decreasing the part of Portland clinker in the
cement which brings about lesser emissions along with replacing clinker with other
materials. These other waste materials like fly ash from the iron and steel industry,
waste from coal stations, and characteristic volcanic materials and so on can be utilized
to substitute clinker in cement, along these lines diminishing the volumes of clinker
utilized.
There has been a gradual uptick in the percentage of blended cements in its cement mix
specially in Indian cement industry. This improvement has significantly influenced the
reductions on energy consumption and CO2 emissions. For reduction of CO2 emission,
the alternative fuels usage and raw materials usage has been proven an important lever
in cement production. Unwanted waste material for society such as end of life tyres
which are discarded, waste oil coming out of other industries which cannot be further
recycled. Sewage sludge and municipal waste has been used in the cement kiln, which
works at quite high temperature with an elongated residence time. It provides an
impactful change which is environment friendly.
There are some other emissions like air emissions and noise arise throughout the cement
manufacturing process. Varieties of other air emissions are also happening from the
process of cement manufacture, including other process stages like the storage and
handling of raw materials which results in emission of particulate matter. Other
emission is also happening such as oxides of nitrogen and other nitrogen compounds,
sulphur dioxide and other sulphur compounds dust, total organic compounds including
volatile organic compounds (VOC), metals and their compounds, hydrogen fluoride,
hydrogen chloride, carbon monoxide (CO) etc. Kiln is the main process which is
responsible for huge while production of cement. The chief ingredients from a cement
kiln escape gas are nitrogen from the ignition air, CO2 from calcination of CaCO3 and
burning of fuel, water vapor from the burning process.
• Company reporting Emissions in CDP/ as per ISO 14064
• Direct Emission Pattern
• Indirect emission pattern
Page | 79
• Emission pattern for supply chain/ employee commute not under direct control
of company
• Commitment to reduce CHG emissions with timelines.
• AAQ -PM, Sox, Nox
• Availability of latest technologies
• emission offset programs
Water Consumption and Conservation
There is a huge pressure on natural water resources with increasing population, growing
industrial and agricultural activities. Pollution and climate change impacts are merging
and resulting in extreme stress on water resources. Across globe, freshwater is
becoming scares and inadequate to feed the population. Approx. seventy percent of
earth’s surface is enclosed with water, out of which only approx. three percent is fresh
water and hardly one percent is usable for humankind since the most of the fresh water
is ice-covered in glaciers and polar ice caps. Water is a scarce resource, and an essential
component for survival of human being. Potable freshwater availability is a critical for
sake of social and environmental factors. Industries and human activities consume huge
quantity of water and also pollute the water bodies. It is need of the hour to reduce both
consumption and wastage of water which is an important aspect of water management
system. The importance of water issue is discussed globally in various international
fora. Majority of the countries have reached to that level where they are facing water
scarcity challenges and have identified as water stressed. Such regions are left with
limited water reserve to feed the population to meet their water demands.
Total water footprint of cement manufacturing is quite less in comparison other sectors.
Cement production needs water at a numeral of phases during the manufacturing
process. It is required for cooling, wet scrubbers, for preparing slurry in the cement
manufacturing with wet process, though the wet process has been phased out with time.
Cement plants which are still on the wet process required huge water for producing per
tonne of cement to feed slurry in the kiln. In the wet process up to 600 litres water is
being consumed for per tonne of clinker production. Now a days the advanced dry
processes have been practiced which is more water efficient and has significantly
reduced in water feeding for cement business.
In cement manufacturing generally, the recycled waste water is being used for cooling
purpose in the process. Wastewater generated in some operations have high pH and
high suspended solids, which is treated in waste water treatment plants and later used
for cooling and horticulture.
• ISO 14001 management system certification
• Fresh water consumption pattern (YOY)
• Ground water resource extraction pattern (YOY)
• Water Metering and management
Page | 80
• Waste Water Treatment and Reuse (reused percentage of fresh water
consumption)
• Water Quality of effluent water
• Zero discharge plants
• Rainwater Harvesting (YOY)
• Ground water recharge
Raw material consumption and recycling
The conservation of natural resources is important part of sustainable business practice.
Companies have started putting more stress on their Research and development
activities to search for cost effective and efficient raw material and alternate fuel.
Replacement of raw materials with the use of wastes in the clinker making has reduced
the huge amount of virgin raw material usage. Such practices have improved the
resource conservation by using alternative fuels and raw materials for the cement
manufacturing. In recent years it has been observed that the availability of alternative
resources has been augmented with various industry by products.
Limestone, petcoke, gypsum, coal, slag and fly ash, iron ore, bauxite, etc. are the key
input material for cement manufacturing. Mostly cement plants in India are located
close vicinity of limestone mines, which helps in reducing the transportation cost as
well as related energy and emissions. The major fuel sourced are coal and petcoke from
domestic market, which also plays an important role in sustainable procurement
practices. Materials transportation is important aspect in material sourcing.
• Use of recycled materials as % recycled material of total Raw material used
• Sustainable procurement Initiatives
Occupational Health and Safety
The cement industry has hazardous manufacturing processes which also involves
number of worker’s at large scale. Due to this reason health and safety is a priority issue
for the cement industry for its stakeholders like employees, contractors and those who
are living in plant vicinity. During various processes exposure happens to cement dust
and working near high temperatures areas like kiln and other which can cause contact
with allergic materials etc. can be demarcated as hazards linked with health. Under
Safety potential hazards are falling objects, working near hot surface causing burns,
working at height, slip/trips/falls and transportation accidents can be defined as hazards
associated with workers safety. Ensuring a health and safety culture in workplaces is a
critical aspect for sustainability. For Sustainable health and safety practices it is
required to carry out risk assessment regularly and efficiently.
Page | 81
Occupational Health
• OHSAS 18001 management system Certification
• Health and wellness programs in 1 year
• Health and safety programs- Hygiene, ergonomics
Workplace Safety
Trade union representatives are determined to strengthen their focus on OHS issues, to
form and improve OHS committees, strengthen the capacity of union members, involve
workers in OHS training. In recent times, almost all fatal accidents in the Indian cement
industry have involved workers. Road accidents are also a key reason of numbers of
fatalities in the cement industry. In cement manufacturing a large number of
occupational illnesses including musculoskeletal, respiratory, skin and circulatory
diseases, are often not even recognized as occupational diseases, resulting in a lack of
appropriate medical treatment and compensation for victims. Union representatives
continually working to enhance the union representation and regularization of workers.
They are committed to put more effort into organizing and supporting to workers and
improving participation of women and youth worker in EHS committees.
If safety performance of other sectors of manufacturing industry done with cement
industry, it shows that the cement industry is lagging behind. It is high time for cement
industry to raise safety bars urgently to ensure a sustainable industry model that fulfills
the social and employment potentials. With the development of upgraded work
practices and its intrinsic risks, it has resulted in critical requirement of raising
awareness, sharing information, providing safety trainings to workers and motivate
them to adopt and follow health and safety procedures at work.
• Frequency Rate (FR) – Number of recordable incidents per 1 million man-hours
worked divided by year, should be less than the national average
• Severity rate (SR) – Number of man days lost per 1million man-hours worked/
divided by year, should be less than the national average
• Loss time injury rate
• Program on Behavior based safety
• EHS Trainings
• Safe work place initiatives to boost employee morale
• EHS committee and meetings
Social Environment Health and Safety
For Social aspects which are linked to EHS includes following actions - alleviation of
extreme hunger and poverty, decrease in child mortality and mental health
enhancement, positive events for education, vocational skill training programs for
Page | 82
women empowerment and gender balance. Investing on the initiatives like eradication
of malaria disease, spread awareness on HIV infection, AIDS, and other diseases etc.
which would be considered for CSR under the health care and hygiene. Projects which
are associated to sustainability of our natural environment have also been considered as
CSR which may comprise ecological equilibrium, natural resource preservation,
safeguarding flora and fauna, animal welfare, promoting agroforestry along with
maintaining good ambient air quality, safe water and fertile soil. In addition to the
aforesaid activities, the development and safety of national heritage, backing sports and
contribution for Prime Minister's National Relief Fund or other development program
for socio-economic upliftment by the governments which are concentrating on
procedures for reducing social and economic disparities in vulnerable groups.
• Community project - Water conservation, forestry and basic amenities
• Community project-Green Belt development
• Community Healthcare
5.3 Defining sustainable practices scenarios
Now a days at company level Enterprise risk management (ERM) has been frequently
been used for issues identification which are significant from business perspective.
Although when it is about EHS still companies are currently using aspect Impact
assessment (AIA) and Hazard identification and risk assessment (HIRA) for key EHS
issues identification. Usually, AIA and HIRA are done at plant level and the actions are
taken on identified opportunities and significant issues, where actions are taken for
improvements. Targets taken under the identified issues are not prioritized and
benchmarked with industry practices and also not assessed for sustainable performance.
The study has attempted to identify the scenarios for sustainable practices basis the
performance of the selected companies. (Refer Appendix VI)
Environment:
Energy Consumption and Conservation:
• ISO 50001/SS 564 management system certification- Status of certification of
plants for energy management system
• Energy consumption pattern- Direct Energy (fuel) (YOY)- Specific direct
energy consumption should show decreasing trend year on year with respect to
industry standard
• Energy consumption pattern- Indirect Energy (grid electricity) (YOY)- Specific
indirect energy consumption should show decreasing trend year on year with
respect to industry standard
Page | 83
• Energy consumption pattern for supply chain/ employee commute not under
direct control of company (YOY)- Pattern of energy consumption under scope
3 which talk about employee commuting and logistics and supply chain carbon
footprint. Footprinting should show decreasing trend year on year with respect
to industry standard.
• Company conducts Environment and Energy Audit- status of energy audits
undertaken by company to understand the opportunities for energy
conservation.
• Energy Efficiency Initiatives- Results of energy efficiency projects in terms of
energy conservation
• Alternate fuels Usage as a percentage of total energy (YOY)- Pattern of
Alternate fuel usage with respect to best industry practice
• Renewable energy usage as a percentage of total energy (in a given year)-
percentage of energy consumed from renewable resource with respect to
industry practice
• PAT implementation and status- Results of PAT with respect to industry
performance
• Renewable purchase obligation status- Results of RPO with respect to industry
performance
GHG and other Air Emissions
• Company reporting Emissions in CDP/ as per ISO 14064- Reporting status to
CDP
• Direct Emission Pattern- Specific direct emission reduction should show
decreasing trend year on year with respect to industry standard
• Indirect emission pattern- Specific indirect emission reduction should show
decreasing trend year on year with respect to industry standard
• Emission pattern for supply chain/ employee commute not under direct control
of company- Pattern of emission reduction under scope 3 which talk about
employee commuting and logistics and supply chain
• Commitment to reduce CHG emissions with timelines. - targets achieved for
emission reduction
• AAQ -PM, Sox, Nox- permissible limits and results achieved with respect to
legal mandates and beyond.
• Availability of latest technologies- investment on latest technology for emission
reduction
• emission offset programs- Status of emission offset projects and results with
respect to industry practice.
Page | 84
Water Consumption and Conservation
• ISO 14001 management system certification- Status of certification of plants
for environment management system and Fresh water consumption pattern
(YOY) specific water reduction
• Ground water resource extraction pattern (YOY)- specific water reduction with
respect to industry practices
• Water Metering and management- Initiatives undertaken for water management
and results achieved in water savings
• Waste Water Treatment and Reuse (reused percentage of fresh water
consumption)- Percentage of water recycling and reuse with respect to industry
practice.
• Water Quality of effluent water- permissible limits and results achieved with
respect to legal mandates and beyond.
• Zero discharge plants- Status and results in actual
• Rainwater Harvesting (YOY)- To understand the potential with respect to
industry practices basis projects undertaken internally and externally.
• Ground water recharge- Yearly water recharge basis location of plant and
potential.
Raw material consumption and recycling
• Use of recycled materials as a percentage of total Raw material used- percentage
of use of recycled material
• Sustainable procurement Initiatives- various initiatives undertaken for
sustainable procurement and green supply chain basis best industry practices
Occupational Health and Safety
Occupational Health
• OHSAS 18001 management system Certification Status of certification of
plants for Occupational health and safety management system and Fresh water
consumption pattern (YOY) specific water reduction
• Health and wellness programs in 1 year- No and type of programs undertaken
and its impact on LTIFR
• Health and safety programs- Hygiene, ergonomics- No and type of programs
undertaken
Page | 85
Workplace Safety
• Frequency Rate (FR) – Number of recordable incidents per 1 million man-hours
worked divided by year, should be less than the national average- impact of
programs undertaken and LTIFR
• Severity rate (SR) – Number of man days lost per 1million man-hours worked
divided by year, should be less than the national average- impact of programs
undertaken and SR
• Loss time injury rate- Year on year performance
• Program on Behavior based safety- Status of BBS incorporation in safety
systems
• EHS Trainings- Year on year training on EHS and impact on incident numbers
• Safe work place initiatives to boost employee morale- Initiatives undertaken
which are inclusive in nature and affects employee engagement
• EHS committee and meetings- Status of committee meetings and its
effectiveness
Social Environment Health and Safety
Cement manufacturing have significant impressions on the natural environment and
nearby communities in plant vicinity. Limestone mines which are operated for years
more than five decades are long-lasting resources. Throughout the lifecycle of
production of cement creates impact on environment, counting dust, noise and other
aspects, must be accurately managed. The soil removal for mining activities and
fluctuations done in landscape can have influences on local ecologies and water tables.
• Community project - Water conservation, forestry and basic amenities- No. and
type of programs undertaken and investment done
• Community project-Green Belt development- No. and type of programs undertaken
and investment done
• Community Healthcare- No. and type of programs undertaken and investment done
5.4 Developing a Sustainability Index
5.4.1 Prioritizing EHS indicators and sub indicators for defining Sustainability
maturity Level
While making a well-integrated system for EHS and sustainability, it is foremost step
to prioritize issues basis sustainability focus criteria performance benchmark. It enables
the system to prioritize the issues and setting up targets for sustainable development.
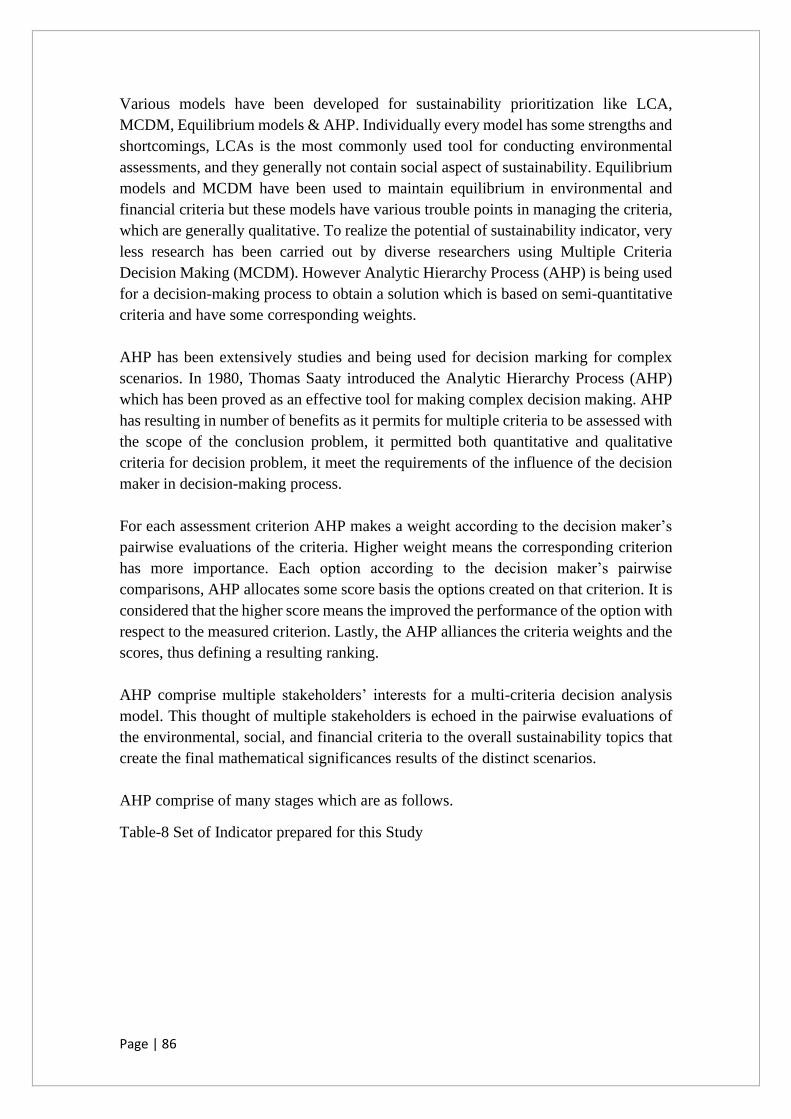
Page | 86
Various models have been developed for sustainability prioritization like LCA,
MCDM, Equilibrium models & AHP. Individually every model has some strengths and
shortcomings, LCAs is the most commonly used tool for conducting environmental
assessments, and they generally not contain social aspect of sustainability. Equilibrium
models and MCDM have been used to maintain equilibrium in environmental and
financial criteria but these models have various trouble points in managing the criteria,
which are generally qualitative. To realize the potential of sustainability indicator, very
less research has been carried out by diverse researchers using Multiple Criteria
Decision Making (MCDM). However Analytic Hierarchy Process (AHP) is being used
for a decision-making process to obtain a solution which is based on semi-quantitative
criteria and have some corresponding weights.
AHP has been extensively studies and being used for decision marking for complex
scenarios. In 1980, Thomas Saaty introduced the Analytic Hierarchy Process (AHP)
which has been proved as an effective tool for making complex decision making. AHP
has resulting in number of benefits as it permits for multiple criteria to be assessed with
the scope of the conclusion problem, it permitted both quantitative and qualitative
criteria for decision problem, it meet the requirements of the influence of the decision
maker in decision-making process.
For each assessment criterion AHP makes a weight according to the decision maker’s
pairwise evaluations of the criteria. Higher weight means the corresponding criterion
has more importance. Each option according to the decision maker’s pairwise
comparisons, AHP allocates some score basis the options created on that criterion. It is
considered that the higher score means the improved the performance of the option with
respect to the measured criterion. Lastly, the AHP alliances the criteria weights and the
scores, thus defining a resulting ranking.
AHP comprise multiple stakeholders’ interests for a multi-criteria decision analysis
model. This thought of multiple stakeholders is echoed in the pairwise evaluations of
the environmental, social, and financial criteria to the overall sustainability topics that
create the final mathematical significances results of the distinct scenarios.
AHP comprise of many stages which are as follows.
Table-8 Set of Indicator prepared for this Study
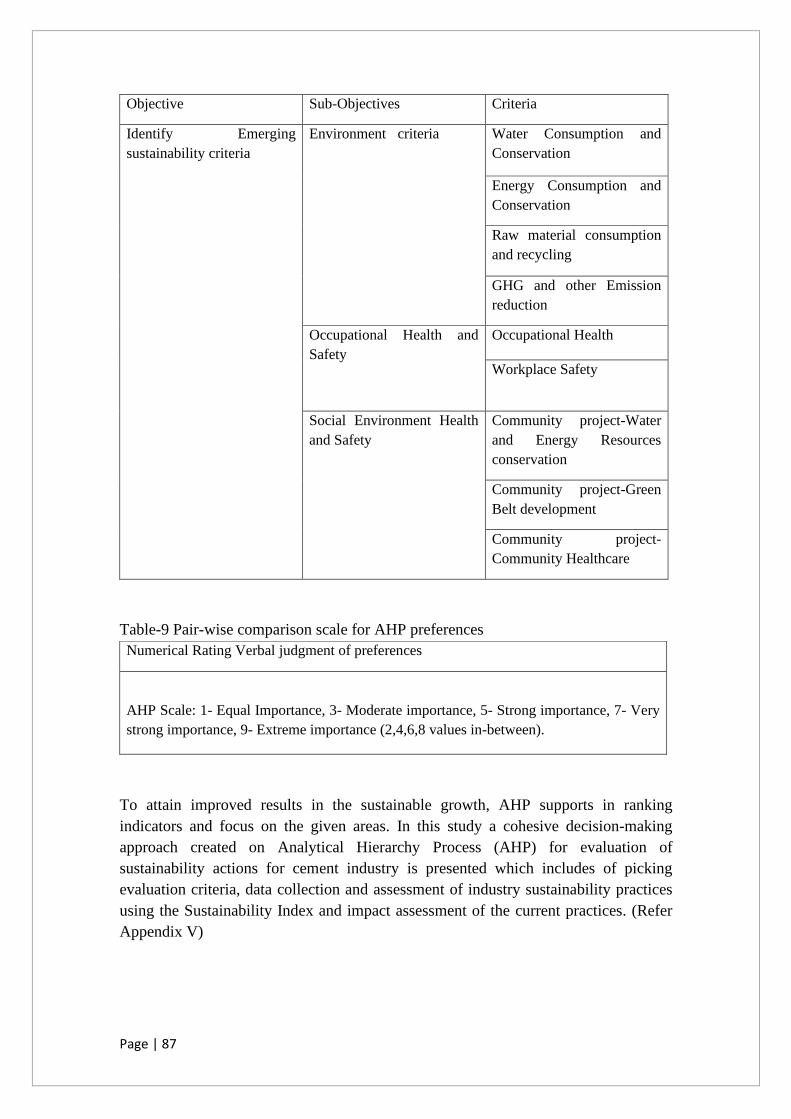
Page | 87
Table-9 Pair-wise comparison scale for AHP preferences
To attain improved results in the sustainable growth, AHP supports in ranking
indicators and focus on the given areas. In this study a cohesive decision-making
approach created on Analytical Hierarchy Process (AHP) for evaluation of
sustainability actions for cement industry is presented which includes of picking
evaluation criteria, data collection and assessment of industry sustainability practices
using the Sustainability Index and impact assessment of the current practices. (Refer
Appendix V)
Objective Sub-Objectives Criteria
Identify Emerging
sustainability criteria
Environment criteria Water Consumption and
Conservation
Energy Consumption and
Conservation
Raw material consumption
and recycling
GHG and other Emission
reduction
Occupational Health and
Safety
Occupational Health
Workplace Safety
Social Environment Health
and Safety
Community project-Water
and Energy Resources
conservation
Community project-Green
Belt development
Community project-
Community Healthcare
Numerical Rating Verbal judgment of preferences
AHP Scale: 1- Equal Importance, 3- Moderate importance, 5- Strong importance, 7- Very
strong importance, 9- Extreme importance (2,4,6,8 values in-between).
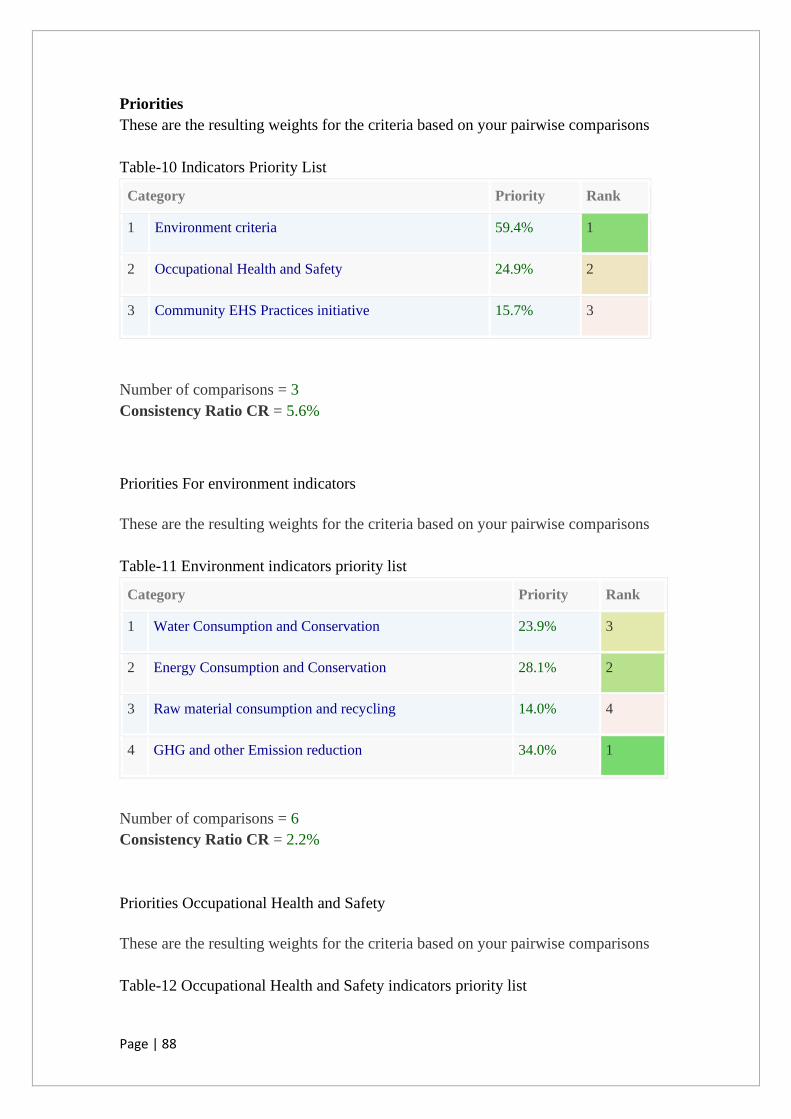
Page | 88
Priorities
These are the resulting weights for the criteria based on your pairwise comparisons
Table-10 Indicators Priority List
Number of comparisons = 3
Consistency Ratio CR = 5.6%
Priorities For environment indicators
These are the resulting weights for the criteria based on your pairwise comparisons
Table-11 Environment indicators priority list
Number of comparisons = 6
Consistency Ratio CR = 2.2%
Priorities Occupational Health and Safety
These are the resulting weights for the criteria based on your pairwise comparisons
Table-12 Occupational Health and Safety indicators priority list
Category Priority Rank
1 Environment criteria 59.4% 1
2 Occupational Health and Safety 24.9% 2
3 Community EHS Practices initiative 15.7% 3
Category Priority Rank
1 Water Consumption and Conservation 23.9% 3
2 Energy Consumption and Conservation 28.1% 2
3 Raw material consumption and recycling 14.0% 4
4 GHG and other Emission reduction 34.0% 1
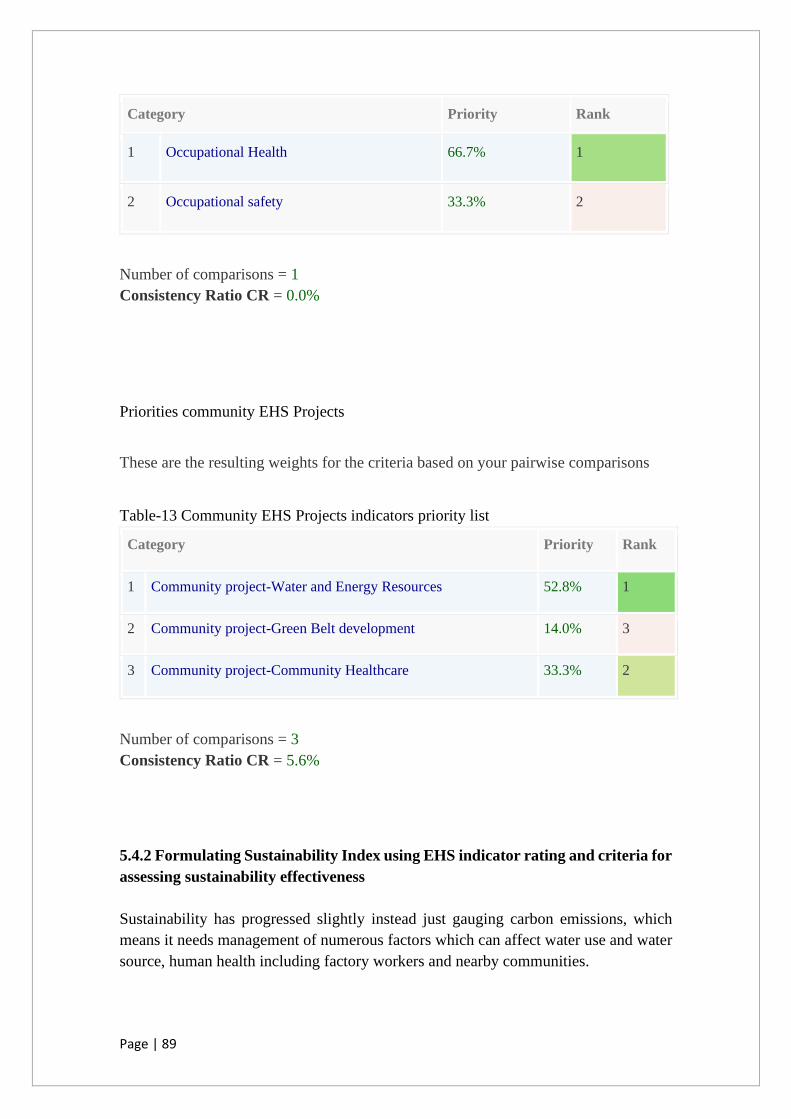
Page | 89
Number of comparisons = 1
Consistency Ratio CR = 0.0%
Priorities community EHS Projects
These are the resulting weights for the criteria based on your pairwise comparisons
Table-13 Community EHS Projects indicators priority list
Number of comparisons = 3
Consistency Ratio CR = 5.6%
5.4.2 Formulating Sustainability Index using EHS indicator rating and criteria for
assessing sustainability effectiveness
Sustainability has progressed slightly instead just gauging carbon emissions, which
means it needs management of numerous factors which can affect water use and water
source, human health including factory workers and nearby communities.
Category Priority Rank
1 Occupational Health 66.7% 1
2 Occupational safety 33.3% 2
Category Priority Rank
1 Community project-Water and Energy Resources 52.8% 1
2 Community project-Green Belt development 14.0% 3
3 Community project-Community Healthcare 33.3% 2

Page | 90
Companies sustainability performance in line with social, environmental and economic
responsibilities can then be plotted to quantify their sustainability effectiveness and
recognize areas of development.
With time sustainability concept has become important and companies need to monitor,
track and compare their actions to progress their sustainable practices year on year.
Sustainability Index is a valuable tool for decision-making process that supports the
company to become constantly sustainable. Though process behind a sustainability
index is to combined the comparative information about the sustainability aspects of
several decisions, strategies, and methods, and then offer an easy-to-understand
“grading” system to swiftly determine the most sustainable choices. It is a modified
sustainability index which will benefit to offer a platform for assessing decisions that
will upsurge the sustainable value of the organization based on EHS performance.
In the given EHS Sustainability index rating methodology is based on cement
production impacts on environment health and safety, performance trend and
information transparency. Globally accepted sustainability scenarios are identified
which are used to define the sustainability performance. The research has mapped the
EHS indicators that are considered in the sustainability scoring.
Rating system counts the performance in terms of specific consumption of resources
per unit of production that are categorized as high sustainability performance, moderate
performance and evolving sustainable performance. An example of evolving
sustainable performance is a higher specific consumption than the current Indian
industry standard while a high sustainability performance is lesser or equal to specific
consumption than the current Indian industry standard. Other information is also factor
in additional such as year on year performance and available information on adoption
of advanced measures for improvement to assign the indicator ratings. Some of the
ratings are done basis qualitative criteria especially for social indicators.
The objective is to develop the Sustainability index focusing on EHS measures
available to assess company's sustainability performance that will help the company to
understand how the company’s sustainability efforts are aligned to sustainable business
requirements.
5.4.3 Validation of the effectiveness of developed sustainability index
To check the effectiveness of the sustainability index, it was introduced in the company
in line with the requirement of ISO 14001:2015. The revised version of environment
management system talks about inclusion of stakeholder engagement and
sustainability. The index was developed for integration of EHS and sustainability
concept for sustainable business. The issues identified by ISO and OHSAS were lacking
in the stakeholder engagement and sustainability incorporation in the system. The
identified issue from ISO and OHAS were mapped on index and the stakeholder
Page | 91
engagement was done to prioritize the issues and Peer benchmark was also used as an
element for assessing the sustainable performance for the identified issues.
Considering the requirement of ISO 14001:2015, it was used for ISO transition from
2006 version to 2015 version. It was found well in structured manner for including
stakeholder engagement and sustainability. The index was tested for one of the sample
company and the identified issues were prioritized and target was taken accordingly
which resulted in improved performance trend.
The developed index has been provided in the tables below to which was used by the
companies for validation.
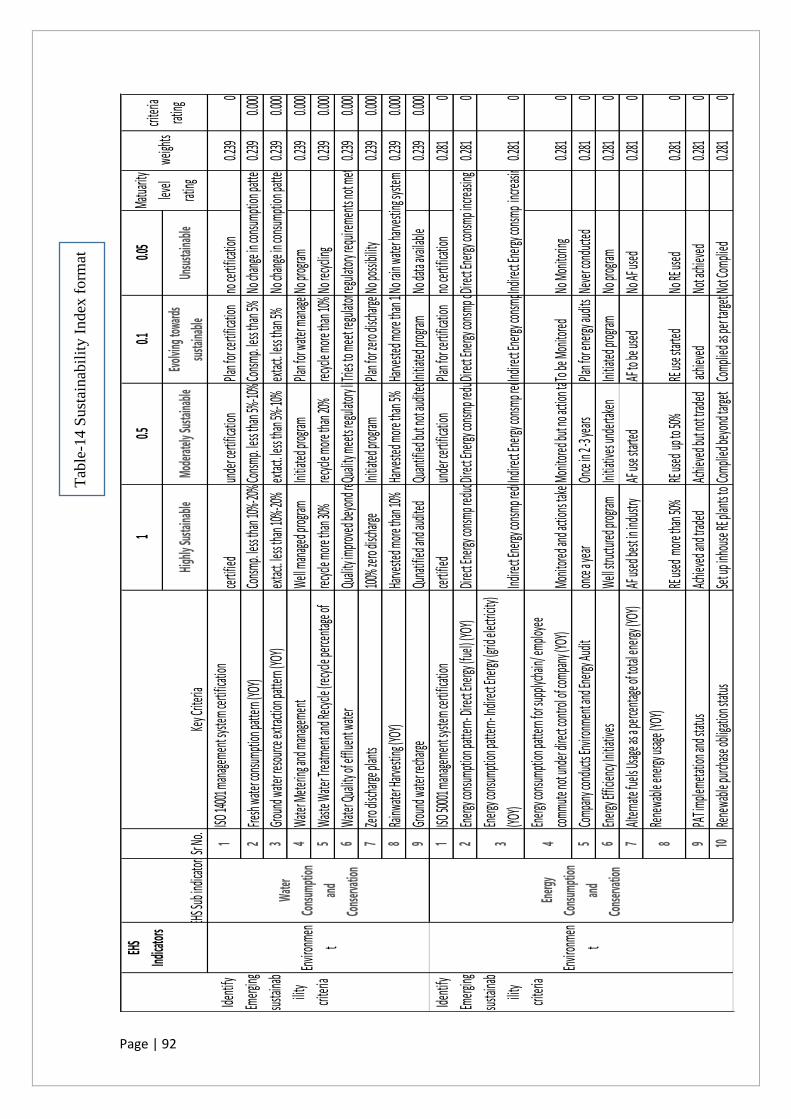
Page | 92
10.5
0.10.0
5
High
ly Su
stain
able
Mod
erat
ely Su
stain
able
Evol
ving
towa
rds
susta
inab
leUn
susta
inab
le
1ISO
14001
man
ageme
nt sys
tem ce
rtifica
tion
certifi
edun
der ce
rtifica
tion
Plan f
or cer
tificat
ionno
certif
icatio
n 0.2
390
2Fre
sh wa
ter co
nsump
tion p
attern
(YOY
)Co
nsmp.
less th
an 10
%-20%
Consm
p. les
s than
5%-10
% Con
smp.
less th
an 5%
No c
hang
e in c
onsum
ption
patte
rn0.2
390.0
00
3Gro
und w
ater re
source
extra
ction
patte
rn (YO
Y)ex
tact. l
ess th
an 10
%-20%
ex
tact. l
ess th
an 5%
-10%
extac
t. less
than
5%
No ch
ange
in co
nsump
tion p
attern
0.239
0.000
4Wa
ter M
eterin
g and
man
ageme
nt We
ll man
aged p
rogram
Initia
ted pr
ogram
Plan f
or wa
ter m
anage
ment
No pr
ogram
0.239
0.000
5Wa
ste W
ater T
reatm
ent a
nd Re
cycle
(recyc
le pe
rcenta
ge of
rec
ycle m
ore th
an 30
%rec
ycle m
ore th
an 20
%rec
ycle m
ore th
an 10
%No
recyc
ling
0.239
0.000
6Wa
ter Qu
ality
of eff
luent
water
Quali
ty im
prove
d bey
ond r
egula
tory li
mits
Quali
ty me
ets re
gulat
ory lim
itsTries
to me
et reg
ulator
y limi
ts reg
ulator
y req
uirem
ents n
ot me
t0.2
390.0
00
7Ze
ro dis
charge
plan
ts100
% zero
disch
arge
Initia
ted pr
ogram
Plan f
or zer
o disc
harge
No po
ssibil
ity0.2
390.0
00
8Ra
inwate
r Harv
esting
(YOY
)Ha
rveste
d more
than
10%
Harve
sted m
ore th
an 5%
Harve
sted m
ore th
an 1%N
o rain
water
harve
sting
syste
m in
place
0.239
0.000
9Gro
und w
ater re
charge
Quna
tified
and a
udite
dQu
antifi
ed bu
t not
audit
edIni
tiated
prog
ram
No da
ta ava
ilable
0.239
0.000
1ISO
50001
man
ageme
nt sys
tem ce
rtifica
tion
certifi
edun
der ce
rtifica
tion
Plan f
or cer
tificat
ionno
certif
icatio
n 0.2
810
2En
ergy c
onsum
ption
patte
rn- Di
rect E
nergy
(fuel)
(YOY
)Dir
ect En
ergy c
onsm
p red
uced m
ore th
an 5%
Direct
Energ
y con
smp r
educe
d more
than
2%Dir
ect En
ergy c
onsm
p con
sistan
tDir
ect En
ergy c
onsm
p incr
easin
g 0.2
810
3En
ergy c
onsum
ption
patte
rn- In
direct
Energ
y (gri
d elec
tricity
)
(YOY)
Indire
ct Ene
rgy co
nsmp r
educe
d more
than
10%
Indire
ct Ene
rgy co
nsmp r
educe
d more
than
5%Ind
irect E
nergy
consm
p con
sistan
tInd
irect E
nergy
consm
p incr
easin
g0.28
10
4En
ergy c
onsum
ption
patte
rn for
supp
lycha
in/ em
ploye
e
commu
te no
t und
er dir
ect co
ntrol
of com
pany
(YOY
)Mo
nitore
d and
actio
ns tak
enMon
itored
but n
o acti
on ta
kenTo be
Mon
itored
No M
onito
ring
0.281
0
5Co
mpan
y con
ducts
Envir
onme
nt an
d Ene
rgy Au
dit
once
a yea
rOn
ce in
2 -3 y
ears
Plan f
or en
ergy a
udits
Neve
r cond
ucted
0.281
0
6En
ergy E
fficien
cy Ini
tiativ
esWe
ll stru
ctured
prog
ramIni
tiativ
es un
derta
ken
Initia
ted pr
ogram
No pr
ogram
0.281
0
7Alt
ernate
fuels
Usage
as a p
ercen
tage o
f total
energ
y (YO
Y)AF
used
best i
n ind
ustry
AF us
e star
tedAF
to be
used
No
AF us
ed
0.281
0
8Re
newa
ble en
ergy u
sage (
YOY)
RE us
ed m
ore th
an 50
% RE
used
up to
50%
RE us
e star
tedNo
RE us
ed0.2
810
9PA
T imple
metat
ion an
d stat
usAc
hieve
d and
trade
dAc
hieve
d but
not tr
aded
achie
ved
Not a
chiev
ed0.2
810
10Re
newa
ble pu
rchase
oblig
ation
status
Set u
p inh
ouse
RE pl
ants t
o achi
eve t
argets
Comp
lied b
eyon
d targ
etCo
mplie
d as p
er tar
getN
ot Co
mplie
d0.2
810
Matua
rity
level
rating
Sr No
.
EHS
Indica
tors EH
S Sub
indic
ators
Key C
riteria
Ener
gy
Cons
umpt
ion
and
Cons
erva
tion
Wat
er
Cons
umpt
ion
and
Cons
erva
tion
weigh
tscri
teria
rating
Envir
onme
n
t
Envir
onme
n
t
Identi
fy
Emerg
ing
sustai
nab
ility
criter
ia
Identi
fy
Emerg
ing
sustai
nab
ility
criter
ia
Tab
le-1
4 S
ust
ainab
ilit
y I
ndex
form
at

Page | 93
1Use
of rec
ycled
mater
ials (p
ercent
age YO
Y)
Recyle
d mat.
used m
ore tha
n 50%
Rec
yled m
at. use
d up to
50% Rec
yled m
at. use
starte
dNo rec
ycling
0.1
40
2Sus
tainabl
e proc
ureme
nt Init
iatives
Well m
anaged
progra
m valid
ated b
y third
party
sustaib
ale pro
curem
ent is p
art of
sourcin
g proc
essInit
iated p
rogram
No pro
gram
0.14
0
1Com
pany re
portin
g Emis
sions
in CDP
/ as pe
r ISO 1
4064
Disclo
sed wi
th A rat
ingDis
closed
with l
ess tha
n A rat
ingDisclo
sed wi
thout r
atingsNo
disclo
sure
0.34
0
2Dir
ect Em
ission
Patter
nDir
ect Em
ission
reduce
d more
than 5
%Dir
ect Em
ission
reduce
d more
than 2
%Dir
ect Em
ission
consist
antDirect
Emissi
on inc
reasin
g0.3
40
3Ind
irect e
missio
n patt
ernInd
irect E
missio
n reduc
ed mo
re than
10%
Indire
ct Emis
sion re
duced
more t
han 5%
Indire
ct Emis
sion c
onsista
ntIndire
ct Emis
sion in
creasi
ng0.3
40
4Em
ission
patter
n for su
pplych
ain/ e
mploy
ee com
mute n
ot
under d
irect c
ontrol
of com
pany
usage
>25%
10-25%
0%-10
%0%
0.34
0
5Com
mitme
nt to re
duce G
HG em
issions
with t
imeline
s.Mo
nitore
d and
audite
d Mo
nitore
d inhou
seTo
be Mo
nitore
dNo
Monit
oring
0.34
0
6AA
Q -PM
, Sox, N
oxAA
Q imp
roved
beyond
regula
tory li
mits
AAQ m
eets re
gulato
ry limi
tsTries
to meet
AAQ r
egulato
ry limi
ts not
meeti
ng reg
ulator
ty requ
ireme
nts0.34
0
7Ava
ilabilit
y of la
test te
chnolo
gies
State o
f Art t
echnol
ogy ad
optedtec
hnolog
y upga
radatio
nin pro
cess
techno
logy u
pgarad
ation to
be do
neno
tech. u
pgrada
tion
0.34
0
8em
ission
offset
progra
msWe
ll stru
ctured
progra
m and
audite
d by th
ird pa
rtyem
ission
offset
progra
m in p
rogres
sInit
iated p
rogram
No pro
gram
0.34
0
1OH
SAS 18
001 ma
nagem
ent sys
tem Ce
rtifica
tion
certifi
edund
er cert
ificatio
nPla
n for ce
rtifica
tion
no cer
tificat
ion
0.667
0
2He
alth an
d welln
ess pro
grams
in 1 y
ear1 o
r more
progra
m per m
onth1 o
r more
progra
m per q
tr1 p
rogram
per Si
x Mont
h/ yea
rNo
progra
m0.6
670
3He
alth an
d safe
ty prog
rams- H
ygiene
, ergon
omics
1 or m
ore pro
gram p
er mont
h1 or m
ore pro
gram p
er qtr
1 prog
ram pe
r Six M
onth/
year
No pro
gram
0.667
0
1
Freque
ncy Ra
te (FR)
– Num
ber of
record
able in
cident
s per 1
million
man-h
ours w
orked/
year (l
ess tha
n thein
dustry
averag
e)
Zero F
RFR
above
25% of
the ind
ustrial
avera
geFR
above
50% of
the ind
ustrial
avera
gehig
hest in
indust
ry0.3
330
2Los
s time
injury
zero fa
tal inc
ident i
n last t
wo ye
arsMin
or Inci
dent bu
t no fat
al inci
dent in
last tw
o year
sMin
or inci
dent an
d sign
ificant
first a
id case
s but n
o fatal
incide
nt in la
st 2 ye
arsfat
al inci
dent la
st two
years
0.333
0
3Pro
gram o
n Beha
viour b
ased s
afety
1 or m
ore pro
gram p
er mont
h1 or m
ore pro
gram p
er qtr
1 prog
ram pe
r Six M
onth/
year
No pro
gram i
nitiate
d yet
0.333
0
4EHS
Trainin
gs1 o
r more
progra
m per m
onth1 o
r more
progra
m per q
tr1 p
rogram
per Si
x Mont
h/ yea
rNo
progra
m init
iated y
et0.3
330
5Saf
e work
place
inititiv
es to b
oost em
ployee
morale
Well m
anaged
progra
m and
emplo
yee en
gagem
ent ev
ident
progra
m unde
rtaken
but no
tracki
ng don
e to ev
aluate
emplo
yee en
agegm
entInit
iated p
rogram
No pro
gram i
nitiate
d yet
0.333
0
6EHS
comm
ittiee
and me
etings
Forma
l comm
ittee m
eeting
s happ
ening
Inform
al meet
ings h
appeni
ngInitiate
d prog
ramNo
progra
m init
iated y
et0.3
330
Occupa
tiona
l Health
and
Safety
Workp
lace
Safet
y
Occu
patio
nal
Healt
h
Raw
mater
ial
Cons
umpti
on
and r
ecycli
ng
GHG a
nd ot
her
Emiss
ion
reduc
tion
Enviro
nmen
t
Identi
fy
Emerg
ing
sustain
ab
ility
criteri
a
Identi
fy
Emerg
ing
sustain
ab
ility
criteri
a
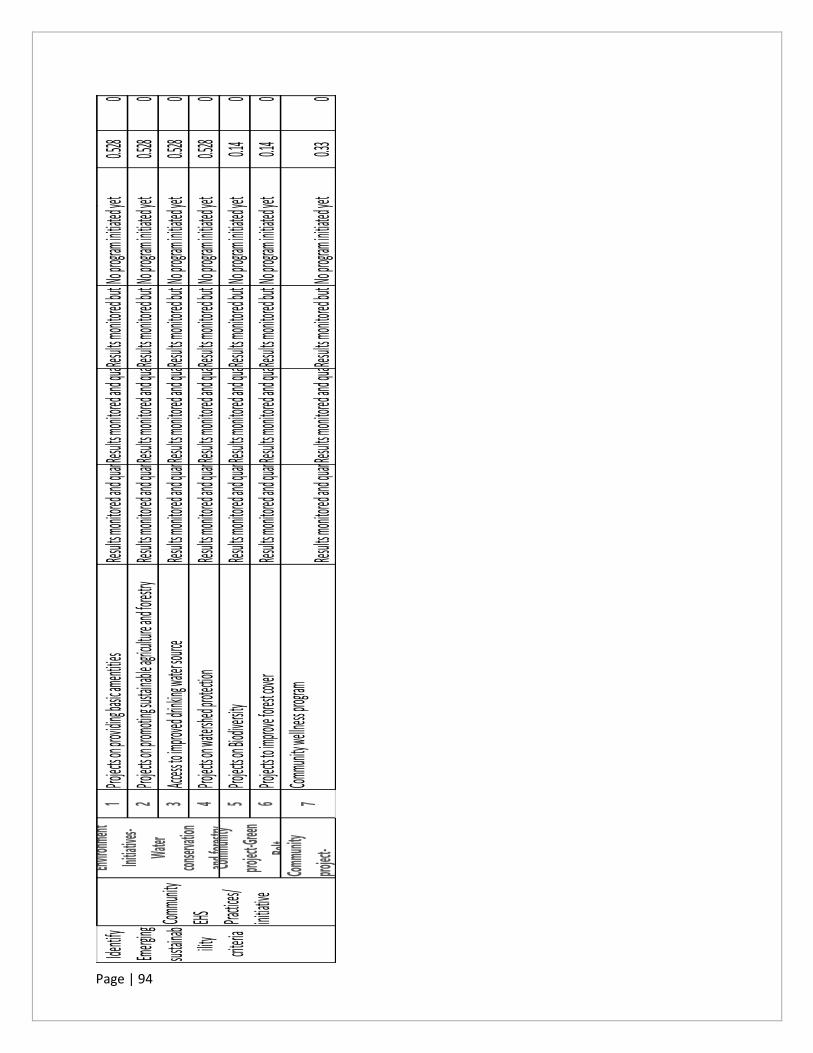
Page | 94
1Pro
jects on
providi
ng basic
ament
ities
Results
monito
red and
quantif
iedResults
monito
red and
quantif
ied but
not aud
itedRes
ults mo
nitored
but not
quantif
ied
No pro
gram init
iated ye
t0.52
80
2Pro
jects on
promo
ting sus
tainable
agricul
ture and
forestr
yRes
ults mo
nitored
and qua
ntifiedRes
ults mo
nitored
and qua
ntified
but not
audited
Results
monito
red but
not qua
ntified
No
program
initiate
d yet
0.528
0
3Acc
ess to i
mprov
ed drink
ing wat
er sour
ceRes
ults mo
nitored
and qua
ntifiedRes
ults mo
nitored
and qua
ntified
but not
audited
Results
monito
red but
not qua
ntified
No
program
initiate
d yet
0.528
0
4Pro
jects on
waters
hed pro
tection
Res
ults mo
nitored
and qua
ntifiedRes
ults mo
nitored
and qua
ntified
but not
audited
Results
monito
red but
not qua
ntified
No
program
initiate
d yet
0.528
0
5Pro
jects on
Biodive
rsity
Results
monito
red and
quantif
iedResults
monito
red and
quantif
ied but
not aud
itedRes
ults mo
nitored
but not
quantif
ied
No pro
gram init
iated ye
t0.14
0
6Pro
jects to
improv
e forest
cover
Results
monito
red and
quantif
iedResults
monito
red and
quantif
ied but
not aud
itedRes
ults mo
nitored
but not
quantif
ied
No pro
gram init
iated ye
t0.14
0Com
munit
y
projec
t-7
Commu
nity we
llness p
rogram
Results
monito
red and
quantif
iedResults
monito
red and
quantif
ied but
not aud
itedRes
ults mo
nitored
but not
quantif
ied
No pro
gram init
iated ye
t0.33
0
Commu
nity
projec
t-Gree
n
Belt
Commu
nity
EHS
Practic
es/
initiati
ve
Enviro
nment
Initiati
ves-
Water
conser
vation
and fo
restry
Identif
y
Emergin
g
sustain
ab
ility
criteria
Page | 95
CHAPTER 6
6. RESULT AND DISCUSSION
Companies have started advancing towards Sustainability and adopting sustainable practices.
Companies are attempting to lessen their energy consumption, carbon footprints, water
conservation and total effect on environment. Plants have started adding certified integrated
management programs, including energy management to ISO 50001 along with environmental
management ISO 14001 and OHSAS 18001 safety management programs. It was found that
Cement plants adopting approach towards integrated system with ISO 9001, ISO 14001, OHSAS
18001 and ISO 50001 have resulted in successful improvements on sustainability. Basis the study
done on sample plants selected for this study have been analyzed for their performance basis the
measures adopted and results achieved for better integration of EHS for sustainability. Refer
appendix VII and VIII for details on prioritized and selected indicators and their performance trend
over a year. The performance has been validated basis the audits qualified and management
feedback shared by third party agencies.
6.1 Water Performance analysis
Most of the cement plants in India are situated in dry and arid regions and requires water for
manufacturing processes. So, cement plants have realized the requirements of water management
projects to meet the demand by other sources and reducing ground water or surface water
consumption. Potential of rain water harvesting has been implemented inside the plant and as well
as in nearby communities to restore the ground water reserve and to improve the water availability.
Rainwater harvesting systems have also been installed in business complexes, on the roof of
hospitals, schools and mine and plant offices around manufacturing plants. At plant level
installation of water meters on water withdrawal points, water discharges points and the chief water
feeding points have been done to capture meaningful information about water performance and
hot spots are identified for corrections to make the efficient water use. Reuse, recycling of waste
water and zero discharge approach have been adopted towards water management. Recycling
process wastewater and reducing the consumption of fresh water have been now used as standard
operating procedures at manufacturing plants.
Recycling of waste water, rain water-harvesting, recharging of ground water by constructing
check dams are also some of the typical structures implemented by the cement manufacturing
plants.
6.2 Energy Performance analysis
Companies have three focus areas: Energy efficiency, Waste Heat Recovery and use of renewable
energy. Waste heat recovery (WHR) has been identified as strategic part of all upcoming cement
plants of top cement companies to install all new kilns with a WHR arrangement. In few of cement
Page | 96
kilns are equipped with Waste Heat Recovery (WHR) arrangements. There is acceptable scope in
current dry process of cement manufacturing to produce energy from waste heat. It has been
projected by some researches that one fourth of the energy required by a cement plant can be
supplied by installing WHRS in the current systems.
Under energy efficiency initiatives implemented by cement companies are as follows like use of
alternative fuels such as Carbon Black and Agro Waste. Other operational modifications
&improvements are done to reduce Thermal Energy of Kiln by Installing the Variable Frequency
Drives etc.
Electrical energy also called indirect energy source is presently produced mostly by burning fossil
fuels like coal and oil which is used for manufacturing cement. To reduce the grid energy
consumptions in some percentage, most of the cement companies have started generating power
through solar panels and wind mills, bio mass energy. Wind and solar energy sources cannot be
considered free of carbon as their infra involves some emissions, whereas only biomass fuels are
carbon neutral. Companies are incessantly discovering several possibilities in order to produce
renewable energy. The energy from solar plants is mainly used to provide electricity in townships
established by cement giants. Energy savings achieved by the cement plants has a significant
influence on lessening GHG emissions.
The cement industries are promoting the use of waste as fossil fuels. Number of cement plants
have developed ground-breaking procedures for waste utilization in cement production as an
alternative material such as rice husk, waste tyres chips, crop waste and saw dust as a source of
fuel. One of the cement company has signed an agreement with municipal corporation to set up
waste processing plant which can alter MSW to Refuse Derived Fuel (RDF). This confirms
protection of natural resources and productive usage of industrial waste.
To reduce energy in scope 3 which is transport not owned or controlled by the cement
manufactures are another focus area. Companies have ensured to maximize the source of raw
materials from sites adjoining to cement plants. It is helping in improving the cost and
environmental effect of transportation. For deliveries of clinker to other grinding plants owned or
other, they have started deliveries by truck and railway transport. More focus id given on railways
to make it more efficient.
6.3 Emission Performance analysis
Due to inherent release of significant amount of carbon dioxide to the atmosphere, as CO2 is
released from limestone, the basic raw material of cement during in the process of calcination.
Combustion of fuel fired in the kiln and electricity use for other plant operations are another source
of emission. Blended cements release less CO2 as compared to Ordinary Portland Cement per ton
of cement. The quantum of Co2 release is directly proportional to the quantum of fuel fired and
the quantum of carbon in it, which means to reduce emissions the heat requirement has to be

Page | 97
reduced or to use fuels with less carbon or those that are carbon neutral. Alternate fuels have been
found to be used successfully in kilns. There are great opportunities available for using wastes of
other industries and agriculture waste that have some calorific value which can be used as
secondary fuels in kilns. Municipal and industrial waste as substitutes for coal as well as using
materials being waste from other industries (fly ash, slag, rea-gypsum, etc.) to substitute for natural
materials.
There are some technological changes required like certain modifications and additions in the
existing fuel preparation and firing systems in order to use secondary fuels along with basic fossil
fuels. It also requires capital investment for technological change, which need careful planning
and top management approvals.
So, more focus is given to number of other key initiatives like- reducing the clinker-to-cement
ratio. Governments can encourage investment and innovation through RD&D funding and by
adopting mandatory CO2 emissions reduction policies.
Process optimization can bring down power consumed per ton of cement which in turn it will also
reduce the Co2 emission as well as Particulate matters. manufactured and it also reduce
consumption of other resources like water, cooling air, compressed air and manpower. In many
Cement plants air pollution control equipment like ESP have been converted to pulse jet type of
bag filter or a hybrid of ESP and bag filter combination to achieve the collection efficiency desired
and also to comply with the emission norms.
There is huge potential in reducing Scope 3 emissions, which are indirect emissions from the
production of purchased materials and fuels (such as clinker) which are used for cement
manufacturing and then Fuel used for transport of finished product to market. Fuel used for
employees for their transportation, transport-related activities in vehicles which are not owned or
controlled by the cement companies, electricity-related activities (e.g., transmission and
distribution losses) which are not covered in Scope 2, outsourced activities, waste disposal, etc.
can also be explored for formulating emission reduction strategies.
6.4 Recycle material Performance analysis
Few Companies are putting more stress on their Research and development activities to search for
cost effective and efficient raw material and alternate fuel. One of the sample company of studies
under this research is using slag and Fly Ash to make superior blended cements. Cement companies
are using fly ash and slurries as substitute for raw material to reduce its carbon footprints as well
its production cost. Cement companies are experimenting with industrial and municipal solid waste
and bio-waste like tyres, plastic, wood chips, rice husk etc.to be used as alternative raw material
in cement manufacturing.
Page | 98
Large volume but low toxicity by-products or wastes are suitable for raw material alternatives.
The following are few examples with the elements that each material contributes to the raw mix:
Blast furnace slag, Bottom ash, Water treatment sludges, fly ash, Foundry sand, Petroleum
contaminated soil, Refractory brick, lignite fly ash, crushed concrete fines etc. These Industrial
wastes have potential for use in building materials as raw materials for clinker production.
6.5 Health and Safety Performance analysis
Safety
Behavior-based safety (BBS) has been evolved as one of the best tools for managing occupational
risks and prevention of workplace injuries which is found not used effectively at cement industry.
The research outcome assesses the efficiency of behavior-based safety implementation in cement
plant. The efficiency of BBS assessed by comparing the accident and first aid cases recorded before
and after implementation of BBS. The result demonstrates that BBS can help in minimizing the
accidents in workplace, especially which happens due to manual interventions and negligence.
BBS can be applied for improving the safety of workers.
Health
It has been resulted that the health and safety related cases in cement manufacturing industry can
be reduced by maintaining safe working conditions and enforcing safety procedures focusing on
training of employee on use of personal protective equipment. Exposure to cement dust can cause
irritation in eyes, nose, throat and the upper respiratory system related disease which can lead to
lung injuries including silicosis and lung cancer. Skin contact may result in cracking of skin to
severe skin. With the support of top management and co-operation of workers as well as active
participation of supervisory staff can help in achieving the positive results. Use of earmuff or ear
plug where the noise level is more than or equal to 90dB (A), ensuring use of disposable coveralls,
ensuring use of face masks or dust masks with instructing and providing training to workers on
proper use of the equipment.
6.6 Community EHS Performance analysis
The result shows that companies took initiative to boost agricultural and horticultural activities to
help farmers to make them achieve a rich harvest from their farms. Training programs were
conducted for farmers to enable them to understand the modern agricultural practices. They were
also helped in soil testing, providing quality seeds etc. and farmers were benefitted by these steps.
Water conservation projects were also undertaken at community level which helped in improving
harvest and developing pasture land area in the community. The projects were implemented to
restore the ecological balance by conserving and developing watershed areas. These diverse agro-
based activities improved soil fertility and reduced soil erosion and helped farmers in providing
sustainable livelihoods. The local drainage system and seasonal nullahs around the mining areas
were examined and check dams and canals were constructed to divert the water to recharge the
local aquifer, which resulted in higher agriculture yield for the villagers. In the CSR reports it was
Page | 99
found that community had given good feedback on the Agri projects. Cement companies are also
keeping the environment green by planting trees and taking up schemes for afforestation in nearby
areas even nearby cities as well.
The formulated index has been adopted under sustainability program at plant level to identify the
gap areas for that particular unit. Base line study has been carried out to identify the current status
of various initiatives undertaken under the purview of environment health and safety including the
social aspects. Basis the indexing priority topics were defined for the selected plants and measures
were planned and executed for the given year and performance monitoring was done to check the
effectiveness and its impact. It has been identified that the improvements have been observed and
been highlighted during audits.
Specifically, environment performance indicators were showing quick results as its qualification
process is quite exhaustive and has also been captured under objective and targets for the
environment management system. Even health and safety has also shown improved performance
in terms of less injuries and recorded occupational health issues over a year in comparison to
historical trend. Though the social aspects were found bit challenging to quantify but intangible
positive changes have been accounted and validated through feedback responses. (Refer appendix
VII and VIII)
This indexing has been used by the plants and has also been qualified as one of the approaches
adopted for stakeholder inclusion under environment health and safety management system new
requirements. The new set of requirements for stakeholder engagement and identification of their
need and expectations have been incorporated while rating the indicators and to arrive the key
material topics for improvements.
Page | 100
CHAPTER 7
7. SUMMARY AND CONCLUSIONS
The researches and various studies have identified that closely connected EHS and sustainability
programs are very helpful. Well integrated program on EHS and sustainability give opportunity of
scrutinize relevant issues which may result in legal implications due to regulatory non
compliances. Hence such programs help in increasing company’s revenue, improving brand image
and also effectively managing business risks. Additionally, it also helps in strategic betterment of
workplace culture which results in raising employee’s morale.
• Earlier no linkage process was available to embed sustainability in EHS management
system.
• It helped in mapping EHS management system improvement areas with sustainability by
using the index.
• It resulted in defining the precise gap in EHS performance against industry performance.
• It can be used in ISO and OHSAS Audits for showcasing the change points in upgraded
version of IS014001:2015 requirements and it was well accepted and found effective.
• Environmental and social metrics are key performance indicators for company’s
sustainability performance. There is a significant linkage between EHS and Sustainability
but still both are drive separately.
• Integration of EHS and sustainability management programs will create comprehensive
and extensive framework for the companies focusing on sustainable development
encompassing social and environment indicators.
• Well integrated program on EHS and sustainability give opportunity of scrutinize relevant
issues which may result in legal implications due to regulatory non compliances.
Environmental and social metrics are key performance indicators for company’s sustainability
performance. There is a significant linkage between EHS and Sustainability but still both are drive
separately. Integration of EHS and sustainability management programs will create comprehensive
and extensive framework for the companies focusing on sustainable development encompassing
social and environment indicators. The evaluation can be done through index which is comprises
of set of indicators that plays major role in decision making for company’s sustainability
performance and future actions. The requirement of linkage between EHS and the sustainable
development is now crystal clear which should be addressed by their integration in the form of
EHS sustainability index.

Page | 101
Using the developed index Sustainability maturity level for two of the sample companies are
assessed and the ratings were given basis their performance and resulted level has been identified.
Table-15
7.1 Main contribution from the research
This research has helped in developing the sustainability index which can be used as key
linkage between Sustainability and EHS management system. As the EHS and sustainability
were practiced separately irrespective of the fact that both are adopted for the same set of
improvements. It can be used in integration of ISO 14001 and OHSAS 18001 with
sustainability for improved and sustainable performance results.
EHS and sustainability were practiced separately irrespective of the fact that both are adopted
for the same set of improvements. In order to address this problem and the sustainability index
developed to assist in linking EHS and sustainability. It worked as missing linkage between
EHS and sustainability. It is helpful in decision making for company’s sustainability
performance and future actions.
EHS Indicator Rating for
sustainabailitySustainability maturity Level
0.05 Unsustainable
0.1 Evolving towards sustainable
0.5 Moderately Sustainable
1 Highly Sustainable
Company-E- Plant-1 0.20 Towards Moderately sustainable
Company-C-Plant-2 0.28 Towards Moderately sustainable
EHS Index for Sustainablity
Sample Cement
Companies
Page | 102
CHAPTER 8
8. SCOPE OF FUTURE WORK
This research scope was kept limited to Cement manufacturing plants and its relevant environment,
health and safety aspects. Though other areas which comes under cradle to grave like Mining,
Supply chain involved in distribution of final product to market, end use and then end of life of
the product, can also be studied to evaluate the focus sustainability indicators for each segment of
this industry. Not only for cement industry but this can be replicated to any kind of industry by
customizing the industry benchmark as per the required industry sector.
Other untouched areas of environment health and safety like Mining aspects, Waste Management,
Noise, Contaminated Land, safety aspects of emergency preparedness and response, disease
prevention, other social EHS indicators can be added for future studies to evaluate the microlevel
of EHS indicators which can bring improvements in overall manufacturing process.
The criteria and scenarios are dynamic in nature which need to be incorporated in existing EHS
management system design. As the cement industries are investing in R& D to explore
opportunities to design green cement plants in future which will be designed to conserve natural
resources of all kinds and that will contribute in possible extent to reduce the release of the
greenhouse gases (GHG) to the atmosphere without compromising on the quality of cement
produced.
Companies are working on Carbon Capture concept which aims at reducing the GHG emissions
by physically collecting CO2 emitted and storing it and making it available to other industries that
have use for it. Green building concept is also a growing criterion for manufacturing plants.
Cement companies are designing and constructing cement plant as per green buildings
requirements to make maximum use of natural light, ventilation, etc.
Now construction and demolition waste has been given focus and greeting more organized than
before. It is also going to add value in cement manufacturing initiatives wherein raw material
replacement can be done by using construction and demolition waste (CDW). The use of such
waste material in cement plants will offer an opportunity for using it as recycled products and
avoids consumption of natural raw materials (limestone, marls and clays) traditionally used for
cement production.
With digitization of world and more user-friendly interphase, E–training for workers and
contractors will become easier than before. After completing training on E platforms, it will be
possible to take test and give certificates. More awareness can be created by such modes to reduce
injury and incidents by upgrading safety skills of workers. Similarly, new studies and researches
will keep happening and can be added in the scenarios to evaluate the need of the hour.
Page | 103
Another aspect for comprehensive coverage environment social and governance indicators can be
added for future studies to enhance the scope of such indexes which can help in achieving the
sustainable development goals. As well as benchmarking and materiality assessment can be
aligned and assessed for integrated approach for sustainability.
Page | 104
REFERENCES
1. Sustainability in the workplace: A new approach for advancing worker safety and health,
OSHA, December 2016
2. Current Practices in Occupational Health & Safety Sustainability Reporting, A Report from
the Center for Safety and Health Sustainability, February 2013
3. Gan, Xiaoyu, et al. "When to use what: Methods for weighting and aggregating
sustainability indicators." Ecological Indicators 81 (2017): 491-502.
4. Mu, Enrique, and Milagros Pereyra-Rojas. "Understanding the analytic Hierarchy
process." Practical Decision Making. Springer, Cham, 2017. 7-22.
5. Cîrstea, Stefan Dragos, et al. "Evaluating Renewable Energy Sustainability by Composite
Index." Sustainability 10.3 (2018): 811.
6. Boulanger, Paul-Marie. "Sustainable development indicators: a scientific challenge, a
democratic issue." SAPI EN. S. Surveys and Perspectives Integrating Environment and
Society 1.1 (2008).
7. Zen, Aurora Carneiro, et al. "Sustainability, energy and development: a proposal of
indicators." International Journal for Infonomics 5.1-2 (2012): 537-541.
8. Molamohamadi, Zohreh, and Napsiah Ismail. "The relationship between occupational
safety, health, and environment, and sustainable development: a review and critique."
International Journal of Innovation, Management and Technology 5.3 (2014): 198.
9. VENKATARAMAN, NARAYANASWAMY, and KANESAN MUTHUSAMY.
"Development of a multidisciplinary approach to compute sustainability index for
manufacturing plants-Singapore perspective." Energy Procedia 143 (2017): 327-335.
10. Popovic, Tamara, et al. "Quantitative indicators for social sustainability assessment of
society and product responsibility aspects in supply chains." Journal of International
Studies Vol 10.4 (2017).
11. Wang, Yu. "The framework of social sustainability for Chinese communities: Revelation
from western experiences." International review for spatial planning and sustainable
development 2.3 (2014): 4-17.
12. Amponsah-Tawiah, Kwesi. "Occupational health and safety and sustainable development
in Ghana." International Journal of Business Administration 4.2 (2013): 74.
13. Jha, Raghbendra, and K. V. Murthy. "A critique of the Environmental Sustainability
Index." (2003).
14. Fortuna, Maria Emiliana, Isabela Maria Simion, and Maria Gavrilescu. "Indicators for
sustainability in industrial systems case study: paper manufacturing." Scientific Study &
Research. Chemistry & Chemical Engineering, Biotechnology, Food Industry 12.4 (2011):
363.
15. Christoph Böhringer and Patrick Jochem, Measuring the Immeasurable: A Survey of
Sustainability Indices, Discussi on Paper No. 06-073

Page | 105
16. Al Hinai, Maryam, and Ruzanna Chitchyan. "Social sustainability indicators for software:
Initial review." (2014).
17. CO2 Accounting and Reporting Standard for the Cement Industry. WBCSD June 2005
18. Lee, Ju Yeon, and Y. Tina Lee. "A framework for a research inventory of sustainability
assessment in manufacturing." Journal of cleaner production 79 (2014): 207-218.
19. Markelj, Jernej, et al. "A simplified method for evaluating building sustainability in the
early design phase for architects." Sustainability 6.12 (2014): 8775-8795.
20. Gautam, R., Singh, A.: Corporate social responsibility practices in India: a study of top 500
companies. Glob. Bus. Manag. Res. Int. J. 2(1), 41–56 (2010)
21. Vani. M, Murlikrishna. P, Corporate Social Responsibility: A Glance at The Practices of
Cement Industry, (2015)
22. Patil, M. R., and Pravin Sawant. "Corporate Social Responsibility, Performance and
Sustainability Reporting of Shree Cement Company in India: A Case Study." (2014)
23. Gautam, Richa, and Anju Singh. "Corporate social responsibility practices in India: A
study of top 500 companies." Global Business and Management Research: An International
Journal 2.1 (2010): 41-56.
24. Agarwal, Supriya. "Corporate Social Responsibility Vs. Corporate Sustainability in India:
A case study on Aditya Birla Group." International Journal for Innovative Research in
Multidisciplinary Field 2.6 (2016): 13.
25. Satish Y. Deodhar India’s Mandatory CSR, Process of Compliance and Channels of
Spending, IIM Ahmedabad, 2015
26. Companies Act Notification, 2014
27. General Circular No. 21/2014, Government of India Mini Proposal of a Sustainable
Circulars try of Corporate Affairs, 2014
28. Office Memorandum, Environment sustainability and CSR related issues guidelines, 2014
29. Technical EIA Guidance Manuals Project for Cement Industry, 2010
30. Annual Reports of Ultratech Cement, Ambuja cement, Shree Cement, ACC, India Cement,
2013-16
31. Handbook on Corporate Social Responsibility in India, CII, 2013
32. Lyon, Thomas P., and John W. Maxwell. "Corporate social responsibility and the
environment: A theoretical perspective." Review of environmental economics and policy
2.2 (2008): 240-260.
33. 14. Shankar, Truptha, and H. Rajashekar. "Impact of the proposed Corporate Social
Responsibility mandate in the new Companies Bill 2012 of India." Asian Journal of
Management 4.4 (2013): 317-324.
34. World Business Council for Sustainable Development (WBCSD) - Cement Sustainability
Initiative – About the cement industry. Online available at:
http://www.wbcsdcement.org/index.php/about-cement) [accessed 07 May 2014].
35. Potgieter Johannes H. An Overview of Cement production: How “green” and sustainable
is the industry? 2012
Page | 106
36. Marlowe Ian and Mansfield David, toward a Sustainable Cement Industry Sub study 10:
Environment, Health & Safety Performance Improvement, December 2002, an
Independent Study Commissioned by WBCSD
37. Pariyar Suman K, Das Tapash, Ferdous Tanima, Environment and Health Impact for Brick
Kilns in Kathmandu Valley, 2013
38. Marchwinska-Wyrwal E., Dziubanek G., Hajo I., Rusin M., Oleksiuk K. and Kubasiak M.,
Impact of Air Pollution on Public Health, (2011).
39. Pollution Prevention and Abatement Handbook 1998 toward Cleaner Production, World
Bank Group, International Finance Corporation, Washington D.C., 1999.
40. Mehraj.S, Bhat G.A., Balkhi. H.M, Cement Factories and Human Health, 2013
41. Sustainable Cement Production, Co-Processing of Alternative Fuels and Raw Materials in
The European Cement Industry Chembureau, 2009
42. Worrell Ernst, Price Lynn, Martin Nathan, Hendriks Chris, and Ozawa Meida Leticia,
Carbon Dioxide Emissions from The Global Cement Industry, 2001
43. Sharma Kuldeep, Treatment of Waste Generated from Cement Industry and Their
Treatment- A Review
44. Madlool N.A., Saidur R, Hossain M.S, Rahim N.A, A critical review on energy use and
savings in the cement industries, 2011
45. Huntzinger Deborah N., D. Eatmon Thomas, A life-cycle assessment of portland cement
manufacturing: comparing the traditional process with alternative technologies, 2008
46. Rai Priyanka, Mishra RM and Parihar Sarita, Quantifying the Cement Air Pollution related
Human Health diseases in Maihar city, MP, India, 2013
47. Bashar M. Al Smadi, Kamel K. Al-Zboon and Khaldoun M. Shatnawi, Assessment of Air
Pollutants Emissions from a Cement Plant: A Case Study in Jordan, 2009
48. Babatunde Saheed Bada1, Kofoworola Amudat Olatunde and Adeola Oluwajana, Air
Quality Assessment in The Vicinity of Cement Company, 2013
49. Hesham G. Ibrahim, Aly Y. Okasha, Mokhtar S. Elatrash and Mohamed A. Al-Meshragi,
Emissions of SO2, NOx and PMs from Cement Plant in Vicinity of Khoms City in
Northwestern Libya, 2012
50. Aribigbola Afolabi*, Fatusin Afolabi Francis and Fagbohunka Adejompo, Assessment of
Health and Environmental Challenges of Cement Factory on Ewekoro Community
Residents, Ogun State, Nigeria, 2012 [18] Pollution Prevention and Abatement Handbook
1998, 1999
51. Process Compatible SO2 Control in Cement Kilns, 2011, Online available at:
http://gcisolutions.com/gcitn0711.html [accessed 13 May 2014].
52. Sayed Horkoss, Reducing the SO2 emission from a Cement kiln, 2008
53. Yousef S. H. Najjar, Gaseous Pollutants Formation and Their Harmful Effects on Health
and Environment, 2011
Page | 107
54. Human Health and environmental effects of emissions from power generation,
Environment protection Agency report, online available at:
http://www.epa.gov/captrade/documents/power.pdf, [accessed 14 May 2014].
55. Available and Emerging Technologies for Reducing Greenhouse Gas Emissions from The
Portland Cement Industry, EPA, 2010
56. Hendrik G. van Oss and Amy C. Padovani, Cement Manufacture and the Environment Part
II: Environmental Challenges and Opportunities, 2003
57. Health Effects of Regulated Air Pollutants from Toxic Waste Burning Cement Kilns,
online available at: http://www.groundwork.org.za/Cement, [accessed 15 May 2014].
58. Mark Z. Jacobson, on the causal link between carbon dioxide and air pollution mortality,
2008
59. Cristian Dincă, Călin-Cristian Cormoş, Horia Necula, Environmental Impact Assessment
of GHG Emissions Generated by Coal Life Cycle and Solutions for Reducing CO2, 2013
60. Cement Manufacturing Enforcement Initiative, Environment protection Agency report,
online available at: http://www2.epa.gov/enforcement/cement-manufacturing-
enforcement-initiative, [accessed 15 May 2014].
61. Manjula R., R. Praveena, Rashmi R. Clevin, C. H. Ghattargi, A. S. Dorle, D. H. Lalitha,
Effects of occupational dust exposure on the health status of portland cement factory
workers, 2014
62. M.A. Darweesh, M.K.El-Sayed, The Effect of Cement Dust Pollution on the Zygophyllum
Coccinum Plant, 2014
63. Environmental Assessment of the Amran Cement Plant, US Agency for International
Development, 2005
64. Syed Sana Mehraj, Bhat, G.A., Henah Mehraj Balkhi, Research Article Comparative Study
of Ambient Air Quality and Health Symptoms Associated with The Population Living in
The Neighborhood of The Cement Industries, 2013.
65. https://www.osha.gov/sites/default/files/2018-12/fy11_sh-22318-
1_Mod_3_ParticipantManual.pdf
66. Matjaž Maletic, Manja Podpečan, Damjan Maletic, (2015) "ISO 14001 in a corporate
sustainability context: a multiple case study approach", Management of Environmental
Quality: An International Journal, Vol. 26 Issue: 6, pp.872-890,
https://doi.org/10.1108/MEQ-08-2014-0129
67. https://advisera.com/14001academy/knowledgebase/environmental-aspect-identification-
and-classification/
68. https://www.westernsydney.edu.au/__data/assets/pdf_file/0020/12917/12917_Hazard_Id
entification,_Risk_Assessment_and_control_Procedure.pdf
69. Bernard Fei-Baffoe, Godsgood K. Botwe-Koomson, Isaac Fimpong Mensa-Bonsu, and
Eric Appiah Agyapong, “Impact of ISO 14001 Environmental Management System on
Key Environmental Performance Indicators of Selected Gold Mining Companies in
Page | 108
Ghana,” Journal of Waste Management, vol. 2013, Article ID 935843, 6 pages, 2013.
https://doi.org/10.1155/2013/935843.
70. Environmental Impact Analysis: A Case Study of Acc Cement Plant Tiwari Jeetendra
Kumar* 1 and Rawani A. M.
71. An Analysis of Environmental Impacts of Various Environmental Aspects for Indian
Manufacturing Industries M.S. Narwal1, Ajit2, Ram Bhool3
72. https://www.ehstoday.com/environment/value-integrating-ehs-and-sustainability-
programs
73. Nawaz, Waqas, and Patrick Linke. "Safety and sustainability nexus: A review and
appraisal." Journal of Cleaner Production (2019).
74. Beekaroo, Dickcha, Devkumar S. Callychurn, and Dinesh Kumar Hurreeram. "Developing
a sustainability index for Mauritian manufacturing companies." Ecological Indicators 96
(2019): 250-257.
75. https://www.nist.gov/topics/sustainable-manufacturing
76. M.Z. Majdalani, A.T. Mehzer, Sustainability in the construction industry: a Lebanese case
study Constr. Innovation, 6 (1) (2006), pp. 33-46
77. Gülçin Büyükozkan, Yagmur Karabulut, Sustainability performance evaluation: Literature
review and future directions, 2018
78. Stella Stoychevaa, Dayton Marcheseb, Cameron Paul, Multi-criteria decision analysis
framework for sustainable manufacturing in automotive industry, 2018
79. Alamo Alexandre da Silva Batista, Antonio Carlos de Francisco, Organizational
Sustainability Practices: A Study of the Firms Listed by the Corporate Sustainability Index,
2018
80. Ilija Djekic, Nada Smigic, Ruzica Glavan, Transportation sustainability index in dairy
industry e Fuzzy logic approach, 2018
81. Susana Garrido Azevedo, Radu Godina and João Carlos de Oliveira Matias, Proposal of a
Sustainable Circular Index for Manufacturing Companies, 2017
82. M.S. Hasan, Z. Ebrahim, W.H. Wan Mahmood3and M.N. Ab Rahman, Sustainable-ERP
System: A Preliminary Study on Sustainability Indicators, 2017
83. Ankur Goyal, Rajat Agrawal, Advanced Manufacturing Management System for
Environmental Sustainability: A Review of Select Literature, 2017
84. Beekaroo, Dickcha, Devkumar S. Callychurn, and Dinesh Kumar Hurreeram, "Developing
a sustainability index for Mauritian manufacturing companies." Ecological Indicators 96,
2019
85. Waqas Nawaz, Patrick Linke, Muammer Koҫ, Safety and sustainability nexus: A review
and appraisal, 2019
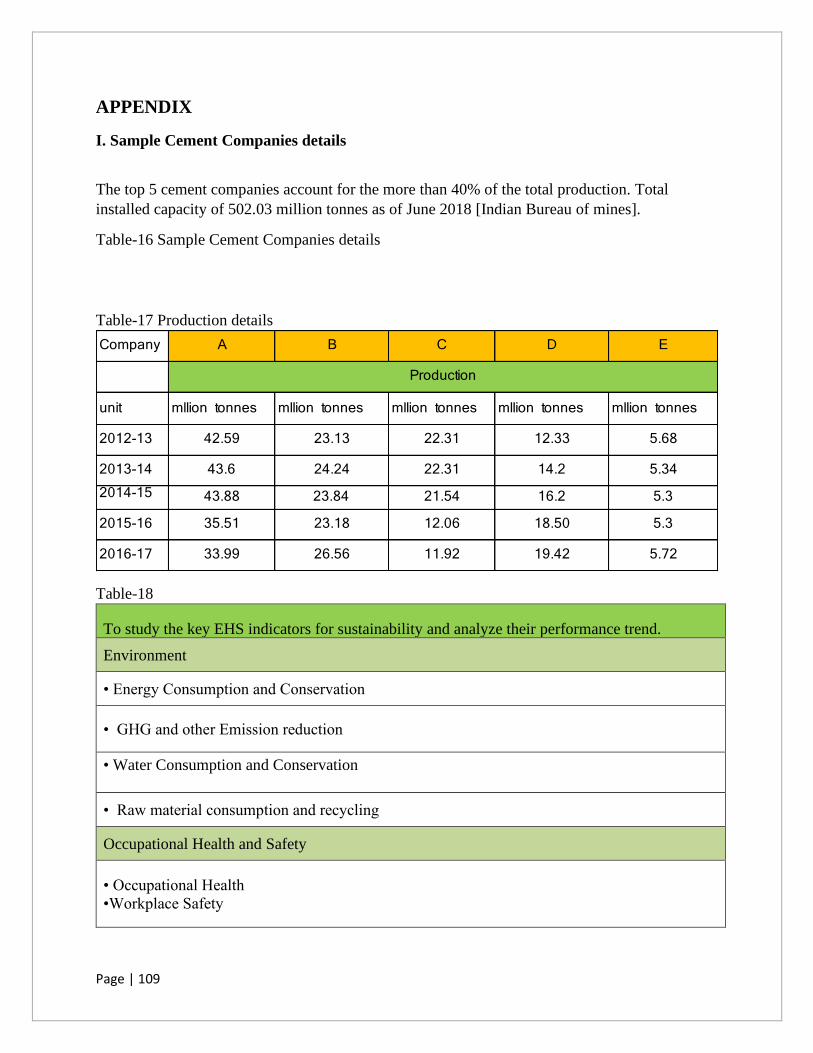
Page | 109
APPENDIX
I. Sample Cement Companies details
The top 5 cement companies account for the more than 40% of the total production. Total
installed capacity of 502.03 million tonnes as of June 2018 [Indian Bureau of mines].
Table-16 Sample Cement Companies details
Table-17 Production details
Table-18
To study the key EHS indicators for sustainability and analyze their performance trend.
Environment
• Energy Consumption and Conservation
• GHG and other Emission reduction
• Water Consumption and Conservation
• Raw material consumption and recycling
Occupational Health and Safety
• Occupational Health
•Workplace Safety
Company A B C D E
unit mllion tonnes mllion tonnes mllion tonnes mllion tonnes mllion tonnes
2012-13 42.59 23.13 22.31 12.33 5.68
2013-14 43.6 24.24 22.31 14.2 5.342014-15 43.88 23.84 21.54 16.2 5.32015-16 35.51 23.18 12.06 18.50 5.3
2016-17 33.99 26.56 11.92 19.42 5.72
Production
Page | 110
Community Environment Health and Safety
•Water and Energy Resources conservation
• Green Belt development
•Community Healthcare
II. Environmental Data Collection
Energy Consumption:
Direct Energy- Total fuel consumption within the organization from non-renewable sources, in
joules or multiples, and including fuel types used.
Indirect Energy- It is the total energy by electricity purchased and used by the organization.
Renewable Energy- Total fuel consumption within the organization from renewable sources, in
joules or multiples, and including fuel types used.
Table-19
Direct energy consumption (GJ)
A B C D E
2013-14 107980000 47584000 46119000 43910000 17504081
2014-15 117920000 46371000 45085000 47090000 20490127
2015-16 128310000 47159000 45101100 31880000 21465838
2016-17 126060000 48950000 49298900 43000000 17274409
Page | 111
Table-20
Renewable energy consumed (GJ)
A B C D E
2013-14 69850 117.11 36360.00 0.00 0.00
2014-15 238880 133.75 37440.00 0.00 0.00
2015-16 688860 1990.30 34920.00 0.00 275.53
2016-17 1001580 2039.44 37440.00 0.00 286.39
Table-21
Indirect Energy Consumed (GJ)
A B C D E
2013-14 2429000 1959124 2109000 220000 725663
2014-15 2738000 2295706 2098000 426000 367544
2015-16 2799000 1733846 1882000 405000 663892
2016-17 1930800 2040131 1761000 545000 520090
Table-22
Specific Direct energy consumption (GJ/tonne of cement)
A B C D E
2013-14 3260 3060 3070 3090 3100.00
2014-15 3280 3050 3100 3020 3400.00
2015-16 3240 3050 3130 2360 3090.00
2016-17 3350 3120 3150 3010 3020.00
Page | 112
Table-23
Specific indirect energy consumption (GJ/tonne of cement)
A B C D E
2013-14 0.07 0.08 0.09 0.015 0.14
2014-15 0.06 0.10 0.10 0.026 0.07
2015-16 0.06 0.07 0.16 0.022 0.12
2016-17 0.05 0.08 0.15 0.03 0.10
Emission
Direct Emission- Direct GHG emissions also called Scope 1 emissions include the CO2 emissions
from the fuel consumption reported as direct energy source consumption.
Indirect Emission- Indirect GHG emissions also called Scope 2 emissions include, the CO2
emissions from the purchased electricity consumed by an organization which is reported as indirect
energy source.
Table-24
Direct CO2 (thousand t CO2/year)
A B C D E
2013-14 32203 15144 13997 9100 4302.22
2014-15 36437 14706 13586 10100 4936.02
2015-16 37860 15098 13544 11651 3964.55
2016-17 37136 14856 14712 12869 4666.72
Page | 113
Table-25
Indirect CO2 (thousand t CO2/year)
A B C D E
2013-14 684.00 508.81 707.36 170.00 165.29
2014-15 728.00 622.88 547.81 140.00 83.72
2015-16 733.00 462.36 507.08 151.35 150.66
2016-17 711.00 504.04 474.48 181.57 116.40
Table-26
Specific CO2 emission (kg/tonnes of cement)
A B C D E
2013-14 626.88 543 556 585 606.00
2014-15 637.98 556 545 588 585.00
2015-16 627.37 551 543 576 588.00
2016-17 627.52 534 550 552 576.00
Water – Total water consumption by plant is comprises of following categories:
Groundwater
Surface Water
Third Party Purchase
Harvested Water
water recycled and reused
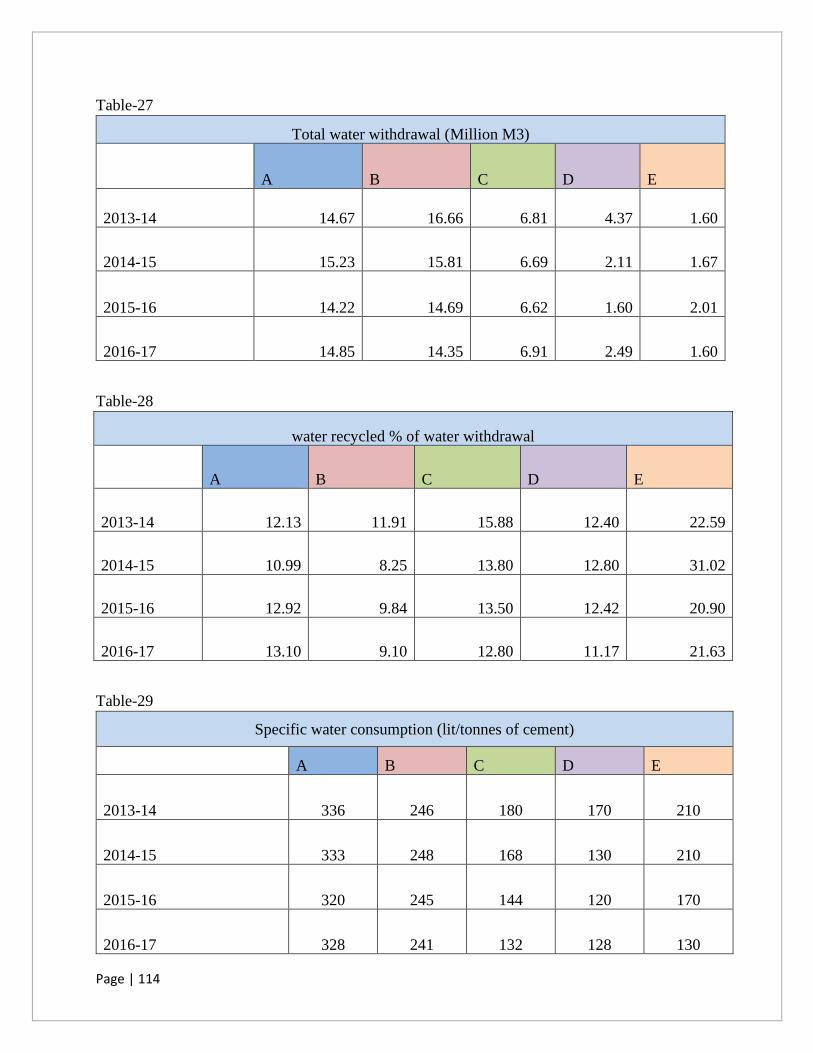
Page | 114
Table-27
Total water withdrawal (Million M3)
A B C D E
2013-14 14.67 16.66 6.81 4.37 1.60
2014-15 15.23 15.81 6.69 2.11 1.67
2015-16 14.22 14.69 6.62 1.60 2.01
2016-17 14.85 14.35 6.91 2.49 1.60
Table-28
water recycled % of water withdrawal
A B C D E
2013-14 12.13 11.91 15.88 12.40 22.59
2014-15 10.99 8.25 13.80 12.80 31.02
2015-16 12.92 9.84 13.50 12.42 20.90
2016-17 13.10 9.10 12.80 11.17 21.63
Table-29
Specific water consumption (lit/tonnes of cement)
A B C D E
2013-14 336 246 180 170 210
2014-15 333 248 168 130 210
2015-16 320 245 144 120 170
2016-17 328 241 132 128 130
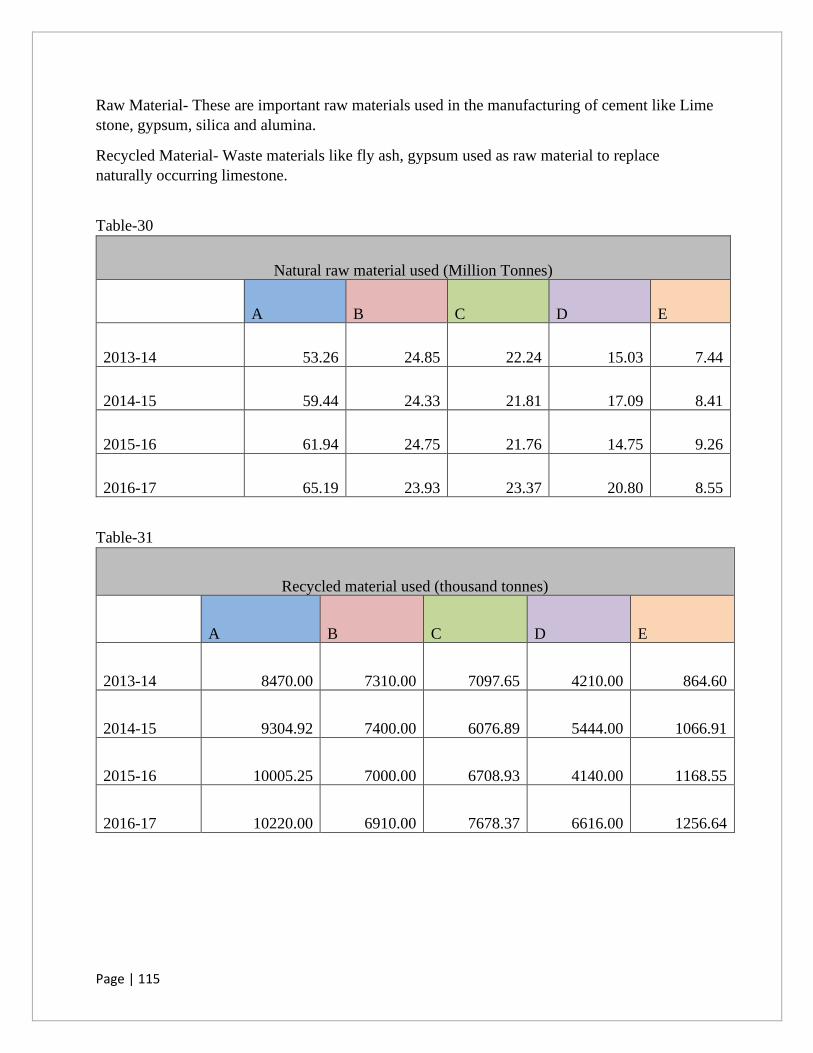
Page | 115
Raw Material- These are important raw materials used in the manufacturing of cement like Lime
stone, gypsum, silica and alumina.
Recycled Material- Waste materials like fly ash, gypsum used as raw material to replace
naturally occurring limestone.
Table-30
Natural raw material used (Million Tonnes)
A B C D E
2013-14 53.26 24.85 22.24 15.03 7.44
2014-15 59.44 24.33 21.81 17.09 8.41
2015-16 61.94 24.75 21.76 14.75 9.26
2016-17 65.19 23.93 23.37 20.80 8.55
Table-31
Recycled material used (thousand tonnes)
A B C D E
2013-14 8470.00 7310.00 7097.65 4210.00 864.60
2014-15 9304.92 7400.00 6076.89 5444.00 1066.91
2015-16 10005.25 7000.00 6708.93 4140.00 1168.55
2016-17 10220.00 6910.00 7678.37 6616.00 1256.64
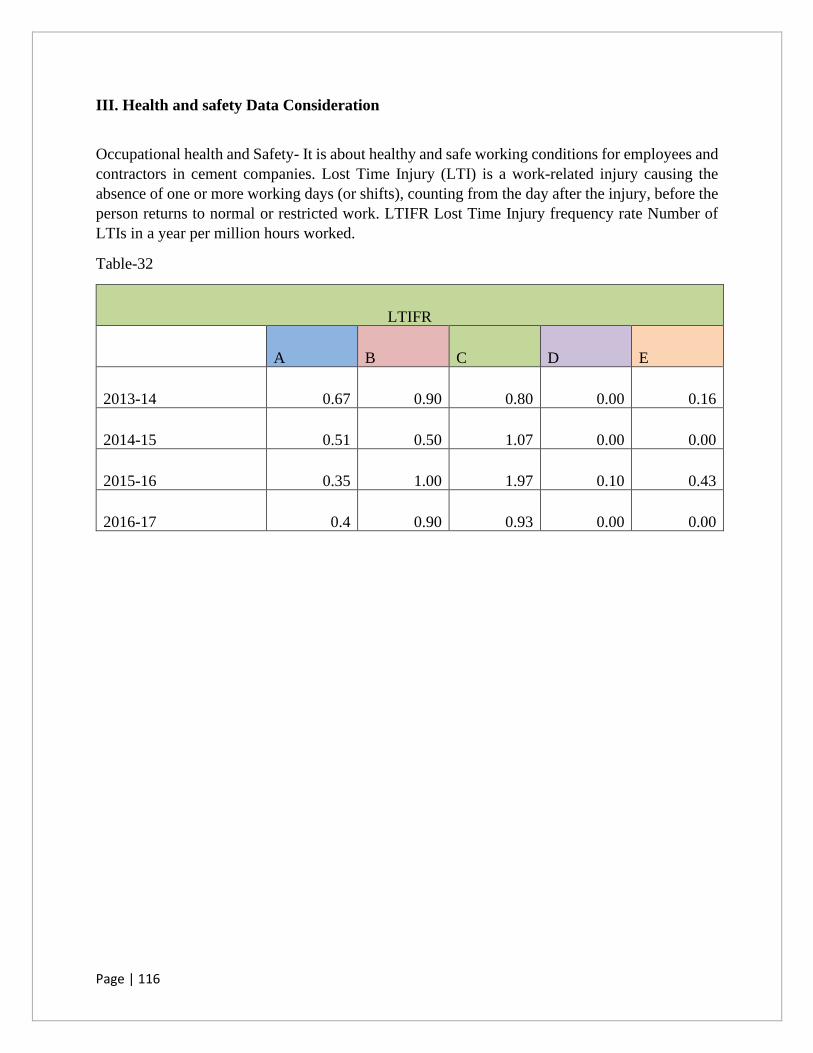
Page | 116
III. Health and safety Data Consideration
Occupational health and Safety- It is about healthy and safe working conditions for employees and
contractors in cement companies. Lost Time Injury (LTI) is a work-related injury causing the
absence of one or more working days (or shifts), counting from the day after the injury, before the
person returns to normal or restricted work. LTIFR Lost Time Injury frequency rate Number of
LTIs in a year per million hours worked.
Table-32
LTIFR
A B C D E
2013-14 0.67 0.90 0.80 0.00 0.16
2014-15 0.51 0.50 1.07 0.00 0.00
2015-16 0.35 1.00 1.97 0.10 0.43
2016-17 0.4 0.90 0.93 0.00 0.00
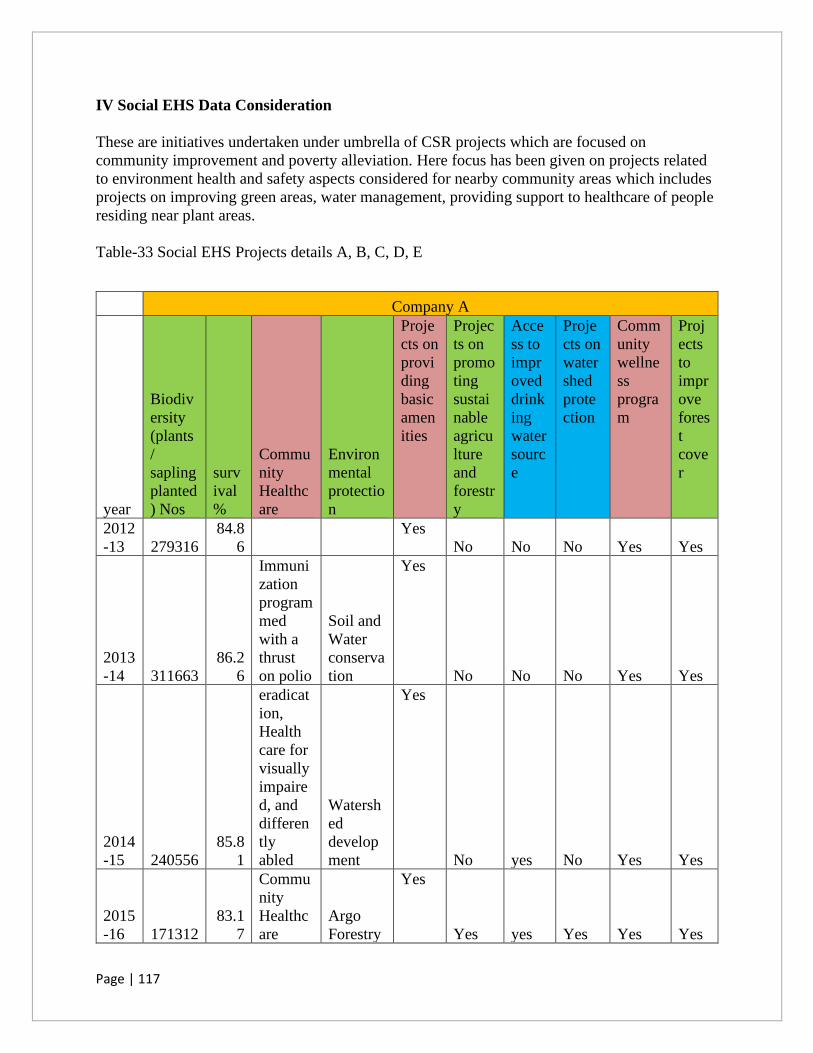
Page | 117
IV Social EHS Data Consideration
These are initiatives undertaken under umbrella of CSR projects which are focused on
community improvement and poverty alleviation. Here focus has been given on projects related
to environment health and safety aspects considered for nearby community areas which includes
projects on improving green areas, water management, providing support to healthcare of people
residing near plant areas.
Table-33 Social EHS Projects details A, B, C, D, E
Company A
year
Biodiv
ersity
(plants
/
sapling
planted
) Nos
surv
ival
%
Commu
nity
Healthc
are
Environ
mental
protectio
n
Proje
cts on
provi
ding
basic
amen
ities
Projec
ts on
promo
ting
sustai
nable
agricu
lture
and
forestr
y
Acce
ss to
impr
oved
drink
ing
water
sourc
e
Proje
cts on
water
shed
prote
ction
Comm
unity
wellne
ss
progra
m
Proj
ects
to
impr
ove
fores
t
cove
r
2012
-13 279316
84.8
6
Yes
No No No Yes Yes
2013
-14 311663
86.2
6
Immuni
zation
program
med
with a
thrust
on polio
Soil and
Water
conserva
tion
Yes
No No No Yes Yes
2014
-15 240556
85.8
1
eradicat
ion,
Health
care for
visually
impaire
d, and
differen
tly
abled
Watersh
ed
develop
ment
Yes
No yes No Yes Yes
2015
-16 171312
83.1
7
Commu
nity
Healthc
are
Argo
Forestry
Yes
Yes yes Yes Yes Yes
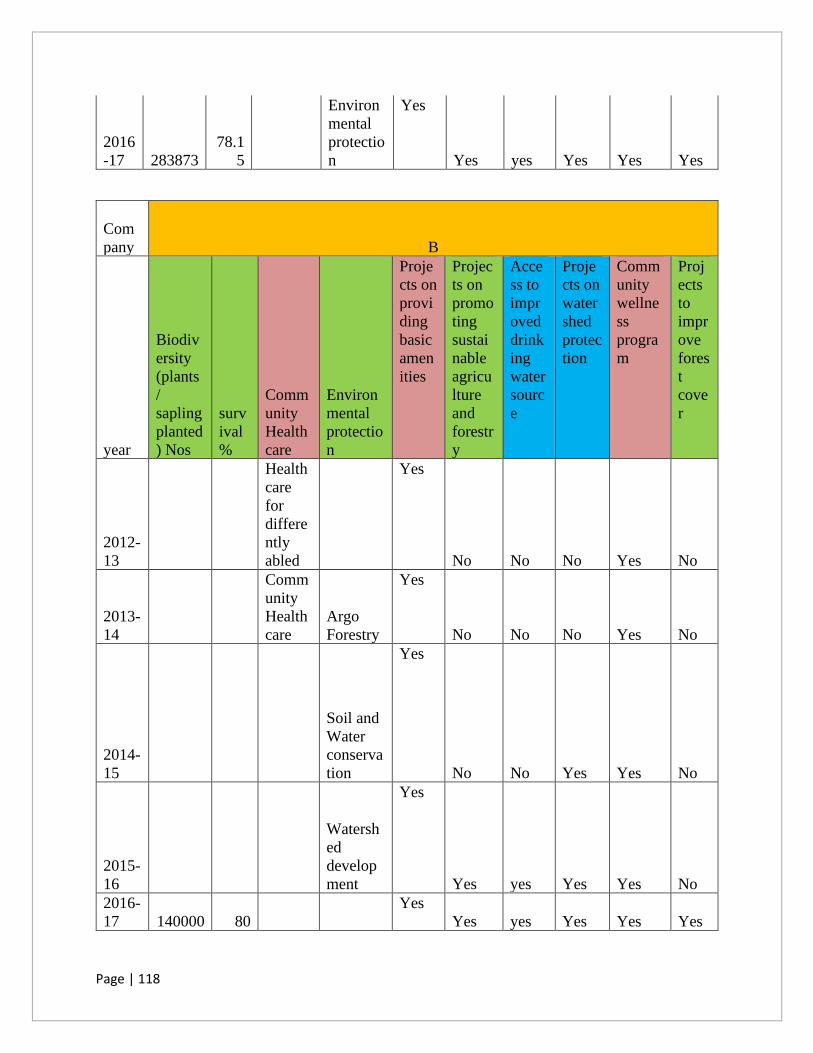
Page | 118
2016
-17 283873
78.1
5
Environ
mental
protectio
n
Yes
Yes yes Yes Yes Yes
Com
pany B
year
Biodiv
ersity
(plants
/
sapling
planted
) Nos
surv
ival
%
Comm
unity
Health
care
Environ
mental
protectio
n
Proje
cts on
provi
ding
basic
amen
ities
Projec
ts on
promo
ting
sustai
nable
agricu
lture
and
forestr
y
Acce
ss to
impr
oved
drink
ing
water
sourc
e
Proje
cts on
water
shed
protec
tion
Comm
unity
wellne
ss
progra
m
Proj
ects
to
impr
ove
fores
t
cove
r
2012-
13
Health
care
for
differe
ntly
abled
Yes
No No No Yes No
2013-
14
Comm
unity
Health
care
Argo
Forestry
Yes
No No No Yes No
2014-
15
Soil and
Water
conserva
tion
Yes
No No Yes Yes No
2015-
16
Watersh
ed
develop
ment
Yes
Yes yes Yes Yes No
2016-
17 140000 80
Yes
Yes yes Yes Yes Yes

Page | 119
Com
pany C
year
Biodiv
ersity
(plants
/
sapling
planted
) Nos
surv
ival
%
Comm
unity
Health
care
Environ
mental
protectio
n
Proje
cts on
provi
ding
basic
amen
ities
Projec
ts on
promo
ting
sustai
nable
agricu
lture
and
forestr
y
Acce
ss to
impr
oved
drink
ing
water
sourc
e
Proje
cts on
water
shed
protec
tion
Comm
unity
wellne
ss
progra
m
Proj
ects
to
impr
ove
fores
t
cove
r
2012-
13
Health
care
for
differe
ntly
abled
Yes
No No No Yes No
2013-
14
Comm
unity
Health
care
Agro
Forestry
Yes
No No No Yes No
2014-
15
Soil and
Water
conserva
tion
Yes
No No Yes Yes No
2015-
16 160000
Watersh
ed
develop
ment
Yes
Yes yes Yes Yes yes
2016-
17 280000
Yes
Yes yes Yes Yes Yes
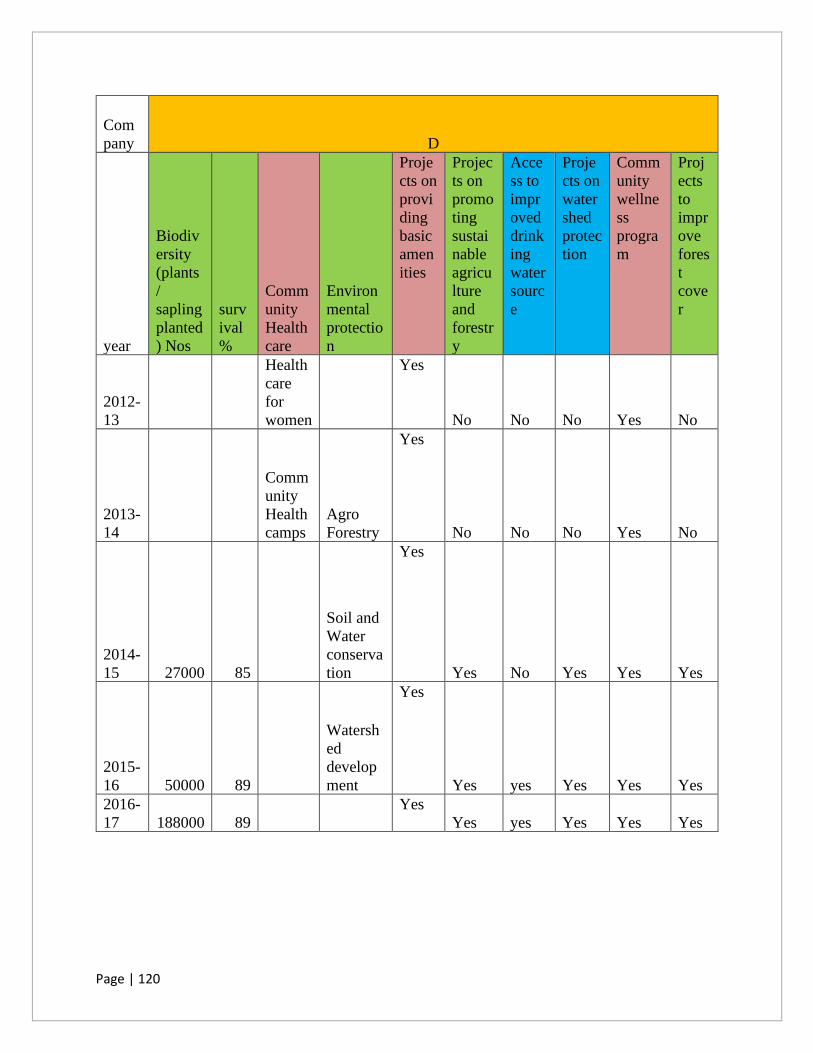
Page | 120
Com
pany D
year
Biodiv
ersity
(plants
/
sapling
planted
) Nos
surv
ival
%
Comm
unity
Health
care
Environ
mental
protectio
n
Proje
cts on
provi
ding
basic
amen
ities
Projec
ts on
promo
ting
sustai
nable
agricu
lture
and
forestr
y
Acce
ss to
impr
oved
drink
ing
water
sourc
e
Proje
cts on
water
shed
protec
tion
Comm
unity
wellne
ss
progra
m
Proj
ects
to
impr
ove
fores
t
cove
r
2012-
13
Health
care
for
women
Yes
No No No Yes No
2013-
14
Comm
unity
Health
camps
Agro
Forestry
Yes
No No No Yes No
2014-
15 27000 85
Soil and
Water
conserva
tion
Yes
Yes No Yes Yes Yes
2015-
16 50000 89
Watersh
ed
develop
ment
Yes
Yes yes Yes Yes Yes
2016-
17 188000 89
Yes
Yes yes Yes Yes Yes
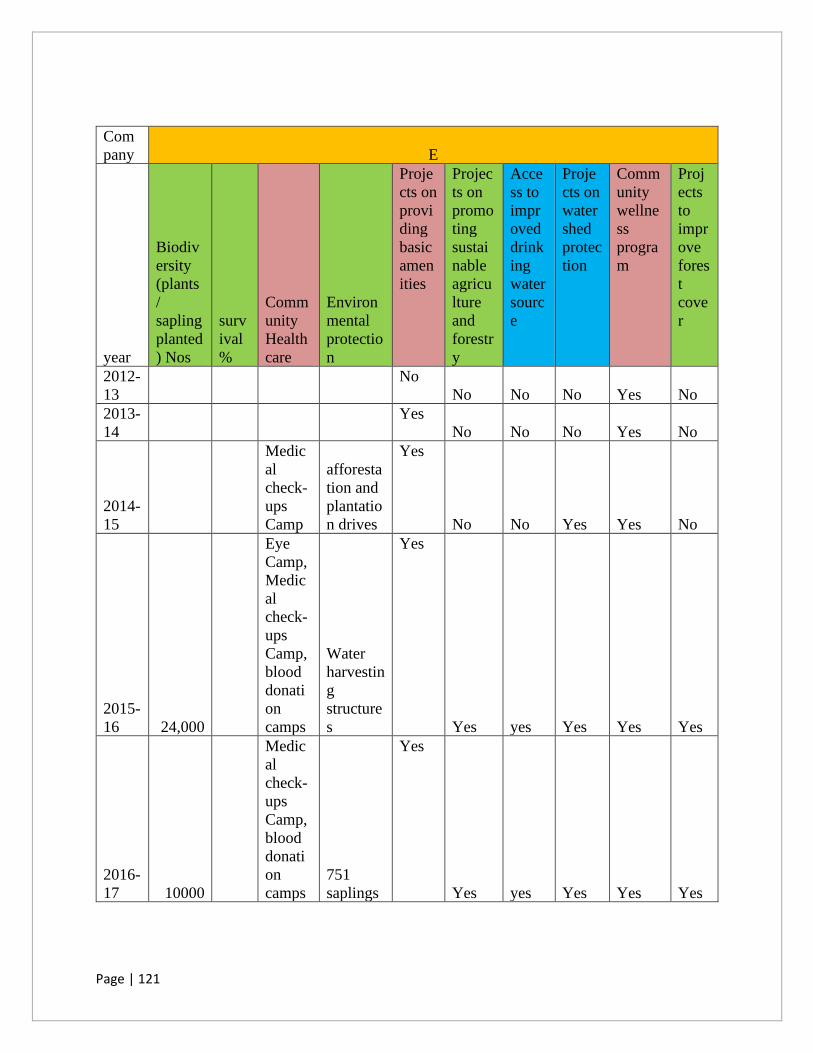
Page | 121
Com
pany E
year
Biodiv
ersity
(plants
/
sapling
planted
) Nos
surv
ival
%
Comm
unity
Health
care
Environ
mental
protectio
n
Proje
cts on
provi
ding
basic
amen
ities
Projec
ts on
promo
ting
sustai
nable
agricu
lture
and
forestr
y
Acce
ss to
impr
oved
drink
ing
water
sourc
e
Proje
cts on
water
shed
protec
tion
Comm
unity
wellne
ss
progra
m
Proj
ects
to
impr
ove
fores
t
cove
r
2012-
13
No
No No No Yes No
2013-
14
Yes
No No No Yes No
2014-
15
Medic
al
check-
ups
Camp
afforesta
tion and
plantatio
n drives
Yes
No No Yes Yes No
2015-
16 24,000
Eye
Camp,
Medic
al
check-
ups
Camp,
blood
donati
on
camps
Water
harvestin
g
structure
s
Yes
Yes yes Yes Yes Yes
2016-
17 10000
Medic
al
check-
ups
Camp,
blood
donati
on
camps
751
saplings
Yes
Yes yes Yes Yes Yes
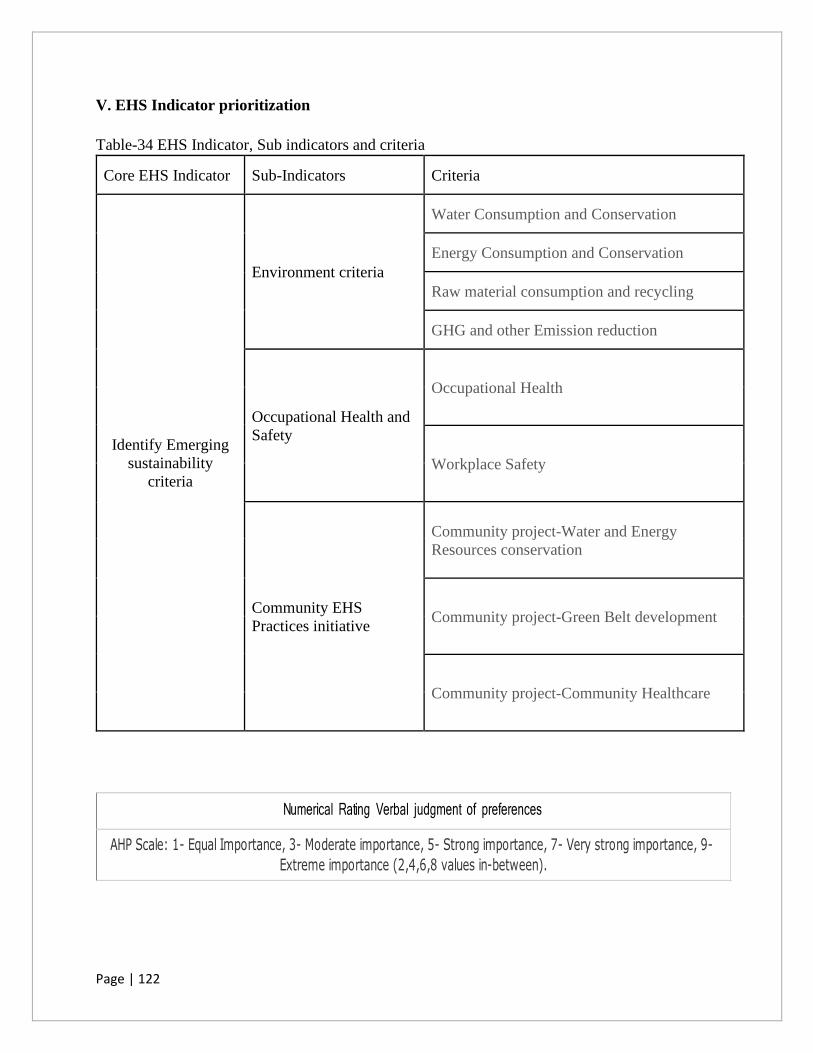
Page | 122
V. EHS Indicator prioritization
Table-34 EHS Indicator, Sub indicators and criteria
Core EHS Indicator Sub-Indicators Criteria
Identify Emerging
sustainability
criteria
Environment criteria
Water Consumption and Conservation
Energy Consumption and Conservation
Raw material consumption and recycling
GHG and other Emission reduction
Occupational Health and
Safety
Occupational Health
Workplace Safety
Community EHS
Practices initiative
Community project-Water and Energy
Resources conservation
Community project-Green Belt development
Community project-Community Healthcare
Numerical Rating Verbal judgment of preferences
AHP Scale: 1- Equal Importance, 3- Moderate importance, 5- Strong importance, 7- Very strong importance, 9-
Extreme importance (2,4,6,8 values in-between).
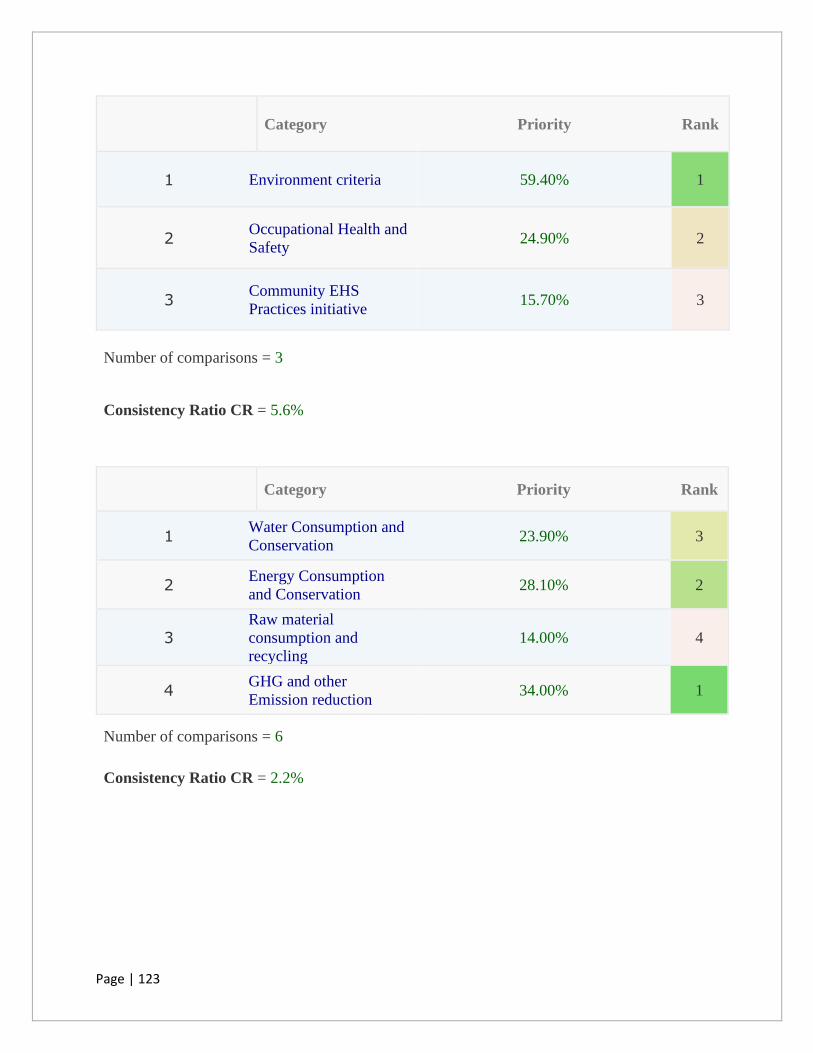
Page | 123
Category Priority Rank
1 Environment criteria 59.40% 1
2 Occupational Health and
Safety 24.90% 2
3 Community EHS
Practices initiative 15.70% 3
Number of comparisons = 3
Consistency Ratio CR = 5.6%
Category Priority Rank
1 Water Consumption and
Conservation 23.90% 3
2 Energy Consumption
and Conservation 28.10% 2
3
Raw material
consumption and
recycling
14.00% 4
4 GHG and other
Emission reduction 34.00% 1
Number of comparisons = 6
Consistency Ratio CR = 2.2%
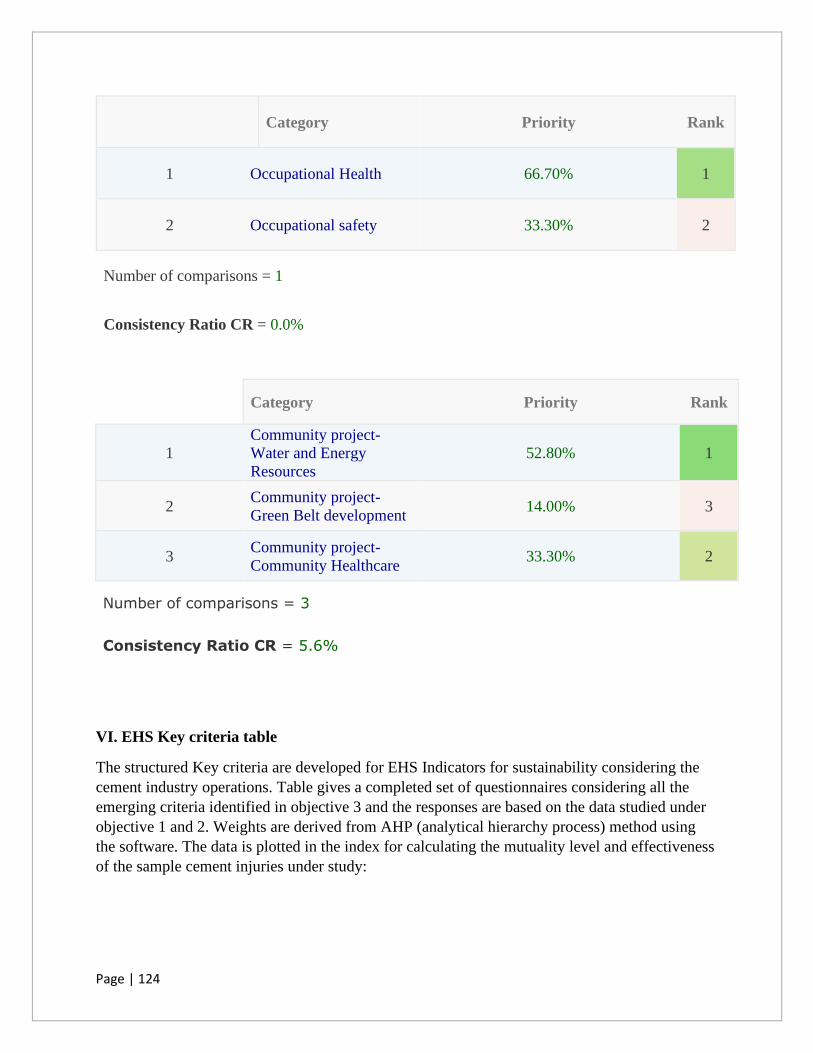
Page | 124
Category Priority Rank
1 Occupational Health 66.70% 1
2 Occupational safety 33.30% 2
Number of comparisons = 1
Consistency Ratio CR = 0.0%
Category Priority Rank
1
Community project-
Water and Energy
Resources
52.80% 1
2 Community project-
Green Belt development 14.00% 3
3 Community project-
Community Healthcare 33.30% 2
Number of comparisons = 3
Consistency Ratio CR = 5.6%
VI. EHS Key criteria table
The structured Key criteria are developed for EHS Indicators for sustainability considering the
cement industry operations. Table gives a completed set of questionnaires considering all the
emerging criteria identified in objective 3 and the responses are based on the data studied under
objective 1 and 2. Weights are derived from AHP (analytical hierarchy process) method using
the software. The data is plotted in the index for calculating the mutuality level and effectiveness
of the sample cement injuries under study:

Page | 125
Table-35 EHS Key criteria table
Identify
Emerging
sustainabili
ty criteria
EHS
Indicators
EHS Sub
indicators
Sr
No.
Key Criteria
Environme
nt
Water
Consumptio
n and
Conservatio
n
1 ISO 14001 management system certification
2 Fresh water consumption pattern (YOY)
3 Ground water resource extraction pattern
(YOY)
4 Water Metering and management
5 Waste Water Treatment and Recycle (recycle
percentage of fresh water consumption) YOY
6 Water Quality of effluent water
7 Zero discharge plants
8 Rainwater Harvesting (YOY)
9 Ground water recharge
1 0.5 0.1 0.05
Highly Sustainable Moderately
Sustainable
Evolving
towards
sustainable
Unsustainable
certified under certification Plan for
certification
no certification
Consmp. less than 10%-
20%
Consmp. less than
5%-10%
Consmp. less than
5%
No change in
consumption pattern
extact. less than 10%-
20%
extact. less than
5%-10%
extact. less than
5%
No change in
consumption pattern
Well managed program Initiated program Plan for water
management
No program
recycle more than 30% recycle more than
20%
recycle more than
10%
No recycling
Quality improved beyond
regulatory limits
Quality meets
regulatory limits
Tries to meet
regulatory limits
regulatory requirements
not met
100% zero discharge Initiated program Plan for zero
discharge
No possibility
Harvested more than
10%
Harvested more
than 5%
Harvested more
than 1%
No rain water harvesting
system in place
Quantified and audited Quantified but not
audited
Initiated program No data available
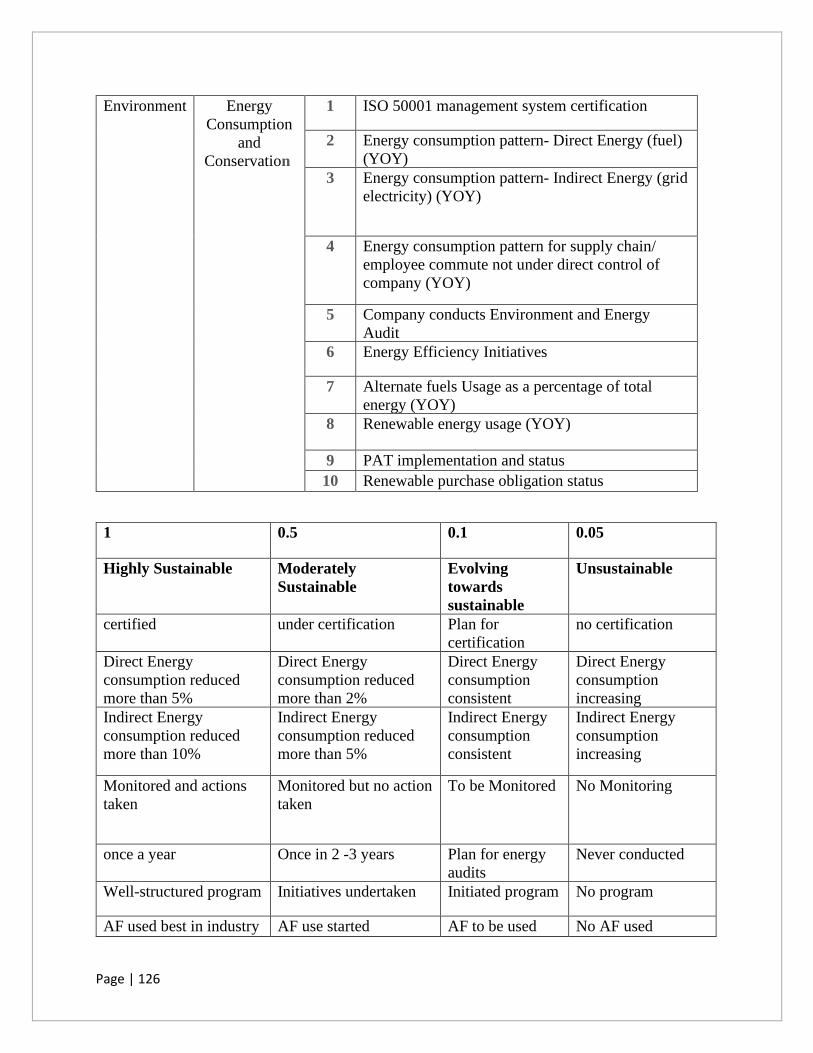
Page | 126
Environment Energy
Consumption
and
Conservation
1 ISO 50001 management system certification
2 Energy consumption pattern- Direct Energy (fuel)
(YOY)
3 Energy consumption pattern- Indirect Energy (grid
electricity) (YOY)
4 Energy consumption pattern for supply chain/
employee commute not under direct control of
company (YOY)
5 Company conducts Environment and Energy
Audit
6 Energy Efficiency Initiatives
7 Alternate fuels Usage as a percentage of total
energy (YOY)
8 Renewable energy usage (YOY)
9 PAT implementation and status
10 Renewable purchase obligation status
1 0.5 0.1 0.05
Highly Sustainable Moderately
Sustainable
Evolving
towards
sustainable
Unsustainable
certified under certification Plan for
certification
no certification
Direct Energy
consumption reduced
more than 5%
Direct Energy
consumption reduced
more than 2%
Direct Energy
consumption
consistent
Direct Energy
consumption
increasing
Indirect Energy
consumption reduced
more than 10%
Indirect Energy
consumption reduced
more than 5%
Indirect Energy
consumption
consistent
Indirect Energy
consumption
increasing
Monitored and actions
taken
Monitored but no action
taken
To be Monitored No Monitoring
once a year Once in 2 -3 years Plan for energy
audits
Never conducted
Well-structured program Initiatives undertaken Initiated program No program
AF used best in industry AF use started AF to be used No AF used
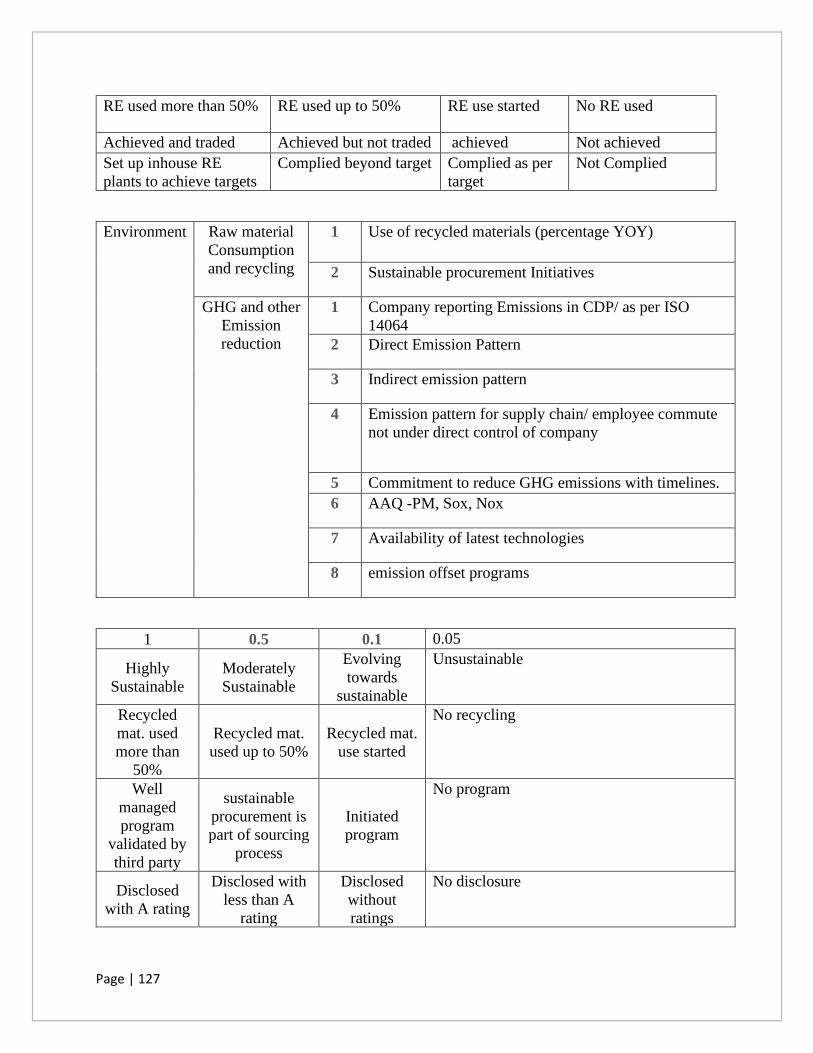
Page | 127
RE used more than 50% RE used up to 50% RE use started No RE used
Achieved and traded Achieved but not traded achieved Not achieved
Set up inhouse RE
plants to achieve targets
Complied beyond target Complied as per
target
Not Complied
Environment Raw material
Consumption
and recycling
1 Use of recycled materials (percentage YOY)
2 Sustainable procurement Initiatives
GHG and other
Emission
reduction
1 Company reporting Emissions in CDP/ as per ISO
14064
2 Direct Emission Pattern
3 Indirect emission pattern
4 Emission pattern for supply chain/ employee commute
not under direct control of company
5 Commitment to reduce GHG emissions with timelines.
6 AAQ -PM, Sox, Nox
7 Availability of latest technologies
8 emission offset programs
1 0.5 0.1 0.05
Highly
Sustainable
Moderately
Sustainable
Evolving
towards
sustainable
Unsustainable
Recycled
mat. used
more than
50%
Recycled mat.
used up to 50%
Recycled mat.
use started
No recycling
Well
managed
program
validated by
third party
sustainable
procurement is
part of sourcing
process
Initiated
program
No program
Disclosed
with A rating
Disclosed with
less than A
rating
Disclosed
without
ratings
No disclosure
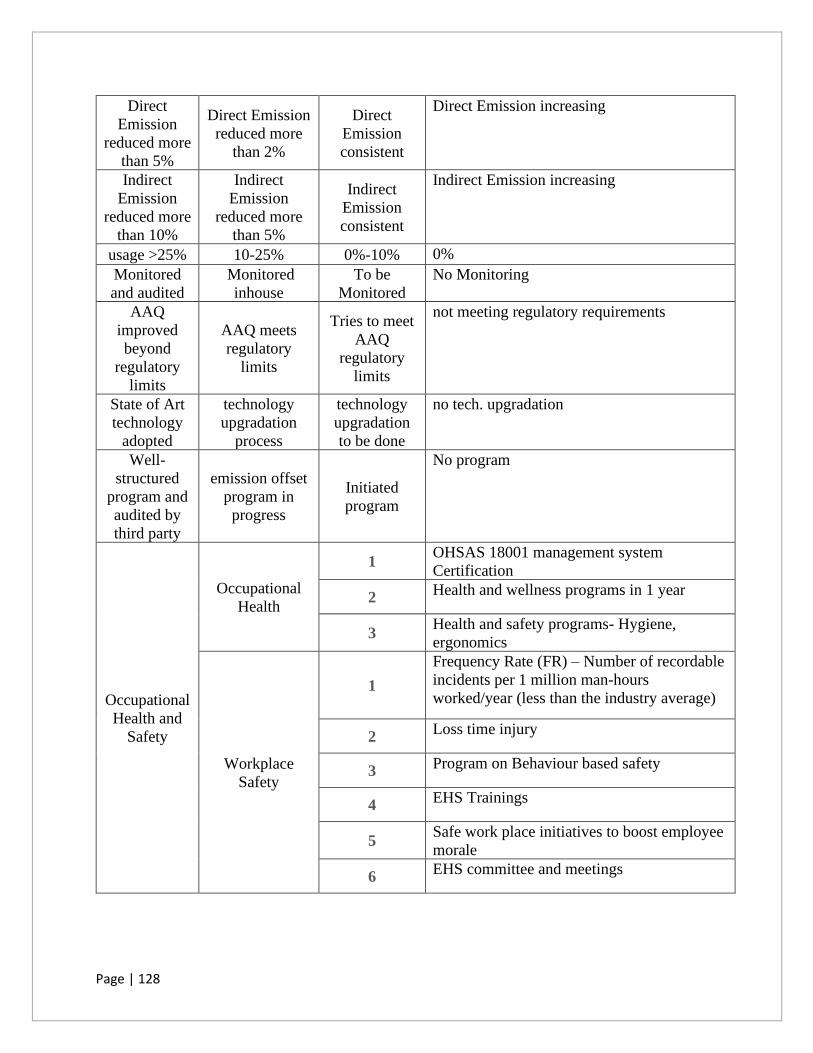
Page | 128
Direct
Emission
reduced more
than 5%
Direct Emission
reduced more
than 2%
Direct
Emission
consistent
Direct Emission increasing
Indirect
Emission
reduced more
than 10%
Indirect
Emission
reduced more
than 5%
Indirect
Emission
consistent
Indirect Emission increasing
usage >25% 10-25% 0%-10% 0%
Monitored
and audited
Monitored
inhouse
To be
Monitored
No Monitoring
AAQ
improved
beyond
regulatory
limits
AAQ meets
regulatory
limits
Tries to meet
AAQ
regulatory
limits
not meeting regulatory requirements
State of Art
technology
adopted
technology
upgradation
process
technology
upgradation
to be done
no tech. upgradation
Well-
structured
program and
audited by
third party
emission offset
program in
progress
Initiated
program
No program
Occupational
Health and
Safety
Occupational
Health
1 OHSAS 18001 management system
Certification
2 Health and wellness programs in 1 year
3 Health and safety programs- Hygiene,
ergonomics
Workplace
Safety
1
Frequency Rate (FR) – Number of recordable
incidents per 1 million man-hours
worked/year (less than the industry average)
2 Loss time injury
3 Program on Behaviour based safety
4 EHS Trainings
5 Safe work place initiatives to boost employee
morale
6 EHS committee and meetings
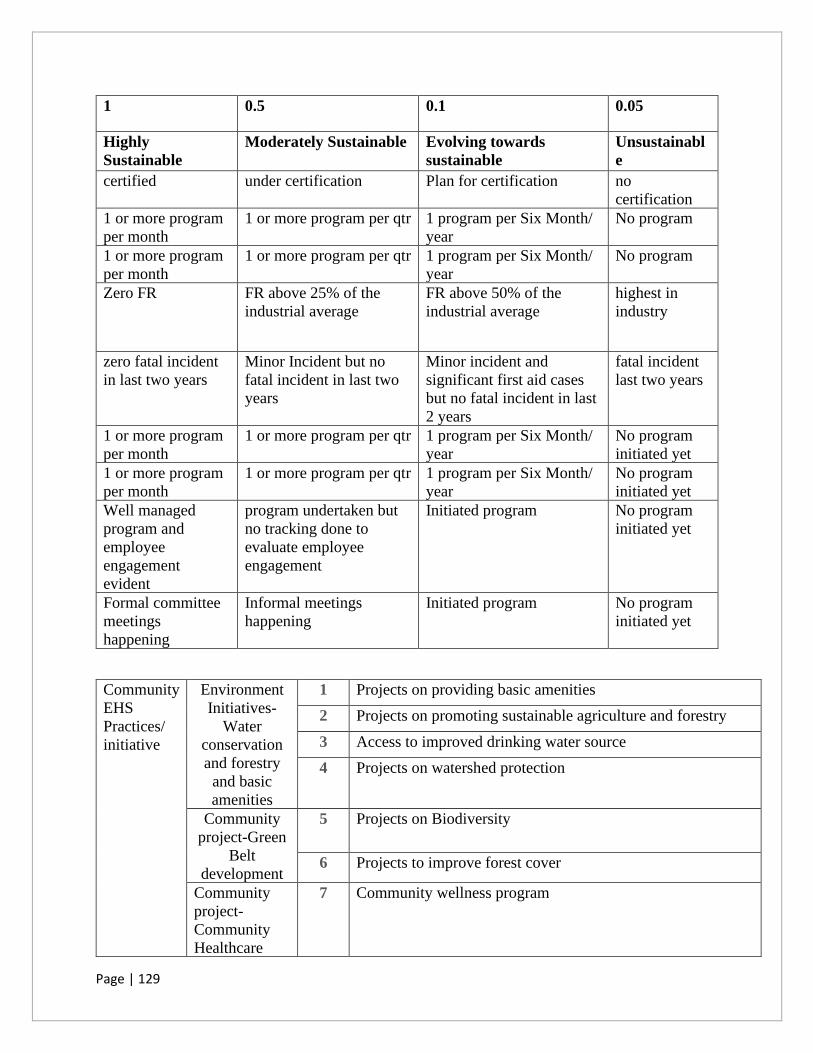
Page | 129
1 0.5 0.1 0.05
Highly
Sustainable
Moderately Sustainable Evolving towards
sustainable
Unsustainabl
e
certified under certification Plan for certification no
certification
1 or more program
per month
1 or more program per qtr 1 program per Six Month/
year
No program
1 or more program
per month
1 or more program per qtr 1 program per Six Month/
year
No program
Zero FR FR above 25% of the
industrial average
FR above 50% of the
industrial average
highest in
industry
zero fatal incident
in last two years
Minor Incident but no
fatal incident in last two
years
Minor incident and
significant first aid cases
but no fatal incident in last
2 years
fatal incident
last two years
1 or more program
per month
1 or more program per qtr 1 program per Six Month/
year
No program
initiated yet
1 or more program
per month
1 or more program per qtr 1 program per Six Month/
year
No program
initiated yet
Well managed
program and
employee
engagement
evident
program undertaken but
no tracking done to
evaluate employee
engagement
Initiated program No program
initiated yet
Formal committee
meetings
happening
Informal meetings
happening
Initiated program No program
initiated yet
Community
EHS
Practices/
initiative
Environment
Initiatives-
Water
conservation
and forestry
and basic
amenities
1 Projects on providing basic amenities
2 Projects on promoting sustainable agriculture and forestry
3 Access to improved drinking water source
4 Projects on watershed protection
Community
project-Green
Belt
development
5 Projects on Biodiversity
6 Projects to improve forest cover
Community
project-
Community
Healthcare
7 Community wellness program
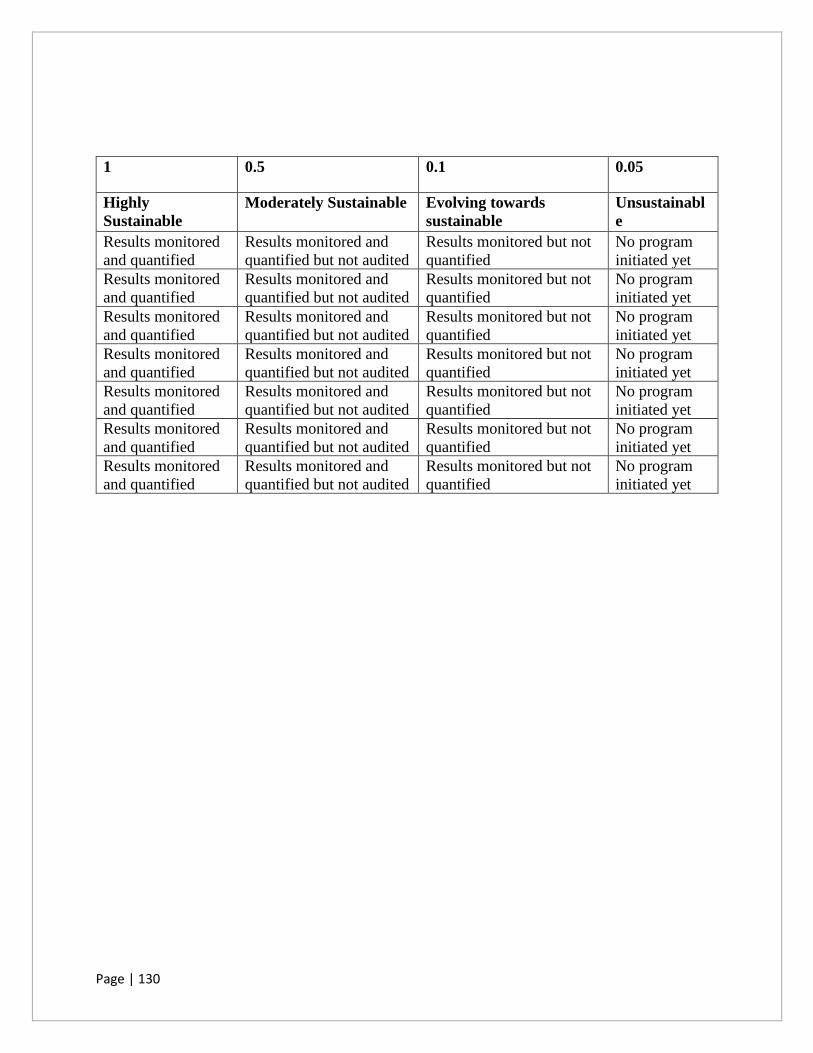
Page | 130
1 0.5 0.1 0.05
Highly
Sustainable
Moderately Sustainable Evolving towards
sustainable
Unsustainabl
e
Results monitored
and quantified
Results monitored and
quantified but not audited
Results monitored but not
quantified
No program
initiated yet
Results monitored
and quantified
Results monitored and
quantified but not audited
Results monitored but not
quantified
No program
initiated yet
Results monitored
and quantified
Results monitored and
quantified but not audited
Results monitored but not
quantified
No program
initiated yet
Results monitored
and quantified
Results monitored and
quantified but not audited
Results monitored but not
quantified
No program
initiated yet
Results monitored
and quantified
Results monitored and
quantified but not audited
Results monitored but not
quantified
No program
initiated yet
Results monitored
and quantified
Results monitored and
quantified but not audited
Results monitored but not
quantified
No program
initiated yet
Results monitored
and quantified
Results monitored and
quantified but not audited
Results monitored but not
quantified
No program
initiated yet

Page | 131
VII. Index Implementation Plant-1 Rating for sustainability
Table-36 Plant-1 Rating for sustainability
EHS
Indic
ators
EHS
Sub
indicat
ors
S
r
N
o.
Key
Criteri
a
1 0.5 0.1 0.05 Maturi
ty
level
rating
w
ei
g
ht
s
crit
eri
a
rati
ng
su
b-
In
dic
ato
r
rat
ing
EHS
Indicator
Rating for
sustainabil
ity
High
ly
Sust
aina
ble
Moder
ately
Sustai
nable
Evolv
ing
towar
ds
sustai
nable
Unsus
tainab
le
Envir
onme
nt
Water
Consu
mption
and
Conser
vation
1 ISO
14001
manag
ement
system
certific
ation
certif
ied
under
certific
ation
no
certifi
cation
no
certifi
cation
1 0.
2
3
0.2
3
0.1
2
0.10
2 Fresh
water
consu
mption
pattern
(YOY)
Cons
mp.
less
than
10%-
20%
Consm
p. less
than
5%-
10%
Cons
mp.
less
than
5%
No
chang
e in
consu
mptio
n
pattern
0.5 0.
2
3
0.1
2
3 Groun
d
water
resour
ce
extract
ion
pattern
(YOY)
extac
t. less
than
10%-
20%
extact.
less
than
5%-
10%
extact
. less
than
5%
No
chang
e in
consu
mptio
n
pattern
0.5 0.
2
3
0.1
2
4 Water
Meteri
ng and
manag
ement
Well
mana
ged
progr
am
Initiate
d
progra
m
No
progr
am
No
progra
m
0.5 0.
2
3
0.1
2
5 Waste
Water
Treat
ment
and
Recycl
e
recyc
le
more
than
30%
recycle
more
than
20%
recycl
e
more
than
10%
No
recycli
ng
0.1 0.
2
3
0.0
2
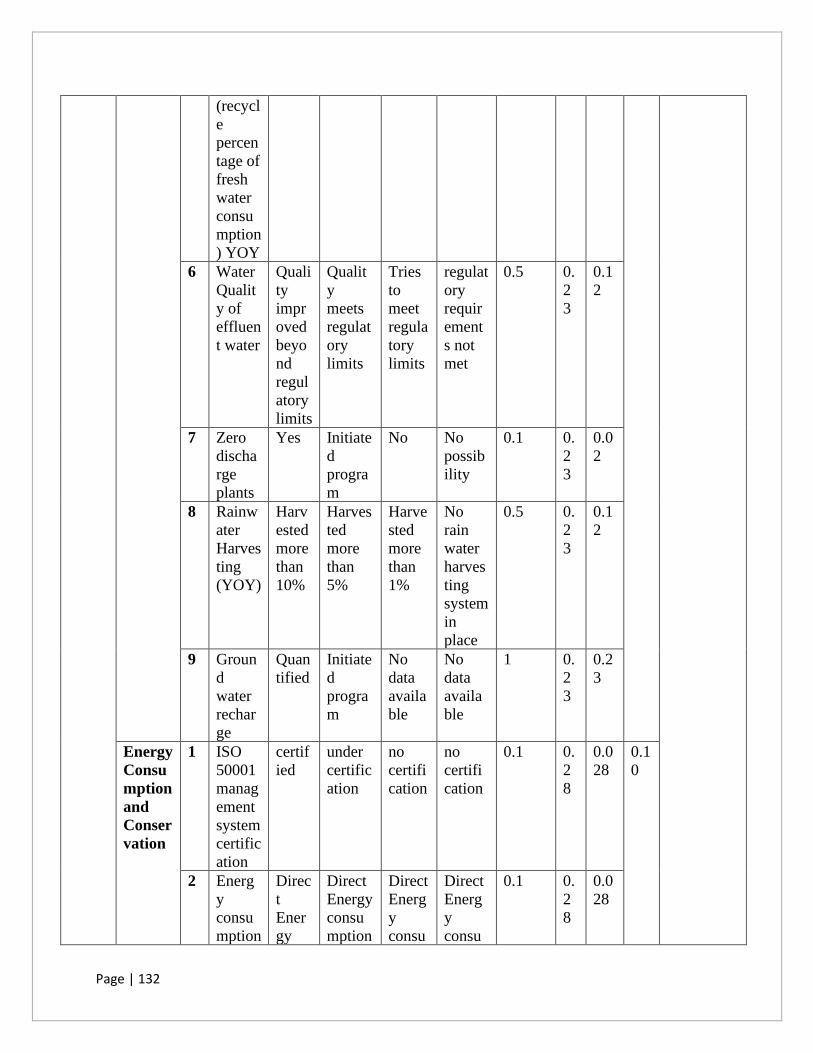
Page | 132
(recycl
e
percen
tage of
fresh
water
consu
mption
) YOY
6 Water
Qualit
y of
effluen
t water
Quali
ty
impr
oved
beyo
nd
regul
atory
limits
Qualit
y
meets
regulat
ory
limits
Tries
to
meet
regula
tory
limits
regulat
ory
requir
ement
s not
met
0.5 0.
2
3
0.1
2
7 Zero
discha
rge
plants
Yes Initiate
d
progra
m
No No
possib
ility
0.1 0.
2
3
0.0
2
8 Rainw
ater
Harves
ting
(YOY)
Harv
ested
more
than
10%
Harves
ted
more
than
5%
Harve
sted
more
than
1%
No
rain
water
harves
ting
system
in
place
0.5 0.
2
3
0.1
2
9 Groun
d
water
rechar
ge
Quan
tified
Initiate
d
progra
m
No
data
availa
ble
No
data
availa
ble
1 0.
2
3
0.2
3
Energy
Consu
mption
and
Conser
vation
1 ISO
50001
manag
ement
system
certific
ation
certif
ied
under
certific
ation
no
certifi
cation
no
certifi
cation
0.1 0.
2
8
0.0
28
0.1
0
2 Energ
y
consu
mption
Direc
t
Ener
gy
Direct
Energy
consu
mption
Direct
Energ
y
consu
Direct
Energ
y
consu
0.1 0.
2
8
0.0
28
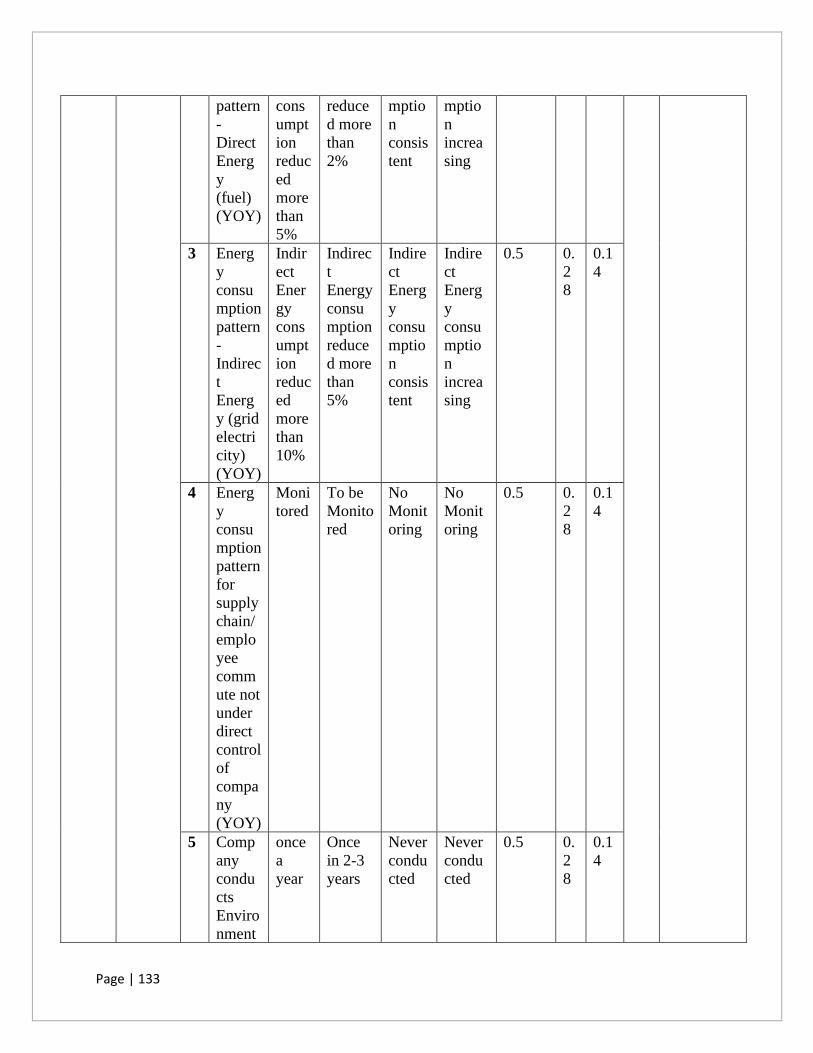
Page | 133
pattern
-
Direct
Energ
y
(fuel)
(YOY)
cons
umpt
ion
reduc
ed
more
than
5%
reduce
d more
than
2%
mptio
n
consis
tent
mptio
n
increa
sing
3 Energ
y
consu
mption
pattern
-
Indirec
t
Energ
y (grid
electri
city)
(YOY)
Indir
ect
Ener
gy
cons
umpt
ion
reduc
ed
more
than
10%
Indirec
t
Energy
consu
mption
reduce
d more
than
5%
Indire
ct
Energ
y
consu
mptio
n
consis
tent
Indire
ct
Energ
y
consu
mptio
n
increa
sing
0.5 0.
2
8
0.1
4
4 Energ
y
consu
mption
pattern
for
supply
chain/
emplo
yee
comm
ute not
under
direct
control
of
compa
ny
(YOY)
Moni
tored
To be
Monito
red
No
Monit
oring
No
Monit
oring
0.5 0.
2
8
0.1
4
5 Comp
any
condu
cts
Enviro
nment
once
a
year
Once
in 2-3
years
Never
condu
cted
Never
condu
cted
0.5 0.
2
8
0.1
4
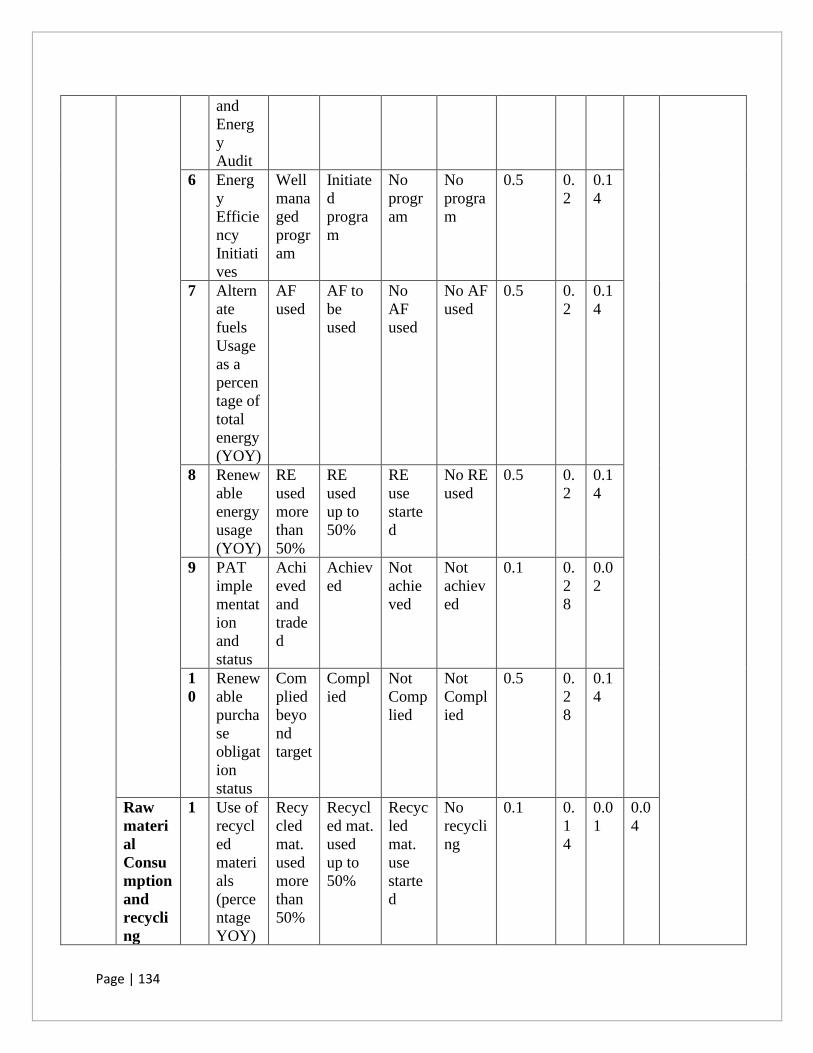
Page | 134
and
Energ
y
Audit
6 Energ
y
Efficie
ncy
Initiati
ves
Well
mana
ged
progr
am
Initiate
d
progra
m
No
progr
am
No
progra
m
0.5 0.
2
0.1
4
7 Altern
ate
fuels
Usage
as a
percen
tage of
total
energy
(YOY)
AF
used
AF to
be
used
No
AF
used
No AF
used
0.5 0.
2
0.1
4
8 Renew
able
energy
usage
(YOY)
RE
used
more
than
50%
RE
used
up to
50%
RE
use
starte
d
No RE
used
0.5 0.
2
0.1
4
9 PAT
imple
mentat
ion
and
status
Achi
eved
and
trade
d
Achiev
ed
Not
achie
ved
Not
achiev
ed
0.1 0.
2
8
0.0
2
1
0
Renew
able
purcha
se
obligat
ion
status
Com
plied
beyo
nd
target
Compl
ied
Not
Comp
lied
Not
Compl
ied
0.5 0.
2
8
0.1
4
Raw
materi
al
Consu
mption
and
recycli
ng
1 Use of
recycl
ed
materi
als
(perce
ntage
YOY)
Recy
cled
mat.
used
more
than
50%
Recycl
ed mat.
used
up to
50%
Recyc
led
mat.
use
starte
d
No
recycli
ng
0.1 0.
1
4
0.0
1
0.0
4
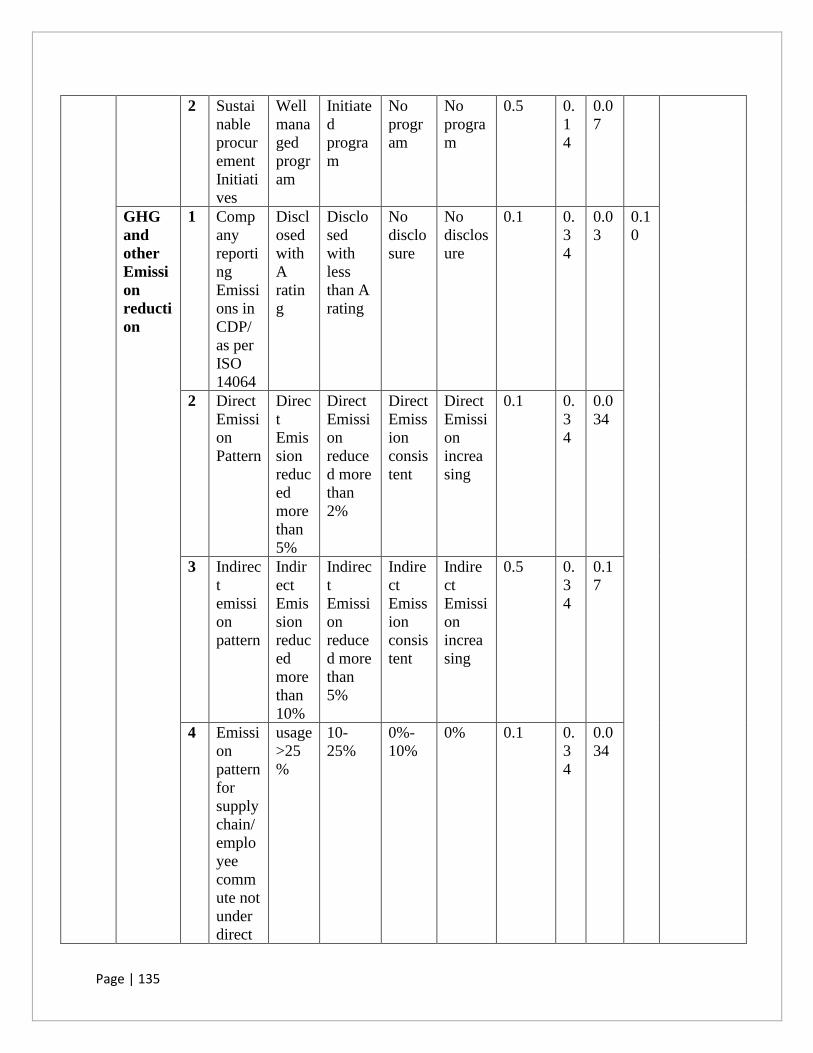
Page | 135
2 Sustai
nable
procur
ement
Initiati
ves
Well
mana
ged
progr
am
Initiate
d
progra
m
No
progr
am
No
progra
m
0.5 0.
1
4
0.0
7
GHG
and
other
Emissi
on
reducti
on
1 Comp
any
reporti
ng
Emissi
ons in
CDP/
as per
ISO
14064
Discl
osed
with
A
ratin
g
Disclo
sed
with
less
than A
rating
No
disclo
sure
No
disclos
ure
0.1 0.
3
4
0.0
3
0.1
0
2 Direct
Emissi
on
Pattern
Direc
t
Emis
sion
reduc
ed
more
than
5%
Direct
Emissi
on
reduce
d more
than
2%
Direct
Emiss
ion
consis
tent
Direct
Emissi
on
increa
sing
0.1 0.
3
4
0.0
34
3 Indirec
t
emissi
on
pattern
Indir
ect
Emis
sion
reduc
ed
more
than
10%
Indirec
t
Emissi
on
reduce
d more
than
5%
Indire
ct
Emiss
ion
consis
tent
Indire
ct
Emissi
on
increa
sing
0.5 0.
3
4
0.1
7
4 Emissi
on
pattern
for
supply
chain/
emplo
yee
comm
ute not
under
direct
usage
>25
%
10-
25%
0%-
10%
0% 0.1 0.
3
4
0.0
34
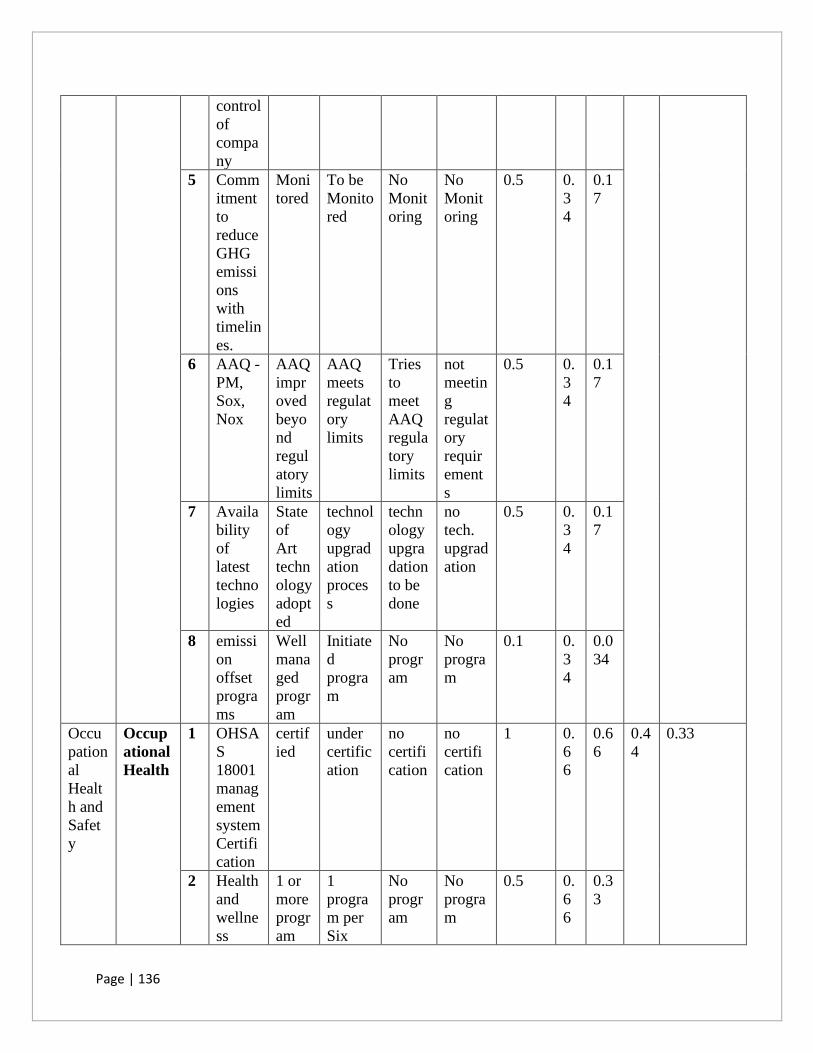
Page | 136
control
of
compa
ny
5 Comm
itment
to
reduce
GHG
emissi
ons
with
timelin
es.
Moni
tored
To be
Monito
red
No
Monit
oring
No
Monit
oring
0.5 0.
3
4
0.1
7
6 AAQ -
PM,
Sox,
Nox
AAQ
impr
oved
beyo
nd
regul
atory
limits
AAQ
meets
regulat
ory
limits
Tries
to
meet
AAQ
regula
tory
limits
not
meetin
g
regulat
ory
requir
ement
s
0.5 0.
3
4
0.1
7
7 Availa
bility
of
latest
techno
logies
State
of
Art
techn
ology
adopt
ed
technol
ogy
upgrad
ation
proces
s
techn
ology
upgra
dation
to be
done
no
tech.
upgrad
ation
0.5 0.
3
4
0.1
7
8 emissi
on
offset
progra
ms
Well
mana
ged
progr
am
Initiate
d
progra
m
No
progr
am
No
progra
m
0.1 0.
3
4
0.0
34
Occu
pation
al
Healt
h and
Safet
y
Occup
ational
Health
1 OHSA
S
18001
manag
ement
system
Certifi
cation
certif
ied
under
certific
ation
no
certifi
cation
no
certifi
cation
1 0.
6
6
0.6
6
0.4
4
0.33
2 Health
and
wellne
ss
1 or
more
progr
am
1
progra
m per
Six
No
progr
am
No
progra
m
0.5 0.
6
6
0.3
3
Page | 137
progra
ms in
1 year
per
mont
h/ qtr
Month/
year
3 Health
and
safety
progra
ms-
Hygie
ne,
ergono
mics
1 or
more
progr
am
per
mont
h/ qtr
1
progra
m per
Six
Month/
year
No
progr
am
No
progra
m
0.5 0.
6
6
0.3
3
Workp
lace
Safety
1 Freque
ncy
Rate
(FR) –
Numb
er of
record
able
incide
nts per
1
millio
n man-
hours
worke
d/year
(less
than
the
industr
y
averag
e)
Zero
FR
FR
above
25% of
the
industr
ial
averag
e
FR
above
50%
of the
indust
rial
avera
ge
highes
t in
industr
y
1 0.
3
3
0.3
3
0.2
7
2 Loss
time
injury
zero
fatal
incid
ent
Minor
Incide
nt but
no
fatal
inciden
t
fatal
incide
nt
fatal
incide
nt last
two
years
0.5 0.
3
3
0.1
6
3 Progra
m on
Behavi
our
Well
mana
ged
Initiate
d
progra
m
No
progr
am
No
progra
m
0.5 0.
3
3
0.1
6
Page | 138
based
safety
progr
am
initiate
d yet
4 EHS
Traini
ngs
Well
mana
ged
progr
am
Initiate
d
progra
m
No
progr
am
No
progra
m
initiate
d yet
1 0.
3
3
0.3
3
5 Safe
work
place
initiati
ves to
boost
emplo
yee
morale
Well
mana
ged
progr
am
Initiate
d
progra
m
No
progr
am
No
progra
m
initiate
d yet
1 0.
3
3
0.3
3
6 EHS
commi
ttee
and
meetin
gs
Well
mana
ged
progr
am
Initiate
d
progra
m
No
progr
am
No
progra
m
initiate
d yet
1 0.
3
3
0.3
3
Com
munit
y
EHS
Practi
ces/
initiat
ive
Enviro
nment
Initiati
ves-
Water
conser
vation
and
forestr
y and
basic
amenit
ies
1 Project
s on
provid
ing
basic
amenit
ies
Resul
ts
moni
tored
and
quant
ified
Results
monito
red but
not
quantif
ied
No
progr
am
No
progra
m
initiate
d yet
0.5 0.
5
2
0.2
6
0.1
8
0.18
2 Project
s on
promo
ting
sustain
able
agricul
ture
and
forestr
y
Resul
ts
moni
tored
and
quant
ified
Results
monito
red but
not
quantif
ied
No
progr
am
No
progra
m
initiate
d yet
0.5 0.
5
2
0.2
6
3 Access
to
impro
ved
drinki
ng
Resul
ts
moni
tored
and
Results
monito
red but
not
quantif
ied
No
progr
am
No
progra
m
initiate
d yet
0.5 0.
5
2
0.2
6
Page | 139
water
source
quant
ified
4 Project
s on
waters
hed
protect
ion
Resul
ts
moni
tored
and
quant
ified
Results
monito
red but
not
quantif
ied
No
progr
am
No
progra
m
initiate
d yet
0.1 0.
5
2
0.0
5
Comm
unity
project
-Green
Belt
develo
pment
5 Project
s on
Biodiv
ersity
Resul
ts
moni
tored
and
quant
ified
Results
monito
red but
not
quantif
ied
No
progr
am
No
progra
m
initiate
d yet
0.5 0.
1
4
0.0
7
0.0
7
6 Project
s to
impro
ve
forest
cover
Resul
ts
moni
tored
and
quant
ified
Results
monito
red but
not
quantif
ied
No
progr
am
No
progra
m
initiate
d yet
0.5 0.
1
4
0.0
7
Comm
unity
project
-
Comm
unity
Health
care
7 Comm
unity
wellne
ss
progra
m
Resul
ts
moni
tored
and
quant
ified
Results
monito
red but
not
quantif
ied
No
progr
am
No
progra
m
initiate
d yet
1 0.
3
3
0.3
3
0.3
3
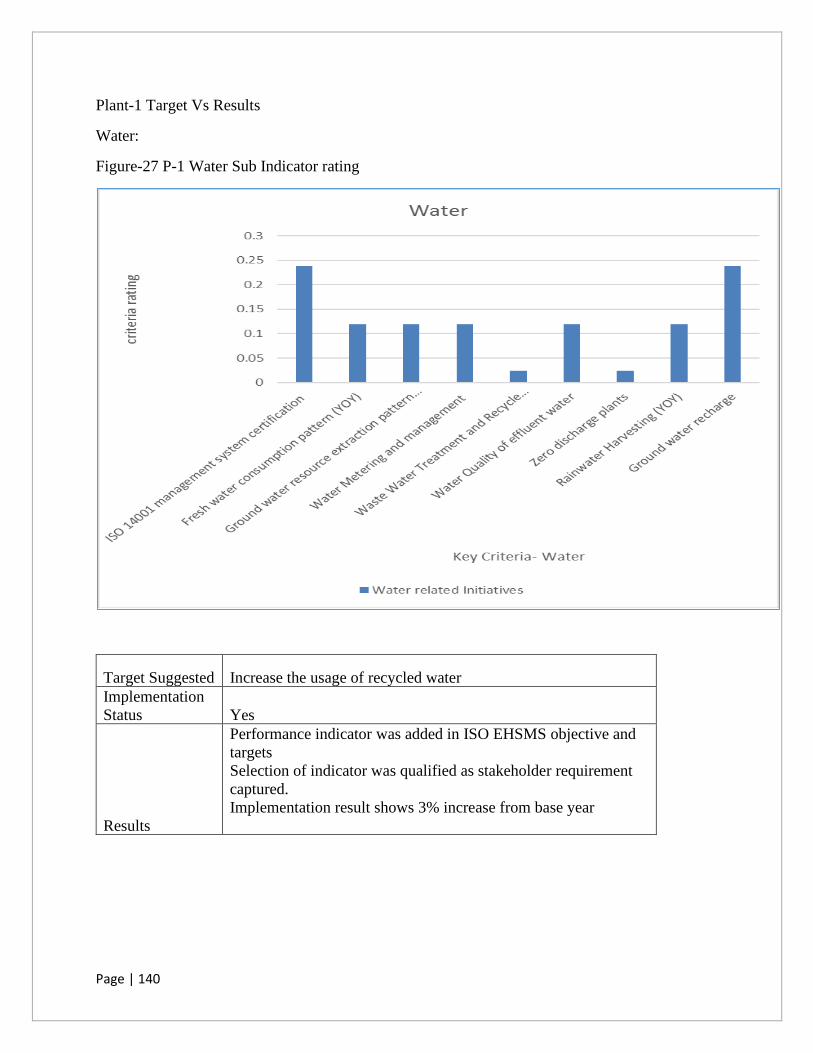
Page | 140
Plant-1 Target Vs Results
Water:
Figure-27 P-1 Water Sub Indicator rating
Target Suggested Increase the usage of recycled water Implementation
Status Yes
Results
Performance indicator was added in ISO EHSMS objective and
targets
Selection of indicator was qualified as stakeholder requirement
captured.
Implementation result shows 3% increase from base year
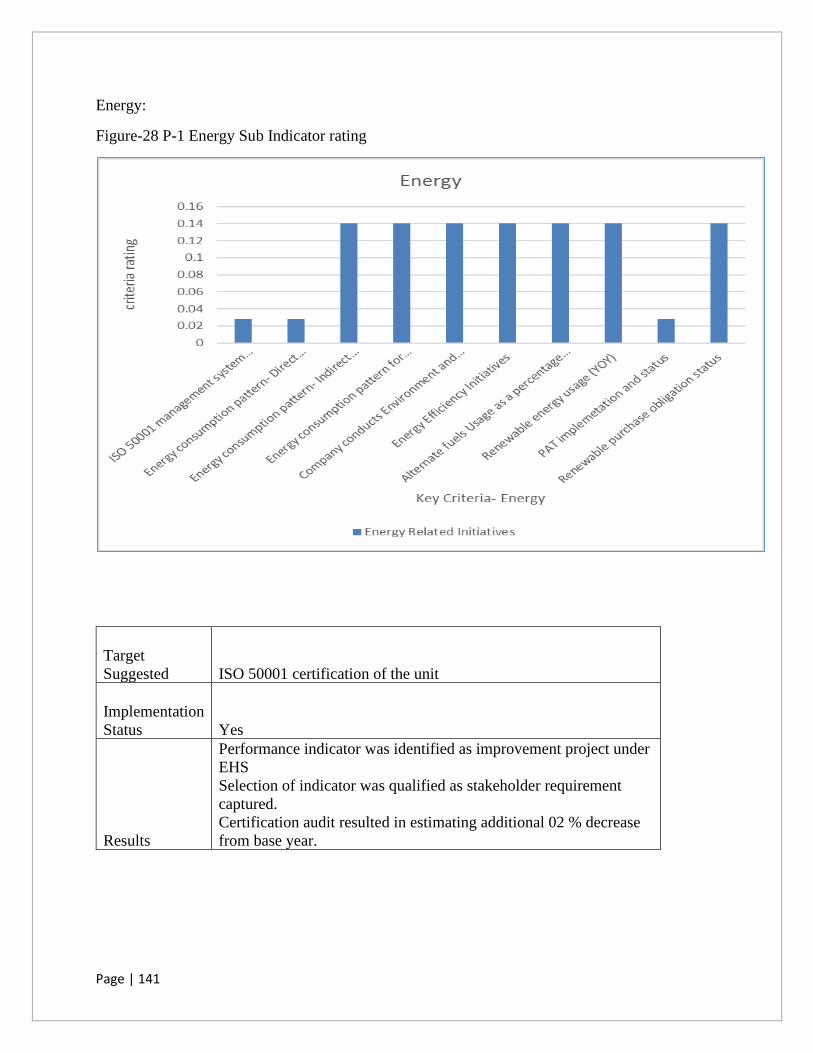
Page | 141
Energy:
Figure-28 P-1 Energy Sub Indicator rating
Target
Suggested ISO 50001 certification of the unit
Implementation
Status Yes
Results
Performance indicator was identified as improvement project under
EHS
Selection of indicator was qualified as stakeholder requirement
captured.
Certification audit resulted in estimating additional 02 % decrease
from base year.
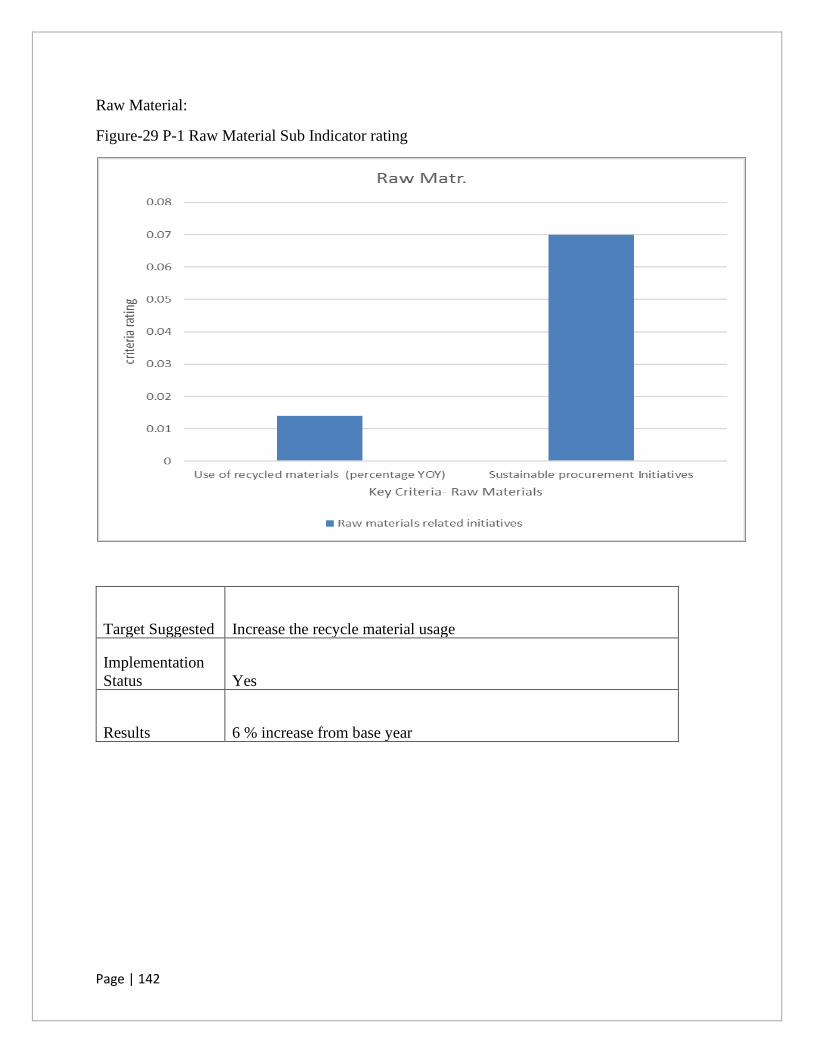
Page | 142
Raw Material:
Figure-29 P-1 Raw Material Sub Indicator rating
Target Suggested Increase the recycle material usage
Implementation
Status Yes
Results 6 % increase from base year
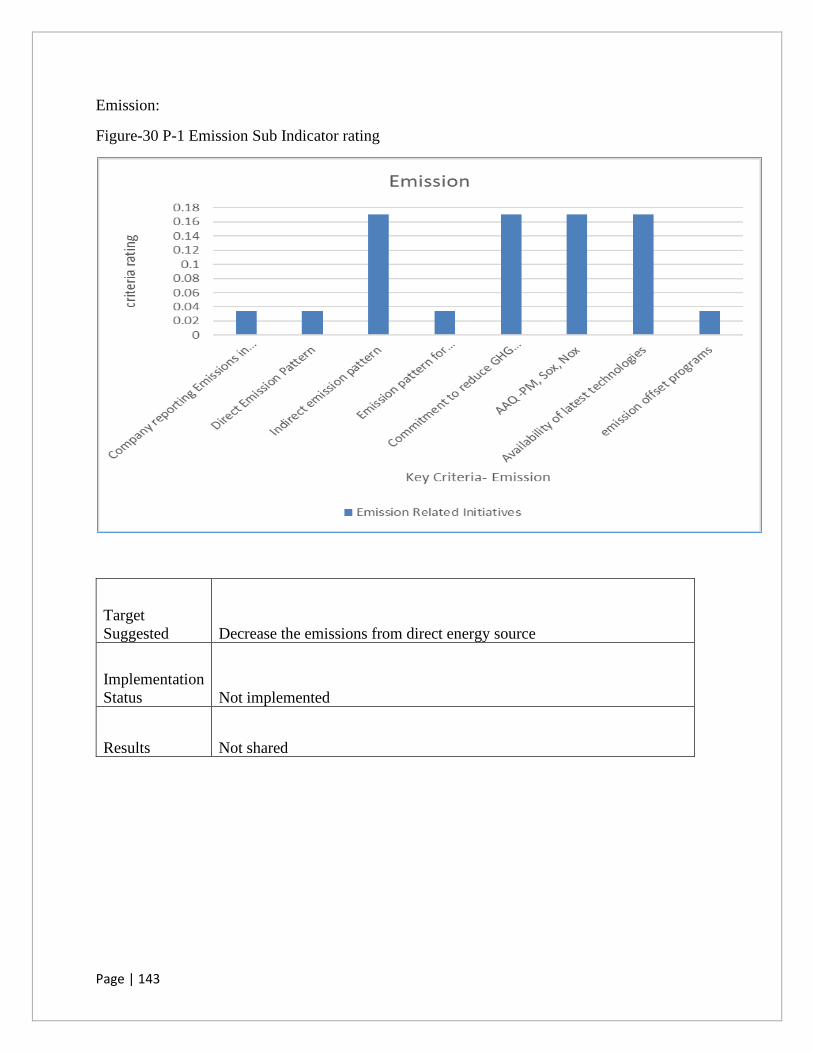
Page | 143
Emission:
Figure-30 P-1 Emission Sub Indicator rating
Target
Suggested Decrease the emissions from direct energy source
Implementation
Status Not implemented
Results Not shared
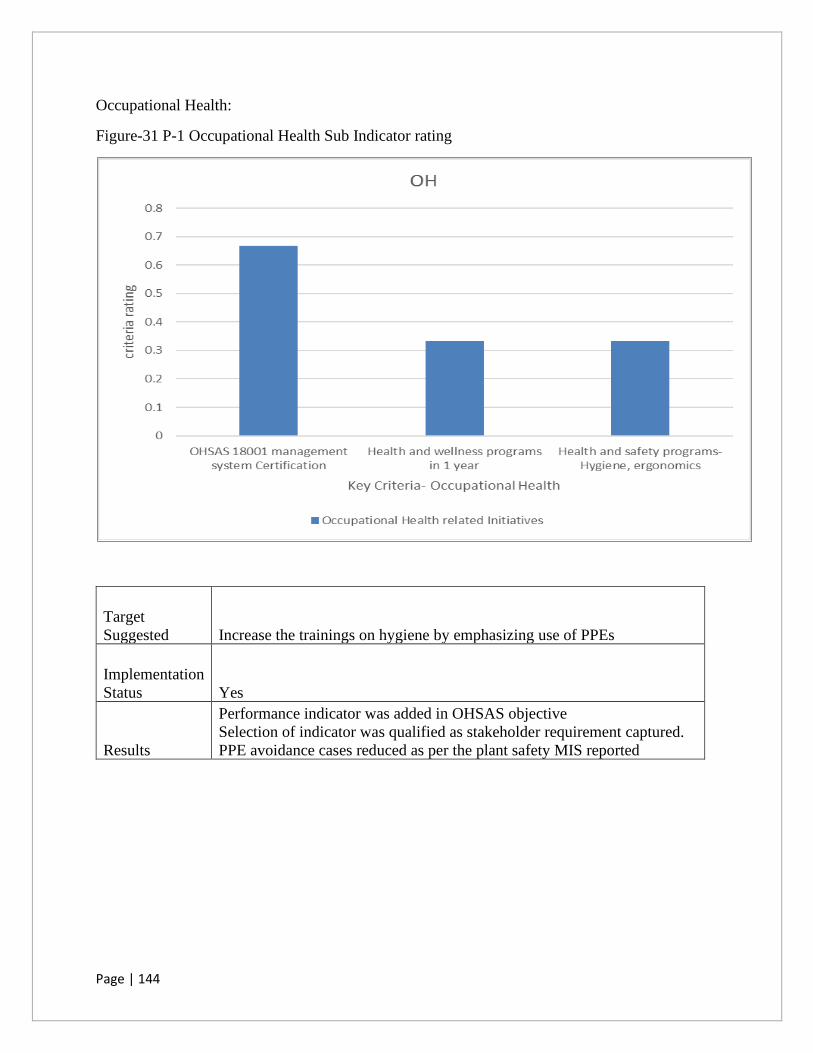
Page | 144
Occupational Health:
Figure-31 P-1 Occupational Health Sub Indicator rating
Target
Suggested Increase the trainings on hygiene by emphasizing use of PPEs
Implementation
Status Yes
Results
Performance indicator was added in OHSAS objective
Selection of indicator was qualified as stakeholder requirement captured.
PPE avoidance cases reduced as per the plant safety MIS reported
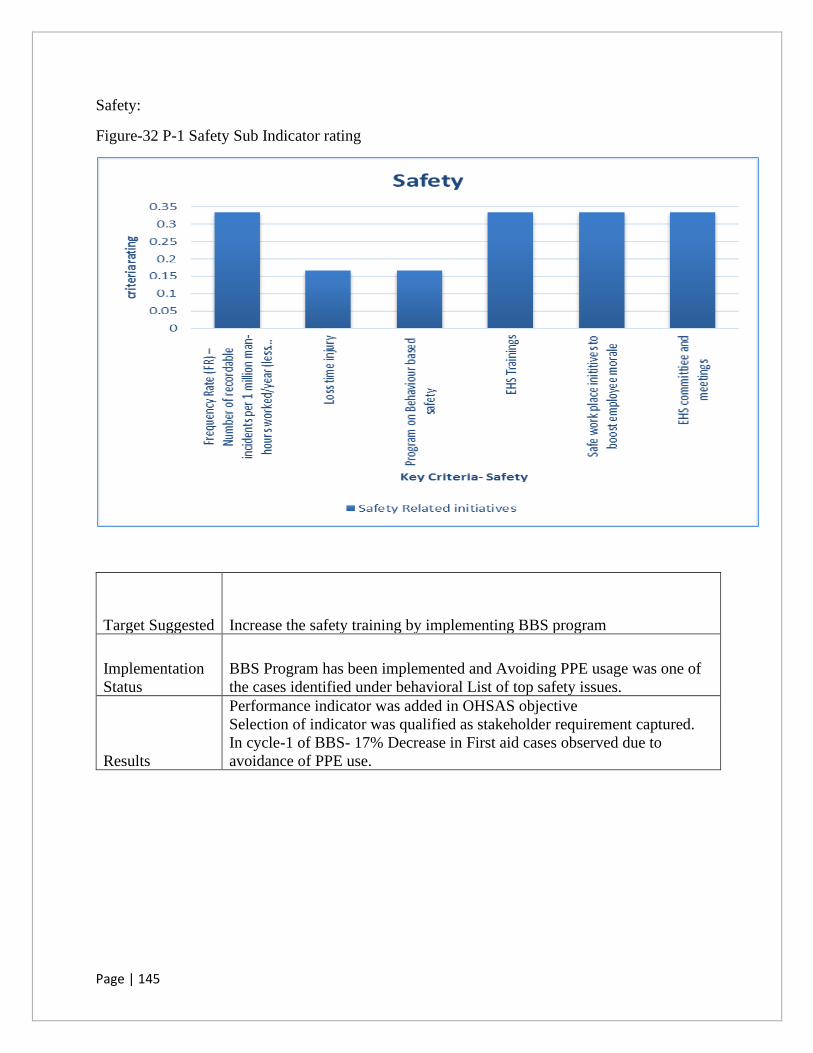
Page | 145
Safety:
Figure-32 P-1 Safety Sub Indicator rating
Target Suggested Increase the safety training by implementing BBS program
Implementation
Status
BBS Program has been implemented and Avoiding PPE usage was one of
the cases identified under behavioral List of top safety issues.
Results
Performance indicator was added in OHSAS objective
Selection of indicator was qualified as stakeholder requirement captured.
In cycle-1 of BBS- 17% Decrease in First aid cases observed due to
avoidance of PPE use.

Page | 146
Community EHS:
Figure-33 P-1 Community EHS Sub Indicator rating
Target Suggested Focus on water related program for community
Implementation
Status
Yes
Results Safe drinking water project was implemented by spending on water
sanitization project.
Improved Survey results were observed in CSR report.
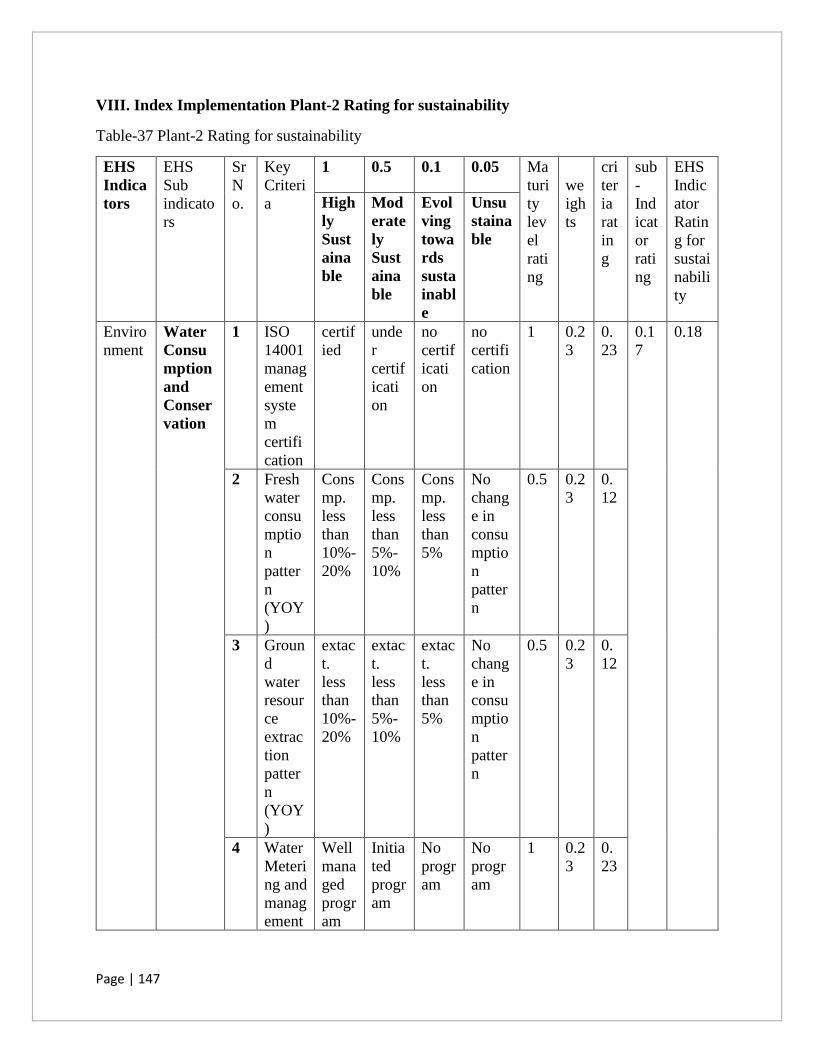
Page | 147
VIII. Index Implementation Plant-2 Rating for sustainability
Table-37 Plant-2 Rating for sustainability
EHS
Indica
tors
EHS
Sub
indicato
rs
Sr
N
o.
Key
Criteri
a
1 0.5 0.1 0.05 Ma
turi
ty
lev
el
rati
ng
we
igh
ts
cri
ter
ia
rat
in
g
sub
-
Ind
icat
or
rati
ng
EHS
Indic
ator
Ratin
g for
sustai
nabili
ty
High
ly
Sust
aina
ble
Mod
erate
ly
Sust
aina
ble
Evol
ving
towa
rds
susta
inabl
e
Unsu
staina
ble
Enviro
nment
Water
Consu
mption
and
Conser
vation
1 ISO
14001
manag
ement
syste
m
certifi
cation
certif
ied
unde
r
certif
icati
on
no
certif
icati
on
no
certifi
cation
1 0.2
3
0.
23
0.1
7
0.18
2 Fresh
water
consu
mptio
n
patter
n
(YOY
)
Cons
mp.
less
than
10%-
20%
Cons
mp.
less
than
5%-
10%
Cons
mp.
less
than
5%
No
chang
e in
consu
mptio
n
patter
n
0.5 0.2
3
0.
12
3 Groun
d
water
resour
ce
extrac
tion
patter
n
(YOY
)
extac
t.
less
than
10%-
20%
extac
t.
less
than
5%-
10%
extac
t.
less
than
5%
No
chang
e in
consu
mptio
n
patter
n
0.5 0.2
3
0.
12
4 Water
Meteri
ng and
manag
ement
Well
mana
ged
progr
am
Initia
ted
progr
am
No
progr
am
No
progr
am
1 0.2
3
0.
23
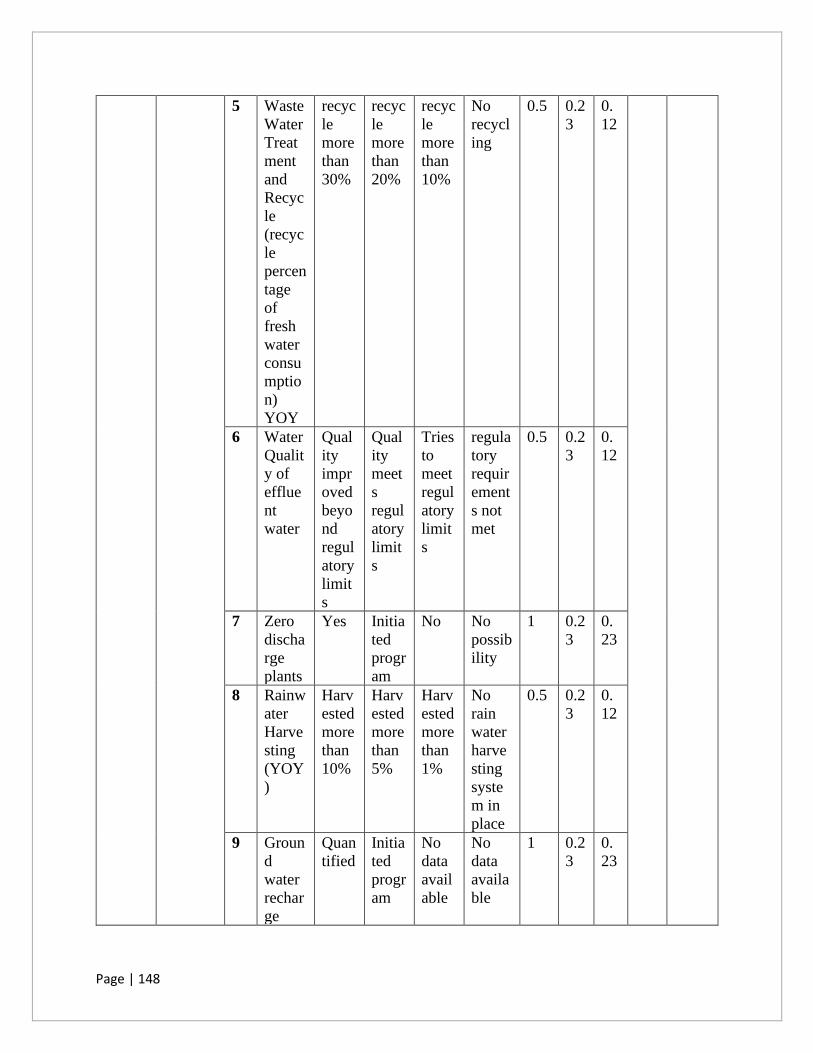
Page | 148
5 Waste
Water
Treat
ment
and
Recyc
le
(recyc
le
percen
tage
of
fresh
water
consu
mptio
n)
YOY
recyc
le
more
than
30%
recyc
le
more
than
20%
recyc
le
more
than
10%
No
recycl
ing
0.5 0.2
3
0.
12
6 Water
Qualit
y of
efflue
nt
water
Qual
ity
impr
oved
beyo
nd
regul
atory
limit
s
Qual
ity
meet
s
regul
atory
limit
s
Tries
to
meet
regul
atory
limit
s
regula
tory
requir
ement
s not
met
0.5 0.2
3
0.
12
7 Zero
discha
rge
plants
Yes Initia
ted
progr
am
No No
possib
ility
1 0.2
3
0.
23
8 Rainw
ater
Harve
sting
(YOY
)
Harv
ested
more
than
10%
Harv
ested
more
than
5%
Harv
ested
more
than
1%
No
rain
water
harve
sting
syste
m in
place
0.5 0.2
3
0.
12
9 Groun
d
water
rechar
ge
Quan
tified
Initia
ted
progr
am
No
data
avail
able
No
data
availa
ble
1 0.2
3
0.
23
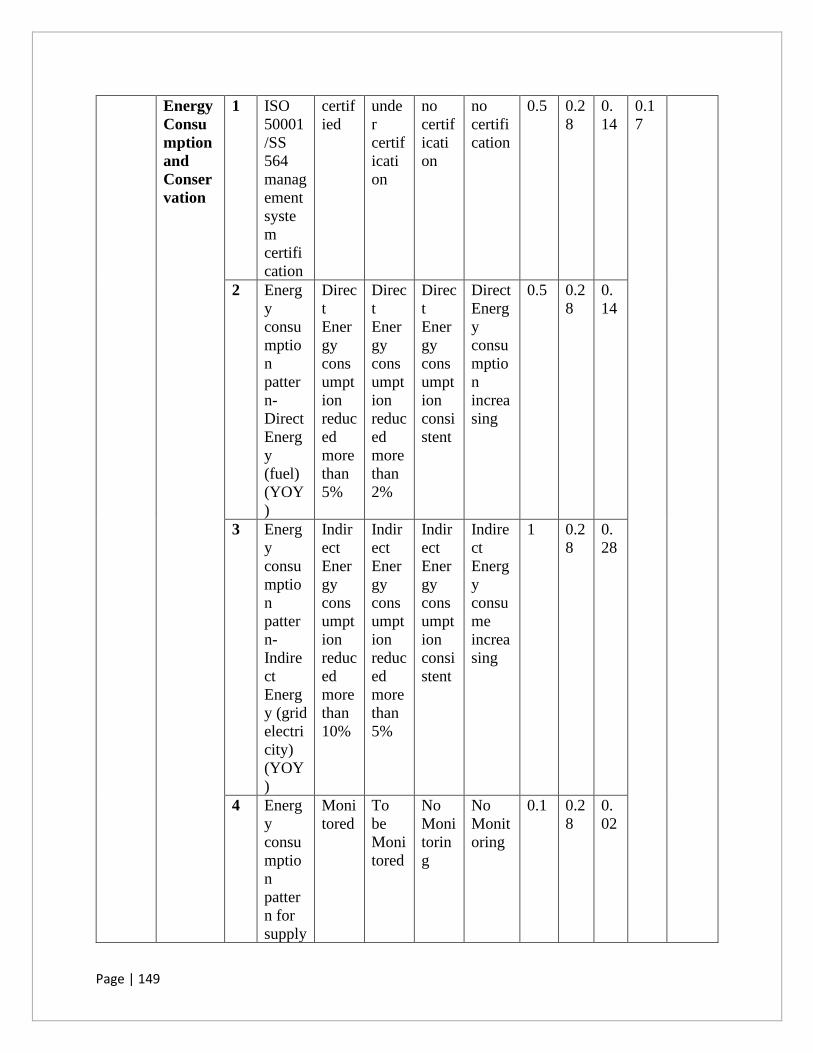
Page | 149
Energy
Consu
mption
and
Conser
vation
1 ISO
50001
/SS
564
manag
ement
syste
m
certifi
cation
certif
ied
unde
r
certif
icati
on
no
certif
icati
on
no
certifi
cation
0.5 0.2
8
0.
14
0.1
7
2 Energ
y
consu
mptio
n
patter
n-
Direct
Energ
y
(fuel)
(YOY
)
Direc
t
Ener
gy
cons
umpt
ion
reduc
ed
more
than
5%
Direc
t
Ener
gy
cons
umpt
ion
reduc
ed
more
than
2%
Direc
t
Ener
gy
cons
umpt
ion
consi
stent
Direct
Energ
y
consu
mptio
n
increa
sing
0.5 0.2
8
0.
14
3 Energ
y
consu
mptio
n
patter
n-
Indire
ct
Energ
y (grid
electri
city)
(YOY
)
Indir
ect
Ener
gy
cons
umpt
ion
reduc
ed
more
than
10%
Indir
ect
Ener
gy
cons
umpt
ion
reduc
ed
more
than
5%
Indir
ect
Ener
gy
cons
umpt
ion
consi
stent
Indire
ct
Energ
y
consu
me
increa
sing
1 0.2
8
0.
28
4 Energ
y
consu
mptio
n
patter
n for
supply
Moni
tored
To
be
Moni
tored
No
Moni
torin
g
No
Monit
oring
0.1 0.2
8
0.
02
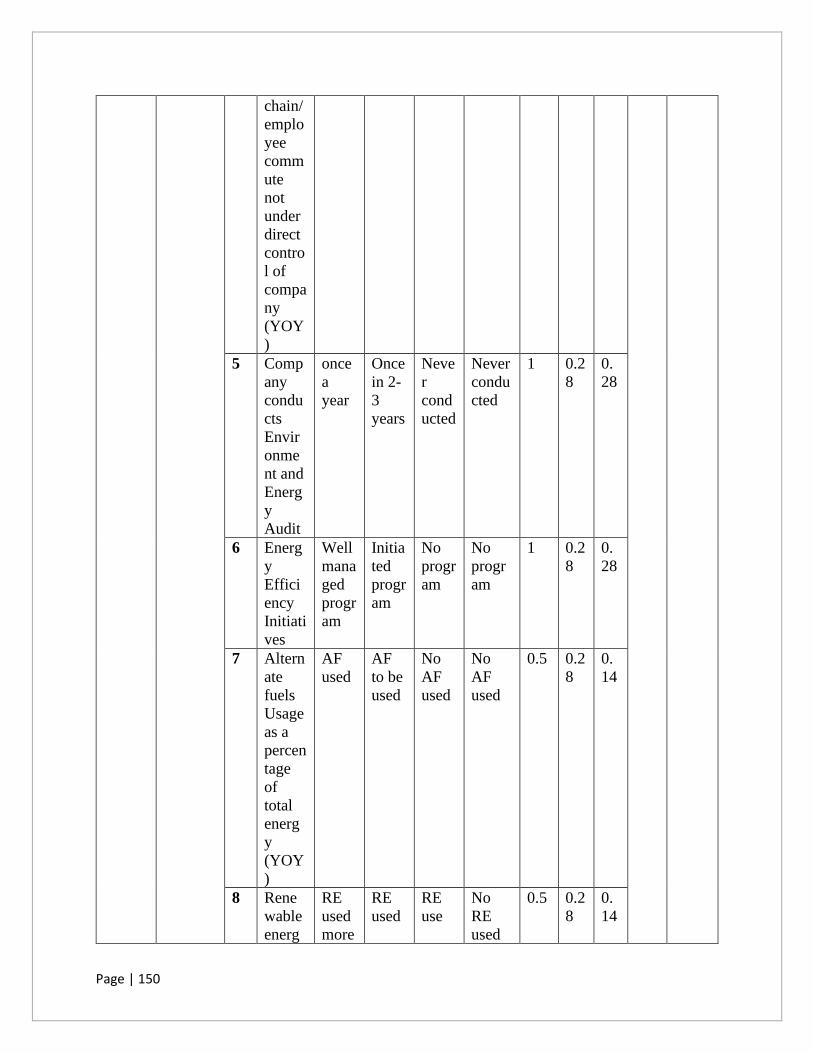
Page | 150
chain/
emplo
yee
comm
ute
not
under
direct
contro
l of
compa
ny
(YOY
)
5 Comp
any
condu
cts
Envir
onme
nt and
Energ
y
Audit
once
a
year
Once
in 2-
3
years
Neve
r
cond
ucted
Never
condu
cted
1 0.2
8
0.
28
6 Energ
y
Effici
ency
Initiati
ves
Well
mana
ged
progr
am
Initia
ted
progr
am
No
progr
am
No
progr
am
1 0.2
8
0.
28
7 Altern
ate
fuels
Usage
as a
percen
tage
of
total
energ
y
(YOY
)
AF
used
AF
to be
used
No
AF
used
No
AF
used
0.5 0.2
8
0.
14
8 Rene
wable
energ
RE
used
more
RE
used
RE
use
No
RE
used
0.5 0.2
8
0.
14
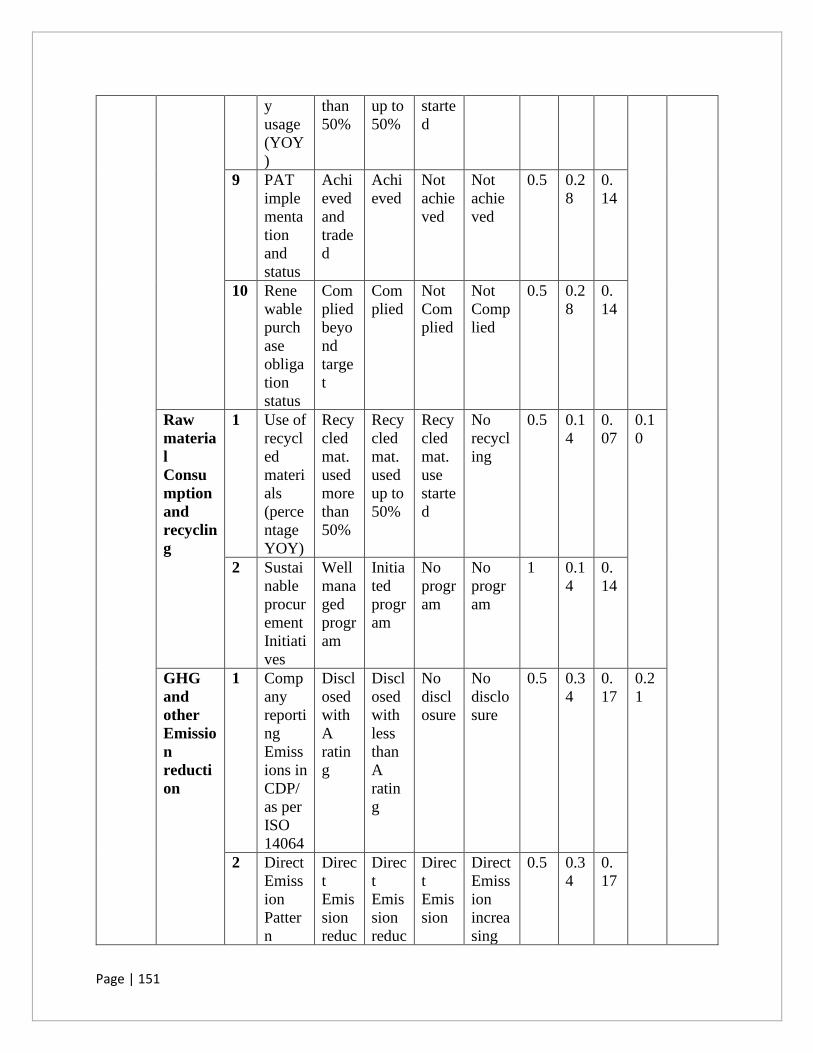
Page | 151
y
usage
(YOY
)
than
50%
up to
50%
starte
d
9 PAT
imple
menta
tion
and
status
Achi
eved
and
trade
d
Achi
eved
Not
achie
ved
Not
achie
ved
0.5 0.2
8
0.
14
10 Rene
wable
purch
ase
obliga
tion
status
Com
plied
beyo
nd
targe
t
Com
plied
Not
Com
plied
Not
Comp
lied
0.5 0.2
8
0.
14
Raw
materia
l
Consu
mption
and
recyclin
g
1 Use of
recycl
ed
materi
als
(perce
ntage
YOY)
Recy
cled
mat.
used
more
than
50%
Recy
cled
mat.
used
up to
50%
Recy
cled
mat.
use
starte
d
No
recycl
ing
0.5 0.1
4
0.
07
0.1
0
2 Sustai
nable
procur
ement
Initiati
ves
Well
mana
ged
progr
am
Initia
ted
progr
am
No
progr
am
No
progr
am
1 0.1
4
0.
14
GHG
and
other
Emissio
n
reducti
on
1 Comp
any
reporti
ng
Emiss
ions in
CDP/
as per
ISO
14064
Discl
osed
with
A
ratin
g
Discl
osed
with
less
than
A
ratin
g
No
discl
osure
No
disclo
sure
0.5 0.3
4
0.
17
0.2
1
2 Direct
Emiss
ion
Patter
n
Direc
t
Emis
sion
reduc
Direc
t
Emis
sion
reduc
Direc
t
Emis
sion
Direct
Emiss
ion
increa
sing
0.5 0.3
4
0.
17
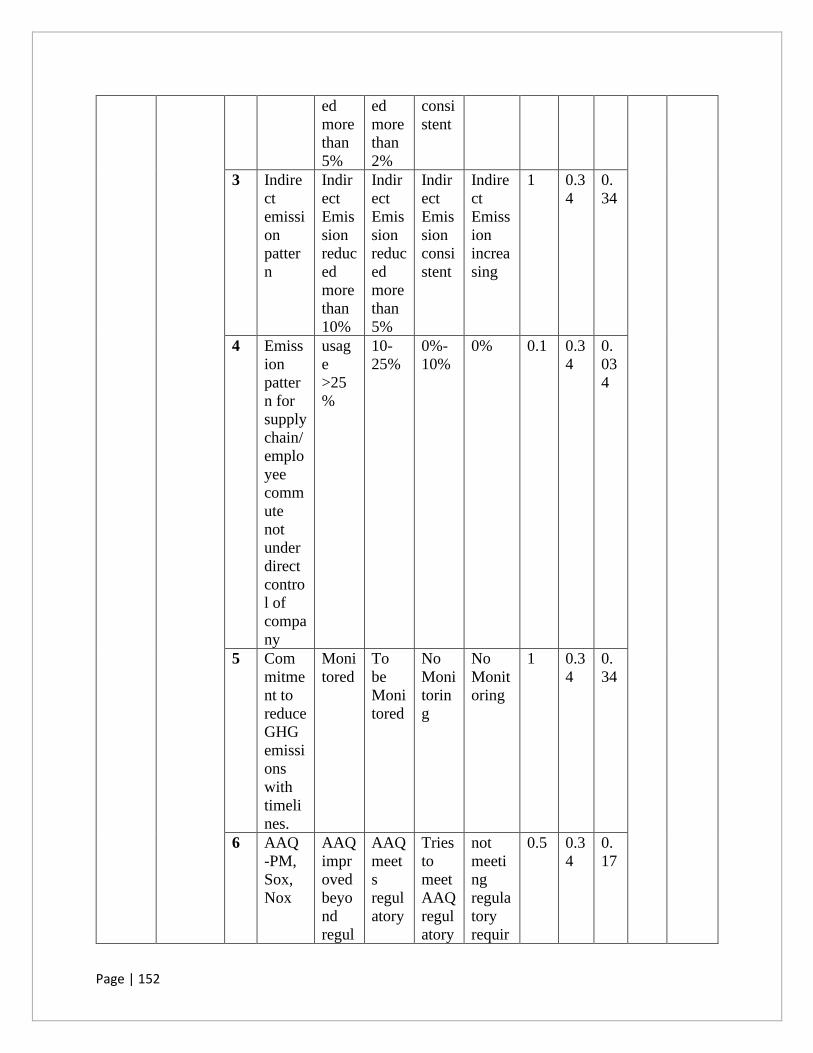
Page | 152
ed
more
than
5%
ed
more
than
2%
consi
stent
3 Indire
ct
emissi
on
patter
n
Indir
ect
Emis
sion
reduc
ed
more
than
10%
Indir
ect
Emis
sion
reduc
ed
more
than
5%
Indir
ect
Emis
sion
consi
stent
Indire
ct
Emiss
ion
increa
sing
1 0.3
4
0.
34
4 Emiss
ion
patter
n for
supply
chain/
emplo
yee
comm
ute
not
under
direct
contro
l of
compa
ny
usag
e
>25
%
10-
25%
0%-
10%
0% 0.1 0.3
4
0.
03
4
5 Com
mitme
nt to
reduce
GHG
emissi
ons
with
timeli
nes.
Moni
tored
To
be
Moni
tored
No
Moni
torin
g
No
Monit
oring
1 0.3
4
0.
34
6 AAQ
-PM,
Sox,
Nox
AAQ
impr
oved
beyo
nd
regul
AAQ
meet
s
regul
atory
Tries
to
meet
AAQ
regul
atory
not
meeti
ng
regula
tory
requir
0.5 0.3
4
0.
17

Page | 153
atory
limit
s
limit
s
limit
s
ement
s
7 Availa
bility
of
latest
techno
logies
State
of
Art
techn
olog
y
adop
ted
techn
olog
y
upgr
adati
on
proce
ss
techn
olog
y
upgr
adati
on to
be
done
no
tech.
upgra
dation
0.5 1 0.
5
8 emissi
on
offset
progra
ms
Well
mana
ged
progr
am
Initia
ted
progr
am
No
progr
am
No
progr
am
0.1 0.3
4
0.
03
Occup
ational
Health
and
Safety
Occupa
tional
Health
1 OHS
AS
18001
manag
ement
syste
m
Certifi
cation
certif
ied
unde
r
certif
icati
on
no
certif
icati
on
no
certifi
cation
1 0.6
6
0.
66
0.5
5
0.38
2 Health
and
wellne
ss
progra
ms in
1 year
1 or
more
progr
am
per
mont
h/ qtr
1
progr
am
per
Six
Mont
h/
year
No
progr
am
No
progr
am
1 0.6
6
0.
66
3 Health
and
safety
progra
ms-
Hygie
ne,
ergon
omics
1 or
more
progr
am
per
mont
h/ qtr
1
progr
am
per
Six
Mont
h/
year
No
progr
am
No
progr
am
0.5 0.6
6
0.
33
Workpl
ace
Safety
1 Frequ
ency
Rate
(FR) –
Zero
FR
FR
abov
e
25%
FR
abov
e
50%
highe
st in
indust
ry
1 0.3
3
0.
33
0.3
0

Page | 154
Numb
er of
record
able
incide
nts per
1
millio
n
man-
hours
worke
d/year
(less
than
the
indust
ry
averag
e)
of
the
indus
trial
avera
ge
of
the
indus
trial
avera
ge
2 Loss
time
injury
zero
fatal
incid
ent
Mino
r
Incid
ent
but
no
fatal
incid
ent
fatal
incid
ent
fatal
incide
nt last
two
years
1 0.3
3
0.
33
3 Progra
m on
Behav
iour
based
safety
Well
mana
ged
progr
am
Initia
ted
progr
am
No
progr
am
No
progr
am
initiat
ed yet
0.5 0.3
3
0.
16
4 EHS
Traini
ngs
Well
mana
ged
progr
am
Initia
ted
progr
am
No
progr
am
No
progr
am
initiat
ed yet
1 0.3
3
0.
33
5 Safe
work
place
initiati
ves to
boost
Well
mana
ged
progr
am
Initia
ted
progr
am
No
progr
am
No
progr
am
initiat
ed yet
1 0.3
3
0.
33
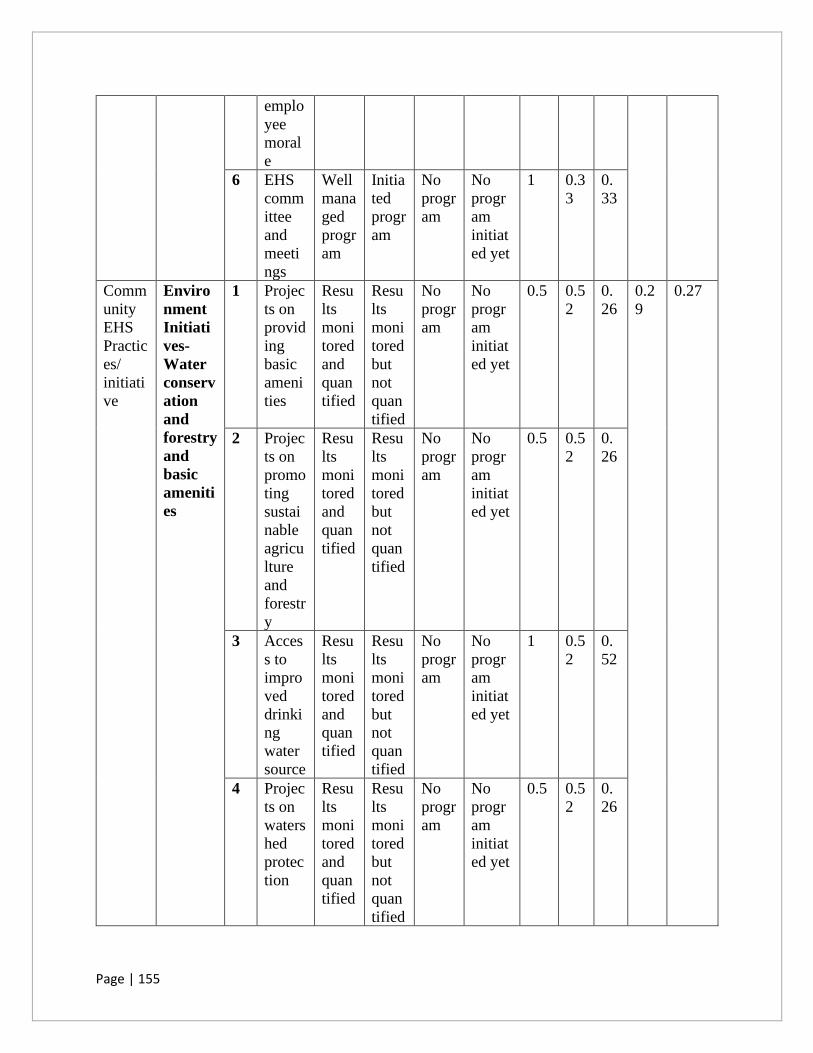
Page | 155
emplo
yee
moral
e
6 EHS
comm
ittee
and
meeti
ngs
Well
mana
ged
progr
am
Initia
ted
progr
am
No
progr
am
No
progr
am
initiat
ed yet
1 0.3
3
0.
33
Comm
unity
EHS
Practic
es/
initiati
ve
Enviro
nment
Initiati
ves-
Water
conserv
ation
and
forestry
and
basic
ameniti
es
1 Projec
ts on
provid
ing
basic
ameni
ties
Resu
lts
moni
tored
and
quan
tified
Resu
lts
moni
tored
but
not
quan
tified
No
progr
am
No
progr
am
initiat
ed yet
0.5 0.5
2
0.
26
0.2
9
0.27
2 Projec
ts on
promo
ting
sustai
nable
agricu
lture
and
forestr
y
Resu
lts
moni
tored
and
quan
tified
Resu
lts
moni
tored
but
not
quan
tified
No
progr
am
No
progr
am
initiat
ed yet
0.5 0.5
2
0.
26
3 Acces
s to
impro
ved
drinki
ng
water
source
Resu
lts
moni
tored
and
quan
tified
Resu
lts
moni
tored
but
not
quan
tified
No
progr
am
No
progr
am
initiat
ed yet
1 0.5
2
0.
52
4 Projec
ts on
waters
hed
protec
tion
Resu
lts
moni
tored
and
quan
tified
Resu
lts
moni
tored
but
not
quan
tified
No
progr
am
No
progr
am
initiat
ed yet
0.5 0.5
2
0.
26
Page | 156
Comm
unity
project-
Green
Belt
develop
ment
5 Projec
ts on
Biodi
versit
y
Resu
lts
moni
tored
and
quan
tified
Resu
lts
moni
tored
but
not
quan
tified
No
progr
am
No
progr
am
initiat
ed yet
1 0.1
4
0.
14
0.1
4
6 Projec
ts to
impro
ve
forest
cover
Resu
lts
moni
tored
and
quan
tified
Resu
lts
moni
tored
but
not
quan
tified
No
progr
am
No
progr
am
initiat
ed yet
1 0.1
4
0.
14
Comm
unity
project-
Comm
unity
Healthc
are
7 Com
munit
y
wellne
ss
progra
m
Resu
lts
moni
tored
and
quan
tified
Resu
lts
moni
tored
but
not
quan
tified
No
progr
am
No
progr
am
initiat
ed yet
1 0.3
3
0.
33
0.3
3
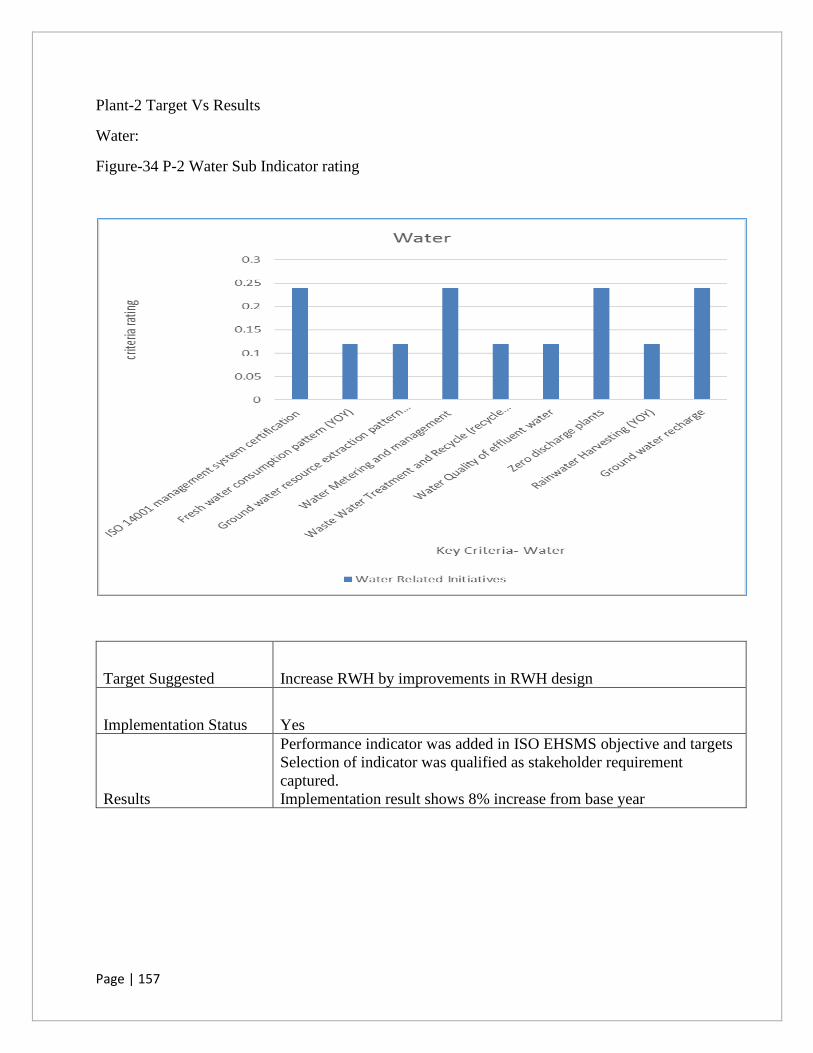
Page | 157
Plant-2 Target Vs Results
Water:
Figure-34 P-2 Water Sub Indicator rating
Target Suggested Increase RWH by improvements in RWH design
Implementation Status Yes
Results
Performance indicator was added in ISO EHSMS objective and targets
Selection of indicator was qualified as stakeholder requirement
captured.
Implementation result shows 8% increase from base year

Page | 158
Energy:
Figure-35 P-2 Energy Sub Indicator rating
Target Suggested
Scope 3 energy to be monitored and tracked to measure the potential
reduction in future
Implementation Status Tracking started and reduction target to be decided
Results
Performance indicator was identified as improvement project under
EHSMS
Monitoring started and it has been recognized as one of the effective
initiatives under energy saving under supply chain category.

Page | 159
Raw Material:
Figure-36 P-2 Raw Material Sub Indicator rating
Target Suggested Increase the recycle material usage
Implementation Status Yes
Results
6 % increase from base year
Under ISO objective and target it has been identified as resource
conservation potential area and targeted under sustainability target.
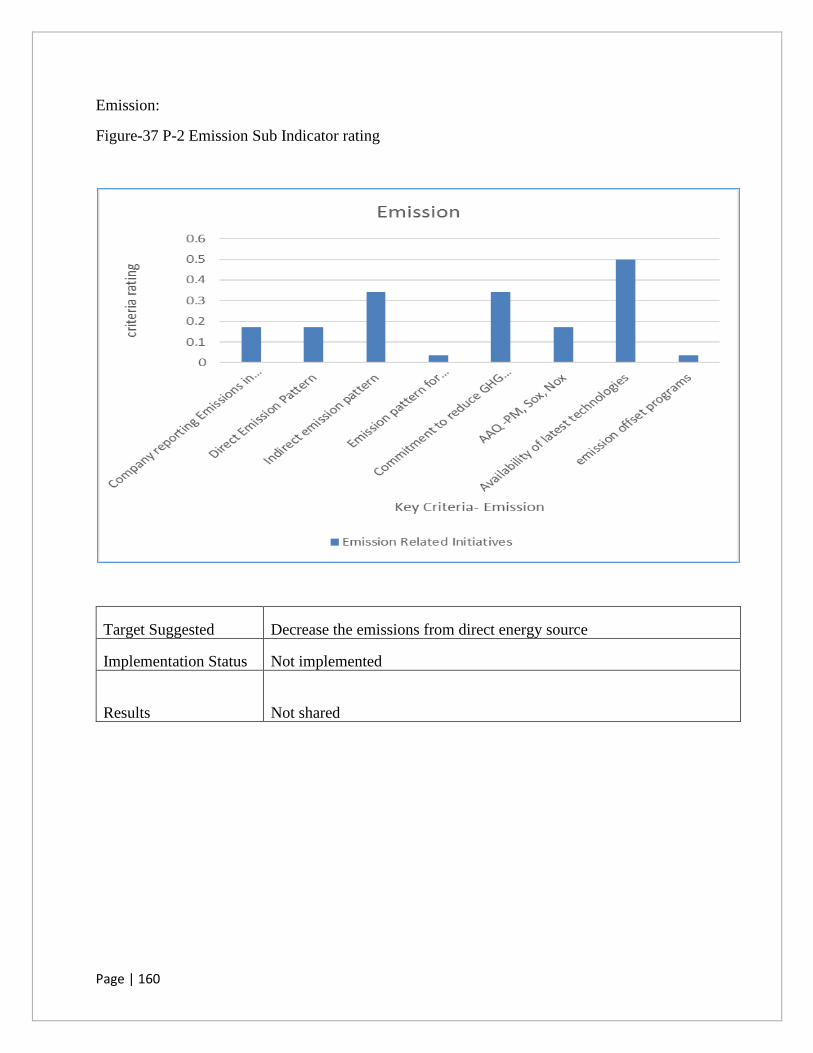
Page | 160
Emission:
Figure-37 P-2 Emission Sub Indicator rating
Target Suggested Decrease the emissions from direct energy source
Implementation Status Not implemented
Results Not shared
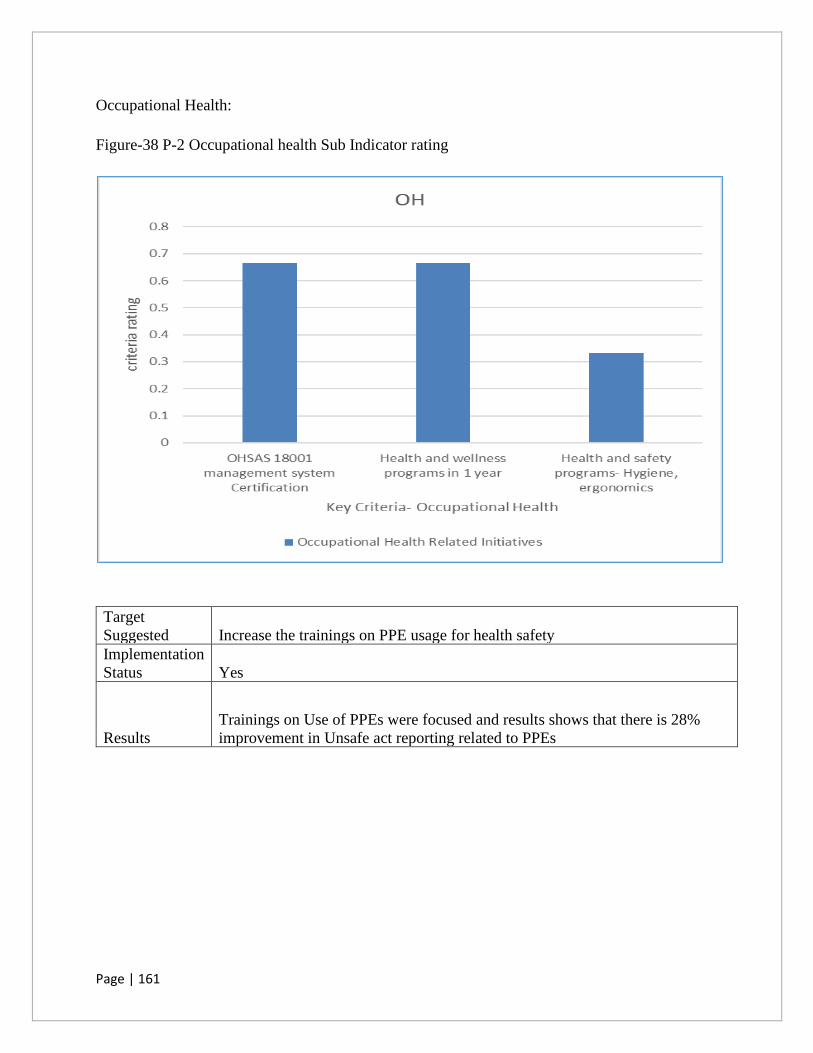
Page | 161
Occupational Health:
Figure-38 P-2 Occupational health Sub Indicator rating
Target
Suggested Increase the trainings on PPE usage for health safety
Implementation
Status Yes
Results
Trainings on Use of PPEs were focused and results shows that there is 28%
improvement in Unsafe act reporting related to PPEs
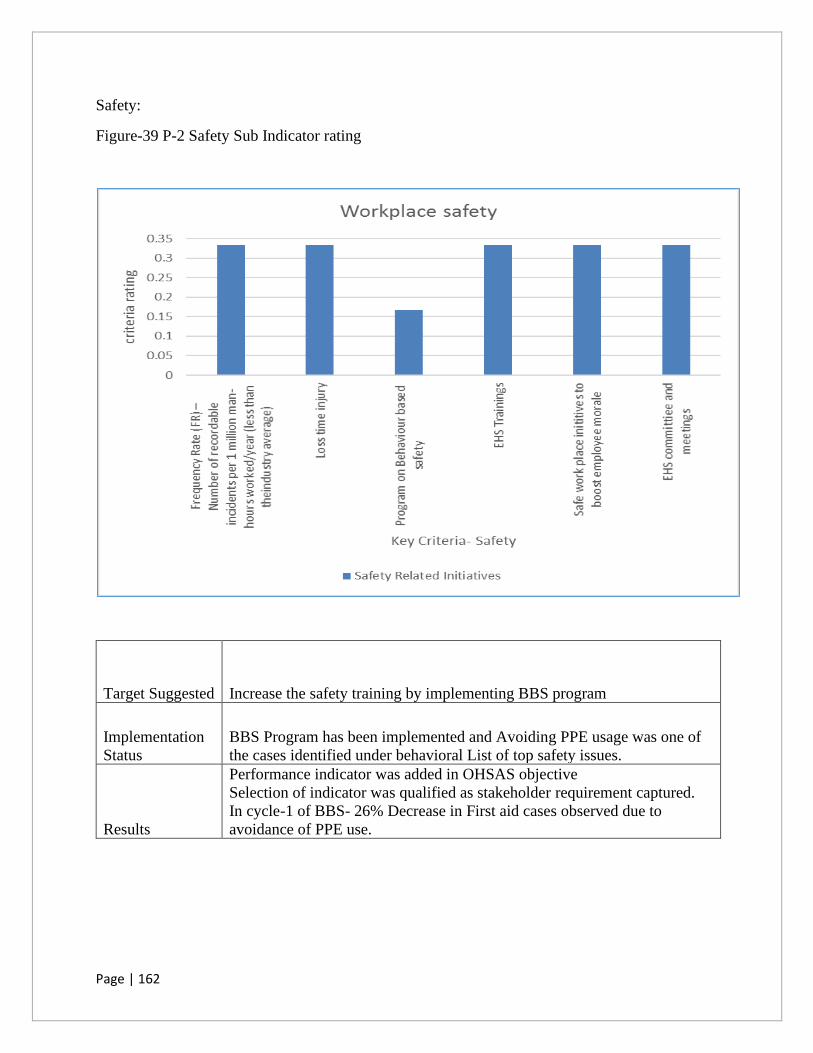
Page | 162
Safety:
Figure-39 P-2 Safety Sub Indicator rating
Target Suggested Increase the safety training by implementing BBS program
Implementation
Status
BBS Program has been implemented and Avoiding PPE usage was one of
the cases identified under behavioral List of top safety issues.
Results
Performance indicator was added in OHSAS objective
Selection of indicator was qualified as stakeholder requirement captured.
In cycle-1 of BBS- 26% Decrease in First aid cases observed due to
avoidance of PPE use.
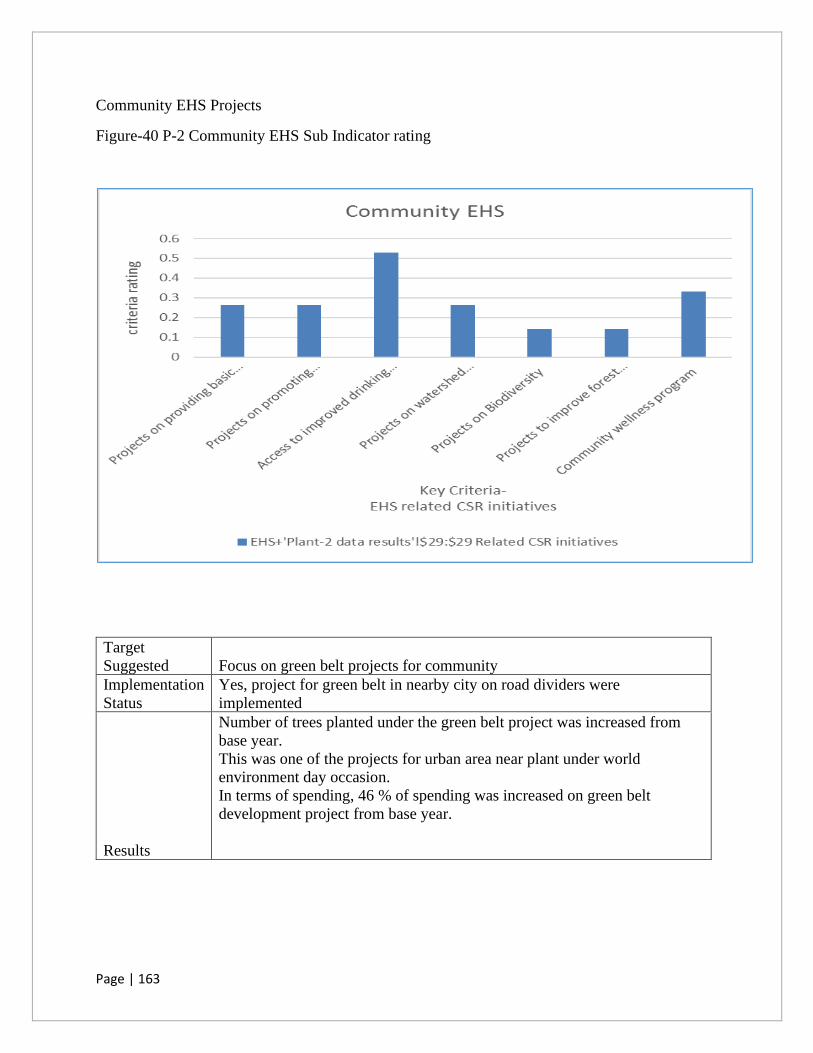
Page | 163
Community EHS Projects
Figure-40 P-2 Community EHS Sub Indicator rating
Target
Suggested Focus on green belt projects for community
Implementation
Status
Yes, project for green belt in nearby city on road dividers were
implemented
Results
Number of trees planted under the green belt project was increased from
base year.
This was one of the projects for urban area near plant under world
environment day occasion.
In terms of spending, 46 % of spending was increased on green belt
development project from base year.
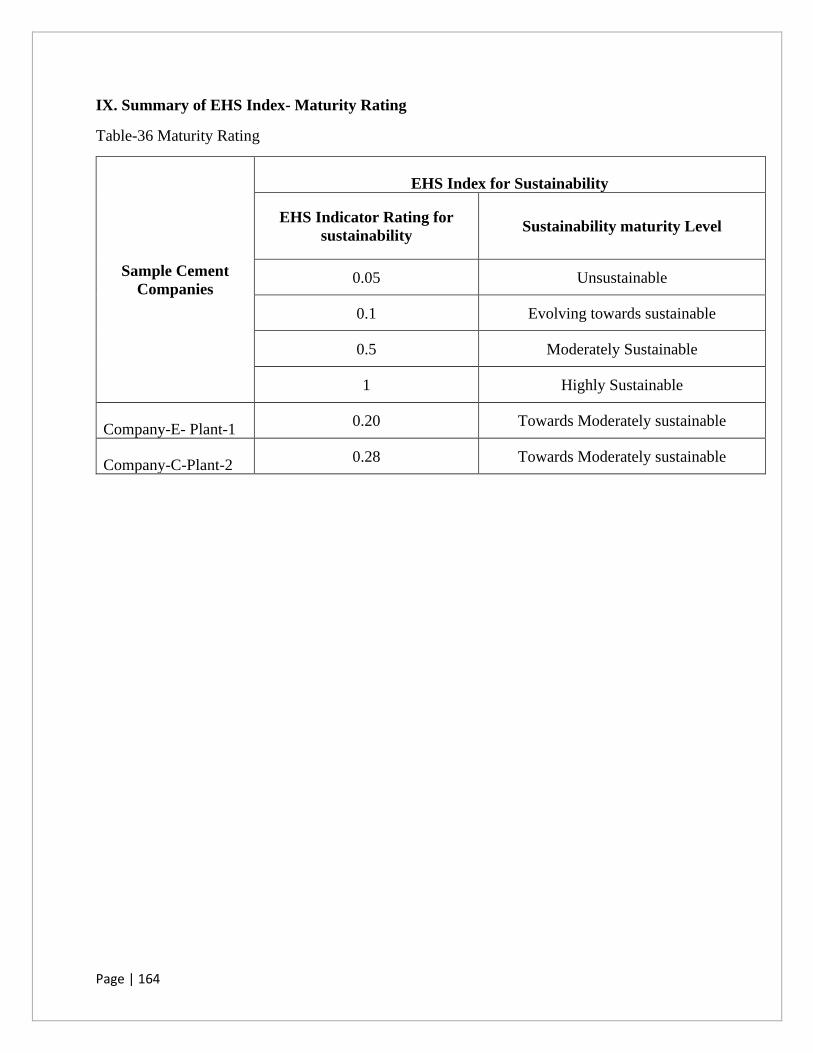
Page | 164
IX. Summary of EHS Index- Maturity Rating
Table-36 Maturity Rating
Sample Cement
Companies
EHS Index for Sustainability
EHS Indicator Rating for
sustainability Sustainability maturity Level
0.05 Unsustainable
0.1 Evolving towards sustainable
0.5 Moderately Sustainable
1 Highly Sustainable
Company-E- Plant-1 0.20 Towards Moderately sustainable
Company-C-Plant-2 0.28 Towards Moderately sustainable
Page | 165
X. PUBLISHED PAPER
9.1 Published Papers
• Mishra, Shraddha, and N. A. Siddiqui. "A review on environmental and health impacts of
cement manufacturing emissions." International journal of geology, agriculture and
environmental sciences 2.3 (2014): 26-31.
• Mishra S., Siddiqui N.A. (2018) A Review of CSR Activities Under Companies Act 2013
and Enterprise Social Commitment Under Environment Clearance for Major Cement
Industries in India. In: Siddiqui N., Tauseef S., Bansal K. (eds) Advances in Health and
Environment Safety. Springer Transactions in Civil and Environmental Engineering.
Springer, Singapore
• Mishra, S., Siddiqui N.A. & Ashutosh Gautam (2019). Emerging Environment Health and
Safety Indicators and Criteria to Establish sustainability Index for Cement Industry,
International Journal of Scientific & Technology Research Volume 8, Issue 09, September
2019
Page | 166
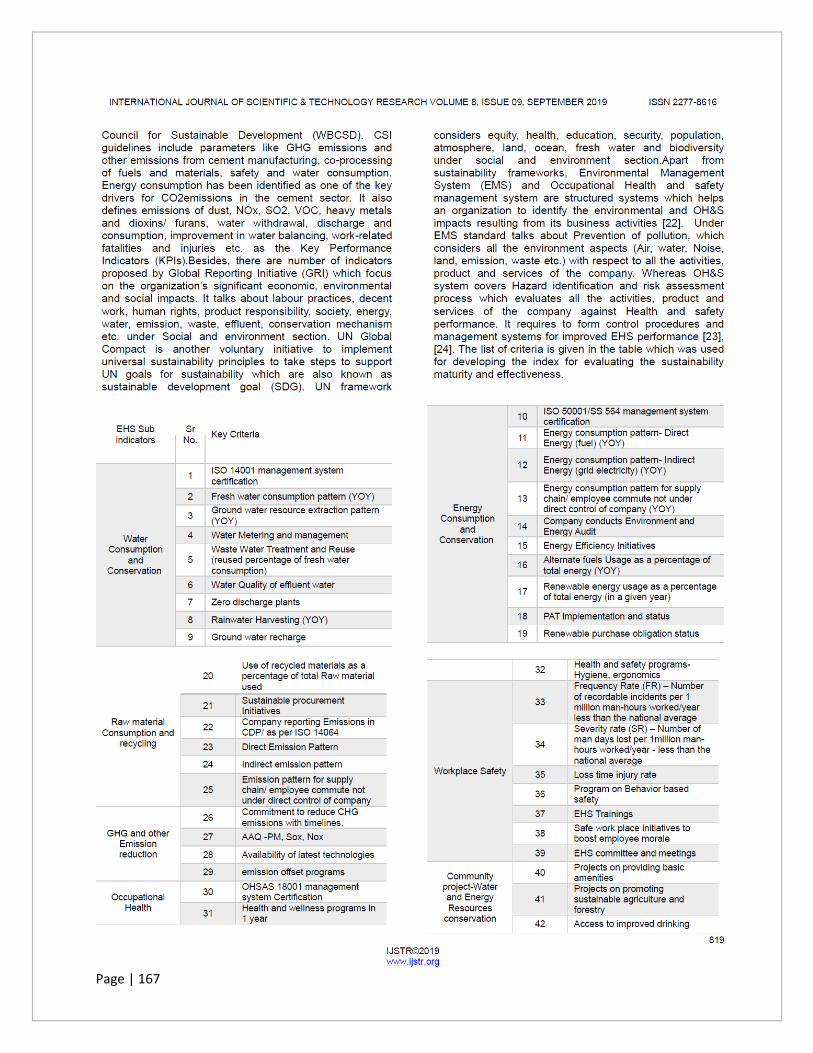
Page | 167
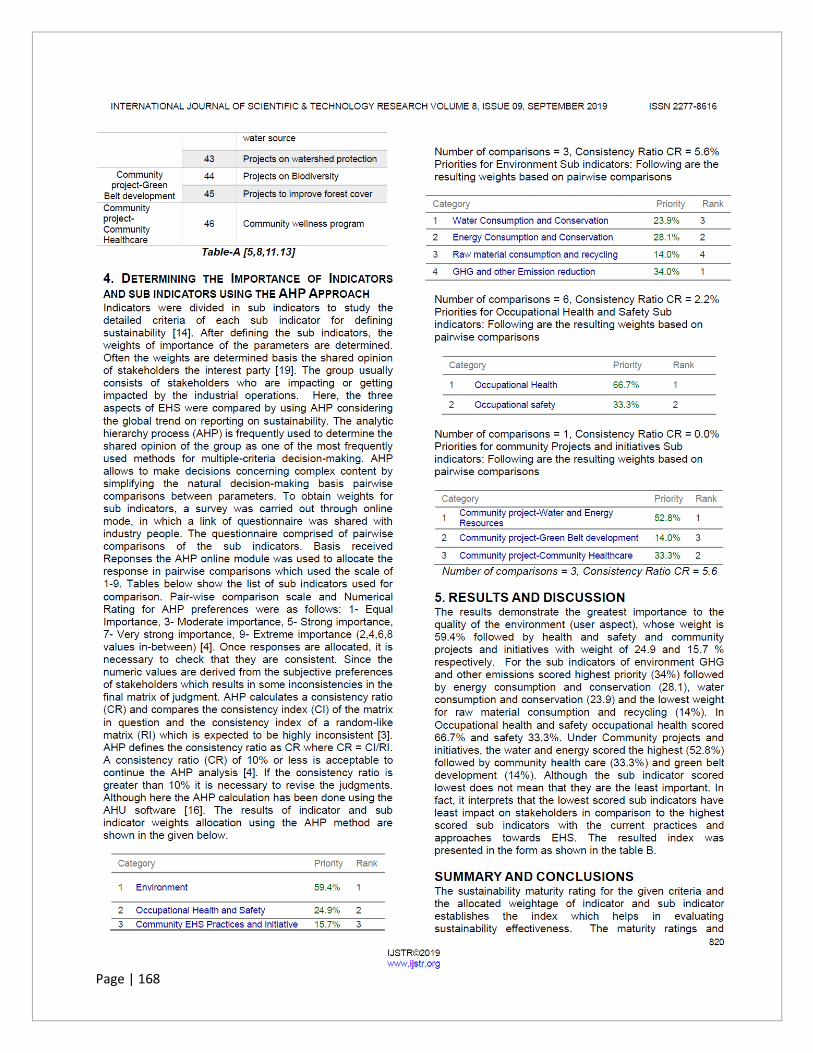
Page | 168

Page | 169

Page | 170
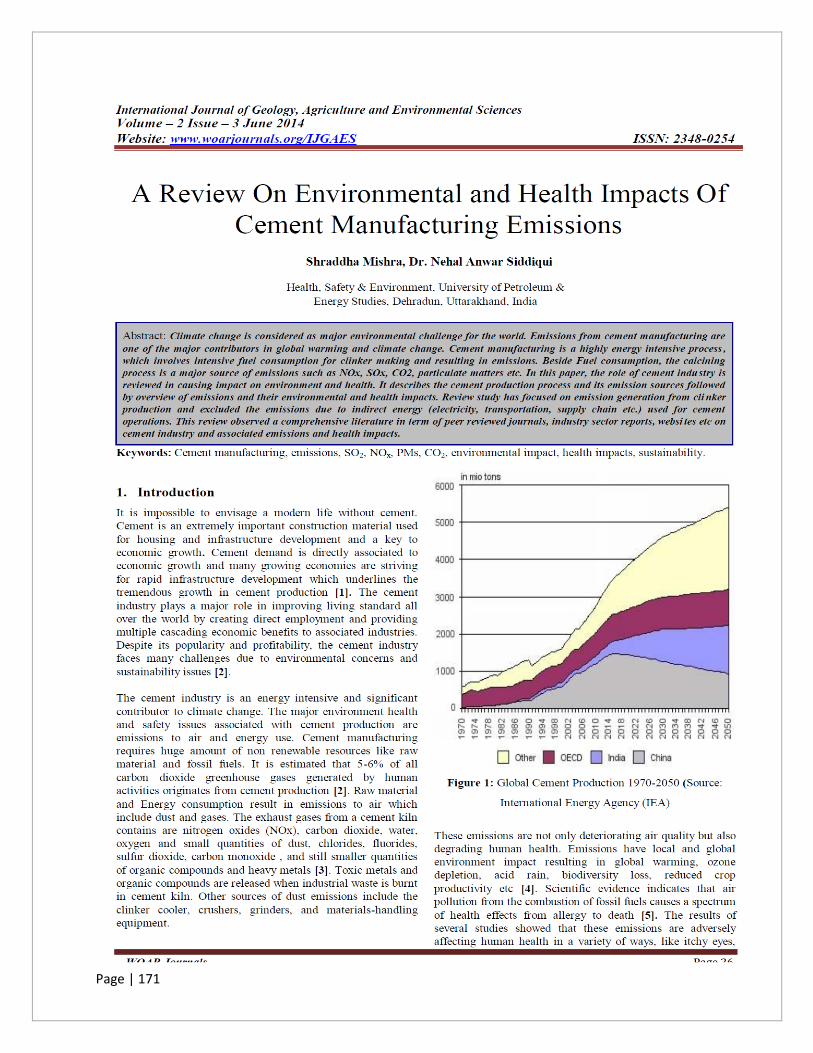
Page | 171
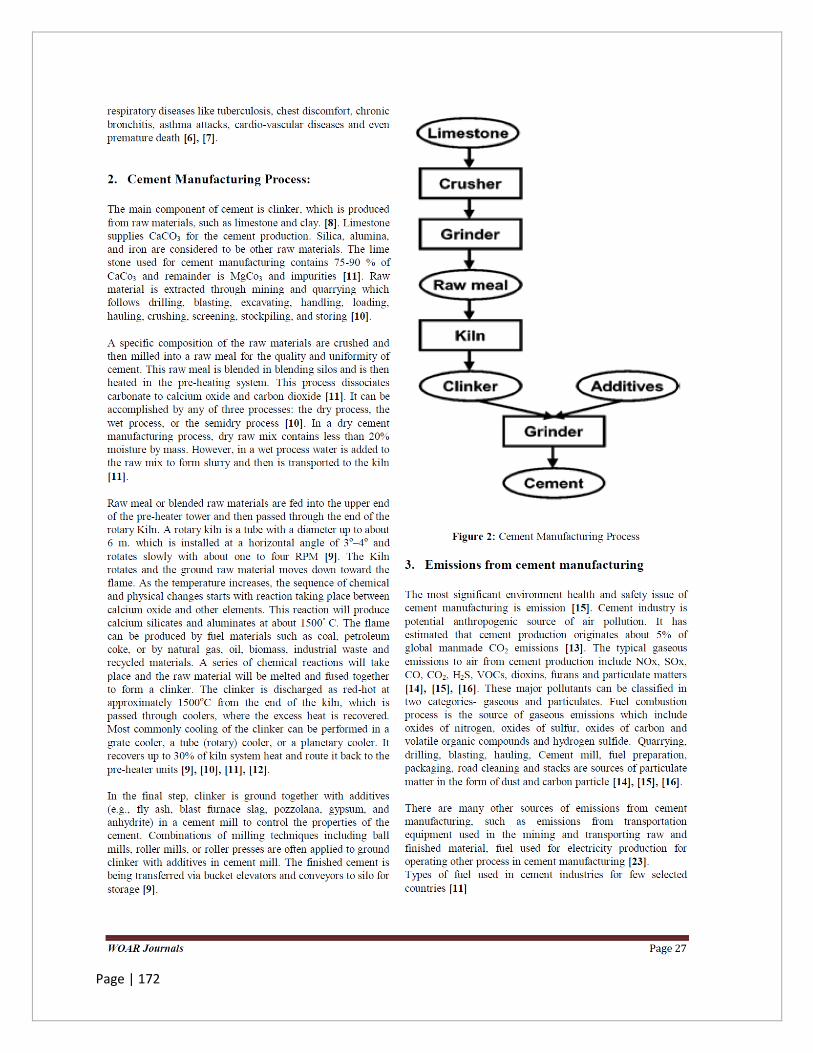
Page | 172
Page | 173
Page | 174
XI: CURRICULUM VITAE
Shraddha Mishra
Mobile No: 9717565559
Experience Summary
Environment, Health and Safety professional with 10+ Years’ of Experience in the core field
of Environment, Health, Safety (EHS) and Sustainability with expertise in designing and
implementing Environment Health Safety Management system for various industries as per
ISO 14001 & OHSAS 18001/ISO45001, Environment and Safety Audits, Behavior Based
Safety, Emergency preparedness and Mock drills, Sustainability reporting & CSR
Reporting, Green House gas Accounting/ Carbon Footprinting, Water Foot-printing,
Environment Legal Compliance, Environment Impact assessment. Have Assurance Audit
Experience in Corporate Sustainability Reports/ Social Responsibility Report, Positive
Water Balance.
Experience Profile
Organization : Genpact India Pvt Limited
From : Jun 2017 to till date
Profile : EHS & Sustainability Consultant
Job Responsibility:
• Maintaining EHS management system as per ISO 14001:2004 and OHSAS
18001:2007
• EHS audits- Project site safety audit/ facility safety audit/transport safety audits,
vendor audits, infrastructure readiness audits, fire safety audits.
• Imparting Training on EHS, Emergency preparedness, BBS & Ergonomics,
sustainability practices
• Leading Sustainability Reporting & Strategy development
• EHS & Sustainability Communication and Awareness Project
• EHS Legal Compliance review and assisting in return filing
• EHS Internal/external Audits
• Compliance to Business related EHS & Sustainability requirements
• Environment Footprinting projects
Page | 175
Organization : Subros Limited
From : Jun 2015 to Jun 2017
Profile : Manager- EHS
Job Responsibility:
• Maintaining EHS management system as per ISO 14001:2004 and OHSAS
18001:2007
• Conducting EHS audit/ Machine safety audit.
• Imparting Training on EHS, Emergency preparedness and sustainability practices
• Conducting EHS Committee meetings periodically
• Coordinating External Audits and ensuring closure of NCs
• Conducting Hazard Identification Risk Assessment, Environment Aspect Impact
• Formulating EHS control procedures
• Mock Drills on emergency preparedness response plan
• Incident investigation and Corrective and preventive Action implementation and
monitoring
• Ensuring EHS legal and other compliances
• Customer EHS requirement and Green Supply chain compliances
• Coordinating with external EHS consultants and auditors
• Compliance to Corporate standards and practices related to Environment, Health and
Safety
• Sustainability Indicators Tracking- GHG Emissions, water footprints, resource
conservation, Health and Safety performance, CSR activities
• Implementing Behavior Based Safety (BBS)
• Compliance to Business related EHS requirements
Organization : Binani Industries Limited
From : Aug 2012 to Jan 2015
Profile : Manager- Sustainability Reporting
Project : Binani Cement Limited- Sustainability Reporting, Water Foot-printing
Project : Binani Zinc Limited- Sustainability Reporting
Project : Binani Industries Limited- Sustainability Reporting
Job Responsibility:
• Sustainability Policy formulation aligned with NVG, Company Bill 2012, UNGC 10
principle and MDG
• Sustainability Report writing as per GRI G 3.1 Guidelines
• Corporate Social Responsibility Reporting as per NVG Guidelines
• Coordinating with different departments at different plant locations for data collection
Page | 176
• Data Analysis and Trend Analysis
• Conducting sessions on Sustainability Reporting and CSR and alignment with ISO
14001 & OHSAS 18001, SA 8000
• Coordinating with third parties for Assurance on report, coordinating with designers
for theme-based report designing
Organization : Deloitte Touche Tomatsu India Pvt Limited
From : April 2011 to July 2012
Profile : Sr. Analyst - Environment Health Safety and Sustainability
Project : Design and Development of Environment Health Safety Management
System (Clients- Telecommunication, Banking Services)
Project : Positive Water Balance Assurance Audit (Clients- Beverage giant)
Project : Sustainability/ Corporate Social Responsibility Assurance Audit (Client- Oil
and Gas, Glass Industry)
Project : Environment and Social Due Diligence (Client- Infrastructure Company)
Project : Greenhouse Gas Accounting & Corporate Sustainability Reporting (Client-
Telecommunication)
Project : Design and Development of Quality Management System (ISO 9001:2008)
(Clients- Infrastructure Company)
Project : Environment Health & Safety Audit (Greening of supply chain) (Client-
Telecom vendor companies)
Job Responsibility:
• Design and Development of Safety Health and Environment Management System as
per ISO 14001 and OHSAS 18001 for Telecom and banking industry.
• Conducted Safety Health Environment Audit.
• Prepared HIRA and Initial Environment Review
• Prepared Formats for GHG reporting and Corporate Social Responsibility Reporting
• Conducted Assurance audits for corporate social responsibility/ Sustainability
Reporting
• Audited Beverage Plants for Water Balance
• Environment and Social Due Diligence
• Developed Quality Management Plan for telecom industry
Organization : Gammon India Limited
From : Mar 2009 to Mar 2011
Profile : Engineer- Safety Health Environment
Page | 177
Project : DMRC Project Phase-II, New Delhi, Noida Corridor (Client: Delhi Metro
rail Corporation)
Project : DDA Flyover Project (Client: Delhi Development Authority)
Job Responsibility:
• Design, Development and Implementation of Site Safety Health and Environment
plan
• Maintaining all SHE documents as per ISO 14001:2004 and OHSAS 18001:2007
• Conduct Monthly Environment Audit and Environment Monitoring.
• Conducting SHE Committee meetings periodically
• Prepared Hazard Identification Risk Assessment, Environment Aspect Impact and
emergency preparedness plan for the project.
• To ensure compliance to statutory and corporate standards relating to Environment,
Health and Safety
Achievements/ Responsibilities:
• Has done GRI certified training on Sustainability reporting
• Has done IS0 14046- Draft (Water foot-printing course) training
• Has done ISO 14001:2004 and OHSAS 18001- Integrated Management system
internal auditor course.
• Has done certified Course of First Aid.
• Work as personnel in Environment impact assessment of Dehradoon City, done by
University of Petroleum and Energy Studies.
• Has done training on ‘‘SHE Policy and its implementation’’.
• Attended webinar and online training on BBS
Academic Qualification:
• M.Tech. (Environment health and safety engineering)- (2009) from University of
Petroleum & Energy Studies, Dehradun
• M.Sc. (Environment Science)- (2007) from C.S.J.M University, Kanpur
• B.Sc. (Chemistry and Zoology)- (2005) from C.S.J.M University, Kanpur
• Intermediate (2002) from Uttar Pradesh Board, Allahabad
• High School (2002) from Uttar Pradesh Board, Allahabad
Page | 178
Internships Undertaken:
• 2 months summer internship at Jaiprakash associates limited, Noida as a part of M. Tech
(HSE). Project Work: “Health Safety Environment Compliances at Jaypee Greens,
Noida”.
• 4 months summer internship at Industrial Toxicology Research Center, Lucknow as a
part of M.Sc. (Environmental Science). Project Work: “Evaluation of Water Quality of
Different District for Drinking Purpose”.
Computer Proficiency:
• Applications : MSOffice (Word, Excel, Power Point, Project)
Personal Profile:
Name : Shraddha Mishra
Fathers Name : Mr. R. N. Mishra
Spouse Name : Mr. Vineet Tiwari
Permanent Address : 1154 Ratan Lal Nagar, Kanpur Uttar Pradesh.
Tel. No. : 9717565559
Date of birth : 9 Oct 1984
Marital Status : Married
Nationality : Indian
Language Known : English, Hindi
E-Mail Address : [email protected]
Place: Noida Shraddha Mishra
Date: 01.10.2020 Signature
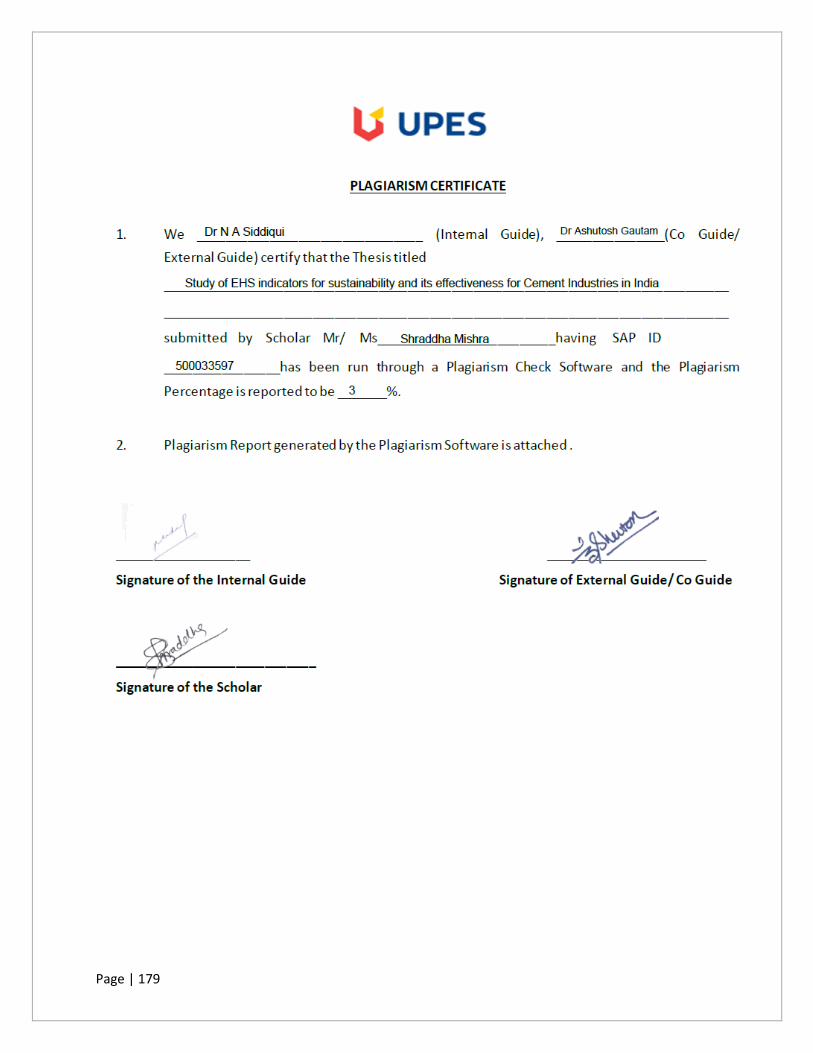
Page | 179
Page | 180
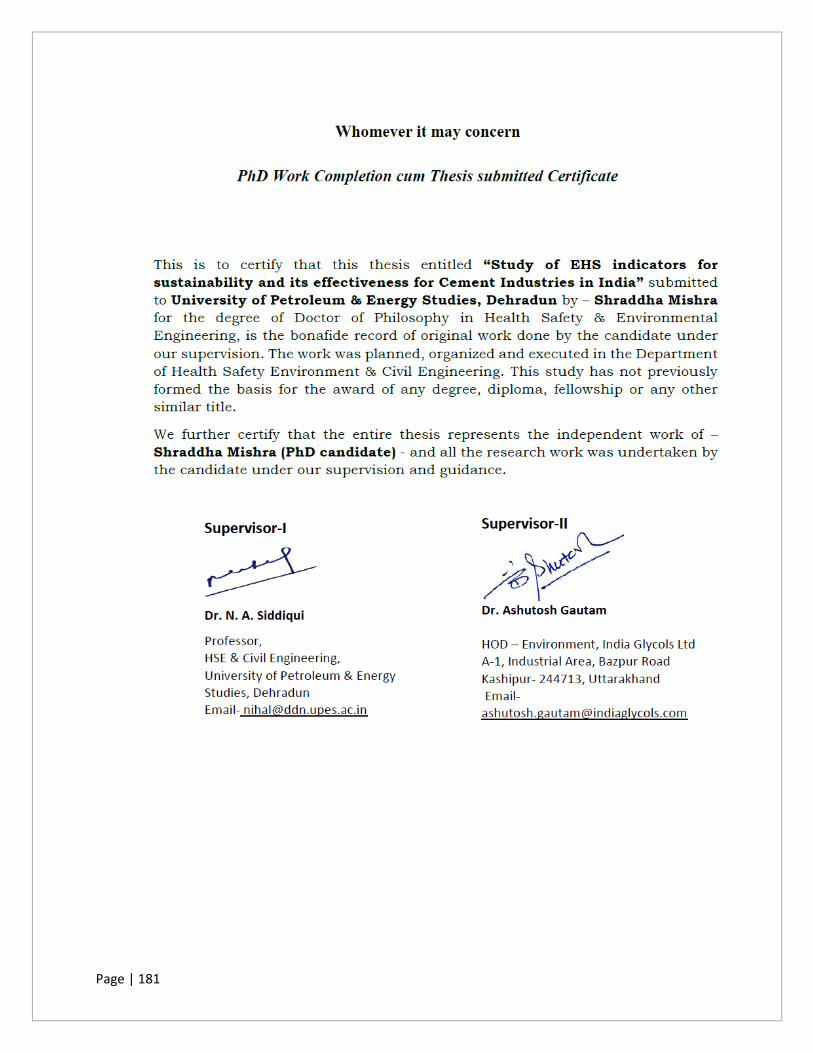
Page | 181
Copyright © 2022 FDOKUMEN