MEASURING SUSTAINABILITY OF CITIES AND COMMUNITY WELLBEING THROUGH THE MALAYSIAN URBAN RURAL...
23
MEASURING SUSTAINABILITY CITIES AND COMMUNITY WELLBEING THROUGH THE MALAYSIAN URBAN RURAL NATIONAL INDICATORS NETWORK (MURNInets) DR. AZMIZAM ABDUL RASHID Federal Department of Town and Country Planning Ministry of Urban Wellbeing, Housing and Local Government JOHOR BAHRU | 9 – 10 FEBRUARY 2015 6 TH HIGH LEVEL SEMINAR ON ENVIRONMENTALLY SUSTAINABLE CITIES 1
Transcript of MEASURING SUSTAINABILITY OF CITIES AND COMMUNITY WELLBEING THROUGH THE MALAYSIAN URBAN RURAL...

MEASURING SUSTAINABILITY CITIES
AND COMMUNITY WELLBEING THROUGH THE
MALAYSIAN URBAN RURAL NATIONAL
INDICATORS NETWORK (MURNInets)
DR. AZMIZAM ABDUL RASHID Federal Department of Town and Country Planning
Ministry of Urban Wellbeing, Housing and Local Government
JOHOR BAHRU | 9 – 10 FEBRUARY 2015
6TH HIGH LEVEL SEMINAR ON ENVIRONMENTALLY SUSTAINABLE CITIES
1

FEDERAL DEPARTMENT OF TOWN AND COUNTRY PLANNING PENINSULAR MALAYSIA
MINISTRY OF URBAN WELLBEING, HOUSING AND LOCAL GOVERNMENT
1972
UN
Conference
on
Human
Environment
1980
UN sets up
the World
Commission
on
Environment
and
Development
Bruntland
Report on
definition and
principles of
sustainable
development
SUSTAINABLE DEVELOPMENT IN MALAYSIA
1987
Rio+5 - Rio
Summit :
World
commitment
on
sustainable
development
& LA 21
1992
Kyoto
Declaration
on Green
House
Emission
1997
Rio+10
Johannesbur
g Earth
Summit
2002.
2002
Bali
Roadmap
Towards
International
agreement
on Climate
Change
2007
COP 15 :
Copenhagen
Climate
Conference
2009
Rio+20 : Rio
de Janeiro,
Brazil : The
Future We
Want
2012
Malaysia
National
Environmental
Policy
Malaysia
(LOCAL
AGENDA
21)
PLANNING
DOCTRINE
- Holistic
developmen
t for land
use planning
2000
Town and
Country
Planning Act
(Act 172)
1976
National
Physical
Plan
2005
9th Malaysia
Plan: Thrust
4 - Improve
standards &
Sustainability
of quality of
life
National
Urbanization
Policy
2006
Establishment
of MURNInets
to measure
sustainability
levels of urban
areas
1998
10th
Malaysia
Plan
National
Green
Technology
Policy
2014
MURNInets
extended to
rural areas
and
Happiness
Index Study
2010
National
Physical
Plan 2
2
First Wave
1970-1980’s
Nature Protection and
Conservation
Pollution Control
Second Wave
1990-2005
Governmental Reform,
Supra Structure,
New Instruments, Agenda 21
Third Wave
2006 - Present
Low Carbon Growth,
Energy Switch,
Technology Localization
MALAYSIAN URBAN
SUSTAINABLE
REPORT
AND HAPPINESS
RANKING REPORT
MURNInets
Portal
UN World
Happiness
Report

FEDERAL DEPARTMENT OF TOWN AND COUNTRY PLANNING PENINSULAR MALAYSIA
MINISTRY OF URBAN WELLBEING, HOUSING AND LOCAL GOVERNMENT
1. MURNInets innovative system to determine the
sustainability level of an urban-rural area by using a
set of indicators.
2. It has embedded a culture along with the knowledge of
evaluating sustainability amongst urban-rural areas.
3. The knowledge generated has also help spawned other
means of measuring progress, which includes a
happiness indicators incorporated into it.
4. The program enables the tracking of the sustainability
status of an urban-rural areas whether it has
increased, reduced or static.
5. Analysis of scoring indicators can assist local
authorities to identify programs for enhancing their
sustainability urban-rural areas.
INTRODUCTION
3

FEDERAL DEPARTMENT OF TOWN AND COUNTRY PLANNING PENINSULAR MALAYSIA
MINISTRY OF URBAN WELLBEING, HOUSING AND LOCAL GOVERNMENT
CHRONOLOGY- MURNInets IMPLEMENTATION PROGRAMME
1998 MALAYSIAN
URBAN
INDICATORS
NETWORK
(MURNInet) DESIGN BY FDTCP
& CONSULTANT
11 sectors
56 indicators
2002 PILOT
PROJECT ON
6 CITIES (Kuantan,
Georgetown,
Johor Bahru,
Kuching, Batu
Pahat & Pasir
Mas)
11 sectors
56 indicators
2004 APPLIED TO 8
CAPITAL
CITIES; Kangar,
Alor Star, Ipoh,
Shah Alam,
Seremban, Melaka,
Kota Bharu &
Kuala Terengganu
11 sectors
38 indicators
2005 - 2006 ALL
CAPITAL CITIES
IN MALAYSIA --Kuching &
Kota Kinabalu
11 sectors
38 indicators
2007-2009 MURNInet Portal
LAUNCHED -
online data entry
11 sectors
38 indicators
2010 MURNINet
INDICATOR
MODIFICATION
WORKSHOP 11 sectors
40 indicators
2011 REVIEW AND
STRENGTHENING
OF MURNInet
11 sectors
40 indicators
2012 Malaysian Urban Rural National Indicators Network for Sustainable Development (MURNInets)
36 indicators
21 themes
6 dimensions
MURNInets
Portal Launched
4

FEDERAL DEPARTMENT OF TOWN AND COUNTRY PLANNING PENINSULAR MALAYSIA
MINISTRY OF URBAN WELLBEING, HOUSING AND LOCAL GOVERNMENT
FEATURES OF MURNInets PORTAL
http://murninet.townplan.gov.my/murninets/
More structured
interface design,
easier to access &
more user-friendly;
Applying open source
platform (php) that is
stable and there is
expertise;
The index generation
process is more
scientific and
‘analytic’;
'Mandatory fields' have
been introduced which
requires all local
authorities enter data
for all indicators before
the index can be
generated;
Entry information is
more flexible / easy to
maintain
Additional image
display map for
verification of data
sources.
5
FEDERAL DEPARTMENT OF TOWN AND COUNTRY PLANNING PENINSULAR MALAYSIA
MINISTRY OF URBAN WELLBEING, HOUSING AND LOCAL GOVERNMENT
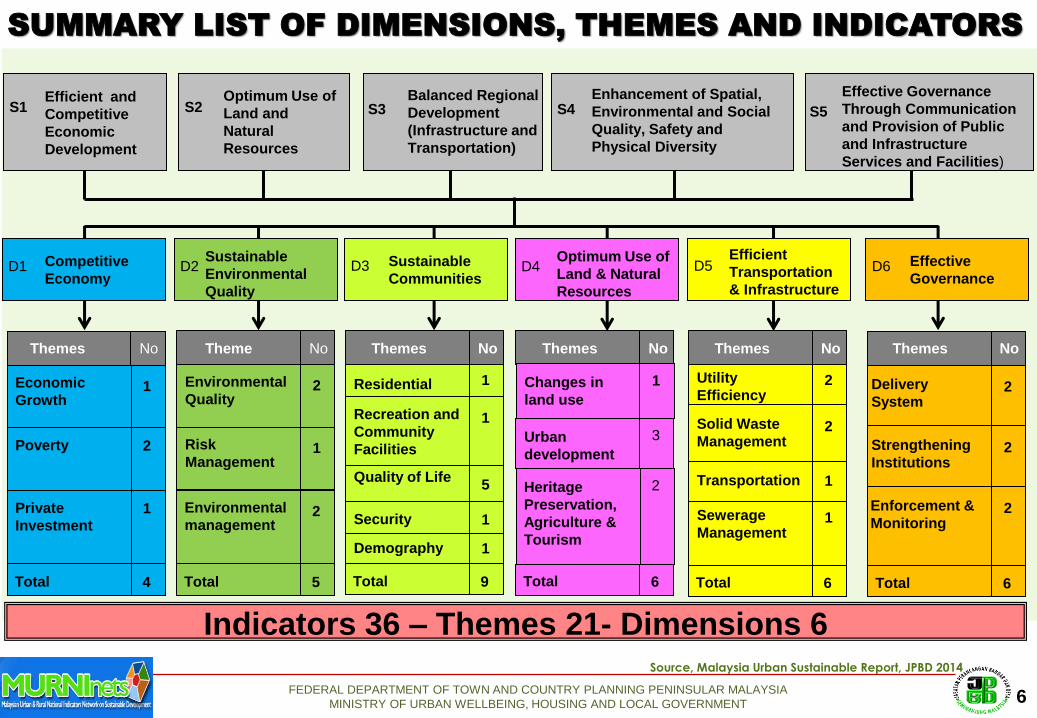
SUMMARY LIST OF DIMENSIONS, THEMES AND INDICATORS
S1 S5 S4 S3 S2 Efficient and
Competitive
Economic
Development
Optimum Use of
Land and
Natural
Resources
Balanced Regional
Development
(Infrastructure and
Transportation)
Enhancement of Spatial,
Environmental and Social
Quality, Safety and
Physical Diversity
Effective Governance
Through Communication
and Provision of Public
and Infrastructure
Services and Facilities)
D1 Competitive
Economy D2
Sustainable
Environmental
Quality
D3 Sustainable
Communities D4
Optimum Use of
Land & Natural
Resources
D5 Efficient
Transportation
& Infrastructure
D6 Effective
Governance
Themes Themes
Themes
Theme
Themes
Themes
No No
No
No
No
No
Economic
Growth 1
Poverty 2
Private
Investment 1
Total 4
Environmental
Quality 2
Risk
Management 1
Environmental
management 2
Total
5
Residential 1
Recreation and
Community
Facilities
1
Quality of Life 5
Security 1
Demography 1
Total
9
Changes in
land use
1
Urban
development
3
Heritage
Preservation,
Agriculture &
Tourism
2
Total
6 Total
6 Total
6
Utility
Efficiency 2
Solid Waste
Management 2
Transportation 1
Sewerage
Management 1
Delivery
System 2
Strengthening
Institutions 2
Enforcement &
Monitoring 2
Indicators 36 – Themes 21- Dimensions 6 Source, Malaysia Urban Sustainable Report, JPBD 2014
6
FEDERAL DEPARTMENT OF TOWN AND COUNTRY PLANNING PENINSULAR MALAYSIA
MINISTRY OF URBAN WELLBEING, HOUSING AND LOCAL GOVERNMENT
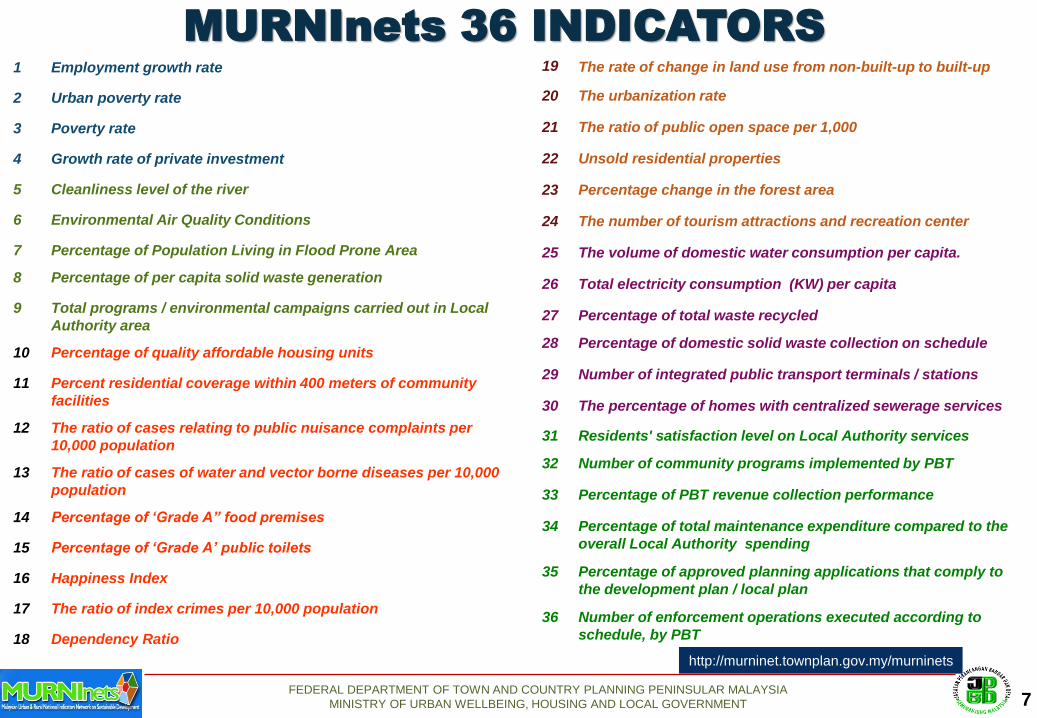
MURNInets 36 INDICATORS
7
http://murninet.townplan.gov.my/murninets
7
1 Employment growth rate
2 Urban poverty rate
3 Poverty rate
4 Growth rate of private investment
5 Cleanliness level of the river
6 Environmental Air Quality Conditions
7 Percentage of Population Living in Flood Prone Area
8 Percentage of per capita solid waste generation
9 Total programs / environmental campaigns carried out in Local
Authority area
10 Percentage of quality affordable housing units
11 Percent residential coverage within 400 meters of community
facilities
12 The ratio of cases relating to public nuisance complaints per
10,000 population
13 The ratio of cases of water and vector borne diseases per 10,000
population
14 Percentage of ‘Grade A” food premises
15 Percentage of ‘Grade A’ public toilets
16 Happiness Index
17 The ratio of index crimes per 10,000 population
18 Dependency Ratio
19 The rate of change in land use from non-built-up to built-up
20 The urbanization rate
21 The ratio of public open space per 1,000
22 Unsold residential properties
23 Percentage change in the forest area
24 The number of tourism attractions and recreation center
25 The volume of domestic water consumption per capita.
26 Total electricity consumption (KW) per capita
27 Percentage of total waste recycled
28 Percentage of domestic solid waste collection on schedule
29 Number of integrated public transport terminals / stations
30 The percentage of homes with centralized sewerage services
31 Residents' satisfaction level on Local Authority services
32 Number of community programs implemented by PBT
33 Percentage of PBT revenue collection performance
34 Percentage of total maintenance expenditure compared to the
overall Local Authority spending
35 Percentage of approved planning applications that comply to
the development plan / local plan
36 Number of enforcement operations executed according to
schedule, by PBT

FEDERAL DEPARTMENT OF TOWN AND COUNTRY PLANNING PENINSULAR MALAYSIA
MINISTRY OF URBAN WELLBEING, HOUSING AND LOCAL GOVERNMENT
MURNInet 11 sectors 38 indicators (Malaysian Urban Indicators Network)
LOCAL AUTHORITIES PARTICIPATION
2007 2008 2009 2010 No of LA 146
Participated 47
Evaluate 41
Sustainable 5
Moderate 36
No of LA 146
Participated 67
Evaluate 48
Sustainable 6
Moderate 42
No of LA 147
Participated 101
Evaluate 87
Sustainable 22
Moderate 65
No of LA 149
Participated 105
Evaluate 100
Sustainable 25
Moderate 75
MURNInets 6 dimensions, 21 themes , 36 indicators (Malaysian Urban Rural National Indicators Network for Sustainable Development)
2011 2013 2014 No of LA 151
Participated 108
Evaluate 73
Sustainable 36
Moderate 37
No of LA 151
Participated 108
Evaluate 97
Sustainable 54
Moderate 43
8
2012 No of LA 151
Participated 108
Evaluate 45
Sustainable 27
Moderate 18
REVIEW AND
STRENGTHENING
OF MURNInet
Source, Malaysia Urban Sustainable Report,
JPBD 2014

FEDERAL DEPARTMENT OF TOWN AND COUNTRY PLANNING PENINSULAR MALAYSIA
MINISTRY OF URBAN WELLBEING, HOUSING AND LOCAL GOVERNMENT
9
2013 AND 2012 SUSTAINABLE CITIES INDEX
2013 54 local authorities achieved sustainable
- 53.70% urban (city & municipal)
- 46.30% rural (district)
2012 36 local authorities achieved sustainable
- 62.50% urban (city & municipal)
- 37.50% rural (district)
Source, Malaysia Urban Sustainable Report, JPBD 2014
9
Sustainability Index
> 80% - sustainable
50%-79% - moderate
< 50 – less sustainable
80

FEDERAL DEPARTMENT OF TOWN AND COUNTRY PLANNING PENINSULAR MALAYSIA
MINISTRY OF URBAN WELLBEING, HOUSING AND LOCAL GOVERNMENT
2013 AND 2012 SELECTED SUSTAINABLE CITIES INDEX
KTrg 2013 2012
% 91% 89%
Eco 0.63 0.88
Envi 1.00 1.00
Comm 0.93 0.73
Land 0.97 0.90
Infa 1.00 1.00
Gover 1.00 0.89 KK 2013 2012
% 69% 73%
Eco 0.63 0.71
Envi 0.88 1.00
Com 0.58 0.56
Land 0.75 0.62
Infa 0.81 0.81
Gover 0.72 0.67
JB 2013 2012
% 88% 83%
Eco 0.88 0.88
Envi 0.94 0.69
Com 0.74 0.79
Land 0.73 0.87
Infa 1.00 0.90
Gover 1.00 0.94
MEL 2013 2012
% 88% 80%
Eco 1.00 1.00
Envi 0.88 0.88
Comm 0.76 0.54
Land 0.73 0.73
Infa 0.90 0.71
Gover 1.00 0.94
KL 2013 2012
% 76% 74%
Eco 0.63 0.71
Envi 0.88 0.75
Comm 0.63 0.56
Land 0.83 0.95
Infa 0.86 0.90
Gover 0.83 0.83
PUTR 2013 2012
% 82% 86%
Eco 0.83 1.00
Envi 1.00 0.88
Comm 0.58 0.60
Land 0.97 0.97
Infa 0.62 0.76
Gover 0.94 1.00
AStar 2013 2012
% 77% 74%
Eco 0.71 0.75
Envi 0.88 0.75
Comm 0.58 0.82
Land 0.82 0.71
Infa 0.81 0.94
Gover 0.94 0.75
Source, Malaysia Urban Sustainable Report, JPBD 2014
2012 - 61.67% dimensions are sustainable
- 38.33% dimensions are moderate sustainable
2013 - 71.67% dimensions are sustainable
- 28.33% dimensions are moderate sustainable
IPOH 2013 2012
% 81% 66%
Eco 0.58 0.58
Envi 0.81 0.75
Comm 0.90 0.66
Land 0.77 0.58
Infa 0.94 0.83
Gover 1.00 0.89
10

FEDERAL DEPARTMENT OF TOWN AND COUNTRY PLANNING PENINSULAR MALAYSIA
MINISTRY OF URBAN WELLBEING, HOUSING AND LOCAL GOVERNMENT
11
3 Sustainable 2 Moderately Sustainable 1 Less Sustainable
INDICATORS
PETALING
JAYA SHAH ALAM MELAKA PUTRAJAYA JOHOR BAHRU
KUALA
LUMPUR ALOR SETAR IPOH
KUALA
TERENGGANU
KOTA
KINABALU
2013 2012 2013 2012 2013 2012 2013 2012 2013 2012 2013 2012 2013 2012 2013 2012 2013 2012 2013 2012
EC
ON
OM
IC
1 3 3 3 3 3 3 3 3 2 2 2 2 2 2 1 1 1 3 2 2
2 3 3 3 3 3 3 3 3 3 3 1 3 3 3 3 3 2 2 3 3
3 3 3 3 3 3 3 3 3 3 3 1 3 3 3 3 3 2 2 3 3
4 3 3 3 3 3 3 3 3 3 3 3 1 1 3 1 1 3 3 2 1
EN
VIR
ON
ME
NTA
L
5 3 2 3 3 2 1 1 3 2 1 1 1 3 1 2 1 3 3 3 3
6 3 3 3 3 3 3 3 3 3 2 3 1 3 3 3 2 3 3 3 3
7 3 3 3 3 3 3 3 3 3 3 3 3 3 3 3 3 3 3 3 3
8 3 3 3 3 2 3 3 1 3 1 3 3 1 1 1 2 3 3 1 3
9 3 3 3 3 3 3 3 3 3 3 3 3 3 3 3 3 3 3 3 3
SU
STA
INA
BL
E C
OM
MU
NIT
IES
10 3 3 3 3 3 1 1 1 1 1 1 1 1 1 3 1 3 1 1 1
11 3 3 3 3 3 2 3 3 3 3 3 1 3 1 3 1 3 3 1 1
12 3 3 3 3 3 3 1 1 3 3 3 1 3 3 3 1 3 3 2 2
13 2 2 2 2 1 1 2 3 2 3 2 1 2 2 3 1 3 2 1 1
14 3 3 3 2 1 2 1 2 3 1 2 2 1 1 2 2 3 1 1 1
15 3 3 3 1 1 3 1 1 2 2 2 1 1 1 1 1 3 3 3 3
16 2 2 2 2 2 2 2 2 2 2 2 2 2 2 2 2 2 2 2 2
17 2 1 2 2 1 1 1 1 3 3 1 1 1 1 3 1 3 3 1 1
18 3 3 3 3 2 2 2 2 2 2 3 3 2 2 2 2 2 2 2 3
2013 AND 2012 ANALYSIS OF INDICATORS SCORE : SELECTED CITIES

FEDERAL DEPARTMENT OF TOWN AND COUNTRY PLANNING PENINSULAR MALAYSIA
MINISTRY OF URBAN WELLBEING, HOUSING AND LOCAL GOVERNMENT
12
3 Sustainable 2 Moderately Sustainable 1 Less Sustainable
INDICATORS
PETALING
JAYA SHAH ALAM MELAKA PUTRAJAYA JOHOR BAHRU
KUALA
LUMPUR ALOR SETAR IPOH
KUALA
TERENGGANU
KOTA
KINABALU
2013 2012 2013 2012 2013 2012 2013 2012 2013 2012 2013 2012 2013 2012 2013 2012 2013 2012 2013 2012
LA
ND
US
E
19 3 3 3 3 3 3 3 3 3 3 3 3 3 3 2 1 3 2 3 1
20 3 3 3 3 1 1 3 3 3 3 3 3 2 2 3 3 3 3 2 2
21 3 3 3 3 3 3 3 3 1 1 3 2 1 1 3 2 3 3 1 1
22 1 3 2 3 1 1 3 3 1 3 1 3 3 3 2 1 3 3 2 3
23 3 3 2 3 2 2 2 2 2 2 2 3 2 2 3 2 2 3 2 2
24 3 3 3 3 3 3 3 3 3 3 3 3 3 3 3 3 3 3 3 3
INF
RA
ST
RU
CT
UR
E
25 3 3 3 3 3 3 1 1 3 3 3 3 3 1 3 3 3 3 3 3
26 3 3 3 3 3 3 3 3 3 3 3 3 3 3 3 3 3 3 3 3
27 3 3 3 3 3 1 1 2 3 1 1 1 1 1 3 3 3 3 1 1
28 3 3 3 3 3 3 3 3 3 3 2 3 3 3 3 2 3 3 3 3
29 3 3 3 3 2 1 1 2 3 3 3 3 3 3 3 3 3 2 3 3
30 3 3 3 3 3 3 3 3 3 3 3 3 1 1 2 2 3 3 1 1
GO
VE
RN
AN
CE
31 2 3 2 2 3 3 2 3 3 2 2 3 2 2 2 2 3 2 2 1
32 3 3 3 3 3 3 2 3 3 3 3 2 3 3 3 3 3 3 1 1
33 3 3 3 3 3 3 3 3 3 3 3 3 3 3 3 3 3 2 3 3
34 3 2 3 3 3 3 3 3 3 3 1 3 3 3 3 1 3 3 3 3
35 3 3 3 3 3 2 3 3 3 3 3 1 3 3 3 3 3 3 1 1
36 3 3 3 3 3 3 3 3 3 3 3 3 3 3 3 3 3 3 3 3
2013 AND 2012 ANALYSIS OF INDICATORS SCORE : SELECTED CITIES

FEDERAL DEPARTMENT OF TOWN AND COUNTRY PLANNING PENINSULAR MALAYSIA
MINISTRY OF URBAN WELLBEING, HOUSING AND LOCAL GOVERNMENT
MURNInets and HAPPINESS INDEX
1. In the 10th
Malaysia Plan, the
government has explicitly stated
the commitment to ensure high
quality of life in urban and rural
area.
2. FDTCP is the focal point for
MURNInets and Happiness Index.
3. Happiness Index study involves
primary data collection jointly
between local authorities and
residents.
4. 151 local authorities participate
with 44,500 questionnaires
distributed - CLUSTER SAMPLING
- the target population is spread
across a geography.
THRUST 4 :
Improving the
standard and
sustainability
of quality of
life – to create
a caring
society and
promote
community
wellbeing
10TH MALAYSIA PLAN
13

FEDERAL DEPARTMENT OF TOWN AND COUNTRY PLANNING PENINSULAR MALAYSIA
MINISTRY OF URBAN WELLBEING, HOUSING AND LOCAL GOVERNMENT
SCOPE OF HAPPINESS INDEX
ASPECTS QUESTIONS
Q1 STRESS LEVEL How do you rank your stress level ?
Q2 HEALTH Are you satisfied with your health ?
Q3 FAMILY LIFE How satisfied are you with your life partner or family ?
Q4 JOB SATISFACTION Are you happy with your job ?
Q5 INCOME Are you satisfied with your current monthly income ?
Q6 SPIRITUALITY Do you believe that spirituality can bring you joy and happiness in your life ?
Q7 NEIGHBOURHOOD Do you interact well with your neighbours ?
Q8 COMMUNITY Do you enjoy it when you get involved with community activities in your area ?
Q9 SAFETY Do you feel safe in your home ?
Q10 PUBLIC AMENITIES Are you satisfied with the facilities provided in your neighborhood ?
Q11 LOCAL AUTHORITY SERVICES Are you satisfied with services provided by local authorities in your area ?
Q12 POLITICAL REPRESENTATIVE Are you satisfied with the services of the political representative in your area ?
Q13 ENVIRONMENT Are you happy with the quality of your living environment ?
Source, Malaysia Urban Sustainable Report, JPBD 2014
14

FEDERAL DEPARTMENT OF TOWN AND COUNTRY PLANNING PENINSULAR MALAYSIA
MINISTRY OF URBAN WELLBEING, HOUSING AND LOCAL GOVERNMENT
2012 2013 2014
PARTICIPATION
No of LA 72
City Council 9
Municipal 20
District 43
Sample 11,271
Happy 3
Moderate 69
RESULTS
PARTICIPATION
No of LA 94
City Council 10
Municipal 31
District 53
Sample 14,450
Happy 4
Moderate 90
RESULTS
PARTICIPATION
No of LA 104
City Council 10
Municipal 36
District 58
Sample 21,731
Happy 12
Moderate 92
RESULTS
HAPPINESS INDEX STUDY
LESS HAPPY MODERATE HAPPY
< 49% 50% - 79% > 80%
74.68% 74.80% 76.06% City Council 74.23%
Municipal 73.81%
District 75.17%
City Council 74.38%
Municipal 74.40%
District 75.63%
City Council 75.85%
Municipal 76.09%
District 76.09%
15
Source, Malaysia Urban Sustainable Report, JPBD 2014

FEDERAL DEPARTMENT OF TOWN AND COUNTRY PLANNING PENINSULAR MALAYSIA
MINISTRY OF URBAN WELLBEING, HOUSING AND LOCAL GOVERNMENT
HAPPINESS INDEX STUDY
2012 2013
2014
74.68% 74.80%
76.06%
72 LAs 94 LAs
104 LAs
16

FEDERAL DEPARTMENT OF TOWN AND COUNTRY PLANNING PENINSULAR MALAYSIA
MINISTRY OF URBAN WELLBEING, HOUSING AND LOCAL GOVERNMENT
BAROMETER ANALYSIS OF HAPPINESS INDEX
1. Average Happiness Index for Malaysia is
76.06% (2014) compare to 74.80 % (2013).
2. Based on our findings, people who live in
rural areas are much happier with their lives
compared to those who live in urban
areas/cities.
3. Happiness index can be used as a tool to
formulate related policies to improve the
social wellbeing of communities. Source, Malaysia Urban Sustainable Report, JPBD 2014
17
FEDERAL DEPARTMENT OF TOWN AND COUNTRY PLANNING PENINSULAR MALAYSIA
MINISTRY OF URBAN WELLBEING, HOUSING AND LOCAL GOVERNMENT
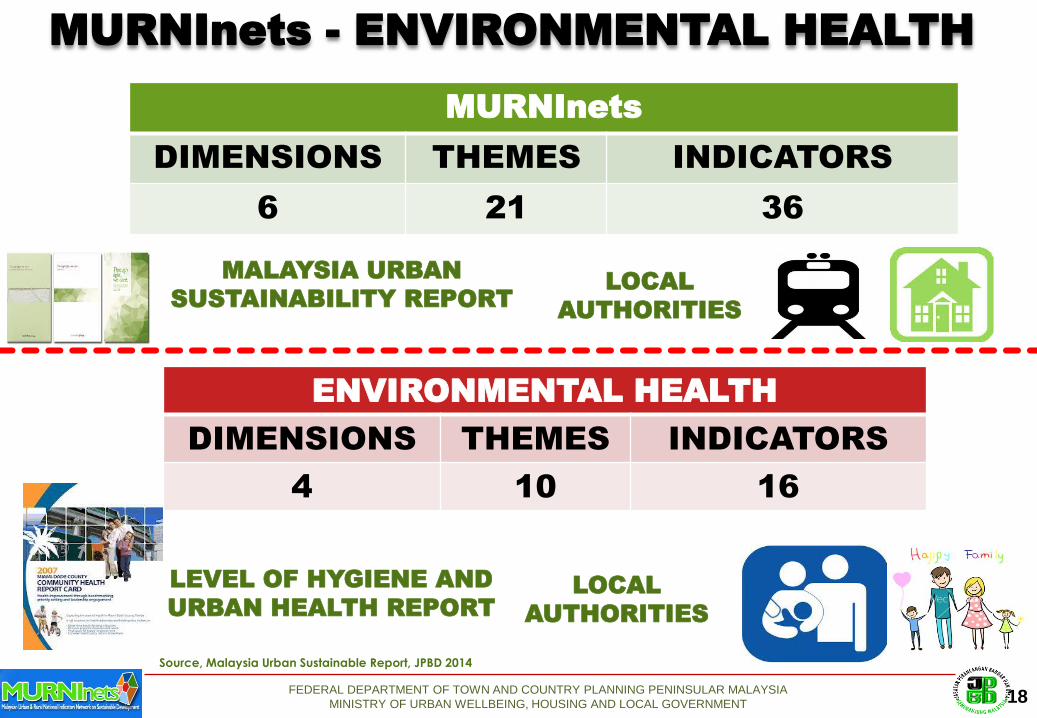
MURNInets
DIMENSIONS THEMES INDICATORS
6 21 36
ENVIRONMENTAL HEALTH
DIMENSIONS THEMES INDICATORS
4 10 16
MALAYSIA URBAN
SUSTAINABILITY REPORT
LEVEL OF HYGIENE AND
URBAN HEALTH REPORT
LOCAL
AUTHORITIES
Source, Malaysia Urban Sustainable Report, JPBD 2014
LOCAL
AUTHORITIES
MURNInets - ENVIRONMENTAL HEALTH
18

FEDERAL DEPARTMENT OF TOWN AND COUNTRY PLANNING PENINSULAR MALAYSIA
MINISTRY OF URBAN WELLBEING, HOUSING AND LOCAL GOVERNMENT
MURNInets – ENVIRONMENTAL HEALTH INDICATORS SCORES
3
Sustainable
2
Moderate
1
Less
1 Cleanliness Level of The River 16 32 60
2 Environmental Air Quality Conditions 16 24 68
3 Percentage of Population Living in Flood Prone Area 9 10 89
4 Percentage of Per Capita Solid Waste Generation 19 27 62
5 Total Programs / Environmental Campaigns Carried Out in Local Authority Area 12 15 81
6 Percent Residential Coverage Within 400 Meters of Community Facilities 38 19 51
7 The Ratio of Cases of Water and Vector Borne Diseases per 10,000 Population 58 39 11
8 Percentage of Grade A Food Premises 65 29 14
9 Percentage of Grade A (five star) Public Toilets 80 14 14
10 The Ratio of Public Open Space per 1,000 Population 36 23 49
11 Percentage Change in the Forest Area 19 65 24
12 The Number of Tourism Attractions and Recreation Centers 7 22 79
13 Percentage of Total Waste Recycled 58 20 30
14 Percentage of Domestic Solid Waste Collection on Schedule 12 14 82
15 Number of Integrated Public Transport Terminals / Stations 30 47 31
16 The Percentage of Homes with Centralized Sewerage Services 56 16 36
19

FEDERAL DEPARTMENT OF TOWN AND COUNTRY PLANNING PENINSULAR MALAYSIA
MINISTRY OF URBAN WELLBEING, HOUSING AND LOCAL GOVERNMENT
Ph
ysic
al
Pla
nn
ing
an
d U
rban
Desig
n
FRAMEWORK OF THE PILOT PROJECT HEALTHY CITIES
HE
ALT
HY
A
ND
A
CT
IV
E L
IV
IN
G L
IF
ES
TY
LE
:
KU
AL
A T
ER
EN
GG
AN
U A
ND
K
LU
AN
G
So
cia
l an
d
Co
mm
un
ity
Pro
gra
mm
e
Healt
hty
Lif
esty
le
Pro
gra
mm
e
20

FEDERAL DEPARTMENT OF TOWN AND COUNTRY PLANNING PENINSULAR MALAYSIA
MINISTRY OF URBAN WELLBEING, HOUSING AND LOCAL GOVERNMENT
CENTRE OF EXCELLENCE (COE)
Place
Making
for urban wellbeing and happiness
OBJECTIVE
1. Social Coherence
2. Happiness
3. Health
4. Community Empowerment
5. Place making
RESEARCH – CAPACITY BUILDING –
PROMOTION & KNOWLEDGE SHARING
FUNCTION
21

FEDERAL DEPARTMENT OF TOWN AND COUNTRY PLANNING PENINSULAR MALAYSIA
MINISTRY OF URBAN WELLBEING, HOUSING AND LOCAL GOVERNMENT
1. The role of local authorities is seen as crucial in planning for
sustainability using a bottom up mechanism from support of the
local communities to ensure that strategic local planning,
development regulation and governance coherent with the
sustainability objectives.
2. Sustainability performance of local authorities can be monitored and
served as a guideline for urban managers towards sustainable cities.
3. MURNInets is monitoring mechanism to identify sustainability gaps
in local authorities and to assist in improving identified areas
concern.
4. Happiness is pre-requisite in Sustainable Development / Urban
Sustainability and Sustainable Communities.
5. Happiness index as a framework for decision-making and policy
development and provides guidance to local authorities interested in
improving the level of wellbeing people.
CONCLUSION
22

FEDERAL DEPARTMENT OF TOWN AND COUNTRY PLANNING PENINSULAR MALAYSIA
MINISTRY OF URBAN WELLBEING, HOUSING AND LOCAL GOVERNMENT
THANK YOU
(www.townplan.gov.my)
FEDERAL DEPARTMENT OF TOWN AND COUNTRY PLANNING PENINSULAR MALAYSIA
MINISTRY OF URBAN WELLBEING, HOUSING AND LOCAL GOVERNMENT