sustainability indicators - Observatorio Español de Acuicultura |
156
Defining sustainability indicators for Mediterranean Aquaculture
-
Upload
khangminh22 -
Category
Documents
-
view
0 -
download
0
Transcript of sustainability indicators - Observatorio Español de Acuicultura |
Defining sustainability indicators for Mediterranean Aquaculture

Defining
sustainability indicators for Mediterranean Aquaculture
The designation of geographical entities and the presentation of the material in this book does not
imply the expression of any opinion on behalf of the Spanish Aquaculture Observatory Foundation
(FOESA), the International Union for the Conservation of Nature (IUCN), or the Spanish Association
of Marine Fish Farmers (APROMAR) regarding the legal condition of any country, territory or area, or
of its authorities, with regards to the demarcation of its frontiers or boundaries.
The views expressed in this publication do not necessarily reflect those of FOESA, IUCN or
APROMAR.
This publication has been made possible thanks to the collaboration of the Biodiversity Foundation
and the Spanish Ministry for the Environment and Rural and Marine Affairs.
Published by: The Spanish Aquaculture Observatory Foundation (FOESA), Madrid, Spain, in
partnership with the International Union for the Conservation of Nature (IUCN) and the Spanish
Association of Marine Fish Farmers (APROMAR).
Copyright: ©2010 Spanish Aquaculture Observatory Foundation (FOESA)
Reproduction of this publication for educational and other non-commercial purposes is authorized
without prior written permission from the copyright holder providing the source is fully acknowledged.
Reproduction of this publication for resale or other commercial purposes is expressly prohibited
without prior written permission from the copyright holder.
Citation: FOESA (2010) Defining sustainability indicators for Mediterranean Aquaculture FOESA,
Madrid, Spain 152 pages.
ISBN: 978-84-937611-2-7
Legal Deposit: NIPO: 770-10-293-6
Design, editing and layout: Arpa & Asociados
Developed by: Spanish Aquaculture Observatory Foundation (FOESA)
Available from: Spanish Aquaculture Observatory Foundation (FOESA)
c/Fortuny, 47 1º 17
28010 Madrid
Tel: 91 310 75 46
www.fundacionoesa.es / www.mediterraneon.es
A catalogue of FOESA publications is also available at:
www.fundacionoesa.es/publicaciones
The text of this book was printed on 100% recycled coated paper.
2
Defining sustainability indicators for Mediterranean Aquaculture
33
INDEX
FOREWORD 4
EXECUTIVE SUMMARY 8
GENERAL STATE OF AQUACULTURE 12
1. State of World aquaculture 132. State of Mediterranean aquaculture 17
SUSTAINABLE DEVELOPMENT OF AQUACULTURE 24
PROJECT MEDITERRANE-ON 281. Approach 29
2. Background 323. Procedure 35
PRINCIPLES, CRITERIA AND INDICATOR GUIDE 381. Introduction 39
2. Indicators of sustainability at a farm/company level 433. Indicators of sustainability at a national level 69
4. Indicators of sustainability at a Mediterranean level 98
APPENDICES 114
APPENDIX 1. Records for Mediterranean countries 115
APPENDIX 2. Glossary 135
APPENDIX 3. Bibliography 139
APPENDIX 4. List of participants 141
APPENDIX 5. List of acronyms 145
FOREWORD
Our society faces new and formidable challenges in promoting and implementing moresustainable social and economic development in each and every socioeconomic activity andaspect that enable our civilization to progress. A firm commitment to this development modelis forcing social agents to seek to adopt new interrelationship and coordination mechanisms,which contemplate the world in a global manner, as was reflected in recent internationalsummits held to collectively make headway regarding sustainability.
The term “sustainable development” emerged in 1987, when it appeared for the first timein the Brundtland Report and it presented a new approach, which took future generationsinto account in the decision-making process, so that their development capabilities would notbe compromised, allowing for environmental, economic and social aspects in this decision-making process, from a comprehensive perspective.
Today, the term 'sustainable' is attached to a great number of products, processes andactivities. It has rapidly become an essential aspect for agents and consumers who associateits use with the incorporation of new features and qualities related to the conservation andpreservation of the environment, the economic durability of a particular activity or the concernfor social aspects in business management such as quality of employment and non-discrimination.
In this regard, the risk of sustainable development becoming just another marketing feature ishigh, hence the need to join forces so that this development does not simply remain a fad butcan become a reality and be used in an effective and appropriate manner, responding to thenew needs that society faces.
From an environmental point of view, the fight against climate change, global warming andthe protection and conservation of biodiversity have become the core issues of a number ofinitiatives and actions, both public and private, taking up the main pages in the politicalagenda and the media, and instilling in society the importance of optimizing the use of naturalresources which we have today, to ensure that future generations can enjoy them.
In this field, sustainable aquaculture is enabling the production of a high number of speciesthat have been jeopardised in the wild such as eels, red tuna or common trout, thisproduction contributing to the protection of biodiversity and the fight against their extinctionin the wild. There is no doubt that research, technological development and innovation, whichsupport aquaculture to a great extent, will enable the production of new species in the future,with the aim of improving biodiversity and the natural resources of our seas and rivers.
5
FORE
WOR
D
On a social basis, the fight against hunger, malnutrition and poverty is still, even today, oneof the greatest challenges that we face. Recent initiatives, such as the United NationsMillennium Development Goals, have opened a window of hope, with the need to join forcesif we want to live in a fairer, safer and more sustainable world by 2015.
Aquaculture will also play a key role in this fight, as highlighted by the FAO, given that it isalready the main source of fish protein for the world's population, generating wealth and well-being as well as creating employment in rural and fishing areas, where often, developmentopportunities are limited.
From an economic point of view, there is no doubt that aquaculture is a booming anddynamic activity on a worldwide level. The 68.4 million tonnes produced in 2008 directlygenerated economic resources nearing 85.000 million euros, in addition to resourcesgenerated by auxiliary activities that support aquaculture. Today, society and marketglobalization is forcing our businesses to seek synergies and business concentration, aimingto improve their competitiveness in a very demanding context of economies of scale for smalland medium producers. To meet this challenge they must aim for maximum product qualitythrough certification, being ready to undergo transformation and to search for innovativepresentations, which are increasingly sought after by a large part of society in a momentwhere, more than ever, time is money.
At the Spanish Aquaculture Observatory Foundation (FOESA) we understand that our societymust follow this path, committing to research, technological development and innovation andapply this knowledge to improve sustainability in Spanish aquaculture, which is what we worktowards on a daily basis.
Alicia Villauriz
General Sea Secretary
President of the Spanish Aquaculture Observatory Foundation
Vice-President of the Biodiversity Foundation
6
Defining sustainability indicators for Mediterranean Aquaculture
ackn
owle
dgm
ents
77
Data were compiled and this document was drafted by Cristina García Diez (FOESA) andSandra Simoes Rubiales (IUCN) under the general coordination of Javier Remiro Perlado(FOESA). The following mediterranean experts also took part in the reviews andcomments:
• Abdelhafid Chalabi (Department of Fisheries and Aquaculture, Canada)
• Alistair Lane (EAS, Belgium)
• Dror Angel (Haifa University, Israel)
• Eduardo Chia (INRA, France)
• Fernando Torrent (UPM, Spain)
• Fernando Otero Lourido (APROMAR, Spain)
• François René (IFREMER, France)
• François Simard (IUCN, Switzerland)
• Güzel Yücel-Gier (Dokuz Eylül University, Turkey)
• Javier Ojeda González-Posada (APROMAR/FEAP, Spain)
• José Carlos Macías Rivero (D.a.p., Spain)
• Pablo Ávila Zaragoza (D.a.p., Spain)
• Philippos Papageorgiou (Fisheries and Aquaculture Consultant, Greece)
• Rosa Chapela Pérez (CETMAR, Spain)
• Shirra Freeman (Haifa University, Israel/EEUU)
This project has been co-funded by the Biodiversity Foundation.
The photographs of the document have been given by the institutions and experts thatcollaborated in the development of the project or belong to the photo database of theOESA Foundation.
EXECUTIVE SUMMARY
Aquaculture has existed for more than 4.000 years in the various cultures and civilizationsthat have inhabited the earth. Nevertheless, the development process leading to its globalimportance today is relatively recent and has run side by side with the process of socialawareness regarding the need to satisfy economic viability, social fairness andenvironmental conservation in all aspects of society, which are the three pillars that supportthe concept of sustainable development or sustainability. Nowadays, aquaculture isconsidered a consolidated and strategic practice that plays a key role in the growingdemand for animal proteins on a worldwide scale and acting as a perfect complement tocommercial fishing, which, as scientific studies have shown, has reached its highest levelsince the end of the 1980s. Aquaculture has to be able to face this challenge, byresponding in a sustainable manner to society's expectations.
There is still strong potential for aquaculture development in the Mediterranean area, withthe need to continue working together to guarantee that this development is sustainable,with fair and balanced rules that can be applied to all the countries within the region,thereby laying the foundations for Mediterranean aquaculture that are committed tobiodiversity conservation and social and economic development in each of these countries,taking their current and future needs into account.
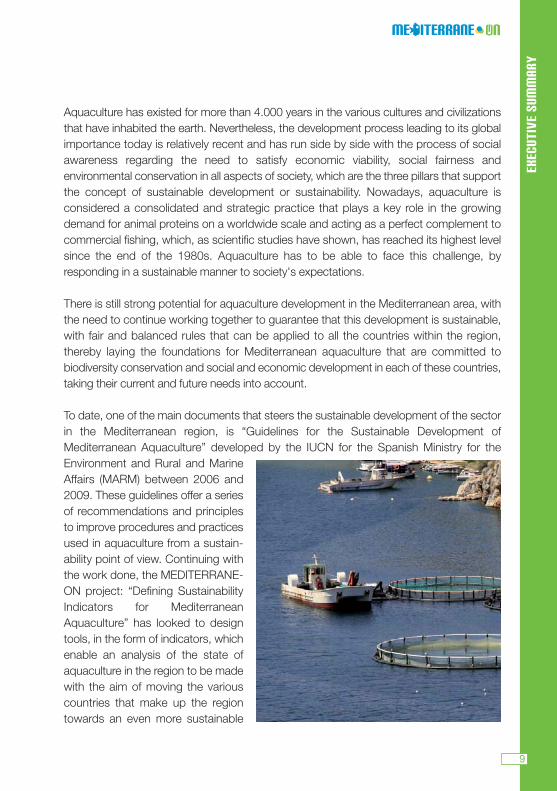
To date, one of the main documents that steers the sustainable development of the sectorin the Mediterranean region, is “Guidelines for the Sustainable Development ofMediterranean Aquaculture” developed by the IUCN for the Spanish Ministry for theEnvironment and Rural and MarineAffairs (MARM) between 2006 and2009. These guidelines offer a seriesof recommendations and principlesto improve procedures and practicesused in aquaculture from a sustain-ability point of view. Continuing withthe work done, the MEDITERRANE-ON project: “Defining SustainabilityIndicators for MediterraneanAquaculture” has looked to designtools, in the form of indicators, whichenable an analysis of the state ofaquaculture in the region to be madewith the aim of moving the variouscountries that make up the regiontowards an even more sustainable
9
EXEC
UTIV
E SU
MM
ARY
aquaculture development. These tools aim to be of use to all the stakeholders involved inthe sector; administrations, producing sectors, scientific communities, non-governmentalorganizations and other sectors and stakeholders, in order to obtain an initial assessmentof Mediterranean aquaculture from a sustainability point of view.
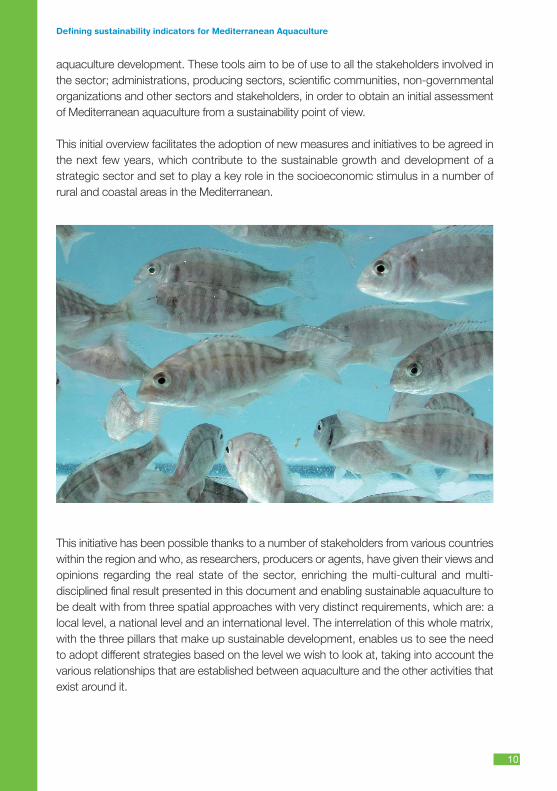
This initial overview facilitates the adoption of new measures and initiatives to be agreed inthe next few years, which contribute to the sustainable growth and development of astrategic sector and set to play a key role in the socioeconomic stimulus in a number ofrural and coastal areas in the Mediterranean.
This initiative has been possible thanks to a number of stakeholders from various countrieswithin the region and who, as researchers, producers or agents, have given their views andopinions regarding the real state of the sector, enriching the multi-cultural and multi-disciplined final result presented in this document and enabling sustainable aquaculture tobe dealt with from three spatial approaches with very distinct requirements, which are: alocal level, a national level and an international level. The interrelation of this whole matrix,with the three pillars that make up sustainable development, enables us to see the needto adopt different strategies based on the level we wish to look at, taking into account thevarious relationships that are established between aquaculture and the other activities thatexist around it.
10
Defining sustainability indicators for Mediterranean Aquaculture
EXEC
UTIV
E SU
MM
ARY
11
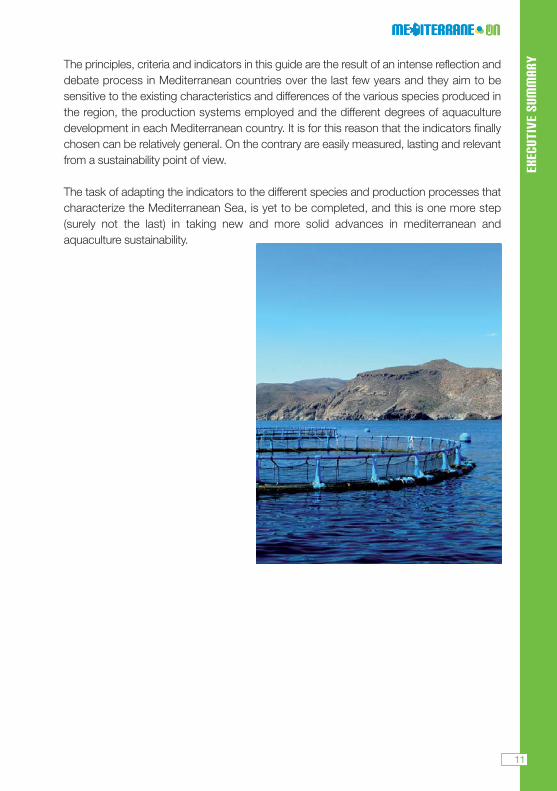
The principles, criteria and indicators in this guide are the result of an intense reflection anddebate process in Mediterranean countries over the last few years and they aim to besensitive to the existing characteristics and differences of the various species produced inthe region, the production systems employed and the different degrees of aquaculturedevelopment in each Mediterranean country. It is for this reason that the indicators finallychosen can be relatively general. On the contrary are easily measured, lasting and relevantfrom a sustainability point of view.
The task of adapting the indicators to the different species and production processes thatcharacterize the Mediterranean Sea, is yet to be completed, and this is one more step(surely not the last) in taking new and more solid advances in mediterranean andaquaculture sustainability.
11
GENERAL STATE OF AQUACULTURE
1. State of World aquaculture
Although aquaculture is more than 4.000 years old, it only started its industrialdevelopment on a worldwide level 50 years ago, and since then it has been considered anemergent practice with high growth and development prospects. Time has proved rightthose who proposed a rapid and sustained growth in this activity, which today, inproductive terms, exceeds commercial fishing.
This growth is also due largely to the stagnation of commercial fishing towards the end ofthe 1980s; since then catches have remained stable at around 90-95 million tonnes.Improvements in the management of fishing resources will allow fishing levels in thefollowing years to be maintained but probably not increased, so further increases in globalseafood production will only be able to come from aquaculture activities.
According to the latest information available (The State of World Fisheries andAquaculture, FAO, 2008), worldwide aquaculture now produces 68.4 million tonnes,compared to approximately 67.0 million tonnes of fishing products caught for humanconsumption by fishing. In reality, the total amount of fish catches exceeded 90.8 milliontonnes but nearly 24 million tonnes of this goes towards other uses, mainly feeds for farmanimals, fish and prawns.
13
GENE
RAL
STAT
E OF
AQU
ACUL
TURE
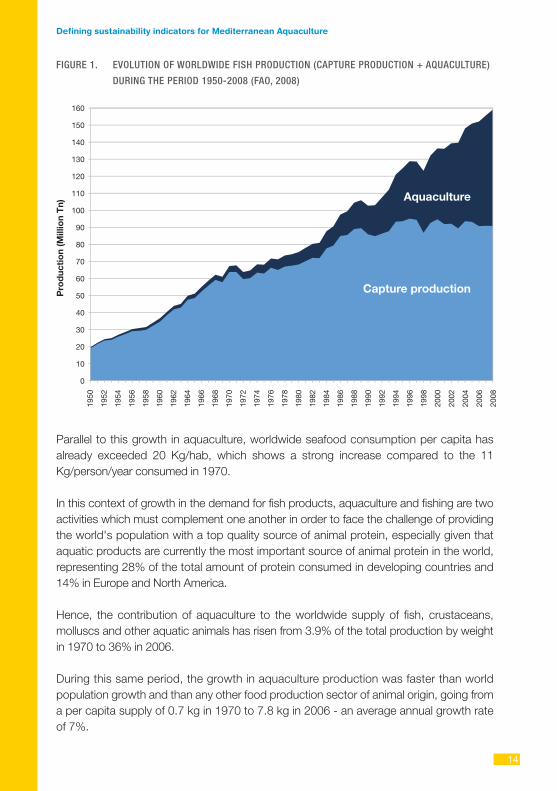
FIGURE 1. EVOLUTION OF WORLDWIDE FISH PRODUCTION (CAPTURE PRODUCTION + AQUACULTURE)
DURING THE PERIOD 1950-2008 (FAO, 2008)
Parallel to this growth in aquaculture, worldwide seafood consumption per capita hasalready exceeded 20 Kg/hab, which shows a strong increase compared to the 11Kg/person/year consumed in 1970.
In this context of growth in the demand for fish products, aquaculture and fishing are twoactivities which must complement one another in order to face the challenge of providingthe world's population with a top quality source of animal protein, especially given thataquatic products are currently the most important source of animal protein in the world,representing 28% of the total amount of protein consumed in developing countries and14% in Europe and North America.
Hence, the contribution of aquaculture to the worldwide supply of fish, crustaceans,molluscs and other aquatic animals has risen from 3.9% of the total production by weightin 1970 to 36% in 2006.
During this same period, the growth in aquaculture production was faster than worldpopulation growth and than any other food production sector of animal origin, going froma per capita supply of 0.7 kg in 1970 to 7.8 kg in 2006 - an average annual growth rateof 7%.
14
Defining sustainability indicators for Mediterranean Aquaculture
GENE
RAL
STAT
E OF
AQU
ACUL
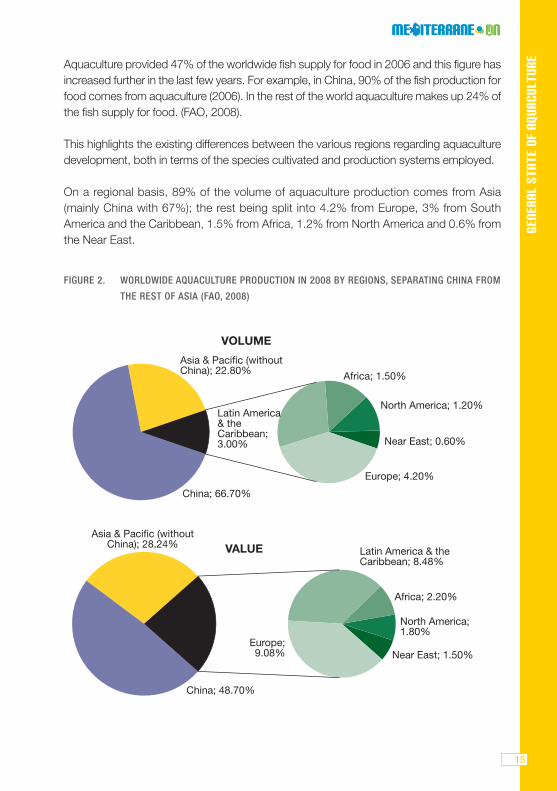
TUREAquaculture provided 47% of the worldwide fish supply for food in 2006 and this figure has
increased further in the last few years. For example, in China, 90% of the fish production forfood comes from aquaculture (2006). In the rest of the world aquaculture makes up 24% ofthe fish supply for food. (FAO, 2008).
This highlights the existing differences between the various regions regarding aquaculturedevelopment, both in terms of the species cultivated and production systems employed.
On a regional basis, 89% of the volume of aquaculture production comes from Asia(mainly China with 67%); the rest being split into 4.2% from Europe, 3% from SouthAmerica and the Caribbean, 1.5% from Africa, 1.2% from North America and 0.6% fromthe Near East.
FIGURE 2. WORLDWIDE AQUACULTURE PRODUCTION IN 2008 BY REGIONS, SEPARATING CHINA FROM
THE REST OF ASIA (FAO, 2008)
1515
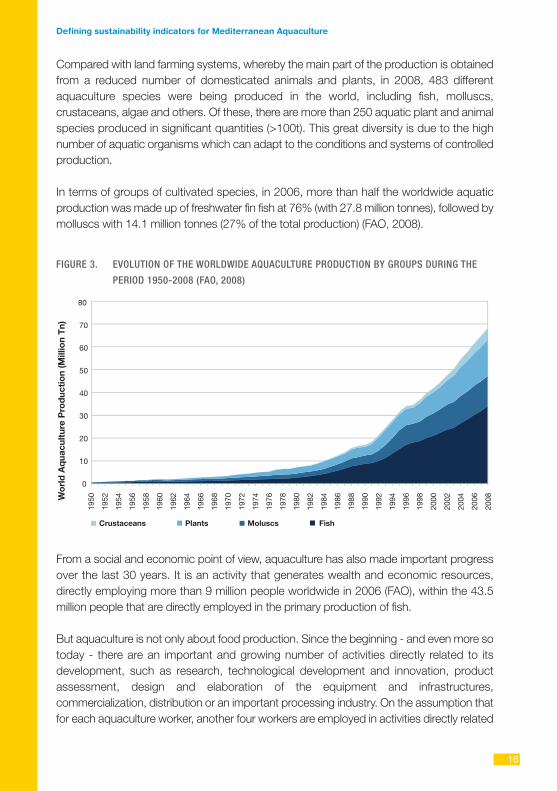
Compared with land farming systems, whereby the main part of the production is obtainedfrom a reduced number of domesticated animals and plants, in 2008, 483 differentaquaculture species were being produced in the world, including fish, molluscs,crustaceans, algae and others. Of these, there are more than 250 aquatic plant and animalspecies produced in significant quantities (>100t). This great diversity is due to the highnumber of aquatic organisms which can adapt to the conditions and systems of controlledproduction.
In terms of groups of cultivated species, in 2006, more than half the worldwide aquaticproduction was made up of freshwater fin fish at 76% (with 27.8 million tonnes), followed bymolluscs with 14.1 million tonnes (27% of the total production) (FAO, 2008).
FIGURE 3. EVOLUTION OF THE WORLDWIDE AQUACULTURE PRODUCTION BY GROUPS DURING THE
PERIOD 1950-2008 (FAO, 2008)
From a social and economic point of view, aquaculture has also made important progressover the last 30 years. It is an activity that generates wealth and economic resources,directly employing more than 9 million people worldwide in 2006 (FAO), within the 43.5million people that are directly employed in the primary production of fish.
But aquaculture is not only about food production. Since the beginning - and even more sotoday - there are an important and growing number of activities directly related to itsdevelopment, such as research, technological development and innovation, productassessment, design and elaboration of the equipment and infrastructures,commercialization, distribution or an important processing industry. On the assumption thatfor each aquaculture worker, another four workers are employed in activities directly related
16
Defining sustainability indicators for Mediterranean Aquaculture
GENE
RAL
STAT
E OF
AQU
ACUL
TUREto aquaculture production, then some 36 million people worldwide are generating an
income from the breeding of aquatic species.
The success of modern aquaculture is based on the control of species reproduction,improved knowledge of their biology, technological innovations and the development ofsafe and good quality food products. In line with this approach, aquaculture is certainly anactivity with an important development potential, capable of contributing to reducingpoverty and malnutrition, providing society with foods rich in protein, oils, vitamins andminerals that improve health and quality of life, as well as improving economic incomes andgenerating new specialized job positions and hence promoting socioeconomicdevelopment in the regions where it continues to grow.
Over the last thirty years aquaculture has grown and diversified with very significanttechnological improvements. The contribution of these improvements for achievingsocioeconomic wellbeing - both in developed and developing countries - for improvedquality of life and better food safety has been recognised by the FAO in its BangkokDeclaration and Strategy (2000). This document highlights the need to back the potentialdevelopment in aquaculture for the benefit of human beings. This growth will only besuccessful and lasting if it is done in a sustainable manner, respecting the environment, thecreatures that live in it and by being sensitive and committed to the social and economicdevelopment of all persons.
2. State of Mediterranean aquaculture
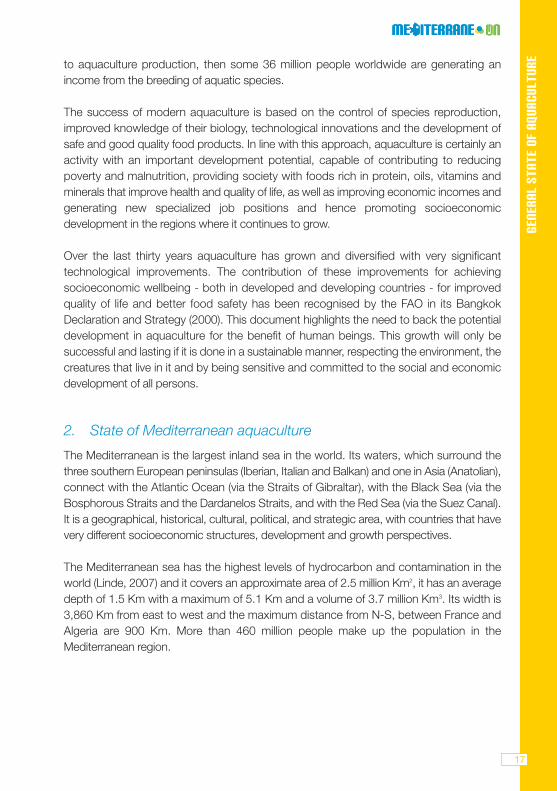
The Mediterranean is the largest inland sea in the world. Its waters, which surround thethree southern European peninsulas (Iberian, Italian and Balkan) and one in Asia (Anatolian),connect with the Atlantic Ocean (via the Straits of Gibraltar), with the Black Sea (via theBosphorous Straits and the Dardanelos Straits, and with the Red Sea (via the Suez Canal).It is a geographical, historical, cultural, political, and strategic area, with countries that havevery different socioeconomic structures, development and growth perspectives.
The Mediterranean sea has the highest levels of hydrocarbon and contamination in theworld (Linde, 2007) and it covers an approximate area of 2.5 million Km2, it has an averagedepth of 1.5 Km with a maximum of 5.1 Km and a volume of 3.7 million Km3. Its width is3,860 Km from east to west and the maximum distance from N-S, between France andAlgeria are 900 Km. More than 460 million people make up the population in theMediterranean region.
17
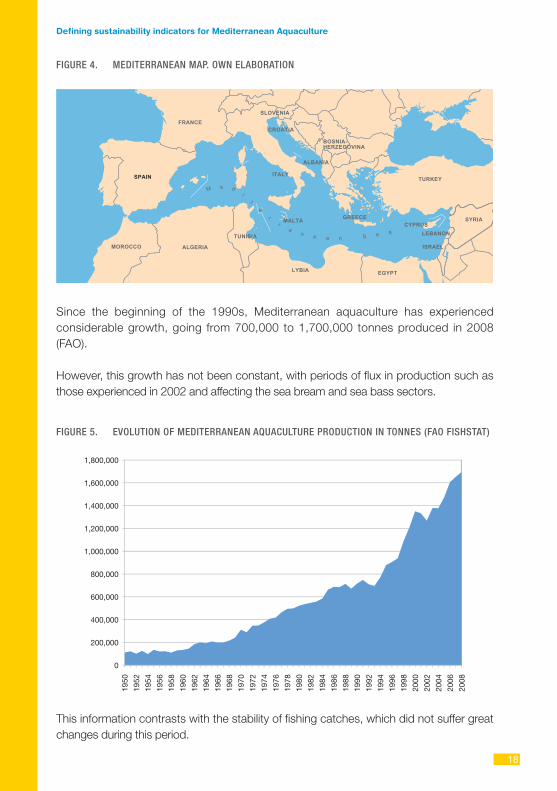
FIGURE 4. MEDITERRANEAN MAP. OWN ELABORATION
Since the beginning of the 1990s, Mediterranean aquaculture has experiencedconsiderable growth, going from 700,000 to 1,700,000 tonnes produced in 2008(FAO).
However, this growth has not been constant, with periods of flux in production such asthose experienced in 2002 and affecting the sea bream and sea bass sectors.
FIGURE 5. EVOLUTION OF MEDITERRANEAN AQUACULTURE PRODUCTION IN TONNES (FAO FISHSTAT)
This information contrasts with the stability of fishing catches, which did not suffer greatchanges during this period.
18
Defining sustainability indicators for Mediterranean Aquaculture

GENE
RAL
STAT
E OF
AQU
ACUL
TUREFIGURE 6. PRODUCTION IN THE MEDITERRANEAN. CAPTURE PRODUCTION + AQUACULTURE
(FAO, 2008)
With regards to the economic value of the species farmed, there are also importantdifferences where both extremes can be noted: Species with moderate production but ahigh economic value, such as sea bream and sea bass and species with a high productionlevel but moderate economic value such as tilapia or mussels.
FIGURE 7. AQUACULTURE IN THE MEDITERRANEAN. PRODUCTION BY SPECIES (FAO, 2008)
Although Mediterranean aquaculture was based on the cultivation of molluscs in the 1990sthe percentage of fish cultivation has experienced an exponential increase in the last fewyears and is still on the rise although at a lesser rate today. The trend is for further increasesin fin fish production, with more moderate growth in the case of molluscs.
19
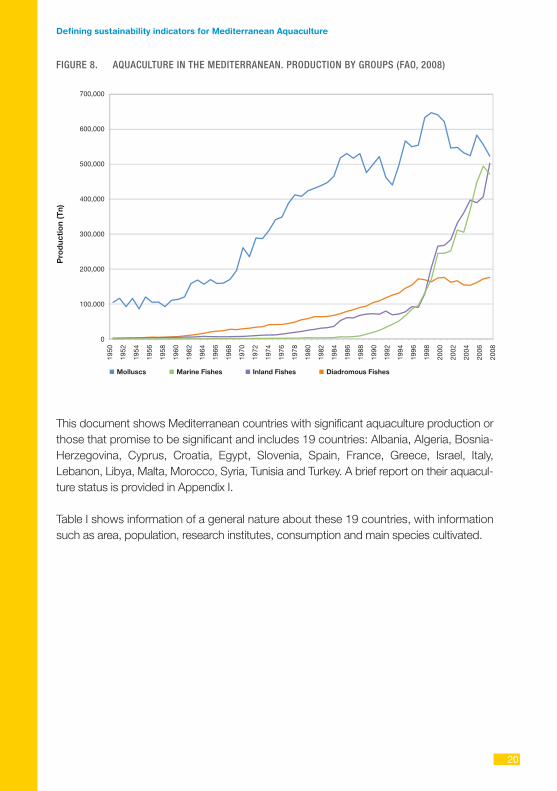
FIGURE 8. AQUACULTURE IN THE MEDITERRANEAN. PRODUCTION BY GROUPS (FAO, 2008)
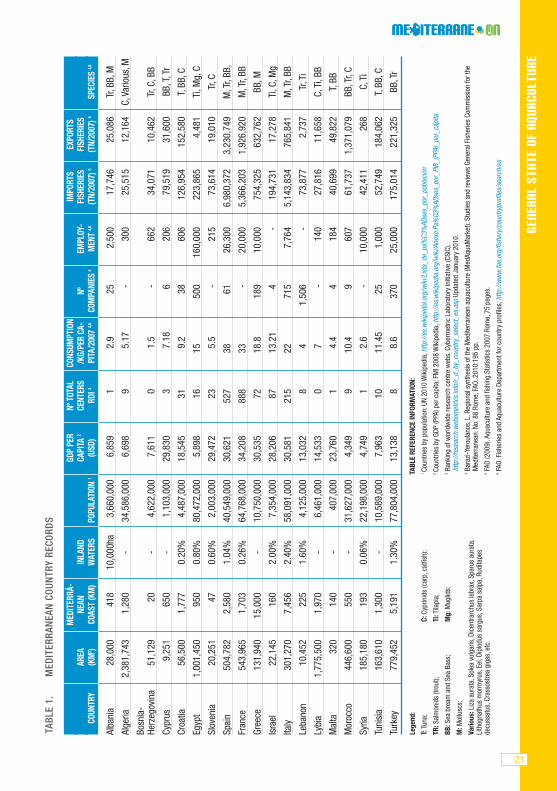
This document shows Mediterranean countries with significant aquaculture production orthose that promise to be significant and includes 19 countries: Albania, Algeria, Bosnia-Herzegovina, Cyprus, Croatia, Egypt, Slovenia, Spain, France, Greece, Israel, Italy,Lebanon, Libya, Malta, Morocco, Syria, Tunisia and Turkey. A brief report on their aquacul-ture status is provided in Appendix I.
Table I shows information of a general nature about these 19 countries, with informationsuch as area, population, research institutes, consumption and main species cultivated.
20
Defining sustainability indicators for Mediterranean Aquaculture
GENE
RAL
STAT
E OF
AQU
ACUL
TURE
21
TABL
E 1.
M
EDIT
ERRA
NEA
N C
OUN
TRY
RECO
RDS
MED
ITER
RÁ-
GDP
PER
Nº T
OTAL
CO
NSUM
PTIO
N IM
PORT
SEX
PORT
SAR
EANE
AN
INLA
NDCA
PITA
2CE
NTER
S /K
G/PE
R CA
-Nº
EM
PLOY
-FI
SHER
IES
FISH
ERIE
S CO
UNTR
Y(K
M2 )
COAS
T (K
M)
WAT
ERS
POPU
LATI
ON 1
(USD
)RD
I 3PI
TA/2
007
4,6
COM
PANI
ES 4
MEN
T 4,
6(T
N/20
07) 5
(TN/
2007
) 5SP
ECIE
S 4,
6
Alba
nia
28,0
0041
810
,000
ha3,
660,
000
6,85
91
2.9
252,
500
17,7
4625
,086
Tr,B
B,M
Alge
ria
2,38
1,74
31,
280
-34
,586
,000
6,69
89
5.17
-30
025
,515
12,1
64C,
Vario
us,M
Bosn
ia-
Herz
egov
ina
51,1
2920
-4,
622,
000
7,61
10
1.5
-66
234
,071
10,4
62Tr
,C,B
B
Cypr
us9,
251
650
-1,
103,
000
29,8
303
7.18
620
679
,519
31,6
00BB
,T,T
r
Croa
tia56
,500
1,77
70.
20%
4,48
7,00
018
,545
319.
238
606
126,
954
152,
580
T,BB
,C
Egyp
t 1,
001,
450
950
0.80
%80
,472
,000
5,89
816
1550
016
0,00
022
3,86
54,
481
Ti,M
g,C
Slov
enia
20,2
5147
0.60
%2,
003,
000
29,4
7223
5.5
-21
573
,614
19,0
10Tr
,C
Spai
n50
4,78
22,
580
1.04
%40
,549
,000
30,6
2152
738
6126
,300
6,98
0,37
23,
230,
749
M,T
r,BB
,
Fran
ce54
3,96
51,
703
0.26
%64
,768
,000
34,2
0888
833
-20
,000
5,36
6,20
31,
926,
920
M,T
r,BB
Gree
ce13
1,94
015
,000
-10
,750
,000
30,5
3572
18.8
189
10,0
0075
4,32
563
2,76
2BB
,M
Isra
el22
,145
160
2.00
%7,
354,
000
28,2
0687
13.2
14
-19
4,73
117
,278
Ti,C
,Mg
Italy
30
1,27
07,
456
2.40
%58
,091
,000
30,5
8121
522
715
7,76
45,
143,
834
765,
841
M,T
r,BB
Leba
non
10,4
5222
51.
60%
4,12
5,00
013
,032
84
1,50
6-
73,8
772,
737
Tr,T
i
Lybi
a1,
775,
500
1,97
0-
6,46
1,00
014
,533
07
-14
027
,816
11,6
58C,
Ti,B
B
Mal
ta32
014
0-
407,
000
23,7
601
4.4
418
440
,699
49,8
22T,
BB
Mor
occo
44
6,60
055
0-
31,6
27,0
004,
349
910
.49
607
61,7
371,
371,
079
BB,T
r,C
Syria
185,
180
193
0.06
%22
,198
,000
4,74
91
2.6
-10
,000
42,4
1126
8C,
Ti
Tuni
sia
163,
610
1,30
0-
10,5
89,0
007,
963
1011
.45
251,
000
52,7
4918
4,06
2T,
BB,C
Turk
ey
779,
452
5,19
11.
30%
77,8
04,0
0013
,138
88.
637
025
,000
175,
014
221,
325
BB,T
r
TABL
E RE
FERE
NCE
INFO
RMAT
ION:
1 Co
untri
es b
y po
pula
tion:
UN 2
010
Wik
iped
ia,h
ttp://
es.w
ikip
edia
.org
/wik
i/Lis
ta_d
e_pa
%C3
%AD
ses_
por_
pobl
ació
n2 Co
untri
es b
y GD
P (P
PA) p
er c
apita
:FM
I 200
8 W
ikip
edia
,http
://es
.wik
iped
ia.o
rg/w
iki/A
nexo
:Pa%
C3%
ADse
s_po
r_PI
B_(P
PA)_
per_
cápi
ta
3Ra
nkin
g of
wor
ldw
ide
rese
arch
cen
tre w
ebs.
Cybe
rmet
ric L
abor
ator
y In
itiat
ive
(CSI
C),
http
://re
sear
ch.w
ebom
etric
s.in
fo/r_
d_by
_cou
ntry
_sel
ect_
es.a
sp U
pdat
ed J
anua
ry 2
010.
4Ba
razi
-Yer
oula
nos,
L.Re
gion
al s
ynth
esis
of t
he M
edite
rran
ean
aqua
cultu
re (M
edAq
uaM
arke
t).St
udie
s an
d re
view
s Ge
nera
l Fis
herie
s Co
mm
issi
on fo
r the
Med
iterr
anea
n.No
.88
Rom
e,FA
O.20
10:1
95 p
p.5FA
O (2
009)
.Aqu
acul
ture
and
fish
ing
Stat
istic
s 20
07.R
ome,
75 p
ages
.6FA
O.Fi
sher
ies
and
Aqua
cultu
re D
epar
tmen
t for
cou
ntry
pro
files
,http
://w
ww
.fao.
org/
fishe
ry/c
ount
rypr
ofile
s/se
arch
/es
Lege
nd:
T:Tu
na;
C:Cy
prin
ids
(car
p,ca
tfish
);
TR:S
alm
onid
s (tr
out);
Ti
:Tila
pia;
BB:S
ea b
ream
and
Sea
Bas
s;
Mg:
Mug
lids;
M:M
ollu
scs;
Vario
us:L
iza
aura
ta,S
olea
vul
garis
,Dic
entra
rchu
s la
brax
,Spa
rus
aura
ta,
Lith
ogna
thus
mor
myr
us,E
el,D
iplo
dus
sarg
us,S
arpa
sal
pa,R
udita
pes
decu
ssat
us,C
rass
ostre
a gi
gas,
etc.
22
Defining sustainability indicators for Mediterranean Aquaculture
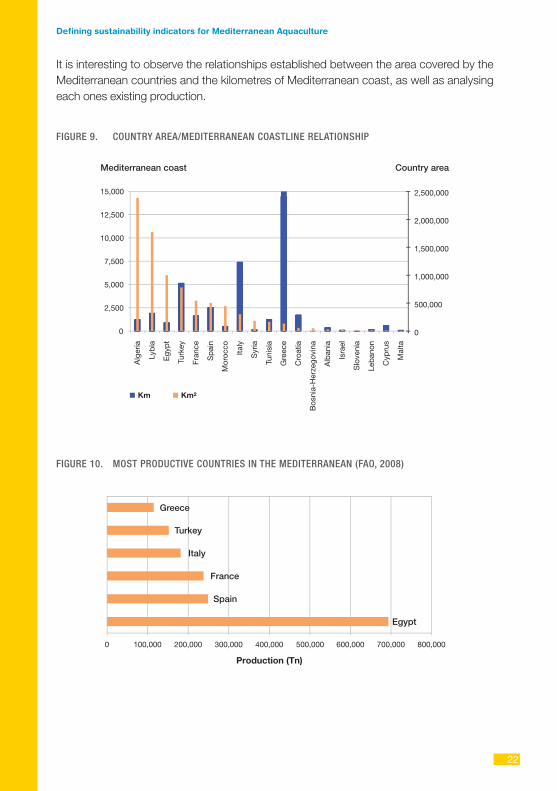
It is interesting to observe the relationships established between the area covered by theMediterranean countries and the kilometres of Mediterranean coast, as well as analysingeach ones existing production.
FIGURE 9. COUNTRY AREA/MEDITERRANEAN COASTLINE RELATIONSHIP
FIGURE 10. MOST PRODUCTIVE COUNTRIES IN THE MEDITERRANEAN (FAO, 2008)
GENE
RAL
STAT
E OF
AQU
ACUL
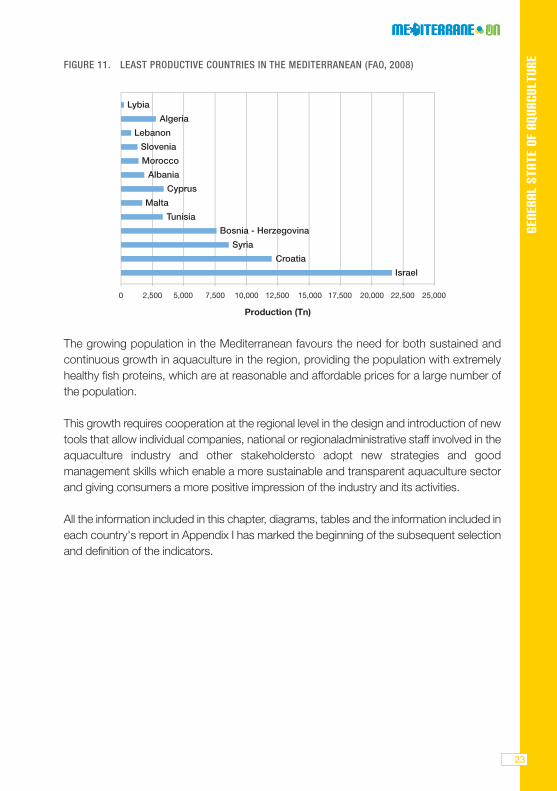
TUREFIGURE 11. LEAST PRODUCTIVE COUNTRIES IN THE MEDITERRANEAN (FAO, 2008)
The growing population in the Mediterranean favours the need for both sustained andcontinuous growth in aquaculture in the region, providing the population with extremelyhealthy fish proteins, which are at reasonable and affordable prices for a large number ofthe population.
This growth requires cooperation at the regional level in the design and introduction of newtools that allow individual companies, national or regionaladministrative staff involved in theaquaculture industry and other stakeholdersto adopt new strategies and goodmanagement skills which enable a more sustainable and transparent aquaculture sectorand giving consumers a more positive impression of the industry and its activities.
All the information included in this chapter, diagrams, tables and the information included ineach country's report in Appendix I has marked the beginning of the subsequent selectionand definition of the indicators.
23
SUSTAINABLE DEVELOPMENT IN AQUACULTURE
Towards the end of the 20th century, a new way of thinking appeared, known asconservation, as a result of the decisive change caused by the industrial revolutionregarding the relationship between man and his environment. It promoted a developmentstandard which was more humane and respectful towards the environment, compared tothe existing development, based on economic growth. From then on, both society and theindustry began to see the need to combine the concepts of production and developmentwith environmental preservation, giving rise to the concept of the environmental unit, whichstates that a change to any system will inevitably cause changes to others which thereforeforce one to think globally.
With this in mind, The Club of Rome was formed in 1968, which reflected on globalproblems, with the aim of offering new alternatives and suggestions to national andinternational leaders. Its first study was published in 1972, highlighting the ecologicaldangers of the economic and demographic growth being experienced throughout theworld at that point and which could lead to a catastrophic future if action was not taken.That same year the first Earth Summit took place in Stockholm (Sweden), where it wasacknowledged that environmental protection and the efficient management of naturalresources are crucial matters which affect the well-being of the population and economicdevelopment all over the world. The concept of eco-development flourished in thisanimated climate.
In 1984, nearly one year after the UN's General Assembly created it, the World Commissionon Environment and Development's first meeting took place. A mandate was created forthe first time which asked for the opinions and points of view of individuals, scientificinstitutions, non-governmental organizations, specialist organizations and other UnitedNation and Government organizations regarding the existing problems related to theenvironment and development. In 1987, the Brundtland Report also known as “OurCommon Future” was published. The term “sustainable development” appeared for the firsttime in this report, defining it as “development that meets the needs of the present withoutcompromising the ability of future generations to meet their own needs”. This documentacted as the foundation for the second Earth Summit in Río de Janiero in 1992, whichmarked the start of new lines of action based on development that combined economicviability, social fairness and the conservation of the environment. This is how “sustainabledevelopment” acquired its current 3-pillared definition.
The aquaculture sector, which experienced unprecedented development in the 1980s, isalso synonymous in the mid 1990s with creating the first tool for reaching a common andaccepted understanding of sustainability by all interested parties, and also wider socialacceptance. In the context of the third world summit for sustainable development in
25
SUST
AINA
BLE
DEVE
LOPM
ENT
IN A
QUAC
ULTU
RE
Johannesburg (South Africa), the crisis suffered due to the badly controlled intensification ofshrimp farming ultimately tarnished the image of aquaculture. Indeed, it started to beassociated with the destruction of fragile ecosystems as well as with the negative impact onlocal towns. Generally speaking, aquaculture must, as a new emerging industry, in time,face up to global fears regarding both economic and social aspects as well asenvironmental ones. However, its development has also resulted in multiple actions thathave led to the breeding of aquatic species in captivity moving towards a practice more intune with sustainable development.
Various initiatives by a number of institutions such as; syndicates, internationalorganizations, NGOs and research institutes have been applied at various geographicalscales to promote sustainable development in aquaculture. Amongst them, and inparticular, is the FAO's 1995 “Code of Conduct for Responsible Fisheries”, which wasspecifically applied to aquaculture in 1998 or the Federation of European AquacultureProducers (FEAP)'s 2000 “Code of Conduct for European Aquaculture”. At theMediterranean level, the three “Guides for the sustainable development of mediterraneanaquaculture” published by the Spanish Ministry of the Environment and Rural and MarineAffairs and created by the IUCN between 2006 and 2009 are, to date, the only documentsdirected towards sustainable development of the sector in the region via theimplementation of good practices in aquaculture. On the other hand, more than a dozeninitiatives on a local, national or international level have been set up since the end of the1990s with the aim of developing criteria and sustainability indicators. This is the case, forexample, of the EU-funded CONSENSUS project which began in 2005 or the EVADproject. Information on these and other projects are provided in the next section.
26
Defining sustainability indicators for Mediterranean Aquaculture
SUST
AINA
BLE
DEVE
LOPM
ENT
IN A
QUAC
ULTU
REIn the same way, in the natural resources management policy, aquaculture has movedfrom a sectoral focus to an integrated management focus of the area, which considers allthe activities and usage of the coast or the coastal areas for better integration of thesector. This management concept aims to balance the pillars of sustainable developmentvia a process of co-construction, taking into consideration the opinions and interests of allthose involved.
Sustainability has become, in a way, aquaculture's pet project. It is synonymous withknowledge and optimization of the interactions that aquaculture establishes with theenvironment in which it is done, tending towards the maintenance and/ or increase inbiodiversity. Sustainability also contemplates socioeconomic development through thecreation of jobs, wealth and social and cultural development, at the same time aspromoting a harmonious integration with other activities in coastal and rural areas,generating synergies with these current and future activities and guaranteeing, ultimately,the viability and durability of aquaculture in the long term.
Despite considerable efforts, the social and environmental aspects of sustainabledevelopment do not carry the weight of the economic dimension. Aquaculture requires abetter understanding of the dynamics that regulate the three dimensions and theirinteractions. Research and the application of new and improved technologies cancontribute to better symmetry between the three pillars, as well as the definition andutilisation of sustainability indicators that allow those involved to measure and monitor,in a simple and timeless manner, the situation of aquaculture from a sustainability point ofview.
This report takes the existing publications and reports on this subject as a starting point,with the main aim of identifying sustainability indicators in the field of Mediterraneanaquaculture in the three dimensions; social, economic and environmental adapted to thethree levels: local, national and Mediterranean.
2727
PROJECT MEDITERRANE-ON
1. Approach
The definition of sustainable indicators has become a necessary first stage in order toachieve sustainable development. Aquaculture producers are the first to be interested inpromoting the sustainable development of their businesses, through the understanding thatthe final quality of their product depends largely on the actual sustainability of their businessand an appropriate assessment of the existing interactions between aquaculture and theenvironment and social and economic aspects.
The MEDITERRANE-ON project, co-funded by the Biodiversity Foundation, is coordinatedby the Spanish Aquaculture Observatory Foundation (FOESA), with the collaboration of theInternational Union for the Conservation of Nature (IUCN) and the Spanish Association ofMarine Fish Farmers (APROMAR) and it aims to provide all those involved in the aquacultureindustry: producers, central and regional administrations and international organizationswith a series of measurable indicators applicable to the whole Mediterranean Basin, andallowing those involved to analyse and improve the sustainability of this strategic industry forsocioeconomic development.
MEDITERRANE-ON's objectives are:
1. The definition and identification of indicators, capable of measuring sustainable aquaculture at a farm/ busi-ness, national and Mediterranean level.
2. To provide the decision makers and the aquaculture producers with a technical tool and advice on theprocesses of sustainable aquaculture development adapted to the Mediterranean context.
3. To increase awareness in the sustainable use and management of the social, economic and environmentalresources available in order to obtain a sustainable balance in the management of the activity.
The Biodiversity Foundation (BF) is a public foundation of Spain's Ministry for the Environment andRural and Marine Affairs. Its mission is to preserve natural heritage and promote biodiversity con-
servation, aiming to create jobs, wealth and well-being in society, with particular attention to rural areas. In orderto do this, the Foundation collaborates with organizations which make up a large network which includes the pub-lic sector, civil society and the business sector.
The Biodiversity Foundation was founded by the Spanish Government in 1998 to contribute towards the conser-vation and the sustainable use of biodiversity. The council is the Biodiversity Foundation's main organ of govern-ment. Representatives of the General State Administration take part in it as well as well-known people in the fieldof nature conservation. To carry out its mission, the Biodiversity Foundation has a multi-disciplinary team made upof around 50 professionals, who respond to the demands of the job, the management and the social projection ofthe organization.
Web: www.fundacion-biodiversidad.es/
29
PROJ
ECT
MED
ITER
RANE
-ON
The Spanish Association of Marine Fish Farmers (APROMAR) is a national organiza-tion with professional scope, recognized since 1986 as a Producer Organization (OP-30).It belongs to the Federation of European Aquaculture Producers.
APROMAR's main aim is to represent the business sector of Spanish marine aquaculture,to provide services that contribute to improving competitiveness amongst its members and encourage sociallyresponsible behaviour for sustainable aquaculture.
APROMAR also supports food quality and food safety in fish rearing, while respecting the environment and the ani-mal well-being.
Web: www.apromar.es / www.feap.es
The International Union for the Conservation of Nature, (IUCN) helps the world find pragmaticsolutions to our most pressing environment and development challenges. It supports scientificresearch, manages field projects all over the world and brings governments and non-governmentorganizations, United Nations agencies, companies and local communities together to develop and
implement policy, laws and best practice.
IUCN is the world's oldest and largest environmental network. IUCN is a democratic membership union with morethan 1,000 government and NGO member organizations and almost 11,000 volunteer scientists in more than 160countries.
IUCN's work is supported by more than 1,000 professional staff in 60 offices and hundreds of partners in public,NGO and private sectors around the world.
IUCN's Global Marine Project covers 8 subjects.The Global Marine Project's Fisheries and Aquaculture activities pro-gramme includes:
1. Governance
2. Certification
3. Sustainable Aquaculture
4. Illegal Unreported and Unregulated fishing (IUU)
Web: www.uicn.es
Web: www.uicnmed.org
30
Defining sustainability indicators for Mediterranean Aquaculture
PROJ
ECT
MED
ITER
RANE
-ON
The Spanish Aquaculture Observatory Foundation (FOESA), set up in june2008, is a public Foundation protected by the Spanish Ministry of theEnvironment and Rural and Marine Affairs (MARM), as well as Biodiversity
Foundation. Its patrons are the Secretary General of the Sea, National Advisory board of Marine Aquaculture Farms(JACUMAR), Spanish Institute of Oceanography (IEO), Spanish National Research Council (CSIC), Spanish Scienceand Technology Foundation (FECYT) and Alfonso Martin Escudero Foundation (FUNDAME).
FOESA's priority is to bring together aquaculture and society, promote and popularize aquaculture, as well as toencourage the sustainability development of the sector.
To achieve this FOESA works on 5 working lines:
1. Bringing aquaculture closer to society and media
1. Strengthening the bond between I+D+i and producers
1. Publishing and training
1. Sustainable environment and development
1. International cooperation
Web: www.fundacionoesa.es
The project stems from the need to know and incorporate the different points of view of thestakeholders in the development of the Mediterranean aquaculture sector, with the absoluteneed to promote and favour dialogue and the participation of all. It is for this reason that thework schedule has been designed based on the various meetings and workshops withmulti-disciplinary groups of experts who work in the Mediterranean region.
In these workshops the principles, criteria and subsequently the indicators have beenidentified and defined, which can best represent sustained aquaculture. These indicatorsmust be easily obtained and audited, based on existing information or easily obtainableinformation, as well as allowing producers and aquaculture administrative staff to promotea more sustainable aquaculture, through the implementation of initiatives or improvementproposals.
The project will be communicated to all involved in the industry, so that the indicators canbe adopted and introduced into the Mediterranean context in a gradual and continualmanner which will require the implementation of various media initiatives and the circulationand promotion of the project and its results.
3131
2. Background
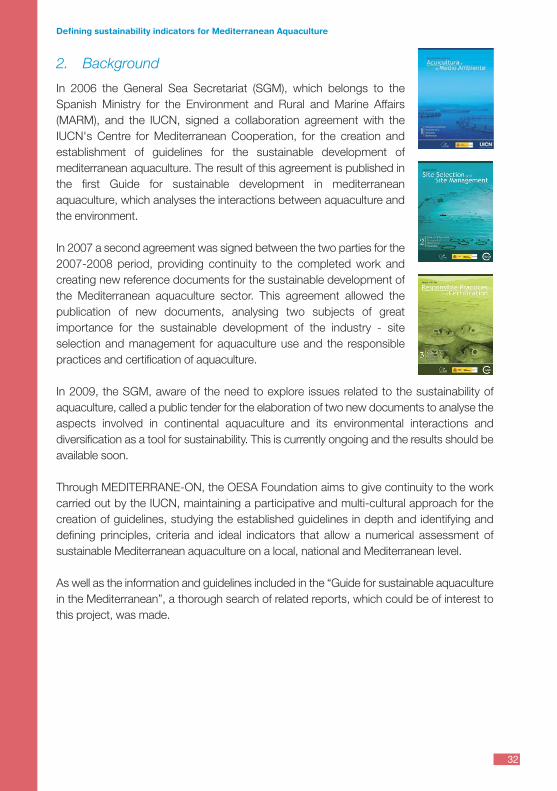
In 2006 the General Sea Secretariat (SGM), which belongs to theSpanish Ministry for the Environment and Rural and Marine Affairs(MARM), and the IUCN, signed a collaboration agreement with theIUCN's Centre for Mediterranean Cooperation, for the creation andestablishment of guidelines for the sustainable development ofmediterranean aquaculture. The result of this agreement is published inthe first Guide for sustainable development in mediterraneanaquaculture, which analyses the interactions between aquaculture andthe environment.
In 2007 a second agreement was signed between the two parties for the2007-2008 period, providing continuity to the completed work andcreating new reference documents for the sustainable development ofthe Mediterranean aquaculture sector. This agreement allowed thepublication of new documents, analysing two subjects of greatimportance for the sustainable development of the industry - siteselection and management for aquaculture use and the responsiblepractices and certification of aquaculture.
In 2009, the SGM, aware of the need to explore issues related to the sustainability ofaquaculture, called a public tender for the elaboration of two new documents to analyse theaspects involved in continental aquaculture and its environmental interactions anddiversification as a tool for sustainability. This is currently ongoing and the results should beavailable soon.
Through MEDITERRANE-ON, the OESA Foundation aims to give continuity to the workcarried out by the IUCN, maintaining a participative and multi-cultural approach for thecreation of guidelines, studying the established guidelines in depth and identifying anddefining principles, criteria and ideal indicators that allow a numerical assessment ofsustainable Mediterranean aquaculture on a local, national and Mediterranean level.
As well as the information and guidelines included in the “Guide for sustainable aquaculturein the Mediterranean”, a thorough search of related reports, which could be of interest tothis project, was made.
32
Defining sustainability indicators for Mediterranean Aquaculture
PROJ
ECT
MED
ITER
RANE
-ONTherefore, the main projects related with MEDITERRANE-ON are:
CONSENSUS: is a platform for European sustainable aquaculture.
Funded by the European Commission under the 6th Framework Programme
It is an initiative that works towards a sustainable European aquaculture by building sustainableaquaculture protocols that are based on low environmental impact, high competitiveness and ethical responsibil-ities with regard to biodiversity and animal welfare.
Duration: 2005/2008
Scope: European marine and continental companies for fish and molluscs
Results: 78 indicators under 8 themes agreed by 120 stakeholders from 16 countries. Reduced to 25 indicators forcode of practice for improvement at national level and of species
and 30 reference indicators for the industry, with potential use in European standards. Other outputs include infor-mation brochures for European consumer organisations and a collection of short films on sustainability byEuropean fish and shellfish farmers and available on youtube.
Web: www.euraquaculture.info
ECASA: is a Ecosystematic Focus towards Sustainable Aquaculture
EU funded Framework 6 RTD project with 16 research partners from 13 member states
Duration: 2005/2007
Scope: Europe: Both fish farming and mollusc farming from all the European regions with around 10 field locationsin various types of marine environments.
Dimensions: environmental
Results: 24 sediment and benthic indicators, 6 indicators of water quality, 8 environmental indicators, 15 socioe-conomic indicators, 4 genetic and 4 coastal area management indicators
Web: www.ecasa.org.uk
EVAD: Assessment of the durability of the aquacultural systems. Elaboration of a method andimplementation in different contexts of tropical and temporate areas.
Funded by the French National Investigation Agency
Duration: 11-2005/11-2008
Dimensions: technical-economic, institutional, environmental and social
Results: 13 principles, 81 criteria, 234 indicators on two levels: Sectoral and regional
Case study: France, Mediterranean, Cameroon, Philippines and Indonesia
Web: www.inra.fr/coordination_piscicole/groupes_de_travail/systeme_d_elevage/evad
3333
IDAqua: Steps towards lasting aquaculture
Funded by Casdar + Feb/IFOP
Duration: 4-2006/2008
Objective: Tool for salmonid (trout) activity in France, voluntary and internal amongst the producers.
Results: 35 selected indicators from 110 tests: 11 economical, 9 socio-terrestrial and 15 environmental, spreadbetween the various types of production.
Web: www.sati.tv/spip.php?article1306
SEACASE: Provide an added value to the extensive and semi-intensive systems from southernEurope via the optimization of the systems and coverage of the differentiation of the product onthe market from these low- impact production systems.
Funded by the European Commission under the 6th Framework Programme
Duration: 01-2007/01-2010
Web: www.seacase.org
InDAM: Indicators for the sustainable development of aquaculture and guidelines for their usein the Mediterranean
Funded by the EU DG Mare and developed by the Aquaculture Committee of the SustainableAquaculture Workgroup which belongs to the General Fisheries Commission for the Mediterranean (GFCM)
Dimensions: economic, institutional, environmental and social
Duration: 11-2008/2012
Objective: Provide the countries with a support tool for decisions in the development of sustainable marine aqua-culture based on indicators, reference points and guidelines adapted to the Mediterranean region.
Pilot cases: Turkey and Tunisia
Results: 14 principles, 67 criteria, 156 indicators
Web: http://www.faosipam.org/?pag=content/_ShowPortal&Portal=InDAM
34
Defining sustainability indicators for Mediterranean Aquaculture
PROJ
ECT
MED
ITER
RANE
-ON3. Procedure
The starting principle was that the selected and defined indicators could be used on anytype of aquaculture farm in any Mediterranean country. In the first phase of the project, theidentification of the most suitable indicators to assess the sustainability of aquaculture activ-ity in the Mediterranean was made on the basis of ease of measurement and monitoringwithout further (administrative or other) burdens for producing companies.
The indicators may appear to be rather general but they can be used on any farm in anycountry, regardless of the type of water used (salt or fresh), the type of cultivation, intensive,semi-intensive or extensive, or the system or facilities employed, external tanks, floatinghatcheries, etc. The indicators have also been defined for application to any of the 15species or more that breed in the Mediterranean.
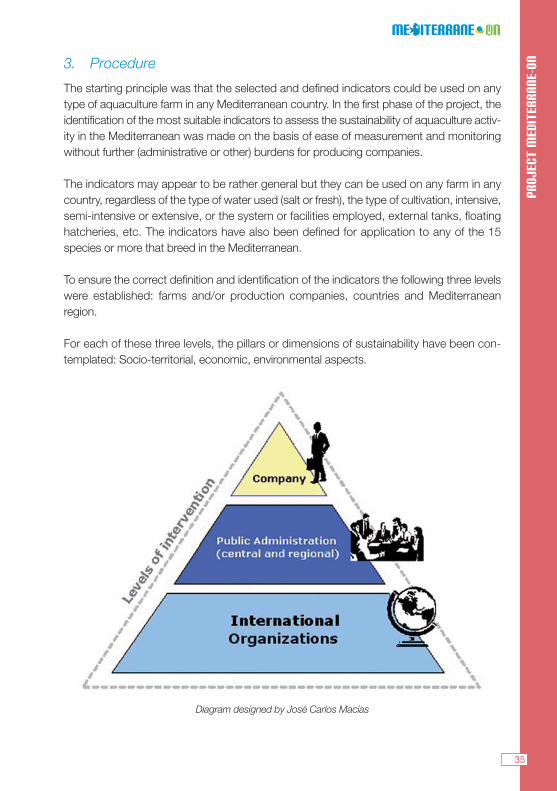
To ensure the correct definition and identification of the indicators the following three levelswere established: farms and/or production companies, countries and Mediterraneanregion.
For each of these three levels, the pillars or dimensions of sustainability have been con-templated: Socio-territorial, economic, environmental aspects.
3535
Diagram designed by José Carlos Macías
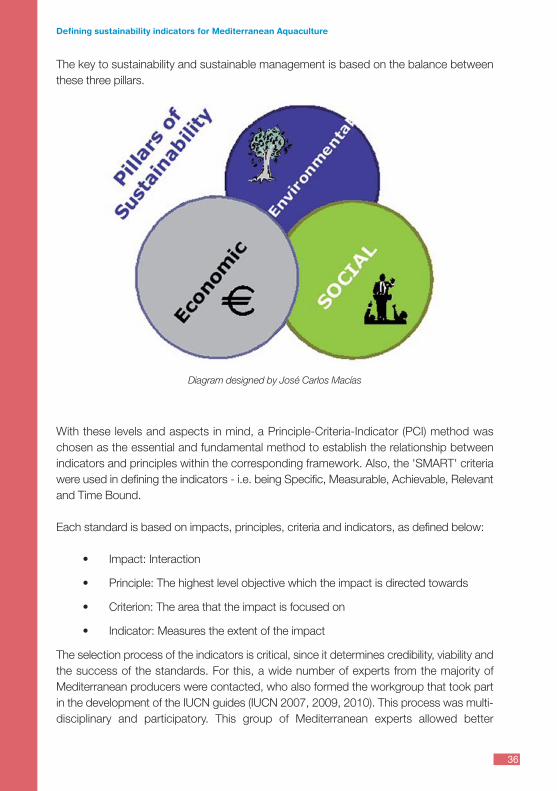
The key to sustainability and sustainable management is based on the balance betweenthese three pillars.
With these levels and aspects in mind, a Principle-Criteria-Indicator (PCI) method waschosen as the essential and fundamental method to establish the relationship betweenindicators and principles within the corresponding framework. Also, the 'SMART' criteriawere used in defining the indicators - i.e. being Specific, Measurable, Achievable, Relevantand Time Bound.
Each standard is based on impacts, principles, criteria and indicators, as defined below:
• Impact: Interaction
• Principle: The highest level objective which the impact is directed towards
• Criterion: The area that the impact is focused on
• Indicator: Measures the extent of the impact
The selection process of the indicators is critical, since it determines credibility, viability andthe success of the standards. For this, a wide number of experts from the majority ofMediterranean producers were contacted, who also formed the workgroup that took partin the development of the IUCN guides (IUCN 2007, 2009, 2010). This process was multi-disciplinary and participatory. This group of Mediterranean experts allowed better
36
Defining sustainability indicators for Mediterranean Aquaculture
Diagram designed by José Carlos Macías
PROJ
ECT
MED
ITER
RANE
-ONassessment of the complexity of aquaculture in the Mediterranean Basin, to analyse the
industry's requirements and the challenges which must be faced in the next few years todemonstrate sustainability and become an even more consolidated, extended and wellknown activity in all countries that share the Mediterranean Sea.
In the workshops organised over the duration of the project, the participation of the expertswas facilitated by a different work system, firstly according to the source language, forwhich three debate groups were held, in Spanish, English and French and secondly,according to the academic or professional specialization, for which three workgroups wereformed for environment, social aspects and economic affairs.
This exercise allowed a better definition of the indicators and greater consensus regardingtheir selection, reinforced by the project team's work and coordination.
Some of the most interesting aspects discussed in the workshops with a view to futurework, revolved around the importance or advisability of introducing governance as a fourthpillar for the sustainability or suitability, the convenience and current difficulties when itcomes to defining sustainability indicators applicable to any type of species and cultivationsystem, which in the future will be able to be adopted on an international level, allowingcomparisons to be made with aquaculture in different parts of the world.
The selection of suggested indicators in this document aims to support decision making forall stakeholders with a direct or indirect bearing on the development of the Mediterraneanaquaculture sector, with tools that do not cause extra work on a day-to-day basis. TheMEDITERRANE-ON project also aimed to increase awareness firstly amongst thoseinvolved in the activity but also in society, for the need to obtain a more sustainablemanagement of our coastal and rural areas, which will allow future generations to makebetter use of them.
37
PRINCIPLEs, CRITERIA AND INDICATOR GUIDE
1. Introduction
Since the end of the 1990s, various initiatives have been completed on a local, national orinternational scale to identify sustainability indicators for aquaculture. However, thesenumerous proceedings and tasks have culminated in an accumulation of potentialindicators which can no longer be used, given the complexity or difficulty in obtaining theinformation needed for a calculation and/or preventing subsequent tracking and analysis,thereby hindering the ability to adopt correct measures. The OESA Foundation started thisproject for the Mediterranean basin to get started and continue to broaden its search andpromote greater sustainability in its activities, as well as diagnosing the state of aquaculturein this region, from a sustainability, social, environmental and economic point of view. Thisanalysis also aimed to create a 'grade' of aquaculture sustainability for the differentcountries in the Mediterranean, thus enabling new initiatives and strategies for futherprogress to be initiatied.
The indicators chosen for each of the three levels (local, national and Mediterranean) and foreach of the three pillars of sustainability (environment, society and economy), will bevalidated in the next three months through a pilot project that will enable final improvementand approval.
The chosen indicators entail a simplification and summary of the existing information anda homogenization through its use as application standards for a wide spectrum of situationsand cases. It is about qualitative and quantitative values which enable the state or evolutionto be expressed in a significant way. According to Madec (2003), “indicators arecommunication tools which enable information to be quantified and simplified to make itunderstandable to a specific audience. They are monitoring, evaluation, indicative anddecision making tools. They are defined in reference to previously set objectives; theconfrontation of values taken by an indicator with the corresponding objective enables oneto comment on the efficiency of an action”.
The strength of the indicators lies in the fact that they report on a situation (state) or on theevolution of a variable and they are basically a measuring tool. They are, in other words,tools which provide synthetic information for a complex reality such as that which surroundsus. According to the Organization for Economic Co-operation and Development (OECD),the term indicator is defined as a “parameter or the value resulting from a set of parameters,which provides information about a phenomenon with a broader meaning than that directlyassociated with the parameter settings”. On the other hand, all indicators express priorityorders between variables and reveal important factors which have to be taken into account.It therefore responds to an inventory function pinpointing the variable, which amongst manyothers, is the object of this monitoring.
39
PRIN
CIPL
E, C
RITE
RIA
AND
INDI
CATO
R GU
IDE
The indicator is also a tool which can be used at any time as a means of communication.It must be elaborated in a way that it is understandable to all those involved, easilymeasurable, financially affordable and sensitive enough to detect any changes in themanagement of the aquaculture sector as a whole against chosen references forsustainable development assessments; it constitutes a reference point with a thresholdwhich synthetically determines the positive and negative situations assessed.
The elaboration of indicators must be perceived as an opportunity to include aquaculture insustainable development, with the object of heading towards viability and sustainability inthis sector. A good indicator is one which can be put into practice and for that it needs tohave a precise meaning for the person who uses it. It is therefore vital that those involvedcan take part in the elaboration of these indicators in a collective manner, as well as theprinciples and criterion that regulate them.
In MEDITERRANE-ON, those involved are from the majority of Mediterranean countries anddifferent fields of work, made up of producers, economic, social and environmental expertsas well as representatives of institutional and environmental organizations. The approachis done in a transversal manner, taking three spatial scales into account: local, national andinternational and evaluating the three pillars which support sustainable development, givingthe whole a more integrated identity.
The indicator's approach is one of a cascading chain effect in which, firstly, the mainprinciples of a context are defined whereby sustainability acquires a common meaning forthe parties involved. The principles are devised from action verbs such as “contribute to”,“ensure that”, “improve”, etc. and they are particular in that they are the founder element,the starting point from where reflections and actions in favour of sustainable aquaculturestem from. These principles then incline towards criterion, which are expressed in termswhich show the state of a variable. Terms are used such as “importance of”, “existence of”,and “ability to” in order to break down the principle on the one hand, and on the other, toprefigure the indicators, which will enable them to be assessed. Lastly, the indicatorsculminate in the determination of threshold values by points of reference which are featuresof the availability of information, of the degree of implementation and the social acceptanceof the rules they establish. By this hierarchical adjustment, territorial and/ or sectoralchallenges are connected.
In this study, the indicators determined by the group of Mediterranean experts showaquaculture sustainability in the region from an environmental, economic and social point ofview, setting a trend regarding improvement strategies which can be undertaken in eachpillar with a view to obtaining a more sustainable development in the sector. Some of theaspects dealt with in the indicators shown below are related to food and conversionindexes, the activity's carbon footprint and the use of different sources of energy,environmental certifications, work generated or social acceptance of aquaculture.
40
Defining sustainability indicators for Mediterranean Aquaculture
PRIN
CIPL
E, C
RITE
RIA
AND
INDI
CATO
R GU
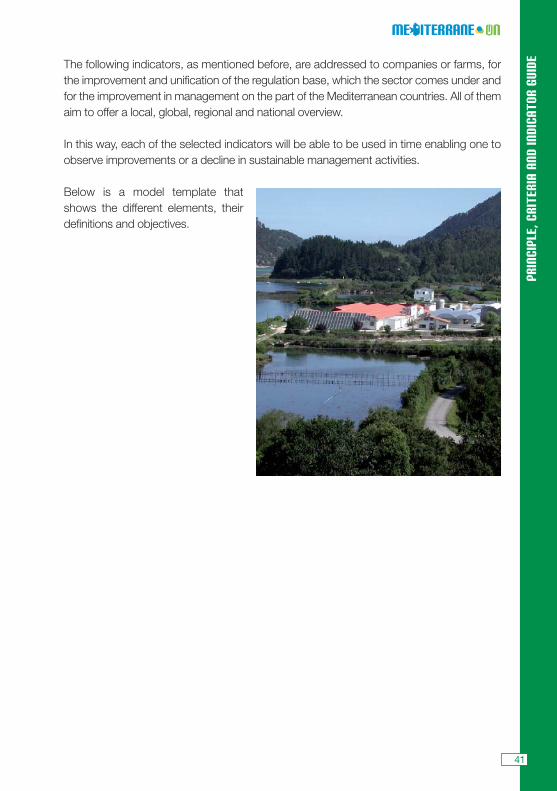
IDE The following indicators, as mentioned before, are addressed to companies or farms, for
the improvement and unification of the regulation base, which the sector comes under andfor the improvement in management on the part of the Mediterranean countries. All of themaim to offer a local, global, regional and national overview.
In this way, each of the selected indicators will be able to be used in time enabling one toobserve improvements or a decline in sustainable management activities.
Below is a model template thatshows the different elements, theirdefinitions and objectives.
41
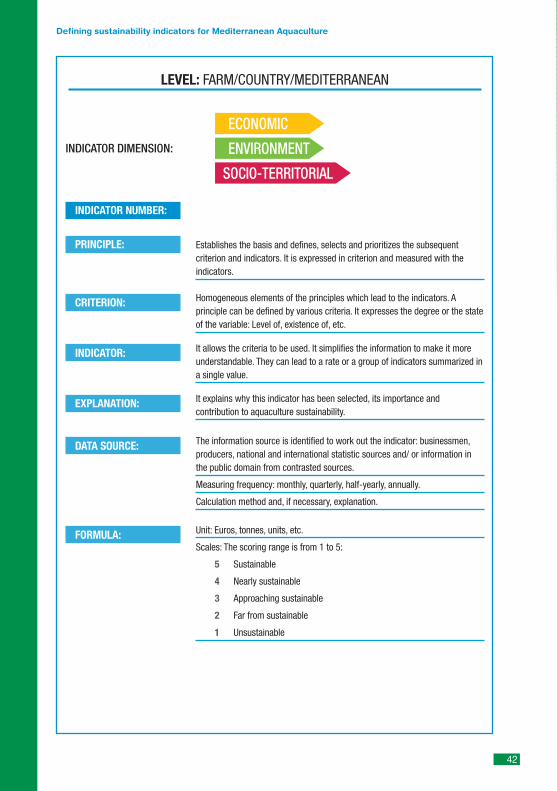
LEVEL: FARM/COUNTRY/MEDITERRANEAN
42
Defining sustainability indicators for Mediterranean Aquaculture
INDICATOR DIMENSION:
INDICATOR NUMBER:
PRINCIPLE:
CRITERION:
INDICATOR:
EXPLANATION:
DATA SOURCE:
FORMULA:
Establishes the basis and defines, selects and prioritizes the subsequentcriterion and indicators. It is expressed in criterion and measured with theindicators.
Homogeneous elements of the principles which lead to the indicators. Aprinciple can be defined by various criteria. It expresses the degree or the stateof the variable: Level of, existence of, etc.
It allows the criteria to be used. It simplifies the information to make it moreunderstandable. They can lead to a rate or a group of indicators summarized ina single value.
It explains why this indicator has been selected, its importance andcontribution to aquaculture sustainability.
The information source is identified to work out the indicator: businessmen,producers, national and international statistic sources and/ or information inthe public domain from contrasted sources.
Measuring frequency: monthly, quarterly, half-yearly, annually.
Calculation method and, if necessary, explanation.
Unit: Euros, tonnes, units, etc.
Scales: The scoring range is from 1 to 5:
5 Sustainable
4 Nearly sustainable
3 Approaching sustainable
2 Far from sustainable
1 Unsustainable
Indi
cato
rs f
arm
/com
pany
lev
el2. Indicators of sustainability at a farm/company level
Introduction
The following indicators are aimed at farms or companies and they intend to provide withan idea of the level of awareness and implementation of aspects related to sustainability inbusiness management. The indicators have therefore been defined and selected tostrengthen certain actions which show this social, economic and of course, environmentalawareness. Each of the selected indicators will be able to be used over time so as toobserve improvements or a decline in sustainable management activities.
As shown in the summary table, 9 indicators have been chosen for this assessment, threefor each dimension: economy, society and environment. A score for each of the indicatorsand dimensions contributes to the overall score for a farm or company.
All the indicators have a total of 5 points:
5 Sustainable
4 Nearly sustainable
3 Approaching sustainable
2 Far from sustainable
1 Unsustainable
Based on the score obtained in each of the indicators, design or propose improvementmeasures to be used, appointing someone responsible for this and establishing a deadlinefor monitoring and assessment.
This same assessment criterion must be applied to the three dimensions, rememberingthat sustainability is supported by sustainable practices in each of them. As aconsequence, the farm/ company must, when implementing its final sustainabilityassessment, obtain a balanced score in the three dimensions, if one of the dimensionsdoes not obtain sustainability level, it cannot be considered sustainable.
43
44
Defining sustainability indicators for Mediterranean Aquaculture
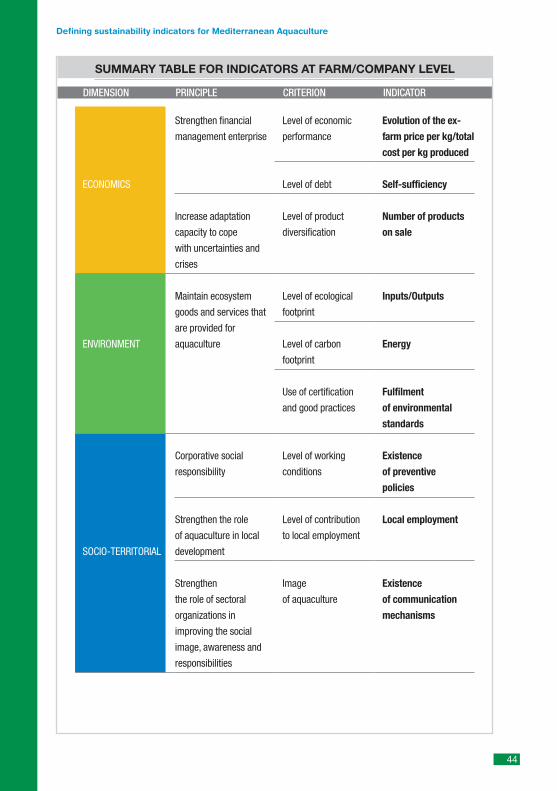
SUMMARY TABLE FOR INDICATORS AT FARM/COMPANY LEVEL
DIMENSION PRINCIPLE CRITERION INDICATOR
ECONOMICS
ENVIRONMENT
SOCIO-TERRITORIAL
Strengthen financial
management enterprise
Increase adaptation
capacity to cope
with uncertainties and
crises
Maintain ecosystem
goods and services that
are provided for
aquaculture
Corporative social
responsibility
Strengthen the role
of aquaculture in local
development
Strengthen
the role of sectoral
organizations in
improving the social
image, awareness and
responsibilities
Level of economic
performance
Level of debt
Level of product
diversification
Level of ecological
footprint
Level of carbon
footprint
Use of certification
and good practices
Level of working
conditions
Level of contribution
to local employment
Image
of aquaculture
Evolution of the ex-
farm price per kg/total
cost per kg produced
Self-sufficiency
Number of products
on sale
Inputs/Outputs
Energy
Fulfilment
of environmental
standards
Existence
of preventive
policies
Local employment
Existence
of communication
mechanisms
Indi
cato
rs f
arm
/com
pany
lev
elECONOMIC INDICATORS
ASSESSING THE ECONOMIC SUSTAINABILITY OF AQUACULTURE
Philippos PapageorgiouAquaculture & Fisheries Consultant
Greece
Aquaculture has become a truly global industry. Aquaculture companies, regardless oftheir size, level of -horizontal and/ or vertical- diversification, location of production unit(s)etc, compete for market shares against companies of the wider food producing sector, at thelocal, national and international markets. Equally, they compete for resources(environmental, human and financial) which often surpass local level and expand tonational or even international levels.
While prospects for the future of aquaculture are generally positive, the industry facesvarious challenges which need to be promptly and adequately addressed. The dynamicintra- and interrelationships of aspects related to the environment, the society and theeconomics of aquaculture companies, and the efficient overcoming of the challengesassociated with these relationships, form the basis of sustainability, a concept that hasemerged as an important precondition for the future of the industry.
Taking for granted that, in the present era of ever-increasing environmental and socialawareness, any company must strive for the lowest possible environmental impact, and thatit must yearn for social acceptability, any such (private) company must also be profitable inorder to justify its existence, and its purpose thereof, to its shareholders. In this respect, thereare many elaborate ways to measure and evaluate economic performance of a company,based on various accounting rules and principles. However, in search of an easilyapplicable and commonly understood measurement of financial viability, the Gross Margin(the difference between the sales and the production costs) is probably the most simple andsuitable indicator of the economic sustainability of the fish-farming operation of acompany. Apart from the latter, various other economic indicators could also becomplementary used, at a secondary level (i.e.: past the line of the company's 'existence').Nonetheless, these would serve more as 'competitiveness' indicators, including the ratio ofR&D and marketing expenditures over total company investments.
Given that aquaculture companies are profit making entities (when not state-subsidized forsocial or regional development reasons), it becomes apparent that economic sustainabilitycan only be directly measured at company level (as means of returns over incurred costsand investments made). Measurements above that level (i.e. local, national), although theycould provide a number of useful (relative and comparable) indicators, these would bemore performance or impact related, rather than actual (absolute) indicators ofsustainability.
45
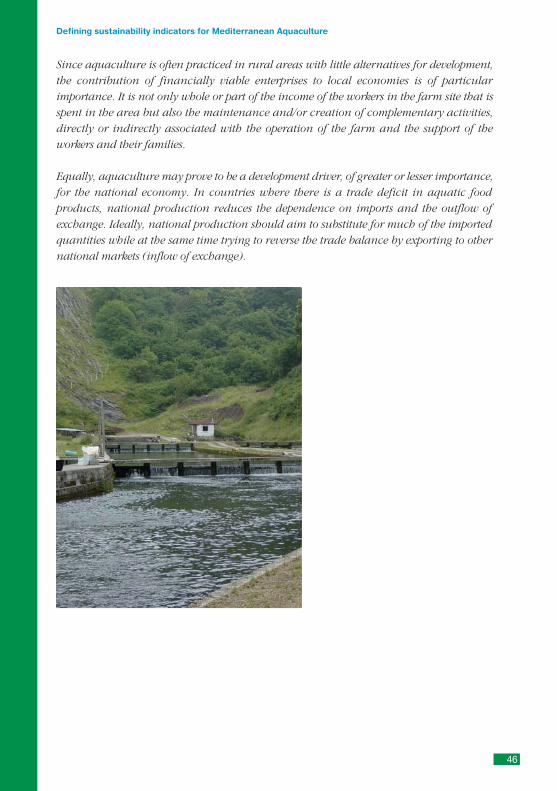
Since aquaculture is often practiced in rural areas with little alternatives for development,the contribution of financially viable enterprises to local economies is of particularimportance. It is not only whole or part of the income of the workers in the farm site that isspent in the area but also the maintenance and/or creation of complementary activities,directly or indirectly associated with the operation of the farm and the support of theworkers and their families.
Equally, aquaculture may prove to be a development driver, of greater or lesser importance,for the national economy. In countries where there is a trade deficit in aquatic foodproducts, national production reduces the dependence on imports and the outflow ofexchange. Ideally, national production should aim to substitute for much of the importedquantities while at the same time trying to reverse the trade balance by exporting to othernational markets (inflow of exchange).
46
Defining sustainability indicators for Mediterranean Aquaculture
Indi
cato
rs f
arm
/com
pany
lev
elECONOMIC INDICATORS
INDICATOR 1
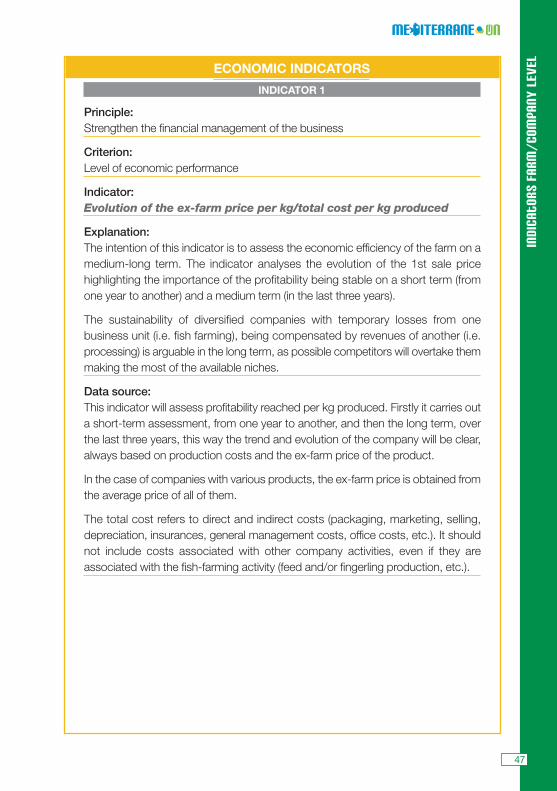
Principle: Strengthen the financial management of the business
Criterion: Level of economic performance
Indicator: Evolution of the ex-farm price per kg/total cost per kg produced
Explanation:The intention of this indicator is to assess the economic efficiency of the farm on amedium-long term. The indicator analyses the evolution of the 1st sale pricehighlighting the importance of the profitability being stable on a short term (fromone year to another) and a medium term (in the last three years).
The sustainability of diversified companies with temporary losses from onebusiness unit (i.e. fish farming), being compensated by revenues of another (i.e.processing) is arguable in the long term, as possible competitors will overtake themmaking the most of the available niches.
Data source: This indicator will assess profitability reached per kg produced. Firstly it carries outa short-term assessment, from one year to another, and then the long term, overthe last three years, this way the trend and evolution of the company will be clear,always based on production costs and the ex-farm price of the product.
In the case of companies with various products, the ex-farm price is obtained fromthe average price of all of them.
The total cost refers to direct and indirect costs (packaging, marketing, selling,depreciation, insurances, general management costs, office costs, etc.). It shouldnot include costs associated with other company activities, even if they areassociated with the fish-farming activity (feed and/or fingerling production, etc.).
47
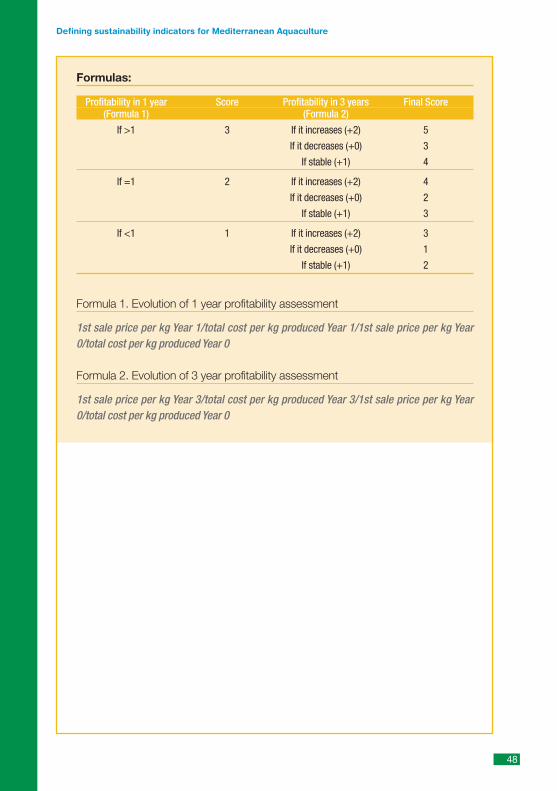
Formulas:
Profitability in 1 year Score Profitability in 3 years Final Score(Formula 1) (Formula 2)
If >1 3 If it increases (+2) 5
If it decreases (+0) 3
If stable (+1) 4
If =1 2 If it increases (+2) 4
If it decreases (+0) 2
If stable (+1) 3
If <1 1 If it increases (+2) 3
If it decreases (+0) 1
If stable (+1) 2
Formula 1. Evolution of 1 year profitability assessment
1st sale price per kg Year 1/total cost per kg produced Year 1/1st sale price per kg Year0/total cost per kg produced Year 0
Formula 2. Evolution of 3 year profitability assessment
1st sale price per kg Year 3/total cost per kg produced Year 3/1st sale price per kg Year0/total cost per kg produced Year 0
48
Defining sustainability indicators for Mediterranean Aquaculture
Indi
cato
rs f
arm
/com
pany
lev
el
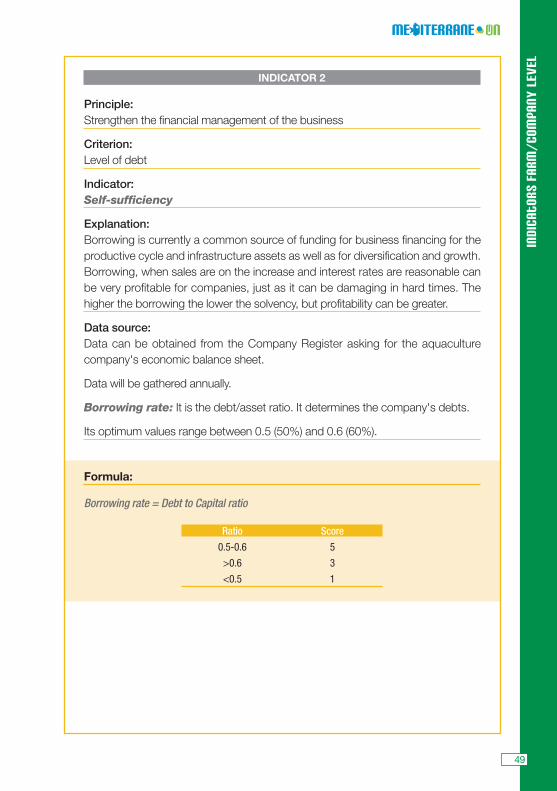
INDICATOR 2
Principle: Strengthen the financial management of the business
Criterion: Level of debt
Indicator: Self-sufficiency
Explanation:Borrowing is currently a common source of funding for business financing for theproductive cycle and infrastructure assets as well as for diversification and growth.Borrowing, when sales are on the increase and interest rates are reasonable canbe very profitable for companies, just as it can be damaging in hard times. Thehigher the borrowing the lower the solvency, but profitability can be greater.
Data source: Data can be obtained from the Company Register asking for the aquaculturecompany's economic balance sheet.
Data will be gathered annually.
Borrowing rate: It is the debt/asset ratio. It determines the company's debts.
Its optimum values range between 0.5 (50%) and 0.6 (60%).
Formula:
Borrowing rate = Debt to Capital ratio
Ratio Score
0.5-0.6 5
>0.6 3
<0.5 1
49
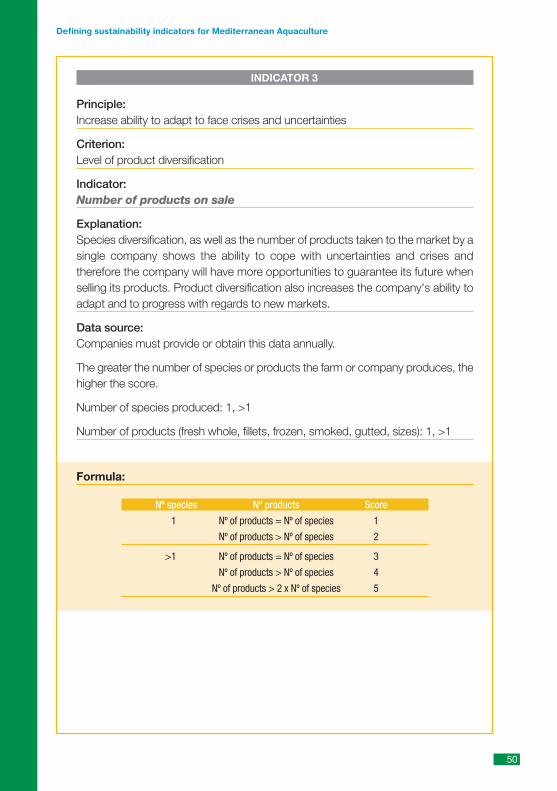
INDICATOR 3
Principle: Increase ability to adapt to face crises and uncertainties
Criterion: Level of product diversification
Indicator: Number of products on sale
Explanation:Species diversification, as well as the number of products taken to the market by asingle company shows the ability to cope with uncertainties and crises andtherefore the company will have more opportunities to guarantee its future whenselling its products. Product diversification also increases the company's ability toadapt and to progress with regards to new markets.
Data source:Companies must provide or obtain this data annually.
The greater the number of species or products the farm or company produces, thehigher the score.
Number of species produced: 1, >1
Number of products (fresh whole, fillets, frozen, smoked, gutted, sizes): 1, >1
Formula:
Nº species Nº products Score
1 Nº of products = Nº of species 1
Nº of products > Nº of species 2
>1 Nº of products = Nº of species 3
Nº of products > Nº of species 4
Nº of products > 2 x Nº of species 5
50
Defining sustainability indicators for Mediterranean Aquaculture
Indi
cato
rs f
arm
/com
pany
lev
elENVIRONMENTAL INDICATORS
SUSTAINABILITY INDICATORS FOR AQUACULTURE
Fernando TorrentPolytechnic University of Madrid
Spain
Aquaculture is a very new industry and in the beginning it was particularly fragile, whichwent hand in hand with the low social and economic effect it had on the Mediterraneancoast. Particularly with regards to marine fish farming, which began in the 1980s and isonly just gaining importance, but also inland aquaculture, which have to be carried outin areas of high environmental quality, which are increasingly scarce in our society. Fromthe beginning, aquaculture has been competing for areas with other industries, which aremuch stronger and more established.
The Mediterranean area and particularly the European coast, have modern economic andcultural populations, which are characterized for their important, consolidated andsocially accepted industries associated with the coast.
Obviously any activity we carry out has an impact. It may be big or small, but it evidentlyalways has an impact on the location. What greater impact than the destruction ofwoodland to create fields for grazing or grain fields or any traditional activities whichincrease the biomass required by mankind within the terrestrial environment? The origin ofaquaculture as an industry has to initially be associated with not knowing the effects of theactivity on the environment, and therefore, until we know more about the activity, we mustgo through a learning process. Fortunately, this learning period is becoming easier as thereare more examples of important developments in aquaculture in the world and what mustand must not be done in the various economic, social and environment aspects to developaquaculture in a sustainable manner, . We need to have the right balance between theseaspects in order to reach modern society's required sustainability, which protects thisdevelopment and foreseeable growth.
The reality is that the lack of knowledge in this field and in particular the effects ofindustrial development in aquaculture have created scientific information which has beenpoorly understood and negatively publicised by today's powerful media, distorting theimage of aquaculture. What was an idyllic image of marine farming only a few years agonow portrays and image of aquaculture being a contaminating activity.
All this information, which is generated during the monitoring process, is used inabundance by other coast and sea users, in legitimate defence of their own interests, tomagnify the negative effects of aquaculture by using any argument in the conflictsgenerated by the industry.
51
52
Defining sustainability indicators for Mediterranean Aquaculture
This is why the aquaculture industry and the scientific community that surrounds it arestudying these impacts closely to control them and keep them at acceptable levels for today'ssociety. Particularly the European Aquaculture Technology and Innovation Platform(EATIP), seems to be the tool which will channel the priorities of future research by the EUwhich will enable better control of the activity.
The most consolidated aquacultural industries in our cultural environment are musselsin Galicia, which are fully accepted and which are one of the economic driving forces ofthe Galician coast. The same occurs with the Norwegian aquaculture industry, which isnow worth more than fishing and which is accepted by society as the coast's maineconomic force. This is achieved over time and with the general social acceptance of theactivity.
Aquaculture's sustainability indicators are going to be essential tools in channelling thecharacteristics of the industry to society. There is no better tool than the knowledge andcontrol of aquaculture's development, which will help society accept the expected hugegrowth of aquaculture's producers in the Mediterranean. The elaboration of appropriatesimple and easy sustainability indicators, in environmental, economic and social aspectshave to be the most suitable tool to convey to society the harmlessness of these practices ifthey are planned correctly. We cannot let small pieces of information, which have beenmagnified by other coastal industries with a conflict of interest in aquaculture andbroadcast to the media, often with no knowledge of the subject, become “de facto” of theaquaculture industry in society.
Mediterranean aquaculture is set to become a much more efficient food producer than thecurrent farming industries. And in order for society to accept the idea, that a consolidatedaquaculture industry on our coasts will guarantee the quality of the coastal waters, weneed to find, introduce and set up some reliable and socially acceptable indicators whichclearly contribute to guaranteeing continual and sustainable growth on our coasts thesame as the rest of the world is doing.
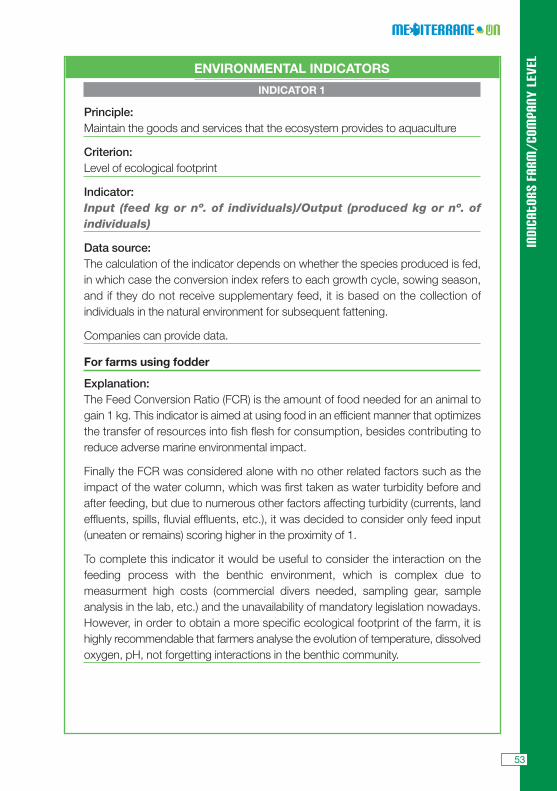
Indi
cato
rs f
arm
/com
pany
lev
elENVIRONMENTAL INDICATORS
INDICATOR 1
Principle: Maintain the goods and services that the ecosystem provides to aquaculture
Criterion: Level of ecological footprint
Indicator: Input (feed kg or nº. of individuals)/Output (produced kg or nº. ofindividuals)
Data source: The calculation of the indicator depends on whether the species produced is fed,in which case the conversion index refers to each growth cycle, sowing season,and if they do not receive supplementary feed, it is based on the collection ofindividuals in the natural environment for subsequent fattening.
Companies can provide data.
For farms using fodder
Explanation:The Feed Conversion Ratio (FCR) is the amount of food needed for an animal togain 1 kg. This indicator is aimed at using food in an efficient manner that optimizesthe transfer of resources into fish flesh for consumption, besides contributing toreduce adverse marine environmental impact.
Finally the FCR was considered alone with no other related factors such as theimpact of the water column, which was first taken as water turbidity before andafter feeding, but due to numerous other factors affecting turbidity (currents, landeffluents, spills, fluvial effluents, etc.), it was decided to consider only feed input(uneaten or remains) scoring higher in the proximity of 1.
To complete this indicator it would be useful to consider the interaction on thefeeding process with the benthic environment, which is complex due tomeasurment high costs (commercial divers needed, sampling gear, sampleanalysis in the lab, etc.) and the unavailability of mandatory legislation nowadays.However, in order to obtain a more specific ecological footprint of the farm, it ishighly recommendable that farmers analyse the evolution of temperature, dissolvedoxygen, pH, not forgetting interactions in the benthic community.
53
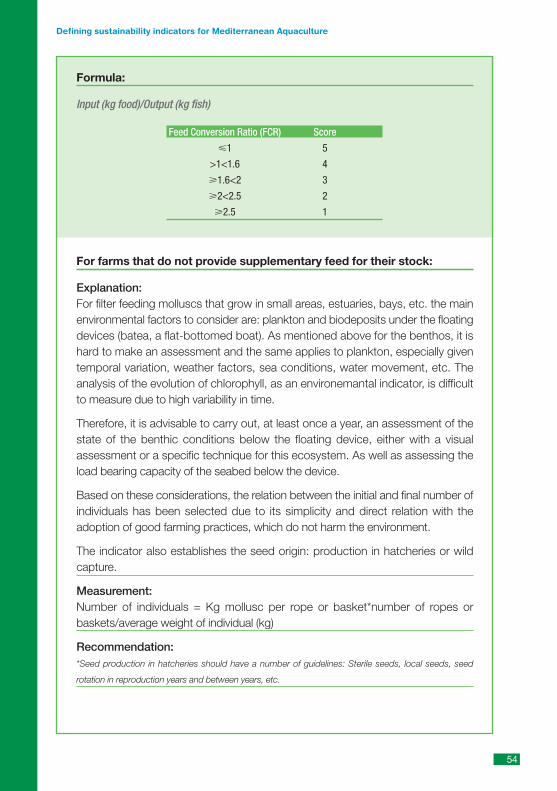
Formula:
Input (kg food)/Output (kg fish)
Feed Conversion Ratio (FCR) Score
�1 5
>1<1.6 4
�1.6<2 3
�2<2.5 2
�2.5 1
For farms that do not provide supplementary feed for their stock:
Explanation: For filter feeding molluscs that grow in small areas, estuaries, bays, etc. the mainenvironmental factors to consider are: plankton and biodeposits under the floatingdevices (batea, a flat-bottomed boat). As mentioned above for the benthos, it ishard to make an assessment and the same applies to plankton, especially giventemporal variation, weather factors, sea conditions, water movement, etc. Theanalysis of the evolution of chlorophyll, as an environemantal indicator, is difficultto measure due to high variability in time.
Therefore, it is advisable to carry out, at least once a year, an assessment of thestate of the benthic conditions below the floating device, either with a visualassessment or a specific technique for this ecosystem. As well as assessing theload bearing capacity of the seabed below the device.
Based on these considerations, the relation between the initial and final number ofindividuals has been selected due to its simplicity and direct relation with theadoption of good farming practices, which do not harm the environment.
The indicator also establishes the seed origin: production in hatcheries or wildcapture.
Measurement: Number of individuals = Kg mollusc per rope or basket*number of ropes orbaskets/average weight of individual (kg)
Recommendation: *Seed production in hatcheries should have a number of guidelines: Sterile seeds, local seeds, seed
rotation in reproduction years and between years, etc.
54
Defining sustainability indicators for Mediterranean Aquaculture
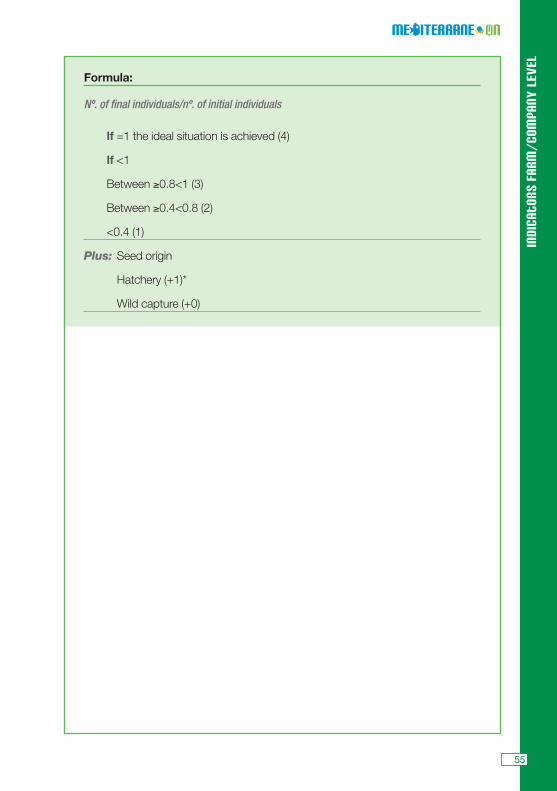
Indi
cato
rs f
arm
/com
pany
lev
el
Formula:
Nº. of final individuals/nº. of initial individuals
If =1 the ideal situation is achieved (4)
If <1
Between ≥0.8<1 (3)
Between ≥0.4<0.8 (2)
<0.4 (1)
Plus: Seed origin
Hatchery (+1)*
Wild capture (+0)
55
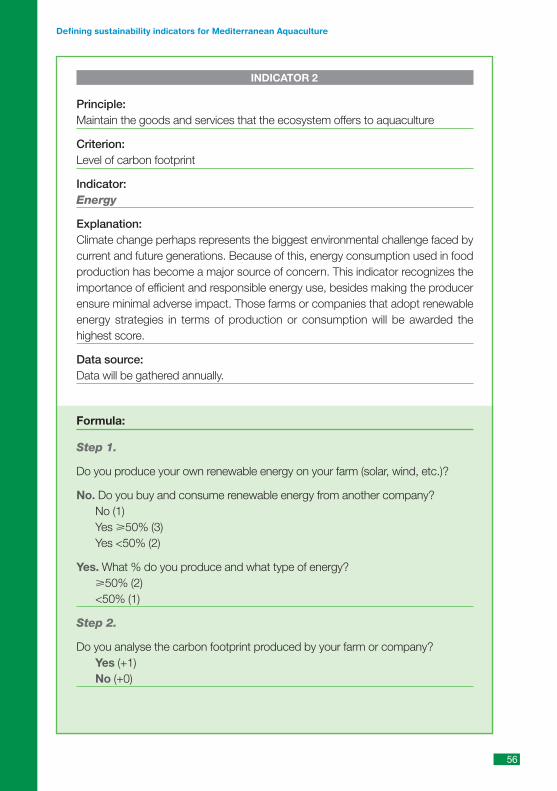
INDICATOR 2
Principle: Maintain the goods and services that the ecosystem offers to aquaculture
Criterion: Level of carbon footprint
Indicator: Energy
Explanation: Climate change perhaps represents the biggest environmental challenge faced bycurrent and future generations. Because of this, energy consumption used in foodproduction has become a major source of concern. This indicator recognizes theimportance of efficient and responsible energy use, besides making the producerensure minimal adverse impact. Those farms or companies that adopt renewableenergy strategies in terms of production or consumption will be awarded thehighest score.
Data source: Data will be gathered annually.
Formula:
Step 1.
Do you produce your own renewable energy on your farm (solar, wind, etc.)?
No. Do you buy and consume renewable energy from another company? No (1)Yes �50% (3) Yes <50% (2)
Yes. What % do you produce and what type of energy? �50% (2)<50% (1)
Step 2.
Do you analyse the carbon footprint produced by your farm or company? Yes (+1) No (+0)
56
Defining sustainability indicators for Mediterranean Aquaculture
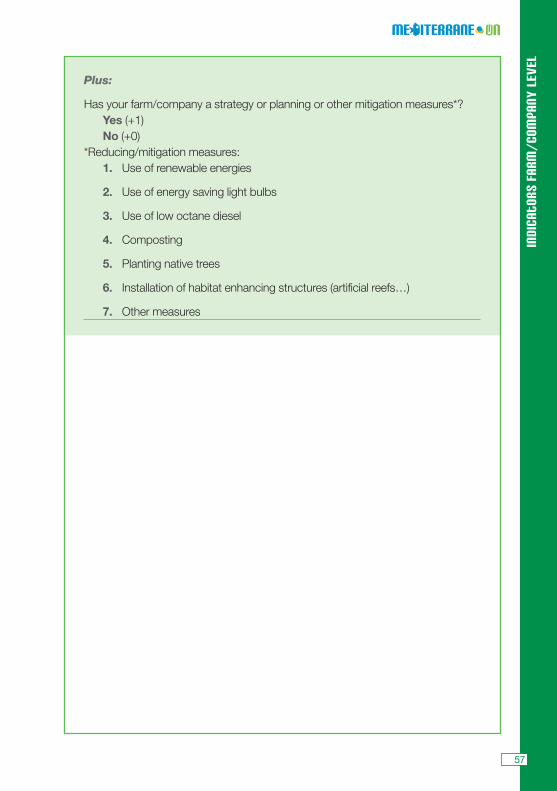
Indi
cato
rs f
arm
/com
pany
lev
el
Plus:
Has your farm/company a strategy or planning or other mitigation measures*?Yes (+1)No (+0)
*Reducing/mitigation measures: 1. Use of renewable energies
2. Use of energy saving light bulbs
3. Use of low octane diesel
4. Composting
5. Planting native trees
6. Installation of habitat enhancing structures (artificial reefs…)
7. Other measures
57
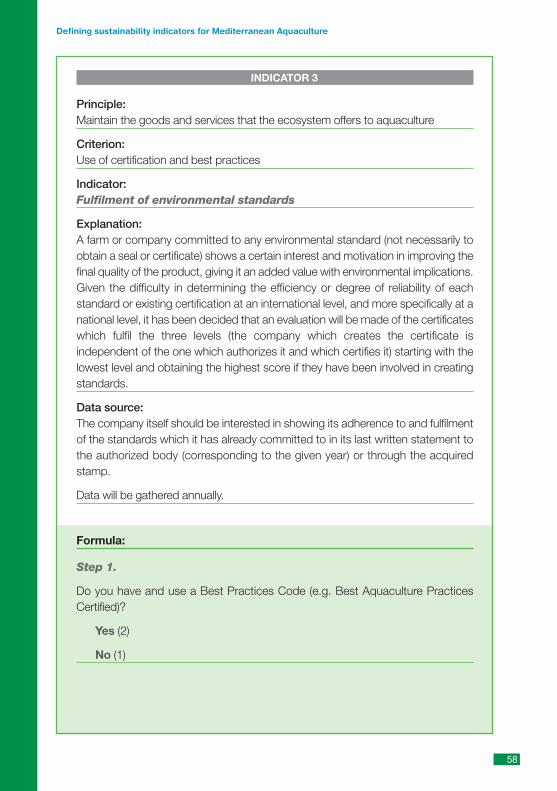
INDICATOR 3
Principle: Maintain the goods and services that the ecosystem offers to aquaculture
Criterion: Use of certification and best practices
Indicator: Fulfilment of environmental standards
Explanation:A farm or company committed to any environmental standard (not necessarily toobtain a seal or certificate) shows a certain interest and motivation in improving thefinal quality of the product, giving it an added value with environmental implications.Given the difficulty in determining the efficiency or degree of reliability of eachstandard or existing certification at an international level, and more specifically at anational level, it has been decided that an evaluation will be made of the certificateswhich fulfil the three levels (the company which creates the certificate isindependent of the one which authorizes it and which certifies it) starting with thelowest level and obtaining the highest score if they have been involved in creatingstandards.
Data source: The company itself should be interested in showing its adherence to and fulfilmentof the standards which it has already committed to in its last written statement tothe authorized body (corresponding to the given year) or through the acquiredstamp.
Data will be gathered annually.
Formula:
Step 1.
Do you have and use a Best Practices Code (e.g. Best Aquaculture PracticesCertified)?
Yes (2)
No (1)
58
Defining sustainability indicators for Mediterranean Aquaculture
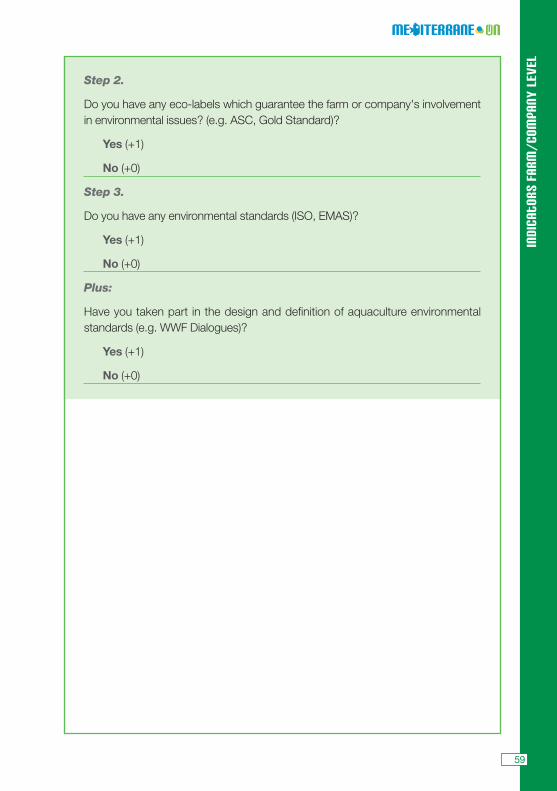
Indi
cato
rs f
arm
/com
pany
lev
el
Step 2.
Do you have any eco-labels which guarantee the farm or company's involvementin environmental issues? (e.g. ASC, Gold Standard)?
Yes (+1)
No (+0)
Step 3.
Do you have any environmental standards (ISO, EMAS)?
Yes (+1)
No (+0)
Plus:
Have you taken part in the design and definition of aquaculture environmentalstandards (e.g. WWF Dialogues)?
Yes (+1)
No (+0)
59
SOCIOTERRITORIAL INDICATORS
SOME ANGLES ON THE SOCIAL DIMENSION OF AQUACULTURE
Güzel Yücel Gier Institute of Marine Science and Technology
Dokuz Eylul University Turkey
It is essential that the full range of knowledge connected with aquaculture is passed on to thepublic at large. Knowledge has always been critically important to the development ofaquaculture. Knowledge management will become increasingly critical to the sustainabledevelopment of aquaculture and its movement towards attaining the desired social outputs.Networks such as the farmers associations, the ministries and the municipalities, need topass on information about, say, the way aquaculture successfully interacts with theenvironment and how this is being effectively monitored. Knowledge networks and the useof knowledge platforms should be aimed at the effective dissemination and adoption ofaquaculture. Marine Aquaculture is relatively new to the Mediterranean, whereas fisheryactivities are extremely ancient. The exchange of information between professionals andthe setting up of support and communications networks, with know-how as to their effectivepolitical implementation, are essential. But they must be very professional in how theyoperate in connection with local, national and supranational (EU) politics. Theseprofessional organizations are essential for the effective circulation of information. Thesocial acceptability of aquaculture and the conflicts between stakeholders are reflected inextensive, and often one sided, media coverage. As a useful indicator it would beinformative to compare, with reasons, relative amounts of positive and negative news aboutaquaculture. More documentary films and TV programs focusing on aquaculture wouldhelp develop a favourable image.
The social dimensions of aquacultural often seem to be more complex than environmentaland economic ones. Farmed fish production is the concern of the people directly involvedin marine aquaculture and who live and work near the sea. But it is also the concern of thepublic at large who may never have seen a fish farm but who like the good nutrimentalresults and the social ambience connected with eating fish. Moreover, many people whocomplain about fish farms seem to be the very ones who want to cover our coastline withcities and, at the same time, to eat the farmed fish at restaurants. These people are oftenunaware the way their new summer homes look to a fish farmer who set up in businesswhen the coastline was empty. On the other hand, the layout of a fish farming installationmust be carefully planned so as to enhance the landscape in terms of visibility. Thearchitectural quality of buildings and cages must be carefully selected with regard to overallspatial integration with surroundings.
60
Defining sustainability indicators for Mediterranean Aquaculture
Indi
cato
rs f
arm
/com
pany
lev
elSuccessful social integration of aquaculture activities with those of other local people andtheir livelihoods, and especially other stakeholders, is an important matter. Not only shouldfarm installations enhance the landscape, but also the potential of activating direct salesof their products is important for the community. Opportunities for sport fishing, for on-siterestaurants, for touristic visits to the aquaculture establishments and so on, can augmentthe social integration of site into the locality. The indicator of how many people visit the siteis a strong convincing argument in favour of aquaculture. The owner and staff of themarine farm should play a full part in local social activities so as to become well known andrespected.
The social dimensions of aquaculture are also indicated by how many people work all yearround on the farm or do other sectoral work full time. For example many people areconnected with transporting fish products, or supplying a huge range of farm equipment.Many workers manufacture food pellets. Others process the fish as smoked fish, fish cakes,fish fingers and so on. Other people supply scientific, legal and financial advice, work intraining schools and provide veterinary services. Yet other people in the sector advertise thelarge companies that make aquacultural machinery and other technological products onan international scale. Just examine the “Future Fish Eurasia” trade fair newsletter to seehow big the fish farming sector is as an employer and as a money-spinner. And in such acatalogue we have many other indicators of the importance of the social dimension in theappraisal of aquaculture.
Good pay and congenial working conditions for personnel are necessary to encourage thedevelopment of social status and high quality staffing. For example working hours andshifts, health and safety, both preparatory and in-service training and length of holidaymust be considered in attracting able and professional people to work in aquaculture.
At global level future prospects for aquaculture are generally positive. But there are variouschallenges to be faced, promptly and effectively. The social and the economic faces ofbusinesses associated with aquaculture, and the overcoming of the challenges ofenvironmental interaction, form the basis of sustainability at company level. Companymanager must strive for the lowest possible environmental impact. But they must also yearnfor social acceptability whilst pleasing their shareholders.
61
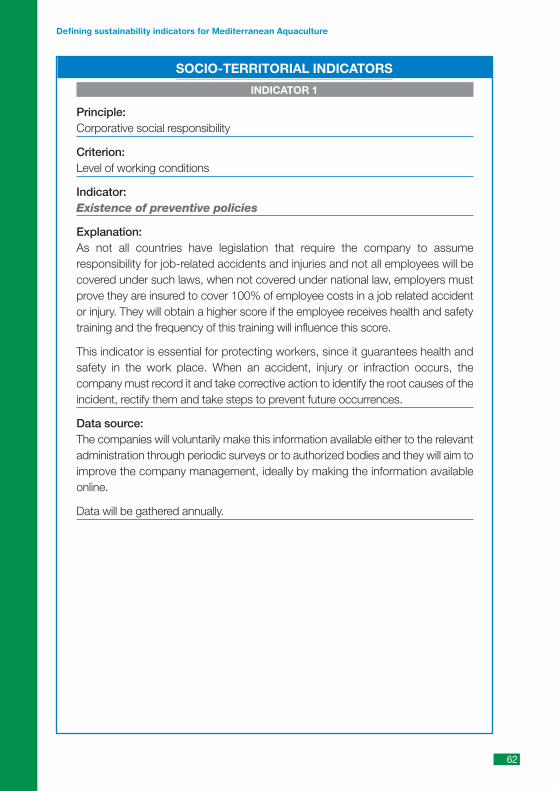
SOCIO-TERRITORIAL INDICATORS
INDICATOR 1
Principle: Corporative social responsibility
Criterion: Level of working conditions
Indicator: Existence of preventive policies
Explanation:As not all countries have legislation that require the company to assumeresponsibility for job-related accidents and injuries and not all employees will becovered under such laws, when not covered under national law, employers mustprove they are insured to cover 100% of employee costs in a job related accidentor injury. They will obtain a higher score if the employee receives health and safetytraining and the frequency of this training will influence this score.
This indicator is essential for protecting workers, since it guarantees health andsafety in the work place. When an accident, injury or infraction occurs, thecompany must record it and take corrective action to identify the root causes of theincident, rectify them and take steps to prevent future occurrences.
Data source:The companies will voluntarily make this information available either to the relevantadministration through periodic surveys or to authorized bodies and they will aim toimprove the company management, ideally by making the information availableonline.
Data will be gathered annually.
62
Defining sustainability indicators for Mediterranean Aquaculture
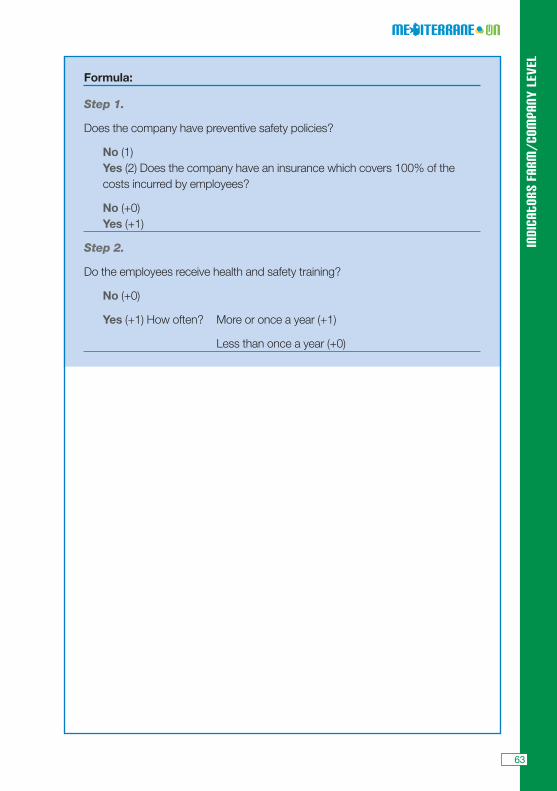
Indi
cato
rs f
arm
/com
pany
lev
el
Formula:
Step 1.
Does the company have preventive safety policies?
No (1)Yes (2) Does the company have an insurance which covers 100% of thecosts incurred by employees?
No (+0)Yes (+1)
Step 2.
Do the employees receive health and safety training?
No (+0)
Yes (+1) How often? More or once a year (+1)
Less than once a year (+0)
63
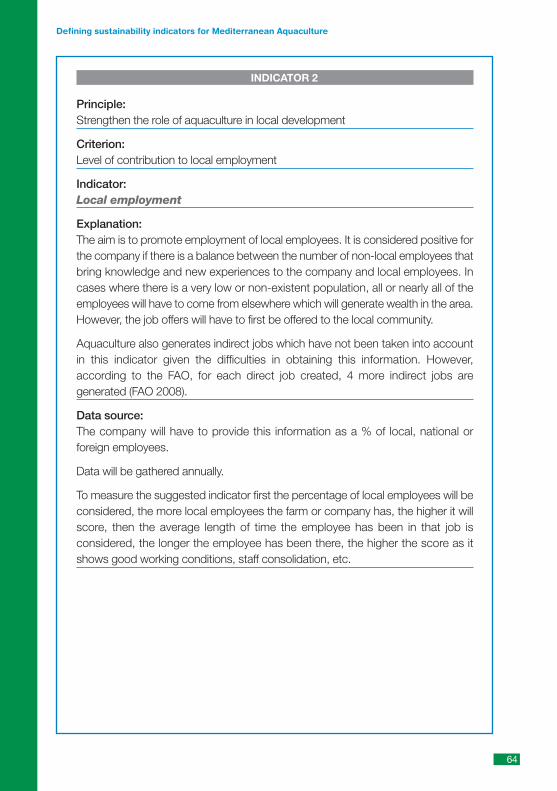
INDICATOR 2
Principle: Strengthen the role of aquaculture in local development
Criterion: Level of contribution to local employment
Indicator:Local employment
Explanation:The aim is to promote employment of local employees. It is considered positive forthe company if there is a balance between the number of non-local employees thatbring knowledge and new experiences to the company and local employees. Incases where there is a very low or non-existent population, all or nearly all of theemployees will have to come from elsewhere which will generate wealth in the area.However, the job offers will have to first be offered to the local community.
Aquaculture also generates indirect jobs which have not been taken into accountin this indicator given the difficulties in obtaining this information. However,according to the FAO, for each direct job created, 4 more indirect jobs aregenerated (FAO 2008).
Data source:The company will have to provide this information as a % of local, national orforeign employees.
Data will be gathered annually.
To measure the suggested indicator first the percentage of local employees will beconsidered, the more local employees the farm or company has, the higher it willscore, then the average length of time the employee has been in that job isconsidered, the longer the employee has been there, the higher the score as itshows good working conditions, staff consolidation, etc.
64
Defining sustainability indicators for Mediterranean Aquaculture

Indi
cato
rs f
arm
/com
pany
lev
el
Formula:
(Nº. of local employees / nº. of total employees farm) * 100
Step 1.
What% of employees is local?
If ≥70% (3)
If 30-70% (2)
If ≤30% (1)
Step 2.
Turnover of employees or time in the company?
If ≤1 year (+0)
If 1-3 years (+1)
If ≥3 years (+2)
65
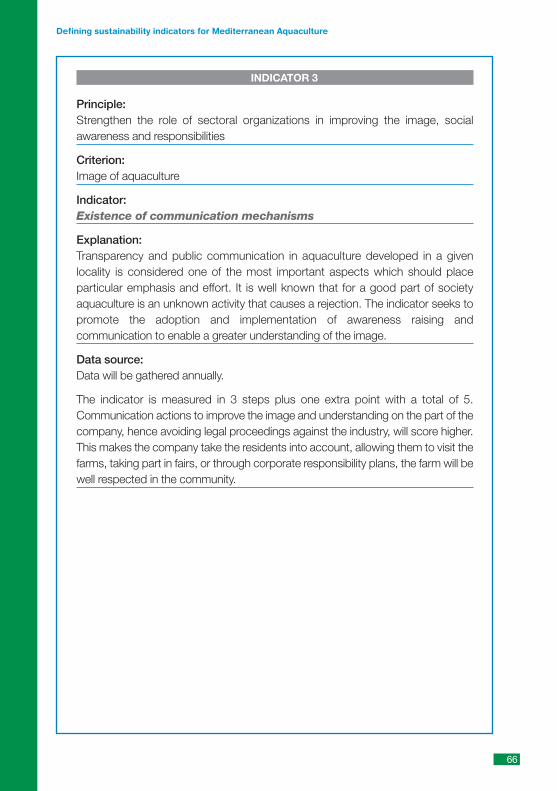
INDICATOR 3
Principle: Strengthen the role of sectoral organizations in improving the image, socialawareness and responsibilities
Criterion: Image of aquaculture
Indicator: Existence of communication mechanisms
Explanation:Transparency and public communication in aquaculture developed in a givenlocality is considered one of the most important aspects which should placeparticular emphasis and effort. It is well known that for a good part of societyaquaculture is an unknown activity that causes a rejection. The indicator seeks topromote the adoption and implementation of awareness raising andcommunication to enable a greater understanding of the image.
Data source:Data will be gathered annually.
The indicator is measured in 3 steps plus one extra point with a total of 5.Communication actions to improve the image and understanding on the part of thecompany, hence avoiding legal proceedings against the industry, will score higher.This makes the company take the residents into account, allowing them to visit thefarms, taking part in fairs, or through corporate responsibility plans, the farm will bewell respected in the community.
66
Defining sustainability indicators for Mediterranean Aquaculture
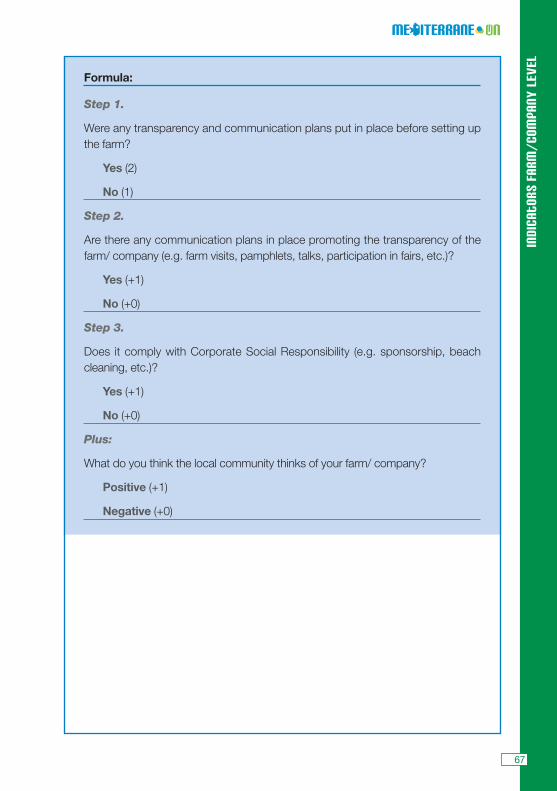
Indi
cato
rs f
arm
/com
pany
lev
el
Formula:
Step 1.
Were any transparency and communication plans put in place before setting upthe farm?
Yes (2)
No (1)
Step 2.
Are there any communication plans in place promoting the transparency of thefarm/ company (e.g. farm visits, pamphlets, talks, participation in fairs, etc.)?
Yes (+1)
No (+0)
Step 3.
Does it comply with Corporate Social Responsibility (e.g. sponsorship, beachcleaning, etc.)?
Yes (+1)
No (+0)
Plus:
What do you think the local community thinks of your farm/ company?
Positive (+1)
Negative (+0)
67
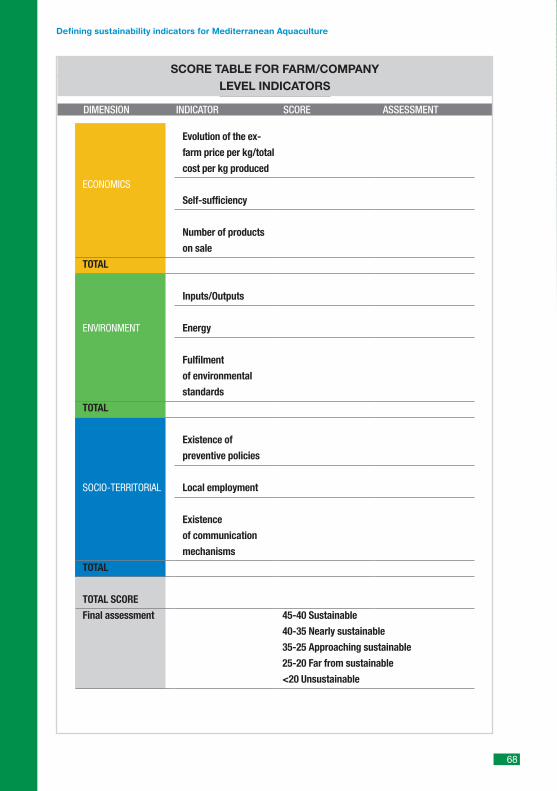
68
Defining sustainability indicators for Mediterranean Aquaculture
SCORE TABLE FOR FARM/COMPANY LEVEL INDICATORS
DIMENSION INDICATOR SCORE ASSESSMENT
ECONOMICS
TOTAL
ENVIRONMENT
TOTAL
SOCIO-TERRITORIAL
TOTAL
TOTAL SCORE
Final assessment
Evolution of the ex-
farm price per kg/total
cost per kg produced
Self-sufficiency
Number of products
on sale
Inputs/Outputs
Energy
Fulfilment
of environmental
standards
Existence of
preventive policies
Local employment
Existence
of communication
mechanisms
45-40 Sustainable
40-35 Nearly sustainable
35-25 Approaching sustainable
25-20 Far from sustainable
<20 Unsustainable
Indi
cato
rs n
atio
nal
leve
l
3. Indicators of sustainability at a National level
Introduction
The indicators defined in this section have been designed for use in the 19 Mediterraneancountries included in this study as previously described. However, the pilot projects carriedout in specific countries will enable assessment and improvement.
The aspects which provoked the most debate and discussion when selecting thesenational indicators are the definition and use of the terms “development” and “growth” inrelation to the following issues: “Is it really sustainable to increase farm food productionwithout setting a limit? Should the relevant administrations set or put these limits in place?”The biggest difference in opinions can be seen in the answers voiced by the producers andconservation organizations. According to them, development is most suitable in finitesystems because it stretches itself to its full extent until it reaches a balanced state. As aresult of this approach, the use of indicators relative to aquaculture's contribution to GDP orthe number of direct or indirect employees against the total number of employees in thecountry has been dismissed, favouring the selection of indicators more in line with thisdevelopmental approach.
It should also be mentioned that some of these indicators selected on a national level comefrom already defined farm/ company level indicators, even extrapolating to a Mediterraneanlevel. An example of this type of indicator could be the use of environmental standards.Such an indicator enables one to easily obtain information through an extrapolation ofresults obtained on a local level by linking them and making them more consistent.
As with the farm indicators, the first part of the sustainability assessment should beeconomic, since, if this area is not sustainable, the company will obviously have to ceaseoperation in the future. However, this does not mean that this is going to be more importantin the final appraisal than environmental and socio-territorial aspects.
All the indicators have a total number of points, with 5 Sustainable, 4 Nearly sustainable, 3Approaching sustainable, 2 Far from sustainable and 1 Unsustainable.
The calculation of some indicators are made up of various steps and/ or may require morethan one formula, so the final score is calculated by the addition of or by obtaining bonuseswhich allow the maximum score to be obtained.
69
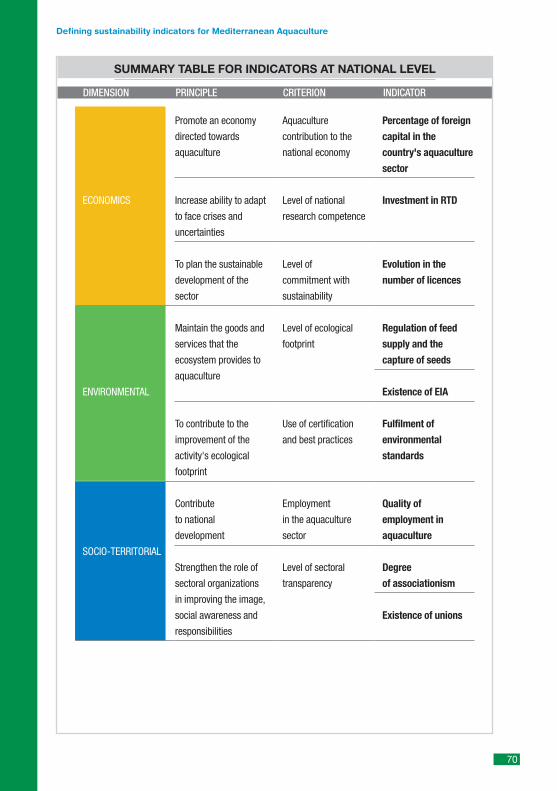
70
Defining sustainability indicators for Mediterranean Aquaculture
SUMMARY TABLE FOR INDICATORS AT NATIONAL LEVEL
DIMENSION PRINCIPLE CRITERION INDICATOR
ECONOMICS
ENVIRONMENTAL
SOCIO-TERRITORIAL
Promote an economy
directed towards
aquaculture
Increase ability to adapt
to face crises and
uncertainties
To plan the sustainable
development of the
sector
Maintain the goods and
services that the
ecosystem provides to
aquaculture
To contribute to the
improvement of the
activity's ecological
footprint
Contribute
to national
development
Strengthen the role of
sectoral organizations
in improving the image,
social awareness and
responsibilities
Aquaculture
contribution to the
national economy
Level of national
research competence
Level of
commitment with
sustainability
Level of ecological
footprint
Use of certification
and best practices
Employment
in the aquaculture
sector
Level of sectoral
transparency
Percentage of foreign
capital in the
country's aquaculture
sector
Investment in RTD
Evolution in the
number of licences
Regulation of feed
supply and the
capture of seeds
Existence of EIA
Fulfilment of
environmental
standards
Quality of
employment in
aquaculture
Degree
of associationism
Existence of unions
Indi
cato
rs n
atio
nal
leve
l
ECONOMIC INDICATORS
ECONOMIC INDICATORS FOR DOWNSTREAM EFFECTS AND ENVIRONMENTAL SPILLOVERS
Shirra FreemanUniversity of Haifa (Israel) / Harvard School of Public Health (USA)
Economic indicators for the enterprise and sector are essential to the sustainability ofaquaculture. No entrepreneur or investor would undertake the risks of establishing andoperating a fish farm without the expectations of profits and returns on investment. Thus,from the perspective of the business community, performance indicators such as thoseabove are existential.
The economic dimension of sustainable aquaculture goes beyond firm, industry andmacro-economic concerns; however and in order to represent the economic dimensionmore completely, one must consider downstream effects and environmental spillovers.Although some of these effects are commonly placed in either of the environmental orsocial pillars of sustainability, they're full contribution to human welfare can only becaptured through the use of economic indicators together with social and environmentalindicators. Thus, for example though employment may fall within the social pillar, itshould also be measured in terms of contributions in monetary terms to householdincomes and the local tax base. Similarly, the interaction between aquaculture and theenvironment can be measured in terms of the monetary costs of cleaning up a pollutedenvironment and lost livelihoods.
Economic Indicators at the company and/or local level:
Indicators stemming from environmental impacts: The main impacts at these levels stemfrom interaction with other uses/users of the ecosystem. They include the monetary valueof damage caused by pollution. In the case of farm effluent, the appropriate indicators arethe costs of clean up and the costs of damages of self pollution to the farm and impairmentof non-farm users (e.g.: recreation, tourism, drinking water).
Indicators stemming from stakeholder interactions: Where there is competition for space,there are trade-offs between fish farms and other users. Trade-offs can be measure as theenterprise income foregone (opportunity cost) by other potential users.
Indicators stemming from economic spillovers: Often, the off-farm opportunities created byfish farms are greater than the on-farm potential. Downstream industries such asprocessing, transport, marketing and maintenance all have measurable monetary values.
71
Economic Indicators at the industry or sectoral level
The primary economic indicator at this level measures the monetary value of the wider-range environmental effects of many aquaculture enterprises over a large geographic area.Here there may be measurable pollution effects and impacts on wild stocks. For example,large collectivities of farms may substantially increase local wildstocks and commercial fishlandings. The indicator in this case would be the estimated value of these increasedlandings.
Many of the same stakeholder interactions and economic spillovers that exist at the locallevel can be aggregated up to the sectoral level, but do not require a separate indicator.
Economic indicators at the national level
The national level indicators are essentially an aggregation of those at the enterprise/localand industry/sectoral level.
Non-monetary indicators of risk
The risk of most enterprises and industries is directly proportional to the level ofdiversification. For aquaculture, diversification indicators include the number of speciesfarmed, the range of culture techniques used and the level of vertical or horizontalintegration. The higher the level of diversification is, the lower the risk is.
The indicator for species diversity is the proportional distribution of species.
The indicator for the range of culture techniques is the proportional distribution oftechniques.
The indicator for integration is the proportion of enterprises engaged in the culture of morethan one species and the number of farms that engage in activities other than fish culture(e.g.: processing and marketing
72
Defining sustainability indicators for Mediterranean Aquaculture
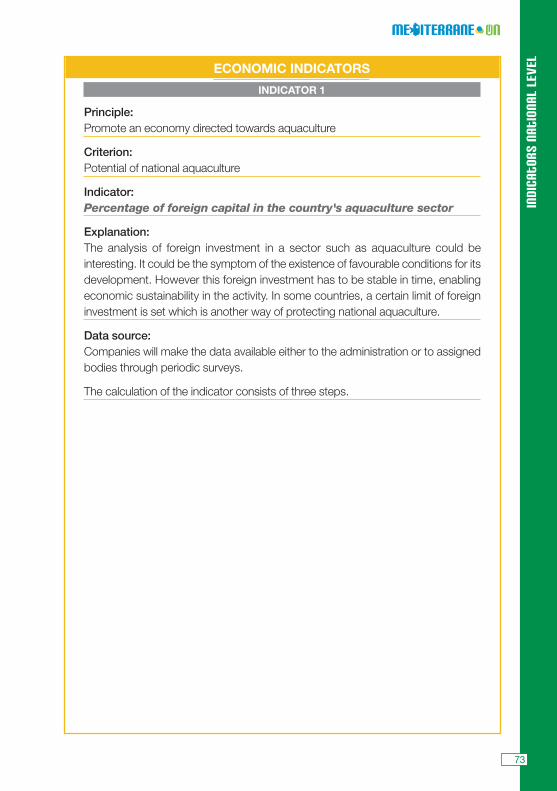
Indi
cato
rs n
atio
nal
leve
l
ECONOMIC INDICATORS
INDICATOR 1
Principle: Promote an economy directed towards aquaculture
Criterion: Potential of national aquaculture
Indicator: Percentage of foreign capital in the country's aquaculture sector
Explanation:The analysis of foreign investment in a sector such as aquaculture could beinteresting. It could be the symptom of the existence of favourable conditions for itsdevelopment. However this foreign investment has to be stable in time, enablingeconomic sustainability in the activity. In some countries, a certain limit of foreigninvestment is set which is another way of protecting national aquaculture.
Data source:Companies will make the data available either to the administration or to assignedbodies through periodic surveys.
The calculation of the indicator consists of three steps.
73
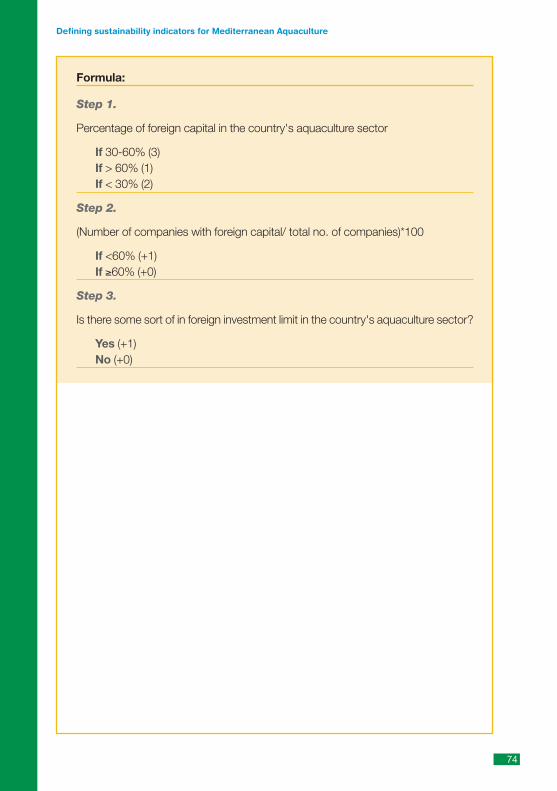
Formula:
Step 1.
Percentage of foreign capital in the country's aquaculture sector
If 30-60% (3) If > 60% (1) If < 30% (2)
Step 2.
(Number of companies with foreign capital/ total no. of companies)*100
If <60% (+1) If ≥60% (+0)
Step 3.
Is there some sort of in foreign investment limit in the country's aquaculture sector?
Yes (+1) No (+0)
74
Defining sustainability indicators for Mediterranean Aquaculture
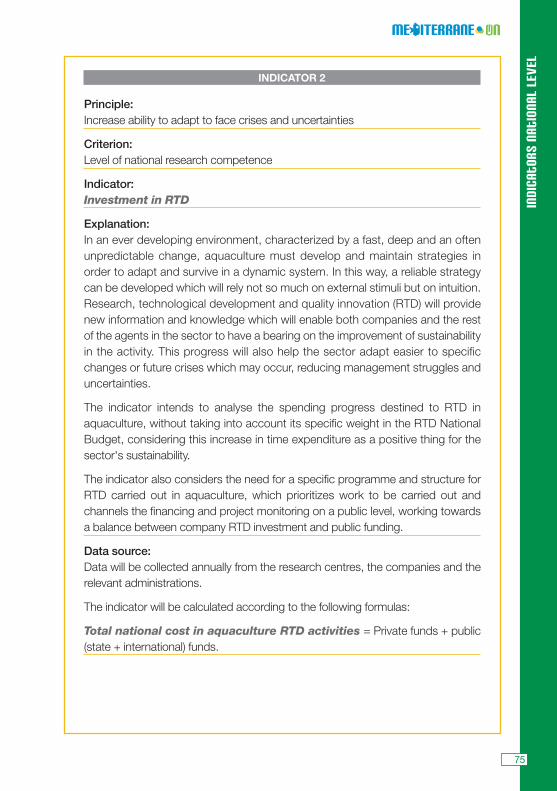
Indi
cato
rs n
atio
nal
leve
l
INDICATOR 2
Principle: Increase ability to adapt to face crises and uncertainties
Criterion: Level of national research competence
Indicator: Investment in RTD
Explanation:In an ever developing environment, characterized by a fast, deep and an oftenunpredictable change, aquaculture must develop and maintain strategies inorder to adapt and survive in a dynamic system. In this way, a reliable strategycan be developed which will rely not so much on external stimuli but on intuition.Research, technological development and quality innovation (RTD) will providenew information and knowledge which will enable both companies and the restof the agents in the sector to have a bearing on the improvement of sustainabilityin the activity. This progress will also help the sector adapt easier to specificchanges or future crises which may occur, reducing management struggles anduncertainties.
The indicator intends to analyse the spending progress destined to RTD inaquaculture, without taking into account its specific weight in the RTD NationalBudget, considering this increase in time expenditure as a positive thing for thesector's sustainability.
The indicator also considers the need for a specific programme and structure forRTD carried out in aquaculture, which prioritizes work to be carried out andchannels the financing and project monitoring on a public level, working towardsa balance between company RTD investment and public funding.
Data source:Data will be collected annually from the research centres, the companies and therelevant administrations.
The indicator will be calculated according to the following formulas:
Total national cost in aquaculture RTD activities = Private funds + public(state + international) funds.
75
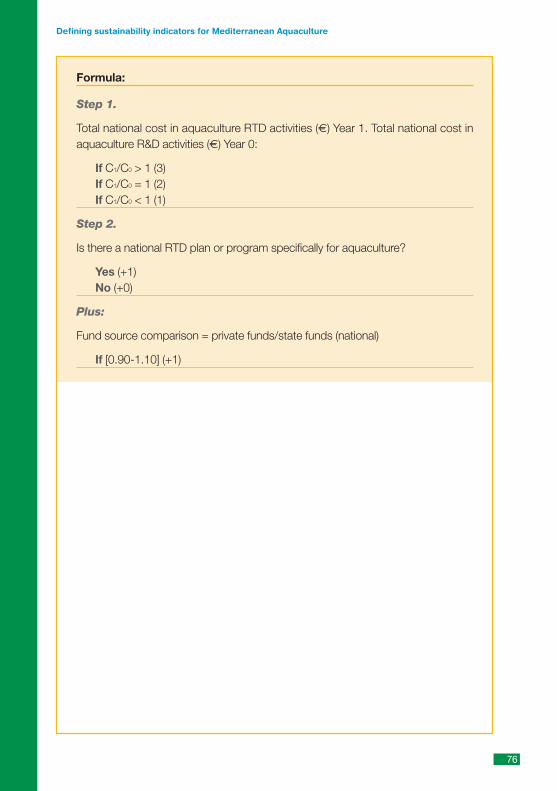
Formula:
Step 1.
Total national cost in aquaculture RTD activities (€) Year 1. Total national cost inaquaculture R&D activities (€) Year 0:
If C1/C0 > 1 (3) If C1/C0 = 1 (2) If C1/C0 < 1 (1)
Step 2.
Is there a national RTD plan or program specifically for aquaculture?
Yes (+1) No (+0)
Plus:
Fund source comparison = private funds/state funds (national)
If [0.90-1.10] (+1)
76
Defining sustainability indicators for Mediterranean Aquaculture
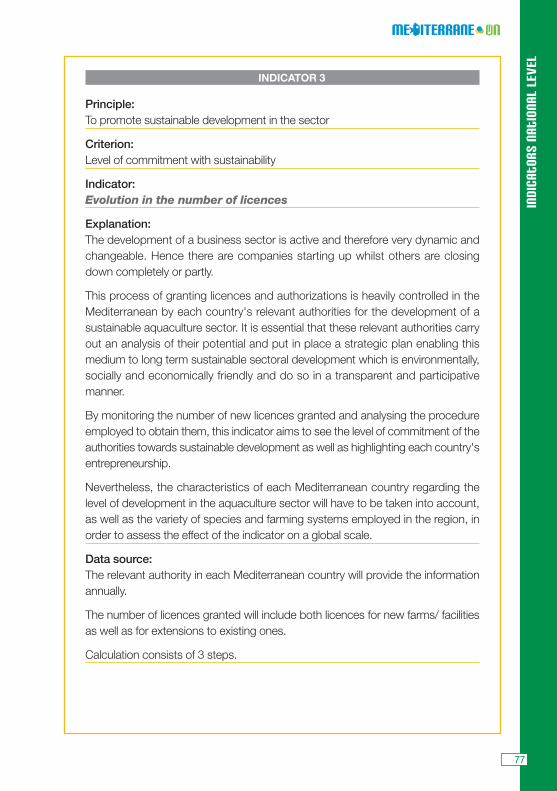
INDICATOR 3
Principle: To promote sustainable development in the sector
Criterion: Level of commitment with sustainability
Indicator: Evolution in the number of licences
Explanation:The development of a business sector is active and therefore very dynamic andchangeable. Hence there are companies starting up whilst others are closingdown completely or partly.
This process of granting licences and authorizations is heavily controlled in theMediterranean by each country's relevant authorities for the development of asustainable aquaculture sector. It is essential that these relevant authorities carryout an analysis of their potential and put in place a strategic plan enabling thismedium to long term sustainable sectoral development which is environmentally,socially and economically friendly and do so in a transparent and participativemanner.
By monitoring the number of new licences granted and analysing the procedureemployed to obtain them, this indicator aims to see the level of commitment of theauthorities towards sustainable development as well as highlighting each country'sentrepreneurship.
Nevertheless, the characteristics of each Mediterranean country regarding thelevel of development in the aquaculture sector will have to be taken into account,as well as the variety of species and farming systems employed in the region, inorder to assess the effect of the indicator on a global scale.
Data source:The relevant authority in each Mediterranean country will provide the informationannually.
The number of licences granted will include both licences for new farms/ facilitiesas well as for extensions to existing ones.
Calculation consists of 3 steps.
Indi
cato
rs n
atio
nal
leve
l
77
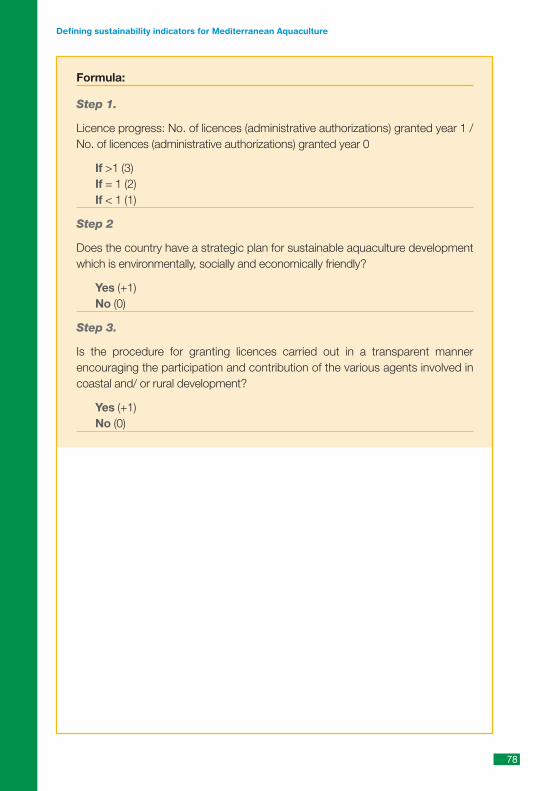
Formula:
Step 1.
Licence progress: No. of licences (administrative authorizations) granted year 1 /No. of licences (administrative authorizations) granted year 0
If >1 (3) If = 1 (2) If < 1 (1)
Step 2
Does the country have a strategic plan for sustainable aquaculture developmentwhich is environmentally, socially and economically friendly?
Yes (+1)No (0)
Step 3.
Is the procedure for granting licences carried out in a transparent mannerencouraging the participation and contribution of the various agents involved incoastal and/ or rural development?
Yes (+1) No (0)
78
Defining sustainability indicators for Mediterranean Aquaculture
Indi
cato
rs n
atio
nal
leve
l
ENVIRONMENTAL INDICATORS
REFLECTIONS ON THE ENVIRONMENTAL ASPECTS OF THE SUSTAINABILITY OF AQUACULTURE
Dror L. AngelRecanati Institute of Maritime Studies & Dept of Maritime Civilizations
University of HaifaIsrael
The intense growth in marine aquaculture that has occurred over the past 30 years is theresult of a number of remarkable changes in the marine environment. Foremost amongthese was the drop in capture fishery landings which made the supply of marine products tothe market less reliable at a time that the market had actually increased its demand for thiscommodity. The decrease in commercial fishery landings was the result of several factors,including overfishing (Pauly et al. 1998), marine pollution and deterioration of waterquality (FAO 1997), destruction of marine habitats and climate change (Cochrane et al.2009). The drop in supply of wild-captured fish paved the way for marine aquaculture(mariculture) development. Mariculture was heralded as a sustainable way to obtain foodfrom the sea, i.e. with minimal impact to marine resources.
In its early years, mariculture production levels were small relative to capture fisheries andthe sector did not attract a lot of attention. This changed dramatically following the massivegrowth in tropical shrimp-farming during the 1980s (Chua et al. 1989, Primavera 1998).In coastal areas mangroves were cut down to make room for shrimp farms, therebyreducing biodiversity, increasing coastal erosion and destroying crucial coastal habitat.In addition, discharged pond effluents added large organic loads, toxic chemicals, e.g.pesticides and antibiotics and disease agents, such as viruses to the coastal marineenvironment. The media provided wide coverage to the destructive impacts of shrimpfarming and helped establish a generally negative public attitude toward aquaculture onthe basis of the environmental impacts of this industry.
Another sector that grew at a tremendous rate during the 1980s was salmon farming. In theearly years of this industry, salmon farmers used high levels of antibiotics to combat thediseases that afflicted the fish, thereby reinforcing the harmful impact on the environmentand the human consumers. High feed conversion factors and inappropriate husbandry ledto heavy organic loads on the seafloor, benthic anoxia (and sulfidic sediments) and severeimpacts to the benthos, i.e. additional negative environmental effects.
79
Although shrimp and salmon farming are only two examples of marine aquaculture andthere are other less-problematic practices, e.g. bivalve and seaweed farming, the damagewas done and public opinion in many countries was stacked against aquaculture, largelyon the basis of environmental impacts (Dierberg and Kiattisimkul 1996, Primavera 1998).Public surveys to assess the basis for public opinion regarding aquaculture revealed that itwas the result of a largely un-informed public and a strong media campaign againstaquaculture (Barraclough and Finger-Stich 1996).
If we use an environmental ruler to measure the sustainability of mariculture, it is essentialto separate among different types of practices on the basis of how they affect theirsurroundings. Among the issues at stake we may consider the following: feed footprint,impact on the water column and impact on the benthic community. The feed footprintrelates to the effect that aquaculture has on an ecosystem level. If the preparation of finfishfood, for example, involves increased pressure on natural fisheries or other resources, thesustainability of this practice is low and the footprint will be large. If the food is obtainedlocally and its harvest or production have limited effects on the food web and on marineresources, the feed footprint will be small. With respect to aquaculture impacts on the watercolumn and benthos, there is a variety of possibilities. On one end of the spectrum, pond ortank-based mariculture may have minimal impacts on the water column and the benthosif nutrients and contaminants are removed from effluents before discharge. However, land-based mariculture (e.g. shrimp or fish ponds) often draws criticism because it is limited tothe coastal zone which is the focus of conflicts between the numerous stakeholders there.Farming of organisms in the sea may have small or large effects, depending on whether theyare fed or extractive and on the husbandry and management of the farm. Aquaculture is“fed”, when the farmed organisms, e.g. finfish or shrimp receive formulated feeds thatcontain components that do not originate in natural food from their surroundings(allochthonous). Fed aquaculture is usually intensive in order to be economicallysustainable and the wastes from such farms often create a benthic footprint, though thewater column is seldom affected. In extractive aquaculture the farmed organisms extracttheir natural (autochthonous) food from the surrounding water, e.g. bivalves or seaweedsthat feed on phytoplankton and inorganic nutrients, respectively. In eutrophicenvironments where there is an excess of phytoplankton and nutrients (mainly N & P)conversion of these into biomass that is then harvested at a profit is a win-win situation.Marine farmers clearly have an incentive to rear profitable extractive crops andenvironmental loads are reduced, thereby averting ecological disasters such as dead zones.
80
Defining sustainability indicators for Mediterranean Aquaculture
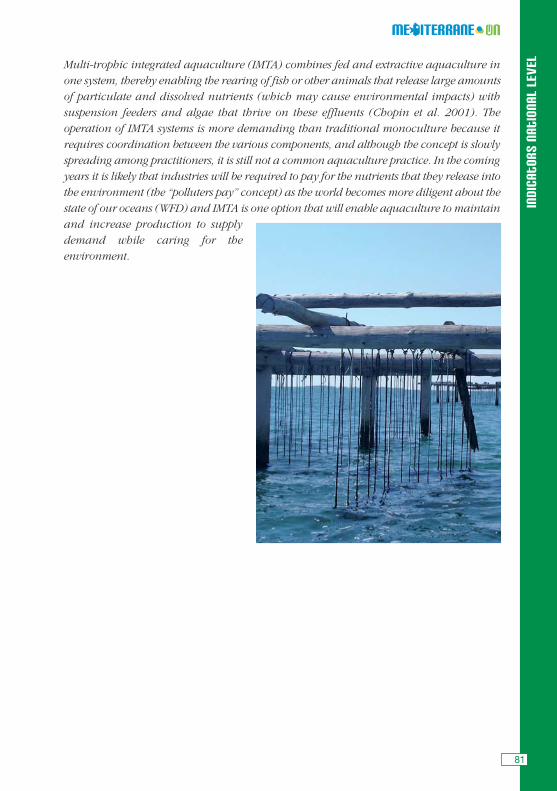
Indi
cato
rs n
atio
nal
leve
l
Multi-trophic integrated aquaculture (IMTA) combines fed and extractive aquaculture inone system, thereby enabling the rearing of fish or other animals that release large amountsof particulate and dissolved nutrients (which may cause environmental impacts) withsuspension feeders and algae that thrive on these effluents (Chopin et al. 2001). Theoperation of IMTA systems is more demanding than traditional monoculture because itrequires coordination between the various components, and although the concept is slowlyspreading among practitioners, it is still not a common aquaculture practice. In the comingyears it is likely that industries will be required to pay for the nutrients that they release intothe environment (the “polluters pay” concept) as the world becomes more diligent about thestate of our oceans (WFD) and IMTA is one option that will enable aquaculture to maintainand increase production to supplydemand while caring for theenvironment.
81
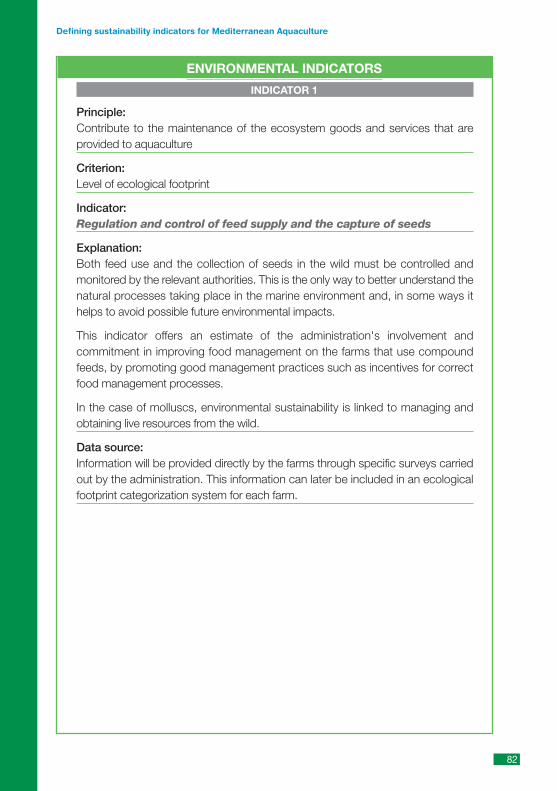
ENVIRONMENTAL INDICATORS
INDICATOR 1
Principle: Contribute to the maintenance of the ecosystem goods and services that areprovided to aquaculture
Criterion: Level of ecological footprint
Indicator: Regulation and control of feed supply and the capture of seeds
Explanation:Both feed use and the collection of seeds in the wild must be controlled andmonitored by the relevant authorities. This is the only way to better understand thenatural processes taking place in the marine environment and, in some ways ithelps to avoid possible future environmental impacts.
This indicator offers an estimate of the administration's involvement andcommitment in improving food management on the farms that use compoundfeeds, by promoting good management practices such as incentives for correctfood management processes.
In the case of molluscs, environmental sustainability is linked to managing andobtaining live resources from the wild.
Data source:Information will be provided directly by the farms through specific surveys carriedout by the administration. This information can later be included in an ecologicalfootprint categorization system for each farm.
82
Defining sustainability indicators for Mediterranean Aquaculture
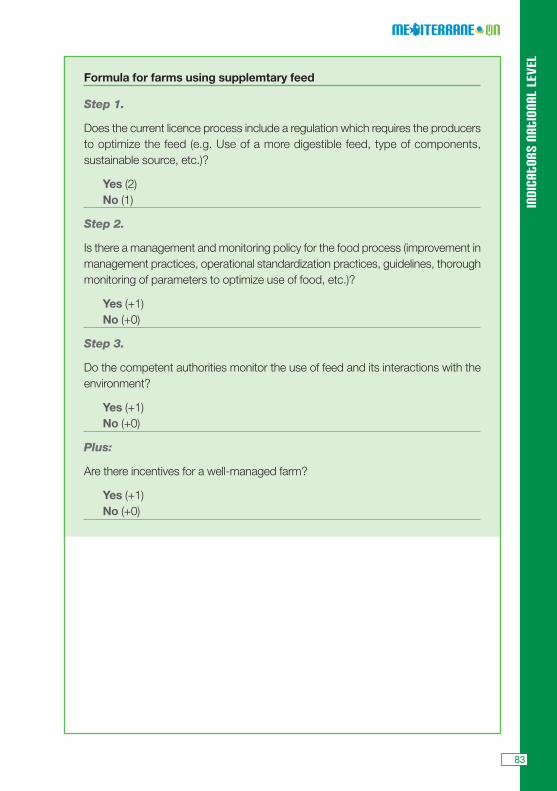
Indi
cato
rs n
atio
nal
leve
l
Formula for farms using supplemtary feed
Step 1.
Does the current licence process include a regulation which requires the producersto optimize the feed (e.g. Use of a more digestible feed, type of components,sustainable source, etc.)?
Yes (2) No (1)
Step 2.
Is there a management and monitoring policy for the food process (improvement inmanagement practices, operational standardization practices, guidelines, thoroughmonitoring of parameters to optimize use of food, etc.)?
Yes (+1) No (+0)
Step 3.
Do the competent authorities monitor the use of feed and its interactions with theenvironment?
Yes (+1) No (+0)
Plus:
Are there incentives for a well-managed farm?
Yes (+1) No (+0)
83
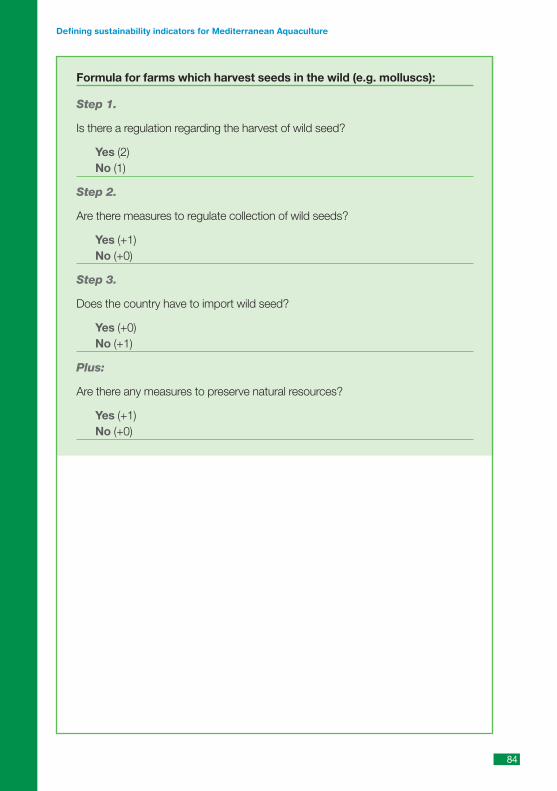
Formula for farms which harvest seeds in the wild (e.g. molluscs):
Step 1.
Is there a regulation regarding the harvest of wild seed?
Yes (2) No (1)
Step 2.
Are there measures to regulate collection of wild seeds?
Yes (+1) No (+0)
Step 3.
Does the country have to import wild seed?
Yes (+0) No (+1)
Plus:
Are there any measures to preserve natural resources?
Yes (+1) No (+0)
84
Defining sustainability indicators for Mediterranean Aquaculture
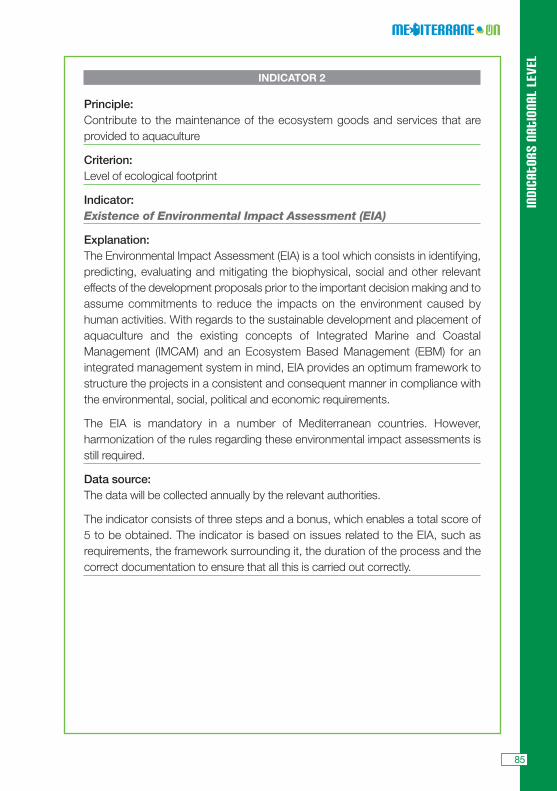
Indi
cato
rs n
atio
nal
leve
l
INDICATOR 2
Principle: Contribute to the maintenance of the ecosystem goods and services that areprovided to aquaculture
Criterion: Level of ecological footprint
Indicator: Existence of Environmental Impact Assessment (EIA)
Explanation:The Environmental Impact Assessment (EIA) is a tool which consists in identifying,predicting, evaluating and mitigating the biophysical, social and other relevanteffects of the development proposals prior to the important decision making and toassume commitments to reduce the impacts on the environment caused byhuman activities. With regards to the sustainable development and placement ofaquaculture and the existing concepts of Integrated Marine and CoastalManagement (IMCAM) and an Ecosystem Based Management (EBM) for anintegrated management system in mind, EIA provides an optimum framework tostructure the projects in a consistent and consequent manner in compliance withthe environmental, social, political and economic requirements.
The EIA is mandatory in a number of Mediterranean countries. However,harmonization of the rules regarding these environmental impact assessments isstill required.
Data source:The data will be collected annually by the relevant authorities.
The indicator consists of three steps and a bonus, which enables a total score of5 to be obtained. The indicator is based on issues related to the EIA, such asrequirements, the framework surrounding it, the duration of the process and thecorrect documentation to ensure that all this is carried out correctly.
85
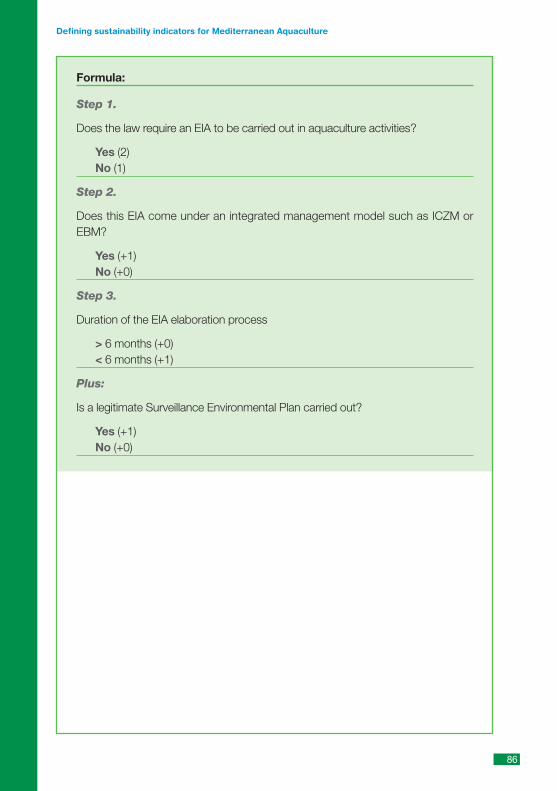
Formula:
Step 1.
Does the law require an EIA to be carried out in aquaculture activities?
Yes (2) No (1)
Step 2.
Does this EIA come under an integrated management model such as ICZM orEBM?
Yes (+1) No (+0)
Step 3.
Duration of the EIA elaboration process
> 6 months (+0) < 6 months (+1)
Plus:
Is a legitimate Surveillance Environmental Plan carried out?
Yes (+1) No (+0)
86
Defining sustainability indicators for Mediterranean Aquaculture
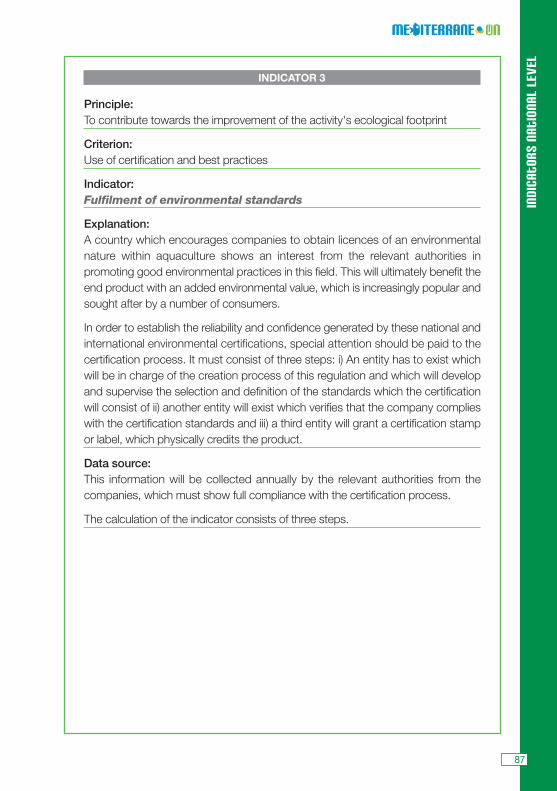
Indi
cato
rs n
atio
nal
leve
l
INDICATOR 3
Principle: To contribute towards the improvement of the activity's ecological footprint
Criterion: Use of certification and best practices
Indicator: Fulfilment of environmental standards
Explanation:A country which encourages companies to obtain licences of an environmentalnature within aquaculture shows an interest from the relevant authorities inpromoting good environmental practices in this field. This will ultimately benefit theend product with an added environmental value, which is increasingly popular andsought after by a number of consumers.
In order to establish the reliability and confidence generated by these national andinternational environmental certifications, special attention should be paid to thecertification process. It must consist of three steps: i) An entity has to exist whichwill be in charge of the creation process of this regulation and which will developand supervise the selection and definition of the standards which the certificationwill consist of ii) another entity will exist which verifies that the company complieswith the certification standards and iii) a third entity will grant a certification stampor label, which physically credits the product.
Data source:This information will be collected annually by the relevant authorities from thecompanies, which must show full compliance with the certification process.
The calculation of the indicator consists of three steps.
87
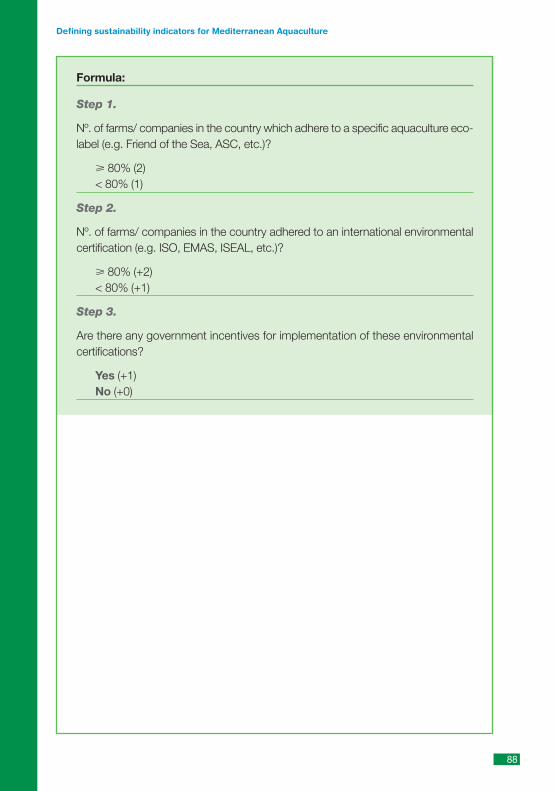
Formula:
Step 1.
Nº. of farms/ companies in the country which adhere to a specific aquaculture eco-label (e.g. Friend of the Sea, ASC, etc.)?
� 80% (2) < 80% (1)
Step 2.
Nº. of farms/ companies in the country adhered to an international environmentalcertification (e.g. ISO, EMAS, ISEAL, etc.)?
� 80% (+2) < 80% (+1)
Step 3.
Are there any government incentives for implementation of these environmentalcertifications?
Yes (+1) No (+0)
88
Defining sustainability indicators for Mediterranean Aquaculture

Indi
cato
rs n
atio
nal
leve
l
SOCIO-TERRITORIAL INDICATORS
ROLE OF THE CREATION OF SOCIAL INDICATORS IN ESTABLISHING SUSTAINABLE DEVELOPMENT
Eduardo ChiaINRA/CIRAD
France
Sustainable development, as a general principle of public action, is increasingly present indevelopment projects on a local and regional level. However, the creation of the projects andtheir implementation does not happen naturally. On a territorial level, the implementationof sustainable development is everybody's responsibility: private and public parties,aquaculturists, agriculturists, salespersons, etc. The scheduled actions may causeantagonism amongst those involved who feel they are isolated and not involved enough.This antagonism can sometimes turn into conflicts and endanger the execution of theprojects. Solving these conflicts will involve large economic and operational costs whichshould be avoided. A way of reducing and eliminating these conflicts is by establishingagreement and negotiation mechanisms to start community action.
The indicators which assess the effects and impacts of actions of sustainable developmentcan play an important part in the structuring of community action, which is essential forterritorial level projects, so long as they are co-produced, that they make sense to thosecommitted to action and enable external communication.
The indicators are not just measuring tools for progress or a specific situation. They are alsoinventories which enable a variable to be defined, amongst several others, which will bemonitored. The variables can be arranged in order of importance to form a sort of controlpanel. But an indicator is also an internal and external communication vector. Theindicator becomes a standard once it is accepted and its limitations are identified. Itbecomes the signal which can eventually entail penalties for situations which, beyond theaforementioned threshold, are considered negative.
This group of functions lead the indicators to be considered as both technical and socialmechanisms, which report social construction and commitment.
Sustainable development has the environment and the human being at the top of itsagenda, so it requires a change in mentality and practices of those involved, hence the needto establish learning mechanisms and processes. Learning to create common projectsdefining synergies between the individual logics; learning to establish actions; learning towork together; learning to communicate and assess the changes. In this way, the
89
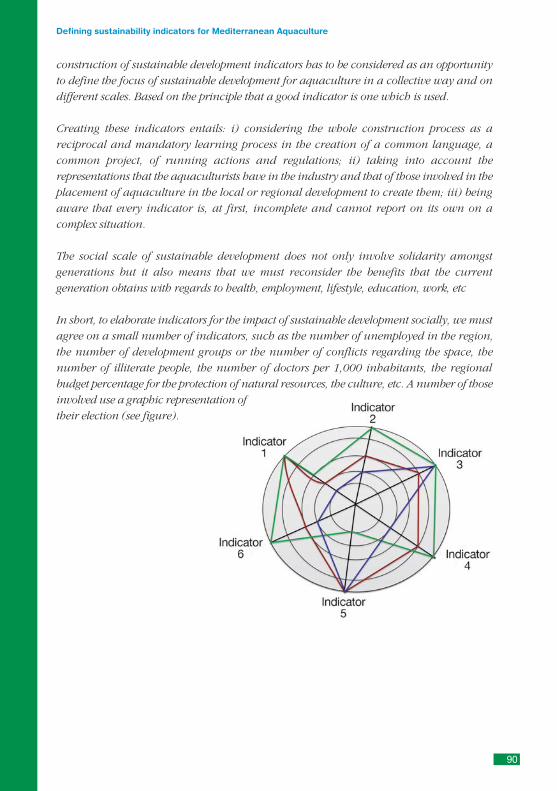
construction of sustainable development indicators has to be considered as an opportunityto define the focus of sustainable development for aquaculture in a collective way and ondifferent scales. Based on the principle that a good indicator is one which is used.
Creating these indicators entails: i) considering the whole construction process as areciprocal and mandatory learning process in the creation of a common language, acommon project, of running actions and regulations; ii) taking into account therepresentations that the aquaculturists have in the industry and that of those involved in theplacement of aquaculture in the local or regional development to create them; iii) beingaware that every indicator is, at first, incomplete and cannot report on its own on acomplex situation.
The social scale of sustainable development does not only involve solidarity amongstgenerations but it also means that we must reconsider the benefits that the currentgeneration obtains with regards to health, employment, lifestyle, education, work, etc
In short, to elaborate indicators for the impact of sustainable development socially, we mustagree on a small number of indicators, such as the number of unemployed in the region,the number of development groups or the number of conflicts regarding the space, thenumber of illiterate people, the number of doctors per 1,000 inhabitants, the regionalbudget percentage for the protection of natural resources, the culture, etc. A number of thoseinvolved use a graphic representation oftheir election (see figure).
90
Defining sustainability indicators for Mediterranean Aquaculture
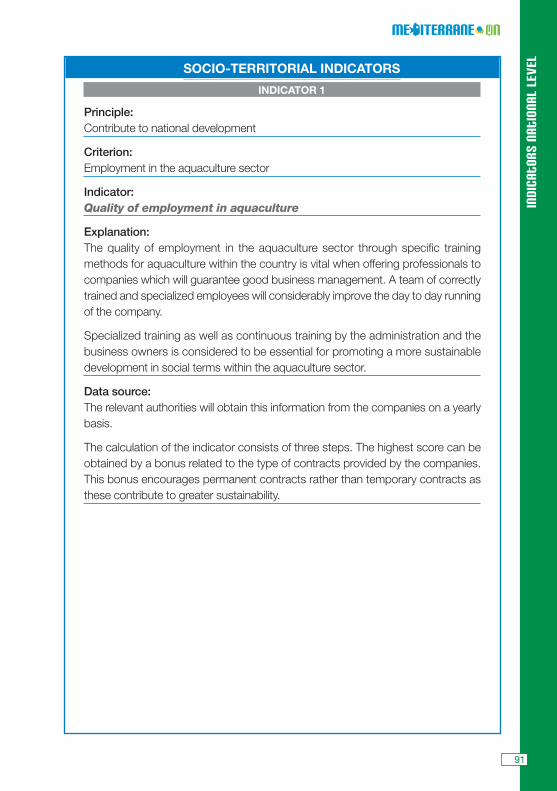
Indi
cato
rs n
atio
nal
leve
l
SOCIO-TERRITORIAL INDICATORS
INDICATOR 1
Principle: Contribute to national development
Criterion: Employment in the aquaculture sector
Indicator: Quality of employment in aquaculture
Explanation:The quality of employment in the aquaculture sector through specific trainingmethods for aquaculture within the country is vital when offering professionals tocompanies which will guarantee good business management. A team of correctlytrained and specialized employees will considerably improve the day to day runningof the company.
Specialized training as well as continuous training by the administration and thebusiness owners is considered to be essential for promoting a more sustainabledevelopment in social terms within the aquaculture sector.
Data source:The relevant authorities will obtain this information from the companies on a yearlybasis.
The calculation of the indicator consists of three steps. The highest score can beobtained by a bonus related to the type of contracts provided by the companies.This bonus encourages permanent contracts rather than temporary contracts asthese contribute to greater sustainability.
91
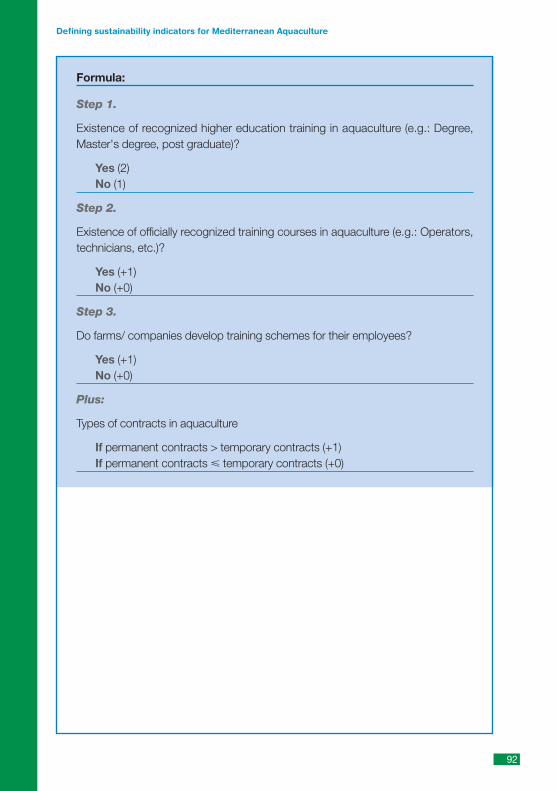
Formula:
Step 1.
Existence of recognized higher education training in aquaculture (e.g.: Degree,Master's degree, post graduate)?
Yes (2) No (1)
Step 2.
Existence of officially recognized training courses in aquaculture (e.g.: Operators,technicians, etc.)?
Yes (+1) No (+0)
Step 3.
Do farms/ companies develop training schemes for their employees?
Yes (+1) No (+0)
Plus:
Types of contracts in aquaculture
If permanent contracts > temporary contracts (+1) If permanent contracts � temporary contracts (+0)
92
Defining sustainability indicators for Mediterranean Aquaculture
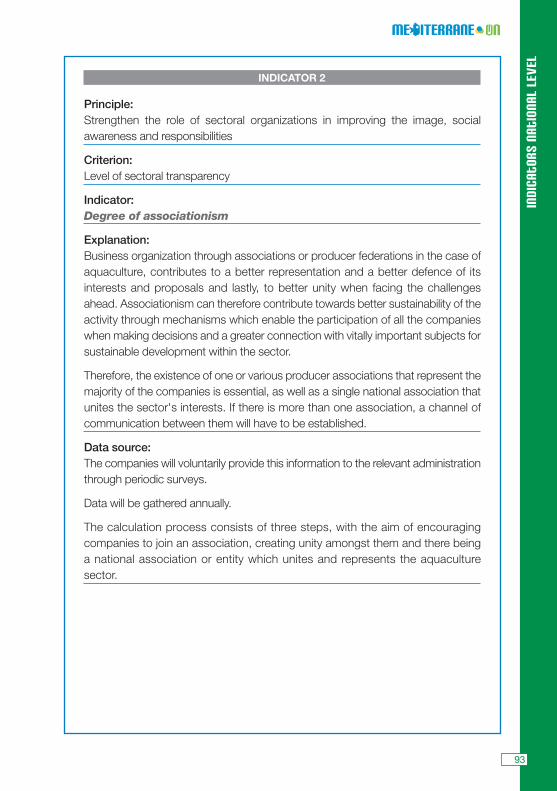
Indi
cato
rs n
atio
nal
leve
l
INDICATOR 2
Principle: Strengthen the role of sectoral organizations in improving the image, socialawareness and responsibilities
Criterion: Level of sectoral transparency
Indicator: Degree of associationism
Explanation:Business organization through associations or producer federations in the case ofaquaculture, contributes to a better representation and a better defence of itsinterests and proposals and lastly, to better unity when facing the challengesahead. Associationism can therefore contribute towards better sustainability of theactivity through mechanisms which enable the participation of all the companieswhen making decisions and a greater connection with vitally important subjects forsustainable development within the sector.
Therefore, the existence of one or various producer associations that represent themajority of the companies is essential, as well as a single national association thatunites the sector's interests. If there is more than one association, a channel ofcommunication between them will have to be established.
Data source:The companies will voluntarily provide this information to the relevant administrationthrough periodic surveys.
Data will be gathered annually.
The calculation process consists of three steps, with the aim of encouragingcompanies to join an association, creating unity amongst them and there beinga national association or entity which unites and represents the aquaculturesector.
93
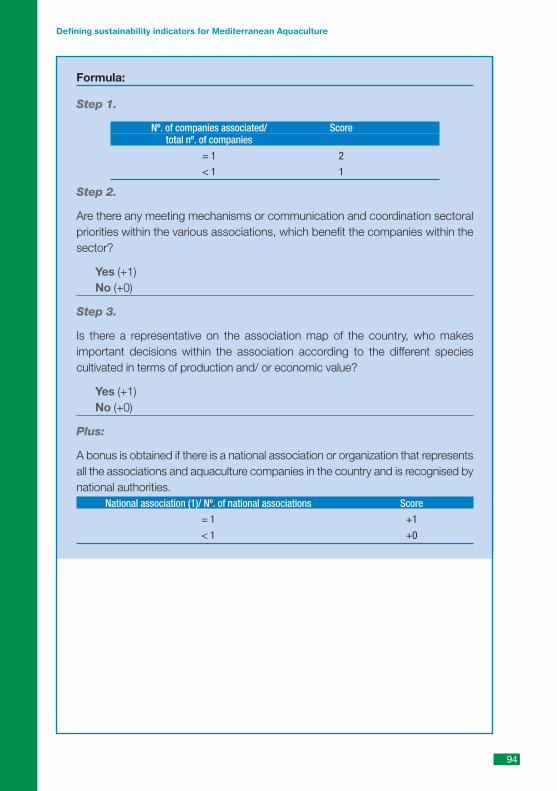
Formula:
Step 1.
Nº. of companies associated/ Scoretotal nº. of companies
= 1 2
< 1 1
Step 2.
Are there any meeting mechanisms or communication and coordination sectoralpriorities within the various associations, which benefit the companies within thesector?
Yes (+1) No (+0)
Step 3.
Is there a representative on the association map of the country, who makesimportant decisions within the association according to the different speciescultivated in terms of production and/ or economic value?
Yes (+1) No (+0)
Plus:
A bonus is obtained if there is a national association or organization that representsall the associations and aquaculture companies in the country and is recognised bynational authorities.
National association (1)/ Nº. of national associations Score
= 1 +1
< 1 +0
94
Defining sustainability indicators for Mediterranean Aquaculture
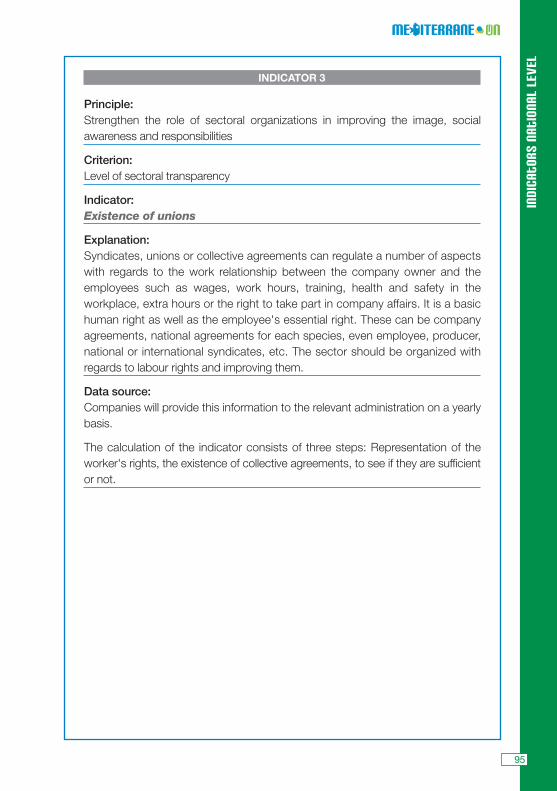
Indi
cato
rs n
atio
nal
leve
l
INDICATOR 3
Principle: Strengthen the role of sectoral organizations in improving the image, socialawareness and responsibilities
Criterion: Level of sectoral transparency
Indicator: Existence of unions
Explanation:Syndicates, unions or collective agreements can regulate a number of aspectswith regards to the work relationship between the company owner and theemployees such as wages, work hours, training, health and safety in theworkplace, extra hours or the right to take part in company affairs. It is a basichuman right as well as the employee's essential right. These can be companyagreements, national agreements for each species, even employee, producer,national or international syndicates, etc. The sector should be organized withregards to labour rights and improving them.
Data source:Companies will provide this information to the relevant administration on a yearlybasis.
The calculation of the indicator consists of three steps: Representation of theworker's rights, the existence of collective agreements, to see if they are sufficientor not.
95
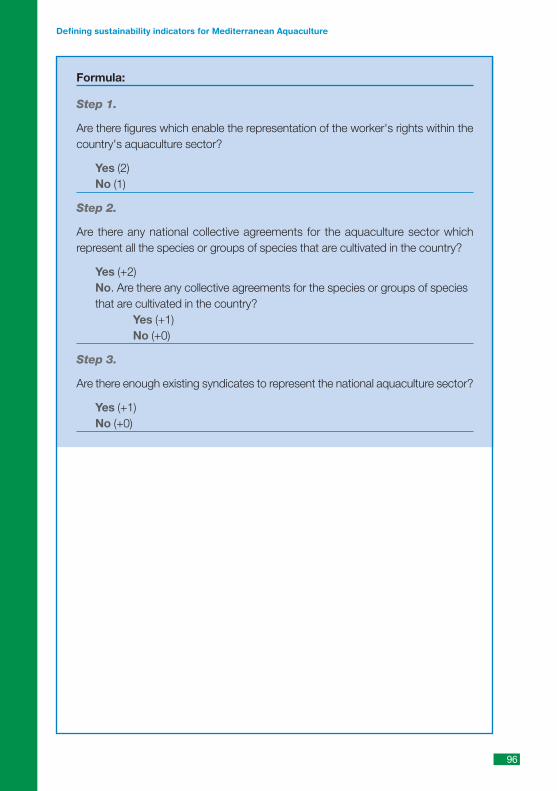
Formula:
Step 1.
Are there figures which enable the representation of the worker's rights within thecountry's aquaculture sector?
Yes (2) No (1)
Step 2.
Are there any national collective agreements for the aquaculture sector whichrepresent all the species or groups of species that are cultivated in the country?
Yes (+2) No. Are there any collective agreements for the species or groups of speciesthat are cultivated in the country?
Yes (+1) No (+0)
Step 3.
Are there enough existing syndicates to represent the national aquaculture sector?
Yes (+1) No (+0)
96
Defining sustainability indicators for Mediterranean Aquaculture
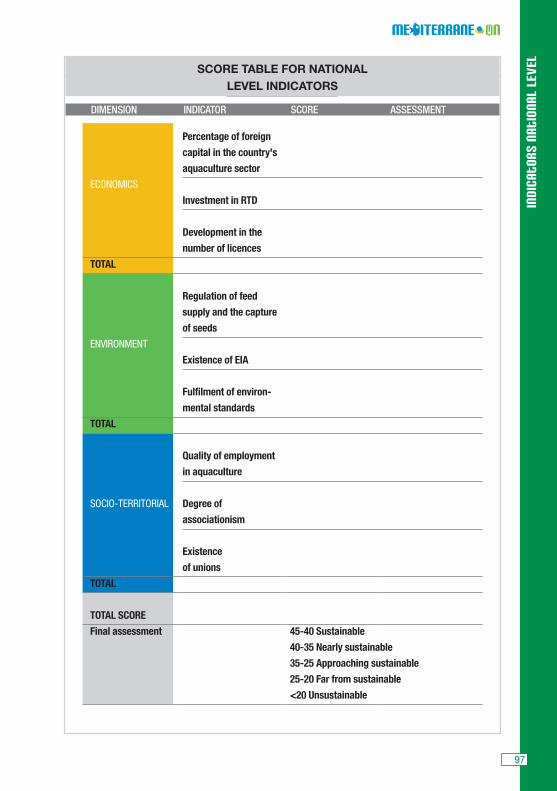
Indi
cato
rs n
atio
nal
leve
l
97
SCORE TABLE FOR NATIONAL LEVEL INDICATORS
DIMENSION INDICATOR SCORE ASSESSMENT
ECONOMICS
TOTAL
ENVIRONMENT
TOTAL
SOCIO-TERRITORIAL
TOTAL
TOTAL SCORE
Final assessment
Percentage of foreign
capital in the country's
aquaculture sector
Investment in RTD
Development in the
number of licences
Regulation of feed
supply and the capture
of seeds
Existence of EIA
Fulfilment of environ-
mental standards
Quality of employment
in aquaculture
Degree of
associationism
Existence
of unions
45-40 Sustainable
40-35 Nearly sustainable
35-25 Approaching sustainable
25-20 Far from sustainable
<20 Unsustainable

Defining sustainability indicators for Mediterranean Aquaculture
98
4 Indicators of sustainability at a Mediterranean level
Introduction
The identification and definition of the indicators on a Mediterranean level has been verychallenging due to the particular complexity of the region and high diversity of species,which are cultivated in it.
A number of similar practices and activities merge in the Mediterranean, also sharing anumber of problems which affect aquaculture. Despite this, there is a big difference in thelevel of development of aquaculture in the different countries. in this study and more so inkey aspects of that development such as administrative and legislative activity regulation,or access to contrasted and updated information related to the sector.
Some general observations in this analysis can be made; to the north of the Mediterraneanregion aquaculture is subjected to a complex and sometimes excessive legislative system,which is mainly because these countries belong to the EU. In the South, as there is nobody or entity to unite the different countries which make up this area, there are multiplelegislative frameworks for each country which prevent or hinder the identification ofdevelopment requirements within the sector as well as the adoption of sustainabledevelopment strategies in the sector. This imbalance in socio-economic and environmentaldevelopment makes it difficult to find common indicators which enable a sustainableassessment of aquaculture in the region.
Despite this, three indicators have been defined and developed for this level: one for eachdimension. In order to try to complete this list, a second table has been included at the endof this appendix with indicators which have been defined but because of theaforementioned factors have not been completely developed.
The results obtained in the proposed indicators will be able to be used both as acomparison with other parts of the world (Caribbean, Southeast Asia, etc.), following asituation report on the regions through calculation or by obtaining the indicators and as astarting point to assess the situation and development of aquaculture sustainability in theMediterranean region. The results obtained from the indicators on a country level can beused in many ways -not only as a comparison with other countries but also with regions,north-south and east-west.
All the indicators have a total number of 5 points, with 5 Sustainable, 4 Nearly sustainable,3 Approaching sustainable, 2 Far from sustainable and 1 Unsustainable.
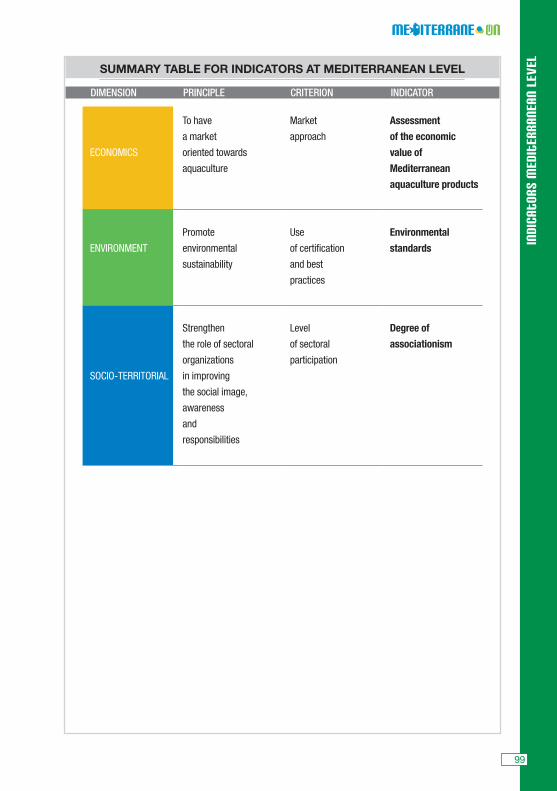
Indi
cato
rs m
edit
erra
nean
lev
el
99
SUMMARY TABLE FOR INDICATORS AT MEDITERRANEAN LEVEL
DIMENSION PRINCIPLE CRITERION INDICATOR
ECONOMICS
ENVIRONMENT
SOCIO-TERRITORIAL
To have
a market
oriented towards
aquaculture
Promote
environmental
sustainability
Strengthen
the role of sectoral
organizations
in improving
the social image,
awareness
and
responsibilities
Market
approach
Use
of certification
and best
practices
Level
of sectoral
participation
Assessment
of the economic
value of
Mediterranean
aquaculture products
Environmental
standards
Degree of
associationism
INTRODUCTION TO THE NEED FOR GOVERNANCE INDICATORS IN AQUACULTURE
Rosa Chapela PérezMarine Technology Centre (CETMAR)
Spain
Establishing governance indicators in aquaculture management and, specifically, in theselection and planning processes of areas for the activity, will help in determining a legalsafety level which will enable promoters to start their aquaculture businesses, as well asdetermining a level of good aquaculture governance or regulation as an economic, socialand environmental regulation authority. The indicators will contribute to the monitoringand validation mechanisms of public policies which affect aquaculture, with the help ofpublic and private agents in the framework of good governance.
Governance and governability go hand in hand. There has been much research andanalysis in the sociology and politics field which has differentiated them in the 1970s. Theterm “governability” refers to the government processes and systems within the Stateframework and its institutions in decision making and outlining public policies in theframework of a vertical scheme in a state/ citizen relationship. Meanwhile, the“Governance” concept involves a horizontal relationship between diversity of public andprivate actors to improve public policy decision making, management and developmentprocesses, bearing in mind negotiation, integration and interrelation processes.1
Governance defined as the establishment of public and private interaction which is createdto resolve social problems and create social opportunities, would aid the institutions'governability and make it more effective.
Since its first years of development, aquaculture has been better identified with the“governability” concept, as it has been regulated by public administrations, establishingprocedures and adopting public policies for aquaculture without the participation of agentsor private organizations. Good governability has for years been limited to determining alevel of elaboration of regulations in an institutional or State field and guaranteeing legalsafety for any aquaculture promoter and other coastal interests.
But technical and technological progress and a greater complexity of social processes havemade traditional systems of public management insufficient or inoperable. This is where theneed for governance backup comes in. Over time, aquaculture has become a technically,
100
Defining sustainability indicators for Mediterranean Aquaculture
1 Vid. Elkin Velásquez Governability and governance of citizen security. Towards a functional proposal, local governmentconsolidation international seminar for citizen security, training and experience, Florence 2006.
Indi
cato
rs m
edit
erra
nean
lev
elsocially and environmentally complex activity, creating a series of conditions for itsdevelopment which traditional public management would struggle to deal with alone. Weneed to bring in social agents to participate who are directly or indirectly related toaquaculture: Entrust the management to participating social agents (companies,associations, interest groups…) and to public institutions with aquaculture abilities which,by clearly defining their interactions and relations, will enable their conflicts to be resolvedin a more efficient and versatile manner.
In short, the hierarchical management systems must be replaced by new forms of regulationbased on negotiation, participation and coordination, even auto regulation - as seen in thesector's adoption of codes of conduct, UNE, ISO, etc., - in which those responsible for thepolicies try to manage public and private agents. The legal-administrative system tends toget divided and generate participation networks as a result of society's transformations. Soaquaculture must let private agents, public organizations, NGOs, pressure groups, etc.participate as they have a lot to say in this sector. Governance constitutes a new policystrategy aimed at guaranteeing society governability and to maintain legitimacy within theinstitutions in exchange for the transfer of political authority to the economic and socialauthors.2
This goal can only be reached with the implementation of good governance in aquaculturewhich includes all agents involved - companies, producer organizations (POs), auxiliarycompanies, NGOs- in making decisions, elaborating processes or procedures, in selectingand planning spaces, etc. By participating they could have a bearing on the definition andimplementation of politics which have an impact on aquaculture; collectively decide whatthe main and common problems are for aquaculture development and how they shouldbe dealt with; and, finally, that these public and private agents jointly monitor and assessthe impact of these policies on aquaculture.
Previously, the Administration established these social and economic aspects. Companiesadapted to them. Now it is society and the market who establish their own requirements andthese have to be contemplated in the regulation. Both local and national politics are moredemanding with social and environmental aspects. Since 2002 there has been a need tostrengthen governance in Europe. The White Paper on European Governance (2001)confirms this, “open up the Union's decision making procedures to allow citizens toparticipate in making decisions which concern them, which would translate into greatertransparency and greater accountability”. This would show citizens how governments areable to efficiently respond to their concerns.
101
2 Frances Morata “Multilevel Governance in the EU”, VII International congress of CLAD on State and PublicAdministration Reform Lisbon 8-11 October 2002.
And specifically in aquaculture, the Strategy for Sustainable Aquaculture Development inEurope [(COM2002) 501final], has expressed the need to “improve governance” inaquaculture through “greater participation in decision making by the agents involved.Likewise, self-regulation and voluntary agreements should be encouraged, as a code of bestpractice and good conduct. The same could be said of the introduction of communitymanagement and environmental audit schemes (EMAS) to the aquaculture system”. Morerecently the European Commission's “Building a sustainable future for aquaculture. Newimpetus to the sustainable development of European aquaculture” insists on the need toimprove “governance conditions” in aquaculture, with special emphasis on “consultingwith stakeholders for an enhanced image of the companies within the sector”. Although itdoes highlight that it is the national authorities, “who will have an essential role indesigning aquaculture development in their area”.3
This new document aims at:
• Improving the implementation of EU legislation• Reducing the administrative burden• Ensuring that both fishermen and national administrators have access to the
information they need in a clear and understandable manner• Guaranteeing suitable monitoring of the aquaculture sector
Finally, the state and development of aquaculture in a specific area can be improved if itslegislation works efficiently, if it is balanced.
102
Defining sustainability indicators for Mediterranean Aquaculture
3 Communication from the Commission to the European Council and European Parliament [COM (2009) 162 final], 8th April2009.
Indi
cato
rs m
edit
erra
nean
lev
elTHE IMPORTANCE OF LEGISLATION AND GOVERNANCE IN AQUACULTURE DEVELOPMENT
Fernando Otero LouridoSpanish Association of Marine Fish Farmers (APROMAR)
Spain
It is common knowledge that aquaculture has to occupy a public domain and areas ofrestricted use, competing with other activities which also interact with the environment; itis subjected to complex license restrictions; it produces and sells fresh products; and operatesin a very structured market, coveted by countries with negligible legislation and costs. It istherefore a vulnerable activity in need of legislation.
However, this is unsatisfactory and counterproductive: an abundance of confusing, vague,illogical and void laws; slow and uncertain administrative processes; renunciation of theprinciple of equal opportunities with non-EU countries - and some EU ones- whichsometimes benefit from unfairly favourable production conditions and public aid; andconsequent annulment of the basis of competition law (so well protected in other aspects ofthe native marine industry).
And that is not all: Such legislative magma has to be implemented by undefined authoritiesreluctant to commit to an industry which has its development blocked when it comes to theneed for consistent legislation in key aspects - suitable sites, an efficient market organizationand 'level playing field'.
Unsatisfactory legislation, indecisive administrations. Result: Confinement to inadequateinfrastructures (which disheartens the more dynamic sub-sectors and leads them tooutsource some excellent projects), and the perpetuation of a chronic crisis for those lessfortunate, which is in part due to weak legislation relating to certain imports.
Therefore, good planning and solid development are essential. In exchange we offerenvironmental, economic and social sustainability. A two way street, marked byconsecutive milestones: 1) an initial, realistic estimate of the size of the sector (currentstrength and the medium/ long term growth possibilities); 2) eco-systematic selection ofsuitable sites, prior to assessment of surrounding ecosystem's carrying capacity; 3)implementation of the necessary legislation for its development - according to the threesustainable aspects- and 4) decisive implementation without hesitation. - This is the key tothe future of this sector.
103
Planning is, therefore, the first step. It must start with a good outlook for the future as a basefor the subsequent and proportional granting of ideal aquaculture sites through preciselocalization research and legislative coverage, which takes us from coastal legislation tospecific sectoral planning and projects. But it is not the only step: It will be of little use if isnot followed up with secure and decisive development.
Therefore, in order to face up to the sector's bigger problems, European aquaculture needstwo things: Constructive legislation which aids reasonable development and a direction forthe process, based on a well-founded and objective knowledge of the activity, in agreementwith the sector with a view to a society without complexes or false prejudices. This alsoimplies clarity of ideas and policies and efficient administrative management. In otherwords, good governance.
A coordinated, transversal and efficient public management in aquaculture is a basicsupposition for an encouraging future. Because from a business perspective, governance isjust that, a symbol of confidence: Confidence in the 'administrative viability' of investment,as the first step towards legislation which is globally inclined towards the viable and efficientdevelopment of the European aquaculture sector.
And this is decisive: it determines everything from the beginning. When you think that withsome species, the engineering project alone can cost one hundred thousand Euros; and withall of them, the resulting investment and employment depend on separate decisions madeby various agencies that know nothing about aquaculture. This is why we must appeal forthe coordination of three terms (laws, political decisions, bureaucracy) and theclarification of ideas on the administration side: The investor needs to know beforehand ifhis project is going to be authorized, when, with what environmental requirements and atwhat cost and repayment period. And he also needs to be able to decisively take part in theprocess, as an ever more essential supplier of a fundamental product in society and not asan uncomfortable participant.
This is not possible without good governance: it is important that the administrations assessthe sector and join us in planning for our space, but it is even more important that they putthe means in place for its development, which solidly supports a coordinated andtransversal course of action in quality administration, in support of the business initiative.A course which concerns each project, each body, each report and each paper. Which givesor withdraws safety and therefore investment and development which is being ever soevasive.
104
Defining sustainability indicators for Mediterranean Aquaculture
Indi
cato
rs m
edit
erra
nean
lev
el
105
In its absence it is obvious that this sector “…is not developing its creative wealth andemployment potential…, the national authorities must become aware of this and establishtheir own appropriate framework” (1), which should “…include specific conditions foraquaculture, with environmental legislation specifically for aquaculture…, designating afisheries authority to act as the relevant entity for environmental assessment issues” (2). Inthis context, “the main challenge for the legislators is the development of an administrativeand legal environment for the development of aquaculture which contributes to theexpansion of this activity to its full potential” (3).
It is not us saying it: The three citations that define governance under the coordination offishery authorities and the need for an ideal legislative framework for the development ofaquaculture, come from recent documents from, none other than, the European Economicand Social Committee (1), the European Parliament (2) and from the FAO (3).
With such respectable company, it is amazing that we are still stuck in an inefficient legalframework and prisoners of the administration's indecisiveness. The necessary governancemust know and understand aquaculture, take it as its own and guarantee its deservedright to the responsible co-use of public marine resources and establish the foundationswhich bring about the consolidation of a solid and viable national European aquaculturesector. Without further delay, as we are in injury time.
(1) Report n° 445 European Social and Economic Committee EESC, “Building a sustainable future for European aquacul-ture” - NAT Commission, Section for Agriculture, Rural Development and Environment, Vigo. -Brussels 28/04/2010 [avail-able at www.eesc.europa.eu/index_es.asp].-(2) “Regulatory and Legal Constraints for European Aquaculture” Study, Directorate General for Internal Policies, EuropeanParliament.-Brussels, 2009 [at http://www.europarl.europa.eu/studies].-(3) FAO/Fisheries: “The state of world Fisheries and Aquaculture” (Sofia - 2008).
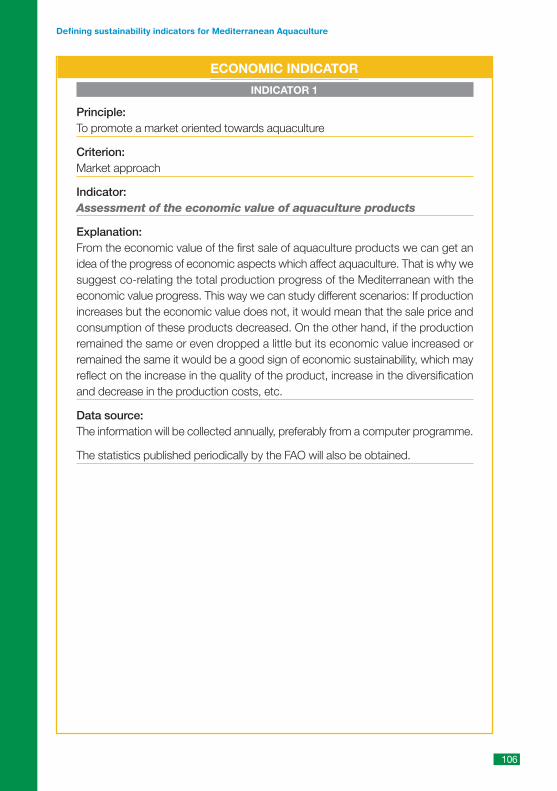
106
Defining sustainability indicators for Mediterranean Aquaculture
ECONOMIC INDICATOR
INDICATOR 1
Principle: To promote a market oriented towards aquaculture
Criterion: Market approach
Indicator: Assessment of the economic value of aquaculture products
Explanation:From the economic value of the first sale of aquaculture products we can get anidea of the progress of economic aspects which affect aquaculture. That is why wesuggest co-relating the total production progress of the Mediterranean with theeconomic value progress. This way we can study different scenarios: If productionincreases but the economic value does not, it would mean that the sale price andconsumption of these products decreased. On the other hand, if the productionremained the same or even dropped a little but its economic value increased orremained the same it would be a good sign of economic sustainability, which mayreflect on the increase in the quality of the product, increase in the diversificationand decrease in the production costs, etc.
Data source:The information will be collected annually, preferably from a computer programme.
The statistics published periodically by the FAO will also be obtained.
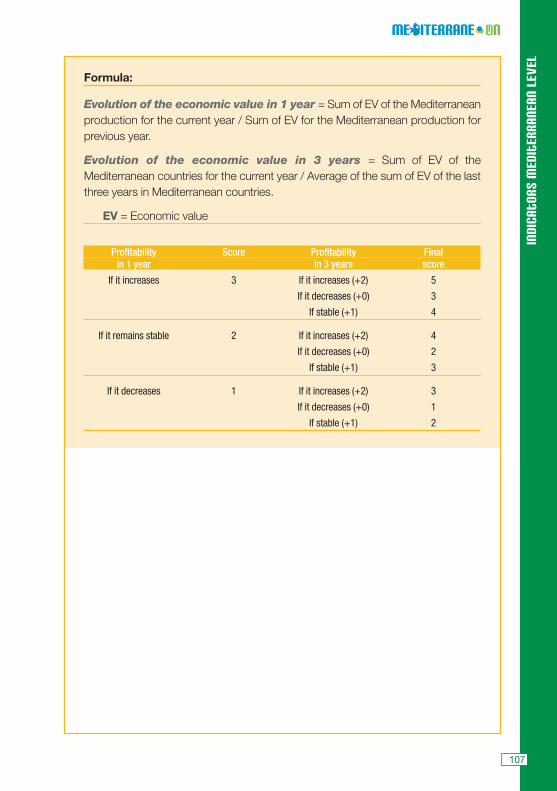
Indi
cato
rs m
edit
erra
nean
lev
el
Formula:
Evolution of the economic value in 1 year = Sum of EV of the Mediterraneanproduction for the current year / Sum of EV for the Mediterranean production forprevious year.
Evolution of the economic value in 3 years = Sum of EV of theMediterranean countries for the current year / Average of the sum of EV of the lastthree years in Mediterranean countries.
EV = Economic value
Profitability Score Profitability Final in 1 year in 3 years score
If it increases 3 If it increases (+2) 5
If it decreases (+0) 3
If stable (+1) 4
If it remains stable 2 If it increases (+2) 4
If it decreases (+0) 2
If stable (+1) 3
If it decreases 1 If it increases (+2) 3
If it decreases (+0) 1
If stable (+1) 2
107
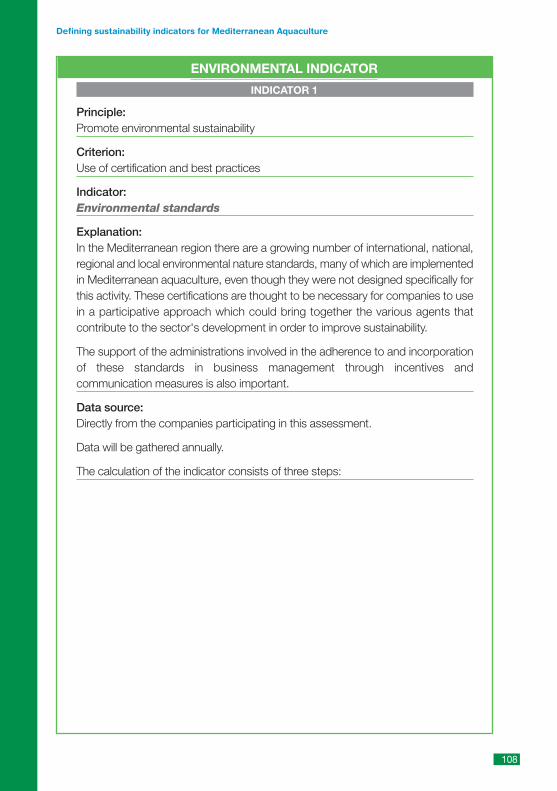
ENVIRONMENTAL INDICATOR
INDICATOR 1
Principle: Promote environmental sustainability
Criterion: Use of certification and best practices
Indicator: Environmental standards
Explanation:In the Mediterranean region there are a growing number of international, national,regional and local environmental nature standards, many of which are implementedin Mediterranean aquaculture, even though they were not designed specifically forthis activity. These certifications are thought to be necessary for companies to usein a participative approach which could bring together the various agents thatcontribute to the sector's development in order to improve sustainability.
The support of the administrations involved in the adherence to and incorporationof these standards in business management through incentives andcommunication measures is also important.
Data source:Directly from the companies participating in this assessment.
Data will be gathered annually.
The calculation of the indicator consists of three steps:
108
Defining sustainability indicators for Mediterranean Aquaculture
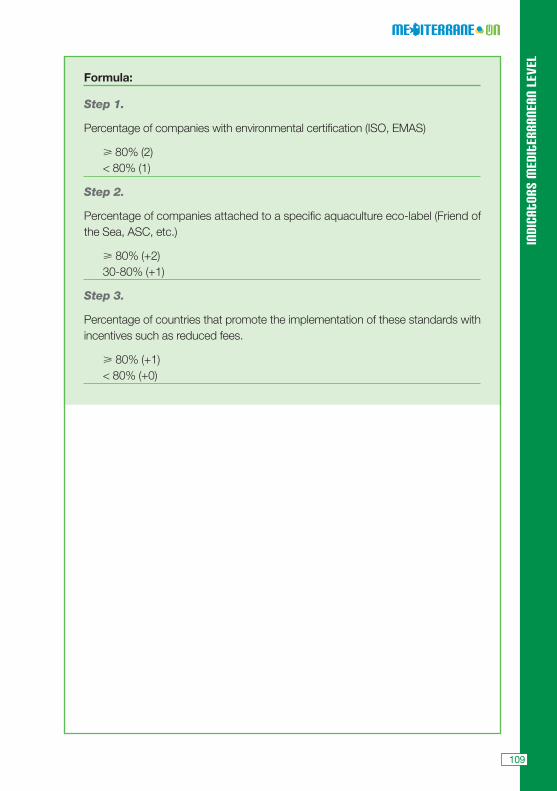
Indi
cato
rs m
edit
erra
nean
lev
el
Formula:
Step 1.
Percentage of companies with environmental certification (ISO, EMAS)
� 80% (2) < 80% (1)
Step 2.
Percentage of companies attached to a specific aquaculture eco-label (Friend ofthe Sea, ASC, etc.)
� 80% (+2) 30-80% (+1)
Step 3.
Percentage of countries that promote the implementation of these standards withincentives such as reduced fees.
� 80% (+1) < 80% (+0)
109
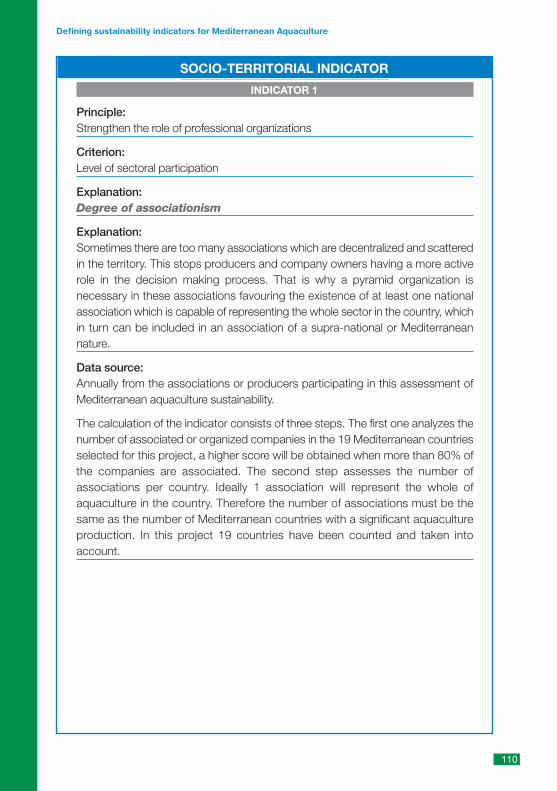
SOCIO-TERRITORIAL INDICATOR
INDICATOR 1
Principle: Strengthen the role of professional organizations
Criterion: Level of sectoral participation
Explanation: Degree of associationism
Explanation: Sometimes there are too many associations which are decentralized and scatteredin the territory. This stops producers and company owners having a more activerole in the decision making process. That is why a pyramid organization isnecessary in these associations favouring the existence of at least one nationalassociation which is capable of representing the whole sector in the country, whichin turn can be included in an association of a supra-national or Mediterraneannature.
Data source:Annually from the associations or producers participating in this assessment ofMediterranean aquaculture sustainability.
The calculation of the indicator consists of three steps. The first one analyzes thenumber of associated or organized companies in the 19 Mediterranean countriesselected for this project, a higher score will be obtained when more than 80% ofthe companies are associated. The second step assesses the number ofassociations per country. Ideally 1 association will represent the whole ofaquaculture in the country. Therefore the number of associations must be thesame as the number of Mediterranean countries with a significant aquacultureproduction. In this project 19 countries have been counted and taken intoaccount.
110
Defining sustainability indicators for Mediterranean Aquaculture
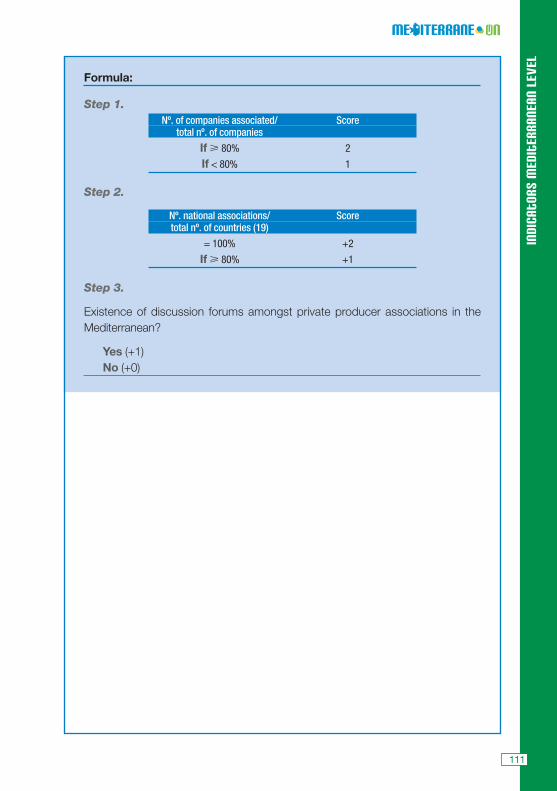
Indi
cato
rs m
edit
erra
nean
lev
el
Formula:
Step 1.Nº. of companies associated/ Score
total nº. of companies
If � 80% 2
If < 80% 1
Step 2.
Nº. national associations/ Scoretotal nº. of countries (19)
= 100% +2
If � 80% +1
Step 3.
Existence of discussion forums amongst private producer associations in theMediterranean?
Yes (+1) No (+0)
111
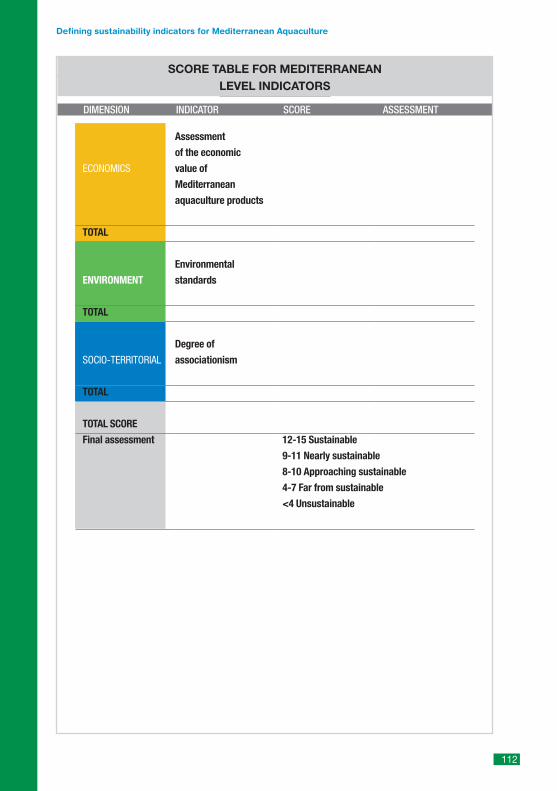
112
Defining sustainability indicators for Mediterranean Aquaculture
SCORE TABLE FOR MEDITERRANEAN LEVEL INDICATORS
DIMENSION INDICATOR SCORE ASSESSMENT
ECONOMICS
TOTAL
ENVIRONMENT
TOTAL
SOCIO-TERRITORIAL
TOTAL
TOTAL SCORE
Final assessment
Assessment
of the economic
value of
Mediterranean
aquaculture products
Environmental
standards
Degree of
associationism
12-15 Sustainable
9-11 Nearly sustainable
8-10 Approaching sustainable
4-7 Far from sustainable
<4 Unsustainable
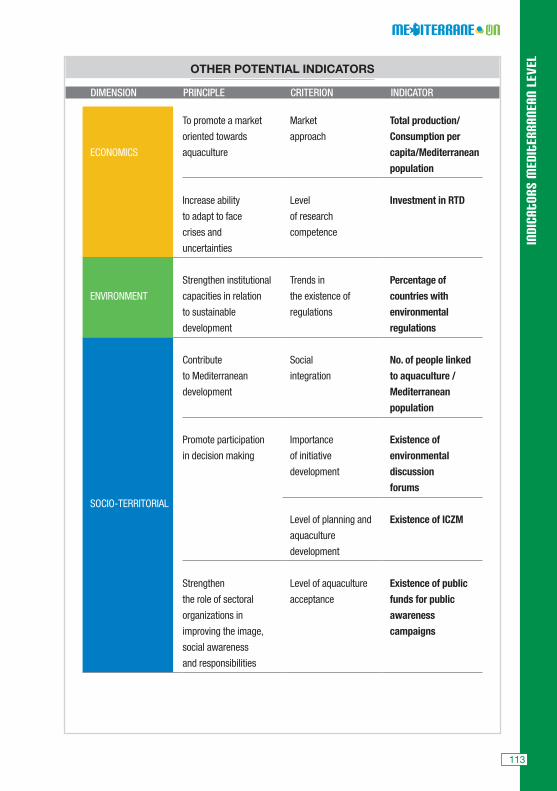
Indi
cato
rs m
edit
erra
nean
lev
el
113
OTHER POTENTIAL INDICATORS
DIMENSION PRINCIPLE CRITERION INDICATOR
ECONOMICS
ENVIRONMENT
SOCIO-TERRITORIAL
To promote a market
oriented towards
aquaculture
Increase ability
to adapt to face
crises and
uncertainties
Strengthen institutional
capacities in relation
to sustainable
development
Contribute
to Mediterranean
development
Promote participation
in decision making
Strengthen
the role of sectoral
organizations in
improving the image,
social awareness
and responsibilities
Market
approach
Level
of research
competence
Trends in
the existence of
regulations
Social
integration
Importance
of initiative
development
Level of planning and
aquaculture
development
Level of aquaculture
acceptance
Total production/
Consumption per
capita/Mediterranean
population
Investment in RTD
Percentage of
countries with
environmental
regulations
No. of people linked
to aquaculture /
Mediterranean
population
Existence of
environmental
discussion
forums
Existence of ICZM
Existence of public
funds for public
awareness
campaigns
APPENDICES
115
APPE
NDIX
1
Records for Mediterranean countriesThe information included in these reports has been developed using public informationavailable in the databases of the United Nation's Fisheries and Aquaculture Departmentfor Food and Agriculture (FAO). This information has been updated and contrasted with thereport: Regional synthesis of the Mediterranean aquaculture (MedAquaMarket). Barazi-Yeroulanos, Developed by the General Fisheries Commission for the Mediterranean.
For more information please visit:
http://www.fao.org/fishery/naso/search/es
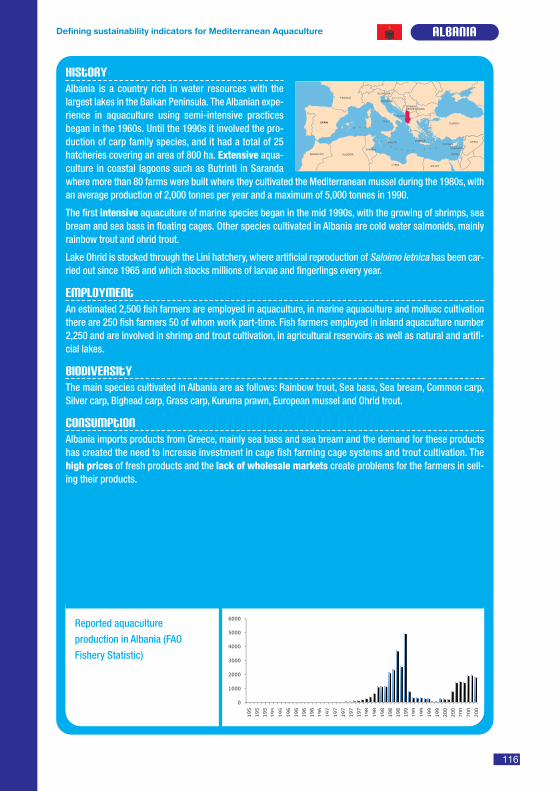
HistoryAlbania is a country rich in water resources with thelargest lakes in the Balkan Peninsula. The Albanian expe-rience in aquaculture using semi-intensive practicesbegan in the 1960s. Until the 1990s it involved the pro-duction of carp family species, and it had a total of 25hatcheries covering an area of 800 ha. Extensive aqua-culture in coastal lagoons such as Butrinti in Sarandawhere more than 80 farms were built where they cultivated the Mediterranean mussel during the 1980s, withan average production of 2,000 tonnes per year and a maximum of 5,000 tonnes in 1990.
The first intensive aquaculture of marine species began in the mid 1990s, with the growing of shrimps, seabream and sea bass in floating cages. Other species cultivated in Albania are cold water salmonids, mainlyrainbow trout and ohrid trout.
Lake Ohrid is stocked through the Lini hatchery, where artificial reproduction of Saloimo letnica has been car-ried out since 1965 and which stocks millions of larvae and fingerlings every year.
EmploymentAn estimated 2,500 fish farmers are employed in aquaculture, in marine aquaculture and mollusc cultivationthere are 250 fish farmers 50 of whom work part-time. Fish farmers employed in inland aquaculture number2,250 and are involved in shrimp and trout cultivation, in agricultural reservoirs as well as natural and artifi-cial lakes.
BiodiversityThe main species cultivated in Albania are as follows: Rainbow trout, Sea bass, Sea bream, Common carp,Silver carp, Bighead carp, Grass carp, Kuruma prawn, European mussel and Ohrid trout.
ConsumptionAlbania imports products from Greece, mainly sea bass and sea bream and the demand for these productshas created the need to increase investment in cage fish farming cage systems and trout cultivation. Thehigh prices of fresh products and the lack of wholesale markets create problems for the farmers in sell-ing their products.
116
Defining sustainability indicators for Mediterranean Aquaculture ALBANIA
Reported aquaculture
production in Albania (FAO
Fishery Statistic)
�
����
����
����
����
���
���
���
���
���
��
��
��
��
��
��
��
��
��
��
���
���
���
���
���
���
���
���
���
���
���
���
���
���
���
����
���
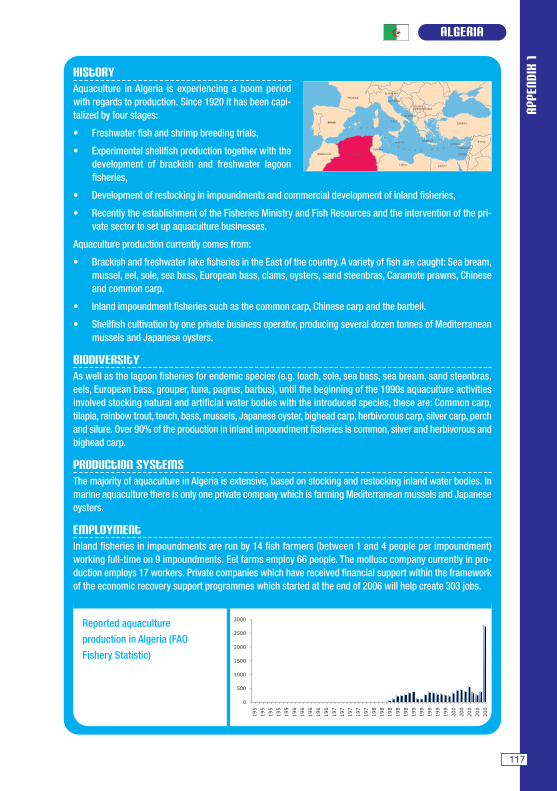
APPE
NDIX
1
ALGERIA
Reported aquaculture
production in Algeria (FAO
Fishery Statistic)
�
���
����
����
����
����
����
���
���
���
���
���
��
��
��
��
��
��
��
��
��
��
���
���
���
���
���
���
���
���
���
���
���
���
���
���
���
HistoryAquaculture in Algeria is experiencing a boom periodwith regards to production. Since 1920 it has been capi-talized by four stages:
• Freshwater fish and shrimp breeding trials,
• Experimental shellfish production together with thedevelopment of brackish and freshwater lagoonfisheries,
• Development of restocking in impoundments and commercial development of inland fisheries,
• Recently the establishment of the Fisheries Ministry and Fish Resources and the intervention of the pri-vate sector to set up aquaculture businesses.
Aquaculture production currently comes from:
• Brackish and freshwater lake fisheries in the East of the country. A variety of fish are caught: Sea bream,mussel, eel, sole, sea bass, European bass, clams, oysters, sand steenbras, Caramote prawns, Chineseand common carp.
• Inland impoundment fisheries such as the common carp, Chinese carp and the barbell.
• Shellfish cultivation by one private business operator, producing several dozen tonnes of Mediterraneanmussels and Japanese oysters.
BiodiversityAs well as the lagoon fisheries for endemic species (e.g. loach, sole, sea bass, sea bream, sand steenbras,eels, European bass, grouper, tuna, pagrus, barbus), until the beginning of the 1990s aquaculture activitiesinvolved stocking natural and artificial water bodies with the introduced species, these are: Common carp,tilapia, rainbow trout, tench, bass, mussels, Japanese oyster, bighead carp, herbivorous carp, silver carp, perchand silure. Over 90% of the production in inland impoundment fisheries is common, silver and herbivorous andbighead carp.
Production systemsThe majority of aquaculture in Algeria is extensive, based on stocking and restocking inland water bodies. Inmarine aquaculture there is only one private company which is farming Mediterranean mussels and Japaneseoysters.
EmploymentInland fisheries in impoundments are run by 14 fish farmers (between 1 and 4 people per impoundment)working full-time on 9 impoundments. Eel farms employ 66 people. The mollusc company currently in pro-duction employs 17 workers. Private companies which have received financial support within the frameworkof the economic recovery support programmes which started at the end of 2006 will help create 303 jobs.
117
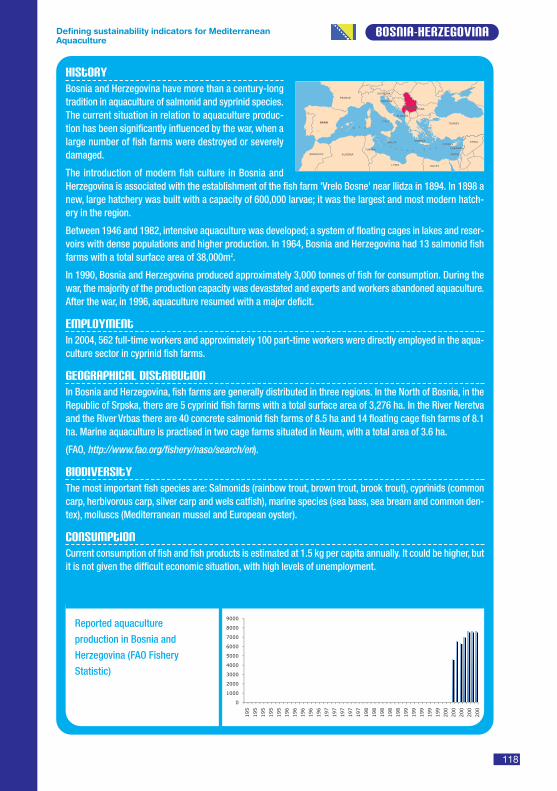
BOSNIA-HERZEGOVINA
Reported aquaculture
production in Bosnia and
Herzegovina (FAO Fishery
Statistic)
�
����
����
����
����
����
���
���
����
����
���
���
���
���
���
��
��
��
��
��
��
��
��
��
��
���
���
���
���
���
���
���
���
���
���
���
���
���
���
���
HistoryBosnia and Herzegovina have more than a century-longtradition in aquaculture of salmonid and syprinid species.The current situation in relation to aquaculture produc-tion has been significantly influenced by the war, when alarge number of fish farms were destroyed or severelydamaged.
The introduction of modern fish culture in Bosnia andHerzegovina is associated with the establishment of the fish farm 'Vrelo Bosne' near Ilidza in 1894. In 1898 anew, large hatchery was built with a capacity of 600,000 larvae; it was the largest and most modern hatch-ery in the region.
Between 1946 and 1982, intensive aquaculture was developed; a system of floating cages in lakes and reser-voirs with dense populations and higher production. In 1964, Bosnia and Herzegovina had 13 salmonid fishfarms with a total surface area of 38,000m2.
In 1990, Bosnia and Herzegovina produced approximately 3,000 tonnes of fish for consumption. During thewar, the majority of the production capacity was devastated and experts and workers abandoned aquaculture.After the war, in 1996, aquaculture resumed with a major deficit.
EmploymentIn 2004, 562 full-time workers and approximately 100 part-time workers were directly employed in the aqua-culture sector in cyprinid fish farms.
Geographical distributionIn Bosnia and Herzegovina, fish farms are generally distributed in three regions. In the North of Bosnia, in theRepublic of Srpska, there are 5 cyprinid fish farms with a total surface area of 3,276 ha. In the River Neretvaand the River Vrbas there are 40 concrete salmonid fish farms of 8.5 ha and 14 floating cage fish farms of 8.1ha. Marine aquaculture is practised in two cage farms situated in Neum, with a total area of 3.6 ha.
(FAO, http://www.fao.org/fishery/naso/search/en).
BiodiversityThe most important fish species are: Salmonids (rainbow trout, brown trout, brook trout), cyprinids (commoncarp, herbivorous carp, silver carp and wels catfish), marine species (sea bass, sea bream and common den-tex), molluscs (Mediterranean mussel and European oyster).
ConsumptionCurrent consumption of fish and fish products is estimated at 1.5 kg per capita annually. It could be higher, butit is not given the difficult economic situation, with high levels of unemployment.
118
Defining sustainability indicators for Mediterranean Aquaculture
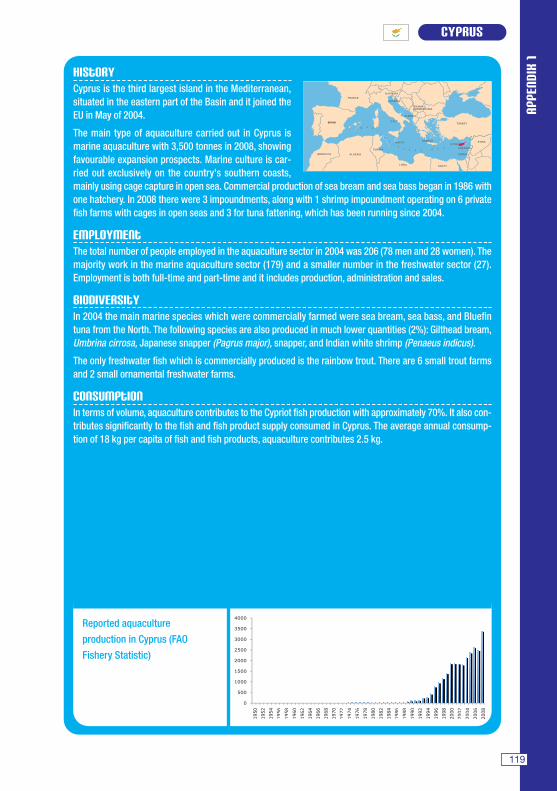
APPE
NDIX
1
CYPRUS
Reported aquaculture
production in Cyprus (FAO
Fishery Statistic)
�
���
����
����
����
����
����
����
����
����
����
����
���
����
���
���
���
��
���
���
���
���
��
���
����
����
����
���
����
����
����
����
���
����
����
����
����
���
����
HistoryCyprus is the third largest island in the Mediterranean,situated in the eastern part of the Basin and it joined theEU in May of 2004.
The main type of aquaculture carried out in Cyprus ismarine aquaculture with 3,500 tonnes in 2008, showingfavourable expansion prospects. Marine culture is car-ried out exclusively on the country's southern coasts,mainly using cage capture in open sea. Commercial production of sea bream and sea bass began in 1986 withone hatchery. In 2008 there were 3 impoundments, along with 1 shrimp impoundment operating on 6 privatefish farms with cages in open seas and 3 for tuna fattening, which has been running since 2004.
EmploymentThe total number of people employed in the aquaculture sector in 2004 was 206 (78 men and 28 women). Themajority work in the marine aquaculture sector (179) and a smaller number in the freshwater sector (27).Employment is both full-time and part-time and it includes production, administration and sales.
BiodiversityIn 2004 the main marine species which were commercially farmed were sea bream, sea bass, and Bluefintuna from the North. The following species are also produced in much lower quantities (2%): Gilthead bream,Umbrina cirrosa, Japanese snapper (Pagrus major), snapper, and Indian white shrimp (Penaeus indicus).
The only freshwater fish which is commercially produced is the rainbow trout. There are 6 small trout farmsand 2 small ornamental freshwater farms.
ConsumptionIn terms of volume, aquaculture contributes to the Cypriot fish production with approximately 70%. It also con-tributes significantly to the fish and fish product supply consumed in Cyprus. The average annual consump-tion of 18 kg per capita of fish and fish products, aquaculture contributes 2.5 kg.
119
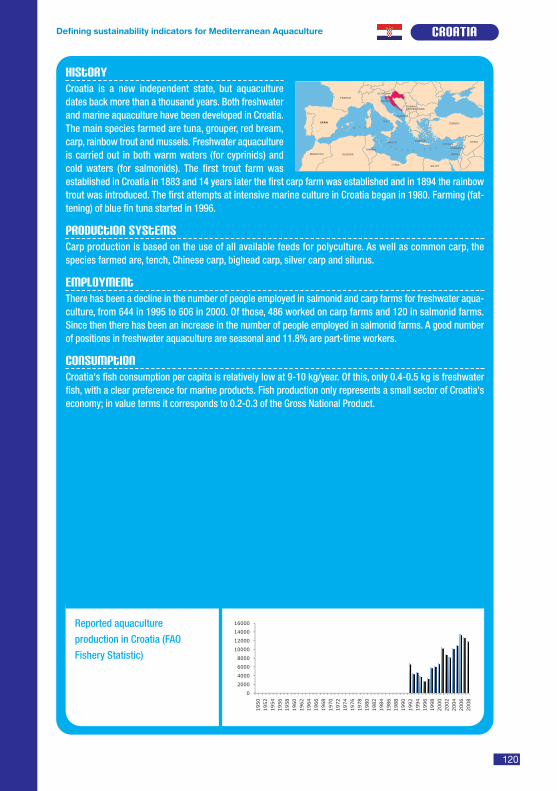
CROATIA
Reported aquaculture
production in Croatia (FAO
Fishery Statistic)
�
����
����
���
����
�����
�����
�����
����
����
����
����
���
����
���
���
���
��
���
���
���
���
��
���
����
����
����
���
����
����
����
����
���
����
����
����
����
���
����
HistoryCroatia is a new independent state, but aquaculturedates back more than a thousand years. Both freshwaterand marine aquaculture have been developed in Croatia.The main species farmed are tuna, grouper, red bream,carp, rainbow trout and mussels. Freshwater aquacultureis carried out in both warm waters (for cyprinids) andcold waters (for salmonids). The first trout farm wasestablished in Croatia in 1883 and 14 years later the first carp farm was established and in 1894 the rainbowtrout was introduced. The first attempts at intensive marine culture in Croatia began in 1980. Farming (fat-tening) of blue fin tuna started in 1996.
Production systemsCarp production is based on the use of all available feeds for polyculture. As well as common carp, thespecies farmed are, tench, Chinese carp, bighead carp, silver carp and silurus.
EmploymentThere has been a decline in the number of people employed in salmonid and carp farms for freshwater aqua-culture, from 644 in 1995 to 606 in 2000. Of those, 486 worked on carp farms and 120 in salmonid farms.Since then there has been an increase in the number of people employed in salmonid farms. A good numberof positions in freshwater aquaculture are seasonal and 11.8% are part-time workers.
ConsumptionCroatia's fish consumption per capita is relatively low at 9-10 kg/year. Of this, only 0.4-0.5 kg is freshwaterfish, with a clear preference for marine products. Fish production only represents a small sector of Croatia'seconomy; in value terms it corresponds to 0.2-0.3 of the Gross National Product.
120
Defining sustainability indicators for Mediterranean Aquaculture
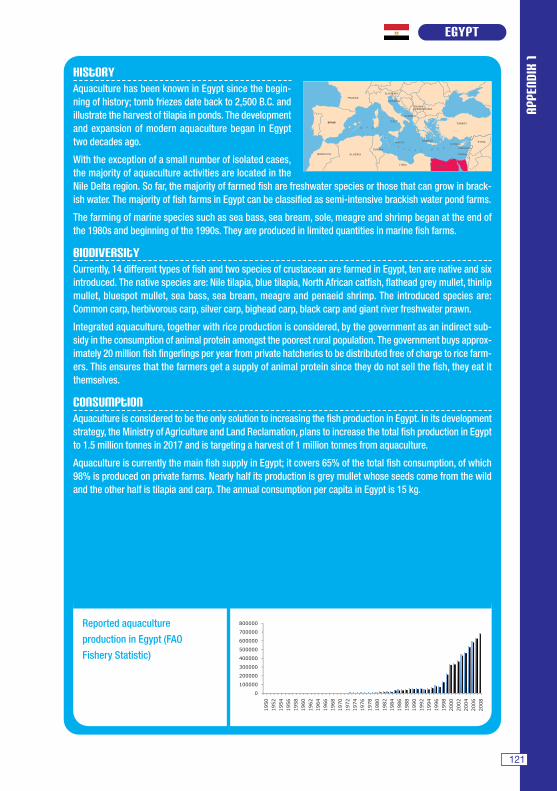
APPE
NDIX
1
EGYPT
Reported aquaculture
production in Egypt (FAO
Fishery Statistic)
�
������
������
������
������
������
�����
�����
������
����
����
����
���
����
���
���
���
��
���
���
���
���
��
���
����
����
����
���
����
����
����
����
���
����
����
����
����
���
����
HistoryAquaculture has been known in Egypt since the begin-ning of history; tomb friezes date back to 2,500 B.C. andillustrate the harvest of tilapia in ponds. The developmentand expansion of modern aquaculture began in Egypttwo decades ago.
With the exception of a small number of isolated cases,the majority of aquaculture activities are located in theNile Delta region. So far, the majority of farmed fish are freshwater species or those that can grow in brack-ish water. The majority of fish farms in Egypt can be classified as semi-intensive brackish water pond farms.
The farming of marine species such as sea bass, sea bream, sole, meagre and shrimp began at the end ofthe 1980s and beginning of the 1990s. They are produced in limited quantities in marine fish farms.
BiodiversityCurrently, 14 different types of fish and two species of crustacean are farmed in Egypt, ten are native and sixintroduced. The native species are: Nile tilapia, blue tilapia, North African catfish, flathead grey mullet, thinlipmullet, bluespot mullet, sea bass, sea bream, meagre and penaeid shrimp. The introduced species are:Common carp, herbivorous carp, silver carp, bighead carp, black carp and giant river freshwater prawn.
Integrated aquaculture, together with rice production is considered, by the government as an indirect sub-sidy in the consumption of animal protein amongst the poorest rural population. The government buys approx-imately 20 million fish fingerlings per year from private hatcheries to be distributed free of charge to rice farm-ers. This ensures that the farmers get a supply of animal protein since they do not sell the fish, they eat itthemselves.
ConsumptionAquaculture is considered to be the only solution to increasing the fish production in Egypt. In its developmentstrategy, the Ministry of Agriculture and Land Reclamation, plans to increase the total fish production in Egyptto 1.5 million tonnes in 2017 and is targeting a harvest of 1 million tonnes from aquaculture.
Aquaculture is currently the main fish supply in Egypt; it covers 65% of the total fish consumption, of which98% is produced on private farms. Nearly half its production is grey mullet whose seeds come from the wildand the other half is tilapia and carp. The annual consumption per capita in Egypt is 15 kg.
121
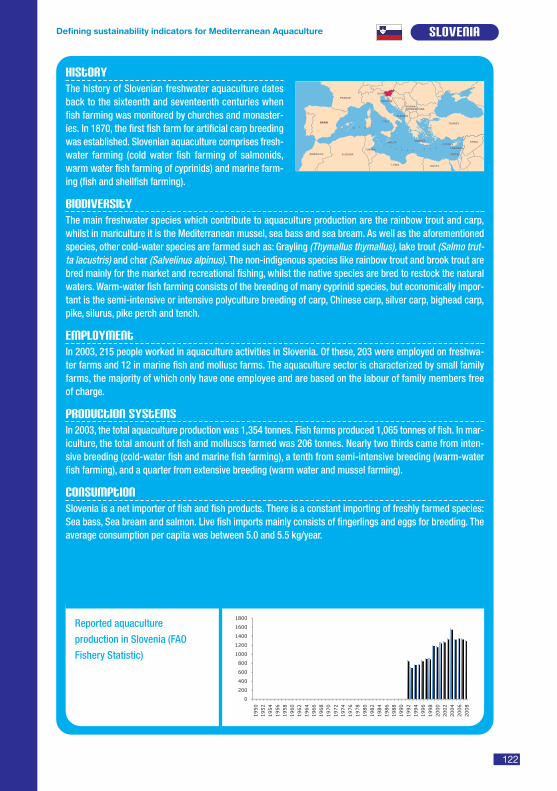
SLOVENIA
Reported aquaculture
production in Slovenia (FAO
Fishery Statistic)
�
���
���
��
���
����
����
����
���
����
����
����
����
���
����
���
���
���
��
���
���
���
���
��
���
����
����
����
���
����
����
����
����
���
����
����
����
����
���
����
HistoryThe history of Slovenian freshwater aquaculture datesback to the sixteenth and seventeenth centuries whenfish farming was monitored by churches and monaster-ies. In 1870, the first fish farm for artificial carp breedingwas established. Slovenian aquaculture comprises fresh-water farming (cold water fish farming of salmonids,warm water fish farming of cyprinids) and marine farm-ing (fish and shellfish farming).
BiodiversityThe main freshwater species which contribute to aquaculture production are the rainbow trout and carp,whilst in mariculture it is the Mediterranean mussel, sea bass and sea bream. As well as the aforementionedspecies, other cold-water species are farmed such as: Grayling (Thymallus thymallus), lake trout (Salmo trut-ta lacustris) and char (Salvelinus alpinus). The non-indigenous species like rainbow trout and brook trout arebred mainly for the market and recreational fishing, whilst the native species are bred to restock the naturalwaters. Warm-water fish farming consists of the breeding of many cyprinid species, but economically impor-tant is the semi-intensive or intensive polyculture breeding of carp, Chinese carp, silver carp, bighead carp,pike, silurus, pike perch and tench.
EmploymentIn 2003, 215 people worked in aquaculture activities in Slovenia. Of these, 203 were employed on freshwa-ter farms and 12 in marine fish and mollusc farms. The aquaculture sector is characterized by small familyfarms, the majority of which only have one employee and are based on the labour of family members freeof charge.
Production systemsIn 2003, the total aquaculture production was 1,354 tonnes. Fish farms produced 1,065 tonnes of fish. In mar-iculture, the total amount of fish and molluscs farmed was 206 tonnes. Nearly two thirds came from inten-sive breeding (cold-water fish and marine fish farming), a tenth from semi-intensive breeding (warm-waterfish farming), and a quarter from extensive breeding (warm water and mussel farming).
ConsumptionSlovenia is a net importer of fish and fish products. There is a constant importing of freshly farmed species:Sea bass, Sea bream and salmon. Live fish imports mainly consists of fingerlings and eggs for breeding. Theaverage consumption per capita was between 5.0 and 5.5 kg/year.
122
Defining sustainability indicators for Mediterranean Aquaculture
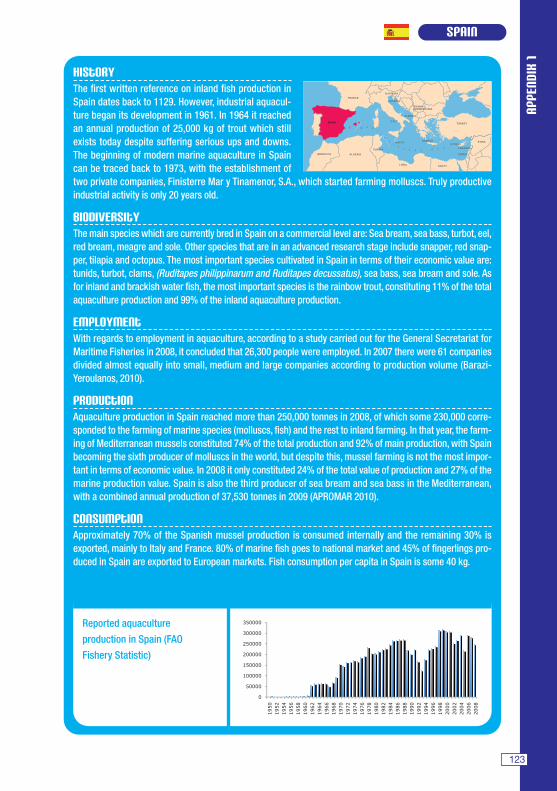
APPE
NDIX
1
SPAIN
Reported aquaculture
production in Spain (FAO
Fishery Statistic)
�
�����
������
������
������
������
������
������
����
����
����
���
����
���
���
���
��
���
���
���
���
��
���
����
����
����
���
����
����
����
����
���
����
����
����
����
���
����
HistoryThe first written reference on inland fish production inSpain dates back to 1129. However, industrial aquacul-ture began its development in 1961. In 1964 it reachedan annual production of 25,000 kg of trout which stillexists today despite suffering serious ups and downs.The beginning of modern marine aquaculture in Spaincan be traced back to 1973, with the establishment oftwo private companies, Finisterre Mar y Tinamenor, S.A., which started farming molluscs. Truly productiveindustrial activity is only 20 years old.
BiodiversityThe main species which are currently bred in Spain on a commercial level are: Sea bream, sea bass, turbot, eel,red bream, meagre and sole. Other species that are in an advanced research stage include snapper, red snap-per, tilapia and octopus. The most important species cultivated in Spain in terms of their economic value are:tunids, turbot, clams, (Ruditapes philippinarum and Ruditapes decussatus), sea bass, sea bream and sole. Asfor inland and brackish water fish, the most important species is the rainbow trout, constituting 11% of the totalaquaculture production and 99% of the inland aquaculture production.
EmploymentWith regards to employment in aquaculture, according to a study carried out for the General Secretariat forMaritime Fisheries in 2008, it concluded that 26,300 people were employed. In 2007 there were 61 companiesdivided almost equally into small, medium and large companies according to production volume (Barazi-Yeroulanos, 2010).
Production Aquaculture production in Spain reached more than 250,000 tonnes in 2008, of which some 230,000 corre-sponded to the farming of marine species (molluscs, fish) and the rest to inland farming. In that year, the farm-ing of Mediterranean mussels constituted 74% of the total production and 92% of main production, with Spainbecoming the sixth producer of molluscs in the world, but despite this, mussel farming is not the most impor-tant in terms of economic value. In 2008 it only constituted 24% of the total value of production and 27% of themarine production value. Spain is also the third producer of sea bream and sea bass in the Mediterranean,with a combined annual production of 37,530 tonnes in 2009 (APROMAR 2010).
ConsumptionApproximately 70% of the Spanish mussel production is consumed internally and the remaining 30% isexported, mainly to Italy and France. 80% of marine fish goes to national market and 45% of fingerlings pro-duced in Spain are exported to European markets. Fish consumption per capita in Spain is some 40 kg.
123
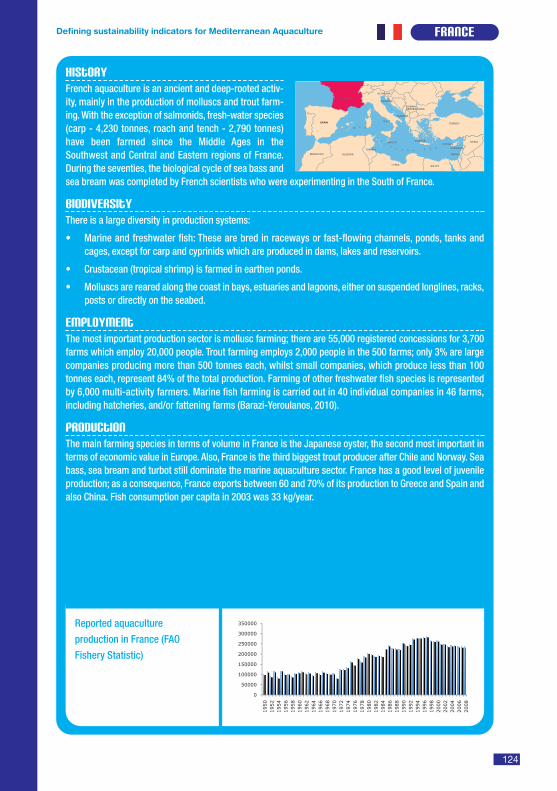
FRANCe
Reported aquaculture
production in France (FAO
Fishery Statistic)
�
�����
������
������
������
������
������
������
����
����
����
���
����
���
���
���
��
���
���
���
���
��
���
����
����
����
���
����
����
����
����
���
����
����
����
����
���
����
HistoryFrench aquaculture is an ancient and deep-rooted activ-ity, mainly in the production of molluscs and trout farm-ing. With the exception of salmonids, fresh-water species(carp - 4,230 tonnes, roach and tench - 2,790 tonnes)have been farmed since the Middle Ages in theSouthwest and Central and Eastern regions of France.During the seventies, the biological cycle of sea bass andsea bream was completed by French scientists who were experimenting in the South of France.
BiodiversityThere is a large diversity in production systems:
• Marine and freshwater fish: These are bred in raceways or fast-flowing channels, ponds, tanks andcages, except for carp and cyprinids which are produced in dams, lakes and reservoirs.
• Crustacean (tropical shrimp) is farmed in earthen ponds.
• Molluscs are reared along the coast in bays, estuaries and lagoons, either on suspended longlines, racks,posts or directly on the seabed.
EmploymentThe most important production sector is mollusc farming; there are 55,000 registered concessions for 3,700farms which employ 20,000 people. Trout farming employs 2,000 people in the 500 farms; only 3% are largecompanies producing more than 500 tonnes each, whilst small companies, which produce less than 100tonnes each, represent 84% of the total production. Farming of other freshwater fish species is representedby 6,000 multi-activity farmers. Marine fish farming is carried out in 40 individual companies in 46 farms,including hatcheries, and/or fattening farms (Barazi-Yeroulanos, 2010).
Production The main farming species in terms of volume in France is the Japanese oyster, the second most important interms of economic value in Europe. Also, France is the third biggest trout producer after Chile and Norway. Seabass, sea bream and turbot still dominate the marine aquaculture sector. France has a good level of juvenileproduction; as a consequence, France exports between 60 and 70% of its production to Greece and Spain andalso China. Fish consumption per capita in 2003 was 33 kg/year.
124
Defining sustainability indicators for Mediterranean Aquaculture
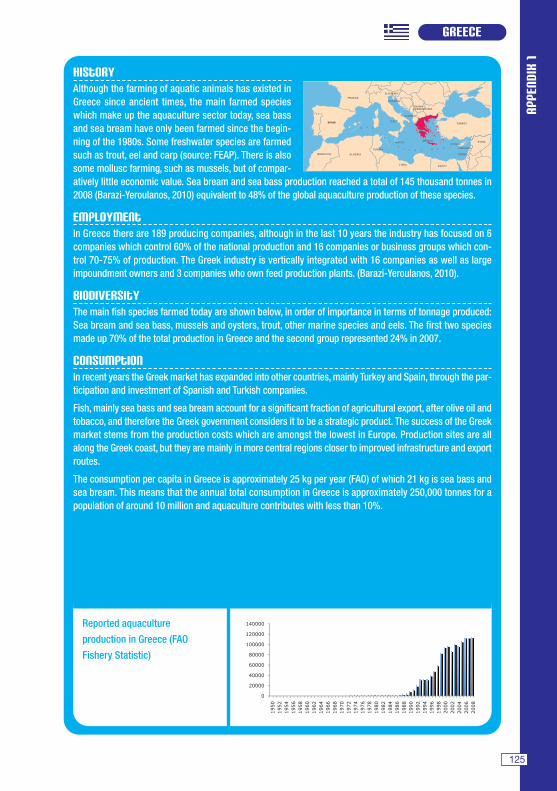
APPE
NDIX
1
GREECE
Reported aquaculture
production in Greece (FAO
Fishery Statistic)
�
�����
�����
����
�����
������
������
������
����
����
����
���
����
���
���
���
��
���
���
���
���
��
���
����
����
����
���
����
����
����
����
���
����
����
����
����
���
����
HistoryAlthough the farming of aquatic animals has existed inGreece since ancient times, the main farmed specieswhich make up the aquaculture sector today, sea bassand sea bream have only been farmed since the begin-ning of the 1980s. Some freshwater species are farmedsuch as trout, eel and carp (source: FEAP). There is alsosome mollusc farming, such as mussels, but of compar-atively little economic value. Sea bream and sea bass production reached a total of 145 thousand tonnes in2008 (Barazi-Yeroulanos, 2010) equivalent to 48% of the global aquaculture production of these species.
EmploymentIn Greece there are 189 producing companies, although in the last 10 years the industry has focused on 6companies which control 60% of the national production and 16 companies or business groups which con-trol 70-75% of production. The Greek industry is vertically integrated with 16 companies as well as largeimpoundment owners and 3 companies who own feed production plants. (Barazi-Yeroulanos, 2010).
BiodiversityThe main fish species farmed today are shown below, in order of importance in terms of tonnage produced:Sea bream and sea bass, mussels and oysters, trout, other marine species and eels. The first two speciesmade up 70% of the total production in Greece and the second group represented 24% in 2007.
ConsumptionIn recent years the Greek market has expanded into other countries, mainly Turkey and Spain, through the par-ticipation and investment of Spanish and Turkish companies.
Fish, mainly sea bass and sea bream account for a significant fraction of agricultural export, after olive oil andtobacco, and therefore the Greek government considers it to be a strategic product. The success of the Greekmarket stems from the production costs which are amongst the lowest in Europe. Production sites are allalong the Greek coast, but they are mainly in more central regions closer to improved infrastructure and exportroutes.
The consumption per capita in Greece is approximately 25 kg per year (FAO) of which 21 kg is sea bass andsea bream. This means that the annual total consumption in Greece is approximately 250,000 tonnes for apopulation of around 10 million and aquaculture contributes with less than 10%.
125
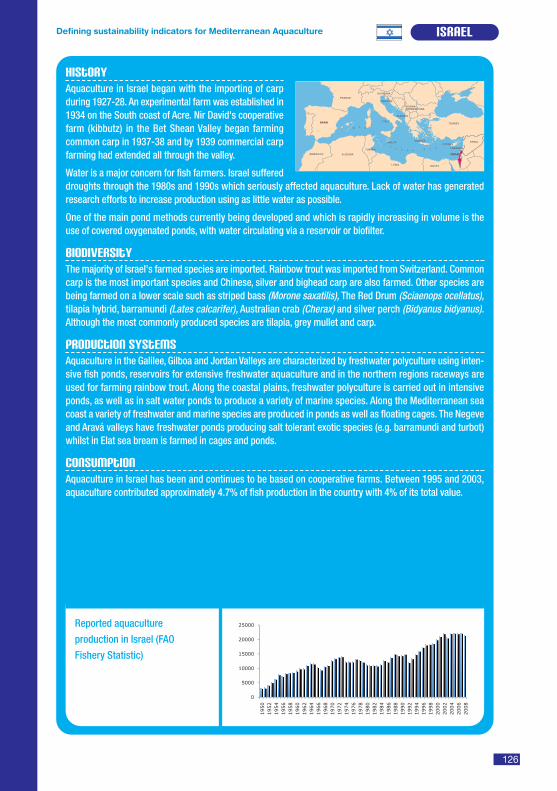
ISRAEL
Reported aquaculture
production in Israel (FAO
Fishery Statistic)
�
����
�����
�����
�����
�����
����
����
����
���
����
���
���
���
��
���
���
���
���
��
���
����
����
����
���
����
����
����
����
���
����
����
����
����
���
����
HistoryAquaculture in Israel began with the importing of carpduring 1927-28. An experimental farm was established in1934 on the South coast of Acre. Nir David's cooperativefarm (kibbutz) in the Bet Shean Valley began farmingcommon carp in 1937-38 and by 1939 commercial carpfarming had extended all through the valley.
Water is a major concern for fish farmers. Israel suffereddroughts through the 1980s and 1990s which seriously affected aquaculture. Lack of water has generatedresearch efforts to increase production using as little water as possible.
One of the main pond methods currently being developed and which is rapidly increasing in volume is theuse of covered oxygenated ponds, with water circulating via a reservoir or biofilter.
BiodiversityThe majority of Israel's farmed species are imported. Rainbow trout was imported from Switzerland. Commoncarp is the most important species and Chinese, silver and bighead carp are also farmed. Other species arebeing farmed on a lower scale such as striped bass (Morone saxatilis), The Red Drum (Sciaenops ocellatus),tilapia hybrid, barramundi (Lates calcarifer), Australian crab (Cherax) and silver perch (Bidyanus bidyanus).Although the most commonly produced species are tilapia, grey mullet and carp.
Production systemsAquaculture in the Galilee, Gilboa and Jordan Valleys are characterized by freshwater polyculture using inten-sive fish ponds, reservoirs for extensive freshwater aquaculture and in the northern regions raceways areused for farming rainbow trout. Along the coastal plains, freshwater polyculture is carried out in intensiveponds, as well as in salt water ponds to produce a variety of marine species. Along the Mediterranean seacoast a variety of freshwater and marine species are produced in ponds as well as floating cages. The Negeveand Aravá valleys have freshwater ponds producing salt tolerant exotic species (e.g. barramundi and turbot)whilst in Elat sea bream is farmed in cages and ponds.
ConsumptionAquaculture in Israel has been and continues to be based on cooperative farms. Between 1995 and 2003,aquaculture contributed approximately 4.7% of fish production in the country with 4% of its total value.
126
Defining sustainability indicators for Mediterranean Aquaculture
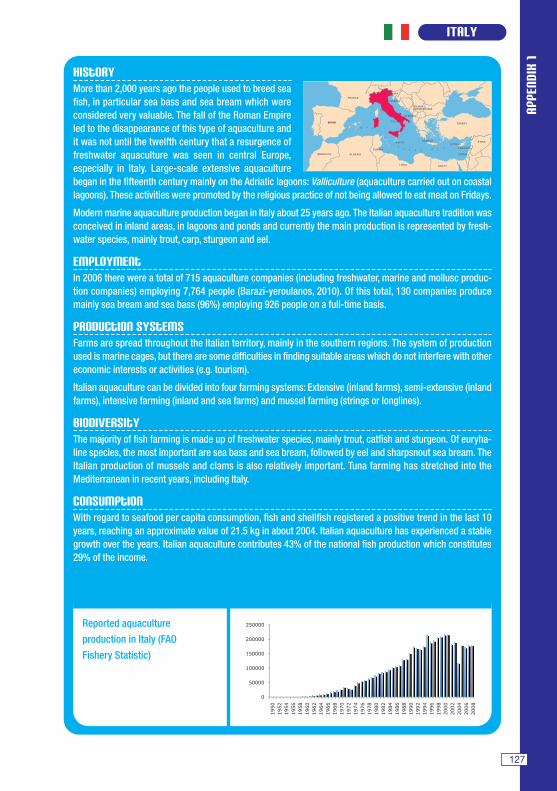
APPE
NDIX
1
ITALy
Reported aquaculture
production in Italy (FAO
Fishery Statistic)
�
�����
������
������
������
������
����
����
����
���
����
���
���
���
��
���
���
���
���
��
���
����
����
����
���
����
����
����
����
���
����
����
����
����
���
����
HistoryMore than 2,000 years ago the people used to breed seafish, in particular sea bass and sea bream which wereconsidered very valuable. The fall of the Roman Empireled to the disappearance of this type of aquaculture andit was not until the twelfth century that a resurgence offreshwater aquaculture was seen in central Europe,especially in Italy. Large-scale extensive aquaculturebegan in the fifteenth century mainly on the Adriatic lagoons: Valliculture (aquaculture carried out on coastallagoons). These activities were promoted by the religious practice of not being allowed to eat meat on Fridays.
Modern marine aquaculture production began in Italy about 25 years ago. The Italian aquaculture tradition wasconceived in inland areas, in lagoons and ponds and currently the main production is represented by fresh-water species, mainly trout, carp, sturgeon and eel.
EmploymentIn 2006 there were a total of 715 aquaculture companies (including freshwater, marine and mollusc produc-tion companies) employing 7,764 people (Barazi-yeroulanos, 2010). Of this total, 130 companies producemainly sea bream and sea bass (96%) employing 926 people on a full-time basis.
Production systemsFarms are spread throughout the Italian territory, mainly in the southern regions. The system of productionused is marine cages, but there are some difficulties in finding suitable areas which do not interfere with othereconomic interests or activities (e.g. tourism).
Italian aquaculture can be divided into four farming systems: Extensive (inland farms), semi-extensive (inlandfarms), intensive farming (inland and sea farms) and mussel farming (strings or longlines).
BiodiversityThe majority of fish farming is made up of freshwater species, mainly trout, catfish and sturgeon. Of euryha-line species, the most important are sea bass and sea bream, followed by eel and sharpsnout sea bream. TheItalian production of mussels and clams is also relatively important. Tuna farming has stretched into theMediterranean in recent years, including Italy.
ConsumptionWith regard to seafood per capita consumption, fish and shellfish registered a positive trend in the last 10years, reaching an approximate value of 21.5 kg in about 2004. Italian aquaculture has experienced a stablegrowth over the years. Italian aquaculture contributes 43% of the national fish production which constitutes29% of the income.
127

LEBANON
Reported aquaculture
production in Lebanon (FAO
Fishery Statistic)
�
���
���
���
���
���
��
��
���
���
����
����
����
���
����
���
���
���
��
���
���
���
���
��
���
����
����
����
���
����
����
����
����
���
����
����
����
����
���
����
HistoryInland aquaculture has been practiced in Lebanon since1930 (El-Zein, 1997). The first farm was created in 1965in the area of Hermel, nearly all the farms (41%) wereestablished between 1985-1990, mainly in the areas ofAnjar and Hermel and a few in Zahle.
More than 90% of Lebanese fish farming production israinbow trout. They are farmed in semi-intensive sys-tems introduced in 1958. Today there are 150 fish farms or concessions. Tilapia farms have recently beenestablished through private initiatives. There is only one marine aquaculture farm and it produces shrimp, itbelongs to a private company and it is situated in the north of Lebanon.
BiodiversityThe following species are farmed in Lebanon: rainbow trout, tilapia and shrimp.
Geographical distribution and production systems Aquaculture is practiced in the following areas: Bekaa, Akkar in the North of Lebanon and in the South ofLebanon.
The production system mainly used is semi-intensive. The average annual production of rainbow trout is 600 tonnes, which is produced in 150 farms, of which 80% are in the northern area of Hermel and Bekaa, thevalue of this production is US$ 2 million and with an average yield of 10-12 tonnes (approximately 1.5 kg/litre/minute).
ConsumptionThe total fish production (capture and aquaculture) accounts for less than 27% of local consumption.Aquaculture contributes 10% of local production and 3% of local fish production.
Compared to other Mediterranean countries fish consumption in Lebanon is still limited, with 4 kg/person/year. Domestic consumption is estimated at 25,000t/year.
128
Defining sustainability indicators for Mediterranean Aquaculture
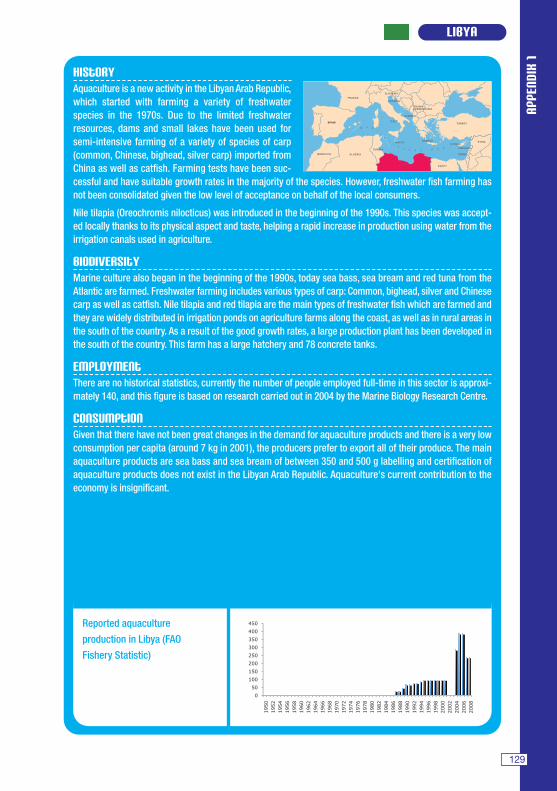
APPE
NDIX
1
LIByA
Reported aquaculture
production in Libya (FAO
Fishery Statistic)
�
��
���
���
���
���
���
���
���
���
����
����
����
���
����
���
���
���
��
���
���
���
���
��
���
����
����
����
���
����
����
����
����
���
����
����
����
����
���
����
HistoryAquaculture is a new activity in the Libyan Arab Republic,which started with farming a variety of freshwaterspecies in the 1970s. Due to the limited freshwaterresources, dams and small lakes have been used forsemi-intensive farming of a variety of species of carp(common, Chinese, bighead, silver carp) imported fromChina as well as catfish. Farming tests have been suc-cessful and have suitable growth rates in the majority of the species. However, freshwater fish farming hasnot been consolidated given the low level of acceptance on behalf of the local consumers.
Nile tilapia (Oreochromis nilocticus) was introduced in the beginning of the 1990s. This species was accept-ed locally thanks to its physical aspect and taste, helping a rapid increase in production using water from theirrigation canals used in agriculture.
BiodiversityMarine culture also began in the beginning of the 1990s, today sea bass, sea bream and red tuna from theAtlantic are farmed. Freshwater farming includes various types of carp: Common, bighead, silver and Chinesecarp as well as catfish. Nile tilapia and red tilapia are the main types of freshwater fish which are farmed andthey are widely distributed in irrigation ponds on agriculture farms along the coast, as well as in rural areas inthe south of the country. As a result of the good growth rates, a large production plant has been developed inthe south of the country. This farm has a large hatchery and 78 concrete tanks.
EmploymentThere are no historical statistics, currently the number of people employed full-time in this sector is approxi-mately 140, and this figure is based on research carried out in 2004 by the Marine Biology Research Centre.
ConsumptionGiven that there have not been great changes in the demand for aquaculture products and there is a very lowconsumption per capita (around 7 kg in 2001), the producers prefer to export all of their produce. The mainaquaculture products are sea bass and sea bream of between 350 and 500 g labelling and certification ofaquaculture products does not exist in the Libyan Arab Republic. Aquaculture's current contribution to theeconomy is insignificant.
129
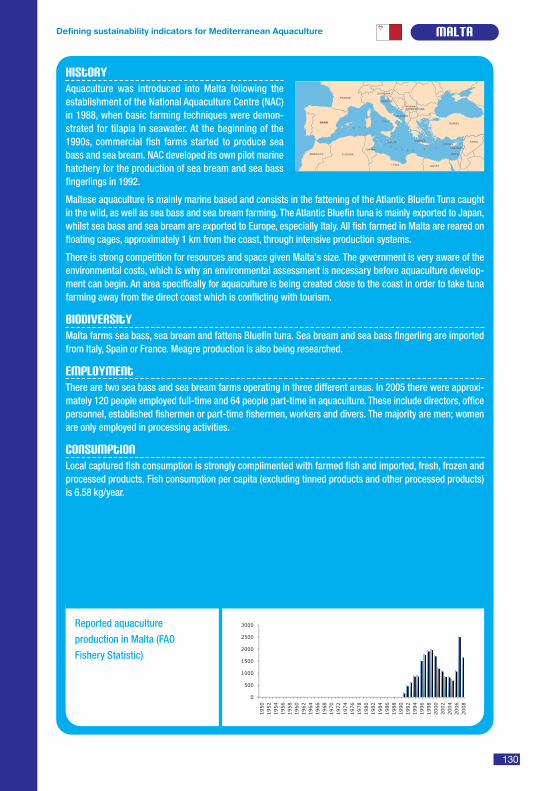
MALTA
Reported aquaculture
production in Malta (FAO
Fishery Statistic)
�
���
����
����
����
����
����
����
����
����
���
����
���
���
���
��
���
���
���
���
��
���
����
����
����
���
����
����
����
����
���
����
����
����
����
���
����
HistoryAquaculture was introduced into Malta following theestablishment of the National Aquaculture Centre (NAC)in 1988, when basic farming techniques were demon-strated for tilapia in seawater. At the beginning of the1990s, commercial fish farms started to produce seabass and sea bream. NAC developed its own pilot marinehatchery for the production of sea bream and sea bassfingerlings in 1992.
Maltese aquaculture is mainly marine based and consists in the fattening of the Atlantic Bluefin Tuna caughtin the wild, as well as sea bass and sea bream farming. The Atlantic Bluefin tuna is mainly exported to Japan,whilst sea bass and sea bream are exported to Europe, especially Italy. All fish farmed in Malta are reared onfloating cages, approximately 1 km from the coast, through intensive production systems.
There is strong competition for resources and space given Malta's size. The government is very aware of theenvironmental costs, which is why an environmental assessment is necessary before aquaculture develop-ment can begin. An area specifically for aquaculture is being created close to the coast in order to take tunafarming away from the direct coast which is conflicting with tourism.
BiodiversityMalta farms sea bass, sea bream and fattens Bluefin tuna. Sea bream and sea bass fingerling are importedfrom Italy, Spain or France. Meagre production is also being researched.
EmploymentThere are two sea bass and sea bream farms operating in three different areas. In 2005 there were approxi-mately 120 people employed full-time and 64 people part-time in aquaculture. These include directors, officepersonnel, established fishermen or part-time fishermen, workers and divers. The majority are men; womenare only employed in processing activities.
ConsumptionLocal captured fish consumption is strongly complimented with farmed fish and imported, fresh, frozen andprocessed products. Fish consumption per capita (excluding tinned products and other processed products)is 6.58 kg/year.
130
Defining sustainability indicators for Mediterranean Aquaculture
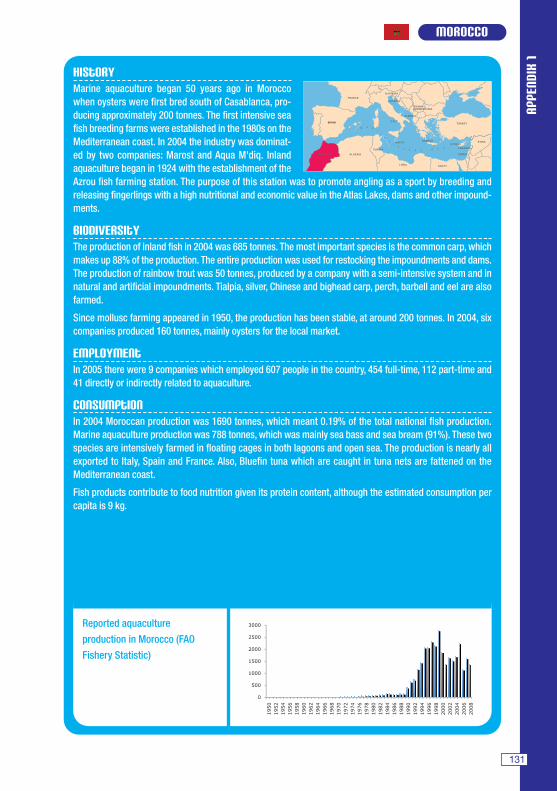
APPE
NDIX
1
MOROCCO
Reported aquaculture
production in Morocco (FAO
Fishery Statistic)
�
���
����
����
����
����
����
����
����
����
���
����
���
���
���
��
���
���
���
���
��
���
����
����
����
���
����
����
����
����
���
����
����
����
����
���
����
HistoryMarine aquaculture began 50 years ago in Moroccowhen oysters were first bred south of Casablanca, pro-ducing approximately 200 tonnes. The first intensive seafish breeding farms were established in the 1980s on theMediterranean coast. In 2004 the industry was dominat-ed by two companies: Marost and Aqua M'diq. Inlandaquaculture began in 1924 with the establishment of theAzrou fish farming station. The purpose of this station was to promote angling as a sport by breeding andreleasing fingerlings with a high nutritional and economic value in the Atlas Lakes, dams and other impound-ments.
BiodiversityThe production of inland fish in 2004 was 685 tonnes. The most important species is the common carp, whichmakes up 88% of the production. The entire production was used for restocking the impoundments and dams.The production of rainbow trout was 50 tonnes, produced by a company with a semi-intensive system and innatural and artificial impoundments. Tialpia, silver, Chinese and bighead carp, perch, barbell and eel are alsofarmed.
Since mollusc farming appeared in 1950, the production has been stable, at around 200 tonnes. In 2004, sixcompanies produced 160 tonnes, mainly oysters for the local market.
EmploymentIn 2005 there were 9 companies which employed 607 people in the country, 454 full-time, 112 part-time and41 directly or indirectly related to aquaculture.
ConsumptionIn 2004 Moroccan production was 1690 tonnes, which meant 0.19% of the total national fish production.Marine aquaculture production was 788 tonnes, which was mainly sea bass and sea bream (91%). These twospecies are intensively farmed in floating cages in both lagoons and open sea. The production is nearly allexported to Italy, Spain and France. Also, Bluefin tuna which are caught in tuna nets are fattened on theMediterranean coast.
Fish products contribute to food nutrition given its protein content, although the estimated consumption percapita is 9 kg.
131
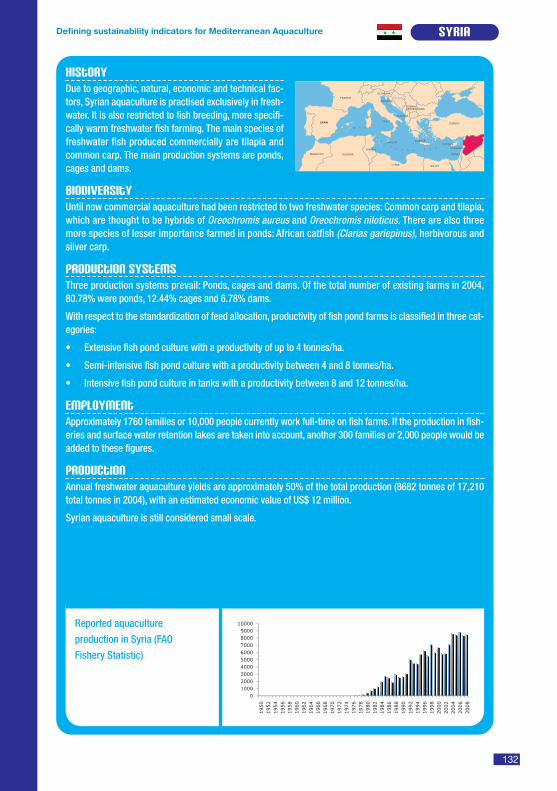
SyRIA
Reported aquaculture
production in Syria (FAO
Fishery Statistic)
����������������������������������������
����
����
����
���
����
���
���
���
��
���
���
���
���
��
���
����
����
����
���
����
����
����
����
���
����
����
����
����
���
����
HistoryDue to geographic, natural, economic and technical fac-tors, Syrian aquaculture is practised exclusively in fresh-water. It is also restricted to fish breeding, more specifi-cally warm freshwater fish farming. The main species offreshwater fish produced commercially are tilapia andcommon carp. The main production systems are ponds,cages and dams.
BiodiversityUntil now commercial aquaculture had been restricted to two freshwater species: Common carp and tilapia,which are thought to be hybrids of Oreochromis aureus and Oreochromis niloticus. There are also threemore species of lesser importance farmed in ponds: African catfish (Clarias gariepinus), herbivorous andsilver carp.
Production systems Three production systems prevail: Ponds, cages and dams. Of the total number of existing farms in 2004,80.78% were ponds, 12.44% cages and 6.78% dams.
With respect to the standardization of feed allocation, productivity of fish pond farms is classified in three cat-egories:
• Extensive fish pond culture with a productivity of up to 4 tonnes/ha.
• Semi-intensive fish pond culture with a productivity between 4 and 8 tonnes/ha.
• Intensive fish pond culture in tanks with a productivity between 8 and 12 tonnes/ha.
EmploymentApproximately 1760 families or 10,000 people currently work full-time on fish farms. If the production in fish-eries and surface water retention lakes are taken into account, another 300 families or 2,000 people would beadded to these figures.
Production Annual freshwater aquaculture yields are approximately 50% of the total production (8682 tonnes of 17,210total tonnes in 2004), with an estimated economic value of US$ 12 million.
Syrian aquaculture is still considered small scale.
132
Defining sustainability indicators for Mediterranean Aquaculture
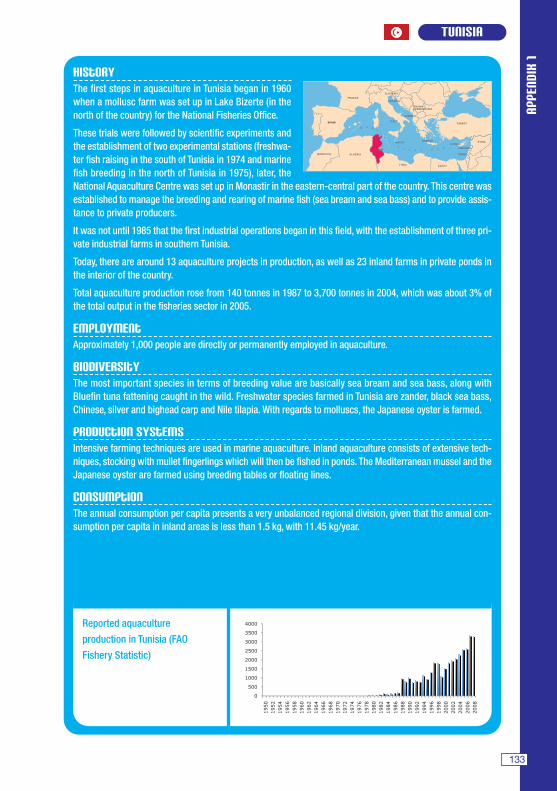
APPE
NDIX
1
TUNISIA
Reported aquaculture
production in Tunisia (FAO
Fishery Statistic)
�
���
����
����
����
����
����
����
����
����
����
����
���
����
���
���
���
��
���
���
���
���
��
���
����
����
����
���
����
����
����
����
���
����
����
����
����
���
����
HistoryThe first steps in aquaculture in Tunisia began in 1960when a mollusc farm was set up in Lake Bizerte (in thenorth of the country) for the National Fisheries Office.
These trials were followed by scientific experiments andthe establishment of two experimental stations (freshwa-ter fish raising in the south of Tunisia in 1974 and marinefish breeding in the north of Tunisia in 1975), later, theNational Aquaculture Centre was set up in Monastir in the eastern-central part of the country. This centre wasestablished to manage the breeding and rearing of marine fish (sea bream and sea bass) and to provide assis-tance to private producers.
It was not until 1985 that the first industrial operations began in this field, with the establishment of three pri-vate industrial farms in southern Tunisia.
Today, there are around 13 aquaculture projects in production, as well as 23 inland farms in private ponds inthe interior of the country.
Total aquaculture production rose from 140 tonnes in 1987 to 3,700 tonnes in 2004, which was about 3% ofthe total output in the fisheries sector in 2005.
EmploymentApproximately 1,000 people are directly or permanently employed in aquaculture.
BiodiversityThe most important species in terms of breeding value are basically sea bream and sea bass, along withBluefin tuna fattening caught in the wild. Freshwater species farmed in Tunisia are zander, black sea bass,Chinese, silver and bighead carp and Nile tilapia. With regards to molluscs, the Japanese oyster is farmed.
Production systemsIntensive farming techniques are used in marine aquaculture. Inland aquaculture consists of extensive tech-niques, stocking with mullet fingerlings which will then be fished in ponds. The Mediterranean mussel and theJapanese oyster are farmed using breeding tables or floating lines.
ConsumptionThe annual consumption per capita presents a very unbalanced regional division, given that the annual con-sumption per capita in inland areas is less than 1.5 kg, with 11.45 kg/year.
133
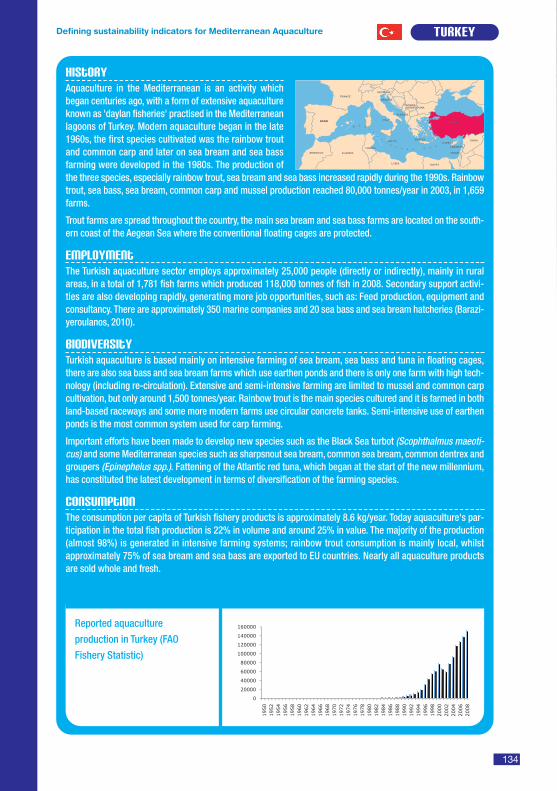
TURKEY
Reported aquaculture
production in Turkey (FAO
Fishery Statistic)
�
�����
�����
����
�����
������
������
������
�����
����
����
����
���
����
���
���
���
��
���
���
���
���
��
���
����
����
����
���
����
����
����
����
���
����
����
����
����
���
����
HistoryAquaculture in the Mediterranean is an activity whichbegan centuries ago, with a form of extensive aquacultureknown as 'daylan fisheries' practised in the Mediterraneanlagoons of Turkey. Modern aquaculture began in the late1960s, the first species cultivated was the rainbow troutand common carp and later on sea bream and sea bassfarming were developed in the 1980s. The production ofthe three species, especially rainbow trout, sea bream and sea bass increased rapidly during the 1990s. Rainbowtrout, sea bass, sea bream, common carp and mussel production reached 80,000 tonnes/year in 2003, in 1,659farms.
Trout farms are spread throughout the country, the main sea bream and sea bass farms are located on the south-ern coast of the Aegean Sea where the conventional floating cages are protected.
EmploymentThe Turkish aquaculture sector employs approximately 25,000 people (directly or indirectly), mainly in ruralareas, in a total of 1,781 fish farms which produced 118,000 tonnes of fish in 2008. Secondary support activi-ties are also developing rapidly, generating more job opportunities, such as: Feed production, equipment andconsultancy. There are approximately 350 marine companies and 20 sea bass and sea bream hatcheries (Barazi-yeroulanos, 2010).
BiodiversityTurkish aquaculture is based mainly on intensive farming of sea bream, sea bass and tuna in floating cages,there are also sea bass and sea bream farms which use earthen ponds and there is only one farm with high tech-nology (including re-circulation). Extensive and semi-intensive farming are limited to mussel and common carpcultivation, but only around 1,500 tonnes/year. Rainbow trout is the main species cultured and it is farmed in bothland-based raceways and some more modern farms use circular concrete tanks. Semi-intensive use of earthenponds is the most common system used for carp farming.
Important efforts have been made to develop new species such as the Black Sea turbot (Scophthalmus maeoti-cus) and some Mediterranean species such as sharpsnout sea bream, common sea bream, common dentrex andgroupers (Epinephelus spp.). Fattening of the Atlantic red tuna, which began at the start of the new millennium,has constituted the latest development in terms of diversification of the farming species.
ConsumptionThe consumption per capita of Turkish fishery products is approximately 8.6 kg/year. Today aquaculture's par-ticipation in the total fish production is 22% in volume and around 25% in value. The majority of the production(almost 98%) is generated in intensive farming systems; rainbow trout consumption is mainly local, whilstapproximately 75% of sea bream and sea bass are exported to EU countries. Nearly all aquaculture productsare sold whole and fresh.
134
Defining sustainability indicators for Mediterranean Aquaculture
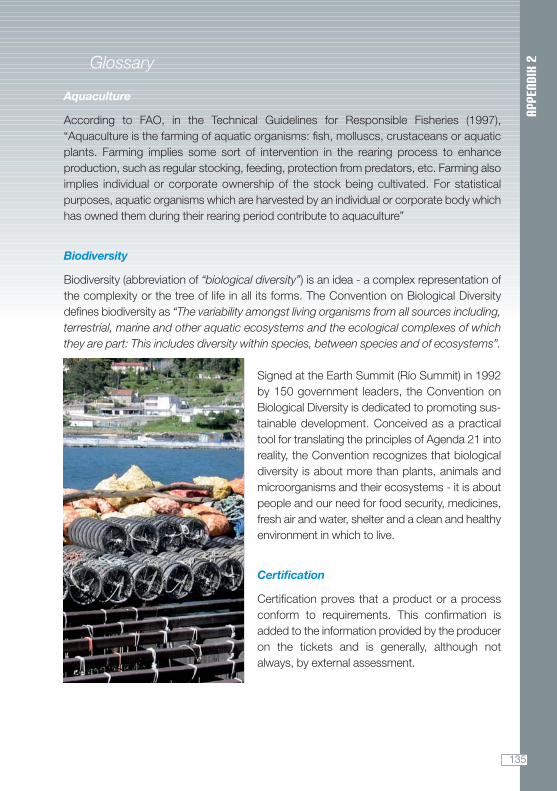
APPE
NDIX
2Glossary
Aquaculture
According to FAO, in the Technical Guidelines for Responsible Fisheries (1997),“Aquaculture is the farming of aquatic organisms: fish, molluscs, crustaceans or aquaticplants. Farming implies some sort of intervention in the rearing process to enhanceproduction, such as regular stocking, feeding, protection from predators, etc. Farming alsoimplies individual or corporate ownership of the stock being cultivated. For statisticalpurposes, aquatic organisms which are harvested by an individual or corporate body whichhas owned them during their rearing period contribute to aquaculture”
Biodiversity
Biodiversity (abbreviation of “biological diversity”) is an idea - a complex representation ofthe complexity or the tree of life in all its forms. The Convention on Biological Diversitydefines biodiversity as “The variability amongst living organisms from all sources including,terrestrial, marine and other aquatic ecosystems and the ecological complexes of whichthey are part: This includes diversity within species, between species and of ecosystems”.
Signed at the Earth Summit (Río Summit) in 1992by 150 government leaders, the Convention onBiological Diversity is dedicated to promoting sus-tainable development. Conceived as a practicaltool for translating the principles of Agenda 21 intoreality, the Convention recognizes that biologicaldiversity is about more than plants, animals andmicroorganisms and their ecosystems - it is aboutpeople and our need for food security, medicines,fresh air and water, shelter and a clean and healthyenvironment in which to live.
Certification
Certification proves that a product or a processconform to requirements. This confirmation isadded to the information provided by the produceron the tickets and is generally, although notalways, by external assessment.
135
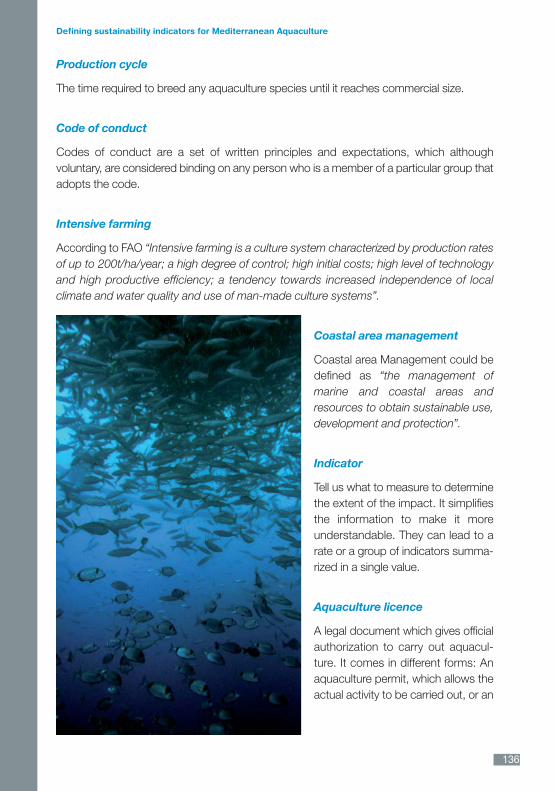
Production cycle
The time required to breed any aquaculture species until it reaches commercial size.
Code of conduct
Codes of conduct are a set of written principles and expectations, which althoughvoluntary, are considered binding on any person who is a member of a particular group thatadopts the code.
Intensive farming
According to FAO “Intensive farming is a culture system characterized by production ratesof up to 200t/ha/year; a high degree of control; high initial costs; high level of technologyand high productive efficiency; a tendency towards increased independence of localclimate and water quality and use of man-made culture systems”.
Coastal area management
Coastal area Management could bedefined as “the management ofmarine and coastal areas andresources to obtain sustainable use,development and protection”.
Indicator
Tell us what to measure to determinethe extent of the impact. It simplifiesthe information to make it moreunderstandable. They can lead to arate or a group of indicators summa-rized in a single value.
Aquaculture licence
A legal document which gives officialauthorization to carry out aquacul-ture. It comes in different forms: Anaquaculture permit, which allows theactual activity to be carried out, or an
Defining sustainability indicators for Mediterranean Aquaculture
136
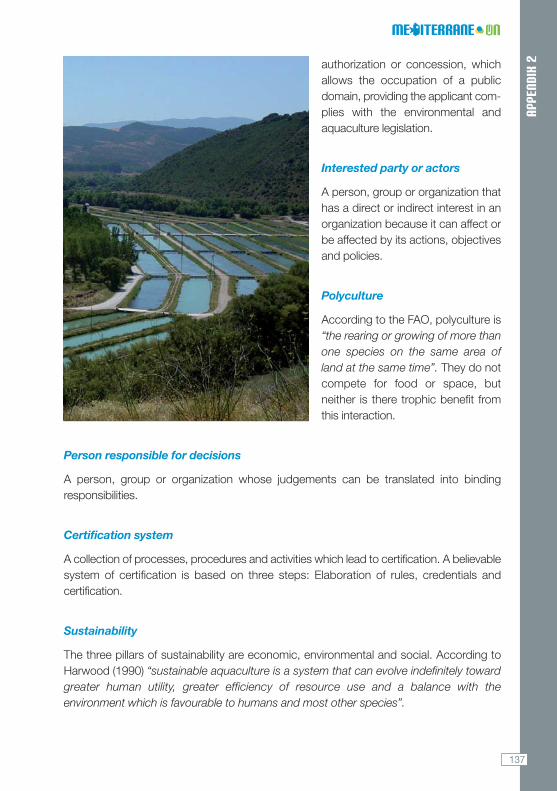
APPE
NDIX
2authorization or concession, whichallows the occupation of a publicdomain, providing the applicant com-plies with the environmental andaquaculture legislation.
Interested party or actors
A person, group or organization thathas a direct or indirect interest in anorganization because it can affect orbe affected by its actions, objectivesand policies.
Polyculture
According to the FAO, polyculture is“the rearing or growing of more thanone species on the same area ofland at the same time”. They do notcompete for food or space, butneither is there trophic benefit fromthis interaction.
Person responsible for decisions
A person, group or organization whose judgements can be translated into bindingresponsibilities.
Certification system
A collection of processes, procedures and activities which lead to certification. A believablesystem of certification is based on three steps: Elaboration of rules, credentials andcertification.
Sustainability
The three pillars of sustainability are economic, environmental and social. According toHarwood (1990) “sustainable aquaculture is a system that can evolve indefinitely towardgreater human utility, greater efficiency of resource use and a balance with theenvironment which is favourable to humans and most other species”.
137
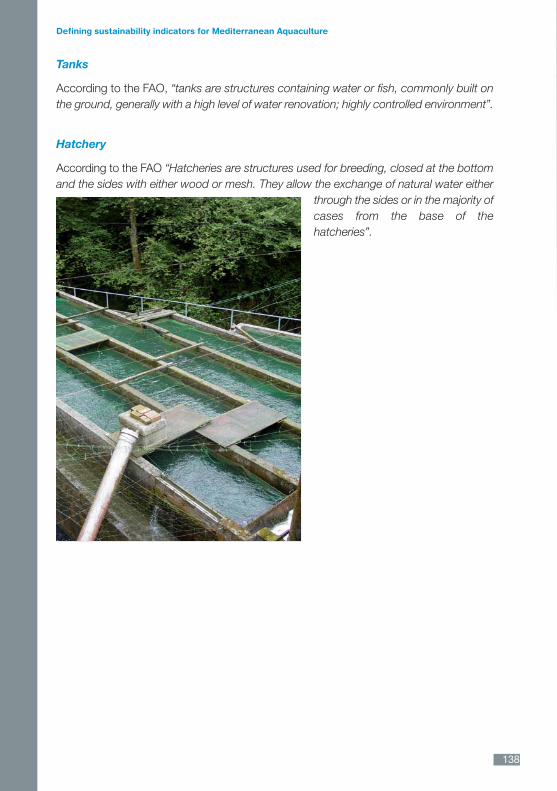
Tanks
According to the FAO, “tanks are structures containing water or fish, commonly built onthe ground, generally with a high level of water renovation; highly controlled environment”.
Hatchery
According to the FAO “Hatcheries are structures used for breeding, closed at the bottomand the sides with either wood or mesh. They allow the exchange of natural water either
through the sides or in the majority ofcases from the base of thehatcheries”.
Defining sustainability indicators for Mediterranean Aquaculture
138

APPE
NDIX
3Bibliography
Apromar. 2010. Spanish Association of Marine Fish Farmers. 74 pages.
Barraclough, S. and Finger-Stich, A. 1996. Some Ecological and Social Implications ofCommercial Shrimp Farming in Asia. United Nations Research Institute for SocialDevelopment (UNRISD) Discussion Paper #74.
Chopin, T., Buschmann, A.H., Halling, C., Troell, M., Kautsky, N., Neori, A., Kraemer, G.,Zertuche-Gonzalez, J., Yarish, C., Neefus, C. 2001. Integrating seaweeds intoaquaculture systems: a key towards sustainability. Journal of Phycology 37:975-986.
Chua, T., Paw, J. and Guarin. 1989. The environmental impact of aquaculture and theeffects of pollution on coastal aquaculture development. Marine Pollution Bulletin 20:335-343.
Cochrane, K.; De Young, C.; Soto, D.; Bahri, T. (eds). 2009. Climate change implications forfisheries and aquaculture: overview of current scientific knowledge. FAO Fisheries andAquaculture Technical Paper. No. 530. Rome, FAO. 212p.
Dierberg, F. and Kiattisimkul, W. 1996. Issues, impacts, and implications of shrimpaquaculture in Thailand. Environmental Management 20: 649-666.
139

El Zein, G. 1997. Development Actuel de la peche et l'aquaculture au Liban. La piscicultureFrancaise d'eau vive et d'etang saumatre et marine. Numero 130 - 4eme trimestre1997 revue trimestrielle - 80F, pp. 13-27.
FAO. 1997. Fisheries management. FAO Technical Guidelines for Responsible Fisheries.No. 4. FAO, Rome 82 p.
Food and Agriculture Organization of the United Nations. 2008. State of world aquaculture:2008. FAO Fisheries technical paper No. 500, 197pp.
Madec P. 2003. Les indicateurs de développement durable. INRA-Université de MontpellierII. 118 p.
Linde, P. 2007. El mar más sucio del mundo. El País 23/07/2007,http://www.elpais.com/articulo/sociedad/mar/sucio/mundo/elpepusoc/20070723elpepisoc_1/Tes.
Pauly, D., V. Christensen, J. Dalsgaard, R. Froese and F.C. Torres Jr. 1998. Fishing downmarine food webs. Science 279: 860-863.
Primavera, J.H. 1998. Tropical shrimp farming and its sustainability. In: Tropical Mariculture.De Silva, S. (ed), Academic Press, New York, pp. 257-289.
IUCN, 2007. Guide for the Sustainable Development of Mediterranean Aquaculture 1.Interaction between Aquaculture and the Environment. IUCN, Gland, Switzerland andMalaga, Spain. 107 pages.
IUCN, 2009. Guide for the Sustainable Development of Mediterranean Aquaculture 2.Aquaculture Site Selection and Site Management, IUCN, Gland, Switzerland andMalaga, Spain. VIII + 303 pages.
IUCN, 2009. Guide for the Sustainable Development of Mediterranean Aquaculture 3.Aquaculture Responsible Practices and Certification. Gland, Switzerland and Malaga,Spain: IUCN. VI+70 pp.
Defining sustainability indicators for Mediterranean Aquaculture
140
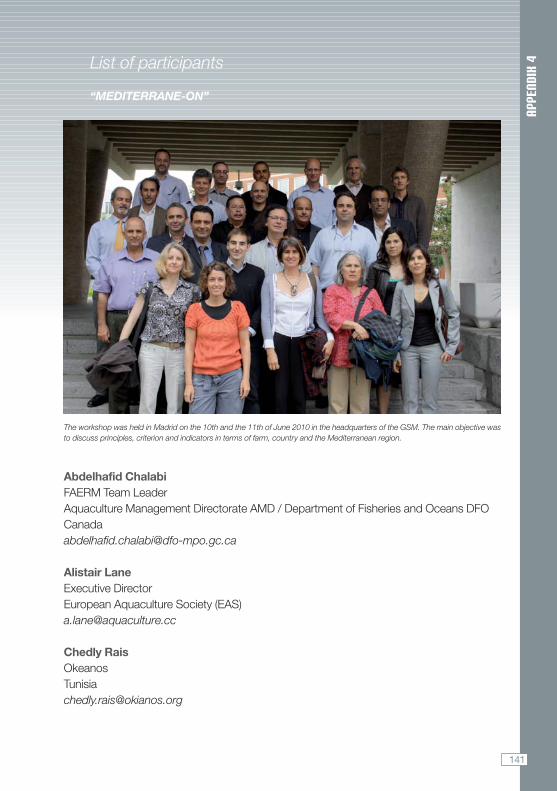
APPE
NDIX
4List of participants
“MEDITERRANE-ON”
The workshop was held in Madrid on the 10th and the 11th of June 2010 in the headquarters of the GSM. The main objective wasto discuss principles, criterion and indicators in terms of farm, country and the Mediterranean region.
Abdelhafid Chalabi FAERM Team Leader Aquaculture Management Directorate AMD / Department of Fisheries and Oceans [email protected]
Alistair Lane Executive DirectorEuropean Aquaculture Society (EAS)[email protected]
Chedly Rais OkeanosTunisia [email protected]
141
Cristina García DiezSpanish Aquaculture Observatory Foundation (FOESA). [email protected]
Eduardo Chia CIRAD, UMR Innovation, [email protected]
Fabio Massa FAO [email protected]
Fernando Torrent Polytechnic University of Madrid [email protected]
François René IFREMER, Montpellier [email protected]
Francois Simard Global Marine Programme, IUCN [email protected]
Güzel Yücel-Gier Institute of Marine Sciences and Technology Univeristy Izmir, Turkey [email protected]
Javier Ojeda González-PosadaAPROMAR [email protected]
Javier Remiro PerladoSpanish Aquaculture Observatory Foundation (FOESA)[email protected]
Defining sustainability indicators for Mediterranean Aquaculture
142
APPE
NDIX
4José Carlos Macías Rivero Public Enterprise for Agriculture and Fisheries Development (D.a.p.)[email protected]
Joseph Borg University of Malta [email protected]
Julian Le Viol IUCN, Má[email protected]
Maria Teresa Dinis SEACASEPortugal [email protected]
Pablo Ávila Zaragoza Public Enterprise for Agriculture and Fisheries Development (D.a.p.)[email protected]
Pablo Sánchez JerezUniversity of Alicante [email protected]
Paco Padilla Brotherhood of Fishermen of ConilSpain [email protected]
Panos Christofilogiannis Management Solutions for Aquatic Resources (AQUARK)Greece [email protected]
Philippos Papageorgiou Consultant on Fisheries and Aquaculture [email protected]
143
144
Rosa Chapela PérezMarine Technology Centre (CETMAR), GaliciaSpain [email protected]
Sandra Simoes RubialesGlobal Marine Programme, [email protected]
Sherif Sadek Aquaculture Consultant Office (ACO)Egypt [email protected]
Shirra Freeman University of Haifa/Harvard School of Public HealthIsrael / [email protected]
Other collaborators:
Fernando Otero [email protected]
Dror AngelUniversity of [email protected]
Jose Ramón TexeiraPublic Enterprise for Agriculture and Fisheries Development (D.a.p.)[email protected]
Defining sustainability indicators for Mediterranean Aquaculture
APPE
NDIX
5List of acronyms
ACO: Aquaculture Consultant Office
APROMAR: Spanish Association of Marine Fish Farmers
CAQ: CGPM's Aquaculture Committee
CETMAR: Marine Technology Centre (Vigo)
CGPM: FAO's General Fisheries Commission for the Mediterranean
DAP: Agriculture and Fisheries Development of Andalucía
EBM: Ecosystem Based Management
EC: European Commission
EMAS: Eco-Management and Audit Scheme
EU: European Union
FAO: Food and Agriculture Organization of the United Nations
FEAP: Federation of European Aquaculture Producers
145
146
FOESA: Spanish Aquaculture Observatory Foundation
ICZM: Integrated Coastal Zone Management
IEO: Spanish Institute of Oceanography
INRA: French National Institute for Agricultural Research
ISO: International Organization for Standardization
IUCN: International Union for the Conservation of Nature
MARM: Spanish Ministry for the Environment and Rural and Marine Affairs.
JACUMAR: National Advisory Board of Marine Aquaculture Farms
OP: Producers Organization
SEP: Surveillance Environmental Plan
Defining sustainability indicators for Mediterranean Aquaculture

NOTe
S
147
NOTeS
. . . . . . . . . . . . . . . . . . . . . . . . . . . . . . . . . . . . . . . . . . . . . . . . . . . . . . . . . . . . . . . . . . . . . . . . . . . .
. . . . . . . . . . . . . . . . . . . . . . . . . . . . . . . . . . . . . . . . . . . . . . . . . . . . . . . . . . . . . . . . . . . .
. . . . . . . . . . . . . . . . . . . . . . . . . . . . . . . . . . . . . . . . . . . . . . . . . . . . . . . . . . . . . . . . . . . .
. . . . . . . . . . . . . . . . . . . . . . . . . . . . . . . . . . . . . . . . . . . . . . . . . . . . . . . . . . . . . . . . . . . .
. . . . . . . . . . . . . . . . . . . . . . . . . . . . . . . . . . . . . . . . . . . . . . . . . . . . . . . . . . . . . . . . . . . .
. . . . . . . . . . . . . . . . . . . . . . . . . . . . . . . . . . . . . . . . . . . . . . . . . . . . . . . . . . . . . . . . . . . .
. . . . . . . . . . . . . . . . . . . . . . . . . . . . . . . . . . . . . . . . . . . . . . . . . . . . . . . . . . . . . . . . . . . .
. . . . . . . . . . . . . . . . . . . . . . . . . . . . . . . . . . . . . . . . . . . . . . . . . . . . . . . . . . . . . . . . . . . .
. . . . . . . . . . . . . . . . . . . . . . . . . . . . . . . . . . . . . . . . . . . . . . . . . . . . . . . . . . . . . . . . . . . .
. . . . . . . . . . . . . . . . . . . . . . . . . . . . . . . . . . . . . . . . . . . . . . . . . . . . . . . . . . . . . . . . . . . .
. . . . . . . . . . . . . . . . . . . . . . . . . . . . . . . . . . . . . . . . . . . . . . . . . . . . . . . . . . . . . . . . . . . .
. . . . . . . . . . . . . . . . . . . . . . . . . . . . . . . . . . . . . . . . . . . . . . . . . . . . . . . . . . . . . . . . . . . .
. . . . . . . . . . . . . . . . . . . . . . . . . . . . . . . . . . . . . . . . . . . . . . . . . . . . . . . . . . . . . . . . . . . .
. . . . . . . . . . . . . . . . . . . . . . . . . . . . . . . . . . . . . . . . . . . . . . . . . . . . . . . . . . . . . . . . . . . .
. . . . . . . . . . . . . . . . . . . . . . . . . . . . . . . . . . . . . . . . . . . . . . . . . . . . . . . . . . . . . . . . . . . .
. . . . . . . . . . . . . . . . . . . . . . . . . . . . . . . . . . . . . . . . . . . . . . . . . . . . . . . . . . . . . . . . . . . .
. . . . . . . . . . . . . . . . . . . . . . . . . . . . . . . . . . . . . . . . . . . . . . . . . . . . . . . . . . . . . . . . . . . .
. . . . . . . . . . . . . . . . . . . . . . . . . . . . . . . . . . . . . . . . . . . . . . . . . . . . . . . . . . . . . . . . . . . .
. . . . . . . . . . . . . . . . . . . . . . . . . . . . . . . . . . . . . . . . . . . . . . . . . . . . . . . . . . . . . . . . . . . .
. . . . . . . . . . . . . . . . . . . . . . . . . . . . . . . . . . . . . . . . . . . . . . . . . . . . . . . . . . . . . . . . . . . .
. . . . . . . . . . . . . . . . . . . . . . . . . . . . . . . . . . . . . . . . . . . . . . . . . . . . . . . . . . . . . . . . . . . .
. . . . . . . . . . . . . . . . . . . . . . . . . . . . . . . . . . . . . . . . . . . . . . . . . . . . . . . . . . . . . . . . . . . .
. . . . . . . . . . . . . . . . . . . . . . . . . . . . . . . . . . . . . . . . . . . . . . . . . . . . . . . . . . . . . . . . . . . .
147

148
Defining sustainability indicators for Mediterranean Aquaculture
NOTeS
. . . . . . . . . . . . . . . . . . . . . . . . . . . . . . . . . . . . . . . . . . . . . . . . . . . . . . . . . . . . . . . . . . . . . . . . . . . .
. . . . . . . . . . . . . . . . . . . . . . . . . . . . . . . . . . . . . . . . . . . . . . . . . . . . . . . . . . . . . . . . . . . .
. . . . . . . . . . . . . . . . . . . . . . . . . . . . . . . . . . . . . . . . . . . . . . . . . . . . . . . . . . . . . . . . . . . .
. . . . . . . . . . . . . . . . . . . . . . . . . . . . . . . . . . . . . . . . . . . . . . . . . . . . . . . . . . . . . . . . . . . .
. . . . . . . . . . . . . . . . . . . . . . . . . . . . . . . . . . . . . . . . . . . . . . . . . . . . . . . . . . . . . . . . . . . .
. . . . . . . . . . . . . . . . . . . . . . . . . . . . . . . . . . . . . . . . . . . . . . . . . . . . . . . . . . . . . . . . . . . .
. . . . . . . . . . . . . . . . . . . . . . . . . . . . . . . . . . . . . . . . . . . . . . . . . . . . . . . . . . . . . . . . . . . .
. . . . . . . . . . . . . . . . . . . . . . . . . . . . . . . . . . . . . . . . . . . . . . . . . . . . . . . . . . . . . . . . . . . .
. . . . . . . . . . . . . . . . . . . . . . . . . . . . . . . . . . . . . . . . . . . . . . . . . . . . . . . . . . . . . . . . . . . .
. . . . . . . . . . . . . . . . . . . . . . . . . . . . . . . . . . . . . . . . . . . . . . . . . . . . . . . . . . . . . . . . . . . .
. . . . . . . . . . . . . . . . . . . . . . . . . . . . . . . . . . . . . . . . . . . . . . . . . . . . . . . . . . . . . . . . . . . .
. . . . . . . . . . . . . . . . . . . . . . . . . . . . . . . . . . . . . . . . . . . . . . . . . . . . . . . . . . . . . . . . . . . .
. . . . . . . . . . . . . . . . . . . . . . . . . . . . . . . . . . . . . . . . . . . . . . . . . . . . . . . . . . . . . . . . . . . .
. . . . . . . . . . . . . . . . . . . . . . . . . . . . . . . . . . . . . . . . . . . . . . . . . . . . . . . . . . . . . . . . . . . .
. . . . . . . . . . . . . . . . . . . . . . . . . . . . . . . . . . . . . . . . . . . . . . . . . . . . . . . . . . . . . . . . . . . .
. . . . . . . . . . . . . . . . . . . . . . . . . . . . . . . . . . . . . . . . . . . . . . . . . . . . . . . . . . . . . . . . . . . .
. . . . . . . . . . . . . . . . . . . . . . . . . . . . . . . . . . . . . . . . . . . . . . . . . . . . . . . . . . . . . . . . . . . .
. . . . . . . . . . . . . . . . . . . . . . . . . . . . . . . . . . . . . . . . . . . . . . . . . . . . . . . . . . . . . . . . . . . .
. . . . . . . . . . . . . . . . . . . . . . . . . . . . . . . . . . . . . . . . . . . . . . . . . . . . . . . . . . . . . . . . . . . .
. . . . . . . . . . . . . . . . . . . . . . . . . . . . . . . . . . . . . . . . . . . . . . . . . . . . . . . . . . . . . . . . . . . .
. . . . . . . . . . . . . . . . . . . . . . . . . . . . . . . . . . . . . . . . . . . . . . . . . . . . . . . . . . . . . . . . . . . .
. . . . . . . . . . . . . . . . . . . . . . . . . . . . . . . . . . . . . . . . . . . . . . . . . . . . . . . . . . . . . . . . . . . .
. . . . . . . . . . . . . . . . . . . . . . . . . . . . . . . . . . . . . . . . . . . . . . . . . . . . . . . . . . . . . . . . . . . .
149
NOTe
S
149
NOTeS
. . . . . . . . . . . . . . . . . . . . . . . . . . . . . . . . . . . . . . . . . . . . . . . . . . . . . . . . . . . . . . . . . . . . . . . . . . . .
. . . . . . . . . . . . . . . . . . . . . . . . . . . . . . . . . . . . . . . . . . . . . . . . . . . . . . . . . . . . . . . . . . . .
. . . . . . . . . . . . . . . . . . . . . . . . . . . . . . . . . . . . . . . . . . . . . . . . . . . . . . . . . . . . . . . . . . . .
. . . . . . . . . . . . . . . . . . . . . . . . . . . . . . . . . . . . . . . . . . . . . . . . . . . . . . . . . . . . . . . . . . . .
. . . . . . . . . . . . . . . . . . . . . . . . . . . . . . . . . . . . . . . . . . . . . . . . . . . . . . . . . . . . . . . . . . . .
. . . . . . . . . . . . . . . . . . . . . . . . . . . . . . . . . . . . . . . . . . . . . . . . . . . . . . . . . . . . . . . . . . . .
. . . . . . . . . . . . . . . . . . . . . . . . . . . . . . . . . . . . . . . . . . . . . . . . . . . . . . . . . . . . . . . . . . . .
. . . . . . . . . . . . . . . . . . . . . . . . . . . . . . . . . . . . . . . . . . . . . . . . . . . . . . . . . . . . . . . . . . . .
. . . . . . . . . . . . . . . . . . . . . . . . . . . . . . . . . . . . . . . . . . . . . . . . . . . . . . . . . . . . . . . . . . . .
. . . . . . . . . . . . . . . . . . . . . . . . . . . . . . . . . . . . . . . . . . . . . . . . . . . . . . . . . . . . . . . . . . . .
. . . . . . . . . . . . . . . . . . . . . . . . . . . . . . . . . . . . . . . . . . . . . . . . . . . . . . . . . . . . . . . . . . . .
. . . . . . . . . . . . . . . . . . . . . . . . . . . . . . . . . . . . . . . . . . . . . . . . . . . . . . . . . . . . . . . . . . . .
. . . . . . . . . . . . . . . . . . . . . . . . . . . . . . . . . . . . . . . . . . . . . . . . . . . . . . . . . . . . . . . . . . . .
. . . . . . . . . . . . . . . . . . . . . . . . . . . . . . . . . . . . . . . . . . . . . . . . . . . . . . . . . . . . . . . . . . . .
. . . . . . . . . . . . . . . . . . . . . . . . . . . . . . . . . . . . . . . . . . . . . . . . . . . . . . . . . . . . . . . . . . . .
. . . . . . . . . . . . . . . . . . . . . . . . . . . . . . . . . . . . . . . . . . . . . . . . . . . . . . . . . . . . . . . . . . . .
. . . . . . . . . . . . . . . . . . . . . . . . . . . . . . . . . . . . . . . . . . . . . . . . . . . . . . . . . . . . . . . . . . . .
. . . . . . . . . . . . . . . . . . . . . . . . . . . . . . . . . . . . . . . . . . . . . . . . . . . . . . . . . . . . . . . . . . . .
. . . . . . . . . . . . . . . . . . . . . . . . . . . . . . . . . . . . . . . . . . . . . . . . . . . . . . . . . . . . . . . . . . . .
. . . . . . . . . . . . . . . . . . . . . . . . . . . . . . . . . . . . . . . . . . . . . . . . . . . . . . . . . . . . . . . . . . . .
. . . . . . . . . . . . . . . . . . . . . . . . . . . . . . . . . . . . . . . . . . . . . . . . . . . . . . . . . . . . . . . . . . . .
. . . . . . . . . . . . . . . . . . . . . . . . . . . . . . . . . . . . . . . . . . . . . . . . . . . . . . . . . . . . . . . . . . . .
. . . . . . . . . . . . . . . . . . . . . . . . . . . . . . . . . . . . . . . . . . . . . . . . . . . . . . . . . . . . . . . . . . . .

Defining sustainability indicators for Mediterranean Aquaculture
NOTeS
. . . . . . . . . . . . . . . . . . . . . . . . . . . . . . . . . . . . . . . . . . . . . . . . . . . . . . . . . . . . . . . . . . . . . . . . . . . .
. . . . . . . . . . . . . . . . . . . . . . . . . . . . . . . . . . . . . . . . . . . . . . . . . . . . . . . . . . . . . . . . . . . .
. . . . . . . . . . . . . . . . . . . . . . . . . . . . . . . . . . . . . . . . . . . . . . . . . . . . . . . . . . . . . . . . . . . .
. . . . . . . . . . . . . . . . . . . . . . . . . . . . . . . . . . . . . . . . . . . . . . . . . . . . . . . . . . . . . . . . . . . .
. . . . . . . . . . . . . . . . . . . . . . . . . . . . . . . . . . . . . . . . . . . . . . . . . . . . . . . . . . . . . . . . . . . .
. . . . . . . . . . . . . . . . . . . . . . . . . . . . . . . . . . . . . . . . . . . . . . . . . . . . . . . . . . . . . . . . . . . .
. . . . . . . . . . . . . . . . . . . . . . . . . . . . . . . . . . . . . . . . . . . . . . . . . . . . . . . . . . . . . . . . . . . .
. . . . . . . . . . . . . . . . . . . . . . . . . . . . . . . . . . . . . . . . . . . . . . . . . . . . . . . . . . . . . . . . . . . .
. . . . . . . . . . . . . . . . . . . . . . . . . . . . . . . . . . . . . . . . . . . . . . . . . . . . . . . . . . . . . . . . . . . .
. . . . . . . . . . . . . . . . . . . . . . . . . . . . . . . . . . . . . . . . . . . . . . . . . . . . . . . . . . . . . . . . . . . .
. . . . . . . . . . . . . . . . . . . . . . . . . . . . . . . . . . . . . . . . . . . . . . . . . . . . . . . . . . . . . . . . . . . .
. . . . . . . . . . . . . . . . . . . . . . . . . . . . . . . . . . . . . . . . . . . . . . . . . . . . . . . . . . . . . . . . . . . .
. . . . . . . . . . . . . . . . . . . . . . . . . . . . . . . . . . . . . . . . . . . . . . . . . . . . . . . . . . . . . . . . . . . .
. . . . . . . . . . . . . . . . . . . . . . . . . . . . . . . . . . . . . . . . . . . . . . . . . . . . . . . . . . . . . . . . . . . .
. . . . . . . . . . . . . . . . . . . . . . . . . . . . . . . . . . . . . . . . . . . . . . . . . . . . . . . . . . . . . . . . . . . .
. . . . . . . . . . . . . . . . . . . . . . . . . . . . . . . . . . . . . . . . . . . . . . . . . . . . . . . . . . . . . . . . . . . .
. . . . . . . . . . . . . . . . . . . . . . . . . . . . . . . . . . . . . . . . . . . . . . . . . . . . . . . . . . . . . . . . . . . .
. . . . . . . . . . . . . . . . . . . . . . . . . . . . . . . . . . . . . . . . . . . . . . . . . . . . . . . . . . . . . . . . . . . .
. . . . . . . . . . . . . . . . . . . . . . . . . . . . . . . . . . . . . . . . . . . . . . . . . . . . . . . . . . . . . . . . . . . .
. . . . . . . . . . . . . . . . . . . . . . . . . . . . . . . . . . . . . . . . . . . . . . . . . . . . . . . . . . . . . . . . . . . .
. . . . . . . . . . . . . . . . . . . . . . . . . . . . . . . . . . . . . . . . . . . . . . . . . . . . . . . . . . . . . . . . . . . .
. . . . . . . . . . . . . . . . . . . . . . . . . . . . . . . . . . . . . . . . . . . . . . . . . . . . . . . . . . . . . . . . . . . .
. . . . . . . . . . . . . . . . . . . . . . . . . . . . . . . . . . . . . . . . . . . . . . . . . . . . . . . . . . . . . . . . . . . .
150

151
NOTe
SNOTeS
. . . . . . . . . . . . . . . . . . . . . . . . . . . . . . . . . . . . . . . . . . . . . . . . . . . . . . . . . . . . . . . . . . . . . . . . . . . .
. . . . . . . . . . . . . . . . . . . . . . . . . . . . . . . . . . . . . . . . . . . . . . . . . . . . . . . . . . . . . . . . . . . .
. . . . . . . . . . . . . . . . . . . . . . . . . . . . . . . . . . . . . . . . . . . . . . . . . . . . . . . . . . . . . . . . . . . .
. . . . . . . . . . . . . . . . . . . . . . . . . . . . . . . . . . . . . . . . . . . . . . . . . . . . . . . . . . . . . . . . . . . .
. . . . . . . . . . . . . . . . . . . . . . . . . . . . . . . . . . . . . . . . . . . . . . . . . . . . . . . . . . . . . . . . . . . .
. . . . . . . . . . . . . . . . . . . . . . . . . . . . . . . . . . . . . . . . . . . . . . . . . . . . . . . . . . . . . . . . . . . .
. . . . . . . . . . . . . . . . . . . . . . . . . . . . . . . . . . . . . . . . . . . . . . . . . . . . . . . . . . . . . . . . . . . .
. . . . . . . . . . . . . . . . . . . . . . . . . . . . . . . . . . . . . . . . . . . . . . . . . . . . . . . . . . . . . . . . . . . .
. . . . . . . . . . . . . . . . . . . . . . . . . . . . . . . . . . . . . . . . . . . . . . . . . . . . . . . . . . . . . . . . . . . .
. . . . . . . . . . . . . . . . . . . . . . . . . . . . . . . . . . . . . . . . . . . . . . . . . . . . . . . . . . . . . . . . . . . .
. . . . . . . . . . . . . . . . . . . . . . . . . . . . . . . . . . . . . . . . . . . . . . . . . . . . . . . . . . . . . . . . . . . .
. . . . . . . . . . . . . . . . . . . . . . . . . . . . . . . . . . . . . . . . . . . . . . . . . . . . . . . . . . . . . . . . . . . .
. . . . . . . . . . . . . . . . . . . . . . . . . . . . . . . . . . . . . . . . . . . . . . . . . . . . . . . . . . . . . . . . . . . .
. . . . . . . . . . . . . . . . . . . . . . . . . . . . . . . . . . . . . . . . . . . . . . . . . . . . . . . . . . . . . . . . . . . .
. . . . . . . . . . . . . . . . . . . . . . . . . . . . . . . . . . . . . . . . . . . . . . . . . . . . . . . . . . . . . . . . . . . .
. . . . . . . . . . . . . . . . . . . . . . . . . . . . . . . . . . . . . . . . . . . . . . . . . . . . . . . . . . . . . . . . . . . .
. . . . . . . . . . . . . . . . . . . . . . . . . . . . . . . . . . . . . . . . . . . . . . . . . . . . . . . . . . . . . . . . . . . .
. . . . . . . . . . . . . . . . . . . . . . . . . . . . . . . . . . . . . . . . . . . . . . . . . . . . . . . . . . . . . . . . . . . .
. . . . . . . . . . . . . . . . . . . . . . . . . . . . . . . . . . . . . . . . . . . . . . . . . . . . . . . . . . . . . . . . . . . .
. . . . . . . . . . . . . . . . . . . . . . . . . . . . . . . . . . . . . . . . . . . . . . . . . . . . . . . . . . . . . . . . . . . .
. . . . . . . . . . . . . . . . . . . . . . . . . . . . . . . . . . . . . . . . . . . . . . . . . . . . . . . . . . . . . . . . . . . .
. . . . . . . . . . . . . . . . . . . . . . . . . . . . . . . . . . . . . . . . . . . . . . . . . . . . . . . . . . . . . . . . . . . .
. . . . . . . . . . . . . . . . . . . . . . . . . . . . . . . . . . . . . . . . . . . . . . . . . . . . . . . . . . . . . . . . . . . .
151
Defining sustainability indicators for Mediterranean Aquaculture
NOTeS
. . . . . . . . . . . . . . . . . . . . . . . . . . . . . . . . . . . . . . . . . . . . . . . . . . . . . . . . . . . . . . . . . . . . . . . . . . . .
. . . . . . . . . . . . . . . . . . . . . . . . . . . . . . . . . . . . . . . . . . . . . . . . . . . . . . . . . . . . . . . . . . . .
. . . . . . . . . . . . . . . . . . . . . . . . . . . . . . . . . . . . . . . . . . . . . . . . . . . . . . . . . . . . . . . . . . . .
. . . . . . . . . . . . . . . . . . . . . . . . . . . . . . . . . . . . . . . . . . . . . . . . . . . . . . . . . . . . . . . . . . . .
. . . . . . . . . . . . . . . . . . . . . . . . . . . . . . . . . . . . . . . . . . . . . . . . . . . . . . . . . . . . . . . . . . . .
. . . . . . . . . . . . . . . . . . . . . . . . . . . . . . . . . . . . . . . . . . . . . . . . . . . . . . . . . . . . . . . . . . . .
. . . . . . . . . . . . . . . . . . . . . . . . . . . . . . . . . . . . . . . . . . . . . . . . . . . . . . . . . . . . . . . . . . . .
. . . . . . . . . . . . . . . . . . . . . . . . . . . . . . . . . . . . . . . . . . . . . . . . . . . . . . . . . . . . . . . . . . . .
. . . . . . . . . . . . . . . . . . . . . . . . . . . . . . . . . . . . . . . . . . . . . . . . . . . . . . . . . . . . . . . . . . . .
. . . . . . . . . . . . . . . . . . . . . . . . . . . . . . . . . . . . . . . . . . . . . . . . . . . . . . . . . . . . . . . . . . . .
. . . . . . . . . . . . . . . . . . . . . . . . . . . . . . . . . . . . . . . . . . . . . . . . . . . . . . . . . . . . . . . . . . . .
. . . . . . . . . . . . . . . . . . . . . . . . . . . . . . . . . . . . . . . . . . . . . . . . . . . . . . . . . . . . . . . . . . . .
. . . . . . . . . . . . . . . . . . . . . . . . . . . . . . . . . . . . . . . . . . . . . . . . . . . . . . . . . . . . . . . . . . . .
. . . . . . . . . . . . . . . . . . . . . . . . . . . . . . . . . . . . . . . . . . . . . . . . . . . . . . . . . . . . . . . . . . . .
. . . . . . . . . . . . . . . . . . . . . . . . . . . . . . . . . . . . . . . . . . . . . . . . . . . . . . . . . . . . . . . . . . . .
. . . . . . . . . . . . . . . . . . . . . . . . . . . . . . . . . . . . . . . . . . . . . . . . . . . . . . . . . . . . . . . . . . . .
. . . . . . . . . . . . . . . . . . . . . . . . . . . . . . . . . . . . . . . . . . . . . . . . . . . . . . . . . . . . . . . . . . . .
. . . . . . . . . . . . . . . . . . . . . . . . . . . . . . . . . . . . . . . . . . . . . . . . . . . . . . . . . . . . . . . . . . . .
. . . . . . . . . . . . . . . . . . . . . . . . . . . . . . . . . . . . . . . . . . . . . . . . . . . . . . . . . . . . . . . . . . . .
. . . . . . . . . . . . . . . . . . . . . . . . . . . . . . . . . . . . . . . . . . . . . . . . . . . . . . . . . . . . . . . . . . . .
. . . . . . . . . . . . . . . . . . . . . . . . . . . . . . . . . . . . . . . . . . . . . . . . . . . . . . . . . . . . . . . . . . . .
. . . . . . . . . . . . . . . . . . . . . . . . . . . . . . . . . . . . . . . . . . . . . . . . . . . . . . . . . . . . . . . . . . . .
. . . . . . . . . . . . . . . . . . . . . . . . . . . . . . . . . . . . . . . . . . . . . . . . . . . . . . . . . . . . . . . . . . . .
152

In partnership with:
Developed by:
www.mediterraneon.es