Spatial distribution of biomass consumption as energy in rural areas of the Indo-Gangetic plain
11
This article appeared in a journal published by Elsevier. The attached copy is furnished to the author for internal non-commercial research and education use, including for instruction at the authors institution and sharing with colleagues. Other uses, including reproduction and distribution, or selling or licensing copies, or posting to personal, institutional or third party websites are prohibited. In most cases authors are permitted to post their version of the article (e.g. in Word or Tex form) to their personal website or institutional repository. Authors requiring further information regarding Elsevier’s archiving and manuscript policies are encouraged to visit: http://www.elsevier.com/copyright
-
Upload
independent -
Category
Documents
-
view
4 -
download
0
Transcript of Spatial distribution of biomass consumption as energy in rural areas of the Indo-Gangetic plain

This article appeared in a journal published by Elsevier. The attachedcopy is furnished to the author for internal non-commercial researchand education use, including for instruction at the authors institution
and sharing with colleagues.
Other uses, including reproduction and distribution, or selling orlicensing copies, or posting to personal, institutional or third party
websites are prohibited.
In most cases authors are permitted to post their version of thearticle (e.g. in Word or Tex form) to their personal website orinstitutional repository. Authors requiring further information
regarding Elsevier’s archiving and manuscript policies areencouraged to visit:
http://www.elsevier.com/copyright
Author's personal copy
Spatial distribution of biomass consumption as energy inrural areas of the Indo-Gangetic plain
T. Saud a,b,*, D.P. Singh b, T.K. Mandal a, Ranu Gadi b, H. Pathak c, M. Saxena a,S.K. Sharma a, R. Gautam a, A. Mukherjee a, R.P. Bhatnagar a
aNational Physical Laboratory, Council of Scientific and Industrial Research (CSIR), New Delhi-110012, Indiab Indira Gandhi Institute of Technology, Guru Gobind Singh Indraprastha University, Delhi-110006, IndiacDivision of Environmental Sciences, Indian Agricultural Research Institute, New Delhi-110012, India
a r t i c l e i n f o
Article history:
Received 26 May 2010
Received in revised form
27 August 2010
Accepted 1 November 2010
Available online 23 November 2010
Keywords:
Biomass
Indo-Gangetic plain
Crop residues
Fuelwood
Dung cake
a b s t r a c t
Biomass is widely used as energy source in rural households in India. Biomass samples and
socio-economic data have been collected at district level in the rural areas of Indo-Gangetic
plain (IGP), India to determine the emissions of trace gases and aerosols from domestic
fuels. Dung cake, fuelwood and crop residue are main sources of energy in rural areas of
the IGP. Dung cake is the major domestic fuel (80e90%) in the rural areas of Delhi, Punjab,
Haryana, Uttar Pradesh, Bihar and West Bengal, whereas, 99% of rural households in
Uttarakhand use wood as the main energy source. Using crop production data and usage of
crop residues as energy, new consumption values have been estimated (21.13 Mt). Present
information on the domestic fuel usage would be helpful in determining budgets estimates
of trace gases and aerosols for India.
ª 2010 Elsevier Ltd. All rights reserved.
1. Introduction
Energy is an integral part of a society playing an important role
in its socio-economic development by raising the standard of
living and the quality of life. The state of economic develop-
ment of any region can be assessed from the pattern and
consumption quality of its energy. Energy demand increases
as the economy grows bringing along a change in the
consumption pattern of energy, which, in turn, varies with its
source and availability. Through the different stages of devel-
opment, humankind has experimented on various sources of
energy ranging from wood, coal, oil and petroleum to nuclear
power. But indiscriminate exploitation of natural resources
and unplanned developmental activities have led to serious
ecological and environmental problems. For the purpose of
space heating and food preparation, especially in rural areas,
fuelwood, crop residue and dried animal manure are burnt in
traditional domestic stoves (chulhas) and cookers with low
combustionefficiency.Use of traditional fuelmayhave serious
consequences on human health too [3].
Biomass burning is an important source of trace gases and
aerosol which effect on atmospheric chemistry and radiation
budget of the earth [1,2]. Quantitative information on biomass
burning is necessary to understand the source and sinks of
the atmospheric trace gases and aerosols. The latest National
Ambient Air Quality Standards released by Ministry of Envi-
ronment and Forest, India [4] requires the daily average
concentration of PM10 (particulate matter less than 10 mm in
* Corresponding author. Radio and Atmospheric Sciences Division, National Physical Laboratory, Council of Scientific and IndustrialResearch (CSIR), Dr. K. S. Krishnan Marg, New Delhi-110012, India. Tel.: þ91 11 45609448; fax: þ91 11 45609310.
E-mail address: [email protected] (T. Saud).
Avai lab le at www.sc iencedi rect .com
ht tp : / /www.e lsev ier . com/ loca te /b iombioe
b i om a s s an d b i o e n e r g y 3 5 ( 2 0 1 1 ) 9 3 2e9 4 1
0961-9534/$ e see front matter ª 2010 Elsevier Ltd. All rights reserved.doi:10.1016/j.biombioe.2010.11.001
Author's personal copy
diameter) to be less than 100 mg m�3 and annual average to
be less than 60 mg m�3. In contrast, concentration of PM10
ranges from 500 to 2000 mg m�3 during cooking in typical
Indian households [5]. In addition, smoke contains high level
of pollutants like carbon monoxide, oxides of nitrogen and
sulphur, formaldehyde, benzo(a)pyrene and benzene, which
are hazardous for human health [3]. Besidesmorbidity, indoor
air pollution from biomass burning in developing countries is
believed to be responsible for an estimated 2.2e2.5 million
premature deaths every year [6]. India alone registers over 0.6
million premature deaths per year that can be attributed to
use of biomass fuel [7].
Biomass (fuelwood, animal dung, crop residue) is widely
used as a source of energy in developed as well as developing
countries. Every year more than 120 million tones of biomass
residues are generated in SoutheEast Asia [8] and provide
26% of total primary energy supply [9]. In China, total biomass
productioncomprisesofagricultural residues (57.7%), fuelwood
(39.2%) and animal waste (3.2%) [10]; whereas, biomass energy
consumption in Pakistan, Philippines and Sri Lanka are 2.72,
1.36 and 1.51 EJ respectively [11,12,13]. Approximately 80% of
rural households in India use unprocessed solid biomass such
as wood, dung and agricultural residues for domestic cooking
and room heating [14]. Joshi [15] reported the predominance of
firewood usage in rural areas with per capita consumption
(national aggregates in 1992) of 1.10e1.34 kg day�1. The per
capita consumption of dung cake and agricultural residue is
0.47e0.63 and 0.40e0.49 kg day�1 respectively. The rural energy
database generated across the agro climatic zones showed
significant variation in firewood. According to Mahapatra and
Mitchell [16], socio-economic factors influence the bioenergy
use in rural India. But scarcity of forests does not lower the
demand for biofuels. Natarajan [17] showed that firewood
constituted 61.2% of total rural household energy in 1992e93 as
against 54.57% in 1978e79. Sinha et al. [18] reported that
contribution of firewood has remained around 65% of the rural
energy during the last three decades. The demand of fuelwood
in rural areas for domestic needs in 1991 was 180 million tons
(Mt), with the average consumption in villages being
1.22 kg day�1. Misra et al. [19] reported that 49% of domestic
energy used for cooking and heating was from biomass. Fuel-
wood was the only fuel used by all the income groups.
The present study has been carried out across the Indo-
Gangetic Plains (IGP) of India. The IGP is the major source of
pollutants over India due to the usage of biomass fuels as
energy. Moreover, due to rapid urbanization and industriali-
zation over this region, geographical distribution of pollutants
has changed. These pollutants affect the air quality as well as
climate of the region. Availability of large amount of crop
residues over the IGP due to high yielding wheat and rice
varieties has enabled the population to use it as source of
energy. There is limited information on the consumption
pattern of biomass fuels as energy source over the IGP of India.
In the present study biomass fuel samples and socio-
economic information data are collected at district level over
IGP to estimate the trace gas and aerosol emission budget.
Availability of bio-resource is highly diversified as it is influ-
enced bymeteorological, geographic and also to certain extent
the socio-economic status of the people. Using information
on crop production and pattern of agricultural residue
consumption collected during survey, amount of consump-
tion of crop residues over the IGP area is estimated and
compared with available published data.
2. Sampling area
The IGP is a great alluvial crescent stretching from the Indus
River system in Pakistan to the Punjab Plain (in both Pakistan
and India) and the Haryana Plains to the delta of the river
Ganga in Bangladesh. Topographically the plain is homoge-
neous, with only floodplains and other related features of the
river erosion and changes in river channels forming important
natural features. The IGP is sometimes divided into three
parts: the IndusValley (mostly in Pakistan), the Punjab (divided
between India and Pakistan) and Haryana plains, and the
middle and lower Ganga. These regional distinctions are based
primarily on the availability of water. IGP, India comprises of
the states of Uttarakhand, Punjab, Haryana, Uttar Pradesh
(UP), Bihar and West Bengal. Indian IGP can be divided into
sub-regions: the Trans-Gangetic Plains (TGP: Uttarakhand,
Punjab and Haryana) and the Gangetic Plains (U.P., Bihar and
West Bengal). The Gangetic Plains of UP thereby comprises the
Upper-Gangetic Plains and part of the Middle-Gangetic Plains.
Bihar comprises most of the Middle-Gangetic Plains andWest
Bengal, the Lower-Gangetic Plains. Each sub-region comprises
of various agro-ecological subzones as described in the clas-
sification by Narang and Virmani [20] and Kumar et al. [21].
Samples of domestic biomass fuels and information on
biomass fuel usages have been collected at district level in
rural areas of Punjab, Haryana, Delhi, Uttar Pradesh, Uttarak-
hand, Bihar and West Bengal of Indo-Gangetic Plain (IGP).
Areas of sampling are shown in Fig. 1.
3. Methodology
Samples of biomass fuels have been collectedmostly from the
households of low- tomedium income groupswhere themain
occupation is either being employed in government sector or
self employed in the agricultural fields. We have categorized
household biomass fuels into three different types: residues
of all agricultural crops as agricultural biomass (crop residue),
all types of wood used as fuelwood and faeces of domestic
animals used as energy under dung cakes (Table 1). Data on
crop yield are also collected to correlate the usage of biomass
as fuel and crop production. Using ratio of this crop produc-
tion and consumption of agricultural residues, the consump-
tion of biomass as fuel has been estimated.
During thesurvey,wehavechosentwovillages (sites)of two
different subdivisions in each district to get the representative
data for each district. In addition,while collecting biomass fuel
samples, we have followed three criteria for choosing two
villages (sites) e.g., (i) population of the village must be within
the range of 2000e20,000, (ii) about 50e90% of inhabitants of
the village should use biomass as their primary source of
energy for their household activities (iii) two sites must be
away from district head quarters by 10e15 km. We have also
correlated the use of biomass fuels with the economic
constraints as well as availability of biomass fuels.
b i om a s s a n d b i o e n e r g y 3 5 ( 2 0 1 1 ) 9 3 2e9 4 1 933

Author's personal copy
The survey of the village has been conducted by using
semi-structured interviews. Details of people, resources,
infrastructure, crop yield, availability of fuelwood, dung cake
used in the village and other significant aspects of village
livelihood are collected from village leader on discussion with
villagers. Particular attention is given to the management of
crop residues. Questionnaire was developed to collect infor-
mation of crop yield in that area, type of biomass fuels used as
energy and their percentage, percentage of chulha and LPG
used for cooking, approximate percentage of service holders,
cultivators and self employed etc. It has been observed over
the study area that the fluctuation of use of biomass fuels
strongly depend on economic stability as well as easy avail-
ability of biomass fuels.
We have compared our present observation with two
reported data sets viz, the TERI Energy Data Directory Year-
book (TEDDY) and National Family Health Survey (NFHS-3).
4. Results and discussion
In SoutheEast Asia, biomass is the major source of energy
nearly accounting for 33% of the country’s energy usage
reaching levels as high as 75e90%. Fuelwood is mostly used
for cooking and heating purposes. When scarcity arises,
fuelwood is substituted by crop residues and animal dung.
The IGP is considered as a study area for detail understanding
of fuel consumption pattern as a source of energy.
4.1. Variation of biomass fuel consumption over IGP
Present study has been carried out across the IGP, comprising
the states of Uttarakhand, Punjab, Haryana, Delhi, Uttar Pra-
desh (U.P.), Bihar and West Bengal. The pattern of biomass
fuels consumption for energy in rural area has been deter-
mined by surveying several villages of Indo-Gangetic plain.
It has been observed that pattern of consumption of biomass
fuels have varied widely according to agro-climate zones.
We will discuss the consumption pattern of biomass fuels as
a source of energy in different states of the IGP.
Fig. 1 e Areas of sampling over Indo-Gangetic plain.
Table 1 e Types of biomass used as fuels.
Domestic biomass Species
Agricultural biomass (crop residue):
Straw Wheat, Paddy, Barley, Pulses etc.
Stalk Cotton, Maize, Arhar, Mustard,
Sesame, Chilly
Bagasse, Tops
and Leaves
Sugarcane
Cobsa Maize
Huska Paddy
Shellsa Groundnut
Fuelwood Woody
Dung cake Cattle dung
a Processing residue.
b i om a s s an d b i o e n e r g y 3 5 ( 2 0 1 1 ) 9 3 2e9 4 1934
Author's personal copy
4.1.1. UttarakhandThe state of Uttarakhand is situated in the northern part of
India and geographical area lies between latitude 28� 430 and31� 280 Nand longitude 77� 340 and 81� 030 E. As per Census 2001[22], the total population of the state is 8.48 million of which
the rural population is 73.33%. This state is almost covered
by mountains. This state comprises of three different climate
zones: tropical, sub-tropical and temperate. The climate can
be divided into three different zones: rainy (mid JuneeSep-
tember), winter (OctobereFebruary) and summer (Marchemid
June). The percentage of cultivators in this region is found to
be approximately 60e70%.
Thepeople of this state dependonly on fuelwood asprimary
energy for cooking. Hence consumption of fuelwood is more
in this region as compared to other regions of the IGP. Kumar
and Sharma [23] have reported the fuelwood consumption
pattern at different altitudes in rural areas of Garhwal Hima-
layas and availability of fuelwood over these regions. House-
holds mostly use fuelwood e.g., Pine (61%), Quercus sp. (35%),
Rhododren (26%),Grewia sp. (22%),Azadirachtasp. (9%),Eucalyptus
(17%) and Shorea sp. (9%) as mixed fuel for cooking (Fig. 2).
Averageconsumptionof fuelwoodvaries from1.50kgpercapita
per day (summer) to 2.50 kg per capita per day (winter) [23,24].
This consumption value is higher than Central Himalayas
region (1.49 kg per capita per day). Chetri et al. [25] and Sati [26]
havealso reportedhigher fuelwoodconsumption in this region.
Unlike other regions of India, where forest resources are
not sufficient, people use easily available agricultural residues
and dung cake as alternate source of energy for cooking. In
this region, agricultural residues are used as food for the
livestock. Due to the decrease of livestock in this region,
availability of dung cakes from animal faeces is very less. Most
of the animal faeces are used as farmyard manure. Another
probable reason for not using dung cakes in this region is that
due to high humidity and less sunshine and it is quite
a tedious task to prepare dried dung cakes. Usage of animal
faeces as dung cake for cooking is not reported anywhere in
this region.
4.1.2. HaryanaThe geographical area of Haryana lies between latitude 27� 390
and 30� 550N and longitude 74� 270 and 77� 360E. Physio-
graphically, the state is divided into three zones viz. the
Shiwaliks, the Aravali hills and the Indo-Gangetic plains. The
sub-region has a semi-arid climate and a sauce-shaped
topography. Annual rainfall ranges from 400 to 700 mm in
surveyed zones, with a marked seasonality (some 80% falling
in JuneeSeptember). The total population of the state is 21.14
million of which the rural population constitutes 70.08% [22].
Most of the village households (90%) use Chulha for cooking.
Usage of LPG as primary energy product in rural households
is rare and restricted to high income group households only.
Irrigation infrastructure in this state is so extensive that in
2000e2001 the irrigated area of Haryana was 84% of total land.
Agriculture is the main occupation of the population. The
major crops in this state are rice, wheat, sugarcane, pulses and
cereals. Erenstein et al. [27] have also reported that the agri-
cultural residue of wheat and rice is used as ex-situ feed. Of
course, farmers do not consider the residue of coarse grain rice
as animal feed; rather they prefer to in-situ burning. Similarly,
top of sugarcane is also used as animal feed. These observa-
tions match with our present survey. Households do not
consider rice and wheat residue as energy for cooking. Joon
et al. [28] have surveyed on household energy consumption
pattern and socio-cultural dimensions in Jhajjar district of
Haryana. Apart from rice andwheat residue, other agricultural
residues like Gossypium sp. (50%), Cayanus sp. (28%) and Jantar
(28%) are used in households for cooking (Fig. 2).
Since average livestock is more in Haryana (2.5 heads per
village household) than other IGP regions, availability of
potential quantity of dung from animal faeces in Haryana is
observed. Out of total dung available, 58% of it is used as
farmyardmanure, 40% is used as fuel and 2% is used for biogas
generation [27]. Beri et al. [29] reported that 72% of dung is
used as farmyard manure, 21% as cakes for energy and 7%
for biogas plants. In our present survey it is observed that
100% of households of total number of sampling sites use
dung cake as primary fuel for cooking. It has been observed
that bigger sizes of dung cake are stored for the whole year for
cooking purposes. This is probably due to the reason that the
weather in this region is quite hot and dry and dried dung
cakes made by the people of the area can be stored easily for
future requirement throughout the year.
In addition to the usage of crop residues and dung cakes, it
has been observed that households use fuelwood e.g., Keekar
(61%), Azadirchta sp. (11%),Mulberry sp. (11%), Eucalyptus (17%),
Populous sp. (33%) for cooking generally as a mixed fuel. Usage
of these fuelwood is restricted to lower income group of the
village since this fuelwood are picked from unguarded forest
cover in that locality. Our present observations on the
consumption pattern of all the biomass fuels are almost same
with the values reported by TEDDY [30] but differ in case of
consumption pattern of dung cake.
4.1.3. PunjabPunjab, an intensively cultivated state having more than
84% of total area under agriculture, is situated in the north-
western part of India and lies between latitude 29� 330 and32� 320N and longitude 73� 530 and 76�560E. Physiographically,the state can be divided into three regions viz. mountain
Himalayas, sub mountainous Himalayas and eastern and
Western Alluvial plains. As per Census 2001 [22], the total
population of the state is 24.29 million of which the rural
population constitute 66.10%. Since Punjab is a part of trans-
Gangetic Plain, Punjab has semi-arid climate with annually
400e700mm rainfall. Due to large crop productivity in Punjab,
economic standard has increased substantially as compared
to other regions of IGP. As a result, 30% of households in the
village use LPG as a primary energy for cooking and pattern is
different from any other IGP states. Of course, 70% people use
traditional chulha for cooking. It has also been observed that
few households use chulha with the belief that food cooked
is tastier on chuhla although they can afford to use LPG.
Approximately, 70% people in the village area are cultiva-
tors in this state. During monsoon season rice, pulses and
other cereals are grown which are harvested in autumn
(kharif), whereas, during winter season (rabi), major crops are
wheat, cotton, sugarcane and pulses etc which are harvested
in spring season. As discussed earlier, like Haryana residues
generated fromwheat, fine rice and top of sugarcane are used
b i om a s s a n d b i o e n e r g y 3 5 ( 2 0 1 1 ) 9 3 2e9 4 1 935
Author's personal copy
b i om a s s an d b i o e n e r g y 3 5 ( 2 0 1 1 ) 9 3 2e9 4 1936
Author's personal copy
as ex-situ animal feed, whereas, coarse grain rice is mostly
burnt in the field before tilling and sawing of another crop. In
Punjab, the effect on such in-situ crop residue burning on the
atmosphere is studied by Badrinath et al. [31] using satellite
data. Households use other agricultural residues e.g., Jantar
(25%) and Gossypium sp. (25%) as fuels for cooking (Fig. 2).
Like Haryana, average livestock density (3.3 heads per
household in village) in Punjab is more than other IGP regions
[32]. Potential quantity of dung is also available in this state.
Use of chemical fertilizer in this state is universal and more
than any other states of India, but due to degrading soil quality
[33,34], use of dung as farmyard manure is also increasing in
this state to sustain the productivity. Beri et al. [29] have found
that inPunjab, animaldung ismostlyusedas farmyardmanure
(72%) as compared to its use as fuel (21%) and production of
biogas (7%). Results of recent survey in Patiala [32] shows that
potential amount of animal dung is used as fuel (40%) in
addition to its use as farmyard manure and for biogas gener-
ation.Ourpresent survey shows that 88%villagehouseholdsof
Punjab use dung cakes as primary fuel for cooking. This is less
as compared to thehouseholds ofHaryanaand itmaybedue to
better economic development of this state.
The village households use available fuelwood as a mixed
fuel in this state. In Punjab, fuelwood likeAzadirachta sp. (53%),
Mulberry sp. (38%), Dalbergia sisso sp. (25%), Eucalyptus (31%),
Keekar (16%) and Populous sp. (16%) (Fig. 2) are used for cooking.
Like Haryana, it is noticed that use of fuelwood collected from
unguarded forest areas is mostly restricted to lower income
group. The pattern for consumption of biomass fuels reported
by TEDDY [30] is almost similar to that of Haryana (Fig. 4).
4.1.4. DelhiDelhi, the capital state of India is located on the bank of the
river Yamuna. It lies between latitude 28� 220 to 28� 540N and
longitude 76� 480 to 77� 230E. Delhi lies almost in the Trans-
Gangetic plains. The total population of Delhi is 13.85 million
[22]. The urban population is 93.18% and rural is 6.82%.
Mostly, the migrated people of lower income group reside in
small temporary houses. These groups are potential users of
biomass fuels as energy in Delhi. We have done the survey for
only those regions where people of lower income group reside
and the border areas of Delhi.
Lower income group (100%) households of Delhi use dung
cake as fuel. This dung is mostly available from surrounding
local areas. Due to availability of large amount of unguarded
forest cover, the use of fuelwood is reported to be more than
expected value. Generally, the fuelwood is picked up dried
twigs from the unguarded forest areas all over Delhi. During
the present survey, it has been noticed that lower income
groups have used Keekar (70%), Azadirachta sp. (20%), Mulberry
sp. (10%) and Dalbergia sp. (10%) for cooking as a mixed fuel
(Fig. 2). Due to non-availability of cultivation land in Delhi, no
crop residue is available for fuel. However, some of the
household use crop residue and it may be only available when
they are transported from outside and sold to the lower
income group in cheaper prices. It has been noticed that only
mustard stem is used as agricultural residue (10%) (Fig. 4).
4.1.5. Uttar PradeshThe most populous state of the country Uttar Pradesh is sit-
uated between 23� 520 and 30� 240N latitude and 77� 050 and 84�
380E longitude neighboring Punjab, Haryana, Delhi, Uttarak-
hand Bihar, and western Nepal. The state can be divided into
two physiographic zones namely; the vast Gangetic plains
having highly fertile alluvial soil and the smaller southern hill
plateau having predominantly rocky strata. The state covers
from semi-arid to sub-humid climate with an annual rainfall
ranging from 700 to 1300 mm with a highly seasonal distri-
bution. The population of the state is 166.05 million [22]. Rural
and urban population is 79.22% and 20.78% respectively. Here
also around 90% people use chulha for cooking.
Crop production is themajor source of incomeof the general
population. On average, in the monsoon season, the village
cropped area is allocated to rice (30%), sugarcane (22%), horti-
culture crops (10%), other cereals (9%), fodder crops (5%) and
pulses/oilseeds (3%) [35]. U.P. is one of themajorwheat, rice and
sugarcane producing state. Beri et al. [29] estimated that 22% of
rice straw and 10% of wheat straw are burned in-situ in U.P.
Burning of the cereal residue is prominent over northwest and
central UP, whereas rice straw burning is limited and wheat
strawburning is almost absent. Crop residuemanagement over
UP can be seen as ex-situ animal feed (100%), in-situ grazing
(67%), non-feed use (50%) and in-situ burning (0e67%). Rest of
crop residues consist of Brassica sp. (41%), cayanas sp. (23%) and
maize (9%)andaresupposed tobeusedasfuel for cooking (Fig. 2).
Average livestock availability in western part of U.P. is on
an average comparable to Haryana and Punjab (2.1e2.2 heads
per village household) in contrast to easternU.P. (0.7 heads per
village household). Consumption of dung as farmyardmanure
ismore inwesternU.P. (52%) as compared to easternU.P. (47%)
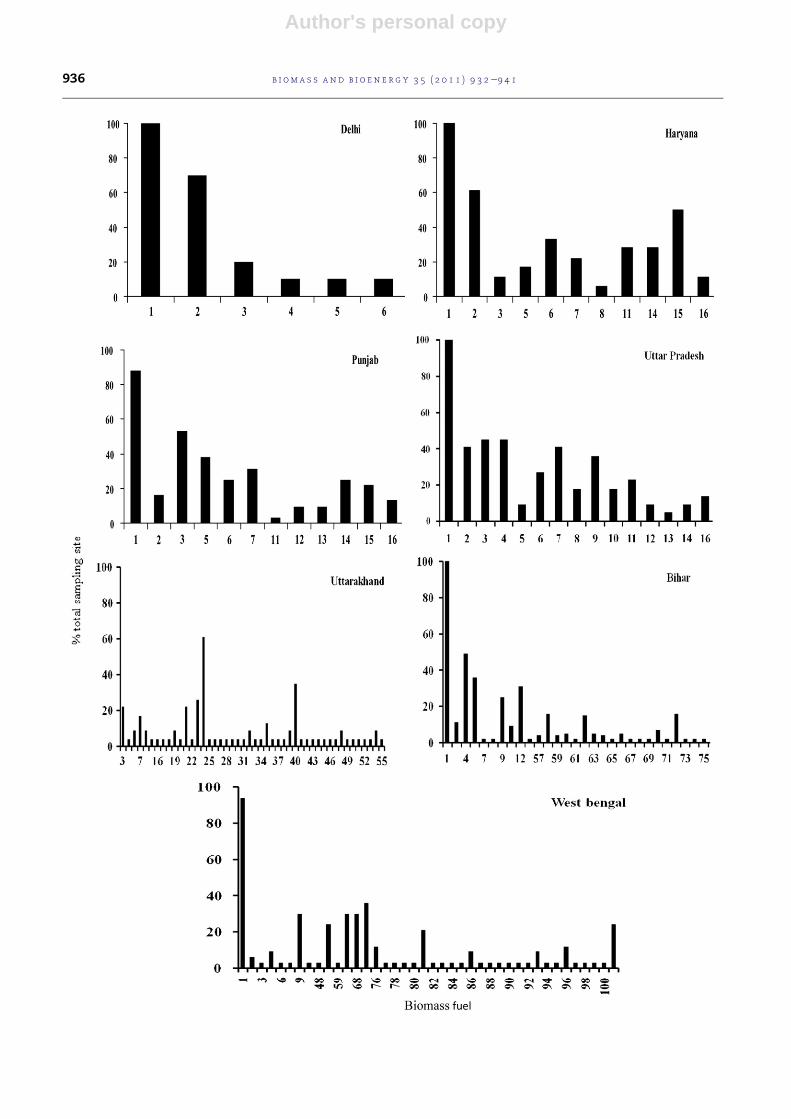
Fig. 2 e Distribution of Biomass fuel uses over Indo-Gangetic plain. 1. Dung Cake; 2. Acacia sp.; 3. Azadirachta sp; 4. Brassica
sp.; 5. Morus sp.; 6. Dalbergia sp.; 7. Eucalyptus sp.; 8. Oleum sp.; 9. Mangifera sp.; 10. Castor sp.; 11. Cajanas sp.; 12. Maize;
13. Ficus sp.;14. Coriandrum sp.; 15. Gossypium sp.; 16. Populus sp.;17.Asheta; 18. Bark of spruce; 19. Bel; 20. Betan; 21.
Grewia sp.; 22. Borial; 23. Rododendron; 24. Pinus sp.; 25. Dhara; 26. Dhola; 27. Fedo; 28. Gum; 29. Haldu; 30. Karonda; 31.
Kemu; 32. Kharik; 33. Kharsa; 34. Kigri; 35. Kuri; 36. Latten; 37. Mahal; 38. More; 39. Pyrus commonis sp.; 40. Quercus sp.; 41.
Ongal; 42. Pariya; 43. Reindel; 44 Rohini; 45. Roria; 46. Ryne; 47. Tectona grandis; 48. Shorea robusta sp.; 49. Suttar; 50.
Melanoxylon sp.; 51. Timara; 52. Tungla; 53. Tunn; 54. Utish; 55. Vasinda; 56.Adu; 57. Acacia sp.; 58. Bambusa sp.; 59. Musa
acuminata; 60. Solanummelongena sp.; 61. Capsicum sp.; 62. Coal cake; 63. Coriander stem; 64. Dencha; 65. Psidium sp.; 66.
Corchorus sp.; 67. Kanhaya; 68. Kariya; 69. Hibiscus sp.; 70. Mahua 22. Mangifera sp.; 71. Meetha neem (azadirachta sp.); 72.
Oriza sp.; 73. Sikad; 74. Soccharum sp.; 75. Helianthus sp.; 76. Triticum sp.; 77. Terminalia sp.; 78. Bera kalmi; 79. Besharam;
80. Bhabri; 81. Coconut; 82. Dupa; 83. Tamarind sp.;84. Flower straw; 85. Gamari; 86. Arachis hypogea sp.; 87. Jinni; 88.
Kadam; 89. Arto carpus sp.; 90. Mealleetun; 91. Vigna Mungo sp.; 92. Palm leaves; 93. Butea sp.; 94. Solanum sp.; 95.
Resham; 96. Sirish; 97. Sonajhuri; 98. Sourajhum; 99. Supari; 100. Chamelia sinesis sp.; 101. Sesame.
b i om a s s a n d b i o e n e r g y 3 5 ( 2 0 1 1 ) 9 3 2e9 4 1 937

Author's personal copy
[35]. Earlier survey [29] shows that 65% dung is used as farm-
yard manure, 26% as dung cakes, whereas, 9% is used for
biogas plants. Recent survey [35] shows that only 45% of dung
is used as fuel, 54% is used as farmyardmanure and 1% is used
for biogas. In the present study, it is estimated that 100% of
village households use dung cake as primary energy for
cooking. It is also observed that bigger size dung cakes are
dried and stored in a place for the whole year for cooking
purposes. The same pattern is also noticed in Haryana and
Punjab. Fuelwood e.g., Keekar (41%), Azadirachta sp. (45%),
Eucalyptus (41%), Dalbergia sisso sp.(27%), Mangifera sp.(36%)
and Populous sp. (14%) are used as mixed fuel. Unlike Haryana
and Punjab, generally village households of all income groups
use fuelwood as mixed fuel for cooking.
4.1.6. BiharGeographical area of Bihar lies between latitude 24� 160 and 27�
450N and longitude 83�160 and 88�300E. It is also situated in the
eastern part of India and lies in the lower Indo-Gangetic plain.
Thetotalpopulationofthestate is82.88million[22].Ofthis, rural
population is 89.50% and urban is 10.50%. Bihar is characterized
by a hot sub-humid climate with annual rainfall in the range of
1000e1500 mm (with 85% falling in JuneeSeptember), the
presence of low-lying flood-prone areas, periodically changing
river courses, and a diversity of rice-based cropping systems. In
Bihar, for rural households with access to land, the major
activity is crop production. Seasonal cropping patterns are
distinct and influenced by variation in topography, soils, depth
to ground water, and availability of reliable irrigation. We have
surveyed 34districts out of 38districts exceptWest Champaran,
Shekhpura, Jehanabad, Arwal. The main livelihood activities
were crop farming, farm labour, employed outside district,
livestock rearing and self employed. Practicing agriculture,
whether crop or animal, is the main livelihood source for
75e95% of households. Thorpe et al. [36] have reported that
53e64% of village households depend on agriculture in three
districts: Bhojpur, Samastipur and Begusarai. About 90% people
of this state in rural areas use chulha for cooking.
Bihar comprises 17% of the riceewheat system area of the
IGP in India [37]. The riceewheatsystemparticularlyprevails in
the NW and South Bihar Plains. Cultivation remains the main
source of income in this region. Themain crops are rice,wheat,
maize, mustard, lentils, gram etc. The use of agricultural resi-
duesasbiomass fuels like rice straw;wheat strawandgramare
very low. Other agricultural residues e.g., mustard stem (49%),
maize (31%) are used as biomass fuels. Rice straw,wheat straw
and gram are used for feeding livestock. Thorpe et al. [36] also
reported that crop residue over Bhojpur, Samastipur and
Begusarai are used as ex-situ feed use (100%), in-situ grazing
(44%), non-feed use (67%) and in-situ burning (11%). This
pattern changes with the topography. Particularly such
difference may be noticed over southern side of the Ganges in
Bihar as it is mostly barren land and availability of low level
ground water as compared to northern side of the Ganges.
Average livestock availability in Bihar is 0.5 heads per
household [36]. Availability of dung is therefore less as
compared to Haryana, Punjab and western U.P. but matches
with eastern U.P. region. Thorpe et al. [36] have reported that
dung is used as fuel (48e92%), farmyard manure (8e69%) and
other (3%) over Bhojpur, Samastipur and Begugsarai districts
of Bihar. As per present survey, 100% households in this state
use dung cake as a primary energy source for cooking.
Fuelwood e.g., Dalbergia sisso sp. (36%), Mangifera sp. (25%)
and Bambusa sp. (16%) are used as biomass fuels (Fig. 2). The
fuelwood is available from unguarded forest cover of common
ownership. LikeU.P. thevillagehouseholdsofall incomegroups
use fuelwood as mixed fuel for cooking. According to TEDDY
report [30], 68% rural households use fuelwood as biomass
fuel in this state because of burning efficiency and availability.
The comparative chart for crop residue is given in Fig. 4.
4.1.7. West BengalGeographically West Bengal is situated in the eastern part of
the country between 21� 200 and 27� 320N latitude and 85� 500
and 89� 520E longitudes with coastline as well as the Hima-
layas. The population of the state is 80.22million [22] of which
rural and urban population is 72% and 28% respectively. We
have surveyed in 18 districts out of 19 districts except Kolkata,
because of non-availability of rural areas. We could collect
samples from two villages (sites) of each district except
Burdwan, Darjeeling, East Midnapur and North 24-Parganas.
As per our survey, approximately 90% village households
in this state are engaged in cultivation practices. It is also
observed in this study that about 90% village households use
Chulha for cooking, whereas, only 10% use LPG. It suggests that
Fig. 3 e Variation of crop residue used as biomass fuel (%
biomass fuel) in West Bengal, Bihar, Haryana and Punjab.
Fig. 4 e Percentage of consumption of different biomass
fuels over Indo-Gangetic plain.
b i om a s s an d b i o e n e r g y 3 5 ( 2 0 1 1 ) 9 3 2e9 4 1938
Author's personal copy
use of biomass fuels depend primarily on the economic
condition of the people.
In area of West Bengal, the major crop is rice. Wheat, jute,
potato, pulses and oil seeds etc. are also produced as seasonal
crops. Tea is also a major crop in North Bengal especially in
Darjeeling and Jalpaiguri districts. The main crop residue is
rice straw. Agricultural residues e.g., Oriza sativa sp. (36%),
Triticum sp. (12%), Corchorus sp. (12%), and Sesame (24%) are
used as fuel in this state (Fig. 2). Very less amount of Triticum
sp. and Corchorus sp. are used as biomass fuels. Rice straw is
mostly used either for thatching or fodder for animals. Simi-
larly, wheat straw is also used as food for domestic animals.
Das and Jash [39] have estimated the district wise crop residue
generation in West Bengal. As per their estimation, total
agricultural residue generation is 29.55 Mt yr�1. Varma et al.
[38] reported that crop residue management over three
districts viz., Malda, Nadia and West Midnapur in four cate-
gories e.g., ex-situ feed use (100%), in-situ grazing (67%), non-
feed use (94%) and in-situ burning (11%).
Average livestock density in West Bengal is very less (0.1
heads per household) as compared to other states in the IGP
regions. Availability of manure is also very less in this state as
compared to other IGP region. Based on earlier survey over
three districts viz., Malda, Nadia and West Midnapur, Varma
et al. [38] have reported the use of dung as fuel (20e68%) and
farmyard manure (32e79%). It is noticed seen that approxi-
mately 94% village households use dung cake as their main
energy source for cooking. During this survey, it is also
observed that there is a tradition of using ‘dung sticks’ (dung
balls pressed around jute sticks). Compared to the large and
voluminous dung cakes in the other parts of IGP region, the
size and shape of the West Bengal dung cakes have resem-
blance to fist-sized ‘dung balls’. Dung sticks/balls are
produced manually mainly during dry season so that these
sticks/balls dry properly in the open. These observations are
quite similar to the results reported by Varma et al. [38].
Fuelwood e.g.,Mangifera sp. (30%), Bambusa sp. (24%), Sirish
(30%) and Coconut (21%) are used as fuel in this state.
Consumption of fuelwood, dung cake and agricultural residue
are given in Fig. 4. According to TEDDY report [30], fuelwood
consumption is 51% in this state as compared to other states
in the IGP. The total forest area over this region is 13.52%.
Hence very less amount of forest wood is used here as
biomass fuel.
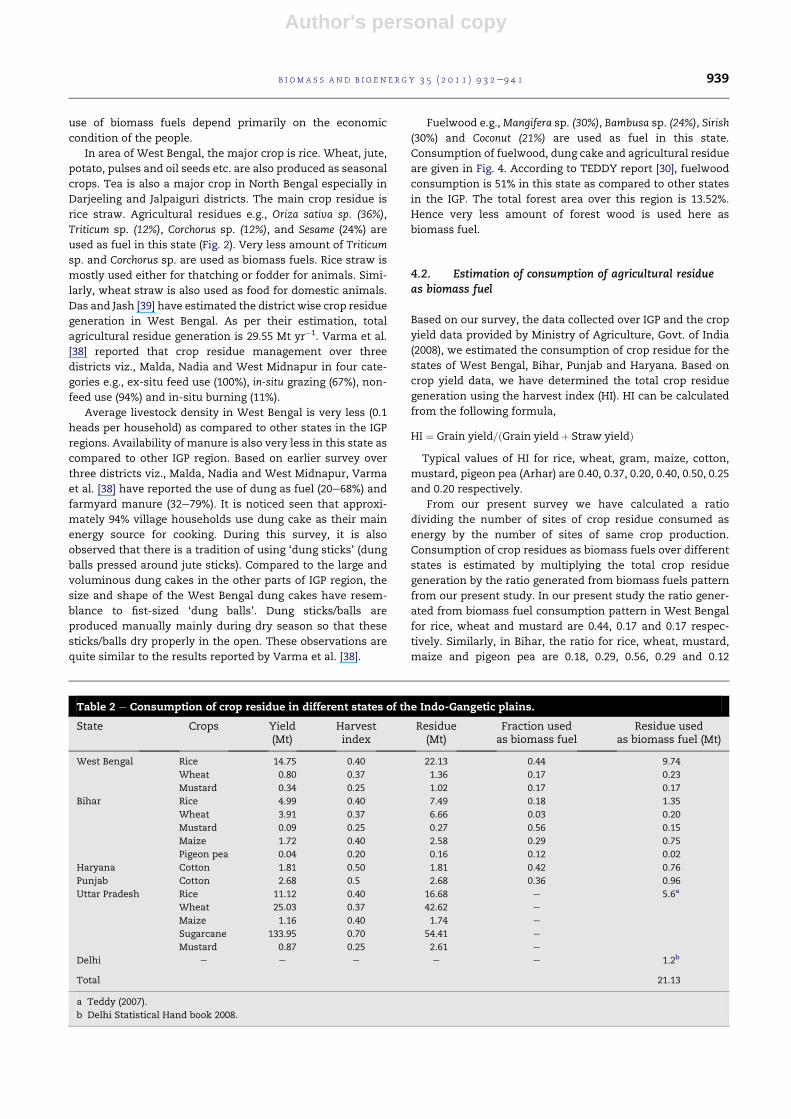
4.2. Estimation of consumption of agricultural residueas biomass fuel
Based on our survey, the data collected over IGP and the crop
yield data provided by Ministry of Agriculture, Govt. of India
(2008), we estimated the consumption of crop residue for the
states of West Bengal, Bihar, Punjab and Haryana. Based on
crop yield data, we have determined the total crop residue
generation using the harvest index (HI). HI can be calculated
from the following formula,
HI ¼ Grain yield=ðGrain yieldþ Straw yieldÞTypical values of HI for rice, wheat, gram, maize, cotton,
mustard, pigeon pea (Arhar) are 0.40, 0.37, 0.20, 0.40, 0.50, 0.25
and 0.20 respectively.
From our present survey we have calculated a ratio
dividing the number of sites of crop residue consumed as
energy by the number of sites of same crop production.
Consumption of crop residues as biomass fuels over different
states is estimated by multiplying the total crop residue
generation by the ratio generated from biomass fuels pattern
from our present study. In our present study the ratio gener-
ated from biomass fuel consumption pattern in West Bengal
for rice, wheat and mustard are 0.44, 0.17 and 0.17 respec-
tively. Similarly, in Bihar, the ratio for rice, wheat, mustard,
maize and pigeon pea are 0.18, 0.29, 0.56, 0.29 and 0.12
Table 2 e Consumption of crop residue in different states of the Indo-Gangetic plains.
State Crops Yield(Mt)
Harvestindex
Residue(Mt)
Fraction usedas biomass fuel
Residue usedas biomass fuel (Mt)
West Bengal Rice 14.75 0.40 22.13 0.44 9.74
Wheat 0.80 0.37 1.36 0.17 0.23
Mustard 0.34 0.25 1.02 0.17 0.17
Bihar Rice 4.99 0.40 7.49 0.18 1.35
Wheat 3.91 0.37 6.66 0.03 0.20
Mustard 0.09 0.25 0.27 0.56 0.15
Maize 1.72 0.40 2.58 0.29 0.75
Pigeon pea 0.04 0.20 0.16 0.12 0.02
Haryana Cotton 1.81 0.50 1.81 0.42 0.76
Punjab Cotton 2.68 0.5 2.68 0.36 0.96
Uttar Pradesh Rice 11.12 0.40 16.68 e 5.6a
Wheat 25.03 0.37 42.62 e
Maize 1.16 0.40 1.74 e
Sugarcane 133.95 0.70 54.41 e
Mustard 0.87 0.25 2.61 e
Delhi e e e e e 1.2b
Total 21.13
a Teddy (2007).
b Delhi Statistical Hand book 2008.
b i om a s s a n d b i o e n e r g y 3 5 ( 2 0 1 1 ) 9 3 2e9 4 1 939

Author's personal copy
respectively. In Punjab and Haryana, only crop residue i.e.,
cotton is used as a biomass fuel (Fig. 3). The ratio determined
for cotton in Punjab and Haryana are 0.36 and 0.42
respectively.
Among the states of the IGP, it may be observed that the
consumption of crop residues as biomass fuels is higher in
West Bengal (w10.23 Mt) as compared to other states of the
IGP (Table 2). In Punjab and Haryana, minimum amount of
crop residues generated from wheat and rice are used as
fuels although a very small amount of those residues is used
in making dung cakes. The consumption of crop residues as
biomass fuel in Bihar, Punjab and Haryana are found to be
2.45, 0.96, 0.75 Mt respectively. Fig. 5 presents the comparison
of consumption of crop residue used as biomass fuel in this
study with NFHS-3 data [40] and TEDDY report [30]. The
percentage consumption of crop residue as a biomass in
Punjab and Haryana are similar with data reported in NFHS-3.
The large variation is observed in consumption of crop residue
as biomass fuel used in Bihar and West Bengal (Fig. 5) as
compared to NFHS-3 data set. In Bihar, NFHS-3 is based on
a sample of 3016 households that is representative at the state
level and within the state at the urban and rural levels.
Similarly, in West Bengal, the NFHS-3 survey is based on
a sample of 5992 households that is representative at the state
level, at the urban and rural levels within the state, and for the
city of Kolkata and Kolkata’s slum and non-slum populations.
Our analysis is based on survey at rural levels and each data
are representative of at least two villages consisting of
approximately 500 households per village in a district.
5. Conclusion
Based on present survey, it is observed that approximately
90% of rural households use biomass fuel as their main source
of energy over the IGP. It has been noticed that total biomass
fuel usage pattern has not changed. The residues of some of
the crops e.g., wheat and rice are not totally used as fuel
particularly in Punjab and Haryana. Several factors including
economic, technical, social and traditional constraints affect
the household fuel usage. From this study, estimated
consumption of crop residue as fuel over the IGP is 21.13 Mt,
which shows large fluctuation as compared to previous
reported data [30]. Along with fuelwood and agricultural
residue, dung cake is mostly (80e90%) used as energy by rural
households over the IGP states. This information may help to
develop mitigation strategy to reduce atmospheric as well as
indoor pollution.
Acknowledgement
The authors are grateful to Prof. R.C. Budhani, Director,
National Physical Laboratory (NPL) and Dr. S.K. Sarkar, Head,
Radio and Atmospheric Sciences Division, NPL for their
encouragement and support. The authors also acknowledge
Department of Science and Technology, India for providing
financial support for this project. Two of the authors (TS
and DPS) are thankful to Council of Scientific & Industrial
Research, NewDelhi for awarding Senior Research Fellowship.
Appendix. Supplementary data
Supplementary data related to this article can be found online
at doi:10.1016/j.biombioe.2010.11.001.
r e f e r e n c e s
[1] Crutzen PJ, Andreae MO. Biomass burning in the tropics:impact on atmospheric chemistry and biogeochemicalcycles. Science 1990;250:1669e78.
[2] AndreaeMO,Merlet P. Emission of trace gas and aerosols frombiomass burning. Global Biogeochem Cycles 2000;15:955e66.
[3] Smith KR, Samet JM, Romieu I, Bruce N. Indoor air pollutionin developing countries and acute lower respiratoryinfections in children. Thorax 2000;55:518e32.
[4] NAAQS, http://www.indiaenvironmentportal.org.in/content/revised-national-ambient-air-quality-standards-naaqs-2009;2009.
[5] Balakrishnan K, Sankar S, Parikh J, Padmavathi R, Srividya K,Venugopal V. Daily average exposures to respirableparticulate matter from combustion of biomass fuels in ruralhouseholds of southern India. Environ Health Perspect 2002;110:1069e75.
[6] WHO (World Health Organization). Health and environmentfor sustainable development. Geneva: World HealthOrganization; 1997.
[7] Smith KR. Indoor air pollution in developing countries:recommendations for research. Indoor Air 2002;12:198e207.
[8] Chanfreau E, Carlos RM, Shakya SK. EC-ASEAN COGENProgramme: implementing biomass cogeneration in ASEAN.Second world conference and technology exhibition onbiomass for energy, industry and climate protection, Rome,Italy; May 2004. pp. 10e14.
[9] International Energy Agency Statistics; Renewablesinformation. Paris; 2003.
[10] Qingyu J, Yuan-bin H, Bhattacharya SC, Sharma M, Amur GQ.A study of biomass as a source of energy in China. RERIC IntEnergy J 1999;21(1):1e10.
[11] Amur GQ, Bhattacharya SC. A study of biomass as a source ofenergy in Pakistan. RERIC Int Energy J 1999;21(1):25e36.
Fig. 5 e Comparison of percentage consumption of crop
residue as biomass fuel with NFHS-3 and TEDDY-2007
data.
b i om a s s an d b i o e n e r g y 3 5 ( 2 0 1 1 ) 9 3 2e9 4 1940
Author's personal copy
[12] Elauria JC, Quejas RET, Cabrera MI, Liganor RV,Bhattacharya SC, Predicala NLJ. A study of biomass asa source of energy in Philippines. RERIC Int Energy J 1999;21(1):37e54.
[13] Kumaradasa MA, Bhattacharya SC, Salam PA, Amur GQ. Astudy of biomass as a source of energy in Sri Lanka. RERIC IntEnergy J 1999;21(1):55e68.
[14] Holdren JP, Smith KR. The world energy assessment: energyand the challenge of Sustainability. New York: UnitedNations Development Programme; 2000. pp. 61e110.
[15] Joshi V, Ramana Sinha CS, Karuppaswamy M, Srivastava KK,Singh PB. Rural energy data base. New Delhi: TERI; 1992.
[16] Mahapatra AK, Mitchell CP. Biofuel consumption,deforestation and farm level tree growing in rural India.Biomass Bioenergy 1999;17:291e303.
[17] Natarajan I. Trends in firewood consumption in rural India.Margin 1995;28(1):41e7.
[18] Sinha CS, Venkata RP, Joshi V. Rural energy planning inIndia: defining effective intervention strategies. EnergyPolicy 1994;22(5):403e14.
[19] Misra MK, Sahu NC, Govind Rao B, Nisanka SK. Domestic fuelenergy consumption in an Indian urban ecosystem. BiomassBioenergy 1995;9(6):473e86.
[20] Narang RS, Virmani SM. Rice-wheat cropping systems of theIndo-Gangetic plain of India. Rice-Wheat Consortium PaperSeries 11. New Delhi, India: RWC; 2001.
[21] Kumar P, Jha D, Kumar A, Chaudhary MK, Grover RK,Singh RK, et al. Economic analysis of total factor productivityof crop sector in Indo-Gangetic Plain of India by district andregion. Agricultural Economics Research Report 2. NewDelhi, India: Indian Agricultural Research Institute; 2002.
[22] Office of Registrar-General and Census Commissioner(ORGCC).Census of India 2001.
[23] Mukesh K, Sharma CM. Fuelwood consumption pattern atdifferent altitudes in rural areas of Garhwal Himalaya.Biomass Bioenergy 2009;33:1413e8.
[24] Hedge MS. Fuel problem in villages: challenges andopportunities. Bull Sci; 1984:8e13. JulyeAugust.
[25] Chettri N, Sharma E, Dev DC, Sundriyal RC. Impact offirewood extraction on tree structure, regeneration andwoody biomass productivity in a trekking corridor of theSikkim Himalaya. Mt Res Dev 2002;22(2):150e8.
[26] Sati VP. Natural resource conditions and economicsdevelopment in the Uttaranchal Himalaya, India. J Mt Sci2005;2(4):336e50.
[27] Erenstein O, Hellin J, Chandna P. Livelihoods, poverty andtargeting in the Indo-Gangetic Plains: a spatial mappingapproach. Research Report. New Delhi, India: CIMMYT andRWC; 2007a.
[28] Joon V, Chandra A, Bhattacharya M. Household energyconsumption pattern and socio-cultural dimensionassociated with it: a case study of rural Haryana, India.Biomass Bioenergy 2009;33:1509e12.
[29] Beri V, Sidhu BS, Gupta AP, Tiwari RC, Pareek RP, Rupela OP,et al. Organic resources of a part of Indo-Gangetic Plain andtheir utilization. Ludhiana: Dept. of Soils, Punjab AgriculturalUniversity; 2003. National Agricultural Technology Project(NATP).
[30] TEDDY. Tata energy data directory and yearbook, India; 2007.[31] Badrinath KVS, Kiran chand TR, Prasad VK. Agriculture
crop residue burning in the Indo-Gangetic Plains-a study using IRS-P6 AWiFS satellite data. Curr Sci 2006;91(8):1085e9.
[32] Erenstein O, Thorpe W, Joginder S, Arun V. Crop-Livestockinteractions and livelihoods in the Indo-Gangetic plains,India: a regional synthesis. Research Report. New Delhi,India: CIMMYT and RWC; 2007b.
[33] Kumar P, Joshi PK, Johansen C, Asokan A. Rice-WheatConsortium Paper Series. Sustainability of rice-wheat basedcropping systems in India: socio-economic and policy issues,vol. 5. New Delhi, India: RWC; 1999. 61e77.
[34] Pingali PL, Shah M. Rice-wheat cropping systems in the Indo-Gangetic Plains: policy redirections for sustainable resourceuse. Rice-Wheat Consortium Paper Series 5. New Delhi,India: RWC; 1999. pp. 1e12.
[35] Joginder S, Erenstein O, Thorpe W, Varma A. Crop-livestockinteractions and livelihoods in the Gangetic plains of UttarPradesh, India. Crop-Livestock Interactions Scoping Study-Report 2. New Delhi, India: CIMMYT-ILRI-RWC; 2007.
[36] Thorpe W, Erenstein O, Joginder S, Varma A. Crop-livestockinteractions and livelihoods in the Gangetic plains of Bihar,India. Crop-Livestock Interactions Scoping Study-Report 3.New Delhi, India: CIMMYT-ILRI-RWC; 2007.
[37] Sharma SK, Subba R AVM, Murari K, Sharma GC. Atlas ofriceewheat cropping system in Indo-Gangetic plains ofIndia; Bulletin No. 2004-I. Modipuram, India: PDCSR (ICAR);2004.
[38] Verma A, Erenstein O, Thorpe W, Joginder S. Crop-LivestockInteractions and livelihoods in the Gangetic plains of WestBengal, India. Crop-Livestock Interactions scoping study-Report 4. Research Report 13. Nairboi, Keniya: ILRI(International Livestock Research Institute); 2007. pp. 94.
[39] Subhrabaran D, Tushar J. District level biomass resourceassessment: a case study of an Indian state West Bengal.Biomass Bioenergy 2009;33:137e43.
[40] IIPS. National family health survey (NFHS-3), 2005e06.Mumbai: International Institute for Population Sciences;2007.
b i om a s s a n d b i o e n e r g y 3 5 ( 2 0 1 1 ) 9 3 2e9 4 1 941