Deconvolution-free Subcellular Imaging with Axially Swept Light Sheet Microscopy
Upload
independentCategory
view
0download
0
RESEARCH ARTICLE
Time-Dependent Subcellular Distributionand Effects of Carbon Nanotubes in Lungsof MiceCarsten Købler1,2, Sarah S. Poulsen3,4, Anne T. Saber3, Nicklas R. Jacobsen3,HåkanWallin3,5, Carole L. Yauk6, Sabina Halappanavar6, Ulla Vogel1,3, Klaus Qvortrup7,Kristian Mølhave1*
1 DTU Nanotech, Technical University of Denmark, Kgs. Lyngby, Denmark, 2 DTU CEN, TechnicalUniversity of Denmark, Kgs. Lyngby, Denmark, 3 National Research Centre for theWorking Environment,Copenhagen, Denmark, 4 Department of Science, Systems and Models, Roskilde University, Roskilde,Denmark, 5 Institute of Public Health, University of Copenhagen, Copenhagen, Denmark, 6 Environmentaland Radiation Health Sciences Directorate, Health Canada, Ontario, Canada, 7 Department of BiomedicalSciences, CFIM, University of Copenhagen, Copenhagen, Denmark
Abstract
Background and Methods
Pulmonary deposited carbon nanotubes (CNTs) are cleared very slowly from the lung, but
there is limited information on how CNTs interact with the lung tissue over time. To address
this, three different multiwalled CNTs were intratracheally instilled into female C57BL/6
mice: one short (850 nm) and tangled, and two longer (4 μm and 5.7 μm) and thicker. We
assessed the cellular interaction with these CNTs using transmission electron microscopy
(TEM) 1, 3 and 28 days after instillation.
Results
TEM analysis revealed that the three CNTs followed the same overall progression
pattern over time. Initially, CNTs were taken up either by a diffusion mechanism or via
endocytosis. Then CNTs were agglomerated in vesicles in macrophages. Lastly, at 28 days
post-exposure, evidence suggesting CNT escape from vesicle enclosures were found.
The longer and thicker CNTs more often perturbed and escaped vesicular enclosures in
macrophages compared to the smaller CNTs. Bronchoalveolar lavage (BAL) showed that
the CNT exposure induced both an eosinophil influx and also eosinophilic crystalline
pneumonia.
Conclusion
Two very different types of multiwalled CNTs had very similar pattern of cellular interactions
in lung tissue, with the longer and thicker CNTs resulting in more severe effects in terms of
eosinophil influx and incidence of eosinophilic crystalline pneumonia (ECP).
PLOS ONE | DOI:10.1371/journal.pone.0116481 January 23, 2015 1 / 17
OPEN ACCESS
Citation: Købler C, Poulsen SS, Saber AT, JacobsenNR, Wallin H, Yauk CL, et al. (2015) Time-DependentSubcellular Distribution and Effects of Carbon Nano-tubes in Lungs of Mice. PLoS ONE 10(1): e0116481.doi:10.1371/journal.pone.0116481
Academic Editor: Valentin Ceña, Universidad deCastilla-La Mancha, SPAIN
Received: October 15, 2014
Accepted: December 8, 2014
Published: January 23, 2015
Copyright: © 2015 Købler et al. This is an open ac-cess article distributed under the terms of theCreative Commons Attribution License, which permitsunrestricted use, distribution, and reproduction in anymedium, provided the original author and source arecredited.
Data Availability Statement: All relevant data arewithin the paper and its Supporting Information files.
Funding:Work was supported by the Danish Centrefor Nanosafety (20110092173/3) from the DanishWorking Environment Research Foundation, and theEuropean Community’s Seventh Framework Pro-gramme (FP7/2007–2013) under grant agreement n°247989 (Nanosustain) and Chemicals ManagementPlan of Health Canada. The funders had no role instudy design, data collection and analysis, decision topublish, or preparation of the manuscript.

IntroductionCarbon nanotubes (CNTs) have excellent mechanical and electrical properties and have thereforebeen of great interest to researchers since their discovery some 50 year ago [1]. The increasingnumber of possible applications for CNTs evokes an increasing need to investigate theirtoxicity. The possible asbestos-like toxicity of CNTs causes particular concern [2]. Inhaled CNTsare removed very slowly from the lung, and the half-life of CNTs in lung following inhalation inmice has been estimated to be ca. 1 year [3]. CNTs have been shown to cause pulmonary long-lasting inflammation, fibrosis and granulomas in lungs of rodents following pulmonary exposure[3–5].
Assessment of CNT-toxicity is complicated by the wide variety of physical and chemicalproperties with which they can be manufactured. For instance, the physical dimensions ofCNTs have been reported to play an important role in their toxicity [6–8], and the length/widthratios of some CNTs are consistent with the fiber pathogenicity paradigm [2]. The number ofdefects in the lattice structure of CNTs also plays a role in their toxicity [9], together with agglom-eration level [10] and functionalization [11–13]. In addition to the direct interaction betweenCNTs and cells, their toxicity is further complicated by the ability of CNTs to adsorb biomole-cules and essentially transform into different biological identities [14].
Inhaled CNTs are met by a dynamic response responsible for clearing and dealing with par-ticulates in the lung. The lung responds to CNTs by a rapid influx of neutrophils and macro-phages [5,15,16], and in certain cases also by eosinophil influx [16–19]. Within a few days toweeks, exposure to even small doses of CNTs induces inflammation, granulomas and fibrosis[2,3,15]. CNT-cell interaction therefore changes over time, making it necessary to study theCNT-cell interaction at multiple time points.
In order to be able to visualize single CNTs inside cells, and investigate how the CNT-cellinteraction changes over time, transmission electron microscopy (TEM) can be used. Thetime dependent effects of CNT exposure in vivo have mainly been studied using lightmicroscopy, where electron microscopy is used to support the results [20–22]. TEM has, forexample, revealed low CNT concentrations in neutrophils and type II pneumocytes, whereashigh CNT-concentrations were readily visible in alveolar macrophages using light microscopy[20].
Cellular uptake and clearance mechanisms of CNTs have predominantly been studied invitro. CNTs are taken up either as agglomerates entering the endosomal pathway by endocyto-sis, or as single CNTs piercing the cell membrane in what appears to be a non-endocytoticdiffusion-driven process [7,12,23–25]. In addition, it has been argued that after direct non-endocytotic uptake, CNTs can subsequently be engulfed in vesicles [12,24], and that CNTsalready contained in vesicles may escape into the cytosol [23,24]. Lastly, CNTs can escape thecell via microvesicles [26] or membrane disruption [12]. These in vitro studies illustrate thecomplexity of the interactions, the need for high resolution microscopy to understand thedetails of CNT toxicity and the need for in vivo studies to test if these conclusions hold in thepresence of an active immune response.
Here, we study the ultra-structural time course of CNT distribution in vivo 1, 3 and 28 daysafter intratracheal instillation of CNTs in mice with a focus on TEM imaging. In addition, wedocument the differences and similarities in pulmonary toxicological response of mice exposedto three CNTs, of which two have very different physiochemical properties and two were verysimilar. Lung samples were imaged with transmission electron microscopy (TEM), and the re-sults compared with bronchoalveolar lavage (BAL) cell composition and relevant gene expres-sion data to investigate the induced eosinophilic crystalline pneumonia (ECP) [16].
Time-Dependent Subcellular Distribution and Effects of CNTs in Lungs
PLOS ONE | DOI:10.1371/journal.pone.0116481 January 23, 2015 2 / 17
Competing Interests: The authors have declaredthat no competing interests exist.
Materials and Methods
CNTsThree types of multiwalled CNTs (MWCNT) were used. A detailed description of the physio-chemical data is found in S1 Table:
• NRCWE-026 (CNTSmall) has an average length of 850 nm and width of 10 nm. It was used ina previous study [27].
• NM-401 (CNTLarge) is on average 4 mm long and 70 nm wide. It was also used in a previousstudy [27] and was a test material in the Nanogenotox project [28].
• The last MWCNT (denoted Mitsui-7) has an average length of 5.7 mm and width of 75 nm[16,17,29]. It was also used in the Nanogenotox project, under the name NRCWE-006 [28].
MiceFemale C57BL/6 mice, 5–7 weeks old, obtained from Taconic, were allowed water and food(Altromin # 1324) ad libitum during the experiment. The animals were acclimatised fortwo weeks and housed in experimental groups in polypropylene cages with sawdust. Theenvironment was controlled with a temperature of 21� 1°C, a humidity of 50� 10% and a12-h light/dark cycle. Experiments complied with EC Directive 86/609/EEC and were approvedby the Danish “Animal Experiments Inspectorate” (permit 2010/561-1779).
ExposureParticle suspensions and intratracheal instillation were described previously [16,27]. Animalswere exposed to 18, 54 or 162 mg/mouse, and respectively correspond to the pulmonary deposi-tion of CNTs during 4, 11 or 32 eight-hour working days at the current Danish occupationalexposure level for carbon black (3.5 mg/m3) assuming 10% pulmonary deposition [15].
This study was done with mice used for several ongoing studies and to limit the number ofmice, there are minor variations in the instillation procedure, which does not seem to be influ-encing the results: Briefly, the Mitsui-7 CNTs were suspended in 0.9%wt NaCl and 10% v/vacellular bronchoalveolar lavage (BAL) fluid. CNTSmall and CNTLarge were suspended in 2%serum in Nanopure water. Serum and BAL fluid were obtained from unexposed C57BL/6mice. The Mitsui-7 (4.05 mg/ml) and the CNTSmall and CNTLarge (3.24 mg/ml) suspensionswere sonicated on ice using a Branson Sonifier S-450D equipped with a disruptor horn (Modelnumber: 101-147-037). Mitsui-7 was sonicated for a total of 4 minutes at 10% amplitude, withalternating 10 s pulses and pauses, while CNTSmall and CNTLarge were sonicated for a total of16 min at 400 W and 10% amplitude. These suspensions were used for the high dose (162 mg)and diluted 1:3 in vehicle for the medium (54 mg) dose and diluted further 1:3 for the low dose(18 mg). Between the dilutions the suspensions were mixed by pipetting. Vehicle control solu-tions were prepared with 0.9% NaCl and 10% acellular BAL fluid, and 2% serum in Nanopurewater, respectively, and were sonicated as described above. Mice were intratracheally instilledwith 40 ml (Mitsui-7) and 50 mL (CNTSmall and CNTLarge) particle suspension, respectively. Asdiscussed in the Results section, no discernible differences were observed between the two largeCNT types in different suspension medium.
Lung tissueAt 1, 3, and 28 days after the intratracheal instillation, the mice dedicated for electron micros-copy were anaesthetized by subcutaneous injection of Hypnorm–Dormicum and the mice
Time-Dependent Subcellular Distribution and Effects of CNTs in Lungs
PLOS ONE | DOI:10.1371/journal.pone.0116481 January 23, 2015 3 / 17

were bled by cutting the groin. The lungs were fixed in situ by cannulating the trachea and in-fusing 2% glutaraldehyde in 0.05 M cacodylate buffer (pH 7.2) at a constant fluid pressure of30 cm before the thorax was opened. The lungs were excised and immersed in 2% glutaralde-hyde 0.05 M cacodylate buffer (pH 7.2) and stored refrigerated until further processing.
BAL cells compositionOne, 3, and 28 days after intratracheal instillation, mice dedicated for the other endpoints (BALcell counts and microarray gene expression on lung tissue) were anaesthetized by subcutaneousinjection of Hypnorm-Dormicum. BAL fluid was collected directly after cardiac puncture andcentrifuged. The cellular pellet was collected on glass slides and stained with standard May-Grünwald-Giemsa. The number of neutrophils, macrophages, eosinophils and lymphocytes cellswere counted (n = 6). Lung tissue was snap frozen in liquid nitrogen and stored at −80°C untilRNA purification. Statistical analysis was performed in SAS v. 9.2. A non-parametric one-wayANOVA test with a Tukey-type mean comparison was used to determine statistical significance.
Gene expressionTotal RNA (n = 6 per dose group) was extracted and isolated from the lung tissue of Mitsui-7exposed mice (doses: 18, 54 and 162 mg on post-exposure day 1, and 54 mg on post-exposureday 28), from the CNTSmall and CNTLarge exposed mice (doses: 18, 54 and 162 mg on post-ex-posure day 1, 3 and 28), and from concurrent controls as previously described [16]. All samplespassed quality control and were used in the microarray hybridization measurement. The mi-croarray hybridization was performed on Agilent 8 × 60K oligonucleotide microarrays (AgilentTechnologies Inc., Mississauga, ON, Canada) using 200 ng total RNA from each sample. Boththe hybridization procedures and statistical analyses have previously been described [16].Global gene expression results will be published elsewhere (Poulsen et al. in peer review), andhere we report specifically mRNA levels of Ccl11, Ccl24 and Chi3L3.
Electron microscopy sample preparationWe investigated one CNT sample (164 mg) from each time point by electron microscopy. Ap-proximately 1 mm3 samples of lung tissue were cut with a scalpel and embedded in Epon [27].Briefly, the samples were rinsed in buffer and postfixed in 2% osmium tetroxide and 0.05 Mpotassium ferricyanide in 0.12 M sodium cacodylate buffer (pH 7.2) for 2 hours. Samples werethen rinsed in ultrapure water, en-bloc stained with 1% uranyl acetate in water overnight, de-hydrated in ethanol and embedded in epon following standard protocols for the TAAB 812resin kit, TAAB Laboratories Equipment.
Ultramicrotomy of the samples was performed on a Leica Ultracut with a diamond-knife-angle of 6° and a cutting speed of 1.5 mm/s. Due to extensive microtomy artefacts caused bythe hard CNTs [27], we used thicker TEM sections (approximately 200–300 nm) on selectedCNTLarge and Mitsui-7 samples. TEM sections were post-stained with uranyl acetate and leadcitrate (Ultrastain-2, Leica Microsystems), and imaged on a CM 100 BioTWIN (Philips) oper-ated at 80 kV. For 3D imaging of ECP crystals, focused ion beam scanning electron microscopy(FIB-SEM) imaging was performed using a FEI QuantaFEG 3D with a dedicated vC backscat-tered electron detector operated at 3 kV and spot 1. Milling was performed on the ultramicrot-omy prepared blocks and the images processed as previously described [27].
Time-Dependent Subcellular Distribution and Effects of CNTs in Lungs
PLOS ONE | DOI:10.1371/journal.pone.0116481 January 23, 2015 4 / 17

Results
BAL fluid cell compositionIntratracheal instillation of the three different CNTs resulted in pulmonary inflammation interms of increased number of cells in BAL (S2 Table). In general, similar changes in BAL cellcomposition were observed for the three different CNT types as described previously [16] and(Poulsen et al. in peer review). The BAL cell influx was dominated by a large neutrophil influxthat peaked on day 3 compared to vehicle-exposed controls.
Increased eosinophil counts were observed for all the CNT types on day 1 and 3, and eosinophilcounts were higher for CNTLarge andMitsui-7 compared to CNTSmall (Table 1). On day 28, onlythe eosinophil counts of Mitsui-7 were statistically significantly different from vehicle controls.
Electron microscopyThe interactions between the three types of CNTs with lung tissue were studied over timeusing TEM. We compared CNT-tissue interactions of CNTSmall (850 nm long and 10 nm wide)and CNTLarge (4 mm long and 70 nm wide) for structurally induced differences.
The reproducibility of the interactions was evaluated by comparing CNTLarge and Mitsui-7(5.7 mm long and 75 nm wide). TEM imaging showed that these two fairly similar tubes alsoshowed similar CNT-cell interactions, and thus we only show images of CNTSmall andCNTLarge (Fig. 1). Lung tissue from vehicle-exposed mice revealed no CNT-like structuresand there was no discernible difference between the different suspension media.
On post exposure day 1, minimal CNT-cell interaction was observed (Fig. 2 A-B). TheCNTs were primarily aggregated outside cells in the alveolar lumen (Fig. 1 ‘between cells’). Theindividual CNTs were in close proximity to cells. In a few cases, CNTs were observed apparent-ly in the process of entering the cell via physical indentation and subsequent piercing of the cel-lular membrane (Fig. 1 ‘piercing’). However, these observations were rare, and for CNTLarge
and Mitsui-7 it was difficult to ascertain if cells were pierced due to ultramicrotomy artefactscaused by the large CNTs. We did not observe any clear signs of vesicular uptake at this timepoint, and only few immune cells were seen.
On post exposure day 3, we observed increasing cell-CNT interaction and increased numbersof what appeared to be inflammatory cells (Fig. 2 C-D), in agreement with the increased numberof BAL cell counts observed at this time point. Large and small open cytoplasmic inclusions wereobserved containing agglomerated CNTs, apparently in the process of being taken up by the cells(Fig. 1 ‘inclusions’). Again, CNTSmall were observed directly entering the cytosol by direct pierc-ing of the membrane, whereas this could not be verified for CNTLarge (Fig. 1 ‘piercing’). Threedays post exposure, CNTSmall were primarily observed enclosed within vesicles (Fig. 1 ‘in vesi-cles’), and few CNTs were observed as free in the cytosol. CNTLarge uptake resulted in CNTsbeing enclosed in vesicles (Fig. 1 ‘in vesicles’), in addition to single CNTs found freely in the cyto-sol (Fig. 1 ‘in cytosol’). In a few cases, CNTLarge caused clear deformation of the vesicles inside al-veolar macrophages, which was not observed to the same extent for CNTSmall, and appeared tobe involved in the process of vesicular escape (Fig. 1 ‘vesicular escape’).
There were fewer CNTs present 28 days post exposure compared to three days post expo-sure, and the CNTs were almost exclusively found inside cells and not in the alveolar lumen.CNTs were located within single alveolar macrophages and in larger inflammatory sites withinmultinucleate giant cells [30] (S1 Fig.). CNTSmall were found in both small and large vesicleswith large amounts of CNTs inside some individual cells (Fig. 2 E). In certain cases, CNTs werefound deforming vesicle membranes or between vesicles (Fig. 1 ‘vesicular escape’). CNTLarge
was found inside deformed vesicles or sporadically distributed in the cytosol on day 28 (Fig. 2 F).
Time-Dependent Subcellular Distribution and Effects of CNTs in Lungs
PLOS ONE | DOI:10.1371/journal.pone.0116481 January 23, 2015 5 / 17

Generally, there were fewer obvious CNT-containing vesicular structures compared to day 3 forCNTLarge.
At all the studied time points, CNTs were found in alveolar macrophages, identified by theirultrastructure and location in the alveoli. We did not observe any CNTs in what appeared to betype II pneumocytes, but we observed a few CNTSmall that appeared to be inside what lookedlike type I pneumocytes. Likewise, CNTs were not observed inside well-defined neutrophils oreosinophils. Cells were identified and classified according to their morphological traits [31].However, in some instances, especially in lung tissue on day 28, it was difficult to unambigu-ously determine the cell types of the cells containing the CNTs because the cell morphologywas strongly perturbed by the CNTs (Fig. 2 E), and cells were found in agglomerates. CNTswere never observed inside the nucleus, except for what appeared to be caused by ultramicroto-my artefacts showing obvious drag marks. CNTs occasionally caused indentation of the nucle-us, as previously observed in vitro for cells grown on nanowires [32,33].
Eosinophilic crystalline pneumoniaTEM images revealed crystalline bodies in the cytosol of alveolar macrophages (Fig. 3 A-C)and multinucleated-cells (S1 Fig.) in the CNTLarge and Mitsui-7 exposed mice. Similar crystalstructures have been observed in mice with eosinophilic crystalline pneumonia (ECP) [34–37].Crystal bodies were observed in lung tissues fromMitsui-7 exposed mice for the highest doseon day 3, and in lung tissue from mice exposed to both the medium and high doses on day 28.For CNTLarge treated mice, crystalline bodies were observed on day 28 for the medium andhigh doses (S3 Table).
Table 1. Overview of Chi3L3 mRNA levels, BAL eosinophil counts and presence of eosinophilic crystals in BAL cell fluid.
Dose [μg] Day 1 Day 3 Day 28
Chi3L3 Eos (×103) Chi3L3 Eos (×103) Chi3L3 Eos (×103) ECP
0 - 1.0 - 3.9 - 10.5 1/12
CNTSmall 18 2.0 17* 1.4 69* 1.0 0.5 2/6
54 1.0 1.4* 0.5 72* 0.9 0.2 1/6
162 1.0 3.4* 0.7 7.1 1.7 0.0 3/6
CNTLarge 18 2.8* 51* 5.8* 317* 1.8 34 6/6
54 3.1* 86* 4.3* 138* 2.5 32 5/6
162 1.1 1.7 1.1 1.8 9.2* 46 4/6
Mitsui-7 0 - 0.3 - 0.4 - 0.3 1/6
18 2.9* 39* - 341* - 5.5* 6/6
54 1.8 23* - 268* 3.9* 22* 6/6
162 2.0 2.2* - 102* - 46* 6/6
Chi3L3 expression is given as the relative fold-increase in Chi3L3 mRNA levels relative to concurrent controls, where values below 1 indicate a decreased
mRNA level. Eos denotes the number of eosinophils. The control groups for CNTSmall and CNTLarge were pooled, since these were instilled using the
same instillation vehicle (2% serum) and BAL cell composition of the control groups was not significantly different from each other. Mitsui-7 was instilled
using a different vehicle (10% BAL in 0.9%NaCl), and BAL cell composition of Mitsui-7 controls was statistically different from the other control groups.
Asterisk (*) denotes data statistically significantly different from controls (p<0.05). ECP indicates how many of the samples (n = 6) contained eosinophilic
crystals. Dashes (–) indicate no data available.
doi:10.1371/journal.pone.0116481.t001
Time-Dependent Subcellular Distribution and Effects of CNTs in Lungs
PLOS ONE | DOI:10.1371/journal.pone.0116481 January 23, 2015 6 / 17

Time-Dependent Subcellular Distribution and Effects of CNTs in Lungs
PLOS ONE | DOI:10.1371/journal.pone.0116481 January 23, 2015 7 / 17
In some cases, the crystals appeared as needle-like structures similar in size to CNTLarge andMitsui-7, but occasionally massive crystalline bodies up to 40 mm long and 5 mmwide were ob-served (Fig. 3 A). The structures were found in two variants: sharply defined enclosed in vesi-cles, and more diffusely defined enclosed in vesicles (S2 Fig.). ECP crystals were also observedoutside cells, as previously documented [35,36,38]. Some of the observed structures had peri-odic lattice structures in the longitudinal direction (about 5 nm), a feature previously described[37], and the structures were clearly not CNTs as they did not cause characteristic microtomyartefacts of CNTs [27].
In order to elucidate the three dimensional structure of the crystals, we examined a samplecontaining crystals with slice-and-view 3D FIB-SEM (Fig. 3 D-F). In single slices the crystalswere very similar to those observed in TEM with an inverted contrast (Fig. 3 E), but assembledcrystals appeared as orthorhombic plates that often were stacked and piled up (Fig. 3 F and S1Movie).
BAL cells were examined in light microscopy to confirm the presence of extracellularcrystals related to ECP [36,38]. There was an increased crystal incidence in the CNTLarge andMitsui-7 exposed samples on day 28. This was not observed to the same degree in CNTSmall
exposed samples or the control samples (Table 1). In addition, the crystals found in CNTSmall
and control samples were fewer in number and smaller compared to the crystals observed inCNTLarge and Mitsui-7 exposed samples. Generally, the crystals varied vastly in size and weremostly stained blue or had a blue periphery (Fig. 4 and S2 Fig.). In BAL slides from exposedmice, CNTs were observed inside alveolar macrophages and in agglomerations apparently out-side of the cells (Fig. 4). No CNTs were observed in vehicle controls.
After the discovery of crystals in the present study, BAL cells previously recovered frommice 28 days after intratracheal instillation with similar doses of carbon black [39], and twosingle walled carbon nanotubes (SWCNT) [40], were also screened for the presence of crystals.10% (2/17) of carbon black (Printex 90) samples contained crystals, whereas the two SWCNTshad a 50% crystal incidence in the 18 samples investigated per SWCNT (S3 Table).
Gene expressionEosinophilic crystals consist of the protein Chi3L3 encoded by Chi3L3 [38,41,42]. Chi3L3 pro-tein, also known as Ym1 and ECF-L, accumulates in alveolar macrophages and is associatedwith inflammatory diseases and parasite infestations [41,42]. We therefore assessed Chi3L3mRNA expression using available global gene expression data. Detailed description of the glob-al gene expression analysis of lung tissues following pulmonary exposure to Mitsui-7 has beenpublished [16], and will be published elsewhere for CNTSmall and CNTLarge (Poulsen et al. inpeer review).
Both Mitsui-7 and CNTLarge induced statistically significant increases in Chi3L3mRNAlevels whereas no change in Chi3L3 expression was observed following CNTSmall exposure(Table 1). Chi3L3 expression was increased on post-exposure day 1 and 3 following CNTLarge
exposure for the two lower doses, whereas a significant increase was observed for the highestdose on day 28 (Table 1), coinciding with the observation of ECP crystals on day 28. Similarobservations were made following Mitsui-7 exposure (Table 1).
In addition to the increased expression of Chi3L3, the expression of several chemokines andcytokines specific to eosinophil activity were increased following exposure to all three CNTs
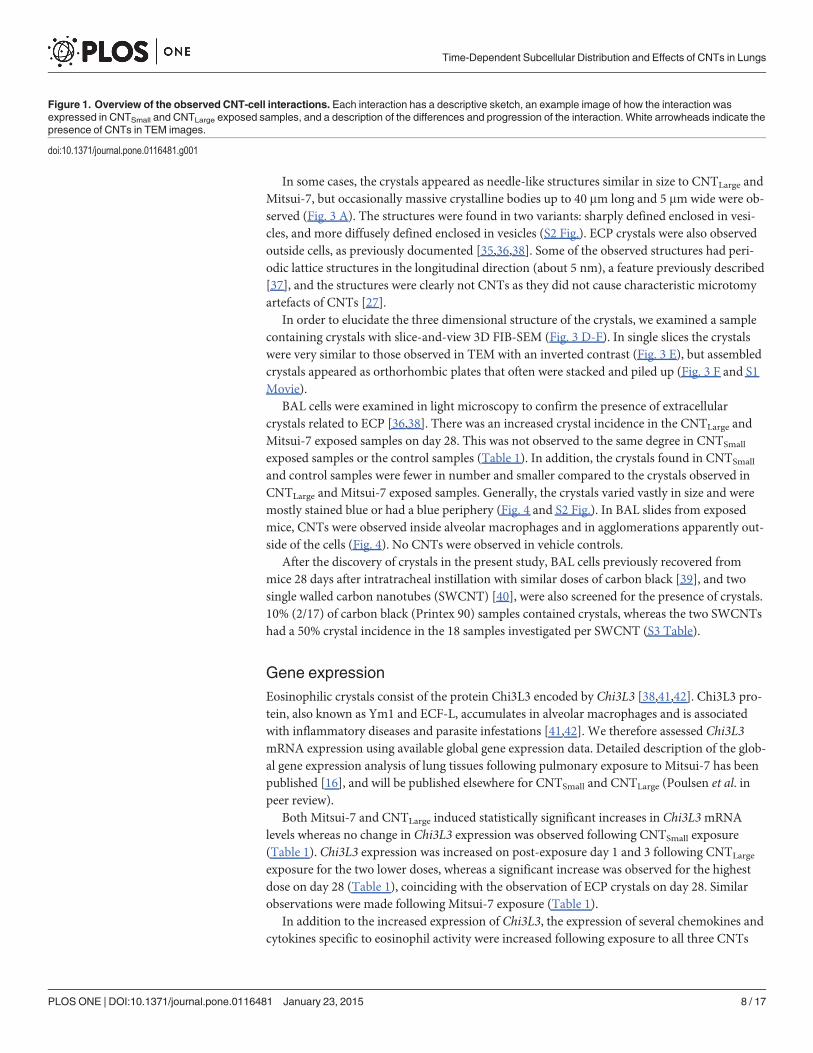
Figure 1. Overview of the observed CNT-cell interactions. Each interaction has a descriptive sketch, an example image of how the interaction wasexpressed in CNTSmall and CNTLarge exposed samples, and a description of the differences and progression of the interaction. White arrowheads indicate thepresence of CNTs in TEM images.
doi:10.1371/journal.pone.0116481.g001
Time-Dependent Subcellular Distribution and Effects of CNTs in Lungs
PLOS ONE | DOI:10.1371/journal.pone.0116481 January 23, 2015 8 / 17

Time-Dependent Subcellular Distribution and Effects of CNTs in Lungs
PLOS ONE | DOI:10.1371/journal.pone.0116481 January 23, 2015 9 / 17

(S4 Table). Eosinophil migration and influx into the lung lumen is highly dependent on CCR3,a chemokine receptor that is abundant on eosinophils [43]. The chemokines CCL11 (eotaxin 1)and CCL24 (eotaxin 2) are produced by epithelial cells, smooth muscle cells and macrophages,and they have a high affinity for CCR3 [43–46]. The expression of these chemokines variedgreatly following exposure to Mitsui-7, CNTSmall and CNTLarge (S4 Table). Ccl11 and Ccl24were differentially expressed only at the high dose on day 3 following exposure to CNTSmall,whereas both chemokines were expressed continuously at all doses on day 1 and 3 followingexposure to CNTLarge and Mitsui-7. This correlates with the higher eosinophil influx observedfollowing CNTLarge and Mitsui-7 exposure, as compared to CNTSmall.
DiscussionCellular interactions of three different CNT were characterized at acute and intermediate timepoints. The observed cellular interactions of the three different CNTs were quite similar, withuptake following a general CNT distribution progression as illustrated in Fig. 5. The initial cell
Figure 2. Representative images of the samples 1 day (a-b), 3 days (c-d), and 28 days (e-f) post exposure for CNTSmall (a,c,e) and CNTLarge (b,d,f).(a-b) Shows CNTSmall and CNTLarge, respectively, on day 1, where CNTs were mainly found in the alveolar lumen or in the interface between cells. (c-d) Onday 3 CNTs were increasingly found in vesicles inside what appeared to be alveolar macrophages, but some CNTs were observed outside cells. (e) On day28, CNTSmall was found inside vesicles and in the cytosol of cells in large cell agglomerations, but were also found inside vesicles in singular cells. (f) On day28, there were fewer vesicles containing CNTLarge and the CNTs were more individually spaced in the cytosol. In addition, immune cells were found in largeagglomerations indicating inflammation at this stage. Arrowheads points to CNTs.
doi:10.1371/journal.pone.0116481.g002
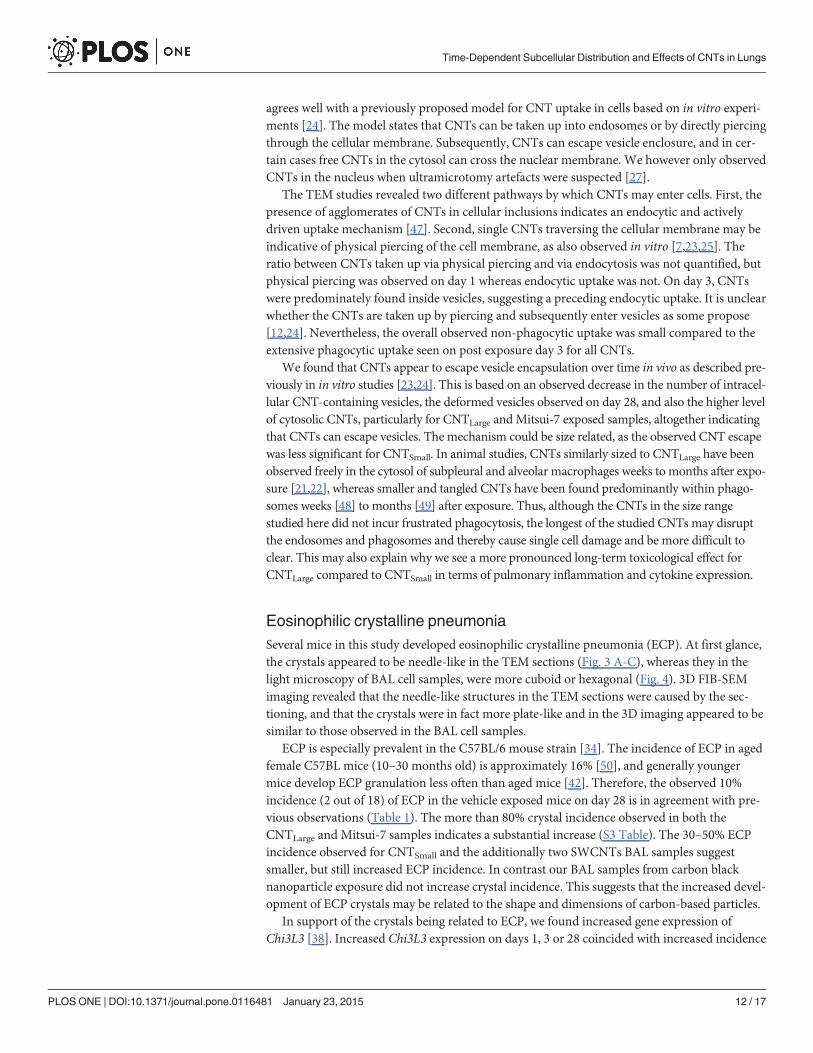
Figure 3. TEM (a-c) and SEM (d-f) images of crystalline bodies observed on day 28 in CNTLarge samples. (a) Low magnification TEM image showinglarge crystals, some up to 40 μm long. (b) Image showing scattered crystalline bodies and CNTs in clusters. (c) Ordered crystalline bodies in the cytosol.(d) SEM image of the ultramicrotomed block revealing the underlying cells prior to milling. The image also shows a few protruding CNTs (white arrowhead)[27]. (e) FIB-SEM image of crystals in a cell. (f) 3D representation of the FIB-SEM stack where a few of the crystals have been traced (yellow), revealing theirplate-like structure. Black arrowheads indicate ECP crystals while white arrowheads indicate the CNTs.
doi:10.1371/journal.pone.0116481.g003
Time-Dependent Subcellular Distribution and Effects of CNTs in Lungs
PLOS ONE | DOI:10.1371/journal.pone.0116481 January 23, 2015 10 / 17

response on day 1 was dominated by CNTs situated in the alveoli, with only a few CNTs ob-served in the apparent process of piercing cellular membranes. Three days post exposure CNTswere observed as free in the cytosol and in intracellular vesicles, with a majority of CNTs beingagglomerated in vesicles. On day 28, more individually dispersed CNTs were observed intracel-lularly for CNTLarge and Mitsui-7, whereas CNTSmall mainly were found in vesicles. In addition,deformed vesicles were observed, where CNTs deformed or penetrated the enclosing membrane.This was particularly evident for CNTLarge and Mitsui-7. This time-dependent progression
Figure 4. Representative image of stained eosinophilic crystals in BAL frommice exposed to thehighest dose (162 μg) of CNTLarge 28 days post exposure. Large amounts of crystals were also observedfor the two lower doses (18 μg and 54 μg), and similarly for Mitsui-7 samples on day 28. Black arrowheadspoint to crystals, whereas white arrowheads indicate CNT agglomerations or cells containing CNTs.
doi:10.1371/journal.pone.0116481.g004
Figure 5. Model showing CNT interactions with lung tissue over time in vivo. At day 1, most CNTs were found in the alveolar spacing, while a few CNTswere found freely inside cells apparently having entered the cells using a non-endocytotic pathway. At day 3, CNTs are found in the alveolar spacing and alarger number of CNTs are found within vesicles, indicating an endocytotic-pathway. At day 28, most of the CNTs were either taken up by cells or in closerelation to cells. Compared to post exposure day 3, the two larger CNTs had more CNTs outside vesicle bounds, indicating CNT escape from vesicles.
doi:10.1371/journal.pone.0116481.g005
Time-Dependent Subcellular Distribution and Effects of CNTs in Lungs
PLOS ONE | DOI:10.1371/journal.pone.0116481 January 23, 2015 11 / 17
agrees well with a previously proposed model for CNT uptake in cells based on in vitro experi-ments [24]. The model states that CNTs can be taken up into endosomes or by directly piercingthrough the cellular membrane. Subsequently, CNTs can escape vesicle enclosure, and in cer-tain cases free CNTs in the cytosol can cross the nuclear membrane. We however only observedCNTs in the nucleus when ultramicrotomy artefacts were suspected [27].
The TEM studies revealed two different pathways by which CNTs may enter cells. First, thepresence of agglomerates of CNTs in cellular inclusions indicates an endocytic and activelydriven uptake mechanism [47]. Second, single CNTs traversing the cellular membrane may beindicative of physical piercing of the cell membrane, as also observed in vitro [7,23,25]. Theratio between CNTs taken up via physical piercing and via endocytosis was not quantified, butphysical piercing was observed on day 1 whereas endocytic uptake was not. On day 3, CNTswere predominately found inside vesicles, suggesting a preceding endocytic uptake. It is unclearwhether the CNTs are taken up by piercing and subsequently enter vesicles as some propose[12,24]. Nevertheless, the overall observed non-phagocytic uptake was small compared to theextensive phagocytic uptake seen on post exposure day 3 for all CNTs.
We found that CNTs appear to escape vesicle encapsulation over time in vivo as described pre-viously in in vitro studies [23,24]. This is based on an observed decrease in the number of intracel-lular CNT-containing vesicles, the deformed vesicles observed on day 28, and also the higher levelof cytosolic CNTs, particularly for CNTLarge and Mitsui-7 exposed samples, altogether indicatingthat CNTs can escape vesicles. The mechanism could be size related, as the observed CNT escapewas less significant for CNTSmall. In animal studies, CNTs similarly sized to CNTLarge have beenobserved freely in the cytosol of subpleural and alveolar macrophages weeks to months after expo-sure [21,22], whereas smaller and tangled CNTs have been found predominantly within phago-somes weeks [48] to months [49] after exposure. Thus, although the CNTs in the size rangestudied here did not incur frustrated phagocytosis, the longest of the studied CNTs may disruptthe endosomes and phagosomes and thereby cause single cell damage and be more difficult toclear. This may also explain why we see a more pronounced long-term toxicological effect forCNTLarge compared to CNTSmall in terms of pulmonary inflammation and cytokine expression.
Eosinophilic crystalline pneumoniaSeveral mice in this study developed eosinophilic crystalline pneumonia (ECP). At first glance,the crystals appeared to be needle-like in the TEM sections (Fig. 3 A-C), whereas they in thelight microscopy of BAL cell samples, were more cuboid or hexagonal (Fig. 4). 3D FIB-SEMimaging revealed that the needle-like structures in the TEM sections were caused by the sec-tioning, and that the crystals were in fact more plate-like and in the 3D imaging appeared to besimilar to those observed in the BAL cell samples.
ECP is especially prevalent in the C57BL/6 mouse strain [34]. The incidence of ECP in agedfemale C57BL mice (10–30 months old) is approximately 16% [50], and generally youngermice develop ECP granulation less often than aged mice [42]. Therefore, the observed 10%incidence (2 out of 18) of ECP in the vehicle exposed mice on day 28 is in agreement with pre-vious observations (Table 1). The more than 80% crystal incidence observed in both theCNTLarge and Mitsui-7 samples indicates a substantial increase (S3 Table). The 30–50% ECPincidence observed for CNTSmall and the additionally two SWCNTs BAL samples suggestsmaller, but still increased ECP incidence. In contrast our BAL samples from carbon blacknanoparticle exposure did not increase crystal incidence. This suggests that the increased devel-opment of ECP crystals may be related to the shape and dimensions of carbon-based particles.
In support of the crystals being related to ECP, we found increased gene expression ofChi3L3 [38]. Increased Chi3L3 expression on days 1, 3 or 28 coincided with increased incidence
Time-Dependent Subcellular Distribution and Effects of CNTs in Lungs
PLOS ONE | DOI:10.1371/journal.pone.0116481 January 23, 2015 12 / 17

of crystals (Table 1). Increased Chi3L3 protein levels have previously been observed in lungs ofmice exposed to SWCNT and asbestos [51], but the presence of ECP was not assessed.
Eosinophilic responseThe larger observed eosinophilic response to CNTLarge and Mitsui-7 than CNTSmall suggeststhat these larger CNTs cause a stronger allergy-like effect [17,52]. Eosinophilic inflammation isnot a typical response following a single pulmonary exposure to particles [39,53,53,54].
The data suggests that ECP and eosinophilic response may correlate: The very large eosino-philic response on day 3 for the two larger CNTs (Table 1) correlated with the observation ofcrystals in BAL cell fluids on day 28. Likewise, the lower eosinophil response and Chi3L3 ex-pression levels of CNTSmall, compared to CNTLarge and Mitsui-7, correlate with fewer ECP pos-itive samples at post exposure day 28.
An eosinophilic response induced byMWCNTs has been observed in literature, but this hasoften been in studies using C57BL/6 or other ECP sensitive strains [10,16–18,55]. In contrast, stud-ies noting an eosinophil influx using non-ECP sensitized strains as a response to CNT exposure arerelatively few; e.g., experiments conducted on rats [19] or experiments involving allergens [52,56].
It has been reported that eosinophils are able to biodegrade CNTs [57], although they arenormally thought to be involved in extracellular degradation of parasites which can be largerthan the cell [57]. We speculate that the increased eosinophilic response, prevalent primarily inMitsui-7 and CNTLarge, might be due to long and thick CNTs being more difficult to internalizeand degrade by alveolar macrophages. This correlates with the high extracellular CNT contenton days 1 and 3 where the eosinophil influx was observed and the subsequent decrease in eo-sinophil number on day 28 when most tubes have been internalized.
ConclusionOur ultrastructural investigations revealed that all of the CNTs examined in this study ap-peared to follow the same overall progression over time: CNTs were taken up either by a diffu-sion mechanism or via endocytosis, CNTs agglomerated in vesicles, and lastly the CNTsappeared to escape vesicle enclosure. Our in vivo studies agree with in vitro studies [24] show-ing a similar overall sequence of events for uptake of MWCNTs.
TEM imaging further suggests that CNTLarge and Mitsui-7 were better able to perturb andescape vesicular enclosures in immune cells compared to CNTSmall. The larger CNTs’ apparentability to better escape vesicle enclosures, also correlate well with information gained by com-paring multiple in vivo studies [21,22,48,49]. We speculate that comparably large and stiffCNTs (30–70 nm wide and 0.5–5 mm long) more frequently escape the endosomal system thansmaller and more tangled CNTs.
The longer and thicker CNTs induced more ECP and BAL eosinophil influx, which was lesspronounced for CNTSmall and SWCNTs. The ECP and eosinophil response appear correlated andgiven an ECP incidence in excess of 80% this could be an important factor to test in future studies.
Supporting InformationS1 Table. Physicochemical characterization of the studied carbon nanotubes.Mean CNTdiameter and length were determined by TEM with the range describing the standard deviation(SD). The specific surface area (SSA) was determined by nitrogen adsorption using BET(Braunauer-Emmett-Teller). DLS describes the average aggregate size determined by DynamicLight Scattering (DLS) of well-dispersed CNTs. Chemical composition was determined bywavelength dispersive X-ray fluorescence (WDXRF), results were manually post-processed foreach individual element, to account for low concentration and peak overlaps, and data was
Time-Dependent Subcellular Distribution and Effects of CNTs in Lungs
PLOS ONE | DOI:10.1371/journal.pone.0116481 January 23, 2015 13 / 17

calculated as wt% of the oxides of the elements.�Data from the Nanogenotox joint action programme funded by EUHealth Programme (200921 01).#Data from Jackson et al. 2014 (submitted for publication elsewhere).(DOCX)
S2 Table. BAL cell count. Differential BAL cell counts (×103) and SEM in the parentheses forthe three CNTs. Values for vehicle instilled mice are based on N = 22–25, and N = 5–6 forCNT exposed mice. The control groups for CNTSmall and CNTLarge were pooled, since thesewere instilled using the same instillation vehicle (2% serum) and BAL cell composition of thecontrol groups was not significantly different from each other. Mitsui-7 was instilled using adifferent vehicle (10% BAL in 0.9%NaCl), BAL cell composition of Mitsui-7 controls was statis-tically different from the other control groups. The Mitsui-7 exposure groups were thereforeanalysed separately. Statistically significantly different data (p< 0.05) from vehicle instilledmice are marked with an asterisk (�).(DOCX)
S3 Table. ECP overview. Overview of the Chi3L3 level, eosinophil count (Eos) and ECP crystalpositive samples using light microscopy (LM) or TEM (yes indicates positive findings, no nega-tive findings). Dash (-) denotes no data available, while an asterisk (�) denotes statistically sig-nificant data (p<0.05). Thomas Swan and Sigma Long BAL cell slides were acquired from aprevious study: Saber AT, Lamson JS, Jacobsen NR, et al. (2013) Particle-Induced PulmonaryAcute Phase Response Correlates with Neutrophil Influx Linking Inhaled Particles and Cardio-vascular Risk. PLoS ONE 8:e69020. doi: 10.1371/journal.pone.0069020(DOCX)
S4 Table. Ccl11 and Ccl24mRNA levels. Ccl11 and Ccl24mRNA levels are given as the relativefold-increase in mRNA levels relative to concurrent vehicle controls, where values below 1 indi-cate a lowered mRNA level. Statistically significant changes (p<0.05) are marked with an asterisk(�).(DOCX)
S1 Fig. Multinucleate cells.Multinucleate cells as observed in light microscopy of BAL cells(CNTLarge, 54 mg, day 3) and transmission electron microscopy images of tissue (CNTLarge,162 mg, day 28).(TIF)
S2 Fig. Eosinophilic crystal variation. Light microscopy images of the eosinophilic crystals inBAL fluid (a-c). TEM images of eosinophilic crystals in the lung tissue (d-f). The crystals variedgreatly in size (a), and also in how well they were stained (b-c). (d) Crystals in TEM were ob-served intracellularly as sharply defined or with more blurred edges, and were also found extra-cellularly (e). (f) Shows a periodic*5 nm structure in a crystal.(TIF)
S1 Movie. 3D FIB-SEM video of ECP crystals. The image volume is 16.6 × 12.5 × 5.8 mmlarge, and crystals have manually been traced in the individual slides.(AVI)
AcknowledgmentsWe are grateful to Zhila Nikrozi, Michael Guldbrandsen and Lisbeth Meyer Petersen for tech-nical assistance. The authors would also like to thank the Core Facility for Integrated
Time-Dependent Subcellular Distribution and Effects of CNTs in Lungs
PLOS ONE | DOI:10.1371/journal.pone.0116481 January 23, 2015 14 / 17

Microscopy at the Faculty of Health and Medical Sciences, University of Copenhagen for pro-viding electron microscopy facilities. Mitsui-7 was a kind gift fromMitsui & Co, Ltd. We thankDr. Luna Rahman and Dr. Nathalie Decan for their helpful comments on the manuscript.
Author ContributionsConceived and designed the experiments: CK SP AS HW CY SH UV KM. Performed the ex-periments: CK SP NJ SH. Analyzed the data: CK SP. Contributed reagents/materials/analysistools: SH CY AS UV HW SP KQ. Wrote the paper: CK SP UV KM.
References1. Monthioux M, Kuznetsov VL (2006) Who should be given the credit for the discovery of carbon nano-
tubes? Carbon 44: 1621–1623. doi: 10.1016/j.carbon.2006.03.019.
2. Donaldson K, Poland CA, Murphy FA, MacFarlane M, Chernova T, et al. (2013) Pulmonary toxicity ofcarbon nanotubes and asbestos—Similarities and differences. Advanced Drug Delivery Reviews 65:2078–2086. doi: 10.1016/j.addr.2013.07.014 PMID: 23899865
3. Pauluhn J (2009) Subchronic 13-week inhalation exposure of rats to multiwalled carbon nanotubes:Toxic effects are determined by density of agglomerate structures, not fibrillar structures. ToxicologicalSciences 113: 226–242. doi: 10.1093/toxsci/kfp247 PMID: 19822600
4. Aschberger K, Johnston HJ, Stone V, Aitken RJ, Hankin SM, et al. (2010) Review of carbon nanotubestoxicity and exposure—Appraisal of human health risk assessment based on open literature. CriticalReviews in Toxicology 40: 759–790. doi: 10.3109/10408444.2010.506638 PMID: 20860524
5. Porter DW, Hubbs AF, Mercer RR, Wu N, Wolfarth MG, et al. (2010) Mouse pulmonary dose—and timecourse-responses induced by exposure to multi-walled carbon nanotubes. Toxicology 269: 136–147.doi: 10.1016/j.tox.2009.10.017 PMID: 19857541
6. Hamilton RF, Wu Z, Mitra S, Shaw PK, Holian A (2013) Effect of MWCNT size, carboxylation, and purifi-cation on in vitro and in vivo toxicity, inflammation and lung pathology. Particle and Fibre Toxicology10: 57. doi: 10.1186/1743-8977-10-57 PMID: 24225053
7. Nagai H, Okazaki Y, Chew SH, Misawa N, Yamashita Y, et al. (2011) Diameter and rigidity ofmultiwalled carbon nanotubes are critical factors in mesothelial injury and carcinogenesis. Proceedingsof the National Academy of Sciences 108: E1330–E1338. doi: 10.1073/pnas.1110013108 PMID:22084097
8. Poland CA, Duffin R, Kinloch I, Maynard A, WallaceWAH, et al. (2008) Carbon nanotubes introducedinto the abdominal cavity of mice show asbestos-like pathogenicity in a pilot study. Nature Nanotech 3:423–428. doi: 10.1038/nnano.2008.111 PMID: 18654567
9. Muller J, Huaux F, Fonseca A, Nagy JB, Moreau N, et al. (2008) Structural defects play a major role inthe acute lung toxicity of multiwall carbon nanotubes: Toxicological aspects. Chemical Research inToxicology 21: 1698–1705. doi: 10.1021/tx800101p PMID: 18636756
10. Wang X, Xia T, Addo Ntim S, Ji Z, Lin S, et al. (2011) Dispersal state of multiwalled carbon nanotubeselicits profibrogenic cellular responses that correlate with fibrogenesis biomarkers and fibrosis in themurine lung. ACS Nano 5: 9772–9787. doi: 10.1021/nn2033055 PMID: 22047207
11. Ali-Boucetta H, Nunes A, Sainz R, Herrero MA, Tian B, et al. (2013) Asbestos-like pathogenicity of longcarbon nanotubes alleviated by chemical functionalization. Angewandte Chemie 125: 2330–2334. doi:10.1002/ange.201207664.
12. Lacerda L, Russier J, Pastorin G, Herrero MA, Venturelli E, et al. (2012) Translocation mechanisms ofchemically functionalised carbon nanotubes across plasmamembranes. Biomaterials 33: 3334–3343.doi: 10.1016/j.biomaterials.2012.01.024 PMID: 22289266
13. Sager TM,Wolfarth MW, AndrewM, Hubbs A, Friend S, et al. (2014) Effect of multi-walled carbon nano-tube surface modification on bioactivity in the C57BL/6 mouse model. Nanotoxicology 8: 317–327. doi:10.3109/17435390.2013.779757 PMID: 23432020
14. Kapralov AA, FengWH, Amoscato AA, Yanamala N, Balasubramanian K, et al. (2012) Adsorption ofsurfactant lipids by single-walled carbon nanotubes in mouse lung upon pharyngeal aspiration. ACSNano 6: 4147–4156. doi: 10.1021/nn300626q PMID: 22463369
15. Ma-Hock L, Treumann S, Strauss V, Brill S, Luizi F, et al. (2009) Inhalation toxicity of multiwall carbonnanotubes in rats exposed for 3 months. Toxicological Sciences 112: 468–481. doi: 10.1093/toxsci/kfp146 PMID: 19584127
16. Poulsen SS, Jacobsen NR, Labib S, Wu D, Husain M, et al. (2013) Transcriptomic analysis revealsnovel mechanistic insight into murine biological responses to multi-walled carbon nanotubes in lungs
Time-Dependent Subcellular Distribution and Effects of CNTs in Lungs
PLOS ONE | DOI:10.1371/journal.pone.0116481 January 23, 2015 15 / 17

and cultured lung epithelial cells. PLoS ONE 8: e80452. doi: 10.1371/journal.pone.0080452 PMID:24260392
17. Erdely A, Liston A, Salmen-Muniz R, Hulderman T, Young S-H, et al. (2011) Identification of systemicmarkers from a pulmonary carbon nanotube exposure: Journal of Occupational and EnvironmentalMedicine 53: S80–S86. doi: 10.1097/JOM.0b013e31821ad724 PMID: 21654424
18. Girtsman TA, Beamer CA, Wu N, Buford M, Holian A (2014) IL-1R signalling is critical for regulation ofmulti-walled carbon nanotubes-induced acute lung inflammation in C57Bl/6 mice. Nanotoxicology 8:17–27. doi: 10.3109/17435390.2012.744110 PMID: 23094697
19. Muller J, Huaux F, Moreau N, Misson P, Heilier J-F, et al. (2005) Respiratory toxicity of multi-wall carbonnanotubes. Toxicology and Applied Pharmacology 207: 221–231. doi: 10.1016/j.taap.2005.01.008PMID: 16129115
20. Ronzani C, Spiegelhalter C, Vonesch J-L, Lebeau L, Pons F (2012) Lung deposition and toxicologicalresponses evoked by multi-walled carbon nanotubes dispersed in a synthetic lung surfactant in themouse. Archives of Toxicology 86: 137–149. doi: 10.1007/s00204-011-0741-y PMID: 21805258
21. Ryman-Rasmussen JP, Cesta MF, Brody AR, Shipley-Phillips JK, Everitt JI, et al. (2009) Inhaled car-bon nanotubes reach the subpleural tissue in mice. Nature Nanotechnology 4: 747–751. doi: 10.1038/nnano.2009.305 PMID: 19893520
22. Kobayashi N, Naya M, EmaM, Endoh S, Maru J, et al. (2010) Biological response and morphologicalassessment of individually dispersed multi-wall carbon nanotubes in the lung after intratracheal instilla-tion in rats. Toxicology 276: 143–153. doi: 10.1016/j.tox.2010.07.021 PMID: 20696199
23. Al-Jamal KT, Nerl H, Müller KH, Ali-Boucetta H, Li S, et al. (2011) Cellular uptake mechanisms offunctionalised multi-walled carbon nanotubes by 3D electron tomography imaging. Nanoscale 3: 2627.doi: 10.1039/c1nr10080g PMID: 21603701
24. MuQ, Broughton DL, Yan B (2009) Endosomal leakage and nuclear translocation of multiwalled carbonnanotubes: Developing a model for cell uptake. Nano Letters 9: 4370–4375. doi: 10.1021/nl902647xPMID: 19902917
25. Pantarotto D, Singh R, McCarthy D, Erhardt M, Briand J-P, et al. (2004) Functionalized carbon nano-tubes for plasmid DNA gene delivery. Angewandte Chemie International Edition 43: 5242–5246. doi:10.1002/anie.200460437 PMID: 15455428
26. Marangon I, Boggetto N, Ménard-Moyon C, Venturelli E, Béoutis M-L, et al. (2012) Intercellular carbonnanotube translocation assessed by flow cytometry imaging. Nano Letters 12: 4830–4837. doi: 10.1021/nl302273p PMID: 22928721
27. Købler C, Saber AT, Jacobsen NR, Wallin H, Vogel U, et al. (2014) FIB-SEM imaging of carbon nano-tubes in mouse lung tissue. Analytical and Bioanalytical Chemistry. Available: http://link.springer.com/10.1007/s00216-013-7566-x. Accessed 2014 Feb 26.
28. Nanogenotox (2013) Towards a method for detecting the potential genotoxicity of nanomaterials.Available: www.nanogenotox.eu. Accessed 2014 Apr 28.
29. Porter DW, Hubbs AF, Chen BT, McKinney W, Mercer RR, et al. (2013) Acute pulmonary dose–responses to inhaled multi-walled carbon nanotubes. Nanotoxicology 7: 1179–1194. doi: 10.3109/17435390.2012.719649 PMID: 22881873
30. Bhattacharya K, Andón FT, El-Sayed R, Fadeel B (2013) Mechanisms of carbon nanotube-induced tox-icity: Focus on pulmonary inflammation. Advanced Drug Delivery Reviews 65: 2087–2097. doi: 10.1016/j.addr.2013.05.012 PMID: 23751779
31. Ross MH (2011) Histology: a text and atlas: with correlated cell and molecular biology. 6th ed. Phila-delphia: Wolters Kluwer/Lippincott Williams &Wilkins Health. 974 p.
32. Persson H, Købler C, Mølhave K, Samuelson L, Tegenfeldt JO, et al. (2013) Fibroblasts cultured onnanowires exhibit low motility, impaired cell Division, and DNA Damage. Small 9: 4006–4016. doi: 10.1002/smll.201300644 PMID: 23813871
33. Wierzbicki R, Købler C, Jensen MRB, Łopacińska J, Schmidt MS, et al. (2013) Mapping the complexmorphology of cell interactions with nanowire substrates using FIB-SEM. PLoS ONE 8: e53307. doi:10.1371/journal.pone.0053307 PMID: 23326412
34. Elmore SA, Berridge BR, Boyle MC, Cora MC, Hoenerhoff MJ, et al. (2012) Proceedings of the 2012national toxicology program satellite symposium. Toxicologic Pathology 41: 151–180. doi: 10.1177/0192623312467102 PMID: 23262640
35. Feldmesser M, Kress Y, Casadevall A (2001) Intracellular crystal formation as a mechanism ofcytotoxicity in murine pulmonary Cryptococcus neoformans infection. Infection and Immunity 69:2723–2727. doi: 10.1128/IAI.69.4.2723-2727.2001 PMID: 11254641
36. Guo L (2000) Biochemical characterization of endogenously formed eosinophilic crystals in the lungs ofmice. Journal of Biological Chemistry 275: 8032–8037. doi: 10.1074/jbc.275.11.8032 PMID: 10713123
Time-Dependent Subcellular Distribution and Effects of CNTs in Lungs
PLOS ONE | DOI:10.1371/journal.pone.0116481 January 23, 2015 16 / 17

37. Murray AB, Luz A (1990) Acidophilic macrophage pneumonia in laboratory mice. Vet Pathol 27: 274–281. PMID: 2169666
38. Hoenerhoff MJ, Starost MF,Ward JM (2006) Eosinophilic crystalline pneumonia as amajor cause of deathin 129S4/SvJaemice. Veterinary Pathology 43: 682–688. doi: 10.1354/vp.43-5-682 PMID: 16966445
39. Bourdon JA, Saber AT, Jacobsen NR, Jensen KA, Madsen AM, et al. (2012) Carbon black nanoparticleinstillation induces sustained inflammation and genotoxicity in mouse lung and liver. Particle and FibreToxicology 9: 5. doi: 10.1186/1743-8977-9-5 PMID: 22300514
40. Saber AT, Lamson JS, Jacobsen NR, Ravn-Haren G, Hougaard KS, et al. (2013) Particle-induced pul-monary acute phase response correlates with neutrophil influx linking inhaled particles and cardiovas-cular risk. PLoS ONE 8: e69020. doi: 10.1371/journal.pone.0069020 PMID: 23894396
41. Nio J, Fujimoto W, Konno A, Kon Y, Owhashi M, et al. (2004) Cellular expression of murine Ym1 andYm2, chitinase family proteins, as revealed by in situ hybridization and immunohistochemistry. Histo-chemistry and Cell Biology 121. Available: http://link.springer.com/10.1007/s00418-004-0654-4. Ac-cessed 2013 Oct 4.
42. Waern I, Jia J, Pejler G, Zcharia E, Vlodavsky I, et al. (2010) Accumulation of Ym1 and formation of in-tracellular crystalline bodies in alveolar macrophages lacking heparanase. Molecular Immunology 47:1467–1475. doi: 10.1016/j.molimm.2010.02.004 PMID: 20226534
43. Humbles AA, Lu B, Friend DS, Okinaga S, Lora J, et al. (2002) The murine CCR3 receptor regulatesboth the role of eosinophils and mast cells in allergen-induced airway inflammation and hyperrespon-siveness. Proceedings of the National Academy of Sciences 99: 1479–1484. doi: 10.1073/pnas.261462598 PMID: 11830666
44. Guo R-F, Lentsch AB, Warner RL, Huber-Lang M, Sarma JV, et al. (2001) Regulatory effects of eotaxinon acute lung inflammatory injury. The Journal of Immunology 166: 5208–5218. PMID: 11290805
45. Heath H, Qin S, Rao P, Wu L, LaRosa G, et al. (1997) Chemokine receptor usage by human eosino-phils. The importance of CCR3 demonstrated using an antagonistic monoclonal antibody. Journal ofClinical Investigation 99: 178–184. doi: 10.1172/JCI119145 PMID: 9005985
46. Ben-Yehuda C, Bader R, Puxeddu I, Levi-Schaffer F, Breuer R, et al. (2008) Airway eosinophil accumu-lation and eotaxin-2/CCL24 expression following allergen challenge in BALB/c mice. ExperimentalLung Research 34: 467–479. doi: 10.1080/01902140802220625 PMID: 18850374
47. Canton I, Battaglia G (2012) Endocytosis at the nanoscale. Chemical Society Reviews 41: 2718. doi:10.1039/c2cs15309b PMID: 22389111
48. Wang X, Zang JJ, Wang H, Nie H, Wang TC, et al. (2010) Pulmonary toxicity in mice exposed to lowand medium doses of water-soluble multi-walled carbon nanotubes. Journal of Nanoscience and Nano-technology 10: 8516–8526. doi: 10.1166/jnn.2010.2688 PMID: 21121361
49. Treumann S, Ma-Hock L, Groters S, Landsiedel R, van Ravenzwaay B (2013) Additional histopatholog-ic examination of the lungs from a 3-month inhalation toxicity study with multiwall carbon nanotubes inrats. Toxicological Sciences 134: 103–110. doi: 10.1093/toxsci/kft089 PMID: 23570993
50. Van Zweiten M., Zurcher C, Solleveld HA, Hollander CF (1981) Immunological techniques applied toaging research. Boca Raton, Fla: CRC Press. 236 p.
51. Teeguarden JG,Webb-Robertson B-J, Waters KM, Murray AR, Kisin ER, et al. (2010) Comparative proteo-mics and pulmonary toxicity of instilled single-walled carbon nanotubes, crocidolite asbestos, and ultrafinecarbon black in mice. Toxicological Sciences 120: 123–135. doi: 10.1093/toxsci/kfq363 PMID: 21135415
52. Nygaard UC, Hansen JS, Samuelsen M, Alberg T, Marioara CD, et al. (2009) Single-walled and multi-walled carbon nanotubes promote allergic immune responses in mice. Toxicological Sciences 109:113–123. doi: 10.1093/toxsci/kfp057 PMID: 19293371
53. Saber AT, Jacobsen N, Mortensen A, Szarek J, Jackson P, et al. (2012) Nanotitanium dioxide toxicityin mouse lung is reduced in sanding dust from paint. Particle and Fibre Toxicology 9: 4. doi: 10.1186/1743-8977-9-4 PMID: 22300483
54. Saber AT, Jensen KA, Jacobsen NR, Birkedal R, Mikkelsen L, et al. (2012) Inflammatory and genotoxiceffects of nanoparticles designed for inclusion in paints and lacquers. Nanotoxicology 6: 453–471. doi:10.3109/17435390.2011.587900 PMID: 21649461
55. Beamer CA, Girtsman TA, Seaver BP, Finsaas KJ, Migliaccio CT, et al. (2013) IL-33mediatesmulti-walledcarbon nanotube (MWCNT)-induced airway hyper-reactivity via themobilization of innate helper cells inthe lung. Nanotoxicology 7: 1070–1081. doi: 10.3109/17435390.2012.702230 PMID: 22686327
56. Inoue K, Koike E, Yanagisawa R, Hirano S, Nishikawa M, et al. (2009) Effects of multi-walled carbonnanotubes on a murine allergic airway inflammation model. Toxicology and Applied Pharmacology237: 306–316. doi: 10.1016/j.taap.2009.04.003 PMID: 19371758
57. Andón FT, Kapralov AA, YanamalaN, FengW, BayganA, et al. (2013) Biodegradation of single-walled carbonnanotubes by eosinophil peroxidase. Small 9: 2721–2729. doi: 10.1002/smll.201202508 PMID: 23447468
Time-Dependent Subcellular Distribution and Effects of CNTs in Lungs
PLOS ONE | DOI:10.1371/journal.pone.0116481 January 23, 2015 17 / 17
Copyright © 2022 FDOKUMEN