Towards traceable size determination of extracellular vesicles
Upload
khangminh22Category
view
0download
0
HAL Id hal-03399741httpshalarchives-ouvertesfrhal-03399741
Preprint submitted on 24 Oct 2021
HAL is a multi-disciplinary open accessarchive for the deposit and dissemination of sci-entific research documents whether they are pub-lished or not The documents may come fromteaching and research institutions in France orabroad or from public or private research centers
Lrsquoarchive ouverte pluridisciplinaire HAL estdestineacutee au deacutepocirct et agrave la diffusion de documentsscientifiques de niveau recherche publieacutes ou noneacutemanant des eacutetablissements drsquoenseignement et derecherche franccedilais ou eacutetrangers des laboratoirespublics ou priveacutes
Topological connection between vesicles and nanotubesin single-component lipid membranes driven by head-tail
interactionsNiki Baccile Ceacutedric Lorthioir Abdoul Ba Patrick Le Griel Cristina Diogo
Javier Perez Wim Soetaert Sophie Roelants
To cite this versionNiki Baccile Ceacutedric Lorthioir Abdoul Ba Patrick Le Griel Cristina Diogo et al Topologicalconnection between vesicles and nanotubes in single-component lipid membranes driven by head-tailinteractions 2021 hal-03399741
1
Topological connection between vesicles and nanotubes in single-1
component lipid membranes driven by head-tail interactions 2
3
Niki Baccilea Ceacutedric Lorthioira Abdoul Aziz Baa Patrick Le Griela Cristina Coelho Diogob 4
Javier Perezc Wim Soetaertd Sophie L K W Roelantsd 5
6
a Sorbonne Universiteacute Centre National de la Recherche Scientifique Laboratoire de Chimie de 7
la Matiegravere Condenseacutee de Paris LCMCP F-75005 Paris France 8
b Institut des Mateacuteriaux de Paris Centre Sorbonne Universiteacute Paris France 9
c Synchrotron Soleil LrsquoOrme des Merisiers Saint-Aubin BP48 91192 Gif-sur-Yvette Cedex 10
France 11
d InBio Department of Biotechnology Ghent University Ghent Belgium 12
13
Corresponding author 14
Dr Niki Baccile 15
E-mail address nikibaccilesorbonne-universitefr 16
Phone +33 1 44 27 56 77 17
2
Abstract 18
Lipid nanotube-vesicle networks are important channels for intercellular communication and 19
transport of matter Experimentally observed in neighboring mammalian cells but also 20
reproduced in model membrane systems a broad consensus exists on their formation and 21
stability Lipid membranes must be composed of at least two components each stabilizing low 22
(generally a phospholipid) and high curvatures Strong anisotropy or enhanced conical shape 23
of the second amphiphilic component is crucial for the formation of nanotunnels Anisotropic 24
driving forces generally favor nanotube protrusions from vesicles In the present work we 25
report the unique case of topologically-connected nanotubes-vesicles obtained in the absence 26
of directional forces in single-component membranes composed of an anisotropic bolaform 27
glucolipid above its melting temperature Tm Cryo-TEM and fluorescence confocal 28
microscopy show the interconnection between vesicles and nanotubes in a single-phase region 29
between 60deg and 90degC under diluted conditions Solid-state NMR necessarily recorded on the 30
dry powder yet demonstrates that the glucolipid can simultaneously assume two distinct 31
configurations head-head and head-tail These arrangements seemingly of comparable energy 32
above the Tm could explain the existence and stability of the topologically-connected vesicles 33
and nanotubes which are generally not observed for classical single-component phospholipid-34
based membranes above their Tm 35
36
Keywords Nanotube vesicle networks Tunnelling nanotubes Block liposomes Liposomes 37
Lipid nanotubes Biosurfactants Microbial glycolipids 38
39
Introduction 40
Topological connections between closed lipidic compartments through nanotubes1ndash3 41
have been shown to play a crucial role in the transfer of matter and communication in 42
neighboring mammalian cells4 These singular nanosystems observed since the lsquo90s as 43
spontaneous non-equilibrium structures in electroformed model liposome membranes56 have 44
since been largely studied both experimentally and theoretically7ndash9 Addressed in the literature 45
by different terms tunnelling nanotubes (TNT)149 block liposomes10ndash12 or nanotube-vesicle 46
networks13ndash16 (instead of tubes some work speak of tethers617) all refer to a similar 47
phenomenon driven by various internal or external forces The latter must overcome the energy 48
barrier needed to bend a phospholipid bilayer from low positive mean and gaussian curvatures 49
(vesicle) to a high mean and zero Gaussian (tube) curvatures 50
3
A large body of both experimental and theoretical work has shown that budding and 51
eventual nanotube formation from an existing membrane can only occur spontaneously for 52
membranes of at least two-components9102425111218ndash23 and below a vesicle-nanotube phase 53
transition event2627 Otherwise external anisotropic driving forces like electroformation5ndash54
82829 osmotic pressure6 laser ldquotweezersrdquo30 or electrodynamics13ndash16 must be employed to obtain 55
similar results with in some cases an impressive degree of 2D and 3D organization13ndash16 The 56
origin of spontaneous nanotube formation has been shown to be related to a nanoscale phase 57
separation between two membrane components stabilizing low and high curvatures 58
respectively10ndash1231 with at least one component being highly anisotropic203233 Theoretically 59
this behavior has been explained by deviations in the elastic properties of membranes due to in-60
plane orientational ordering of membrane inclusions composed of anisotropic amphiphiles 61
these referring to a non-symmetrical shape upon a 90deg tilt along the amphiphile axis8919242533 62
In this work we show unexpected nanotubing of membranes prepared from a single-63
component lipid in the absence of external directional forces and above the lipidrsquos Tm This 64
phenomenon is observed for a novel anisotropic double amphiphile (bolaform amphiphile or 65
bolaamphiphile) a glucolipid composed of β-D-glucose and a C181-cis fatty alcohol (G-66
C181-OH Figure 1) This compound is obtained by microbial fermentation of a genetically-67
modified S bombicola yeast in the presence of oleyl alcohol34 and is developed in the broader 68
context of extending the library of new biobased surfactants and lipids in view of replacing 69
petrochemical low molecular weight amphiphiles35ndash41 The structure of G-C181-OH is 70
analogous to that of other microbial glycolipids developed through genetic engineering4243 71
Topological connections between nanotubes and vesicles are observed by means of 72
cryogenic transmission electron microscopy (cryo-TEM) fluorescence microscopy and wide 73
angle X-ray scattering (WAXS) above the melting temperatures Tm= 483degC under strong 74
dilution (05 wt) Spin diffusion and 1H double-quantum single-quantum (DQ-SQ) 2D solid-75
state nuclear magnetic resonance (ssNMR) spectroscopy under magic angle spinning (MAS) 76
necessarily performed on the dry glucolipid powder provides a spectroscopic ground to 77
understand the vesicle-nanotube coexistence The bolaform glucolipids could be in a head-78
headtail-tail configuration in the vesicles but rather in a head-tail configuration in the 79
nanotubes In the dry glucolipid both configurations are energetically comparable in the single-80
phase region above Tm and their coexistence is evidenced by the splitting of some 13C NMR 81
signals These facts could explain the stability of nanotubes while the following hypotheses are 82
formulated for their formation membrane inclusions with different orientational ordering13ndash16 83
possibly driven by inter-vesicle collisions 84
4
85
86
87
88
89
Figure 1 ndash Non acetylated C181 alcohol glucoside G-C181-OH is obtained by a bioprocess performed 90
with modified S bombicola yeast 91
92
Experimental Section 93
Synthesis of non acetylated C181 Alcohol Glucosides (G-C181-OH) G-C181-OH (Mw= 94
41856 gmol-1) was produced by aerobic whole cell bioprocess with a modified S bombicola 95
strain as described by Van Renterghem et al (Fig S4 in Ref 34) The molecule was purchased 96
from the Bio Base Europe Pilot Plant (Gent Belgium) and has the generalized chemical 97
structure given in figure Figure 1 The HPLC and 1H NMR spectrum (MeOD-d4) with peak 98
assignment are shown in Figure S 1 High purity levels (99) and high degree of uniformity 99
were obtained as can be derived from HPLC-ELSD chromatogram 1H NMR and table of 100
contaminant given in Figure S 1 101
102
1H solution Nuclear Magnetic Resonance (NMR) 1H solution NMR experiments were 103
performed on a Bruker Avance III 300 spectrometer using a 5 mm 1H-X BBFO probe using 104
methanol-d4 as solvent The number of transients is 8 with 3 s recycling delay an acquisition 105
time of 546 s and a receiver gain of 362 The 1H NMR spectrum and relative assignment are 106
shown in Figure S 1 and Table S 1 13C solution NMR were performed on the same probe using 107
DMSO-d6 Corresponding chemical shifts are given in Table 1 Referencing is done with 108
respect to TMS δ1H= 0 ppm δ13C= 0 ppm 109
110
Sample preparation The sample was dissolved in milliQ-grade water at the concentration of 5 111
mgmL (05 wt) Lack of pH-sensitive probes (eg COOH groups) in G-C181-OH as 112
otherwise found in other microbial amphiphiles44 but also the will to avoid ion-specific 113
effects45 exclude the use of buffer The solution was heat at the given temperature using a CH3-114
150 Combitherm-2 dry block heating device For the cryo-TEM experiments the vials were 115
heat at the given temperature next to the cryofixation device and plunged into liquid ethane as 116
fast as possible For temperatures of 25degC and 70degC the sample was heat at 90degC and then 117
Synthesis path
5
cooled at to the desired temperature For the SAXS experiment the sample was heat at 90degC in 118
the block heating device and cooled at to 25degC before analysis For the SANS experiment the 119
sample was heat at 90degC directly in front of the beam using the thermalized sample holder 120
available 121
122
Differential Scanning Calorimetry (DSC) DSC was performed using a DSC Q20 apparatus 123
from TA Instruments equipped with the Advantage for Q Series Version acquisition software 124
(v540) Acquisition was performed on both hydrated and dry powder sample (~ 3-5 mg) sealed 125
in a classical aluminium cup and using an immediate sequence of heating and cooling ramps at 126
a rate of 10degCmin-1 Melting temperatures Tm 1 and 2 Tm1 and Tm2 were taken at the minimum 127
of the endothermic peak 128
129
Small and Wide Angle Scattering experiments Small angle neutron scattering (SANS) 130
experiments were performed at the D11 beamline of Institut Laue Langevin (Grenoble France) 131
during the run No 9-13-778 Four q-ranges have been explored and merged using the following 132
wavelengths λ and sample-to-detector (StD) distances 1) ultra-low q λ= 135Aring StD= 39 m 133
2) low-q λ= 53Aring StD= 39 m 3) mid-q λ= 53Aring StD= 8 m 4) high-q λ= 53Aring StD= 14 m 134
The sample (C= 5 mgmL-1) was prepared in 999 D2O to limit the incoherent background 135
scattering The sample solution was analyzed in standard 1 mm quartz cells Direct beam empty 136
quartz cell H2O (incoherent scatterer) within the quartz cell were recorded and boron carbide 137
(B4C) was used as neutron absorber The sample acquisition was measured at 90degC where 138
temperature was controlled through the controller thermalized sample holder available at the 139
beamline The background sample (D2O) signal was subtracted from the experimental data 140
Absolute values of the scattering intensity were obtained from the direct determination of the 141
number of neutrons in the incident beam and the detector cell solid angle The 2D raw data were 142
corrected for the ambient background and empty cell scattering and normalized to yield an 143
absolute scale (cross section per unit volume) by the neutron flux on the samples The data were 144
then circularly averaged to yield the 1D intensity distribution I(q) The software package Grasp 145
(developed at ILL and available free of charge) was used to integrate the data while the 146
software package SAXSUtilities (developed at ESRF and available free of charge) was used to 147
merge the data acquired at all configurations and subtract the background 148
Wide-angle X-ray scattering (WAXS) was performed under temperature control at the 149
SWING beamline of SOLEIL synchrotron facility (Saint-Aubin France) during the run 150
20201747 (energy 14 keV sample-to-detector distance 05 m) Two sample concentrations in 151
6
H2O were probed C= 5 mgmL-1 and C= 25 mgmL-1 The 2D data were integrated azimuthally 152
at the beamline using the software Foxtrot and in order to obtain the I(q) vs q spectrum after 153
masking the beam stop shadow Silver behenate (d(100) = 5838 Aring) was used as a standard to 154
calibrate the q-scale Sample solutions were inserted in borosilicate capillaries of 15 mm in 155
diameter Capillaries were flame-sealed A capillary oven with controlled temperature (plusmn 05degC) 156
provided at the beamline was used to control the sample temperature between 25degC and 111degC 157
Data were normalized by the transmission and calibrated to the SAXS signal of H2O at large q-158
values (I= 00163 cm-1) in order to obtain an absolute intensity scale The water signal was 159
measured by subtracting the signal of the empty capillary from the signal of a water-filled 160
capillary The signal of (water + capillary) was used as background for the samples and it was 161
subtracted after integration of the 2D data 162
163
Cryogenic transmission electron microscopy (cryo-TEM) Cryo-TEM experiments were carried 164
out on an FEI Tecnai 120 twin microscope operating at 120 kV and equipped with a Gatan 165
Orius CCD numeric camera The sample holder was a Gatan Cryoholder (Gatan 626DH 166
Gatan) Digital Micrograph software was used for image acquisition Cryofixation was 167
performed using a homemade cryofixation device The solutions were deposited on a glow-168
discharged holey carbon coated TEM copper grid (Quantifoil R22 Germany) Excess solution 169
was removed and the grid was immediately plunged into liquid ethane at -180degC before 170
transferring them into liquid nitrogen All grids were kept at liquid nitrogen temperature 171
throughout all experimentation Cryo-TEM images have been treated and analyzed using Fiji 172
(is just ImageJ) software available free of charge at the developerrsquos website46 173
The samplersquos concentration was C= 5 mgmL-1 For technical reasons the temperature 174
during cryofixation could not be controlled For this reason the temperature associated with 175
each cryo-TEM image in the text was related to the equilibration temperature just before 176
cryofixation the device being as close as possible to the dry bath used for temperature control 177
Since temperature control during cryofixation was not possible in our device and practically 178
impossible at high temperatures one should take the T values as indicative of the given value 179
Although the sample transfer between the dry bath and the cryofixation device was performed 180
as fast as possible it is more than likely that the actual temperature of the sample at the moment 181
of cryofixation was lower than the one indicated here although impossible to know precisely 182
183
7
Fluorescence microscopy Images were recorded using a 40x objective on a Leica SP5 upright 184
confocal microscope with 405 nm laser excitation The sample was marked with 6-dodecanoyl-185
NN-dimethyl-2-naphthylamine (Laurdan Mw= 35354 gmol-1) fluorophore as follows A 186
stock solution of 3 mg of Laurdan in 100 microL of acetone was initially prepared (C= 30 mgmL-187
1) A volume of 028 microL of the stock Laurdan solution was diluted in 1 mL of a 5 mgmL-1 G-188
C181-OH water solution temporary set at 110degC in a sealed Eppendorf The latter was 189
important so to enhance inclusion of Laurdan in the membrane constituted by the glucolipid 190
while in its vesicle phase The final Laurdan concentration was approximately 24 micromol with a 191
molar Laurdan-to-G-C181-OH molar ratio of approximately 1-to-500 Fluorophore-to-lipid 192
ratios above 1200 were generally considered as non-interfering with the lipid phase behavior 193
as also verified in this work 194
Laurdan can be excited between 365 nm and 410 nm and its emission wavelength can 195
vary according to the rigidity of the membrane intercalation within a rigid or flexible 196
membrane generates emissions at 440 nm or 490 nm respectively47 In the present experiment 197
we have flame-sealed a solution of G-C181-OH at 5 mgmL-1 containing Laurdan (1-to-500 in 198
lipid-to-Laurdan ratio) in flat optical capillaries of 01 mm thickness Capillaries were set on a 199
Linkam support for temperature control eventually placed under the microscope The sample 200
was excited at 405 nm and detection was made in spectral mode with a 5 nm window sliding 201
every 5 nm from 412 nm to 602 nm in 16 bits which allows quantify the signal and compare 202
the different conditions Quantitative analysis was performed according to the literature4849 203
several ROI (range of interest) have been drawn on several images using the ROI manager of 204
Fiji (is just ImageJ) software The integrated intensity of each ROI at 440 nm and 490 nm was 205
eventually recorded and used to calculate the value of the generalized polarization GP as 206
follows of 207
119866119875 =(120582440 minus 120582490)
120582440 + 120582490 208
A negative GP indicates a flexible membrane while a positive GP indicates a rigid membrane 209
210
Solid-state Nuclear Magnetic Resonance (ssNMR) 1H and 13C ssNMR experiments have been 211
performed using an Avance III HD Bruker 705 T (ν1H= 300 MHz) spectrometer and a 4 mm 212
magic angle spinning (MAS) probe except for the BAck-to-BAck (BABA) experiment which 213
was performed on an Avance III Bruker 1644 T (ν1H= 700 MHz) spectrometer equipped with 214
25 mm MAS probe Temperature was controlled through a Smart cooler BCUIIa BCU-xtreme 215
unit using 10 min of equilibration time after each temperature variation Temperature was 216
8
always varied from high (110degC) to low (70degC) before analysis Due to combined use of fast 217
MAS rates necessary to achieve high resolution spectra and heating close to the boiling point 218
of water neither diluted nor concentrated samples could be used for ssNMR experiments All 219
tests employing up to 50 wt G-C181-OH in water resulted in sample centrifugation drying 220
but also expulsion from the rotor causing sudden stop of rotor spinning For these reasons all 221
attempts to study hydrated G-C181-OH failed and only the dry powder could be analyzed The 222
dry sample powder was analyzed as such in zirconia rotors (4 mm or 25 mm) spinning at MAS= 223
10 kHz (4 mm) or 22 kHz (25 mm) and Chemical shifts were calibrated with respect to 224
adamantane (13C 13C(CH2)= 3848 ppm = 191 ppm) and glycine alpha (13C(CO)= 17603 225
ppm) Details on the acquisition parameters are given in the Supporting Information 226
227
Results and discussion 228
Topologically-connected nanotubes and vesicles 229
G-C181-OH is a biobased glucolipid water-insoluble at room temperature and of 230
which the physicochemical properties are poorly known The DSC thermogram performed at 231
10degCmin of G-C181-OH as a function of the water content (Figure 2a) shows two endothermic 232
peaks on the dry powder (996 wt glucolipid) They are attributed to two melting phenomena 233
occurring at the following temperatures Tm 483degC (Tm1) and 957degC (Tm2) the enthalpy of the 234
former being lower than that of the latter Interestingly DSC also shows that Tm1 is hydration 235
independent and reversible (the associated exothermic peak is systematically observed) while 236
the transition at Tm2 is simply suppressed (here tested up to 130degC) on hydrated powders and 237
never observed on the cooling profile even at slow cooling rates (1degCmin) The thermogram 238
recorded on the dry powder is typical of single-component lipids having an intermediate50 239
metastable phase (often referred to the ripple phase Pβ´ in reference to the periodic undulation 240
of the bilayer)50ndash54 between the classical lamellar gel (Lβ) and liquid crystalline (Lα) phases50ndash241
54 and characterized by regions of both liquid order and disorder5455 The effect of water does 242
not influence the low-temperature crystallization at Tm1 but it contributes to disrupt the ordered 243
array of hydrocarbon chains in the metastable phase 244
On the basis of the DSC thermogram the aqueous phase behavior of G-C181-OH under 245
diluted conditions (5 mgmL-1) was studied at four different temperatures (red marks on Figure 246
2a) below and above Tm1 but also between Tm1 and Tm2 corresponding to the thermogram of 247
the dry powder 248
9
249
Figure 2 ndash a) DSC thermogram of G-C181-OH under dry (04 wt water estimated by thermogravimetric 250
analysis) and hydrated conditions recorded at a heating rate of 10degCmin Red marks indicate the 251
temperatures at which cryo-TEM experiments are performed on the corresponding 5 mgmL aqueous 252
solutions b) Cryo-TEM images recorded for a 5 mgmL G-C181-OH aqueous solution heat at T= 130degC 253
90degC 70degC and 25degC T indicates the temperature of the sample solution before cryofixation Tne T T 254
being the temperature of the sample upon plunging in liquid ethane Please refer to the materials and 255
methods section for more information 256
T= 130degC
T= 90degC
T= 70degC
T= 25degC
a)
b)
20 40 60 80 100 120
99 wt
50 wt
25 wt
T degC
En
do
10 wt
Tm1= 483 degC
Tm2= 957 degC
10
257
The series of cryo-TEM images in Figure 2b show an overview of the most relevant 258
structures observed on G-C181-OH solution from T= 130degC to T= 25degC whereas T is 259
indicative of the equilibrium temperature before cryofixation (refer to materials and methods 260
section for more information on the sense and interpretation of T) At Tgt 100degC the sample 261
is essentially composed of polydisperse single wall vesicles massively shown by the 262
complementary pictures presented in Figure S 2 In between Tm1 and Tm2 at T= 90degC and T= 263
70degC (Figure 2b Figure 3 Figure 4 complemented by Figure S 3 and Figure S 4) vesicles are 264
connected by nanotubes At Tlt Tm1 flat crystals are otherwise observed (Figure 2b and Figure 265
S 5) 266
267
268
Figure 3 ndash Cryo-TEM images recorded for a 5 mgmL G-C181-OH aqueous solution heat at T= 90degC 269
270
A deeper insight at T= 90degC is given in Figure 3 (more images are provided in Figure 271
S 3) Arrows 1 through 6 mark very clearly the typical continuity in the glucolipid membrane 272
between the vesicle and nanotubes Arrow Ndeg 7 shows that a single nanotube connects the outer 273
membrane of two vesicles several hundred nanometers apart The connection is shown by 274
2
34
5
6
6
1
5
7
A
B
D
C
0 10 20 30 40 50 60
BIn
tensity
au
Profile nm
A
0 10 20 30 40 50 60
Inte
nsity
au
Profile nm
C
D
T= 90degC
11
arrows Ndeg5 and Ndeg6 The corresponding profiles A through D confirm the tubular nature of 275
the elongated objects Profiles B and D are both characterized by typical symmetrical thick 276
walls (low intensity depths highlighted by shaded rectangles) surrounding a hollow region (high 277
intensity peak between the shaded rectangles) The wall thickness varies between 35 and 40 278
nm for profile B and between 41 and 61 nm for profile D while the total nanotube diameter 279
varies between 14 nm at B and 20 nm at D At the same time the thickness of the vesicle wall 280
is about 6 nm at A and 135 nm at C Considerations about the bilayer or interdigitated structure 281
of the membrane will be presented below 282
The connection between nanotubes and vesicles seems to be multiple For instance 283
arrow Ndeg1 (Figure S 3) and Ndeg4 (Figure 3) show a single-wall vesicle of which the membrane 284
is extruded into a nanotube Similarly a closer look at arrows Ndeg1 2 and 3 in Figure 3 show 285
that the vesicle is single-wall and fully closed while the nanotube nucleates at the vesicle outer 286
surface with no apparent topological continuity In many regions of the sample at T= 90degC 287
one can find exvaginations or buds232531 in the nanotube wall This is shown for instance by 288
arrows Ndeg7 and particularly put in evidence in Figure 4 by arrows Ndeg1 through Ndeg4 where the 289
amplitude of the oscillation varies between 20-25 nm (arrow Ndeg1) and 6-8 nm (arrows Ndeg3-4) 290
291
Figure 4 - Cryo-TEM images recorded for a 5 mgmL G-C181-OH aqueous solution heated at T= 90degC 292
293
Still between Tm2 and Tm1 but at lower temperature (T= 70degC) the nanotubes seem to 294
vary from single threads (arrow Ndeg1 Figure S 4) to nanotubes of diameter below 15 nm both 295
connecting nanotubes of diameter ranging between 50 nm and 100 nm (arrows Ndeg2 Figure S 296
4) The larger tubes are most likely formed by the inflation and flattening of the nanotubes 297
probably after assimilation of surrounding vesicles and fusion of the exvagination discussed 298
above The transition between vesicles tubes and flat membranes is certainly more accentuated 299
Arrow Ndeg3 in Figure S 4 shows distinct vesicles while arrow Ndeg4 identifies a flat structure 300
evidently formed from fused vesicles In particular arrow Ndeg5 points at the fusion of two 301
2
1 132
4
12
vesicles while arrow Ndeg6 points at two vesicles fusing into the flat membrane Additional areas 302
where vesicle fusion is prominent are indicated by the oscillations at the outer skirt of broad 303
lamellae and pointed by arrow Ndeg7 304
Finally below Tm1 at T= 25degC for instance mainly flat crystals with no visible 305
exvaginations or tubes are visible (Figure S 5) by cryo-TEM and the material turns into an 306
insoluble precipitate Massive presence of flat crystalline structures is also clear from the bulk 307
iridescent behavior of a G-C181-OH solution under manual shear 308
In summary despite the uncertainty related to the actual state of equilibrium of the 309
glucolipids at the moment of cryofixation cryo-TEM depicts a vesicle phase at Tgt 100degC a 310
flat lamellar phase below Tm1 and an interconnected vesicle-nanotube network between Tm1 and 311
about 100degC The combination of statistically-relevant fluorescence microscopy and 312
scatteringdiffraction experiments provides an additional proof of the coexistence of 313
vesiclenanotube systems between the two transition temperatures Please note that the 314
experiments reported below have been performed under controlled conditions of temperature 315
which is then indicated by the use of T instead of T 316
13
317
Figure 5 ndash a-c) Confocal fluorescence microscopy images recorded at 90degC and 70degC for a 5 mgmL G-318
C181-OH aqueous solution d-g) Typical fluorescence microscopy images recorded at T= 80degC using 319
Laurdan (refer to materials and methods section for more details on this fluorophore) Excitation 320
wavelength is 405 nm for all the images while emission wavelength is 490 nm in (df) and 440 nm in (eg) 321
h) Full emission spectra obtained from the integration of various fluorescence images recorded from 412 322
nm to 600 nm (step 5 nm) at 90degC 80degC and 70degC i) Box plot of GP defined as 119918119927 =(120640120786120786120782minus120640120786120791120782)
120640120786120786120782+120640120786120791120782 with 120640120786120786120782 323
and 120640120786120791120782 being the emission wavelengths at 440 nm and 490 nm at 90degC 80degC and 70degC Each data point 324
l= 490 nm l= 440 nm
l= 490 nm l= 440 nm
10 μm400 450 500 550 600
00
02
04
06
08
10
No
rma
lize
d I
nte
nsity
l nm
90degC
80degC
80degC
70degC
70degC
400 450 500 550 60000
02
04
06
08
10
No
rma
lize
d I
nte
nsity
l nm
90degC
80degC
80degC
70degC
70degC
d) e)
f) g)
h)
i)
T= 80degC
Laurdan
T= 80degC
T= 80degC T= 80degC
T= 90degC T= 70degC T= 70degC
a) b) c)
1
1
1
14
corresponds to a set of regions of interest (ROIs) (54 at 90degC 65 at 80degC and 75 at 70degC) selected in the 325
corresponding fluorescence images ROIs were representatively selected so to include the entire image but 326
also vesicles alone tubes alone and mixtures of vesicles and tubes 327
328
Figure 5ab shows two typical confocal fluorescence microscopy images recorded on a 329
G-C181-OH solution (5 mgmL) in a flame-sealed capillary heat at T= 90degC and T= 70degC 330
Although the resolution of optical microscopy is not comparable with cryo-TEM the sample is 331
broadly composed of vesicles coexisting with nanotubes whereas in some cases the nanotube 332
starts from the vesicle itself (arrow Ndeg1) in good agreement with cryo-TEM data Furthermore 333
SANS recorded at T= 90degC (Figure S 6a) shows a scattering profile with a pronounced -2 334
dependence of the scattering intensity against the wavevector q in the log-log scale This 335
indicates the massive presence of a flat interface and it is expected typical of bilayers in 336
vesicular morphologies56 However the typical signature of nanotubes cannot be observed in 337
the SANS profile and this can be explained by both an argument related to the relative lower 338
amount of nanotubes with respect to vesicles at 90degC but also to the steeper slope of flat 339
morphologies (-2) compared to tubes (-1) the signal of the former masking the tube signal at 340
low wavevector values The SANS profile is characterized by a diffraction peak at q= 0167 Aring-341
1 of which the assignment is refined by WAXS data 342
Temperature-driven WAXS experiments in Figure S 6bc (5 mgmL-1 and 25 mgmL-1 343
respectively) show a lamellar order possibly attributed to a multilamellar structure of the 344
vesicles (dv Figure S 6d) at high temperature and to the interplanar arrangement of the 345
crystalline flat structures (dL Figure S 6d) at T= 25degC The sharp (001) reflection indicates 346
typical interlamellar distance of 353 Aring at 25degC although this value varies with temperature 347
(400 Aring at 111degC 372 Aring at 88degC) thus confirming its assignment to a hydration-dependent 348
interlamellar order More intriguing is the second broader peak at q= 0403 Aring-1 (d= 156 Aring) 349
and its reflection both clearly visible at 88degC below Tm2 We attribute it to the inter-glucolipid 350
arrangement inside the tubular phase (dt Figure S 6d) coexisting with the vesicle phase 351
between Tm1 and Tm2 and to the planar lipid arrangement (di Figure S 6d) in the rigid flat 352
lamellar structure below Tm2 Its temperature- hence hydration- independent position also 353
confirms its structural origin Finally besides the water-structure peak at about 2 Aring-1 we also 354
observe a broad peak at 144 Aring-1 characteristics of the lateral packing (d Figure S 6d) of lipids 355
in bilayers While its position could be consistent with an Lα phase5758 above Tm2 its broadness 356
and positional invariance as well as the coexistence between vesicles and tubes do not allow a 357
precise assignment 358
15
Does G-C181-OH assume a bilayer or interdigitated structure the latter being the one 359
found for other similar bolaform glucolipids4243 The size of G-C181-OH can be estimated to 360
be at the most 32 Aring given by the length L of the C16 tail (L = 22 Aring from the Tanford formula 361
L= 154 + 1265 times n (n= 16)59) and the sugar (about 10 Aring)4243 However the cis conformation 362
of the C=C bond imposes a ldquokinkrdquo of 60deg in the aliphatic chain which reduces the effective 363
length of the oleic backbone to about 17 Aring for an effective total G-C181-OH length of about 364
27 Aring Cryo-TEM provides a tube thickness varying from 35 Aring to 60 Aring and a vesicle membrane 365
thickness of at least 60 Aring WAXS suggests an interlamellar thickness (membrane and water) 366
between 40 Aring and 37 Aring and an inter-lipid distance in the tube of about 16 Aring In the absence of 367
a clear form factor oscillation profile as found for similar glucolipids4243 one must 368
acknowledge that these data pledge neither in favor of fully interdigitated nor a double layer 369
structure and might suggest a tilted lipid arrangement with partial interdigitation60 370
371
13C ssNMR demonstrates that G-C181-OH can assume two coexisting head-head and 372
head-tail configurations 373
Vesicles are characterized by low positive mean and gaussian curvatures while 374
nanotubes are described by a combination of a high positive mean and zero gaussian curvatures 375
In this regard the coexistence of vesicles and nanotubes requires glucolipids to adapt 376
themselves to both environments at the same time For this reason the formation of nanotube-377
vesicle networks generally requires a specific driving force able to impose a high mean and 378
zero gaussian curvature to the membrane In many systems insertion of at least a second 379
constituent (lipid surfactant protein) in the membrane becomes a necessary internal driving 380
force for the nucleation and growth of so-called membrane inclusions from which 381
topologically-connected nanotubes can form10ndash123261 as explained by orientational ordering 382
arguments62 It has also been shown that external driving forces such as use of laser 383
ldquotweezersrdquo30 osmotic pressure6 electroformation5ndash82829 or controlled suction13ndash16 are 384
otherwise necessary as also supported by theoretical studies19 385
The bending energy of tubes is higher than that of a vesicle membrane8 due to the 386
dependence of the membrane free energy from the principal curvatures For this reason 387
isotropic (rotational symmetry along the main axis) but also anisotropic33 lipids generally 388
stabilize low-curvature shapes like flat membranes or vesicles Lipid nanotubes are also a 389
common phase formed by amphiphiles but generally for lipids with a certain complexity in 390
their molecular structures as exampled by diacetylenic derivatives of phospholipids among 391
others262763ndash65 Negative contributions to the bending energy favoring the simultaneous 392
16
presence of interconnected vesicles and tubes was shown to be driven by the presence of 393
anisotropic lipids in a membrane continuum Spontaneous deviations to the elastic theory in the 394
presence of surfactants lipids and proteins with anisotropic structures favor the formation of 395
protrusions with radius of the order of the fraction of a micron9ndash1219ndash2362 396
In the absence of both internal and external driving forces mentioned above G-C181-397
OH should behave as a standard lipid Its DSC profile (Figure 2)536667 under both hydrated and 398
dry conditions identifies a hydration-independent transition (Tm1) slightly above room 399
temperature this is followed by one main transition at higher temperature (Tm2) in the dry 400
sample50 For such a profile one expects a gel phase (Lβ) below Tm1 and a liquid crystalline 401
structure possibly in the morphology of vesicles (L4 phase) possibly above Tm1 and most likely 402
above Tm231 as experimentally found On the basis of the thermogram recorded on the dry 403
powder one may also expect a ldquoripplerdquo (Pβ) phase between Tm1 and Tm2 characterized by 404
periodic undulations of the bilayer (generally addressed to as regions with both liquid order and 405
disorder)5455 406
In the present work instead of a Lβ phase we observe flat crystals below Tm1 and a 407
vesicle-nanotube network instead of the ldquoripplerdquo phase The latter is particularly unexpected 408
because the membrane is composed of a single-component (G-C181-OH) and no anisotropic 409
external force (osmotic hydrodynamic electric) is used to pull and stabilize the tubes In 410
addition the nanotubes are observed at fairly high temperatures above Tm1 (between about 411
60degC and 90degC) while this morphology is generally favored at low temperature (proportionality 412
with 1kT figure 5 in Ref 62) commonly below a given transition temperature characteristics 413
for each specific amphiphile27 Furthermore nanotubes of G-C181-OH seem to be stable in 414
time thus differing from what is found in electroformed vesicles78 They are also observed 415
away from phase transition events (may them be at Tm1 or Tm2) as otherwise reported before 416
for a diacetylenic derivative of phosphatidylcholine26 and many other systems27 417
A stable nanotube-vesicle network for a single-component phospholipid in the absence 418
of external driving forces is not expected and has never been reported before It could be 419
explained by the coexistence of two micro-separated phases of different rigidity This 420
hypothesis is excluded by confocal microscopy on Laurdan-labelled membranes and magic 421
angle spinning (MAS) solid-state NMR (ssNMR) experiments 422
Laurdan is a well-known fluorophore used to put in evidence the coexistence of rigid 423
and fluid domains in both model and biological membranes47ndash49 Laurdan was used here to label 424
the G-C181-OH membranes between Tm1 and Tm2 and to verify the possible micro-segregation 425
and coexistence of rigid (eg Lβ λem= 440 nm) and fluid (eg Lα λem= 490 nm) domains in 426
17
tubes and vesicles respectively A set of quantitative experiments performed on a 5 mgmL-1 427
solution summarized in Figure 5 shows an excess of fluorescence at only λem= 490 nm for 428
temperature between 90degC and 70degC (Figure 5h) The GP value which quantifies the rigidfluid 429
character of the membrane is systematically negative (Figure 5i) indicating an overall fluid 430
membrane at all temperatures GP is quantified on more than 50 regions of interest (ROIs) at 431
each temperature including vesicles and tubes alone as well as connected nanotube-vesicles 432
(Figure 5d-g) The dispersion of GP at 80degC and 70degC between -08 and -02 could suggest the 433
spurious presence of membranes with various degrees of flexibility although fluidity is always 434
predominant The combination of WAXS (broad peak d= 144 Aring-1 invariant with 435
temperature Figure S 6bc) and confocal fluorescence microscopy using Laurdan confirms the 436
single-phase of the membrane composed of G-C181-OH both in vesicles and nanotubes This 437
is also consistent with the lack of phase transitions in DSC experiments between ~85degC and 438
~60degC especially in hydrated samples We conclude that the vesicle-nanotube transition is not 439
driven by the local segregation of gel phase (Lβ) microdomains nor that the nanotubes are 440
composed of such phase 441
ssNMR is the best-suited approach to investigate the origin of the local driving force for 442
the nucleation of anisotropic inclusions of which the average orientation depends on the local 443
membrane and inclusion curvatures and was shown to promote tubing62 ssNMR can provide 444
information on the local molecular mobility eg through the nuclear spin relaxation behavior 445
but also on intermolecular interactions and stereochemistry eg through variations in the 446
chemical shift68ndash70 447
Ideally ssNMR should be performed on diluted G-C181-OH samples above Tm1 448
However fast MAS necessary for high resolution centrifuges the sample As a first 449
approximation hydrated G-C181-OH samples for instance at 50 wt as classically done for 450
phospholipids71 could be studied Unfortunately permeability of the sample holder combined 451
to heating (close to the boiling point of water) and MAS provoke dehydration and even sample 452
ejection After experiencing both of the above this approach was abandoned As a second 453
approximation the study of the dehydrated G-C181-OH powder avoids centrifugation and 454
evaporation If studying dried lipids may not reflect their exact behaviour under diluted 455
conditions valuable structural information can still be obtained in dehydrated molecular 456
systems like proteins thus illustrating that this approach is not unreasonable Furthermore if 457
DSC (Figure 2a) shows that hydration suppresses the Tm2 it also shows that the value of Tm1 is 458
not affected by water at concentrations as low as 10 wt For this reason performing a 459
structural analysis of dehydrated G-C181-OH by ssNMR above Tm1 may help understanding 460
18
the local arrangement of G-C181-OH in two morphologies vesicles and nanotubes having 461
sensibly different curvatures 462
To explore the local mobility of the most relevant chemical groups of G-C181-OH 463
above Tm2 (T= 110degC) and between Tm2 and Tm1 (70 lt T degC lt 90) we combine a series of 1H 464
and 13C experiments Single-pulse (SP) MAS experiments (1H and 13C) when recorded under 465
quantitative conditions allow the detection of all chemical species while cross-polarization 466
(CP) MAS (13C only) experiments are sensitive only to constrained groups for which the 1H-467
13C dipolar coupling is not averaged to zero by the molecular motions 468
469
Figure 6 ndash a) 1H MAS (10 kHz) ssNMR spectra recorded from 110degC to 70degC b) 13C MAS (10 kHz) ssNMR 470
spectra recorded using high power decoupling single pulse (SP) and cross-polarization (CP) pulse sequences 471
Contact time for CP experiments and corresponding temperatures are given on each spectrum Full spectra 472
are given in Figure S 7 473
The most relevant 1H and 13C spectra are given in Figure 6 (full range in Figure 7 and 474
Figure S 7) As expected the 1H solid-state SPMAS spectra show broader peaks compared to 475
the solution-state NMR spectrum (Figure 6a) reflecting the obvious solid-state character of the 476
sample at any temperature The sugar group and the C=C bond resonate in the 25-6 ppm range 477
and 535 ppm respectively while the OH groups of the sugar moiety are found below 45 ppm 478
(Figure 6a full assignment in Table S 1) Very broad (~1 ppm) at 100degC the position of the 479
OH peak varies with the temperature value and becomes narrower (lt~05 ppm) and visible at 480
δH= 464 ppm at T= 70degC Line narrowing and chemical shift variations of the OH resonance 481
in ssNMR is always a direct sign of H-bonding interactions whereas the strength of the H-482
bonding hence its OHhellipH distance is correlated to a dispersion in chemical shifts72ndash75 All other 483
60 55 50 45 40 35 30 25
ppm
110
90
80
70
910
1rsquo
6rsquo16
1
OH
134 132 130 128 126
ppm110 108 106 104 102 100
ppm
SP (T= 110degC)
SP (T= 70degC)
CP 50 ms (T= 70degC)
CP 3 ms (T= 70degC)
910 1rsquo
1H 13C
1
811
910
CH2 CH2
1rsquo
6rsquo
a) b)
C102
13024
C9101
13003
C92
12869 C1rsquo210382
C1rsquo110443
C1rsquo13035
2rsquo3rsquo4rsquo
T degC
5rsquo
19
resonances broaden from 110degC to 70degC thus indicating slower andor more anisotropic 484
reorientational motions of all chemical groups The specific dynamic behaviour of the sugar 485
headgroup is also reflected by its 1H transverse relaxation time T2 whereas the shorter the T2 486
the higher the rigidity Experiments performed between 110degC and 70degC shown and 487
commented in Figure S 8 in the Supporting Information globally show a single short (lt 1 ms 488
below 100degC) T2 relaxation component for H1rsquo H5rsquo and H6rsquo and two both short and long 489
(between 4 ms and 12 ms) T2 for the acyl chain (CH2 H910 H811) even below 100degC 490
At 110degC 13C SPMAS experiments (Figure 6b full range in Figure 7 and Figure S 7 491
assignments in Table 1) show a single peak at δC= 10335 ppm for C1rsquo and at δC= 13003 ppm 492
for C910 as expected for a symmetrical conformation with two chemically-equivalent 493
carbons76 At 70degC the C1rsquo peak disappears while C910 now shows two peaks around 128 494
ppm and 130 ppm (Table 1 full temperature series in Figure S 7b) attributed to C92 (δC= 12869 495
ppm) and C10 in a non-symmetric configuration respectively for which these two carbons are 496
chemically inequivalent76 More precisely the resonance at 130 ppm is actually the 497
superposition of two close resonances C9101 (δC= 13003 ppm) and C102 (δC= 13024 ppm) 498
where subscripts 1 and 2 stand for two different conformations of the cis-olefin group as 499
reported for various phases of oleic acid in the vicinity of 0degC76 500
501
Table 1 ndash 13C Chemical shifts of G-C181-OH in solution and solid-state Solid-state experiments are 502
recorded at MAS= 10 kHz All spectra are reported in Figure 7 and Figure S 7 The contact time for cross 503
polarization is 3 ms In all ssNMR experiments temperature is first raised at 110degC and then lowered to 504
either 90degC or 70degC Attribution of the 13C resonances in Table 1 is performed on the basis of the solution 505
spectrum (Figure S 1b) Additional peaks observed in both single pulse and cross polarization ssNMR 506
experiments are attributed when possible to a configuration effect of the given atom eg C9101 and C92 507
indicate two configurations of C9 All new peaks observed in solid-state and not detected in solution are 508
highlighted in red for convenience 509
510
511
δ ppm
Peak Liquid (DMSO-d6)
Solid Single Pulse
T= 110degC
Solid Single Pulse
T= 90degC
Solid Single Pulse
T= 70degC
Solid Cross Polarization
T= 70degC
C102
- - 13024 13024
C910C9101 13009 13003 13003 13003 13003
C1C9C10C1rsquo
C6rsquo
20
C92 - - - 12869 12869
C1rsquoC11 10329 10335 10335 - 10443
C12 - - - - 10382
C3 7724 7709 7702 - 7829
- 7634 7629 - 7621
7525
C2 7388 7398 7390 7370 7370
C4 7052 7077 7054 7041 7098
C16 6900 7016 - - 7029
- - - - 6793
C1C5C6 6153 6241 6236 6239 6262
C1C5C6 6117 - - - 5956
C2 3300 3290 3290 3283 3279
CH2(trans) - - - 3198 3196
CH2(gauche)C15 2941 2981 2987 3004 -
C811 2706 2747 2747 2832 2817
CH2 2597 2625 2628 2630 2817
512
13C CPMAS spectra at 70degC (Figure 6b full range in Figure 7 and Figure S 7d) at 513
increasing contact times confirm the presence of two cis-olefin environments one for which 514
C910 are equivalent labelled here C9101 and one for which they are inequivalent labelled 515
C92 C102 Both environments are rigid enough to be observed at short contact time (tc= 50 μs) 516
A similar double environment is also observed for the sugar C1rsquo CPMAS at 70degC shows two 517
peaks (C1rsquo1 at δC= 10443 ppm C1rsquo2 at δC= 10382 ppm Figure 6b Figure S 7d) These are 518
significantly shifted downfield from the C1rsquo peak observed at 110degC and are detected at contact 519
times as short as 50 μs thus indicating their rigid character One also finds that CPMAS is 520
totally inefficient at 100degC for short contact times (50 μs) and poorly efficient even at 3 ms 521
typical of fast-tumbling molecules (Figure S 7c) also both gauche (δC= 3004 ppm) and all-522
trans (δC= 3198 ppm) conformations of the CH2 carbons coexist at 70degC (Figure S 7b)77 523
According to ssNMR one main mobile molecular environment exists at 110degC as 524
shown by the well-resolved 1H spectrum single C=C (C9101) and anomeric (C1rsquo) resonances 525
gauche conformation of the aliphatic CH2 and single T2 of the aliphatic CH2 chain and sugar 526
protons The sugar group is certainly mobile (inefficient 1H13C CPMAS) but still more 527
constrainted than the acyl chain (shorter T2 (1H)) As the temperature is lowered the overall 528
rigidity increases (broadening of 1H NMR peaks faster 1H transverse relaxation and efficient 529
1H13C magnetization transfer during CPMAS) presumably driven by H-bonding 530
interactions (downfield shift and line narrowing of the OH 1H signal very short OH T2 loss of 531
the C1rsquo signal in SPMAS) At the same time a number of spectroscopic data (two concomitant 532
21
resonances for anomeric C1rsquo1 and C1rsquo2 cis-olefin C9101 and C92 C102 and CH2 gauche and 533
all-trans environments) and relaxation behaviour (fast and slow T2 relaxation components) 534
strongly suggests the coexistence of two molecular environments Further proofs of the 535
coexistence of two distinct molecular domains are given by a number of chemical shift 536
variations in the 13C CPMAS spectrum at 70degC compared to the one at 110degC 90degC and 537
solution This is shown in Figure 7 and in the list of 13C chemical shifts in Table 1 538
539
540
Figure 7 - Comparison between solution- and solid-state 13C NMR spectra of G-C181-OH Solid-state 541
experiments are recorded directly on the sample powder at a MAS of 10 kHz (4 mm zirconia rotor) SP 542
Single Pulse CP Cross Polarization In all the ssNMR experiments temperature is first raised at 110degC 543
and then lowered to either 90degC or 70degC Segmented lines are meant to highlight the known peak position 544
in solution thus stressing the strong chemical shift variations in the solid-state 545
546
NMR experiments above Tm2 suggest that vesicles could contain G-C181-OH with a 547
single family of mobile conformations characterized by chemically-equivalent C=C (red 548
Figure 8b) and a single C1rsquo conformation (green Figure 8b) Experiments between Tm1 and Tm2 549
otherwise suggest that two coexisting conformations characterized by chemically-equivalent 550
(red Figure 8b) and inequivalent (magenta Figure 8b) C=C could be associated to nanotubes 551
Two distinct C1rsquo sites (grey Figure 8b) also indicate two configurations of the sugar headgroup 552
A comment on this point will be given in the following paragraphs 553
The local (Aring-scale) variation of molecular mobility below Tm2 drives the coexistence of 554
two distinct molecular environments of the same G-C181-OH molecule This occurs within a 555
single-phase domain (as deduced by WAXS) of equivalent membrane rigidity (as derived from 556
Laurdan probe in confocal microscopy) Although never reported before the difference in the 557
local mobility of the same amphiphile (here G-C181-OH) could satisfy the theoretically-558
140 120 100 80 60 40 20
CP(3 ms)-70degC
SP-70degC
SP-90degC
SP-110degC
ppm
LiquidC910
C1rsquo
C2rsquo
C4rsquo
C3rsquo
C1
C6rsquoC5rsquo
C1
6
C8
11
C2 C
H2
C1
5
CH
2
DM
SO
13C
22
required conditions that induce local lipid segregation and formation of membrane inclusions 559
(Figure 8c) In case of their non-zero average orientation the local membrane curvature 560
increases62 and nanotubes can spontaneously form (Figure 8bc) More intriguing this 561
mechanism occurs at least 10degC above Tm1 although it should not be favored above the Tm27 562
From both experimental and theoretical backgrounds the conditions of topologically-563
connected vesicles-nanotubes systems are met only when either internal (two components) or 564
external driving forces are applied19 In the present single-lipid system of which the phase 565
behavior is summarized in Figure 8a the most plausible driving force could be explained by 566
the NMR results collected on the dry sample G-C181-OH concomitantly occupies two 567
molecular environments characterized by 1) two distinct conformations of the sugar 568
displaying equivalent mobility and 2) two conformations of the acyl chain unsaturation 569
570
23
571
Figure 8 ndash a) Thermotropic phase behavior of G-C181-OH at 5 mgmL-1 Note that Tm2 is observed on the 572
dry powder only b) Possible relationship between the molecular environment as derived from NMR and 573
membrane curvatures All the molecular drawings refer to the same G-C181-OH molecule (bulky ellipsoid 574
equiv sugar headgroup) while each color corresponds to a given configuration Grey of C1rsquo1 and C1rsquo2 indicates 575
the uncertainty about the assignment of the specific NMR peak The curvature C is defined as 1R R being 576
the curvature radius R1 R2 radius of curvature CG Gauss curvature CM Mean curvature c) Free 577
interpretation of the anisotropic high-curvature (CMgt 0 CG= 0) inclusions in the membrane (low CM and 578
CG) continuum driven by inter-sugar H-bonding and reduced intramembrane diffusion for a G-C181-OH 579
glucolipid 580
581
Flat crystalline structure
Nanotube-vesicle network
Vesicles
48degC
120deg
106 105 104 103 102 101
ppm
H9 H10H1rsquo
106 105 104 103 102 101
ppm106 105 104 103 102 101
ppm106 105 104 103 102 101
ppm
C=CC=C
C1rsquo1C1rsquo2
C1rsquo
Tm2(96degC)Tm1
a)
b)
c)
Same molecule different local orientations and sugar conformations
High curvature membrane
Low curvature inclusion
Flip-FlopStrong H-bonding
CG
CM ( + )
CG 0
CM 0 CG 0
CM 0
G-C181-OH
24
Two related questions are unanswered at the moment What actually drives nanotube 582
formation and is the organization of G-C181-OH within the vesicles and tubes the same Lipid 583
nanotubes have been studied for at least three decades over which broad experimental and 584
theoretical insight has been generated Despite this fact the actual understanding is still matter 585
of debate27 Micelle-to-nanotube and vesicle-to-nanotube phase transitions are generally 586
reported for single amphiphiles below a given Tm and intermediate phase composed of twisted 587
and flat fibers is concomitantly reported Initially thought to be a chirality-driven phenomenon 588
recent studies propose a more general mechanism involving crystallization and symmetry 589
breaking in the lipid packing driven by optimal packing27 If twisted ribbons were observed 590
before for a number of microbial glycolipid bolaamphiphiles44 they are not found for G-C181-591
OH This fact as well as the large body of cryo-TEM images and the observation of nanotubes 592
above Tm1 rather pledge in favour of a direct topological change from positive (vesicles) to 593
zero (nanotubes) Gaussian curvatures In this case vesicle-to-nanotube transitions could be 594
driven by external forces56307813ndash162829 595
Considering the absence of external forces in the present system there are only two 596
possibilities left spontaneous budding of the membrane or nanotube pulling after inter-vesicle 597
collisions due to Brownian motion Both are possible as inclusions composed of a different 598
arrangement of the same molecule in the membrane continuum can theoretically explain 599
spontaneous nanotube formation in an isotropic medium672223629ndash1218ndash21 However the second 600
one is probably more likely to prevail because it could explain the large number of nanotubes 601
connecting two distant vesicles Interestingly similar events occur for any phospholipid-based 602
vesicular solution but nanotubes are extremely rare unless at least two lipids of different 603
molecular structure are mixed together The spectroscopic 1H and 13C and relaxation (1H) 604
ssNMR data even if collected on a dry powder demonstrate that the coexistence of two G-605
C181-OH configurations involving both the sugar headgroup and fatty alcohol chain are 606
possible for this molecule As a matter of fact this is not so surprising as more than one energy 607
minima each corresponding to a given conformation are known for glucose its non-reducing 608
derivative methylglucose and carbohydrates in general78ndash80 609
The presence of two configurations could explain the coexistence between two 610
structures of different curvature but the data presented so far do not explain the origin of these 611
two configurations In other words what drives the change in the local structure of the sugar 612
headgroup and fatty alcohol within the membrane 613
The association of known self-assembled structures to spectroscopic 13C ssNMR data is 614
known for years in particular for gluconamides lipids having a linear sugar headgroup81ndash84 It 615
25
was found that gauche effects in some cases up to the γ position in the sugar chain induce 616
upfield chemical shifts while anti and trans conformations result in downfield shifts Each 617
structure (monolayer crystal bilayer crystal or micellar fiber) was then characterized by a given 618
organization of the gluconamide and a characteristic 13C ssNMR fingerprint which could be 619
explained by gauche γ-gauche anti and trans conformations of the headgroup Similar 620
structural-spectroscopic correlations have been collected over the years for much simpler cyclic 621
sugars85 whereas pyranoses can undergo important conformational changes (chair half-chair 622
boat skew) when the appropriate energy barriers are crossed78ndash8086 A quantitative 623
conformational study based on the 13C chemical shift variations shown in Table 1 would be 624
certainly helpful but very delicate in the context of the present state of the art because a 625
rigorous approach requires at least one known crystal structure8182 which is currently missing 626
for this compound A qualitative approach will then be adopted 627
G-C181-OH is a bolaform amphiphile and flip-flop could be a possible mechanism 628
involved in the nanotube stabilization whereas head-tail interactions have long been considered 629
as important in nanotube-forming bolaform amphiphiles6063 From mere considerations based 630
on T2 (1H) relaxation arguments one could exclude head-tail configurations if the R-CH2OH 631
endgroup (H1) was involved in a direct interaction with the sugar group its corresponding T2 632
would probably be comparable to the sugarrsquos one (OH and H1rsquo) but this does not seem to be 633
the case However this hypothesis would be based on the comparison of the relaxation from 634
CH and CH2 protons additionally involved in different kind of motions Besides the relaxation 635
of H1 is influenced by the strong overlap between H1 and H5rsquo For these reasons relaxation 636
arguments are not solid enough and will not be used 637
We then address this question by exploring intermolecular interactions in a direct 638
manner using 2D 1H-1H homonuclear ssNMR correlation spectroscopy At 90degC in the fast-639
tumbling domain of molecular motion (narrow 1H NMR peaks Figure 6a) and corresponding 640
to the vesicle-rich region spin diffusion (NOESY) experiments are preferred over dipolar 641
coupling based experiments because such interaction is averaged out by molecular motion 642
However when the molecular motion is more constrained in the domain of nanotube stability 643
at 70degC (broad 1H spectra Figure 6a) Double-Quantum Single-Quantum (DQ-SQ) correlation 644
experiments are best suited to probe interaction between close molecular neighbors These 645
experiments are reported in Figure 9 and the related interpretation is only briefly reported 646
below while a more detailed discussion can be found on Page 12 in the Supporting Information 647
26
648
Figure 9 ndash a) 2D 1H-1H NOESY NMR experiment performed at MAS= 10 kHz (4 mm probe) on a Bruker 649
300 MHz Avance III HD spectrometer using 300 ms of mixing time Sample temperature is regulated to 650
90degC reached by cooling from 110degC b) 2D 1H-1H DQ-SQ (BAck-to-BAck BABA pulse sequence used for 651
the DQ excitation scheme) NMR experiment performed at MAS= 22 kHz (25 mm probe) on a Bruker 700 652
MHz Avance III spectrometer using a DQ excitation time equal to 2 rotor periods Sample temperature is 653
regulated to 70degC reached by cooling from 110degC The typical schemes illustrating how to interpret these 654
2D experiments are reported above each experimental map Zooms of the sugar region and configurational 655
interpretation are given below each 2D map More information are given in the text below 656
H16-H16
H1-H1
H9-H10
H1rsquo-H1
H1rsquoH910 H16
H1
H1rsquo-H1rsquo
Hxrsquo-Hxrsquo
2
(pp
m)
(ppm)
315
811910 1rsquo
2rsquo2
3rsquo 4rsquo6rsquo
5rsquo
1rsquo2910
asymp asymp asympHDO MeOD Acetone
1
315
811 9101rsquo
2rsquo2
3rsquo4rsquo6rsquo
5rsquo
1rsquo2 9 10
asympasympasympHDOMeODAcetone
H1rsquo-H1
1rsquo
1
(p
pm
)
(ppm)
H1-H2
H1rsquo-H1
H1rsquo
H910
H1H5rsquo
H2
H1rsquo-H5rsquo
315
811910 1rsquo
2rsquo2
3rsquo 4rsquo6rsquo
5rsquo
1rsquo2910
asymp asymp asympHDO MeOD Acetone
1
H2rsquoH3rsquoH4rsquo
H2rsquoH3rsquoH4rsquo
X= 2rsquo3rsquo4rsquo
NOESY - T= 90degC
1H
1H
1H
1H
DQ-SQ - T= 70degC
a) b)
2
(pp
m)
(p
pm
)
(ppm)
A B
AhellipB
AhellipA
BhellipB
NOESY
(ppm)
A B
AhellipB
DQ-SQ
Single-quantum dimension
Do
ub
le-q
ua
ntu
m d
imen
sio
n
AhellipA
BhellipB
BhellipA
BhellipA
315
811910 1rsquo
2rsquo2
3rsquo 4rsquo6rsquo
5rsquo
1rsquo2910
asymp asymp asympHDO MeOD Acetone
1
lt 5 Aring
lt 5 Aring
H1-H2
H811
H15
H16
H6rsquo
H1rsquo
H1
H5rsquo
H2
H1-H2
H1rsquo-H1
H1rsquo-H5rsquo
H1rsquo
H1 H5rsquo
H1rsquo
H1
H5rsquo
H1H2rsquo H3rsquo H4rsquo
H1-H1
H1rsquo-H1
Hxrsquo-HxrsquoX= 2rsquo3rsquo4rsquo
H1-H2
H1rsquo
Zoom sugar region 28 ndash 45 ppmNOESY DQ-SQ
27
Head-tail or head-head configurations could be probed by the existence of H1rsquo-H1 657
interactions whereas H1 (δH= 356 ppm) is associated to the glucolipid tail and H1rsquo (δH= 432 658
ppm) to the sugar headgroup These atoms are more than 15 Aring apart and a direct interaction 659
could not be observed in both NOESY and DQ-SQ experiments NOESY experiments (Figure 660
9a) show that H1rsquo-H1 correlations are not observed Meanwhile clear-cut direct H1rsquo-H1 661
interactions are indeed observed are detected at T= 70degC (DQ cross-peaks related to H1rsquo-H1 662
correlation in DQ-SQ experiment shown in Figure 9b) Interestingly the absence of auto peaks 663
at δH= 432 ppm and δH= 335 ppm in the SQ dimension excludes H1rsquo-H1rsquo and Hxrsquo-Hxrsquo (x= 2 664
3 4) interactions respectively strengthening the idea that sugar headgroups from two nearest-665
neighbor G-C181-OH molecules are not adjacent in the nanotube-vesicle region 666
Homonuclear 2D ssNMR supports the idea according to which G-C181-OH can 667
undergo molecular flip-flops and a head-tail arrangement in the dry product Extrapolating these 668
conclusions in the lower concentration range lack of H1rsquo-H1 proximity at T= 90degC suggests a 669
head-head configuration in the vesicle-rich region and head-tail configuration within the 670
nanotubes It is however still unclear whether flip-flops are driven by spontaneous temperature-671
induced conformational changes in the glucolipid packing stimulating inclusions within the 672
membrane itself672223629ndash1218ndash21 or by defects generated by inter-vesicle collisions In fact a 673
combination of both is not unlikely Nanotubes are not stable when temperature is 20 to 30 674
degrees above Tm1 indicating that inter-vesicle collisions alone cannot explain the unusual 675
phenomenon In an energy landscape approach87 the head-head configuration is certainly 676
favored at high temperature while both head-head and head-tail configurations could be 677
favored in the mid-temperature region corresponding to the range between Tm1 and Tm2 in the 678
dry powder Both statistical and defect-induced flip-flop events contribute to form high mean 679
zero Gaussian curvature morphologies (nanotubes) for which the head-tail conformation 680
limiting the proximity between bulky sugar headgroups is probably more adapted (Figure 8c) 681
The flip-flop interpretation now reasonably explains the strong differences in the sugar and fatty 682
alcohol conformations deduced by the multiple NMR signals attributed to chemically-683
equivalent groups The existence of various low-energy conformations each having specific 684
NMR signature for sugars in solution78ndash8086 and solid-state81ndash84 further supports our 685
interpretation 686
One last point should be clarified Why between Tm1 and Tm2 are two molecular 687
environments able to coexist instead of a single one of average rigidity as found in the case of 688
ldquoripplerdquo phases50ndash54 We believe that this question can be answered based on the NMR results 689
the relatively short T2 values of the H1rsquo and OH protons shows the constrained mobility of the 690
28
sugar headgroup despite a certain flexibility of the chain (long T2 component) This trend may 691
suggest restrictions in translational mobility probably due to the sugar-OH hydrogen bonding 692
(Figure 8c) meaning that lipids are not able to diffuse within the membrane thus keeping two 693
different configurations stable 694
695
Conclusions 696
Topologically-connected nanotube-vesicle lipidic systems are commonly observed for 697
self-assembled membranes composed of at least two amphiphiles and spontaneously driven by 698
anisotropic inclusions andor by external directional forces This work shows that strong 699
differences in membrane curvature can spontaneously occur in single-lipid systems without 700
external anisotropic forces Coexistence and interconnection between nanotubes and vesicles 701
are evidenced via cryo-TEM and fluorescence confocal microscopy in a single-phase region at 702
temperature above a transition temperature Tm1= 483degC determined by DSC on the hydrated 703
sample but below the second transition temperature Tm2 (957degC) determined by DSC on the 704
dry powder X-ray diffraction (WAXS) also shows the coexistence of two lattice periods one 705
attributed to an inter-membrane repeating distance and the other possibly related to the intra-706
nanotube glucolipid arrangement Labelling the systems with Laurdan a fluorophore of which 707
the emission strongly varies with the local membrane rigidity excludes the presence of rigid 708
micro-separated phases (eg Lβ) 709
1H and 13C ssNMR despite the fact that it can only be performed on the dry powder 710
confirm the presence of one main fluid G-C181-OH environment above Tm2 Below Tm2 the 711
splitting of some 13C peaks and the coexistence of short and long 1H relaxation components 712
demonstrate that G-C181-OH can simultaneously pack into structurally and dynamically 713
inequivalent environments Combining advanced 2D 1H-1H correlation experiments based on 714
spin diffusion or double-quanta excitation suggests that vesicles could contain a preferred head-715
head configuration of the bolaform lipid while nanotubes a preferred head-tail assembly 716
The presence of two environments composed of the same molecule characterized by 717
different molecular configurations and rigidity fulfills the theoretical conditions necessary to 718
spontaneously nucleate a membrane inclusion of non-zero average orientation described as 719
necessary to observe topologically-connected nanotube-vesicle structures in the absence of 720
external forces This hypothesis could also be enriched by the possibility of nanotubes to be 721
pulled away between two vesicles after a collision event 722
This work expands the actual theoretical and experimental framework on lipid networks 723
stabilized by a different radius of curvature It could also motivate the synthesis or isolation 724
29
of new lipids providing a higher level of 3D architectural control in soft networks possibly in 725
the range of room temperature 726
727
Acknowledgements 728
Dr Andrea Lassenberger and Dr Sylvain Preacutevost at Institut Laue Langevin (ILL Grenoble 729
France) are kindly acknowledged for their assistance on the SANS experiment Confocal 730
images were performed at the Institut de Biologie Paris Seine (IBPS) imaging facility Jean-731
Franccedilois Gilles (Imaging Core Facility Institut de Biologie Paris Seine (IBPS) CNRS 732
Sorbonne Universiteacute Paris France) is kindly acknowledged for his assistance on the confocal 733
microscopy imaging Dr Guillaume Laurent (LCMCP Sorbonne Universiteacute Paris France) is 734
kindly acknowledged for helpful discussions The French region Ile-de-France SESAME 735
program is acknowledged for financial support (700 MHz NMR 736
spectrometer) Dr Olivier Diat (ICSM Marcoule France) Prof eronikaIglič and Prof V Aleš737
onsul discussi Slovenia) are kindly acknowledged for helpfUniversity of LjubljanaIglič (-Kralj 738
739
Financial support 740
WAXS experiments have been supported by Soleil Light Source Saint Aubin France proposal 741
Ndeg 20201747 SANS experiments have been supported by ILL proposal Ndeg9-13-778 742
743
References 744
1 D Kabaso N Bobrovska W Goacuteźdź E Gongadze V Kralj-Iglič R Zorec and A 745
Iglič Bioelectrochemistry 2012 87 204ndash210 746
2 C R Safinya U Raviv D J Needleman A Zidovska M C Choi M A Ojeda-747
Lopez K K Ewert Y Li H P Miller J Quispe B Carragher C S Potter M W 748
Kim S C Feinstein and L Wilson Adv Mater 2011 23 2260ndash2270 749
3 P Veranič M Lokar G J Schuumltz J Weghuber S Wieser H Haumlgerstrand V Kralj-750
Iglič and A Iglič Biophys J 2008 95 4416ndash4425 751
4 A Rustom R Saffrich I Markovic P Walther and H-H Gerdes Science (80- ) 752
2004 303 1007ndash1010 753
5 M I Angelova S Soleacuteau P Meacuteleacuteard F Faucon and P Bothorel Prog Colloid 754
Polym Sci 1992 89 127ndash131 755
6 L Mathivet S Cribier and P F Devaux Biophys J 1996 70 1112ndash1121 756
7 V Kralj-Iglič G Gomišček J Majhenc V Arrigler and S Svetina Colloids Surfaces 757
A Physicochem Eng Asp 2001 181 315ndash318 758
30
8 V Kralj-Iglič A Iglič G Gomišček F Sevšek V Arrigler and H Haumlgerstrand J 759
Phys A Math Gen 2002 35 1533ndash1549 760
9 M Drab D Stopar V Kralj-Iglič and A Iglič Cells 2019 8 626 761
10 A Zidovska K K Ewert J Quispe B Carragher C S Potter and C R Safinya 762
Langmuir 2009 25 2979ndash2985 763
11 A Zidovska K K Ewert J Quispe B Carragher C S Potter and C R Safinya Soft 764
Matter 2011 7 8363ndash8369 765
12 A Zidovska K K Ewert J Quispe B Carragher C S Potter and C R Safinya 766
Biochim Biophys Acta - Biomembr 2009 1788 1869ndash1876 767
13 M Karlsson K Sott M Davidson A S Cans P Linderholm D Chiu and O Orwar 768
Proc Natl Acad Sci U S A 2002 99 11573ndash11578 769
14 A Karlsson R Karlsson M Karlsson A-S Cans A Stromberg F Ryttsen and O 770
Orwar Nature 2001 409 150ndash152 771
15 M Karlsson K Sott A S Cans A Karlsson R Karlsson and O Orwar Langmuir 772
2001 17 6754ndash6758 773
16 E Evans H Bowman A Leung D Needham and D Tirrell Science (80- ) 1996 774
273 933ndash935 775
17 U Seifert Configurations of fluid membranes and vesicles 1997 vol 46 776
18 J Kaumls and E Sackmann Biophys J 1991 60 825ndash844 777
19 N Bobrovska W Goacuteźdź V Kralj-Iglič and A Iglič PLoS One 2013 8 e73941 778
20 A Iglič B Babnik K Bohinc M Fošnarič H Haumlgerstrand and V Kralj-Iglič J 779
Biomech 2007 40 579ndash585 780
21 K Bohinc T Slivnik A Iglič M Brumen and V Kralj-Iglič J Phys Chem C 2007 781
111 9709ndash9718 782
22 A Iglič H Haumlgerstrand P Veranič A Plemenitaš and V Kralj-Iglič J Theor Biol 783
2006 240 368ndash373 784
23 V Kralj-Iglič and P Veranič Adv Planar Lipid Bilayers Liposomes 2006 5 129ndash785
149 786
24 A Iglic and V Kralj-Iglic Adv Planar Lipid Bilayers Liposomes 2006 4 253ndash279 787
25 S Penič L Mesarec M Fošnarič L Mroacutewczyńska H Haumlgerstrand V Kralj-Iglič and 788
A Iglič Front Phys 2020 8 342 789
26 P Yager and P E Schoen Mol Cryst Liq Cryst 1984 106 371ndash381 790
27 T G Barclay K Constantopoulos and J Matisons Chem Rev 2014 114 10217ndash791
10291 792
31
28 B Božič G Gomišček V Kralj-Iglič S Svetina and B Žekš Eur Biophys J 2002 793
31 487ndash496 794
29 A Iglič H Haumlgerstrand M Bobrowska-Haumlgerstrand V Arrigler and V Kralj-Iglič 795
Phys Lett A 2003 310 493ndash497 796
30 R Bar-Ziv and E Moses Phys Rev Lett 1994 73 1392ndash1395 797
31 S Chiruvolu H E Warriner E Naranjo S H Idziak J O Raumldler R J Plano J A 798
Zasadzinski and C R Safinya Science (80- ) 1994 266 1222ndash1225 799
32 V Kralj-Iglič A Iglič H Haumlgerstrand and P Peterlin Phys Rev E 2000 61 4230ndash800
4234 801
33 L Mesarec M Drab S Penič V Kralj-Iglič and A Iglič Int J Mol Sci 2021 22 802
2348 803
34 L Van Renterghem S L K W Roelants N Baccile K Uyttersprot M C Taelman 804
B Everaert S Mincke S Ledegen S Debrouwer K Scholtens C V Stevens W 805
Soetaert L Van Renterghem S L K W Roelants N Baccile K Uytersprot M C 806
Taelman B Everaert S Mincke S Ledegen S Debrouwer K Scholtens C V 807
Stevens and W Soetaert Biotechnol Bioeng 2018 115 1195ndash1206 808
35 J Clark and F Deswarte Introduction to Chemicals from Biomass Second Edition 809
John Wiley amp Sons 2015 810
36 K V Sajna R Houmlfer R K Sukumaran L D Gottumukkala and A Pandey in 811
Industrial Biorefineries and White Biotechnology eds A Pandey R Houmlfer M 812
Taherzadeh K M Nampoothiri and C Larroche Amsterdam Oxford Waltham 813
Elsevier 2015 pp 499ndash521 814
37 R Marchant and I M Banat Trends Biotechnol 2012 30 558ndash565 815
38 K Hill and C LeHen-Ferrenbach in Sugar-Based Surfactants Fundamentals and 816
Applications ed C C Ruiz Boca Raton CRC Press 2009 pp 1ndash20 817
39 L Rodrigues I M Banat J Teixeira and R Oliveira J Antimicrob Chemother 818
2006 57 609ndash618 819
40 J D Desai and I M Banat Microbiol Mol Biol Rev 1997 61 47ndash64 820
41 S L K W Roelants K Ciesielska S L De Maeseneire H Moens B Everaert S 821
Verweire Q Denon B Vanlerberghe I N A Van Bogaert P Van der Meeren B 822
Devreese and W Soetaert Biotechnol Bioeng 2016 113 550ndash559 823
42 N Baccile M Selmane P Le Griel S Preacutevost J Perez C V Stevens E Delbeke S 824
Zibek M Guenther W Soetaert I N A Van Bogaert and S Roelants Langmuir 825
2016 32 6343ndash6359 826
32
43 N Baccile A-S Cuvier S Preacutevost C V Stevens E Delbeke J Berton W Soetaert 827
I N A Van Bogaert and S Roelants Langmuir 2016 32 10881ndash10894 828
44 N Baccile C Seyrig A Poirier S A Castro S L K W Roelants and S Abel Green 829
Chem 2021 23 3842ndash3944 830
45 A Salis L Cappai C Carucci D F Parsons and M Monduzzi J Phys Chem Lett 831
2020 11 6805ndash6811 832
46 J Schindelin I Arganda-Carreras E Frise V Kaynig M Longair T Pietzsch S 833
Preibisch C Rueden S Saalfeld B Schmid J-Y Tinevez D J White V 834
Hartenstein K Eliceiri P Tomancak and A Cardona Nat Methods 2012 9 676ndash835
682 836
47 T Parasassi and E Gratton J Fluoresc 1995 5 59ndash69 837
48 M M Dodes Traian F L Gonzaacutelez Flecha and V Levi J Lipid Res 2012 53 609ndash838
616 839
49 D M Owen C Rentero A Magenau A Abu-Siniyeh and K Gaus Nat Protoc 840
2012 7 24ndash35 841
50 W Stillwell in An Introduction to Biological Membranes Academic Press 2016 pp 842
135ndash180 843
51 W Stillwell in An Introduction to Biological Membranes Academic Press 2016 pp 844
181ndash220 845
52 B Tenchov Chem Phys Lipids 1991 57 165ndash177 846
53 R Koynova and M Caffrey Biochim Biophys Acta 1998 1376 91ndash145 847
54 F Schmid S Dolezel O Lenz and S Meinhardt J Phys Conf Ser 2014 487 848
012004 849
55 S Meinhardt R L C Vink and F Schmid Proc Natl Acad Sci U S A 2013 110 850
4476ndash4481 851
56 O Glatter and O Kratky Small Angle X-ray Scattering Academic Press London 852
1982 853
57 B A Cunningham A D Brown D H Wolfe W P Williams and A Brain Phys 854
Rev E 1998 58 3662ndash3672 855
58 M Nadler A Steiner T Dvir O Szekely P Szekely A Ginsburg R Asor R Resh 856
C Tamburu M Peres and U Raviv Soft Matter 2011 7 1512ndash1523 857
59 C Tanford The hydrophobic effect Formation of micelles and biological membranes 858
John Wiley amp Sons Inc New York 1973 859
60 M Masuda and T Shimizu Langmuir 2004 20 5969ndash5977 860
33
61 A Zidovska K K Ewert J Quispe B Carragher C S Potter and C R Safinya 861
Block Liposomes Vesicles of Charged Lipids with Distinctly Shaped Nanoscale 862
Sphere- Pear- Tube- or Rod-Segments Elsevier Inc 1st edn 2009 vol 465 863
62 A Iglic V Kralj-Iglic B Božič M Bobrowska-Haumlgerstrand B Isomaa and H 864
Haumlgerstrand Bioelectrochemistry 2000 52 203ndash211 865
63 T Shimizu M Masuda and H Minamikawa Chem Rev 2005 105 1401ndash1444 866
64 J V Selinger and J M Schnur Phys Rev Lett 1993 71 4091ndash4094 867
65 J M Schnur Science (80- ) 1993 262 1669ndash1676 868
66 B Tenchov R Koynova and G Rapp Biophys J 2001 80 1873ndash1890 869
67 R Koynova and B Tenchov Ser Biomech 2017 31 3ndash19 870
68 S J Angyal and R Le Fur Carbohydr Res 1984 126 15ndash26 871
69 J K Whitesell and M A Minton J Am Chem Soc 1987 109 225ndash228 872
70 T Takayama S Ando and I Ando J Mol Struct 1990 220 245ndash250 873
71 K Gawrisch N V Eldho and I V Polozov Chem Phys Lipids 2002 116 135ndash151 874
72 F Tielens C Gervais J F Lambert F Mauri and D Costa Chem Mater 2008 20 875
3336ndash3344 876
73 G A Jeffrey and Y Yeon Acta Crystallogr Sect B 1986 42 410ndash413 877
74 B Berglund and R W Vaughan J Chem Phys 1980 73 2037ndash2043 878
75 C Gervais C Coelho T Azaiumls J Maquet G Laurent F Pourpoint C Bonhomme 879
P Florian B Alonso G Guerrero P H Mutin and F Mauri J Magn Reson 2007 880
187 131ndash140 881
76 C Akita T Kawaguchi F Kaneko H Yamamoto and M Suzuki J Phys Chem B 882
2004 108 4862ndash4868 883
77 R N Purusottam L Seacutenicourt J J Lacapegravere and P Tekely Biochim Biophys Acta - 884
Biomembr 2015 1848 3134ndash3139 885
78 X Biarneacutes A Ardegravevol A Planas C Rovira A Laio and M Parrinello J Am Chem 886
Soc 2007 129 10686ndash10693 887
79 L M J Kroon‐Batenburg and J Kroon Biopolymers 1990 29 1243ndash1248 888
80 K N Kirschner and R J Woods Proc Natl Acad Sci U S A 2001 98 10541ndash889
10545 890
81 S Svenson B Kirste and J H Fuhrhop J Am Chem Soc 1994 116 11969ndash11975 891
82 I Sack S Macholl J H Fuhrhop and G Buntkowsky Phys Chem Chem Phys 892
2000 2 1781ndash1788 893
83 S Svenson J Koening and J H Fuhrhop J Phys Chem 1994 98 1022ndash1028 894
34
84 S Svenson A Schaefer and J H Fuhrhop J Chem Soc Perkin Trans 2 1994 2 895
1023ndash1028 896
85 K Bock and C Pedersen Adv Carbohydr Chem Biochem 1983 41 27ndash66 897
86 T B Grindley Structure and Conformation of Carbohydrates Springer Berlin 898
Heidelberg 2008 899
87 F Tantakitti J Boekhoven X Wang R V Kazantsev T Yu J Li E Zhuang R 900
Zandi J H Ortony C J Newcomb L C Palmer G S Shekhawat M O De La 901
Cruz G C Schatz and S I Stupp Nat Mater 2016 15 469ndash476 902
903
1
Supporting Information 904
905
Topological connection between vesicles and nanotubes in single-906
component lipid membranes driven by head-tail interactions 907
908
Niki Baccilea Ceacutedric Lorthioira Abdoul Aziz Baa Patrick Le Griela Cristina Coelhob Javier 909
Perezc Wim Soetaertd Sophie L K W Roelantsd 910
911
a Sorbonne Universiteacute Centre National de la Recherche Scientifique Laboratoire de Chimie de 912
la Matiegravere Condenseacutee de Paris LCMCP F-75005 Paris France 913
b Institut des Mateacuteriaux de Paris Centre Sorbonne Universiteacute Paris France 914
c Synchrotron Soleil LrsquoOrme des Merisiers Saint-Aubin BP48 91192 Gif-sur-Yvette Cedex 915
France 916
d InBio Department of Biotechnology Ghent University Ghent Belgium 917
918
919
Corresponding author 920
Dr Niki Baccile 921
E-mail address nikibaccilesorbonne-universitefr 922
Phone +33 1 44 27 56 77 923
924
925
926
2
a) 927
Parameter Method
Dry Matter (DM ) 996 Infrared balance 105degC
Glucose () 012 HPLC-Metacarb
Glycerol () nd HPLC-Metacarb
Free Fatty Acid content () lt001 Internal method BBEPP
GC with FID Detector
Oil () lt001 Internal method BBEPP
GC with FID Detector
Moulds (CFUg) lt10 3M-Nordval ndeg16 B
Yeasts (CFUg) lt10 3M-Nordval ndeg16 B
Anaerobic count (CFUg) lt10 SP-VG M005 B
Protein () tbd BCA protein assay
928
Figure S 1 - a) HPLC-ELSD chromatogram and composition table 929
930
931
932
933
3
b) 934
935
Group Ndeg δ ppm
CH2 1 354
CH2 2 153
CH2 3-712-14 132
CH2 811 203
CH 910 534
CH2 15 162
CH2 16 388
CH 1 424
CH 2 316
CH 3 334
CH 4 329
CH 5 354
CH2 6 366
Figure S 1 (next) ndash b) 1H NMR spectrum (MeOD-d4) recorded on the purified G-C181-OH compounds 936
and related assignment 937
938
2
811910 1rsquo
5rsquo1
3rsquo4rsquo
1rsquo1910
asymp asymp asympHDO MeOD Acetone
6rsquo2rsquo
1615
3-712-14
4
939
940
Figure S 2 ndash Cryo-TEM images recorded for a 5 mgmL G-C181-OH aqueous solution heat at T= 130degC 941
5
942
943
Figure S 3 - Cryo-TEM images recorded for a 5 mgmL G-C181-OH aqueous solution heat at T= 90degC 944
945
90degC
1
22
6
946
947
948
949
Figure S 4 ndash Cryo-TEM images recorded for a 5 mgmL G-C181-OH aqueous solution heat at T= 70degC 950
951
21
11
1
2
5
3
4
45
5
6
7
7
7
952
953
954
Figure S 5 ndash Cryo-TEM images recorded for a 5 mgmL G-C181-OH aqueous solution heat at T= 25degC 955
956
957
1
1 1
8
958
Figure S 6 ndash a) SANS experiment recorded at 90degC for a 5 mgmL G-C181-OH aqueous solution b-c) 959
WAXS experiments recorded on aqueous solutions of G-C181-OH at b) 5 mgmL and c) 25 mgmL d) 960
Structural interpretation of the repeating distances pointed out in c) 961
962
963
964
001 01 1
q Aring-1
25degC
68degC
88degC
111degC
01 1q Aring
-1
02 04 06 08 1q Aring
-1
001 01
10-1
100
101
Inte
nsity
cm
-1
q Aring-1
-2
T= 90degC
SANS WAXS WAXS
a) b) c)
dv
dL d= 144 Aring-1
di
ddH2O
dt
dvdL
dtdi d
d)
9
965
966
Figure S 7 ndash ssNMR MAS (10 kHz) experiments recorded on a G-C181-OH dry powder a) 1H spectra 967
recorded from 110degC to 70degC b) 13C single pulse (SP) spectra recorded with high power 1H decoupling from 968
110degC to 70degC c) 13C cross polarization (CP) spectra recorded at 110degC and contact time tc of 50 micros and 969
3000 micros d) 13C CP spectra recorded at 70degC and for 20 lt tc micros lt 3000 970
971
1
811
910
CH2 CH2
1rsquo
6rsquo
8 6 4 2 0 ppm
110
90
80
70
910
1rsquo
6rsquo16
1
2rsquo3rsquo4rsquo
811
OH
45 40 35 30 25 20 15
ppm
200 180 160 140 120 100 80 60 40 20 0
ppm140 120 100 80
ppm
CH2-gauche
3004
110
90
80
70
65
60
50
25
C91013003
C9 - 12869
CH2-all-trans
3198
C1rsquo10335
a) b)
1H
T degCT degC
13C Single Pulse MAS
A
B
A
B
70degC70degC
5rsquo
215
200 180 160 140 120 100 80 60 40 20 0
ppm
13C CPMAST= 110degC
200 180 160 140 120 100 80 60 40 20 0
ppm
132 131 130 129 128 127 126
ppm
106 105 104 103 102
ppm
13C CPMAST= 70degC
50
tc micros
3000
20
tc micros
50 500 1000 3000
tc micros
C102
13024 C910113003
C92
12869
C1rsquo213082
C1rsquo110443
A B
106 105 104 103 102
ppm
3000
1000
500
50
20
AB
c)
d)
10
972
Figure S 8 ndash a) Short and d) long T2 components displayed by the 1H transverse relaxation signal c) 1H 973
transverse relaxation signals recorded on a G-C181-OH dry powder from 110degC to 70degC The area of each 974
given resonance is plotted (log-lin) as a function of the echo time (CPMG pulse sequence) for each 975
temperature and fitted using the equation given above T2s and T2l indicate the short and long T2 relaxation 976
times respectively obtained by describing the 1H transverse relaxation signal using a biexponential decay 977
For H1rsquo H5rsquo and H6rsquo the 1H relaxation function could be described by a monoexponential decay 978
- Protons from the sugar group (H1rsquo H5rsquo H6rsquo) show a single T2 relaxation component (Figure 979
6c and Figure S 8) while protons of the acyl chain (CH2 H910 H811) show both short (Figure 980
6c) and long (Figure 6d) T2 relaxation component 981
- The short T2 relaxation time systematically decreases from 110degC to 70degC for all species by a 982
factor ranging from two to seven depending on the specific chemical group Very long T2 are 983
observed at 110degC for all acyl species while nearly unchanged values are measured below 984
90degC without any clear trend 985
- The sugar protons (H1rsquo H5rsquo H6rsquo) have the shortest set of T2 values (lt 1 ms) below 100degC 986
The long component of T2 generally ranges between 4 ms and 12 ms 987
0 1 2 3 4 5 6 7 8
00
05
10
15
20
25
30
35
40
45
Log
In
ten
sity
Time ms
0 1 2 3 4 5 6 7 8
00
05
10
15
20
25
30
35
40
45
Log
In
ten
sity
Time ms
0 1000 2000 3000 4000 5000 6000 7000 8000
00
05
10
15
20
25
30
35
40
45
Log
In
ten
sity
Time ms
0 1000 2000 3000 4000 5000 6000 7000 8000
00
05
10
15
20
25
30
35
40
45
Log
In
ten
sity
Time ms
0 1000 2000 3000 4000 5000 6000 7000 8000
00
05
10
15
20
25
30
35
40
45
Log
In
ten
sity
Time ms
0 1000 2000 3000 4000 5000 6000 7000 8000
00
05
10
15
20
25
30
35
40
45
Log
In
ten
sity
Time ms
H1
H8H11
H9H10
CH2
H1rsquo
H6rsquo
CH2
H910H811 H1CH2
H1rsquo H5rsquo6rsquo
0 1000 2000 3000 4000 5000 6000 7000 8000
00
05
10
15
20
25
30
35
40
45
Log
In
ten
sity
Time ms
OH
0 1000 2000 3000 4000 5000 6000 7000 8000
00
05
10
15
20
25
30
35
40
45 T= 110degC
T= 90degC
T= 80degC
T= 70degC
Log
In
ten
sity
Time ms
Fit
)
CH2 H910 H811 H1 H56 H1 OH
00
05
10
15
20
25
30
35
40
T2 m
s
T= 110degC
T= 90degC
T= 80degC
T= 70degC
CH2 H910 H811 H1
0
2
4
6
8
10
12
T2 m
s
T= 110degC
T= 90degC
T= 80degC
T= 70degC
Short T2(1H) Long T2(1H)
a) b)
c)
11
Table S 1 ndash 1H chemical shifts of G-C181-OH in solution and in the solid-state Solid-state spectra are 988
recorded at a MAS frequency of 10 kHz in DMSO-d6 broad peak 989
990
δH ppm
Group Ndeg Liquid
(MeOD-d4) Solid
(T= 110degC) Solid
(T= 70degC)
CH2 H1 354 357
CH2 H2 153 156
CH2 H3-712-14 132 135
CH2 H811 203 203
CH H910 534 534
CH2 H15 162 164
CH2 H16 388 383
CH H1 424 432
CH H2 316 335
CH H3 334 335
CH H4 329 335
CH H5 354 351 357
CH2 H6 366 383
OH OH1 432
45 463
OH OH2 492
OH OH3 490
OH OH4 487
OH OH6 445
991
992
H1H9H10H1rsquo
H6rsquo
OH2rsquo
OH1
12
Detailed discussion about the NOESY and DQ-SQ 2D 1H-1H ssNMR experiments presented in 993
Figure 9 994
995
2D 1H-1H ssNMR experiments are a unique tool to explore through-space proximities 996
between 1H nuclei ssNMR offers a large number of possibilities each adapted to a given 997
system The advantage of 2D maps with respect to a dynamics approach is their direct 998
readability in clear two nuclei which exchange their magnetization through-space (whichever 999
mechanism may be responsible for this exchange) will display a specific cross-peak However 1000
the way cross-peaks are presented and interpreted strictly depends on the nature of the pulse 1001
program which in turn is chosen according to the physical nature of the sample 1002
1D temperature-dependent 1H NMR experiments performed on G-C181-OH (Figure 1003
4a in the main text) indicate sharp peaks at 90degC and broad peaks at 70degC Narrow peaks 1004
indicate fast andor large-amplitude molecular tumbling averaging the strong 1H-1H dipolar 1005
interactions This excludes the use of pulse sequences like DQ-SQ which is not efficient under 1006
these conditions For this reason we employ spin-diffusion-based pulse sequences like 1007
NOESY which is more adapted for samples with high molecular mobility When mixing times 1008
are chosen to be short (lt 1 s) one generally explores through-space proximities within about 5 1009
10 Aring On the contrary when molecular motions are restricted dipolar coupling becomes 1010
significant 1H NMR peaks are broader and pulse sequences like DQ-SQ can now be used 1011
with a spatial resolution of less than 5 Aring 1012
Whenever possible DQ-SQ experiments are preferred over spin diffusion-based pulse 1013
sequences because they are more selective in particular for likewise interactions which are 1014
not discriminated in NOESY-type experiments This is illustrated by the typical interaction 1015
schemes for NOESY (top Figure 9a) and DQ-SQ (top Figure 9b) For two given A and B 1016
protons 2D NOESY maps will display two on-diagonal and two square-shaped symmetrical 1017
off-diagonal cross-peaks Off-diagonal cross-peaks illustrate the mutual A-B and B-A 1018
interaction but the on-diagonal peaks are systematic and do not prove any A-A or B-B 1019
interaction Similarly to NOESY 2D DQ-SQ maps display off-diagonal peaks (symmetric 1020
across the diagonal top Figure 9b) upon A-B and B-A interaction but in contrast they will 1021
display on-diagonal peaks only in the presence of self-interaction In the tutorial example of 1022
Figure 9b top the on-diagonal A-A peak indicates mutual A-A interaction while lack of on-1023
diagonal B-B peak evidences the absence of B-B proximities Combining NOESY and DQ-SQ 1024
experiments is capital to study the local arrangement of G-C181-OH and its evolution with 1025
temperature 1026
13
At T= 90degC the H1 and H5rsquo contributions are very close but possible to discriminate 1027
them (δ(H1)= 354 ppm δ(H5rsquo)= 351 ppm) according to 1H NMR chemical shifts in Table S 1028
1 2D 1H-1H NOESY in Figure 9a also discriminates between the two components attributed 1029
on the basis of the interactions with their mutual neighbors (green H1-H2 and H5rsquo-H1rsquo squares 1030
in Figure 9a) On this basis 2D NOESY does not show a direct H1rsquo-H1 correlation (blue red-1031
crossed) but rather an extensive network of intra-sugar interactions These features exclude 1032
suggest intra- and inter-sugar interactions and they exclude head-tail arrangements as a major 1033
molecular configuration at 90degC 1034
At 70degC the 1H NMR peaks are broader indicating a reduction of the T2 (1H) relaxation 1035
times andor residual homonuclear dipolar interactions excluding the use of NOESY In this 1036
case 1H-1H DQ-SQ correlation experiments are best suited Figure 9b presents the 1H-1H DQ-1037
SQ experiment on G-C181-OH at 70degC Peaks are broader than in NOESY and attribution may 1038
be cumbersome However the experiment is performed at 700 MHz and MAS= 22 kHz which 1039
improves spectral resolution with respect to the same experiment performed at 300 MHz and 1040
MAS= 10 kHz The auto-peak at δH= 356 ppm in the SQ dimension is attributed to H1-H1 spin 1041
pairs mainly resulting from intra CH2 interaction while the DQ cross-peaks at δH= 156-356 1042
ppm and δH= 432-356 ppm respectively origin from H2-H1 and H1rsquo-H1 interactions (Figure 1043
9b) DQ-SQ map does not show any auto-peak corresponding to H1rsquo-H1rsquo or Hxrsquo-Hxrsquo (x= 2rsquo 1044
3rsquo 4rsquo) interactions (red-crossed blue Figure 9b) thus excluding any proximity (lt 5 Aring) between 1045
close glucose neighbors On the contrary DQ-SQ maps (recorded both at 700 MHz Figure 9b 1046
or at 300 MHz not shown) systematically show DQ cross-peaks which can only be attributed 1047
to H1rsquo-H1 interactions (δH= 432-356) The presence of these H1rsquo-H1 interactions can only be 1048
explained by a head-tail arrangement of the G-C181-OH molecules as illustrated below the 1049
DQ-SQ map in Figure 9b 1050

1
Topological connection between vesicles and nanotubes in single-1
component lipid membranes driven by head-tail interactions 2
3
Niki Baccilea Ceacutedric Lorthioira Abdoul Aziz Baa Patrick Le Griela Cristina Coelho Diogob 4
Javier Perezc Wim Soetaertd Sophie L K W Roelantsd 5
6
a Sorbonne Universiteacute Centre National de la Recherche Scientifique Laboratoire de Chimie de 7
la Matiegravere Condenseacutee de Paris LCMCP F-75005 Paris France 8
b Institut des Mateacuteriaux de Paris Centre Sorbonne Universiteacute Paris France 9
c Synchrotron Soleil LrsquoOrme des Merisiers Saint-Aubin BP48 91192 Gif-sur-Yvette Cedex 10
France 11
d InBio Department of Biotechnology Ghent University Ghent Belgium 12
13
Corresponding author 14
Dr Niki Baccile 15
E-mail address nikibaccilesorbonne-universitefr 16
Phone +33 1 44 27 56 77 17
2
Abstract 18
Lipid nanotube-vesicle networks are important channels for intercellular communication and 19
transport of matter Experimentally observed in neighboring mammalian cells but also 20
reproduced in model membrane systems a broad consensus exists on their formation and 21
stability Lipid membranes must be composed of at least two components each stabilizing low 22
(generally a phospholipid) and high curvatures Strong anisotropy or enhanced conical shape 23
of the second amphiphilic component is crucial for the formation of nanotunnels Anisotropic 24
driving forces generally favor nanotube protrusions from vesicles In the present work we 25
report the unique case of topologically-connected nanotubes-vesicles obtained in the absence 26
of directional forces in single-component membranes composed of an anisotropic bolaform 27
glucolipid above its melting temperature Tm Cryo-TEM and fluorescence confocal 28
microscopy show the interconnection between vesicles and nanotubes in a single-phase region 29
between 60deg and 90degC under diluted conditions Solid-state NMR necessarily recorded on the 30
dry powder yet demonstrates that the glucolipid can simultaneously assume two distinct 31
configurations head-head and head-tail These arrangements seemingly of comparable energy 32
above the Tm could explain the existence and stability of the topologically-connected vesicles 33
and nanotubes which are generally not observed for classical single-component phospholipid-34
based membranes above their Tm 35
36
Keywords Nanotube vesicle networks Tunnelling nanotubes Block liposomes Liposomes 37
Lipid nanotubes Biosurfactants Microbial glycolipids 38
39
Introduction 40
Topological connections between closed lipidic compartments through nanotubes1ndash3 41
have been shown to play a crucial role in the transfer of matter and communication in 42
neighboring mammalian cells4 These singular nanosystems observed since the lsquo90s as 43
spontaneous non-equilibrium structures in electroformed model liposome membranes56 have 44
since been largely studied both experimentally and theoretically7ndash9 Addressed in the literature 45
by different terms tunnelling nanotubes (TNT)149 block liposomes10ndash12 or nanotube-vesicle 46
networks13ndash16 (instead of tubes some work speak of tethers617) all refer to a similar 47
phenomenon driven by various internal or external forces The latter must overcome the energy 48
barrier needed to bend a phospholipid bilayer from low positive mean and gaussian curvatures 49
(vesicle) to a high mean and zero Gaussian (tube) curvatures 50
3
A large body of both experimental and theoretical work has shown that budding and 51
eventual nanotube formation from an existing membrane can only occur spontaneously for 52
membranes of at least two-components9102425111218ndash23 and below a vesicle-nanotube phase 53
transition event2627 Otherwise external anisotropic driving forces like electroformation5ndash54
82829 osmotic pressure6 laser ldquotweezersrdquo30 or electrodynamics13ndash16 must be employed to obtain 55
similar results with in some cases an impressive degree of 2D and 3D organization13ndash16 The 56
origin of spontaneous nanotube formation has been shown to be related to a nanoscale phase 57
separation between two membrane components stabilizing low and high curvatures 58
respectively10ndash1231 with at least one component being highly anisotropic203233 Theoretically 59
this behavior has been explained by deviations in the elastic properties of membranes due to in-60
plane orientational ordering of membrane inclusions composed of anisotropic amphiphiles 61
these referring to a non-symmetrical shape upon a 90deg tilt along the amphiphile axis8919242533 62
In this work we show unexpected nanotubing of membranes prepared from a single-63
component lipid in the absence of external directional forces and above the lipidrsquos Tm This 64
phenomenon is observed for a novel anisotropic double amphiphile (bolaform amphiphile or 65
bolaamphiphile) a glucolipid composed of β-D-glucose and a C181-cis fatty alcohol (G-66
C181-OH Figure 1) This compound is obtained by microbial fermentation of a genetically-67
modified S bombicola yeast in the presence of oleyl alcohol34 and is developed in the broader 68
context of extending the library of new biobased surfactants and lipids in view of replacing 69
petrochemical low molecular weight amphiphiles35ndash41 The structure of G-C181-OH is 70
analogous to that of other microbial glycolipids developed through genetic engineering4243 71
Topological connections between nanotubes and vesicles are observed by means of 72
cryogenic transmission electron microscopy (cryo-TEM) fluorescence microscopy and wide 73
angle X-ray scattering (WAXS) above the melting temperatures Tm= 483degC under strong 74
dilution (05 wt) Spin diffusion and 1H double-quantum single-quantum (DQ-SQ) 2D solid-75
state nuclear magnetic resonance (ssNMR) spectroscopy under magic angle spinning (MAS) 76
necessarily performed on the dry glucolipid powder provides a spectroscopic ground to 77
understand the vesicle-nanotube coexistence The bolaform glucolipids could be in a head-78
headtail-tail configuration in the vesicles but rather in a head-tail configuration in the 79
nanotubes In the dry glucolipid both configurations are energetically comparable in the single-80
phase region above Tm and their coexistence is evidenced by the splitting of some 13C NMR 81
signals These facts could explain the stability of nanotubes while the following hypotheses are 82
formulated for their formation membrane inclusions with different orientational ordering13ndash16 83
possibly driven by inter-vesicle collisions 84
4
85
86
87
88
89
Figure 1 ndash Non acetylated C181 alcohol glucoside G-C181-OH is obtained by a bioprocess performed 90
with modified S bombicola yeast 91
92
Experimental Section 93
Synthesis of non acetylated C181 Alcohol Glucosides (G-C181-OH) G-C181-OH (Mw= 94
41856 gmol-1) was produced by aerobic whole cell bioprocess with a modified S bombicola 95
strain as described by Van Renterghem et al (Fig S4 in Ref 34) The molecule was purchased 96
from the Bio Base Europe Pilot Plant (Gent Belgium) and has the generalized chemical 97
structure given in figure Figure 1 The HPLC and 1H NMR spectrum (MeOD-d4) with peak 98
assignment are shown in Figure S 1 High purity levels (99) and high degree of uniformity 99
were obtained as can be derived from HPLC-ELSD chromatogram 1H NMR and table of 100
contaminant given in Figure S 1 101
102
1H solution Nuclear Magnetic Resonance (NMR) 1H solution NMR experiments were 103
performed on a Bruker Avance III 300 spectrometer using a 5 mm 1H-X BBFO probe using 104
methanol-d4 as solvent The number of transients is 8 with 3 s recycling delay an acquisition 105
time of 546 s and a receiver gain of 362 The 1H NMR spectrum and relative assignment are 106
shown in Figure S 1 and Table S 1 13C solution NMR were performed on the same probe using 107
DMSO-d6 Corresponding chemical shifts are given in Table 1 Referencing is done with 108
respect to TMS δ1H= 0 ppm δ13C= 0 ppm 109
110
Sample preparation The sample was dissolved in milliQ-grade water at the concentration of 5 111
mgmL (05 wt) Lack of pH-sensitive probes (eg COOH groups) in G-C181-OH as 112
otherwise found in other microbial amphiphiles44 but also the will to avoid ion-specific 113
effects45 exclude the use of buffer The solution was heat at the given temperature using a CH3-114
150 Combitherm-2 dry block heating device For the cryo-TEM experiments the vials were 115
heat at the given temperature next to the cryofixation device and plunged into liquid ethane as 116
fast as possible For temperatures of 25degC and 70degC the sample was heat at 90degC and then 117
Synthesis path
5
cooled at to the desired temperature For the SAXS experiment the sample was heat at 90degC in 118
the block heating device and cooled at to 25degC before analysis For the SANS experiment the 119
sample was heat at 90degC directly in front of the beam using the thermalized sample holder 120
available 121
122
Differential Scanning Calorimetry (DSC) DSC was performed using a DSC Q20 apparatus 123
from TA Instruments equipped with the Advantage for Q Series Version acquisition software 124
(v540) Acquisition was performed on both hydrated and dry powder sample (~ 3-5 mg) sealed 125
in a classical aluminium cup and using an immediate sequence of heating and cooling ramps at 126
a rate of 10degCmin-1 Melting temperatures Tm 1 and 2 Tm1 and Tm2 were taken at the minimum 127
of the endothermic peak 128
129
Small and Wide Angle Scattering experiments Small angle neutron scattering (SANS) 130
experiments were performed at the D11 beamline of Institut Laue Langevin (Grenoble France) 131
during the run No 9-13-778 Four q-ranges have been explored and merged using the following 132
wavelengths λ and sample-to-detector (StD) distances 1) ultra-low q λ= 135Aring StD= 39 m 133
2) low-q λ= 53Aring StD= 39 m 3) mid-q λ= 53Aring StD= 8 m 4) high-q λ= 53Aring StD= 14 m 134
The sample (C= 5 mgmL-1) was prepared in 999 D2O to limit the incoherent background 135
scattering The sample solution was analyzed in standard 1 mm quartz cells Direct beam empty 136
quartz cell H2O (incoherent scatterer) within the quartz cell were recorded and boron carbide 137
(B4C) was used as neutron absorber The sample acquisition was measured at 90degC where 138
temperature was controlled through the controller thermalized sample holder available at the 139
beamline The background sample (D2O) signal was subtracted from the experimental data 140
Absolute values of the scattering intensity were obtained from the direct determination of the 141
number of neutrons in the incident beam and the detector cell solid angle The 2D raw data were 142
corrected for the ambient background and empty cell scattering and normalized to yield an 143
absolute scale (cross section per unit volume) by the neutron flux on the samples The data were 144
then circularly averaged to yield the 1D intensity distribution I(q) The software package Grasp 145
(developed at ILL and available free of charge) was used to integrate the data while the 146
software package SAXSUtilities (developed at ESRF and available free of charge) was used to 147
merge the data acquired at all configurations and subtract the background 148
Wide-angle X-ray scattering (WAXS) was performed under temperature control at the 149
SWING beamline of SOLEIL synchrotron facility (Saint-Aubin France) during the run 150
20201747 (energy 14 keV sample-to-detector distance 05 m) Two sample concentrations in 151
6
H2O were probed C= 5 mgmL-1 and C= 25 mgmL-1 The 2D data were integrated azimuthally 152
at the beamline using the software Foxtrot and in order to obtain the I(q) vs q spectrum after 153
masking the beam stop shadow Silver behenate (d(100) = 5838 Aring) was used as a standard to 154
calibrate the q-scale Sample solutions were inserted in borosilicate capillaries of 15 mm in 155
diameter Capillaries were flame-sealed A capillary oven with controlled temperature (plusmn 05degC) 156
provided at the beamline was used to control the sample temperature between 25degC and 111degC 157
Data were normalized by the transmission and calibrated to the SAXS signal of H2O at large q-158
values (I= 00163 cm-1) in order to obtain an absolute intensity scale The water signal was 159
measured by subtracting the signal of the empty capillary from the signal of a water-filled 160
capillary The signal of (water + capillary) was used as background for the samples and it was 161
subtracted after integration of the 2D data 162
163
Cryogenic transmission electron microscopy (cryo-TEM) Cryo-TEM experiments were carried 164
out on an FEI Tecnai 120 twin microscope operating at 120 kV and equipped with a Gatan 165
Orius CCD numeric camera The sample holder was a Gatan Cryoholder (Gatan 626DH 166
Gatan) Digital Micrograph software was used for image acquisition Cryofixation was 167
performed using a homemade cryofixation device The solutions were deposited on a glow-168
discharged holey carbon coated TEM copper grid (Quantifoil R22 Germany) Excess solution 169
was removed and the grid was immediately plunged into liquid ethane at -180degC before 170
transferring them into liquid nitrogen All grids were kept at liquid nitrogen temperature 171
throughout all experimentation Cryo-TEM images have been treated and analyzed using Fiji 172
(is just ImageJ) software available free of charge at the developerrsquos website46 173
The samplersquos concentration was C= 5 mgmL-1 For technical reasons the temperature 174
during cryofixation could not be controlled For this reason the temperature associated with 175
each cryo-TEM image in the text was related to the equilibration temperature just before 176
cryofixation the device being as close as possible to the dry bath used for temperature control 177
Since temperature control during cryofixation was not possible in our device and practically 178
impossible at high temperatures one should take the T values as indicative of the given value 179
Although the sample transfer between the dry bath and the cryofixation device was performed 180
as fast as possible it is more than likely that the actual temperature of the sample at the moment 181
of cryofixation was lower than the one indicated here although impossible to know precisely 182
183
7
Fluorescence microscopy Images were recorded using a 40x objective on a Leica SP5 upright 184
confocal microscope with 405 nm laser excitation The sample was marked with 6-dodecanoyl-185
NN-dimethyl-2-naphthylamine (Laurdan Mw= 35354 gmol-1) fluorophore as follows A 186
stock solution of 3 mg of Laurdan in 100 microL of acetone was initially prepared (C= 30 mgmL-187
1) A volume of 028 microL of the stock Laurdan solution was diluted in 1 mL of a 5 mgmL-1 G-188
C181-OH water solution temporary set at 110degC in a sealed Eppendorf The latter was 189
important so to enhance inclusion of Laurdan in the membrane constituted by the glucolipid 190
while in its vesicle phase The final Laurdan concentration was approximately 24 micromol with a 191
molar Laurdan-to-G-C181-OH molar ratio of approximately 1-to-500 Fluorophore-to-lipid 192
ratios above 1200 were generally considered as non-interfering with the lipid phase behavior 193
as also verified in this work 194
Laurdan can be excited between 365 nm and 410 nm and its emission wavelength can 195
vary according to the rigidity of the membrane intercalation within a rigid or flexible 196
membrane generates emissions at 440 nm or 490 nm respectively47 In the present experiment 197
we have flame-sealed a solution of G-C181-OH at 5 mgmL-1 containing Laurdan (1-to-500 in 198
lipid-to-Laurdan ratio) in flat optical capillaries of 01 mm thickness Capillaries were set on a 199
Linkam support for temperature control eventually placed under the microscope The sample 200
was excited at 405 nm and detection was made in spectral mode with a 5 nm window sliding 201
every 5 nm from 412 nm to 602 nm in 16 bits which allows quantify the signal and compare 202
the different conditions Quantitative analysis was performed according to the literature4849 203
several ROI (range of interest) have been drawn on several images using the ROI manager of 204
Fiji (is just ImageJ) software The integrated intensity of each ROI at 440 nm and 490 nm was 205
eventually recorded and used to calculate the value of the generalized polarization GP as 206
follows of 207
119866119875 =(120582440 minus 120582490)
120582440 + 120582490 208
A negative GP indicates a flexible membrane while a positive GP indicates a rigid membrane 209
210
Solid-state Nuclear Magnetic Resonance (ssNMR) 1H and 13C ssNMR experiments have been 211
performed using an Avance III HD Bruker 705 T (ν1H= 300 MHz) spectrometer and a 4 mm 212
magic angle spinning (MAS) probe except for the BAck-to-BAck (BABA) experiment which 213
was performed on an Avance III Bruker 1644 T (ν1H= 700 MHz) spectrometer equipped with 214
25 mm MAS probe Temperature was controlled through a Smart cooler BCUIIa BCU-xtreme 215
unit using 10 min of equilibration time after each temperature variation Temperature was 216
8
always varied from high (110degC) to low (70degC) before analysis Due to combined use of fast 217
MAS rates necessary to achieve high resolution spectra and heating close to the boiling point 218
of water neither diluted nor concentrated samples could be used for ssNMR experiments All 219
tests employing up to 50 wt G-C181-OH in water resulted in sample centrifugation drying 220
but also expulsion from the rotor causing sudden stop of rotor spinning For these reasons all 221
attempts to study hydrated G-C181-OH failed and only the dry powder could be analyzed The 222
dry sample powder was analyzed as such in zirconia rotors (4 mm or 25 mm) spinning at MAS= 223
10 kHz (4 mm) or 22 kHz (25 mm) and Chemical shifts were calibrated with respect to 224
adamantane (13C 13C(CH2)= 3848 ppm = 191 ppm) and glycine alpha (13C(CO)= 17603 225
ppm) Details on the acquisition parameters are given in the Supporting Information 226
227
Results and discussion 228
Topologically-connected nanotubes and vesicles 229
G-C181-OH is a biobased glucolipid water-insoluble at room temperature and of 230
which the physicochemical properties are poorly known The DSC thermogram performed at 231
10degCmin of G-C181-OH as a function of the water content (Figure 2a) shows two endothermic 232
peaks on the dry powder (996 wt glucolipid) They are attributed to two melting phenomena 233
occurring at the following temperatures Tm 483degC (Tm1) and 957degC (Tm2) the enthalpy of the 234
former being lower than that of the latter Interestingly DSC also shows that Tm1 is hydration 235
independent and reversible (the associated exothermic peak is systematically observed) while 236
the transition at Tm2 is simply suppressed (here tested up to 130degC) on hydrated powders and 237
never observed on the cooling profile even at slow cooling rates (1degCmin) The thermogram 238
recorded on the dry powder is typical of single-component lipids having an intermediate50 239
metastable phase (often referred to the ripple phase Pβ´ in reference to the periodic undulation 240
of the bilayer)50ndash54 between the classical lamellar gel (Lβ) and liquid crystalline (Lα) phases50ndash241
54 and characterized by regions of both liquid order and disorder5455 The effect of water does 242
not influence the low-temperature crystallization at Tm1 but it contributes to disrupt the ordered 243
array of hydrocarbon chains in the metastable phase 244
On the basis of the DSC thermogram the aqueous phase behavior of G-C181-OH under 245
diluted conditions (5 mgmL-1) was studied at four different temperatures (red marks on Figure 246
2a) below and above Tm1 but also between Tm1 and Tm2 corresponding to the thermogram of 247
the dry powder 248
9
249
Figure 2 ndash a) DSC thermogram of G-C181-OH under dry (04 wt water estimated by thermogravimetric 250
analysis) and hydrated conditions recorded at a heating rate of 10degCmin Red marks indicate the 251
temperatures at which cryo-TEM experiments are performed on the corresponding 5 mgmL aqueous 252
solutions b) Cryo-TEM images recorded for a 5 mgmL G-C181-OH aqueous solution heat at T= 130degC 253
90degC 70degC and 25degC T indicates the temperature of the sample solution before cryofixation Tne T T 254
being the temperature of the sample upon plunging in liquid ethane Please refer to the materials and 255
methods section for more information 256
T= 130degC
T= 90degC
T= 70degC
T= 25degC
a)
b)
20 40 60 80 100 120
99 wt
50 wt
25 wt
T degC
En
do
10 wt
Tm1= 483 degC
Tm2= 957 degC
10
257
The series of cryo-TEM images in Figure 2b show an overview of the most relevant 258
structures observed on G-C181-OH solution from T= 130degC to T= 25degC whereas T is 259
indicative of the equilibrium temperature before cryofixation (refer to materials and methods 260
section for more information on the sense and interpretation of T) At Tgt 100degC the sample 261
is essentially composed of polydisperse single wall vesicles massively shown by the 262
complementary pictures presented in Figure S 2 In between Tm1 and Tm2 at T= 90degC and T= 263
70degC (Figure 2b Figure 3 Figure 4 complemented by Figure S 3 and Figure S 4) vesicles are 264
connected by nanotubes At Tlt Tm1 flat crystals are otherwise observed (Figure 2b and Figure 265
S 5) 266
267
268
Figure 3 ndash Cryo-TEM images recorded for a 5 mgmL G-C181-OH aqueous solution heat at T= 90degC 269
270
A deeper insight at T= 90degC is given in Figure 3 (more images are provided in Figure 271
S 3) Arrows 1 through 6 mark very clearly the typical continuity in the glucolipid membrane 272
between the vesicle and nanotubes Arrow Ndeg 7 shows that a single nanotube connects the outer 273
membrane of two vesicles several hundred nanometers apart The connection is shown by 274
2
34
5
6
6
1
5
7
A
B
D
C
0 10 20 30 40 50 60
BIn
tensity
au
Profile nm
A
0 10 20 30 40 50 60
Inte
nsity
au
Profile nm
C
D
T= 90degC
11
arrows Ndeg5 and Ndeg6 The corresponding profiles A through D confirm the tubular nature of 275
the elongated objects Profiles B and D are both characterized by typical symmetrical thick 276
walls (low intensity depths highlighted by shaded rectangles) surrounding a hollow region (high 277
intensity peak between the shaded rectangles) The wall thickness varies between 35 and 40 278
nm for profile B and between 41 and 61 nm for profile D while the total nanotube diameter 279
varies between 14 nm at B and 20 nm at D At the same time the thickness of the vesicle wall 280
is about 6 nm at A and 135 nm at C Considerations about the bilayer or interdigitated structure 281
of the membrane will be presented below 282
The connection between nanotubes and vesicles seems to be multiple For instance 283
arrow Ndeg1 (Figure S 3) and Ndeg4 (Figure 3) show a single-wall vesicle of which the membrane 284
is extruded into a nanotube Similarly a closer look at arrows Ndeg1 2 and 3 in Figure 3 show 285
that the vesicle is single-wall and fully closed while the nanotube nucleates at the vesicle outer 286
surface with no apparent topological continuity In many regions of the sample at T= 90degC 287
one can find exvaginations or buds232531 in the nanotube wall This is shown for instance by 288
arrows Ndeg7 and particularly put in evidence in Figure 4 by arrows Ndeg1 through Ndeg4 where the 289
amplitude of the oscillation varies between 20-25 nm (arrow Ndeg1) and 6-8 nm (arrows Ndeg3-4) 290
291
Figure 4 - Cryo-TEM images recorded for a 5 mgmL G-C181-OH aqueous solution heated at T= 90degC 292
293
Still between Tm2 and Tm1 but at lower temperature (T= 70degC) the nanotubes seem to 294
vary from single threads (arrow Ndeg1 Figure S 4) to nanotubes of diameter below 15 nm both 295
connecting nanotubes of diameter ranging between 50 nm and 100 nm (arrows Ndeg2 Figure S 296
4) The larger tubes are most likely formed by the inflation and flattening of the nanotubes 297
probably after assimilation of surrounding vesicles and fusion of the exvagination discussed 298
above The transition between vesicles tubes and flat membranes is certainly more accentuated 299
Arrow Ndeg3 in Figure S 4 shows distinct vesicles while arrow Ndeg4 identifies a flat structure 300
evidently formed from fused vesicles In particular arrow Ndeg5 points at the fusion of two 301
2
1 132
4
12
vesicles while arrow Ndeg6 points at two vesicles fusing into the flat membrane Additional areas 302
where vesicle fusion is prominent are indicated by the oscillations at the outer skirt of broad 303
lamellae and pointed by arrow Ndeg7 304
Finally below Tm1 at T= 25degC for instance mainly flat crystals with no visible 305
exvaginations or tubes are visible (Figure S 5) by cryo-TEM and the material turns into an 306
insoluble precipitate Massive presence of flat crystalline structures is also clear from the bulk 307
iridescent behavior of a G-C181-OH solution under manual shear 308
In summary despite the uncertainty related to the actual state of equilibrium of the 309
glucolipids at the moment of cryofixation cryo-TEM depicts a vesicle phase at Tgt 100degC a 310
flat lamellar phase below Tm1 and an interconnected vesicle-nanotube network between Tm1 and 311
about 100degC The combination of statistically-relevant fluorescence microscopy and 312
scatteringdiffraction experiments provides an additional proof of the coexistence of 313
vesiclenanotube systems between the two transition temperatures Please note that the 314
experiments reported below have been performed under controlled conditions of temperature 315
which is then indicated by the use of T instead of T 316
13
317
Figure 5 ndash a-c) Confocal fluorescence microscopy images recorded at 90degC and 70degC for a 5 mgmL G-318
C181-OH aqueous solution d-g) Typical fluorescence microscopy images recorded at T= 80degC using 319
Laurdan (refer to materials and methods section for more details on this fluorophore) Excitation 320
wavelength is 405 nm for all the images while emission wavelength is 490 nm in (df) and 440 nm in (eg) 321
h) Full emission spectra obtained from the integration of various fluorescence images recorded from 412 322
nm to 600 nm (step 5 nm) at 90degC 80degC and 70degC i) Box plot of GP defined as 119918119927 =(120640120786120786120782minus120640120786120791120782)
120640120786120786120782+120640120786120791120782 with 120640120786120786120782 323
and 120640120786120791120782 being the emission wavelengths at 440 nm and 490 nm at 90degC 80degC and 70degC Each data point 324
l= 490 nm l= 440 nm
l= 490 nm l= 440 nm
10 μm400 450 500 550 600
00
02
04
06
08
10
No
rma
lize
d I
nte
nsity
l nm
90degC
80degC
80degC
70degC
70degC
400 450 500 550 60000
02
04
06
08
10
No
rma
lize
d I
nte
nsity
l nm
90degC
80degC
80degC
70degC
70degC
d) e)
f) g)
h)
i)
T= 80degC
Laurdan
T= 80degC
T= 80degC T= 80degC
T= 90degC T= 70degC T= 70degC
a) b) c)
1
1
1
14
corresponds to a set of regions of interest (ROIs) (54 at 90degC 65 at 80degC and 75 at 70degC) selected in the 325
corresponding fluorescence images ROIs were representatively selected so to include the entire image but 326
also vesicles alone tubes alone and mixtures of vesicles and tubes 327
328
Figure 5ab shows two typical confocal fluorescence microscopy images recorded on a 329
G-C181-OH solution (5 mgmL) in a flame-sealed capillary heat at T= 90degC and T= 70degC 330
Although the resolution of optical microscopy is not comparable with cryo-TEM the sample is 331
broadly composed of vesicles coexisting with nanotubes whereas in some cases the nanotube 332
starts from the vesicle itself (arrow Ndeg1) in good agreement with cryo-TEM data Furthermore 333
SANS recorded at T= 90degC (Figure S 6a) shows a scattering profile with a pronounced -2 334
dependence of the scattering intensity against the wavevector q in the log-log scale This 335
indicates the massive presence of a flat interface and it is expected typical of bilayers in 336
vesicular morphologies56 However the typical signature of nanotubes cannot be observed in 337
the SANS profile and this can be explained by both an argument related to the relative lower 338
amount of nanotubes with respect to vesicles at 90degC but also to the steeper slope of flat 339
morphologies (-2) compared to tubes (-1) the signal of the former masking the tube signal at 340
low wavevector values The SANS profile is characterized by a diffraction peak at q= 0167 Aring-341
1 of which the assignment is refined by WAXS data 342
Temperature-driven WAXS experiments in Figure S 6bc (5 mgmL-1 and 25 mgmL-1 343
respectively) show a lamellar order possibly attributed to a multilamellar structure of the 344
vesicles (dv Figure S 6d) at high temperature and to the interplanar arrangement of the 345
crystalline flat structures (dL Figure S 6d) at T= 25degC The sharp (001) reflection indicates 346
typical interlamellar distance of 353 Aring at 25degC although this value varies with temperature 347
(400 Aring at 111degC 372 Aring at 88degC) thus confirming its assignment to a hydration-dependent 348
interlamellar order More intriguing is the second broader peak at q= 0403 Aring-1 (d= 156 Aring) 349
and its reflection both clearly visible at 88degC below Tm2 We attribute it to the inter-glucolipid 350
arrangement inside the tubular phase (dt Figure S 6d) coexisting with the vesicle phase 351
between Tm1 and Tm2 and to the planar lipid arrangement (di Figure S 6d) in the rigid flat 352
lamellar structure below Tm2 Its temperature- hence hydration- independent position also 353
confirms its structural origin Finally besides the water-structure peak at about 2 Aring-1 we also 354
observe a broad peak at 144 Aring-1 characteristics of the lateral packing (d Figure S 6d) of lipids 355
in bilayers While its position could be consistent with an Lα phase5758 above Tm2 its broadness 356
and positional invariance as well as the coexistence between vesicles and tubes do not allow a 357
precise assignment 358
15
Does G-C181-OH assume a bilayer or interdigitated structure the latter being the one 359
found for other similar bolaform glucolipids4243 The size of G-C181-OH can be estimated to 360
be at the most 32 Aring given by the length L of the C16 tail (L = 22 Aring from the Tanford formula 361
L= 154 + 1265 times n (n= 16)59) and the sugar (about 10 Aring)4243 However the cis conformation 362
of the C=C bond imposes a ldquokinkrdquo of 60deg in the aliphatic chain which reduces the effective 363
length of the oleic backbone to about 17 Aring for an effective total G-C181-OH length of about 364
27 Aring Cryo-TEM provides a tube thickness varying from 35 Aring to 60 Aring and a vesicle membrane 365
thickness of at least 60 Aring WAXS suggests an interlamellar thickness (membrane and water) 366
between 40 Aring and 37 Aring and an inter-lipid distance in the tube of about 16 Aring In the absence of 367
a clear form factor oscillation profile as found for similar glucolipids4243 one must 368
acknowledge that these data pledge neither in favor of fully interdigitated nor a double layer 369
structure and might suggest a tilted lipid arrangement with partial interdigitation60 370
371
13C ssNMR demonstrates that G-C181-OH can assume two coexisting head-head and 372
head-tail configurations 373
Vesicles are characterized by low positive mean and gaussian curvatures while 374
nanotubes are described by a combination of a high positive mean and zero gaussian curvatures 375
In this regard the coexistence of vesicles and nanotubes requires glucolipids to adapt 376
themselves to both environments at the same time For this reason the formation of nanotube-377
vesicle networks generally requires a specific driving force able to impose a high mean and 378
zero gaussian curvature to the membrane In many systems insertion of at least a second 379
constituent (lipid surfactant protein) in the membrane becomes a necessary internal driving 380
force for the nucleation and growth of so-called membrane inclusions from which 381
topologically-connected nanotubes can form10ndash123261 as explained by orientational ordering 382
arguments62 It has also been shown that external driving forces such as use of laser 383
ldquotweezersrdquo30 osmotic pressure6 electroformation5ndash82829 or controlled suction13ndash16 are 384
otherwise necessary as also supported by theoretical studies19 385
The bending energy of tubes is higher than that of a vesicle membrane8 due to the 386
dependence of the membrane free energy from the principal curvatures For this reason 387
isotropic (rotational symmetry along the main axis) but also anisotropic33 lipids generally 388
stabilize low-curvature shapes like flat membranes or vesicles Lipid nanotubes are also a 389
common phase formed by amphiphiles but generally for lipids with a certain complexity in 390
their molecular structures as exampled by diacetylenic derivatives of phospholipids among 391
others262763ndash65 Negative contributions to the bending energy favoring the simultaneous 392
16
presence of interconnected vesicles and tubes was shown to be driven by the presence of 393
anisotropic lipids in a membrane continuum Spontaneous deviations to the elastic theory in the 394
presence of surfactants lipids and proteins with anisotropic structures favor the formation of 395
protrusions with radius of the order of the fraction of a micron9ndash1219ndash2362 396
In the absence of both internal and external driving forces mentioned above G-C181-397
OH should behave as a standard lipid Its DSC profile (Figure 2)536667 under both hydrated and 398
dry conditions identifies a hydration-independent transition (Tm1) slightly above room 399
temperature this is followed by one main transition at higher temperature (Tm2) in the dry 400
sample50 For such a profile one expects a gel phase (Lβ) below Tm1 and a liquid crystalline 401
structure possibly in the morphology of vesicles (L4 phase) possibly above Tm1 and most likely 402
above Tm231 as experimentally found On the basis of the thermogram recorded on the dry 403
powder one may also expect a ldquoripplerdquo (Pβ) phase between Tm1 and Tm2 characterized by 404
periodic undulations of the bilayer (generally addressed to as regions with both liquid order and 405
disorder)5455 406
In the present work instead of a Lβ phase we observe flat crystals below Tm1 and a 407
vesicle-nanotube network instead of the ldquoripplerdquo phase The latter is particularly unexpected 408
because the membrane is composed of a single-component (G-C181-OH) and no anisotropic 409
external force (osmotic hydrodynamic electric) is used to pull and stabilize the tubes In 410
addition the nanotubes are observed at fairly high temperatures above Tm1 (between about 411
60degC and 90degC) while this morphology is generally favored at low temperature (proportionality 412
with 1kT figure 5 in Ref 62) commonly below a given transition temperature characteristics 413
for each specific amphiphile27 Furthermore nanotubes of G-C181-OH seem to be stable in 414
time thus differing from what is found in electroformed vesicles78 They are also observed 415
away from phase transition events (may them be at Tm1 or Tm2) as otherwise reported before 416
for a diacetylenic derivative of phosphatidylcholine26 and many other systems27 417
A stable nanotube-vesicle network for a single-component phospholipid in the absence 418
of external driving forces is not expected and has never been reported before It could be 419
explained by the coexistence of two micro-separated phases of different rigidity This 420
hypothesis is excluded by confocal microscopy on Laurdan-labelled membranes and magic 421
angle spinning (MAS) solid-state NMR (ssNMR) experiments 422
Laurdan is a well-known fluorophore used to put in evidence the coexistence of rigid 423
and fluid domains in both model and biological membranes47ndash49 Laurdan was used here to label 424
the G-C181-OH membranes between Tm1 and Tm2 and to verify the possible micro-segregation 425
and coexistence of rigid (eg Lβ λem= 440 nm) and fluid (eg Lα λem= 490 nm) domains in 426
17
tubes and vesicles respectively A set of quantitative experiments performed on a 5 mgmL-1 427
solution summarized in Figure 5 shows an excess of fluorescence at only λem= 490 nm for 428
temperature between 90degC and 70degC (Figure 5h) The GP value which quantifies the rigidfluid 429
character of the membrane is systematically negative (Figure 5i) indicating an overall fluid 430
membrane at all temperatures GP is quantified on more than 50 regions of interest (ROIs) at 431
each temperature including vesicles and tubes alone as well as connected nanotube-vesicles 432
(Figure 5d-g) The dispersion of GP at 80degC and 70degC between -08 and -02 could suggest the 433
spurious presence of membranes with various degrees of flexibility although fluidity is always 434
predominant The combination of WAXS (broad peak d= 144 Aring-1 invariant with 435
temperature Figure S 6bc) and confocal fluorescence microscopy using Laurdan confirms the 436
single-phase of the membrane composed of G-C181-OH both in vesicles and nanotubes This 437
is also consistent with the lack of phase transitions in DSC experiments between ~85degC and 438
~60degC especially in hydrated samples We conclude that the vesicle-nanotube transition is not 439
driven by the local segregation of gel phase (Lβ) microdomains nor that the nanotubes are 440
composed of such phase 441
ssNMR is the best-suited approach to investigate the origin of the local driving force for 442
the nucleation of anisotropic inclusions of which the average orientation depends on the local 443
membrane and inclusion curvatures and was shown to promote tubing62 ssNMR can provide 444
information on the local molecular mobility eg through the nuclear spin relaxation behavior 445
but also on intermolecular interactions and stereochemistry eg through variations in the 446
chemical shift68ndash70 447
Ideally ssNMR should be performed on diluted G-C181-OH samples above Tm1 448
However fast MAS necessary for high resolution centrifuges the sample As a first 449
approximation hydrated G-C181-OH samples for instance at 50 wt as classically done for 450
phospholipids71 could be studied Unfortunately permeability of the sample holder combined 451
to heating (close to the boiling point of water) and MAS provoke dehydration and even sample 452
ejection After experiencing both of the above this approach was abandoned As a second 453
approximation the study of the dehydrated G-C181-OH powder avoids centrifugation and 454
evaporation If studying dried lipids may not reflect their exact behaviour under diluted 455
conditions valuable structural information can still be obtained in dehydrated molecular 456
systems like proteins thus illustrating that this approach is not unreasonable Furthermore if 457
DSC (Figure 2a) shows that hydration suppresses the Tm2 it also shows that the value of Tm1 is 458
not affected by water at concentrations as low as 10 wt For this reason performing a 459
structural analysis of dehydrated G-C181-OH by ssNMR above Tm1 may help understanding 460
18
the local arrangement of G-C181-OH in two morphologies vesicles and nanotubes having 461
sensibly different curvatures 462
To explore the local mobility of the most relevant chemical groups of G-C181-OH 463
above Tm2 (T= 110degC) and between Tm2 and Tm1 (70 lt T degC lt 90) we combine a series of 1H 464
and 13C experiments Single-pulse (SP) MAS experiments (1H and 13C) when recorded under 465
quantitative conditions allow the detection of all chemical species while cross-polarization 466
(CP) MAS (13C only) experiments are sensitive only to constrained groups for which the 1H-467
13C dipolar coupling is not averaged to zero by the molecular motions 468
469
Figure 6 ndash a) 1H MAS (10 kHz) ssNMR spectra recorded from 110degC to 70degC b) 13C MAS (10 kHz) ssNMR 470
spectra recorded using high power decoupling single pulse (SP) and cross-polarization (CP) pulse sequences 471
Contact time for CP experiments and corresponding temperatures are given on each spectrum Full spectra 472
are given in Figure S 7 473
The most relevant 1H and 13C spectra are given in Figure 6 (full range in Figure 7 and 474
Figure S 7) As expected the 1H solid-state SPMAS spectra show broader peaks compared to 475
the solution-state NMR spectrum (Figure 6a) reflecting the obvious solid-state character of the 476
sample at any temperature The sugar group and the C=C bond resonate in the 25-6 ppm range 477
and 535 ppm respectively while the OH groups of the sugar moiety are found below 45 ppm 478
(Figure 6a full assignment in Table S 1) Very broad (~1 ppm) at 100degC the position of the 479
OH peak varies with the temperature value and becomes narrower (lt~05 ppm) and visible at 480
δH= 464 ppm at T= 70degC Line narrowing and chemical shift variations of the OH resonance 481
in ssNMR is always a direct sign of H-bonding interactions whereas the strength of the H-482
bonding hence its OHhellipH distance is correlated to a dispersion in chemical shifts72ndash75 All other 483
60 55 50 45 40 35 30 25
ppm
110
90
80
70
910
1rsquo
6rsquo16
1
OH
134 132 130 128 126
ppm110 108 106 104 102 100
ppm
SP (T= 110degC)
SP (T= 70degC)
CP 50 ms (T= 70degC)
CP 3 ms (T= 70degC)
910 1rsquo
1H 13C
1
811
910
CH2 CH2
1rsquo
6rsquo
a) b)
C102
13024
C9101
13003
C92
12869 C1rsquo210382
C1rsquo110443
C1rsquo13035
2rsquo3rsquo4rsquo
T degC
5rsquo
19
resonances broaden from 110degC to 70degC thus indicating slower andor more anisotropic 484
reorientational motions of all chemical groups The specific dynamic behaviour of the sugar 485
headgroup is also reflected by its 1H transverse relaxation time T2 whereas the shorter the T2 486
the higher the rigidity Experiments performed between 110degC and 70degC shown and 487
commented in Figure S 8 in the Supporting Information globally show a single short (lt 1 ms 488
below 100degC) T2 relaxation component for H1rsquo H5rsquo and H6rsquo and two both short and long 489
(between 4 ms and 12 ms) T2 for the acyl chain (CH2 H910 H811) even below 100degC 490
At 110degC 13C SPMAS experiments (Figure 6b full range in Figure 7 and Figure S 7 491
assignments in Table 1) show a single peak at δC= 10335 ppm for C1rsquo and at δC= 13003 ppm 492
for C910 as expected for a symmetrical conformation with two chemically-equivalent 493
carbons76 At 70degC the C1rsquo peak disappears while C910 now shows two peaks around 128 494
ppm and 130 ppm (Table 1 full temperature series in Figure S 7b) attributed to C92 (δC= 12869 495
ppm) and C10 in a non-symmetric configuration respectively for which these two carbons are 496
chemically inequivalent76 More precisely the resonance at 130 ppm is actually the 497
superposition of two close resonances C9101 (δC= 13003 ppm) and C102 (δC= 13024 ppm) 498
where subscripts 1 and 2 stand for two different conformations of the cis-olefin group as 499
reported for various phases of oleic acid in the vicinity of 0degC76 500
501
Table 1 ndash 13C Chemical shifts of G-C181-OH in solution and solid-state Solid-state experiments are 502
recorded at MAS= 10 kHz All spectra are reported in Figure 7 and Figure S 7 The contact time for cross 503
polarization is 3 ms In all ssNMR experiments temperature is first raised at 110degC and then lowered to 504
either 90degC or 70degC Attribution of the 13C resonances in Table 1 is performed on the basis of the solution 505
spectrum (Figure S 1b) Additional peaks observed in both single pulse and cross polarization ssNMR 506
experiments are attributed when possible to a configuration effect of the given atom eg C9101 and C92 507
indicate two configurations of C9 All new peaks observed in solid-state and not detected in solution are 508
highlighted in red for convenience 509
510
511
δ ppm
Peak Liquid (DMSO-d6)
Solid Single Pulse
T= 110degC
Solid Single Pulse
T= 90degC
Solid Single Pulse
T= 70degC
Solid Cross Polarization
T= 70degC
C102
- - 13024 13024
C910C9101 13009 13003 13003 13003 13003
C1C9C10C1rsquo
C6rsquo
20
C92 - - - 12869 12869
C1rsquoC11 10329 10335 10335 - 10443
C12 - - - - 10382
C3 7724 7709 7702 - 7829
- 7634 7629 - 7621
7525
C2 7388 7398 7390 7370 7370
C4 7052 7077 7054 7041 7098
C16 6900 7016 - - 7029
- - - - 6793
C1C5C6 6153 6241 6236 6239 6262
C1C5C6 6117 - - - 5956
C2 3300 3290 3290 3283 3279
CH2(trans) - - - 3198 3196
CH2(gauche)C15 2941 2981 2987 3004 -
C811 2706 2747 2747 2832 2817
CH2 2597 2625 2628 2630 2817
512
13C CPMAS spectra at 70degC (Figure 6b full range in Figure 7 and Figure S 7d) at 513
increasing contact times confirm the presence of two cis-olefin environments one for which 514
C910 are equivalent labelled here C9101 and one for which they are inequivalent labelled 515
C92 C102 Both environments are rigid enough to be observed at short contact time (tc= 50 μs) 516
A similar double environment is also observed for the sugar C1rsquo CPMAS at 70degC shows two 517
peaks (C1rsquo1 at δC= 10443 ppm C1rsquo2 at δC= 10382 ppm Figure 6b Figure S 7d) These are 518
significantly shifted downfield from the C1rsquo peak observed at 110degC and are detected at contact 519
times as short as 50 μs thus indicating their rigid character One also finds that CPMAS is 520
totally inefficient at 100degC for short contact times (50 μs) and poorly efficient even at 3 ms 521
typical of fast-tumbling molecules (Figure S 7c) also both gauche (δC= 3004 ppm) and all-522
trans (δC= 3198 ppm) conformations of the CH2 carbons coexist at 70degC (Figure S 7b)77 523
According to ssNMR one main mobile molecular environment exists at 110degC as 524
shown by the well-resolved 1H spectrum single C=C (C9101) and anomeric (C1rsquo) resonances 525
gauche conformation of the aliphatic CH2 and single T2 of the aliphatic CH2 chain and sugar 526
protons The sugar group is certainly mobile (inefficient 1H13C CPMAS) but still more 527
constrainted than the acyl chain (shorter T2 (1H)) As the temperature is lowered the overall 528
rigidity increases (broadening of 1H NMR peaks faster 1H transverse relaxation and efficient 529
1H13C magnetization transfer during CPMAS) presumably driven by H-bonding 530
interactions (downfield shift and line narrowing of the OH 1H signal very short OH T2 loss of 531
the C1rsquo signal in SPMAS) At the same time a number of spectroscopic data (two concomitant 532
21
resonances for anomeric C1rsquo1 and C1rsquo2 cis-olefin C9101 and C92 C102 and CH2 gauche and 533
all-trans environments) and relaxation behaviour (fast and slow T2 relaxation components) 534
strongly suggests the coexistence of two molecular environments Further proofs of the 535
coexistence of two distinct molecular domains are given by a number of chemical shift 536
variations in the 13C CPMAS spectrum at 70degC compared to the one at 110degC 90degC and 537
solution This is shown in Figure 7 and in the list of 13C chemical shifts in Table 1 538
539
540
Figure 7 - Comparison between solution- and solid-state 13C NMR spectra of G-C181-OH Solid-state 541
experiments are recorded directly on the sample powder at a MAS of 10 kHz (4 mm zirconia rotor) SP 542
Single Pulse CP Cross Polarization In all the ssNMR experiments temperature is first raised at 110degC 543
and then lowered to either 90degC or 70degC Segmented lines are meant to highlight the known peak position 544
in solution thus stressing the strong chemical shift variations in the solid-state 545
546
NMR experiments above Tm2 suggest that vesicles could contain G-C181-OH with a 547
single family of mobile conformations characterized by chemically-equivalent C=C (red 548
Figure 8b) and a single C1rsquo conformation (green Figure 8b) Experiments between Tm1 and Tm2 549
otherwise suggest that two coexisting conformations characterized by chemically-equivalent 550
(red Figure 8b) and inequivalent (magenta Figure 8b) C=C could be associated to nanotubes 551
Two distinct C1rsquo sites (grey Figure 8b) also indicate two configurations of the sugar headgroup 552
A comment on this point will be given in the following paragraphs 553
The local (Aring-scale) variation of molecular mobility below Tm2 drives the coexistence of 554
two distinct molecular environments of the same G-C181-OH molecule This occurs within a 555
single-phase domain (as deduced by WAXS) of equivalent membrane rigidity (as derived from 556
Laurdan probe in confocal microscopy) Although never reported before the difference in the 557
local mobility of the same amphiphile (here G-C181-OH) could satisfy the theoretically-558
140 120 100 80 60 40 20
CP(3 ms)-70degC
SP-70degC
SP-90degC
SP-110degC
ppm
LiquidC910
C1rsquo
C2rsquo
C4rsquo
C3rsquo
C1
C6rsquoC5rsquo
C1
6
C8
11
C2 C
H2
C1
5
CH
2
DM
SO
13C
22
required conditions that induce local lipid segregation and formation of membrane inclusions 559
(Figure 8c) In case of their non-zero average orientation the local membrane curvature 560
increases62 and nanotubes can spontaneously form (Figure 8bc) More intriguing this 561
mechanism occurs at least 10degC above Tm1 although it should not be favored above the Tm27 562
From both experimental and theoretical backgrounds the conditions of topologically-563
connected vesicles-nanotubes systems are met only when either internal (two components) or 564
external driving forces are applied19 In the present single-lipid system of which the phase 565
behavior is summarized in Figure 8a the most plausible driving force could be explained by 566
the NMR results collected on the dry sample G-C181-OH concomitantly occupies two 567
molecular environments characterized by 1) two distinct conformations of the sugar 568
displaying equivalent mobility and 2) two conformations of the acyl chain unsaturation 569
570
23
571
Figure 8 ndash a) Thermotropic phase behavior of G-C181-OH at 5 mgmL-1 Note that Tm2 is observed on the 572
dry powder only b) Possible relationship between the molecular environment as derived from NMR and 573
membrane curvatures All the molecular drawings refer to the same G-C181-OH molecule (bulky ellipsoid 574
equiv sugar headgroup) while each color corresponds to a given configuration Grey of C1rsquo1 and C1rsquo2 indicates 575
the uncertainty about the assignment of the specific NMR peak The curvature C is defined as 1R R being 576
the curvature radius R1 R2 radius of curvature CG Gauss curvature CM Mean curvature c) Free 577
interpretation of the anisotropic high-curvature (CMgt 0 CG= 0) inclusions in the membrane (low CM and 578
CG) continuum driven by inter-sugar H-bonding and reduced intramembrane diffusion for a G-C181-OH 579
glucolipid 580
581
Flat crystalline structure
Nanotube-vesicle network
Vesicles
48degC
120deg
106 105 104 103 102 101
ppm
H9 H10H1rsquo
106 105 104 103 102 101
ppm106 105 104 103 102 101
ppm106 105 104 103 102 101
ppm
C=CC=C
C1rsquo1C1rsquo2
C1rsquo
Tm2(96degC)Tm1
a)
b)
c)
Same molecule different local orientations and sugar conformations
High curvature membrane
Low curvature inclusion
Flip-FlopStrong H-bonding
CG
CM ( + )
CG 0
CM 0 CG 0
CM 0
G-C181-OH
24
Two related questions are unanswered at the moment What actually drives nanotube 582
formation and is the organization of G-C181-OH within the vesicles and tubes the same Lipid 583
nanotubes have been studied for at least three decades over which broad experimental and 584
theoretical insight has been generated Despite this fact the actual understanding is still matter 585
of debate27 Micelle-to-nanotube and vesicle-to-nanotube phase transitions are generally 586
reported for single amphiphiles below a given Tm and intermediate phase composed of twisted 587
and flat fibers is concomitantly reported Initially thought to be a chirality-driven phenomenon 588
recent studies propose a more general mechanism involving crystallization and symmetry 589
breaking in the lipid packing driven by optimal packing27 If twisted ribbons were observed 590
before for a number of microbial glycolipid bolaamphiphiles44 they are not found for G-C181-591
OH This fact as well as the large body of cryo-TEM images and the observation of nanotubes 592
above Tm1 rather pledge in favour of a direct topological change from positive (vesicles) to 593
zero (nanotubes) Gaussian curvatures In this case vesicle-to-nanotube transitions could be 594
driven by external forces56307813ndash162829 595
Considering the absence of external forces in the present system there are only two 596
possibilities left spontaneous budding of the membrane or nanotube pulling after inter-vesicle 597
collisions due to Brownian motion Both are possible as inclusions composed of a different 598
arrangement of the same molecule in the membrane continuum can theoretically explain 599
spontaneous nanotube formation in an isotropic medium672223629ndash1218ndash21 However the second 600
one is probably more likely to prevail because it could explain the large number of nanotubes 601
connecting two distant vesicles Interestingly similar events occur for any phospholipid-based 602
vesicular solution but nanotubes are extremely rare unless at least two lipids of different 603
molecular structure are mixed together The spectroscopic 1H and 13C and relaxation (1H) 604
ssNMR data even if collected on a dry powder demonstrate that the coexistence of two G-605
C181-OH configurations involving both the sugar headgroup and fatty alcohol chain are 606
possible for this molecule As a matter of fact this is not so surprising as more than one energy 607
minima each corresponding to a given conformation are known for glucose its non-reducing 608
derivative methylglucose and carbohydrates in general78ndash80 609
The presence of two configurations could explain the coexistence between two 610
structures of different curvature but the data presented so far do not explain the origin of these 611
two configurations In other words what drives the change in the local structure of the sugar 612
headgroup and fatty alcohol within the membrane 613
The association of known self-assembled structures to spectroscopic 13C ssNMR data is 614
known for years in particular for gluconamides lipids having a linear sugar headgroup81ndash84 It 615
25
was found that gauche effects in some cases up to the γ position in the sugar chain induce 616
upfield chemical shifts while anti and trans conformations result in downfield shifts Each 617
structure (monolayer crystal bilayer crystal or micellar fiber) was then characterized by a given 618
organization of the gluconamide and a characteristic 13C ssNMR fingerprint which could be 619
explained by gauche γ-gauche anti and trans conformations of the headgroup Similar 620
structural-spectroscopic correlations have been collected over the years for much simpler cyclic 621
sugars85 whereas pyranoses can undergo important conformational changes (chair half-chair 622
boat skew) when the appropriate energy barriers are crossed78ndash8086 A quantitative 623
conformational study based on the 13C chemical shift variations shown in Table 1 would be 624
certainly helpful but very delicate in the context of the present state of the art because a 625
rigorous approach requires at least one known crystal structure8182 which is currently missing 626
for this compound A qualitative approach will then be adopted 627
G-C181-OH is a bolaform amphiphile and flip-flop could be a possible mechanism 628
involved in the nanotube stabilization whereas head-tail interactions have long been considered 629
as important in nanotube-forming bolaform amphiphiles6063 From mere considerations based 630
on T2 (1H) relaxation arguments one could exclude head-tail configurations if the R-CH2OH 631
endgroup (H1) was involved in a direct interaction with the sugar group its corresponding T2 632
would probably be comparable to the sugarrsquos one (OH and H1rsquo) but this does not seem to be 633
the case However this hypothesis would be based on the comparison of the relaxation from 634
CH and CH2 protons additionally involved in different kind of motions Besides the relaxation 635
of H1 is influenced by the strong overlap between H1 and H5rsquo For these reasons relaxation 636
arguments are not solid enough and will not be used 637
We then address this question by exploring intermolecular interactions in a direct 638
manner using 2D 1H-1H homonuclear ssNMR correlation spectroscopy At 90degC in the fast-639
tumbling domain of molecular motion (narrow 1H NMR peaks Figure 6a) and corresponding 640
to the vesicle-rich region spin diffusion (NOESY) experiments are preferred over dipolar 641
coupling based experiments because such interaction is averaged out by molecular motion 642
However when the molecular motion is more constrained in the domain of nanotube stability 643
at 70degC (broad 1H spectra Figure 6a) Double-Quantum Single-Quantum (DQ-SQ) correlation 644
experiments are best suited to probe interaction between close molecular neighbors These 645
experiments are reported in Figure 9 and the related interpretation is only briefly reported 646
below while a more detailed discussion can be found on Page 12 in the Supporting Information 647
26
648
Figure 9 ndash a) 2D 1H-1H NOESY NMR experiment performed at MAS= 10 kHz (4 mm probe) on a Bruker 649
300 MHz Avance III HD spectrometer using 300 ms of mixing time Sample temperature is regulated to 650
90degC reached by cooling from 110degC b) 2D 1H-1H DQ-SQ (BAck-to-BAck BABA pulse sequence used for 651
the DQ excitation scheme) NMR experiment performed at MAS= 22 kHz (25 mm probe) on a Bruker 700 652
MHz Avance III spectrometer using a DQ excitation time equal to 2 rotor periods Sample temperature is 653
regulated to 70degC reached by cooling from 110degC The typical schemes illustrating how to interpret these 654
2D experiments are reported above each experimental map Zooms of the sugar region and configurational 655
interpretation are given below each 2D map More information are given in the text below 656
H16-H16
H1-H1
H9-H10
H1rsquo-H1
H1rsquoH910 H16
H1
H1rsquo-H1rsquo
Hxrsquo-Hxrsquo
2
(pp
m)
(ppm)
315
811910 1rsquo
2rsquo2
3rsquo 4rsquo6rsquo
5rsquo
1rsquo2910
asymp asymp asympHDO MeOD Acetone
1
315
811 9101rsquo
2rsquo2
3rsquo4rsquo6rsquo
5rsquo
1rsquo2 9 10
asympasympasympHDOMeODAcetone
H1rsquo-H1
1rsquo
1
(p
pm
)
(ppm)
H1-H2
H1rsquo-H1
H1rsquo
H910
H1H5rsquo
H2
H1rsquo-H5rsquo
315
811910 1rsquo
2rsquo2
3rsquo 4rsquo6rsquo
5rsquo
1rsquo2910
asymp asymp asympHDO MeOD Acetone
1
H2rsquoH3rsquoH4rsquo
H2rsquoH3rsquoH4rsquo
X= 2rsquo3rsquo4rsquo
NOESY - T= 90degC
1H
1H
1H
1H
DQ-SQ - T= 70degC
a) b)
2
(pp
m)
(p
pm
)
(ppm)
A B
AhellipB
AhellipA
BhellipB
NOESY
(ppm)
A B
AhellipB
DQ-SQ
Single-quantum dimension
Do
ub
le-q
ua
ntu
m d
imen
sio
n
AhellipA
BhellipB
BhellipA
BhellipA
315
811910 1rsquo
2rsquo2
3rsquo 4rsquo6rsquo
5rsquo
1rsquo2910
asymp asymp asympHDO MeOD Acetone
1
lt 5 Aring
lt 5 Aring
H1-H2
H811
H15
H16
H6rsquo
H1rsquo
H1
H5rsquo
H2
H1-H2
H1rsquo-H1
H1rsquo-H5rsquo
H1rsquo
H1 H5rsquo
H1rsquo
H1
H5rsquo
H1H2rsquo H3rsquo H4rsquo
H1-H1
H1rsquo-H1
Hxrsquo-HxrsquoX= 2rsquo3rsquo4rsquo
H1-H2
H1rsquo
Zoom sugar region 28 ndash 45 ppmNOESY DQ-SQ
27
Head-tail or head-head configurations could be probed by the existence of H1rsquo-H1 657
interactions whereas H1 (δH= 356 ppm) is associated to the glucolipid tail and H1rsquo (δH= 432 658
ppm) to the sugar headgroup These atoms are more than 15 Aring apart and a direct interaction 659
could not be observed in both NOESY and DQ-SQ experiments NOESY experiments (Figure 660
9a) show that H1rsquo-H1 correlations are not observed Meanwhile clear-cut direct H1rsquo-H1 661
interactions are indeed observed are detected at T= 70degC (DQ cross-peaks related to H1rsquo-H1 662
correlation in DQ-SQ experiment shown in Figure 9b) Interestingly the absence of auto peaks 663
at δH= 432 ppm and δH= 335 ppm in the SQ dimension excludes H1rsquo-H1rsquo and Hxrsquo-Hxrsquo (x= 2 664
3 4) interactions respectively strengthening the idea that sugar headgroups from two nearest-665
neighbor G-C181-OH molecules are not adjacent in the nanotube-vesicle region 666
Homonuclear 2D ssNMR supports the idea according to which G-C181-OH can 667
undergo molecular flip-flops and a head-tail arrangement in the dry product Extrapolating these 668
conclusions in the lower concentration range lack of H1rsquo-H1 proximity at T= 90degC suggests a 669
head-head configuration in the vesicle-rich region and head-tail configuration within the 670
nanotubes It is however still unclear whether flip-flops are driven by spontaneous temperature-671
induced conformational changes in the glucolipid packing stimulating inclusions within the 672
membrane itself672223629ndash1218ndash21 or by defects generated by inter-vesicle collisions In fact a 673
combination of both is not unlikely Nanotubes are not stable when temperature is 20 to 30 674
degrees above Tm1 indicating that inter-vesicle collisions alone cannot explain the unusual 675
phenomenon In an energy landscape approach87 the head-head configuration is certainly 676
favored at high temperature while both head-head and head-tail configurations could be 677
favored in the mid-temperature region corresponding to the range between Tm1 and Tm2 in the 678
dry powder Both statistical and defect-induced flip-flop events contribute to form high mean 679
zero Gaussian curvature morphologies (nanotubes) for which the head-tail conformation 680
limiting the proximity between bulky sugar headgroups is probably more adapted (Figure 8c) 681
The flip-flop interpretation now reasonably explains the strong differences in the sugar and fatty 682
alcohol conformations deduced by the multiple NMR signals attributed to chemically-683
equivalent groups The existence of various low-energy conformations each having specific 684
NMR signature for sugars in solution78ndash8086 and solid-state81ndash84 further supports our 685
interpretation 686
One last point should be clarified Why between Tm1 and Tm2 are two molecular 687
environments able to coexist instead of a single one of average rigidity as found in the case of 688
ldquoripplerdquo phases50ndash54 We believe that this question can be answered based on the NMR results 689
the relatively short T2 values of the H1rsquo and OH protons shows the constrained mobility of the 690
28
sugar headgroup despite a certain flexibility of the chain (long T2 component) This trend may 691
suggest restrictions in translational mobility probably due to the sugar-OH hydrogen bonding 692
(Figure 8c) meaning that lipids are not able to diffuse within the membrane thus keeping two 693
different configurations stable 694
695
Conclusions 696
Topologically-connected nanotube-vesicle lipidic systems are commonly observed for 697
self-assembled membranes composed of at least two amphiphiles and spontaneously driven by 698
anisotropic inclusions andor by external directional forces This work shows that strong 699
differences in membrane curvature can spontaneously occur in single-lipid systems without 700
external anisotropic forces Coexistence and interconnection between nanotubes and vesicles 701
are evidenced via cryo-TEM and fluorescence confocal microscopy in a single-phase region at 702
temperature above a transition temperature Tm1= 483degC determined by DSC on the hydrated 703
sample but below the second transition temperature Tm2 (957degC) determined by DSC on the 704
dry powder X-ray diffraction (WAXS) also shows the coexistence of two lattice periods one 705
attributed to an inter-membrane repeating distance and the other possibly related to the intra-706
nanotube glucolipid arrangement Labelling the systems with Laurdan a fluorophore of which 707
the emission strongly varies with the local membrane rigidity excludes the presence of rigid 708
micro-separated phases (eg Lβ) 709
1H and 13C ssNMR despite the fact that it can only be performed on the dry powder 710
confirm the presence of one main fluid G-C181-OH environment above Tm2 Below Tm2 the 711
splitting of some 13C peaks and the coexistence of short and long 1H relaxation components 712
demonstrate that G-C181-OH can simultaneously pack into structurally and dynamically 713
inequivalent environments Combining advanced 2D 1H-1H correlation experiments based on 714
spin diffusion or double-quanta excitation suggests that vesicles could contain a preferred head-715
head configuration of the bolaform lipid while nanotubes a preferred head-tail assembly 716
The presence of two environments composed of the same molecule characterized by 717
different molecular configurations and rigidity fulfills the theoretical conditions necessary to 718
spontaneously nucleate a membrane inclusion of non-zero average orientation described as 719
necessary to observe topologically-connected nanotube-vesicle structures in the absence of 720
external forces This hypothesis could also be enriched by the possibility of nanotubes to be 721
pulled away between two vesicles after a collision event 722
This work expands the actual theoretical and experimental framework on lipid networks 723
stabilized by a different radius of curvature It could also motivate the synthesis or isolation 724
29
of new lipids providing a higher level of 3D architectural control in soft networks possibly in 725
the range of room temperature 726
727
Acknowledgements 728
Dr Andrea Lassenberger and Dr Sylvain Preacutevost at Institut Laue Langevin (ILL Grenoble 729
France) are kindly acknowledged for their assistance on the SANS experiment Confocal 730
images were performed at the Institut de Biologie Paris Seine (IBPS) imaging facility Jean-731
Franccedilois Gilles (Imaging Core Facility Institut de Biologie Paris Seine (IBPS) CNRS 732
Sorbonne Universiteacute Paris France) is kindly acknowledged for his assistance on the confocal 733
microscopy imaging Dr Guillaume Laurent (LCMCP Sorbonne Universiteacute Paris France) is 734
kindly acknowledged for helpful discussions The French region Ile-de-France SESAME 735
program is acknowledged for financial support (700 MHz NMR 736
spectrometer) Dr Olivier Diat (ICSM Marcoule France) Prof eronikaIglič and Prof V Aleš737
onsul discussi Slovenia) are kindly acknowledged for helpfUniversity of LjubljanaIglič (-Kralj 738
739
Financial support 740
WAXS experiments have been supported by Soleil Light Source Saint Aubin France proposal 741
Ndeg 20201747 SANS experiments have been supported by ILL proposal Ndeg9-13-778 742
743
References 744
1 D Kabaso N Bobrovska W Goacuteźdź E Gongadze V Kralj-Iglič R Zorec and A 745
Iglič Bioelectrochemistry 2012 87 204ndash210 746
2 C R Safinya U Raviv D J Needleman A Zidovska M C Choi M A Ojeda-747
Lopez K K Ewert Y Li H P Miller J Quispe B Carragher C S Potter M W 748
Kim S C Feinstein and L Wilson Adv Mater 2011 23 2260ndash2270 749
3 P Veranič M Lokar G J Schuumltz J Weghuber S Wieser H Haumlgerstrand V Kralj-750
Iglič and A Iglič Biophys J 2008 95 4416ndash4425 751
4 A Rustom R Saffrich I Markovic P Walther and H-H Gerdes Science (80- ) 752
2004 303 1007ndash1010 753
5 M I Angelova S Soleacuteau P Meacuteleacuteard F Faucon and P Bothorel Prog Colloid 754
Polym Sci 1992 89 127ndash131 755
6 L Mathivet S Cribier and P F Devaux Biophys J 1996 70 1112ndash1121 756
7 V Kralj-Iglič G Gomišček J Majhenc V Arrigler and S Svetina Colloids Surfaces 757
A Physicochem Eng Asp 2001 181 315ndash318 758
30
8 V Kralj-Iglič A Iglič G Gomišček F Sevšek V Arrigler and H Haumlgerstrand J 759
Phys A Math Gen 2002 35 1533ndash1549 760
9 M Drab D Stopar V Kralj-Iglič and A Iglič Cells 2019 8 626 761
10 A Zidovska K K Ewert J Quispe B Carragher C S Potter and C R Safinya 762
Langmuir 2009 25 2979ndash2985 763
11 A Zidovska K K Ewert J Quispe B Carragher C S Potter and C R Safinya Soft 764
Matter 2011 7 8363ndash8369 765
12 A Zidovska K K Ewert J Quispe B Carragher C S Potter and C R Safinya 766
Biochim Biophys Acta - Biomembr 2009 1788 1869ndash1876 767
13 M Karlsson K Sott M Davidson A S Cans P Linderholm D Chiu and O Orwar 768
Proc Natl Acad Sci U S A 2002 99 11573ndash11578 769
14 A Karlsson R Karlsson M Karlsson A-S Cans A Stromberg F Ryttsen and O 770
Orwar Nature 2001 409 150ndash152 771
15 M Karlsson K Sott A S Cans A Karlsson R Karlsson and O Orwar Langmuir 772
2001 17 6754ndash6758 773
16 E Evans H Bowman A Leung D Needham and D Tirrell Science (80- ) 1996 774
273 933ndash935 775
17 U Seifert Configurations of fluid membranes and vesicles 1997 vol 46 776
18 J Kaumls and E Sackmann Biophys J 1991 60 825ndash844 777
19 N Bobrovska W Goacuteźdź V Kralj-Iglič and A Iglič PLoS One 2013 8 e73941 778
20 A Iglič B Babnik K Bohinc M Fošnarič H Haumlgerstrand and V Kralj-Iglič J 779
Biomech 2007 40 579ndash585 780
21 K Bohinc T Slivnik A Iglič M Brumen and V Kralj-Iglič J Phys Chem C 2007 781
111 9709ndash9718 782
22 A Iglič H Haumlgerstrand P Veranič A Plemenitaš and V Kralj-Iglič J Theor Biol 783
2006 240 368ndash373 784
23 V Kralj-Iglič and P Veranič Adv Planar Lipid Bilayers Liposomes 2006 5 129ndash785
149 786
24 A Iglic and V Kralj-Iglic Adv Planar Lipid Bilayers Liposomes 2006 4 253ndash279 787
25 S Penič L Mesarec M Fošnarič L Mroacutewczyńska H Haumlgerstrand V Kralj-Iglič and 788
A Iglič Front Phys 2020 8 342 789
26 P Yager and P E Schoen Mol Cryst Liq Cryst 1984 106 371ndash381 790
27 T G Barclay K Constantopoulos and J Matisons Chem Rev 2014 114 10217ndash791
10291 792
31
28 B Božič G Gomišček V Kralj-Iglič S Svetina and B Žekš Eur Biophys J 2002 793
31 487ndash496 794
29 A Iglič H Haumlgerstrand M Bobrowska-Haumlgerstrand V Arrigler and V Kralj-Iglič 795
Phys Lett A 2003 310 493ndash497 796
30 R Bar-Ziv and E Moses Phys Rev Lett 1994 73 1392ndash1395 797
31 S Chiruvolu H E Warriner E Naranjo S H Idziak J O Raumldler R J Plano J A 798
Zasadzinski and C R Safinya Science (80- ) 1994 266 1222ndash1225 799
32 V Kralj-Iglič A Iglič H Haumlgerstrand and P Peterlin Phys Rev E 2000 61 4230ndash800
4234 801
33 L Mesarec M Drab S Penič V Kralj-Iglič and A Iglič Int J Mol Sci 2021 22 802
2348 803
34 L Van Renterghem S L K W Roelants N Baccile K Uyttersprot M C Taelman 804
B Everaert S Mincke S Ledegen S Debrouwer K Scholtens C V Stevens W 805
Soetaert L Van Renterghem S L K W Roelants N Baccile K Uytersprot M C 806
Taelman B Everaert S Mincke S Ledegen S Debrouwer K Scholtens C V 807
Stevens and W Soetaert Biotechnol Bioeng 2018 115 1195ndash1206 808
35 J Clark and F Deswarte Introduction to Chemicals from Biomass Second Edition 809
John Wiley amp Sons 2015 810
36 K V Sajna R Houmlfer R K Sukumaran L D Gottumukkala and A Pandey in 811
Industrial Biorefineries and White Biotechnology eds A Pandey R Houmlfer M 812
Taherzadeh K M Nampoothiri and C Larroche Amsterdam Oxford Waltham 813
Elsevier 2015 pp 499ndash521 814
37 R Marchant and I M Banat Trends Biotechnol 2012 30 558ndash565 815
38 K Hill and C LeHen-Ferrenbach in Sugar-Based Surfactants Fundamentals and 816
Applications ed C C Ruiz Boca Raton CRC Press 2009 pp 1ndash20 817
39 L Rodrigues I M Banat J Teixeira and R Oliveira J Antimicrob Chemother 818
2006 57 609ndash618 819
40 J D Desai and I M Banat Microbiol Mol Biol Rev 1997 61 47ndash64 820
41 S L K W Roelants K Ciesielska S L De Maeseneire H Moens B Everaert S 821
Verweire Q Denon B Vanlerberghe I N A Van Bogaert P Van der Meeren B 822
Devreese and W Soetaert Biotechnol Bioeng 2016 113 550ndash559 823
42 N Baccile M Selmane P Le Griel S Preacutevost J Perez C V Stevens E Delbeke S 824
Zibek M Guenther W Soetaert I N A Van Bogaert and S Roelants Langmuir 825
2016 32 6343ndash6359 826
32
43 N Baccile A-S Cuvier S Preacutevost C V Stevens E Delbeke J Berton W Soetaert 827
I N A Van Bogaert and S Roelants Langmuir 2016 32 10881ndash10894 828
44 N Baccile C Seyrig A Poirier S A Castro S L K W Roelants and S Abel Green 829
Chem 2021 23 3842ndash3944 830
45 A Salis L Cappai C Carucci D F Parsons and M Monduzzi J Phys Chem Lett 831
2020 11 6805ndash6811 832
46 J Schindelin I Arganda-Carreras E Frise V Kaynig M Longair T Pietzsch S 833
Preibisch C Rueden S Saalfeld B Schmid J-Y Tinevez D J White V 834
Hartenstein K Eliceiri P Tomancak and A Cardona Nat Methods 2012 9 676ndash835
682 836
47 T Parasassi and E Gratton J Fluoresc 1995 5 59ndash69 837
48 M M Dodes Traian F L Gonzaacutelez Flecha and V Levi J Lipid Res 2012 53 609ndash838
616 839
49 D M Owen C Rentero A Magenau A Abu-Siniyeh and K Gaus Nat Protoc 840
2012 7 24ndash35 841
50 W Stillwell in An Introduction to Biological Membranes Academic Press 2016 pp 842
135ndash180 843
51 W Stillwell in An Introduction to Biological Membranes Academic Press 2016 pp 844
181ndash220 845
52 B Tenchov Chem Phys Lipids 1991 57 165ndash177 846
53 R Koynova and M Caffrey Biochim Biophys Acta 1998 1376 91ndash145 847
54 F Schmid S Dolezel O Lenz and S Meinhardt J Phys Conf Ser 2014 487 848
012004 849
55 S Meinhardt R L C Vink and F Schmid Proc Natl Acad Sci U S A 2013 110 850
4476ndash4481 851
56 O Glatter and O Kratky Small Angle X-ray Scattering Academic Press London 852
1982 853
57 B A Cunningham A D Brown D H Wolfe W P Williams and A Brain Phys 854
Rev E 1998 58 3662ndash3672 855
58 M Nadler A Steiner T Dvir O Szekely P Szekely A Ginsburg R Asor R Resh 856
C Tamburu M Peres and U Raviv Soft Matter 2011 7 1512ndash1523 857
59 C Tanford The hydrophobic effect Formation of micelles and biological membranes 858
John Wiley amp Sons Inc New York 1973 859
60 M Masuda and T Shimizu Langmuir 2004 20 5969ndash5977 860
33
61 A Zidovska K K Ewert J Quispe B Carragher C S Potter and C R Safinya 861
Block Liposomes Vesicles of Charged Lipids with Distinctly Shaped Nanoscale 862
Sphere- Pear- Tube- or Rod-Segments Elsevier Inc 1st edn 2009 vol 465 863
62 A Iglic V Kralj-Iglic B Božič M Bobrowska-Haumlgerstrand B Isomaa and H 864
Haumlgerstrand Bioelectrochemistry 2000 52 203ndash211 865
63 T Shimizu M Masuda and H Minamikawa Chem Rev 2005 105 1401ndash1444 866
64 J V Selinger and J M Schnur Phys Rev Lett 1993 71 4091ndash4094 867
65 J M Schnur Science (80- ) 1993 262 1669ndash1676 868
66 B Tenchov R Koynova and G Rapp Biophys J 2001 80 1873ndash1890 869
67 R Koynova and B Tenchov Ser Biomech 2017 31 3ndash19 870
68 S J Angyal and R Le Fur Carbohydr Res 1984 126 15ndash26 871
69 J K Whitesell and M A Minton J Am Chem Soc 1987 109 225ndash228 872
70 T Takayama S Ando and I Ando J Mol Struct 1990 220 245ndash250 873
71 K Gawrisch N V Eldho and I V Polozov Chem Phys Lipids 2002 116 135ndash151 874
72 F Tielens C Gervais J F Lambert F Mauri and D Costa Chem Mater 2008 20 875
3336ndash3344 876
73 G A Jeffrey and Y Yeon Acta Crystallogr Sect B 1986 42 410ndash413 877
74 B Berglund and R W Vaughan J Chem Phys 1980 73 2037ndash2043 878
75 C Gervais C Coelho T Azaiumls J Maquet G Laurent F Pourpoint C Bonhomme 879
P Florian B Alonso G Guerrero P H Mutin and F Mauri J Magn Reson 2007 880
187 131ndash140 881
76 C Akita T Kawaguchi F Kaneko H Yamamoto and M Suzuki J Phys Chem B 882
2004 108 4862ndash4868 883
77 R N Purusottam L Seacutenicourt J J Lacapegravere and P Tekely Biochim Biophys Acta - 884
Biomembr 2015 1848 3134ndash3139 885
78 X Biarneacutes A Ardegravevol A Planas C Rovira A Laio and M Parrinello J Am Chem 886
Soc 2007 129 10686ndash10693 887
79 L M J Kroon‐Batenburg and J Kroon Biopolymers 1990 29 1243ndash1248 888
80 K N Kirschner and R J Woods Proc Natl Acad Sci U S A 2001 98 10541ndash889
10545 890
81 S Svenson B Kirste and J H Fuhrhop J Am Chem Soc 1994 116 11969ndash11975 891
82 I Sack S Macholl J H Fuhrhop and G Buntkowsky Phys Chem Chem Phys 892
2000 2 1781ndash1788 893
83 S Svenson J Koening and J H Fuhrhop J Phys Chem 1994 98 1022ndash1028 894
34
84 S Svenson A Schaefer and J H Fuhrhop J Chem Soc Perkin Trans 2 1994 2 895
1023ndash1028 896
85 K Bock and C Pedersen Adv Carbohydr Chem Biochem 1983 41 27ndash66 897
86 T B Grindley Structure and Conformation of Carbohydrates Springer Berlin 898
Heidelberg 2008 899
87 F Tantakitti J Boekhoven X Wang R V Kazantsev T Yu J Li E Zhuang R 900
Zandi J H Ortony C J Newcomb L C Palmer G S Shekhawat M O De La 901
Cruz G C Schatz and S I Stupp Nat Mater 2016 15 469ndash476 902
903
1
Supporting Information 904
905
Topological connection between vesicles and nanotubes in single-906
component lipid membranes driven by head-tail interactions 907
908
Niki Baccilea Ceacutedric Lorthioira Abdoul Aziz Baa Patrick Le Griela Cristina Coelhob Javier 909
Perezc Wim Soetaertd Sophie L K W Roelantsd 910
911
a Sorbonne Universiteacute Centre National de la Recherche Scientifique Laboratoire de Chimie de 912
la Matiegravere Condenseacutee de Paris LCMCP F-75005 Paris France 913
b Institut des Mateacuteriaux de Paris Centre Sorbonne Universiteacute Paris France 914
c Synchrotron Soleil LrsquoOrme des Merisiers Saint-Aubin BP48 91192 Gif-sur-Yvette Cedex 915
France 916
d InBio Department of Biotechnology Ghent University Ghent Belgium 917
918
919
Corresponding author 920
Dr Niki Baccile 921
E-mail address nikibaccilesorbonne-universitefr 922
Phone +33 1 44 27 56 77 923
924
925
926
2
a) 927
Parameter Method
Dry Matter (DM ) 996 Infrared balance 105degC
Glucose () 012 HPLC-Metacarb
Glycerol () nd HPLC-Metacarb
Free Fatty Acid content () lt001 Internal method BBEPP
GC with FID Detector
Oil () lt001 Internal method BBEPP
GC with FID Detector
Moulds (CFUg) lt10 3M-Nordval ndeg16 B
Yeasts (CFUg) lt10 3M-Nordval ndeg16 B
Anaerobic count (CFUg) lt10 SP-VG M005 B
Protein () tbd BCA protein assay
928
Figure S 1 - a) HPLC-ELSD chromatogram and composition table 929
930
931
932
933
3
b) 934
935
Group Ndeg δ ppm
CH2 1 354
CH2 2 153
CH2 3-712-14 132
CH2 811 203
CH 910 534
CH2 15 162
CH2 16 388
CH 1 424
CH 2 316
CH 3 334
CH 4 329
CH 5 354
CH2 6 366
Figure S 1 (next) ndash b) 1H NMR spectrum (MeOD-d4) recorded on the purified G-C181-OH compounds 936
and related assignment 937
938
2
811910 1rsquo
5rsquo1
3rsquo4rsquo
1rsquo1910
asymp asymp asympHDO MeOD Acetone
6rsquo2rsquo
1615
3-712-14
4
939
940
Figure S 2 ndash Cryo-TEM images recorded for a 5 mgmL G-C181-OH aqueous solution heat at T= 130degC 941
5
942
943
Figure S 3 - Cryo-TEM images recorded for a 5 mgmL G-C181-OH aqueous solution heat at T= 90degC 944
945
90degC
1
22
6
946
947
948
949
Figure S 4 ndash Cryo-TEM images recorded for a 5 mgmL G-C181-OH aqueous solution heat at T= 70degC 950
951
21
11
1
2
5
3
4
45
5
6
7
7
7
952
953
954
Figure S 5 ndash Cryo-TEM images recorded for a 5 mgmL G-C181-OH aqueous solution heat at T= 25degC 955
956
957
1
1 1
8
958
Figure S 6 ndash a) SANS experiment recorded at 90degC for a 5 mgmL G-C181-OH aqueous solution b-c) 959
WAXS experiments recorded on aqueous solutions of G-C181-OH at b) 5 mgmL and c) 25 mgmL d) 960
Structural interpretation of the repeating distances pointed out in c) 961
962
963
964
001 01 1
q Aring-1
25degC
68degC
88degC
111degC
01 1q Aring
-1
02 04 06 08 1q Aring
-1
001 01
10-1
100
101
Inte
nsity
cm
-1
q Aring-1
-2
T= 90degC
SANS WAXS WAXS
a) b) c)
dv
dL d= 144 Aring-1
di
ddH2O
dt
dvdL
dtdi d
d)
9
965
966
Figure S 7 ndash ssNMR MAS (10 kHz) experiments recorded on a G-C181-OH dry powder a) 1H spectra 967
recorded from 110degC to 70degC b) 13C single pulse (SP) spectra recorded with high power 1H decoupling from 968
110degC to 70degC c) 13C cross polarization (CP) spectra recorded at 110degC and contact time tc of 50 micros and 969
3000 micros d) 13C CP spectra recorded at 70degC and for 20 lt tc micros lt 3000 970
971
1
811
910
CH2 CH2
1rsquo
6rsquo
8 6 4 2 0 ppm
110
90
80
70
910
1rsquo
6rsquo16
1
2rsquo3rsquo4rsquo
811
OH
45 40 35 30 25 20 15
ppm
200 180 160 140 120 100 80 60 40 20 0
ppm140 120 100 80
ppm
CH2-gauche
3004
110
90
80
70
65
60
50
25
C91013003
C9 - 12869
CH2-all-trans
3198
C1rsquo10335
a) b)
1H
T degCT degC
13C Single Pulse MAS
A
B
A
B
70degC70degC
5rsquo
215
200 180 160 140 120 100 80 60 40 20 0
ppm
13C CPMAST= 110degC
200 180 160 140 120 100 80 60 40 20 0
ppm
132 131 130 129 128 127 126
ppm
106 105 104 103 102
ppm
13C CPMAST= 70degC
50
tc micros
3000
20
tc micros
50 500 1000 3000
tc micros
C102
13024 C910113003
C92
12869
C1rsquo213082
C1rsquo110443
A B
106 105 104 103 102
ppm
3000
1000
500
50
20
AB
c)
d)
10
972
Figure S 8 ndash a) Short and d) long T2 components displayed by the 1H transverse relaxation signal c) 1H 973
transverse relaxation signals recorded on a G-C181-OH dry powder from 110degC to 70degC The area of each 974
given resonance is plotted (log-lin) as a function of the echo time (CPMG pulse sequence) for each 975
temperature and fitted using the equation given above T2s and T2l indicate the short and long T2 relaxation 976
times respectively obtained by describing the 1H transverse relaxation signal using a biexponential decay 977
For H1rsquo H5rsquo and H6rsquo the 1H relaxation function could be described by a monoexponential decay 978
- Protons from the sugar group (H1rsquo H5rsquo H6rsquo) show a single T2 relaxation component (Figure 979
6c and Figure S 8) while protons of the acyl chain (CH2 H910 H811) show both short (Figure 980
6c) and long (Figure 6d) T2 relaxation component 981
- The short T2 relaxation time systematically decreases from 110degC to 70degC for all species by a 982
factor ranging from two to seven depending on the specific chemical group Very long T2 are 983
observed at 110degC for all acyl species while nearly unchanged values are measured below 984
90degC without any clear trend 985
- The sugar protons (H1rsquo H5rsquo H6rsquo) have the shortest set of T2 values (lt 1 ms) below 100degC 986
The long component of T2 generally ranges between 4 ms and 12 ms 987
0 1 2 3 4 5 6 7 8
00
05
10
15
20
25
30
35
40
45
Log
In
ten
sity
Time ms
0 1 2 3 4 5 6 7 8
00
05
10
15
20
25
30
35
40
45
Log
In
ten
sity
Time ms
0 1000 2000 3000 4000 5000 6000 7000 8000
00
05
10
15
20
25
30
35
40
45
Log
In
ten
sity
Time ms
0 1000 2000 3000 4000 5000 6000 7000 8000
00
05
10
15
20
25
30
35
40
45
Log
In
ten
sity
Time ms
0 1000 2000 3000 4000 5000 6000 7000 8000
00
05
10
15
20
25
30
35
40
45
Log
In
ten
sity
Time ms
0 1000 2000 3000 4000 5000 6000 7000 8000
00
05
10
15
20
25
30
35
40
45
Log
In
ten
sity
Time ms
H1
H8H11
H9H10
CH2
H1rsquo
H6rsquo
CH2
H910H811 H1CH2
H1rsquo H5rsquo6rsquo
0 1000 2000 3000 4000 5000 6000 7000 8000
00
05
10
15
20
25
30
35
40
45
Log
In
ten
sity
Time ms
OH
0 1000 2000 3000 4000 5000 6000 7000 8000
00
05
10
15
20
25
30
35
40
45 T= 110degC
T= 90degC
T= 80degC
T= 70degC
Log
In
ten
sity
Time ms
Fit
)
CH2 H910 H811 H1 H56 H1 OH
00
05
10
15
20
25
30
35
40
T2 m
s
T= 110degC
T= 90degC
T= 80degC
T= 70degC
CH2 H910 H811 H1
0
2
4
6
8
10
12
T2 m
s
T= 110degC
T= 90degC
T= 80degC
T= 70degC
Short T2(1H) Long T2(1H)
a) b)
c)
11
Table S 1 ndash 1H chemical shifts of G-C181-OH in solution and in the solid-state Solid-state spectra are 988
recorded at a MAS frequency of 10 kHz in DMSO-d6 broad peak 989
990
δH ppm
Group Ndeg Liquid
(MeOD-d4) Solid
(T= 110degC) Solid
(T= 70degC)
CH2 H1 354 357
CH2 H2 153 156
CH2 H3-712-14 132 135
CH2 H811 203 203
CH H910 534 534
CH2 H15 162 164
CH2 H16 388 383
CH H1 424 432
CH H2 316 335
CH H3 334 335
CH H4 329 335
CH H5 354 351 357
CH2 H6 366 383
OH OH1 432
45 463
OH OH2 492
OH OH3 490
OH OH4 487
OH OH6 445
991
992
H1H9H10H1rsquo
H6rsquo
OH2rsquo
OH1
12
Detailed discussion about the NOESY and DQ-SQ 2D 1H-1H ssNMR experiments presented in 993
Figure 9 994
995
2D 1H-1H ssNMR experiments are a unique tool to explore through-space proximities 996
between 1H nuclei ssNMR offers a large number of possibilities each adapted to a given 997
system The advantage of 2D maps with respect to a dynamics approach is their direct 998
readability in clear two nuclei which exchange their magnetization through-space (whichever 999
mechanism may be responsible for this exchange) will display a specific cross-peak However 1000
the way cross-peaks are presented and interpreted strictly depends on the nature of the pulse 1001
program which in turn is chosen according to the physical nature of the sample 1002
1D temperature-dependent 1H NMR experiments performed on G-C181-OH (Figure 1003
4a in the main text) indicate sharp peaks at 90degC and broad peaks at 70degC Narrow peaks 1004
indicate fast andor large-amplitude molecular tumbling averaging the strong 1H-1H dipolar 1005
interactions This excludes the use of pulse sequences like DQ-SQ which is not efficient under 1006
these conditions For this reason we employ spin-diffusion-based pulse sequences like 1007
NOESY which is more adapted for samples with high molecular mobility When mixing times 1008
are chosen to be short (lt 1 s) one generally explores through-space proximities within about 5 1009
10 Aring On the contrary when molecular motions are restricted dipolar coupling becomes 1010
significant 1H NMR peaks are broader and pulse sequences like DQ-SQ can now be used 1011
with a spatial resolution of less than 5 Aring 1012
Whenever possible DQ-SQ experiments are preferred over spin diffusion-based pulse 1013
sequences because they are more selective in particular for likewise interactions which are 1014
not discriminated in NOESY-type experiments This is illustrated by the typical interaction 1015
schemes for NOESY (top Figure 9a) and DQ-SQ (top Figure 9b) For two given A and B 1016
protons 2D NOESY maps will display two on-diagonal and two square-shaped symmetrical 1017
off-diagonal cross-peaks Off-diagonal cross-peaks illustrate the mutual A-B and B-A 1018
interaction but the on-diagonal peaks are systematic and do not prove any A-A or B-B 1019
interaction Similarly to NOESY 2D DQ-SQ maps display off-diagonal peaks (symmetric 1020
across the diagonal top Figure 9b) upon A-B and B-A interaction but in contrast they will 1021
display on-diagonal peaks only in the presence of self-interaction In the tutorial example of 1022
Figure 9b top the on-diagonal A-A peak indicates mutual A-A interaction while lack of on-1023
diagonal B-B peak evidences the absence of B-B proximities Combining NOESY and DQ-SQ 1024
experiments is capital to study the local arrangement of G-C181-OH and its evolution with 1025
temperature 1026
13
At T= 90degC the H1 and H5rsquo contributions are very close but possible to discriminate 1027
them (δ(H1)= 354 ppm δ(H5rsquo)= 351 ppm) according to 1H NMR chemical shifts in Table S 1028
1 2D 1H-1H NOESY in Figure 9a also discriminates between the two components attributed 1029
on the basis of the interactions with their mutual neighbors (green H1-H2 and H5rsquo-H1rsquo squares 1030
in Figure 9a) On this basis 2D NOESY does not show a direct H1rsquo-H1 correlation (blue red-1031
crossed) but rather an extensive network of intra-sugar interactions These features exclude 1032
suggest intra- and inter-sugar interactions and they exclude head-tail arrangements as a major 1033
molecular configuration at 90degC 1034
At 70degC the 1H NMR peaks are broader indicating a reduction of the T2 (1H) relaxation 1035
times andor residual homonuclear dipolar interactions excluding the use of NOESY In this 1036
case 1H-1H DQ-SQ correlation experiments are best suited Figure 9b presents the 1H-1H DQ-1037
SQ experiment on G-C181-OH at 70degC Peaks are broader than in NOESY and attribution may 1038
be cumbersome However the experiment is performed at 700 MHz and MAS= 22 kHz which 1039
improves spectral resolution with respect to the same experiment performed at 300 MHz and 1040
MAS= 10 kHz The auto-peak at δH= 356 ppm in the SQ dimension is attributed to H1-H1 spin 1041
pairs mainly resulting from intra CH2 interaction while the DQ cross-peaks at δH= 156-356 1042
ppm and δH= 432-356 ppm respectively origin from H2-H1 and H1rsquo-H1 interactions (Figure 1043
9b) DQ-SQ map does not show any auto-peak corresponding to H1rsquo-H1rsquo or Hxrsquo-Hxrsquo (x= 2rsquo 1044
3rsquo 4rsquo) interactions (red-crossed blue Figure 9b) thus excluding any proximity (lt 5 Aring) between 1045
close glucose neighbors On the contrary DQ-SQ maps (recorded both at 700 MHz Figure 9b 1046
or at 300 MHz not shown) systematically show DQ cross-peaks which can only be attributed 1047
to H1rsquo-H1 interactions (δH= 432-356) The presence of these H1rsquo-H1 interactions can only be 1048
explained by a head-tail arrangement of the G-C181-OH molecules as illustrated below the 1049
DQ-SQ map in Figure 9b 1050

2
Abstract 18
Lipid nanotube-vesicle networks are important channels for intercellular communication and 19
transport of matter Experimentally observed in neighboring mammalian cells but also 20
reproduced in model membrane systems a broad consensus exists on their formation and 21
stability Lipid membranes must be composed of at least two components each stabilizing low 22
(generally a phospholipid) and high curvatures Strong anisotropy or enhanced conical shape 23
of the second amphiphilic component is crucial for the formation of nanotunnels Anisotropic 24
driving forces generally favor nanotube protrusions from vesicles In the present work we 25
report the unique case of topologically-connected nanotubes-vesicles obtained in the absence 26
of directional forces in single-component membranes composed of an anisotropic bolaform 27
glucolipid above its melting temperature Tm Cryo-TEM and fluorescence confocal 28
microscopy show the interconnection between vesicles and nanotubes in a single-phase region 29
between 60deg and 90degC under diluted conditions Solid-state NMR necessarily recorded on the 30
dry powder yet demonstrates that the glucolipid can simultaneously assume two distinct 31
configurations head-head and head-tail These arrangements seemingly of comparable energy 32
above the Tm could explain the existence and stability of the topologically-connected vesicles 33
and nanotubes which are generally not observed for classical single-component phospholipid-34
based membranes above their Tm 35
36
Keywords Nanotube vesicle networks Tunnelling nanotubes Block liposomes Liposomes 37
Lipid nanotubes Biosurfactants Microbial glycolipids 38
39
Introduction 40
Topological connections between closed lipidic compartments through nanotubes1ndash3 41
have been shown to play a crucial role in the transfer of matter and communication in 42
neighboring mammalian cells4 These singular nanosystems observed since the lsquo90s as 43
spontaneous non-equilibrium structures in electroformed model liposome membranes56 have 44
since been largely studied both experimentally and theoretically7ndash9 Addressed in the literature 45
by different terms tunnelling nanotubes (TNT)149 block liposomes10ndash12 or nanotube-vesicle 46
networks13ndash16 (instead of tubes some work speak of tethers617) all refer to a similar 47
phenomenon driven by various internal or external forces The latter must overcome the energy 48
barrier needed to bend a phospholipid bilayer from low positive mean and gaussian curvatures 49
(vesicle) to a high mean and zero Gaussian (tube) curvatures 50
3
A large body of both experimental and theoretical work has shown that budding and 51
eventual nanotube formation from an existing membrane can only occur spontaneously for 52
membranes of at least two-components9102425111218ndash23 and below a vesicle-nanotube phase 53
transition event2627 Otherwise external anisotropic driving forces like electroformation5ndash54
82829 osmotic pressure6 laser ldquotweezersrdquo30 or electrodynamics13ndash16 must be employed to obtain 55
similar results with in some cases an impressive degree of 2D and 3D organization13ndash16 The 56
origin of spontaneous nanotube formation has been shown to be related to a nanoscale phase 57
separation between two membrane components stabilizing low and high curvatures 58
respectively10ndash1231 with at least one component being highly anisotropic203233 Theoretically 59
this behavior has been explained by deviations in the elastic properties of membranes due to in-60
plane orientational ordering of membrane inclusions composed of anisotropic amphiphiles 61
these referring to a non-symmetrical shape upon a 90deg tilt along the amphiphile axis8919242533 62
In this work we show unexpected nanotubing of membranes prepared from a single-63
component lipid in the absence of external directional forces and above the lipidrsquos Tm This 64
phenomenon is observed for a novel anisotropic double amphiphile (bolaform amphiphile or 65
bolaamphiphile) a glucolipid composed of β-D-glucose and a C181-cis fatty alcohol (G-66
C181-OH Figure 1) This compound is obtained by microbial fermentation of a genetically-67
modified S bombicola yeast in the presence of oleyl alcohol34 and is developed in the broader 68
context of extending the library of new biobased surfactants and lipids in view of replacing 69
petrochemical low molecular weight amphiphiles35ndash41 The structure of G-C181-OH is 70
analogous to that of other microbial glycolipids developed through genetic engineering4243 71
Topological connections between nanotubes and vesicles are observed by means of 72
cryogenic transmission electron microscopy (cryo-TEM) fluorescence microscopy and wide 73
angle X-ray scattering (WAXS) above the melting temperatures Tm= 483degC under strong 74
dilution (05 wt) Spin diffusion and 1H double-quantum single-quantum (DQ-SQ) 2D solid-75
state nuclear magnetic resonance (ssNMR) spectroscopy under magic angle spinning (MAS) 76
necessarily performed on the dry glucolipid powder provides a spectroscopic ground to 77
understand the vesicle-nanotube coexistence The bolaform glucolipids could be in a head-78
headtail-tail configuration in the vesicles but rather in a head-tail configuration in the 79
nanotubes In the dry glucolipid both configurations are energetically comparable in the single-80
phase region above Tm and their coexistence is evidenced by the splitting of some 13C NMR 81
signals These facts could explain the stability of nanotubes while the following hypotheses are 82
formulated for their formation membrane inclusions with different orientational ordering13ndash16 83
possibly driven by inter-vesicle collisions 84
4
85
86
87
88
89
Figure 1 ndash Non acetylated C181 alcohol glucoside G-C181-OH is obtained by a bioprocess performed 90
with modified S bombicola yeast 91
92
Experimental Section 93
Synthesis of non acetylated C181 Alcohol Glucosides (G-C181-OH) G-C181-OH (Mw= 94
41856 gmol-1) was produced by aerobic whole cell bioprocess with a modified S bombicola 95
strain as described by Van Renterghem et al (Fig S4 in Ref 34) The molecule was purchased 96
from the Bio Base Europe Pilot Plant (Gent Belgium) and has the generalized chemical 97
structure given in figure Figure 1 The HPLC and 1H NMR spectrum (MeOD-d4) with peak 98
assignment are shown in Figure S 1 High purity levels (99) and high degree of uniformity 99
were obtained as can be derived from HPLC-ELSD chromatogram 1H NMR and table of 100
contaminant given in Figure S 1 101
102
1H solution Nuclear Magnetic Resonance (NMR) 1H solution NMR experiments were 103
performed on a Bruker Avance III 300 spectrometer using a 5 mm 1H-X BBFO probe using 104
methanol-d4 as solvent The number of transients is 8 with 3 s recycling delay an acquisition 105
time of 546 s and a receiver gain of 362 The 1H NMR spectrum and relative assignment are 106
shown in Figure S 1 and Table S 1 13C solution NMR were performed on the same probe using 107
DMSO-d6 Corresponding chemical shifts are given in Table 1 Referencing is done with 108
respect to TMS δ1H= 0 ppm δ13C= 0 ppm 109
110
Sample preparation The sample was dissolved in milliQ-grade water at the concentration of 5 111
mgmL (05 wt) Lack of pH-sensitive probes (eg COOH groups) in G-C181-OH as 112
otherwise found in other microbial amphiphiles44 but also the will to avoid ion-specific 113
effects45 exclude the use of buffer The solution was heat at the given temperature using a CH3-114
150 Combitherm-2 dry block heating device For the cryo-TEM experiments the vials were 115
heat at the given temperature next to the cryofixation device and plunged into liquid ethane as 116
fast as possible For temperatures of 25degC and 70degC the sample was heat at 90degC and then 117
Synthesis path
5
cooled at to the desired temperature For the SAXS experiment the sample was heat at 90degC in 118
the block heating device and cooled at to 25degC before analysis For the SANS experiment the 119
sample was heat at 90degC directly in front of the beam using the thermalized sample holder 120
available 121
122
Differential Scanning Calorimetry (DSC) DSC was performed using a DSC Q20 apparatus 123
from TA Instruments equipped with the Advantage for Q Series Version acquisition software 124
(v540) Acquisition was performed on both hydrated and dry powder sample (~ 3-5 mg) sealed 125
in a classical aluminium cup and using an immediate sequence of heating and cooling ramps at 126
a rate of 10degCmin-1 Melting temperatures Tm 1 and 2 Tm1 and Tm2 were taken at the minimum 127
of the endothermic peak 128
129
Small and Wide Angle Scattering experiments Small angle neutron scattering (SANS) 130
experiments were performed at the D11 beamline of Institut Laue Langevin (Grenoble France) 131
during the run No 9-13-778 Four q-ranges have been explored and merged using the following 132
wavelengths λ and sample-to-detector (StD) distances 1) ultra-low q λ= 135Aring StD= 39 m 133
2) low-q λ= 53Aring StD= 39 m 3) mid-q λ= 53Aring StD= 8 m 4) high-q λ= 53Aring StD= 14 m 134
The sample (C= 5 mgmL-1) was prepared in 999 D2O to limit the incoherent background 135
scattering The sample solution was analyzed in standard 1 mm quartz cells Direct beam empty 136
quartz cell H2O (incoherent scatterer) within the quartz cell were recorded and boron carbide 137
(B4C) was used as neutron absorber The sample acquisition was measured at 90degC where 138
temperature was controlled through the controller thermalized sample holder available at the 139
beamline The background sample (D2O) signal was subtracted from the experimental data 140
Absolute values of the scattering intensity were obtained from the direct determination of the 141
number of neutrons in the incident beam and the detector cell solid angle The 2D raw data were 142
corrected for the ambient background and empty cell scattering and normalized to yield an 143
absolute scale (cross section per unit volume) by the neutron flux on the samples The data were 144
then circularly averaged to yield the 1D intensity distribution I(q) The software package Grasp 145
(developed at ILL and available free of charge) was used to integrate the data while the 146
software package SAXSUtilities (developed at ESRF and available free of charge) was used to 147
merge the data acquired at all configurations and subtract the background 148
Wide-angle X-ray scattering (WAXS) was performed under temperature control at the 149
SWING beamline of SOLEIL synchrotron facility (Saint-Aubin France) during the run 150
20201747 (energy 14 keV sample-to-detector distance 05 m) Two sample concentrations in 151
6
H2O were probed C= 5 mgmL-1 and C= 25 mgmL-1 The 2D data were integrated azimuthally 152
at the beamline using the software Foxtrot and in order to obtain the I(q) vs q spectrum after 153
masking the beam stop shadow Silver behenate (d(100) = 5838 Aring) was used as a standard to 154
calibrate the q-scale Sample solutions were inserted in borosilicate capillaries of 15 mm in 155
diameter Capillaries were flame-sealed A capillary oven with controlled temperature (plusmn 05degC) 156
provided at the beamline was used to control the sample temperature between 25degC and 111degC 157
Data were normalized by the transmission and calibrated to the SAXS signal of H2O at large q-158
values (I= 00163 cm-1) in order to obtain an absolute intensity scale The water signal was 159
measured by subtracting the signal of the empty capillary from the signal of a water-filled 160
capillary The signal of (water + capillary) was used as background for the samples and it was 161
subtracted after integration of the 2D data 162
163
Cryogenic transmission electron microscopy (cryo-TEM) Cryo-TEM experiments were carried 164
out on an FEI Tecnai 120 twin microscope operating at 120 kV and equipped with a Gatan 165
Orius CCD numeric camera The sample holder was a Gatan Cryoholder (Gatan 626DH 166
Gatan) Digital Micrograph software was used for image acquisition Cryofixation was 167
performed using a homemade cryofixation device The solutions were deposited on a glow-168
discharged holey carbon coated TEM copper grid (Quantifoil R22 Germany) Excess solution 169
was removed and the grid was immediately plunged into liquid ethane at -180degC before 170
transferring them into liquid nitrogen All grids were kept at liquid nitrogen temperature 171
throughout all experimentation Cryo-TEM images have been treated and analyzed using Fiji 172
(is just ImageJ) software available free of charge at the developerrsquos website46 173
The samplersquos concentration was C= 5 mgmL-1 For technical reasons the temperature 174
during cryofixation could not be controlled For this reason the temperature associated with 175
each cryo-TEM image in the text was related to the equilibration temperature just before 176
cryofixation the device being as close as possible to the dry bath used for temperature control 177
Since temperature control during cryofixation was not possible in our device and practically 178
impossible at high temperatures one should take the T values as indicative of the given value 179
Although the sample transfer between the dry bath and the cryofixation device was performed 180
as fast as possible it is more than likely that the actual temperature of the sample at the moment 181
of cryofixation was lower than the one indicated here although impossible to know precisely 182
183
7
Fluorescence microscopy Images were recorded using a 40x objective on a Leica SP5 upright 184
confocal microscope with 405 nm laser excitation The sample was marked with 6-dodecanoyl-185
NN-dimethyl-2-naphthylamine (Laurdan Mw= 35354 gmol-1) fluorophore as follows A 186
stock solution of 3 mg of Laurdan in 100 microL of acetone was initially prepared (C= 30 mgmL-187
1) A volume of 028 microL of the stock Laurdan solution was diluted in 1 mL of a 5 mgmL-1 G-188
C181-OH water solution temporary set at 110degC in a sealed Eppendorf The latter was 189
important so to enhance inclusion of Laurdan in the membrane constituted by the glucolipid 190
while in its vesicle phase The final Laurdan concentration was approximately 24 micromol with a 191
molar Laurdan-to-G-C181-OH molar ratio of approximately 1-to-500 Fluorophore-to-lipid 192
ratios above 1200 were generally considered as non-interfering with the lipid phase behavior 193
as also verified in this work 194
Laurdan can be excited between 365 nm and 410 nm and its emission wavelength can 195
vary according to the rigidity of the membrane intercalation within a rigid or flexible 196
membrane generates emissions at 440 nm or 490 nm respectively47 In the present experiment 197
we have flame-sealed a solution of G-C181-OH at 5 mgmL-1 containing Laurdan (1-to-500 in 198
lipid-to-Laurdan ratio) in flat optical capillaries of 01 mm thickness Capillaries were set on a 199
Linkam support for temperature control eventually placed under the microscope The sample 200
was excited at 405 nm and detection was made in spectral mode with a 5 nm window sliding 201
every 5 nm from 412 nm to 602 nm in 16 bits which allows quantify the signal and compare 202
the different conditions Quantitative analysis was performed according to the literature4849 203
several ROI (range of interest) have been drawn on several images using the ROI manager of 204
Fiji (is just ImageJ) software The integrated intensity of each ROI at 440 nm and 490 nm was 205
eventually recorded and used to calculate the value of the generalized polarization GP as 206
follows of 207
119866119875 =(120582440 minus 120582490)
120582440 + 120582490 208
A negative GP indicates a flexible membrane while a positive GP indicates a rigid membrane 209
210
Solid-state Nuclear Magnetic Resonance (ssNMR) 1H and 13C ssNMR experiments have been 211
performed using an Avance III HD Bruker 705 T (ν1H= 300 MHz) spectrometer and a 4 mm 212
magic angle spinning (MAS) probe except for the BAck-to-BAck (BABA) experiment which 213
was performed on an Avance III Bruker 1644 T (ν1H= 700 MHz) spectrometer equipped with 214
25 mm MAS probe Temperature was controlled through a Smart cooler BCUIIa BCU-xtreme 215
unit using 10 min of equilibration time after each temperature variation Temperature was 216
8
always varied from high (110degC) to low (70degC) before analysis Due to combined use of fast 217
MAS rates necessary to achieve high resolution spectra and heating close to the boiling point 218
of water neither diluted nor concentrated samples could be used for ssNMR experiments All 219
tests employing up to 50 wt G-C181-OH in water resulted in sample centrifugation drying 220
but also expulsion from the rotor causing sudden stop of rotor spinning For these reasons all 221
attempts to study hydrated G-C181-OH failed and only the dry powder could be analyzed The 222
dry sample powder was analyzed as such in zirconia rotors (4 mm or 25 mm) spinning at MAS= 223
10 kHz (4 mm) or 22 kHz (25 mm) and Chemical shifts were calibrated with respect to 224
adamantane (13C 13C(CH2)= 3848 ppm = 191 ppm) and glycine alpha (13C(CO)= 17603 225
ppm) Details on the acquisition parameters are given in the Supporting Information 226
227
Results and discussion 228
Topologically-connected nanotubes and vesicles 229
G-C181-OH is a biobased glucolipid water-insoluble at room temperature and of 230
which the physicochemical properties are poorly known The DSC thermogram performed at 231
10degCmin of G-C181-OH as a function of the water content (Figure 2a) shows two endothermic 232
peaks on the dry powder (996 wt glucolipid) They are attributed to two melting phenomena 233
occurring at the following temperatures Tm 483degC (Tm1) and 957degC (Tm2) the enthalpy of the 234
former being lower than that of the latter Interestingly DSC also shows that Tm1 is hydration 235
independent and reversible (the associated exothermic peak is systematically observed) while 236
the transition at Tm2 is simply suppressed (here tested up to 130degC) on hydrated powders and 237
never observed on the cooling profile even at slow cooling rates (1degCmin) The thermogram 238
recorded on the dry powder is typical of single-component lipids having an intermediate50 239
metastable phase (often referred to the ripple phase Pβ´ in reference to the periodic undulation 240
of the bilayer)50ndash54 between the classical lamellar gel (Lβ) and liquid crystalline (Lα) phases50ndash241
54 and characterized by regions of both liquid order and disorder5455 The effect of water does 242
not influence the low-temperature crystallization at Tm1 but it contributes to disrupt the ordered 243
array of hydrocarbon chains in the metastable phase 244
On the basis of the DSC thermogram the aqueous phase behavior of G-C181-OH under 245
diluted conditions (5 mgmL-1) was studied at four different temperatures (red marks on Figure 246
2a) below and above Tm1 but also between Tm1 and Tm2 corresponding to the thermogram of 247
the dry powder 248
9
249
Figure 2 ndash a) DSC thermogram of G-C181-OH under dry (04 wt water estimated by thermogravimetric 250
analysis) and hydrated conditions recorded at a heating rate of 10degCmin Red marks indicate the 251
temperatures at which cryo-TEM experiments are performed on the corresponding 5 mgmL aqueous 252
solutions b) Cryo-TEM images recorded for a 5 mgmL G-C181-OH aqueous solution heat at T= 130degC 253
90degC 70degC and 25degC T indicates the temperature of the sample solution before cryofixation Tne T T 254
being the temperature of the sample upon plunging in liquid ethane Please refer to the materials and 255
methods section for more information 256
T= 130degC
T= 90degC
T= 70degC
T= 25degC
a)
b)
20 40 60 80 100 120
99 wt
50 wt
25 wt
T degC
En
do
10 wt
Tm1= 483 degC
Tm2= 957 degC
10
257
The series of cryo-TEM images in Figure 2b show an overview of the most relevant 258
structures observed on G-C181-OH solution from T= 130degC to T= 25degC whereas T is 259
indicative of the equilibrium temperature before cryofixation (refer to materials and methods 260
section for more information on the sense and interpretation of T) At Tgt 100degC the sample 261
is essentially composed of polydisperse single wall vesicles massively shown by the 262
complementary pictures presented in Figure S 2 In between Tm1 and Tm2 at T= 90degC and T= 263
70degC (Figure 2b Figure 3 Figure 4 complemented by Figure S 3 and Figure S 4) vesicles are 264
connected by nanotubes At Tlt Tm1 flat crystals are otherwise observed (Figure 2b and Figure 265
S 5) 266
267
268
Figure 3 ndash Cryo-TEM images recorded for a 5 mgmL G-C181-OH aqueous solution heat at T= 90degC 269
270
A deeper insight at T= 90degC is given in Figure 3 (more images are provided in Figure 271
S 3) Arrows 1 through 6 mark very clearly the typical continuity in the glucolipid membrane 272
between the vesicle and nanotubes Arrow Ndeg 7 shows that a single nanotube connects the outer 273
membrane of two vesicles several hundred nanometers apart The connection is shown by 274
2
34
5
6
6
1
5
7
A
B
D
C
0 10 20 30 40 50 60
BIn
tensity
au
Profile nm
A
0 10 20 30 40 50 60
Inte
nsity
au
Profile nm
C
D
T= 90degC
11
arrows Ndeg5 and Ndeg6 The corresponding profiles A through D confirm the tubular nature of 275
the elongated objects Profiles B and D are both characterized by typical symmetrical thick 276
walls (low intensity depths highlighted by shaded rectangles) surrounding a hollow region (high 277
intensity peak between the shaded rectangles) The wall thickness varies between 35 and 40 278
nm for profile B and between 41 and 61 nm for profile D while the total nanotube diameter 279
varies between 14 nm at B and 20 nm at D At the same time the thickness of the vesicle wall 280
is about 6 nm at A and 135 nm at C Considerations about the bilayer or interdigitated structure 281
of the membrane will be presented below 282
The connection between nanotubes and vesicles seems to be multiple For instance 283
arrow Ndeg1 (Figure S 3) and Ndeg4 (Figure 3) show a single-wall vesicle of which the membrane 284
is extruded into a nanotube Similarly a closer look at arrows Ndeg1 2 and 3 in Figure 3 show 285
that the vesicle is single-wall and fully closed while the nanotube nucleates at the vesicle outer 286
surface with no apparent topological continuity In many regions of the sample at T= 90degC 287
one can find exvaginations or buds232531 in the nanotube wall This is shown for instance by 288
arrows Ndeg7 and particularly put in evidence in Figure 4 by arrows Ndeg1 through Ndeg4 where the 289
amplitude of the oscillation varies between 20-25 nm (arrow Ndeg1) and 6-8 nm (arrows Ndeg3-4) 290
291
Figure 4 - Cryo-TEM images recorded for a 5 mgmL G-C181-OH aqueous solution heated at T= 90degC 292
293
Still between Tm2 and Tm1 but at lower temperature (T= 70degC) the nanotubes seem to 294
vary from single threads (arrow Ndeg1 Figure S 4) to nanotubes of diameter below 15 nm both 295
connecting nanotubes of diameter ranging between 50 nm and 100 nm (arrows Ndeg2 Figure S 296
4) The larger tubes are most likely formed by the inflation and flattening of the nanotubes 297
probably after assimilation of surrounding vesicles and fusion of the exvagination discussed 298
above The transition between vesicles tubes and flat membranes is certainly more accentuated 299
Arrow Ndeg3 in Figure S 4 shows distinct vesicles while arrow Ndeg4 identifies a flat structure 300
evidently formed from fused vesicles In particular arrow Ndeg5 points at the fusion of two 301
2
1 132
4
12
vesicles while arrow Ndeg6 points at two vesicles fusing into the flat membrane Additional areas 302
where vesicle fusion is prominent are indicated by the oscillations at the outer skirt of broad 303
lamellae and pointed by arrow Ndeg7 304
Finally below Tm1 at T= 25degC for instance mainly flat crystals with no visible 305
exvaginations or tubes are visible (Figure S 5) by cryo-TEM and the material turns into an 306
insoluble precipitate Massive presence of flat crystalline structures is also clear from the bulk 307
iridescent behavior of a G-C181-OH solution under manual shear 308
In summary despite the uncertainty related to the actual state of equilibrium of the 309
glucolipids at the moment of cryofixation cryo-TEM depicts a vesicle phase at Tgt 100degC a 310
flat lamellar phase below Tm1 and an interconnected vesicle-nanotube network between Tm1 and 311
about 100degC The combination of statistically-relevant fluorescence microscopy and 312
scatteringdiffraction experiments provides an additional proof of the coexistence of 313
vesiclenanotube systems between the two transition temperatures Please note that the 314
experiments reported below have been performed under controlled conditions of temperature 315
which is then indicated by the use of T instead of T 316
13
317
Figure 5 ndash a-c) Confocal fluorescence microscopy images recorded at 90degC and 70degC for a 5 mgmL G-318
C181-OH aqueous solution d-g) Typical fluorescence microscopy images recorded at T= 80degC using 319
Laurdan (refer to materials and methods section for more details on this fluorophore) Excitation 320
wavelength is 405 nm for all the images while emission wavelength is 490 nm in (df) and 440 nm in (eg) 321
h) Full emission spectra obtained from the integration of various fluorescence images recorded from 412 322
nm to 600 nm (step 5 nm) at 90degC 80degC and 70degC i) Box plot of GP defined as 119918119927 =(120640120786120786120782minus120640120786120791120782)
120640120786120786120782+120640120786120791120782 with 120640120786120786120782 323
and 120640120786120791120782 being the emission wavelengths at 440 nm and 490 nm at 90degC 80degC and 70degC Each data point 324
l= 490 nm l= 440 nm
l= 490 nm l= 440 nm
10 μm400 450 500 550 600
00
02
04
06
08
10
No
rma
lize
d I
nte
nsity
l nm
90degC
80degC
80degC
70degC
70degC
400 450 500 550 60000
02
04
06
08
10
No
rma
lize
d I
nte
nsity
l nm
90degC
80degC
80degC
70degC
70degC
d) e)
f) g)
h)
i)
T= 80degC
Laurdan
T= 80degC
T= 80degC T= 80degC
T= 90degC T= 70degC T= 70degC
a) b) c)
1
1
1
14
corresponds to a set of regions of interest (ROIs) (54 at 90degC 65 at 80degC and 75 at 70degC) selected in the 325
corresponding fluorescence images ROIs were representatively selected so to include the entire image but 326
also vesicles alone tubes alone and mixtures of vesicles and tubes 327
328
Figure 5ab shows two typical confocal fluorescence microscopy images recorded on a 329
G-C181-OH solution (5 mgmL) in a flame-sealed capillary heat at T= 90degC and T= 70degC 330
Although the resolution of optical microscopy is not comparable with cryo-TEM the sample is 331
broadly composed of vesicles coexisting with nanotubes whereas in some cases the nanotube 332
starts from the vesicle itself (arrow Ndeg1) in good agreement with cryo-TEM data Furthermore 333
SANS recorded at T= 90degC (Figure S 6a) shows a scattering profile with a pronounced -2 334
dependence of the scattering intensity against the wavevector q in the log-log scale This 335
indicates the massive presence of a flat interface and it is expected typical of bilayers in 336
vesicular morphologies56 However the typical signature of nanotubes cannot be observed in 337
the SANS profile and this can be explained by both an argument related to the relative lower 338
amount of nanotubes with respect to vesicles at 90degC but also to the steeper slope of flat 339
morphologies (-2) compared to tubes (-1) the signal of the former masking the tube signal at 340
low wavevector values The SANS profile is characterized by a diffraction peak at q= 0167 Aring-341
1 of which the assignment is refined by WAXS data 342
Temperature-driven WAXS experiments in Figure S 6bc (5 mgmL-1 and 25 mgmL-1 343
respectively) show a lamellar order possibly attributed to a multilamellar structure of the 344
vesicles (dv Figure S 6d) at high temperature and to the interplanar arrangement of the 345
crystalline flat structures (dL Figure S 6d) at T= 25degC The sharp (001) reflection indicates 346
typical interlamellar distance of 353 Aring at 25degC although this value varies with temperature 347
(400 Aring at 111degC 372 Aring at 88degC) thus confirming its assignment to a hydration-dependent 348
interlamellar order More intriguing is the second broader peak at q= 0403 Aring-1 (d= 156 Aring) 349
and its reflection both clearly visible at 88degC below Tm2 We attribute it to the inter-glucolipid 350
arrangement inside the tubular phase (dt Figure S 6d) coexisting with the vesicle phase 351
between Tm1 and Tm2 and to the planar lipid arrangement (di Figure S 6d) in the rigid flat 352
lamellar structure below Tm2 Its temperature- hence hydration- independent position also 353
confirms its structural origin Finally besides the water-structure peak at about 2 Aring-1 we also 354
observe a broad peak at 144 Aring-1 characteristics of the lateral packing (d Figure S 6d) of lipids 355
in bilayers While its position could be consistent with an Lα phase5758 above Tm2 its broadness 356
and positional invariance as well as the coexistence between vesicles and tubes do not allow a 357
precise assignment 358
15
Does G-C181-OH assume a bilayer or interdigitated structure the latter being the one 359
found for other similar bolaform glucolipids4243 The size of G-C181-OH can be estimated to 360
be at the most 32 Aring given by the length L of the C16 tail (L = 22 Aring from the Tanford formula 361
L= 154 + 1265 times n (n= 16)59) and the sugar (about 10 Aring)4243 However the cis conformation 362
of the C=C bond imposes a ldquokinkrdquo of 60deg in the aliphatic chain which reduces the effective 363
length of the oleic backbone to about 17 Aring for an effective total G-C181-OH length of about 364
27 Aring Cryo-TEM provides a tube thickness varying from 35 Aring to 60 Aring and a vesicle membrane 365
thickness of at least 60 Aring WAXS suggests an interlamellar thickness (membrane and water) 366
between 40 Aring and 37 Aring and an inter-lipid distance in the tube of about 16 Aring In the absence of 367
a clear form factor oscillation profile as found for similar glucolipids4243 one must 368
acknowledge that these data pledge neither in favor of fully interdigitated nor a double layer 369
structure and might suggest a tilted lipid arrangement with partial interdigitation60 370
371
13C ssNMR demonstrates that G-C181-OH can assume two coexisting head-head and 372
head-tail configurations 373
Vesicles are characterized by low positive mean and gaussian curvatures while 374
nanotubes are described by a combination of a high positive mean and zero gaussian curvatures 375
In this regard the coexistence of vesicles and nanotubes requires glucolipids to adapt 376
themselves to both environments at the same time For this reason the formation of nanotube-377
vesicle networks generally requires a specific driving force able to impose a high mean and 378
zero gaussian curvature to the membrane In many systems insertion of at least a second 379
constituent (lipid surfactant protein) in the membrane becomes a necessary internal driving 380
force for the nucleation and growth of so-called membrane inclusions from which 381
topologically-connected nanotubes can form10ndash123261 as explained by orientational ordering 382
arguments62 It has also been shown that external driving forces such as use of laser 383
ldquotweezersrdquo30 osmotic pressure6 electroformation5ndash82829 or controlled suction13ndash16 are 384
otherwise necessary as also supported by theoretical studies19 385
The bending energy of tubes is higher than that of a vesicle membrane8 due to the 386
dependence of the membrane free energy from the principal curvatures For this reason 387
isotropic (rotational symmetry along the main axis) but also anisotropic33 lipids generally 388
stabilize low-curvature shapes like flat membranes or vesicles Lipid nanotubes are also a 389
common phase formed by amphiphiles but generally for lipids with a certain complexity in 390
their molecular structures as exampled by diacetylenic derivatives of phospholipids among 391
others262763ndash65 Negative contributions to the bending energy favoring the simultaneous 392
16
presence of interconnected vesicles and tubes was shown to be driven by the presence of 393
anisotropic lipids in a membrane continuum Spontaneous deviations to the elastic theory in the 394
presence of surfactants lipids and proteins with anisotropic structures favor the formation of 395
protrusions with radius of the order of the fraction of a micron9ndash1219ndash2362 396
In the absence of both internal and external driving forces mentioned above G-C181-397
OH should behave as a standard lipid Its DSC profile (Figure 2)536667 under both hydrated and 398
dry conditions identifies a hydration-independent transition (Tm1) slightly above room 399
temperature this is followed by one main transition at higher temperature (Tm2) in the dry 400
sample50 For such a profile one expects a gel phase (Lβ) below Tm1 and a liquid crystalline 401
structure possibly in the morphology of vesicles (L4 phase) possibly above Tm1 and most likely 402
above Tm231 as experimentally found On the basis of the thermogram recorded on the dry 403
powder one may also expect a ldquoripplerdquo (Pβ) phase between Tm1 and Tm2 characterized by 404
periodic undulations of the bilayer (generally addressed to as regions with both liquid order and 405
disorder)5455 406
In the present work instead of a Lβ phase we observe flat crystals below Tm1 and a 407
vesicle-nanotube network instead of the ldquoripplerdquo phase The latter is particularly unexpected 408
because the membrane is composed of a single-component (G-C181-OH) and no anisotropic 409
external force (osmotic hydrodynamic electric) is used to pull and stabilize the tubes In 410
addition the nanotubes are observed at fairly high temperatures above Tm1 (between about 411
60degC and 90degC) while this morphology is generally favored at low temperature (proportionality 412
with 1kT figure 5 in Ref 62) commonly below a given transition temperature characteristics 413
for each specific amphiphile27 Furthermore nanotubes of G-C181-OH seem to be stable in 414
time thus differing from what is found in electroformed vesicles78 They are also observed 415
away from phase transition events (may them be at Tm1 or Tm2) as otherwise reported before 416
for a diacetylenic derivative of phosphatidylcholine26 and many other systems27 417
A stable nanotube-vesicle network for a single-component phospholipid in the absence 418
of external driving forces is not expected and has never been reported before It could be 419
explained by the coexistence of two micro-separated phases of different rigidity This 420
hypothesis is excluded by confocal microscopy on Laurdan-labelled membranes and magic 421
angle spinning (MAS) solid-state NMR (ssNMR) experiments 422
Laurdan is a well-known fluorophore used to put in evidence the coexistence of rigid 423
and fluid domains in both model and biological membranes47ndash49 Laurdan was used here to label 424
the G-C181-OH membranes between Tm1 and Tm2 and to verify the possible micro-segregation 425
and coexistence of rigid (eg Lβ λem= 440 nm) and fluid (eg Lα λem= 490 nm) domains in 426
17
tubes and vesicles respectively A set of quantitative experiments performed on a 5 mgmL-1 427
solution summarized in Figure 5 shows an excess of fluorescence at only λem= 490 nm for 428
temperature between 90degC and 70degC (Figure 5h) The GP value which quantifies the rigidfluid 429
character of the membrane is systematically negative (Figure 5i) indicating an overall fluid 430
membrane at all temperatures GP is quantified on more than 50 regions of interest (ROIs) at 431
each temperature including vesicles and tubes alone as well as connected nanotube-vesicles 432
(Figure 5d-g) The dispersion of GP at 80degC and 70degC between -08 and -02 could suggest the 433
spurious presence of membranes with various degrees of flexibility although fluidity is always 434
predominant The combination of WAXS (broad peak d= 144 Aring-1 invariant with 435
temperature Figure S 6bc) and confocal fluorescence microscopy using Laurdan confirms the 436
single-phase of the membrane composed of G-C181-OH both in vesicles and nanotubes This 437
is also consistent with the lack of phase transitions in DSC experiments between ~85degC and 438
~60degC especially in hydrated samples We conclude that the vesicle-nanotube transition is not 439
driven by the local segregation of gel phase (Lβ) microdomains nor that the nanotubes are 440
composed of such phase 441
ssNMR is the best-suited approach to investigate the origin of the local driving force for 442
the nucleation of anisotropic inclusions of which the average orientation depends on the local 443
membrane and inclusion curvatures and was shown to promote tubing62 ssNMR can provide 444
information on the local molecular mobility eg through the nuclear spin relaxation behavior 445
but also on intermolecular interactions and stereochemistry eg through variations in the 446
chemical shift68ndash70 447
Ideally ssNMR should be performed on diluted G-C181-OH samples above Tm1 448
However fast MAS necessary for high resolution centrifuges the sample As a first 449
approximation hydrated G-C181-OH samples for instance at 50 wt as classically done for 450
phospholipids71 could be studied Unfortunately permeability of the sample holder combined 451
to heating (close to the boiling point of water) and MAS provoke dehydration and even sample 452
ejection After experiencing both of the above this approach was abandoned As a second 453
approximation the study of the dehydrated G-C181-OH powder avoids centrifugation and 454
evaporation If studying dried lipids may not reflect their exact behaviour under diluted 455
conditions valuable structural information can still be obtained in dehydrated molecular 456
systems like proteins thus illustrating that this approach is not unreasonable Furthermore if 457
DSC (Figure 2a) shows that hydration suppresses the Tm2 it also shows that the value of Tm1 is 458
not affected by water at concentrations as low as 10 wt For this reason performing a 459
structural analysis of dehydrated G-C181-OH by ssNMR above Tm1 may help understanding 460
18
the local arrangement of G-C181-OH in two morphologies vesicles and nanotubes having 461
sensibly different curvatures 462
To explore the local mobility of the most relevant chemical groups of G-C181-OH 463
above Tm2 (T= 110degC) and between Tm2 and Tm1 (70 lt T degC lt 90) we combine a series of 1H 464
and 13C experiments Single-pulse (SP) MAS experiments (1H and 13C) when recorded under 465
quantitative conditions allow the detection of all chemical species while cross-polarization 466
(CP) MAS (13C only) experiments are sensitive only to constrained groups for which the 1H-467
13C dipolar coupling is not averaged to zero by the molecular motions 468
469
Figure 6 ndash a) 1H MAS (10 kHz) ssNMR spectra recorded from 110degC to 70degC b) 13C MAS (10 kHz) ssNMR 470
spectra recorded using high power decoupling single pulse (SP) and cross-polarization (CP) pulse sequences 471
Contact time for CP experiments and corresponding temperatures are given on each spectrum Full spectra 472
are given in Figure S 7 473
The most relevant 1H and 13C spectra are given in Figure 6 (full range in Figure 7 and 474
Figure S 7) As expected the 1H solid-state SPMAS spectra show broader peaks compared to 475
the solution-state NMR spectrum (Figure 6a) reflecting the obvious solid-state character of the 476
sample at any temperature The sugar group and the C=C bond resonate in the 25-6 ppm range 477
and 535 ppm respectively while the OH groups of the sugar moiety are found below 45 ppm 478
(Figure 6a full assignment in Table S 1) Very broad (~1 ppm) at 100degC the position of the 479
OH peak varies with the temperature value and becomes narrower (lt~05 ppm) and visible at 480
δH= 464 ppm at T= 70degC Line narrowing and chemical shift variations of the OH resonance 481
in ssNMR is always a direct sign of H-bonding interactions whereas the strength of the H-482
bonding hence its OHhellipH distance is correlated to a dispersion in chemical shifts72ndash75 All other 483
60 55 50 45 40 35 30 25
ppm
110
90
80
70
910
1rsquo
6rsquo16
1
OH
134 132 130 128 126
ppm110 108 106 104 102 100
ppm
SP (T= 110degC)
SP (T= 70degC)
CP 50 ms (T= 70degC)
CP 3 ms (T= 70degC)
910 1rsquo
1H 13C
1
811
910
CH2 CH2
1rsquo
6rsquo
a) b)
C102
13024
C9101
13003
C92
12869 C1rsquo210382
C1rsquo110443
C1rsquo13035
2rsquo3rsquo4rsquo
T degC
5rsquo
19
resonances broaden from 110degC to 70degC thus indicating slower andor more anisotropic 484
reorientational motions of all chemical groups The specific dynamic behaviour of the sugar 485
headgroup is also reflected by its 1H transverse relaxation time T2 whereas the shorter the T2 486
the higher the rigidity Experiments performed between 110degC and 70degC shown and 487
commented in Figure S 8 in the Supporting Information globally show a single short (lt 1 ms 488
below 100degC) T2 relaxation component for H1rsquo H5rsquo and H6rsquo and two both short and long 489
(between 4 ms and 12 ms) T2 for the acyl chain (CH2 H910 H811) even below 100degC 490
At 110degC 13C SPMAS experiments (Figure 6b full range in Figure 7 and Figure S 7 491
assignments in Table 1) show a single peak at δC= 10335 ppm for C1rsquo and at δC= 13003 ppm 492
for C910 as expected for a symmetrical conformation with two chemically-equivalent 493
carbons76 At 70degC the C1rsquo peak disappears while C910 now shows two peaks around 128 494
ppm and 130 ppm (Table 1 full temperature series in Figure S 7b) attributed to C92 (δC= 12869 495
ppm) and C10 in a non-symmetric configuration respectively for which these two carbons are 496
chemically inequivalent76 More precisely the resonance at 130 ppm is actually the 497
superposition of two close resonances C9101 (δC= 13003 ppm) and C102 (δC= 13024 ppm) 498
where subscripts 1 and 2 stand for two different conformations of the cis-olefin group as 499
reported for various phases of oleic acid in the vicinity of 0degC76 500
501
Table 1 ndash 13C Chemical shifts of G-C181-OH in solution and solid-state Solid-state experiments are 502
recorded at MAS= 10 kHz All spectra are reported in Figure 7 and Figure S 7 The contact time for cross 503
polarization is 3 ms In all ssNMR experiments temperature is first raised at 110degC and then lowered to 504
either 90degC or 70degC Attribution of the 13C resonances in Table 1 is performed on the basis of the solution 505
spectrum (Figure S 1b) Additional peaks observed in both single pulse and cross polarization ssNMR 506
experiments are attributed when possible to a configuration effect of the given atom eg C9101 and C92 507
indicate two configurations of C9 All new peaks observed in solid-state and not detected in solution are 508
highlighted in red for convenience 509
510
511
δ ppm
Peak Liquid (DMSO-d6)
Solid Single Pulse
T= 110degC
Solid Single Pulse
T= 90degC
Solid Single Pulse
T= 70degC
Solid Cross Polarization
T= 70degC
C102
- - 13024 13024
C910C9101 13009 13003 13003 13003 13003
C1C9C10C1rsquo
C6rsquo
20
C92 - - - 12869 12869
C1rsquoC11 10329 10335 10335 - 10443
C12 - - - - 10382
C3 7724 7709 7702 - 7829
- 7634 7629 - 7621
7525
C2 7388 7398 7390 7370 7370
C4 7052 7077 7054 7041 7098
C16 6900 7016 - - 7029
- - - - 6793
C1C5C6 6153 6241 6236 6239 6262
C1C5C6 6117 - - - 5956
C2 3300 3290 3290 3283 3279
CH2(trans) - - - 3198 3196
CH2(gauche)C15 2941 2981 2987 3004 -
C811 2706 2747 2747 2832 2817
CH2 2597 2625 2628 2630 2817
512
13C CPMAS spectra at 70degC (Figure 6b full range in Figure 7 and Figure S 7d) at 513
increasing contact times confirm the presence of two cis-olefin environments one for which 514
C910 are equivalent labelled here C9101 and one for which they are inequivalent labelled 515
C92 C102 Both environments are rigid enough to be observed at short contact time (tc= 50 μs) 516
A similar double environment is also observed for the sugar C1rsquo CPMAS at 70degC shows two 517
peaks (C1rsquo1 at δC= 10443 ppm C1rsquo2 at δC= 10382 ppm Figure 6b Figure S 7d) These are 518
significantly shifted downfield from the C1rsquo peak observed at 110degC and are detected at contact 519
times as short as 50 μs thus indicating their rigid character One also finds that CPMAS is 520
totally inefficient at 100degC for short contact times (50 μs) and poorly efficient even at 3 ms 521
typical of fast-tumbling molecules (Figure S 7c) also both gauche (δC= 3004 ppm) and all-522
trans (δC= 3198 ppm) conformations of the CH2 carbons coexist at 70degC (Figure S 7b)77 523
According to ssNMR one main mobile molecular environment exists at 110degC as 524
shown by the well-resolved 1H spectrum single C=C (C9101) and anomeric (C1rsquo) resonances 525
gauche conformation of the aliphatic CH2 and single T2 of the aliphatic CH2 chain and sugar 526
protons The sugar group is certainly mobile (inefficient 1H13C CPMAS) but still more 527
constrainted than the acyl chain (shorter T2 (1H)) As the temperature is lowered the overall 528
rigidity increases (broadening of 1H NMR peaks faster 1H transverse relaxation and efficient 529
1H13C magnetization transfer during CPMAS) presumably driven by H-bonding 530
interactions (downfield shift and line narrowing of the OH 1H signal very short OH T2 loss of 531
the C1rsquo signal in SPMAS) At the same time a number of spectroscopic data (two concomitant 532
21
resonances for anomeric C1rsquo1 and C1rsquo2 cis-olefin C9101 and C92 C102 and CH2 gauche and 533
all-trans environments) and relaxation behaviour (fast and slow T2 relaxation components) 534
strongly suggests the coexistence of two molecular environments Further proofs of the 535
coexistence of two distinct molecular domains are given by a number of chemical shift 536
variations in the 13C CPMAS spectrum at 70degC compared to the one at 110degC 90degC and 537
solution This is shown in Figure 7 and in the list of 13C chemical shifts in Table 1 538
539
540
Figure 7 - Comparison between solution- and solid-state 13C NMR spectra of G-C181-OH Solid-state 541
experiments are recorded directly on the sample powder at a MAS of 10 kHz (4 mm zirconia rotor) SP 542
Single Pulse CP Cross Polarization In all the ssNMR experiments temperature is first raised at 110degC 543
and then lowered to either 90degC or 70degC Segmented lines are meant to highlight the known peak position 544
in solution thus stressing the strong chemical shift variations in the solid-state 545
546
NMR experiments above Tm2 suggest that vesicles could contain G-C181-OH with a 547
single family of mobile conformations characterized by chemically-equivalent C=C (red 548
Figure 8b) and a single C1rsquo conformation (green Figure 8b) Experiments between Tm1 and Tm2 549
otherwise suggest that two coexisting conformations characterized by chemically-equivalent 550
(red Figure 8b) and inequivalent (magenta Figure 8b) C=C could be associated to nanotubes 551
Two distinct C1rsquo sites (grey Figure 8b) also indicate two configurations of the sugar headgroup 552
A comment on this point will be given in the following paragraphs 553
The local (Aring-scale) variation of molecular mobility below Tm2 drives the coexistence of 554
two distinct molecular environments of the same G-C181-OH molecule This occurs within a 555
single-phase domain (as deduced by WAXS) of equivalent membrane rigidity (as derived from 556
Laurdan probe in confocal microscopy) Although never reported before the difference in the 557
local mobility of the same amphiphile (here G-C181-OH) could satisfy the theoretically-558
140 120 100 80 60 40 20
CP(3 ms)-70degC
SP-70degC
SP-90degC
SP-110degC
ppm
LiquidC910
C1rsquo
C2rsquo
C4rsquo
C3rsquo
C1
C6rsquoC5rsquo
C1
6
C8
11
C2 C
H2
C1
5
CH
2
DM
SO
13C
22
required conditions that induce local lipid segregation and formation of membrane inclusions 559
(Figure 8c) In case of their non-zero average orientation the local membrane curvature 560
increases62 and nanotubes can spontaneously form (Figure 8bc) More intriguing this 561
mechanism occurs at least 10degC above Tm1 although it should not be favored above the Tm27 562
From both experimental and theoretical backgrounds the conditions of topologically-563
connected vesicles-nanotubes systems are met only when either internal (two components) or 564
external driving forces are applied19 In the present single-lipid system of which the phase 565
behavior is summarized in Figure 8a the most plausible driving force could be explained by 566
the NMR results collected on the dry sample G-C181-OH concomitantly occupies two 567
molecular environments characterized by 1) two distinct conformations of the sugar 568
displaying equivalent mobility and 2) two conformations of the acyl chain unsaturation 569
570
23
571
Figure 8 ndash a) Thermotropic phase behavior of G-C181-OH at 5 mgmL-1 Note that Tm2 is observed on the 572
dry powder only b) Possible relationship between the molecular environment as derived from NMR and 573
membrane curvatures All the molecular drawings refer to the same G-C181-OH molecule (bulky ellipsoid 574
equiv sugar headgroup) while each color corresponds to a given configuration Grey of C1rsquo1 and C1rsquo2 indicates 575
the uncertainty about the assignment of the specific NMR peak The curvature C is defined as 1R R being 576
the curvature radius R1 R2 radius of curvature CG Gauss curvature CM Mean curvature c) Free 577
interpretation of the anisotropic high-curvature (CMgt 0 CG= 0) inclusions in the membrane (low CM and 578
CG) continuum driven by inter-sugar H-bonding and reduced intramembrane diffusion for a G-C181-OH 579
glucolipid 580
581
Flat crystalline structure
Nanotube-vesicle network
Vesicles
48degC
120deg
106 105 104 103 102 101
ppm
H9 H10H1rsquo
106 105 104 103 102 101
ppm106 105 104 103 102 101
ppm106 105 104 103 102 101
ppm
C=CC=C
C1rsquo1C1rsquo2
C1rsquo
Tm2(96degC)Tm1
a)
b)
c)
Same molecule different local orientations and sugar conformations
High curvature membrane
Low curvature inclusion
Flip-FlopStrong H-bonding
CG
CM ( + )
CG 0
CM 0 CG 0
CM 0
G-C181-OH
24
Two related questions are unanswered at the moment What actually drives nanotube 582
formation and is the organization of G-C181-OH within the vesicles and tubes the same Lipid 583
nanotubes have been studied for at least three decades over which broad experimental and 584
theoretical insight has been generated Despite this fact the actual understanding is still matter 585
of debate27 Micelle-to-nanotube and vesicle-to-nanotube phase transitions are generally 586
reported for single amphiphiles below a given Tm and intermediate phase composed of twisted 587
and flat fibers is concomitantly reported Initially thought to be a chirality-driven phenomenon 588
recent studies propose a more general mechanism involving crystallization and symmetry 589
breaking in the lipid packing driven by optimal packing27 If twisted ribbons were observed 590
before for a number of microbial glycolipid bolaamphiphiles44 they are not found for G-C181-591
OH This fact as well as the large body of cryo-TEM images and the observation of nanotubes 592
above Tm1 rather pledge in favour of a direct topological change from positive (vesicles) to 593
zero (nanotubes) Gaussian curvatures In this case vesicle-to-nanotube transitions could be 594
driven by external forces56307813ndash162829 595
Considering the absence of external forces in the present system there are only two 596
possibilities left spontaneous budding of the membrane or nanotube pulling after inter-vesicle 597
collisions due to Brownian motion Both are possible as inclusions composed of a different 598
arrangement of the same molecule in the membrane continuum can theoretically explain 599
spontaneous nanotube formation in an isotropic medium672223629ndash1218ndash21 However the second 600
one is probably more likely to prevail because it could explain the large number of nanotubes 601
connecting two distant vesicles Interestingly similar events occur for any phospholipid-based 602
vesicular solution but nanotubes are extremely rare unless at least two lipids of different 603
molecular structure are mixed together The spectroscopic 1H and 13C and relaxation (1H) 604
ssNMR data even if collected on a dry powder demonstrate that the coexistence of two G-605
C181-OH configurations involving both the sugar headgroup and fatty alcohol chain are 606
possible for this molecule As a matter of fact this is not so surprising as more than one energy 607
minima each corresponding to a given conformation are known for glucose its non-reducing 608
derivative methylglucose and carbohydrates in general78ndash80 609
The presence of two configurations could explain the coexistence between two 610
structures of different curvature but the data presented so far do not explain the origin of these 611
two configurations In other words what drives the change in the local structure of the sugar 612
headgroup and fatty alcohol within the membrane 613
The association of known self-assembled structures to spectroscopic 13C ssNMR data is 614
known for years in particular for gluconamides lipids having a linear sugar headgroup81ndash84 It 615
25
was found that gauche effects in some cases up to the γ position in the sugar chain induce 616
upfield chemical shifts while anti and trans conformations result in downfield shifts Each 617
structure (monolayer crystal bilayer crystal or micellar fiber) was then characterized by a given 618
organization of the gluconamide and a characteristic 13C ssNMR fingerprint which could be 619
explained by gauche γ-gauche anti and trans conformations of the headgroup Similar 620
structural-spectroscopic correlations have been collected over the years for much simpler cyclic 621
sugars85 whereas pyranoses can undergo important conformational changes (chair half-chair 622
boat skew) when the appropriate energy barriers are crossed78ndash8086 A quantitative 623
conformational study based on the 13C chemical shift variations shown in Table 1 would be 624
certainly helpful but very delicate in the context of the present state of the art because a 625
rigorous approach requires at least one known crystal structure8182 which is currently missing 626
for this compound A qualitative approach will then be adopted 627
G-C181-OH is a bolaform amphiphile and flip-flop could be a possible mechanism 628
involved in the nanotube stabilization whereas head-tail interactions have long been considered 629
as important in nanotube-forming bolaform amphiphiles6063 From mere considerations based 630
on T2 (1H) relaxation arguments one could exclude head-tail configurations if the R-CH2OH 631
endgroup (H1) was involved in a direct interaction with the sugar group its corresponding T2 632
would probably be comparable to the sugarrsquos one (OH and H1rsquo) but this does not seem to be 633
the case However this hypothesis would be based on the comparison of the relaxation from 634
CH and CH2 protons additionally involved in different kind of motions Besides the relaxation 635
of H1 is influenced by the strong overlap between H1 and H5rsquo For these reasons relaxation 636
arguments are not solid enough and will not be used 637
We then address this question by exploring intermolecular interactions in a direct 638
manner using 2D 1H-1H homonuclear ssNMR correlation spectroscopy At 90degC in the fast-639
tumbling domain of molecular motion (narrow 1H NMR peaks Figure 6a) and corresponding 640
to the vesicle-rich region spin diffusion (NOESY) experiments are preferred over dipolar 641
coupling based experiments because such interaction is averaged out by molecular motion 642
However when the molecular motion is more constrained in the domain of nanotube stability 643
at 70degC (broad 1H spectra Figure 6a) Double-Quantum Single-Quantum (DQ-SQ) correlation 644
experiments are best suited to probe interaction between close molecular neighbors These 645
experiments are reported in Figure 9 and the related interpretation is only briefly reported 646
below while a more detailed discussion can be found on Page 12 in the Supporting Information 647
26
648
Figure 9 ndash a) 2D 1H-1H NOESY NMR experiment performed at MAS= 10 kHz (4 mm probe) on a Bruker 649
300 MHz Avance III HD spectrometer using 300 ms of mixing time Sample temperature is regulated to 650
90degC reached by cooling from 110degC b) 2D 1H-1H DQ-SQ (BAck-to-BAck BABA pulse sequence used for 651
the DQ excitation scheme) NMR experiment performed at MAS= 22 kHz (25 mm probe) on a Bruker 700 652
MHz Avance III spectrometer using a DQ excitation time equal to 2 rotor periods Sample temperature is 653
regulated to 70degC reached by cooling from 110degC The typical schemes illustrating how to interpret these 654
2D experiments are reported above each experimental map Zooms of the sugar region and configurational 655
interpretation are given below each 2D map More information are given in the text below 656
H16-H16
H1-H1
H9-H10
H1rsquo-H1
H1rsquoH910 H16
H1
H1rsquo-H1rsquo
Hxrsquo-Hxrsquo
2
(pp
m)
(ppm)
315
811910 1rsquo
2rsquo2
3rsquo 4rsquo6rsquo
5rsquo
1rsquo2910
asymp asymp asympHDO MeOD Acetone
1
315
811 9101rsquo
2rsquo2
3rsquo4rsquo6rsquo
5rsquo
1rsquo2 9 10
asympasympasympHDOMeODAcetone
H1rsquo-H1
1rsquo
1
(p
pm
)
(ppm)
H1-H2
H1rsquo-H1
H1rsquo
H910
H1H5rsquo
H2
H1rsquo-H5rsquo
315
811910 1rsquo
2rsquo2
3rsquo 4rsquo6rsquo
5rsquo
1rsquo2910
asymp asymp asympHDO MeOD Acetone
1
H2rsquoH3rsquoH4rsquo
H2rsquoH3rsquoH4rsquo
X= 2rsquo3rsquo4rsquo
NOESY - T= 90degC
1H
1H
1H
1H
DQ-SQ - T= 70degC
a) b)
2
(pp
m)
(p
pm
)
(ppm)
A B
AhellipB
AhellipA
BhellipB
NOESY
(ppm)
A B
AhellipB
DQ-SQ
Single-quantum dimension
Do
ub
le-q
ua
ntu
m d
imen
sio
n
AhellipA
BhellipB
BhellipA
BhellipA
315
811910 1rsquo
2rsquo2
3rsquo 4rsquo6rsquo
5rsquo
1rsquo2910
asymp asymp asympHDO MeOD Acetone
1
lt 5 Aring
lt 5 Aring
H1-H2
H811
H15
H16
H6rsquo
H1rsquo
H1
H5rsquo
H2
H1-H2
H1rsquo-H1
H1rsquo-H5rsquo
H1rsquo
H1 H5rsquo
H1rsquo
H1
H5rsquo
H1H2rsquo H3rsquo H4rsquo
H1-H1
H1rsquo-H1
Hxrsquo-HxrsquoX= 2rsquo3rsquo4rsquo
H1-H2
H1rsquo
Zoom sugar region 28 ndash 45 ppmNOESY DQ-SQ
27
Head-tail or head-head configurations could be probed by the existence of H1rsquo-H1 657
interactions whereas H1 (δH= 356 ppm) is associated to the glucolipid tail and H1rsquo (δH= 432 658
ppm) to the sugar headgroup These atoms are more than 15 Aring apart and a direct interaction 659
could not be observed in both NOESY and DQ-SQ experiments NOESY experiments (Figure 660
9a) show that H1rsquo-H1 correlations are not observed Meanwhile clear-cut direct H1rsquo-H1 661
interactions are indeed observed are detected at T= 70degC (DQ cross-peaks related to H1rsquo-H1 662
correlation in DQ-SQ experiment shown in Figure 9b) Interestingly the absence of auto peaks 663
at δH= 432 ppm and δH= 335 ppm in the SQ dimension excludes H1rsquo-H1rsquo and Hxrsquo-Hxrsquo (x= 2 664
3 4) interactions respectively strengthening the idea that sugar headgroups from two nearest-665
neighbor G-C181-OH molecules are not adjacent in the nanotube-vesicle region 666
Homonuclear 2D ssNMR supports the idea according to which G-C181-OH can 667
undergo molecular flip-flops and a head-tail arrangement in the dry product Extrapolating these 668
conclusions in the lower concentration range lack of H1rsquo-H1 proximity at T= 90degC suggests a 669
head-head configuration in the vesicle-rich region and head-tail configuration within the 670
nanotubes It is however still unclear whether flip-flops are driven by spontaneous temperature-671
induced conformational changes in the glucolipid packing stimulating inclusions within the 672
membrane itself672223629ndash1218ndash21 or by defects generated by inter-vesicle collisions In fact a 673
combination of both is not unlikely Nanotubes are not stable when temperature is 20 to 30 674
degrees above Tm1 indicating that inter-vesicle collisions alone cannot explain the unusual 675
phenomenon In an energy landscape approach87 the head-head configuration is certainly 676
favored at high temperature while both head-head and head-tail configurations could be 677
favored in the mid-temperature region corresponding to the range between Tm1 and Tm2 in the 678
dry powder Both statistical and defect-induced flip-flop events contribute to form high mean 679
zero Gaussian curvature morphologies (nanotubes) for which the head-tail conformation 680
limiting the proximity between bulky sugar headgroups is probably more adapted (Figure 8c) 681
The flip-flop interpretation now reasonably explains the strong differences in the sugar and fatty 682
alcohol conformations deduced by the multiple NMR signals attributed to chemically-683
equivalent groups The existence of various low-energy conformations each having specific 684
NMR signature for sugars in solution78ndash8086 and solid-state81ndash84 further supports our 685
interpretation 686
One last point should be clarified Why between Tm1 and Tm2 are two molecular 687
environments able to coexist instead of a single one of average rigidity as found in the case of 688
ldquoripplerdquo phases50ndash54 We believe that this question can be answered based on the NMR results 689
the relatively short T2 values of the H1rsquo and OH protons shows the constrained mobility of the 690
28
sugar headgroup despite a certain flexibility of the chain (long T2 component) This trend may 691
suggest restrictions in translational mobility probably due to the sugar-OH hydrogen bonding 692
(Figure 8c) meaning that lipids are not able to diffuse within the membrane thus keeping two 693
different configurations stable 694
695
Conclusions 696
Topologically-connected nanotube-vesicle lipidic systems are commonly observed for 697
self-assembled membranes composed of at least two amphiphiles and spontaneously driven by 698
anisotropic inclusions andor by external directional forces This work shows that strong 699
differences in membrane curvature can spontaneously occur in single-lipid systems without 700
external anisotropic forces Coexistence and interconnection between nanotubes and vesicles 701
are evidenced via cryo-TEM and fluorescence confocal microscopy in a single-phase region at 702
temperature above a transition temperature Tm1= 483degC determined by DSC on the hydrated 703
sample but below the second transition temperature Tm2 (957degC) determined by DSC on the 704
dry powder X-ray diffraction (WAXS) also shows the coexistence of two lattice periods one 705
attributed to an inter-membrane repeating distance and the other possibly related to the intra-706
nanotube glucolipid arrangement Labelling the systems with Laurdan a fluorophore of which 707
the emission strongly varies with the local membrane rigidity excludes the presence of rigid 708
micro-separated phases (eg Lβ) 709
1H and 13C ssNMR despite the fact that it can only be performed on the dry powder 710
confirm the presence of one main fluid G-C181-OH environment above Tm2 Below Tm2 the 711
splitting of some 13C peaks and the coexistence of short and long 1H relaxation components 712
demonstrate that G-C181-OH can simultaneously pack into structurally and dynamically 713
inequivalent environments Combining advanced 2D 1H-1H correlation experiments based on 714
spin diffusion or double-quanta excitation suggests that vesicles could contain a preferred head-715
head configuration of the bolaform lipid while nanotubes a preferred head-tail assembly 716
The presence of two environments composed of the same molecule characterized by 717
different molecular configurations and rigidity fulfills the theoretical conditions necessary to 718
spontaneously nucleate a membrane inclusion of non-zero average orientation described as 719
necessary to observe topologically-connected nanotube-vesicle structures in the absence of 720
external forces This hypothesis could also be enriched by the possibility of nanotubes to be 721
pulled away between two vesicles after a collision event 722
This work expands the actual theoretical and experimental framework on lipid networks 723
stabilized by a different radius of curvature It could also motivate the synthesis or isolation 724
29
of new lipids providing a higher level of 3D architectural control in soft networks possibly in 725
the range of room temperature 726
727
Acknowledgements 728
Dr Andrea Lassenberger and Dr Sylvain Preacutevost at Institut Laue Langevin (ILL Grenoble 729
France) are kindly acknowledged for their assistance on the SANS experiment Confocal 730
images were performed at the Institut de Biologie Paris Seine (IBPS) imaging facility Jean-731
Franccedilois Gilles (Imaging Core Facility Institut de Biologie Paris Seine (IBPS) CNRS 732
Sorbonne Universiteacute Paris France) is kindly acknowledged for his assistance on the confocal 733
microscopy imaging Dr Guillaume Laurent (LCMCP Sorbonne Universiteacute Paris France) is 734
kindly acknowledged for helpful discussions The French region Ile-de-France SESAME 735
program is acknowledged for financial support (700 MHz NMR 736
spectrometer) Dr Olivier Diat (ICSM Marcoule France) Prof eronikaIglič and Prof V Aleš737
onsul discussi Slovenia) are kindly acknowledged for helpfUniversity of LjubljanaIglič (-Kralj 738
739
Financial support 740
WAXS experiments have been supported by Soleil Light Source Saint Aubin France proposal 741
Ndeg 20201747 SANS experiments have been supported by ILL proposal Ndeg9-13-778 742
743
References 744
1 D Kabaso N Bobrovska W Goacuteźdź E Gongadze V Kralj-Iglič R Zorec and A 745
Iglič Bioelectrochemistry 2012 87 204ndash210 746
2 C R Safinya U Raviv D J Needleman A Zidovska M C Choi M A Ojeda-747
Lopez K K Ewert Y Li H P Miller J Quispe B Carragher C S Potter M W 748
Kim S C Feinstein and L Wilson Adv Mater 2011 23 2260ndash2270 749
3 P Veranič M Lokar G J Schuumltz J Weghuber S Wieser H Haumlgerstrand V Kralj-750
Iglič and A Iglič Biophys J 2008 95 4416ndash4425 751
4 A Rustom R Saffrich I Markovic P Walther and H-H Gerdes Science (80- ) 752
2004 303 1007ndash1010 753
5 M I Angelova S Soleacuteau P Meacuteleacuteard F Faucon and P Bothorel Prog Colloid 754
Polym Sci 1992 89 127ndash131 755
6 L Mathivet S Cribier and P F Devaux Biophys J 1996 70 1112ndash1121 756
7 V Kralj-Iglič G Gomišček J Majhenc V Arrigler and S Svetina Colloids Surfaces 757
A Physicochem Eng Asp 2001 181 315ndash318 758
30
8 V Kralj-Iglič A Iglič G Gomišček F Sevšek V Arrigler and H Haumlgerstrand J 759
Phys A Math Gen 2002 35 1533ndash1549 760
9 M Drab D Stopar V Kralj-Iglič and A Iglič Cells 2019 8 626 761
10 A Zidovska K K Ewert J Quispe B Carragher C S Potter and C R Safinya 762
Langmuir 2009 25 2979ndash2985 763
11 A Zidovska K K Ewert J Quispe B Carragher C S Potter and C R Safinya Soft 764
Matter 2011 7 8363ndash8369 765
12 A Zidovska K K Ewert J Quispe B Carragher C S Potter and C R Safinya 766
Biochim Biophys Acta - Biomembr 2009 1788 1869ndash1876 767
13 M Karlsson K Sott M Davidson A S Cans P Linderholm D Chiu and O Orwar 768
Proc Natl Acad Sci U S A 2002 99 11573ndash11578 769
14 A Karlsson R Karlsson M Karlsson A-S Cans A Stromberg F Ryttsen and O 770
Orwar Nature 2001 409 150ndash152 771
15 M Karlsson K Sott A S Cans A Karlsson R Karlsson and O Orwar Langmuir 772
2001 17 6754ndash6758 773
16 E Evans H Bowman A Leung D Needham and D Tirrell Science (80- ) 1996 774
273 933ndash935 775
17 U Seifert Configurations of fluid membranes and vesicles 1997 vol 46 776
18 J Kaumls and E Sackmann Biophys J 1991 60 825ndash844 777
19 N Bobrovska W Goacuteźdź V Kralj-Iglič and A Iglič PLoS One 2013 8 e73941 778
20 A Iglič B Babnik K Bohinc M Fošnarič H Haumlgerstrand and V Kralj-Iglič J 779
Biomech 2007 40 579ndash585 780
21 K Bohinc T Slivnik A Iglič M Brumen and V Kralj-Iglič J Phys Chem C 2007 781
111 9709ndash9718 782
22 A Iglič H Haumlgerstrand P Veranič A Plemenitaš and V Kralj-Iglič J Theor Biol 783
2006 240 368ndash373 784
23 V Kralj-Iglič and P Veranič Adv Planar Lipid Bilayers Liposomes 2006 5 129ndash785
149 786
24 A Iglic and V Kralj-Iglic Adv Planar Lipid Bilayers Liposomes 2006 4 253ndash279 787
25 S Penič L Mesarec M Fošnarič L Mroacutewczyńska H Haumlgerstrand V Kralj-Iglič and 788
A Iglič Front Phys 2020 8 342 789
26 P Yager and P E Schoen Mol Cryst Liq Cryst 1984 106 371ndash381 790
27 T G Barclay K Constantopoulos and J Matisons Chem Rev 2014 114 10217ndash791
10291 792
31
28 B Božič G Gomišček V Kralj-Iglič S Svetina and B Žekš Eur Biophys J 2002 793
31 487ndash496 794
29 A Iglič H Haumlgerstrand M Bobrowska-Haumlgerstrand V Arrigler and V Kralj-Iglič 795
Phys Lett A 2003 310 493ndash497 796
30 R Bar-Ziv and E Moses Phys Rev Lett 1994 73 1392ndash1395 797
31 S Chiruvolu H E Warriner E Naranjo S H Idziak J O Raumldler R J Plano J A 798
Zasadzinski and C R Safinya Science (80- ) 1994 266 1222ndash1225 799
32 V Kralj-Iglič A Iglič H Haumlgerstrand and P Peterlin Phys Rev E 2000 61 4230ndash800
4234 801
33 L Mesarec M Drab S Penič V Kralj-Iglič and A Iglič Int J Mol Sci 2021 22 802
2348 803
34 L Van Renterghem S L K W Roelants N Baccile K Uyttersprot M C Taelman 804
B Everaert S Mincke S Ledegen S Debrouwer K Scholtens C V Stevens W 805
Soetaert L Van Renterghem S L K W Roelants N Baccile K Uytersprot M C 806
Taelman B Everaert S Mincke S Ledegen S Debrouwer K Scholtens C V 807
Stevens and W Soetaert Biotechnol Bioeng 2018 115 1195ndash1206 808
35 J Clark and F Deswarte Introduction to Chemicals from Biomass Second Edition 809
John Wiley amp Sons 2015 810
36 K V Sajna R Houmlfer R K Sukumaran L D Gottumukkala and A Pandey in 811
Industrial Biorefineries and White Biotechnology eds A Pandey R Houmlfer M 812
Taherzadeh K M Nampoothiri and C Larroche Amsterdam Oxford Waltham 813
Elsevier 2015 pp 499ndash521 814
37 R Marchant and I M Banat Trends Biotechnol 2012 30 558ndash565 815
38 K Hill and C LeHen-Ferrenbach in Sugar-Based Surfactants Fundamentals and 816
Applications ed C C Ruiz Boca Raton CRC Press 2009 pp 1ndash20 817
39 L Rodrigues I M Banat J Teixeira and R Oliveira J Antimicrob Chemother 818
2006 57 609ndash618 819
40 J D Desai and I M Banat Microbiol Mol Biol Rev 1997 61 47ndash64 820
41 S L K W Roelants K Ciesielska S L De Maeseneire H Moens B Everaert S 821
Verweire Q Denon B Vanlerberghe I N A Van Bogaert P Van der Meeren B 822
Devreese and W Soetaert Biotechnol Bioeng 2016 113 550ndash559 823
42 N Baccile M Selmane P Le Griel S Preacutevost J Perez C V Stevens E Delbeke S 824
Zibek M Guenther W Soetaert I N A Van Bogaert and S Roelants Langmuir 825
2016 32 6343ndash6359 826
32
43 N Baccile A-S Cuvier S Preacutevost C V Stevens E Delbeke J Berton W Soetaert 827
I N A Van Bogaert and S Roelants Langmuir 2016 32 10881ndash10894 828
44 N Baccile C Seyrig A Poirier S A Castro S L K W Roelants and S Abel Green 829
Chem 2021 23 3842ndash3944 830
45 A Salis L Cappai C Carucci D F Parsons and M Monduzzi J Phys Chem Lett 831
2020 11 6805ndash6811 832
46 J Schindelin I Arganda-Carreras E Frise V Kaynig M Longair T Pietzsch S 833
Preibisch C Rueden S Saalfeld B Schmid J-Y Tinevez D J White V 834
Hartenstein K Eliceiri P Tomancak and A Cardona Nat Methods 2012 9 676ndash835
682 836
47 T Parasassi and E Gratton J Fluoresc 1995 5 59ndash69 837
48 M M Dodes Traian F L Gonzaacutelez Flecha and V Levi J Lipid Res 2012 53 609ndash838
616 839
49 D M Owen C Rentero A Magenau A Abu-Siniyeh and K Gaus Nat Protoc 840
2012 7 24ndash35 841
50 W Stillwell in An Introduction to Biological Membranes Academic Press 2016 pp 842
135ndash180 843
51 W Stillwell in An Introduction to Biological Membranes Academic Press 2016 pp 844
181ndash220 845
52 B Tenchov Chem Phys Lipids 1991 57 165ndash177 846
53 R Koynova and M Caffrey Biochim Biophys Acta 1998 1376 91ndash145 847
54 F Schmid S Dolezel O Lenz and S Meinhardt J Phys Conf Ser 2014 487 848
012004 849
55 S Meinhardt R L C Vink and F Schmid Proc Natl Acad Sci U S A 2013 110 850
4476ndash4481 851
56 O Glatter and O Kratky Small Angle X-ray Scattering Academic Press London 852
1982 853
57 B A Cunningham A D Brown D H Wolfe W P Williams and A Brain Phys 854
Rev E 1998 58 3662ndash3672 855
58 M Nadler A Steiner T Dvir O Szekely P Szekely A Ginsburg R Asor R Resh 856
C Tamburu M Peres and U Raviv Soft Matter 2011 7 1512ndash1523 857
59 C Tanford The hydrophobic effect Formation of micelles and biological membranes 858
John Wiley amp Sons Inc New York 1973 859
60 M Masuda and T Shimizu Langmuir 2004 20 5969ndash5977 860
33
61 A Zidovska K K Ewert J Quispe B Carragher C S Potter and C R Safinya 861
Block Liposomes Vesicles of Charged Lipids with Distinctly Shaped Nanoscale 862
Sphere- Pear- Tube- or Rod-Segments Elsevier Inc 1st edn 2009 vol 465 863
62 A Iglic V Kralj-Iglic B Božič M Bobrowska-Haumlgerstrand B Isomaa and H 864
Haumlgerstrand Bioelectrochemistry 2000 52 203ndash211 865
63 T Shimizu M Masuda and H Minamikawa Chem Rev 2005 105 1401ndash1444 866
64 J V Selinger and J M Schnur Phys Rev Lett 1993 71 4091ndash4094 867
65 J M Schnur Science (80- ) 1993 262 1669ndash1676 868
66 B Tenchov R Koynova and G Rapp Biophys J 2001 80 1873ndash1890 869
67 R Koynova and B Tenchov Ser Biomech 2017 31 3ndash19 870
68 S J Angyal and R Le Fur Carbohydr Res 1984 126 15ndash26 871
69 J K Whitesell and M A Minton J Am Chem Soc 1987 109 225ndash228 872
70 T Takayama S Ando and I Ando J Mol Struct 1990 220 245ndash250 873
71 K Gawrisch N V Eldho and I V Polozov Chem Phys Lipids 2002 116 135ndash151 874
72 F Tielens C Gervais J F Lambert F Mauri and D Costa Chem Mater 2008 20 875
3336ndash3344 876
73 G A Jeffrey and Y Yeon Acta Crystallogr Sect B 1986 42 410ndash413 877
74 B Berglund and R W Vaughan J Chem Phys 1980 73 2037ndash2043 878
75 C Gervais C Coelho T Azaiumls J Maquet G Laurent F Pourpoint C Bonhomme 879
P Florian B Alonso G Guerrero P H Mutin and F Mauri J Magn Reson 2007 880
187 131ndash140 881
76 C Akita T Kawaguchi F Kaneko H Yamamoto and M Suzuki J Phys Chem B 882
2004 108 4862ndash4868 883
77 R N Purusottam L Seacutenicourt J J Lacapegravere and P Tekely Biochim Biophys Acta - 884
Biomembr 2015 1848 3134ndash3139 885
78 X Biarneacutes A Ardegravevol A Planas C Rovira A Laio and M Parrinello J Am Chem 886
Soc 2007 129 10686ndash10693 887
79 L M J Kroon‐Batenburg and J Kroon Biopolymers 1990 29 1243ndash1248 888
80 K N Kirschner and R J Woods Proc Natl Acad Sci U S A 2001 98 10541ndash889
10545 890
81 S Svenson B Kirste and J H Fuhrhop J Am Chem Soc 1994 116 11969ndash11975 891
82 I Sack S Macholl J H Fuhrhop and G Buntkowsky Phys Chem Chem Phys 892
2000 2 1781ndash1788 893
83 S Svenson J Koening and J H Fuhrhop J Phys Chem 1994 98 1022ndash1028 894
34
84 S Svenson A Schaefer and J H Fuhrhop J Chem Soc Perkin Trans 2 1994 2 895
1023ndash1028 896
85 K Bock and C Pedersen Adv Carbohydr Chem Biochem 1983 41 27ndash66 897
86 T B Grindley Structure and Conformation of Carbohydrates Springer Berlin 898
Heidelberg 2008 899
87 F Tantakitti J Boekhoven X Wang R V Kazantsev T Yu J Li E Zhuang R 900
Zandi J H Ortony C J Newcomb L C Palmer G S Shekhawat M O De La 901
Cruz G C Schatz and S I Stupp Nat Mater 2016 15 469ndash476 902
903
1
Supporting Information 904
905
Topological connection between vesicles and nanotubes in single-906
component lipid membranes driven by head-tail interactions 907
908
Niki Baccilea Ceacutedric Lorthioira Abdoul Aziz Baa Patrick Le Griela Cristina Coelhob Javier 909
Perezc Wim Soetaertd Sophie L K W Roelantsd 910
911
a Sorbonne Universiteacute Centre National de la Recherche Scientifique Laboratoire de Chimie de 912
la Matiegravere Condenseacutee de Paris LCMCP F-75005 Paris France 913
b Institut des Mateacuteriaux de Paris Centre Sorbonne Universiteacute Paris France 914
c Synchrotron Soleil LrsquoOrme des Merisiers Saint-Aubin BP48 91192 Gif-sur-Yvette Cedex 915
France 916
d InBio Department of Biotechnology Ghent University Ghent Belgium 917
918
919
Corresponding author 920
Dr Niki Baccile 921
E-mail address nikibaccilesorbonne-universitefr 922
Phone +33 1 44 27 56 77 923
924
925
926
2
a) 927
Parameter Method
Dry Matter (DM ) 996 Infrared balance 105degC
Glucose () 012 HPLC-Metacarb
Glycerol () nd HPLC-Metacarb
Free Fatty Acid content () lt001 Internal method BBEPP
GC with FID Detector
Oil () lt001 Internal method BBEPP
GC with FID Detector
Moulds (CFUg) lt10 3M-Nordval ndeg16 B
Yeasts (CFUg) lt10 3M-Nordval ndeg16 B
Anaerobic count (CFUg) lt10 SP-VG M005 B
Protein () tbd BCA protein assay
928
Figure S 1 - a) HPLC-ELSD chromatogram and composition table 929
930
931
932
933
3
b) 934
935
Group Ndeg δ ppm
CH2 1 354
CH2 2 153
CH2 3-712-14 132
CH2 811 203
CH 910 534
CH2 15 162
CH2 16 388
CH 1 424
CH 2 316
CH 3 334
CH 4 329
CH 5 354
CH2 6 366
Figure S 1 (next) ndash b) 1H NMR spectrum (MeOD-d4) recorded on the purified G-C181-OH compounds 936
and related assignment 937
938
2
811910 1rsquo
5rsquo1
3rsquo4rsquo
1rsquo1910
asymp asymp asympHDO MeOD Acetone
6rsquo2rsquo
1615
3-712-14
4
939
940
Figure S 2 ndash Cryo-TEM images recorded for a 5 mgmL G-C181-OH aqueous solution heat at T= 130degC 941
5
942
943
Figure S 3 - Cryo-TEM images recorded for a 5 mgmL G-C181-OH aqueous solution heat at T= 90degC 944
945
90degC
1
22
6
946
947
948
949
Figure S 4 ndash Cryo-TEM images recorded for a 5 mgmL G-C181-OH aqueous solution heat at T= 70degC 950
951
21
11
1
2
5
3
4
45
5
6
7
7
7
952
953
954
Figure S 5 ndash Cryo-TEM images recorded for a 5 mgmL G-C181-OH aqueous solution heat at T= 25degC 955
956
957
1
1 1
8
958
Figure S 6 ndash a) SANS experiment recorded at 90degC for a 5 mgmL G-C181-OH aqueous solution b-c) 959
WAXS experiments recorded on aqueous solutions of G-C181-OH at b) 5 mgmL and c) 25 mgmL d) 960
Structural interpretation of the repeating distances pointed out in c) 961
962
963
964
001 01 1
q Aring-1
25degC
68degC
88degC
111degC
01 1q Aring
-1
02 04 06 08 1q Aring
-1
001 01
10-1
100
101
Inte
nsity
cm
-1
q Aring-1
-2
T= 90degC
SANS WAXS WAXS
a) b) c)
dv
dL d= 144 Aring-1
di
ddH2O
dt
dvdL
dtdi d
d)
9
965
966
Figure S 7 ndash ssNMR MAS (10 kHz) experiments recorded on a G-C181-OH dry powder a) 1H spectra 967
recorded from 110degC to 70degC b) 13C single pulse (SP) spectra recorded with high power 1H decoupling from 968
110degC to 70degC c) 13C cross polarization (CP) spectra recorded at 110degC and contact time tc of 50 micros and 969
3000 micros d) 13C CP spectra recorded at 70degC and for 20 lt tc micros lt 3000 970
971
1
811
910
CH2 CH2
1rsquo
6rsquo
8 6 4 2 0 ppm
110
90
80
70
910
1rsquo
6rsquo16
1
2rsquo3rsquo4rsquo
811
OH
45 40 35 30 25 20 15
ppm
200 180 160 140 120 100 80 60 40 20 0
ppm140 120 100 80
ppm
CH2-gauche
3004
110
90
80
70
65
60
50
25
C91013003
C9 - 12869
CH2-all-trans
3198
C1rsquo10335
a) b)
1H
T degCT degC
13C Single Pulse MAS
A
B
A
B
70degC70degC
5rsquo
215
200 180 160 140 120 100 80 60 40 20 0
ppm
13C CPMAST= 110degC
200 180 160 140 120 100 80 60 40 20 0
ppm
132 131 130 129 128 127 126
ppm
106 105 104 103 102
ppm
13C CPMAST= 70degC
50
tc micros
3000
20
tc micros
50 500 1000 3000
tc micros
C102
13024 C910113003
C92
12869
C1rsquo213082
C1rsquo110443
A B
106 105 104 103 102
ppm
3000
1000
500
50
20
AB
c)
d)
10
972
Figure S 8 ndash a) Short and d) long T2 components displayed by the 1H transverse relaxation signal c) 1H 973
transverse relaxation signals recorded on a G-C181-OH dry powder from 110degC to 70degC The area of each 974
given resonance is plotted (log-lin) as a function of the echo time (CPMG pulse sequence) for each 975
temperature and fitted using the equation given above T2s and T2l indicate the short and long T2 relaxation 976
times respectively obtained by describing the 1H transverse relaxation signal using a biexponential decay 977
For H1rsquo H5rsquo and H6rsquo the 1H relaxation function could be described by a monoexponential decay 978
- Protons from the sugar group (H1rsquo H5rsquo H6rsquo) show a single T2 relaxation component (Figure 979
6c and Figure S 8) while protons of the acyl chain (CH2 H910 H811) show both short (Figure 980
6c) and long (Figure 6d) T2 relaxation component 981
- The short T2 relaxation time systematically decreases from 110degC to 70degC for all species by a 982
factor ranging from two to seven depending on the specific chemical group Very long T2 are 983
observed at 110degC for all acyl species while nearly unchanged values are measured below 984
90degC without any clear trend 985
- The sugar protons (H1rsquo H5rsquo H6rsquo) have the shortest set of T2 values (lt 1 ms) below 100degC 986
The long component of T2 generally ranges between 4 ms and 12 ms 987
0 1 2 3 4 5 6 7 8
00
05
10
15
20
25
30
35
40
45
Log
In
ten
sity
Time ms
0 1 2 3 4 5 6 7 8
00
05
10
15
20
25
30
35
40
45
Log
In
ten
sity
Time ms
0 1000 2000 3000 4000 5000 6000 7000 8000
00
05
10
15
20
25
30
35
40
45
Log
In
ten
sity
Time ms
0 1000 2000 3000 4000 5000 6000 7000 8000
00
05
10
15
20
25
30
35
40
45
Log
In
ten
sity
Time ms
0 1000 2000 3000 4000 5000 6000 7000 8000
00
05
10
15
20
25
30
35
40
45
Log
In
ten
sity
Time ms
0 1000 2000 3000 4000 5000 6000 7000 8000
00
05
10
15
20
25
30
35
40
45
Log
In
ten
sity
Time ms
H1
H8H11
H9H10
CH2
H1rsquo
H6rsquo
CH2
H910H811 H1CH2
H1rsquo H5rsquo6rsquo
0 1000 2000 3000 4000 5000 6000 7000 8000
00
05
10
15
20
25
30
35
40
45
Log
In
ten
sity
Time ms
OH
0 1000 2000 3000 4000 5000 6000 7000 8000
00
05
10
15
20
25
30
35
40
45 T= 110degC
T= 90degC
T= 80degC
T= 70degC
Log
In
ten
sity
Time ms
Fit
)
CH2 H910 H811 H1 H56 H1 OH
00
05
10
15
20
25
30
35
40
T2 m
s
T= 110degC
T= 90degC
T= 80degC
T= 70degC
CH2 H910 H811 H1
0
2
4
6
8
10
12
T2 m
s
T= 110degC
T= 90degC
T= 80degC
T= 70degC
Short T2(1H) Long T2(1H)
a) b)
c)
11
Table S 1 ndash 1H chemical shifts of G-C181-OH in solution and in the solid-state Solid-state spectra are 988
recorded at a MAS frequency of 10 kHz in DMSO-d6 broad peak 989
990
δH ppm
Group Ndeg Liquid
(MeOD-d4) Solid
(T= 110degC) Solid
(T= 70degC)
CH2 H1 354 357
CH2 H2 153 156
CH2 H3-712-14 132 135
CH2 H811 203 203
CH H910 534 534
CH2 H15 162 164
CH2 H16 388 383
CH H1 424 432
CH H2 316 335
CH H3 334 335
CH H4 329 335
CH H5 354 351 357
CH2 H6 366 383
OH OH1 432
45 463
OH OH2 492
OH OH3 490
OH OH4 487
OH OH6 445
991
992
H1H9H10H1rsquo
H6rsquo
OH2rsquo
OH1
12
Detailed discussion about the NOESY and DQ-SQ 2D 1H-1H ssNMR experiments presented in 993
Figure 9 994
995
2D 1H-1H ssNMR experiments are a unique tool to explore through-space proximities 996
between 1H nuclei ssNMR offers a large number of possibilities each adapted to a given 997
system The advantage of 2D maps with respect to a dynamics approach is their direct 998
readability in clear two nuclei which exchange their magnetization through-space (whichever 999
mechanism may be responsible for this exchange) will display a specific cross-peak However 1000
the way cross-peaks are presented and interpreted strictly depends on the nature of the pulse 1001
program which in turn is chosen according to the physical nature of the sample 1002
1D temperature-dependent 1H NMR experiments performed on G-C181-OH (Figure 1003
4a in the main text) indicate sharp peaks at 90degC and broad peaks at 70degC Narrow peaks 1004
indicate fast andor large-amplitude molecular tumbling averaging the strong 1H-1H dipolar 1005
interactions This excludes the use of pulse sequences like DQ-SQ which is not efficient under 1006
these conditions For this reason we employ spin-diffusion-based pulse sequences like 1007
NOESY which is more adapted for samples with high molecular mobility When mixing times 1008
are chosen to be short (lt 1 s) one generally explores through-space proximities within about 5 1009
10 Aring On the contrary when molecular motions are restricted dipolar coupling becomes 1010
significant 1H NMR peaks are broader and pulse sequences like DQ-SQ can now be used 1011
with a spatial resolution of less than 5 Aring 1012
Whenever possible DQ-SQ experiments are preferred over spin diffusion-based pulse 1013
sequences because they are more selective in particular for likewise interactions which are 1014
not discriminated in NOESY-type experiments This is illustrated by the typical interaction 1015
schemes for NOESY (top Figure 9a) and DQ-SQ (top Figure 9b) For two given A and B 1016
protons 2D NOESY maps will display two on-diagonal and two square-shaped symmetrical 1017
off-diagonal cross-peaks Off-diagonal cross-peaks illustrate the mutual A-B and B-A 1018
interaction but the on-diagonal peaks are systematic and do not prove any A-A or B-B 1019
interaction Similarly to NOESY 2D DQ-SQ maps display off-diagonal peaks (symmetric 1020
across the diagonal top Figure 9b) upon A-B and B-A interaction but in contrast they will 1021
display on-diagonal peaks only in the presence of self-interaction In the tutorial example of 1022
Figure 9b top the on-diagonal A-A peak indicates mutual A-A interaction while lack of on-1023
diagonal B-B peak evidences the absence of B-B proximities Combining NOESY and DQ-SQ 1024
experiments is capital to study the local arrangement of G-C181-OH and its evolution with 1025
temperature 1026
13
At T= 90degC the H1 and H5rsquo contributions are very close but possible to discriminate 1027
them (δ(H1)= 354 ppm δ(H5rsquo)= 351 ppm) according to 1H NMR chemical shifts in Table S 1028
1 2D 1H-1H NOESY in Figure 9a also discriminates between the two components attributed 1029
on the basis of the interactions with their mutual neighbors (green H1-H2 and H5rsquo-H1rsquo squares 1030
in Figure 9a) On this basis 2D NOESY does not show a direct H1rsquo-H1 correlation (blue red-1031
crossed) but rather an extensive network of intra-sugar interactions These features exclude 1032
suggest intra- and inter-sugar interactions and they exclude head-tail arrangements as a major 1033
molecular configuration at 90degC 1034
At 70degC the 1H NMR peaks are broader indicating a reduction of the T2 (1H) relaxation 1035
times andor residual homonuclear dipolar interactions excluding the use of NOESY In this 1036
case 1H-1H DQ-SQ correlation experiments are best suited Figure 9b presents the 1H-1H DQ-1037
SQ experiment on G-C181-OH at 70degC Peaks are broader than in NOESY and attribution may 1038
be cumbersome However the experiment is performed at 700 MHz and MAS= 22 kHz which 1039
improves spectral resolution with respect to the same experiment performed at 300 MHz and 1040
MAS= 10 kHz The auto-peak at δH= 356 ppm in the SQ dimension is attributed to H1-H1 spin 1041
pairs mainly resulting from intra CH2 interaction while the DQ cross-peaks at δH= 156-356 1042
ppm and δH= 432-356 ppm respectively origin from H2-H1 and H1rsquo-H1 interactions (Figure 1043
9b) DQ-SQ map does not show any auto-peak corresponding to H1rsquo-H1rsquo or Hxrsquo-Hxrsquo (x= 2rsquo 1044
3rsquo 4rsquo) interactions (red-crossed blue Figure 9b) thus excluding any proximity (lt 5 Aring) between 1045
close glucose neighbors On the contrary DQ-SQ maps (recorded both at 700 MHz Figure 9b 1046
or at 300 MHz not shown) systematically show DQ cross-peaks which can only be attributed 1047
to H1rsquo-H1 interactions (δH= 432-356) The presence of these H1rsquo-H1 interactions can only be 1048
explained by a head-tail arrangement of the G-C181-OH molecules as illustrated below the 1049
DQ-SQ map in Figure 9b 1050
3
A large body of both experimental and theoretical work has shown that budding and 51
eventual nanotube formation from an existing membrane can only occur spontaneously for 52
membranes of at least two-components9102425111218ndash23 and below a vesicle-nanotube phase 53
transition event2627 Otherwise external anisotropic driving forces like electroformation5ndash54
82829 osmotic pressure6 laser ldquotweezersrdquo30 or electrodynamics13ndash16 must be employed to obtain 55
similar results with in some cases an impressive degree of 2D and 3D organization13ndash16 The 56
origin of spontaneous nanotube formation has been shown to be related to a nanoscale phase 57
separation between two membrane components stabilizing low and high curvatures 58
respectively10ndash1231 with at least one component being highly anisotropic203233 Theoretically 59
this behavior has been explained by deviations in the elastic properties of membranes due to in-60
plane orientational ordering of membrane inclusions composed of anisotropic amphiphiles 61
these referring to a non-symmetrical shape upon a 90deg tilt along the amphiphile axis8919242533 62
In this work we show unexpected nanotubing of membranes prepared from a single-63
component lipid in the absence of external directional forces and above the lipidrsquos Tm This 64
phenomenon is observed for a novel anisotropic double amphiphile (bolaform amphiphile or 65
bolaamphiphile) a glucolipid composed of β-D-glucose and a C181-cis fatty alcohol (G-66
C181-OH Figure 1) This compound is obtained by microbial fermentation of a genetically-67
modified S bombicola yeast in the presence of oleyl alcohol34 and is developed in the broader 68
context of extending the library of new biobased surfactants and lipids in view of replacing 69
petrochemical low molecular weight amphiphiles35ndash41 The structure of G-C181-OH is 70
analogous to that of other microbial glycolipids developed through genetic engineering4243 71
Topological connections between nanotubes and vesicles are observed by means of 72
cryogenic transmission electron microscopy (cryo-TEM) fluorescence microscopy and wide 73
angle X-ray scattering (WAXS) above the melting temperatures Tm= 483degC under strong 74
dilution (05 wt) Spin diffusion and 1H double-quantum single-quantum (DQ-SQ) 2D solid-75
state nuclear magnetic resonance (ssNMR) spectroscopy under magic angle spinning (MAS) 76
necessarily performed on the dry glucolipid powder provides a spectroscopic ground to 77
understand the vesicle-nanotube coexistence The bolaform glucolipids could be in a head-78
headtail-tail configuration in the vesicles but rather in a head-tail configuration in the 79
nanotubes In the dry glucolipid both configurations are energetically comparable in the single-80
phase region above Tm and their coexistence is evidenced by the splitting of some 13C NMR 81
signals These facts could explain the stability of nanotubes while the following hypotheses are 82
formulated for their formation membrane inclusions with different orientational ordering13ndash16 83
possibly driven by inter-vesicle collisions 84
4
85
86
87
88
89
Figure 1 ndash Non acetylated C181 alcohol glucoside G-C181-OH is obtained by a bioprocess performed 90
with modified S bombicola yeast 91
92
Experimental Section 93
Synthesis of non acetylated C181 Alcohol Glucosides (G-C181-OH) G-C181-OH (Mw= 94
41856 gmol-1) was produced by aerobic whole cell bioprocess with a modified S bombicola 95
strain as described by Van Renterghem et al (Fig S4 in Ref 34) The molecule was purchased 96
from the Bio Base Europe Pilot Plant (Gent Belgium) and has the generalized chemical 97
structure given in figure Figure 1 The HPLC and 1H NMR spectrum (MeOD-d4) with peak 98
assignment are shown in Figure S 1 High purity levels (99) and high degree of uniformity 99
were obtained as can be derived from HPLC-ELSD chromatogram 1H NMR and table of 100
contaminant given in Figure S 1 101
102
1H solution Nuclear Magnetic Resonance (NMR) 1H solution NMR experiments were 103
performed on a Bruker Avance III 300 spectrometer using a 5 mm 1H-X BBFO probe using 104
methanol-d4 as solvent The number of transients is 8 with 3 s recycling delay an acquisition 105
time of 546 s and a receiver gain of 362 The 1H NMR spectrum and relative assignment are 106
shown in Figure S 1 and Table S 1 13C solution NMR were performed on the same probe using 107
DMSO-d6 Corresponding chemical shifts are given in Table 1 Referencing is done with 108
respect to TMS δ1H= 0 ppm δ13C= 0 ppm 109
110
Sample preparation The sample was dissolved in milliQ-grade water at the concentration of 5 111
mgmL (05 wt) Lack of pH-sensitive probes (eg COOH groups) in G-C181-OH as 112
otherwise found in other microbial amphiphiles44 but also the will to avoid ion-specific 113
effects45 exclude the use of buffer The solution was heat at the given temperature using a CH3-114
150 Combitherm-2 dry block heating device For the cryo-TEM experiments the vials were 115
heat at the given temperature next to the cryofixation device and plunged into liquid ethane as 116
fast as possible For temperatures of 25degC and 70degC the sample was heat at 90degC and then 117
Synthesis path
5
cooled at to the desired temperature For the SAXS experiment the sample was heat at 90degC in 118
the block heating device and cooled at to 25degC before analysis For the SANS experiment the 119
sample was heat at 90degC directly in front of the beam using the thermalized sample holder 120
available 121
122
Differential Scanning Calorimetry (DSC) DSC was performed using a DSC Q20 apparatus 123
from TA Instruments equipped with the Advantage for Q Series Version acquisition software 124
(v540) Acquisition was performed on both hydrated and dry powder sample (~ 3-5 mg) sealed 125
in a classical aluminium cup and using an immediate sequence of heating and cooling ramps at 126
a rate of 10degCmin-1 Melting temperatures Tm 1 and 2 Tm1 and Tm2 were taken at the minimum 127
of the endothermic peak 128
129
Small and Wide Angle Scattering experiments Small angle neutron scattering (SANS) 130
experiments were performed at the D11 beamline of Institut Laue Langevin (Grenoble France) 131
during the run No 9-13-778 Four q-ranges have been explored and merged using the following 132
wavelengths λ and sample-to-detector (StD) distances 1) ultra-low q λ= 135Aring StD= 39 m 133
2) low-q λ= 53Aring StD= 39 m 3) mid-q λ= 53Aring StD= 8 m 4) high-q λ= 53Aring StD= 14 m 134
The sample (C= 5 mgmL-1) was prepared in 999 D2O to limit the incoherent background 135
scattering The sample solution was analyzed in standard 1 mm quartz cells Direct beam empty 136
quartz cell H2O (incoherent scatterer) within the quartz cell were recorded and boron carbide 137
(B4C) was used as neutron absorber The sample acquisition was measured at 90degC where 138
temperature was controlled through the controller thermalized sample holder available at the 139
beamline The background sample (D2O) signal was subtracted from the experimental data 140
Absolute values of the scattering intensity were obtained from the direct determination of the 141
number of neutrons in the incident beam and the detector cell solid angle The 2D raw data were 142
corrected for the ambient background and empty cell scattering and normalized to yield an 143
absolute scale (cross section per unit volume) by the neutron flux on the samples The data were 144
then circularly averaged to yield the 1D intensity distribution I(q) The software package Grasp 145
(developed at ILL and available free of charge) was used to integrate the data while the 146
software package SAXSUtilities (developed at ESRF and available free of charge) was used to 147
merge the data acquired at all configurations and subtract the background 148
Wide-angle X-ray scattering (WAXS) was performed under temperature control at the 149
SWING beamline of SOLEIL synchrotron facility (Saint-Aubin France) during the run 150
20201747 (energy 14 keV sample-to-detector distance 05 m) Two sample concentrations in 151
6
H2O were probed C= 5 mgmL-1 and C= 25 mgmL-1 The 2D data were integrated azimuthally 152
at the beamline using the software Foxtrot and in order to obtain the I(q) vs q spectrum after 153
masking the beam stop shadow Silver behenate (d(100) = 5838 Aring) was used as a standard to 154
calibrate the q-scale Sample solutions were inserted in borosilicate capillaries of 15 mm in 155
diameter Capillaries were flame-sealed A capillary oven with controlled temperature (plusmn 05degC) 156
provided at the beamline was used to control the sample temperature between 25degC and 111degC 157
Data were normalized by the transmission and calibrated to the SAXS signal of H2O at large q-158
values (I= 00163 cm-1) in order to obtain an absolute intensity scale The water signal was 159
measured by subtracting the signal of the empty capillary from the signal of a water-filled 160
capillary The signal of (water + capillary) was used as background for the samples and it was 161
subtracted after integration of the 2D data 162
163
Cryogenic transmission electron microscopy (cryo-TEM) Cryo-TEM experiments were carried 164
out on an FEI Tecnai 120 twin microscope operating at 120 kV and equipped with a Gatan 165
Orius CCD numeric camera The sample holder was a Gatan Cryoholder (Gatan 626DH 166
Gatan) Digital Micrograph software was used for image acquisition Cryofixation was 167
performed using a homemade cryofixation device The solutions were deposited on a glow-168
discharged holey carbon coated TEM copper grid (Quantifoil R22 Germany) Excess solution 169
was removed and the grid was immediately plunged into liquid ethane at -180degC before 170
transferring them into liquid nitrogen All grids were kept at liquid nitrogen temperature 171
throughout all experimentation Cryo-TEM images have been treated and analyzed using Fiji 172
(is just ImageJ) software available free of charge at the developerrsquos website46 173
The samplersquos concentration was C= 5 mgmL-1 For technical reasons the temperature 174
during cryofixation could not be controlled For this reason the temperature associated with 175
each cryo-TEM image in the text was related to the equilibration temperature just before 176
cryofixation the device being as close as possible to the dry bath used for temperature control 177
Since temperature control during cryofixation was not possible in our device and practically 178
impossible at high temperatures one should take the T values as indicative of the given value 179
Although the sample transfer between the dry bath and the cryofixation device was performed 180
as fast as possible it is more than likely that the actual temperature of the sample at the moment 181
of cryofixation was lower than the one indicated here although impossible to know precisely 182
183
7
Fluorescence microscopy Images were recorded using a 40x objective on a Leica SP5 upright 184
confocal microscope with 405 nm laser excitation The sample was marked with 6-dodecanoyl-185
NN-dimethyl-2-naphthylamine (Laurdan Mw= 35354 gmol-1) fluorophore as follows A 186
stock solution of 3 mg of Laurdan in 100 microL of acetone was initially prepared (C= 30 mgmL-187
1) A volume of 028 microL of the stock Laurdan solution was diluted in 1 mL of a 5 mgmL-1 G-188
C181-OH water solution temporary set at 110degC in a sealed Eppendorf The latter was 189
important so to enhance inclusion of Laurdan in the membrane constituted by the glucolipid 190
while in its vesicle phase The final Laurdan concentration was approximately 24 micromol with a 191
molar Laurdan-to-G-C181-OH molar ratio of approximately 1-to-500 Fluorophore-to-lipid 192
ratios above 1200 were generally considered as non-interfering with the lipid phase behavior 193
as also verified in this work 194
Laurdan can be excited between 365 nm and 410 nm and its emission wavelength can 195
vary according to the rigidity of the membrane intercalation within a rigid or flexible 196
membrane generates emissions at 440 nm or 490 nm respectively47 In the present experiment 197
we have flame-sealed a solution of G-C181-OH at 5 mgmL-1 containing Laurdan (1-to-500 in 198
lipid-to-Laurdan ratio) in flat optical capillaries of 01 mm thickness Capillaries were set on a 199
Linkam support for temperature control eventually placed under the microscope The sample 200
was excited at 405 nm and detection was made in spectral mode with a 5 nm window sliding 201
every 5 nm from 412 nm to 602 nm in 16 bits which allows quantify the signal and compare 202
the different conditions Quantitative analysis was performed according to the literature4849 203
several ROI (range of interest) have been drawn on several images using the ROI manager of 204
Fiji (is just ImageJ) software The integrated intensity of each ROI at 440 nm and 490 nm was 205
eventually recorded and used to calculate the value of the generalized polarization GP as 206
follows of 207
119866119875 =(120582440 minus 120582490)
120582440 + 120582490 208
A negative GP indicates a flexible membrane while a positive GP indicates a rigid membrane 209
210
Solid-state Nuclear Magnetic Resonance (ssNMR) 1H and 13C ssNMR experiments have been 211
performed using an Avance III HD Bruker 705 T (ν1H= 300 MHz) spectrometer and a 4 mm 212
magic angle spinning (MAS) probe except for the BAck-to-BAck (BABA) experiment which 213
was performed on an Avance III Bruker 1644 T (ν1H= 700 MHz) spectrometer equipped with 214
25 mm MAS probe Temperature was controlled through a Smart cooler BCUIIa BCU-xtreme 215
unit using 10 min of equilibration time after each temperature variation Temperature was 216
8
always varied from high (110degC) to low (70degC) before analysis Due to combined use of fast 217
MAS rates necessary to achieve high resolution spectra and heating close to the boiling point 218
of water neither diluted nor concentrated samples could be used for ssNMR experiments All 219
tests employing up to 50 wt G-C181-OH in water resulted in sample centrifugation drying 220
but also expulsion from the rotor causing sudden stop of rotor spinning For these reasons all 221
attempts to study hydrated G-C181-OH failed and only the dry powder could be analyzed The 222
dry sample powder was analyzed as such in zirconia rotors (4 mm or 25 mm) spinning at MAS= 223
10 kHz (4 mm) or 22 kHz (25 mm) and Chemical shifts were calibrated with respect to 224
adamantane (13C 13C(CH2)= 3848 ppm = 191 ppm) and glycine alpha (13C(CO)= 17603 225
ppm) Details on the acquisition parameters are given in the Supporting Information 226
227
Results and discussion 228
Topologically-connected nanotubes and vesicles 229
G-C181-OH is a biobased glucolipid water-insoluble at room temperature and of 230
which the physicochemical properties are poorly known The DSC thermogram performed at 231
10degCmin of G-C181-OH as a function of the water content (Figure 2a) shows two endothermic 232
peaks on the dry powder (996 wt glucolipid) They are attributed to two melting phenomena 233
occurring at the following temperatures Tm 483degC (Tm1) and 957degC (Tm2) the enthalpy of the 234
former being lower than that of the latter Interestingly DSC also shows that Tm1 is hydration 235
independent and reversible (the associated exothermic peak is systematically observed) while 236
the transition at Tm2 is simply suppressed (here tested up to 130degC) on hydrated powders and 237
never observed on the cooling profile even at slow cooling rates (1degCmin) The thermogram 238
recorded on the dry powder is typical of single-component lipids having an intermediate50 239
metastable phase (often referred to the ripple phase Pβ´ in reference to the periodic undulation 240
of the bilayer)50ndash54 between the classical lamellar gel (Lβ) and liquid crystalline (Lα) phases50ndash241
54 and characterized by regions of both liquid order and disorder5455 The effect of water does 242
not influence the low-temperature crystallization at Tm1 but it contributes to disrupt the ordered 243
array of hydrocarbon chains in the metastable phase 244
On the basis of the DSC thermogram the aqueous phase behavior of G-C181-OH under 245
diluted conditions (5 mgmL-1) was studied at four different temperatures (red marks on Figure 246
2a) below and above Tm1 but also between Tm1 and Tm2 corresponding to the thermogram of 247
the dry powder 248
9
249
Figure 2 ndash a) DSC thermogram of G-C181-OH under dry (04 wt water estimated by thermogravimetric 250
analysis) and hydrated conditions recorded at a heating rate of 10degCmin Red marks indicate the 251
temperatures at which cryo-TEM experiments are performed on the corresponding 5 mgmL aqueous 252
solutions b) Cryo-TEM images recorded for a 5 mgmL G-C181-OH aqueous solution heat at T= 130degC 253
90degC 70degC and 25degC T indicates the temperature of the sample solution before cryofixation Tne T T 254
being the temperature of the sample upon plunging in liquid ethane Please refer to the materials and 255
methods section for more information 256
T= 130degC
T= 90degC
T= 70degC
T= 25degC
a)
b)
20 40 60 80 100 120
99 wt
50 wt
25 wt
T degC
En
do
10 wt
Tm1= 483 degC
Tm2= 957 degC
10
257
The series of cryo-TEM images in Figure 2b show an overview of the most relevant 258
structures observed on G-C181-OH solution from T= 130degC to T= 25degC whereas T is 259
indicative of the equilibrium temperature before cryofixation (refer to materials and methods 260
section for more information on the sense and interpretation of T) At Tgt 100degC the sample 261
is essentially composed of polydisperse single wall vesicles massively shown by the 262
complementary pictures presented in Figure S 2 In between Tm1 and Tm2 at T= 90degC and T= 263
70degC (Figure 2b Figure 3 Figure 4 complemented by Figure S 3 and Figure S 4) vesicles are 264
connected by nanotubes At Tlt Tm1 flat crystals are otherwise observed (Figure 2b and Figure 265
S 5) 266
267
268
Figure 3 ndash Cryo-TEM images recorded for a 5 mgmL G-C181-OH aqueous solution heat at T= 90degC 269
270
A deeper insight at T= 90degC is given in Figure 3 (more images are provided in Figure 271
S 3) Arrows 1 through 6 mark very clearly the typical continuity in the glucolipid membrane 272
between the vesicle and nanotubes Arrow Ndeg 7 shows that a single nanotube connects the outer 273
membrane of two vesicles several hundred nanometers apart The connection is shown by 274
2
34
5
6
6
1
5
7
A
B
D
C
0 10 20 30 40 50 60
BIn
tensity
au
Profile nm
A
0 10 20 30 40 50 60
Inte
nsity
au
Profile nm
C
D
T= 90degC
11
arrows Ndeg5 and Ndeg6 The corresponding profiles A through D confirm the tubular nature of 275
the elongated objects Profiles B and D are both characterized by typical symmetrical thick 276
walls (low intensity depths highlighted by shaded rectangles) surrounding a hollow region (high 277
intensity peak between the shaded rectangles) The wall thickness varies between 35 and 40 278
nm for profile B and between 41 and 61 nm for profile D while the total nanotube diameter 279
varies between 14 nm at B and 20 nm at D At the same time the thickness of the vesicle wall 280
is about 6 nm at A and 135 nm at C Considerations about the bilayer or interdigitated structure 281
of the membrane will be presented below 282
The connection between nanotubes and vesicles seems to be multiple For instance 283
arrow Ndeg1 (Figure S 3) and Ndeg4 (Figure 3) show a single-wall vesicle of which the membrane 284
is extruded into a nanotube Similarly a closer look at arrows Ndeg1 2 and 3 in Figure 3 show 285
that the vesicle is single-wall and fully closed while the nanotube nucleates at the vesicle outer 286
surface with no apparent topological continuity In many regions of the sample at T= 90degC 287
one can find exvaginations or buds232531 in the nanotube wall This is shown for instance by 288
arrows Ndeg7 and particularly put in evidence in Figure 4 by arrows Ndeg1 through Ndeg4 where the 289
amplitude of the oscillation varies between 20-25 nm (arrow Ndeg1) and 6-8 nm (arrows Ndeg3-4) 290
291
Figure 4 - Cryo-TEM images recorded for a 5 mgmL G-C181-OH aqueous solution heated at T= 90degC 292
293
Still between Tm2 and Tm1 but at lower temperature (T= 70degC) the nanotubes seem to 294
vary from single threads (arrow Ndeg1 Figure S 4) to nanotubes of diameter below 15 nm both 295
connecting nanotubes of diameter ranging between 50 nm and 100 nm (arrows Ndeg2 Figure S 296
4) The larger tubes are most likely formed by the inflation and flattening of the nanotubes 297
probably after assimilation of surrounding vesicles and fusion of the exvagination discussed 298
above The transition between vesicles tubes and flat membranes is certainly more accentuated 299
Arrow Ndeg3 in Figure S 4 shows distinct vesicles while arrow Ndeg4 identifies a flat structure 300
evidently formed from fused vesicles In particular arrow Ndeg5 points at the fusion of two 301
2
1 132
4
12
vesicles while arrow Ndeg6 points at two vesicles fusing into the flat membrane Additional areas 302
where vesicle fusion is prominent are indicated by the oscillations at the outer skirt of broad 303
lamellae and pointed by arrow Ndeg7 304
Finally below Tm1 at T= 25degC for instance mainly flat crystals with no visible 305
exvaginations or tubes are visible (Figure S 5) by cryo-TEM and the material turns into an 306
insoluble precipitate Massive presence of flat crystalline structures is also clear from the bulk 307
iridescent behavior of a G-C181-OH solution under manual shear 308
In summary despite the uncertainty related to the actual state of equilibrium of the 309
glucolipids at the moment of cryofixation cryo-TEM depicts a vesicle phase at Tgt 100degC a 310
flat lamellar phase below Tm1 and an interconnected vesicle-nanotube network between Tm1 and 311
about 100degC The combination of statistically-relevant fluorescence microscopy and 312
scatteringdiffraction experiments provides an additional proof of the coexistence of 313
vesiclenanotube systems between the two transition temperatures Please note that the 314
experiments reported below have been performed under controlled conditions of temperature 315
which is then indicated by the use of T instead of T 316
13
317
Figure 5 ndash a-c) Confocal fluorescence microscopy images recorded at 90degC and 70degC for a 5 mgmL G-318
C181-OH aqueous solution d-g) Typical fluorescence microscopy images recorded at T= 80degC using 319
Laurdan (refer to materials and methods section for more details on this fluorophore) Excitation 320
wavelength is 405 nm for all the images while emission wavelength is 490 nm in (df) and 440 nm in (eg) 321
h) Full emission spectra obtained from the integration of various fluorescence images recorded from 412 322
nm to 600 nm (step 5 nm) at 90degC 80degC and 70degC i) Box plot of GP defined as 119918119927 =(120640120786120786120782minus120640120786120791120782)
120640120786120786120782+120640120786120791120782 with 120640120786120786120782 323
and 120640120786120791120782 being the emission wavelengths at 440 nm and 490 nm at 90degC 80degC and 70degC Each data point 324
l= 490 nm l= 440 nm
l= 490 nm l= 440 nm
10 μm400 450 500 550 600
00
02
04
06
08
10
No
rma
lize
d I
nte
nsity
l nm
90degC
80degC
80degC
70degC
70degC
400 450 500 550 60000
02
04
06
08
10
No
rma
lize
d I
nte
nsity
l nm
90degC
80degC
80degC
70degC
70degC
d) e)
f) g)
h)
i)
T= 80degC
Laurdan
T= 80degC
T= 80degC T= 80degC
T= 90degC T= 70degC T= 70degC
a) b) c)
1
1
1
14
corresponds to a set of regions of interest (ROIs) (54 at 90degC 65 at 80degC and 75 at 70degC) selected in the 325
corresponding fluorescence images ROIs were representatively selected so to include the entire image but 326
also vesicles alone tubes alone and mixtures of vesicles and tubes 327
328
Figure 5ab shows two typical confocal fluorescence microscopy images recorded on a 329
G-C181-OH solution (5 mgmL) in a flame-sealed capillary heat at T= 90degC and T= 70degC 330
Although the resolution of optical microscopy is not comparable with cryo-TEM the sample is 331
broadly composed of vesicles coexisting with nanotubes whereas in some cases the nanotube 332
starts from the vesicle itself (arrow Ndeg1) in good agreement with cryo-TEM data Furthermore 333
SANS recorded at T= 90degC (Figure S 6a) shows a scattering profile with a pronounced -2 334
dependence of the scattering intensity against the wavevector q in the log-log scale This 335
indicates the massive presence of a flat interface and it is expected typical of bilayers in 336
vesicular morphologies56 However the typical signature of nanotubes cannot be observed in 337
the SANS profile and this can be explained by both an argument related to the relative lower 338
amount of nanotubes with respect to vesicles at 90degC but also to the steeper slope of flat 339
morphologies (-2) compared to tubes (-1) the signal of the former masking the tube signal at 340
low wavevector values The SANS profile is characterized by a diffraction peak at q= 0167 Aring-341
1 of which the assignment is refined by WAXS data 342
Temperature-driven WAXS experiments in Figure S 6bc (5 mgmL-1 and 25 mgmL-1 343
respectively) show a lamellar order possibly attributed to a multilamellar structure of the 344
vesicles (dv Figure S 6d) at high temperature and to the interplanar arrangement of the 345
crystalline flat structures (dL Figure S 6d) at T= 25degC The sharp (001) reflection indicates 346
typical interlamellar distance of 353 Aring at 25degC although this value varies with temperature 347
(400 Aring at 111degC 372 Aring at 88degC) thus confirming its assignment to a hydration-dependent 348
interlamellar order More intriguing is the second broader peak at q= 0403 Aring-1 (d= 156 Aring) 349
and its reflection both clearly visible at 88degC below Tm2 We attribute it to the inter-glucolipid 350
arrangement inside the tubular phase (dt Figure S 6d) coexisting with the vesicle phase 351
between Tm1 and Tm2 and to the planar lipid arrangement (di Figure S 6d) in the rigid flat 352
lamellar structure below Tm2 Its temperature- hence hydration- independent position also 353
confirms its structural origin Finally besides the water-structure peak at about 2 Aring-1 we also 354
observe a broad peak at 144 Aring-1 characteristics of the lateral packing (d Figure S 6d) of lipids 355
in bilayers While its position could be consistent with an Lα phase5758 above Tm2 its broadness 356
and positional invariance as well as the coexistence between vesicles and tubes do not allow a 357
precise assignment 358
15
Does G-C181-OH assume a bilayer or interdigitated structure the latter being the one 359
found for other similar bolaform glucolipids4243 The size of G-C181-OH can be estimated to 360
be at the most 32 Aring given by the length L of the C16 tail (L = 22 Aring from the Tanford formula 361
L= 154 + 1265 times n (n= 16)59) and the sugar (about 10 Aring)4243 However the cis conformation 362
of the C=C bond imposes a ldquokinkrdquo of 60deg in the aliphatic chain which reduces the effective 363
length of the oleic backbone to about 17 Aring for an effective total G-C181-OH length of about 364
27 Aring Cryo-TEM provides a tube thickness varying from 35 Aring to 60 Aring and a vesicle membrane 365
thickness of at least 60 Aring WAXS suggests an interlamellar thickness (membrane and water) 366
between 40 Aring and 37 Aring and an inter-lipid distance in the tube of about 16 Aring In the absence of 367
a clear form factor oscillation profile as found for similar glucolipids4243 one must 368
acknowledge that these data pledge neither in favor of fully interdigitated nor a double layer 369
structure and might suggest a tilted lipid arrangement with partial interdigitation60 370
371
13C ssNMR demonstrates that G-C181-OH can assume two coexisting head-head and 372
head-tail configurations 373
Vesicles are characterized by low positive mean and gaussian curvatures while 374
nanotubes are described by a combination of a high positive mean and zero gaussian curvatures 375
In this regard the coexistence of vesicles and nanotubes requires glucolipids to adapt 376
themselves to both environments at the same time For this reason the formation of nanotube-377
vesicle networks generally requires a specific driving force able to impose a high mean and 378
zero gaussian curvature to the membrane In many systems insertion of at least a second 379
constituent (lipid surfactant protein) in the membrane becomes a necessary internal driving 380
force for the nucleation and growth of so-called membrane inclusions from which 381
topologically-connected nanotubes can form10ndash123261 as explained by orientational ordering 382
arguments62 It has also been shown that external driving forces such as use of laser 383
ldquotweezersrdquo30 osmotic pressure6 electroformation5ndash82829 or controlled suction13ndash16 are 384
otherwise necessary as also supported by theoretical studies19 385
The bending energy of tubes is higher than that of a vesicle membrane8 due to the 386
dependence of the membrane free energy from the principal curvatures For this reason 387
isotropic (rotational symmetry along the main axis) but also anisotropic33 lipids generally 388
stabilize low-curvature shapes like flat membranes or vesicles Lipid nanotubes are also a 389
common phase formed by amphiphiles but generally for lipids with a certain complexity in 390
their molecular structures as exampled by diacetylenic derivatives of phospholipids among 391
others262763ndash65 Negative contributions to the bending energy favoring the simultaneous 392
16
presence of interconnected vesicles and tubes was shown to be driven by the presence of 393
anisotropic lipids in a membrane continuum Spontaneous deviations to the elastic theory in the 394
presence of surfactants lipids and proteins with anisotropic structures favor the formation of 395
protrusions with radius of the order of the fraction of a micron9ndash1219ndash2362 396
In the absence of both internal and external driving forces mentioned above G-C181-397
OH should behave as a standard lipid Its DSC profile (Figure 2)536667 under both hydrated and 398
dry conditions identifies a hydration-independent transition (Tm1) slightly above room 399
temperature this is followed by one main transition at higher temperature (Tm2) in the dry 400
sample50 For such a profile one expects a gel phase (Lβ) below Tm1 and a liquid crystalline 401
structure possibly in the morphology of vesicles (L4 phase) possibly above Tm1 and most likely 402
above Tm231 as experimentally found On the basis of the thermogram recorded on the dry 403
powder one may also expect a ldquoripplerdquo (Pβ) phase between Tm1 and Tm2 characterized by 404
periodic undulations of the bilayer (generally addressed to as regions with both liquid order and 405
disorder)5455 406
In the present work instead of a Lβ phase we observe flat crystals below Tm1 and a 407
vesicle-nanotube network instead of the ldquoripplerdquo phase The latter is particularly unexpected 408
because the membrane is composed of a single-component (G-C181-OH) and no anisotropic 409
external force (osmotic hydrodynamic electric) is used to pull and stabilize the tubes In 410
addition the nanotubes are observed at fairly high temperatures above Tm1 (between about 411
60degC and 90degC) while this morphology is generally favored at low temperature (proportionality 412
with 1kT figure 5 in Ref 62) commonly below a given transition temperature characteristics 413
for each specific amphiphile27 Furthermore nanotubes of G-C181-OH seem to be stable in 414
time thus differing from what is found in electroformed vesicles78 They are also observed 415
away from phase transition events (may them be at Tm1 or Tm2) as otherwise reported before 416
for a diacetylenic derivative of phosphatidylcholine26 and many other systems27 417
A stable nanotube-vesicle network for a single-component phospholipid in the absence 418
of external driving forces is not expected and has never been reported before It could be 419
explained by the coexistence of two micro-separated phases of different rigidity This 420
hypothesis is excluded by confocal microscopy on Laurdan-labelled membranes and magic 421
angle spinning (MAS) solid-state NMR (ssNMR) experiments 422
Laurdan is a well-known fluorophore used to put in evidence the coexistence of rigid 423
and fluid domains in both model and biological membranes47ndash49 Laurdan was used here to label 424
the G-C181-OH membranes between Tm1 and Tm2 and to verify the possible micro-segregation 425
and coexistence of rigid (eg Lβ λem= 440 nm) and fluid (eg Lα λem= 490 nm) domains in 426
17
tubes and vesicles respectively A set of quantitative experiments performed on a 5 mgmL-1 427
solution summarized in Figure 5 shows an excess of fluorescence at only λem= 490 nm for 428
temperature between 90degC and 70degC (Figure 5h) The GP value which quantifies the rigidfluid 429
character of the membrane is systematically negative (Figure 5i) indicating an overall fluid 430
membrane at all temperatures GP is quantified on more than 50 regions of interest (ROIs) at 431
each temperature including vesicles and tubes alone as well as connected nanotube-vesicles 432
(Figure 5d-g) The dispersion of GP at 80degC and 70degC between -08 and -02 could suggest the 433
spurious presence of membranes with various degrees of flexibility although fluidity is always 434
predominant The combination of WAXS (broad peak d= 144 Aring-1 invariant with 435
temperature Figure S 6bc) and confocal fluorescence microscopy using Laurdan confirms the 436
single-phase of the membrane composed of G-C181-OH both in vesicles and nanotubes This 437
is also consistent with the lack of phase transitions in DSC experiments between ~85degC and 438
~60degC especially in hydrated samples We conclude that the vesicle-nanotube transition is not 439
driven by the local segregation of gel phase (Lβ) microdomains nor that the nanotubes are 440
composed of such phase 441
ssNMR is the best-suited approach to investigate the origin of the local driving force for 442
the nucleation of anisotropic inclusions of which the average orientation depends on the local 443
membrane and inclusion curvatures and was shown to promote tubing62 ssNMR can provide 444
information on the local molecular mobility eg through the nuclear spin relaxation behavior 445
but also on intermolecular interactions and stereochemistry eg through variations in the 446
chemical shift68ndash70 447
Ideally ssNMR should be performed on diluted G-C181-OH samples above Tm1 448
However fast MAS necessary for high resolution centrifuges the sample As a first 449
approximation hydrated G-C181-OH samples for instance at 50 wt as classically done for 450
phospholipids71 could be studied Unfortunately permeability of the sample holder combined 451
to heating (close to the boiling point of water) and MAS provoke dehydration and even sample 452
ejection After experiencing both of the above this approach was abandoned As a second 453
approximation the study of the dehydrated G-C181-OH powder avoids centrifugation and 454
evaporation If studying dried lipids may not reflect their exact behaviour under diluted 455
conditions valuable structural information can still be obtained in dehydrated molecular 456
systems like proteins thus illustrating that this approach is not unreasonable Furthermore if 457
DSC (Figure 2a) shows that hydration suppresses the Tm2 it also shows that the value of Tm1 is 458
not affected by water at concentrations as low as 10 wt For this reason performing a 459
structural analysis of dehydrated G-C181-OH by ssNMR above Tm1 may help understanding 460
18
the local arrangement of G-C181-OH in two morphologies vesicles and nanotubes having 461
sensibly different curvatures 462
To explore the local mobility of the most relevant chemical groups of G-C181-OH 463
above Tm2 (T= 110degC) and between Tm2 and Tm1 (70 lt T degC lt 90) we combine a series of 1H 464
and 13C experiments Single-pulse (SP) MAS experiments (1H and 13C) when recorded under 465
quantitative conditions allow the detection of all chemical species while cross-polarization 466
(CP) MAS (13C only) experiments are sensitive only to constrained groups for which the 1H-467
13C dipolar coupling is not averaged to zero by the molecular motions 468
469
Figure 6 ndash a) 1H MAS (10 kHz) ssNMR spectra recorded from 110degC to 70degC b) 13C MAS (10 kHz) ssNMR 470
spectra recorded using high power decoupling single pulse (SP) and cross-polarization (CP) pulse sequences 471
Contact time for CP experiments and corresponding temperatures are given on each spectrum Full spectra 472
are given in Figure S 7 473
The most relevant 1H and 13C spectra are given in Figure 6 (full range in Figure 7 and 474
Figure S 7) As expected the 1H solid-state SPMAS spectra show broader peaks compared to 475
the solution-state NMR spectrum (Figure 6a) reflecting the obvious solid-state character of the 476
sample at any temperature The sugar group and the C=C bond resonate in the 25-6 ppm range 477
and 535 ppm respectively while the OH groups of the sugar moiety are found below 45 ppm 478
(Figure 6a full assignment in Table S 1) Very broad (~1 ppm) at 100degC the position of the 479
OH peak varies with the temperature value and becomes narrower (lt~05 ppm) and visible at 480
δH= 464 ppm at T= 70degC Line narrowing and chemical shift variations of the OH resonance 481
in ssNMR is always a direct sign of H-bonding interactions whereas the strength of the H-482
bonding hence its OHhellipH distance is correlated to a dispersion in chemical shifts72ndash75 All other 483
60 55 50 45 40 35 30 25
ppm
110
90
80
70
910
1rsquo
6rsquo16
1
OH
134 132 130 128 126
ppm110 108 106 104 102 100
ppm
SP (T= 110degC)
SP (T= 70degC)
CP 50 ms (T= 70degC)
CP 3 ms (T= 70degC)
910 1rsquo
1H 13C
1
811
910
CH2 CH2
1rsquo
6rsquo
a) b)
C102
13024
C9101
13003
C92
12869 C1rsquo210382
C1rsquo110443
C1rsquo13035
2rsquo3rsquo4rsquo
T degC
5rsquo
19
resonances broaden from 110degC to 70degC thus indicating slower andor more anisotropic 484
reorientational motions of all chemical groups The specific dynamic behaviour of the sugar 485
headgroup is also reflected by its 1H transverse relaxation time T2 whereas the shorter the T2 486
the higher the rigidity Experiments performed between 110degC and 70degC shown and 487
commented in Figure S 8 in the Supporting Information globally show a single short (lt 1 ms 488
below 100degC) T2 relaxation component for H1rsquo H5rsquo and H6rsquo and two both short and long 489
(between 4 ms and 12 ms) T2 for the acyl chain (CH2 H910 H811) even below 100degC 490
At 110degC 13C SPMAS experiments (Figure 6b full range in Figure 7 and Figure S 7 491
assignments in Table 1) show a single peak at δC= 10335 ppm for C1rsquo and at δC= 13003 ppm 492
for C910 as expected for a symmetrical conformation with two chemically-equivalent 493
carbons76 At 70degC the C1rsquo peak disappears while C910 now shows two peaks around 128 494
ppm and 130 ppm (Table 1 full temperature series in Figure S 7b) attributed to C92 (δC= 12869 495
ppm) and C10 in a non-symmetric configuration respectively for which these two carbons are 496
chemically inequivalent76 More precisely the resonance at 130 ppm is actually the 497
superposition of two close resonances C9101 (δC= 13003 ppm) and C102 (δC= 13024 ppm) 498
where subscripts 1 and 2 stand for two different conformations of the cis-olefin group as 499
reported for various phases of oleic acid in the vicinity of 0degC76 500
501
Table 1 ndash 13C Chemical shifts of G-C181-OH in solution and solid-state Solid-state experiments are 502
recorded at MAS= 10 kHz All spectra are reported in Figure 7 and Figure S 7 The contact time for cross 503
polarization is 3 ms In all ssNMR experiments temperature is first raised at 110degC and then lowered to 504
either 90degC or 70degC Attribution of the 13C resonances in Table 1 is performed on the basis of the solution 505
spectrum (Figure S 1b) Additional peaks observed in both single pulse and cross polarization ssNMR 506
experiments are attributed when possible to a configuration effect of the given atom eg C9101 and C92 507
indicate two configurations of C9 All new peaks observed in solid-state and not detected in solution are 508
highlighted in red for convenience 509
510
511
δ ppm
Peak Liquid (DMSO-d6)
Solid Single Pulse
T= 110degC
Solid Single Pulse
T= 90degC
Solid Single Pulse
T= 70degC
Solid Cross Polarization
T= 70degC
C102
- - 13024 13024
C910C9101 13009 13003 13003 13003 13003
C1C9C10C1rsquo
C6rsquo
20
C92 - - - 12869 12869
C1rsquoC11 10329 10335 10335 - 10443
C12 - - - - 10382
C3 7724 7709 7702 - 7829
- 7634 7629 - 7621
7525
C2 7388 7398 7390 7370 7370
C4 7052 7077 7054 7041 7098
C16 6900 7016 - - 7029
- - - - 6793
C1C5C6 6153 6241 6236 6239 6262
C1C5C6 6117 - - - 5956
C2 3300 3290 3290 3283 3279
CH2(trans) - - - 3198 3196
CH2(gauche)C15 2941 2981 2987 3004 -
C811 2706 2747 2747 2832 2817
CH2 2597 2625 2628 2630 2817
512
13C CPMAS spectra at 70degC (Figure 6b full range in Figure 7 and Figure S 7d) at 513
increasing contact times confirm the presence of two cis-olefin environments one for which 514
C910 are equivalent labelled here C9101 and one for which they are inequivalent labelled 515
C92 C102 Both environments are rigid enough to be observed at short contact time (tc= 50 μs) 516
A similar double environment is also observed for the sugar C1rsquo CPMAS at 70degC shows two 517
peaks (C1rsquo1 at δC= 10443 ppm C1rsquo2 at δC= 10382 ppm Figure 6b Figure S 7d) These are 518
significantly shifted downfield from the C1rsquo peak observed at 110degC and are detected at contact 519
times as short as 50 μs thus indicating their rigid character One also finds that CPMAS is 520
totally inefficient at 100degC for short contact times (50 μs) and poorly efficient even at 3 ms 521
typical of fast-tumbling molecules (Figure S 7c) also both gauche (δC= 3004 ppm) and all-522
trans (δC= 3198 ppm) conformations of the CH2 carbons coexist at 70degC (Figure S 7b)77 523
According to ssNMR one main mobile molecular environment exists at 110degC as 524
shown by the well-resolved 1H spectrum single C=C (C9101) and anomeric (C1rsquo) resonances 525
gauche conformation of the aliphatic CH2 and single T2 of the aliphatic CH2 chain and sugar 526
protons The sugar group is certainly mobile (inefficient 1H13C CPMAS) but still more 527
constrainted than the acyl chain (shorter T2 (1H)) As the temperature is lowered the overall 528
rigidity increases (broadening of 1H NMR peaks faster 1H transverse relaxation and efficient 529
1H13C magnetization transfer during CPMAS) presumably driven by H-bonding 530
interactions (downfield shift and line narrowing of the OH 1H signal very short OH T2 loss of 531
the C1rsquo signal in SPMAS) At the same time a number of spectroscopic data (two concomitant 532
21
resonances for anomeric C1rsquo1 and C1rsquo2 cis-olefin C9101 and C92 C102 and CH2 gauche and 533
all-trans environments) and relaxation behaviour (fast and slow T2 relaxation components) 534
strongly suggests the coexistence of two molecular environments Further proofs of the 535
coexistence of two distinct molecular domains are given by a number of chemical shift 536
variations in the 13C CPMAS spectrum at 70degC compared to the one at 110degC 90degC and 537
solution This is shown in Figure 7 and in the list of 13C chemical shifts in Table 1 538
539
540
Figure 7 - Comparison between solution- and solid-state 13C NMR spectra of G-C181-OH Solid-state 541
experiments are recorded directly on the sample powder at a MAS of 10 kHz (4 mm zirconia rotor) SP 542
Single Pulse CP Cross Polarization In all the ssNMR experiments temperature is first raised at 110degC 543
and then lowered to either 90degC or 70degC Segmented lines are meant to highlight the known peak position 544
in solution thus stressing the strong chemical shift variations in the solid-state 545
546
NMR experiments above Tm2 suggest that vesicles could contain G-C181-OH with a 547
single family of mobile conformations characterized by chemically-equivalent C=C (red 548
Figure 8b) and a single C1rsquo conformation (green Figure 8b) Experiments between Tm1 and Tm2 549
otherwise suggest that two coexisting conformations characterized by chemically-equivalent 550
(red Figure 8b) and inequivalent (magenta Figure 8b) C=C could be associated to nanotubes 551
Two distinct C1rsquo sites (grey Figure 8b) also indicate two configurations of the sugar headgroup 552
A comment on this point will be given in the following paragraphs 553
The local (Aring-scale) variation of molecular mobility below Tm2 drives the coexistence of 554
two distinct molecular environments of the same G-C181-OH molecule This occurs within a 555
single-phase domain (as deduced by WAXS) of equivalent membrane rigidity (as derived from 556
Laurdan probe in confocal microscopy) Although never reported before the difference in the 557
local mobility of the same amphiphile (here G-C181-OH) could satisfy the theoretically-558
140 120 100 80 60 40 20
CP(3 ms)-70degC
SP-70degC
SP-90degC
SP-110degC
ppm
LiquidC910
C1rsquo
C2rsquo
C4rsquo
C3rsquo
C1
C6rsquoC5rsquo
C1
6
C8
11
C2 C
H2
C1
5
CH
2
DM
SO
13C
22
required conditions that induce local lipid segregation and formation of membrane inclusions 559
(Figure 8c) In case of their non-zero average orientation the local membrane curvature 560
increases62 and nanotubes can spontaneously form (Figure 8bc) More intriguing this 561
mechanism occurs at least 10degC above Tm1 although it should not be favored above the Tm27 562
From both experimental and theoretical backgrounds the conditions of topologically-563
connected vesicles-nanotubes systems are met only when either internal (two components) or 564
external driving forces are applied19 In the present single-lipid system of which the phase 565
behavior is summarized in Figure 8a the most plausible driving force could be explained by 566
the NMR results collected on the dry sample G-C181-OH concomitantly occupies two 567
molecular environments characterized by 1) two distinct conformations of the sugar 568
displaying equivalent mobility and 2) two conformations of the acyl chain unsaturation 569
570
23
571
Figure 8 ndash a) Thermotropic phase behavior of G-C181-OH at 5 mgmL-1 Note that Tm2 is observed on the 572
dry powder only b) Possible relationship between the molecular environment as derived from NMR and 573
membrane curvatures All the molecular drawings refer to the same G-C181-OH molecule (bulky ellipsoid 574
equiv sugar headgroup) while each color corresponds to a given configuration Grey of C1rsquo1 and C1rsquo2 indicates 575
the uncertainty about the assignment of the specific NMR peak The curvature C is defined as 1R R being 576
the curvature radius R1 R2 radius of curvature CG Gauss curvature CM Mean curvature c) Free 577
interpretation of the anisotropic high-curvature (CMgt 0 CG= 0) inclusions in the membrane (low CM and 578
CG) continuum driven by inter-sugar H-bonding and reduced intramembrane diffusion for a G-C181-OH 579
glucolipid 580
581
Flat crystalline structure
Nanotube-vesicle network
Vesicles
48degC
120deg
106 105 104 103 102 101
ppm
H9 H10H1rsquo
106 105 104 103 102 101
ppm106 105 104 103 102 101
ppm106 105 104 103 102 101
ppm
C=CC=C
C1rsquo1C1rsquo2
C1rsquo
Tm2(96degC)Tm1
a)
b)
c)
Same molecule different local orientations and sugar conformations
High curvature membrane
Low curvature inclusion
Flip-FlopStrong H-bonding
CG
CM ( + )
CG 0
CM 0 CG 0
CM 0
G-C181-OH
24
Two related questions are unanswered at the moment What actually drives nanotube 582
formation and is the organization of G-C181-OH within the vesicles and tubes the same Lipid 583
nanotubes have been studied for at least three decades over which broad experimental and 584
theoretical insight has been generated Despite this fact the actual understanding is still matter 585
of debate27 Micelle-to-nanotube and vesicle-to-nanotube phase transitions are generally 586
reported for single amphiphiles below a given Tm and intermediate phase composed of twisted 587
and flat fibers is concomitantly reported Initially thought to be a chirality-driven phenomenon 588
recent studies propose a more general mechanism involving crystallization and symmetry 589
breaking in the lipid packing driven by optimal packing27 If twisted ribbons were observed 590
before for a number of microbial glycolipid bolaamphiphiles44 they are not found for G-C181-591
OH This fact as well as the large body of cryo-TEM images and the observation of nanotubes 592
above Tm1 rather pledge in favour of a direct topological change from positive (vesicles) to 593
zero (nanotubes) Gaussian curvatures In this case vesicle-to-nanotube transitions could be 594
driven by external forces56307813ndash162829 595
Considering the absence of external forces in the present system there are only two 596
possibilities left spontaneous budding of the membrane or nanotube pulling after inter-vesicle 597
collisions due to Brownian motion Both are possible as inclusions composed of a different 598
arrangement of the same molecule in the membrane continuum can theoretically explain 599
spontaneous nanotube formation in an isotropic medium672223629ndash1218ndash21 However the second 600
one is probably more likely to prevail because it could explain the large number of nanotubes 601
connecting two distant vesicles Interestingly similar events occur for any phospholipid-based 602
vesicular solution but nanotubes are extremely rare unless at least two lipids of different 603
molecular structure are mixed together The spectroscopic 1H and 13C and relaxation (1H) 604
ssNMR data even if collected on a dry powder demonstrate that the coexistence of two G-605
C181-OH configurations involving both the sugar headgroup and fatty alcohol chain are 606
possible for this molecule As a matter of fact this is not so surprising as more than one energy 607
minima each corresponding to a given conformation are known for glucose its non-reducing 608
derivative methylglucose and carbohydrates in general78ndash80 609
The presence of two configurations could explain the coexistence between two 610
structures of different curvature but the data presented so far do not explain the origin of these 611
two configurations In other words what drives the change in the local structure of the sugar 612
headgroup and fatty alcohol within the membrane 613
The association of known self-assembled structures to spectroscopic 13C ssNMR data is 614
known for years in particular for gluconamides lipids having a linear sugar headgroup81ndash84 It 615
25
was found that gauche effects in some cases up to the γ position in the sugar chain induce 616
upfield chemical shifts while anti and trans conformations result in downfield shifts Each 617
structure (monolayer crystal bilayer crystal or micellar fiber) was then characterized by a given 618
organization of the gluconamide and a characteristic 13C ssNMR fingerprint which could be 619
explained by gauche γ-gauche anti and trans conformations of the headgroup Similar 620
structural-spectroscopic correlations have been collected over the years for much simpler cyclic 621
sugars85 whereas pyranoses can undergo important conformational changes (chair half-chair 622
boat skew) when the appropriate energy barriers are crossed78ndash8086 A quantitative 623
conformational study based on the 13C chemical shift variations shown in Table 1 would be 624
certainly helpful but very delicate in the context of the present state of the art because a 625
rigorous approach requires at least one known crystal structure8182 which is currently missing 626
for this compound A qualitative approach will then be adopted 627
G-C181-OH is a bolaform amphiphile and flip-flop could be a possible mechanism 628
involved in the nanotube stabilization whereas head-tail interactions have long been considered 629
as important in nanotube-forming bolaform amphiphiles6063 From mere considerations based 630
on T2 (1H) relaxation arguments one could exclude head-tail configurations if the R-CH2OH 631
endgroup (H1) was involved in a direct interaction with the sugar group its corresponding T2 632
would probably be comparable to the sugarrsquos one (OH and H1rsquo) but this does not seem to be 633
the case However this hypothesis would be based on the comparison of the relaxation from 634
CH and CH2 protons additionally involved in different kind of motions Besides the relaxation 635
of H1 is influenced by the strong overlap between H1 and H5rsquo For these reasons relaxation 636
arguments are not solid enough and will not be used 637
We then address this question by exploring intermolecular interactions in a direct 638
manner using 2D 1H-1H homonuclear ssNMR correlation spectroscopy At 90degC in the fast-639
tumbling domain of molecular motion (narrow 1H NMR peaks Figure 6a) and corresponding 640
to the vesicle-rich region spin diffusion (NOESY) experiments are preferred over dipolar 641
coupling based experiments because such interaction is averaged out by molecular motion 642
However when the molecular motion is more constrained in the domain of nanotube stability 643
at 70degC (broad 1H spectra Figure 6a) Double-Quantum Single-Quantum (DQ-SQ) correlation 644
experiments are best suited to probe interaction between close molecular neighbors These 645
experiments are reported in Figure 9 and the related interpretation is only briefly reported 646
below while a more detailed discussion can be found on Page 12 in the Supporting Information 647
26
648
Figure 9 ndash a) 2D 1H-1H NOESY NMR experiment performed at MAS= 10 kHz (4 mm probe) on a Bruker 649
300 MHz Avance III HD spectrometer using 300 ms of mixing time Sample temperature is regulated to 650
90degC reached by cooling from 110degC b) 2D 1H-1H DQ-SQ (BAck-to-BAck BABA pulse sequence used for 651
the DQ excitation scheme) NMR experiment performed at MAS= 22 kHz (25 mm probe) on a Bruker 700 652
MHz Avance III spectrometer using a DQ excitation time equal to 2 rotor periods Sample temperature is 653
regulated to 70degC reached by cooling from 110degC The typical schemes illustrating how to interpret these 654
2D experiments are reported above each experimental map Zooms of the sugar region and configurational 655
interpretation are given below each 2D map More information are given in the text below 656
H16-H16
H1-H1
H9-H10
H1rsquo-H1
H1rsquoH910 H16
H1
H1rsquo-H1rsquo
Hxrsquo-Hxrsquo
2
(pp
m)
(ppm)
315
811910 1rsquo
2rsquo2
3rsquo 4rsquo6rsquo
5rsquo
1rsquo2910
asymp asymp asympHDO MeOD Acetone
1
315
811 9101rsquo
2rsquo2
3rsquo4rsquo6rsquo
5rsquo
1rsquo2 9 10
asympasympasympHDOMeODAcetone
H1rsquo-H1
1rsquo
1
(p
pm
)
(ppm)
H1-H2
H1rsquo-H1
H1rsquo
H910
H1H5rsquo
H2
H1rsquo-H5rsquo
315
811910 1rsquo
2rsquo2
3rsquo 4rsquo6rsquo
5rsquo
1rsquo2910
asymp asymp asympHDO MeOD Acetone
1
H2rsquoH3rsquoH4rsquo
H2rsquoH3rsquoH4rsquo
X= 2rsquo3rsquo4rsquo
NOESY - T= 90degC
1H
1H
1H
1H
DQ-SQ - T= 70degC
a) b)
2
(pp
m)
(p
pm
)
(ppm)
A B
AhellipB
AhellipA
BhellipB
NOESY
(ppm)
A B
AhellipB
DQ-SQ
Single-quantum dimension
Do
ub
le-q
ua
ntu
m d
imen
sio
n
AhellipA
BhellipB
BhellipA
BhellipA
315
811910 1rsquo
2rsquo2
3rsquo 4rsquo6rsquo
5rsquo
1rsquo2910
asymp asymp asympHDO MeOD Acetone
1
lt 5 Aring
lt 5 Aring
H1-H2
H811
H15
H16
H6rsquo
H1rsquo
H1
H5rsquo
H2
H1-H2
H1rsquo-H1
H1rsquo-H5rsquo
H1rsquo
H1 H5rsquo
H1rsquo
H1
H5rsquo
H1H2rsquo H3rsquo H4rsquo
H1-H1
H1rsquo-H1
Hxrsquo-HxrsquoX= 2rsquo3rsquo4rsquo
H1-H2
H1rsquo
Zoom sugar region 28 ndash 45 ppmNOESY DQ-SQ
27
Head-tail or head-head configurations could be probed by the existence of H1rsquo-H1 657
interactions whereas H1 (δH= 356 ppm) is associated to the glucolipid tail and H1rsquo (δH= 432 658
ppm) to the sugar headgroup These atoms are more than 15 Aring apart and a direct interaction 659
could not be observed in both NOESY and DQ-SQ experiments NOESY experiments (Figure 660
9a) show that H1rsquo-H1 correlations are not observed Meanwhile clear-cut direct H1rsquo-H1 661
interactions are indeed observed are detected at T= 70degC (DQ cross-peaks related to H1rsquo-H1 662
correlation in DQ-SQ experiment shown in Figure 9b) Interestingly the absence of auto peaks 663
at δH= 432 ppm and δH= 335 ppm in the SQ dimension excludes H1rsquo-H1rsquo and Hxrsquo-Hxrsquo (x= 2 664
3 4) interactions respectively strengthening the idea that sugar headgroups from two nearest-665
neighbor G-C181-OH molecules are not adjacent in the nanotube-vesicle region 666
Homonuclear 2D ssNMR supports the idea according to which G-C181-OH can 667
undergo molecular flip-flops and a head-tail arrangement in the dry product Extrapolating these 668
conclusions in the lower concentration range lack of H1rsquo-H1 proximity at T= 90degC suggests a 669
head-head configuration in the vesicle-rich region and head-tail configuration within the 670
nanotubes It is however still unclear whether flip-flops are driven by spontaneous temperature-671
induced conformational changes in the glucolipid packing stimulating inclusions within the 672
membrane itself672223629ndash1218ndash21 or by defects generated by inter-vesicle collisions In fact a 673
combination of both is not unlikely Nanotubes are not stable when temperature is 20 to 30 674
degrees above Tm1 indicating that inter-vesicle collisions alone cannot explain the unusual 675
phenomenon In an energy landscape approach87 the head-head configuration is certainly 676
favored at high temperature while both head-head and head-tail configurations could be 677
favored in the mid-temperature region corresponding to the range between Tm1 and Tm2 in the 678
dry powder Both statistical and defect-induced flip-flop events contribute to form high mean 679
zero Gaussian curvature morphologies (nanotubes) for which the head-tail conformation 680
limiting the proximity between bulky sugar headgroups is probably more adapted (Figure 8c) 681
The flip-flop interpretation now reasonably explains the strong differences in the sugar and fatty 682
alcohol conformations deduced by the multiple NMR signals attributed to chemically-683
equivalent groups The existence of various low-energy conformations each having specific 684
NMR signature for sugars in solution78ndash8086 and solid-state81ndash84 further supports our 685
interpretation 686
One last point should be clarified Why between Tm1 and Tm2 are two molecular 687
environments able to coexist instead of a single one of average rigidity as found in the case of 688
ldquoripplerdquo phases50ndash54 We believe that this question can be answered based on the NMR results 689
the relatively short T2 values of the H1rsquo and OH protons shows the constrained mobility of the 690
28
sugar headgroup despite a certain flexibility of the chain (long T2 component) This trend may 691
suggest restrictions in translational mobility probably due to the sugar-OH hydrogen bonding 692
(Figure 8c) meaning that lipids are not able to diffuse within the membrane thus keeping two 693
different configurations stable 694
695
Conclusions 696
Topologically-connected nanotube-vesicle lipidic systems are commonly observed for 697
self-assembled membranes composed of at least two amphiphiles and spontaneously driven by 698
anisotropic inclusions andor by external directional forces This work shows that strong 699
differences in membrane curvature can spontaneously occur in single-lipid systems without 700
external anisotropic forces Coexistence and interconnection between nanotubes and vesicles 701
are evidenced via cryo-TEM and fluorescence confocal microscopy in a single-phase region at 702
temperature above a transition temperature Tm1= 483degC determined by DSC on the hydrated 703
sample but below the second transition temperature Tm2 (957degC) determined by DSC on the 704
dry powder X-ray diffraction (WAXS) also shows the coexistence of two lattice periods one 705
attributed to an inter-membrane repeating distance and the other possibly related to the intra-706
nanotube glucolipid arrangement Labelling the systems with Laurdan a fluorophore of which 707
the emission strongly varies with the local membrane rigidity excludes the presence of rigid 708
micro-separated phases (eg Lβ) 709
1H and 13C ssNMR despite the fact that it can only be performed on the dry powder 710
confirm the presence of one main fluid G-C181-OH environment above Tm2 Below Tm2 the 711
splitting of some 13C peaks and the coexistence of short and long 1H relaxation components 712
demonstrate that G-C181-OH can simultaneously pack into structurally and dynamically 713
inequivalent environments Combining advanced 2D 1H-1H correlation experiments based on 714
spin diffusion or double-quanta excitation suggests that vesicles could contain a preferred head-715
head configuration of the bolaform lipid while nanotubes a preferred head-tail assembly 716
The presence of two environments composed of the same molecule characterized by 717
different molecular configurations and rigidity fulfills the theoretical conditions necessary to 718
spontaneously nucleate a membrane inclusion of non-zero average orientation described as 719
necessary to observe topologically-connected nanotube-vesicle structures in the absence of 720
external forces This hypothesis could also be enriched by the possibility of nanotubes to be 721
pulled away between two vesicles after a collision event 722
This work expands the actual theoretical and experimental framework on lipid networks 723
stabilized by a different radius of curvature It could also motivate the synthesis or isolation 724
29
of new lipids providing a higher level of 3D architectural control in soft networks possibly in 725
the range of room temperature 726
727
Acknowledgements 728
Dr Andrea Lassenberger and Dr Sylvain Preacutevost at Institut Laue Langevin (ILL Grenoble 729
France) are kindly acknowledged for their assistance on the SANS experiment Confocal 730
images were performed at the Institut de Biologie Paris Seine (IBPS) imaging facility Jean-731
Franccedilois Gilles (Imaging Core Facility Institut de Biologie Paris Seine (IBPS) CNRS 732
Sorbonne Universiteacute Paris France) is kindly acknowledged for his assistance on the confocal 733
microscopy imaging Dr Guillaume Laurent (LCMCP Sorbonne Universiteacute Paris France) is 734
kindly acknowledged for helpful discussions The French region Ile-de-France SESAME 735
program is acknowledged for financial support (700 MHz NMR 736
spectrometer) Dr Olivier Diat (ICSM Marcoule France) Prof eronikaIglič and Prof V Aleš737
onsul discussi Slovenia) are kindly acknowledged for helpfUniversity of LjubljanaIglič (-Kralj 738
739
Financial support 740
WAXS experiments have been supported by Soleil Light Source Saint Aubin France proposal 741
Ndeg 20201747 SANS experiments have been supported by ILL proposal Ndeg9-13-778 742
743
References 744
1 D Kabaso N Bobrovska W Goacuteźdź E Gongadze V Kralj-Iglič R Zorec and A 745
Iglič Bioelectrochemistry 2012 87 204ndash210 746
2 C R Safinya U Raviv D J Needleman A Zidovska M C Choi M A Ojeda-747
Lopez K K Ewert Y Li H P Miller J Quispe B Carragher C S Potter M W 748
Kim S C Feinstein and L Wilson Adv Mater 2011 23 2260ndash2270 749
3 P Veranič M Lokar G J Schuumltz J Weghuber S Wieser H Haumlgerstrand V Kralj-750
Iglič and A Iglič Biophys J 2008 95 4416ndash4425 751
4 A Rustom R Saffrich I Markovic P Walther and H-H Gerdes Science (80- ) 752
2004 303 1007ndash1010 753
5 M I Angelova S Soleacuteau P Meacuteleacuteard F Faucon and P Bothorel Prog Colloid 754
Polym Sci 1992 89 127ndash131 755
6 L Mathivet S Cribier and P F Devaux Biophys J 1996 70 1112ndash1121 756
7 V Kralj-Iglič G Gomišček J Majhenc V Arrigler and S Svetina Colloids Surfaces 757
A Physicochem Eng Asp 2001 181 315ndash318 758
30
8 V Kralj-Iglič A Iglič G Gomišček F Sevšek V Arrigler and H Haumlgerstrand J 759
Phys A Math Gen 2002 35 1533ndash1549 760
9 M Drab D Stopar V Kralj-Iglič and A Iglič Cells 2019 8 626 761
10 A Zidovska K K Ewert J Quispe B Carragher C S Potter and C R Safinya 762
Langmuir 2009 25 2979ndash2985 763
11 A Zidovska K K Ewert J Quispe B Carragher C S Potter and C R Safinya Soft 764
Matter 2011 7 8363ndash8369 765
12 A Zidovska K K Ewert J Quispe B Carragher C S Potter and C R Safinya 766
Biochim Biophys Acta - Biomembr 2009 1788 1869ndash1876 767
13 M Karlsson K Sott M Davidson A S Cans P Linderholm D Chiu and O Orwar 768
Proc Natl Acad Sci U S A 2002 99 11573ndash11578 769
14 A Karlsson R Karlsson M Karlsson A-S Cans A Stromberg F Ryttsen and O 770
Orwar Nature 2001 409 150ndash152 771
15 M Karlsson K Sott A S Cans A Karlsson R Karlsson and O Orwar Langmuir 772
2001 17 6754ndash6758 773
16 E Evans H Bowman A Leung D Needham and D Tirrell Science (80- ) 1996 774
273 933ndash935 775
17 U Seifert Configurations of fluid membranes and vesicles 1997 vol 46 776
18 J Kaumls and E Sackmann Biophys J 1991 60 825ndash844 777
19 N Bobrovska W Goacuteźdź V Kralj-Iglič and A Iglič PLoS One 2013 8 e73941 778
20 A Iglič B Babnik K Bohinc M Fošnarič H Haumlgerstrand and V Kralj-Iglič J 779
Biomech 2007 40 579ndash585 780
21 K Bohinc T Slivnik A Iglič M Brumen and V Kralj-Iglič J Phys Chem C 2007 781
111 9709ndash9718 782
22 A Iglič H Haumlgerstrand P Veranič A Plemenitaš and V Kralj-Iglič J Theor Biol 783
2006 240 368ndash373 784
23 V Kralj-Iglič and P Veranič Adv Planar Lipid Bilayers Liposomes 2006 5 129ndash785
149 786
24 A Iglic and V Kralj-Iglic Adv Planar Lipid Bilayers Liposomes 2006 4 253ndash279 787
25 S Penič L Mesarec M Fošnarič L Mroacutewczyńska H Haumlgerstrand V Kralj-Iglič and 788
A Iglič Front Phys 2020 8 342 789
26 P Yager and P E Schoen Mol Cryst Liq Cryst 1984 106 371ndash381 790
27 T G Barclay K Constantopoulos and J Matisons Chem Rev 2014 114 10217ndash791
10291 792
31
28 B Božič G Gomišček V Kralj-Iglič S Svetina and B Žekš Eur Biophys J 2002 793
31 487ndash496 794
29 A Iglič H Haumlgerstrand M Bobrowska-Haumlgerstrand V Arrigler and V Kralj-Iglič 795
Phys Lett A 2003 310 493ndash497 796
30 R Bar-Ziv and E Moses Phys Rev Lett 1994 73 1392ndash1395 797
31 S Chiruvolu H E Warriner E Naranjo S H Idziak J O Raumldler R J Plano J A 798
Zasadzinski and C R Safinya Science (80- ) 1994 266 1222ndash1225 799
32 V Kralj-Iglič A Iglič H Haumlgerstrand and P Peterlin Phys Rev E 2000 61 4230ndash800
4234 801
33 L Mesarec M Drab S Penič V Kralj-Iglič and A Iglič Int J Mol Sci 2021 22 802
2348 803
34 L Van Renterghem S L K W Roelants N Baccile K Uyttersprot M C Taelman 804
B Everaert S Mincke S Ledegen S Debrouwer K Scholtens C V Stevens W 805
Soetaert L Van Renterghem S L K W Roelants N Baccile K Uytersprot M C 806
Taelman B Everaert S Mincke S Ledegen S Debrouwer K Scholtens C V 807
Stevens and W Soetaert Biotechnol Bioeng 2018 115 1195ndash1206 808
35 J Clark and F Deswarte Introduction to Chemicals from Biomass Second Edition 809
John Wiley amp Sons 2015 810
36 K V Sajna R Houmlfer R K Sukumaran L D Gottumukkala and A Pandey in 811
Industrial Biorefineries and White Biotechnology eds A Pandey R Houmlfer M 812
Taherzadeh K M Nampoothiri and C Larroche Amsterdam Oxford Waltham 813
Elsevier 2015 pp 499ndash521 814
37 R Marchant and I M Banat Trends Biotechnol 2012 30 558ndash565 815
38 K Hill and C LeHen-Ferrenbach in Sugar-Based Surfactants Fundamentals and 816
Applications ed C C Ruiz Boca Raton CRC Press 2009 pp 1ndash20 817
39 L Rodrigues I M Banat J Teixeira and R Oliveira J Antimicrob Chemother 818
2006 57 609ndash618 819
40 J D Desai and I M Banat Microbiol Mol Biol Rev 1997 61 47ndash64 820
41 S L K W Roelants K Ciesielska S L De Maeseneire H Moens B Everaert S 821
Verweire Q Denon B Vanlerberghe I N A Van Bogaert P Van der Meeren B 822
Devreese and W Soetaert Biotechnol Bioeng 2016 113 550ndash559 823
42 N Baccile M Selmane P Le Griel S Preacutevost J Perez C V Stevens E Delbeke S 824
Zibek M Guenther W Soetaert I N A Van Bogaert and S Roelants Langmuir 825
2016 32 6343ndash6359 826
32
43 N Baccile A-S Cuvier S Preacutevost C V Stevens E Delbeke J Berton W Soetaert 827
I N A Van Bogaert and S Roelants Langmuir 2016 32 10881ndash10894 828
44 N Baccile C Seyrig A Poirier S A Castro S L K W Roelants and S Abel Green 829
Chem 2021 23 3842ndash3944 830
45 A Salis L Cappai C Carucci D F Parsons and M Monduzzi J Phys Chem Lett 831
2020 11 6805ndash6811 832
46 J Schindelin I Arganda-Carreras E Frise V Kaynig M Longair T Pietzsch S 833
Preibisch C Rueden S Saalfeld B Schmid J-Y Tinevez D J White V 834
Hartenstein K Eliceiri P Tomancak and A Cardona Nat Methods 2012 9 676ndash835
682 836
47 T Parasassi and E Gratton J Fluoresc 1995 5 59ndash69 837
48 M M Dodes Traian F L Gonzaacutelez Flecha and V Levi J Lipid Res 2012 53 609ndash838
616 839
49 D M Owen C Rentero A Magenau A Abu-Siniyeh and K Gaus Nat Protoc 840
2012 7 24ndash35 841
50 W Stillwell in An Introduction to Biological Membranes Academic Press 2016 pp 842
135ndash180 843
51 W Stillwell in An Introduction to Biological Membranes Academic Press 2016 pp 844
181ndash220 845
52 B Tenchov Chem Phys Lipids 1991 57 165ndash177 846
53 R Koynova and M Caffrey Biochim Biophys Acta 1998 1376 91ndash145 847
54 F Schmid S Dolezel O Lenz and S Meinhardt J Phys Conf Ser 2014 487 848
012004 849
55 S Meinhardt R L C Vink and F Schmid Proc Natl Acad Sci U S A 2013 110 850
4476ndash4481 851
56 O Glatter and O Kratky Small Angle X-ray Scattering Academic Press London 852
1982 853
57 B A Cunningham A D Brown D H Wolfe W P Williams and A Brain Phys 854
Rev E 1998 58 3662ndash3672 855
58 M Nadler A Steiner T Dvir O Szekely P Szekely A Ginsburg R Asor R Resh 856
C Tamburu M Peres and U Raviv Soft Matter 2011 7 1512ndash1523 857
59 C Tanford The hydrophobic effect Formation of micelles and biological membranes 858
John Wiley amp Sons Inc New York 1973 859
60 M Masuda and T Shimizu Langmuir 2004 20 5969ndash5977 860
33
61 A Zidovska K K Ewert J Quispe B Carragher C S Potter and C R Safinya 861
Block Liposomes Vesicles of Charged Lipids with Distinctly Shaped Nanoscale 862
Sphere- Pear- Tube- or Rod-Segments Elsevier Inc 1st edn 2009 vol 465 863
62 A Iglic V Kralj-Iglic B Božič M Bobrowska-Haumlgerstrand B Isomaa and H 864
Haumlgerstrand Bioelectrochemistry 2000 52 203ndash211 865
63 T Shimizu M Masuda and H Minamikawa Chem Rev 2005 105 1401ndash1444 866
64 J V Selinger and J M Schnur Phys Rev Lett 1993 71 4091ndash4094 867
65 J M Schnur Science (80- ) 1993 262 1669ndash1676 868
66 B Tenchov R Koynova and G Rapp Biophys J 2001 80 1873ndash1890 869
67 R Koynova and B Tenchov Ser Biomech 2017 31 3ndash19 870
68 S J Angyal and R Le Fur Carbohydr Res 1984 126 15ndash26 871
69 J K Whitesell and M A Minton J Am Chem Soc 1987 109 225ndash228 872
70 T Takayama S Ando and I Ando J Mol Struct 1990 220 245ndash250 873
71 K Gawrisch N V Eldho and I V Polozov Chem Phys Lipids 2002 116 135ndash151 874
72 F Tielens C Gervais J F Lambert F Mauri and D Costa Chem Mater 2008 20 875
3336ndash3344 876
73 G A Jeffrey and Y Yeon Acta Crystallogr Sect B 1986 42 410ndash413 877
74 B Berglund and R W Vaughan J Chem Phys 1980 73 2037ndash2043 878
75 C Gervais C Coelho T Azaiumls J Maquet G Laurent F Pourpoint C Bonhomme 879
P Florian B Alonso G Guerrero P H Mutin and F Mauri J Magn Reson 2007 880
187 131ndash140 881
76 C Akita T Kawaguchi F Kaneko H Yamamoto and M Suzuki J Phys Chem B 882
2004 108 4862ndash4868 883
77 R N Purusottam L Seacutenicourt J J Lacapegravere and P Tekely Biochim Biophys Acta - 884
Biomembr 2015 1848 3134ndash3139 885
78 X Biarneacutes A Ardegravevol A Planas C Rovira A Laio and M Parrinello J Am Chem 886
Soc 2007 129 10686ndash10693 887
79 L M J Kroon‐Batenburg and J Kroon Biopolymers 1990 29 1243ndash1248 888
80 K N Kirschner and R J Woods Proc Natl Acad Sci U S A 2001 98 10541ndash889
10545 890
81 S Svenson B Kirste and J H Fuhrhop J Am Chem Soc 1994 116 11969ndash11975 891
82 I Sack S Macholl J H Fuhrhop and G Buntkowsky Phys Chem Chem Phys 892
2000 2 1781ndash1788 893
83 S Svenson J Koening and J H Fuhrhop J Phys Chem 1994 98 1022ndash1028 894
34
84 S Svenson A Schaefer and J H Fuhrhop J Chem Soc Perkin Trans 2 1994 2 895
1023ndash1028 896
85 K Bock and C Pedersen Adv Carbohydr Chem Biochem 1983 41 27ndash66 897
86 T B Grindley Structure and Conformation of Carbohydrates Springer Berlin 898
Heidelberg 2008 899
87 F Tantakitti J Boekhoven X Wang R V Kazantsev T Yu J Li E Zhuang R 900
Zandi J H Ortony C J Newcomb L C Palmer G S Shekhawat M O De La 901
Cruz G C Schatz and S I Stupp Nat Mater 2016 15 469ndash476 902
903
1
Supporting Information 904
905
Topological connection between vesicles and nanotubes in single-906
component lipid membranes driven by head-tail interactions 907
908
Niki Baccilea Ceacutedric Lorthioira Abdoul Aziz Baa Patrick Le Griela Cristina Coelhob Javier 909
Perezc Wim Soetaertd Sophie L K W Roelantsd 910
911
a Sorbonne Universiteacute Centre National de la Recherche Scientifique Laboratoire de Chimie de 912
la Matiegravere Condenseacutee de Paris LCMCP F-75005 Paris France 913
b Institut des Mateacuteriaux de Paris Centre Sorbonne Universiteacute Paris France 914
c Synchrotron Soleil LrsquoOrme des Merisiers Saint-Aubin BP48 91192 Gif-sur-Yvette Cedex 915
France 916
d InBio Department of Biotechnology Ghent University Ghent Belgium 917
918
919
Corresponding author 920
Dr Niki Baccile 921
E-mail address nikibaccilesorbonne-universitefr 922
Phone +33 1 44 27 56 77 923
924
925
926
2
a) 927
Parameter Method
Dry Matter (DM ) 996 Infrared balance 105degC
Glucose () 012 HPLC-Metacarb
Glycerol () nd HPLC-Metacarb
Free Fatty Acid content () lt001 Internal method BBEPP
GC with FID Detector
Oil () lt001 Internal method BBEPP
GC with FID Detector
Moulds (CFUg) lt10 3M-Nordval ndeg16 B
Yeasts (CFUg) lt10 3M-Nordval ndeg16 B
Anaerobic count (CFUg) lt10 SP-VG M005 B
Protein () tbd BCA protein assay
928
Figure S 1 - a) HPLC-ELSD chromatogram and composition table 929
930
931
932
933
3
b) 934
935
Group Ndeg δ ppm
CH2 1 354
CH2 2 153
CH2 3-712-14 132
CH2 811 203
CH 910 534
CH2 15 162
CH2 16 388
CH 1 424
CH 2 316
CH 3 334
CH 4 329
CH 5 354
CH2 6 366
Figure S 1 (next) ndash b) 1H NMR spectrum (MeOD-d4) recorded on the purified G-C181-OH compounds 936
and related assignment 937
938
2
811910 1rsquo
5rsquo1
3rsquo4rsquo
1rsquo1910
asymp asymp asympHDO MeOD Acetone
6rsquo2rsquo
1615
3-712-14
4
939
940
Figure S 2 ndash Cryo-TEM images recorded for a 5 mgmL G-C181-OH aqueous solution heat at T= 130degC 941
5
942
943
Figure S 3 - Cryo-TEM images recorded for a 5 mgmL G-C181-OH aqueous solution heat at T= 90degC 944
945
90degC
1
22
6
946
947
948
949
Figure S 4 ndash Cryo-TEM images recorded for a 5 mgmL G-C181-OH aqueous solution heat at T= 70degC 950
951
21
11
1
2
5
3
4
45
5
6
7
7
7
952
953
954
Figure S 5 ndash Cryo-TEM images recorded for a 5 mgmL G-C181-OH aqueous solution heat at T= 25degC 955
956
957
1
1 1
8
958
Figure S 6 ndash a) SANS experiment recorded at 90degC for a 5 mgmL G-C181-OH aqueous solution b-c) 959
WAXS experiments recorded on aqueous solutions of G-C181-OH at b) 5 mgmL and c) 25 mgmL d) 960
Structural interpretation of the repeating distances pointed out in c) 961
962
963
964
001 01 1
q Aring-1
25degC
68degC
88degC
111degC
01 1q Aring
-1
02 04 06 08 1q Aring
-1
001 01
10-1
100
101
Inte
nsity
cm
-1
q Aring-1
-2
T= 90degC
SANS WAXS WAXS
a) b) c)
dv
dL d= 144 Aring-1
di
ddH2O
dt
dvdL
dtdi d
d)
9
965
966
Figure S 7 ndash ssNMR MAS (10 kHz) experiments recorded on a G-C181-OH dry powder a) 1H spectra 967
recorded from 110degC to 70degC b) 13C single pulse (SP) spectra recorded with high power 1H decoupling from 968
110degC to 70degC c) 13C cross polarization (CP) spectra recorded at 110degC and contact time tc of 50 micros and 969
3000 micros d) 13C CP spectra recorded at 70degC and for 20 lt tc micros lt 3000 970
971
1
811
910
CH2 CH2
1rsquo
6rsquo
8 6 4 2 0 ppm
110
90
80
70
910
1rsquo
6rsquo16
1
2rsquo3rsquo4rsquo
811
OH
45 40 35 30 25 20 15
ppm
200 180 160 140 120 100 80 60 40 20 0
ppm140 120 100 80
ppm
CH2-gauche
3004
110
90
80
70
65
60
50
25
C91013003
C9 - 12869
CH2-all-trans
3198
C1rsquo10335
a) b)
1H
T degCT degC
13C Single Pulse MAS
A
B
A
B
70degC70degC
5rsquo
215
200 180 160 140 120 100 80 60 40 20 0
ppm
13C CPMAST= 110degC
200 180 160 140 120 100 80 60 40 20 0
ppm
132 131 130 129 128 127 126
ppm
106 105 104 103 102
ppm
13C CPMAST= 70degC
50
tc micros
3000
20
tc micros
50 500 1000 3000
tc micros
C102
13024 C910113003
C92
12869
C1rsquo213082
C1rsquo110443
A B
106 105 104 103 102
ppm
3000
1000
500
50
20
AB
c)
d)
10
972
Figure S 8 ndash a) Short and d) long T2 components displayed by the 1H transverse relaxation signal c) 1H 973
transverse relaxation signals recorded on a G-C181-OH dry powder from 110degC to 70degC The area of each 974
given resonance is plotted (log-lin) as a function of the echo time (CPMG pulse sequence) for each 975
temperature and fitted using the equation given above T2s and T2l indicate the short and long T2 relaxation 976
times respectively obtained by describing the 1H transverse relaxation signal using a biexponential decay 977
For H1rsquo H5rsquo and H6rsquo the 1H relaxation function could be described by a monoexponential decay 978
- Protons from the sugar group (H1rsquo H5rsquo H6rsquo) show a single T2 relaxation component (Figure 979
6c and Figure S 8) while protons of the acyl chain (CH2 H910 H811) show both short (Figure 980
6c) and long (Figure 6d) T2 relaxation component 981
- The short T2 relaxation time systematically decreases from 110degC to 70degC for all species by a 982
factor ranging from two to seven depending on the specific chemical group Very long T2 are 983
observed at 110degC for all acyl species while nearly unchanged values are measured below 984
90degC without any clear trend 985
- The sugar protons (H1rsquo H5rsquo H6rsquo) have the shortest set of T2 values (lt 1 ms) below 100degC 986
The long component of T2 generally ranges between 4 ms and 12 ms 987
0 1 2 3 4 5 6 7 8
00
05
10
15
20
25
30
35
40
45
Log
In
ten
sity
Time ms
0 1 2 3 4 5 6 7 8
00
05
10
15
20
25
30
35
40
45
Log
In
ten
sity
Time ms
0 1000 2000 3000 4000 5000 6000 7000 8000
00
05
10
15
20
25
30
35
40
45
Log
In
ten
sity
Time ms
0 1000 2000 3000 4000 5000 6000 7000 8000
00
05
10
15
20
25
30
35
40
45
Log
In
ten
sity
Time ms
0 1000 2000 3000 4000 5000 6000 7000 8000
00
05
10
15
20
25
30
35
40
45
Log
In
ten
sity
Time ms
0 1000 2000 3000 4000 5000 6000 7000 8000
00
05
10
15
20
25
30
35
40
45
Log
In
ten
sity
Time ms
H1
H8H11
H9H10
CH2
H1rsquo
H6rsquo
CH2
H910H811 H1CH2
H1rsquo H5rsquo6rsquo
0 1000 2000 3000 4000 5000 6000 7000 8000
00
05
10
15
20
25
30
35
40
45
Log
In
ten
sity
Time ms
OH
0 1000 2000 3000 4000 5000 6000 7000 8000
00
05
10
15
20
25
30
35
40
45 T= 110degC
T= 90degC
T= 80degC
T= 70degC
Log
In
ten
sity
Time ms
Fit
)
CH2 H910 H811 H1 H56 H1 OH
00
05
10
15
20
25
30
35
40
T2 m
s
T= 110degC
T= 90degC
T= 80degC
T= 70degC
CH2 H910 H811 H1
0
2
4
6
8
10
12
T2 m
s
T= 110degC
T= 90degC
T= 80degC
T= 70degC
Short T2(1H) Long T2(1H)
a) b)
c)
11
Table S 1 ndash 1H chemical shifts of G-C181-OH in solution and in the solid-state Solid-state spectra are 988
recorded at a MAS frequency of 10 kHz in DMSO-d6 broad peak 989
990
δH ppm
Group Ndeg Liquid
(MeOD-d4) Solid
(T= 110degC) Solid
(T= 70degC)
CH2 H1 354 357
CH2 H2 153 156
CH2 H3-712-14 132 135
CH2 H811 203 203
CH H910 534 534
CH2 H15 162 164
CH2 H16 388 383
CH H1 424 432
CH H2 316 335
CH H3 334 335
CH H4 329 335
CH H5 354 351 357
CH2 H6 366 383
OH OH1 432
45 463
OH OH2 492
OH OH3 490
OH OH4 487
OH OH6 445
991
992
H1H9H10H1rsquo
H6rsquo
OH2rsquo
OH1
12
Detailed discussion about the NOESY and DQ-SQ 2D 1H-1H ssNMR experiments presented in 993
Figure 9 994
995
2D 1H-1H ssNMR experiments are a unique tool to explore through-space proximities 996
between 1H nuclei ssNMR offers a large number of possibilities each adapted to a given 997
system The advantage of 2D maps with respect to a dynamics approach is their direct 998
readability in clear two nuclei which exchange their magnetization through-space (whichever 999
mechanism may be responsible for this exchange) will display a specific cross-peak However 1000
the way cross-peaks are presented and interpreted strictly depends on the nature of the pulse 1001
program which in turn is chosen according to the physical nature of the sample 1002
1D temperature-dependent 1H NMR experiments performed on G-C181-OH (Figure 1003
4a in the main text) indicate sharp peaks at 90degC and broad peaks at 70degC Narrow peaks 1004
indicate fast andor large-amplitude molecular tumbling averaging the strong 1H-1H dipolar 1005
interactions This excludes the use of pulse sequences like DQ-SQ which is not efficient under 1006
these conditions For this reason we employ spin-diffusion-based pulse sequences like 1007
NOESY which is more adapted for samples with high molecular mobility When mixing times 1008
are chosen to be short (lt 1 s) one generally explores through-space proximities within about 5 1009
10 Aring On the contrary when molecular motions are restricted dipolar coupling becomes 1010
significant 1H NMR peaks are broader and pulse sequences like DQ-SQ can now be used 1011
with a spatial resolution of less than 5 Aring 1012
Whenever possible DQ-SQ experiments are preferred over spin diffusion-based pulse 1013
sequences because they are more selective in particular for likewise interactions which are 1014
not discriminated in NOESY-type experiments This is illustrated by the typical interaction 1015
schemes for NOESY (top Figure 9a) and DQ-SQ (top Figure 9b) For two given A and B 1016
protons 2D NOESY maps will display two on-diagonal and two square-shaped symmetrical 1017
off-diagonal cross-peaks Off-diagonal cross-peaks illustrate the mutual A-B and B-A 1018
interaction but the on-diagonal peaks are systematic and do not prove any A-A or B-B 1019
interaction Similarly to NOESY 2D DQ-SQ maps display off-diagonal peaks (symmetric 1020
across the diagonal top Figure 9b) upon A-B and B-A interaction but in contrast they will 1021
display on-diagonal peaks only in the presence of self-interaction In the tutorial example of 1022
Figure 9b top the on-diagonal A-A peak indicates mutual A-A interaction while lack of on-1023
diagonal B-B peak evidences the absence of B-B proximities Combining NOESY and DQ-SQ 1024
experiments is capital to study the local arrangement of G-C181-OH and its evolution with 1025
temperature 1026
13
At T= 90degC the H1 and H5rsquo contributions are very close but possible to discriminate 1027
them (δ(H1)= 354 ppm δ(H5rsquo)= 351 ppm) according to 1H NMR chemical shifts in Table S 1028
1 2D 1H-1H NOESY in Figure 9a also discriminates between the two components attributed 1029
on the basis of the interactions with their mutual neighbors (green H1-H2 and H5rsquo-H1rsquo squares 1030
in Figure 9a) On this basis 2D NOESY does not show a direct H1rsquo-H1 correlation (blue red-1031
crossed) but rather an extensive network of intra-sugar interactions These features exclude 1032
suggest intra- and inter-sugar interactions and they exclude head-tail arrangements as a major 1033
molecular configuration at 90degC 1034
At 70degC the 1H NMR peaks are broader indicating a reduction of the T2 (1H) relaxation 1035
times andor residual homonuclear dipolar interactions excluding the use of NOESY In this 1036
case 1H-1H DQ-SQ correlation experiments are best suited Figure 9b presents the 1H-1H DQ-1037
SQ experiment on G-C181-OH at 70degC Peaks are broader than in NOESY and attribution may 1038
be cumbersome However the experiment is performed at 700 MHz and MAS= 22 kHz which 1039
improves spectral resolution with respect to the same experiment performed at 300 MHz and 1040
MAS= 10 kHz The auto-peak at δH= 356 ppm in the SQ dimension is attributed to H1-H1 spin 1041
pairs mainly resulting from intra CH2 interaction while the DQ cross-peaks at δH= 156-356 1042
ppm and δH= 432-356 ppm respectively origin from H2-H1 and H1rsquo-H1 interactions (Figure 1043
9b) DQ-SQ map does not show any auto-peak corresponding to H1rsquo-H1rsquo or Hxrsquo-Hxrsquo (x= 2rsquo 1044
3rsquo 4rsquo) interactions (red-crossed blue Figure 9b) thus excluding any proximity (lt 5 Aring) between 1045
close glucose neighbors On the contrary DQ-SQ maps (recorded both at 700 MHz Figure 9b 1046
or at 300 MHz not shown) systematically show DQ cross-peaks which can only be attributed 1047
to H1rsquo-H1 interactions (δH= 432-356) The presence of these H1rsquo-H1 interactions can only be 1048
explained by a head-tail arrangement of the G-C181-OH molecules as illustrated below the 1049
DQ-SQ map in Figure 9b 1050

4
85
86
87
88
89
Figure 1 ndash Non acetylated C181 alcohol glucoside G-C181-OH is obtained by a bioprocess performed 90
with modified S bombicola yeast 91
92
Experimental Section 93
Synthesis of non acetylated C181 Alcohol Glucosides (G-C181-OH) G-C181-OH (Mw= 94
41856 gmol-1) was produced by aerobic whole cell bioprocess with a modified S bombicola 95
strain as described by Van Renterghem et al (Fig S4 in Ref 34) The molecule was purchased 96
from the Bio Base Europe Pilot Plant (Gent Belgium) and has the generalized chemical 97
structure given in figure Figure 1 The HPLC and 1H NMR spectrum (MeOD-d4) with peak 98
assignment are shown in Figure S 1 High purity levels (99) and high degree of uniformity 99
were obtained as can be derived from HPLC-ELSD chromatogram 1H NMR and table of 100
contaminant given in Figure S 1 101
102
1H solution Nuclear Magnetic Resonance (NMR) 1H solution NMR experiments were 103
performed on a Bruker Avance III 300 spectrometer using a 5 mm 1H-X BBFO probe using 104
methanol-d4 as solvent The number of transients is 8 with 3 s recycling delay an acquisition 105
time of 546 s and a receiver gain of 362 The 1H NMR spectrum and relative assignment are 106
shown in Figure S 1 and Table S 1 13C solution NMR were performed on the same probe using 107
DMSO-d6 Corresponding chemical shifts are given in Table 1 Referencing is done with 108
respect to TMS δ1H= 0 ppm δ13C= 0 ppm 109
110
Sample preparation The sample was dissolved in milliQ-grade water at the concentration of 5 111
mgmL (05 wt) Lack of pH-sensitive probes (eg COOH groups) in G-C181-OH as 112
otherwise found in other microbial amphiphiles44 but also the will to avoid ion-specific 113
effects45 exclude the use of buffer The solution was heat at the given temperature using a CH3-114
150 Combitherm-2 dry block heating device For the cryo-TEM experiments the vials were 115
heat at the given temperature next to the cryofixation device and plunged into liquid ethane as 116
fast as possible For temperatures of 25degC and 70degC the sample was heat at 90degC and then 117
Synthesis path
5
cooled at to the desired temperature For the SAXS experiment the sample was heat at 90degC in 118
the block heating device and cooled at to 25degC before analysis For the SANS experiment the 119
sample was heat at 90degC directly in front of the beam using the thermalized sample holder 120
available 121
122
Differential Scanning Calorimetry (DSC) DSC was performed using a DSC Q20 apparatus 123
from TA Instruments equipped with the Advantage for Q Series Version acquisition software 124
(v540) Acquisition was performed on both hydrated and dry powder sample (~ 3-5 mg) sealed 125
in a classical aluminium cup and using an immediate sequence of heating and cooling ramps at 126
a rate of 10degCmin-1 Melting temperatures Tm 1 and 2 Tm1 and Tm2 were taken at the minimum 127
of the endothermic peak 128
129
Small and Wide Angle Scattering experiments Small angle neutron scattering (SANS) 130
experiments were performed at the D11 beamline of Institut Laue Langevin (Grenoble France) 131
during the run No 9-13-778 Four q-ranges have been explored and merged using the following 132
wavelengths λ and sample-to-detector (StD) distances 1) ultra-low q λ= 135Aring StD= 39 m 133
2) low-q λ= 53Aring StD= 39 m 3) mid-q λ= 53Aring StD= 8 m 4) high-q λ= 53Aring StD= 14 m 134
The sample (C= 5 mgmL-1) was prepared in 999 D2O to limit the incoherent background 135
scattering The sample solution was analyzed in standard 1 mm quartz cells Direct beam empty 136
quartz cell H2O (incoherent scatterer) within the quartz cell were recorded and boron carbide 137
(B4C) was used as neutron absorber The sample acquisition was measured at 90degC where 138
temperature was controlled through the controller thermalized sample holder available at the 139
beamline The background sample (D2O) signal was subtracted from the experimental data 140
Absolute values of the scattering intensity were obtained from the direct determination of the 141
number of neutrons in the incident beam and the detector cell solid angle The 2D raw data were 142
corrected for the ambient background and empty cell scattering and normalized to yield an 143
absolute scale (cross section per unit volume) by the neutron flux on the samples The data were 144
then circularly averaged to yield the 1D intensity distribution I(q) The software package Grasp 145
(developed at ILL and available free of charge) was used to integrate the data while the 146
software package SAXSUtilities (developed at ESRF and available free of charge) was used to 147
merge the data acquired at all configurations and subtract the background 148
Wide-angle X-ray scattering (WAXS) was performed under temperature control at the 149
SWING beamline of SOLEIL synchrotron facility (Saint-Aubin France) during the run 150
20201747 (energy 14 keV sample-to-detector distance 05 m) Two sample concentrations in 151
6
H2O were probed C= 5 mgmL-1 and C= 25 mgmL-1 The 2D data were integrated azimuthally 152
at the beamline using the software Foxtrot and in order to obtain the I(q) vs q spectrum after 153
masking the beam stop shadow Silver behenate (d(100) = 5838 Aring) was used as a standard to 154
calibrate the q-scale Sample solutions were inserted in borosilicate capillaries of 15 mm in 155
diameter Capillaries were flame-sealed A capillary oven with controlled temperature (plusmn 05degC) 156
provided at the beamline was used to control the sample temperature between 25degC and 111degC 157
Data were normalized by the transmission and calibrated to the SAXS signal of H2O at large q-158
values (I= 00163 cm-1) in order to obtain an absolute intensity scale The water signal was 159
measured by subtracting the signal of the empty capillary from the signal of a water-filled 160
capillary The signal of (water + capillary) was used as background for the samples and it was 161
subtracted after integration of the 2D data 162
163
Cryogenic transmission electron microscopy (cryo-TEM) Cryo-TEM experiments were carried 164
out on an FEI Tecnai 120 twin microscope operating at 120 kV and equipped with a Gatan 165
Orius CCD numeric camera The sample holder was a Gatan Cryoholder (Gatan 626DH 166
Gatan) Digital Micrograph software was used for image acquisition Cryofixation was 167
performed using a homemade cryofixation device The solutions were deposited on a glow-168
discharged holey carbon coated TEM copper grid (Quantifoil R22 Germany) Excess solution 169
was removed and the grid was immediately plunged into liquid ethane at -180degC before 170
transferring them into liquid nitrogen All grids were kept at liquid nitrogen temperature 171
throughout all experimentation Cryo-TEM images have been treated and analyzed using Fiji 172
(is just ImageJ) software available free of charge at the developerrsquos website46 173
The samplersquos concentration was C= 5 mgmL-1 For technical reasons the temperature 174
during cryofixation could not be controlled For this reason the temperature associated with 175
each cryo-TEM image in the text was related to the equilibration temperature just before 176
cryofixation the device being as close as possible to the dry bath used for temperature control 177
Since temperature control during cryofixation was not possible in our device and practically 178
impossible at high temperatures one should take the T values as indicative of the given value 179
Although the sample transfer between the dry bath and the cryofixation device was performed 180
as fast as possible it is more than likely that the actual temperature of the sample at the moment 181
of cryofixation was lower than the one indicated here although impossible to know precisely 182
183
7
Fluorescence microscopy Images were recorded using a 40x objective on a Leica SP5 upright 184
confocal microscope with 405 nm laser excitation The sample was marked with 6-dodecanoyl-185
NN-dimethyl-2-naphthylamine (Laurdan Mw= 35354 gmol-1) fluorophore as follows A 186
stock solution of 3 mg of Laurdan in 100 microL of acetone was initially prepared (C= 30 mgmL-187
1) A volume of 028 microL of the stock Laurdan solution was diluted in 1 mL of a 5 mgmL-1 G-188
C181-OH water solution temporary set at 110degC in a sealed Eppendorf The latter was 189
important so to enhance inclusion of Laurdan in the membrane constituted by the glucolipid 190
while in its vesicle phase The final Laurdan concentration was approximately 24 micromol with a 191
molar Laurdan-to-G-C181-OH molar ratio of approximately 1-to-500 Fluorophore-to-lipid 192
ratios above 1200 were generally considered as non-interfering with the lipid phase behavior 193
as also verified in this work 194
Laurdan can be excited between 365 nm and 410 nm and its emission wavelength can 195
vary according to the rigidity of the membrane intercalation within a rigid or flexible 196
membrane generates emissions at 440 nm or 490 nm respectively47 In the present experiment 197
we have flame-sealed a solution of G-C181-OH at 5 mgmL-1 containing Laurdan (1-to-500 in 198
lipid-to-Laurdan ratio) in flat optical capillaries of 01 mm thickness Capillaries were set on a 199
Linkam support for temperature control eventually placed under the microscope The sample 200
was excited at 405 nm and detection was made in spectral mode with a 5 nm window sliding 201
every 5 nm from 412 nm to 602 nm in 16 bits which allows quantify the signal and compare 202
the different conditions Quantitative analysis was performed according to the literature4849 203
several ROI (range of interest) have been drawn on several images using the ROI manager of 204
Fiji (is just ImageJ) software The integrated intensity of each ROI at 440 nm and 490 nm was 205
eventually recorded and used to calculate the value of the generalized polarization GP as 206
follows of 207
119866119875 =(120582440 minus 120582490)
120582440 + 120582490 208
A negative GP indicates a flexible membrane while a positive GP indicates a rigid membrane 209
210
Solid-state Nuclear Magnetic Resonance (ssNMR) 1H and 13C ssNMR experiments have been 211
performed using an Avance III HD Bruker 705 T (ν1H= 300 MHz) spectrometer and a 4 mm 212
magic angle spinning (MAS) probe except for the BAck-to-BAck (BABA) experiment which 213
was performed on an Avance III Bruker 1644 T (ν1H= 700 MHz) spectrometer equipped with 214
25 mm MAS probe Temperature was controlled through a Smart cooler BCUIIa BCU-xtreme 215
unit using 10 min of equilibration time after each temperature variation Temperature was 216
8
always varied from high (110degC) to low (70degC) before analysis Due to combined use of fast 217
MAS rates necessary to achieve high resolution spectra and heating close to the boiling point 218
of water neither diluted nor concentrated samples could be used for ssNMR experiments All 219
tests employing up to 50 wt G-C181-OH in water resulted in sample centrifugation drying 220
but also expulsion from the rotor causing sudden stop of rotor spinning For these reasons all 221
attempts to study hydrated G-C181-OH failed and only the dry powder could be analyzed The 222
dry sample powder was analyzed as such in zirconia rotors (4 mm or 25 mm) spinning at MAS= 223
10 kHz (4 mm) or 22 kHz (25 mm) and Chemical shifts were calibrated with respect to 224
adamantane (13C 13C(CH2)= 3848 ppm = 191 ppm) and glycine alpha (13C(CO)= 17603 225
ppm) Details on the acquisition parameters are given in the Supporting Information 226
227
Results and discussion 228
Topologically-connected nanotubes and vesicles 229
G-C181-OH is a biobased glucolipid water-insoluble at room temperature and of 230
which the physicochemical properties are poorly known The DSC thermogram performed at 231
10degCmin of G-C181-OH as a function of the water content (Figure 2a) shows two endothermic 232
peaks on the dry powder (996 wt glucolipid) They are attributed to two melting phenomena 233
occurring at the following temperatures Tm 483degC (Tm1) and 957degC (Tm2) the enthalpy of the 234
former being lower than that of the latter Interestingly DSC also shows that Tm1 is hydration 235
independent and reversible (the associated exothermic peak is systematically observed) while 236
the transition at Tm2 is simply suppressed (here tested up to 130degC) on hydrated powders and 237
never observed on the cooling profile even at slow cooling rates (1degCmin) The thermogram 238
recorded on the dry powder is typical of single-component lipids having an intermediate50 239
metastable phase (often referred to the ripple phase Pβ´ in reference to the periodic undulation 240
of the bilayer)50ndash54 between the classical lamellar gel (Lβ) and liquid crystalline (Lα) phases50ndash241
54 and characterized by regions of both liquid order and disorder5455 The effect of water does 242
not influence the low-temperature crystallization at Tm1 but it contributes to disrupt the ordered 243
array of hydrocarbon chains in the metastable phase 244
On the basis of the DSC thermogram the aqueous phase behavior of G-C181-OH under 245
diluted conditions (5 mgmL-1) was studied at four different temperatures (red marks on Figure 246
2a) below and above Tm1 but also between Tm1 and Tm2 corresponding to the thermogram of 247
the dry powder 248
9
249
Figure 2 ndash a) DSC thermogram of G-C181-OH under dry (04 wt water estimated by thermogravimetric 250
analysis) and hydrated conditions recorded at a heating rate of 10degCmin Red marks indicate the 251
temperatures at which cryo-TEM experiments are performed on the corresponding 5 mgmL aqueous 252
solutions b) Cryo-TEM images recorded for a 5 mgmL G-C181-OH aqueous solution heat at T= 130degC 253
90degC 70degC and 25degC T indicates the temperature of the sample solution before cryofixation Tne T T 254
being the temperature of the sample upon plunging in liquid ethane Please refer to the materials and 255
methods section for more information 256
T= 130degC
T= 90degC
T= 70degC
T= 25degC
a)
b)
20 40 60 80 100 120
99 wt
50 wt
25 wt
T degC
En
do
10 wt
Tm1= 483 degC
Tm2= 957 degC
10
257
The series of cryo-TEM images in Figure 2b show an overview of the most relevant 258
structures observed on G-C181-OH solution from T= 130degC to T= 25degC whereas T is 259
indicative of the equilibrium temperature before cryofixation (refer to materials and methods 260
section for more information on the sense and interpretation of T) At Tgt 100degC the sample 261
is essentially composed of polydisperse single wall vesicles massively shown by the 262
complementary pictures presented in Figure S 2 In between Tm1 and Tm2 at T= 90degC and T= 263
70degC (Figure 2b Figure 3 Figure 4 complemented by Figure S 3 and Figure S 4) vesicles are 264
connected by nanotubes At Tlt Tm1 flat crystals are otherwise observed (Figure 2b and Figure 265
S 5) 266
267
268
Figure 3 ndash Cryo-TEM images recorded for a 5 mgmL G-C181-OH aqueous solution heat at T= 90degC 269
270
A deeper insight at T= 90degC is given in Figure 3 (more images are provided in Figure 271
S 3) Arrows 1 through 6 mark very clearly the typical continuity in the glucolipid membrane 272
between the vesicle and nanotubes Arrow Ndeg 7 shows that a single nanotube connects the outer 273
membrane of two vesicles several hundred nanometers apart The connection is shown by 274
2
34
5
6
6
1
5
7
A
B
D
C
0 10 20 30 40 50 60
BIn
tensity
au
Profile nm
A
0 10 20 30 40 50 60
Inte
nsity
au
Profile nm
C
D
T= 90degC
11
arrows Ndeg5 and Ndeg6 The corresponding profiles A through D confirm the tubular nature of 275
the elongated objects Profiles B and D are both characterized by typical symmetrical thick 276
walls (low intensity depths highlighted by shaded rectangles) surrounding a hollow region (high 277
intensity peak between the shaded rectangles) The wall thickness varies between 35 and 40 278
nm for profile B and between 41 and 61 nm for profile D while the total nanotube diameter 279
varies between 14 nm at B and 20 nm at D At the same time the thickness of the vesicle wall 280
is about 6 nm at A and 135 nm at C Considerations about the bilayer or interdigitated structure 281
of the membrane will be presented below 282
The connection between nanotubes and vesicles seems to be multiple For instance 283
arrow Ndeg1 (Figure S 3) and Ndeg4 (Figure 3) show a single-wall vesicle of which the membrane 284
is extruded into a nanotube Similarly a closer look at arrows Ndeg1 2 and 3 in Figure 3 show 285
that the vesicle is single-wall and fully closed while the nanotube nucleates at the vesicle outer 286
surface with no apparent topological continuity In many regions of the sample at T= 90degC 287
one can find exvaginations or buds232531 in the nanotube wall This is shown for instance by 288
arrows Ndeg7 and particularly put in evidence in Figure 4 by arrows Ndeg1 through Ndeg4 where the 289
amplitude of the oscillation varies between 20-25 nm (arrow Ndeg1) and 6-8 nm (arrows Ndeg3-4) 290
291
Figure 4 - Cryo-TEM images recorded for a 5 mgmL G-C181-OH aqueous solution heated at T= 90degC 292
293
Still between Tm2 and Tm1 but at lower temperature (T= 70degC) the nanotubes seem to 294
vary from single threads (arrow Ndeg1 Figure S 4) to nanotubes of diameter below 15 nm both 295
connecting nanotubes of diameter ranging between 50 nm and 100 nm (arrows Ndeg2 Figure S 296
4) The larger tubes are most likely formed by the inflation and flattening of the nanotubes 297
probably after assimilation of surrounding vesicles and fusion of the exvagination discussed 298
above The transition between vesicles tubes and flat membranes is certainly more accentuated 299
Arrow Ndeg3 in Figure S 4 shows distinct vesicles while arrow Ndeg4 identifies a flat structure 300
evidently formed from fused vesicles In particular arrow Ndeg5 points at the fusion of two 301
2
1 132
4
12
vesicles while arrow Ndeg6 points at two vesicles fusing into the flat membrane Additional areas 302
where vesicle fusion is prominent are indicated by the oscillations at the outer skirt of broad 303
lamellae and pointed by arrow Ndeg7 304
Finally below Tm1 at T= 25degC for instance mainly flat crystals with no visible 305
exvaginations or tubes are visible (Figure S 5) by cryo-TEM and the material turns into an 306
insoluble precipitate Massive presence of flat crystalline structures is also clear from the bulk 307
iridescent behavior of a G-C181-OH solution under manual shear 308
In summary despite the uncertainty related to the actual state of equilibrium of the 309
glucolipids at the moment of cryofixation cryo-TEM depicts a vesicle phase at Tgt 100degC a 310
flat lamellar phase below Tm1 and an interconnected vesicle-nanotube network between Tm1 and 311
about 100degC The combination of statistically-relevant fluorescence microscopy and 312
scatteringdiffraction experiments provides an additional proof of the coexistence of 313
vesiclenanotube systems between the two transition temperatures Please note that the 314
experiments reported below have been performed under controlled conditions of temperature 315
which is then indicated by the use of T instead of T 316
13
317
Figure 5 ndash a-c) Confocal fluorescence microscopy images recorded at 90degC and 70degC for a 5 mgmL G-318
C181-OH aqueous solution d-g) Typical fluorescence microscopy images recorded at T= 80degC using 319
Laurdan (refer to materials and methods section for more details on this fluorophore) Excitation 320
wavelength is 405 nm for all the images while emission wavelength is 490 nm in (df) and 440 nm in (eg) 321
h) Full emission spectra obtained from the integration of various fluorescence images recorded from 412 322
nm to 600 nm (step 5 nm) at 90degC 80degC and 70degC i) Box plot of GP defined as 119918119927 =(120640120786120786120782minus120640120786120791120782)
120640120786120786120782+120640120786120791120782 with 120640120786120786120782 323
and 120640120786120791120782 being the emission wavelengths at 440 nm and 490 nm at 90degC 80degC and 70degC Each data point 324
l= 490 nm l= 440 nm
l= 490 nm l= 440 nm
10 μm400 450 500 550 600
00
02
04
06
08
10
No
rma
lize
d I
nte
nsity
l nm
90degC
80degC
80degC
70degC
70degC
400 450 500 550 60000
02
04
06
08
10
No
rma
lize
d I
nte
nsity
l nm
90degC
80degC
80degC
70degC
70degC
d) e)
f) g)
h)
i)
T= 80degC
Laurdan
T= 80degC
T= 80degC T= 80degC
T= 90degC T= 70degC T= 70degC
a) b) c)
1
1
1
14
corresponds to a set of regions of interest (ROIs) (54 at 90degC 65 at 80degC and 75 at 70degC) selected in the 325
corresponding fluorescence images ROIs were representatively selected so to include the entire image but 326
also vesicles alone tubes alone and mixtures of vesicles and tubes 327
328
Figure 5ab shows two typical confocal fluorescence microscopy images recorded on a 329
G-C181-OH solution (5 mgmL) in a flame-sealed capillary heat at T= 90degC and T= 70degC 330
Although the resolution of optical microscopy is not comparable with cryo-TEM the sample is 331
broadly composed of vesicles coexisting with nanotubes whereas in some cases the nanotube 332
starts from the vesicle itself (arrow Ndeg1) in good agreement with cryo-TEM data Furthermore 333
SANS recorded at T= 90degC (Figure S 6a) shows a scattering profile with a pronounced -2 334
dependence of the scattering intensity against the wavevector q in the log-log scale This 335
indicates the massive presence of a flat interface and it is expected typical of bilayers in 336
vesicular morphologies56 However the typical signature of nanotubes cannot be observed in 337
the SANS profile and this can be explained by both an argument related to the relative lower 338
amount of nanotubes with respect to vesicles at 90degC but also to the steeper slope of flat 339
morphologies (-2) compared to tubes (-1) the signal of the former masking the tube signal at 340
low wavevector values The SANS profile is characterized by a diffraction peak at q= 0167 Aring-341
1 of which the assignment is refined by WAXS data 342
Temperature-driven WAXS experiments in Figure S 6bc (5 mgmL-1 and 25 mgmL-1 343
respectively) show a lamellar order possibly attributed to a multilamellar structure of the 344
vesicles (dv Figure S 6d) at high temperature and to the interplanar arrangement of the 345
crystalline flat structures (dL Figure S 6d) at T= 25degC The sharp (001) reflection indicates 346
typical interlamellar distance of 353 Aring at 25degC although this value varies with temperature 347
(400 Aring at 111degC 372 Aring at 88degC) thus confirming its assignment to a hydration-dependent 348
interlamellar order More intriguing is the second broader peak at q= 0403 Aring-1 (d= 156 Aring) 349
and its reflection both clearly visible at 88degC below Tm2 We attribute it to the inter-glucolipid 350
arrangement inside the tubular phase (dt Figure S 6d) coexisting with the vesicle phase 351
between Tm1 and Tm2 and to the planar lipid arrangement (di Figure S 6d) in the rigid flat 352
lamellar structure below Tm2 Its temperature- hence hydration- independent position also 353
confirms its structural origin Finally besides the water-structure peak at about 2 Aring-1 we also 354
observe a broad peak at 144 Aring-1 characteristics of the lateral packing (d Figure S 6d) of lipids 355
in bilayers While its position could be consistent with an Lα phase5758 above Tm2 its broadness 356
and positional invariance as well as the coexistence between vesicles and tubes do not allow a 357
precise assignment 358
15
Does G-C181-OH assume a bilayer or interdigitated structure the latter being the one 359
found for other similar bolaform glucolipids4243 The size of G-C181-OH can be estimated to 360
be at the most 32 Aring given by the length L of the C16 tail (L = 22 Aring from the Tanford formula 361
L= 154 + 1265 times n (n= 16)59) and the sugar (about 10 Aring)4243 However the cis conformation 362
of the C=C bond imposes a ldquokinkrdquo of 60deg in the aliphatic chain which reduces the effective 363
length of the oleic backbone to about 17 Aring for an effective total G-C181-OH length of about 364
27 Aring Cryo-TEM provides a tube thickness varying from 35 Aring to 60 Aring and a vesicle membrane 365
thickness of at least 60 Aring WAXS suggests an interlamellar thickness (membrane and water) 366
between 40 Aring and 37 Aring and an inter-lipid distance in the tube of about 16 Aring In the absence of 367
a clear form factor oscillation profile as found for similar glucolipids4243 one must 368
acknowledge that these data pledge neither in favor of fully interdigitated nor a double layer 369
structure and might suggest a tilted lipid arrangement with partial interdigitation60 370
371
13C ssNMR demonstrates that G-C181-OH can assume two coexisting head-head and 372
head-tail configurations 373
Vesicles are characterized by low positive mean and gaussian curvatures while 374
nanotubes are described by a combination of a high positive mean and zero gaussian curvatures 375
In this regard the coexistence of vesicles and nanotubes requires glucolipids to adapt 376
themselves to both environments at the same time For this reason the formation of nanotube-377
vesicle networks generally requires a specific driving force able to impose a high mean and 378
zero gaussian curvature to the membrane In many systems insertion of at least a second 379
constituent (lipid surfactant protein) in the membrane becomes a necessary internal driving 380
force for the nucleation and growth of so-called membrane inclusions from which 381
topologically-connected nanotubes can form10ndash123261 as explained by orientational ordering 382
arguments62 It has also been shown that external driving forces such as use of laser 383
ldquotweezersrdquo30 osmotic pressure6 electroformation5ndash82829 or controlled suction13ndash16 are 384
otherwise necessary as also supported by theoretical studies19 385
The bending energy of tubes is higher than that of a vesicle membrane8 due to the 386
dependence of the membrane free energy from the principal curvatures For this reason 387
isotropic (rotational symmetry along the main axis) but also anisotropic33 lipids generally 388
stabilize low-curvature shapes like flat membranes or vesicles Lipid nanotubes are also a 389
common phase formed by amphiphiles but generally for lipids with a certain complexity in 390
their molecular structures as exampled by diacetylenic derivatives of phospholipids among 391
others262763ndash65 Negative contributions to the bending energy favoring the simultaneous 392
16
presence of interconnected vesicles and tubes was shown to be driven by the presence of 393
anisotropic lipids in a membrane continuum Spontaneous deviations to the elastic theory in the 394
presence of surfactants lipids and proteins with anisotropic structures favor the formation of 395
protrusions with radius of the order of the fraction of a micron9ndash1219ndash2362 396
In the absence of both internal and external driving forces mentioned above G-C181-397
OH should behave as a standard lipid Its DSC profile (Figure 2)536667 under both hydrated and 398
dry conditions identifies a hydration-independent transition (Tm1) slightly above room 399
temperature this is followed by one main transition at higher temperature (Tm2) in the dry 400
sample50 For such a profile one expects a gel phase (Lβ) below Tm1 and a liquid crystalline 401
structure possibly in the morphology of vesicles (L4 phase) possibly above Tm1 and most likely 402
above Tm231 as experimentally found On the basis of the thermogram recorded on the dry 403
powder one may also expect a ldquoripplerdquo (Pβ) phase between Tm1 and Tm2 characterized by 404
periodic undulations of the bilayer (generally addressed to as regions with both liquid order and 405
disorder)5455 406
In the present work instead of a Lβ phase we observe flat crystals below Tm1 and a 407
vesicle-nanotube network instead of the ldquoripplerdquo phase The latter is particularly unexpected 408
because the membrane is composed of a single-component (G-C181-OH) and no anisotropic 409
external force (osmotic hydrodynamic electric) is used to pull and stabilize the tubes In 410
addition the nanotubes are observed at fairly high temperatures above Tm1 (between about 411
60degC and 90degC) while this morphology is generally favored at low temperature (proportionality 412
with 1kT figure 5 in Ref 62) commonly below a given transition temperature characteristics 413
for each specific amphiphile27 Furthermore nanotubes of G-C181-OH seem to be stable in 414
time thus differing from what is found in electroformed vesicles78 They are also observed 415
away from phase transition events (may them be at Tm1 or Tm2) as otherwise reported before 416
for a diacetylenic derivative of phosphatidylcholine26 and many other systems27 417
A stable nanotube-vesicle network for a single-component phospholipid in the absence 418
of external driving forces is not expected and has never been reported before It could be 419
explained by the coexistence of two micro-separated phases of different rigidity This 420
hypothesis is excluded by confocal microscopy on Laurdan-labelled membranes and magic 421
angle spinning (MAS) solid-state NMR (ssNMR) experiments 422
Laurdan is a well-known fluorophore used to put in evidence the coexistence of rigid 423
and fluid domains in both model and biological membranes47ndash49 Laurdan was used here to label 424
the G-C181-OH membranes between Tm1 and Tm2 and to verify the possible micro-segregation 425
and coexistence of rigid (eg Lβ λem= 440 nm) and fluid (eg Lα λem= 490 nm) domains in 426
17
tubes and vesicles respectively A set of quantitative experiments performed on a 5 mgmL-1 427
solution summarized in Figure 5 shows an excess of fluorescence at only λem= 490 nm for 428
temperature between 90degC and 70degC (Figure 5h) The GP value which quantifies the rigidfluid 429
character of the membrane is systematically negative (Figure 5i) indicating an overall fluid 430
membrane at all temperatures GP is quantified on more than 50 regions of interest (ROIs) at 431
each temperature including vesicles and tubes alone as well as connected nanotube-vesicles 432
(Figure 5d-g) The dispersion of GP at 80degC and 70degC between -08 and -02 could suggest the 433
spurious presence of membranes with various degrees of flexibility although fluidity is always 434
predominant The combination of WAXS (broad peak d= 144 Aring-1 invariant with 435
temperature Figure S 6bc) and confocal fluorescence microscopy using Laurdan confirms the 436
single-phase of the membrane composed of G-C181-OH both in vesicles and nanotubes This 437
is also consistent with the lack of phase transitions in DSC experiments between ~85degC and 438
~60degC especially in hydrated samples We conclude that the vesicle-nanotube transition is not 439
driven by the local segregation of gel phase (Lβ) microdomains nor that the nanotubes are 440
composed of such phase 441
ssNMR is the best-suited approach to investigate the origin of the local driving force for 442
the nucleation of anisotropic inclusions of which the average orientation depends on the local 443
membrane and inclusion curvatures and was shown to promote tubing62 ssNMR can provide 444
information on the local molecular mobility eg through the nuclear spin relaxation behavior 445
but also on intermolecular interactions and stereochemistry eg through variations in the 446
chemical shift68ndash70 447
Ideally ssNMR should be performed on diluted G-C181-OH samples above Tm1 448
However fast MAS necessary for high resolution centrifuges the sample As a first 449
approximation hydrated G-C181-OH samples for instance at 50 wt as classically done for 450
phospholipids71 could be studied Unfortunately permeability of the sample holder combined 451
to heating (close to the boiling point of water) and MAS provoke dehydration and even sample 452
ejection After experiencing both of the above this approach was abandoned As a second 453
approximation the study of the dehydrated G-C181-OH powder avoids centrifugation and 454
evaporation If studying dried lipids may not reflect their exact behaviour under diluted 455
conditions valuable structural information can still be obtained in dehydrated molecular 456
systems like proteins thus illustrating that this approach is not unreasonable Furthermore if 457
DSC (Figure 2a) shows that hydration suppresses the Tm2 it also shows that the value of Tm1 is 458
not affected by water at concentrations as low as 10 wt For this reason performing a 459
structural analysis of dehydrated G-C181-OH by ssNMR above Tm1 may help understanding 460
18
the local arrangement of G-C181-OH in two morphologies vesicles and nanotubes having 461
sensibly different curvatures 462
To explore the local mobility of the most relevant chemical groups of G-C181-OH 463
above Tm2 (T= 110degC) and between Tm2 and Tm1 (70 lt T degC lt 90) we combine a series of 1H 464
and 13C experiments Single-pulse (SP) MAS experiments (1H and 13C) when recorded under 465
quantitative conditions allow the detection of all chemical species while cross-polarization 466
(CP) MAS (13C only) experiments are sensitive only to constrained groups for which the 1H-467
13C dipolar coupling is not averaged to zero by the molecular motions 468
469
Figure 6 ndash a) 1H MAS (10 kHz) ssNMR spectra recorded from 110degC to 70degC b) 13C MAS (10 kHz) ssNMR 470
spectra recorded using high power decoupling single pulse (SP) and cross-polarization (CP) pulse sequences 471
Contact time for CP experiments and corresponding temperatures are given on each spectrum Full spectra 472
are given in Figure S 7 473
The most relevant 1H and 13C spectra are given in Figure 6 (full range in Figure 7 and 474
Figure S 7) As expected the 1H solid-state SPMAS spectra show broader peaks compared to 475
the solution-state NMR spectrum (Figure 6a) reflecting the obvious solid-state character of the 476
sample at any temperature The sugar group and the C=C bond resonate in the 25-6 ppm range 477
and 535 ppm respectively while the OH groups of the sugar moiety are found below 45 ppm 478
(Figure 6a full assignment in Table S 1) Very broad (~1 ppm) at 100degC the position of the 479
OH peak varies with the temperature value and becomes narrower (lt~05 ppm) and visible at 480
δH= 464 ppm at T= 70degC Line narrowing and chemical shift variations of the OH resonance 481
in ssNMR is always a direct sign of H-bonding interactions whereas the strength of the H-482
bonding hence its OHhellipH distance is correlated to a dispersion in chemical shifts72ndash75 All other 483
60 55 50 45 40 35 30 25
ppm
110
90
80
70
910
1rsquo
6rsquo16
1
OH
134 132 130 128 126
ppm110 108 106 104 102 100
ppm
SP (T= 110degC)
SP (T= 70degC)
CP 50 ms (T= 70degC)
CP 3 ms (T= 70degC)
910 1rsquo
1H 13C
1
811
910
CH2 CH2
1rsquo
6rsquo
a) b)
C102
13024
C9101
13003
C92
12869 C1rsquo210382
C1rsquo110443
C1rsquo13035
2rsquo3rsquo4rsquo
T degC
5rsquo
19
resonances broaden from 110degC to 70degC thus indicating slower andor more anisotropic 484
reorientational motions of all chemical groups The specific dynamic behaviour of the sugar 485
headgroup is also reflected by its 1H transverse relaxation time T2 whereas the shorter the T2 486
the higher the rigidity Experiments performed between 110degC and 70degC shown and 487
commented in Figure S 8 in the Supporting Information globally show a single short (lt 1 ms 488
below 100degC) T2 relaxation component for H1rsquo H5rsquo and H6rsquo and two both short and long 489
(between 4 ms and 12 ms) T2 for the acyl chain (CH2 H910 H811) even below 100degC 490
At 110degC 13C SPMAS experiments (Figure 6b full range in Figure 7 and Figure S 7 491
assignments in Table 1) show a single peak at δC= 10335 ppm for C1rsquo and at δC= 13003 ppm 492
for C910 as expected for a symmetrical conformation with two chemically-equivalent 493
carbons76 At 70degC the C1rsquo peak disappears while C910 now shows two peaks around 128 494
ppm and 130 ppm (Table 1 full temperature series in Figure S 7b) attributed to C92 (δC= 12869 495
ppm) and C10 in a non-symmetric configuration respectively for which these two carbons are 496
chemically inequivalent76 More precisely the resonance at 130 ppm is actually the 497
superposition of two close resonances C9101 (δC= 13003 ppm) and C102 (δC= 13024 ppm) 498
where subscripts 1 and 2 stand for two different conformations of the cis-olefin group as 499
reported for various phases of oleic acid in the vicinity of 0degC76 500
501
Table 1 ndash 13C Chemical shifts of G-C181-OH in solution and solid-state Solid-state experiments are 502
recorded at MAS= 10 kHz All spectra are reported in Figure 7 and Figure S 7 The contact time for cross 503
polarization is 3 ms In all ssNMR experiments temperature is first raised at 110degC and then lowered to 504
either 90degC or 70degC Attribution of the 13C resonances in Table 1 is performed on the basis of the solution 505
spectrum (Figure S 1b) Additional peaks observed in both single pulse and cross polarization ssNMR 506
experiments are attributed when possible to a configuration effect of the given atom eg C9101 and C92 507
indicate two configurations of C9 All new peaks observed in solid-state and not detected in solution are 508
highlighted in red for convenience 509
510
511
δ ppm
Peak Liquid (DMSO-d6)
Solid Single Pulse
T= 110degC
Solid Single Pulse
T= 90degC
Solid Single Pulse
T= 70degC
Solid Cross Polarization
T= 70degC
C102
- - 13024 13024
C910C9101 13009 13003 13003 13003 13003
C1C9C10C1rsquo
C6rsquo
20
C92 - - - 12869 12869
C1rsquoC11 10329 10335 10335 - 10443
C12 - - - - 10382
C3 7724 7709 7702 - 7829
- 7634 7629 - 7621
7525
C2 7388 7398 7390 7370 7370
C4 7052 7077 7054 7041 7098
C16 6900 7016 - - 7029
- - - - 6793
C1C5C6 6153 6241 6236 6239 6262
C1C5C6 6117 - - - 5956
C2 3300 3290 3290 3283 3279
CH2(trans) - - - 3198 3196
CH2(gauche)C15 2941 2981 2987 3004 -
C811 2706 2747 2747 2832 2817
CH2 2597 2625 2628 2630 2817
512
13C CPMAS spectra at 70degC (Figure 6b full range in Figure 7 and Figure S 7d) at 513
increasing contact times confirm the presence of two cis-olefin environments one for which 514
C910 are equivalent labelled here C9101 and one for which they are inequivalent labelled 515
C92 C102 Both environments are rigid enough to be observed at short contact time (tc= 50 μs) 516
A similar double environment is also observed for the sugar C1rsquo CPMAS at 70degC shows two 517
peaks (C1rsquo1 at δC= 10443 ppm C1rsquo2 at δC= 10382 ppm Figure 6b Figure S 7d) These are 518
significantly shifted downfield from the C1rsquo peak observed at 110degC and are detected at contact 519
times as short as 50 μs thus indicating their rigid character One also finds that CPMAS is 520
totally inefficient at 100degC for short contact times (50 μs) and poorly efficient even at 3 ms 521
typical of fast-tumbling molecules (Figure S 7c) also both gauche (δC= 3004 ppm) and all-522
trans (δC= 3198 ppm) conformations of the CH2 carbons coexist at 70degC (Figure S 7b)77 523
According to ssNMR one main mobile molecular environment exists at 110degC as 524
shown by the well-resolved 1H spectrum single C=C (C9101) and anomeric (C1rsquo) resonances 525
gauche conformation of the aliphatic CH2 and single T2 of the aliphatic CH2 chain and sugar 526
protons The sugar group is certainly mobile (inefficient 1H13C CPMAS) but still more 527
constrainted than the acyl chain (shorter T2 (1H)) As the temperature is lowered the overall 528
rigidity increases (broadening of 1H NMR peaks faster 1H transverse relaxation and efficient 529
1H13C magnetization transfer during CPMAS) presumably driven by H-bonding 530
interactions (downfield shift and line narrowing of the OH 1H signal very short OH T2 loss of 531
the C1rsquo signal in SPMAS) At the same time a number of spectroscopic data (two concomitant 532
21
resonances for anomeric C1rsquo1 and C1rsquo2 cis-olefin C9101 and C92 C102 and CH2 gauche and 533
all-trans environments) and relaxation behaviour (fast and slow T2 relaxation components) 534
strongly suggests the coexistence of two molecular environments Further proofs of the 535
coexistence of two distinct molecular domains are given by a number of chemical shift 536
variations in the 13C CPMAS spectrum at 70degC compared to the one at 110degC 90degC and 537
solution This is shown in Figure 7 and in the list of 13C chemical shifts in Table 1 538
539
540
Figure 7 - Comparison between solution- and solid-state 13C NMR spectra of G-C181-OH Solid-state 541
experiments are recorded directly on the sample powder at a MAS of 10 kHz (4 mm zirconia rotor) SP 542
Single Pulse CP Cross Polarization In all the ssNMR experiments temperature is first raised at 110degC 543
and then lowered to either 90degC or 70degC Segmented lines are meant to highlight the known peak position 544
in solution thus stressing the strong chemical shift variations in the solid-state 545
546
NMR experiments above Tm2 suggest that vesicles could contain G-C181-OH with a 547
single family of mobile conformations characterized by chemically-equivalent C=C (red 548
Figure 8b) and a single C1rsquo conformation (green Figure 8b) Experiments between Tm1 and Tm2 549
otherwise suggest that two coexisting conformations characterized by chemically-equivalent 550
(red Figure 8b) and inequivalent (magenta Figure 8b) C=C could be associated to nanotubes 551
Two distinct C1rsquo sites (grey Figure 8b) also indicate two configurations of the sugar headgroup 552
A comment on this point will be given in the following paragraphs 553
The local (Aring-scale) variation of molecular mobility below Tm2 drives the coexistence of 554
two distinct molecular environments of the same G-C181-OH molecule This occurs within a 555
single-phase domain (as deduced by WAXS) of equivalent membrane rigidity (as derived from 556
Laurdan probe in confocal microscopy) Although never reported before the difference in the 557
local mobility of the same amphiphile (here G-C181-OH) could satisfy the theoretically-558
140 120 100 80 60 40 20
CP(3 ms)-70degC
SP-70degC
SP-90degC
SP-110degC
ppm
LiquidC910
C1rsquo
C2rsquo
C4rsquo
C3rsquo
C1
C6rsquoC5rsquo
C1
6
C8
11
C2 C
H2
C1
5
CH
2
DM
SO
13C
22
required conditions that induce local lipid segregation and formation of membrane inclusions 559
(Figure 8c) In case of their non-zero average orientation the local membrane curvature 560
increases62 and nanotubes can spontaneously form (Figure 8bc) More intriguing this 561
mechanism occurs at least 10degC above Tm1 although it should not be favored above the Tm27 562
From both experimental and theoretical backgrounds the conditions of topologically-563
connected vesicles-nanotubes systems are met only when either internal (two components) or 564
external driving forces are applied19 In the present single-lipid system of which the phase 565
behavior is summarized in Figure 8a the most plausible driving force could be explained by 566
the NMR results collected on the dry sample G-C181-OH concomitantly occupies two 567
molecular environments characterized by 1) two distinct conformations of the sugar 568
displaying equivalent mobility and 2) two conformations of the acyl chain unsaturation 569
570
23
571
Figure 8 ndash a) Thermotropic phase behavior of G-C181-OH at 5 mgmL-1 Note that Tm2 is observed on the 572
dry powder only b) Possible relationship between the molecular environment as derived from NMR and 573
membrane curvatures All the molecular drawings refer to the same G-C181-OH molecule (bulky ellipsoid 574
equiv sugar headgroup) while each color corresponds to a given configuration Grey of C1rsquo1 and C1rsquo2 indicates 575
the uncertainty about the assignment of the specific NMR peak The curvature C is defined as 1R R being 576
the curvature radius R1 R2 radius of curvature CG Gauss curvature CM Mean curvature c) Free 577
interpretation of the anisotropic high-curvature (CMgt 0 CG= 0) inclusions in the membrane (low CM and 578
CG) continuum driven by inter-sugar H-bonding and reduced intramembrane diffusion for a G-C181-OH 579
glucolipid 580
581
Flat crystalline structure
Nanotube-vesicle network
Vesicles
48degC
120deg
106 105 104 103 102 101
ppm
H9 H10H1rsquo
106 105 104 103 102 101
ppm106 105 104 103 102 101
ppm106 105 104 103 102 101
ppm
C=CC=C
C1rsquo1C1rsquo2
C1rsquo
Tm2(96degC)Tm1
a)
b)
c)
Same molecule different local orientations and sugar conformations
High curvature membrane
Low curvature inclusion
Flip-FlopStrong H-bonding
CG
CM ( + )
CG 0
CM 0 CG 0
CM 0
G-C181-OH
24
Two related questions are unanswered at the moment What actually drives nanotube 582
formation and is the organization of G-C181-OH within the vesicles and tubes the same Lipid 583
nanotubes have been studied for at least three decades over which broad experimental and 584
theoretical insight has been generated Despite this fact the actual understanding is still matter 585
of debate27 Micelle-to-nanotube and vesicle-to-nanotube phase transitions are generally 586
reported for single amphiphiles below a given Tm and intermediate phase composed of twisted 587
and flat fibers is concomitantly reported Initially thought to be a chirality-driven phenomenon 588
recent studies propose a more general mechanism involving crystallization and symmetry 589
breaking in the lipid packing driven by optimal packing27 If twisted ribbons were observed 590
before for a number of microbial glycolipid bolaamphiphiles44 they are not found for G-C181-591
OH This fact as well as the large body of cryo-TEM images and the observation of nanotubes 592
above Tm1 rather pledge in favour of a direct topological change from positive (vesicles) to 593
zero (nanotubes) Gaussian curvatures In this case vesicle-to-nanotube transitions could be 594
driven by external forces56307813ndash162829 595
Considering the absence of external forces in the present system there are only two 596
possibilities left spontaneous budding of the membrane or nanotube pulling after inter-vesicle 597
collisions due to Brownian motion Both are possible as inclusions composed of a different 598
arrangement of the same molecule in the membrane continuum can theoretically explain 599
spontaneous nanotube formation in an isotropic medium672223629ndash1218ndash21 However the second 600
one is probably more likely to prevail because it could explain the large number of nanotubes 601
connecting two distant vesicles Interestingly similar events occur for any phospholipid-based 602
vesicular solution but nanotubes are extremely rare unless at least two lipids of different 603
molecular structure are mixed together The spectroscopic 1H and 13C and relaxation (1H) 604
ssNMR data even if collected on a dry powder demonstrate that the coexistence of two G-605
C181-OH configurations involving both the sugar headgroup and fatty alcohol chain are 606
possible for this molecule As a matter of fact this is not so surprising as more than one energy 607
minima each corresponding to a given conformation are known for glucose its non-reducing 608
derivative methylglucose and carbohydrates in general78ndash80 609
The presence of two configurations could explain the coexistence between two 610
structures of different curvature but the data presented so far do not explain the origin of these 611
two configurations In other words what drives the change in the local structure of the sugar 612
headgroup and fatty alcohol within the membrane 613
The association of known self-assembled structures to spectroscopic 13C ssNMR data is 614
known for years in particular for gluconamides lipids having a linear sugar headgroup81ndash84 It 615
25
was found that gauche effects in some cases up to the γ position in the sugar chain induce 616
upfield chemical shifts while anti and trans conformations result in downfield shifts Each 617
structure (monolayer crystal bilayer crystal or micellar fiber) was then characterized by a given 618
organization of the gluconamide and a characteristic 13C ssNMR fingerprint which could be 619
explained by gauche γ-gauche anti and trans conformations of the headgroup Similar 620
structural-spectroscopic correlations have been collected over the years for much simpler cyclic 621
sugars85 whereas pyranoses can undergo important conformational changes (chair half-chair 622
boat skew) when the appropriate energy barriers are crossed78ndash8086 A quantitative 623
conformational study based on the 13C chemical shift variations shown in Table 1 would be 624
certainly helpful but very delicate in the context of the present state of the art because a 625
rigorous approach requires at least one known crystal structure8182 which is currently missing 626
for this compound A qualitative approach will then be adopted 627
G-C181-OH is a bolaform amphiphile and flip-flop could be a possible mechanism 628
involved in the nanotube stabilization whereas head-tail interactions have long been considered 629
as important in nanotube-forming bolaform amphiphiles6063 From mere considerations based 630
on T2 (1H) relaxation arguments one could exclude head-tail configurations if the R-CH2OH 631
endgroup (H1) was involved in a direct interaction with the sugar group its corresponding T2 632
would probably be comparable to the sugarrsquos one (OH and H1rsquo) but this does not seem to be 633
the case However this hypothesis would be based on the comparison of the relaxation from 634
CH and CH2 protons additionally involved in different kind of motions Besides the relaxation 635
of H1 is influenced by the strong overlap between H1 and H5rsquo For these reasons relaxation 636
arguments are not solid enough and will not be used 637
We then address this question by exploring intermolecular interactions in a direct 638
manner using 2D 1H-1H homonuclear ssNMR correlation spectroscopy At 90degC in the fast-639
tumbling domain of molecular motion (narrow 1H NMR peaks Figure 6a) and corresponding 640
to the vesicle-rich region spin diffusion (NOESY) experiments are preferred over dipolar 641
coupling based experiments because such interaction is averaged out by molecular motion 642
However when the molecular motion is more constrained in the domain of nanotube stability 643
at 70degC (broad 1H spectra Figure 6a) Double-Quantum Single-Quantum (DQ-SQ) correlation 644
experiments are best suited to probe interaction between close molecular neighbors These 645
experiments are reported in Figure 9 and the related interpretation is only briefly reported 646
below while a more detailed discussion can be found on Page 12 in the Supporting Information 647
26
648
Figure 9 ndash a) 2D 1H-1H NOESY NMR experiment performed at MAS= 10 kHz (4 mm probe) on a Bruker 649
300 MHz Avance III HD spectrometer using 300 ms of mixing time Sample temperature is regulated to 650
90degC reached by cooling from 110degC b) 2D 1H-1H DQ-SQ (BAck-to-BAck BABA pulse sequence used for 651
the DQ excitation scheme) NMR experiment performed at MAS= 22 kHz (25 mm probe) on a Bruker 700 652
MHz Avance III spectrometer using a DQ excitation time equal to 2 rotor periods Sample temperature is 653
regulated to 70degC reached by cooling from 110degC The typical schemes illustrating how to interpret these 654
2D experiments are reported above each experimental map Zooms of the sugar region and configurational 655
interpretation are given below each 2D map More information are given in the text below 656
H16-H16
H1-H1
H9-H10
H1rsquo-H1
H1rsquoH910 H16
H1
H1rsquo-H1rsquo
Hxrsquo-Hxrsquo
2
(pp
m)
(ppm)
315
811910 1rsquo
2rsquo2
3rsquo 4rsquo6rsquo
5rsquo
1rsquo2910
asymp asymp asympHDO MeOD Acetone
1
315
811 9101rsquo
2rsquo2
3rsquo4rsquo6rsquo
5rsquo
1rsquo2 9 10
asympasympasympHDOMeODAcetone
H1rsquo-H1
1rsquo
1
(p
pm
)
(ppm)
H1-H2
H1rsquo-H1
H1rsquo
H910
H1H5rsquo
H2
H1rsquo-H5rsquo
315
811910 1rsquo
2rsquo2
3rsquo 4rsquo6rsquo
5rsquo
1rsquo2910
asymp asymp asympHDO MeOD Acetone
1
H2rsquoH3rsquoH4rsquo
H2rsquoH3rsquoH4rsquo
X= 2rsquo3rsquo4rsquo
NOESY - T= 90degC
1H
1H
1H
1H
DQ-SQ - T= 70degC
a) b)
2
(pp
m)
(p
pm
)
(ppm)
A B
AhellipB
AhellipA
BhellipB
NOESY
(ppm)
A B
AhellipB
DQ-SQ
Single-quantum dimension
Do
ub
le-q
ua
ntu
m d
imen
sio
n
AhellipA
BhellipB
BhellipA
BhellipA
315
811910 1rsquo
2rsquo2
3rsquo 4rsquo6rsquo
5rsquo
1rsquo2910
asymp asymp asympHDO MeOD Acetone
1
lt 5 Aring
lt 5 Aring
H1-H2
H811
H15
H16
H6rsquo
H1rsquo
H1
H5rsquo
H2
H1-H2
H1rsquo-H1
H1rsquo-H5rsquo
H1rsquo
H1 H5rsquo
H1rsquo
H1
H5rsquo
H1H2rsquo H3rsquo H4rsquo
H1-H1
H1rsquo-H1
Hxrsquo-HxrsquoX= 2rsquo3rsquo4rsquo
H1-H2
H1rsquo
Zoom sugar region 28 ndash 45 ppmNOESY DQ-SQ
27
Head-tail or head-head configurations could be probed by the existence of H1rsquo-H1 657
interactions whereas H1 (δH= 356 ppm) is associated to the glucolipid tail and H1rsquo (δH= 432 658
ppm) to the sugar headgroup These atoms are more than 15 Aring apart and a direct interaction 659
could not be observed in both NOESY and DQ-SQ experiments NOESY experiments (Figure 660
9a) show that H1rsquo-H1 correlations are not observed Meanwhile clear-cut direct H1rsquo-H1 661
interactions are indeed observed are detected at T= 70degC (DQ cross-peaks related to H1rsquo-H1 662
correlation in DQ-SQ experiment shown in Figure 9b) Interestingly the absence of auto peaks 663
at δH= 432 ppm and δH= 335 ppm in the SQ dimension excludes H1rsquo-H1rsquo and Hxrsquo-Hxrsquo (x= 2 664
3 4) interactions respectively strengthening the idea that sugar headgroups from two nearest-665
neighbor G-C181-OH molecules are not adjacent in the nanotube-vesicle region 666
Homonuclear 2D ssNMR supports the idea according to which G-C181-OH can 667
undergo molecular flip-flops and a head-tail arrangement in the dry product Extrapolating these 668
conclusions in the lower concentration range lack of H1rsquo-H1 proximity at T= 90degC suggests a 669
head-head configuration in the vesicle-rich region and head-tail configuration within the 670
nanotubes It is however still unclear whether flip-flops are driven by spontaneous temperature-671
induced conformational changes in the glucolipid packing stimulating inclusions within the 672
membrane itself672223629ndash1218ndash21 or by defects generated by inter-vesicle collisions In fact a 673
combination of both is not unlikely Nanotubes are not stable when temperature is 20 to 30 674
degrees above Tm1 indicating that inter-vesicle collisions alone cannot explain the unusual 675
phenomenon In an energy landscape approach87 the head-head configuration is certainly 676
favored at high temperature while both head-head and head-tail configurations could be 677
favored in the mid-temperature region corresponding to the range between Tm1 and Tm2 in the 678
dry powder Both statistical and defect-induced flip-flop events contribute to form high mean 679
zero Gaussian curvature morphologies (nanotubes) for which the head-tail conformation 680
limiting the proximity between bulky sugar headgroups is probably more adapted (Figure 8c) 681
The flip-flop interpretation now reasonably explains the strong differences in the sugar and fatty 682
alcohol conformations deduced by the multiple NMR signals attributed to chemically-683
equivalent groups The existence of various low-energy conformations each having specific 684
NMR signature for sugars in solution78ndash8086 and solid-state81ndash84 further supports our 685
interpretation 686
One last point should be clarified Why between Tm1 and Tm2 are two molecular 687
environments able to coexist instead of a single one of average rigidity as found in the case of 688
ldquoripplerdquo phases50ndash54 We believe that this question can be answered based on the NMR results 689
the relatively short T2 values of the H1rsquo and OH protons shows the constrained mobility of the 690
28
sugar headgroup despite a certain flexibility of the chain (long T2 component) This trend may 691
suggest restrictions in translational mobility probably due to the sugar-OH hydrogen bonding 692
(Figure 8c) meaning that lipids are not able to diffuse within the membrane thus keeping two 693
different configurations stable 694
695
Conclusions 696
Topologically-connected nanotube-vesicle lipidic systems are commonly observed for 697
self-assembled membranes composed of at least two amphiphiles and spontaneously driven by 698
anisotropic inclusions andor by external directional forces This work shows that strong 699
differences in membrane curvature can spontaneously occur in single-lipid systems without 700
external anisotropic forces Coexistence and interconnection between nanotubes and vesicles 701
are evidenced via cryo-TEM and fluorescence confocal microscopy in a single-phase region at 702
temperature above a transition temperature Tm1= 483degC determined by DSC on the hydrated 703
sample but below the second transition temperature Tm2 (957degC) determined by DSC on the 704
dry powder X-ray diffraction (WAXS) also shows the coexistence of two lattice periods one 705
attributed to an inter-membrane repeating distance and the other possibly related to the intra-706
nanotube glucolipid arrangement Labelling the systems with Laurdan a fluorophore of which 707
the emission strongly varies with the local membrane rigidity excludes the presence of rigid 708
micro-separated phases (eg Lβ) 709
1H and 13C ssNMR despite the fact that it can only be performed on the dry powder 710
confirm the presence of one main fluid G-C181-OH environment above Tm2 Below Tm2 the 711
splitting of some 13C peaks and the coexistence of short and long 1H relaxation components 712
demonstrate that G-C181-OH can simultaneously pack into structurally and dynamically 713
inequivalent environments Combining advanced 2D 1H-1H correlation experiments based on 714
spin diffusion or double-quanta excitation suggests that vesicles could contain a preferred head-715
head configuration of the bolaform lipid while nanotubes a preferred head-tail assembly 716
The presence of two environments composed of the same molecule characterized by 717
different molecular configurations and rigidity fulfills the theoretical conditions necessary to 718
spontaneously nucleate a membrane inclusion of non-zero average orientation described as 719
necessary to observe topologically-connected nanotube-vesicle structures in the absence of 720
external forces This hypothesis could also be enriched by the possibility of nanotubes to be 721
pulled away between two vesicles after a collision event 722
This work expands the actual theoretical and experimental framework on lipid networks 723
stabilized by a different radius of curvature It could also motivate the synthesis or isolation 724
29
of new lipids providing a higher level of 3D architectural control in soft networks possibly in 725
the range of room temperature 726
727
Acknowledgements 728
Dr Andrea Lassenberger and Dr Sylvain Preacutevost at Institut Laue Langevin (ILL Grenoble 729
France) are kindly acknowledged for their assistance on the SANS experiment Confocal 730
images were performed at the Institut de Biologie Paris Seine (IBPS) imaging facility Jean-731
Franccedilois Gilles (Imaging Core Facility Institut de Biologie Paris Seine (IBPS) CNRS 732
Sorbonne Universiteacute Paris France) is kindly acknowledged for his assistance on the confocal 733
microscopy imaging Dr Guillaume Laurent (LCMCP Sorbonne Universiteacute Paris France) is 734
kindly acknowledged for helpful discussions The French region Ile-de-France SESAME 735
program is acknowledged for financial support (700 MHz NMR 736
spectrometer) Dr Olivier Diat (ICSM Marcoule France) Prof eronikaIglič and Prof V Aleš737
onsul discussi Slovenia) are kindly acknowledged for helpfUniversity of LjubljanaIglič (-Kralj 738
739
Financial support 740
WAXS experiments have been supported by Soleil Light Source Saint Aubin France proposal 741
Ndeg 20201747 SANS experiments have been supported by ILL proposal Ndeg9-13-778 742
743
References 744
1 D Kabaso N Bobrovska W Goacuteźdź E Gongadze V Kralj-Iglič R Zorec and A 745
Iglič Bioelectrochemistry 2012 87 204ndash210 746
2 C R Safinya U Raviv D J Needleman A Zidovska M C Choi M A Ojeda-747
Lopez K K Ewert Y Li H P Miller J Quispe B Carragher C S Potter M W 748
Kim S C Feinstein and L Wilson Adv Mater 2011 23 2260ndash2270 749
3 P Veranič M Lokar G J Schuumltz J Weghuber S Wieser H Haumlgerstrand V Kralj-750
Iglič and A Iglič Biophys J 2008 95 4416ndash4425 751
4 A Rustom R Saffrich I Markovic P Walther and H-H Gerdes Science (80- ) 752
2004 303 1007ndash1010 753
5 M I Angelova S Soleacuteau P Meacuteleacuteard F Faucon and P Bothorel Prog Colloid 754
Polym Sci 1992 89 127ndash131 755
6 L Mathivet S Cribier and P F Devaux Biophys J 1996 70 1112ndash1121 756
7 V Kralj-Iglič G Gomišček J Majhenc V Arrigler and S Svetina Colloids Surfaces 757
A Physicochem Eng Asp 2001 181 315ndash318 758
30
8 V Kralj-Iglič A Iglič G Gomišček F Sevšek V Arrigler and H Haumlgerstrand J 759
Phys A Math Gen 2002 35 1533ndash1549 760
9 M Drab D Stopar V Kralj-Iglič and A Iglič Cells 2019 8 626 761
10 A Zidovska K K Ewert J Quispe B Carragher C S Potter and C R Safinya 762
Langmuir 2009 25 2979ndash2985 763
11 A Zidovska K K Ewert J Quispe B Carragher C S Potter and C R Safinya Soft 764
Matter 2011 7 8363ndash8369 765
12 A Zidovska K K Ewert J Quispe B Carragher C S Potter and C R Safinya 766
Biochim Biophys Acta - Biomembr 2009 1788 1869ndash1876 767
13 M Karlsson K Sott M Davidson A S Cans P Linderholm D Chiu and O Orwar 768
Proc Natl Acad Sci U S A 2002 99 11573ndash11578 769
14 A Karlsson R Karlsson M Karlsson A-S Cans A Stromberg F Ryttsen and O 770
Orwar Nature 2001 409 150ndash152 771
15 M Karlsson K Sott A S Cans A Karlsson R Karlsson and O Orwar Langmuir 772
2001 17 6754ndash6758 773
16 E Evans H Bowman A Leung D Needham and D Tirrell Science (80- ) 1996 774
273 933ndash935 775
17 U Seifert Configurations of fluid membranes and vesicles 1997 vol 46 776
18 J Kaumls and E Sackmann Biophys J 1991 60 825ndash844 777
19 N Bobrovska W Goacuteźdź V Kralj-Iglič and A Iglič PLoS One 2013 8 e73941 778
20 A Iglič B Babnik K Bohinc M Fošnarič H Haumlgerstrand and V Kralj-Iglič J 779
Biomech 2007 40 579ndash585 780
21 K Bohinc T Slivnik A Iglič M Brumen and V Kralj-Iglič J Phys Chem C 2007 781
111 9709ndash9718 782
22 A Iglič H Haumlgerstrand P Veranič A Plemenitaš and V Kralj-Iglič J Theor Biol 783
2006 240 368ndash373 784
23 V Kralj-Iglič and P Veranič Adv Planar Lipid Bilayers Liposomes 2006 5 129ndash785
149 786
24 A Iglic and V Kralj-Iglic Adv Planar Lipid Bilayers Liposomes 2006 4 253ndash279 787
25 S Penič L Mesarec M Fošnarič L Mroacutewczyńska H Haumlgerstrand V Kralj-Iglič and 788
A Iglič Front Phys 2020 8 342 789
26 P Yager and P E Schoen Mol Cryst Liq Cryst 1984 106 371ndash381 790
27 T G Barclay K Constantopoulos and J Matisons Chem Rev 2014 114 10217ndash791
10291 792
31
28 B Božič G Gomišček V Kralj-Iglič S Svetina and B Žekš Eur Biophys J 2002 793
31 487ndash496 794
29 A Iglič H Haumlgerstrand M Bobrowska-Haumlgerstrand V Arrigler and V Kralj-Iglič 795
Phys Lett A 2003 310 493ndash497 796
30 R Bar-Ziv and E Moses Phys Rev Lett 1994 73 1392ndash1395 797
31 S Chiruvolu H E Warriner E Naranjo S H Idziak J O Raumldler R J Plano J A 798
Zasadzinski and C R Safinya Science (80- ) 1994 266 1222ndash1225 799
32 V Kralj-Iglič A Iglič H Haumlgerstrand and P Peterlin Phys Rev E 2000 61 4230ndash800
4234 801
33 L Mesarec M Drab S Penič V Kralj-Iglič and A Iglič Int J Mol Sci 2021 22 802
2348 803
34 L Van Renterghem S L K W Roelants N Baccile K Uyttersprot M C Taelman 804
B Everaert S Mincke S Ledegen S Debrouwer K Scholtens C V Stevens W 805
Soetaert L Van Renterghem S L K W Roelants N Baccile K Uytersprot M C 806
Taelman B Everaert S Mincke S Ledegen S Debrouwer K Scholtens C V 807
Stevens and W Soetaert Biotechnol Bioeng 2018 115 1195ndash1206 808
35 J Clark and F Deswarte Introduction to Chemicals from Biomass Second Edition 809
John Wiley amp Sons 2015 810
36 K V Sajna R Houmlfer R K Sukumaran L D Gottumukkala and A Pandey in 811
Industrial Biorefineries and White Biotechnology eds A Pandey R Houmlfer M 812
Taherzadeh K M Nampoothiri and C Larroche Amsterdam Oxford Waltham 813
Elsevier 2015 pp 499ndash521 814
37 R Marchant and I M Banat Trends Biotechnol 2012 30 558ndash565 815
38 K Hill and C LeHen-Ferrenbach in Sugar-Based Surfactants Fundamentals and 816
Applications ed C C Ruiz Boca Raton CRC Press 2009 pp 1ndash20 817
39 L Rodrigues I M Banat J Teixeira and R Oliveira J Antimicrob Chemother 818
2006 57 609ndash618 819
40 J D Desai and I M Banat Microbiol Mol Biol Rev 1997 61 47ndash64 820
41 S L K W Roelants K Ciesielska S L De Maeseneire H Moens B Everaert S 821
Verweire Q Denon B Vanlerberghe I N A Van Bogaert P Van der Meeren B 822
Devreese and W Soetaert Biotechnol Bioeng 2016 113 550ndash559 823
42 N Baccile M Selmane P Le Griel S Preacutevost J Perez C V Stevens E Delbeke S 824
Zibek M Guenther W Soetaert I N A Van Bogaert and S Roelants Langmuir 825
2016 32 6343ndash6359 826
32
43 N Baccile A-S Cuvier S Preacutevost C V Stevens E Delbeke J Berton W Soetaert 827
I N A Van Bogaert and S Roelants Langmuir 2016 32 10881ndash10894 828
44 N Baccile C Seyrig A Poirier S A Castro S L K W Roelants and S Abel Green 829
Chem 2021 23 3842ndash3944 830
45 A Salis L Cappai C Carucci D F Parsons and M Monduzzi J Phys Chem Lett 831
2020 11 6805ndash6811 832
46 J Schindelin I Arganda-Carreras E Frise V Kaynig M Longair T Pietzsch S 833
Preibisch C Rueden S Saalfeld B Schmid J-Y Tinevez D J White V 834
Hartenstein K Eliceiri P Tomancak and A Cardona Nat Methods 2012 9 676ndash835
682 836
47 T Parasassi and E Gratton J Fluoresc 1995 5 59ndash69 837
48 M M Dodes Traian F L Gonzaacutelez Flecha and V Levi J Lipid Res 2012 53 609ndash838
616 839
49 D M Owen C Rentero A Magenau A Abu-Siniyeh and K Gaus Nat Protoc 840
2012 7 24ndash35 841
50 W Stillwell in An Introduction to Biological Membranes Academic Press 2016 pp 842
135ndash180 843
51 W Stillwell in An Introduction to Biological Membranes Academic Press 2016 pp 844
181ndash220 845
52 B Tenchov Chem Phys Lipids 1991 57 165ndash177 846
53 R Koynova and M Caffrey Biochim Biophys Acta 1998 1376 91ndash145 847
54 F Schmid S Dolezel O Lenz and S Meinhardt J Phys Conf Ser 2014 487 848
012004 849
55 S Meinhardt R L C Vink and F Schmid Proc Natl Acad Sci U S A 2013 110 850
4476ndash4481 851
56 O Glatter and O Kratky Small Angle X-ray Scattering Academic Press London 852
1982 853
57 B A Cunningham A D Brown D H Wolfe W P Williams and A Brain Phys 854
Rev E 1998 58 3662ndash3672 855
58 M Nadler A Steiner T Dvir O Szekely P Szekely A Ginsburg R Asor R Resh 856
C Tamburu M Peres and U Raviv Soft Matter 2011 7 1512ndash1523 857
59 C Tanford The hydrophobic effect Formation of micelles and biological membranes 858
John Wiley amp Sons Inc New York 1973 859
60 M Masuda and T Shimizu Langmuir 2004 20 5969ndash5977 860
33
61 A Zidovska K K Ewert J Quispe B Carragher C S Potter and C R Safinya 861
Block Liposomes Vesicles of Charged Lipids with Distinctly Shaped Nanoscale 862
Sphere- Pear- Tube- or Rod-Segments Elsevier Inc 1st edn 2009 vol 465 863
62 A Iglic V Kralj-Iglic B Božič M Bobrowska-Haumlgerstrand B Isomaa and H 864
Haumlgerstrand Bioelectrochemistry 2000 52 203ndash211 865
63 T Shimizu M Masuda and H Minamikawa Chem Rev 2005 105 1401ndash1444 866
64 J V Selinger and J M Schnur Phys Rev Lett 1993 71 4091ndash4094 867
65 J M Schnur Science (80- ) 1993 262 1669ndash1676 868
66 B Tenchov R Koynova and G Rapp Biophys J 2001 80 1873ndash1890 869
67 R Koynova and B Tenchov Ser Biomech 2017 31 3ndash19 870
68 S J Angyal and R Le Fur Carbohydr Res 1984 126 15ndash26 871
69 J K Whitesell and M A Minton J Am Chem Soc 1987 109 225ndash228 872
70 T Takayama S Ando and I Ando J Mol Struct 1990 220 245ndash250 873
71 K Gawrisch N V Eldho and I V Polozov Chem Phys Lipids 2002 116 135ndash151 874
72 F Tielens C Gervais J F Lambert F Mauri and D Costa Chem Mater 2008 20 875
3336ndash3344 876
73 G A Jeffrey and Y Yeon Acta Crystallogr Sect B 1986 42 410ndash413 877
74 B Berglund and R W Vaughan J Chem Phys 1980 73 2037ndash2043 878
75 C Gervais C Coelho T Azaiumls J Maquet G Laurent F Pourpoint C Bonhomme 879
P Florian B Alonso G Guerrero P H Mutin and F Mauri J Magn Reson 2007 880
187 131ndash140 881
76 C Akita T Kawaguchi F Kaneko H Yamamoto and M Suzuki J Phys Chem B 882
2004 108 4862ndash4868 883
77 R N Purusottam L Seacutenicourt J J Lacapegravere and P Tekely Biochim Biophys Acta - 884
Biomembr 2015 1848 3134ndash3139 885
78 X Biarneacutes A Ardegravevol A Planas C Rovira A Laio and M Parrinello J Am Chem 886
Soc 2007 129 10686ndash10693 887
79 L M J Kroon‐Batenburg and J Kroon Biopolymers 1990 29 1243ndash1248 888
80 K N Kirschner and R J Woods Proc Natl Acad Sci U S A 2001 98 10541ndash889
10545 890
81 S Svenson B Kirste and J H Fuhrhop J Am Chem Soc 1994 116 11969ndash11975 891
82 I Sack S Macholl J H Fuhrhop and G Buntkowsky Phys Chem Chem Phys 892
2000 2 1781ndash1788 893
83 S Svenson J Koening and J H Fuhrhop J Phys Chem 1994 98 1022ndash1028 894
34
84 S Svenson A Schaefer and J H Fuhrhop J Chem Soc Perkin Trans 2 1994 2 895
1023ndash1028 896
85 K Bock and C Pedersen Adv Carbohydr Chem Biochem 1983 41 27ndash66 897
86 T B Grindley Structure and Conformation of Carbohydrates Springer Berlin 898
Heidelberg 2008 899
87 F Tantakitti J Boekhoven X Wang R V Kazantsev T Yu J Li E Zhuang R 900
Zandi J H Ortony C J Newcomb L C Palmer G S Shekhawat M O De La 901
Cruz G C Schatz and S I Stupp Nat Mater 2016 15 469ndash476 902
903
1
Supporting Information 904
905
Topological connection between vesicles and nanotubes in single-906
component lipid membranes driven by head-tail interactions 907
908
Niki Baccilea Ceacutedric Lorthioira Abdoul Aziz Baa Patrick Le Griela Cristina Coelhob Javier 909
Perezc Wim Soetaertd Sophie L K W Roelantsd 910
911
a Sorbonne Universiteacute Centre National de la Recherche Scientifique Laboratoire de Chimie de 912
la Matiegravere Condenseacutee de Paris LCMCP F-75005 Paris France 913
b Institut des Mateacuteriaux de Paris Centre Sorbonne Universiteacute Paris France 914
c Synchrotron Soleil LrsquoOrme des Merisiers Saint-Aubin BP48 91192 Gif-sur-Yvette Cedex 915
France 916
d InBio Department of Biotechnology Ghent University Ghent Belgium 917
918
919
Corresponding author 920
Dr Niki Baccile 921
E-mail address nikibaccilesorbonne-universitefr 922
Phone +33 1 44 27 56 77 923
924
925
926
2
a) 927
Parameter Method
Dry Matter (DM ) 996 Infrared balance 105degC
Glucose () 012 HPLC-Metacarb
Glycerol () nd HPLC-Metacarb
Free Fatty Acid content () lt001 Internal method BBEPP
GC with FID Detector
Oil () lt001 Internal method BBEPP
GC with FID Detector
Moulds (CFUg) lt10 3M-Nordval ndeg16 B
Yeasts (CFUg) lt10 3M-Nordval ndeg16 B
Anaerobic count (CFUg) lt10 SP-VG M005 B
Protein () tbd BCA protein assay
928
Figure S 1 - a) HPLC-ELSD chromatogram and composition table 929
930
931
932
933
3
b) 934
935
Group Ndeg δ ppm
CH2 1 354
CH2 2 153
CH2 3-712-14 132
CH2 811 203
CH 910 534
CH2 15 162
CH2 16 388
CH 1 424
CH 2 316
CH 3 334
CH 4 329
CH 5 354
CH2 6 366
Figure S 1 (next) ndash b) 1H NMR spectrum (MeOD-d4) recorded on the purified G-C181-OH compounds 936
and related assignment 937
938
2
811910 1rsquo
5rsquo1
3rsquo4rsquo
1rsquo1910
asymp asymp asympHDO MeOD Acetone
6rsquo2rsquo
1615
3-712-14
4
939
940
Figure S 2 ndash Cryo-TEM images recorded for a 5 mgmL G-C181-OH aqueous solution heat at T= 130degC 941
5
942
943
Figure S 3 - Cryo-TEM images recorded for a 5 mgmL G-C181-OH aqueous solution heat at T= 90degC 944
945
90degC
1
22
6
946
947
948
949
Figure S 4 ndash Cryo-TEM images recorded for a 5 mgmL G-C181-OH aqueous solution heat at T= 70degC 950
951
21
11
1
2
5
3
4
45
5
6
7
7
7
952
953
954
Figure S 5 ndash Cryo-TEM images recorded for a 5 mgmL G-C181-OH aqueous solution heat at T= 25degC 955
956
957
1
1 1
8
958
Figure S 6 ndash a) SANS experiment recorded at 90degC for a 5 mgmL G-C181-OH aqueous solution b-c) 959
WAXS experiments recorded on aqueous solutions of G-C181-OH at b) 5 mgmL and c) 25 mgmL d) 960
Structural interpretation of the repeating distances pointed out in c) 961
962
963
964
001 01 1
q Aring-1
25degC
68degC
88degC
111degC
01 1q Aring
-1
02 04 06 08 1q Aring
-1
001 01
10-1
100
101
Inte
nsity
cm
-1
q Aring-1
-2
T= 90degC
SANS WAXS WAXS
a) b) c)
dv
dL d= 144 Aring-1
di
ddH2O
dt
dvdL
dtdi d
d)
9
965
966
Figure S 7 ndash ssNMR MAS (10 kHz) experiments recorded on a G-C181-OH dry powder a) 1H spectra 967
recorded from 110degC to 70degC b) 13C single pulse (SP) spectra recorded with high power 1H decoupling from 968
110degC to 70degC c) 13C cross polarization (CP) spectra recorded at 110degC and contact time tc of 50 micros and 969
3000 micros d) 13C CP spectra recorded at 70degC and for 20 lt tc micros lt 3000 970
971
1
811
910
CH2 CH2
1rsquo
6rsquo
8 6 4 2 0 ppm
110
90
80
70
910
1rsquo
6rsquo16
1
2rsquo3rsquo4rsquo
811
OH
45 40 35 30 25 20 15
ppm
200 180 160 140 120 100 80 60 40 20 0
ppm140 120 100 80
ppm
CH2-gauche
3004
110
90
80
70
65
60
50
25
C91013003
C9 - 12869
CH2-all-trans
3198
C1rsquo10335
a) b)
1H
T degCT degC
13C Single Pulse MAS
A
B
A
B
70degC70degC
5rsquo
215
200 180 160 140 120 100 80 60 40 20 0
ppm
13C CPMAST= 110degC
200 180 160 140 120 100 80 60 40 20 0
ppm
132 131 130 129 128 127 126
ppm
106 105 104 103 102
ppm
13C CPMAST= 70degC
50
tc micros
3000
20
tc micros
50 500 1000 3000
tc micros
C102
13024 C910113003
C92
12869
C1rsquo213082
C1rsquo110443
A B
106 105 104 103 102
ppm
3000
1000
500
50
20
AB
c)
d)
10
972
Figure S 8 ndash a) Short and d) long T2 components displayed by the 1H transverse relaxation signal c) 1H 973
transverse relaxation signals recorded on a G-C181-OH dry powder from 110degC to 70degC The area of each 974
given resonance is plotted (log-lin) as a function of the echo time (CPMG pulse sequence) for each 975
temperature and fitted using the equation given above T2s and T2l indicate the short and long T2 relaxation 976
times respectively obtained by describing the 1H transverse relaxation signal using a biexponential decay 977
For H1rsquo H5rsquo and H6rsquo the 1H relaxation function could be described by a monoexponential decay 978
- Protons from the sugar group (H1rsquo H5rsquo H6rsquo) show a single T2 relaxation component (Figure 979
6c and Figure S 8) while protons of the acyl chain (CH2 H910 H811) show both short (Figure 980
6c) and long (Figure 6d) T2 relaxation component 981
- The short T2 relaxation time systematically decreases from 110degC to 70degC for all species by a 982
factor ranging from two to seven depending on the specific chemical group Very long T2 are 983
observed at 110degC for all acyl species while nearly unchanged values are measured below 984
90degC without any clear trend 985
- The sugar protons (H1rsquo H5rsquo H6rsquo) have the shortest set of T2 values (lt 1 ms) below 100degC 986
The long component of T2 generally ranges between 4 ms and 12 ms 987
0 1 2 3 4 5 6 7 8
00
05
10
15
20
25
30
35
40
45
Log
In
ten
sity
Time ms
0 1 2 3 4 5 6 7 8
00
05
10
15
20
25
30
35
40
45
Log
In
ten
sity
Time ms
0 1000 2000 3000 4000 5000 6000 7000 8000
00
05
10
15
20
25
30
35
40
45
Log
In
ten
sity
Time ms
0 1000 2000 3000 4000 5000 6000 7000 8000
00
05
10
15
20
25
30
35
40
45
Log
In
ten
sity
Time ms
0 1000 2000 3000 4000 5000 6000 7000 8000
00
05
10
15
20
25
30
35
40
45
Log
In
ten
sity
Time ms
0 1000 2000 3000 4000 5000 6000 7000 8000
00
05
10
15
20
25
30
35
40
45
Log
In
ten
sity
Time ms
H1
H8H11
H9H10
CH2
H1rsquo
H6rsquo
CH2
H910H811 H1CH2
H1rsquo H5rsquo6rsquo
0 1000 2000 3000 4000 5000 6000 7000 8000
00
05
10
15
20
25
30
35
40
45
Log
In
ten
sity
Time ms
OH
0 1000 2000 3000 4000 5000 6000 7000 8000
00
05
10
15
20
25
30
35
40
45 T= 110degC
T= 90degC
T= 80degC
T= 70degC
Log
In
ten
sity
Time ms
Fit
)
CH2 H910 H811 H1 H56 H1 OH
00
05
10
15
20
25
30
35
40
T2 m
s
T= 110degC
T= 90degC
T= 80degC
T= 70degC
CH2 H910 H811 H1
0
2
4
6
8
10
12
T2 m
s
T= 110degC
T= 90degC
T= 80degC
T= 70degC
Short T2(1H) Long T2(1H)
a) b)
c)
11
Table S 1 ndash 1H chemical shifts of G-C181-OH in solution and in the solid-state Solid-state spectra are 988
recorded at a MAS frequency of 10 kHz in DMSO-d6 broad peak 989
990
δH ppm
Group Ndeg Liquid
(MeOD-d4) Solid
(T= 110degC) Solid
(T= 70degC)
CH2 H1 354 357
CH2 H2 153 156
CH2 H3-712-14 132 135
CH2 H811 203 203
CH H910 534 534
CH2 H15 162 164
CH2 H16 388 383
CH H1 424 432
CH H2 316 335
CH H3 334 335
CH H4 329 335
CH H5 354 351 357
CH2 H6 366 383
OH OH1 432
45 463
OH OH2 492
OH OH3 490
OH OH4 487
OH OH6 445
991
992
H1H9H10H1rsquo
H6rsquo
OH2rsquo
OH1
12
Detailed discussion about the NOESY and DQ-SQ 2D 1H-1H ssNMR experiments presented in 993
Figure 9 994
995
2D 1H-1H ssNMR experiments are a unique tool to explore through-space proximities 996
between 1H nuclei ssNMR offers a large number of possibilities each adapted to a given 997
system The advantage of 2D maps with respect to a dynamics approach is their direct 998
readability in clear two nuclei which exchange their magnetization through-space (whichever 999
mechanism may be responsible for this exchange) will display a specific cross-peak However 1000
the way cross-peaks are presented and interpreted strictly depends on the nature of the pulse 1001
program which in turn is chosen according to the physical nature of the sample 1002
1D temperature-dependent 1H NMR experiments performed on G-C181-OH (Figure 1003
4a in the main text) indicate sharp peaks at 90degC and broad peaks at 70degC Narrow peaks 1004
indicate fast andor large-amplitude molecular tumbling averaging the strong 1H-1H dipolar 1005
interactions This excludes the use of pulse sequences like DQ-SQ which is not efficient under 1006
these conditions For this reason we employ spin-diffusion-based pulse sequences like 1007
NOESY which is more adapted for samples with high molecular mobility When mixing times 1008
are chosen to be short (lt 1 s) one generally explores through-space proximities within about 5 1009
10 Aring On the contrary when molecular motions are restricted dipolar coupling becomes 1010
significant 1H NMR peaks are broader and pulse sequences like DQ-SQ can now be used 1011
with a spatial resolution of less than 5 Aring 1012
Whenever possible DQ-SQ experiments are preferred over spin diffusion-based pulse 1013
sequences because they are more selective in particular for likewise interactions which are 1014
not discriminated in NOESY-type experiments This is illustrated by the typical interaction 1015
schemes for NOESY (top Figure 9a) and DQ-SQ (top Figure 9b) For two given A and B 1016
protons 2D NOESY maps will display two on-diagonal and two square-shaped symmetrical 1017
off-diagonal cross-peaks Off-diagonal cross-peaks illustrate the mutual A-B and B-A 1018
interaction but the on-diagonal peaks are systematic and do not prove any A-A or B-B 1019
interaction Similarly to NOESY 2D DQ-SQ maps display off-diagonal peaks (symmetric 1020
across the diagonal top Figure 9b) upon A-B and B-A interaction but in contrast they will 1021
display on-diagonal peaks only in the presence of self-interaction In the tutorial example of 1022
Figure 9b top the on-diagonal A-A peak indicates mutual A-A interaction while lack of on-1023
diagonal B-B peak evidences the absence of B-B proximities Combining NOESY and DQ-SQ 1024
experiments is capital to study the local arrangement of G-C181-OH and its evolution with 1025
temperature 1026
13
At T= 90degC the H1 and H5rsquo contributions are very close but possible to discriminate 1027
them (δ(H1)= 354 ppm δ(H5rsquo)= 351 ppm) according to 1H NMR chemical shifts in Table S 1028
1 2D 1H-1H NOESY in Figure 9a also discriminates between the two components attributed 1029
on the basis of the interactions with their mutual neighbors (green H1-H2 and H5rsquo-H1rsquo squares 1030
in Figure 9a) On this basis 2D NOESY does not show a direct H1rsquo-H1 correlation (blue red-1031
crossed) but rather an extensive network of intra-sugar interactions These features exclude 1032
suggest intra- and inter-sugar interactions and they exclude head-tail arrangements as a major 1033
molecular configuration at 90degC 1034
At 70degC the 1H NMR peaks are broader indicating a reduction of the T2 (1H) relaxation 1035
times andor residual homonuclear dipolar interactions excluding the use of NOESY In this 1036
case 1H-1H DQ-SQ correlation experiments are best suited Figure 9b presents the 1H-1H DQ-1037
SQ experiment on G-C181-OH at 70degC Peaks are broader than in NOESY and attribution may 1038
be cumbersome However the experiment is performed at 700 MHz and MAS= 22 kHz which 1039
improves spectral resolution with respect to the same experiment performed at 300 MHz and 1040
MAS= 10 kHz The auto-peak at δH= 356 ppm in the SQ dimension is attributed to H1-H1 spin 1041
pairs mainly resulting from intra CH2 interaction while the DQ cross-peaks at δH= 156-356 1042
ppm and δH= 432-356 ppm respectively origin from H2-H1 and H1rsquo-H1 interactions (Figure 1043
9b) DQ-SQ map does not show any auto-peak corresponding to H1rsquo-H1rsquo or Hxrsquo-Hxrsquo (x= 2rsquo 1044
3rsquo 4rsquo) interactions (red-crossed blue Figure 9b) thus excluding any proximity (lt 5 Aring) between 1045
close glucose neighbors On the contrary DQ-SQ maps (recorded both at 700 MHz Figure 9b 1046
or at 300 MHz not shown) systematically show DQ cross-peaks which can only be attributed 1047
to H1rsquo-H1 interactions (δH= 432-356) The presence of these H1rsquo-H1 interactions can only be 1048
explained by a head-tail arrangement of the G-C181-OH molecules as illustrated below the 1049
DQ-SQ map in Figure 9b 1050

5
cooled at to the desired temperature For the SAXS experiment the sample was heat at 90degC in 118
the block heating device and cooled at to 25degC before analysis For the SANS experiment the 119
sample was heat at 90degC directly in front of the beam using the thermalized sample holder 120
available 121
122
Differential Scanning Calorimetry (DSC) DSC was performed using a DSC Q20 apparatus 123
from TA Instruments equipped with the Advantage for Q Series Version acquisition software 124
(v540) Acquisition was performed on both hydrated and dry powder sample (~ 3-5 mg) sealed 125
in a classical aluminium cup and using an immediate sequence of heating and cooling ramps at 126
a rate of 10degCmin-1 Melting temperatures Tm 1 and 2 Tm1 and Tm2 were taken at the minimum 127
of the endothermic peak 128
129
Small and Wide Angle Scattering experiments Small angle neutron scattering (SANS) 130
experiments were performed at the D11 beamline of Institut Laue Langevin (Grenoble France) 131
during the run No 9-13-778 Four q-ranges have been explored and merged using the following 132
wavelengths λ and sample-to-detector (StD) distances 1) ultra-low q λ= 135Aring StD= 39 m 133
2) low-q λ= 53Aring StD= 39 m 3) mid-q λ= 53Aring StD= 8 m 4) high-q λ= 53Aring StD= 14 m 134
The sample (C= 5 mgmL-1) was prepared in 999 D2O to limit the incoherent background 135
scattering The sample solution was analyzed in standard 1 mm quartz cells Direct beam empty 136
quartz cell H2O (incoherent scatterer) within the quartz cell were recorded and boron carbide 137
(B4C) was used as neutron absorber The sample acquisition was measured at 90degC where 138
temperature was controlled through the controller thermalized sample holder available at the 139
beamline The background sample (D2O) signal was subtracted from the experimental data 140
Absolute values of the scattering intensity were obtained from the direct determination of the 141
number of neutrons in the incident beam and the detector cell solid angle The 2D raw data were 142
corrected for the ambient background and empty cell scattering and normalized to yield an 143
absolute scale (cross section per unit volume) by the neutron flux on the samples The data were 144
then circularly averaged to yield the 1D intensity distribution I(q) The software package Grasp 145
(developed at ILL and available free of charge) was used to integrate the data while the 146
software package SAXSUtilities (developed at ESRF and available free of charge) was used to 147
merge the data acquired at all configurations and subtract the background 148
Wide-angle X-ray scattering (WAXS) was performed under temperature control at the 149
SWING beamline of SOLEIL synchrotron facility (Saint-Aubin France) during the run 150
20201747 (energy 14 keV sample-to-detector distance 05 m) Two sample concentrations in 151
6
H2O were probed C= 5 mgmL-1 and C= 25 mgmL-1 The 2D data were integrated azimuthally 152
at the beamline using the software Foxtrot and in order to obtain the I(q) vs q spectrum after 153
masking the beam stop shadow Silver behenate (d(100) = 5838 Aring) was used as a standard to 154
calibrate the q-scale Sample solutions were inserted in borosilicate capillaries of 15 mm in 155
diameter Capillaries were flame-sealed A capillary oven with controlled temperature (plusmn 05degC) 156
provided at the beamline was used to control the sample temperature between 25degC and 111degC 157
Data were normalized by the transmission and calibrated to the SAXS signal of H2O at large q-158
values (I= 00163 cm-1) in order to obtain an absolute intensity scale The water signal was 159
measured by subtracting the signal of the empty capillary from the signal of a water-filled 160
capillary The signal of (water + capillary) was used as background for the samples and it was 161
subtracted after integration of the 2D data 162
163
Cryogenic transmission electron microscopy (cryo-TEM) Cryo-TEM experiments were carried 164
out on an FEI Tecnai 120 twin microscope operating at 120 kV and equipped with a Gatan 165
Orius CCD numeric camera The sample holder was a Gatan Cryoholder (Gatan 626DH 166
Gatan) Digital Micrograph software was used for image acquisition Cryofixation was 167
performed using a homemade cryofixation device The solutions were deposited on a glow-168
discharged holey carbon coated TEM copper grid (Quantifoil R22 Germany) Excess solution 169
was removed and the grid was immediately plunged into liquid ethane at -180degC before 170
transferring them into liquid nitrogen All grids were kept at liquid nitrogen temperature 171
throughout all experimentation Cryo-TEM images have been treated and analyzed using Fiji 172
(is just ImageJ) software available free of charge at the developerrsquos website46 173
The samplersquos concentration was C= 5 mgmL-1 For technical reasons the temperature 174
during cryofixation could not be controlled For this reason the temperature associated with 175
each cryo-TEM image in the text was related to the equilibration temperature just before 176
cryofixation the device being as close as possible to the dry bath used for temperature control 177
Since temperature control during cryofixation was not possible in our device and practically 178
impossible at high temperatures one should take the T values as indicative of the given value 179
Although the sample transfer between the dry bath and the cryofixation device was performed 180
as fast as possible it is more than likely that the actual temperature of the sample at the moment 181
of cryofixation was lower than the one indicated here although impossible to know precisely 182
183
7
Fluorescence microscopy Images were recorded using a 40x objective on a Leica SP5 upright 184
confocal microscope with 405 nm laser excitation The sample was marked with 6-dodecanoyl-185
NN-dimethyl-2-naphthylamine (Laurdan Mw= 35354 gmol-1) fluorophore as follows A 186
stock solution of 3 mg of Laurdan in 100 microL of acetone was initially prepared (C= 30 mgmL-187
1) A volume of 028 microL of the stock Laurdan solution was diluted in 1 mL of a 5 mgmL-1 G-188
C181-OH water solution temporary set at 110degC in a sealed Eppendorf The latter was 189
important so to enhance inclusion of Laurdan in the membrane constituted by the glucolipid 190
while in its vesicle phase The final Laurdan concentration was approximately 24 micromol with a 191
molar Laurdan-to-G-C181-OH molar ratio of approximately 1-to-500 Fluorophore-to-lipid 192
ratios above 1200 were generally considered as non-interfering with the lipid phase behavior 193
as also verified in this work 194
Laurdan can be excited between 365 nm and 410 nm and its emission wavelength can 195
vary according to the rigidity of the membrane intercalation within a rigid or flexible 196
membrane generates emissions at 440 nm or 490 nm respectively47 In the present experiment 197
we have flame-sealed a solution of G-C181-OH at 5 mgmL-1 containing Laurdan (1-to-500 in 198
lipid-to-Laurdan ratio) in flat optical capillaries of 01 mm thickness Capillaries were set on a 199
Linkam support for temperature control eventually placed under the microscope The sample 200
was excited at 405 nm and detection was made in spectral mode with a 5 nm window sliding 201
every 5 nm from 412 nm to 602 nm in 16 bits which allows quantify the signal and compare 202
the different conditions Quantitative analysis was performed according to the literature4849 203
several ROI (range of interest) have been drawn on several images using the ROI manager of 204
Fiji (is just ImageJ) software The integrated intensity of each ROI at 440 nm and 490 nm was 205
eventually recorded and used to calculate the value of the generalized polarization GP as 206
follows of 207
119866119875 =(120582440 minus 120582490)
120582440 + 120582490 208
A negative GP indicates a flexible membrane while a positive GP indicates a rigid membrane 209
210
Solid-state Nuclear Magnetic Resonance (ssNMR) 1H and 13C ssNMR experiments have been 211
performed using an Avance III HD Bruker 705 T (ν1H= 300 MHz) spectrometer and a 4 mm 212
magic angle spinning (MAS) probe except for the BAck-to-BAck (BABA) experiment which 213
was performed on an Avance III Bruker 1644 T (ν1H= 700 MHz) spectrometer equipped with 214
25 mm MAS probe Temperature was controlled through a Smart cooler BCUIIa BCU-xtreme 215
unit using 10 min of equilibration time after each temperature variation Temperature was 216
8
always varied from high (110degC) to low (70degC) before analysis Due to combined use of fast 217
MAS rates necessary to achieve high resolution spectra and heating close to the boiling point 218
of water neither diluted nor concentrated samples could be used for ssNMR experiments All 219
tests employing up to 50 wt G-C181-OH in water resulted in sample centrifugation drying 220
but also expulsion from the rotor causing sudden stop of rotor spinning For these reasons all 221
attempts to study hydrated G-C181-OH failed and only the dry powder could be analyzed The 222
dry sample powder was analyzed as such in zirconia rotors (4 mm or 25 mm) spinning at MAS= 223
10 kHz (4 mm) or 22 kHz (25 mm) and Chemical shifts were calibrated with respect to 224
adamantane (13C 13C(CH2)= 3848 ppm = 191 ppm) and glycine alpha (13C(CO)= 17603 225
ppm) Details on the acquisition parameters are given in the Supporting Information 226
227
Results and discussion 228
Topologically-connected nanotubes and vesicles 229
G-C181-OH is a biobased glucolipid water-insoluble at room temperature and of 230
which the physicochemical properties are poorly known The DSC thermogram performed at 231
10degCmin of G-C181-OH as a function of the water content (Figure 2a) shows two endothermic 232
peaks on the dry powder (996 wt glucolipid) They are attributed to two melting phenomena 233
occurring at the following temperatures Tm 483degC (Tm1) and 957degC (Tm2) the enthalpy of the 234
former being lower than that of the latter Interestingly DSC also shows that Tm1 is hydration 235
independent and reversible (the associated exothermic peak is systematically observed) while 236
the transition at Tm2 is simply suppressed (here tested up to 130degC) on hydrated powders and 237
never observed on the cooling profile even at slow cooling rates (1degCmin) The thermogram 238
recorded on the dry powder is typical of single-component lipids having an intermediate50 239
metastable phase (often referred to the ripple phase Pβ´ in reference to the periodic undulation 240
of the bilayer)50ndash54 between the classical lamellar gel (Lβ) and liquid crystalline (Lα) phases50ndash241
54 and characterized by regions of both liquid order and disorder5455 The effect of water does 242
not influence the low-temperature crystallization at Tm1 but it contributes to disrupt the ordered 243
array of hydrocarbon chains in the metastable phase 244
On the basis of the DSC thermogram the aqueous phase behavior of G-C181-OH under 245
diluted conditions (5 mgmL-1) was studied at four different temperatures (red marks on Figure 246
2a) below and above Tm1 but also between Tm1 and Tm2 corresponding to the thermogram of 247
the dry powder 248
9
249
Figure 2 ndash a) DSC thermogram of G-C181-OH under dry (04 wt water estimated by thermogravimetric 250
analysis) and hydrated conditions recorded at a heating rate of 10degCmin Red marks indicate the 251
temperatures at which cryo-TEM experiments are performed on the corresponding 5 mgmL aqueous 252
solutions b) Cryo-TEM images recorded for a 5 mgmL G-C181-OH aqueous solution heat at T= 130degC 253
90degC 70degC and 25degC T indicates the temperature of the sample solution before cryofixation Tne T T 254
being the temperature of the sample upon plunging in liquid ethane Please refer to the materials and 255
methods section for more information 256
T= 130degC
T= 90degC
T= 70degC
T= 25degC
a)
b)
20 40 60 80 100 120
99 wt
50 wt
25 wt
T degC
En
do
10 wt
Tm1= 483 degC
Tm2= 957 degC
10
257
The series of cryo-TEM images in Figure 2b show an overview of the most relevant 258
structures observed on G-C181-OH solution from T= 130degC to T= 25degC whereas T is 259
indicative of the equilibrium temperature before cryofixation (refer to materials and methods 260
section for more information on the sense and interpretation of T) At Tgt 100degC the sample 261
is essentially composed of polydisperse single wall vesicles massively shown by the 262
complementary pictures presented in Figure S 2 In between Tm1 and Tm2 at T= 90degC and T= 263
70degC (Figure 2b Figure 3 Figure 4 complemented by Figure S 3 and Figure S 4) vesicles are 264
connected by nanotubes At Tlt Tm1 flat crystals are otherwise observed (Figure 2b and Figure 265
S 5) 266
267
268
Figure 3 ndash Cryo-TEM images recorded for a 5 mgmL G-C181-OH aqueous solution heat at T= 90degC 269
270
A deeper insight at T= 90degC is given in Figure 3 (more images are provided in Figure 271
S 3) Arrows 1 through 6 mark very clearly the typical continuity in the glucolipid membrane 272
between the vesicle and nanotubes Arrow Ndeg 7 shows that a single nanotube connects the outer 273
membrane of two vesicles several hundred nanometers apart The connection is shown by 274
2
34
5
6
6
1
5
7
A
B
D
C
0 10 20 30 40 50 60
BIn
tensity
au
Profile nm
A
0 10 20 30 40 50 60
Inte
nsity
au
Profile nm
C
D
T= 90degC
11
arrows Ndeg5 and Ndeg6 The corresponding profiles A through D confirm the tubular nature of 275
the elongated objects Profiles B and D are both characterized by typical symmetrical thick 276
walls (low intensity depths highlighted by shaded rectangles) surrounding a hollow region (high 277
intensity peak between the shaded rectangles) The wall thickness varies between 35 and 40 278
nm for profile B and between 41 and 61 nm for profile D while the total nanotube diameter 279
varies between 14 nm at B and 20 nm at D At the same time the thickness of the vesicle wall 280
is about 6 nm at A and 135 nm at C Considerations about the bilayer or interdigitated structure 281
of the membrane will be presented below 282
The connection between nanotubes and vesicles seems to be multiple For instance 283
arrow Ndeg1 (Figure S 3) and Ndeg4 (Figure 3) show a single-wall vesicle of which the membrane 284
is extruded into a nanotube Similarly a closer look at arrows Ndeg1 2 and 3 in Figure 3 show 285
that the vesicle is single-wall and fully closed while the nanotube nucleates at the vesicle outer 286
surface with no apparent topological continuity In many regions of the sample at T= 90degC 287
one can find exvaginations or buds232531 in the nanotube wall This is shown for instance by 288
arrows Ndeg7 and particularly put in evidence in Figure 4 by arrows Ndeg1 through Ndeg4 where the 289
amplitude of the oscillation varies between 20-25 nm (arrow Ndeg1) and 6-8 nm (arrows Ndeg3-4) 290
291
Figure 4 - Cryo-TEM images recorded for a 5 mgmL G-C181-OH aqueous solution heated at T= 90degC 292
293
Still between Tm2 and Tm1 but at lower temperature (T= 70degC) the nanotubes seem to 294
vary from single threads (arrow Ndeg1 Figure S 4) to nanotubes of diameter below 15 nm both 295
connecting nanotubes of diameter ranging between 50 nm and 100 nm (arrows Ndeg2 Figure S 296
4) The larger tubes are most likely formed by the inflation and flattening of the nanotubes 297
probably after assimilation of surrounding vesicles and fusion of the exvagination discussed 298
above The transition between vesicles tubes and flat membranes is certainly more accentuated 299
Arrow Ndeg3 in Figure S 4 shows distinct vesicles while arrow Ndeg4 identifies a flat structure 300
evidently formed from fused vesicles In particular arrow Ndeg5 points at the fusion of two 301
2
1 132
4
12
vesicles while arrow Ndeg6 points at two vesicles fusing into the flat membrane Additional areas 302
where vesicle fusion is prominent are indicated by the oscillations at the outer skirt of broad 303
lamellae and pointed by arrow Ndeg7 304
Finally below Tm1 at T= 25degC for instance mainly flat crystals with no visible 305
exvaginations or tubes are visible (Figure S 5) by cryo-TEM and the material turns into an 306
insoluble precipitate Massive presence of flat crystalline structures is also clear from the bulk 307
iridescent behavior of a G-C181-OH solution under manual shear 308
In summary despite the uncertainty related to the actual state of equilibrium of the 309
glucolipids at the moment of cryofixation cryo-TEM depicts a vesicle phase at Tgt 100degC a 310
flat lamellar phase below Tm1 and an interconnected vesicle-nanotube network between Tm1 and 311
about 100degC The combination of statistically-relevant fluorescence microscopy and 312
scatteringdiffraction experiments provides an additional proof of the coexistence of 313
vesiclenanotube systems between the two transition temperatures Please note that the 314
experiments reported below have been performed under controlled conditions of temperature 315
which is then indicated by the use of T instead of T 316
13
317
Figure 5 ndash a-c) Confocal fluorescence microscopy images recorded at 90degC and 70degC for a 5 mgmL G-318
C181-OH aqueous solution d-g) Typical fluorescence microscopy images recorded at T= 80degC using 319
Laurdan (refer to materials and methods section for more details on this fluorophore) Excitation 320
wavelength is 405 nm for all the images while emission wavelength is 490 nm in (df) and 440 nm in (eg) 321
h) Full emission spectra obtained from the integration of various fluorescence images recorded from 412 322
nm to 600 nm (step 5 nm) at 90degC 80degC and 70degC i) Box plot of GP defined as 119918119927 =(120640120786120786120782minus120640120786120791120782)
120640120786120786120782+120640120786120791120782 with 120640120786120786120782 323
and 120640120786120791120782 being the emission wavelengths at 440 nm and 490 nm at 90degC 80degC and 70degC Each data point 324
l= 490 nm l= 440 nm
l= 490 nm l= 440 nm
10 μm400 450 500 550 600
00
02
04
06
08
10
No
rma
lize
d I
nte
nsity
l nm
90degC
80degC
80degC
70degC
70degC
400 450 500 550 60000
02
04
06
08
10
No
rma
lize
d I
nte
nsity
l nm
90degC
80degC
80degC
70degC
70degC
d) e)
f) g)
h)
i)
T= 80degC
Laurdan
T= 80degC
T= 80degC T= 80degC
T= 90degC T= 70degC T= 70degC
a) b) c)
1
1
1
14
corresponds to a set of regions of interest (ROIs) (54 at 90degC 65 at 80degC and 75 at 70degC) selected in the 325
corresponding fluorescence images ROIs were representatively selected so to include the entire image but 326
also vesicles alone tubes alone and mixtures of vesicles and tubes 327
328
Figure 5ab shows two typical confocal fluorescence microscopy images recorded on a 329
G-C181-OH solution (5 mgmL) in a flame-sealed capillary heat at T= 90degC and T= 70degC 330
Although the resolution of optical microscopy is not comparable with cryo-TEM the sample is 331
broadly composed of vesicles coexisting with nanotubes whereas in some cases the nanotube 332
starts from the vesicle itself (arrow Ndeg1) in good agreement with cryo-TEM data Furthermore 333
SANS recorded at T= 90degC (Figure S 6a) shows a scattering profile with a pronounced -2 334
dependence of the scattering intensity against the wavevector q in the log-log scale This 335
indicates the massive presence of a flat interface and it is expected typical of bilayers in 336
vesicular morphologies56 However the typical signature of nanotubes cannot be observed in 337
the SANS profile and this can be explained by both an argument related to the relative lower 338
amount of nanotubes with respect to vesicles at 90degC but also to the steeper slope of flat 339
morphologies (-2) compared to tubes (-1) the signal of the former masking the tube signal at 340
low wavevector values The SANS profile is characterized by a diffraction peak at q= 0167 Aring-341
1 of which the assignment is refined by WAXS data 342
Temperature-driven WAXS experiments in Figure S 6bc (5 mgmL-1 and 25 mgmL-1 343
respectively) show a lamellar order possibly attributed to a multilamellar structure of the 344
vesicles (dv Figure S 6d) at high temperature and to the interplanar arrangement of the 345
crystalline flat structures (dL Figure S 6d) at T= 25degC The sharp (001) reflection indicates 346
typical interlamellar distance of 353 Aring at 25degC although this value varies with temperature 347
(400 Aring at 111degC 372 Aring at 88degC) thus confirming its assignment to a hydration-dependent 348
interlamellar order More intriguing is the second broader peak at q= 0403 Aring-1 (d= 156 Aring) 349
and its reflection both clearly visible at 88degC below Tm2 We attribute it to the inter-glucolipid 350
arrangement inside the tubular phase (dt Figure S 6d) coexisting with the vesicle phase 351
between Tm1 and Tm2 and to the planar lipid arrangement (di Figure S 6d) in the rigid flat 352
lamellar structure below Tm2 Its temperature- hence hydration- independent position also 353
confirms its structural origin Finally besides the water-structure peak at about 2 Aring-1 we also 354
observe a broad peak at 144 Aring-1 characteristics of the lateral packing (d Figure S 6d) of lipids 355
in bilayers While its position could be consistent with an Lα phase5758 above Tm2 its broadness 356
and positional invariance as well as the coexistence between vesicles and tubes do not allow a 357
precise assignment 358
15
Does G-C181-OH assume a bilayer or interdigitated structure the latter being the one 359
found for other similar bolaform glucolipids4243 The size of G-C181-OH can be estimated to 360
be at the most 32 Aring given by the length L of the C16 tail (L = 22 Aring from the Tanford formula 361
L= 154 + 1265 times n (n= 16)59) and the sugar (about 10 Aring)4243 However the cis conformation 362
of the C=C bond imposes a ldquokinkrdquo of 60deg in the aliphatic chain which reduces the effective 363
length of the oleic backbone to about 17 Aring for an effective total G-C181-OH length of about 364
27 Aring Cryo-TEM provides a tube thickness varying from 35 Aring to 60 Aring and a vesicle membrane 365
thickness of at least 60 Aring WAXS suggests an interlamellar thickness (membrane and water) 366
between 40 Aring and 37 Aring and an inter-lipid distance in the tube of about 16 Aring In the absence of 367
a clear form factor oscillation profile as found for similar glucolipids4243 one must 368
acknowledge that these data pledge neither in favor of fully interdigitated nor a double layer 369
structure and might suggest a tilted lipid arrangement with partial interdigitation60 370
371
13C ssNMR demonstrates that G-C181-OH can assume two coexisting head-head and 372
head-tail configurations 373
Vesicles are characterized by low positive mean and gaussian curvatures while 374
nanotubes are described by a combination of a high positive mean and zero gaussian curvatures 375
In this regard the coexistence of vesicles and nanotubes requires glucolipids to adapt 376
themselves to both environments at the same time For this reason the formation of nanotube-377
vesicle networks generally requires a specific driving force able to impose a high mean and 378
zero gaussian curvature to the membrane In many systems insertion of at least a second 379
constituent (lipid surfactant protein) in the membrane becomes a necessary internal driving 380
force for the nucleation and growth of so-called membrane inclusions from which 381
topologically-connected nanotubes can form10ndash123261 as explained by orientational ordering 382
arguments62 It has also been shown that external driving forces such as use of laser 383
ldquotweezersrdquo30 osmotic pressure6 electroformation5ndash82829 or controlled suction13ndash16 are 384
otherwise necessary as also supported by theoretical studies19 385
The bending energy of tubes is higher than that of a vesicle membrane8 due to the 386
dependence of the membrane free energy from the principal curvatures For this reason 387
isotropic (rotational symmetry along the main axis) but also anisotropic33 lipids generally 388
stabilize low-curvature shapes like flat membranes or vesicles Lipid nanotubes are also a 389
common phase formed by amphiphiles but generally for lipids with a certain complexity in 390
their molecular structures as exampled by diacetylenic derivatives of phospholipids among 391
others262763ndash65 Negative contributions to the bending energy favoring the simultaneous 392
16
presence of interconnected vesicles and tubes was shown to be driven by the presence of 393
anisotropic lipids in a membrane continuum Spontaneous deviations to the elastic theory in the 394
presence of surfactants lipids and proteins with anisotropic structures favor the formation of 395
protrusions with radius of the order of the fraction of a micron9ndash1219ndash2362 396
In the absence of both internal and external driving forces mentioned above G-C181-397
OH should behave as a standard lipid Its DSC profile (Figure 2)536667 under both hydrated and 398
dry conditions identifies a hydration-independent transition (Tm1) slightly above room 399
temperature this is followed by one main transition at higher temperature (Tm2) in the dry 400
sample50 For such a profile one expects a gel phase (Lβ) below Tm1 and a liquid crystalline 401
structure possibly in the morphology of vesicles (L4 phase) possibly above Tm1 and most likely 402
above Tm231 as experimentally found On the basis of the thermogram recorded on the dry 403
powder one may also expect a ldquoripplerdquo (Pβ) phase between Tm1 and Tm2 characterized by 404
periodic undulations of the bilayer (generally addressed to as regions with both liquid order and 405
disorder)5455 406
In the present work instead of a Lβ phase we observe flat crystals below Tm1 and a 407
vesicle-nanotube network instead of the ldquoripplerdquo phase The latter is particularly unexpected 408
because the membrane is composed of a single-component (G-C181-OH) and no anisotropic 409
external force (osmotic hydrodynamic electric) is used to pull and stabilize the tubes In 410
addition the nanotubes are observed at fairly high temperatures above Tm1 (between about 411
60degC and 90degC) while this morphology is generally favored at low temperature (proportionality 412
with 1kT figure 5 in Ref 62) commonly below a given transition temperature characteristics 413
for each specific amphiphile27 Furthermore nanotubes of G-C181-OH seem to be stable in 414
time thus differing from what is found in electroformed vesicles78 They are also observed 415
away from phase transition events (may them be at Tm1 or Tm2) as otherwise reported before 416
for a diacetylenic derivative of phosphatidylcholine26 and many other systems27 417
A stable nanotube-vesicle network for a single-component phospholipid in the absence 418
of external driving forces is not expected and has never been reported before It could be 419
explained by the coexistence of two micro-separated phases of different rigidity This 420
hypothesis is excluded by confocal microscopy on Laurdan-labelled membranes and magic 421
angle spinning (MAS) solid-state NMR (ssNMR) experiments 422
Laurdan is a well-known fluorophore used to put in evidence the coexistence of rigid 423
and fluid domains in both model and biological membranes47ndash49 Laurdan was used here to label 424
the G-C181-OH membranes between Tm1 and Tm2 and to verify the possible micro-segregation 425
and coexistence of rigid (eg Lβ λem= 440 nm) and fluid (eg Lα λem= 490 nm) domains in 426
17
tubes and vesicles respectively A set of quantitative experiments performed on a 5 mgmL-1 427
solution summarized in Figure 5 shows an excess of fluorescence at only λem= 490 nm for 428
temperature between 90degC and 70degC (Figure 5h) The GP value which quantifies the rigidfluid 429
character of the membrane is systematically negative (Figure 5i) indicating an overall fluid 430
membrane at all temperatures GP is quantified on more than 50 regions of interest (ROIs) at 431
each temperature including vesicles and tubes alone as well as connected nanotube-vesicles 432
(Figure 5d-g) The dispersion of GP at 80degC and 70degC between -08 and -02 could suggest the 433
spurious presence of membranes with various degrees of flexibility although fluidity is always 434
predominant The combination of WAXS (broad peak d= 144 Aring-1 invariant with 435
temperature Figure S 6bc) and confocal fluorescence microscopy using Laurdan confirms the 436
single-phase of the membrane composed of G-C181-OH both in vesicles and nanotubes This 437
is also consistent with the lack of phase transitions in DSC experiments between ~85degC and 438
~60degC especially in hydrated samples We conclude that the vesicle-nanotube transition is not 439
driven by the local segregation of gel phase (Lβ) microdomains nor that the nanotubes are 440
composed of such phase 441
ssNMR is the best-suited approach to investigate the origin of the local driving force for 442
the nucleation of anisotropic inclusions of which the average orientation depends on the local 443
membrane and inclusion curvatures and was shown to promote tubing62 ssNMR can provide 444
information on the local molecular mobility eg through the nuclear spin relaxation behavior 445
but also on intermolecular interactions and stereochemistry eg through variations in the 446
chemical shift68ndash70 447
Ideally ssNMR should be performed on diluted G-C181-OH samples above Tm1 448
However fast MAS necessary for high resolution centrifuges the sample As a first 449
approximation hydrated G-C181-OH samples for instance at 50 wt as classically done for 450
phospholipids71 could be studied Unfortunately permeability of the sample holder combined 451
to heating (close to the boiling point of water) and MAS provoke dehydration and even sample 452
ejection After experiencing both of the above this approach was abandoned As a second 453
approximation the study of the dehydrated G-C181-OH powder avoids centrifugation and 454
evaporation If studying dried lipids may not reflect their exact behaviour under diluted 455
conditions valuable structural information can still be obtained in dehydrated molecular 456
systems like proteins thus illustrating that this approach is not unreasonable Furthermore if 457
DSC (Figure 2a) shows that hydration suppresses the Tm2 it also shows that the value of Tm1 is 458
not affected by water at concentrations as low as 10 wt For this reason performing a 459
structural analysis of dehydrated G-C181-OH by ssNMR above Tm1 may help understanding 460
18
the local arrangement of G-C181-OH in two morphologies vesicles and nanotubes having 461
sensibly different curvatures 462
To explore the local mobility of the most relevant chemical groups of G-C181-OH 463
above Tm2 (T= 110degC) and between Tm2 and Tm1 (70 lt T degC lt 90) we combine a series of 1H 464
and 13C experiments Single-pulse (SP) MAS experiments (1H and 13C) when recorded under 465
quantitative conditions allow the detection of all chemical species while cross-polarization 466
(CP) MAS (13C only) experiments are sensitive only to constrained groups for which the 1H-467
13C dipolar coupling is not averaged to zero by the molecular motions 468
469
Figure 6 ndash a) 1H MAS (10 kHz) ssNMR spectra recorded from 110degC to 70degC b) 13C MAS (10 kHz) ssNMR 470
spectra recorded using high power decoupling single pulse (SP) and cross-polarization (CP) pulse sequences 471
Contact time for CP experiments and corresponding temperatures are given on each spectrum Full spectra 472
are given in Figure S 7 473
The most relevant 1H and 13C spectra are given in Figure 6 (full range in Figure 7 and 474
Figure S 7) As expected the 1H solid-state SPMAS spectra show broader peaks compared to 475
the solution-state NMR spectrum (Figure 6a) reflecting the obvious solid-state character of the 476
sample at any temperature The sugar group and the C=C bond resonate in the 25-6 ppm range 477
and 535 ppm respectively while the OH groups of the sugar moiety are found below 45 ppm 478
(Figure 6a full assignment in Table S 1) Very broad (~1 ppm) at 100degC the position of the 479
OH peak varies with the temperature value and becomes narrower (lt~05 ppm) and visible at 480
δH= 464 ppm at T= 70degC Line narrowing and chemical shift variations of the OH resonance 481
in ssNMR is always a direct sign of H-bonding interactions whereas the strength of the H-482
bonding hence its OHhellipH distance is correlated to a dispersion in chemical shifts72ndash75 All other 483
60 55 50 45 40 35 30 25
ppm
110
90
80
70
910
1rsquo
6rsquo16
1
OH
134 132 130 128 126
ppm110 108 106 104 102 100
ppm
SP (T= 110degC)
SP (T= 70degC)
CP 50 ms (T= 70degC)
CP 3 ms (T= 70degC)
910 1rsquo
1H 13C
1
811
910
CH2 CH2
1rsquo
6rsquo
a) b)
C102
13024
C9101
13003
C92
12869 C1rsquo210382
C1rsquo110443
C1rsquo13035
2rsquo3rsquo4rsquo
T degC
5rsquo
19
resonances broaden from 110degC to 70degC thus indicating slower andor more anisotropic 484
reorientational motions of all chemical groups The specific dynamic behaviour of the sugar 485
headgroup is also reflected by its 1H transverse relaxation time T2 whereas the shorter the T2 486
the higher the rigidity Experiments performed between 110degC and 70degC shown and 487
commented in Figure S 8 in the Supporting Information globally show a single short (lt 1 ms 488
below 100degC) T2 relaxation component for H1rsquo H5rsquo and H6rsquo and two both short and long 489
(between 4 ms and 12 ms) T2 for the acyl chain (CH2 H910 H811) even below 100degC 490
At 110degC 13C SPMAS experiments (Figure 6b full range in Figure 7 and Figure S 7 491
assignments in Table 1) show a single peak at δC= 10335 ppm for C1rsquo and at δC= 13003 ppm 492
for C910 as expected for a symmetrical conformation with two chemically-equivalent 493
carbons76 At 70degC the C1rsquo peak disappears while C910 now shows two peaks around 128 494
ppm and 130 ppm (Table 1 full temperature series in Figure S 7b) attributed to C92 (δC= 12869 495
ppm) and C10 in a non-symmetric configuration respectively for which these two carbons are 496
chemically inequivalent76 More precisely the resonance at 130 ppm is actually the 497
superposition of two close resonances C9101 (δC= 13003 ppm) and C102 (δC= 13024 ppm) 498
where subscripts 1 and 2 stand for two different conformations of the cis-olefin group as 499
reported for various phases of oleic acid in the vicinity of 0degC76 500
501
Table 1 ndash 13C Chemical shifts of G-C181-OH in solution and solid-state Solid-state experiments are 502
recorded at MAS= 10 kHz All spectra are reported in Figure 7 and Figure S 7 The contact time for cross 503
polarization is 3 ms In all ssNMR experiments temperature is first raised at 110degC and then lowered to 504
either 90degC or 70degC Attribution of the 13C resonances in Table 1 is performed on the basis of the solution 505
spectrum (Figure S 1b) Additional peaks observed in both single pulse and cross polarization ssNMR 506
experiments are attributed when possible to a configuration effect of the given atom eg C9101 and C92 507
indicate two configurations of C9 All new peaks observed in solid-state and not detected in solution are 508
highlighted in red for convenience 509
510
511
δ ppm
Peak Liquid (DMSO-d6)
Solid Single Pulse
T= 110degC
Solid Single Pulse
T= 90degC
Solid Single Pulse
T= 70degC
Solid Cross Polarization
T= 70degC
C102
- - 13024 13024
C910C9101 13009 13003 13003 13003 13003
C1C9C10C1rsquo
C6rsquo
20
C92 - - - 12869 12869
C1rsquoC11 10329 10335 10335 - 10443
C12 - - - - 10382
C3 7724 7709 7702 - 7829
- 7634 7629 - 7621
7525
C2 7388 7398 7390 7370 7370
C4 7052 7077 7054 7041 7098
C16 6900 7016 - - 7029
- - - - 6793
C1C5C6 6153 6241 6236 6239 6262
C1C5C6 6117 - - - 5956
C2 3300 3290 3290 3283 3279
CH2(trans) - - - 3198 3196
CH2(gauche)C15 2941 2981 2987 3004 -
C811 2706 2747 2747 2832 2817
CH2 2597 2625 2628 2630 2817
512
13C CPMAS spectra at 70degC (Figure 6b full range in Figure 7 and Figure S 7d) at 513
increasing contact times confirm the presence of two cis-olefin environments one for which 514
C910 are equivalent labelled here C9101 and one for which they are inequivalent labelled 515
C92 C102 Both environments are rigid enough to be observed at short contact time (tc= 50 μs) 516
A similar double environment is also observed for the sugar C1rsquo CPMAS at 70degC shows two 517
peaks (C1rsquo1 at δC= 10443 ppm C1rsquo2 at δC= 10382 ppm Figure 6b Figure S 7d) These are 518
significantly shifted downfield from the C1rsquo peak observed at 110degC and are detected at contact 519
times as short as 50 μs thus indicating their rigid character One also finds that CPMAS is 520
totally inefficient at 100degC for short contact times (50 μs) and poorly efficient even at 3 ms 521
typical of fast-tumbling molecules (Figure S 7c) also both gauche (δC= 3004 ppm) and all-522
trans (δC= 3198 ppm) conformations of the CH2 carbons coexist at 70degC (Figure S 7b)77 523
According to ssNMR one main mobile molecular environment exists at 110degC as 524
shown by the well-resolved 1H spectrum single C=C (C9101) and anomeric (C1rsquo) resonances 525
gauche conformation of the aliphatic CH2 and single T2 of the aliphatic CH2 chain and sugar 526
protons The sugar group is certainly mobile (inefficient 1H13C CPMAS) but still more 527
constrainted than the acyl chain (shorter T2 (1H)) As the temperature is lowered the overall 528
rigidity increases (broadening of 1H NMR peaks faster 1H transverse relaxation and efficient 529
1H13C magnetization transfer during CPMAS) presumably driven by H-bonding 530
interactions (downfield shift and line narrowing of the OH 1H signal very short OH T2 loss of 531
the C1rsquo signal in SPMAS) At the same time a number of spectroscopic data (two concomitant 532
21
resonances for anomeric C1rsquo1 and C1rsquo2 cis-olefin C9101 and C92 C102 and CH2 gauche and 533
all-trans environments) and relaxation behaviour (fast and slow T2 relaxation components) 534
strongly suggests the coexistence of two molecular environments Further proofs of the 535
coexistence of two distinct molecular domains are given by a number of chemical shift 536
variations in the 13C CPMAS spectrum at 70degC compared to the one at 110degC 90degC and 537
solution This is shown in Figure 7 and in the list of 13C chemical shifts in Table 1 538
539
540
Figure 7 - Comparison between solution- and solid-state 13C NMR spectra of G-C181-OH Solid-state 541
experiments are recorded directly on the sample powder at a MAS of 10 kHz (4 mm zirconia rotor) SP 542
Single Pulse CP Cross Polarization In all the ssNMR experiments temperature is first raised at 110degC 543
and then lowered to either 90degC or 70degC Segmented lines are meant to highlight the known peak position 544
in solution thus stressing the strong chemical shift variations in the solid-state 545
546
NMR experiments above Tm2 suggest that vesicles could contain G-C181-OH with a 547
single family of mobile conformations characterized by chemically-equivalent C=C (red 548
Figure 8b) and a single C1rsquo conformation (green Figure 8b) Experiments between Tm1 and Tm2 549
otherwise suggest that two coexisting conformations characterized by chemically-equivalent 550
(red Figure 8b) and inequivalent (magenta Figure 8b) C=C could be associated to nanotubes 551
Two distinct C1rsquo sites (grey Figure 8b) also indicate two configurations of the sugar headgroup 552
A comment on this point will be given in the following paragraphs 553
The local (Aring-scale) variation of molecular mobility below Tm2 drives the coexistence of 554
two distinct molecular environments of the same G-C181-OH molecule This occurs within a 555
single-phase domain (as deduced by WAXS) of equivalent membrane rigidity (as derived from 556
Laurdan probe in confocal microscopy) Although never reported before the difference in the 557
local mobility of the same amphiphile (here G-C181-OH) could satisfy the theoretically-558
140 120 100 80 60 40 20
CP(3 ms)-70degC
SP-70degC
SP-90degC
SP-110degC
ppm
LiquidC910
C1rsquo
C2rsquo
C4rsquo
C3rsquo
C1
C6rsquoC5rsquo
C1
6
C8
11
C2 C
H2
C1
5
CH
2
DM
SO
13C
22
required conditions that induce local lipid segregation and formation of membrane inclusions 559
(Figure 8c) In case of their non-zero average orientation the local membrane curvature 560
increases62 and nanotubes can spontaneously form (Figure 8bc) More intriguing this 561
mechanism occurs at least 10degC above Tm1 although it should not be favored above the Tm27 562
From both experimental and theoretical backgrounds the conditions of topologically-563
connected vesicles-nanotubes systems are met only when either internal (two components) or 564
external driving forces are applied19 In the present single-lipid system of which the phase 565
behavior is summarized in Figure 8a the most plausible driving force could be explained by 566
the NMR results collected on the dry sample G-C181-OH concomitantly occupies two 567
molecular environments characterized by 1) two distinct conformations of the sugar 568
displaying equivalent mobility and 2) two conformations of the acyl chain unsaturation 569
570
23
571
Figure 8 ndash a) Thermotropic phase behavior of G-C181-OH at 5 mgmL-1 Note that Tm2 is observed on the 572
dry powder only b) Possible relationship between the molecular environment as derived from NMR and 573
membrane curvatures All the molecular drawings refer to the same G-C181-OH molecule (bulky ellipsoid 574
equiv sugar headgroup) while each color corresponds to a given configuration Grey of C1rsquo1 and C1rsquo2 indicates 575
the uncertainty about the assignment of the specific NMR peak The curvature C is defined as 1R R being 576
the curvature radius R1 R2 radius of curvature CG Gauss curvature CM Mean curvature c) Free 577
interpretation of the anisotropic high-curvature (CMgt 0 CG= 0) inclusions in the membrane (low CM and 578
CG) continuum driven by inter-sugar H-bonding and reduced intramembrane diffusion for a G-C181-OH 579
glucolipid 580
581
Flat crystalline structure
Nanotube-vesicle network
Vesicles
48degC
120deg
106 105 104 103 102 101
ppm
H9 H10H1rsquo
106 105 104 103 102 101
ppm106 105 104 103 102 101
ppm106 105 104 103 102 101
ppm
C=CC=C
C1rsquo1C1rsquo2
C1rsquo
Tm2(96degC)Tm1
a)
b)
c)
Same molecule different local orientations and sugar conformations
High curvature membrane
Low curvature inclusion
Flip-FlopStrong H-bonding
CG
CM ( + )
CG 0
CM 0 CG 0
CM 0
G-C181-OH
24
Two related questions are unanswered at the moment What actually drives nanotube 582
formation and is the organization of G-C181-OH within the vesicles and tubes the same Lipid 583
nanotubes have been studied for at least three decades over which broad experimental and 584
theoretical insight has been generated Despite this fact the actual understanding is still matter 585
of debate27 Micelle-to-nanotube and vesicle-to-nanotube phase transitions are generally 586
reported for single amphiphiles below a given Tm and intermediate phase composed of twisted 587
and flat fibers is concomitantly reported Initially thought to be a chirality-driven phenomenon 588
recent studies propose a more general mechanism involving crystallization and symmetry 589
breaking in the lipid packing driven by optimal packing27 If twisted ribbons were observed 590
before for a number of microbial glycolipid bolaamphiphiles44 they are not found for G-C181-591
OH This fact as well as the large body of cryo-TEM images and the observation of nanotubes 592
above Tm1 rather pledge in favour of a direct topological change from positive (vesicles) to 593
zero (nanotubes) Gaussian curvatures In this case vesicle-to-nanotube transitions could be 594
driven by external forces56307813ndash162829 595
Considering the absence of external forces in the present system there are only two 596
possibilities left spontaneous budding of the membrane or nanotube pulling after inter-vesicle 597
collisions due to Brownian motion Both are possible as inclusions composed of a different 598
arrangement of the same molecule in the membrane continuum can theoretically explain 599
spontaneous nanotube formation in an isotropic medium672223629ndash1218ndash21 However the second 600
one is probably more likely to prevail because it could explain the large number of nanotubes 601
connecting two distant vesicles Interestingly similar events occur for any phospholipid-based 602
vesicular solution but nanotubes are extremely rare unless at least two lipids of different 603
molecular structure are mixed together The spectroscopic 1H and 13C and relaxation (1H) 604
ssNMR data even if collected on a dry powder demonstrate that the coexistence of two G-605
C181-OH configurations involving both the sugar headgroup and fatty alcohol chain are 606
possible for this molecule As a matter of fact this is not so surprising as more than one energy 607
minima each corresponding to a given conformation are known for glucose its non-reducing 608
derivative methylglucose and carbohydrates in general78ndash80 609
The presence of two configurations could explain the coexistence between two 610
structures of different curvature but the data presented so far do not explain the origin of these 611
two configurations In other words what drives the change in the local structure of the sugar 612
headgroup and fatty alcohol within the membrane 613
The association of known self-assembled structures to spectroscopic 13C ssNMR data is 614
known for years in particular for gluconamides lipids having a linear sugar headgroup81ndash84 It 615
25
was found that gauche effects in some cases up to the γ position in the sugar chain induce 616
upfield chemical shifts while anti and trans conformations result in downfield shifts Each 617
structure (monolayer crystal bilayer crystal or micellar fiber) was then characterized by a given 618
organization of the gluconamide and a characteristic 13C ssNMR fingerprint which could be 619
explained by gauche γ-gauche anti and trans conformations of the headgroup Similar 620
structural-spectroscopic correlations have been collected over the years for much simpler cyclic 621
sugars85 whereas pyranoses can undergo important conformational changes (chair half-chair 622
boat skew) when the appropriate energy barriers are crossed78ndash8086 A quantitative 623
conformational study based on the 13C chemical shift variations shown in Table 1 would be 624
certainly helpful but very delicate in the context of the present state of the art because a 625
rigorous approach requires at least one known crystal structure8182 which is currently missing 626
for this compound A qualitative approach will then be adopted 627
G-C181-OH is a bolaform amphiphile and flip-flop could be a possible mechanism 628
involved in the nanotube stabilization whereas head-tail interactions have long been considered 629
as important in nanotube-forming bolaform amphiphiles6063 From mere considerations based 630
on T2 (1H) relaxation arguments one could exclude head-tail configurations if the R-CH2OH 631
endgroup (H1) was involved in a direct interaction with the sugar group its corresponding T2 632
would probably be comparable to the sugarrsquos one (OH and H1rsquo) but this does not seem to be 633
the case However this hypothesis would be based on the comparison of the relaxation from 634
CH and CH2 protons additionally involved in different kind of motions Besides the relaxation 635
of H1 is influenced by the strong overlap between H1 and H5rsquo For these reasons relaxation 636
arguments are not solid enough and will not be used 637
We then address this question by exploring intermolecular interactions in a direct 638
manner using 2D 1H-1H homonuclear ssNMR correlation spectroscopy At 90degC in the fast-639
tumbling domain of molecular motion (narrow 1H NMR peaks Figure 6a) and corresponding 640
to the vesicle-rich region spin diffusion (NOESY) experiments are preferred over dipolar 641
coupling based experiments because such interaction is averaged out by molecular motion 642
However when the molecular motion is more constrained in the domain of nanotube stability 643
at 70degC (broad 1H spectra Figure 6a) Double-Quantum Single-Quantum (DQ-SQ) correlation 644
experiments are best suited to probe interaction between close molecular neighbors These 645
experiments are reported in Figure 9 and the related interpretation is only briefly reported 646
below while a more detailed discussion can be found on Page 12 in the Supporting Information 647
26
648
Figure 9 ndash a) 2D 1H-1H NOESY NMR experiment performed at MAS= 10 kHz (4 mm probe) on a Bruker 649
300 MHz Avance III HD spectrometer using 300 ms of mixing time Sample temperature is regulated to 650
90degC reached by cooling from 110degC b) 2D 1H-1H DQ-SQ (BAck-to-BAck BABA pulse sequence used for 651
the DQ excitation scheme) NMR experiment performed at MAS= 22 kHz (25 mm probe) on a Bruker 700 652
MHz Avance III spectrometer using a DQ excitation time equal to 2 rotor periods Sample temperature is 653
regulated to 70degC reached by cooling from 110degC The typical schemes illustrating how to interpret these 654
2D experiments are reported above each experimental map Zooms of the sugar region and configurational 655
interpretation are given below each 2D map More information are given in the text below 656
H16-H16
H1-H1
H9-H10
H1rsquo-H1
H1rsquoH910 H16
H1
H1rsquo-H1rsquo
Hxrsquo-Hxrsquo
2
(pp
m)
(ppm)
315
811910 1rsquo
2rsquo2
3rsquo 4rsquo6rsquo
5rsquo
1rsquo2910
asymp asymp asympHDO MeOD Acetone
1
315
811 9101rsquo
2rsquo2
3rsquo4rsquo6rsquo
5rsquo
1rsquo2 9 10
asympasympasympHDOMeODAcetone
H1rsquo-H1
1rsquo
1
(p
pm
)
(ppm)
H1-H2
H1rsquo-H1
H1rsquo
H910
H1H5rsquo
H2
H1rsquo-H5rsquo
315
811910 1rsquo
2rsquo2
3rsquo 4rsquo6rsquo
5rsquo
1rsquo2910
asymp asymp asympHDO MeOD Acetone
1
H2rsquoH3rsquoH4rsquo
H2rsquoH3rsquoH4rsquo
X= 2rsquo3rsquo4rsquo
NOESY - T= 90degC
1H
1H
1H
1H
DQ-SQ - T= 70degC
a) b)
2
(pp
m)
(p
pm
)
(ppm)
A B
AhellipB
AhellipA
BhellipB
NOESY
(ppm)
A B
AhellipB
DQ-SQ
Single-quantum dimension
Do
ub
le-q
ua
ntu
m d
imen
sio
n
AhellipA
BhellipB
BhellipA
BhellipA
315
811910 1rsquo
2rsquo2
3rsquo 4rsquo6rsquo
5rsquo
1rsquo2910
asymp asymp asympHDO MeOD Acetone
1
lt 5 Aring
lt 5 Aring
H1-H2
H811
H15
H16
H6rsquo
H1rsquo
H1
H5rsquo
H2
H1-H2
H1rsquo-H1
H1rsquo-H5rsquo
H1rsquo
H1 H5rsquo
H1rsquo
H1
H5rsquo
H1H2rsquo H3rsquo H4rsquo
H1-H1
H1rsquo-H1
Hxrsquo-HxrsquoX= 2rsquo3rsquo4rsquo
H1-H2
H1rsquo
Zoom sugar region 28 ndash 45 ppmNOESY DQ-SQ
27
Head-tail or head-head configurations could be probed by the existence of H1rsquo-H1 657
interactions whereas H1 (δH= 356 ppm) is associated to the glucolipid tail and H1rsquo (δH= 432 658
ppm) to the sugar headgroup These atoms are more than 15 Aring apart and a direct interaction 659
could not be observed in both NOESY and DQ-SQ experiments NOESY experiments (Figure 660
9a) show that H1rsquo-H1 correlations are not observed Meanwhile clear-cut direct H1rsquo-H1 661
interactions are indeed observed are detected at T= 70degC (DQ cross-peaks related to H1rsquo-H1 662
correlation in DQ-SQ experiment shown in Figure 9b) Interestingly the absence of auto peaks 663
at δH= 432 ppm and δH= 335 ppm in the SQ dimension excludes H1rsquo-H1rsquo and Hxrsquo-Hxrsquo (x= 2 664
3 4) interactions respectively strengthening the idea that sugar headgroups from two nearest-665
neighbor G-C181-OH molecules are not adjacent in the nanotube-vesicle region 666
Homonuclear 2D ssNMR supports the idea according to which G-C181-OH can 667
undergo molecular flip-flops and a head-tail arrangement in the dry product Extrapolating these 668
conclusions in the lower concentration range lack of H1rsquo-H1 proximity at T= 90degC suggests a 669
head-head configuration in the vesicle-rich region and head-tail configuration within the 670
nanotubes It is however still unclear whether flip-flops are driven by spontaneous temperature-671
induced conformational changes in the glucolipid packing stimulating inclusions within the 672
membrane itself672223629ndash1218ndash21 or by defects generated by inter-vesicle collisions In fact a 673
combination of both is not unlikely Nanotubes are not stable when temperature is 20 to 30 674
degrees above Tm1 indicating that inter-vesicle collisions alone cannot explain the unusual 675
phenomenon In an energy landscape approach87 the head-head configuration is certainly 676
favored at high temperature while both head-head and head-tail configurations could be 677
favored in the mid-temperature region corresponding to the range between Tm1 and Tm2 in the 678
dry powder Both statistical and defect-induced flip-flop events contribute to form high mean 679
zero Gaussian curvature morphologies (nanotubes) for which the head-tail conformation 680
limiting the proximity between bulky sugar headgroups is probably more adapted (Figure 8c) 681
The flip-flop interpretation now reasonably explains the strong differences in the sugar and fatty 682
alcohol conformations deduced by the multiple NMR signals attributed to chemically-683
equivalent groups The existence of various low-energy conformations each having specific 684
NMR signature for sugars in solution78ndash8086 and solid-state81ndash84 further supports our 685
interpretation 686
One last point should be clarified Why between Tm1 and Tm2 are two molecular 687
environments able to coexist instead of a single one of average rigidity as found in the case of 688
ldquoripplerdquo phases50ndash54 We believe that this question can be answered based on the NMR results 689
the relatively short T2 values of the H1rsquo and OH protons shows the constrained mobility of the 690
28
sugar headgroup despite a certain flexibility of the chain (long T2 component) This trend may 691
suggest restrictions in translational mobility probably due to the sugar-OH hydrogen bonding 692
(Figure 8c) meaning that lipids are not able to diffuse within the membrane thus keeping two 693
different configurations stable 694
695
Conclusions 696
Topologically-connected nanotube-vesicle lipidic systems are commonly observed for 697
self-assembled membranes composed of at least two amphiphiles and spontaneously driven by 698
anisotropic inclusions andor by external directional forces This work shows that strong 699
differences in membrane curvature can spontaneously occur in single-lipid systems without 700
external anisotropic forces Coexistence and interconnection between nanotubes and vesicles 701
are evidenced via cryo-TEM and fluorescence confocal microscopy in a single-phase region at 702
temperature above a transition temperature Tm1= 483degC determined by DSC on the hydrated 703
sample but below the second transition temperature Tm2 (957degC) determined by DSC on the 704
dry powder X-ray diffraction (WAXS) also shows the coexistence of two lattice periods one 705
attributed to an inter-membrane repeating distance and the other possibly related to the intra-706
nanotube glucolipid arrangement Labelling the systems with Laurdan a fluorophore of which 707
the emission strongly varies with the local membrane rigidity excludes the presence of rigid 708
micro-separated phases (eg Lβ) 709
1H and 13C ssNMR despite the fact that it can only be performed on the dry powder 710
confirm the presence of one main fluid G-C181-OH environment above Tm2 Below Tm2 the 711
splitting of some 13C peaks and the coexistence of short and long 1H relaxation components 712
demonstrate that G-C181-OH can simultaneously pack into structurally and dynamically 713
inequivalent environments Combining advanced 2D 1H-1H correlation experiments based on 714
spin diffusion or double-quanta excitation suggests that vesicles could contain a preferred head-715
head configuration of the bolaform lipid while nanotubes a preferred head-tail assembly 716
The presence of two environments composed of the same molecule characterized by 717
different molecular configurations and rigidity fulfills the theoretical conditions necessary to 718
spontaneously nucleate a membrane inclusion of non-zero average orientation described as 719
necessary to observe topologically-connected nanotube-vesicle structures in the absence of 720
external forces This hypothesis could also be enriched by the possibility of nanotubes to be 721
pulled away between two vesicles after a collision event 722
This work expands the actual theoretical and experimental framework on lipid networks 723
stabilized by a different radius of curvature It could also motivate the synthesis or isolation 724
29
of new lipids providing a higher level of 3D architectural control in soft networks possibly in 725
the range of room temperature 726
727
Acknowledgements 728
Dr Andrea Lassenberger and Dr Sylvain Preacutevost at Institut Laue Langevin (ILL Grenoble 729
France) are kindly acknowledged for their assistance on the SANS experiment Confocal 730
images were performed at the Institut de Biologie Paris Seine (IBPS) imaging facility Jean-731
Franccedilois Gilles (Imaging Core Facility Institut de Biologie Paris Seine (IBPS) CNRS 732
Sorbonne Universiteacute Paris France) is kindly acknowledged for his assistance on the confocal 733
microscopy imaging Dr Guillaume Laurent (LCMCP Sorbonne Universiteacute Paris France) is 734
kindly acknowledged for helpful discussions The French region Ile-de-France SESAME 735
program is acknowledged for financial support (700 MHz NMR 736
spectrometer) Dr Olivier Diat (ICSM Marcoule France) Prof eronikaIglič and Prof V Aleš737
onsul discussi Slovenia) are kindly acknowledged for helpfUniversity of LjubljanaIglič (-Kralj 738
739
Financial support 740
WAXS experiments have been supported by Soleil Light Source Saint Aubin France proposal 741
Ndeg 20201747 SANS experiments have been supported by ILL proposal Ndeg9-13-778 742
743
References 744
1 D Kabaso N Bobrovska W Goacuteźdź E Gongadze V Kralj-Iglič R Zorec and A 745
Iglič Bioelectrochemistry 2012 87 204ndash210 746
2 C R Safinya U Raviv D J Needleman A Zidovska M C Choi M A Ojeda-747
Lopez K K Ewert Y Li H P Miller J Quispe B Carragher C S Potter M W 748
Kim S C Feinstein and L Wilson Adv Mater 2011 23 2260ndash2270 749
3 P Veranič M Lokar G J Schuumltz J Weghuber S Wieser H Haumlgerstrand V Kralj-750
Iglič and A Iglič Biophys J 2008 95 4416ndash4425 751
4 A Rustom R Saffrich I Markovic P Walther and H-H Gerdes Science (80- ) 752
2004 303 1007ndash1010 753
5 M I Angelova S Soleacuteau P Meacuteleacuteard F Faucon and P Bothorel Prog Colloid 754
Polym Sci 1992 89 127ndash131 755
6 L Mathivet S Cribier and P F Devaux Biophys J 1996 70 1112ndash1121 756
7 V Kralj-Iglič G Gomišček J Majhenc V Arrigler and S Svetina Colloids Surfaces 757
A Physicochem Eng Asp 2001 181 315ndash318 758
30
8 V Kralj-Iglič A Iglič G Gomišček F Sevšek V Arrigler and H Haumlgerstrand J 759
Phys A Math Gen 2002 35 1533ndash1549 760
9 M Drab D Stopar V Kralj-Iglič and A Iglič Cells 2019 8 626 761
10 A Zidovska K K Ewert J Quispe B Carragher C S Potter and C R Safinya 762
Langmuir 2009 25 2979ndash2985 763
11 A Zidovska K K Ewert J Quispe B Carragher C S Potter and C R Safinya Soft 764
Matter 2011 7 8363ndash8369 765
12 A Zidovska K K Ewert J Quispe B Carragher C S Potter and C R Safinya 766
Biochim Biophys Acta - Biomembr 2009 1788 1869ndash1876 767
13 M Karlsson K Sott M Davidson A S Cans P Linderholm D Chiu and O Orwar 768
Proc Natl Acad Sci U S A 2002 99 11573ndash11578 769
14 A Karlsson R Karlsson M Karlsson A-S Cans A Stromberg F Ryttsen and O 770
Orwar Nature 2001 409 150ndash152 771
15 M Karlsson K Sott A S Cans A Karlsson R Karlsson and O Orwar Langmuir 772
2001 17 6754ndash6758 773
16 E Evans H Bowman A Leung D Needham and D Tirrell Science (80- ) 1996 774
273 933ndash935 775
17 U Seifert Configurations of fluid membranes and vesicles 1997 vol 46 776
18 J Kaumls and E Sackmann Biophys J 1991 60 825ndash844 777
19 N Bobrovska W Goacuteźdź V Kralj-Iglič and A Iglič PLoS One 2013 8 e73941 778
20 A Iglič B Babnik K Bohinc M Fošnarič H Haumlgerstrand and V Kralj-Iglič J 779
Biomech 2007 40 579ndash585 780
21 K Bohinc T Slivnik A Iglič M Brumen and V Kralj-Iglič J Phys Chem C 2007 781
111 9709ndash9718 782
22 A Iglič H Haumlgerstrand P Veranič A Plemenitaš and V Kralj-Iglič J Theor Biol 783
2006 240 368ndash373 784
23 V Kralj-Iglič and P Veranič Adv Planar Lipid Bilayers Liposomes 2006 5 129ndash785
149 786
24 A Iglic and V Kralj-Iglic Adv Planar Lipid Bilayers Liposomes 2006 4 253ndash279 787
25 S Penič L Mesarec M Fošnarič L Mroacutewczyńska H Haumlgerstrand V Kralj-Iglič and 788
A Iglič Front Phys 2020 8 342 789
26 P Yager and P E Schoen Mol Cryst Liq Cryst 1984 106 371ndash381 790
27 T G Barclay K Constantopoulos and J Matisons Chem Rev 2014 114 10217ndash791
10291 792
31
28 B Božič G Gomišček V Kralj-Iglič S Svetina and B Žekš Eur Biophys J 2002 793
31 487ndash496 794
29 A Iglič H Haumlgerstrand M Bobrowska-Haumlgerstrand V Arrigler and V Kralj-Iglič 795
Phys Lett A 2003 310 493ndash497 796
30 R Bar-Ziv and E Moses Phys Rev Lett 1994 73 1392ndash1395 797
31 S Chiruvolu H E Warriner E Naranjo S H Idziak J O Raumldler R J Plano J A 798
Zasadzinski and C R Safinya Science (80- ) 1994 266 1222ndash1225 799
32 V Kralj-Iglič A Iglič H Haumlgerstrand and P Peterlin Phys Rev E 2000 61 4230ndash800
4234 801
33 L Mesarec M Drab S Penič V Kralj-Iglič and A Iglič Int J Mol Sci 2021 22 802
2348 803
34 L Van Renterghem S L K W Roelants N Baccile K Uyttersprot M C Taelman 804
B Everaert S Mincke S Ledegen S Debrouwer K Scholtens C V Stevens W 805
Soetaert L Van Renterghem S L K W Roelants N Baccile K Uytersprot M C 806
Taelman B Everaert S Mincke S Ledegen S Debrouwer K Scholtens C V 807
Stevens and W Soetaert Biotechnol Bioeng 2018 115 1195ndash1206 808
35 J Clark and F Deswarte Introduction to Chemicals from Biomass Second Edition 809
John Wiley amp Sons 2015 810
36 K V Sajna R Houmlfer R K Sukumaran L D Gottumukkala and A Pandey in 811
Industrial Biorefineries and White Biotechnology eds A Pandey R Houmlfer M 812
Taherzadeh K M Nampoothiri and C Larroche Amsterdam Oxford Waltham 813
Elsevier 2015 pp 499ndash521 814
37 R Marchant and I M Banat Trends Biotechnol 2012 30 558ndash565 815
38 K Hill and C LeHen-Ferrenbach in Sugar-Based Surfactants Fundamentals and 816
Applications ed C C Ruiz Boca Raton CRC Press 2009 pp 1ndash20 817
39 L Rodrigues I M Banat J Teixeira and R Oliveira J Antimicrob Chemother 818
2006 57 609ndash618 819
40 J D Desai and I M Banat Microbiol Mol Biol Rev 1997 61 47ndash64 820
41 S L K W Roelants K Ciesielska S L De Maeseneire H Moens B Everaert S 821
Verweire Q Denon B Vanlerberghe I N A Van Bogaert P Van der Meeren B 822
Devreese and W Soetaert Biotechnol Bioeng 2016 113 550ndash559 823
42 N Baccile M Selmane P Le Griel S Preacutevost J Perez C V Stevens E Delbeke S 824
Zibek M Guenther W Soetaert I N A Van Bogaert and S Roelants Langmuir 825
2016 32 6343ndash6359 826
32
43 N Baccile A-S Cuvier S Preacutevost C V Stevens E Delbeke J Berton W Soetaert 827
I N A Van Bogaert and S Roelants Langmuir 2016 32 10881ndash10894 828
44 N Baccile C Seyrig A Poirier S A Castro S L K W Roelants and S Abel Green 829
Chem 2021 23 3842ndash3944 830
45 A Salis L Cappai C Carucci D F Parsons and M Monduzzi J Phys Chem Lett 831
2020 11 6805ndash6811 832
46 J Schindelin I Arganda-Carreras E Frise V Kaynig M Longair T Pietzsch S 833
Preibisch C Rueden S Saalfeld B Schmid J-Y Tinevez D J White V 834
Hartenstein K Eliceiri P Tomancak and A Cardona Nat Methods 2012 9 676ndash835
682 836
47 T Parasassi and E Gratton J Fluoresc 1995 5 59ndash69 837
48 M M Dodes Traian F L Gonzaacutelez Flecha and V Levi J Lipid Res 2012 53 609ndash838
616 839
49 D M Owen C Rentero A Magenau A Abu-Siniyeh and K Gaus Nat Protoc 840
2012 7 24ndash35 841
50 W Stillwell in An Introduction to Biological Membranes Academic Press 2016 pp 842
135ndash180 843
51 W Stillwell in An Introduction to Biological Membranes Academic Press 2016 pp 844
181ndash220 845
52 B Tenchov Chem Phys Lipids 1991 57 165ndash177 846
53 R Koynova and M Caffrey Biochim Biophys Acta 1998 1376 91ndash145 847
54 F Schmid S Dolezel O Lenz and S Meinhardt J Phys Conf Ser 2014 487 848
012004 849
55 S Meinhardt R L C Vink and F Schmid Proc Natl Acad Sci U S A 2013 110 850
4476ndash4481 851
56 O Glatter and O Kratky Small Angle X-ray Scattering Academic Press London 852
1982 853
57 B A Cunningham A D Brown D H Wolfe W P Williams and A Brain Phys 854
Rev E 1998 58 3662ndash3672 855
58 M Nadler A Steiner T Dvir O Szekely P Szekely A Ginsburg R Asor R Resh 856
C Tamburu M Peres and U Raviv Soft Matter 2011 7 1512ndash1523 857
59 C Tanford The hydrophobic effect Formation of micelles and biological membranes 858
John Wiley amp Sons Inc New York 1973 859
60 M Masuda and T Shimizu Langmuir 2004 20 5969ndash5977 860
33
61 A Zidovska K K Ewert J Quispe B Carragher C S Potter and C R Safinya 861
Block Liposomes Vesicles of Charged Lipids with Distinctly Shaped Nanoscale 862
Sphere- Pear- Tube- or Rod-Segments Elsevier Inc 1st edn 2009 vol 465 863
62 A Iglic V Kralj-Iglic B Božič M Bobrowska-Haumlgerstrand B Isomaa and H 864
Haumlgerstrand Bioelectrochemistry 2000 52 203ndash211 865
63 T Shimizu M Masuda and H Minamikawa Chem Rev 2005 105 1401ndash1444 866
64 J V Selinger and J M Schnur Phys Rev Lett 1993 71 4091ndash4094 867
65 J M Schnur Science (80- ) 1993 262 1669ndash1676 868
66 B Tenchov R Koynova and G Rapp Biophys J 2001 80 1873ndash1890 869
67 R Koynova and B Tenchov Ser Biomech 2017 31 3ndash19 870
68 S J Angyal and R Le Fur Carbohydr Res 1984 126 15ndash26 871
69 J K Whitesell and M A Minton J Am Chem Soc 1987 109 225ndash228 872
70 T Takayama S Ando and I Ando J Mol Struct 1990 220 245ndash250 873
71 K Gawrisch N V Eldho and I V Polozov Chem Phys Lipids 2002 116 135ndash151 874
72 F Tielens C Gervais J F Lambert F Mauri and D Costa Chem Mater 2008 20 875
3336ndash3344 876
73 G A Jeffrey and Y Yeon Acta Crystallogr Sect B 1986 42 410ndash413 877
74 B Berglund and R W Vaughan J Chem Phys 1980 73 2037ndash2043 878
75 C Gervais C Coelho T Azaiumls J Maquet G Laurent F Pourpoint C Bonhomme 879
P Florian B Alonso G Guerrero P H Mutin and F Mauri J Magn Reson 2007 880
187 131ndash140 881
76 C Akita T Kawaguchi F Kaneko H Yamamoto and M Suzuki J Phys Chem B 882
2004 108 4862ndash4868 883
77 R N Purusottam L Seacutenicourt J J Lacapegravere and P Tekely Biochim Biophys Acta - 884
Biomembr 2015 1848 3134ndash3139 885
78 X Biarneacutes A Ardegravevol A Planas C Rovira A Laio and M Parrinello J Am Chem 886
Soc 2007 129 10686ndash10693 887
79 L M J Kroon‐Batenburg and J Kroon Biopolymers 1990 29 1243ndash1248 888
80 K N Kirschner and R J Woods Proc Natl Acad Sci U S A 2001 98 10541ndash889
10545 890
81 S Svenson B Kirste and J H Fuhrhop J Am Chem Soc 1994 116 11969ndash11975 891
82 I Sack S Macholl J H Fuhrhop and G Buntkowsky Phys Chem Chem Phys 892
2000 2 1781ndash1788 893
83 S Svenson J Koening and J H Fuhrhop J Phys Chem 1994 98 1022ndash1028 894
34
84 S Svenson A Schaefer and J H Fuhrhop J Chem Soc Perkin Trans 2 1994 2 895
1023ndash1028 896
85 K Bock and C Pedersen Adv Carbohydr Chem Biochem 1983 41 27ndash66 897
86 T B Grindley Structure and Conformation of Carbohydrates Springer Berlin 898
Heidelberg 2008 899
87 F Tantakitti J Boekhoven X Wang R V Kazantsev T Yu J Li E Zhuang R 900
Zandi J H Ortony C J Newcomb L C Palmer G S Shekhawat M O De La 901
Cruz G C Schatz and S I Stupp Nat Mater 2016 15 469ndash476 902
903
1
Supporting Information 904
905
Topological connection between vesicles and nanotubes in single-906
component lipid membranes driven by head-tail interactions 907
908
Niki Baccilea Ceacutedric Lorthioira Abdoul Aziz Baa Patrick Le Griela Cristina Coelhob Javier 909
Perezc Wim Soetaertd Sophie L K W Roelantsd 910
911
a Sorbonne Universiteacute Centre National de la Recherche Scientifique Laboratoire de Chimie de 912
la Matiegravere Condenseacutee de Paris LCMCP F-75005 Paris France 913
b Institut des Mateacuteriaux de Paris Centre Sorbonne Universiteacute Paris France 914
c Synchrotron Soleil LrsquoOrme des Merisiers Saint-Aubin BP48 91192 Gif-sur-Yvette Cedex 915
France 916
d InBio Department of Biotechnology Ghent University Ghent Belgium 917
918
919
Corresponding author 920
Dr Niki Baccile 921
E-mail address nikibaccilesorbonne-universitefr 922
Phone +33 1 44 27 56 77 923
924
925
926
2
a) 927
Parameter Method
Dry Matter (DM ) 996 Infrared balance 105degC
Glucose () 012 HPLC-Metacarb
Glycerol () nd HPLC-Metacarb
Free Fatty Acid content () lt001 Internal method BBEPP
GC with FID Detector
Oil () lt001 Internal method BBEPP
GC with FID Detector
Moulds (CFUg) lt10 3M-Nordval ndeg16 B
Yeasts (CFUg) lt10 3M-Nordval ndeg16 B
Anaerobic count (CFUg) lt10 SP-VG M005 B
Protein () tbd BCA protein assay
928
Figure S 1 - a) HPLC-ELSD chromatogram and composition table 929
930
931
932
933
3
b) 934
935
Group Ndeg δ ppm
CH2 1 354
CH2 2 153
CH2 3-712-14 132
CH2 811 203
CH 910 534
CH2 15 162
CH2 16 388
CH 1 424
CH 2 316
CH 3 334
CH 4 329
CH 5 354
CH2 6 366
Figure S 1 (next) ndash b) 1H NMR spectrum (MeOD-d4) recorded on the purified G-C181-OH compounds 936
and related assignment 937
938
2
811910 1rsquo
5rsquo1
3rsquo4rsquo
1rsquo1910
asymp asymp asympHDO MeOD Acetone
6rsquo2rsquo
1615
3-712-14
4
939
940
Figure S 2 ndash Cryo-TEM images recorded for a 5 mgmL G-C181-OH aqueous solution heat at T= 130degC 941
5
942
943
Figure S 3 - Cryo-TEM images recorded for a 5 mgmL G-C181-OH aqueous solution heat at T= 90degC 944
945
90degC
1
22
6
946
947
948
949
Figure S 4 ndash Cryo-TEM images recorded for a 5 mgmL G-C181-OH aqueous solution heat at T= 70degC 950
951
21
11
1
2
5
3
4
45
5
6
7
7
7
952
953
954
Figure S 5 ndash Cryo-TEM images recorded for a 5 mgmL G-C181-OH aqueous solution heat at T= 25degC 955
956
957
1
1 1
8
958
Figure S 6 ndash a) SANS experiment recorded at 90degC for a 5 mgmL G-C181-OH aqueous solution b-c) 959
WAXS experiments recorded on aqueous solutions of G-C181-OH at b) 5 mgmL and c) 25 mgmL d) 960
Structural interpretation of the repeating distances pointed out in c) 961
962
963
964
001 01 1
q Aring-1
25degC
68degC
88degC
111degC
01 1q Aring
-1
02 04 06 08 1q Aring
-1
001 01
10-1
100
101
Inte
nsity
cm
-1
q Aring-1
-2
T= 90degC
SANS WAXS WAXS
a) b) c)
dv
dL d= 144 Aring-1
di
ddH2O
dt
dvdL
dtdi d
d)
9
965
966
Figure S 7 ndash ssNMR MAS (10 kHz) experiments recorded on a G-C181-OH dry powder a) 1H spectra 967
recorded from 110degC to 70degC b) 13C single pulse (SP) spectra recorded with high power 1H decoupling from 968
110degC to 70degC c) 13C cross polarization (CP) spectra recorded at 110degC and contact time tc of 50 micros and 969
3000 micros d) 13C CP spectra recorded at 70degC and for 20 lt tc micros lt 3000 970
971
1
811
910
CH2 CH2
1rsquo
6rsquo
8 6 4 2 0 ppm
110
90
80
70
910
1rsquo
6rsquo16
1
2rsquo3rsquo4rsquo
811
OH
45 40 35 30 25 20 15
ppm
200 180 160 140 120 100 80 60 40 20 0
ppm140 120 100 80
ppm
CH2-gauche
3004
110
90
80
70
65
60
50
25
C91013003
C9 - 12869
CH2-all-trans
3198
C1rsquo10335
a) b)
1H
T degCT degC
13C Single Pulse MAS
A
B
A
B
70degC70degC
5rsquo
215
200 180 160 140 120 100 80 60 40 20 0
ppm
13C CPMAST= 110degC
200 180 160 140 120 100 80 60 40 20 0
ppm
132 131 130 129 128 127 126
ppm
106 105 104 103 102
ppm
13C CPMAST= 70degC
50
tc micros
3000
20
tc micros
50 500 1000 3000
tc micros
C102
13024 C910113003
C92
12869
C1rsquo213082
C1rsquo110443
A B
106 105 104 103 102
ppm
3000
1000
500
50
20
AB
c)
d)
10
972
Figure S 8 ndash a) Short and d) long T2 components displayed by the 1H transverse relaxation signal c) 1H 973
transverse relaxation signals recorded on a G-C181-OH dry powder from 110degC to 70degC The area of each 974
given resonance is plotted (log-lin) as a function of the echo time (CPMG pulse sequence) for each 975
temperature and fitted using the equation given above T2s and T2l indicate the short and long T2 relaxation 976
times respectively obtained by describing the 1H transverse relaxation signal using a biexponential decay 977
For H1rsquo H5rsquo and H6rsquo the 1H relaxation function could be described by a monoexponential decay 978
- Protons from the sugar group (H1rsquo H5rsquo H6rsquo) show a single T2 relaxation component (Figure 979
6c and Figure S 8) while protons of the acyl chain (CH2 H910 H811) show both short (Figure 980
6c) and long (Figure 6d) T2 relaxation component 981
- The short T2 relaxation time systematically decreases from 110degC to 70degC for all species by a 982
factor ranging from two to seven depending on the specific chemical group Very long T2 are 983
observed at 110degC for all acyl species while nearly unchanged values are measured below 984
90degC without any clear trend 985
- The sugar protons (H1rsquo H5rsquo H6rsquo) have the shortest set of T2 values (lt 1 ms) below 100degC 986
The long component of T2 generally ranges between 4 ms and 12 ms 987
0 1 2 3 4 5 6 7 8
00
05
10
15
20
25
30
35
40
45
Log
In
ten
sity
Time ms
0 1 2 3 4 5 6 7 8
00
05
10
15
20
25
30
35
40
45
Log
In
ten
sity
Time ms
0 1000 2000 3000 4000 5000 6000 7000 8000
00
05
10
15
20
25
30
35
40
45
Log
In
ten
sity
Time ms
0 1000 2000 3000 4000 5000 6000 7000 8000
00
05
10
15
20
25
30
35
40
45
Log
In
ten
sity
Time ms
0 1000 2000 3000 4000 5000 6000 7000 8000
00
05
10
15
20
25
30
35
40
45
Log
In
ten
sity
Time ms
0 1000 2000 3000 4000 5000 6000 7000 8000
00
05
10
15
20
25
30
35
40
45
Log
In
ten
sity
Time ms
H1
H8H11
H9H10
CH2
H1rsquo
H6rsquo
CH2
H910H811 H1CH2
H1rsquo H5rsquo6rsquo
0 1000 2000 3000 4000 5000 6000 7000 8000
00
05
10
15
20
25
30
35
40
45
Log
In
ten
sity
Time ms
OH
0 1000 2000 3000 4000 5000 6000 7000 8000
00
05
10
15
20
25
30
35
40
45 T= 110degC
T= 90degC
T= 80degC
T= 70degC
Log
In
ten
sity
Time ms
Fit
)
CH2 H910 H811 H1 H56 H1 OH
00
05
10
15
20
25
30
35
40
T2 m
s
T= 110degC
T= 90degC
T= 80degC
T= 70degC
CH2 H910 H811 H1
0
2
4
6
8
10
12
T2 m
s
T= 110degC
T= 90degC
T= 80degC
T= 70degC
Short T2(1H) Long T2(1H)
a) b)
c)
11
Table S 1 ndash 1H chemical shifts of G-C181-OH in solution and in the solid-state Solid-state spectra are 988
recorded at a MAS frequency of 10 kHz in DMSO-d6 broad peak 989
990
δH ppm
Group Ndeg Liquid
(MeOD-d4) Solid
(T= 110degC) Solid
(T= 70degC)
CH2 H1 354 357
CH2 H2 153 156
CH2 H3-712-14 132 135
CH2 H811 203 203
CH H910 534 534
CH2 H15 162 164
CH2 H16 388 383
CH H1 424 432
CH H2 316 335
CH H3 334 335
CH H4 329 335
CH H5 354 351 357
CH2 H6 366 383
OH OH1 432
45 463
OH OH2 492
OH OH3 490
OH OH4 487
OH OH6 445
991
992
H1H9H10H1rsquo
H6rsquo
OH2rsquo
OH1
12
Detailed discussion about the NOESY and DQ-SQ 2D 1H-1H ssNMR experiments presented in 993
Figure 9 994
995
2D 1H-1H ssNMR experiments are a unique tool to explore through-space proximities 996
between 1H nuclei ssNMR offers a large number of possibilities each adapted to a given 997
system The advantage of 2D maps with respect to a dynamics approach is their direct 998
readability in clear two nuclei which exchange their magnetization through-space (whichever 999
mechanism may be responsible for this exchange) will display a specific cross-peak However 1000
the way cross-peaks are presented and interpreted strictly depends on the nature of the pulse 1001
program which in turn is chosen according to the physical nature of the sample 1002
1D temperature-dependent 1H NMR experiments performed on G-C181-OH (Figure 1003
4a in the main text) indicate sharp peaks at 90degC and broad peaks at 70degC Narrow peaks 1004
indicate fast andor large-amplitude molecular tumbling averaging the strong 1H-1H dipolar 1005
interactions This excludes the use of pulse sequences like DQ-SQ which is not efficient under 1006
these conditions For this reason we employ spin-diffusion-based pulse sequences like 1007
NOESY which is more adapted for samples with high molecular mobility When mixing times 1008
are chosen to be short (lt 1 s) one generally explores through-space proximities within about 5 1009
10 Aring On the contrary when molecular motions are restricted dipolar coupling becomes 1010
significant 1H NMR peaks are broader and pulse sequences like DQ-SQ can now be used 1011
with a spatial resolution of less than 5 Aring 1012
Whenever possible DQ-SQ experiments are preferred over spin diffusion-based pulse 1013
sequences because they are more selective in particular for likewise interactions which are 1014
not discriminated in NOESY-type experiments This is illustrated by the typical interaction 1015
schemes for NOESY (top Figure 9a) and DQ-SQ (top Figure 9b) For two given A and B 1016
protons 2D NOESY maps will display two on-diagonal and two square-shaped symmetrical 1017
off-diagonal cross-peaks Off-diagonal cross-peaks illustrate the mutual A-B and B-A 1018
interaction but the on-diagonal peaks are systematic and do not prove any A-A or B-B 1019
interaction Similarly to NOESY 2D DQ-SQ maps display off-diagonal peaks (symmetric 1020
across the diagonal top Figure 9b) upon A-B and B-A interaction but in contrast they will 1021
display on-diagonal peaks only in the presence of self-interaction In the tutorial example of 1022
Figure 9b top the on-diagonal A-A peak indicates mutual A-A interaction while lack of on-1023
diagonal B-B peak evidences the absence of B-B proximities Combining NOESY and DQ-SQ 1024
experiments is capital to study the local arrangement of G-C181-OH and its evolution with 1025
temperature 1026
13
At T= 90degC the H1 and H5rsquo contributions are very close but possible to discriminate 1027
them (δ(H1)= 354 ppm δ(H5rsquo)= 351 ppm) according to 1H NMR chemical shifts in Table S 1028
1 2D 1H-1H NOESY in Figure 9a also discriminates between the two components attributed 1029
on the basis of the interactions with their mutual neighbors (green H1-H2 and H5rsquo-H1rsquo squares 1030
in Figure 9a) On this basis 2D NOESY does not show a direct H1rsquo-H1 correlation (blue red-1031
crossed) but rather an extensive network of intra-sugar interactions These features exclude 1032
suggest intra- and inter-sugar interactions and they exclude head-tail arrangements as a major 1033
molecular configuration at 90degC 1034
At 70degC the 1H NMR peaks are broader indicating a reduction of the T2 (1H) relaxation 1035
times andor residual homonuclear dipolar interactions excluding the use of NOESY In this 1036
case 1H-1H DQ-SQ correlation experiments are best suited Figure 9b presents the 1H-1H DQ-1037
SQ experiment on G-C181-OH at 70degC Peaks are broader than in NOESY and attribution may 1038
be cumbersome However the experiment is performed at 700 MHz and MAS= 22 kHz which 1039
improves spectral resolution with respect to the same experiment performed at 300 MHz and 1040
MAS= 10 kHz The auto-peak at δH= 356 ppm in the SQ dimension is attributed to H1-H1 spin 1041
pairs mainly resulting from intra CH2 interaction while the DQ cross-peaks at δH= 156-356 1042
ppm and δH= 432-356 ppm respectively origin from H2-H1 and H1rsquo-H1 interactions (Figure 1043
9b) DQ-SQ map does not show any auto-peak corresponding to H1rsquo-H1rsquo or Hxrsquo-Hxrsquo (x= 2rsquo 1044
3rsquo 4rsquo) interactions (red-crossed blue Figure 9b) thus excluding any proximity (lt 5 Aring) between 1045
close glucose neighbors On the contrary DQ-SQ maps (recorded both at 700 MHz Figure 9b 1046
or at 300 MHz not shown) systematically show DQ cross-peaks which can only be attributed 1047
to H1rsquo-H1 interactions (δH= 432-356) The presence of these H1rsquo-H1 interactions can only be 1048
explained by a head-tail arrangement of the G-C181-OH molecules as illustrated below the 1049
DQ-SQ map in Figure 9b 1050

6
H2O were probed C= 5 mgmL-1 and C= 25 mgmL-1 The 2D data were integrated azimuthally 152
at the beamline using the software Foxtrot and in order to obtain the I(q) vs q spectrum after 153
masking the beam stop shadow Silver behenate (d(100) = 5838 Aring) was used as a standard to 154
calibrate the q-scale Sample solutions were inserted in borosilicate capillaries of 15 mm in 155
diameter Capillaries were flame-sealed A capillary oven with controlled temperature (plusmn 05degC) 156
provided at the beamline was used to control the sample temperature between 25degC and 111degC 157
Data were normalized by the transmission and calibrated to the SAXS signal of H2O at large q-158
values (I= 00163 cm-1) in order to obtain an absolute intensity scale The water signal was 159
measured by subtracting the signal of the empty capillary from the signal of a water-filled 160
capillary The signal of (water + capillary) was used as background for the samples and it was 161
subtracted after integration of the 2D data 162
163
Cryogenic transmission electron microscopy (cryo-TEM) Cryo-TEM experiments were carried 164
out on an FEI Tecnai 120 twin microscope operating at 120 kV and equipped with a Gatan 165
Orius CCD numeric camera The sample holder was a Gatan Cryoholder (Gatan 626DH 166
Gatan) Digital Micrograph software was used for image acquisition Cryofixation was 167
performed using a homemade cryofixation device The solutions were deposited on a glow-168
discharged holey carbon coated TEM copper grid (Quantifoil R22 Germany) Excess solution 169
was removed and the grid was immediately plunged into liquid ethane at -180degC before 170
transferring them into liquid nitrogen All grids were kept at liquid nitrogen temperature 171
throughout all experimentation Cryo-TEM images have been treated and analyzed using Fiji 172
(is just ImageJ) software available free of charge at the developerrsquos website46 173
The samplersquos concentration was C= 5 mgmL-1 For technical reasons the temperature 174
during cryofixation could not be controlled For this reason the temperature associated with 175
each cryo-TEM image in the text was related to the equilibration temperature just before 176
cryofixation the device being as close as possible to the dry bath used for temperature control 177
Since temperature control during cryofixation was not possible in our device and practically 178
impossible at high temperatures one should take the T values as indicative of the given value 179
Although the sample transfer between the dry bath and the cryofixation device was performed 180
as fast as possible it is more than likely that the actual temperature of the sample at the moment 181
of cryofixation was lower than the one indicated here although impossible to know precisely 182
183
7
Fluorescence microscopy Images were recorded using a 40x objective on a Leica SP5 upright 184
confocal microscope with 405 nm laser excitation The sample was marked with 6-dodecanoyl-185
NN-dimethyl-2-naphthylamine (Laurdan Mw= 35354 gmol-1) fluorophore as follows A 186
stock solution of 3 mg of Laurdan in 100 microL of acetone was initially prepared (C= 30 mgmL-187
1) A volume of 028 microL of the stock Laurdan solution was diluted in 1 mL of a 5 mgmL-1 G-188
C181-OH water solution temporary set at 110degC in a sealed Eppendorf The latter was 189
important so to enhance inclusion of Laurdan in the membrane constituted by the glucolipid 190
while in its vesicle phase The final Laurdan concentration was approximately 24 micromol with a 191
molar Laurdan-to-G-C181-OH molar ratio of approximately 1-to-500 Fluorophore-to-lipid 192
ratios above 1200 were generally considered as non-interfering with the lipid phase behavior 193
as also verified in this work 194
Laurdan can be excited between 365 nm and 410 nm and its emission wavelength can 195
vary according to the rigidity of the membrane intercalation within a rigid or flexible 196
membrane generates emissions at 440 nm or 490 nm respectively47 In the present experiment 197
we have flame-sealed a solution of G-C181-OH at 5 mgmL-1 containing Laurdan (1-to-500 in 198
lipid-to-Laurdan ratio) in flat optical capillaries of 01 mm thickness Capillaries were set on a 199
Linkam support for temperature control eventually placed under the microscope The sample 200
was excited at 405 nm and detection was made in spectral mode with a 5 nm window sliding 201
every 5 nm from 412 nm to 602 nm in 16 bits which allows quantify the signal and compare 202
the different conditions Quantitative analysis was performed according to the literature4849 203
several ROI (range of interest) have been drawn on several images using the ROI manager of 204
Fiji (is just ImageJ) software The integrated intensity of each ROI at 440 nm and 490 nm was 205
eventually recorded and used to calculate the value of the generalized polarization GP as 206
follows of 207
119866119875 =(120582440 minus 120582490)
120582440 + 120582490 208
A negative GP indicates a flexible membrane while a positive GP indicates a rigid membrane 209
210
Solid-state Nuclear Magnetic Resonance (ssNMR) 1H and 13C ssNMR experiments have been 211
performed using an Avance III HD Bruker 705 T (ν1H= 300 MHz) spectrometer and a 4 mm 212
magic angle spinning (MAS) probe except for the BAck-to-BAck (BABA) experiment which 213
was performed on an Avance III Bruker 1644 T (ν1H= 700 MHz) spectrometer equipped with 214
25 mm MAS probe Temperature was controlled through a Smart cooler BCUIIa BCU-xtreme 215
unit using 10 min of equilibration time after each temperature variation Temperature was 216
8
always varied from high (110degC) to low (70degC) before analysis Due to combined use of fast 217
MAS rates necessary to achieve high resolution spectra and heating close to the boiling point 218
of water neither diluted nor concentrated samples could be used for ssNMR experiments All 219
tests employing up to 50 wt G-C181-OH in water resulted in sample centrifugation drying 220
but also expulsion from the rotor causing sudden stop of rotor spinning For these reasons all 221
attempts to study hydrated G-C181-OH failed and only the dry powder could be analyzed The 222
dry sample powder was analyzed as such in zirconia rotors (4 mm or 25 mm) spinning at MAS= 223
10 kHz (4 mm) or 22 kHz (25 mm) and Chemical shifts were calibrated with respect to 224
adamantane (13C 13C(CH2)= 3848 ppm = 191 ppm) and glycine alpha (13C(CO)= 17603 225
ppm) Details on the acquisition parameters are given in the Supporting Information 226
227
Results and discussion 228
Topologically-connected nanotubes and vesicles 229
G-C181-OH is a biobased glucolipid water-insoluble at room temperature and of 230
which the physicochemical properties are poorly known The DSC thermogram performed at 231
10degCmin of G-C181-OH as a function of the water content (Figure 2a) shows two endothermic 232
peaks on the dry powder (996 wt glucolipid) They are attributed to two melting phenomena 233
occurring at the following temperatures Tm 483degC (Tm1) and 957degC (Tm2) the enthalpy of the 234
former being lower than that of the latter Interestingly DSC also shows that Tm1 is hydration 235
independent and reversible (the associated exothermic peak is systematically observed) while 236
the transition at Tm2 is simply suppressed (here tested up to 130degC) on hydrated powders and 237
never observed on the cooling profile even at slow cooling rates (1degCmin) The thermogram 238
recorded on the dry powder is typical of single-component lipids having an intermediate50 239
metastable phase (often referred to the ripple phase Pβ´ in reference to the periodic undulation 240
of the bilayer)50ndash54 between the classical lamellar gel (Lβ) and liquid crystalline (Lα) phases50ndash241
54 and characterized by regions of both liquid order and disorder5455 The effect of water does 242
not influence the low-temperature crystallization at Tm1 but it contributes to disrupt the ordered 243
array of hydrocarbon chains in the metastable phase 244
On the basis of the DSC thermogram the aqueous phase behavior of G-C181-OH under 245
diluted conditions (5 mgmL-1) was studied at four different temperatures (red marks on Figure 246
2a) below and above Tm1 but also between Tm1 and Tm2 corresponding to the thermogram of 247
the dry powder 248
9
249
Figure 2 ndash a) DSC thermogram of G-C181-OH under dry (04 wt water estimated by thermogravimetric 250
analysis) and hydrated conditions recorded at a heating rate of 10degCmin Red marks indicate the 251
temperatures at which cryo-TEM experiments are performed on the corresponding 5 mgmL aqueous 252
solutions b) Cryo-TEM images recorded for a 5 mgmL G-C181-OH aqueous solution heat at T= 130degC 253
90degC 70degC and 25degC T indicates the temperature of the sample solution before cryofixation Tne T T 254
being the temperature of the sample upon plunging in liquid ethane Please refer to the materials and 255
methods section for more information 256
T= 130degC
T= 90degC
T= 70degC
T= 25degC
a)
b)
20 40 60 80 100 120
99 wt
50 wt
25 wt
T degC
En
do
10 wt
Tm1= 483 degC
Tm2= 957 degC
10
257
The series of cryo-TEM images in Figure 2b show an overview of the most relevant 258
structures observed on G-C181-OH solution from T= 130degC to T= 25degC whereas T is 259
indicative of the equilibrium temperature before cryofixation (refer to materials and methods 260
section for more information on the sense and interpretation of T) At Tgt 100degC the sample 261
is essentially composed of polydisperse single wall vesicles massively shown by the 262
complementary pictures presented in Figure S 2 In between Tm1 and Tm2 at T= 90degC and T= 263
70degC (Figure 2b Figure 3 Figure 4 complemented by Figure S 3 and Figure S 4) vesicles are 264
connected by nanotubes At Tlt Tm1 flat crystals are otherwise observed (Figure 2b and Figure 265
S 5) 266
267
268
Figure 3 ndash Cryo-TEM images recorded for a 5 mgmL G-C181-OH aqueous solution heat at T= 90degC 269
270
A deeper insight at T= 90degC is given in Figure 3 (more images are provided in Figure 271
S 3) Arrows 1 through 6 mark very clearly the typical continuity in the glucolipid membrane 272
between the vesicle and nanotubes Arrow Ndeg 7 shows that a single nanotube connects the outer 273
membrane of two vesicles several hundred nanometers apart The connection is shown by 274
2
34
5
6
6
1
5
7
A
B
D
C
0 10 20 30 40 50 60
BIn
tensity
au
Profile nm
A
0 10 20 30 40 50 60
Inte
nsity
au
Profile nm
C
D
T= 90degC
11
arrows Ndeg5 and Ndeg6 The corresponding profiles A through D confirm the tubular nature of 275
the elongated objects Profiles B and D are both characterized by typical symmetrical thick 276
walls (low intensity depths highlighted by shaded rectangles) surrounding a hollow region (high 277
intensity peak between the shaded rectangles) The wall thickness varies between 35 and 40 278
nm for profile B and between 41 and 61 nm for profile D while the total nanotube diameter 279
varies between 14 nm at B and 20 nm at D At the same time the thickness of the vesicle wall 280
is about 6 nm at A and 135 nm at C Considerations about the bilayer or interdigitated structure 281
of the membrane will be presented below 282
The connection between nanotubes and vesicles seems to be multiple For instance 283
arrow Ndeg1 (Figure S 3) and Ndeg4 (Figure 3) show a single-wall vesicle of which the membrane 284
is extruded into a nanotube Similarly a closer look at arrows Ndeg1 2 and 3 in Figure 3 show 285
that the vesicle is single-wall and fully closed while the nanotube nucleates at the vesicle outer 286
surface with no apparent topological continuity In many regions of the sample at T= 90degC 287
one can find exvaginations or buds232531 in the nanotube wall This is shown for instance by 288
arrows Ndeg7 and particularly put in evidence in Figure 4 by arrows Ndeg1 through Ndeg4 where the 289
amplitude of the oscillation varies between 20-25 nm (arrow Ndeg1) and 6-8 nm (arrows Ndeg3-4) 290
291
Figure 4 - Cryo-TEM images recorded for a 5 mgmL G-C181-OH aqueous solution heated at T= 90degC 292
293
Still between Tm2 and Tm1 but at lower temperature (T= 70degC) the nanotubes seem to 294
vary from single threads (arrow Ndeg1 Figure S 4) to nanotubes of diameter below 15 nm both 295
connecting nanotubes of diameter ranging between 50 nm and 100 nm (arrows Ndeg2 Figure S 296
4) The larger tubes are most likely formed by the inflation and flattening of the nanotubes 297
probably after assimilation of surrounding vesicles and fusion of the exvagination discussed 298
above The transition between vesicles tubes and flat membranes is certainly more accentuated 299
Arrow Ndeg3 in Figure S 4 shows distinct vesicles while arrow Ndeg4 identifies a flat structure 300
evidently formed from fused vesicles In particular arrow Ndeg5 points at the fusion of two 301
2
1 132
4
12
vesicles while arrow Ndeg6 points at two vesicles fusing into the flat membrane Additional areas 302
where vesicle fusion is prominent are indicated by the oscillations at the outer skirt of broad 303
lamellae and pointed by arrow Ndeg7 304
Finally below Tm1 at T= 25degC for instance mainly flat crystals with no visible 305
exvaginations or tubes are visible (Figure S 5) by cryo-TEM and the material turns into an 306
insoluble precipitate Massive presence of flat crystalline structures is also clear from the bulk 307
iridescent behavior of a G-C181-OH solution under manual shear 308
In summary despite the uncertainty related to the actual state of equilibrium of the 309
glucolipids at the moment of cryofixation cryo-TEM depicts a vesicle phase at Tgt 100degC a 310
flat lamellar phase below Tm1 and an interconnected vesicle-nanotube network between Tm1 and 311
about 100degC The combination of statistically-relevant fluorescence microscopy and 312
scatteringdiffraction experiments provides an additional proof of the coexistence of 313
vesiclenanotube systems between the two transition temperatures Please note that the 314
experiments reported below have been performed under controlled conditions of temperature 315
which is then indicated by the use of T instead of T 316
13
317
Figure 5 ndash a-c) Confocal fluorescence microscopy images recorded at 90degC and 70degC for a 5 mgmL G-318
C181-OH aqueous solution d-g) Typical fluorescence microscopy images recorded at T= 80degC using 319
Laurdan (refer to materials and methods section for more details on this fluorophore) Excitation 320
wavelength is 405 nm for all the images while emission wavelength is 490 nm in (df) and 440 nm in (eg) 321
h) Full emission spectra obtained from the integration of various fluorescence images recorded from 412 322
nm to 600 nm (step 5 nm) at 90degC 80degC and 70degC i) Box plot of GP defined as 119918119927 =(120640120786120786120782minus120640120786120791120782)
120640120786120786120782+120640120786120791120782 with 120640120786120786120782 323
and 120640120786120791120782 being the emission wavelengths at 440 nm and 490 nm at 90degC 80degC and 70degC Each data point 324
l= 490 nm l= 440 nm
l= 490 nm l= 440 nm
10 μm400 450 500 550 600
00
02
04
06
08
10
No
rma
lize
d I
nte
nsity
l nm
90degC
80degC
80degC
70degC
70degC
400 450 500 550 60000
02
04
06
08
10
No
rma
lize
d I
nte
nsity
l nm
90degC
80degC
80degC
70degC
70degC
d) e)
f) g)
h)
i)
T= 80degC
Laurdan
T= 80degC
T= 80degC T= 80degC
T= 90degC T= 70degC T= 70degC
a) b) c)
1
1
1
14
corresponds to a set of regions of interest (ROIs) (54 at 90degC 65 at 80degC and 75 at 70degC) selected in the 325
corresponding fluorescence images ROIs were representatively selected so to include the entire image but 326
also vesicles alone tubes alone and mixtures of vesicles and tubes 327
328
Figure 5ab shows two typical confocal fluorescence microscopy images recorded on a 329
G-C181-OH solution (5 mgmL) in a flame-sealed capillary heat at T= 90degC and T= 70degC 330
Although the resolution of optical microscopy is not comparable with cryo-TEM the sample is 331
broadly composed of vesicles coexisting with nanotubes whereas in some cases the nanotube 332
starts from the vesicle itself (arrow Ndeg1) in good agreement with cryo-TEM data Furthermore 333
SANS recorded at T= 90degC (Figure S 6a) shows a scattering profile with a pronounced -2 334
dependence of the scattering intensity against the wavevector q in the log-log scale This 335
indicates the massive presence of a flat interface and it is expected typical of bilayers in 336
vesicular morphologies56 However the typical signature of nanotubes cannot be observed in 337
the SANS profile and this can be explained by both an argument related to the relative lower 338
amount of nanotubes with respect to vesicles at 90degC but also to the steeper slope of flat 339
morphologies (-2) compared to tubes (-1) the signal of the former masking the tube signal at 340
low wavevector values The SANS profile is characterized by a diffraction peak at q= 0167 Aring-341
1 of which the assignment is refined by WAXS data 342
Temperature-driven WAXS experiments in Figure S 6bc (5 mgmL-1 and 25 mgmL-1 343
respectively) show a lamellar order possibly attributed to a multilamellar structure of the 344
vesicles (dv Figure S 6d) at high temperature and to the interplanar arrangement of the 345
crystalline flat structures (dL Figure S 6d) at T= 25degC The sharp (001) reflection indicates 346
typical interlamellar distance of 353 Aring at 25degC although this value varies with temperature 347
(400 Aring at 111degC 372 Aring at 88degC) thus confirming its assignment to a hydration-dependent 348
interlamellar order More intriguing is the second broader peak at q= 0403 Aring-1 (d= 156 Aring) 349
and its reflection both clearly visible at 88degC below Tm2 We attribute it to the inter-glucolipid 350
arrangement inside the tubular phase (dt Figure S 6d) coexisting with the vesicle phase 351
between Tm1 and Tm2 and to the planar lipid arrangement (di Figure S 6d) in the rigid flat 352
lamellar structure below Tm2 Its temperature- hence hydration- independent position also 353
confirms its structural origin Finally besides the water-structure peak at about 2 Aring-1 we also 354
observe a broad peak at 144 Aring-1 characteristics of the lateral packing (d Figure S 6d) of lipids 355
in bilayers While its position could be consistent with an Lα phase5758 above Tm2 its broadness 356
and positional invariance as well as the coexistence between vesicles and tubes do not allow a 357
precise assignment 358
15
Does G-C181-OH assume a bilayer or interdigitated structure the latter being the one 359
found for other similar bolaform glucolipids4243 The size of G-C181-OH can be estimated to 360
be at the most 32 Aring given by the length L of the C16 tail (L = 22 Aring from the Tanford formula 361
L= 154 + 1265 times n (n= 16)59) and the sugar (about 10 Aring)4243 However the cis conformation 362
of the C=C bond imposes a ldquokinkrdquo of 60deg in the aliphatic chain which reduces the effective 363
length of the oleic backbone to about 17 Aring for an effective total G-C181-OH length of about 364
27 Aring Cryo-TEM provides a tube thickness varying from 35 Aring to 60 Aring and a vesicle membrane 365
thickness of at least 60 Aring WAXS suggests an interlamellar thickness (membrane and water) 366
between 40 Aring and 37 Aring and an inter-lipid distance in the tube of about 16 Aring In the absence of 367
a clear form factor oscillation profile as found for similar glucolipids4243 one must 368
acknowledge that these data pledge neither in favor of fully interdigitated nor a double layer 369
structure and might suggest a tilted lipid arrangement with partial interdigitation60 370
371
13C ssNMR demonstrates that G-C181-OH can assume two coexisting head-head and 372
head-tail configurations 373
Vesicles are characterized by low positive mean and gaussian curvatures while 374
nanotubes are described by a combination of a high positive mean and zero gaussian curvatures 375
In this regard the coexistence of vesicles and nanotubes requires glucolipids to adapt 376
themselves to both environments at the same time For this reason the formation of nanotube-377
vesicle networks generally requires a specific driving force able to impose a high mean and 378
zero gaussian curvature to the membrane In many systems insertion of at least a second 379
constituent (lipid surfactant protein) in the membrane becomes a necessary internal driving 380
force for the nucleation and growth of so-called membrane inclusions from which 381
topologically-connected nanotubes can form10ndash123261 as explained by orientational ordering 382
arguments62 It has also been shown that external driving forces such as use of laser 383
ldquotweezersrdquo30 osmotic pressure6 electroformation5ndash82829 or controlled suction13ndash16 are 384
otherwise necessary as also supported by theoretical studies19 385
The bending energy of tubes is higher than that of a vesicle membrane8 due to the 386
dependence of the membrane free energy from the principal curvatures For this reason 387
isotropic (rotational symmetry along the main axis) but also anisotropic33 lipids generally 388
stabilize low-curvature shapes like flat membranes or vesicles Lipid nanotubes are also a 389
common phase formed by amphiphiles but generally for lipids with a certain complexity in 390
their molecular structures as exampled by diacetylenic derivatives of phospholipids among 391
others262763ndash65 Negative contributions to the bending energy favoring the simultaneous 392
16
presence of interconnected vesicles and tubes was shown to be driven by the presence of 393
anisotropic lipids in a membrane continuum Spontaneous deviations to the elastic theory in the 394
presence of surfactants lipids and proteins with anisotropic structures favor the formation of 395
protrusions with radius of the order of the fraction of a micron9ndash1219ndash2362 396
In the absence of both internal and external driving forces mentioned above G-C181-397
OH should behave as a standard lipid Its DSC profile (Figure 2)536667 under both hydrated and 398
dry conditions identifies a hydration-independent transition (Tm1) slightly above room 399
temperature this is followed by one main transition at higher temperature (Tm2) in the dry 400
sample50 For such a profile one expects a gel phase (Lβ) below Tm1 and a liquid crystalline 401
structure possibly in the morphology of vesicles (L4 phase) possibly above Tm1 and most likely 402
above Tm231 as experimentally found On the basis of the thermogram recorded on the dry 403
powder one may also expect a ldquoripplerdquo (Pβ) phase between Tm1 and Tm2 characterized by 404
periodic undulations of the bilayer (generally addressed to as regions with both liquid order and 405
disorder)5455 406
In the present work instead of a Lβ phase we observe flat crystals below Tm1 and a 407
vesicle-nanotube network instead of the ldquoripplerdquo phase The latter is particularly unexpected 408
because the membrane is composed of a single-component (G-C181-OH) and no anisotropic 409
external force (osmotic hydrodynamic electric) is used to pull and stabilize the tubes In 410
addition the nanotubes are observed at fairly high temperatures above Tm1 (between about 411
60degC and 90degC) while this morphology is generally favored at low temperature (proportionality 412
with 1kT figure 5 in Ref 62) commonly below a given transition temperature characteristics 413
for each specific amphiphile27 Furthermore nanotubes of G-C181-OH seem to be stable in 414
time thus differing from what is found in electroformed vesicles78 They are also observed 415
away from phase transition events (may them be at Tm1 or Tm2) as otherwise reported before 416
for a diacetylenic derivative of phosphatidylcholine26 and many other systems27 417
A stable nanotube-vesicle network for a single-component phospholipid in the absence 418
of external driving forces is not expected and has never been reported before It could be 419
explained by the coexistence of two micro-separated phases of different rigidity This 420
hypothesis is excluded by confocal microscopy on Laurdan-labelled membranes and magic 421
angle spinning (MAS) solid-state NMR (ssNMR) experiments 422
Laurdan is a well-known fluorophore used to put in evidence the coexistence of rigid 423
and fluid domains in both model and biological membranes47ndash49 Laurdan was used here to label 424
the G-C181-OH membranes between Tm1 and Tm2 and to verify the possible micro-segregation 425
and coexistence of rigid (eg Lβ λem= 440 nm) and fluid (eg Lα λem= 490 nm) domains in 426
17
tubes and vesicles respectively A set of quantitative experiments performed on a 5 mgmL-1 427
solution summarized in Figure 5 shows an excess of fluorescence at only λem= 490 nm for 428
temperature between 90degC and 70degC (Figure 5h) The GP value which quantifies the rigidfluid 429
character of the membrane is systematically negative (Figure 5i) indicating an overall fluid 430
membrane at all temperatures GP is quantified on more than 50 regions of interest (ROIs) at 431
each temperature including vesicles and tubes alone as well as connected nanotube-vesicles 432
(Figure 5d-g) The dispersion of GP at 80degC and 70degC between -08 and -02 could suggest the 433
spurious presence of membranes with various degrees of flexibility although fluidity is always 434
predominant The combination of WAXS (broad peak d= 144 Aring-1 invariant with 435
temperature Figure S 6bc) and confocal fluorescence microscopy using Laurdan confirms the 436
single-phase of the membrane composed of G-C181-OH both in vesicles and nanotubes This 437
is also consistent with the lack of phase transitions in DSC experiments between ~85degC and 438
~60degC especially in hydrated samples We conclude that the vesicle-nanotube transition is not 439
driven by the local segregation of gel phase (Lβ) microdomains nor that the nanotubes are 440
composed of such phase 441
ssNMR is the best-suited approach to investigate the origin of the local driving force for 442
the nucleation of anisotropic inclusions of which the average orientation depends on the local 443
membrane and inclusion curvatures and was shown to promote tubing62 ssNMR can provide 444
information on the local molecular mobility eg through the nuclear spin relaxation behavior 445
but also on intermolecular interactions and stereochemistry eg through variations in the 446
chemical shift68ndash70 447
Ideally ssNMR should be performed on diluted G-C181-OH samples above Tm1 448
However fast MAS necessary for high resolution centrifuges the sample As a first 449
approximation hydrated G-C181-OH samples for instance at 50 wt as classically done for 450
phospholipids71 could be studied Unfortunately permeability of the sample holder combined 451
to heating (close to the boiling point of water) and MAS provoke dehydration and even sample 452
ejection After experiencing both of the above this approach was abandoned As a second 453
approximation the study of the dehydrated G-C181-OH powder avoids centrifugation and 454
evaporation If studying dried lipids may not reflect their exact behaviour under diluted 455
conditions valuable structural information can still be obtained in dehydrated molecular 456
systems like proteins thus illustrating that this approach is not unreasonable Furthermore if 457
DSC (Figure 2a) shows that hydration suppresses the Tm2 it also shows that the value of Tm1 is 458
not affected by water at concentrations as low as 10 wt For this reason performing a 459
structural analysis of dehydrated G-C181-OH by ssNMR above Tm1 may help understanding 460
18
the local arrangement of G-C181-OH in two morphologies vesicles and nanotubes having 461
sensibly different curvatures 462
To explore the local mobility of the most relevant chemical groups of G-C181-OH 463
above Tm2 (T= 110degC) and between Tm2 and Tm1 (70 lt T degC lt 90) we combine a series of 1H 464
and 13C experiments Single-pulse (SP) MAS experiments (1H and 13C) when recorded under 465
quantitative conditions allow the detection of all chemical species while cross-polarization 466
(CP) MAS (13C only) experiments are sensitive only to constrained groups for which the 1H-467
13C dipolar coupling is not averaged to zero by the molecular motions 468
469
Figure 6 ndash a) 1H MAS (10 kHz) ssNMR spectra recorded from 110degC to 70degC b) 13C MAS (10 kHz) ssNMR 470
spectra recorded using high power decoupling single pulse (SP) and cross-polarization (CP) pulse sequences 471
Contact time for CP experiments and corresponding temperatures are given on each spectrum Full spectra 472
are given in Figure S 7 473
The most relevant 1H and 13C spectra are given in Figure 6 (full range in Figure 7 and 474
Figure S 7) As expected the 1H solid-state SPMAS spectra show broader peaks compared to 475
the solution-state NMR spectrum (Figure 6a) reflecting the obvious solid-state character of the 476
sample at any temperature The sugar group and the C=C bond resonate in the 25-6 ppm range 477
and 535 ppm respectively while the OH groups of the sugar moiety are found below 45 ppm 478
(Figure 6a full assignment in Table S 1) Very broad (~1 ppm) at 100degC the position of the 479
OH peak varies with the temperature value and becomes narrower (lt~05 ppm) and visible at 480
δH= 464 ppm at T= 70degC Line narrowing and chemical shift variations of the OH resonance 481
in ssNMR is always a direct sign of H-bonding interactions whereas the strength of the H-482
bonding hence its OHhellipH distance is correlated to a dispersion in chemical shifts72ndash75 All other 483
60 55 50 45 40 35 30 25
ppm
110
90
80
70
910
1rsquo
6rsquo16
1
OH
134 132 130 128 126
ppm110 108 106 104 102 100
ppm
SP (T= 110degC)
SP (T= 70degC)
CP 50 ms (T= 70degC)
CP 3 ms (T= 70degC)
910 1rsquo
1H 13C
1
811
910
CH2 CH2
1rsquo
6rsquo
a) b)
C102
13024
C9101
13003
C92
12869 C1rsquo210382
C1rsquo110443
C1rsquo13035
2rsquo3rsquo4rsquo
T degC
5rsquo
19
resonances broaden from 110degC to 70degC thus indicating slower andor more anisotropic 484
reorientational motions of all chemical groups The specific dynamic behaviour of the sugar 485
headgroup is also reflected by its 1H transverse relaxation time T2 whereas the shorter the T2 486
the higher the rigidity Experiments performed between 110degC and 70degC shown and 487
commented in Figure S 8 in the Supporting Information globally show a single short (lt 1 ms 488
below 100degC) T2 relaxation component for H1rsquo H5rsquo and H6rsquo and two both short and long 489
(between 4 ms and 12 ms) T2 for the acyl chain (CH2 H910 H811) even below 100degC 490
At 110degC 13C SPMAS experiments (Figure 6b full range in Figure 7 and Figure S 7 491
assignments in Table 1) show a single peak at δC= 10335 ppm for C1rsquo and at δC= 13003 ppm 492
for C910 as expected for a symmetrical conformation with two chemically-equivalent 493
carbons76 At 70degC the C1rsquo peak disappears while C910 now shows two peaks around 128 494
ppm and 130 ppm (Table 1 full temperature series in Figure S 7b) attributed to C92 (δC= 12869 495
ppm) and C10 in a non-symmetric configuration respectively for which these two carbons are 496
chemically inequivalent76 More precisely the resonance at 130 ppm is actually the 497
superposition of two close resonances C9101 (δC= 13003 ppm) and C102 (δC= 13024 ppm) 498
where subscripts 1 and 2 stand for two different conformations of the cis-olefin group as 499
reported for various phases of oleic acid in the vicinity of 0degC76 500
501
Table 1 ndash 13C Chemical shifts of G-C181-OH in solution and solid-state Solid-state experiments are 502
recorded at MAS= 10 kHz All spectra are reported in Figure 7 and Figure S 7 The contact time for cross 503
polarization is 3 ms In all ssNMR experiments temperature is first raised at 110degC and then lowered to 504
either 90degC or 70degC Attribution of the 13C resonances in Table 1 is performed on the basis of the solution 505
spectrum (Figure S 1b) Additional peaks observed in both single pulse and cross polarization ssNMR 506
experiments are attributed when possible to a configuration effect of the given atom eg C9101 and C92 507
indicate two configurations of C9 All new peaks observed in solid-state and not detected in solution are 508
highlighted in red for convenience 509
510
511
δ ppm
Peak Liquid (DMSO-d6)
Solid Single Pulse
T= 110degC
Solid Single Pulse
T= 90degC
Solid Single Pulse
T= 70degC
Solid Cross Polarization
T= 70degC
C102
- - 13024 13024
C910C9101 13009 13003 13003 13003 13003
C1C9C10C1rsquo
C6rsquo
20
C92 - - - 12869 12869
C1rsquoC11 10329 10335 10335 - 10443
C12 - - - - 10382
C3 7724 7709 7702 - 7829
- 7634 7629 - 7621
7525
C2 7388 7398 7390 7370 7370
C4 7052 7077 7054 7041 7098
C16 6900 7016 - - 7029
- - - - 6793
C1C5C6 6153 6241 6236 6239 6262
C1C5C6 6117 - - - 5956
C2 3300 3290 3290 3283 3279
CH2(trans) - - - 3198 3196
CH2(gauche)C15 2941 2981 2987 3004 -
C811 2706 2747 2747 2832 2817
CH2 2597 2625 2628 2630 2817
512
13C CPMAS spectra at 70degC (Figure 6b full range in Figure 7 and Figure S 7d) at 513
increasing contact times confirm the presence of two cis-olefin environments one for which 514
C910 are equivalent labelled here C9101 and one for which they are inequivalent labelled 515
C92 C102 Both environments are rigid enough to be observed at short contact time (tc= 50 μs) 516
A similar double environment is also observed for the sugar C1rsquo CPMAS at 70degC shows two 517
peaks (C1rsquo1 at δC= 10443 ppm C1rsquo2 at δC= 10382 ppm Figure 6b Figure S 7d) These are 518
significantly shifted downfield from the C1rsquo peak observed at 110degC and are detected at contact 519
times as short as 50 μs thus indicating their rigid character One also finds that CPMAS is 520
totally inefficient at 100degC for short contact times (50 μs) and poorly efficient even at 3 ms 521
typical of fast-tumbling molecules (Figure S 7c) also both gauche (δC= 3004 ppm) and all-522
trans (δC= 3198 ppm) conformations of the CH2 carbons coexist at 70degC (Figure S 7b)77 523
According to ssNMR one main mobile molecular environment exists at 110degC as 524
shown by the well-resolved 1H spectrum single C=C (C9101) and anomeric (C1rsquo) resonances 525
gauche conformation of the aliphatic CH2 and single T2 of the aliphatic CH2 chain and sugar 526
protons The sugar group is certainly mobile (inefficient 1H13C CPMAS) but still more 527
constrainted than the acyl chain (shorter T2 (1H)) As the temperature is lowered the overall 528
rigidity increases (broadening of 1H NMR peaks faster 1H transverse relaxation and efficient 529
1H13C magnetization transfer during CPMAS) presumably driven by H-bonding 530
interactions (downfield shift and line narrowing of the OH 1H signal very short OH T2 loss of 531
the C1rsquo signal in SPMAS) At the same time a number of spectroscopic data (two concomitant 532
21
resonances for anomeric C1rsquo1 and C1rsquo2 cis-olefin C9101 and C92 C102 and CH2 gauche and 533
all-trans environments) and relaxation behaviour (fast and slow T2 relaxation components) 534
strongly suggests the coexistence of two molecular environments Further proofs of the 535
coexistence of two distinct molecular domains are given by a number of chemical shift 536
variations in the 13C CPMAS spectrum at 70degC compared to the one at 110degC 90degC and 537
solution This is shown in Figure 7 and in the list of 13C chemical shifts in Table 1 538
539
540
Figure 7 - Comparison between solution- and solid-state 13C NMR spectra of G-C181-OH Solid-state 541
experiments are recorded directly on the sample powder at a MAS of 10 kHz (4 mm zirconia rotor) SP 542
Single Pulse CP Cross Polarization In all the ssNMR experiments temperature is first raised at 110degC 543
and then lowered to either 90degC or 70degC Segmented lines are meant to highlight the known peak position 544
in solution thus stressing the strong chemical shift variations in the solid-state 545
546
NMR experiments above Tm2 suggest that vesicles could contain G-C181-OH with a 547
single family of mobile conformations characterized by chemically-equivalent C=C (red 548
Figure 8b) and a single C1rsquo conformation (green Figure 8b) Experiments between Tm1 and Tm2 549
otherwise suggest that two coexisting conformations characterized by chemically-equivalent 550
(red Figure 8b) and inequivalent (magenta Figure 8b) C=C could be associated to nanotubes 551
Two distinct C1rsquo sites (grey Figure 8b) also indicate two configurations of the sugar headgroup 552
A comment on this point will be given in the following paragraphs 553
The local (Aring-scale) variation of molecular mobility below Tm2 drives the coexistence of 554
two distinct molecular environments of the same G-C181-OH molecule This occurs within a 555
single-phase domain (as deduced by WAXS) of equivalent membrane rigidity (as derived from 556
Laurdan probe in confocal microscopy) Although never reported before the difference in the 557
local mobility of the same amphiphile (here G-C181-OH) could satisfy the theoretically-558
140 120 100 80 60 40 20
CP(3 ms)-70degC
SP-70degC
SP-90degC
SP-110degC
ppm
LiquidC910
C1rsquo
C2rsquo
C4rsquo
C3rsquo
C1
C6rsquoC5rsquo
C1
6
C8
11
C2 C
H2
C1
5
CH
2
DM
SO
13C
22
required conditions that induce local lipid segregation and formation of membrane inclusions 559
(Figure 8c) In case of their non-zero average orientation the local membrane curvature 560
increases62 and nanotubes can spontaneously form (Figure 8bc) More intriguing this 561
mechanism occurs at least 10degC above Tm1 although it should not be favored above the Tm27 562
From both experimental and theoretical backgrounds the conditions of topologically-563
connected vesicles-nanotubes systems are met only when either internal (two components) or 564
external driving forces are applied19 In the present single-lipid system of which the phase 565
behavior is summarized in Figure 8a the most plausible driving force could be explained by 566
the NMR results collected on the dry sample G-C181-OH concomitantly occupies two 567
molecular environments characterized by 1) two distinct conformations of the sugar 568
displaying equivalent mobility and 2) two conformations of the acyl chain unsaturation 569
570
23
571
Figure 8 ndash a) Thermotropic phase behavior of G-C181-OH at 5 mgmL-1 Note that Tm2 is observed on the 572
dry powder only b) Possible relationship between the molecular environment as derived from NMR and 573
membrane curvatures All the molecular drawings refer to the same G-C181-OH molecule (bulky ellipsoid 574
equiv sugar headgroup) while each color corresponds to a given configuration Grey of C1rsquo1 and C1rsquo2 indicates 575
the uncertainty about the assignment of the specific NMR peak The curvature C is defined as 1R R being 576
the curvature radius R1 R2 radius of curvature CG Gauss curvature CM Mean curvature c) Free 577
interpretation of the anisotropic high-curvature (CMgt 0 CG= 0) inclusions in the membrane (low CM and 578
CG) continuum driven by inter-sugar H-bonding and reduced intramembrane diffusion for a G-C181-OH 579
glucolipid 580
581
Flat crystalline structure
Nanotube-vesicle network
Vesicles
48degC
120deg
106 105 104 103 102 101
ppm
H9 H10H1rsquo
106 105 104 103 102 101
ppm106 105 104 103 102 101
ppm106 105 104 103 102 101
ppm
C=CC=C
C1rsquo1C1rsquo2
C1rsquo
Tm2(96degC)Tm1
a)
b)
c)
Same molecule different local orientations and sugar conformations
High curvature membrane
Low curvature inclusion
Flip-FlopStrong H-bonding
CG
CM ( + )
CG 0
CM 0 CG 0
CM 0
G-C181-OH
24
Two related questions are unanswered at the moment What actually drives nanotube 582
formation and is the organization of G-C181-OH within the vesicles and tubes the same Lipid 583
nanotubes have been studied for at least three decades over which broad experimental and 584
theoretical insight has been generated Despite this fact the actual understanding is still matter 585
of debate27 Micelle-to-nanotube and vesicle-to-nanotube phase transitions are generally 586
reported for single amphiphiles below a given Tm and intermediate phase composed of twisted 587
and flat fibers is concomitantly reported Initially thought to be a chirality-driven phenomenon 588
recent studies propose a more general mechanism involving crystallization and symmetry 589
breaking in the lipid packing driven by optimal packing27 If twisted ribbons were observed 590
before for a number of microbial glycolipid bolaamphiphiles44 they are not found for G-C181-591
OH This fact as well as the large body of cryo-TEM images and the observation of nanotubes 592
above Tm1 rather pledge in favour of a direct topological change from positive (vesicles) to 593
zero (nanotubes) Gaussian curvatures In this case vesicle-to-nanotube transitions could be 594
driven by external forces56307813ndash162829 595
Considering the absence of external forces in the present system there are only two 596
possibilities left spontaneous budding of the membrane or nanotube pulling after inter-vesicle 597
collisions due to Brownian motion Both are possible as inclusions composed of a different 598
arrangement of the same molecule in the membrane continuum can theoretically explain 599
spontaneous nanotube formation in an isotropic medium672223629ndash1218ndash21 However the second 600
one is probably more likely to prevail because it could explain the large number of nanotubes 601
connecting two distant vesicles Interestingly similar events occur for any phospholipid-based 602
vesicular solution but nanotubes are extremely rare unless at least two lipids of different 603
molecular structure are mixed together The spectroscopic 1H and 13C and relaxation (1H) 604
ssNMR data even if collected on a dry powder demonstrate that the coexistence of two G-605
C181-OH configurations involving both the sugar headgroup and fatty alcohol chain are 606
possible for this molecule As a matter of fact this is not so surprising as more than one energy 607
minima each corresponding to a given conformation are known for glucose its non-reducing 608
derivative methylglucose and carbohydrates in general78ndash80 609
The presence of two configurations could explain the coexistence between two 610
structures of different curvature but the data presented so far do not explain the origin of these 611
two configurations In other words what drives the change in the local structure of the sugar 612
headgroup and fatty alcohol within the membrane 613
The association of known self-assembled structures to spectroscopic 13C ssNMR data is 614
known for years in particular for gluconamides lipids having a linear sugar headgroup81ndash84 It 615
25
was found that gauche effects in some cases up to the γ position in the sugar chain induce 616
upfield chemical shifts while anti and trans conformations result in downfield shifts Each 617
structure (monolayer crystal bilayer crystal or micellar fiber) was then characterized by a given 618
organization of the gluconamide and a characteristic 13C ssNMR fingerprint which could be 619
explained by gauche γ-gauche anti and trans conformations of the headgroup Similar 620
structural-spectroscopic correlations have been collected over the years for much simpler cyclic 621
sugars85 whereas pyranoses can undergo important conformational changes (chair half-chair 622
boat skew) when the appropriate energy barriers are crossed78ndash8086 A quantitative 623
conformational study based on the 13C chemical shift variations shown in Table 1 would be 624
certainly helpful but very delicate in the context of the present state of the art because a 625
rigorous approach requires at least one known crystal structure8182 which is currently missing 626
for this compound A qualitative approach will then be adopted 627
G-C181-OH is a bolaform amphiphile and flip-flop could be a possible mechanism 628
involved in the nanotube stabilization whereas head-tail interactions have long been considered 629
as important in nanotube-forming bolaform amphiphiles6063 From mere considerations based 630
on T2 (1H) relaxation arguments one could exclude head-tail configurations if the R-CH2OH 631
endgroup (H1) was involved in a direct interaction with the sugar group its corresponding T2 632
would probably be comparable to the sugarrsquos one (OH and H1rsquo) but this does not seem to be 633
the case However this hypothesis would be based on the comparison of the relaxation from 634
CH and CH2 protons additionally involved in different kind of motions Besides the relaxation 635
of H1 is influenced by the strong overlap between H1 and H5rsquo For these reasons relaxation 636
arguments are not solid enough and will not be used 637
We then address this question by exploring intermolecular interactions in a direct 638
manner using 2D 1H-1H homonuclear ssNMR correlation spectroscopy At 90degC in the fast-639
tumbling domain of molecular motion (narrow 1H NMR peaks Figure 6a) and corresponding 640
to the vesicle-rich region spin diffusion (NOESY) experiments are preferred over dipolar 641
coupling based experiments because such interaction is averaged out by molecular motion 642
However when the molecular motion is more constrained in the domain of nanotube stability 643
at 70degC (broad 1H spectra Figure 6a) Double-Quantum Single-Quantum (DQ-SQ) correlation 644
experiments are best suited to probe interaction between close molecular neighbors These 645
experiments are reported in Figure 9 and the related interpretation is only briefly reported 646
below while a more detailed discussion can be found on Page 12 in the Supporting Information 647
26
648
Figure 9 ndash a) 2D 1H-1H NOESY NMR experiment performed at MAS= 10 kHz (4 mm probe) on a Bruker 649
300 MHz Avance III HD spectrometer using 300 ms of mixing time Sample temperature is regulated to 650
90degC reached by cooling from 110degC b) 2D 1H-1H DQ-SQ (BAck-to-BAck BABA pulse sequence used for 651
the DQ excitation scheme) NMR experiment performed at MAS= 22 kHz (25 mm probe) on a Bruker 700 652
MHz Avance III spectrometer using a DQ excitation time equal to 2 rotor periods Sample temperature is 653
regulated to 70degC reached by cooling from 110degC The typical schemes illustrating how to interpret these 654
2D experiments are reported above each experimental map Zooms of the sugar region and configurational 655
interpretation are given below each 2D map More information are given in the text below 656
H16-H16
H1-H1
H9-H10
H1rsquo-H1
H1rsquoH910 H16
H1
H1rsquo-H1rsquo
Hxrsquo-Hxrsquo
2
(pp
m)
(ppm)
315
811910 1rsquo
2rsquo2
3rsquo 4rsquo6rsquo
5rsquo
1rsquo2910
asymp asymp asympHDO MeOD Acetone
1
315
811 9101rsquo
2rsquo2
3rsquo4rsquo6rsquo
5rsquo
1rsquo2 9 10
asympasympasympHDOMeODAcetone
H1rsquo-H1
1rsquo
1
(p
pm
)
(ppm)
H1-H2
H1rsquo-H1
H1rsquo
H910
H1H5rsquo
H2
H1rsquo-H5rsquo
315
811910 1rsquo
2rsquo2
3rsquo 4rsquo6rsquo
5rsquo
1rsquo2910
asymp asymp asympHDO MeOD Acetone
1
H2rsquoH3rsquoH4rsquo
H2rsquoH3rsquoH4rsquo
X= 2rsquo3rsquo4rsquo
NOESY - T= 90degC
1H
1H
1H
1H
DQ-SQ - T= 70degC
a) b)
2
(pp
m)
(p
pm
)
(ppm)
A B
AhellipB
AhellipA
BhellipB
NOESY
(ppm)
A B
AhellipB
DQ-SQ
Single-quantum dimension
Do
ub
le-q
ua
ntu
m d
imen
sio
n
AhellipA
BhellipB
BhellipA
BhellipA
315
811910 1rsquo
2rsquo2
3rsquo 4rsquo6rsquo
5rsquo
1rsquo2910
asymp asymp asympHDO MeOD Acetone
1
lt 5 Aring
lt 5 Aring
H1-H2
H811
H15
H16
H6rsquo
H1rsquo
H1
H5rsquo
H2
H1-H2
H1rsquo-H1
H1rsquo-H5rsquo
H1rsquo
H1 H5rsquo
H1rsquo
H1
H5rsquo
H1H2rsquo H3rsquo H4rsquo
H1-H1
H1rsquo-H1
Hxrsquo-HxrsquoX= 2rsquo3rsquo4rsquo
H1-H2
H1rsquo
Zoom sugar region 28 ndash 45 ppmNOESY DQ-SQ
27
Head-tail or head-head configurations could be probed by the existence of H1rsquo-H1 657
interactions whereas H1 (δH= 356 ppm) is associated to the glucolipid tail and H1rsquo (δH= 432 658
ppm) to the sugar headgroup These atoms are more than 15 Aring apart and a direct interaction 659
could not be observed in both NOESY and DQ-SQ experiments NOESY experiments (Figure 660
9a) show that H1rsquo-H1 correlations are not observed Meanwhile clear-cut direct H1rsquo-H1 661
interactions are indeed observed are detected at T= 70degC (DQ cross-peaks related to H1rsquo-H1 662
correlation in DQ-SQ experiment shown in Figure 9b) Interestingly the absence of auto peaks 663
at δH= 432 ppm and δH= 335 ppm in the SQ dimension excludes H1rsquo-H1rsquo and Hxrsquo-Hxrsquo (x= 2 664
3 4) interactions respectively strengthening the idea that sugar headgroups from two nearest-665
neighbor G-C181-OH molecules are not adjacent in the nanotube-vesicle region 666
Homonuclear 2D ssNMR supports the idea according to which G-C181-OH can 667
undergo molecular flip-flops and a head-tail arrangement in the dry product Extrapolating these 668
conclusions in the lower concentration range lack of H1rsquo-H1 proximity at T= 90degC suggests a 669
head-head configuration in the vesicle-rich region and head-tail configuration within the 670
nanotubes It is however still unclear whether flip-flops are driven by spontaneous temperature-671
induced conformational changes in the glucolipid packing stimulating inclusions within the 672
membrane itself672223629ndash1218ndash21 or by defects generated by inter-vesicle collisions In fact a 673
combination of both is not unlikely Nanotubes are not stable when temperature is 20 to 30 674
degrees above Tm1 indicating that inter-vesicle collisions alone cannot explain the unusual 675
phenomenon In an energy landscape approach87 the head-head configuration is certainly 676
favored at high temperature while both head-head and head-tail configurations could be 677
favored in the mid-temperature region corresponding to the range between Tm1 and Tm2 in the 678
dry powder Both statistical and defect-induced flip-flop events contribute to form high mean 679
zero Gaussian curvature morphologies (nanotubes) for which the head-tail conformation 680
limiting the proximity between bulky sugar headgroups is probably more adapted (Figure 8c) 681
The flip-flop interpretation now reasonably explains the strong differences in the sugar and fatty 682
alcohol conformations deduced by the multiple NMR signals attributed to chemically-683
equivalent groups The existence of various low-energy conformations each having specific 684
NMR signature for sugars in solution78ndash8086 and solid-state81ndash84 further supports our 685
interpretation 686
One last point should be clarified Why between Tm1 and Tm2 are two molecular 687
environments able to coexist instead of a single one of average rigidity as found in the case of 688
ldquoripplerdquo phases50ndash54 We believe that this question can be answered based on the NMR results 689
the relatively short T2 values of the H1rsquo and OH protons shows the constrained mobility of the 690
28
sugar headgroup despite a certain flexibility of the chain (long T2 component) This trend may 691
suggest restrictions in translational mobility probably due to the sugar-OH hydrogen bonding 692
(Figure 8c) meaning that lipids are not able to diffuse within the membrane thus keeping two 693
different configurations stable 694
695
Conclusions 696
Topologically-connected nanotube-vesicle lipidic systems are commonly observed for 697
self-assembled membranes composed of at least two amphiphiles and spontaneously driven by 698
anisotropic inclusions andor by external directional forces This work shows that strong 699
differences in membrane curvature can spontaneously occur in single-lipid systems without 700
external anisotropic forces Coexistence and interconnection between nanotubes and vesicles 701
are evidenced via cryo-TEM and fluorescence confocal microscopy in a single-phase region at 702
temperature above a transition temperature Tm1= 483degC determined by DSC on the hydrated 703
sample but below the second transition temperature Tm2 (957degC) determined by DSC on the 704
dry powder X-ray diffraction (WAXS) also shows the coexistence of two lattice periods one 705
attributed to an inter-membrane repeating distance and the other possibly related to the intra-706
nanotube glucolipid arrangement Labelling the systems with Laurdan a fluorophore of which 707
the emission strongly varies with the local membrane rigidity excludes the presence of rigid 708
micro-separated phases (eg Lβ) 709
1H and 13C ssNMR despite the fact that it can only be performed on the dry powder 710
confirm the presence of one main fluid G-C181-OH environment above Tm2 Below Tm2 the 711
splitting of some 13C peaks and the coexistence of short and long 1H relaxation components 712
demonstrate that G-C181-OH can simultaneously pack into structurally and dynamically 713
inequivalent environments Combining advanced 2D 1H-1H correlation experiments based on 714
spin diffusion or double-quanta excitation suggests that vesicles could contain a preferred head-715
head configuration of the bolaform lipid while nanotubes a preferred head-tail assembly 716
The presence of two environments composed of the same molecule characterized by 717
different molecular configurations and rigidity fulfills the theoretical conditions necessary to 718
spontaneously nucleate a membrane inclusion of non-zero average orientation described as 719
necessary to observe topologically-connected nanotube-vesicle structures in the absence of 720
external forces This hypothesis could also be enriched by the possibility of nanotubes to be 721
pulled away between two vesicles after a collision event 722
This work expands the actual theoretical and experimental framework on lipid networks 723
stabilized by a different radius of curvature It could also motivate the synthesis or isolation 724
29
of new lipids providing a higher level of 3D architectural control in soft networks possibly in 725
the range of room temperature 726
727
Acknowledgements 728
Dr Andrea Lassenberger and Dr Sylvain Preacutevost at Institut Laue Langevin (ILL Grenoble 729
France) are kindly acknowledged for their assistance on the SANS experiment Confocal 730
images were performed at the Institut de Biologie Paris Seine (IBPS) imaging facility Jean-731
Franccedilois Gilles (Imaging Core Facility Institut de Biologie Paris Seine (IBPS) CNRS 732
Sorbonne Universiteacute Paris France) is kindly acknowledged for his assistance on the confocal 733
microscopy imaging Dr Guillaume Laurent (LCMCP Sorbonne Universiteacute Paris France) is 734
kindly acknowledged for helpful discussions The French region Ile-de-France SESAME 735
program is acknowledged for financial support (700 MHz NMR 736
spectrometer) Dr Olivier Diat (ICSM Marcoule France) Prof eronikaIglič and Prof V Aleš737
onsul discussi Slovenia) are kindly acknowledged for helpfUniversity of LjubljanaIglič (-Kralj 738
739
Financial support 740
WAXS experiments have been supported by Soleil Light Source Saint Aubin France proposal 741
Ndeg 20201747 SANS experiments have been supported by ILL proposal Ndeg9-13-778 742
743
References 744
1 D Kabaso N Bobrovska W Goacuteźdź E Gongadze V Kralj-Iglič R Zorec and A 745
Iglič Bioelectrochemistry 2012 87 204ndash210 746
2 C R Safinya U Raviv D J Needleman A Zidovska M C Choi M A Ojeda-747
Lopez K K Ewert Y Li H P Miller J Quispe B Carragher C S Potter M W 748
Kim S C Feinstein and L Wilson Adv Mater 2011 23 2260ndash2270 749
3 P Veranič M Lokar G J Schuumltz J Weghuber S Wieser H Haumlgerstrand V Kralj-750
Iglič and A Iglič Biophys J 2008 95 4416ndash4425 751
4 A Rustom R Saffrich I Markovic P Walther and H-H Gerdes Science (80- ) 752
2004 303 1007ndash1010 753
5 M I Angelova S Soleacuteau P Meacuteleacuteard F Faucon and P Bothorel Prog Colloid 754
Polym Sci 1992 89 127ndash131 755
6 L Mathivet S Cribier and P F Devaux Biophys J 1996 70 1112ndash1121 756
7 V Kralj-Iglič G Gomišček J Majhenc V Arrigler and S Svetina Colloids Surfaces 757
A Physicochem Eng Asp 2001 181 315ndash318 758
30
8 V Kralj-Iglič A Iglič G Gomišček F Sevšek V Arrigler and H Haumlgerstrand J 759
Phys A Math Gen 2002 35 1533ndash1549 760
9 M Drab D Stopar V Kralj-Iglič and A Iglič Cells 2019 8 626 761
10 A Zidovska K K Ewert J Quispe B Carragher C S Potter and C R Safinya 762
Langmuir 2009 25 2979ndash2985 763
11 A Zidovska K K Ewert J Quispe B Carragher C S Potter and C R Safinya Soft 764
Matter 2011 7 8363ndash8369 765
12 A Zidovska K K Ewert J Quispe B Carragher C S Potter and C R Safinya 766
Biochim Biophys Acta - Biomembr 2009 1788 1869ndash1876 767
13 M Karlsson K Sott M Davidson A S Cans P Linderholm D Chiu and O Orwar 768
Proc Natl Acad Sci U S A 2002 99 11573ndash11578 769
14 A Karlsson R Karlsson M Karlsson A-S Cans A Stromberg F Ryttsen and O 770
Orwar Nature 2001 409 150ndash152 771
15 M Karlsson K Sott A S Cans A Karlsson R Karlsson and O Orwar Langmuir 772
2001 17 6754ndash6758 773
16 E Evans H Bowman A Leung D Needham and D Tirrell Science (80- ) 1996 774
273 933ndash935 775
17 U Seifert Configurations of fluid membranes and vesicles 1997 vol 46 776
18 J Kaumls and E Sackmann Biophys J 1991 60 825ndash844 777
19 N Bobrovska W Goacuteźdź V Kralj-Iglič and A Iglič PLoS One 2013 8 e73941 778
20 A Iglič B Babnik K Bohinc M Fošnarič H Haumlgerstrand and V Kralj-Iglič J 779
Biomech 2007 40 579ndash585 780
21 K Bohinc T Slivnik A Iglič M Brumen and V Kralj-Iglič J Phys Chem C 2007 781
111 9709ndash9718 782
22 A Iglič H Haumlgerstrand P Veranič A Plemenitaš and V Kralj-Iglič J Theor Biol 783
2006 240 368ndash373 784
23 V Kralj-Iglič and P Veranič Adv Planar Lipid Bilayers Liposomes 2006 5 129ndash785
149 786
24 A Iglic and V Kralj-Iglic Adv Planar Lipid Bilayers Liposomes 2006 4 253ndash279 787
25 S Penič L Mesarec M Fošnarič L Mroacutewczyńska H Haumlgerstrand V Kralj-Iglič and 788
A Iglič Front Phys 2020 8 342 789
26 P Yager and P E Schoen Mol Cryst Liq Cryst 1984 106 371ndash381 790
27 T G Barclay K Constantopoulos and J Matisons Chem Rev 2014 114 10217ndash791
10291 792
31
28 B Božič G Gomišček V Kralj-Iglič S Svetina and B Žekš Eur Biophys J 2002 793
31 487ndash496 794
29 A Iglič H Haumlgerstrand M Bobrowska-Haumlgerstrand V Arrigler and V Kralj-Iglič 795
Phys Lett A 2003 310 493ndash497 796
30 R Bar-Ziv and E Moses Phys Rev Lett 1994 73 1392ndash1395 797
31 S Chiruvolu H E Warriner E Naranjo S H Idziak J O Raumldler R J Plano J A 798
Zasadzinski and C R Safinya Science (80- ) 1994 266 1222ndash1225 799
32 V Kralj-Iglič A Iglič H Haumlgerstrand and P Peterlin Phys Rev E 2000 61 4230ndash800
4234 801
33 L Mesarec M Drab S Penič V Kralj-Iglič and A Iglič Int J Mol Sci 2021 22 802
2348 803
34 L Van Renterghem S L K W Roelants N Baccile K Uyttersprot M C Taelman 804
B Everaert S Mincke S Ledegen S Debrouwer K Scholtens C V Stevens W 805
Soetaert L Van Renterghem S L K W Roelants N Baccile K Uytersprot M C 806
Taelman B Everaert S Mincke S Ledegen S Debrouwer K Scholtens C V 807
Stevens and W Soetaert Biotechnol Bioeng 2018 115 1195ndash1206 808
35 J Clark and F Deswarte Introduction to Chemicals from Biomass Second Edition 809
John Wiley amp Sons 2015 810
36 K V Sajna R Houmlfer R K Sukumaran L D Gottumukkala and A Pandey in 811
Industrial Biorefineries and White Biotechnology eds A Pandey R Houmlfer M 812
Taherzadeh K M Nampoothiri and C Larroche Amsterdam Oxford Waltham 813
Elsevier 2015 pp 499ndash521 814
37 R Marchant and I M Banat Trends Biotechnol 2012 30 558ndash565 815
38 K Hill and C LeHen-Ferrenbach in Sugar-Based Surfactants Fundamentals and 816
Applications ed C C Ruiz Boca Raton CRC Press 2009 pp 1ndash20 817
39 L Rodrigues I M Banat J Teixeira and R Oliveira J Antimicrob Chemother 818
2006 57 609ndash618 819
40 J D Desai and I M Banat Microbiol Mol Biol Rev 1997 61 47ndash64 820
41 S L K W Roelants K Ciesielska S L De Maeseneire H Moens B Everaert S 821
Verweire Q Denon B Vanlerberghe I N A Van Bogaert P Van der Meeren B 822
Devreese and W Soetaert Biotechnol Bioeng 2016 113 550ndash559 823
42 N Baccile M Selmane P Le Griel S Preacutevost J Perez C V Stevens E Delbeke S 824
Zibek M Guenther W Soetaert I N A Van Bogaert and S Roelants Langmuir 825
2016 32 6343ndash6359 826
32
43 N Baccile A-S Cuvier S Preacutevost C V Stevens E Delbeke J Berton W Soetaert 827
I N A Van Bogaert and S Roelants Langmuir 2016 32 10881ndash10894 828
44 N Baccile C Seyrig A Poirier S A Castro S L K W Roelants and S Abel Green 829
Chem 2021 23 3842ndash3944 830
45 A Salis L Cappai C Carucci D F Parsons and M Monduzzi J Phys Chem Lett 831
2020 11 6805ndash6811 832
46 J Schindelin I Arganda-Carreras E Frise V Kaynig M Longair T Pietzsch S 833
Preibisch C Rueden S Saalfeld B Schmid J-Y Tinevez D J White V 834
Hartenstein K Eliceiri P Tomancak and A Cardona Nat Methods 2012 9 676ndash835
682 836
47 T Parasassi and E Gratton J Fluoresc 1995 5 59ndash69 837
48 M M Dodes Traian F L Gonzaacutelez Flecha and V Levi J Lipid Res 2012 53 609ndash838
616 839
49 D M Owen C Rentero A Magenau A Abu-Siniyeh and K Gaus Nat Protoc 840
2012 7 24ndash35 841
50 W Stillwell in An Introduction to Biological Membranes Academic Press 2016 pp 842
135ndash180 843
51 W Stillwell in An Introduction to Biological Membranes Academic Press 2016 pp 844
181ndash220 845
52 B Tenchov Chem Phys Lipids 1991 57 165ndash177 846
53 R Koynova and M Caffrey Biochim Biophys Acta 1998 1376 91ndash145 847
54 F Schmid S Dolezel O Lenz and S Meinhardt J Phys Conf Ser 2014 487 848
012004 849
55 S Meinhardt R L C Vink and F Schmid Proc Natl Acad Sci U S A 2013 110 850
4476ndash4481 851
56 O Glatter and O Kratky Small Angle X-ray Scattering Academic Press London 852
1982 853
57 B A Cunningham A D Brown D H Wolfe W P Williams and A Brain Phys 854
Rev E 1998 58 3662ndash3672 855
58 M Nadler A Steiner T Dvir O Szekely P Szekely A Ginsburg R Asor R Resh 856
C Tamburu M Peres and U Raviv Soft Matter 2011 7 1512ndash1523 857
59 C Tanford The hydrophobic effect Formation of micelles and biological membranes 858
John Wiley amp Sons Inc New York 1973 859
60 M Masuda and T Shimizu Langmuir 2004 20 5969ndash5977 860
33
61 A Zidovska K K Ewert J Quispe B Carragher C S Potter and C R Safinya 861
Block Liposomes Vesicles of Charged Lipids with Distinctly Shaped Nanoscale 862
Sphere- Pear- Tube- or Rod-Segments Elsevier Inc 1st edn 2009 vol 465 863
62 A Iglic V Kralj-Iglic B Božič M Bobrowska-Haumlgerstrand B Isomaa and H 864
Haumlgerstrand Bioelectrochemistry 2000 52 203ndash211 865
63 T Shimizu M Masuda and H Minamikawa Chem Rev 2005 105 1401ndash1444 866
64 J V Selinger and J M Schnur Phys Rev Lett 1993 71 4091ndash4094 867
65 J M Schnur Science (80- ) 1993 262 1669ndash1676 868
66 B Tenchov R Koynova and G Rapp Biophys J 2001 80 1873ndash1890 869
67 R Koynova and B Tenchov Ser Biomech 2017 31 3ndash19 870
68 S J Angyal and R Le Fur Carbohydr Res 1984 126 15ndash26 871
69 J K Whitesell and M A Minton J Am Chem Soc 1987 109 225ndash228 872
70 T Takayama S Ando and I Ando J Mol Struct 1990 220 245ndash250 873
71 K Gawrisch N V Eldho and I V Polozov Chem Phys Lipids 2002 116 135ndash151 874
72 F Tielens C Gervais J F Lambert F Mauri and D Costa Chem Mater 2008 20 875
3336ndash3344 876
73 G A Jeffrey and Y Yeon Acta Crystallogr Sect B 1986 42 410ndash413 877
74 B Berglund and R W Vaughan J Chem Phys 1980 73 2037ndash2043 878
75 C Gervais C Coelho T Azaiumls J Maquet G Laurent F Pourpoint C Bonhomme 879
P Florian B Alonso G Guerrero P H Mutin and F Mauri J Magn Reson 2007 880
187 131ndash140 881
76 C Akita T Kawaguchi F Kaneko H Yamamoto and M Suzuki J Phys Chem B 882
2004 108 4862ndash4868 883
77 R N Purusottam L Seacutenicourt J J Lacapegravere and P Tekely Biochim Biophys Acta - 884
Biomembr 2015 1848 3134ndash3139 885
78 X Biarneacutes A Ardegravevol A Planas C Rovira A Laio and M Parrinello J Am Chem 886
Soc 2007 129 10686ndash10693 887
79 L M J Kroon‐Batenburg and J Kroon Biopolymers 1990 29 1243ndash1248 888
80 K N Kirschner and R J Woods Proc Natl Acad Sci U S A 2001 98 10541ndash889
10545 890
81 S Svenson B Kirste and J H Fuhrhop J Am Chem Soc 1994 116 11969ndash11975 891
82 I Sack S Macholl J H Fuhrhop and G Buntkowsky Phys Chem Chem Phys 892
2000 2 1781ndash1788 893
83 S Svenson J Koening and J H Fuhrhop J Phys Chem 1994 98 1022ndash1028 894
34
84 S Svenson A Schaefer and J H Fuhrhop J Chem Soc Perkin Trans 2 1994 2 895
1023ndash1028 896
85 K Bock and C Pedersen Adv Carbohydr Chem Biochem 1983 41 27ndash66 897
86 T B Grindley Structure and Conformation of Carbohydrates Springer Berlin 898
Heidelberg 2008 899
87 F Tantakitti J Boekhoven X Wang R V Kazantsev T Yu J Li E Zhuang R 900
Zandi J H Ortony C J Newcomb L C Palmer G S Shekhawat M O De La 901
Cruz G C Schatz and S I Stupp Nat Mater 2016 15 469ndash476 902
903
1
Supporting Information 904
905
Topological connection between vesicles and nanotubes in single-906
component lipid membranes driven by head-tail interactions 907
908
Niki Baccilea Ceacutedric Lorthioira Abdoul Aziz Baa Patrick Le Griela Cristina Coelhob Javier 909
Perezc Wim Soetaertd Sophie L K W Roelantsd 910
911
a Sorbonne Universiteacute Centre National de la Recherche Scientifique Laboratoire de Chimie de 912
la Matiegravere Condenseacutee de Paris LCMCP F-75005 Paris France 913
b Institut des Mateacuteriaux de Paris Centre Sorbonne Universiteacute Paris France 914
c Synchrotron Soleil LrsquoOrme des Merisiers Saint-Aubin BP48 91192 Gif-sur-Yvette Cedex 915
France 916
d InBio Department of Biotechnology Ghent University Ghent Belgium 917
918
919
Corresponding author 920
Dr Niki Baccile 921
E-mail address nikibaccilesorbonne-universitefr 922
Phone +33 1 44 27 56 77 923
924
925
926
2
a) 927
Parameter Method
Dry Matter (DM ) 996 Infrared balance 105degC
Glucose () 012 HPLC-Metacarb
Glycerol () nd HPLC-Metacarb
Free Fatty Acid content () lt001 Internal method BBEPP
GC with FID Detector
Oil () lt001 Internal method BBEPP
GC with FID Detector
Moulds (CFUg) lt10 3M-Nordval ndeg16 B
Yeasts (CFUg) lt10 3M-Nordval ndeg16 B
Anaerobic count (CFUg) lt10 SP-VG M005 B
Protein () tbd BCA protein assay
928
Figure S 1 - a) HPLC-ELSD chromatogram and composition table 929
930
931
932
933
3
b) 934
935
Group Ndeg δ ppm
CH2 1 354
CH2 2 153
CH2 3-712-14 132
CH2 811 203
CH 910 534
CH2 15 162
CH2 16 388
CH 1 424
CH 2 316
CH 3 334
CH 4 329
CH 5 354
CH2 6 366
Figure S 1 (next) ndash b) 1H NMR spectrum (MeOD-d4) recorded on the purified G-C181-OH compounds 936
and related assignment 937
938
2
811910 1rsquo
5rsquo1
3rsquo4rsquo
1rsquo1910
asymp asymp asympHDO MeOD Acetone
6rsquo2rsquo
1615
3-712-14
4
939
940
Figure S 2 ndash Cryo-TEM images recorded for a 5 mgmL G-C181-OH aqueous solution heat at T= 130degC 941
5
942
943
Figure S 3 - Cryo-TEM images recorded for a 5 mgmL G-C181-OH aqueous solution heat at T= 90degC 944
945
90degC
1
22
6
946
947
948
949
Figure S 4 ndash Cryo-TEM images recorded for a 5 mgmL G-C181-OH aqueous solution heat at T= 70degC 950
951
21
11
1
2
5
3
4
45
5
6
7
7
7
952
953
954
Figure S 5 ndash Cryo-TEM images recorded for a 5 mgmL G-C181-OH aqueous solution heat at T= 25degC 955
956
957
1
1 1
8
958
Figure S 6 ndash a) SANS experiment recorded at 90degC for a 5 mgmL G-C181-OH aqueous solution b-c) 959
WAXS experiments recorded on aqueous solutions of G-C181-OH at b) 5 mgmL and c) 25 mgmL d) 960
Structural interpretation of the repeating distances pointed out in c) 961
962
963
964
001 01 1
q Aring-1
25degC
68degC
88degC
111degC
01 1q Aring
-1
02 04 06 08 1q Aring
-1
001 01
10-1
100
101
Inte
nsity
cm
-1
q Aring-1
-2
T= 90degC
SANS WAXS WAXS
a) b) c)
dv
dL d= 144 Aring-1
di
ddH2O
dt
dvdL
dtdi d
d)
9
965
966
Figure S 7 ndash ssNMR MAS (10 kHz) experiments recorded on a G-C181-OH dry powder a) 1H spectra 967
recorded from 110degC to 70degC b) 13C single pulse (SP) spectra recorded with high power 1H decoupling from 968
110degC to 70degC c) 13C cross polarization (CP) spectra recorded at 110degC and contact time tc of 50 micros and 969
3000 micros d) 13C CP spectra recorded at 70degC and for 20 lt tc micros lt 3000 970
971
1
811
910
CH2 CH2
1rsquo
6rsquo
8 6 4 2 0 ppm
110
90
80
70
910
1rsquo
6rsquo16
1
2rsquo3rsquo4rsquo
811
OH
45 40 35 30 25 20 15
ppm
200 180 160 140 120 100 80 60 40 20 0
ppm140 120 100 80
ppm
CH2-gauche
3004
110
90
80
70
65
60
50
25
C91013003
C9 - 12869
CH2-all-trans
3198
C1rsquo10335
a) b)
1H
T degCT degC
13C Single Pulse MAS
A
B
A
B
70degC70degC
5rsquo
215
200 180 160 140 120 100 80 60 40 20 0
ppm
13C CPMAST= 110degC
200 180 160 140 120 100 80 60 40 20 0
ppm
132 131 130 129 128 127 126
ppm
106 105 104 103 102
ppm
13C CPMAST= 70degC
50
tc micros
3000
20
tc micros
50 500 1000 3000
tc micros
C102
13024 C910113003
C92
12869
C1rsquo213082
C1rsquo110443
A B
106 105 104 103 102
ppm
3000
1000
500
50
20
AB
c)
d)
10
972
Figure S 8 ndash a) Short and d) long T2 components displayed by the 1H transverse relaxation signal c) 1H 973
transverse relaxation signals recorded on a G-C181-OH dry powder from 110degC to 70degC The area of each 974
given resonance is plotted (log-lin) as a function of the echo time (CPMG pulse sequence) for each 975
temperature and fitted using the equation given above T2s and T2l indicate the short and long T2 relaxation 976
times respectively obtained by describing the 1H transverse relaxation signal using a biexponential decay 977
For H1rsquo H5rsquo and H6rsquo the 1H relaxation function could be described by a monoexponential decay 978
- Protons from the sugar group (H1rsquo H5rsquo H6rsquo) show a single T2 relaxation component (Figure 979
6c and Figure S 8) while protons of the acyl chain (CH2 H910 H811) show both short (Figure 980
6c) and long (Figure 6d) T2 relaxation component 981
- The short T2 relaxation time systematically decreases from 110degC to 70degC for all species by a 982
factor ranging from two to seven depending on the specific chemical group Very long T2 are 983
observed at 110degC for all acyl species while nearly unchanged values are measured below 984
90degC without any clear trend 985
- The sugar protons (H1rsquo H5rsquo H6rsquo) have the shortest set of T2 values (lt 1 ms) below 100degC 986
The long component of T2 generally ranges between 4 ms and 12 ms 987
0 1 2 3 4 5 6 7 8
00
05
10
15
20
25
30
35
40
45
Log
In
ten
sity
Time ms
0 1 2 3 4 5 6 7 8
00
05
10
15
20
25
30
35
40
45
Log
In
ten
sity
Time ms
0 1000 2000 3000 4000 5000 6000 7000 8000
00
05
10
15
20
25
30
35
40
45
Log
In
ten
sity
Time ms
0 1000 2000 3000 4000 5000 6000 7000 8000
00
05
10
15
20
25
30
35
40
45
Log
In
ten
sity
Time ms
0 1000 2000 3000 4000 5000 6000 7000 8000
00
05
10
15
20
25
30
35
40
45
Log
In
ten
sity
Time ms
0 1000 2000 3000 4000 5000 6000 7000 8000
00
05
10
15
20
25
30
35
40
45
Log
In
ten
sity
Time ms
H1
H8H11
H9H10
CH2
H1rsquo
H6rsquo
CH2
H910H811 H1CH2
H1rsquo H5rsquo6rsquo
0 1000 2000 3000 4000 5000 6000 7000 8000
00
05
10
15
20
25
30
35
40
45
Log
In
ten
sity
Time ms
OH
0 1000 2000 3000 4000 5000 6000 7000 8000
00
05
10
15
20
25
30
35
40
45 T= 110degC
T= 90degC
T= 80degC
T= 70degC
Log
In
ten
sity
Time ms
Fit
)
CH2 H910 H811 H1 H56 H1 OH
00
05
10
15
20
25
30
35
40
T2 m
s
T= 110degC
T= 90degC
T= 80degC
T= 70degC
CH2 H910 H811 H1
0
2
4
6
8
10
12
T2 m
s
T= 110degC
T= 90degC
T= 80degC
T= 70degC
Short T2(1H) Long T2(1H)
a) b)
c)
11
Table S 1 ndash 1H chemical shifts of G-C181-OH in solution and in the solid-state Solid-state spectra are 988
recorded at a MAS frequency of 10 kHz in DMSO-d6 broad peak 989
990
δH ppm
Group Ndeg Liquid
(MeOD-d4) Solid
(T= 110degC) Solid
(T= 70degC)
CH2 H1 354 357
CH2 H2 153 156
CH2 H3-712-14 132 135
CH2 H811 203 203
CH H910 534 534
CH2 H15 162 164
CH2 H16 388 383
CH H1 424 432
CH H2 316 335
CH H3 334 335
CH H4 329 335
CH H5 354 351 357
CH2 H6 366 383
OH OH1 432
45 463
OH OH2 492
OH OH3 490
OH OH4 487
OH OH6 445
991
992
H1H9H10H1rsquo
H6rsquo
OH2rsquo
OH1
12
Detailed discussion about the NOESY and DQ-SQ 2D 1H-1H ssNMR experiments presented in 993
Figure 9 994
995
2D 1H-1H ssNMR experiments are a unique tool to explore through-space proximities 996
between 1H nuclei ssNMR offers a large number of possibilities each adapted to a given 997
system The advantage of 2D maps with respect to a dynamics approach is their direct 998
readability in clear two nuclei which exchange their magnetization through-space (whichever 999
mechanism may be responsible for this exchange) will display a specific cross-peak However 1000
the way cross-peaks are presented and interpreted strictly depends on the nature of the pulse 1001
program which in turn is chosen according to the physical nature of the sample 1002
1D temperature-dependent 1H NMR experiments performed on G-C181-OH (Figure 1003
4a in the main text) indicate sharp peaks at 90degC and broad peaks at 70degC Narrow peaks 1004
indicate fast andor large-amplitude molecular tumbling averaging the strong 1H-1H dipolar 1005
interactions This excludes the use of pulse sequences like DQ-SQ which is not efficient under 1006
these conditions For this reason we employ spin-diffusion-based pulse sequences like 1007
NOESY which is more adapted for samples with high molecular mobility When mixing times 1008
are chosen to be short (lt 1 s) one generally explores through-space proximities within about 5 1009
10 Aring On the contrary when molecular motions are restricted dipolar coupling becomes 1010
significant 1H NMR peaks are broader and pulse sequences like DQ-SQ can now be used 1011
with a spatial resolution of less than 5 Aring 1012
Whenever possible DQ-SQ experiments are preferred over spin diffusion-based pulse 1013
sequences because they are more selective in particular for likewise interactions which are 1014
not discriminated in NOESY-type experiments This is illustrated by the typical interaction 1015
schemes for NOESY (top Figure 9a) and DQ-SQ (top Figure 9b) For two given A and B 1016
protons 2D NOESY maps will display two on-diagonal and two square-shaped symmetrical 1017
off-diagonal cross-peaks Off-diagonal cross-peaks illustrate the mutual A-B and B-A 1018
interaction but the on-diagonal peaks are systematic and do not prove any A-A or B-B 1019
interaction Similarly to NOESY 2D DQ-SQ maps display off-diagonal peaks (symmetric 1020
across the diagonal top Figure 9b) upon A-B and B-A interaction but in contrast they will 1021
display on-diagonal peaks only in the presence of self-interaction In the tutorial example of 1022
Figure 9b top the on-diagonal A-A peak indicates mutual A-A interaction while lack of on-1023
diagonal B-B peak evidences the absence of B-B proximities Combining NOESY and DQ-SQ 1024
experiments is capital to study the local arrangement of G-C181-OH and its evolution with 1025
temperature 1026
13
At T= 90degC the H1 and H5rsquo contributions are very close but possible to discriminate 1027
them (δ(H1)= 354 ppm δ(H5rsquo)= 351 ppm) according to 1H NMR chemical shifts in Table S 1028
1 2D 1H-1H NOESY in Figure 9a also discriminates between the two components attributed 1029
on the basis of the interactions with their mutual neighbors (green H1-H2 and H5rsquo-H1rsquo squares 1030
in Figure 9a) On this basis 2D NOESY does not show a direct H1rsquo-H1 correlation (blue red-1031
crossed) but rather an extensive network of intra-sugar interactions These features exclude 1032
suggest intra- and inter-sugar interactions and they exclude head-tail arrangements as a major 1033
molecular configuration at 90degC 1034
At 70degC the 1H NMR peaks are broader indicating a reduction of the T2 (1H) relaxation 1035
times andor residual homonuclear dipolar interactions excluding the use of NOESY In this 1036
case 1H-1H DQ-SQ correlation experiments are best suited Figure 9b presents the 1H-1H DQ-1037
SQ experiment on G-C181-OH at 70degC Peaks are broader than in NOESY and attribution may 1038
be cumbersome However the experiment is performed at 700 MHz and MAS= 22 kHz which 1039
improves spectral resolution with respect to the same experiment performed at 300 MHz and 1040
MAS= 10 kHz The auto-peak at δH= 356 ppm in the SQ dimension is attributed to H1-H1 spin 1041
pairs mainly resulting from intra CH2 interaction while the DQ cross-peaks at δH= 156-356 1042
ppm and δH= 432-356 ppm respectively origin from H2-H1 and H1rsquo-H1 interactions (Figure 1043
9b) DQ-SQ map does not show any auto-peak corresponding to H1rsquo-H1rsquo or Hxrsquo-Hxrsquo (x= 2rsquo 1044
3rsquo 4rsquo) interactions (red-crossed blue Figure 9b) thus excluding any proximity (lt 5 Aring) between 1045
close glucose neighbors On the contrary DQ-SQ maps (recorded both at 700 MHz Figure 9b 1046
or at 300 MHz not shown) systematically show DQ cross-peaks which can only be attributed 1047
to H1rsquo-H1 interactions (δH= 432-356) The presence of these H1rsquo-H1 interactions can only be 1048
explained by a head-tail arrangement of the G-C181-OH molecules as illustrated below the 1049
DQ-SQ map in Figure 9b 1050

7
Fluorescence microscopy Images were recorded using a 40x objective on a Leica SP5 upright 184
confocal microscope with 405 nm laser excitation The sample was marked with 6-dodecanoyl-185
NN-dimethyl-2-naphthylamine (Laurdan Mw= 35354 gmol-1) fluorophore as follows A 186
stock solution of 3 mg of Laurdan in 100 microL of acetone was initially prepared (C= 30 mgmL-187
1) A volume of 028 microL of the stock Laurdan solution was diluted in 1 mL of a 5 mgmL-1 G-188
C181-OH water solution temporary set at 110degC in a sealed Eppendorf The latter was 189
important so to enhance inclusion of Laurdan in the membrane constituted by the glucolipid 190
while in its vesicle phase The final Laurdan concentration was approximately 24 micromol with a 191
molar Laurdan-to-G-C181-OH molar ratio of approximately 1-to-500 Fluorophore-to-lipid 192
ratios above 1200 were generally considered as non-interfering with the lipid phase behavior 193
as also verified in this work 194
Laurdan can be excited between 365 nm and 410 nm and its emission wavelength can 195
vary according to the rigidity of the membrane intercalation within a rigid or flexible 196
membrane generates emissions at 440 nm or 490 nm respectively47 In the present experiment 197
we have flame-sealed a solution of G-C181-OH at 5 mgmL-1 containing Laurdan (1-to-500 in 198
lipid-to-Laurdan ratio) in flat optical capillaries of 01 mm thickness Capillaries were set on a 199
Linkam support for temperature control eventually placed under the microscope The sample 200
was excited at 405 nm and detection was made in spectral mode with a 5 nm window sliding 201
every 5 nm from 412 nm to 602 nm in 16 bits which allows quantify the signal and compare 202
the different conditions Quantitative analysis was performed according to the literature4849 203
several ROI (range of interest) have been drawn on several images using the ROI manager of 204
Fiji (is just ImageJ) software The integrated intensity of each ROI at 440 nm and 490 nm was 205
eventually recorded and used to calculate the value of the generalized polarization GP as 206
follows of 207
119866119875 =(120582440 minus 120582490)
120582440 + 120582490 208
A negative GP indicates a flexible membrane while a positive GP indicates a rigid membrane 209
210
Solid-state Nuclear Magnetic Resonance (ssNMR) 1H and 13C ssNMR experiments have been 211
performed using an Avance III HD Bruker 705 T (ν1H= 300 MHz) spectrometer and a 4 mm 212
magic angle spinning (MAS) probe except for the BAck-to-BAck (BABA) experiment which 213
was performed on an Avance III Bruker 1644 T (ν1H= 700 MHz) spectrometer equipped with 214
25 mm MAS probe Temperature was controlled through a Smart cooler BCUIIa BCU-xtreme 215
unit using 10 min of equilibration time after each temperature variation Temperature was 216
8
always varied from high (110degC) to low (70degC) before analysis Due to combined use of fast 217
MAS rates necessary to achieve high resolution spectra and heating close to the boiling point 218
of water neither diluted nor concentrated samples could be used for ssNMR experiments All 219
tests employing up to 50 wt G-C181-OH in water resulted in sample centrifugation drying 220
but also expulsion from the rotor causing sudden stop of rotor spinning For these reasons all 221
attempts to study hydrated G-C181-OH failed and only the dry powder could be analyzed The 222
dry sample powder was analyzed as such in zirconia rotors (4 mm or 25 mm) spinning at MAS= 223
10 kHz (4 mm) or 22 kHz (25 mm) and Chemical shifts were calibrated with respect to 224
adamantane (13C 13C(CH2)= 3848 ppm = 191 ppm) and glycine alpha (13C(CO)= 17603 225
ppm) Details on the acquisition parameters are given in the Supporting Information 226
227
Results and discussion 228
Topologically-connected nanotubes and vesicles 229
G-C181-OH is a biobased glucolipid water-insoluble at room temperature and of 230
which the physicochemical properties are poorly known The DSC thermogram performed at 231
10degCmin of G-C181-OH as a function of the water content (Figure 2a) shows two endothermic 232
peaks on the dry powder (996 wt glucolipid) They are attributed to two melting phenomena 233
occurring at the following temperatures Tm 483degC (Tm1) and 957degC (Tm2) the enthalpy of the 234
former being lower than that of the latter Interestingly DSC also shows that Tm1 is hydration 235
independent and reversible (the associated exothermic peak is systematically observed) while 236
the transition at Tm2 is simply suppressed (here tested up to 130degC) on hydrated powders and 237
never observed on the cooling profile even at slow cooling rates (1degCmin) The thermogram 238
recorded on the dry powder is typical of single-component lipids having an intermediate50 239
metastable phase (often referred to the ripple phase Pβ´ in reference to the periodic undulation 240
of the bilayer)50ndash54 between the classical lamellar gel (Lβ) and liquid crystalline (Lα) phases50ndash241
54 and characterized by regions of both liquid order and disorder5455 The effect of water does 242
not influence the low-temperature crystallization at Tm1 but it contributes to disrupt the ordered 243
array of hydrocarbon chains in the metastable phase 244
On the basis of the DSC thermogram the aqueous phase behavior of G-C181-OH under 245
diluted conditions (5 mgmL-1) was studied at four different temperatures (red marks on Figure 246
2a) below and above Tm1 but also between Tm1 and Tm2 corresponding to the thermogram of 247
the dry powder 248
9
249
Figure 2 ndash a) DSC thermogram of G-C181-OH under dry (04 wt water estimated by thermogravimetric 250
analysis) and hydrated conditions recorded at a heating rate of 10degCmin Red marks indicate the 251
temperatures at which cryo-TEM experiments are performed on the corresponding 5 mgmL aqueous 252
solutions b) Cryo-TEM images recorded for a 5 mgmL G-C181-OH aqueous solution heat at T= 130degC 253
90degC 70degC and 25degC T indicates the temperature of the sample solution before cryofixation Tne T T 254
being the temperature of the sample upon plunging in liquid ethane Please refer to the materials and 255
methods section for more information 256
T= 130degC
T= 90degC
T= 70degC
T= 25degC
a)
b)
20 40 60 80 100 120
99 wt
50 wt
25 wt
T degC
En
do
10 wt
Tm1= 483 degC
Tm2= 957 degC
10
257
The series of cryo-TEM images in Figure 2b show an overview of the most relevant 258
structures observed on G-C181-OH solution from T= 130degC to T= 25degC whereas T is 259
indicative of the equilibrium temperature before cryofixation (refer to materials and methods 260
section for more information on the sense and interpretation of T) At Tgt 100degC the sample 261
is essentially composed of polydisperse single wall vesicles massively shown by the 262
complementary pictures presented in Figure S 2 In between Tm1 and Tm2 at T= 90degC and T= 263
70degC (Figure 2b Figure 3 Figure 4 complemented by Figure S 3 and Figure S 4) vesicles are 264
connected by nanotubes At Tlt Tm1 flat crystals are otherwise observed (Figure 2b and Figure 265
S 5) 266
267
268
Figure 3 ndash Cryo-TEM images recorded for a 5 mgmL G-C181-OH aqueous solution heat at T= 90degC 269
270
A deeper insight at T= 90degC is given in Figure 3 (more images are provided in Figure 271
S 3) Arrows 1 through 6 mark very clearly the typical continuity in the glucolipid membrane 272
between the vesicle and nanotubes Arrow Ndeg 7 shows that a single nanotube connects the outer 273
membrane of two vesicles several hundred nanometers apart The connection is shown by 274
2
34
5
6
6
1
5
7
A
B
D
C
0 10 20 30 40 50 60
BIn
tensity
au
Profile nm
A
0 10 20 30 40 50 60
Inte
nsity
au
Profile nm
C
D
T= 90degC
11
arrows Ndeg5 and Ndeg6 The corresponding profiles A through D confirm the tubular nature of 275
the elongated objects Profiles B and D are both characterized by typical symmetrical thick 276
walls (low intensity depths highlighted by shaded rectangles) surrounding a hollow region (high 277
intensity peak between the shaded rectangles) The wall thickness varies between 35 and 40 278
nm for profile B and between 41 and 61 nm for profile D while the total nanotube diameter 279
varies between 14 nm at B and 20 nm at D At the same time the thickness of the vesicle wall 280
is about 6 nm at A and 135 nm at C Considerations about the bilayer or interdigitated structure 281
of the membrane will be presented below 282
The connection between nanotubes and vesicles seems to be multiple For instance 283
arrow Ndeg1 (Figure S 3) and Ndeg4 (Figure 3) show a single-wall vesicle of which the membrane 284
is extruded into a nanotube Similarly a closer look at arrows Ndeg1 2 and 3 in Figure 3 show 285
that the vesicle is single-wall and fully closed while the nanotube nucleates at the vesicle outer 286
surface with no apparent topological continuity In many regions of the sample at T= 90degC 287
one can find exvaginations or buds232531 in the nanotube wall This is shown for instance by 288
arrows Ndeg7 and particularly put in evidence in Figure 4 by arrows Ndeg1 through Ndeg4 where the 289
amplitude of the oscillation varies between 20-25 nm (arrow Ndeg1) and 6-8 nm (arrows Ndeg3-4) 290
291
Figure 4 - Cryo-TEM images recorded for a 5 mgmL G-C181-OH aqueous solution heated at T= 90degC 292
293
Still between Tm2 and Tm1 but at lower temperature (T= 70degC) the nanotubes seem to 294
vary from single threads (arrow Ndeg1 Figure S 4) to nanotubes of diameter below 15 nm both 295
connecting nanotubes of diameter ranging between 50 nm and 100 nm (arrows Ndeg2 Figure S 296
4) The larger tubes are most likely formed by the inflation and flattening of the nanotubes 297
probably after assimilation of surrounding vesicles and fusion of the exvagination discussed 298
above The transition between vesicles tubes and flat membranes is certainly more accentuated 299
Arrow Ndeg3 in Figure S 4 shows distinct vesicles while arrow Ndeg4 identifies a flat structure 300
evidently formed from fused vesicles In particular arrow Ndeg5 points at the fusion of two 301
2
1 132
4
12
vesicles while arrow Ndeg6 points at two vesicles fusing into the flat membrane Additional areas 302
where vesicle fusion is prominent are indicated by the oscillations at the outer skirt of broad 303
lamellae and pointed by arrow Ndeg7 304
Finally below Tm1 at T= 25degC for instance mainly flat crystals with no visible 305
exvaginations or tubes are visible (Figure S 5) by cryo-TEM and the material turns into an 306
insoluble precipitate Massive presence of flat crystalline structures is also clear from the bulk 307
iridescent behavior of a G-C181-OH solution under manual shear 308
In summary despite the uncertainty related to the actual state of equilibrium of the 309
glucolipids at the moment of cryofixation cryo-TEM depicts a vesicle phase at Tgt 100degC a 310
flat lamellar phase below Tm1 and an interconnected vesicle-nanotube network between Tm1 and 311
about 100degC The combination of statistically-relevant fluorescence microscopy and 312
scatteringdiffraction experiments provides an additional proof of the coexistence of 313
vesiclenanotube systems between the two transition temperatures Please note that the 314
experiments reported below have been performed under controlled conditions of temperature 315
which is then indicated by the use of T instead of T 316
13
317
Figure 5 ndash a-c) Confocal fluorescence microscopy images recorded at 90degC and 70degC for a 5 mgmL G-318
C181-OH aqueous solution d-g) Typical fluorescence microscopy images recorded at T= 80degC using 319
Laurdan (refer to materials and methods section for more details on this fluorophore) Excitation 320
wavelength is 405 nm for all the images while emission wavelength is 490 nm in (df) and 440 nm in (eg) 321
h) Full emission spectra obtained from the integration of various fluorescence images recorded from 412 322
nm to 600 nm (step 5 nm) at 90degC 80degC and 70degC i) Box plot of GP defined as 119918119927 =(120640120786120786120782minus120640120786120791120782)
120640120786120786120782+120640120786120791120782 with 120640120786120786120782 323
and 120640120786120791120782 being the emission wavelengths at 440 nm and 490 nm at 90degC 80degC and 70degC Each data point 324
l= 490 nm l= 440 nm
l= 490 nm l= 440 nm
10 μm400 450 500 550 600
00
02
04
06
08
10
No
rma
lize
d I
nte
nsity
l nm
90degC
80degC
80degC
70degC
70degC
400 450 500 550 60000
02
04
06
08
10
No
rma
lize
d I
nte
nsity
l nm
90degC
80degC
80degC
70degC
70degC
d) e)
f) g)
h)
i)
T= 80degC
Laurdan
T= 80degC
T= 80degC T= 80degC
T= 90degC T= 70degC T= 70degC
a) b) c)
1
1
1
14
corresponds to a set of regions of interest (ROIs) (54 at 90degC 65 at 80degC and 75 at 70degC) selected in the 325
corresponding fluorescence images ROIs were representatively selected so to include the entire image but 326
also vesicles alone tubes alone and mixtures of vesicles and tubes 327
328
Figure 5ab shows two typical confocal fluorescence microscopy images recorded on a 329
G-C181-OH solution (5 mgmL) in a flame-sealed capillary heat at T= 90degC and T= 70degC 330
Although the resolution of optical microscopy is not comparable with cryo-TEM the sample is 331
broadly composed of vesicles coexisting with nanotubes whereas in some cases the nanotube 332
starts from the vesicle itself (arrow Ndeg1) in good agreement with cryo-TEM data Furthermore 333
SANS recorded at T= 90degC (Figure S 6a) shows a scattering profile with a pronounced -2 334
dependence of the scattering intensity against the wavevector q in the log-log scale This 335
indicates the massive presence of a flat interface and it is expected typical of bilayers in 336
vesicular morphologies56 However the typical signature of nanotubes cannot be observed in 337
the SANS profile and this can be explained by both an argument related to the relative lower 338
amount of nanotubes with respect to vesicles at 90degC but also to the steeper slope of flat 339
morphologies (-2) compared to tubes (-1) the signal of the former masking the tube signal at 340
low wavevector values The SANS profile is characterized by a diffraction peak at q= 0167 Aring-341
1 of which the assignment is refined by WAXS data 342
Temperature-driven WAXS experiments in Figure S 6bc (5 mgmL-1 and 25 mgmL-1 343
respectively) show a lamellar order possibly attributed to a multilamellar structure of the 344
vesicles (dv Figure S 6d) at high temperature and to the interplanar arrangement of the 345
crystalline flat structures (dL Figure S 6d) at T= 25degC The sharp (001) reflection indicates 346
typical interlamellar distance of 353 Aring at 25degC although this value varies with temperature 347
(400 Aring at 111degC 372 Aring at 88degC) thus confirming its assignment to a hydration-dependent 348
interlamellar order More intriguing is the second broader peak at q= 0403 Aring-1 (d= 156 Aring) 349
and its reflection both clearly visible at 88degC below Tm2 We attribute it to the inter-glucolipid 350
arrangement inside the tubular phase (dt Figure S 6d) coexisting with the vesicle phase 351
between Tm1 and Tm2 and to the planar lipid arrangement (di Figure S 6d) in the rigid flat 352
lamellar structure below Tm2 Its temperature- hence hydration- independent position also 353
confirms its structural origin Finally besides the water-structure peak at about 2 Aring-1 we also 354
observe a broad peak at 144 Aring-1 characteristics of the lateral packing (d Figure S 6d) of lipids 355
in bilayers While its position could be consistent with an Lα phase5758 above Tm2 its broadness 356
and positional invariance as well as the coexistence between vesicles and tubes do not allow a 357
precise assignment 358
15
Does G-C181-OH assume a bilayer or interdigitated structure the latter being the one 359
found for other similar bolaform glucolipids4243 The size of G-C181-OH can be estimated to 360
be at the most 32 Aring given by the length L of the C16 tail (L = 22 Aring from the Tanford formula 361
L= 154 + 1265 times n (n= 16)59) and the sugar (about 10 Aring)4243 However the cis conformation 362
of the C=C bond imposes a ldquokinkrdquo of 60deg in the aliphatic chain which reduces the effective 363
length of the oleic backbone to about 17 Aring for an effective total G-C181-OH length of about 364
27 Aring Cryo-TEM provides a tube thickness varying from 35 Aring to 60 Aring and a vesicle membrane 365
thickness of at least 60 Aring WAXS suggests an interlamellar thickness (membrane and water) 366
between 40 Aring and 37 Aring and an inter-lipid distance in the tube of about 16 Aring In the absence of 367
a clear form factor oscillation profile as found for similar glucolipids4243 one must 368
acknowledge that these data pledge neither in favor of fully interdigitated nor a double layer 369
structure and might suggest a tilted lipid arrangement with partial interdigitation60 370
371
13C ssNMR demonstrates that G-C181-OH can assume two coexisting head-head and 372
head-tail configurations 373
Vesicles are characterized by low positive mean and gaussian curvatures while 374
nanotubes are described by a combination of a high positive mean and zero gaussian curvatures 375
In this regard the coexistence of vesicles and nanotubes requires glucolipids to adapt 376
themselves to both environments at the same time For this reason the formation of nanotube-377
vesicle networks generally requires a specific driving force able to impose a high mean and 378
zero gaussian curvature to the membrane In many systems insertion of at least a second 379
constituent (lipid surfactant protein) in the membrane becomes a necessary internal driving 380
force for the nucleation and growth of so-called membrane inclusions from which 381
topologically-connected nanotubes can form10ndash123261 as explained by orientational ordering 382
arguments62 It has also been shown that external driving forces such as use of laser 383
ldquotweezersrdquo30 osmotic pressure6 electroformation5ndash82829 or controlled suction13ndash16 are 384
otherwise necessary as also supported by theoretical studies19 385
The bending energy of tubes is higher than that of a vesicle membrane8 due to the 386
dependence of the membrane free energy from the principal curvatures For this reason 387
isotropic (rotational symmetry along the main axis) but also anisotropic33 lipids generally 388
stabilize low-curvature shapes like flat membranes or vesicles Lipid nanotubes are also a 389
common phase formed by amphiphiles but generally for lipids with a certain complexity in 390
their molecular structures as exampled by diacetylenic derivatives of phospholipids among 391
others262763ndash65 Negative contributions to the bending energy favoring the simultaneous 392
16
presence of interconnected vesicles and tubes was shown to be driven by the presence of 393
anisotropic lipids in a membrane continuum Spontaneous deviations to the elastic theory in the 394
presence of surfactants lipids and proteins with anisotropic structures favor the formation of 395
protrusions with radius of the order of the fraction of a micron9ndash1219ndash2362 396
In the absence of both internal and external driving forces mentioned above G-C181-397
OH should behave as a standard lipid Its DSC profile (Figure 2)536667 under both hydrated and 398
dry conditions identifies a hydration-independent transition (Tm1) slightly above room 399
temperature this is followed by one main transition at higher temperature (Tm2) in the dry 400
sample50 For such a profile one expects a gel phase (Lβ) below Tm1 and a liquid crystalline 401
structure possibly in the morphology of vesicles (L4 phase) possibly above Tm1 and most likely 402
above Tm231 as experimentally found On the basis of the thermogram recorded on the dry 403
powder one may also expect a ldquoripplerdquo (Pβ) phase between Tm1 and Tm2 characterized by 404
periodic undulations of the bilayer (generally addressed to as regions with both liquid order and 405
disorder)5455 406
In the present work instead of a Lβ phase we observe flat crystals below Tm1 and a 407
vesicle-nanotube network instead of the ldquoripplerdquo phase The latter is particularly unexpected 408
because the membrane is composed of a single-component (G-C181-OH) and no anisotropic 409
external force (osmotic hydrodynamic electric) is used to pull and stabilize the tubes In 410
addition the nanotubes are observed at fairly high temperatures above Tm1 (between about 411
60degC and 90degC) while this morphology is generally favored at low temperature (proportionality 412
with 1kT figure 5 in Ref 62) commonly below a given transition temperature characteristics 413
for each specific amphiphile27 Furthermore nanotubes of G-C181-OH seem to be stable in 414
time thus differing from what is found in electroformed vesicles78 They are also observed 415
away from phase transition events (may them be at Tm1 or Tm2) as otherwise reported before 416
for a diacetylenic derivative of phosphatidylcholine26 and many other systems27 417
A stable nanotube-vesicle network for a single-component phospholipid in the absence 418
of external driving forces is not expected and has never been reported before It could be 419
explained by the coexistence of two micro-separated phases of different rigidity This 420
hypothesis is excluded by confocal microscopy on Laurdan-labelled membranes and magic 421
angle spinning (MAS) solid-state NMR (ssNMR) experiments 422
Laurdan is a well-known fluorophore used to put in evidence the coexistence of rigid 423
and fluid domains in both model and biological membranes47ndash49 Laurdan was used here to label 424
the G-C181-OH membranes between Tm1 and Tm2 and to verify the possible micro-segregation 425
and coexistence of rigid (eg Lβ λem= 440 nm) and fluid (eg Lα λem= 490 nm) domains in 426
17
tubes and vesicles respectively A set of quantitative experiments performed on a 5 mgmL-1 427
solution summarized in Figure 5 shows an excess of fluorescence at only λem= 490 nm for 428
temperature between 90degC and 70degC (Figure 5h) The GP value which quantifies the rigidfluid 429
character of the membrane is systematically negative (Figure 5i) indicating an overall fluid 430
membrane at all temperatures GP is quantified on more than 50 regions of interest (ROIs) at 431
each temperature including vesicles and tubes alone as well as connected nanotube-vesicles 432
(Figure 5d-g) The dispersion of GP at 80degC and 70degC between -08 and -02 could suggest the 433
spurious presence of membranes with various degrees of flexibility although fluidity is always 434
predominant The combination of WAXS (broad peak d= 144 Aring-1 invariant with 435
temperature Figure S 6bc) and confocal fluorescence microscopy using Laurdan confirms the 436
single-phase of the membrane composed of G-C181-OH both in vesicles and nanotubes This 437
is also consistent with the lack of phase transitions in DSC experiments between ~85degC and 438
~60degC especially in hydrated samples We conclude that the vesicle-nanotube transition is not 439
driven by the local segregation of gel phase (Lβ) microdomains nor that the nanotubes are 440
composed of such phase 441
ssNMR is the best-suited approach to investigate the origin of the local driving force for 442
the nucleation of anisotropic inclusions of which the average orientation depends on the local 443
membrane and inclusion curvatures and was shown to promote tubing62 ssNMR can provide 444
information on the local molecular mobility eg through the nuclear spin relaxation behavior 445
but also on intermolecular interactions and stereochemistry eg through variations in the 446
chemical shift68ndash70 447
Ideally ssNMR should be performed on diluted G-C181-OH samples above Tm1 448
However fast MAS necessary for high resolution centrifuges the sample As a first 449
approximation hydrated G-C181-OH samples for instance at 50 wt as classically done for 450
phospholipids71 could be studied Unfortunately permeability of the sample holder combined 451
to heating (close to the boiling point of water) and MAS provoke dehydration and even sample 452
ejection After experiencing both of the above this approach was abandoned As a second 453
approximation the study of the dehydrated G-C181-OH powder avoids centrifugation and 454
evaporation If studying dried lipids may not reflect their exact behaviour under diluted 455
conditions valuable structural information can still be obtained in dehydrated molecular 456
systems like proteins thus illustrating that this approach is not unreasonable Furthermore if 457
DSC (Figure 2a) shows that hydration suppresses the Tm2 it also shows that the value of Tm1 is 458
not affected by water at concentrations as low as 10 wt For this reason performing a 459
structural analysis of dehydrated G-C181-OH by ssNMR above Tm1 may help understanding 460
18
the local arrangement of G-C181-OH in two morphologies vesicles and nanotubes having 461
sensibly different curvatures 462
To explore the local mobility of the most relevant chemical groups of G-C181-OH 463
above Tm2 (T= 110degC) and between Tm2 and Tm1 (70 lt T degC lt 90) we combine a series of 1H 464
and 13C experiments Single-pulse (SP) MAS experiments (1H and 13C) when recorded under 465
quantitative conditions allow the detection of all chemical species while cross-polarization 466
(CP) MAS (13C only) experiments are sensitive only to constrained groups for which the 1H-467
13C dipolar coupling is not averaged to zero by the molecular motions 468
469
Figure 6 ndash a) 1H MAS (10 kHz) ssNMR spectra recorded from 110degC to 70degC b) 13C MAS (10 kHz) ssNMR 470
spectra recorded using high power decoupling single pulse (SP) and cross-polarization (CP) pulse sequences 471
Contact time for CP experiments and corresponding temperatures are given on each spectrum Full spectra 472
are given in Figure S 7 473
The most relevant 1H and 13C spectra are given in Figure 6 (full range in Figure 7 and 474
Figure S 7) As expected the 1H solid-state SPMAS spectra show broader peaks compared to 475
the solution-state NMR spectrum (Figure 6a) reflecting the obvious solid-state character of the 476
sample at any temperature The sugar group and the C=C bond resonate in the 25-6 ppm range 477
and 535 ppm respectively while the OH groups of the sugar moiety are found below 45 ppm 478
(Figure 6a full assignment in Table S 1) Very broad (~1 ppm) at 100degC the position of the 479
OH peak varies with the temperature value and becomes narrower (lt~05 ppm) and visible at 480
δH= 464 ppm at T= 70degC Line narrowing and chemical shift variations of the OH resonance 481
in ssNMR is always a direct sign of H-bonding interactions whereas the strength of the H-482
bonding hence its OHhellipH distance is correlated to a dispersion in chemical shifts72ndash75 All other 483
60 55 50 45 40 35 30 25
ppm
110
90
80
70
910
1rsquo
6rsquo16
1
OH
134 132 130 128 126
ppm110 108 106 104 102 100
ppm
SP (T= 110degC)
SP (T= 70degC)
CP 50 ms (T= 70degC)
CP 3 ms (T= 70degC)
910 1rsquo
1H 13C
1
811
910
CH2 CH2
1rsquo
6rsquo
a) b)
C102
13024
C9101
13003
C92
12869 C1rsquo210382
C1rsquo110443
C1rsquo13035
2rsquo3rsquo4rsquo
T degC
5rsquo
19
resonances broaden from 110degC to 70degC thus indicating slower andor more anisotropic 484
reorientational motions of all chemical groups The specific dynamic behaviour of the sugar 485
headgroup is also reflected by its 1H transverse relaxation time T2 whereas the shorter the T2 486
the higher the rigidity Experiments performed between 110degC and 70degC shown and 487
commented in Figure S 8 in the Supporting Information globally show a single short (lt 1 ms 488
below 100degC) T2 relaxation component for H1rsquo H5rsquo and H6rsquo and two both short and long 489
(between 4 ms and 12 ms) T2 for the acyl chain (CH2 H910 H811) even below 100degC 490
At 110degC 13C SPMAS experiments (Figure 6b full range in Figure 7 and Figure S 7 491
assignments in Table 1) show a single peak at δC= 10335 ppm for C1rsquo and at δC= 13003 ppm 492
for C910 as expected for a symmetrical conformation with two chemically-equivalent 493
carbons76 At 70degC the C1rsquo peak disappears while C910 now shows two peaks around 128 494
ppm and 130 ppm (Table 1 full temperature series in Figure S 7b) attributed to C92 (δC= 12869 495
ppm) and C10 in a non-symmetric configuration respectively for which these two carbons are 496
chemically inequivalent76 More precisely the resonance at 130 ppm is actually the 497
superposition of two close resonances C9101 (δC= 13003 ppm) and C102 (δC= 13024 ppm) 498
where subscripts 1 and 2 stand for two different conformations of the cis-olefin group as 499
reported for various phases of oleic acid in the vicinity of 0degC76 500
501
Table 1 ndash 13C Chemical shifts of G-C181-OH in solution and solid-state Solid-state experiments are 502
recorded at MAS= 10 kHz All spectra are reported in Figure 7 and Figure S 7 The contact time for cross 503
polarization is 3 ms In all ssNMR experiments temperature is first raised at 110degC and then lowered to 504
either 90degC or 70degC Attribution of the 13C resonances in Table 1 is performed on the basis of the solution 505
spectrum (Figure S 1b) Additional peaks observed in both single pulse and cross polarization ssNMR 506
experiments are attributed when possible to a configuration effect of the given atom eg C9101 and C92 507
indicate two configurations of C9 All new peaks observed in solid-state and not detected in solution are 508
highlighted in red for convenience 509
510
511
δ ppm
Peak Liquid (DMSO-d6)
Solid Single Pulse
T= 110degC
Solid Single Pulse
T= 90degC
Solid Single Pulse
T= 70degC
Solid Cross Polarization
T= 70degC
C102
- - 13024 13024
C910C9101 13009 13003 13003 13003 13003
C1C9C10C1rsquo
C6rsquo
20
C92 - - - 12869 12869
C1rsquoC11 10329 10335 10335 - 10443
C12 - - - - 10382
C3 7724 7709 7702 - 7829
- 7634 7629 - 7621
7525
C2 7388 7398 7390 7370 7370
C4 7052 7077 7054 7041 7098
C16 6900 7016 - - 7029
- - - - 6793
C1C5C6 6153 6241 6236 6239 6262
C1C5C6 6117 - - - 5956
C2 3300 3290 3290 3283 3279
CH2(trans) - - - 3198 3196
CH2(gauche)C15 2941 2981 2987 3004 -
C811 2706 2747 2747 2832 2817
CH2 2597 2625 2628 2630 2817
512
13C CPMAS spectra at 70degC (Figure 6b full range in Figure 7 and Figure S 7d) at 513
increasing contact times confirm the presence of two cis-olefin environments one for which 514
C910 are equivalent labelled here C9101 and one for which they are inequivalent labelled 515
C92 C102 Both environments are rigid enough to be observed at short contact time (tc= 50 μs) 516
A similar double environment is also observed for the sugar C1rsquo CPMAS at 70degC shows two 517
peaks (C1rsquo1 at δC= 10443 ppm C1rsquo2 at δC= 10382 ppm Figure 6b Figure S 7d) These are 518
significantly shifted downfield from the C1rsquo peak observed at 110degC and are detected at contact 519
times as short as 50 μs thus indicating their rigid character One also finds that CPMAS is 520
totally inefficient at 100degC for short contact times (50 μs) and poorly efficient even at 3 ms 521
typical of fast-tumbling molecules (Figure S 7c) also both gauche (δC= 3004 ppm) and all-522
trans (δC= 3198 ppm) conformations of the CH2 carbons coexist at 70degC (Figure S 7b)77 523
According to ssNMR one main mobile molecular environment exists at 110degC as 524
shown by the well-resolved 1H spectrum single C=C (C9101) and anomeric (C1rsquo) resonances 525
gauche conformation of the aliphatic CH2 and single T2 of the aliphatic CH2 chain and sugar 526
protons The sugar group is certainly mobile (inefficient 1H13C CPMAS) but still more 527
constrainted than the acyl chain (shorter T2 (1H)) As the temperature is lowered the overall 528
rigidity increases (broadening of 1H NMR peaks faster 1H transverse relaxation and efficient 529
1H13C magnetization transfer during CPMAS) presumably driven by H-bonding 530
interactions (downfield shift and line narrowing of the OH 1H signal very short OH T2 loss of 531
the C1rsquo signal in SPMAS) At the same time a number of spectroscopic data (two concomitant 532
21
resonances for anomeric C1rsquo1 and C1rsquo2 cis-olefin C9101 and C92 C102 and CH2 gauche and 533
all-trans environments) and relaxation behaviour (fast and slow T2 relaxation components) 534
strongly suggests the coexistence of two molecular environments Further proofs of the 535
coexistence of two distinct molecular domains are given by a number of chemical shift 536
variations in the 13C CPMAS spectrum at 70degC compared to the one at 110degC 90degC and 537
solution This is shown in Figure 7 and in the list of 13C chemical shifts in Table 1 538
539
540
Figure 7 - Comparison between solution- and solid-state 13C NMR spectra of G-C181-OH Solid-state 541
experiments are recorded directly on the sample powder at a MAS of 10 kHz (4 mm zirconia rotor) SP 542
Single Pulse CP Cross Polarization In all the ssNMR experiments temperature is first raised at 110degC 543
and then lowered to either 90degC or 70degC Segmented lines are meant to highlight the known peak position 544
in solution thus stressing the strong chemical shift variations in the solid-state 545
546
NMR experiments above Tm2 suggest that vesicles could contain G-C181-OH with a 547
single family of mobile conformations characterized by chemically-equivalent C=C (red 548
Figure 8b) and a single C1rsquo conformation (green Figure 8b) Experiments between Tm1 and Tm2 549
otherwise suggest that two coexisting conformations characterized by chemically-equivalent 550
(red Figure 8b) and inequivalent (magenta Figure 8b) C=C could be associated to nanotubes 551
Two distinct C1rsquo sites (grey Figure 8b) also indicate two configurations of the sugar headgroup 552
A comment on this point will be given in the following paragraphs 553
The local (Aring-scale) variation of molecular mobility below Tm2 drives the coexistence of 554
two distinct molecular environments of the same G-C181-OH molecule This occurs within a 555
single-phase domain (as deduced by WAXS) of equivalent membrane rigidity (as derived from 556
Laurdan probe in confocal microscopy) Although never reported before the difference in the 557
local mobility of the same amphiphile (here G-C181-OH) could satisfy the theoretically-558
140 120 100 80 60 40 20
CP(3 ms)-70degC
SP-70degC
SP-90degC
SP-110degC
ppm
LiquidC910
C1rsquo
C2rsquo
C4rsquo
C3rsquo
C1
C6rsquoC5rsquo
C1
6
C8
11
C2 C
H2
C1
5
CH
2
DM
SO
13C
22
required conditions that induce local lipid segregation and formation of membrane inclusions 559
(Figure 8c) In case of their non-zero average orientation the local membrane curvature 560
increases62 and nanotubes can spontaneously form (Figure 8bc) More intriguing this 561
mechanism occurs at least 10degC above Tm1 although it should not be favored above the Tm27 562
From both experimental and theoretical backgrounds the conditions of topologically-563
connected vesicles-nanotubes systems are met only when either internal (two components) or 564
external driving forces are applied19 In the present single-lipid system of which the phase 565
behavior is summarized in Figure 8a the most plausible driving force could be explained by 566
the NMR results collected on the dry sample G-C181-OH concomitantly occupies two 567
molecular environments characterized by 1) two distinct conformations of the sugar 568
displaying equivalent mobility and 2) two conformations of the acyl chain unsaturation 569
570
23
571
Figure 8 ndash a) Thermotropic phase behavior of G-C181-OH at 5 mgmL-1 Note that Tm2 is observed on the 572
dry powder only b) Possible relationship between the molecular environment as derived from NMR and 573
membrane curvatures All the molecular drawings refer to the same G-C181-OH molecule (bulky ellipsoid 574
equiv sugar headgroup) while each color corresponds to a given configuration Grey of C1rsquo1 and C1rsquo2 indicates 575
the uncertainty about the assignment of the specific NMR peak The curvature C is defined as 1R R being 576
the curvature radius R1 R2 radius of curvature CG Gauss curvature CM Mean curvature c) Free 577
interpretation of the anisotropic high-curvature (CMgt 0 CG= 0) inclusions in the membrane (low CM and 578
CG) continuum driven by inter-sugar H-bonding and reduced intramembrane diffusion for a G-C181-OH 579
glucolipid 580
581
Flat crystalline structure
Nanotube-vesicle network
Vesicles
48degC
120deg
106 105 104 103 102 101
ppm
H9 H10H1rsquo
106 105 104 103 102 101
ppm106 105 104 103 102 101
ppm106 105 104 103 102 101
ppm
C=CC=C
C1rsquo1C1rsquo2
C1rsquo
Tm2(96degC)Tm1
a)
b)
c)
Same molecule different local orientations and sugar conformations
High curvature membrane
Low curvature inclusion
Flip-FlopStrong H-bonding
CG
CM ( + )
CG 0
CM 0 CG 0
CM 0
G-C181-OH
24
Two related questions are unanswered at the moment What actually drives nanotube 582
formation and is the organization of G-C181-OH within the vesicles and tubes the same Lipid 583
nanotubes have been studied for at least three decades over which broad experimental and 584
theoretical insight has been generated Despite this fact the actual understanding is still matter 585
of debate27 Micelle-to-nanotube and vesicle-to-nanotube phase transitions are generally 586
reported for single amphiphiles below a given Tm and intermediate phase composed of twisted 587
and flat fibers is concomitantly reported Initially thought to be a chirality-driven phenomenon 588
recent studies propose a more general mechanism involving crystallization and symmetry 589
breaking in the lipid packing driven by optimal packing27 If twisted ribbons were observed 590
before for a number of microbial glycolipid bolaamphiphiles44 they are not found for G-C181-591
OH This fact as well as the large body of cryo-TEM images and the observation of nanotubes 592
above Tm1 rather pledge in favour of a direct topological change from positive (vesicles) to 593
zero (nanotubes) Gaussian curvatures In this case vesicle-to-nanotube transitions could be 594
driven by external forces56307813ndash162829 595
Considering the absence of external forces in the present system there are only two 596
possibilities left spontaneous budding of the membrane or nanotube pulling after inter-vesicle 597
collisions due to Brownian motion Both are possible as inclusions composed of a different 598
arrangement of the same molecule in the membrane continuum can theoretically explain 599
spontaneous nanotube formation in an isotropic medium672223629ndash1218ndash21 However the second 600
one is probably more likely to prevail because it could explain the large number of nanotubes 601
connecting two distant vesicles Interestingly similar events occur for any phospholipid-based 602
vesicular solution but nanotubes are extremely rare unless at least two lipids of different 603
molecular structure are mixed together The spectroscopic 1H and 13C and relaxation (1H) 604
ssNMR data even if collected on a dry powder demonstrate that the coexistence of two G-605
C181-OH configurations involving both the sugar headgroup and fatty alcohol chain are 606
possible for this molecule As a matter of fact this is not so surprising as more than one energy 607
minima each corresponding to a given conformation are known for glucose its non-reducing 608
derivative methylglucose and carbohydrates in general78ndash80 609
The presence of two configurations could explain the coexistence between two 610
structures of different curvature but the data presented so far do not explain the origin of these 611
two configurations In other words what drives the change in the local structure of the sugar 612
headgroup and fatty alcohol within the membrane 613
The association of known self-assembled structures to spectroscopic 13C ssNMR data is 614
known for years in particular for gluconamides lipids having a linear sugar headgroup81ndash84 It 615
25
was found that gauche effects in some cases up to the γ position in the sugar chain induce 616
upfield chemical shifts while anti and trans conformations result in downfield shifts Each 617
structure (monolayer crystal bilayer crystal or micellar fiber) was then characterized by a given 618
organization of the gluconamide and a characteristic 13C ssNMR fingerprint which could be 619
explained by gauche γ-gauche anti and trans conformations of the headgroup Similar 620
structural-spectroscopic correlations have been collected over the years for much simpler cyclic 621
sugars85 whereas pyranoses can undergo important conformational changes (chair half-chair 622
boat skew) when the appropriate energy barriers are crossed78ndash8086 A quantitative 623
conformational study based on the 13C chemical shift variations shown in Table 1 would be 624
certainly helpful but very delicate in the context of the present state of the art because a 625
rigorous approach requires at least one known crystal structure8182 which is currently missing 626
for this compound A qualitative approach will then be adopted 627
G-C181-OH is a bolaform amphiphile and flip-flop could be a possible mechanism 628
involved in the nanotube stabilization whereas head-tail interactions have long been considered 629
as important in nanotube-forming bolaform amphiphiles6063 From mere considerations based 630
on T2 (1H) relaxation arguments one could exclude head-tail configurations if the R-CH2OH 631
endgroup (H1) was involved in a direct interaction with the sugar group its corresponding T2 632
would probably be comparable to the sugarrsquos one (OH and H1rsquo) but this does not seem to be 633
the case However this hypothesis would be based on the comparison of the relaxation from 634
CH and CH2 protons additionally involved in different kind of motions Besides the relaxation 635
of H1 is influenced by the strong overlap between H1 and H5rsquo For these reasons relaxation 636
arguments are not solid enough and will not be used 637
We then address this question by exploring intermolecular interactions in a direct 638
manner using 2D 1H-1H homonuclear ssNMR correlation spectroscopy At 90degC in the fast-639
tumbling domain of molecular motion (narrow 1H NMR peaks Figure 6a) and corresponding 640
to the vesicle-rich region spin diffusion (NOESY) experiments are preferred over dipolar 641
coupling based experiments because such interaction is averaged out by molecular motion 642
However when the molecular motion is more constrained in the domain of nanotube stability 643
at 70degC (broad 1H spectra Figure 6a) Double-Quantum Single-Quantum (DQ-SQ) correlation 644
experiments are best suited to probe interaction between close molecular neighbors These 645
experiments are reported in Figure 9 and the related interpretation is only briefly reported 646
below while a more detailed discussion can be found on Page 12 in the Supporting Information 647
26
648
Figure 9 ndash a) 2D 1H-1H NOESY NMR experiment performed at MAS= 10 kHz (4 mm probe) on a Bruker 649
300 MHz Avance III HD spectrometer using 300 ms of mixing time Sample temperature is regulated to 650
90degC reached by cooling from 110degC b) 2D 1H-1H DQ-SQ (BAck-to-BAck BABA pulse sequence used for 651
the DQ excitation scheme) NMR experiment performed at MAS= 22 kHz (25 mm probe) on a Bruker 700 652
MHz Avance III spectrometer using a DQ excitation time equal to 2 rotor periods Sample temperature is 653
regulated to 70degC reached by cooling from 110degC The typical schemes illustrating how to interpret these 654
2D experiments are reported above each experimental map Zooms of the sugar region and configurational 655
interpretation are given below each 2D map More information are given in the text below 656
H16-H16
H1-H1
H9-H10
H1rsquo-H1
H1rsquoH910 H16
H1
H1rsquo-H1rsquo
Hxrsquo-Hxrsquo
2
(pp
m)
(ppm)
315
811910 1rsquo
2rsquo2
3rsquo 4rsquo6rsquo
5rsquo
1rsquo2910
asymp asymp asympHDO MeOD Acetone
1
315
811 9101rsquo
2rsquo2
3rsquo4rsquo6rsquo
5rsquo
1rsquo2 9 10
asympasympasympHDOMeODAcetone
H1rsquo-H1
1rsquo
1
(p
pm
)
(ppm)
H1-H2
H1rsquo-H1
H1rsquo
H910
H1H5rsquo
H2
H1rsquo-H5rsquo
315
811910 1rsquo
2rsquo2
3rsquo 4rsquo6rsquo
5rsquo
1rsquo2910
asymp asymp asympHDO MeOD Acetone
1
H2rsquoH3rsquoH4rsquo
H2rsquoH3rsquoH4rsquo
X= 2rsquo3rsquo4rsquo
NOESY - T= 90degC
1H
1H
1H
1H
DQ-SQ - T= 70degC
a) b)
2
(pp
m)
(p
pm
)
(ppm)
A B
AhellipB
AhellipA
BhellipB
NOESY
(ppm)
A B
AhellipB
DQ-SQ
Single-quantum dimension
Do
ub
le-q
ua
ntu
m d
imen
sio
n
AhellipA
BhellipB
BhellipA
BhellipA
315
811910 1rsquo
2rsquo2
3rsquo 4rsquo6rsquo
5rsquo
1rsquo2910
asymp asymp asympHDO MeOD Acetone
1
lt 5 Aring
lt 5 Aring
H1-H2
H811
H15
H16
H6rsquo
H1rsquo
H1
H5rsquo
H2
H1-H2
H1rsquo-H1
H1rsquo-H5rsquo
H1rsquo
H1 H5rsquo
H1rsquo
H1
H5rsquo
H1H2rsquo H3rsquo H4rsquo
H1-H1
H1rsquo-H1
Hxrsquo-HxrsquoX= 2rsquo3rsquo4rsquo
H1-H2
H1rsquo
Zoom sugar region 28 ndash 45 ppmNOESY DQ-SQ
27
Head-tail or head-head configurations could be probed by the existence of H1rsquo-H1 657
interactions whereas H1 (δH= 356 ppm) is associated to the glucolipid tail and H1rsquo (δH= 432 658
ppm) to the sugar headgroup These atoms are more than 15 Aring apart and a direct interaction 659
could not be observed in both NOESY and DQ-SQ experiments NOESY experiments (Figure 660
9a) show that H1rsquo-H1 correlations are not observed Meanwhile clear-cut direct H1rsquo-H1 661
interactions are indeed observed are detected at T= 70degC (DQ cross-peaks related to H1rsquo-H1 662
correlation in DQ-SQ experiment shown in Figure 9b) Interestingly the absence of auto peaks 663
at δH= 432 ppm and δH= 335 ppm in the SQ dimension excludes H1rsquo-H1rsquo and Hxrsquo-Hxrsquo (x= 2 664
3 4) interactions respectively strengthening the idea that sugar headgroups from two nearest-665
neighbor G-C181-OH molecules are not adjacent in the nanotube-vesicle region 666
Homonuclear 2D ssNMR supports the idea according to which G-C181-OH can 667
undergo molecular flip-flops and a head-tail arrangement in the dry product Extrapolating these 668
conclusions in the lower concentration range lack of H1rsquo-H1 proximity at T= 90degC suggests a 669
head-head configuration in the vesicle-rich region and head-tail configuration within the 670
nanotubes It is however still unclear whether flip-flops are driven by spontaneous temperature-671
induced conformational changes in the glucolipid packing stimulating inclusions within the 672
membrane itself672223629ndash1218ndash21 or by defects generated by inter-vesicle collisions In fact a 673
combination of both is not unlikely Nanotubes are not stable when temperature is 20 to 30 674
degrees above Tm1 indicating that inter-vesicle collisions alone cannot explain the unusual 675
phenomenon In an energy landscape approach87 the head-head configuration is certainly 676
favored at high temperature while both head-head and head-tail configurations could be 677
favored in the mid-temperature region corresponding to the range between Tm1 and Tm2 in the 678
dry powder Both statistical and defect-induced flip-flop events contribute to form high mean 679
zero Gaussian curvature morphologies (nanotubes) for which the head-tail conformation 680
limiting the proximity between bulky sugar headgroups is probably more adapted (Figure 8c) 681
The flip-flop interpretation now reasonably explains the strong differences in the sugar and fatty 682
alcohol conformations deduced by the multiple NMR signals attributed to chemically-683
equivalent groups The existence of various low-energy conformations each having specific 684
NMR signature for sugars in solution78ndash8086 and solid-state81ndash84 further supports our 685
interpretation 686
One last point should be clarified Why between Tm1 and Tm2 are two molecular 687
environments able to coexist instead of a single one of average rigidity as found in the case of 688
ldquoripplerdquo phases50ndash54 We believe that this question can be answered based on the NMR results 689
the relatively short T2 values of the H1rsquo and OH protons shows the constrained mobility of the 690
28
sugar headgroup despite a certain flexibility of the chain (long T2 component) This trend may 691
suggest restrictions in translational mobility probably due to the sugar-OH hydrogen bonding 692
(Figure 8c) meaning that lipids are not able to diffuse within the membrane thus keeping two 693
different configurations stable 694
695
Conclusions 696
Topologically-connected nanotube-vesicle lipidic systems are commonly observed for 697
self-assembled membranes composed of at least two amphiphiles and spontaneously driven by 698
anisotropic inclusions andor by external directional forces This work shows that strong 699
differences in membrane curvature can spontaneously occur in single-lipid systems without 700
external anisotropic forces Coexistence and interconnection between nanotubes and vesicles 701
are evidenced via cryo-TEM and fluorescence confocal microscopy in a single-phase region at 702
temperature above a transition temperature Tm1= 483degC determined by DSC on the hydrated 703
sample but below the second transition temperature Tm2 (957degC) determined by DSC on the 704
dry powder X-ray diffraction (WAXS) also shows the coexistence of two lattice periods one 705
attributed to an inter-membrane repeating distance and the other possibly related to the intra-706
nanotube glucolipid arrangement Labelling the systems with Laurdan a fluorophore of which 707
the emission strongly varies with the local membrane rigidity excludes the presence of rigid 708
micro-separated phases (eg Lβ) 709
1H and 13C ssNMR despite the fact that it can only be performed on the dry powder 710
confirm the presence of one main fluid G-C181-OH environment above Tm2 Below Tm2 the 711
splitting of some 13C peaks and the coexistence of short and long 1H relaxation components 712
demonstrate that G-C181-OH can simultaneously pack into structurally and dynamically 713
inequivalent environments Combining advanced 2D 1H-1H correlation experiments based on 714
spin diffusion or double-quanta excitation suggests that vesicles could contain a preferred head-715
head configuration of the bolaform lipid while nanotubes a preferred head-tail assembly 716
The presence of two environments composed of the same molecule characterized by 717
different molecular configurations and rigidity fulfills the theoretical conditions necessary to 718
spontaneously nucleate a membrane inclusion of non-zero average orientation described as 719
necessary to observe topologically-connected nanotube-vesicle structures in the absence of 720
external forces This hypothesis could also be enriched by the possibility of nanotubes to be 721
pulled away between two vesicles after a collision event 722
This work expands the actual theoretical and experimental framework on lipid networks 723
stabilized by a different radius of curvature It could also motivate the synthesis or isolation 724
29
of new lipids providing a higher level of 3D architectural control in soft networks possibly in 725
the range of room temperature 726
727
Acknowledgements 728
Dr Andrea Lassenberger and Dr Sylvain Preacutevost at Institut Laue Langevin (ILL Grenoble 729
France) are kindly acknowledged for their assistance on the SANS experiment Confocal 730
images were performed at the Institut de Biologie Paris Seine (IBPS) imaging facility Jean-731
Franccedilois Gilles (Imaging Core Facility Institut de Biologie Paris Seine (IBPS) CNRS 732
Sorbonne Universiteacute Paris France) is kindly acknowledged for his assistance on the confocal 733
microscopy imaging Dr Guillaume Laurent (LCMCP Sorbonne Universiteacute Paris France) is 734
kindly acknowledged for helpful discussions The French region Ile-de-France SESAME 735
program is acknowledged for financial support (700 MHz NMR 736
spectrometer) Dr Olivier Diat (ICSM Marcoule France) Prof eronikaIglič and Prof V Aleš737
onsul discussi Slovenia) are kindly acknowledged for helpfUniversity of LjubljanaIglič (-Kralj 738
739
Financial support 740
WAXS experiments have been supported by Soleil Light Source Saint Aubin France proposal 741
Ndeg 20201747 SANS experiments have been supported by ILL proposal Ndeg9-13-778 742
743
References 744
1 D Kabaso N Bobrovska W Goacuteźdź E Gongadze V Kralj-Iglič R Zorec and A 745
Iglič Bioelectrochemistry 2012 87 204ndash210 746
2 C R Safinya U Raviv D J Needleman A Zidovska M C Choi M A Ojeda-747
Lopez K K Ewert Y Li H P Miller J Quispe B Carragher C S Potter M W 748
Kim S C Feinstein and L Wilson Adv Mater 2011 23 2260ndash2270 749
3 P Veranič M Lokar G J Schuumltz J Weghuber S Wieser H Haumlgerstrand V Kralj-750
Iglič and A Iglič Biophys J 2008 95 4416ndash4425 751
4 A Rustom R Saffrich I Markovic P Walther and H-H Gerdes Science (80- ) 752
2004 303 1007ndash1010 753
5 M I Angelova S Soleacuteau P Meacuteleacuteard F Faucon and P Bothorel Prog Colloid 754
Polym Sci 1992 89 127ndash131 755
6 L Mathivet S Cribier and P F Devaux Biophys J 1996 70 1112ndash1121 756
7 V Kralj-Iglič G Gomišček J Majhenc V Arrigler and S Svetina Colloids Surfaces 757
A Physicochem Eng Asp 2001 181 315ndash318 758
30
8 V Kralj-Iglič A Iglič G Gomišček F Sevšek V Arrigler and H Haumlgerstrand J 759
Phys A Math Gen 2002 35 1533ndash1549 760
9 M Drab D Stopar V Kralj-Iglič and A Iglič Cells 2019 8 626 761
10 A Zidovska K K Ewert J Quispe B Carragher C S Potter and C R Safinya 762
Langmuir 2009 25 2979ndash2985 763
11 A Zidovska K K Ewert J Quispe B Carragher C S Potter and C R Safinya Soft 764
Matter 2011 7 8363ndash8369 765
12 A Zidovska K K Ewert J Quispe B Carragher C S Potter and C R Safinya 766
Biochim Biophys Acta - Biomembr 2009 1788 1869ndash1876 767
13 M Karlsson K Sott M Davidson A S Cans P Linderholm D Chiu and O Orwar 768
Proc Natl Acad Sci U S A 2002 99 11573ndash11578 769
14 A Karlsson R Karlsson M Karlsson A-S Cans A Stromberg F Ryttsen and O 770
Orwar Nature 2001 409 150ndash152 771
15 M Karlsson K Sott A S Cans A Karlsson R Karlsson and O Orwar Langmuir 772
2001 17 6754ndash6758 773
16 E Evans H Bowman A Leung D Needham and D Tirrell Science (80- ) 1996 774
273 933ndash935 775
17 U Seifert Configurations of fluid membranes and vesicles 1997 vol 46 776
18 J Kaumls and E Sackmann Biophys J 1991 60 825ndash844 777
19 N Bobrovska W Goacuteźdź V Kralj-Iglič and A Iglič PLoS One 2013 8 e73941 778
20 A Iglič B Babnik K Bohinc M Fošnarič H Haumlgerstrand and V Kralj-Iglič J 779
Biomech 2007 40 579ndash585 780
21 K Bohinc T Slivnik A Iglič M Brumen and V Kralj-Iglič J Phys Chem C 2007 781
111 9709ndash9718 782
22 A Iglič H Haumlgerstrand P Veranič A Plemenitaš and V Kralj-Iglič J Theor Biol 783
2006 240 368ndash373 784
23 V Kralj-Iglič and P Veranič Adv Planar Lipid Bilayers Liposomes 2006 5 129ndash785
149 786
24 A Iglic and V Kralj-Iglic Adv Planar Lipid Bilayers Liposomes 2006 4 253ndash279 787
25 S Penič L Mesarec M Fošnarič L Mroacutewczyńska H Haumlgerstrand V Kralj-Iglič and 788
A Iglič Front Phys 2020 8 342 789
26 P Yager and P E Schoen Mol Cryst Liq Cryst 1984 106 371ndash381 790
27 T G Barclay K Constantopoulos and J Matisons Chem Rev 2014 114 10217ndash791
10291 792
31
28 B Božič G Gomišček V Kralj-Iglič S Svetina and B Žekš Eur Biophys J 2002 793
31 487ndash496 794
29 A Iglič H Haumlgerstrand M Bobrowska-Haumlgerstrand V Arrigler and V Kralj-Iglič 795
Phys Lett A 2003 310 493ndash497 796
30 R Bar-Ziv and E Moses Phys Rev Lett 1994 73 1392ndash1395 797
31 S Chiruvolu H E Warriner E Naranjo S H Idziak J O Raumldler R J Plano J A 798
Zasadzinski and C R Safinya Science (80- ) 1994 266 1222ndash1225 799
32 V Kralj-Iglič A Iglič H Haumlgerstrand and P Peterlin Phys Rev E 2000 61 4230ndash800
4234 801
33 L Mesarec M Drab S Penič V Kralj-Iglič and A Iglič Int J Mol Sci 2021 22 802
2348 803
34 L Van Renterghem S L K W Roelants N Baccile K Uyttersprot M C Taelman 804
B Everaert S Mincke S Ledegen S Debrouwer K Scholtens C V Stevens W 805
Soetaert L Van Renterghem S L K W Roelants N Baccile K Uytersprot M C 806
Taelman B Everaert S Mincke S Ledegen S Debrouwer K Scholtens C V 807
Stevens and W Soetaert Biotechnol Bioeng 2018 115 1195ndash1206 808
35 J Clark and F Deswarte Introduction to Chemicals from Biomass Second Edition 809
John Wiley amp Sons 2015 810
36 K V Sajna R Houmlfer R K Sukumaran L D Gottumukkala and A Pandey in 811
Industrial Biorefineries and White Biotechnology eds A Pandey R Houmlfer M 812
Taherzadeh K M Nampoothiri and C Larroche Amsterdam Oxford Waltham 813
Elsevier 2015 pp 499ndash521 814
37 R Marchant and I M Banat Trends Biotechnol 2012 30 558ndash565 815
38 K Hill and C LeHen-Ferrenbach in Sugar-Based Surfactants Fundamentals and 816
Applications ed C C Ruiz Boca Raton CRC Press 2009 pp 1ndash20 817
39 L Rodrigues I M Banat J Teixeira and R Oliveira J Antimicrob Chemother 818
2006 57 609ndash618 819
40 J D Desai and I M Banat Microbiol Mol Biol Rev 1997 61 47ndash64 820
41 S L K W Roelants K Ciesielska S L De Maeseneire H Moens B Everaert S 821
Verweire Q Denon B Vanlerberghe I N A Van Bogaert P Van der Meeren B 822
Devreese and W Soetaert Biotechnol Bioeng 2016 113 550ndash559 823
42 N Baccile M Selmane P Le Griel S Preacutevost J Perez C V Stevens E Delbeke S 824
Zibek M Guenther W Soetaert I N A Van Bogaert and S Roelants Langmuir 825
2016 32 6343ndash6359 826
32
43 N Baccile A-S Cuvier S Preacutevost C V Stevens E Delbeke J Berton W Soetaert 827
I N A Van Bogaert and S Roelants Langmuir 2016 32 10881ndash10894 828
44 N Baccile C Seyrig A Poirier S A Castro S L K W Roelants and S Abel Green 829
Chem 2021 23 3842ndash3944 830
45 A Salis L Cappai C Carucci D F Parsons and M Monduzzi J Phys Chem Lett 831
2020 11 6805ndash6811 832
46 J Schindelin I Arganda-Carreras E Frise V Kaynig M Longair T Pietzsch S 833
Preibisch C Rueden S Saalfeld B Schmid J-Y Tinevez D J White V 834
Hartenstein K Eliceiri P Tomancak and A Cardona Nat Methods 2012 9 676ndash835
682 836
47 T Parasassi and E Gratton J Fluoresc 1995 5 59ndash69 837
48 M M Dodes Traian F L Gonzaacutelez Flecha and V Levi J Lipid Res 2012 53 609ndash838
616 839
49 D M Owen C Rentero A Magenau A Abu-Siniyeh and K Gaus Nat Protoc 840
2012 7 24ndash35 841
50 W Stillwell in An Introduction to Biological Membranes Academic Press 2016 pp 842
135ndash180 843
51 W Stillwell in An Introduction to Biological Membranes Academic Press 2016 pp 844
181ndash220 845
52 B Tenchov Chem Phys Lipids 1991 57 165ndash177 846
53 R Koynova and M Caffrey Biochim Biophys Acta 1998 1376 91ndash145 847
54 F Schmid S Dolezel O Lenz and S Meinhardt J Phys Conf Ser 2014 487 848
012004 849
55 S Meinhardt R L C Vink and F Schmid Proc Natl Acad Sci U S A 2013 110 850
4476ndash4481 851
56 O Glatter and O Kratky Small Angle X-ray Scattering Academic Press London 852
1982 853
57 B A Cunningham A D Brown D H Wolfe W P Williams and A Brain Phys 854
Rev E 1998 58 3662ndash3672 855
58 M Nadler A Steiner T Dvir O Szekely P Szekely A Ginsburg R Asor R Resh 856
C Tamburu M Peres and U Raviv Soft Matter 2011 7 1512ndash1523 857
59 C Tanford The hydrophobic effect Formation of micelles and biological membranes 858
John Wiley amp Sons Inc New York 1973 859
60 M Masuda and T Shimizu Langmuir 2004 20 5969ndash5977 860
33
61 A Zidovska K K Ewert J Quispe B Carragher C S Potter and C R Safinya 861
Block Liposomes Vesicles of Charged Lipids with Distinctly Shaped Nanoscale 862
Sphere- Pear- Tube- or Rod-Segments Elsevier Inc 1st edn 2009 vol 465 863
62 A Iglic V Kralj-Iglic B Božič M Bobrowska-Haumlgerstrand B Isomaa and H 864
Haumlgerstrand Bioelectrochemistry 2000 52 203ndash211 865
63 T Shimizu M Masuda and H Minamikawa Chem Rev 2005 105 1401ndash1444 866
64 J V Selinger and J M Schnur Phys Rev Lett 1993 71 4091ndash4094 867
65 J M Schnur Science (80- ) 1993 262 1669ndash1676 868
66 B Tenchov R Koynova and G Rapp Biophys J 2001 80 1873ndash1890 869
67 R Koynova and B Tenchov Ser Biomech 2017 31 3ndash19 870
68 S J Angyal and R Le Fur Carbohydr Res 1984 126 15ndash26 871
69 J K Whitesell and M A Minton J Am Chem Soc 1987 109 225ndash228 872
70 T Takayama S Ando and I Ando J Mol Struct 1990 220 245ndash250 873
71 K Gawrisch N V Eldho and I V Polozov Chem Phys Lipids 2002 116 135ndash151 874
72 F Tielens C Gervais J F Lambert F Mauri and D Costa Chem Mater 2008 20 875
3336ndash3344 876
73 G A Jeffrey and Y Yeon Acta Crystallogr Sect B 1986 42 410ndash413 877
74 B Berglund and R W Vaughan J Chem Phys 1980 73 2037ndash2043 878
75 C Gervais C Coelho T Azaiumls J Maquet G Laurent F Pourpoint C Bonhomme 879
P Florian B Alonso G Guerrero P H Mutin and F Mauri J Magn Reson 2007 880
187 131ndash140 881
76 C Akita T Kawaguchi F Kaneko H Yamamoto and M Suzuki J Phys Chem B 882
2004 108 4862ndash4868 883
77 R N Purusottam L Seacutenicourt J J Lacapegravere and P Tekely Biochim Biophys Acta - 884
Biomembr 2015 1848 3134ndash3139 885
78 X Biarneacutes A Ardegravevol A Planas C Rovira A Laio and M Parrinello J Am Chem 886
Soc 2007 129 10686ndash10693 887
79 L M J Kroon‐Batenburg and J Kroon Biopolymers 1990 29 1243ndash1248 888
80 K N Kirschner and R J Woods Proc Natl Acad Sci U S A 2001 98 10541ndash889
10545 890
81 S Svenson B Kirste and J H Fuhrhop J Am Chem Soc 1994 116 11969ndash11975 891
82 I Sack S Macholl J H Fuhrhop and G Buntkowsky Phys Chem Chem Phys 892
2000 2 1781ndash1788 893
83 S Svenson J Koening and J H Fuhrhop J Phys Chem 1994 98 1022ndash1028 894
34
84 S Svenson A Schaefer and J H Fuhrhop J Chem Soc Perkin Trans 2 1994 2 895
1023ndash1028 896
85 K Bock and C Pedersen Adv Carbohydr Chem Biochem 1983 41 27ndash66 897
86 T B Grindley Structure and Conformation of Carbohydrates Springer Berlin 898
Heidelberg 2008 899
87 F Tantakitti J Boekhoven X Wang R V Kazantsev T Yu J Li E Zhuang R 900
Zandi J H Ortony C J Newcomb L C Palmer G S Shekhawat M O De La 901
Cruz G C Schatz and S I Stupp Nat Mater 2016 15 469ndash476 902
903
1
Supporting Information 904
905
Topological connection between vesicles and nanotubes in single-906
component lipid membranes driven by head-tail interactions 907
908
Niki Baccilea Ceacutedric Lorthioira Abdoul Aziz Baa Patrick Le Griela Cristina Coelhob Javier 909
Perezc Wim Soetaertd Sophie L K W Roelantsd 910
911
a Sorbonne Universiteacute Centre National de la Recherche Scientifique Laboratoire de Chimie de 912
la Matiegravere Condenseacutee de Paris LCMCP F-75005 Paris France 913
b Institut des Mateacuteriaux de Paris Centre Sorbonne Universiteacute Paris France 914
c Synchrotron Soleil LrsquoOrme des Merisiers Saint-Aubin BP48 91192 Gif-sur-Yvette Cedex 915
France 916
d InBio Department of Biotechnology Ghent University Ghent Belgium 917
918
919
Corresponding author 920
Dr Niki Baccile 921
E-mail address nikibaccilesorbonne-universitefr 922
Phone +33 1 44 27 56 77 923
924
925
926
2
a) 927
Parameter Method
Dry Matter (DM ) 996 Infrared balance 105degC
Glucose () 012 HPLC-Metacarb
Glycerol () nd HPLC-Metacarb
Free Fatty Acid content () lt001 Internal method BBEPP
GC with FID Detector
Oil () lt001 Internal method BBEPP
GC with FID Detector
Moulds (CFUg) lt10 3M-Nordval ndeg16 B
Yeasts (CFUg) lt10 3M-Nordval ndeg16 B
Anaerobic count (CFUg) lt10 SP-VG M005 B
Protein () tbd BCA protein assay
928
Figure S 1 - a) HPLC-ELSD chromatogram and composition table 929
930
931
932
933
3
b) 934
935
Group Ndeg δ ppm
CH2 1 354
CH2 2 153
CH2 3-712-14 132
CH2 811 203
CH 910 534
CH2 15 162
CH2 16 388
CH 1 424
CH 2 316
CH 3 334
CH 4 329
CH 5 354
CH2 6 366
Figure S 1 (next) ndash b) 1H NMR spectrum (MeOD-d4) recorded on the purified G-C181-OH compounds 936
and related assignment 937
938
2
811910 1rsquo
5rsquo1
3rsquo4rsquo
1rsquo1910
asymp asymp asympHDO MeOD Acetone
6rsquo2rsquo
1615
3-712-14
4
939
940
Figure S 2 ndash Cryo-TEM images recorded for a 5 mgmL G-C181-OH aqueous solution heat at T= 130degC 941
5
942
943
Figure S 3 - Cryo-TEM images recorded for a 5 mgmL G-C181-OH aqueous solution heat at T= 90degC 944
945
90degC
1
22
6
946
947
948
949
Figure S 4 ndash Cryo-TEM images recorded for a 5 mgmL G-C181-OH aqueous solution heat at T= 70degC 950
951
21
11
1
2
5
3
4
45
5
6
7
7
7
952
953
954
Figure S 5 ndash Cryo-TEM images recorded for a 5 mgmL G-C181-OH aqueous solution heat at T= 25degC 955
956
957
1
1 1
8
958
Figure S 6 ndash a) SANS experiment recorded at 90degC for a 5 mgmL G-C181-OH aqueous solution b-c) 959
WAXS experiments recorded on aqueous solutions of G-C181-OH at b) 5 mgmL and c) 25 mgmL d) 960
Structural interpretation of the repeating distances pointed out in c) 961
962
963
964
001 01 1
q Aring-1
25degC
68degC
88degC
111degC
01 1q Aring
-1
02 04 06 08 1q Aring
-1
001 01
10-1
100
101
Inte
nsity
cm
-1
q Aring-1
-2
T= 90degC
SANS WAXS WAXS
a) b) c)
dv
dL d= 144 Aring-1
di
ddH2O
dt
dvdL
dtdi d
d)
9
965
966
Figure S 7 ndash ssNMR MAS (10 kHz) experiments recorded on a G-C181-OH dry powder a) 1H spectra 967
recorded from 110degC to 70degC b) 13C single pulse (SP) spectra recorded with high power 1H decoupling from 968
110degC to 70degC c) 13C cross polarization (CP) spectra recorded at 110degC and contact time tc of 50 micros and 969
3000 micros d) 13C CP spectra recorded at 70degC and for 20 lt tc micros lt 3000 970
971
1
811
910
CH2 CH2
1rsquo
6rsquo
8 6 4 2 0 ppm
110
90
80
70
910
1rsquo
6rsquo16
1
2rsquo3rsquo4rsquo
811
OH
45 40 35 30 25 20 15
ppm
200 180 160 140 120 100 80 60 40 20 0
ppm140 120 100 80
ppm
CH2-gauche
3004
110
90
80
70
65
60
50
25
C91013003
C9 - 12869
CH2-all-trans
3198
C1rsquo10335
a) b)
1H
T degCT degC
13C Single Pulse MAS
A
B
A
B
70degC70degC
5rsquo
215
200 180 160 140 120 100 80 60 40 20 0
ppm
13C CPMAST= 110degC
200 180 160 140 120 100 80 60 40 20 0
ppm
132 131 130 129 128 127 126
ppm
106 105 104 103 102
ppm
13C CPMAST= 70degC
50
tc micros
3000
20
tc micros
50 500 1000 3000
tc micros
C102
13024 C910113003
C92
12869
C1rsquo213082
C1rsquo110443
A B
106 105 104 103 102
ppm
3000
1000
500
50
20
AB
c)
d)
10
972
Figure S 8 ndash a) Short and d) long T2 components displayed by the 1H transverse relaxation signal c) 1H 973
transverse relaxation signals recorded on a G-C181-OH dry powder from 110degC to 70degC The area of each 974
given resonance is plotted (log-lin) as a function of the echo time (CPMG pulse sequence) for each 975
temperature and fitted using the equation given above T2s and T2l indicate the short and long T2 relaxation 976
times respectively obtained by describing the 1H transverse relaxation signal using a biexponential decay 977
For H1rsquo H5rsquo and H6rsquo the 1H relaxation function could be described by a monoexponential decay 978
- Protons from the sugar group (H1rsquo H5rsquo H6rsquo) show a single T2 relaxation component (Figure 979
6c and Figure S 8) while protons of the acyl chain (CH2 H910 H811) show both short (Figure 980
6c) and long (Figure 6d) T2 relaxation component 981
- The short T2 relaxation time systematically decreases from 110degC to 70degC for all species by a 982
factor ranging from two to seven depending on the specific chemical group Very long T2 are 983
observed at 110degC for all acyl species while nearly unchanged values are measured below 984
90degC without any clear trend 985
- The sugar protons (H1rsquo H5rsquo H6rsquo) have the shortest set of T2 values (lt 1 ms) below 100degC 986
The long component of T2 generally ranges between 4 ms and 12 ms 987
0 1 2 3 4 5 6 7 8
00
05
10
15
20
25
30
35
40
45
Log
In
ten
sity
Time ms
0 1 2 3 4 5 6 7 8
00
05
10
15
20
25
30
35
40
45
Log
In
ten
sity
Time ms
0 1000 2000 3000 4000 5000 6000 7000 8000
00
05
10
15
20
25
30
35
40
45
Log
In
ten
sity
Time ms
0 1000 2000 3000 4000 5000 6000 7000 8000
00
05
10
15
20
25
30
35
40
45
Log
In
ten
sity
Time ms
0 1000 2000 3000 4000 5000 6000 7000 8000
00
05
10
15
20
25
30
35
40
45
Log
In
ten
sity
Time ms
0 1000 2000 3000 4000 5000 6000 7000 8000
00
05
10
15
20
25
30
35
40
45
Log
In
ten
sity
Time ms
H1
H8H11
H9H10
CH2
H1rsquo
H6rsquo
CH2
H910H811 H1CH2
H1rsquo H5rsquo6rsquo
0 1000 2000 3000 4000 5000 6000 7000 8000
00
05
10
15
20
25
30
35
40
45
Log
In
ten
sity
Time ms
OH
0 1000 2000 3000 4000 5000 6000 7000 8000
00
05
10
15
20
25
30
35
40
45 T= 110degC
T= 90degC
T= 80degC
T= 70degC
Log
In
ten
sity
Time ms
Fit
)
CH2 H910 H811 H1 H56 H1 OH
00
05
10
15
20
25
30
35
40
T2 m
s
T= 110degC
T= 90degC
T= 80degC
T= 70degC
CH2 H910 H811 H1
0
2
4
6
8
10
12
T2 m
s
T= 110degC
T= 90degC
T= 80degC
T= 70degC
Short T2(1H) Long T2(1H)
a) b)
c)
11
Table S 1 ndash 1H chemical shifts of G-C181-OH in solution and in the solid-state Solid-state spectra are 988
recorded at a MAS frequency of 10 kHz in DMSO-d6 broad peak 989
990
δH ppm
Group Ndeg Liquid
(MeOD-d4) Solid
(T= 110degC) Solid
(T= 70degC)
CH2 H1 354 357
CH2 H2 153 156
CH2 H3-712-14 132 135
CH2 H811 203 203
CH H910 534 534
CH2 H15 162 164
CH2 H16 388 383
CH H1 424 432
CH H2 316 335
CH H3 334 335
CH H4 329 335
CH H5 354 351 357
CH2 H6 366 383
OH OH1 432
45 463
OH OH2 492
OH OH3 490
OH OH4 487
OH OH6 445
991
992
H1H9H10H1rsquo
H6rsquo
OH2rsquo
OH1
12
Detailed discussion about the NOESY and DQ-SQ 2D 1H-1H ssNMR experiments presented in 993
Figure 9 994
995
2D 1H-1H ssNMR experiments are a unique tool to explore through-space proximities 996
between 1H nuclei ssNMR offers a large number of possibilities each adapted to a given 997
system The advantage of 2D maps with respect to a dynamics approach is their direct 998
readability in clear two nuclei which exchange their magnetization through-space (whichever 999
mechanism may be responsible for this exchange) will display a specific cross-peak However 1000
the way cross-peaks are presented and interpreted strictly depends on the nature of the pulse 1001
program which in turn is chosen according to the physical nature of the sample 1002
1D temperature-dependent 1H NMR experiments performed on G-C181-OH (Figure 1003
4a in the main text) indicate sharp peaks at 90degC and broad peaks at 70degC Narrow peaks 1004
indicate fast andor large-amplitude molecular tumbling averaging the strong 1H-1H dipolar 1005
interactions This excludes the use of pulse sequences like DQ-SQ which is not efficient under 1006
these conditions For this reason we employ spin-diffusion-based pulse sequences like 1007
NOESY which is more adapted for samples with high molecular mobility When mixing times 1008
are chosen to be short (lt 1 s) one generally explores through-space proximities within about 5 1009
10 Aring On the contrary when molecular motions are restricted dipolar coupling becomes 1010
significant 1H NMR peaks are broader and pulse sequences like DQ-SQ can now be used 1011
with a spatial resolution of less than 5 Aring 1012
Whenever possible DQ-SQ experiments are preferred over spin diffusion-based pulse 1013
sequences because they are more selective in particular for likewise interactions which are 1014
not discriminated in NOESY-type experiments This is illustrated by the typical interaction 1015
schemes for NOESY (top Figure 9a) and DQ-SQ (top Figure 9b) For two given A and B 1016
protons 2D NOESY maps will display two on-diagonal and two square-shaped symmetrical 1017
off-diagonal cross-peaks Off-diagonal cross-peaks illustrate the mutual A-B and B-A 1018
interaction but the on-diagonal peaks are systematic and do not prove any A-A or B-B 1019
interaction Similarly to NOESY 2D DQ-SQ maps display off-diagonal peaks (symmetric 1020
across the diagonal top Figure 9b) upon A-B and B-A interaction but in contrast they will 1021
display on-diagonal peaks only in the presence of self-interaction In the tutorial example of 1022
Figure 9b top the on-diagonal A-A peak indicates mutual A-A interaction while lack of on-1023
diagonal B-B peak evidences the absence of B-B proximities Combining NOESY and DQ-SQ 1024
experiments is capital to study the local arrangement of G-C181-OH and its evolution with 1025
temperature 1026
13
At T= 90degC the H1 and H5rsquo contributions are very close but possible to discriminate 1027
them (δ(H1)= 354 ppm δ(H5rsquo)= 351 ppm) according to 1H NMR chemical shifts in Table S 1028
1 2D 1H-1H NOESY in Figure 9a also discriminates between the two components attributed 1029
on the basis of the interactions with their mutual neighbors (green H1-H2 and H5rsquo-H1rsquo squares 1030
in Figure 9a) On this basis 2D NOESY does not show a direct H1rsquo-H1 correlation (blue red-1031
crossed) but rather an extensive network of intra-sugar interactions These features exclude 1032
suggest intra- and inter-sugar interactions and they exclude head-tail arrangements as a major 1033
molecular configuration at 90degC 1034
At 70degC the 1H NMR peaks are broader indicating a reduction of the T2 (1H) relaxation 1035
times andor residual homonuclear dipolar interactions excluding the use of NOESY In this 1036
case 1H-1H DQ-SQ correlation experiments are best suited Figure 9b presents the 1H-1H DQ-1037
SQ experiment on G-C181-OH at 70degC Peaks are broader than in NOESY and attribution may 1038
be cumbersome However the experiment is performed at 700 MHz and MAS= 22 kHz which 1039
improves spectral resolution with respect to the same experiment performed at 300 MHz and 1040
MAS= 10 kHz The auto-peak at δH= 356 ppm in the SQ dimension is attributed to H1-H1 spin 1041
pairs mainly resulting from intra CH2 interaction while the DQ cross-peaks at δH= 156-356 1042
ppm and δH= 432-356 ppm respectively origin from H2-H1 and H1rsquo-H1 interactions (Figure 1043
9b) DQ-SQ map does not show any auto-peak corresponding to H1rsquo-H1rsquo or Hxrsquo-Hxrsquo (x= 2rsquo 1044
3rsquo 4rsquo) interactions (red-crossed blue Figure 9b) thus excluding any proximity (lt 5 Aring) between 1045
close glucose neighbors On the contrary DQ-SQ maps (recorded both at 700 MHz Figure 9b 1046
or at 300 MHz not shown) systematically show DQ cross-peaks which can only be attributed 1047
to H1rsquo-H1 interactions (δH= 432-356) The presence of these H1rsquo-H1 interactions can only be 1048
explained by a head-tail arrangement of the G-C181-OH molecules as illustrated below the 1049
DQ-SQ map in Figure 9b 1050
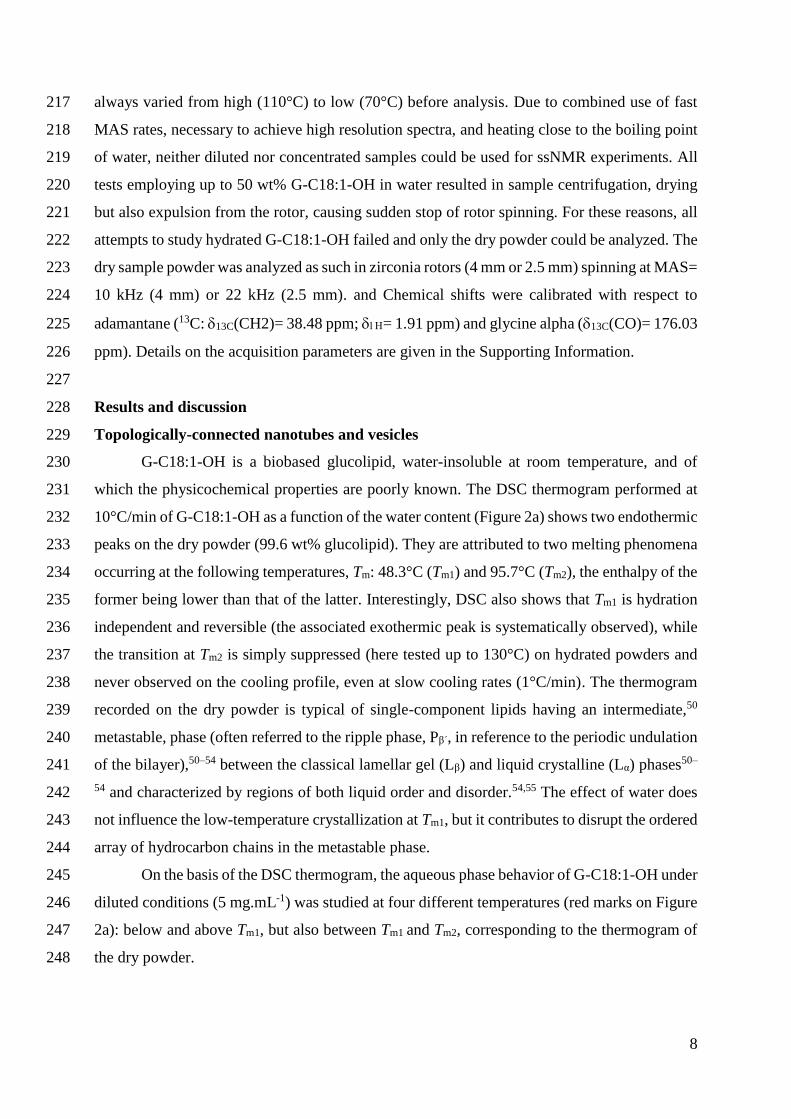
8
always varied from high (110degC) to low (70degC) before analysis Due to combined use of fast 217
MAS rates necessary to achieve high resolution spectra and heating close to the boiling point 218
of water neither diluted nor concentrated samples could be used for ssNMR experiments All 219
tests employing up to 50 wt G-C181-OH in water resulted in sample centrifugation drying 220
but also expulsion from the rotor causing sudden stop of rotor spinning For these reasons all 221
attempts to study hydrated G-C181-OH failed and only the dry powder could be analyzed The 222
dry sample powder was analyzed as such in zirconia rotors (4 mm or 25 mm) spinning at MAS= 223
10 kHz (4 mm) or 22 kHz (25 mm) and Chemical shifts were calibrated with respect to 224
adamantane (13C 13C(CH2)= 3848 ppm = 191 ppm) and glycine alpha (13C(CO)= 17603 225
ppm) Details on the acquisition parameters are given in the Supporting Information 226
227
Results and discussion 228
Topologically-connected nanotubes and vesicles 229
G-C181-OH is a biobased glucolipid water-insoluble at room temperature and of 230
which the physicochemical properties are poorly known The DSC thermogram performed at 231
10degCmin of G-C181-OH as a function of the water content (Figure 2a) shows two endothermic 232
peaks on the dry powder (996 wt glucolipid) They are attributed to two melting phenomena 233
occurring at the following temperatures Tm 483degC (Tm1) and 957degC (Tm2) the enthalpy of the 234
former being lower than that of the latter Interestingly DSC also shows that Tm1 is hydration 235
independent and reversible (the associated exothermic peak is systematically observed) while 236
the transition at Tm2 is simply suppressed (here tested up to 130degC) on hydrated powders and 237
never observed on the cooling profile even at slow cooling rates (1degCmin) The thermogram 238
recorded on the dry powder is typical of single-component lipids having an intermediate50 239
metastable phase (often referred to the ripple phase Pβ´ in reference to the periodic undulation 240
of the bilayer)50ndash54 between the classical lamellar gel (Lβ) and liquid crystalline (Lα) phases50ndash241
54 and characterized by regions of both liquid order and disorder5455 The effect of water does 242
not influence the low-temperature crystallization at Tm1 but it contributes to disrupt the ordered 243
array of hydrocarbon chains in the metastable phase 244
On the basis of the DSC thermogram the aqueous phase behavior of G-C181-OH under 245
diluted conditions (5 mgmL-1) was studied at four different temperatures (red marks on Figure 246
2a) below and above Tm1 but also between Tm1 and Tm2 corresponding to the thermogram of 247
the dry powder 248
9
249
Figure 2 ndash a) DSC thermogram of G-C181-OH under dry (04 wt water estimated by thermogravimetric 250
analysis) and hydrated conditions recorded at a heating rate of 10degCmin Red marks indicate the 251
temperatures at which cryo-TEM experiments are performed on the corresponding 5 mgmL aqueous 252
solutions b) Cryo-TEM images recorded for a 5 mgmL G-C181-OH aqueous solution heat at T= 130degC 253
90degC 70degC and 25degC T indicates the temperature of the sample solution before cryofixation Tne T T 254
being the temperature of the sample upon plunging in liquid ethane Please refer to the materials and 255
methods section for more information 256
T= 130degC
T= 90degC
T= 70degC
T= 25degC
a)
b)
20 40 60 80 100 120
99 wt
50 wt
25 wt
T degC
En
do
10 wt
Tm1= 483 degC
Tm2= 957 degC
10
257
The series of cryo-TEM images in Figure 2b show an overview of the most relevant 258
structures observed on G-C181-OH solution from T= 130degC to T= 25degC whereas T is 259
indicative of the equilibrium temperature before cryofixation (refer to materials and methods 260
section for more information on the sense and interpretation of T) At Tgt 100degC the sample 261
is essentially composed of polydisperse single wall vesicles massively shown by the 262
complementary pictures presented in Figure S 2 In between Tm1 and Tm2 at T= 90degC and T= 263
70degC (Figure 2b Figure 3 Figure 4 complemented by Figure S 3 and Figure S 4) vesicles are 264
connected by nanotubes At Tlt Tm1 flat crystals are otherwise observed (Figure 2b and Figure 265
S 5) 266
267
268
Figure 3 ndash Cryo-TEM images recorded for a 5 mgmL G-C181-OH aqueous solution heat at T= 90degC 269
270
A deeper insight at T= 90degC is given in Figure 3 (more images are provided in Figure 271
S 3) Arrows 1 through 6 mark very clearly the typical continuity in the glucolipid membrane 272
between the vesicle and nanotubes Arrow Ndeg 7 shows that a single nanotube connects the outer 273
membrane of two vesicles several hundred nanometers apart The connection is shown by 274
2
34
5
6
6
1
5
7
A
B
D
C
0 10 20 30 40 50 60
BIn
tensity
au
Profile nm
A
0 10 20 30 40 50 60
Inte
nsity
au
Profile nm
C
D
T= 90degC
11
arrows Ndeg5 and Ndeg6 The corresponding profiles A through D confirm the tubular nature of 275
the elongated objects Profiles B and D are both characterized by typical symmetrical thick 276
walls (low intensity depths highlighted by shaded rectangles) surrounding a hollow region (high 277
intensity peak between the shaded rectangles) The wall thickness varies between 35 and 40 278
nm for profile B and between 41 and 61 nm for profile D while the total nanotube diameter 279
varies between 14 nm at B and 20 nm at D At the same time the thickness of the vesicle wall 280
is about 6 nm at A and 135 nm at C Considerations about the bilayer or interdigitated structure 281
of the membrane will be presented below 282
The connection between nanotubes and vesicles seems to be multiple For instance 283
arrow Ndeg1 (Figure S 3) and Ndeg4 (Figure 3) show a single-wall vesicle of which the membrane 284
is extruded into a nanotube Similarly a closer look at arrows Ndeg1 2 and 3 in Figure 3 show 285
that the vesicle is single-wall and fully closed while the nanotube nucleates at the vesicle outer 286
surface with no apparent topological continuity In many regions of the sample at T= 90degC 287
one can find exvaginations or buds232531 in the nanotube wall This is shown for instance by 288
arrows Ndeg7 and particularly put in evidence in Figure 4 by arrows Ndeg1 through Ndeg4 where the 289
amplitude of the oscillation varies between 20-25 nm (arrow Ndeg1) and 6-8 nm (arrows Ndeg3-4) 290
291
Figure 4 - Cryo-TEM images recorded for a 5 mgmL G-C181-OH aqueous solution heated at T= 90degC 292
293
Still between Tm2 and Tm1 but at lower temperature (T= 70degC) the nanotubes seem to 294
vary from single threads (arrow Ndeg1 Figure S 4) to nanotubes of diameter below 15 nm both 295
connecting nanotubes of diameter ranging between 50 nm and 100 nm (arrows Ndeg2 Figure S 296
4) The larger tubes are most likely formed by the inflation and flattening of the nanotubes 297
probably after assimilation of surrounding vesicles and fusion of the exvagination discussed 298
above The transition between vesicles tubes and flat membranes is certainly more accentuated 299
Arrow Ndeg3 in Figure S 4 shows distinct vesicles while arrow Ndeg4 identifies a flat structure 300
evidently formed from fused vesicles In particular arrow Ndeg5 points at the fusion of two 301
2
1 132
4
12
vesicles while arrow Ndeg6 points at two vesicles fusing into the flat membrane Additional areas 302
where vesicle fusion is prominent are indicated by the oscillations at the outer skirt of broad 303
lamellae and pointed by arrow Ndeg7 304
Finally below Tm1 at T= 25degC for instance mainly flat crystals with no visible 305
exvaginations or tubes are visible (Figure S 5) by cryo-TEM and the material turns into an 306
insoluble precipitate Massive presence of flat crystalline structures is also clear from the bulk 307
iridescent behavior of a G-C181-OH solution under manual shear 308
In summary despite the uncertainty related to the actual state of equilibrium of the 309
glucolipids at the moment of cryofixation cryo-TEM depicts a vesicle phase at Tgt 100degC a 310
flat lamellar phase below Tm1 and an interconnected vesicle-nanotube network between Tm1 and 311
about 100degC The combination of statistically-relevant fluorescence microscopy and 312
scatteringdiffraction experiments provides an additional proof of the coexistence of 313
vesiclenanotube systems between the two transition temperatures Please note that the 314
experiments reported below have been performed under controlled conditions of temperature 315
which is then indicated by the use of T instead of T 316
13
317
Figure 5 ndash a-c) Confocal fluorescence microscopy images recorded at 90degC and 70degC for a 5 mgmL G-318
C181-OH aqueous solution d-g) Typical fluorescence microscopy images recorded at T= 80degC using 319
Laurdan (refer to materials and methods section for more details on this fluorophore) Excitation 320
wavelength is 405 nm for all the images while emission wavelength is 490 nm in (df) and 440 nm in (eg) 321
h) Full emission spectra obtained from the integration of various fluorescence images recorded from 412 322
nm to 600 nm (step 5 nm) at 90degC 80degC and 70degC i) Box plot of GP defined as 119918119927 =(120640120786120786120782minus120640120786120791120782)
120640120786120786120782+120640120786120791120782 with 120640120786120786120782 323
and 120640120786120791120782 being the emission wavelengths at 440 nm and 490 nm at 90degC 80degC and 70degC Each data point 324
l= 490 nm l= 440 nm
l= 490 nm l= 440 nm
10 μm400 450 500 550 600
00
02
04
06
08
10
No
rma
lize
d I
nte
nsity
l nm
90degC
80degC
80degC
70degC
70degC
400 450 500 550 60000
02
04
06
08
10
No
rma
lize
d I
nte
nsity
l nm
90degC
80degC
80degC
70degC
70degC
d) e)
f) g)
h)
i)
T= 80degC
Laurdan
T= 80degC
T= 80degC T= 80degC
T= 90degC T= 70degC T= 70degC
a) b) c)
1
1
1
14
corresponds to a set of regions of interest (ROIs) (54 at 90degC 65 at 80degC and 75 at 70degC) selected in the 325
corresponding fluorescence images ROIs were representatively selected so to include the entire image but 326
also vesicles alone tubes alone and mixtures of vesicles and tubes 327
328
Figure 5ab shows two typical confocal fluorescence microscopy images recorded on a 329
G-C181-OH solution (5 mgmL) in a flame-sealed capillary heat at T= 90degC and T= 70degC 330
Although the resolution of optical microscopy is not comparable with cryo-TEM the sample is 331
broadly composed of vesicles coexisting with nanotubes whereas in some cases the nanotube 332
starts from the vesicle itself (arrow Ndeg1) in good agreement with cryo-TEM data Furthermore 333
SANS recorded at T= 90degC (Figure S 6a) shows a scattering profile with a pronounced -2 334
dependence of the scattering intensity against the wavevector q in the log-log scale This 335
indicates the massive presence of a flat interface and it is expected typical of bilayers in 336
vesicular morphologies56 However the typical signature of nanotubes cannot be observed in 337
the SANS profile and this can be explained by both an argument related to the relative lower 338
amount of nanotubes with respect to vesicles at 90degC but also to the steeper slope of flat 339
morphologies (-2) compared to tubes (-1) the signal of the former masking the tube signal at 340
low wavevector values The SANS profile is characterized by a diffraction peak at q= 0167 Aring-341
1 of which the assignment is refined by WAXS data 342
Temperature-driven WAXS experiments in Figure S 6bc (5 mgmL-1 and 25 mgmL-1 343
respectively) show a lamellar order possibly attributed to a multilamellar structure of the 344
vesicles (dv Figure S 6d) at high temperature and to the interplanar arrangement of the 345
crystalline flat structures (dL Figure S 6d) at T= 25degC The sharp (001) reflection indicates 346
typical interlamellar distance of 353 Aring at 25degC although this value varies with temperature 347
(400 Aring at 111degC 372 Aring at 88degC) thus confirming its assignment to a hydration-dependent 348
interlamellar order More intriguing is the second broader peak at q= 0403 Aring-1 (d= 156 Aring) 349
and its reflection both clearly visible at 88degC below Tm2 We attribute it to the inter-glucolipid 350
arrangement inside the tubular phase (dt Figure S 6d) coexisting with the vesicle phase 351
between Tm1 and Tm2 and to the planar lipid arrangement (di Figure S 6d) in the rigid flat 352
lamellar structure below Tm2 Its temperature- hence hydration- independent position also 353
confirms its structural origin Finally besides the water-structure peak at about 2 Aring-1 we also 354
observe a broad peak at 144 Aring-1 characteristics of the lateral packing (d Figure S 6d) of lipids 355
in bilayers While its position could be consistent with an Lα phase5758 above Tm2 its broadness 356
and positional invariance as well as the coexistence between vesicles and tubes do not allow a 357
precise assignment 358
15
Does G-C181-OH assume a bilayer or interdigitated structure the latter being the one 359
found for other similar bolaform glucolipids4243 The size of G-C181-OH can be estimated to 360
be at the most 32 Aring given by the length L of the C16 tail (L = 22 Aring from the Tanford formula 361
L= 154 + 1265 times n (n= 16)59) and the sugar (about 10 Aring)4243 However the cis conformation 362
of the C=C bond imposes a ldquokinkrdquo of 60deg in the aliphatic chain which reduces the effective 363
length of the oleic backbone to about 17 Aring for an effective total G-C181-OH length of about 364
27 Aring Cryo-TEM provides a tube thickness varying from 35 Aring to 60 Aring and a vesicle membrane 365
thickness of at least 60 Aring WAXS suggests an interlamellar thickness (membrane and water) 366
between 40 Aring and 37 Aring and an inter-lipid distance in the tube of about 16 Aring In the absence of 367
a clear form factor oscillation profile as found for similar glucolipids4243 one must 368
acknowledge that these data pledge neither in favor of fully interdigitated nor a double layer 369
structure and might suggest a tilted lipid arrangement with partial interdigitation60 370
371
13C ssNMR demonstrates that G-C181-OH can assume two coexisting head-head and 372
head-tail configurations 373
Vesicles are characterized by low positive mean and gaussian curvatures while 374
nanotubes are described by a combination of a high positive mean and zero gaussian curvatures 375
In this regard the coexistence of vesicles and nanotubes requires glucolipids to adapt 376
themselves to both environments at the same time For this reason the formation of nanotube-377
vesicle networks generally requires a specific driving force able to impose a high mean and 378
zero gaussian curvature to the membrane In many systems insertion of at least a second 379
constituent (lipid surfactant protein) in the membrane becomes a necessary internal driving 380
force for the nucleation and growth of so-called membrane inclusions from which 381
topologically-connected nanotubes can form10ndash123261 as explained by orientational ordering 382
arguments62 It has also been shown that external driving forces such as use of laser 383
ldquotweezersrdquo30 osmotic pressure6 electroformation5ndash82829 or controlled suction13ndash16 are 384
otherwise necessary as also supported by theoretical studies19 385
The bending energy of tubes is higher than that of a vesicle membrane8 due to the 386
dependence of the membrane free energy from the principal curvatures For this reason 387
isotropic (rotational symmetry along the main axis) but also anisotropic33 lipids generally 388
stabilize low-curvature shapes like flat membranes or vesicles Lipid nanotubes are also a 389
common phase formed by amphiphiles but generally for lipids with a certain complexity in 390
their molecular structures as exampled by diacetylenic derivatives of phospholipids among 391
others262763ndash65 Negative contributions to the bending energy favoring the simultaneous 392
16
presence of interconnected vesicles and tubes was shown to be driven by the presence of 393
anisotropic lipids in a membrane continuum Spontaneous deviations to the elastic theory in the 394
presence of surfactants lipids and proteins with anisotropic structures favor the formation of 395
protrusions with radius of the order of the fraction of a micron9ndash1219ndash2362 396
In the absence of both internal and external driving forces mentioned above G-C181-397
OH should behave as a standard lipid Its DSC profile (Figure 2)536667 under both hydrated and 398
dry conditions identifies a hydration-independent transition (Tm1) slightly above room 399
temperature this is followed by one main transition at higher temperature (Tm2) in the dry 400
sample50 For such a profile one expects a gel phase (Lβ) below Tm1 and a liquid crystalline 401
structure possibly in the morphology of vesicles (L4 phase) possibly above Tm1 and most likely 402
above Tm231 as experimentally found On the basis of the thermogram recorded on the dry 403
powder one may also expect a ldquoripplerdquo (Pβ) phase between Tm1 and Tm2 characterized by 404
periodic undulations of the bilayer (generally addressed to as regions with both liquid order and 405
disorder)5455 406
In the present work instead of a Lβ phase we observe flat crystals below Tm1 and a 407
vesicle-nanotube network instead of the ldquoripplerdquo phase The latter is particularly unexpected 408
because the membrane is composed of a single-component (G-C181-OH) and no anisotropic 409
external force (osmotic hydrodynamic electric) is used to pull and stabilize the tubes In 410
addition the nanotubes are observed at fairly high temperatures above Tm1 (between about 411
60degC and 90degC) while this morphology is generally favored at low temperature (proportionality 412
with 1kT figure 5 in Ref 62) commonly below a given transition temperature characteristics 413
for each specific amphiphile27 Furthermore nanotubes of G-C181-OH seem to be stable in 414
time thus differing from what is found in electroformed vesicles78 They are also observed 415
away from phase transition events (may them be at Tm1 or Tm2) as otherwise reported before 416
for a diacetylenic derivative of phosphatidylcholine26 and many other systems27 417
A stable nanotube-vesicle network for a single-component phospholipid in the absence 418
of external driving forces is not expected and has never been reported before It could be 419
explained by the coexistence of two micro-separated phases of different rigidity This 420
hypothesis is excluded by confocal microscopy on Laurdan-labelled membranes and magic 421
angle spinning (MAS) solid-state NMR (ssNMR) experiments 422
Laurdan is a well-known fluorophore used to put in evidence the coexistence of rigid 423
and fluid domains in both model and biological membranes47ndash49 Laurdan was used here to label 424
the G-C181-OH membranes between Tm1 and Tm2 and to verify the possible micro-segregation 425
and coexistence of rigid (eg Lβ λem= 440 nm) and fluid (eg Lα λem= 490 nm) domains in 426
17
tubes and vesicles respectively A set of quantitative experiments performed on a 5 mgmL-1 427
solution summarized in Figure 5 shows an excess of fluorescence at only λem= 490 nm for 428
temperature between 90degC and 70degC (Figure 5h) The GP value which quantifies the rigidfluid 429
character of the membrane is systematically negative (Figure 5i) indicating an overall fluid 430
membrane at all temperatures GP is quantified on more than 50 regions of interest (ROIs) at 431
each temperature including vesicles and tubes alone as well as connected nanotube-vesicles 432
(Figure 5d-g) The dispersion of GP at 80degC and 70degC between -08 and -02 could suggest the 433
spurious presence of membranes with various degrees of flexibility although fluidity is always 434
predominant The combination of WAXS (broad peak d= 144 Aring-1 invariant with 435
temperature Figure S 6bc) and confocal fluorescence microscopy using Laurdan confirms the 436
single-phase of the membrane composed of G-C181-OH both in vesicles and nanotubes This 437
is also consistent with the lack of phase transitions in DSC experiments between ~85degC and 438
~60degC especially in hydrated samples We conclude that the vesicle-nanotube transition is not 439
driven by the local segregation of gel phase (Lβ) microdomains nor that the nanotubes are 440
composed of such phase 441
ssNMR is the best-suited approach to investigate the origin of the local driving force for 442
the nucleation of anisotropic inclusions of which the average orientation depends on the local 443
membrane and inclusion curvatures and was shown to promote tubing62 ssNMR can provide 444
information on the local molecular mobility eg through the nuclear spin relaxation behavior 445
but also on intermolecular interactions and stereochemistry eg through variations in the 446
chemical shift68ndash70 447
Ideally ssNMR should be performed on diluted G-C181-OH samples above Tm1 448
However fast MAS necessary for high resolution centrifuges the sample As a first 449
approximation hydrated G-C181-OH samples for instance at 50 wt as classically done for 450
phospholipids71 could be studied Unfortunately permeability of the sample holder combined 451
to heating (close to the boiling point of water) and MAS provoke dehydration and even sample 452
ejection After experiencing both of the above this approach was abandoned As a second 453
approximation the study of the dehydrated G-C181-OH powder avoids centrifugation and 454
evaporation If studying dried lipids may not reflect their exact behaviour under diluted 455
conditions valuable structural information can still be obtained in dehydrated molecular 456
systems like proteins thus illustrating that this approach is not unreasonable Furthermore if 457
DSC (Figure 2a) shows that hydration suppresses the Tm2 it also shows that the value of Tm1 is 458
not affected by water at concentrations as low as 10 wt For this reason performing a 459
structural analysis of dehydrated G-C181-OH by ssNMR above Tm1 may help understanding 460
18
the local arrangement of G-C181-OH in two morphologies vesicles and nanotubes having 461
sensibly different curvatures 462
To explore the local mobility of the most relevant chemical groups of G-C181-OH 463
above Tm2 (T= 110degC) and between Tm2 and Tm1 (70 lt T degC lt 90) we combine a series of 1H 464
and 13C experiments Single-pulse (SP) MAS experiments (1H and 13C) when recorded under 465
quantitative conditions allow the detection of all chemical species while cross-polarization 466
(CP) MAS (13C only) experiments are sensitive only to constrained groups for which the 1H-467
13C dipolar coupling is not averaged to zero by the molecular motions 468
469
Figure 6 ndash a) 1H MAS (10 kHz) ssNMR spectra recorded from 110degC to 70degC b) 13C MAS (10 kHz) ssNMR 470
spectra recorded using high power decoupling single pulse (SP) and cross-polarization (CP) pulse sequences 471
Contact time for CP experiments and corresponding temperatures are given on each spectrum Full spectra 472
are given in Figure S 7 473
The most relevant 1H and 13C spectra are given in Figure 6 (full range in Figure 7 and 474
Figure S 7) As expected the 1H solid-state SPMAS spectra show broader peaks compared to 475
the solution-state NMR spectrum (Figure 6a) reflecting the obvious solid-state character of the 476
sample at any temperature The sugar group and the C=C bond resonate in the 25-6 ppm range 477
and 535 ppm respectively while the OH groups of the sugar moiety are found below 45 ppm 478
(Figure 6a full assignment in Table S 1) Very broad (~1 ppm) at 100degC the position of the 479
OH peak varies with the temperature value and becomes narrower (lt~05 ppm) and visible at 480
δH= 464 ppm at T= 70degC Line narrowing and chemical shift variations of the OH resonance 481
in ssNMR is always a direct sign of H-bonding interactions whereas the strength of the H-482
bonding hence its OHhellipH distance is correlated to a dispersion in chemical shifts72ndash75 All other 483
60 55 50 45 40 35 30 25
ppm
110
90
80
70
910
1rsquo
6rsquo16
1
OH
134 132 130 128 126
ppm110 108 106 104 102 100
ppm
SP (T= 110degC)
SP (T= 70degC)
CP 50 ms (T= 70degC)
CP 3 ms (T= 70degC)
910 1rsquo
1H 13C
1
811
910
CH2 CH2
1rsquo
6rsquo
a) b)
C102
13024
C9101
13003
C92
12869 C1rsquo210382
C1rsquo110443
C1rsquo13035
2rsquo3rsquo4rsquo
T degC
5rsquo
19
resonances broaden from 110degC to 70degC thus indicating slower andor more anisotropic 484
reorientational motions of all chemical groups The specific dynamic behaviour of the sugar 485
headgroup is also reflected by its 1H transverse relaxation time T2 whereas the shorter the T2 486
the higher the rigidity Experiments performed between 110degC and 70degC shown and 487
commented in Figure S 8 in the Supporting Information globally show a single short (lt 1 ms 488
below 100degC) T2 relaxation component for H1rsquo H5rsquo and H6rsquo and two both short and long 489
(between 4 ms and 12 ms) T2 for the acyl chain (CH2 H910 H811) even below 100degC 490
At 110degC 13C SPMAS experiments (Figure 6b full range in Figure 7 and Figure S 7 491
assignments in Table 1) show a single peak at δC= 10335 ppm for C1rsquo and at δC= 13003 ppm 492
for C910 as expected for a symmetrical conformation with two chemically-equivalent 493
carbons76 At 70degC the C1rsquo peak disappears while C910 now shows two peaks around 128 494
ppm and 130 ppm (Table 1 full temperature series in Figure S 7b) attributed to C92 (δC= 12869 495
ppm) and C10 in a non-symmetric configuration respectively for which these two carbons are 496
chemically inequivalent76 More precisely the resonance at 130 ppm is actually the 497
superposition of two close resonances C9101 (δC= 13003 ppm) and C102 (δC= 13024 ppm) 498
where subscripts 1 and 2 stand for two different conformations of the cis-olefin group as 499
reported for various phases of oleic acid in the vicinity of 0degC76 500
501
Table 1 ndash 13C Chemical shifts of G-C181-OH in solution and solid-state Solid-state experiments are 502
recorded at MAS= 10 kHz All spectra are reported in Figure 7 and Figure S 7 The contact time for cross 503
polarization is 3 ms In all ssNMR experiments temperature is first raised at 110degC and then lowered to 504
either 90degC or 70degC Attribution of the 13C resonances in Table 1 is performed on the basis of the solution 505
spectrum (Figure S 1b) Additional peaks observed in both single pulse and cross polarization ssNMR 506
experiments are attributed when possible to a configuration effect of the given atom eg C9101 and C92 507
indicate two configurations of C9 All new peaks observed in solid-state and not detected in solution are 508
highlighted in red for convenience 509
510
511
δ ppm
Peak Liquid (DMSO-d6)
Solid Single Pulse
T= 110degC
Solid Single Pulse
T= 90degC
Solid Single Pulse
T= 70degC
Solid Cross Polarization
T= 70degC
C102
- - 13024 13024
C910C9101 13009 13003 13003 13003 13003
C1C9C10C1rsquo
C6rsquo
20
C92 - - - 12869 12869
C1rsquoC11 10329 10335 10335 - 10443
C12 - - - - 10382
C3 7724 7709 7702 - 7829
- 7634 7629 - 7621
7525
C2 7388 7398 7390 7370 7370
C4 7052 7077 7054 7041 7098
C16 6900 7016 - - 7029
- - - - 6793
C1C5C6 6153 6241 6236 6239 6262
C1C5C6 6117 - - - 5956
C2 3300 3290 3290 3283 3279
CH2(trans) - - - 3198 3196
CH2(gauche)C15 2941 2981 2987 3004 -
C811 2706 2747 2747 2832 2817
CH2 2597 2625 2628 2630 2817
512
13C CPMAS spectra at 70degC (Figure 6b full range in Figure 7 and Figure S 7d) at 513
increasing contact times confirm the presence of two cis-olefin environments one for which 514
C910 are equivalent labelled here C9101 and one for which they are inequivalent labelled 515
C92 C102 Both environments are rigid enough to be observed at short contact time (tc= 50 μs) 516
A similar double environment is also observed for the sugar C1rsquo CPMAS at 70degC shows two 517
peaks (C1rsquo1 at δC= 10443 ppm C1rsquo2 at δC= 10382 ppm Figure 6b Figure S 7d) These are 518
significantly shifted downfield from the C1rsquo peak observed at 110degC and are detected at contact 519
times as short as 50 μs thus indicating their rigid character One also finds that CPMAS is 520
totally inefficient at 100degC for short contact times (50 μs) and poorly efficient even at 3 ms 521
typical of fast-tumbling molecules (Figure S 7c) also both gauche (δC= 3004 ppm) and all-522
trans (δC= 3198 ppm) conformations of the CH2 carbons coexist at 70degC (Figure S 7b)77 523
According to ssNMR one main mobile molecular environment exists at 110degC as 524
shown by the well-resolved 1H spectrum single C=C (C9101) and anomeric (C1rsquo) resonances 525
gauche conformation of the aliphatic CH2 and single T2 of the aliphatic CH2 chain and sugar 526
protons The sugar group is certainly mobile (inefficient 1H13C CPMAS) but still more 527
constrainted than the acyl chain (shorter T2 (1H)) As the temperature is lowered the overall 528
rigidity increases (broadening of 1H NMR peaks faster 1H transverse relaxation and efficient 529
1H13C magnetization transfer during CPMAS) presumably driven by H-bonding 530
interactions (downfield shift and line narrowing of the OH 1H signal very short OH T2 loss of 531
the C1rsquo signal in SPMAS) At the same time a number of spectroscopic data (two concomitant 532
21
resonances for anomeric C1rsquo1 and C1rsquo2 cis-olefin C9101 and C92 C102 and CH2 gauche and 533
all-trans environments) and relaxation behaviour (fast and slow T2 relaxation components) 534
strongly suggests the coexistence of two molecular environments Further proofs of the 535
coexistence of two distinct molecular domains are given by a number of chemical shift 536
variations in the 13C CPMAS spectrum at 70degC compared to the one at 110degC 90degC and 537
solution This is shown in Figure 7 and in the list of 13C chemical shifts in Table 1 538
539
540
Figure 7 - Comparison between solution- and solid-state 13C NMR spectra of G-C181-OH Solid-state 541
experiments are recorded directly on the sample powder at a MAS of 10 kHz (4 mm zirconia rotor) SP 542
Single Pulse CP Cross Polarization In all the ssNMR experiments temperature is first raised at 110degC 543
and then lowered to either 90degC or 70degC Segmented lines are meant to highlight the known peak position 544
in solution thus stressing the strong chemical shift variations in the solid-state 545
546
NMR experiments above Tm2 suggest that vesicles could contain G-C181-OH with a 547
single family of mobile conformations characterized by chemically-equivalent C=C (red 548
Figure 8b) and a single C1rsquo conformation (green Figure 8b) Experiments between Tm1 and Tm2 549
otherwise suggest that two coexisting conformations characterized by chemically-equivalent 550
(red Figure 8b) and inequivalent (magenta Figure 8b) C=C could be associated to nanotubes 551
Two distinct C1rsquo sites (grey Figure 8b) also indicate two configurations of the sugar headgroup 552
A comment on this point will be given in the following paragraphs 553
The local (Aring-scale) variation of molecular mobility below Tm2 drives the coexistence of 554
two distinct molecular environments of the same G-C181-OH molecule This occurs within a 555
single-phase domain (as deduced by WAXS) of equivalent membrane rigidity (as derived from 556
Laurdan probe in confocal microscopy) Although never reported before the difference in the 557
local mobility of the same amphiphile (here G-C181-OH) could satisfy the theoretically-558
140 120 100 80 60 40 20
CP(3 ms)-70degC
SP-70degC
SP-90degC
SP-110degC
ppm
LiquidC910
C1rsquo
C2rsquo
C4rsquo
C3rsquo
C1
C6rsquoC5rsquo
C1
6
C8
11
C2 C
H2
C1
5
CH
2
DM
SO
13C
22
required conditions that induce local lipid segregation and formation of membrane inclusions 559
(Figure 8c) In case of their non-zero average orientation the local membrane curvature 560
increases62 and nanotubes can spontaneously form (Figure 8bc) More intriguing this 561
mechanism occurs at least 10degC above Tm1 although it should not be favored above the Tm27 562
From both experimental and theoretical backgrounds the conditions of topologically-563
connected vesicles-nanotubes systems are met only when either internal (two components) or 564
external driving forces are applied19 In the present single-lipid system of which the phase 565
behavior is summarized in Figure 8a the most plausible driving force could be explained by 566
the NMR results collected on the dry sample G-C181-OH concomitantly occupies two 567
molecular environments characterized by 1) two distinct conformations of the sugar 568
displaying equivalent mobility and 2) two conformations of the acyl chain unsaturation 569
570
23
571
Figure 8 ndash a) Thermotropic phase behavior of G-C181-OH at 5 mgmL-1 Note that Tm2 is observed on the 572
dry powder only b) Possible relationship between the molecular environment as derived from NMR and 573
membrane curvatures All the molecular drawings refer to the same G-C181-OH molecule (bulky ellipsoid 574
equiv sugar headgroup) while each color corresponds to a given configuration Grey of C1rsquo1 and C1rsquo2 indicates 575
the uncertainty about the assignment of the specific NMR peak The curvature C is defined as 1R R being 576
the curvature radius R1 R2 radius of curvature CG Gauss curvature CM Mean curvature c) Free 577
interpretation of the anisotropic high-curvature (CMgt 0 CG= 0) inclusions in the membrane (low CM and 578
CG) continuum driven by inter-sugar H-bonding and reduced intramembrane diffusion for a G-C181-OH 579
glucolipid 580
581
Flat crystalline structure
Nanotube-vesicle network
Vesicles
48degC
120deg
106 105 104 103 102 101
ppm
H9 H10H1rsquo
106 105 104 103 102 101
ppm106 105 104 103 102 101
ppm106 105 104 103 102 101
ppm
C=CC=C
C1rsquo1C1rsquo2
C1rsquo
Tm2(96degC)Tm1
a)
b)
c)
Same molecule different local orientations and sugar conformations
High curvature membrane
Low curvature inclusion
Flip-FlopStrong H-bonding
CG
CM ( + )
CG 0
CM 0 CG 0
CM 0
G-C181-OH
24
Two related questions are unanswered at the moment What actually drives nanotube 582
formation and is the organization of G-C181-OH within the vesicles and tubes the same Lipid 583
nanotubes have been studied for at least three decades over which broad experimental and 584
theoretical insight has been generated Despite this fact the actual understanding is still matter 585
of debate27 Micelle-to-nanotube and vesicle-to-nanotube phase transitions are generally 586
reported for single amphiphiles below a given Tm and intermediate phase composed of twisted 587
and flat fibers is concomitantly reported Initially thought to be a chirality-driven phenomenon 588
recent studies propose a more general mechanism involving crystallization and symmetry 589
breaking in the lipid packing driven by optimal packing27 If twisted ribbons were observed 590
before for a number of microbial glycolipid bolaamphiphiles44 they are not found for G-C181-591
OH This fact as well as the large body of cryo-TEM images and the observation of nanotubes 592
above Tm1 rather pledge in favour of a direct topological change from positive (vesicles) to 593
zero (nanotubes) Gaussian curvatures In this case vesicle-to-nanotube transitions could be 594
driven by external forces56307813ndash162829 595
Considering the absence of external forces in the present system there are only two 596
possibilities left spontaneous budding of the membrane or nanotube pulling after inter-vesicle 597
collisions due to Brownian motion Both are possible as inclusions composed of a different 598
arrangement of the same molecule in the membrane continuum can theoretically explain 599
spontaneous nanotube formation in an isotropic medium672223629ndash1218ndash21 However the second 600
one is probably more likely to prevail because it could explain the large number of nanotubes 601
connecting two distant vesicles Interestingly similar events occur for any phospholipid-based 602
vesicular solution but nanotubes are extremely rare unless at least two lipids of different 603
molecular structure are mixed together The spectroscopic 1H and 13C and relaxation (1H) 604
ssNMR data even if collected on a dry powder demonstrate that the coexistence of two G-605
C181-OH configurations involving both the sugar headgroup and fatty alcohol chain are 606
possible for this molecule As a matter of fact this is not so surprising as more than one energy 607
minima each corresponding to a given conformation are known for glucose its non-reducing 608
derivative methylglucose and carbohydrates in general78ndash80 609
The presence of two configurations could explain the coexistence between two 610
structures of different curvature but the data presented so far do not explain the origin of these 611
two configurations In other words what drives the change in the local structure of the sugar 612
headgroup and fatty alcohol within the membrane 613
The association of known self-assembled structures to spectroscopic 13C ssNMR data is 614
known for years in particular for gluconamides lipids having a linear sugar headgroup81ndash84 It 615
25
was found that gauche effects in some cases up to the γ position in the sugar chain induce 616
upfield chemical shifts while anti and trans conformations result in downfield shifts Each 617
structure (monolayer crystal bilayer crystal or micellar fiber) was then characterized by a given 618
organization of the gluconamide and a characteristic 13C ssNMR fingerprint which could be 619
explained by gauche γ-gauche anti and trans conformations of the headgroup Similar 620
structural-spectroscopic correlations have been collected over the years for much simpler cyclic 621
sugars85 whereas pyranoses can undergo important conformational changes (chair half-chair 622
boat skew) when the appropriate energy barriers are crossed78ndash8086 A quantitative 623
conformational study based on the 13C chemical shift variations shown in Table 1 would be 624
certainly helpful but very delicate in the context of the present state of the art because a 625
rigorous approach requires at least one known crystal structure8182 which is currently missing 626
for this compound A qualitative approach will then be adopted 627
G-C181-OH is a bolaform amphiphile and flip-flop could be a possible mechanism 628
involved in the nanotube stabilization whereas head-tail interactions have long been considered 629
as important in nanotube-forming bolaform amphiphiles6063 From mere considerations based 630
on T2 (1H) relaxation arguments one could exclude head-tail configurations if the R-CH2OH 631
endgroup (H1) was involved in a direct interaction with the sugar group its corresponding T2 632
would probably be comparable to the sugarrsquos one (OH and H1rsquo) but this does not seem to be 633
the case However this hypothesis would be based on the comparison of the relaxation from 634
CH and CH2 protons additionally involved in different kind of motions Besides the relaxation 635
of H1 is influenced by the strong overlap between H1 and H5rsquo For these reasons relaxation 636
arguments are not solid enough and will not be used 637
We then address this question by exploring intermolecular interactions in a direct 638
manner using 2D 1H-1H homonuclear ssNMR correlation spectroscopy At 90degC in the fast-639
tumbling domain of molecular motion (narrow 1H NMR peaks Figure 6a) and corresponding 640
to the vesicle-rich region spin diffusion (NOESY) experiments are preferred over dipolar 641
coupling based experiments because such interaction is averaged out by molecular motion 642
However when the molecular motion is more constrained in the domain of nanotube stability 643
at 70degC (broad 1H spectra Figure 6a) Double-Quantum Single-Quantum (DQ-SQ) correlation 644
experiments are best suited to probe interaction between close molecular neighbors These 645
experiments are reported in Figure 9 and the related interpretation is only briefly reported 646
below while a more detailed discussion can be found on Page 12 in the Supporting Information 647
26
648
Figure 9 ndash a) 2D 1H-1H NOESY NMR experiment performed at MAS= 10 kHz (4 mm probe) on a Bruker 649
300 MHz Avance III HD spectrometer using 300 ms of mixing time Sample temperature is regulated to 650
90degC reached by cooling from 110degC b) 2D 1H-1H DQ-SQ (BAck-to-BAck BABA pulse sequence used for 651
the DQ excitation scheme) NMR experiment performed at MAS= 22 kHz (25 mm probe) on a Bruker 700 652
MHz Avance III spectrometer using a DQ excitation time equal to 2 rotor periods Sample temperature is 653
regulated to 70degC reached by cooling from 110degC The typical schemes illustrating how to interpret these 654
2D experiments are reported above each experimental map Zooms of the sugar region and configurational 655
interpretation are given below each 2D map More information are given in the text below 656
H16-H16
H1-H1
H9-H10
H1rsquo-H1
H1rsquoH910 H16
H1
H1rsquo-H1rsquo
Hxrsquo-Hxrsquo
2
(pp
m)
(ppm)
315
811910 1rsquo
2rsquo2
3rsquo 4rsquo6rsquo
5rsquo
1rsquo2910
asymp asymp asympHDO MeOD Acetone
1
315
811 9101rsquo
2rsquo2
3rsquo4rsquo6rsquo
5rsquo
1rsquo2 9 10
asympasympasympHDOMeODAcetone
H1rsquo-H1
1rsquo
1
(p
pm
)
(ppm)
H1-H2
H1rsquo-H1
H1rsquo
H910
H1H5rsquo
H2
H1rsquo-H5rsquo
315
811910 1rsquo
2rsquo2
3rsquo 4rsquo6rsquo
5rsquo
1rsquo2910
asymp asymp asympHDO MeOD Acetone
1
H2rsquoH3rsquoH4rsquo
H2rsquoH3rsquoH4rsquo
X= 2rsquo3rsquo4rsquo
NOESY - T= 90degC
1H
1H
1H
1H
DQ-SQ - T= 70degC
a) b)
2
(pp
m)
(p
pm
)
(ppm)
A B
AhellipB
AhellipA
BhellipB
NOESY
(ppm)
A B
AhellipB
DQ-SQ
Single-quantum dimension
Do
ub
le-q
ua
ntu
m d
imen
sio
n
AhellipA
BhellipB
BhellipA
BhellipA
315
811910 1rsquo
2rsquo2
3rsquo 4rsquo6rsquo
5rsquo
1rsquo2910
asymp asymp asympHDO MeOD Acetone
1
lt 5 Aring
lt 5 Aring
H1-H2
H811
H15
H16
H6rsquo
H1rsquo
H1
H5rsquo
H2
H1-H2
H1rsquo-H1
H1rsquo-H5rsquo
H1rsquo
H1 H5rsquo
H1rsquo
H1
H5rsquo
H1H2rsquo H3rsquo H4rsquo
H1-H1
H1rsquo-H1
Hxrsquo-HxrsquoX= 2rsquo3rsquo4rsquo
H1-H2
H1rsquo
Zoom sugar region 28 ndash 45 ppmNOESY DQ-SQ
27
Head-tail or head-head configurations could be probed by the existence of H1rsquo-H1 657
interactions whereas H1 (δH= 356 ppm) is associated to the glucolipid tail and H1rsquo (δH= 432 658
ppm) to the sugar headgroup These atoms are more than 15 Aring apart and a direct interaction 659
could not be observed in both NOESY and DQ-SQ experiments NOESY experiments (Figure 660
9a) show that H1rsquo-H1 correlations are not observed Meanwhile clear-cut direct H1rsquo-H1 661
interactions are indeed observed are detected at T= 70degC (DQ cross-peaks related to H1rsquo-H1 662
correlation in DQ-SQ experiment shown in Figure 9b) Interestingly the absence of auto peaks 663
at δH= 432 ppm and δH= 335 ppm in the SQ dimension excludes H1rsquo-H1rsquo and Hxrsquo-Hxrsquo (x= 2 664
3 4) interactions respectively strengthening the idea that sugar headgroups from two nearest-665
neighbor G-C181-OH molecules are not adjacent in the nanotube-vesicle region 666
Homonuclear 2D ssNMR supports the idea according to which G-C181-OH can 667
undergo molecular flip-flops and a head-tail arrangement in the dry product Extrapolating these 668
conclusions in the lower concentration range lack of H1rsquo-H1 proximity at T= 90degC suggests a 669
head-head configuration in the vesicle-rich region and head-tail configuration within the 670
nanotubes It is however still unclear whether flip-flops are driven by spontaneous temperature-671
induced conformational changes in the glucolipid packing stimulating inclusions within the 672
membrane itself672223629ndash1218ndash21 or by defects generated by inter-vesicle collisions In fact a 673
combination of both is not unlikely Nanotubes are not stable when temperature is 20 to 30 674
degrees above Tm1 indicating that inter-vesicle collisions alone cannot explain the unusual 675
phenomenon In an energy landscape approach87 the head-head configuration is certainly 676
favored at high temperature while both head-head and head-tail configurations could be 677
favored in the mid-temperature region corresponding to the range between Tm1 and Tm2 in the 678
dry powder Both statistical and defect-induced flip-flop events contribute to form high mean 679
zero Gaussian curvature morphologies (nanotubes) for which the head-tail conformation 680
limiting the proximity between bulky sugar headgroups is probably more adapted (Figure 8c) 681
The flip-flop interpretation now reasonably explains the strong differences in the sugar and fatty 682
alcohol conformations deduced by the multiple NMR signals attributed to chemically-683
equivalent groups The existence of various low-energy conformations each having specific 684
NMR signature for sugars in solution78ndash8086 and solid-state81ndash84 further supports our 685
interpretation 686
One last point should be clarified Why between Tm1 and Tm2 are two molecular 687
environments able to coexist instead of a single one of average rigidity as found in the case of 688
ldquoripplerdquo phases50ndash54 We believe that this question can be answered based on the NMR results 689
the relatively short T2 values of the H1rsquo and OH protons shows the constrained mobility of the 690
28
sugar headgroup despite a certain flexibility of the chain (long T2 component) This trend may 691
suggest restrictions in translational mobility probably due to the sugar-OH hydrogen bonding 692
(Figure 8c) meaning that lipids are not able to diffuse within the membrane thus keeping two 693
different configurations stable 694
695
Conclusions 696
Topologically-connected nanotube-vesicle lipidic systems are commonly observed for 697
self-assembled membranes composed of at least two amphiphiles and spontaneously driven by 698
anisotropic inclusions andor by external directional forces This work shows that strong 699
differences in membrane curvature can spontaneously occur in single-lipid systems without 700
external anisotropic forces Coexistence and interconnection between nanotubes and vesicles 701
are evidenced via cryo-TEM and fluorescence confocal microscopy in a single-phase region at 702
temperature above a transition temperature Tm1= 483degC determined by DSC on the hydrated 703
sample but below the second transition temperature Tm2 (957degC) determined by DSC on the 704
dry powder X-ray diffraction (WAXS) also shows the coexistence of two lattice periods one 705
attributed to an inter-membrane repeating distance and the other possibly related to the intra-706
nanotube glucolipid arrangement Labelling the systems with Laurdan a fluorophore of which 707
the emission strongly varies with the local membrane rigidity excludes the presence of rigid 708
micro-separated phases (eg Lβ) 709
1H and 13C ssNMR despite the fact that it can only be performed on the dry powder 710
confirm the presence of one main fluid G-C181-OH environment above Tm2 Below Tm2 the 711
splitting of some 13C peaks and the coexistence of short and long 1H relaxation components 712
demonstrate that G-C181-OH can simultaneously pack into structurally and dynamically 713
inequivalent environments Combining advanced 2D 1H-1H correlation experiments based on 714
spin diffusion or double-quanta excitation suggests that vesicles could contain a preferred head-715
head configuration of the bolaform lipid while nanotubes a preferred head-tail assembly 716
The presence of two environments composed of the same molecule characterized by 717
different molecular configurations and rigidity fulfills the theoretical conditions necessary to 718
spontaneously nucleate a membrane inclusion of non-zero average orientation described as 719
necessary to observe topologically-connected nanotube-vesicle structures in the absence of 720
external forces This hypothesis could also be enriched by the possibility of nanotubes to be 721
pulled away between two vesicles after a collision event 722
This work expands the actual theoretical and experimental framework on lipid networks 723
stabilized by a different radius of curvature It could also motivate the synthesis or isolation 724
29
of new lipids providing a higher level of 3D architectural control in soft networks possibly in 725
the range of room temperature 726
727
Acknowledgements 728
Dr Andrea Lassenberger and Dr Sylvain Preacutevost at Institut Laue Langevin (ILL Grenoble 729
France) are kindly acknowledged for their assistance on the SANS experiment Confocal 730
images were performed at the Institut de Biologie Paris Seine (IBPS) imaging facility Jean-731
Franccedilois Gilles (Imaging Core Facility Institut de Biologie Paris Seine (IBPS) CNRS 732
Sorbonne Universiteacute Paris France) is kindly acknowledged for his assistance on the confocal 733
microscopy imaging Dr Guillaume Laurent (LCMCP Sorbonne Universiteacute Paris France) is 734
kindly acknowledged for helpful discussions The French region Ile-de-France SESAME 735
program is acknowledged for financial support (700 MHz NMR 736
spectrometer) Dr Olivier Diat (ICSM Marcoule France) Prof eronikaIglič and Prof V Aleš737
onsul discussi Slovenia) are kindly acknowledged for helpfUniversity of LjubljanaIglič (-Kralj 738
739
Financial support 740
WAXS experiments have been supported by Soleil Light Source Saint Aubin France proposal 741
Ndeg 20201747 SANS experiments have been supported by ILL proposal Ndeg9-13-778 742
743
References 744
1 D Kabaso N Bobrovska W Goacuteźdź E Gongadze V Kralj-Iglič R Zorec and A 745
Iglič Bioelectrochemistry 2012 87 204ndash210 746
2 C R Safinya U Raviv D J Needleman A Zidovska M C Choi M A Ojeda-747
Lopez K K Ewert Y Li H P Miller J Quispe B Carragher C S Potter M W 748
Kim S C Feinstein and L Wilson Adv Mater 2011 23 2260ndash2270 749
3 P Veranič M Lokar G J Schuumltz J Weghuber S Wieser H Haumlgerstrand V Kralj-750
Iglič and A Iglič Biophys J 2008 95 4416ndash4425 751
4 A Rustom R Saffrich I Markovic P Walther and H-H Gerdes Science (80- ) 752
2004 303 1007ndash1010 753
5 M I Angelova S Soleacuteau P Meacuteleacuteard F Faucon and P Bothorel Prog Colloid 754
Polym Sci 1992 89 127ndash131 755
6 L Mathivet S Cribier and P F Devaux Biophys J 1996 70 1112ndash1121 756
7 V Kralj-Iglič G Gomišček J Majhenc V Arrigler and S Svetina Colloids Surfaces 757
A Physicochem Eng Asp 2001 181 315ndash318 758
30
8 V Kralj-Iglič A Iglič G Gomišček F Sevšek V Arrigler and H Haumlgerstrand J 759
Phys A Math Gen 2002 35 1533ndash1549 760
9 M Drab D Stopar V Kralj-Iglič and A Iglič Cells 2019 8 626 761
10 A Zidovska K K Ewert J Quispe B Carragher C S Potter and C R Safinya 762
Langmuir 2009 25 2979ndash2985 763
11 A Zidovska K K Ewert J Quispe B Carragher C S Potter and C R Safinya Soft 764
Matter 2011 7 8363ndash8369 765
12 A Zidovska K K Ewert J Quispe B Carragher C S Potter and C R Safinya 766
Biochim Biophys Acta - Biomembr 2009 1788 1869ndash1876 767
13 M Karlsson K Sott M Davidson A S Cans P Linderholm D Chiu and O Orwar 768
Proc Natl Acad Sci U S A 2002 99 11573ndash11578 769
14 A Karlsson R Karlsson M Karlsson A-S Cans A Stromberg F Ryttsen and O 770
Orwar Nature 2001 409 150ndash152 771
15 M Karlsson K Sott A S Cans A Karlsson R Karlsson and O Orwar Langmuir 772
2001 17 6754ndash6758 773
16 E Evans H Bowman A Leung D Needham and D Tirrell Science (80- ) 1996 774
273 933ndash935 775
17 U Seifert Configurations of fluid membranes and vesicles 1997 vol 46 776
18 J Kaumls and E Sackmann Biophys J 1991 60 825ndash844 777
19 N Bobrovska W Goacuteźdź V Kralj-Iglič and A Iglič PLoS One 2013 8 e73941 778
20 A Iglič B Babnik K Bohinc M Fošnarič H Haumlgerstrand and V Kralj-Iglič J 779
Biomech 2007 40 579ndash585 780
21 K Bohinc T Slivnik A Iglič M Brumen and V Kralj-Iglič J Phys Chem C 2007 781
111 9709ndash9718 782
22 A Iglič H Haumlgerstrand P Veranič A Plemenitaš and V Kralj-Iglič J Theor Biol 783
2006 240 368ndash373 784
23 V Kralj-Iglič and P Veranič Adv Planar Lipid Bilayers Liposomes 2006 5 129ndash785
149 786
24 A Iglic and V Kralj-Iglic Adv Planar Lipid Bilayers Liposomes 2006 4 253ndash279 787
25 S Penič L Mesarec M Fošnarič L Mroacutewczyńska H Haumlgerstrand V Kralj-Iglič and 788
A Iglič Front Phys 2020 8 342 789
26 P Yager and P E Schoen Mol Cryst Liq Cryst 1984 106 371ndash381 790
27 T G Barclay K Constantopoulos and J Matisons Chem Rev 2014 114 10217ndash791
10291 792
31
28 B Božič G Gomišček V Kralj-Iglič S Svetina and B Žekš Eur Biophys J 2002 793
31 487ndash496 794
29 A Iglič H Haumlgerstrand M Bobrowska-Haumlgerstrand V Arrigler and V Kralj-Iglič 795
Phys Lett A 2003 310 493ndash497 796
30 R Bar-Ziv and E Moses Phys Rev Lett 1994 73 1392ndash1395 797
31 S Chiruvolu H E Warriner E Naranjo S H Idziak J O Raumldler R J Plano J A 798
Zasadzinski and C R Safinya Science (80- ) 1994 266 1222ndash1225 799
32 V Kralj-Iglič A Iglič H Haumlgerstrand and P Peterlin Phys Rev E 2000 61 4230ndash800
4234 801
33 L Mesarec M Drab S Penič V Kralj-Iglič and A Iglič Int J Mol Sci 2021 22 802
2348 803
34 L Van Renterghem S L K W Roelants N Baccile K Uyttersprot M C Taelman 804
B Everaert S Mincke S Ledegen S Debrouwer K Scholtens C V Stevens W 805
Soetaert L Van Renterghem S L K W Roelants N Baccile K Uytersprot M C 806
Taelman B Everaert S Mincke S Ledegen S Debrouwer K Scholtens C V 807
Stevens and W Soetaert Biotechnol Bioeng 2018 115 1195ndash1206 808
35 J Clark and F Deswarte Introduction to Chemicals from Biomass Second Edition 809
John Wiley amp Sons 2015 810
36 K V Sajna R Houmlfer R K Sukumaran L D Gottumukkala and A Pandey in 811
Industrial Biorefineries and White Biotechnology eds A Pandey R Houmlfer M 812
Taherzadeh K M Nampoothiri and C Larroche Amsterdam Oxford Waltham 813
Elsevier 2015 pp 499ndash521 814
37 R Marchant and I M Banat Trends Biotechnol 2012 30 558ndash565 815
38 K Hill and C LeHen-Ferrenbach in Sugar-Based Surfactants Fundamentals and 816
Applications ed C C Ruiz Boca Raton CRC Press 2009 pp 1ndash20 817
39 L Rodrigues I M Banat J Teixeira and R Oliveira J Antimicrob Chemother 818
2006 57 609ndash618 819
40 J D Desai and I M Banat Microbiol Mol Biol Rev 1997 61 47ndash64 820
41 S L K W Roelants K Ciesielska S L De Maeseneire H Moens B Everaert S 821
Verweire Q Denon B Vanlerberghe I N A Van Bogaert P Van der Meeren B 822
Devreese and W Soetaert Biotechnol Bioeng 2016 113 550ndash559 823
42 N Baccile M Selmane P Le Griel S Preacutevost J Perez C V Stevens E Delbeke S 824
Zibek M Guenther W Soetaert I N A Van Bogaert and S Roelants Langmuir 825
2016 32 6343ndash6359 826
32
43 N Baccile A-S Cuvier S Preacutevost C V Stevens E Delbeke J Berton W Soetaert 827
I N A Van Bogaert and S Roelants Langmuir 2016 32 10881ndash10894 828
44 N Baccile C Seyrig A Poirier S A Castro S L K W Roelants and S Abel Green 829
Chem 2021 23 3842ndash3944 830
45 A Salis L Cappai C Carucci D F Parsons and M Monduzzi J Phys Chem Lett 831
2020 11 6805ndash6811 832
46 J Schindelin I Arganda-Carreras E Frise V Kaynig M Longair T Pietzsch S 833
Preibisch C Rueden S Saalfeld B Schmid J-Y Tinevez D J White V 834
Hartenstein K Eliceiri P Tomancak and A Cardona Nat Methods 2012 9 676ndash835
682 836
47 T Parasassi and E Gratton J Fluoresc 1995 5 59ndash69 837
48 M M Dodes Traian F L Gonzaacutelez Flecha and V Levi J Lipid Res 2012 53 609ndash838
616 839
49 D M Owen C Rentero A Magenau A Abu-Siniyeh and K Gaus Nat Protoc 840
2012 7 24ndash35 841
50 W Stillwell in An Introduction to Biological Membranes Academic Press 2016 pp 842
135ndash180 843
51 W Stillwell in An Introduction to Biological Membranes Academic Press 2016 pp 844
181ndash220 845
52 B Tenchov Chem Phys Lipids 1991 57 165ndash177 846
53 R Koynova and M Caffrey Biochim Biophys Acta 1998 1376 91ndash145 847
54 F Schmid S Dolezel O Lenz and S Meinhardt J Phys Conf Ser 2014 487 848
012004 849
55 S Meinhardt R L C Vink and F Schmid Proc Natl Acad Sci U S A 2013 110 850
4476ndash4481 851
56 O Glatter and O Kratky Small Angle X-ray Scattering Academic Press London 852
1982 853
57 B A Cunningham A D Brown D H Wolfe W P Williams and A Brain Phys 854
Rev E 1998 58 3662ndash3672 855
58 M Nadler A Steiner T Dvir O Szekely P Szekely A Ginsburg R Asor R Resh 856
C Tamburu M Peres and U Raviv Soft Matter 2011 7 1512ndash1523 857
59 C Tanford The hydrophobic effect Formation of micelles and biological membranes 858
John Wiley amp Sons Inc New York 1973 859
60 M Masuda and T Shimizu Langmuir 2004 20 5969ndash5977 860
33
61 A Zidovska K K Ewert J Quispe B Carragher C S Potter and C R Safinya 861
Block Liposomes Vesicles of Charged Lipids with Distinctly Shaped Nanoscale 862
Sphere- Pear- Tube- or Rod-Segments Elsevier Inc 1st edn 2009 vol 465 863
62 A Iglic V Kralj-Iglic B Božič M Bobrowska-Haumlgerstrand B Isomaa and H 864
Haumlgerstrand Bioelectrochemistry 2000 52 203ndash211 865
63 T Shimizu M Masuda and H Minamikawa Chem Rev 2005 105 1401ndash1444 866
64 J V Selinger and J M Schnur Phys Rev Lett 1993 71 4091ndash4094 867
65 J M Schnur Science (80- ) 1993 262 1669ndash1676 868
66 B Tenchov R Koynova and G Rapp Biophys J 2001 80 1873ndash1890 869
67 R Koynova and B Tenchov Ser Biomech 2017 31 3ndash19 870
68 S J Angyal and R Le Fur Carbohydr Res 1984 126 15ndash26 871
69 J K Whitesell and M A Minton J Am Chem Soc 1987 109 225ndash228 872
70 T Takayama S Ando and I Ando J Mol Struct 1990 220 245ndash250 873
71 K Gawrisch N V Eldho and I V Polozov Chem Phys Lipids 2002 116 135ndash151 874
72 F Tielens C Gervais J F Lambert F Mauri and D Costa Chem Mater 2008 20 875
3336ndash3344 876
73 G A Jeffrey and Y Yeon Acta Crystallogr Sect B 1986 42 410ndash413 877
74 B Berglund and R W Vaughan J Chem Phys 1980 73 2037ndash2043 878
75 C Gervais C Coelho T Azaiumls J Maquet G Laurent F Pourpoint C Bonhomme 879
P Florian B Alonso G Guerrero P H Mutin and F Mauri J Magn Reson 2007 880
187 131ndash140 881
76 C Akita T Kawaguchi F Kaneko H Yamamoto and M Suzuki J Phys Chem B 882
2004 108 4862ndash4868 883
77 R N Purusottam L Seacutenicourt J J Lacapegravere and P Tekely Biochim Biophys Acta - 884
Biomembr 2015 1848 3134ndash3139 885
78 X Biarneacutes A Ardegravevol A Planas C Rovira A Laio and M Parrinello J Am Chem 886
Soc 2007 129 10686ndash10693 887
79 L M J Kroon‐Batenburg and J Kroon Biopolymers 1990 29 1243ndash1248 888
80 K N Kirschner and R J Woods Proc Natl Acad Sci U S A 2001 98 10541ndash889
10545 890
81 S Svenson B Kirste and J H Fuhrhop J Am Chem Soc 1994 116 11969ndash11975 891
82 I Sack S Macholl J H Fuhrhop and G Buntkowsky Phys Chem Chem Phys 892
2000 2 1781ndash1788 893
83 S Svenson J Koening and J H Fuhrhop J Phys Chem 1994 98 1022ndash1028 894
34
84 S Svenson A Schaefer and J H Fuhrhop J Chem Soc Perkin Trans 2 1994 2 895
1023ndash1028 896
85 K Bock and C Pedersen Adv Carbohydr Chem Biochem 1983 41 27ndash66 897
86 T B Grindley Structure and Conformation of Carbohydrates Springer Berlin 898
Heidelberg 2008 899
87 F Tantakitti J Boekhoven X Wang R V Kazantsev T Yu J Li E Zhuang R 900
Zandi J H Ortony C J Newcomb L C Palmer G S Shekhawat M O De La 901
Cruz G C Schatz and S I Stupp Nat Mater 2016 15 469ndash476 902
903
1
Supporting Information 904
905
Topological connection between vesicles and nanotubes in single-906
component lipid membranes driven by head-tail interactions 907
908
Niki Baccilea Ceacutedric Lorthioira Abdoul Aziz Baa Patrick Le Griela Cristina Coelhob Javier 909
Perezc Wim Soetaertd Sophie L K W Roelantsd 910
911
a Sorbonne Universiteacute Centre National de la Recherche Scientifique Laboratoire de Chimie de 912
la Matiegravere Condenseacutee de Paris LCMCP F-75005 Paris France 913
b Institut des Mateacuteriaux de Paris Centre Sorbonne Universiteacute Paris France 914
c Synchrotron Soleil LrsquoOrme des Merisiers Saint-Aubin BP48 91192 Gif-sur-Yvette Cedex 915
France 916
d InBio Department of Biotechnology Ghent University Ghent Belgium 917
918
919
Corresponding author 920
Dr Niki Baccile 921
E-mail address nikibaccilesorbonne-universitefr 922
Phone +33 1 44 27 56 77 923
924
925
926
2
a) 927
Parameter Method
Dry Matter (DM ) 996 Infrared balance 105degC
Glucose () 012 HPLC-Metacarb
Glycerol () nd HPLC-Metacarb
Free Fatty Acid content () lt001 Internal method BBEPP
GC with FID Detector
Oil () lt001 Internal method BBEPP
GC with FID Detector
Moulds (CFUg) lt10 3M-Nordval ndeg16 B
Yeasts (CFUg) lt10 3M-Nordval ndeg16 B
Anaerobic count (CFUg) lt10 SP-VG M005 B
Protein () tbd BCA protein assay
928
Figure S 1 - a) HPLC-ELSD chromatogram and composition table 929
930
931
932
933
3
b) 934
935
Group Ndeg δ ppm
CH2 1 354
CH2 2 153
CH2 3-712-14 132
CH2 811 203
CH 910 534
CH2 15 162
CH2 16 388
CH 1 424
CH 2 316
CH 3 334
CH 4 329
CH 5 354
CH2 6 366
Figure S 1 (next) ndash b) 1H NMR spectrum (MeOD-d4) recorded on the purified G-C181-OH compounds 936
and related assignment 937
938
2
811910 1rsquo
5rsquo1
3rsquo4rsquo
1rsquo1910
asymp asymp asympHDO MeOD Acetone
6rsquo2rsquo
1615
3-712-14
4
939
940
Figure S 2 ndash Cryo-TEM images recorded for a 5 mgmL G-C181-OH aqueous solution heat at T= 130degC 941
5
942
943
Figure S 3 - Cryo-TEM images recorded for a 5 mgmL G-C181-OH aqueous solution heat at T= 90degC 944
945
90degC
1
22
6
946
947
948
949
Figure S 4 ndash Cryo-TEM images recorded for a 5 mgmL G-C181-OH aqueous solution heat at T= 70degC 950
951
21
11
1
2
5
3
4
45
5
6
7
7
7
952
953
954
Figure S 5 ndash Cryo-TEM images recorded for a 5 mgmL G-C181-OH aqueous solution heat at T= 25degC 955
956
957
1
1 1
8
958
Figure S 6 ndash a) SANS experiment recorded at 90degC for a 5 mgmL G-C181-OH aqueous solution b-c) 959
WAXS experiments recorded on aqueous solutions of G-C181-OH at b) 5 mgmL and c) 25 mgmL d) 960
Structural interpretation of the repeating distances pointed out in c) 961
962
963
964
001 01 1
q Aring-1
25degC
68degC
88degC
111degC
01 1q Aring
-1
02 04 06 08 1q Aring
-1
001 01
10-1
100
101
Inte
nsity
cm
-1
q Aring-1
-2
T= 90degC
SANS WAXS WAXS
a) b) c)
dv
dL d= 144 Aring-1
di
ddH2O
dt
dvdL
dtdi d
d)
9
965
966
Figure S 7 ndash ssNMR MAS (10 kHz) experiments recorded on a G-C181-OH dry powder a) 1H spectra 967
recorded from 110degC to 70degC b) 13C single pulse (SP) spectra recorded with high power 1H decoupling from 968
110degC to 70degC c) 13C cross polarization (CP) spectra recorded at 110degC and contact time tc of 50 micros and 969
3000 micros d) 13C CP spectra recorded at 70degC and for 20 lt tc micros lt 3000 970
971
1
811
910
CH2 CH2
1rsquo
6rsquo
8 6 4 2 0 ppm
110
90
80
70
910
1rsquo
6rsquo16
1
2rsquo3rsquo4rsquo
811
OH
45 40 35 30 25 20 15
ppm
200 180 160 140 120 100 80 60 40 20 0
ppm140 120 100 80
ppm
CH2-gauche
3004
110
90
80
70
65
60
50
25
C91013003
C9 - 12869
CH2-all-trans
3198
C1rsquo10335
a) b)
1H
T degCT degC
13C Single Pulse MAS
A
B
A
B
70degC70degC
5rsquo
215
200 180 160 140 120 100 80 60 40 20 0
ppm
13C CPMAST= 110degC
200 180 160 140 120 100 80 60 40 20 0
ppm
132 131 130 129 128 127 126
ppm
106 105 104 103 102
ppm
13C CPMAST= 70degC
50
tc micros
3000
20
tc micros
50 500 1000 3000
tc micros
C102
13024 C910113003
C92
12869
C1rsquo213082
C1rsquo110443
A B
106 105 104 103 102
ppm
3000
1000
500
50
20
AB
c)
d)
10
972
Figure S 8 ndash a) Short and d) long T2 components displayed by the 1H transverse relaxation signal c) 1H 973
transverse relaxation signals recorded on a G-C181-OH dry powder from 110degC to 70degC The area of each 974
given resonance is plotted (log-lin) as a function of the echo time (CPMG pulse sequence) for each 975
temperature and fitted using the equation given above T2s and T2l indicate the short and long T2 relaxation 976
times respectively obtained by describing the 1H transverse relaxation signal using a biexponential decay 977
For H1rsquo H5rsquo and H6rsquo the 1H relaxation function could be described by a monoexponential decay 978
- Protons from the sugar group (H1rsquo H5rsquo H6rsquo) show a single T2 relaxation component (Figure 979
6c and Figure S 8) while protons of the acyl chain (CH2 H910 H811) show both short (Figure 980
6c) and long (Figure 6d) T2 relaxation component 981
- The short T2 relaxation time systematically decreases from 110degC to 70degC for all species by a 982
factor ranging from two to seven depending on the specific chemical group Very long T2 are 983
observed at 110degC for all acyl species while nearly unchanged values are measured below 984
90degC without any clear trend 985
- The sugar protons (H1rsquo H5rsquo H6rsquo) have the shortest set of T2 values (lt 1 ms) below 100degC 986
The long component of T2 generally ranges between 4 ms and 12 ms 987
0 1 2 3 4 5 6 7 8
00
05
10
15
20
25
30
35
40
45
Log
In
ten
sity
Time ms
0 1 2 3 4 5 6 7 8
00
05
10
15
20
25
30
35
40
45
Log
In
ten
sity
Time ms
0 1000 2000 3000 4000 5000 6000 7000 8000
00
05
10
15
20
25
30
35
40
45
Log
In
ten
sity
Time ms
0 1000 2000 3000 4000 5000 6000 7000 8000
00
05
10
15
20
25
30
35
40
45
Log
In
ten
sity
Time ms
0 1000 2000 3000 4000 5000 6000 7000 8000
00
05
10
15
20
25
30
35
40
45
Log
In
ten
sity
Time ms
0 1000 2000 3000 4000 5000 6000 7000 8000
00
05
10
15
20
25
30
35
40
45
Log
In
ten
sity
Time ms
H1
H8H11
H9H10
CH2
H1rsquo
H6rsquo
CH2
H910H811 H1CH2
H1rsquo H5rsquo6rsquo
0 1000 2000 3000 4000 5000 6000 7000 8000
00
05
10
15
20
25
30
35
40
45
Log
In
ten
sity
Time ms
OH
0 1000 2000 3000 4000 5000 6000 7000 8000
00
05
10
15
20
25
30
35
40
45 T= 110degC
T= 90degC
T= 80degC
T= 70degC
Log
In
ten
sity
Time ms
Fit
)
CH2 H910 H811 H1 H56 H1 OH
00
05
10
15
20
25
30
35
40
T2 m
s
T= 110degC
T= 90degC
T= 80degC
T= 70degC
CH2 H910 H811 H1
0
2
4
6
8
10
12
T2 m
s
T= 110degC
T= 90degC
T= 80degC
T= 70degC
Short T2(1H) Long T2(1H)
a) b)
c)
11
Table S 1 ndash 1H chemical shifts of G-C181-OH in solution and in the solid-state Solid-state spectra are 988
recorded at a MAS frequency of 10 kHz in DMSO-d6 broad peak 989
990
δH ppm
Group Ndeg Liquid
(MeOD-d4) Solid
(T= 110degC) Solid
(T= 70degC)
CH2 H1 354 357
CH2 H2 153 156
CH2 H3-712-14 132 135
CH2 H811 203 203
CH H910 534 534
CH2 H15 162 164
CH2 H16 388 383
CH H1 424 432
CH H2 316 335
CH H3 334 335
CH H4 329 335
CH H5 354 351 357
CH2 H6 366 383
OH OH1 432
45 463
OH OH2 492
OH OH3 490
OH OH4 487
OH OH6 445
991
992
H1H9H10H1rsquo
H6rsquo
OH2rsquo
OH1
12
Detailed discussion about the NOESY and DQ-SQ 2D 1H-1H ssNMR experiments presented in 993
Figure 9 994
995
2D 1H-1H ssNMR experiments are a unique tool to explore through-space proximities 996
between 1H nuclei ssNMR offers a large number of possibilities each adapted to a given 997
system The advantage of 2D maps with respect to a dynamics approach is their direct 998
readability in clear two nuclei which exchange their magnetization through-space (whichever 999
mechanism may be responsible for this exchange) will display a specific cross-peak However 1000
the way cross-peaks are presented and interpreted strictly depends on the nature of the pulse 1001
program which in turn is chosen according to the physical nature of the sample 1002
1D temperature-dependent 1H NMR experiments performed on G-C181-OH (Figure 1003
4a in the main text) indicate sharp peaks at 90degC and broad peaks at 70degC Narrow peaks 1004
indicate fast andor large-amplitude molecular tumbling averaging the strong 1H-1H dipolar 1005
interactions This excludes the use of pulse sequences like DQ-SQ which is not efficient under 1006
these conditions For this reason we employ spin-diffusion-based pulse sequences like 1007
NOESY which is more adapted for samples with high molecular mobility When mixing times 1008
are chosen to be short (lt 1 s) one generally explores through-space proximities within about 5 1009
10 Aring On the contrary when molecular motions are restricted dipolar coupling becomes 1010
significant 1H NMR peaks are broader and pulse sequences like DQ-SQ can now be used 1011
with a spatial resolution of less than 5 Aring 1012
Whenever possible DQ-SQ experiments are preferred over spin diffusion-based pulse 1013
sequences because they are more selective in particular for likewise interactions which are 1014
not discriminated in NOESY-type experiments This is illustrated by the typical interaction 1015
schemes for NOESY (top Figure 9a) and DQ-SQ (top Figure 9b) For two given A and B 1016
protons 2D NOESY maps will display two on-diagonal and two square-shaped symmetrical 1017
off-diagonal cross-peaks Off-diagonal cross-peaks illustrate the mutual A-B and B-A 1018
interaction but the on-diagonal peaks are systematic and do not prove any A-A or B-B 1019
interaction Similarly to NOESY 2D DQ-SQ maps display off-diagonal peaks (symmetric 1020
across the diagonal top Figure 9b) upon A-B and B-A interaction but in contrast they will 1021
display on-diagonal peaks only in the presence of self-interaction In the tutorial example of 1022
Figure 9b top the on-diagonal A-A peak indicates mutual A-A interaction while lack of on-1023
diagonal B-B peak evidences the absence of B-B proximities Combining NOESY and DQ-SQ 1024
experiments is capital to study the local arrangement of G-C181-OH and its evolution with 1025
temperature 1026
13
At T= 90degC the H1 and H5rsquo contributions are very close but possible to discriminate 1027
them (δ(H1)= 354 ppm δ(H5rsquo)= 351 ppm) according to 1H NMR chemical shifts in Table S 1028
1 2D 1H-1H NOESY in Figure 9a also discriminates between the two components attributed 1029
on the basis of the interactions with their mutual neighbors (green H1-H2 and H5rsquo-H1rsquo squares 1030
in Figure 9a) On this basis 2D NOESY does not show a direct H1rsquo-H1 correlation (blue red-1031
crossed) but rather an extensive network of intra-sugar interactions These features exclude 1032
suggest intra- and inter-sugar interactions and they exclude head-tail arrangements as a major 1033
molecular configuration at 90degC 1034
At 70degC the 1H NMR peaks are broader indicating a reduction of the T2 (1H) relaxation 1035
times andor residual homonuclear dipolar interactions excluding the use of NOESY In this 1036
case 1H-1H DQ-SQ correlation experiments are best suited Figure 9b presents the 1H-1H DQ-1037
SQ experiment on G-C181-OH at 70degC Peaks are broader than in NOESY and attribution may 1038
be cumbersome However the experiment is performed at 700 MHz and MAS= 22 kHz which 1039
improves spectral resolution with respect to the same experiment performed at 300 MHz and 1040
MAS= 10 kHz The auto-peak at δH= 356 ppm in the SQ dimension is attributed to H1-H1 spin 1041
pairs mainly resulting from intra CH2 interaction while the DQ cross-peaks at δH= 156-356 1042
ppm and δH= 432-356 ppm respectively origin from H2-H1 and H1rsquo-H1 interactions (Figure 1043
9b) DQ-SQ map does not show any auto-peak corresponding to H1rsquo-H1rsquo or Hxrsquo-Hxrsquo (x= 2rsquo 1044
3rsquo 4rsquo) interactions (red-crossed blue Figure 9b) thus excluding any proximity (lt 5 Aring) between 1045
close glucose neighbors On the contrary DQ-SQ maps (recorded both at 700 MHz Figure 9b 1046
or at 300 MHz not shown) systematically show DQ cross-peaks which can only be attributed 1047
to H1rsquo-H1 interactions (δH= 432-356) The presence of these H1rsquo-H1 interactions can only be 1048
explained by a head-tail arrangement of the G-C181-OH molecules as illustrated below the 1049
DQ-SQ map in Figure 9b 1050
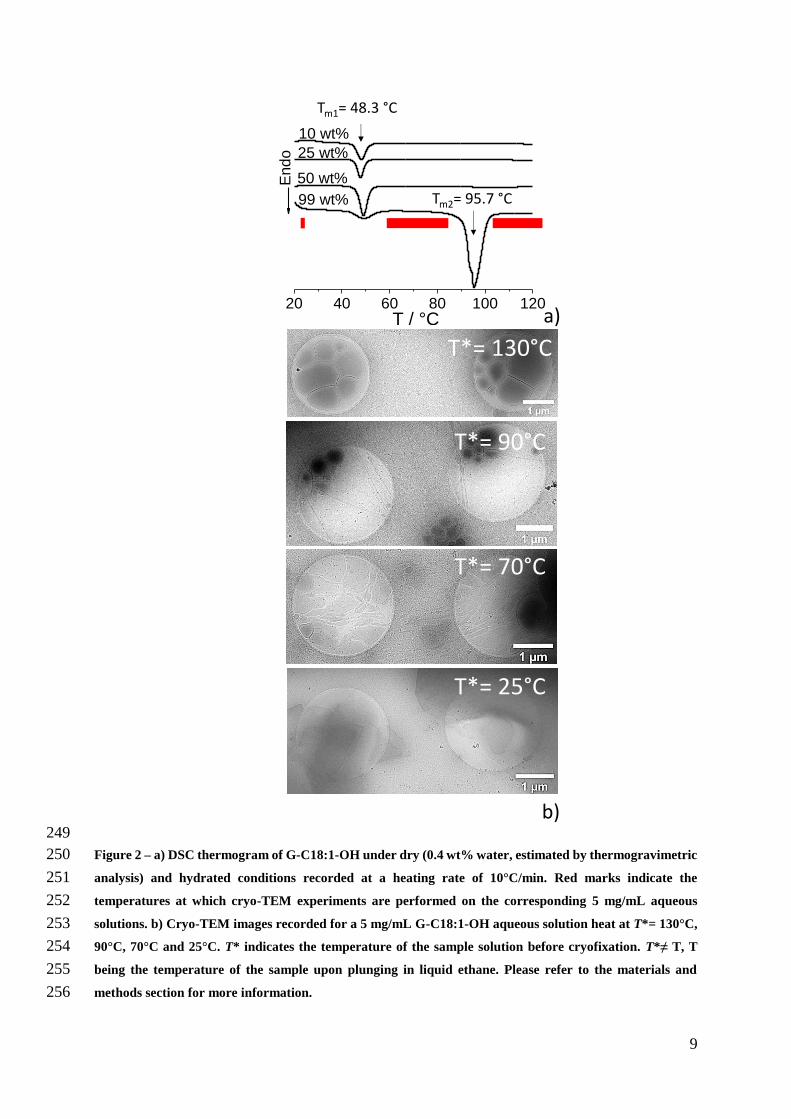
9
249
Figure 2 ndash a) DSC thermogram of G-C181-OH under dry (04 wt water estimated by thermogravimetric 250
analysis) and hydrated conditions recorded at a heating rate of 10degCmin Red marks indicate the 251
temperatures at which cryo-TEM experiments are performed on the corresponding 5 mgmL aqueous 252
solutions b) Cryo-TEM images recorded for a 5 mgmL G-C181-OH aqueous solution heat at T= 130degC 253
90degC 70degC and 25degC T indicates the temperature of the sample solution before cryofixation Tne T T 254
being the temperature of the sample upon plunging in liquid ethane Please refer to the materials and 255
methods section for more information 256
T= 130degC
T= 90degC
T= 70degC
T= 25degC
a)
b)
20 40 60 80 100 120
99 wt
50 wt
25 wt
T degC
En
do
10 wt
Tm1= 483 degC
Tm2= 957 degC
10
257
The series of cryo-TEM images in Figure 2b show an overview of the most relevant 258
structures observed on G-C181-OH solution from T= 130degC to T= 25degC whereas T is 259
indicative of the equilibrium temperature before cryofixation (refer to materials and methods 260
section for more information on the sense and interpretation of T) At Tgt 100degC the sample 261
is essentially composed of polydisperse single wall vesicles massively shown by the 262
complementary pictures presented in Figure S 2 In between Tm1 and Tm2 at T= 90degC and T= 263
70degC (Figure 2b Figure 3 Figure 4 complemented by Figure S 3 and Figure S 4) vesicles are 264
connected by nanotubes At Tlt Tm1 flat crystals are otherwise observed (Figure 2b and Figure 265
S 5) 266
267
268
Figure 3 ndash Cryo-TEM images recorded for a 5 mgmL G-C181-OH aqueous solution heat at T= 90degC 269
270
A deeper insight at T= 90degC is given in Figure 3 (more images are provided in Figure 271
S 3) Arrows 1 through 6 mark very clearly the typical continuity in the glucolipid membrane 272
between the vesicle and nanotubes Arrow Ndeg 7 shows that a single nanotube connects the outer 273
membrane of two vesicles several hundred nanometers apart The connection is shown by 274
2
34
5
6
6
1
5
7
A
B
D
C
0 10 20 30 40 50 60
BIn
tensity
au
Profile nm
A
0 10 20 30 40 50 60
Inte
nsity
au
Profile nm
C
D
T= 90degC
11
arrows Ndeg5 and Ndeg6 The corresponding profiles A through D confirm the tubular nature of 275
the elongated objects Profiles B and D are both characterized by typical symmetrical thick 276
walls (low intensity depths highlighted by shaded rectangles) surrounding a hollow region (high 277
intensity peak between the shaded rectangles) The wall thickness varies between 35 and 40 278
nm for profile B and between 41 and 61 nm for profile D while the total nanotube diameter 279
varies between 14 nm at B and 20 nm at D At the same time the thickness of the vesicle wall 280
is about 6 nm at A and 135 nm at C Considerations about the bilayer or interdigitated structure 281
of the membrane will be presented below 282
The connection between nanotubes and vesicles seems to be multiple For instance 283
arrow Ndeg1 (Figure S 3) and Ndeg4 (Figure 3) show a single-wall vesicle of which the membrane 284
is extruded into a nanotube Similarly a closer look at arrows Ndeg1 2 and 3 in Figure 3 show 285
that the vesicle is single-wall and fully closed while the nanotube nucleates at the vesicle outer 286
surface with no apparent topological continuity In many regions of the sample at T= 90degC 287
one can find exvaginations or buds232531 in the nanotube wall This is shown for instance by 288
arrows Ndeg7 and particularly put in evidence in Figure 4 by arrows Ndeg1 through Ndeg4 where the 289
amplitude of the oscillation varies between 20-25 nm (arrow Ndeg1) and 6-8 nm (arrows Ndeg3-4) 290
291
Figure 4 - Cryo-TEM images recorded for a 5 mgmL G-C181-OH aqueous solution heated at T= 90degC 292
293
Still between Tm2 and Tm1 but at lower temperature (T= 70degC) the nanotubes seem to 294
vary from single threads (arrow Ndeg1 Figure S 4) to nanotubes of diameter below 15 nm both 295
connecting nanotubes of diameter ranging between 50 nm and 100 nm (arrows Ndeg2 Figure S 296
4) The larger tubes are most likely formed by the inflation and flattening of the nanotubes 297
probably after assimilation of surrounding vesicles and fusion of the exvagination discussed 298
above The transition between vesicles tubes and flat membranes is certainly more accentuated 299
Arrow Ndeg3 in Figure S 4 shows distinct vesicles while arrow Ndeg4 identifies a flat structure 300
evidently formed from fused vesicles In particular arrow Ndeg5 points at the fusion of two 301
2
1 132
4
12
vesicles while arrow Ndeg6 points at two vesicles fusing into the flat membrane Additional areas 302
where vesicle fusion is prominent are indicated by the oscillations at the outer skirt of broad 303
lamellae and pointed by arrow Ndeg7 304
Finally below Tm1 at T= 25degC for instance mainly flat crystals with no visible 305
exvaginations or tubes are visible (Figure S 5) by cryo-TEM and the material turns into an 306
insoluble precipitate Massive presence of flat crystalline structures is also clear from the bulk 307
iridescent behavior of a G-C181-OH solution under manual shear 308
In summary despite the uncertainty related to the actual state of equilibrium of the 309
glucolipids at the moment of cryofixation cryo-TEM depicts a vesicle phase at Tgt 100degC a 310
flat lamellar phase below Tm1 and an interconnected vesicle-nanotube network between Tm1 and 311
about 100degC The combination of statistically-relevant fluorescence microscopy and 312
scatteringdiffraction experiments provides an additional proof of the coexistence of 313
vesiclenanotube systems between the two transition temperatures Please note that the 314
experiments reported below have been performed under controlled conditions of temperature 315
which is then indicated by the use of T instead of T 316
13
317
Figure 5 ndash a-c) Confocal fluorescence microscopy images recorded at 90degC and 70degC for a 5 mgmL G-318
C181-OH aqueous solution d-g) Typical fluorescence microscopy images recorded at T= 80degC using 319
Laurdan (refer to materials and methods section for more details on this fluorophore) Excitation 320
wavelength is 405 nm for all the images while emission wavelength is 490 nm in (df) and 440 nm in (eg) 321
h) Full emission spectra obtained from the integration of various fluorescence images recorded from 412 322
nm to 600 nm (step 5 nm) at 90degC 80degC and 70degC i) Box plot of GP defined as 119918119927 =(120640120786120786120782minus120640120786120791120782)
120640120786120786120782+120640120786120791120782 with 120640120786120786120782 323
and 120640120786120791120782 being the emission wavelengths at 440 nm and 490 nm at 90degC 80degC and 70degC Each data point 324
l= 490 nm l= 440 nm
l= 490 nm l= 440 nm
10 μm400 450 500 550 600
00
02
04
06
08
10
No
rma
lize
d I
nte
nsity
l nm
90degC
80degC
80degC
70degC
70degC
400 450 500 550 60000
02
04
06
08
10
No
rma
lize
d I
nte
nsity
l nm
90degC
80degC
80degC
70degC
70degC
d) e)
f) g)
h)
i)
T= 80degC
Laurdan
T= 80degC
T= 80degC T= 80degC
T= 90degC T= 70degC T= 70degC
a) b) c)
1
1
1
14
corresponds to a set of regions of interest (ROIs) (54 at 90degC 65 at 80degC and 75 at 70degC) selected in the 325
corresponding fluorescence images ROIs were representatively selected so to include the entire image but 326
also vesicles alone tubes alone and mixtures of vesicles and tubes 327
328
Figure 5ab shows two typical confocal fluorescence microscopy images recorded on a 329
G-C181-OH solution (5 mgmL) in a flame-sealed capillary heat at T= 90degC and T= 70degC 330
Although the resolution of optical microscopy is not comparable with cryo-TEM the sample is 331
broadly composed of vesicles coexisting with nanotubes whereas in some cases the nanotube 332
starts from the vesicle itself (arrow Ndeg1) in good agreement with cryo-TEM data Furthermore 333
SANS recorded at T= 90degC (Figure S 6a) shows a scattering profile with a pronounced -2 334
dependence of the scattering intensity against the wavevector q in the log-log scale This 335
indicates the massive presence of a flat interface and it is expected typical of bilayers in 336
vesicular morphologies56 However the typical signature of nanotubes cannot be observed in 337
the SANS profile and this can be explained by both an argument related to the relative lower 338
amount of nanotubes with respect to vesicles at 90degC but also to the steeper slope of flat 339
morphologies (-2) compared to tubes (-1) the signal of the former masking the tube signal at 340
low wavevector values The SANS profile is characterized by a diffraction peak at q= 0167 Aring-341
1 of which the assignment is refined by WAXS data 342
Temperature-driven WAXS experiments in Figure S 6bc (5 mgmL-1 and 25 mgmL-1 343
respectively) show a lamellar order possibly attributed to a multilamellar structure of the 344
vesicles (dv Figure S 6d) at high temperature and to the interplanar arrangement of the 345
crystalline flat structures (dL Figure S 6d) at T= 25degC The sharp (001) reflection indicates 346
typical interlamellar distance of 353 Aring at 25degC although this value varies with temperature 347
(400 Aring at 111degC 372 Aring at 88degC) thus confirming its assignment to a hydration-dependent 348
interlamellar order More intriguing is the second broader peak at q= 0403 Aring-1 (d= 156 Aring) 349
and its reflection both clearly visible at 88degC below Tm2 We attribute it to the inter-glucolipid 350
arrangement inside the tubular phase (dt Figure S 6d) coexisting with the vesicle phase 351
between Tm1 and Tm2 and to the planar lipid arrangement (di Figure S 6d) in the rigid flat 352
lamellar structure below Tm2 Its temperature- hence hydration- independent position also 353
confirms its structural origin Finally besides the water-structure peak at about 2 Aring-1 we also 354
observe a broad peak at 144 Aring-1 characteristics of the lateral packing (d Figure S 6d) of lipids 355
in bilayers While its position could be consistent with an Lα phase5758 above Tm2 its broadness 356
and positional invariance as well as the coexistence between vesicles and tubes do not allow a 357
precise assignment 358
15
Does G-C181-OH assume a bilayer or interdigitated structure the latter being the one 359
found for other similar bolaform glucolipids4243 The size of G-C181-OH can be estimated to 360
be at the most 32 Aring given by the length L of the C16 tail (L = 22 Aring from the Tanford formula 361
L= 154 + 1265 times n (n= 16)59) and the sugar (about 10 Aring)4243 However the cis conformation 362
of the C=C bond imposes a ldquokinkrdquo of 60deg in the aliphatic chain which reduces the effective 363
length of the oleic backbone to about 17 Aring for an effective total G-C181-OH length of about 364
27 Aring Cryo-TEM provides a tube thickness varying from 35 Aring to 60 Aring and a vesicle membrane 365
thickness of at least 60 Aring WAXS suggests an interlamellar thickness (membrane and water) 366
between 40 Aring and 37 Aring and an inter-lipid distance in the tube of about 16 Aring In the absence of 367
a clear form factor oscillation profile as found for similar glucolipids4243 one must 368
acknowledge that these data pledge neither in favor of fully interdigitated nor a double layer 369
structure and might suggest a tilted lipid arrangement with partial interdigitation60 370
371
13C ssNMR demonstrates that G-C181-OH can assume two coexisting head-head and 372
head-tail configurations 373
Vesicles are characterized by low positive mean and gaussian curvatures while 374
nanotubes are described by a combination of a high positive mean and zero gaussian curvatures 375
In this regard the coexistence of vesicles and nanotubes requires glucolipids to adapt 376
themselves to both environments at the same time For this reason the formation of nanotube-377
vesicle networks generally requires a specific driving force able to impose a high mean and 378
zero gaussian curvature to the membrane In many systems insertion of at least a second 379
constituent (lipid surfactant protein) in the membrane becomes a necessary internal driving 380
force for the nucleation and growth of so-called membrane inclusions from which 381
topologically-connected nanotubes can form10ndash123261 as explained by orientational ordering 382
arguments62 It has also been shown that external driving forces such as use of laser 383
ldquotweezersrdquo30 osmotic pressure6 electroformation5ndash82829 or controlled suction13ndash16 are 384
otherwise necessary as also supported by theoretical studies19 385
The bending energy of tubes is higher than that of a vesicle membrane8 due to the 386
dependence of the membrane free energy from the principal curvatures For this reason 387
isotropic (rotational symmetry along the main axis) but also anisotropic33 lipids generally 388
stabilize low-curvature shapes like flat membranes or vesicles Lipid nanotubes are also a 389
common phase formed by amphiphiles but generally for lipids with a certain complexity in 390
their molecular structures as exampled by diacetylenic derivatives of phospholipids among 391
others262763ndash65 Negative contributions to the bending energy favoring the simultaneous 392
16
presence of interconnected vesicles and tubes was shown to be driven by the presence of 393
anisotropic lipids in a membrane continuum Spontaneous deviations to the elastic theory in the 394
presence of surfactants lipids and proteins with anisotropic structures favor the formation of 395
protrusions with radius of the order of the fraction of a micron9ndash1219ndash2362 396
In the absence of both internal and external driving forces mentioned above G-C181-397
OH should behave as a standard lipid Its DSC profile (Figure 2)536667 under both hydrated and 398
dry conditions identifies a hydration-independent transition (Tm1) slightly above room 399
temperature this is followed by one main transition at higher temperature (Tm2) in the dry 400
sample50 For such a profile one expects a gel phase (Lβ) below Tm1 and a liquid crystalline 401
structure possibly in the morphology of vesicles (L4 phase) possibly above Tm1 and most likely 402
above Tm231 as experimentally found On the basis of the thermogram recorded on the dry 403
powder one may also expect a ldquoripplerdquo (Pβ) phase between Tm1 and Tm2 characterized by 404
periodic undulations of the bilayer (generally addressed to as regions with both liquid order and 405
disorder)5455 406
In the present work instead of a Lβ phase we observe flat crystals below Tm1 and a 407
vesicle-nanotube network instead of the ldquoripplerdquo phase The latter is particularly unexpected 408
because the membrane is composed of a single-component (G-C181-OH) and no anisotropic 409
external force (osmotic hydrodynamic electric) is used to pull and stabilize the tubes In 410
addition the nanotubes are observed at fairly high temperatures above Tm1 (between about 411
60degC and 90degC) while this morphology is generally favored at low temperature (proportionality 412
with 1kT figure 5 in Ref 62) commonly below a given transition temperature characteristics 413
for each specific amphiphile27 Furthermore nanotubes of G-C181-OH seem to be stable in 414
time thus differing from what is found in electroformed vesicles78 They are also observed 415
away from phase transition events (may them be at Tm1 or Tm2) as otherwise reported before 416
for a diacetylenic derivative of phosphatidylcholine26 and many other systems27 417
A stable nanotube-vesicle network for a single-component phospholipid in the absence 418
of external driving forces is not expected and has never been reported before It could be 419
explained by the coexistence of two micro-separated phases of different rigidity This 420
hypothesis is excluded by confocal microscopy on Laurdan-labelled membranes and magic 421
angle spinning (MAS) solid-state NMR (ssNMR) experiments 422
Laurdan is a well-known fluorophore used to put in evidence the coexistence of rigid 423
and fluid domains in both model and biological membranes47ndash49 Laurdan was used here to label 424
the G-C181-OH membranes between Tm1 and Tm2 and to verify the possible micro-segregation 425
and coexistence of rigid (eg Lβ λem= 440 nm) and fluid (eg Lα λem= 490 nm) domains in 426
17
tubes and vesicles respectively A set of quantitative experiments performed on a 5 mgmL-1 427
solution summarized in Figure 5 shows an excess of fluorescence at only λem= 490 nm for 428
temperature between 90degC and 70degC (Figure 5h) The GP value which quantifies the rigidfluid 429
character of the membrane is systematically negative (Figure 5i) indicating an overall fluid 430
membrane at all temperatures GP is quantified on more than 50 regions of interest (ROIs) at 431
each temperature including vesicles and tubes alone as well as connected nanotube-vesicles 432
(Figure 5d-g) The dispersion of GP at 80degC and 70degC between -08 and -02 could suggest the 433
spurious presence of membranes with various degrees of flexibility although fluidity is always 434
predominant The combination of WAXS (broad peak d= 144 Aring-1 invariant with 435
temperature Figure S 6bc) and confocal fluorescence microscopy using Laurdan confirms the 436
single-phase of the membrane composed of G-C181-OH both in vesicles and nanotubes This 437
is also consistent with the lack of phase transitions in DSC experiments between ~85degC and 438
~60degC especially in hydrated samples We conclude that the vesicle-nanotube transition is not 439
driven by the local segregation of gel phase (Lβ) microdomains nor that the nanotubes are 440
composed of such phase 441
ssNMR is the best-suited approach to investigate the origin of the local driving force for 442
the nucleation of anisotropic inclusions of which the average orientation depends on the local 443
membrane and inclusion curvatures and was shown to promote tubing62 ssNMR can provide 444
information on the local molecular mobility eg through the nuclear spin relaxation behavior 445
but also on intermolecular interactions and stereochemistry eg through variations in the 446
chemical shift68ndash70 447
Ideally ssNMR should be performed on diluted G-C181-OH samples above Tm1 448
However fast MAS necessary for high resolution centrifuges the sample As a first 449
approximation hydrated G-C181-OH samples for instance at 50 wt as classically done for 450
phospholipids71 could be studied Unfortunately permeability of the sample holder combined 451
to heating (close to the boiling point of water) and MAS provoke dehydration and even sample 452
ejection After experiencing both of the above this approach was abandoned As a second 453
approximation the study of the dehydrated G-C181-OH powder avoids centrifugation and 454
evaporation If studying dried lipids may not reflect their exact behaviour under diluted 455
conditions valuable structural information can still be obtained in dehydrated molecular 456
systems like proteins thus illustrating that this approach is not unreasonable Furthermore if 457
DSC (Figure 2a) shows that hydration suppresses the Tm2 it also shows that the value of Tm1 is 458
not affected by water at concentrations as low as 10 wt For this reason performing a 459
structural analysis of dehydrated G-C181-OH by ssNMR above Tm1 may help understanding 460
18
the local arrangement of G-C181-OH in two morphologies vesicles and nanotubes having 461
sensibly different curvatures 462
To explore the local mobility of the most relevant chemical groups of G-C181-OH 463
above Tm2 (T= 110degC) and between Tm2 and Tm1 (70 lt T degC lt 90) we combine a series of 1H 464
and 13C experiments Single-pulse (SP) MAS experiments (1H and 13C) when recorded under 465
quantitative conditions allow the detection of all chemical species while cross-polarization 466
(CP) MAS (13C only) experiments are sensitive only to constrained groups for which the 1H-467
13C dipolar coupling is not averaged to zero by the molecular motions 468
469
Figure 6 ndash a) 1H MAS (10 kHz) ssNMR spectra recorded from 110degC to 70degC b) 13C MAS (10 kHz) ssNMR 470
spectra recorded using high power decoupling single pulse (SP) and cross-polarization (CP) pulse sequences 471
Contact time for CP experiments and corresponding temperatures are given on each spectrum Full spectra 472
are given in Figure S 7 473
The most relevant 1H and 13C spectra are given in Figure 6 (full range in Figure 7 and 474
Figure S 7) As expected the 1H solid-state SPMAS spectra show broader peaks compared to 475
the solution-state NMR spectrum (Figure 6a) reflecting the obvious solid-state character of the 476
sample at any temperature The sugar group and the C=C bond resonate in the 25-6 ppm range 477
and 535 ppm respectively while the OH groups of the sugar moiety are found below 45 ppm 478
(Figure 6a full assignment in Table S 1) Very broad (~1 ppm) at 100degC the position of the 479
OH peak varies with the temperature value and becomes narrower (lt~05 ppm) and visible at 480
δH= 464 ppm at T= 70degC Line narrowing and chemical shift variations of the OH resonance 481
in ssNMR is always a direct sign of H-bonding interactions whereas the strength of the H-482
bonding hence its OHhellipH distance is correlated to a dispersion in chemical shifts72ndash75 All other 483
60 55 50 45 40 35 30 25
ppm
110
90
80
70
910
1rsquo
6rsquo16
1
OH
134 132 130 128 126
ppm110 108 106 104 102 100
ppm
SP (T= 110degC)
SP (T= 70degC)
CP 50 ms (T= 70degC)
CP 3 ms (T= 70degC)
910 1rsquo
1H 13C
1
811
910
CH2 CH2
1rsquo
6rsquo
a) b)
C102
13024
C9101
13003
C92
12869 C1rsquo210382
C1rsquo110443
C1rsquo13035
2rsquo3rsquo4rsquo
T degC
5rsquo
19
resonances broaden from 110degC to 70degC thus indicating slower andor more anisotropic 484
reorientational motions of all chemical groups The specific dynamic behaviour of the sugar 485
headgroup is also reflected by its 1H transverse relaxation time T2 whereas the shorter the T2 486
the higher the rigidity Experiments performed between 110degC and 70degC shown and 487
commented in Figure S 8 in the Supporting Information globally show a single short (lt 1 ms 488
below 100degC) T2 relaxation component for H1rsquo H5rsquo and H6rsquo and two both short and long 489
(between 4 ms and 12 ms) T2 for the acyl chain (CH2 H910 H811) even below 100degC 490
At 110degC 13C SPMAS experiments (Figure 6b full range in Figure 7 and Figure S 7 491
assignments in Table 1) show a single peak at δC= 10335 ppm for C1rsquo and at δC= 13003 ppm 492
for C910 as expected for a symmetrical conformation with two chemically-equivalent 493
carbons76 At 70degC the C1rsquo peak disappears while C910 now shows two peaks around 128 494
ppm and 130 ppm (Table 1 full temperature series in Figure S 7b) attributed to C92 (δC= 12869 495
ppm) and C10 in a non-symmetric configuration respectively for which these two carbons are 496
chemically inequivalent76 More precisely the resonance at 130 ppm is actually the 497
superposition of two close resonances C9101 (δC= 13003 ppm) and C102 (δC= 13024 ppm) 498
where subscripts 1 and 2 stand for two different conformations of the cis-olefin group as 499
reported for various phases of oleic acid in the vicinity of 0degC76 500
501
Table 1 ndash 13C Chemical shifts of G-C181-OH in solution and solid-state Solid-state experiments are 502
recorded at MAS= 10 kHz All spectra are reported in Figure 7 and Figure S 7 The contact time for cross 503
polarization is 3 ms In all ssNMR experiments temperature is first raised at 110degC and then lowered to 504
either 90degC or 70degC Attribution of the 13C resonances in Table 1 is performed on the basis of the solution 505
spectrum (Figure S 1b) Additional peaks observed in both single pulse and cross polarization ssNMR 506
experiments are attributed when possible to a configuration effect of the given atom eg C9101 and C92 507
indicate two configurations of C9 All new peaks observed in solid-state and not detected in solution are 508
highlighted in red for convenience 509
510
511
δ ppm
Peak Liquid (DMSO-d6)
Solid Single Pulse
T= 110degC
Solid Single Pulse
T= 90degC
Solid Single Pulse
T= 70degC
Solid Cross Polarization
T= 70degC
C102
- - 13024 13024
C910C9101 13009 13003 13003 13003 13003
C1C9C10C1rsquo
C6rsquo
20
C92 - - - 12869 12869
C1rsquoC11 10329 10335 10335 - 10443
C12 - - - - 10382
C3 7724 7709 7702 - 7829
- 7634 7629 - 7621
7525
C2 7388 7398 7390 7370 7370
C4 7052 7077 7054 7041 7098
C16 6900 7016 - - 7029
- - - - 6793
C1C5C6 6153 6241 6236 6239 6262
C1C5C6 6117 - - - 5956
C2 3300 3290 3290 3283 3279
CH2(trans) - - - 3198 3196
CH2(gauche)C15 2941 2981 2987 3004 -
C811 2706 2747 2747 2832 2817
CH2 2597 2625 2628 2630 2817
512
13C CPMAS spectra at 70degC (Figure 6b full range in Figure 7 and Figure S 7d) at 513
increasing contact times confirm the presence of two cis-olefin environments one for which 514
C910 are equivalent labelled here C9101 and one for which they are inequivalent labelled 515
C92 C102 Both environments are rigid enough to be observed at short contact time (tc= 50 μs) 516
A similar double environment is also observed for the sugar C1rsquo CPMAS at 70degC shows two 517
peaks (C1rsquo1 at δC= 10443 ppm C1rsquo2 at δC= 10382 ppm Figure 6b Figure S 7d) These are 518
significantly shifted downfield from the C1rsquo peak observed at 110degC and are detected at contact 519
times as short as 50 μs thus indicating their rigid character One also finds that CPMAS is 520
totally inefficient at 100degC for short contact times (50 μs) and poorly efficient even at 3 ms 521
typical of fast-tumbling molecules (Figure S 7c) also both gauche (δC= 3004 ppm) and all-522
trans (δC= 3198 ppm) conformations of the CH2 carbons coexist at 70degC (Figure S 7b)77 523
According to ssNMR one main mobile molecular environment exists at 110degC as 524
shown by the well-resolved 1H spectrum single C=C (C9101) and anomeric (C1rsquo) resonances 525
gauche conformation of the aliphatic CH2 and single T2 of the aliphatic CH2 chain and sugar 526
protons The sugar group is certainly mobile (inefficient 1H13C CPMAS) but still more 527
constrainted than the acyl chain (shorter T2 (1H)) As the temperature is lowered the overall 528
rigidity increases (broadening of 1H NMR peaks faster 1H transverse relaxation and efficient 529
1H13C magnetization transfer during CPMAS) presumably driven by H-bonding 530
interactions (downfield shift and line narrowing of the OH 1H signal very short OH T2 loss of 531
the C1rsquo signal in SPMAS) At the same time a number of spectroscopic data (two concomitant 532
21
resonances for anomeric C1rsquo1 and C1rsquo2 cis-olefin C9101 and C92 C102 and CH2 gauche and 533
all-trans environments) and relaxation behaviour (fast and slow T2 relaxation components) 534
strongly suggests the coexistence of two molecular environments Further proofs of the 535
coexistence of two distinct molecular domains are given by a number of chemical shift 536
variations in the 13C CPMAS spectrum at 70degC compared to the one at 110degC 90degC and 537
solution This is shown in Figure 7 and in the list of 13C chemical shifts in Table 1 538
539
540
Figure 7 - Comparison between solution- and solid-state 13C NMR spectra of G-C181-OH Solid-state 541
experiments are recorded directly on the sample powder at a MAS of 10 kHz (4 mm zirconia rotor) SP 542
Single Pulse CP Cross Polarization In all the ssNMR experiments temperature is first raised at 110degC 543
and then lowered to either 90degC or 70degC Segmented lines are meant to highlight the known peak position 544
in solution thus stressing the strong chemical shift variations in the solid-state 545
546
NMR experiments above Tm2 suggest that vesicles could contain G-C181-OH with a 547
single family of mobile conformations characterized by chemically-equivalent C=C (red 548
Figure 8b) and a single C1rsquo conformation (green Figure 8b) Experiments between Tm1 and Tm2 549
otherwise suggest that two coexisting conformations characterized by chemically-equivalent 550
(red Figure 8b) and inequivalent (magenta Figure 8b) C=C could be associated to nanotubes 551
Two distinct C1rsquo sites (grey Figure 8b) also indicate two configurations of the sugar headgroup 552
A comment on this point will be given in the following paragraphs 553
The local (Aring-scale) variation of molecular mobility below Tm2 drives the coexistence of 554
two distinct molecular environments of the same G-C181-OH molecule This occurs within a 555
single-phase domain (as deduced by WAXS) of equivalent membrane rigidity (as derived from 556
Laurdan probe in confocal microscopy) Although never reported before the difference in the 557
local mobility of the same amphiphile (here G-C181-OH) could satisfy the theoretically-558
140 120 100 80 60 40 20
CP(3 ms)-70degC
SP-70degC
SP-90degC
SP-110degC
ppm
LiquidC910
C1rsquo
C2rsquo
C4rsquo
C3rsquo
C1
C6rsquoC5rsquo
C1
6
C8
11
C2 C
H2
C1
5
CH
2
DM
SO
13C
22
required conditions that induce local lipid segregation and formation of membrane inclusions 559
(Figure 8c) In case of their non-zero average orientation the local membrane curvature 560
increases62 and nanotubes can spontaneously form (Figure 8bc) More intriguing this 561
mechanism occurs at least 10degC above Tm1 although it should not be favored above the Tm27 562
From both experimental and theoretical backgrounds the conditions of topologically-563
connected vesicles-nanotubes systems are met only when either internal (two components) or 564
external driving forces are applied19 In the present single-lipid system of which the phase 565
behavior is summarized in Figure 8a the most plausible driving force could be explained by 566
the NMR results collected on the dry sample G-C181-OH concomitantly occupies two 567
molecular environments characterized by 1) two distinct conformations of the sugar 568
displaying equivalent mobility and 2) two conformations of the acyl chain unsaturation 569
570
23
571
Figure 8 ndash a) Thermotropic phase behavior of G-C181-OH at 5 mgmL-1 Note that Tm2 is observed on the 572
dry powder only b) Possible relationship between the molecular environment as derived from NMR and 573
membrane curvatures All the molecular drawings refer to the same G-C181-OH molecule (bulky ellipsoid 574
equiv sugar headgroup) while each color corresponds to a given configuration Grey of C1rsquo1 and C1rsquo2 indicates 575
the uncertainty about the assignment of the specific NMR peak The curvature C is defined as 1R R being 576
the curvature radius R1 R2 radius of curvature CG Gauss curvature CM Mean curvature c) Free 577
interpretation of the anisotropic high-curvature (CMgt 0 CG= 0) inclusions in the membrane (low CM and 578
CG) continuum driven by inter-sugar H-bonding and reduced intramembrane diffusion for a G-C181-OH 579
glucolipid 580
581
Flat crystalline structure
Nanotube-vesicle network
Vesicles
48degC
120deg
106 105 104 103 102 101
ppm
H9 H10H1rsquo
106 105 104 103 102 101
ppm106 105 104 103 102 101
ppm106 105 104 103 102 101
ppm
C=CC=C
C1rsquo1C1rsquo2
C1rsquo
Tm2(96degC)Tm1
a)
b)
c)
Same molecule different local orientations and sugar conformations
High curvature membrane
Low curvature inclusion
Flip-FlopStrong H-bonding
CG
CM ( + )
CG 0
CM 0 CG 0
CM 0
G-C181-OH
24
Two related questions are unanswered at the moment What actually drives nanotube 582
formation and is the organization of G-C181-OH within the vesicles and tubes the same Lipid 583
nanotubes have been studied for at least three decades over which broad experimental and 584
theoretical insight has been generated Despite this fact the actual understanding is still matter 585
of debate27 Micelle-to-nanotube and vesicle-to-nanotube phase transitions are generally 586
reported for single amphiphiles below a given Tm and intermediate phase composed of twisted 587
and flat fibers is concomitantly reported Initially thought to be a chirality-driven phenomenon 588
recent studies propose a more general mechanism involving crystallization and symmetry 589
breaking in the lipid packing driven by optimal packing27 If twisted ribbons were observed 590
before for a number of microbial glycolipid bolaamphiphiles44 they are not found for G-C181-591
OH This fact as well as the large body of cryo-TEM images and the observation of nanotubes 592
above Tm1 rather pledge in favour of a direct topological change from positive (vesicles) to 593
zero (nanotubes) Gaussian curvatures In this case vesicle-to-nanotube transitions could be 594
driven by external forces56307813ndash162829 595
Considering the absence of external forces in the present system there are only two 596
possibilities left spontaneous budding of the membrane or nanotube pulling after inter-vesicle 597
collisions due to Brownian motion Both are possible as inclusions composed of a different 598
arrangement of the same molecule in the membrane continuum can theoretically explain 599
spontaneous nanotube formation in an isotropic medium672223629ndash1218ndash21 However the second 600
one is probably more likely to prevail because it could explain the large number of nanotubes 601
connecting two distant vesicles Interestingly similar events occur for any phospholipid-based 602
vesicular solution but nanotubes are extremely rare unless at least two lipids of different 603
molecular structure are mixed together The spectroscopic 1H and 13C and relaxation (1H) 604
ssNMR data even if collected on a dry powder demonstrate that the coexistence of two G-605
C181-OH configurations involving both the sugar headgroup and fatty alcohol chain are 606
possible for this molecule As a matter of fact this is not so surprising as more than one energy 607
minima each corresponding to a given conformation are known for glucose its non-reducing 608
derivative methylglucose and carbohydrates in general78ndash80 609
The presence of two configurations could explain the coexistence between two 610
structures of different curvature but the data presented so far do not explain the origin of these 611
two configurations In other words what drives the change in the local structure of the sugar 612
headgroup and fatty alcohol within the membrane 613
The association of known self-assembled structures to spectroscopic 13C ssNMR data is 614
known for years in particular for gluconamides lipids having a linear sugar headgroup81ndash84 It 615
25
was found that gauche effects in some cases up to the γ position in the sugar chain induce 616
upfield chemical shifts while anti and trans conformations result in downfield shifts Each 617
structure (monolayer crystal bilayer crystal or micellar fiber) was then characterized by a given 618
organization of the gluconamide and a characteristic 13C ssNMR fingerprint which could be 619
explained by gauche γ-gauche anti and trans conformations of the headgroup Similar 620
structural-spectroscopic correlations have been collected over the years for much simpler cyclic 621
sugars85 whereas pyranoses can undergo important conformational changes (chair half-chair 622
boat skew) when the appropriate energy barriers are crossed78ndash8086 A quantitative 623
conformational study based on the 13C chemical shift variations shown in Table 1 would be 624
certainly helpful but very delicate in the context of the present state of the art because a 625
rigorous approach requires at least one known crystal structure8182 which is currently missing 626
for this compound A qualitative approach will then be adopted 627
G-C181-OH is a bolaform amphiphile and flip-flop could be a possible mechanism 628
involved in the nanotube stabilization whereas head-tail interactions have long been considered 629
as important in nanotube-forming bolaform amphiphiles6063 From mere considerations based 630
on T2 (1H) relaxation arguments one could exclude head-tail configurations if the R-CH2OH 631
endgroup (H1) was involved in a direct interaction with the sugar group its corresponding T2 632
would probably be comparable to the sugarrsquos one (OH and H1rsquo) but this does not seem to be 633
the case However this hypothesis would be based on the comparison of the relaxation from 634
CH and CH2 protons additionally involved in different kind of motions Besides the relaxation 635
of H1 is influenced by the strong overlap between H1 and H5rsquo For these reasons relaxation 636
arguments are not solid enough and will not be used 637
We then address this question by exploring intermolecular interactions in a direct 638
manner using 2D 1H-1H homonuclear ssNMR correlation spectroscopy At 90degC in the fast-639
tumbling domain of molecular motion (narrow 1H NMR peaks Figure 6a) and corresponding 640
to the vesicle-rich region spin diffusion (NOESY) experiments are preferred over dipolar 641
coupling based experiments because such interaction is averaged out by molecular motion 642
However when the molecular motion is more constrained in the domain of nanotube stability 643
at 70degC (broad 1H spectra Figure 6a) Double-Quantum Single-Quantum (DQ-SQ) correlation 644
experiments are best suited to probe interaction between close molecular neighbors These 645
experiments are reported in Figure 9 and the related interpretation is only briefly reported 646
below while a more detailed discussion can be found on Page 12 in the Supporting Information 647
26
648
Figure 9 ndash a) 2D 1H-1H NOESY NMR experiment performed at MAS= 10 kHz (4 mm probe) on a Bruker 649
300 MHz Avance III HD spectrometer using 300 ms of mixing time Sample temperature is regulated to 650
90degC reached by cooling from 110degC b) 2D 1H-1H DQ-SQ (BAck-to-BAck BABA pulse sequence used for 651
the DQ excitation scheme) NMR experiment performed at MAS= 22 kHz (25 mm probe) on a Bruker 700 652
MHz Avance III spectrometer using a DQ excitation time equal to 2 rotor periods Sample temperature is 653
regulated to 70degC reached by cooling from 110degC The typical schemes illustrating how to interpret these 654
2D experiments are reported above each experimental map Zooms of the sugar region and configurational 655
interpretation are given below each 2D map More information are given in the text below 656
H16-H16
H1-H1
H9-H10
H1rsquo-H1
H1rsquoH910 H16
H1
H1rsquo-H1rsquo
Hxrsquo-Hxrsquo
2
(pp
m)
(ppm)
315
811910 1rsquo
2rsquo2
3rsquo 4rsquo6rsquo
5rsquo
1rsquo2910
asymp asymp asympHDO MeOD Acetone
1
315
811 9101rsquo
2rsquo2
3rsquo4rsquo6rsquo
5rsquo
1rsquo2 9 10
asympasympasympHDOMeODAcetone
H1rsquo-H1
1rsquo
1
(p
pm
)
(ppm)
H1-H2
H1rsquo-H1
H1rsquo
H910
H1H5rsquo
H2
H1rsquo-H5rsquo
315
811910 1rsquo
2rsquo2
3rsquo 4rsquo6rsquo
5rsquo
1rsquo2910
asymp asymp asympHDO MeOD Acetone
1
H2rsquoH3rsquoH4rsquo
H2rsquoH3rsquoH4rsquo
X= 2rsquo3rsquo4rsquo
NOESY - T= 90degC
1H
1H
1H
1H
DQ-SQ - T= 70degC
a) b)
2
(pp
m)
(p
pm
)
(ppm)
A B
AhellipB
AhellipA
BhellipB
NOESY
(ppm)
A B
AhellipB
DQ-SQ
Single-quantum dimension
Do
ub
le-q
ua
ntu
m d
imen
sio
n
AhellipA
BhellipB
BhellipA
BhellipA
315
811910 1rsquo
2rsquo2
3rsquo 4rsquo6rsquo
5rsquo
1rsquo2910
asymp asymp asympHDO MeOD Acetone
1
lt 5 Aring
lt 5 Aring
H1-H2
H811
H15
H16
H6rsquo
H1rsquo
H1
H5rsquo
H2
H1-H2
H1rsquo-H1
H1rsquo-H5rsquo
H1rsquo
H1 H5rsquo
H1rsquo
H1
H5rsquo
H1H2rsquo H3rsquo H4rsquo
H1-H1
H1rsquo-H1
Hxrsquo-HxrsquoX= 2rsquo3rsquo4rsquo
H1-H2
H1rsquo
Zoom sugar region 28 ndash 45 ppmNOESY DQ-SQ
27
Head-tail or head-head configurations could be probed by the existence of H1rsquo-H1 657
interactions whereas H1 (δH= 356 ppm) is associated to the glucolipid tail and H1rsquo (δH= 432 658
ppm) to the sugar headgroup These atoms are more than 15 Aring apart and a direct interaction 659
could not be observed in both NOESY and DQ-SQ experiments NOESY experiments (Figure 660
9a) show that H1rsquo-H1 correlations are not observed Meanwhile clear-cut direct H1rsquo-H1 661
interactions are indeed observed are detected at T= 70degC (DQ cross-peaks related to H1rsquo-H1 662
correlation in DQ-SQ experiment shown in Figure 9b) Interestingly the absence of auto peaks 663
at δH= 432 ppm and δH= 335 ppm in the SQ dimension excludes H1rsquo-H1rsquo and Hxrsquo-Hxrsquo (x= 2 664
3 4) interactions respectively strengthening the idea that sugar headgroups from two nearest-665
neighbor G-C181-OH molecules are not adjacent in the nanotube-vesicle region 666
Homonuclear 2D ssNMR supports the idea according to which G-C181-OH can 667
undergo molecular flip-flops and a head-tail arrangement in the dry product Extrapolating these 668
conclusions in the lower concentration range lack of H1rsquo-H1 proximity at T= 90degC suggests a 669
head-head configuration in the vesicle-rich region and head-tail configuration within the 670
nanotubes It is however still unclear whether flip-flops are driven by spontaneous temperature-671
induced conformational changes in the glucolipid packing stimulating inclusions within the 672
membrane itself672223629ndash1218ndash21 or by defects generated by inter-vesicle collisions In fact a 673
combination of both is not unlikely Nanotubes are not stable when temperature is 20 to 30 674
degrees above Tm1 indicating that inter-vesicle collisions alone cannot explain the unusual 675
phenomenon In an energy landscape approach87 the head-head configuration is certainly 676
favored at high temperature while both head-head and head-tail configurations could be 677
favored in the mid-temperature region corresponding to the range between Tm1 and Tm2 in the 678
dry powder Both statistical and defect-induced flip-flop events contribute to form high mean 679
zero Gaussian curvature morphologies (nanotubes) for which the head-tail conformation 680
limiting the proximity between bulky sugar headgroups is probably more adapted (Figure 8c) 681
The flip-flop interpretation now reasonably explains the strong differences in the sugar and fatty 682
alcohol conformations deduced by the multiple NMR signals attributed to chemically-683
equivalent groups The existence of various low-energy conformations each having specific 684
NMR signature for sugars in solution78ndash8086 and solid-state81ndash84 further supports our 685
interpretation 686
One last point should be clarified Why between Tm1 and Tm2 are two molecular 687
environments able to coexist instead of a single one of average rigidity as found in the case of 688
ldquoripplerdquo phases50ndash54 We believe that this question can be answered based on the NMR results 689
the relatively short T2 values of the H1rsquo and OH protons shows the constrained mobility of the 690
28
sugar headgroup despite a certain flexibility of the chain (long T2 component) This trend may 691
suggest restrictions in translational mobility probably due to the sugar-OH hydrogen bonding 692
(Figure 8c) meaning that lipids are not able to diffuse within the membrane thus keeping two 693
different configurations stable 694
695
Conclusions 696
Topologically-connected nanotube-vesicle lipidic systems are commonly observed for 697
self-assembled membranes composed of at least two amphiphiles and spontaneously driven by 698
anisotropic inclusions andor by external directional forces This work shows that strong 699
differences in membrane curvature can spontaneously occur in single-lipid systems without 700
external anisotropic forces Coexistence and interconnection between nanotubes and vesicles 701
are evidenced via cryo-TEM and fluorescence confocal microscopy in a single-phase region at 702
temperature above a transition temperature Tm1= 483degC determined by DSC on the hydrated 703
sample but below the second transition temperature Tm2 (957degC) determined by DSC on the 704
dry powder X-ray diffraction (WAXS) also shows the coexistence of two lattice periods one 705
attributed to an inter-membrane repeating distance and the other possibly related to the intra-706
nanotube glucolipid arrangement Labelling the systems with Laurdan a fluorophore of which 707
the emission strongly varies with the local membrane rigidity excludes the presence of rigid 708
micro-separated phases (eg Lβ) 709
1H and 13C ssNMR despite the fact that it can only be performed on the dry powder 710
confirm the presence of one main fluid G-C181-OH environment above Tm2 Below Tm2 the 711
splitting of some 13C peaks and the coexistence of short and long 1H relaxation components 712
demonstrate that G-C181-OH can simultaneously pack into structurally and dynamically 713
inequivalent environments Combining advanced 2D 1H-1H correlation experiments based on 714
spin diffusion or double-quanta excitation suggests that vesicles could contain a preferred head-715
head configuration of the bolaform lipid while nanotubes a preferred head-tail assembly 716
The presence of two environments composed of the same molecule characterized by 717
different molecular configurations and rigidity fulfills the theoretical conditions necessary to 718
spontaneously nucleate a membrane inclusion of non-zero average orientation described as 719
necessary to observe topologically-connected nanotube-vesicle structures in the absence of 720
external forces This hypothesis could also be enriched by the possibility of nanotubes to be 721
pulled away between two vesicles after a collision event 722
This work expands the actual theoretical and experimental framework on lipid networks 723
stabilized by a different radius of curvature It could also motivate the synthesis or isolation 724
29
of new lipids providing a higher level of 3D architectural control in soft networks possibly in 725
the range of room temperature 726
727
Acknowledgements 728
Dr Andrea Lassenberger and Dr Sylvain Preacutevost at Institut Laue Langevin (ILL Grenoble 729
France) are kindly acknowledged for their assistance on the SANS experiment Confocal 730
images were performed at the Institut de Biologie Paris Seine (IBPS) imaging facility Jean-731
Franccedilois Gilles (Imaging Core Facility Institut de Biologie Paris Seine (IBPS) CNRS 732
Sorbonne Universiteacute Paris France) is kindly acknowledged for his assistance on the confocal 733
microscopy imaging Dr Guillaume Laurent (LCMCP Sorbonne Universiteacute Paris France) is 734
kindly acknowledged for helpful discussions The French region Ile-de-France SESAME 735
program is acknowledged for financial support (700 MHz NMR 736
spectrometer) Dr Olivier Diat (ICSM Marcoule France) Prof eronikaIglič and Prof V Aleš737
onsul discussi Slovenia) are kindly acknowledged for helpfUniversity of LjubljanaIglič (-Kralj 738
739
Financial support 740
WAXS experiments have been supported by Soleil Light Source Saint Aubin France proposal 741
Ndeg 20201747 SANS experiments have been supported by ILL proposal Ndeg9-13-778 742
743
References 744
1 D Kabaso N Bobrovska W Goacuteźdź E Gongadze V Kralj-Iglič R Zorec and A 745
Iglič Bioelectrochemistry 2012 87 204ndash210 746
2 C R Safinya U Raviv D J Needleman A Zidovska M C Choi M A Ojeda-747
Lopez K K Ewert Y Li H P Miller J Quispe B Carragher C S Potter M W 748
Kim S C Feinstein and L Wilson Adv Mater 2011 23 2260ndash2270 749
3 P Veranič M Lokar G J Schuumltz J Weghuber S Wieser H Haumlgerstrand V Kralj-750
Iglič and A Iglič Biophys J 2008 95 4416ndash4425 751
4 A Rustom R Saffrich I Markovic P Walther and H-H Gerdes Science (80- ) 752
2004 303 1007ndash1010 753
5 M I Angelova S Soleacuteau P Meacuteleacuteard F Faucon and P Bothorel Prog Colloid 754
Polym Sci 1992 89 127ndash131 755
6 L Mathivet S Cribier and P F Devaux Biophys J 1996 70 1112ndash1121 756
7 V Kralj-Iglič G Gomišček J Majhenc V Arrigler and S Svetina Colloids Surfaces 757
A Physicochem Eng Asp 2001 181 315ndash318 758
30
8 V Kralj-Iglič A Iglič G Gomišček F Sevšek V Arrigler and H Haumlgerstrand J 759
Phys A Math Gen 2002 35 1533ndash1549 760
9 M Drab D Stopar V Kralj-Iglič and A Iglič Cells 2019 8 626 761
10 A Zidovska K K Ewert J Quispe B Carragher C S Potter and C R Safinya 762
Langmuir 2009 25 2979ndash2985 763
11 A Zidovska K K Ewert J Quispe B Carragher C S Potter and C R Safinya Soft 764
Matter 2011 7 8363ndash8369 765
12 A Zidovska K K Ewert J Quispe B Carragher C S Potter and C R Safinya 766
Biochim Biophys Acta - Biomembr 2009 1788 1869ndash1876 767
13 M Karlsson K Sott M Davidson A S Cans P Linderholm D Chiu and O Orwar 768
Proc Natl Acad Sci U S A 2002 99 11573ndash11578 769
14 A Karlsson R Karlsson M Karlsson A-S Cans A Stromberg F Ryttsen and O 770
Orwar Nature 2001 409 150ndash152 771
15 M Karlsson K Sott A S Cans A Karlsson R Karlsson and O Orwar Langmuir 772
2001 17 6754ndash6758 773
16 E Evans H Bowman A Leung D Needham and D Tirrell Science (80- ) 1996 774
273 933ndash935 775
17 U Seifert Configurations of fluid membranes and vesicles 1997 vol 46 776
18 J Kaumls and E Sackmann Biophys J 1991 60 825ndash844 777
19 N Bobrovska W Goacuteźdź V Kralj-Iglič and A Iglič PLoS One 2013 8 e73941 778
20 A Iglič B Babnik K Bohinc M Fošnarič H Haumlgerstrand and V Kralj-Iglič J 779
Biomech 2007 40 579ndash585 780
21 K Bohinc T Slivnik A Iglič M Brumen and V Kralj-Iglič J Phys Chem C 2007 781
111 9709ndash9718 782
22 A Iglič H Haumlgerstrand P Veranič A Plemenitaš and V Kralj-Iglič J Theor Biol 783
2006 240 368ndash373 784
23 V Kralj-Iglič and P Veranič Adv Planar Lipid Bilayers Liposomes 2006 5 129ndash785
149 786
24 A Iglic and V Kralj-Iglic Adv Planar Lipid Bilayers Liposomes 2006 4 253ndash279 787
25 S Penič L Mesarec M Fošnarič L Mroacutewczyńska H Haumlgerstrand V Kralj-Iglič and 788
A Iglič Front Phys 2020 8 342 789
26 P Yager and P E Schoen Mol Cryst Liq Cryst 1984 106 371ndash381 790
27 T G Barclay K Constantopoulos and J Matisons Chem Rev 2014 114 10217ndash791
10291 792
31
28 B Božič G Gomišček V Kralj-Iglič S Svetina and B Žekš Eur Biophys J 2002 793
31 487ndash496 794
29 A Iglič H Haumlgerstrand M Bobrowska-Haumlgerstrand V Arrigler and V Kralj-Iglič 795
Phys Lett A 2003 310 493ndash497 796
30 R Bar-Ziv and E Moses Phys Rev Lett 1994 73 1392ndash1395 797
31 S Chiruvolu H E Warriner E Naranjo S H Idziak J O Raumldler R J Plano J A 798
Zasadzinski and C R Safinya Science (80- ) 1994 266 1222ndash1225 799
32 V Kralj-Iglič A Iglič H Haumlgerstrand and P Peterlin Phys Rev E 2000 61 4230ndash800
4234 801
33 L Mesarec M Drab S Penič V Kralj-Iglič and A Iglič Int J Mol Sci 2021 22 802
2348 803
34 L Van Renterghem S L K W Roelants N Baccile K Uyttersprot M C Taelman 804
B Everaert S Mincke S Ledegen S Debrouwer K Scholtens C V Stevens W 805
Soetaert L Van Renterghem S L K W Roelants N Baccile K Uytersprot M C 806
Taelman B Everaert S Mincke S Ledegen S Debrouwer K Scholtens C V 807
Stevens and W Soetaert Biotechnol Bioeng 2018 115 1195ndash1206 808
35 J Clark and F Deswarte Introduction to Chemicals from Biomass Second Edition 809
John Wiley amp Sons 2015 810
36 K V Sajna R Houmlfer R K Sukumaran L D Gottumukkala and A Pandey in 811
Industrial Biorefineries and White Biotechnology eds A Pandey R Houmlfer M 812
Taherzadeh K M Nampoothiri and C Larroche Amsterdam Oxford Waltham 813
Elsevier 2015 pp 499ndash521 814
37 R Marchant and I M Banat Trends Biotechnol 2012 30 558ndash565 815
38 K Hill and C LeHen-Ferrenbach in Sugar-Based Surfactants Fundamentals and 816
Applications ed C C Ruiz Boca Raton CRC Press 2009 pp 1ndash20 817
39 L Rodrigues I M Banat J Teixeira and R Oliveira J Antimicrob Chemother 818
2006 57 609ndash618 819
40 J D Desai and I M Banat Microbiol Mol Biol Rev 1997 61 47ndash64 820
41 S L K W Roelants K Ciesielska S L De Maeseneire H Moens B Everaert S 821
Verweire Q Denon B Vanlerberghe I N A Van Bogaert P Van der Meeren B 822
Devreese and W Soetaert Biotechnol Bioeng 2016 113 550ndash559 823
42 N Baccile M Selmane P Le Griel S Preacutevost J Perez C V Stevens E Delbeke S 824
Zibek M Guenther W Soetaert I N A Van Bogaert and S Roelants Langmuir 825
2016 32 6343ndash6359 826
32
43 N Baccile A-S Cuvier S Preacutevost C V Stevens E Delbeke J Berton W Soetaert 827
I N A Van Bogaert and S Roelants Langmuir 2016 32 10881ndash10894 828
44 N Baccile C Seyrig A Poirier S A Castro S L K W Roelants and S Abel Green 829
Chem 2021 23 3842ndash3944 830
45 A Salis L Cappai C Carucci D F Parsons and M Monduzzi J Phys Chem Lett 831
2020 11 6805ndash6811 832
46 J Schindelin I Arganda-Carreras E Frise V Kaynig M Longair T Pietzsch S 833
Preibisch C Rueden S Saalfeld B Schmid J-Y Tinevez D J White V 834
Hartenstein K Eliceiri P Tomancak and A Cardona Nat Methods 2012 9 676ndash835
682 836
47 T Parasassi and E Gratton J Fluoresc 1995 5 59ndash69 837
48 M M Dodes Traian F L Gonzaacutelez Flecha and V Levi J Lipid Res 2012 53 609ndash838
616 839
49 D M Owen C Rentero A Magenau A Abu-Siniyeh and K Gaus Nat Protoc 840
2012 7 24ndash35 841
50 W Stillwell in An Introduction to Biological Membranes Academic Press 2016 pp 842
135ndash180 843
51 W Stillwell in An Introduction to Biological Membranes Academic Press 2016 pp 844
181ndash220 845
52 B Tenchov Chem Phys Lipids 1991 57 165ndash177 846
53 R Koynova and M Caffrey Biochim Biophys Acta 1998 1376 91ndash145 847
54 F Schmid S Dolezel O Lenz and S Meinhardt J Phys Conf Ser 2014 487 848
012004 849
55 S Meinhardt R L C Vink and F Schmid Proc Natl Acad Sci U S A 2013 110 850
4476ndash4481 851
56 O Glatter and O Kratky Small Angle X-ray Scattering Academic Press London 852
1982 853
57 B A Cunningham A D Brown D H Wolfe W P Williams and A Brain Phys 854
Rev E 1998 58 3662ndash3672 855
58 M Nadler A Steiner T Dvir O Szekely P Szekely A Ginsburg R Asor R Resh 856
C Tamburu M Peres and U Raviv Soft Matter 2011 7 1512ndash1523 857
59 C Tanford The hydrophobic effect Formation of micelles and biological membranes 858
John Wiley amp Sons Inc New York 1973 859
60 M Masuda and T Shimizu Langmuir 2004 20 5969ndash5977 860
33
61 A Zidovska K K Ewert J Quispe B Carragher C S Potter and C R Safinya 861
Block Liposomes Vesicles of Charged Lipids with Distinctly Shaped Nanoscale 862
Sphere- Pear- Tube- or Rod-Segments Elsevier Inc 1st edn 2009 vol 465 863
62 A Iglic V Kralj-Iglic B Božič M Bobrowska-Haumlgerstrand B Isomaa and H 864
Haumlgerstrand Bioelectrochemistry 2000 52 203ndash211 865
63 T Shimizu M Masuda and H Minamikawa Chem Rev 2005 105 1401ndash1444 866
64 J V Selinger and J M Schnur Phys Rev Lett 1993 71 4091ndash4094 867
65 J M Schnur Science (80- ) 1993 262 1669ndash1676 868
66 B Tenchov R Koynova and G Rapp Biophys J 2001 80 1873ndash1890 869
67 R Koynova and B Tenchov Ser Biomech 2017 31 3ndash19 870
68 S J Angyal and R Le Fur Carbohydr Res 1984 126 15ndash26 871
69 J K Whitesell and M A Minton J Am Chem Soc 1987 109 225ndash228 872
70 T Takayama S Ando and I Ando J Mol Struct 1990 220 245ndash250 873
71 K Gawrisch N V Eldho and I V Polozov Chem Phys Lipids 2002 116 135ndash151 874
72 F Tielens C Gervais J F Lambert F Mauri and D Costa Chem Mater 2008 20 875
3336ndash3344 876
73 G A Jeffrey and Y Yeon Acta Crystallogr Sect B 1986 42 410ndash413 877
74 B Berglund and R W Vaughan J Chem Phys 1980 73 2037ndash2043 878
75 C Gervais C Coelho T Azaiumls J Maquet G Laurent F Pourpoint C Bonhomme 879
P Florian B Alonso G Guerrero P H Mutin and F Mauri J Magn Reson 2007 880
187 131ndash140 881
76 C Akita T Kawaguchi F Kaneko H Yamamoto and M Suzuki J Phys Chem B 882
2004 108 4862ndash4868 883
77 R N Purusottam L Seacutenicourt J J Lacapegravere and P Tekely Biochim Biophys Acta - 884
Biomembr 2015 1848 3134ndash3139 885
78 X Biarneacutes A Ardegravevol A Planas C Rovira A Laio and M Parrinello J Am Chem 886
Soc 2007 129 10686ndash10693 887
79 L M J Kroon‐Batenburg and J Kroon Biopolymers 1990 29 1243ndash1248 888
80 K N Kirschner and R J Woods Proc Natl Acad Sci U S A 2001 98 10541ndash889
10545 890
81 S Svenson B Kirste and J H Fuhrhop J Am Chem Soc 1994 116 11969ndash11975 891
82 I Sack S Macholl J H Fuhrhop and G Buntkowsky Phys Chem Chem Phys 892
2000 2 1781ndash1788 893
83 S Svenson J Koening and J H Fuhrhop J Phys Chem 1994 98 1022ndash1028 894
34
84 S Svenson A Schaefer and J H Fuhrhop J Chem Soc Perkin Trans 2 1994 2 895
1023ndash1028 896
85 K Bock and C Pedersen Adv Carbohydr Chem Biochem 1983 41 27ndash66 897
86 T B Grindley Structure and Conformation of Carbohydrates Springer Berlin 898
Heidelberg 2008 899
87 F Tantakitti J Boekhoven X Wang R V Kazantsev T Yu J Li E Zhuang R 900
Zandi J H Ortony C J Newcomb L C Palmer G S Shekhawat M O De La 901
Cruz G C Schatz and S I Stupp Nat Mater 2016 15 469ndash476 902
903
1
Supporting Information 904
905
Topological connection between vesicles and nanotubes in single-906
component lipid membranes driven by head-tail interactions 907
908
Niki Baccilea Ceacutedric Lorthioira Abdoul Aziz Baa Patrick Le Griela Cristina Coelhob Javier 909
Perezc Wim Soetaertd Sophie L K W Roelantsd 910
911
a Sorbonne Universiteacute Centre National de la Recherche Scientifique Laboratoire de Chimie de 912
la Matiegravere Condenseacutee de Paris LCMCP F-75005 Paris France 913
b Institut des Mateacuteriaux de Paris Centre Sorbonne Universiteacute Paris France 914
c Synchrotron Soleil LrsquoOrme des Merisiers Saint-Aubin BP48 91192 Gif-sur-Yvette Cedex 915
France 916
d InBio Department of Biotechnology Ghent University Ghent Belgium 917
918
919
Corresponding author 920
Dr Niki Baccile 921
E-mail address nikibaccilesorbonne-universitefr 922
Phone +33 1 44 27 56 77 923
924
925
926
2
a) 927
Parameter Method
Dry Matter (DM ) 996 Infrared balance 105degC
Glucose () 012 HPLC-Metacarb
Glycerol () nd HPLC-Metacarb
Free Fatty Acid content () lt001 Internal method BBEPP
GC with FID Detector
Oil () lt001 Internal method BBEPP
GC with FID Detector
Moulds (CFUg) lt10 3M-Nordval ndeg16 B
Yeasts (CFUg) lt10 3M-Nordval ndeg16 B
Anaerobic count (CFUg) lt10 SP-VG M005 B
Protein () tbd BCA protein assay
928
Figure S 1 - a) HPLC-ELSD chromatogram and composition table 929
930
931
932
933
3
b) 934
935
Group Ndeg δ ppm
CH2 1 354
CH2 2 153
CH2 3-712-14 132
CH2 811 203
CH 910 534
CH2 15 162
CH2 16 388
CH 1 424
CH 2 316
CH 3 334
CH 4 329
CH 5 354
CH2 6 366
Figure S 1 (next) ndash b) 1H NMR spectrum (MeOD-d4) recorded on the purified G-C181-OH compounds 936
and related assignment 937
938
2
811910 1rsquo
5rsquo1
3rsquo4rsquo
1rsquo1910
asymp asymp asympHDO MeOD Acetone
6rsquo2rsquo
1615
3-712-14
4
939
940
Figure S 2 ndash Cryo-TEM images recorded for a 5 mgmL G-C181-OH aqueous solution heat at T= 130degC 941
5
942
943
Figure S 3 - Cryo-TEM images recorded for a 5 mgmL G-C181-OH aqueous solution heat at T= 90degC 944
945
90degC
1
22
6
946
947
948
949
Figure S 4 ndash Cryo-TEM images recorded for a 5 mgmL G-C181-OH aqueous solution heat at T= 70degC 950
951
21
11
1
2
5
3
4
45
5
6
7
7
7
952
953
954
Figure S 5 ndash Cryo-TEM images recorded for a 5 mgmL G-C181-OH aqueous solution heat at T= 25degC 955
956
957
1
1 1
8
958
Figure S 6 ndash a) SANS experiment recorded at 90degC for a 5 mgmL G-C181-OH aqueous solution b-c) 959
WAXS experiments recorded on aqueous solutions of G-C181-OH at b) 5 mgmL and c) 25 mgmL d) 960
Structural interpretation of the repeating distances pointed out in c) 961
962
963
964
001 01 1
q Aring-1
25degC
68degC
88degC
111degC
01 1q Aring
-1
02 04 06 08 1q Aring
-1
001 01
10-1
100
101
Inte
nsity
cm
-1
q Aring-1
-2
T= 90degC
SANS WAXS WAXS
a) b) c)
dv
dL d= 144 Aring-1
di
ddH2O
dt
dvdL
dtdi d
d)
9
965
966
Figure S 7 ndash ssNMR MAS (10 kHz) experiments recorded on a G-C181-OH dry powder a) 1H spectra 967
recorded from 110degC to 70degC b) 13C single pulse (SP) spectra recorded with high power 1H decoupling from 968
110degC to 70degC c) 13C cross polarization (CP) spectra recorded at 110degC and contact time tc of 50 micros and 969
3000 micros d) 13C CP spectra recorded at 70degC and for 20 lt tc micros lt 3000 970
971
1
811
910
CH2 CH2
1rsquo
6rsquo
8 6 4 2 0 ppm
110
90
80
70
910
1rsquo
6rsquo16
1
2rsquo3rsquo4rsquo
811
OH
45 40 35 30 25 20 15
ppm
200 180 160 140 120 100 80 60 40 20 0
ppm140 120 100 80
ppm
CH2-gauche
3004
110
90
80
70
65
60
50
25
C91013003
C9 - 12869
CH2-all-trans
3198
C1rsquo10335
a) b)
1H
T degCT degC
13C Single Pulse MAS
A
B
A
B
70degC70degC
5rsquo
215
200 180 160 140 120 100 80 60 40 20 0
ppm
13C CPMAST= 110degC
200 180 160 140 120 100 80 60 40 20 0
ppm
132 131 130 129 128 127 126
ppm
106 105 104 103 102
ppm
13C CPMAST= 70degC
50
tc micros
3000
20
tc micros
50 500 1000 3000
tc micros
C102
13024 C910113003
C92
12869
C1rsquo213082
C1rsquo110443
A B
106 105 104 103 102
ppm
3000
1000
500
50
20
AB
c)
d)
10
972
Figure S 8 ndash a) Short and d) long T2 components displayed by the 1H transverse relaxation signal c) 1H 973
transverse relaxation signals recorded on a G-C181-OH dry powder from 110degC to 70degC The area of each 974
given resonance is plotted (log-lin) as a function of the echo time (CPMG pulse sequence) for each 975
temperature and fitted using the equation given above T2s and T2l indicate the short and long T2 relaxation 976
times respectively obtained by describing the 1H transverse relaxation signal using a biexponential decay 977
For H1rsquo H5rsquo and H6rsquo the 1H relaxation function could be described by a monoexponential decay 978
- Protons from the sugar group (H1rsquo H5rsquo H6rsquo) show a single T2 relaxation component (Figure 979
6c and Figure S 8) while protons of the acyl chain (CH2 H910 H811) show both short (Figure 980
6c) and long (Figure 6d) T2 relaxation component 981
- The short T2 relaxation time systematically decreases from 110degC to 70degC for all species by a 982
factor ranging from two to seven depending on the specific chemical group Very long T2 are 983
observed at 110degC for all acyl species while nearly unchanged values are measured below 984
90degC without any clear trend 985
- The sugar protons (H1rsquo H5rsquo H6rsquo) have the shortest set of T2 values (lt 1 ms) below 100degC 986
The long component of T2 generally ranges between 4 ms and 12 ms 987
0 1 2 3 4 5 6 7 8
00
05
10
15
20
25
30
35
40
45
Log
In
ten
sity
Time ms
0 1 2 3 4 5 6 7 8
00
05
10
15
20
25
30
35
40
45
Log
In
ten
sity
Time ms
0 1000 2000 3000 4000 5000 6000 7000 8000
00
05
10
15
20
25
30
35
40
45
Log
In
ten
sity
Time ms
0 1000 2000 3000 4000 5000 6000 7000 8000
00
05
10
15
20
25
30
35
40
45
Log
In
ten
sity
Time ms
0 1000 2000 3000 4000 5000 6000 7000 8000
00
05
10
15
20
25
30
35
40
45
Log
In
ten
sity
Time ms
0 1000 2000 3000 4000 5000 6000 7000 8000
00
05
10
15
20
25
30
35
40
45
Log
In
ten
sity
Time ms
H1
H8H11
H9H10
CH2
H1rsquo
H6rsquo
CH2
H910H811 H1CH2
H1rsquo H5rsquo6rsquo
0 1000 2000 3000 4000 5000 6000 7000 8000
00
05
10
15
20
25
30
35
40
45
Log
In
ten
sity
Time ms
OH
0 1000 2000 3000 4000 5000 6000 7000 8000
00
05
10
15
20
25
30
35
40
45 T= 110degC
T= 90degC
T= 80degC
T= 70degC
Log
In
ten
sity
Time ms
Fit
)
CH2 H910 H811 H1 H56 H1 OH
00
05
10
15
20
25
30
35
40
T2 m
s
T= 110degC
T= 90degC
T= 80degC
T= 70degC
CH2 H910 H811 H1
0
2
4
6
8
10
12
T2 m
s
T= 110degC
T= 90degC
T= 80degC
T= 70degC
Short T2(1H) Long T2(1H)
a) b)
c)
11
Table S 1 ndash 1H chemical shifts of G-C181-OH in solution and in the solid-state Solid-state spectra are 988
recorded at a MAS frequency of 10 kHz in DMSO-d6 broad peak 989
990
δH ppm
Group Ndeg Liquid
(MeOD-d4) Solid
(T= 110degC) Solid
(T= 70degC)
CH2 H1 354 357
CH2 H2 153 156
CH2 H3-712-14 132 135
CH2 H811 203 203
CH H910 534 534
CH2 H15 162 164
CH2 H16 388 383
CH H1 424 432
CH H2 316 335
CH H3 334 335
CH H4 329 335
CH H5 354 351 357
CH2 H6 366 383
OH OH1 432
45 463
OH OH2 492
OH OH3 490
OH OH4 487
OH OH6 445
991
992
H1H9H10H1rsquo
H6rsquo
OH2rsquo
OH1
12
Detailed discussion about the NOESY and DQ-SQ 2D 1H-1H ssNMR experiments presented in 993
Figure 9 994
995
2D 1H-1H ssNMR experiments are a unique tool to explore through-space proximities 996
between 1H nuclei ssNMR offers a large number of possibilities each adapted to a given 997
system The advantage of 2D maps with respect to a dynamics approach is their direct 998
readability in clear two nuclei which exchange their magnetization through-space (whichever 999
mechanism may be responsible for this exchange) will display a specific cross-peak However 1000
the way cross-peaks are presented and interpreted strictly depends on the nature of the pulse 1001
program which in turn is chosen according to the physical nature of the sample 1002
1D temperature-dependent 1H NMR experiments performed on G-C181-OH (Figure 1003
4a in the main text) indicate sharp peaks at 90degC and broad peaks at 70degC Narrow peaks 1004
indicate fast andor large-amplitude molecular tumbling averaging the strong 1H-1H dipolar 1005
interactions This excludes the use of pulse sequences like DQ-SQ which is not efficient under 1006
these conditions For this reason we employ spin-diffusion-based pulse sequences like 1007
NOESY which is more adapted for samples with high molecular mobility When mixing times 1008
are chosen to be short (lt 1 s) one generally explores through-space proximities within about 5 1009
10 Aring On the contrary when molecular motions are restricted dipolar coupling becomes 1010
significant 1H NMR peaks are broader and pulse sequences like DQ-SQ can now be used 1011
with a spatial resolution of less than 5 Aring 1012
Whenever possible DQ-SQ experiments are preferred over spin diffusion-based pulse 1013
sequences because they are more selective in particular for likewise interactions which are 1014
not discriminated in NOESY-type experiments This is illustrated by the typical interaction 1015
schemes for NOESY (top Figure 9a) and DQ-SQ (top Figure 9b) For two given A and B 1016
protons 2D NOESY maps will display two on-diagonal and two square-shaped symmetrical 1017
off-diagonal cross-peaks Off-diagonal cross-peaks illustrate the mutual A-B and B-A 1018
interaction but the on-diagonal peaks are systematic and do not prove any A-A or B-B 1019
interaction Similarly to NOESY 2D DQ-SQ maps display off-diagonal peaks (symmetric 1020
across the diagonal top Figure 9b) upon A-B and B-A interaction but in contrast they will 1021
display on-diagonal peaks only in the presence of self-interaction In the tutorial example of 1022
Figure 9b top the on-diagonal A-A peak indicates mutual A-A interaction while lack of on-1023
diagonal B-B peak evidences the absence of B-B proximities Combining NOESY and DQ-SQ 1024
experiments is capital to study the local arrangement of G-C181-OH and its evolution with 1025
temperature 1026
13
At T= 90degC the H1 and H5rsquo contributions are very close but possible to discriminate 1027
them (δ(H1)= 354 ppm δ(H5rsquo)= 351 ppm) according to 1H NMR chemical shifts in Table S 1028
1 2D 1H-1H NOESY in Figure 9a also discriminates between the two components attributed 1029
on the basis of the interactions with their mutual neighbors (green H1-H2 and H5rsquo-H1rsquo squares 1030
in Figure 9a) On this basis 2D NOESY does not show a direct H1rsquo-H1 correlation (blue red-1031
crossed) but rather an extensive network of intra-sugar interactions These features exclude 1032
suggest intra- and inter-sugar interactions and they exclude head-tail arrangements as a major 1033
molecular configuration at 90degC 1034
At 70degC the 1H NMR peaks are broader indicating a reduction of the T2 (1H) relaxation 1035
times andor residual homonuclear dipolar interactions excluding the use of NOESY In this 1036
case 1H-1H DQ-SQ correlation experiments are best suited Figure 9b presents the 1H-1H DQ-1037
SQ experiment on G-C181-OH at 70degC Peaks are broader than in NOESY and attribution may 1038
be cumbersome However the experiment is performed at 700 MHz and MAS= 22 kHz which 1039
improves spectral resolution with respect to the same experiment performed at 300 MHz and 1040
MAS= 10 kHz The auto-peak at δH= 356 ppm in the SQ dimension is attributed to H1-H1 spin 1041
pairs mainly resulting from intra CH2 interaction while the DQ cross-peaks at δH= 156-356 1042
ppm and δH= 432-356 ppm respectively origin from H2-H1 and H1rsquo-H1 interactions (Figure 1043
9b) DQ-SQ map does not show any auto-peak corresponding to H1rsquo-H1rsquo or Hxrsquo-Hxrsquo (x= 2rsquo 1044
3rsquo 4rsquo) interactions (red-crossed blue Figure 9b) thus excluding any proximity (lt 5 Aring) between 1045
close glucose neighbors On the contrary DQ-SQ maps (recorded both at 700 MHz Figure 9b 1046
or at 300 MHz not shown) systematically show DQ cross-peaks which can only be attributed 1047
to H1rsquo-H1 interactions (δH= 432-356) The presence of these H1rsquo-H1 interactions can only be 1048
explained by a head-tail arrangement of the G-C181-OH molecules as illustrated below the 1049
DQ-SQ map in Figure 9b 1050
10
257
The series of cryo-TEM images in Figure 2b show an overview of the most relevant 258
structures observed on G-C181-OH solution from T= 130degC to T= 25degC whereas T is 259
indicative of the equilibrium temperature before cryofixation (refer to materials and methods 260
section for more information on the sense and interpretation of T) At Tgt 100degC the sample 261
is essentially composed of polydisperse single wall vesicles massively shown by the 262
complementary pictures presented in Figure S 2 In between Tm1 and Tm2 at T= 90degC and T= 263
70degC (Figure 2b Figure 3 Figure 4 complemented by Figure S 3 and Figure S 4) vesicles are 264
connected by nanotubes At Tlt Tm1 flat crystals are otherwise observed (Figure 2b and Figure 265
S 5) 266
267
268
Figure 3 ndash Cryo-TEM images recorded for a 5 mgmL G-C181-OH aqueous solution heat at T= 90degC 269
270
A deeper insight at T= 90degC is given in Figure 3 (more images are provided in Figure 271
S 3) Arrows 1 through 6 mark very clearly the typical continuity in the glucolipid membrane 272
between the vesicle and nanotubes Arrow Ndeg 7 shows that a single nanotube connects the outer 273
membrane of two vesicles several hundred nanometers apart The connection is shown by 274
2
34
5
6
6
1
5
7
A
B
D
C
0 10 20 30 40 50 60
BIn
tensity
au
Profile nm
A
0 10 20 30 40 50 60
Inte
nsity
au
Profile nm
C
D
T= 90degC
11
arrows Ndeg5 and Ndeg6 The corresponding profiles A through D confirm the tubular nature of 275
the elongated objects Profiles B and D are both characterized by typical symmetrical thick 276
walls (low intensity depths highlighted by shaded rectangles) surrounding a hollow region (high 277
intensity peak between the shaded rectangles) The wall thickness varies between 35 and 40 278
nm for profile B and between 41 and 61 nm for profile D while the total nanotube diameter 279
varies between 14 nm at B and 20 nm at D At the same time the thickness of the vesicle wall 280
is about 6 nm at A and 135 nm at C Considerations about the bilayer or interdigitated structure 281
of the membrane will be presented below 282
The connection between nanotubes and vesicles seems to be multiple For instance 283
arrow Ndeg1 (Figure S 3) and Ndeg4 (Figure 3) show a single-wall vesicle of which the membrane 284
is extruded into a nanotube Similarly a closer look at arrows Ndeg1 2 and 3 in Figure 3 show 285
that the vesicle is single-wall and fully closed while the nanotube nucleates at the vesicle outer 286
surface with no apparent topological continuity In many regions of the sample at T= 90degC 287
one can find exvaginations or buds232531 in the nanotube wall This is shown for instance by 288
arrows Ndeg7 and particularly put in evidence in Figure 4 by arrows Ndeg1 through Ndeg4 where the 289
amplitude of the oscillation varies between 20-25 nm (arrow Ndeg1) and 6-8 nm (arrows Ndeg3-4) 290
291
Figure 4 - Cryo-TEM images recorded for a 5 mgmL G-C181-OH aqueous solution heated at T= 90degC 292
293
Still between Tm2 and Tm1 but at lower temperature (T= 70degC) the nanotubes seem to 294
vary from single threads (arrow Ndeg1 Figure S 4) to nanotubes of diameter below 15 nm both 295
connecting nanotubes of diameter ranging between 50 nm and 100 nm (arrows Ndeg2 Figure S 296
4) The larger tubes are most likely formed by the inflation and flattening of the nanotubes 297
probably after assimilation of surrounding vesicles and fusion of the exvagination discussed 298
above The transition between vesicles tubes and flat membranes is certainly more accentuated 299
Arrow Ndeg3 in Figure S 4 shows distinct vesicles while arrow Ndeg4 identifies a flat structure 300
evidently formed from fused vesicles In particular arrow Ndeg5 points at the fusion of two 301
2
1 132
4
12
vesicles while arrow Ndeg6 points at two vesicles fusing into the flat membrane Additional areas 302
where vesicle fusion is prominent are indicated by the oscillations at the outer skirt of broad 303
lamellae and pointed by arrow Ndeg7 304
Finally below Tm1 at T= 25degC for instance mainly flat crystals with no visible 305
exvaginations or tubes are visible (Figure S 5) by cryo-TEM and the material turns into an 306
insoluble precipitate Massive presence of flat crystalline structures is also clear from the bulk 307
iridescent behavior of a G-C181-OH solution under manual shear 308
In summary despite the uncertainty related to the actual state of equilibrium of the 309
glucolipids at the moment of cryofixation cryo-TEM depicts a vesicle phase at Tgt 100degC a 310
flat lamellar phase below Tm1 and an interconnected vesicle-nanotube network between Tm1 and 311
about 100degC The combination of statistically-relevant fluorescence microscopy and 312
scatteringdiffraction experiments provides an additional proof of the coexistence of 313
vesiclenanotube systems between the two transition temperatures Please note that the 314
experiments reported below have been performed under controlled conditions of temperature 315
which is then indicated by the use of T instead of T 316
13
317
Figure 5 ndash a-c) Confocal fluorescence microscopy images recorded at 90degC and 70degC for a 5 mgmL G-318
C181-OH aqueous solution d-g) Typical fluorescence microscopy images recorded at T= 80degC using 319
Laurdan (refer to materials and methods section for more details on this fluorophore) Excitation 320
wavelength is 405 nm for all the images while emission wavelength is 490 nm in (df) and 440 nm in (eg) 321
h) Full emission spectra obtained from the integration of various fluorescence images recorded from 412 322
nm to 600 nm (step 5 nm) at 90degC 80degC and 70degC i) Box plot of GP defined as 119918119927 =(120640120786120786120782minus120640120786120791120782)
120640120786120786120782+120640120786120791120782 with 120640120786120786120782 323
and 120640120786120791120782 being the emission wavelengths at 440 nm and 490 nm at 90degC 80degC and 70degC Each data point 324
l= 490 nm l= 440 nm
l= 490 nm l= 440 nm
10 μm400 450 500 550 600
00
02
04
06
08
10
No
rma
lize
d I
nte
nsity
l nm
90degC
80degC
80degC
70degC
70degC
400 450 500 550 60000
02
04
06
08
10
No
rma
lize
d I
nte
nsity
l nm
90degC
80degC
80degC
70degC
70degC
d) e)
f) g)
h)
i)
T= 80degC
Laurdan
T= 80degC
T= 80degC T= 80degC
T= 90degC T= 70degC T= 70degC
a) b) c)
1
1
1
14
corresponds to a set of regions of interest (ROIs) (54 at 90degC 65 at 80degC and 75 at 70degC) selected in the 325
corresponding fluorescence images ROIs were representatively selected so to include the entire image but 326
also vesicles alone tubes alone and mixtures of vesicles and tubes 327
328
Figure 5ab shows two typical confocal fluorescence microscopy images recorded on a 329
G-C181-OH solution (5 mgmL) in a flame-sealed capillary heat at T= 90degC and T= 70degC 330
Although the resolution of optical microscopy is not comparable with cryo-TEM the sample is 331
broadly composed of vesicles coexisting with nanotubes whereas in some cases the nanotube 332
starts from the vesicle itself (arrow Ndeg1) in good agreement with cryo-TEM data Furthermore 333
SANS recorded at T= 90degC (Figure S 6a) shows a scattering profile with a pronounced -2 334
dependence of the scattering intensity against the wavevector q in the log-log scale This 335
indicates the massive presence of a flat interface and it is expected typical of bilayers in 336
vesicular morphologies56 However the typical signature of nanotubes cannot be observed in 337
the SANS profile and this can be explained by both an argument related to the relative lower 338
amount of nanotubes with respect to vesicles at 90degC but also to the steeper slope of flat 339
morphologies (-2) compared to tubes (-1) the signal of the former masking the tube signal at 340
low wavevector values The SANS profile is characterized by a diffraction peak at q= 0167 Aring-341
1 of which the assignment is refined by WAXS data 342
Temperature-driven WAXS experiments in Figure S 6bc (5 mgmL-1 and 25 mgmL-1 343
respectively) show a lamellar order possibly attributed to a multilamellar structure of the 344
vesicles (dv Figure S 6d) at high temperature and to the interplanar arrangement of the 345
crystalline flat structures (dL Figure S 6d) at T= 25degC The sharp (001) reflection indicates 346
typical interlamellar distance of 353 Aring at 25degC although this value varies with temperature 347
(400 Aring at 111degC 372 Aring at 88degC) thus confirming its assignment to a hydration-dependent 348
interlamellar order More intriguing is the second broader peak at q= 0403 Aring-1 (d= 156 Aring) 349
and its reflection both clearly visible at 88degC below Tm2 We attribute it to the inter-glucolipid 350
arrangement inside the tubular phase (dt Figure S 6d) coexisting with the vesicle phase 351
between Tm1 and Tm2 and to the planar lipid arrangement (di Figure S 6d) in the rigid flat 352
lamellar structure below Tm2 Its temperature- hence hydration- independent position also 353
confirms its structural origin Finally besides the water-structure peak at about 2 Aring-1 we also 354
observe a broad peak at 144 Aring-1 characteristics of the lateral packing (d Figure S 6d) of lipids 355
in bilayers While its position could be consistent with an Lα phase5758 above Tm2 its broadness 356
and positional invariance as well as the coexistence between vesicles and tubes do not allow a 357
precise assignment 358
15
Does G-C181-OH assume a bilayer or interdigitated structure the latter being the one 359
found for other similar bolaform glucolipids4243 The size of G-C181-OH can be estimated to 360
be at the most 32 Aring given by the length L of the C16 tail (L = 22 Aring from the Tanford formula 361
L= 154 + 1265 times n (n= 16)59) and the sugar (about 10 Aring)4243 However the cis conformation 362
of the C=C bond imposes a ldquokinkrdquo of 60deg in the aliphatic chain which reduces the effective 363
length of the oleic backbone to about 17 Aring for an effective total G-C181-OH length of about 364
27 Aring Cryo-TEM provides a tube thickness varying from 35 Aring to 60 Aring and a vesicle membrane 365
thickness of at least 60 Aring WAXS suggests an interlamellar thickness (membrane and water) 366
between 40 Aring and 37 Aring and an inter-lipid distance in the tube of about 16 Aring In the absence of 367
a clear form factor oscillation profile as found for similar glucolipids4243 one must 368
acknowledge that these data pledge neither in favor of fully interdigitated nor a double layer 369
structure and might suggest a tilted lipid arrangement with partial interdigitation60 370
371
13C ssNMR demonstrates that G-C181-OH can assume two coexisting head-head and 372
head-tail configurations 373
Vesicles are characterized by low positive mean and gaussian curvatures while 374
nanotubes are described by a combination of a high positive mean and zero gaussian curvatures 375
In this regard the coexistence of vesicles and nanotubes requires glucolipids to adapt 376
themselves to both environments at the same time For this reason the formation of nanotube-377
vesicle networks generally requires a specific driving force able to impose a high mean and 378
zero gaussian curvature to the membrane In many systems insertion of at least a second 379
constituent (lipid surfactant protein) in the membrane becomes a necessary internal driving 380
force for the nucleation and growth of so-called membrane inclusions from which 381
topologically-connected nanotubes can form10ndash123261 as explained by orientational ordering 382
arguments62 It has also been shown that external driving forces such as use of laser 383
ldquotweezersrdquo30 osmotic pressure6 electroformation5ndash82829 or controlled suction13ndash16 are 384
otherwise necessary as also supported by theoretical studies19 385
The bending energy of tubes is higher than that of a vesicle membrane8 due to the 386
dependence of the membrane free energy from the principal curvatures For this reason 387
isotropic (rotational symmetry along the main axis) but also anisotropic33 lipids generally 388
stabilize low-curvature shapes like flat membranes or vesicles Lipid nanotubes are also a 389
common phase formed by amphiphiles but generally for lipids with a certain complexity in 390
their molecular structures as exampled by diacetylenic derivatives of phospholipids among 391
others262763ndash65 Negative contributions to the bending energy favoring the simultaneous 392
16
presence of interconnected vesicles and tubes was shown to be driven by the presence of 393
anisotropic lipids in a membrane continuum Spontaneous deviations to the elastic theory in the 394
presence of surfactants lipids and proteins with anisotropic structures favor the formation of 395
protrusions with radius of the order of the fraction of a micron9ndash1219ndash2362 396
In the absence of both internal and external driving forces mentioned above G-C181-397
OH should behave as a standard lipid Its DSC profile (Figure 2)536667 under both hydrated and 398
dry conditions identifies a hydration-independent transition (Tm1) slightly above room 399
temperature this is followed by one main transition at higher temperature (Tm2) in the dry 400
sample50 For such a profile one expects a gel phase (Lβ) below Tm1 and a liquid crystalline 401
structure possibly in the morphology of vesicles (L4 phase) possibly above Tm1 and most likely 402
above Tm231 as experimentally found On the basis of the thermogram recorded on the dry 403
powder one may also expect a ldquoripplerdquo (Pβ) phase between Tm1 and Tm2 characterized by 404
periodic undulations of the bilayer (generally addressed to as regions with both liquid order and 405
disorder)5455 406
In the present work instead of a Lβ phase we observe flat crystals below Tm1 and a 407
vesicle-nanotube network instead of the ldquoripplerdquo phase The latter is particularly unexpected 408
because the membrane is composed of a single-component (G-C181-OH) and no anisotropic 409
external force (osmotic hydrodynamic electric) is used to pull and stabilize the tubes In 410
addition the nanotubes are observed at fairly high temperatures above Tm1 (between about 411
60degC and 90degC) while this morphology is generally favored at low temperature (proportionality 412
with 1kT figure 5 in Ref 62) commonly below a given transition temperature characteristics 413
for each specific amphiphile27 Furthermore nanotubes of G-C181-OH seem to be stable in 414
time thus differing from what is found in electroformed vesicles78 They are also observed 415
away from phase transition events (may them be at Tm1 or Tm2) as otherwise reported before 416
for a diacetylenic derivative of phosphatidylcholine26 and many other systems27 417
A stable nanotube-vesicle network for a single-component phospholipid in the absence 418
of external driving forces is not expected and has never been reported before It could be 419
explained by the coexistence of two micro-separated phases of different rigidity This 420
hypothesis is excluded by confocal microscopy on Laurdan-labelled membranes and magic 421
angle spinning (MAS) solid-state NMR (ssNMR) experiments 422
Laurdan is a well-known fluorophore used to put in evidence the coexistence of rigid 423
and fluid domains in both model and biological membranes47ndash49 Laurdan was used here to label 424
the G-C181-OH membranes between Tm1 and Tm2 and to verify the possible micro-segregation 425
and coexistence of rigid (eg Lβ λem= 440 nm) and fluid (eg Lα λem= 490 nm) domains in 426
17
tubes and vesicles respectively A set of quantitative experiments performed on a 5 mgmL-1 427
solution summarized in Figure 5 shows an excess of fluorescence at only λem= 490 nm for 428
temperature between 90degC and 70degC (Figure 5h) The GP value which quantifies the rigidfluid 429
character of the membrane is systematically negative (Figure 5i) indicating an overall fluid 430
membrane at all temperatures GP is quantified on more than 50 regions of interest (ROIs) at 431
each temperature including vesicles and tubes alone as well as connected nanotube-vesicles 432
(Figure 5d-g) The dispersion of GP at 80degC and 70degC between -08 and -02 could suggest the 433
spurious presence of membranes with various degrees of flexibility although fluidity is always 434
predominant The combination of WAXS (broad peak d= 144 Aring-1 invariant with 435
temperature Figure S 6bc) and confocal fluorescence microscopy using Laurdan confirms the 436
single-phase of the membrane composed of G-C181-OH both in vesicles and nanotubes This 437
is also consistent with the lack of phase transitions in DSC experiments between ~85degC and 438
~60degC especially in hydrated samples We conclude that the vesicle-nanotube transition is not 439
driven by the local segregation of gel phase (Lβ) microdomains nor that the nanotubes are 440
composed of such phase 441
ssNMR is the best-suited approach to investigate the origin of the local driving force for 442
the nucleation of anisotropic inclusions of which the average orientation depends on the local 443
membrane and inclusion curvatures and was shown to promote tubing62 ssNMR can provide 444
information on the local molecular mobility eg through the nuclear spin relaxation behavior 445
but also on intermolecular interactions and stereochemistry eg through variations in the 446
chemical shift68ndash70 447
Ideally ssNMR should be performed on diluted G-C181-OH samples above Tm1 448
However fast MAS necessary for high resolution centrifuges the sample As a first 449
approximation hydrated G-C181-OH samples for instance at 50 wt as classically done for 450
phospholipids71 could be studied Unfortunately permeability of the sample holder combined 451
to heating (close to the boiling point of water) and MAS provoke dehydration and even sample 452
ejection After experiencing both of the above this approach was abandoned As a second 453
approximation the study of the dehydrated G-C181-OH powder avoids centrifugation and 454
evaporation If studying dried lipids may not reflect their exact behaviour under diluted 455
conditions valuable structural information can still be obtained in dehydrated molecular 456
systems like proteins thus illustrating that this approach is not unreasonable Furthermore if 457
DSC (Figure 2a) shows that hydration suppresses the Tm2 it also shows that the value of Tm1 is 458
not affected by water at concentrations as low as 10 wt For this reason performing a 459
structural analysis of dehydrated G-C181-OH by ssNMR above Tm1 may help understanding 460
18
the local arrangement of G-C181-OH in two morphologies vesicles and nanotubes having 461
sensibly different curvatures 462
To explore the local mobility of the most relevant chemical groups of G-C181-OH 463
above Tm2 (T= 110degC) and between Tm2 and Tm1 (70 lt T degC lt 90) we combine a series of 1H 464
and 13C experiments Single-pulse (SP) MAS experiments (1H and 13C) when recorded under 465
quantitative conditions allow the detection of all chemical species while cross-polarization 466
(CP) MAS (13C only) experiments are sensitive only to constrained groups for which the 1H-467
13C dipolar coupling is not averaged to zero by the molecular motions 468
469
Figure 6 ndash a) 1H MAS (10 kHz) ssNMR spectra recorded from 110degC to 70degC b) 13C MAS (10 kHz) ssNMR 470
spectra recorded using high power decoupling single pulse (SP) and cross-polarization (CP) pulse sequences 471
Contact time for CP experiments and corresponding temperatures are given on each spectrum Full spectra 472
are given in Figure S 7 473
The most relevant 1H and 13C spectra are given in Figure 6 (full range in Figure 7 and 474
Figure S 7) As expected the 1H solid-state SPMAS spectra show broader peaks compared to 475
the solution-state NMR spectrum (Figure 6a) reflecting the obvious solid-state character of the 476
sample at any temperature The sugar group and the C=C bond resonate in the 25-6 ppm range 477
and 535 ppm respectively while the OH groups of the sugar moiety are found below 45 ppm 478
(Figure 6a full assignment in Table S 1) Very broad (~1 ppm) at 100degC the position of the 479
OH peak varies with the temperature value and becomes narrower (lt~05 ppm) and visible at 480
δH= 464 ppm at T= 70degC Line narrowing and chemical shift variations of the OH resonance 481
in ssNMR is always a direct sign of H-bonding interactions whereas the strength of the H-482
bonding hence its OHhellipH distance is correlated to a dispersion in chemical shifts72ndash75 All other 483
60 55 50 45 40 35 30 25
ppm
110
90
80
70
910
1rsquo
6rsquo16
1
OH
134 132 130 128 126
ppm110 108 106 104 102 100
ppm
SP (T= 110degC)
SP (T= 70degC)
CP 50 ms (T= 70degC)
CP 3 ms (T= 70degC)
910 1rsquo
1H 13C
1
811
910
CH2 CH2
1rsquo
6rsquo
a) b)
C102
13024
C9101
13003
C92
12869 C1rsquo210382
C1rsquo110443
C1rsquo13035
2rsquo3rsquo4rsquo
T degC
5rsquo
19
resonances broaden from 110degC to 70degC thus indicating slower andor more anisotropic 484
reorientational motions of all chemical groups The specific dynamic behaviour of the sugar 485
headgroup is also reflected by its 1H transverse relaxation time T2 whereas the shorter the T2 486
the higher the rigidity Experiments performed between 110degC and 70degC shown and 487
commented in Figure S 8 in the Supporting Information globally show a single short (lt 1 ms 488
below 100degC) T2 relaxation component for H1rsquo H5rsquo and H6rsquo and two both short and long 489
(between 4 ms and 12 ms) T2 for the acyl chain (CH2 H910 H811) even below 100degC 490
At 110degC 13C SPMAS experiments (Figure 6b full range in Figure 7 and Figure S 7 491
assignments in Table 1) show a single peak at δC= 10335 ppm for C1rsquo and at δC= 13003 ppm 492
for C910 as expected for a symmetrical conformation with two chemically-equivalent 493
carbons76 At 70degC the C1rsquo peak disappears while C910 now shows two peaks around 128 494
ppm and 130 ppm (Table 1 full temperature series in Figure S 7b) attributed to C92 (δC= 12869 495
ppm) and C10 in a non-symmetric configuration respectively for which these two carbons are 496
chemically inequivalent76 More precisely the resonance at 130 ppm is actually the 497
superposition of two close resonances C9101 (δC= 13003 ppm) and C102 (δC= 13024 ppm) 498
where subscripts 1 and 2 stand for two different conformations of the cis-olefin group as 499
reported for various phases of oleic acid in the vicinity of 0degC76 500
501
Table 1 ndash 13C Chemical shifts of G-C181-OH in solution and solid-state Solid-state experiments are 502
recorded at MAS= 10 kHz All spectra are reported in Figure 7 and Figure S 7 The contact time for cross 503
polarization is 3 ms In all ssNMR experiments temperature is first raised at 110degC and then lowered to 504
either 90degC or 70degC Attribution of the 13C resonances in Table 1 is performed on the basis of the solution 505
spectrum (Figure S 1b) Additional peaks observed in both single pulse and cross polarization ssNMR 506
experiments are attributed when possible to a configuration effect of the given atom eg C9101 and C92 507
indicate two configurations of C9 All new peaks observed in solid-state and not detected in solution are 508
highlighted in red for convenience 509
510
511
δ ppm
Peak Liquid (DMSO-d6)
Solid Single Pulse
T= 110degC
Solid Single Pulse
T= 90degC
Solid Single Pulse
T= 70degC
Solid Cross Polarization
T= 70degC
C102
- - 13024 13024
C910C9101 13009 13003 13003 13003 13003
C1C9C10C1rsquo
C6rsquo
20
C92 - - - 12869 12869
C1rsquoC11 10329 10335 10335 - 10443
C12 - - - - 10382
C3 7724 7709 7702 - 7829
- 7634 7629 - 7621
7525
C2 7388 7398 7390 7370 7370
C4 7052 7077 7054 7041 7098
C16 6900 7016 - - 7029
- - - - 6793
C1C5C6 6153 6241 6236 6239 6262
C1C5C6 6117 - - - 5956
C2 3300 3290 3290 3283 3279
CH2(trans) - - - 3198 3196
CH2(gauche)C15 2941 2981 2987 3004 -
C811 2706 2747 2747 2832 2817
CH2 2597 2625 2628 2630 2817
512
13C CPMAS spectra at 70degC (Figure 6b full range in Figure 7 and Figure S 7d) at 513
increasing contact times confirm the presence of two cis-olefin environments one for which 514
C910 are equivalent labelled here C9101 and one for which they are inequivalent labelled 515
C92 C102 Both environments are rigid enough to be observed at short contact time (tc= 50 μs) 516
A similar double environment is also observed for the sugar C1rsquo CPMAS at 70degC shows two 517
peaks (C1rsquo1 at δC= 10443 ppm C1rsquo2 at δC= 10382 ppm Figure 6b Figure S 7d) These are 518
significantly shifted downfield from the C1rsquo peak observed at 110degC and are detected at contact 519
times as short as 50 μs thus indicating their rigid character One also finds that CPMAS is 520
totally inefficient at 100degC for short contact times (50 μs) and poorly efficient even at 3 ms 521
typical of fast-tumbling molecules (Figure S 7c) also both gauche (δC= 3004 ppm) and all-522
trans (δC= 3198 ppm) conformations of the CH2 carbons coexist at 70degC (Figure S 7b)77 523
According to ssNMR one main mobile molecular environment exists at 110degC as 524
shown by the well-resolved 1H spectrum single C=C (C9101) and anomeric (C1rsquo) resonances 525
gauche conformation of the aliphatic CH2 and single T2 of the aliphatic CH2 chain and sugar 526
protons The sugar group is certainly mobile (inefficient 1H13C CPMAS) but still more 527
constrainted than the acyl chain (shorter T2 (1H)) As the temperature is lowered the overall 528
rigidity increases (broadening of 1H NMR peaks faster 1H transverse relaxation and efficient 529
1H13C magnetization transfer during CPMAS) presumably driven by H-bonding 530
interactions (downfield shift and line narrowing of the OH 1H signal very short OH T2 loss of 531
the C1rsquo signal in SPMAS) At the same time a number of spectroscopic data (two concomitant 532
21
resonances for anomeric C1rsquo1 and C1rsquo2 cis-olefin C9101 and C92 C102 and CH2 gauche and 533
all-trans environments) and relaxation behaviour (fast and slow T2 relaxation components) 534
strongly suggests the coexistence of two molecular environments Further proofs of the 535
coexistence of two distinct molecular domains are given by a number of chemical shift 536
variations in the 13C CPMAS spectrum at 70degC compared to the one at 110degC 90degC and 537
solution This is shown in Figure 7 and in the list of 13C chemical shifts in Table 1 538
539
540
Figure 7 - Comparison between solution- and solid-state 13C NMR spectra of G-C181-OH Solid-state 541
experiments are recorded directly on the sample powder at a MAS of 10 kHz (4 mm zirconia rotor) SP 542
Single Pulse CP Cross Polarization In all the ssNMR experiments temperature is first raised at 110degC 543
and then lowered to either 90degC or 70degC Segmented lines are meant to highlight the known peak position 544
in solution thus stressing the strong chemical shift variations in the solid-state 545
546
NMR experiments above Tm2 suggest that vesicles could contain G-C181-OH with a 547
single family of mobile conformations characterized by chemically-equivalent C=C (red 548
Figure 8b) and a single C1rsquo conformation (green Figure 8b) Experiments between Tm1 and Tm2 549
otherwise suggest that two coexisting conformations characterized by chemically-equivalent 550
(red Figure 8b) and inequivalent (magenta Figure 8b) C=C could be associated to nanotubes 551
Two distinct C1rsquo sites (grey Figure 8b) also indicate two configurations of the sugar headgroup 552
A comment on this point will be given in the following paragraphs 553
The local (Aring-scale) variation of molecular mobility below Tm2 drives the coexistence of 554
two distinct molecular environments of the same G-C181-OH molecule This occurs within a 555
single-phase domain (as deduced by WAXS) of equivalent membrane rigidity (as derived from 556
Laurdan probe in confocal microscopy) Although never reported before the difference in the 557
local mobility of the same amphiphile (here G-C181-OH) could satisfy the theoretically-558
140 120 100 80 60 40 20
CP(3 ms)-70degC
SP-70degC
SP-90degC
SP-110degC
ppm
LiquidC910
C1rsquo
C2rsquo
C4rsquo
C3rsquo
C1
C6rsquoC5rsquo
C1
6
C8
11
C2 C
H2
C1
5
CH
2
DM
SO
13C
22
required conditions that induce local lipid segregation and formation of membrane inclusions 559
(Figure 8c) In case of their non-zero average orientation the local membrane curvature 560
increases62 and nanotubes can spontaneously form (Figure 8bc) More intriguing this 561
mechanism occurs at least 10degC above Tm1 although it should not be favored above the Tm27 562
From both experimental and theoretical backgrounds the conditions of topologically-563
connected vesicles-nanotubes systems are met only when either internal (two components) or 564
external driving forces are applied19 In the present single-lipid system of which the phase 565
behavior is summarized in Figure 8a the most plausible driving force could be explained by 566
the NMR results collected on the dry sample G-C181-OH concomitantly occupies two 567
molecular environments characterized by 1) two distinct conformations of the sugar 568
displaying equivalent mobility and 2) two conformations of the acyl chain unsaturation 569
570
23
571
Figure 8 ndash a) Thermotropic phase behavior of G-C181-OH at 5 mgmL-1 Note that Tm2 is observed on the 572
dry powder only b) Possible relationship between the molecular environment as derived from NMR and 573
membrane curvatures All the molecular drawings refer to the same G-C181-OH molecule (bulky ellipsoid 574
equiv sugar headgroup) while each color corresponds to a given configuration Grey of C1rsquo1 and C1rsquo2 indicates 575
the uncertainty about the assignment of the specific NMR peak The curvature C is defined as 1R R being 576
the curvature radius R1 R2 radius of curvature CG Gauss curvature CM Mean curvature c) Free 577
interpretation of the anisotropic high-curvature (CMgt 0 CG= 0) inclusions in the membrane (low CM and 578
CG) continuum driven by inter-sugar H-bonding and reduced intramembrane diffusion for a G-C181-OH 579
glucolipid 580
581
Flat crystalline structure
Nanotube-vesicle network
Vesicles
48degC
120deg
106 105 104 103 102 101
ppm
H9 H10H1rsquo
106 105 104 103 102 101
ppm106 105 104 103 102 101
ppm106 105 104 103 102 101
ppm
C=CC=C
C1rsquo1C1rsquo2
C1rsquo
Tm2(96degC)Tm1
a)
b)
c)
Same molecule different local orientations and sugar conformations
High curvature membrane
Low curvature inclusion
Flip-FlopStrong H-bonding
CG
CM ( + )
CG 0
CM 0 CG 0
CM 0
G-C181-OH
24
Two related questions are unanswered at the moment What actually drives nanotube 582
formation and is the organization of G-C181-OH within the vesicles and tubes the same Lipid 583
nanotubes have been studied for at least three decades over which broad experimental and 584
theoretical insight has been generated Despite this fact the actual understanding is still matter 585
of debate27 Micelle-to-nanotube and vesicle-to-nanotube phase transitions are generally 586
reported for single amphiphiles below a given Tm and intermediate phase composed of twisted 587
and flat fibers is concomitantly reported Initially thought to be a chirality-driven phenomenon 588
recent studies propose a more general mechanism involving crystallization and symmetry 589
breaking in the lipid packing driven by optimal packing27 If twisted ribbons were observed 590
before for a number of microbial glycolipid bolaamphiphiles44 they are not found for G-C181-591
OH This fact as well as the large body of cryo-TEM images and the observation of nanotubes 592
above Tm1 rather pledge in favour of a direct topological change from positive (vesicles) to 593
zero (nanotubes) Gaussian curvatures In this case vesicle-to-nanotube transitions could be 594
driven by external forces56307813ndash162829 595
Considering the absence of external forces in the present system there are only two 596
possibilities left spontaneous budding of the membrane or nanotube pulling after inter-vesicle 597
collisions due to Brownian motion Both are possible as inclusions composed of a different 598
arrangement of the same molecule in the membrane continuum can theoretically explain 599
spontaneous nanotube formation in an isotropic medium672223629ndash1218ndash21 However the second 600
one is probably more likely to prevail because it could explain the large number of nanotubes 601
connecting two distant vesicles Interestingly similar events occur for any phospholipid-based 602
vesicular solution but nanotubes are extremely rare unless at least two lipids of different 603
molecular structure are mixed together The spectroscopic 1H and 13C and relaxation (1H) 604
ssNMR data even if collected on a dry powder demonstrate that the coexistence of two G-605
C181-OH configurations involving both the sugar headgroup and fatty alcohol chain are 606
possible for this molecule As a matter of fact this is not so surprising as more than one energy 607
minima each corresponding to a given conformation are known for glucose its non-reducing 608
derivative methylglucose and carbohydrates in general78ndash80 609
The presence of two configurations could explain the coexistence between two 610
structures of different curvature but the data presented so far do not explain the origin of these 611
two configurations In other words what drives the change in the local structure of the sugar 612
headgroup and fatty alcohol within the membrane 613
The association of known self-assembled structures to spectroscopic 13C ssNMR data is 614
known for years in particular for gluconamides lipids having a linear sugar headgroup81ndash84 It 615
25
was found that gauche effects in some cases up to the γ position in the sugar chain induce 616
upfield chemical shifts while anti and trans conformations result in downfield shifts Each 617
structure (monolayer crystal bilayer crystal or micellar fiber) was then characterized by a given 618
organization of the gluconamide and a characteristic 13C ssNMR fingerprint which could be 619
explained by gauche γ-gauche anti and trans conformations of the headgroup Similar 620
structural-spectroscopic correlations have been collected over the years for much simpler cyclic 621
sugars85 whereas pyranoses can undergo important conformational changes (chair half-chair 622
boat skew) when the appropriate energy barriers are crossed78ndash8086 A quantitative 623
conformational study based on the 13C chemical shift variations shown in Table 1 would be 624
certainly helpful but very delicate in the context of the present state of the art because a 625
rigorous approach requires at least one known crystal structure8182 which is currently missing 626
for this compound A qualitative approach will then be adopted 627
G-C181-OH is a bolaform amphiphile and flip-flop could be a possible mechanism 628
involved in the nanotube stabilization whereas head-tail interactions have long been considered 629
as important in nanotube-forming bolaform amphiphiles6063 From mere considerations based 630
on T2 (1H) relaxation arguments one could exclude head-tail configurations if the R-CH2OH 631
endgroup (H1) was involved in a direct interaction with the sugar group its corresponding T2 632
would probably be comparable to the sugarrsquos one (OH and H1rsquo) but this does not seem to be 633
the case However this hypothesis would be based on the comparison of the relaxation from 634
CH and CH2 protons additionally involved in different kind of motions Besides the relaxation 635
of H1 is influenced by the strong overlap between H1 and H5rsquo For these reasons relaxation 636
arguments are not solid enough and will not be used 637
We then address this question by exploring intermolecular interactions in a direct 638
manner using 2D 1H-1H homonuclear ssNMR correlation spectroscopy At 90degC in the fast-639
tumbling domain of molecular motion (narrow 1H NMR peaks Figure 6a) and corresponding 640
to the vesicle-rich region spin diffusion (NOESY) experiments are preferred over dipolar 641
coupling based experiments because such interaction is averaged out by molecular motion 642
However when the molecular motion is more constrained in the domain of nanotube stability 643
at 70degC (broad 1H spectra Figure 6a) Double-Quantum Single-Quantum (DQ-SQ) correlation 644
experiments are best suited to probe interaction between close molecular neighbors These 645
experiments are reported in Figure 9 and the related interpretation is only briefly reported 646
below while a more detailed discussion can be found on Page 12 in the Supporting Information 647
26
648
Figure 9 ndash a) 2D 1H-1H NOESY NMR experiment performed at MAS= 10 kHz (4 mm probe) on a Bruker 649
300 MHz Avance III HD spectrometer using 300 ms of mixing time Sample temperature is regulated to 650
90degC reached by cooling from 110degC b) 2D 1H-1H DQ-SQ (BAck-to-BAck BABA pulse sequence used for 651
the DQ excitation scheme) NMR experiment performed at MAS= 22 kHz (25 mm probe) on a Bruker 700 652
MHz Avance III spectrometer using a DQ excitation time equal to 2 rotor periods Sample temperature is 653
regulated to 70degC reached by cooling from 110degC The typical schemes illustrating how to interpret these 654
2D experiments are reported above each experimental map Zooms of the sugar region and configurational 655
interpretation are given below each 2D map More information are given in the text below 656
H16-H16
H1-H1
H9-H10
H1rsquo-H1
H1rsquoH910 H16
H1
H1rsquo-H1rsquo
Hxrsquo-Hxrsquo
2
(pp
m)
(ppm)
315
811910 1rsquo
2rsquo2
3rsquo 4rsquo6rsquo
5rsquo
1rsquo2910
asymp asymp asympHDO MeOD Acetone
1
315
811 9101rsquo
2rsquo2
3rsquo4rsquo6rsquo
5rsquo
1rsquo2 9 10
asympasympasympHDOMeODAcetone
H1rsquo-H1
1rsquo
1
(p
pm
)
(ppm)
H1-H2
H1rsquo-H1
H1rsquo
H910
H1H5rsquo
H2
H1rsquo-H5rsquo
315
811910 1rsquo
2rsquo2
3rsquo 4rsquo6rsquo
5rsquo
1rsquo2910
asymp asymp asympHDO MeOD Acetone
1
H2rsquoH3rsquoH4rsquo
H2rsquoH3rsquoH4rsquo
X= 2rsquo3rsquo4rsquo
NOESY - T= 90degC
1H
1H
1H
1H
DQ-SQ - T= 70degC
a) b)
2
(pp
m)
(p
pm
)
(ppm)
A B
AhellipB
AhellipA
BhellipB
NOESY
(ppm)
A B
AhellipB
DQ-SQ
Single-quantum dimension
Do
ub
le-q
ua
ntu
m d
imen
sio
n
AhellipA
BhellipB
BhellipA
BhellipA
315
811910 1rsquo
2rsquo2
3rsquo 4rsquo6rsquo
5rsquo
1rsquo2910
asymp asymp asympHDO MeOD Acetone
1
lt 5 Aring
lt 5 Aring
H1-H2
H811
H15
H16
H6rsquo
H1rsquo
H1
H5rsquo
H2
H1-H2
H1rsquo-H1
H1rsquo-H5rsquo
H1rsquo
H1 H5rsquo
H1rsquo
H1
H5rsquo
H1H2rsquo H3rsquo H4rsquo
H1-H1
H1rsquo-H1
Hxrsquo-HxrsquoX= 2rsquo3rsquo4rsquo
H1-H2
H1rsquo
Zoom sugar region 28 ndash 45 ppmNOESY DQ-SQ
27
Head-tail or head-head configurations could be probed by the existence of H1rsquo-H1 657
interactions whereas H1 (δH= 356 ppm) is associated to the glucolipid tail and H1rsquo (δH= 432 658
ppm) to the sugar headgroup These atoms are more than 15 Aring apart and a direct interaction 659
could not be observed in both NOESY and DQ-SQ experiments NOESY experiments (Figure 660
9a) show that H1rsquo-H1 correlations are not observed Meanwhile clear-cut direct H1rsquo-H1 661
interactions are indeed observed are detected at T= 70degC (DQ cross-peaks related to H1rsquo-H1 662
correlation in DQ-SQ experiment shown in Figure 9b) Interestingly the absence of auto peaks 663
at δH= 432 ppm and δH= 335 ppm in the SQ dimension excludes H1rsquo-H1rsquo and Hxrsquo-Hxrsquo (x= 2 664
3 4) interactions respectively strengthening the idea that sugar headgroups from two nearest-665
neighbor G-C181-OH molecules are not adjacent in the nanotube-vesicle region 666
Homonuclear 2D ssNMR supports the idea according to which G-C181-OH can 667
undergo molecular flip-flops and a head-tail arrangement in the dry product Extrapolating these 668
conclusions in the lower concentration range lack of H1rsquo-H1 proximity at T= 90degC suggests a 669
head-head configuration in the vesicle-rich region and head-tail configuration within the 670
nanotubes It is however still unclear whether flip-flops are driven by spontaneous temperature-671
induced conformational changes in the glucolipid packing stimulating inclusions within the 672
membrane itself672223629ndash1218ndash21 or by defects generated by inter-vesicle collisions In fact a 673
combination of both is not unlikely Nanotubes are not stable when temperature is 20 to 30 674
degrees above Tm1 indicating that inter-vesicle collisions alone cannot explain the unusual 675
phenomenon In an energy landscape approach87 the head-head configuration is certainly 676
favored at high temperature while both head-head and head-tail configurations could be 677
favored in the mid-temperature region corresponding to the range between Tm1 and Tm2 in the 678
dry powder Both statistical and defect-induced flip-flop events contribute to form high mean 679
zero Gaussian curvature morphologies (nanotubes) for which the head-tail conformation 680
limiting the proximity between bulky sugar headgroups is probably more adapted (Figure 8c) 681
The flip-flop interpretation now reasonably explains the strong differences in the sugar and fatty 682
alcohol conformations deduced by the multiple NMR signals attributed to chemically-683
equivalent groups The existence of various low-energy conformations each having specific 684
NMR signature for sugars in solution78ndash8086 and solid-state81ndash84 further supports our 685
interpretation 686
One last point should be clarified Why between Tm1 and Tm2 are two molecular 687
environments able to coexist instead of a single one of average rigidity as found in the case of 688
ldquoripplerdquo phases50ndash54 We believe that this question can be answered based on the NMR results 689
the relatively short T2 values of the H1rsquo and OH protons shows the constrained mobility of the 690
28
sugar headgroup despite a certain flexibility of the chain (long T2 component) This trend may 691
suggest restrictions in translational mobility probably due to the sugar-OH hydrogen bonding 692
(Figure 8c) meaning that lipids are not able to diffuse within the membrane thus keeping two 693
different configurations stable 694
695
Conclusions 696
Topologically-connected nanotube-vesicle lipidic systems are commonly observed for 697
self-assembled membranes composed of at least two amphiphiles and spontaneously driven by 698
anisotropic inclusions andor by external directional forces This work shows that strong 699
differences in membrane curvature can spontaneously occur in single-lipid systems without 700
external anisotropic forces Coexistence and interconnection between nanotubes and vesicles 701
are evidenced via cryo-TEM and fluorescence confocal microscopy in a single-phase region at 702
temperature above a transition temperature Tm1= 483degC determined by DSC on the hydrated 703
sample but below the second transition temperature Tm2 (957degC) determined by DSC on the 704
dry powder X-ray diffraction (WAXS) also shows the coexistence of two lattice periods one 705
attributed to an inter-membrane repeating distance and the other possibly related to the intra-706
nanotube glucolipid arrangement Labelling the systems with Laurdan a fluorophore of which 707
the emission strongly varies with the local membrane rigidity excludes the presence of rigid 708
micro-separated phases (eg Lβ) 709
1H and 13C ssNMR despite the fact that it can only be performed on the dry powder 710
confirm the presence of one main fluid G-C181-OH environment above Tm2 Below Tm2 the 711
splitting of some 13C peaks and the coexistence of short and long 1H relaxation components 712
demonstrate that G-C181-OH can simultaneously pack into structurally and dynamically 713
inequivalent environments Combining advanced 2D 1H-1H correlation experiments based on 714
spin diffusion or double-quanta excitation suggests that vesicles could contain a preferred head-715
head configuration of the bolaform lipid while nanotubes a preferred head-tail assembly 716
The presence of two environments composed of the same molecule characterized by 717
different molecular configurations and rigidity fulfills the theoretical conditions necessary to 718
spontaneously nucleate a membrane inclusion of non-zero average orientation described as 719
necessary to observe topologically-connected nanotube-vesicle structures in the absence of 720
external forces This hypothesis could also be enriched by the possibility of nanotubes to be 721
pulled away between two vesicles after a collision event 722
This work expands the actual theoretical and experimental framework on lipid networks 723
stabilized by a different radius of curvature It could also motivate the synthesis or isolation 724
29
of new lipids providing a higher level of 3D architectural control in soft networks possibly in 725
the range of room temperature 726
727
Acknowledgements 728
Dr Andrea Lassenberger and Dr Sylvain Preacutevost at Institut Laue Langevin (ILL Grenoble 729
France) are kindly acknowledged for their assistance on the SANS experiment Confocal 730
images were performed at the Institut de Biologie Paris Seine (IBPS) imaging facility Jean-731
Franccedilois Gilles (Imaging Core Facility Institut de Biologie Paris Seine (IBPS) CNRS 732
Sorbonne Universiteacute Paris France) is kindly acknowledged for his assistance on the confocal 733
microscopy imaging Dr Guillaume Laurent (LCMCP Sorbonne Universiteacute Paris France) is 734
kindly acknowledged for helpful discussions The French region Ile-de-France SESAME 735
program is acknowledged for financial support (700 MHz NMR 736
spectrometer) Dr Olivier Diat (ICSM Marcoule France) Prof eronikaIglič and Prof V Aleš737
onsul discussi Slovenia) are kindly acknowledged for helpfUniversity of LjubljanaIglič (-Kralj 738
739
Financial support 740
WAXS experiments have been supported by Soleil Light Source Saint Aubin France proposal 741
Ndeg 20201747 SANS experiments have been supported by ILL proposal Ndeg9-13-778 742
743
References 744
1 D Kabaso N Bobrovska W Goacuteźdź E Gongadze V Kralj-Iglič R Zorec and A 745
Iglič Bioelectrochemistry 2012 87 204ndash210 746
2 C R Safinya U Raviv D J Needleman A Zidovska M C Choi M A Ojeda-747
Lopez K K Ewert Y Li H P Miller J Quispe B Carragher C S Potter M W 748
Kim S C Feinstein and L Wilson Adv Mater 2011 23 2260ndash2270 749
3 P Veranič M Lokar G J Schuumltz J Weghuber S Wieser H Haumlgerstrand V Kralj-750
Iglič and A Iglič Biophys J 2008 95 4416ndash4425 751
4 A Rustom R Saffrich I Markovic P Walther and H-H Gerdes Science (80- ) 752
2004 303 1007ndash1010 753
5 M I Angelova S Soleacuteau P Meacuteleacuteard F Faucon and P Bothorel Prog Colloid 754
Polym Sci 1992 89 127ndash131 755
6 L Mathivet S Cribier and P F Devaux Biophys J 1996 70 1112ndash1121 756
7 V Kralj-Iglič G Gomišček J Majhenc V Arrigler and S Svetina Colloids Surfaces 757
A Physicochem Eng Asp 2001 181 315ndash318 758
30
8 V Kralj-Iglič A Iglič G Gomišček F Sevšek V Arrigler and H Haumlgerstrand J 759
Phys A Math Gen 2002 35 1533ndash1549 760
9 M Drab D Stopar V Kralj-Iglič and A Iglič Cells 2019 8 626 761
10 A Zidovska K K Ewert J Quispe B Carragher C S Potter and C R Safinya 762
Langmuir 2009 25 2979ndash2985 763
11 A Zidovska K K Ewert J Quispe B Carragher C S Potter and C R Safinya Soft 764
Matter 2011 7 8363ndash8369 765
12 A Zidovska K K Ewert J Quispe B Carragher C S Potter and C R Safinya 766
Biochim Biophys Acta - Biomembr 2009 1788 1869ndash1876 767
13 M Karlsson K Sott M Davidson A S Cans P Linderholm D Chiu and O Orwar 768
Proc Natl Acad Sci U S A 2002 99 11573ndash11578 769
14 A Karlsson R Karlsson M Karlsson A-S Cans A Stromberg F Ryttsen and O 770
Orwar Nature 2001 409 150ndash152 771
15 M Karlsson K Sott A S Cans A Karlsson R Karlsson and O Orwar Langmuir 772
2001 17 6754ndash6758 773
16 E Evans H Bowman A Leung D Needham and D Tirrell Science (80- ) 1996 774
273 933ndash935 775
17 U Seifert Configurations of fluid membranes and vesicles 1997 vol 46 776
18 J Kaumls and E Sackmann Biophys J 1991 60 825ndash844 777
19 N Bobrovska W Goacuteźdź V Kralj-Iglič and A Iglič PLoS One 2013 8 e73941 778
20 A Iglič B Babnik K Bohinc M Fošnarič H Haumlgerstrand and V Kralj-Iglič J 779
Biomech 2007 40 579ndash585 780
21 K Bohinc T Slivnik A Iglič M Brumen and V Kralj-Iglič J Phys Chem C 2007 781
111 9709ndash9718 782
22 A Iglič H Haumlgerstrand P Veranič A Plemenitaš and V Kralj-Iglič J Theor Biol 783
2006 240 368ndash373 784
23 V Kralj-Iglič and P Veranič Adv Planar Lipid Bilayers Liposomes 2006 5 129ndash785
149 786
24 A Iglic and V Kralj-Iglic Adv Planar Lipid Bilayers Liposomes 2006 4 253ndash279 787
25 S Penič L Mesarec M Fošnarič L Mroacutewczyńska H Haumlgerstrand V Kralj-Iglič and 788
A Iglič Front Phys 2020 8 342 789
26 P Yager and P E Schoen Mol Cryst Liq Cryst 1984 106 371ndash381 790
27 T G Barclay K Constantopoulos and J Matisons Chem Rev 2014 114 10217ndash791
10291 792
31
28 B Božič G Gomišček V Kralj-Iglič S Svetina and B Žekš Eur Biophys J 2002 793
31 487ndash496 794
29 A Iglič H Haumlgerstrand M Bobrowska-Haumlgerstrand V Arrigler and V Kralj-Iglič 795
Phys Lett A 2003 310 493ndash497 796
30 R Bar-Ziv and E Moses Phys Rev Lett 1994 73 1392ndash1395 797
31 S Chiruvolu H E Warriner E Naranjo S H Idziak J O Raumldler R J Plano J A 798
Zasadzinski and C R Safinya Science (80- ) 1994 266 1222ndash1225 799
32 V Kralj-Iglič A Iglič H Haumlgerstrand and P Peterlin Phys Rev E 2000 61 4230ndash800
4234 801
33 L Mesarec M Drab S Penič V Kralj-Iglič and A Iglič Int J Mol Sci 2021 22 802
2348 803
34 L Van Renterghem S L K W Roelants N Baccile K Uyttersprot M C Taelman 804
B Everaert S Mincke S Ledegen S Debrouwer K Scholtens C V Stevens W 805
Soetaert L Van Renterghem S L K W Roelants N Baccile K Uytersprot M C 806
Taelman B Everaert S Mincke S Ledegen S Debrouwer K Scholtens C V 807
Stevens and W Soetaert Biotechnol Bioeng 2018 115 1195ndash1206 808
35 J Clark and F Deswarte Introduction to Chemicals from Biomass Second Edition 809
John Wiley amp Sons 2015 810
36 K V Sajna R Houmlfer R K Sukumaran L D Gottumukkala and A Pandey in 811
Industrial Biorefineries and White Biotechnology eds A Pandey R Houmlfer M 812
Taherzadeh K M Nampoothiri and C Larroche Amsterdam Oxford Waltham 813
Elsevier 2015 pp 499ndash521 814
37 R Marchant and I M Banat Trends Biotechnol 2012 30 558ndash565 815
38 K Hill and C LeHen-Ferrenbach in Sugar-Based Surfactants Fundamentals and 816
Applications ed C C Ruiz Boca Raton CRC Press 2009 pp 1ndash20 817
39 L Rodrigues I M Banat J Teixeira and R Oliveira J Antimicrob Chemother 818
2006 57 609ndash618 819
40 J D Desai and I M Banat Microbiol Mol Biol Rev 1997 61 47ndash64 820
41 S L K W Roelants K Ciesielska S L De Maeseneire H Moens B Everaert S 821
Verweire Q Denon B Vanlerberghe I N A Van Bogaert P Van der Meeren B 822
Devreese and W Soetaert Biotechnol Bioeng 2016 113 550ndash559 823
42 N Baccile M Selmane P Le Griel S Preacutevost J Perez C V Stevens E Delbeke S 824
Zibek M Guenther W Soetaert I N A Van Bogaert and S Roelants Langmuir 825
2016 32 6343ndash6359 826
32
43 N Baccile A-S Cuvier S Preacutevost C V Stevens E Delbeke J Berton W Soetaert 827
I N A Van Bogaert and S Roelants Langmuir 2016 32 10881ndash10894 828
44 N Baccile C Seyrig A Poirier S A Castro S L K W Roelants and S Abel Green 829
Chem 2021 23 3842ndash3944 830
45 A Salis L Cappai C Carucci D F Parsons and M Monduzzi J Phys Chem Lett 831
2020 11 6805ndash6811 832
46 J Schindelin I Arganda-Carreras E Frise V Kaynig M Longair T Pietzsch S 833
Preibisch C Rueden S Saalfeld B Schmid J-Y Tinevez D J White V 834
Hartenstein K Eliceiri P Tomancak and A Cardona Nat Methods 2012 9 676ndash835
682 836
47 T Parasassi and E Gratton J Fluoresc 1995 5 59ndash69 837
48 M M Dodes Traian F L Gonzaacutelez Flecha and V Levi J Lipid Res 2012 53 609ndash838
616 839
49 D M Owen C Rentero A Magenau A Abu-Siniyeh and K Gaus Nat Protoc 840
2012 7 24ndash35 841
50 W Stillwell in An Introduction to Biological Membranes Academic Press 2016 pp 842
135ndash180 843
51 W Stillwell in An Introduction to Biological Membranes Academic Press 2016 pp 844
181ndash220 845
52 B Tenchov Chem Phys Lipids 1991 57 165ndash177 846
53 R Koynova and M Caffrey Biochim Biophys Acta 1998 1376 91ndash145 847
54 F Schmid S Dolezel O Lenz and S Meinhardt J Phys Conf Ser 2014 487 848
012004 849
55 S Meinhardt R L C Vink and F Schmid Proc Natl Acad Sci U S A 2013 110 850
4476ndash4481 851
56 O Glatter and O Kratky Small Angle X-ray Scattering Academic Press London 852
1982 853
57 B A Cunningham A D Brown D H Wolfe W P Williams and A Brain Phys 854
Rev E 1998 58 3662ndash3672 855
58 M Nadler A Steiner T Dvir O Szekely P Szekely A Ginsburg R Asor R Resh 856
C Tamburu M Peres and U Raviv Soft Matter 2011 7 1512ndash1523 857
59 C Tanford The hydrophobic effect Formation of micelles and biological membranes 858
John Wiley amp Sons Inc New York 1973 859
60 M Masuda and T Shimizu Langmuir 2004 20 5969ndash5977 860
33
61 A Zidovska K K Ewert J Quispe B Carragher C S Potter and C R Safinya 861
Block Liposomes Vesicles of Charged Lipids with Distinctly Shaped Nanoscale 862
Sphere- Pear- Tube- or Rod-Segments Elsevier Inc 1st edn 2009 vol 465 863
62 A Iglic V Kralj-Iglic B Božič M Bobrowska-Haumlgerstrand B Isomaa and H 864
Haumlgerstrand Bioelectrochemistry 2000 52 203ndash211 865
63 T Shimizu M Masuda and H Minamikawa Chem Rev 2005 105 1401ndash1444 866
64 J V Selinger and J M Schnur Phys Rev Lett 1993 71 4091ndash4094 867
65 J M Schnur Science (80- ) 1993 262 1669ndash1676 868
66 B Tenchov R Koynova and G Rapp Biophys J 2001 80 1873ndash1890 869
67 R Koynova and B Tenchov Ser Biomech 2017 31 3ndash19 870
68 S J Angyal and R Le Fur Carbohydr Res 1984 126 15ndash26 871
69 J K Whitesell and M A Minton J Am Chem Soc 1987 109 225ndash228 872
70 T Takayama S Ando and I Ando J Mol Struct 1990 220 245ndash250 873
71 K Gawrisch N V Eldho and I V Polozov Chem Phys Lipids 2002 116 135ndash151 874
72 F Tielens C Gervais J F Lambert F Mauri and D Costa Chem Mater 2008 20 875
3336ndash3344 876
73 G A Jeffrey and Y Yeon Acta Crystallogr Sect B 1986 42 410ndash413 877
74 B Berglund and R W Vaughan J Chem Phys 1980 73 2037ndash2043 878
75 C Gervais C Coelho T Azaiumls J Maquet G Laurent F Pourpoint C Bonhomme 879
P Florian B Alonso G Guerrero P H Mutin and F Mauri J Magn Reson 2007 880
187 131ndash140 881
76 C Akita T Kawaguchi F Kaneko H Yamamoto and M Suzuki J Phys Chem B 882
2004 108 4862ndash4868 883
77 R N Purusottam L Seacutenicourt J J Lacapegravere and P Tekely Biochim Biophys Acta - 884
Biomembr 2015 1848 3134ndash3139 885
78 X Biarneacutes A Ardegravevol A Planas C Rovira A Laio and M Parrinello J Am Chem 886
Soc 2007 129 10686ndash10693 887
79 L M J Kroon‐Batenburg and J Kroon Biopolymers 1990 29 1243ndash1248 888
80 K N Kirschner and R J Woods Proc Natl Acad Sci U S A 2001 98 10541ndash889
10545 890
81 S Svenson B Kirste and J H Fuhrhop J Am Chem Soc 1994 116 11969ndash11975 891
82 I Sack S Macholl J H Fuhrhop and G Buntkowsky Phys Chem Chem Phys 892
2000 2 1781ndash1788 893
83 S Svenson J Koening and J H Fuhrhop J Phys Chem 1994 98 1022ndash1028 894
34
84 S Svenson A Schaefer and J H Fuhrhop J Chem Soc Perkin Trans 2 1994 2 895
1023ndash1028 896
85 K Bock and C Pedersen Adv Carbohydr Chem Biochem 1983 41 27ndash66 897
86 T B Grindley Structure and Conformation of Carbohydrates Springer Berlin 898
Heidelberg 2008 899
87 F Tantakitti J Boekhoven X Wang R V Kazantsev T Yu J Li E Zhuang R 900
Zandi J H Ortony C J Newcomb L C Palmer G S Shekhawat M O De La 901
Cruz G C Schatz and S I Stupp Nat Mater 2016 15 469ndash476 902
903
1
Supporting Information 904
905
Topological connection between vesicles and nanotubes in single-906
component lipid membranes driven by head-tail interactions 907
908
Niki Baccilea Ceacutedric Lorthioira Abdoul Aziz Baa Patrick Le Griela Cristina Coelhob Javier 909
Perezc Wim Soetaertd Sophie L K W Roelantsd 910
911
a Sorbonne Universiteacute Centre National de la Recherche Scientifique Laboratoire de Chimie de 912
la Matiegravere Condenseacutee de Paris LCMCP F-75005 Paris France 913
b Institut des Mateacuteriaux de Paris Centre Sorbonne Universiteacute Paris France 914
c Synchrotron Soleil LrsquoOrme des Merisiers Saint-Aubin BP48 91192 Gif-sur-Yvette Cedex 915
France 916
d InBio Department of Biotechnology Ghent University Ghent Belgium 917
918
919
Corresponding author 920
Dr Niki Baccile 921
E-mail address nikibaccilesorbonne-universitefr 922
Phone +33 1 44 27 56 77 923
924
925
926
2
a) 927
Parameter Method
Dry Matter (DM ) 996 Infrared balance 105degC
Glucose () 012 HPLC-Metacarb
Glycerol () nd HPLC-Metacarb
Free Fatty Acid content () lt001 Internal method BBEPP
GC with FID Detector
Oil () lt001 Internal method BBEPP
GC with FID Detector
Moulds (CFUg) lt10 3M-Nordval ndeg16 B
Yeasts (CFUg) lt10 3M-Nordval ndeg16 B
Anaerobic count (CFUg) lt10 SP-VG M005 B
Protein () tbd BCA protein assay
928
Figure S 1 - a) HPLC-ELSD chromatogram and composition table 929
930
931
932
933
3
b) 934
935
Group Ndeg δ ppm
CH2 1 354
CH2 2 153
CH2 3-712-14 132
CH2 811 203
CH 910 534
CH2 15 162
CH2 16 388
CH 1 424
CH 2 316
CH 3 334
CH 4 329
CH 5 354
CH2 6 366
Figure S 1 (next) ndash b) 1H NMR spectrum (MeOD-d4) recorded on the purified G-C181-OH compounds 936
and related assignment 937
938
2
811910 1rsquo
5rsquo1
3rsquo4rsquo
1rsquo1910
asymp asymp asympHDO MeOD Acetone
6rsquo2rsquo
1615
3-712-14
4
939
940
Figure S 2 ndash Cryo-TEM images recorded for a 5 mgmL G-C181-OH aqueous solution heat at T= 130degC 941
5
942
943
Figure S 3 - Cryo-TEM images recorded for a 5 mgmL G-C181-OH aqueous solution heat at T= 90degC 944
945
90degC
1
22
6
946
947
948
949
Figure S 4 ndash Cryo-TEM images recorded for a 5 mgmL G-C181-OH aqueous solution heat at T= 70degC 950
951
21
11
1
2
5
3
4
45
5
6
7
7
7
952
953
954
Figure S 5 ndash Cryo-TEM images recorded for a 5 mgmL G-C181-OH aqueous solution heat at T= 25degC 955
956
957
1
1 1
8
958
Figure S 6 ndash a) SANS experiment recorded at 90degC for a 5 mgmL G-C181-OH aqueous solution b-c) 959
WAXS experiments recorded on aqueous solutions of G-C181-OH at b) 5 mgmL and c) 25 mgmL d) 960
Structural interpretation of the repeating distances pointed out in c) 961
962
963
964
001 01 1
q Aring-1
25degC
68degC
88degC
111degC
01 1q Aring
-1
02 04 06 08 1q Aring
-1
001 01
10-1
100
101
Inte
nsity
cm
-1
q Aring-1
-2
T= 90degC
SANS WAXS WAXS
a) b) c)
dv
dL d= 144 Aring-1
di
ddH2O
dt
dvdL
dtdi d
d)
9
965
966
Figure S 7 ndash ssNMR MAS (10 kHz) experiments recorded on a G-C181-OH dry powder a) 1H spectra 967
recorded from 110degC to 70degC b) 13C single pulse (SP) spectra recorded with high power 1H decoupling from 968
110degC to 70degC c) 13C cross polarization (CP) spectra recorded at 110degC and contact time tc of 50 micros and 969
3000 micros d) 13C CP spectra recorded at 70degC and for 20 lt tc micros lt 3000 970
971
1
811
910
CH2 CH2
1rsquo
6rsquo
8 6 4 2 0 ppm
110
90
80
70
910
1rsquo
6rsquo16
1
2rsquo3rsquo4rsquo
811
OH
45 40 35 30 25 20 15
ppm
200 180 160 140 120 100 80 60 40 20 0
ppm140 120 100 80
ppm
CH2-gauche
3004
110
90
80
70
65
60
50
25
C91013003
C9 - 12869
CH2-all-trans
3198
C1rsquo10335
a) b)
1H
T degCT degC
13C Single Pulse MAS
A
B
A
B
70degC70degC
5rsquo
215
200 180 160 140 120 100 80 60 40 20 0
ppm
13C CPMAST= 110degC
200 180 160 140 120 100 80 60 40 20 0
ppm
132 131 130 129 128 127 126
ppm
106 105 104 103 102
ppm
13C CPMAST= 70degC
50
tc micros
3000
20
tc micros
50 500 1000 3000
tc micros
C102
13024 C910113003
C92
12869
C1rsquo213082
C1rsquo110443
A B
106 105 104 103 102
ppm
3000
1000
500
50
20
AB
c)
d)
10
972
Figure S 8 ndash a) Short and d) long T2 components displayed by the 1H transverse relaxation signal c) 1H 973
transverse relaxation signals recorded on a G-C181-OH dry powder from 110degC to 70degC The area of each 974
given resonance is plotted (log-lin) as a function of the echo time (CPMG pulse sequence) for each 975
temperature and fitted using the equation given above T2s and T2l indicate the short and long T2 relaxation 976
times respectively obtained by describing the 1H transverse relaxation signal using a biexponential decay 977
For H1rsquo H5rsquo and H6rsquo the 1H relaxation function could be described by a monoexponential decay 978
- Protons from the sugar group (H1rsquo H5rsquo H6rsquo) show a single T2 relaxation component (Figure 979
6c and Figure S 8) while protons of the acyl chain (CH2 H910 H811) show both short (Figure 980
6c) and long (Figure 6d) T2 relaxation component 981
- The short T2 relaxation time systematically decreases from 110degC to 70degC for all species by a 982
factor ranging from two to seven depending on the specific chemical group Very long T2 are 983
observed at 110degC for all acyl species while nearly unchanged values are measured below 984
90degC without any clear trend 985
- The sugar protons (H1rsquo H5rsquo H6rsquo) have the shortest set of T2 values (lt 1 ms) below 100degC 986
The long component of T2 generally ranges between 4 ms and 12 ms 987
0 1 2 3 4 5 6 7 8
00
05
10
15
20
25
30
35
40
45
Log
In
ten
sity
Time ms
0 1 2 3 4 5 6 7 8
00
05
10
15
20
25
30
35
40
45
Log
In
ten
sity
Time ms
0 1000 2000 3000 4000 5000 6000 7000 8000
00
05
10
15
20
25
30
35
40
45
Log
In
ten
sity
Time ms
0 1000 2000 3000 4000 5000 6000 7000 8000
00
05
10
15
20
25
30
35
40
45
Log
In
ten
sity
Time ms
0 1000 2000 3000 4000 5000 6000 7000 8000
00
05
10
15
20
25
30
35
40
45
Log
In
ten
sity
Time ms
0 1000 2000 3000 4000 5000 6000 7000 8000
00
05
10
15
20
25
30
35
40
45
Log
In
ten
sity
Time ms
H1
H8H11
H9H10
CH2
H1rsquo
H6rsquo
CH2
H910H811 H1CH2
H1rsquo H5rsquo6rsquo
0 1000 2000 3000 4000 5000 6000 7000 8000
00
05
10
15
20
25
30
35
40
45
Log
In
ten
sity
Time ms
OH
0 1000 2000 3000 4000 5000 6000 7000 8000
00
05
10
15
20
25
30
35
40
45 T= 110degC
T= 90degC
T= 80degC
T= 70degC
Log
In
ten
sity
Time ms
Fit
)
CH2 H910 H811 H1 H56 H1 OH
00
05
10
15
20
25
30
35
40
T2 m
s
T= 110degC
T= 90degC
T= 80degC
T= 70degC
CH2 H910 H811 H1
0
2
4
6
8
10
12
T2 m
s
T= 110degC
T= 90degC
T= 80degC
T= 70degC
Short T2(1H) Long T2(1H)
a) b)
c)
11
Table S 1 ndash 1H chemical shifts of G-C181-OH in solution and in the solid-state Solid-state spectra are 988
recorded at a MAS frequency of 10 kHz in DMSO-d6 broad peak 989
990
δH ppm
Group Ndeg Liquid
(MeOD-d4) Solid
(T= 110degC) Solid
(T= 70degC)
CH2 H1 354 357
CH2 H2 153 156
CH2 H3-712-14 132 135
CH2 H811 203 203
CH H910 534 534
CH2 H15 162 164
CH2 H16 388 383
CH H1 424 432
CH H2 316 335
CH H3 334 335
CH H4 329 335
CH H5 354 351 357
CH2 H6 366 383
OH OH1 432
45 463
OH OH2 492
OH OH3 490
OH OH4 487
OH OH6 445
991
992
H1H9H10H1rsquo
H6rsquo
OH2rsquo
OH1
12
Detailed discussion about the NOESY and DQ-SQ 2D 1H-1H ssNMR experiments presented in 993
Figure 9 994
995
2D 1H-1H ssNMR experiments are a unique tool to explore through-space proximities 996
between 1H nuclei ssNMR offers a large number of possibilities each adapted to a given 997
system The advantage of 2D maps with respect to a dynamics approach is their direct 998
readability in clear two nuclei which exchange their magnetization through-space (whichever 999
mechanism may be responsible for this exchange) will display a specific cross-peak However 1000
the way cross-peaks are presented and interpreted strictly depends on the nature of the pulse 1001
program which in turn is chosen according to the physical nature of the sample 1002
1D temperature-dependent 1H NMR experiments performed on G-C181-OH (Figure 1003
4a in the main text) indicate sharp peaks at 90degC and broad peaks at 70degC Narrow peaks 1004
indicate fast andor large-amplitude molecular tumbling averaging the strong 1H-1H dipolar 1005
interactions This excludes the use of pulse sequences like DQ-SQ which is not efficient under 1006
these conditions For this reason we employ spin-diffusion-based pulse sequences like 1007
NOESY which is more adapted for samples with high molecular mobility When mixing times 1008
are chosen to be short (lt 1 s) one generally explores through-space proximities within about 5 1009
10 Aring On the contrary when molecular motions are restricted dipolar coupling becomes 1010
significant 1H NMR peaks are broader and pulse sequences like DQ-SQ can now be used 1011
with a spatial resolution of less than 5 Aring 1012
Whenever possible DQ-SQ experiments are preferred over spin diffusion-based pulse 1013
sequences because they are more selective in particular for likewise interactions which are 1014
not discriminated in NOESY-type experiments This is illustrated by the typical interaction 1015
schemes for NOESY (top Figure 9a) and DQ-SQ (top Figure 9b) For two given A and B 1016
protons 2D NOESY maps will display two on-diagonal and two square-shaped symmetrical 1017
off-diagonal cross-peaks Off-diagonal cross-peaks illustrate the mutual A-B and B-A 1018
interaction but the on-diagonal peaks are systematic and do not prove any A-A or B-B 1019
interaction Similarly to NOESY 2D DQ-SQ maps display off-diagonal peaks (symmetric 1020
across the diagonal top Figure 9b) upon A-B and B-A interaction but in contrast they will 1021
display on-diagonal peaks only in the presence of self-interaction In the tutorial example of 1022
Figure 9b top the on-diagonal A-A peak indicates mutual A-A interaction while lack of on-1023
diagonal B-B peak evidences the absence of B-B proximities Combining NOESY and DQ-SQ 1024
experiments is capital to study the local arrangement of G-C181-OH and its evolution with 1025
temperature 1026
13
At T= 90degC the H1 and H5rsquo contributions are very close but possible to discriminate 1027
them (δ(H1)= 354 ppm δ(H5rsquo)= 351 ppm) according to 1H NMR chemical shifts in Table S 1028
1 2D 1H-1H NOESY in Figure 9a also discriminates between the two components attributed 1029
on the basis of the interactions with their mutual neighbors (green H1-H2 and H5rsquo-H1rsquo squares 1030
in Figure 9a) On this basis 2D NOESY does not show a direct H1rsquo-H1 correlation (blue red-1031
crossed) but rather an extensive network of intra-sugar interactions These features exclude 1032
suggest intra- and inter-sugar interactions and they exclude head-tail arrangements as a major 1033
molecular configuration at 90degC 1034
At 70degC the 1H NMR peaks are broader indicating a reduction of the T2 (1H) relaxation 1035
times andor residual homonuclear dipolar interactions excluding the use of NOESY In this 1036
case 1H-1H DQ-SQ correlation experiments are best suited Figure 9b presents the 1H-1H DQ-1037
SQ experiment on G-C181-OH at 70degC Peaks are broader than in NOESY and attribution may 1038
be cumbersome However the experiment is performed at 700 MHz and MAS= 22 kHz which 1039
improves spectral resolution with respect to the same experiment performed at 300 MHz and 1040
MAS= 10 kHz The auto-peak at δH= 356 ppm in the SQ dimension is attributed to H1-H1 spin 1041
pairs mainly resulting from intra CH2 interaction while the DQ cross-peaks at δH= 156-356 1042
ppm and δH= 432-356 ppm respectively origin from H2-H1 and H1rsquo-H1 interactions (Figure 1043
9b) DQ-SQ map does not show any auto-peak corresponding to H1rsquo-H1rsquo or Hxrsquo-Hxrsquo (x= 2rsquo 1044
3rsquo 4rsquo) interactions (red-crossed blue Figure 9b) thus excluding any proximity (lt 5 Aring) between 1045
close glucose neighbors On the contrary DQ-SQ maps (recorded both at 700 MHz Figure 9b 1046
or at 300 MHz not shown) systematically show DQ cross-peaks which can only be attributed 1047
to H1rsquo-H1 interactions (δH= 432-356) The presence of these H1rsquo-H1 interactions can only be 1048
explained by a head-tail arrangement of the G-C181-OH molecules as illustrated below the 1049
DQ-SQ map in Figure 9b 1050

11
arrows Ndeg5 and Ndeg6 The corresponding profiles A through D confirm the tubular nature of 275
the elongated objects Profiles B and D are both characterized by typical symmetrical thick 276
walls (low intensity depths highlighted by shaded rectangles) surrounding a hollow region (high 277
intensity peak between the shaded rectangles) The wall thickness varies between 35 and 40 278
nm for profile B and between 41 and 61 nm for profile D while the total nanotube diameter 279
varies between 14 nm at B and 20 nm at D At the same time the thickness of the vesicle wall 280
is about 6 nm at A and 135 nm at C Considerations about the bilayer or interdigitated structure 281
of the membrane will be presented below 282
The connection between nanotubes and vesicles seems to be multiple For instance 283
arrow Ndeg1 (Figure S 3) and Ndeg4 (Figure 3) show a single-wall vesicle of which the membrane 284
is extruded into a nanotube Similarly a closer look at arrows Ndeg1 2 and 3 in Figure 3 show 285
that the vesicle is single-wall and fully closed while the nanotube nucleates at the vesicle outer 286
surface with no apparent topological continuity In many regions of the sample at T= 90degC 287
one can find exvaginations or buds232531 in the nanotube wall This is shown for instance by 288
arrows Ndeg7 and particularly put in evidence in Figure 4 by arrows Ndeg1 through Ndeg4 where the 289
amplitude of the oscillation varies between 20-25 nm (arrow Ndeg1) and 6-8 nm (arrows Ndeg3-4) 290
291
Figure 4 - Cryo-TEM images recorded for a 5 mgmL G-C181-OH aqueous solution heated at T= 90degC 292
293
Still between Tm2 and Tm1 but at lower temperature (T= 70degC) the nanotubes seem to 294
vary from single threads (arrow Ndeg1 Figure S 4) to nanotubes of diameter below 15 nm both 295
connecting nanotubes of diameter ranging between 50 nm and 100 nm (arrows Ndeg2 Figure S 296
4) The larger tubes are most likely formed by the inflation and flattening of the nanotubes 297
probably after assimilation of surrounding vesicles and fusion of the exvagination discussed 298
above The transition between vesicles tubes and flat membranes is certainly more accentuated 299
Arrow Ndeg3 in Figure S 4 shows distinct vesicles while arrow Ndeg4 identifies a flat structure 300
evidently formed from fused vesicles In particular arrow Ndeg5 points at the fusion of two 301
2
1 132
4
12
vesicles while arrow Ndeg6 points at two vesicles fusing into the flat membrane Additional areas 302
where vesicle fusion is prominent are indicated by the oscillations at the outer skirt of broad 303
lamellae and pointed by arrow Ndeg7 304
Finally below Tm1 at T= 25degC for instance mainly flat crystals with no visible 305
exvaginations or tubes are visible (Figure S 5) by cryo-TEM and the material turns into an 306
insoluble precipitate Massive presence of flat crystalline structures is also clear from the bulk 307
iridescent behavior of a G-C181-OH solution under manual shear 308
In summary despite the uncertainty related to the actual state of equilibrium of the 309
glucolipids at the moment of cryofixation cryo-TEM depicts a vesicle phase at Tgt 100degC a 310
flat lamellar phase below Tm1 and an interconnected vesicle-nanotube network between Tm1 and 311
about 100degC The combination of statistically-relevant fluorescence microscopy and 312
scatteringdiffraction experiments provides an additional proof of the coexistence of 313
vesiclenanotube systems between the two transition temperatures Please note that the 314
experiments reported below have been performed under controlled conditions of temperature 315
which is then indicated by the use of T instead of T 316
13
317
Figure 5 ndash a-c) Confocal fluorescence microscopy images recorded at 90degC and 70degC for a 5 mgmL G-318
C181-OH aqueous solution d-g) Typical fluorescence microscopy images recorded at T= 80degC using 319
Laurdan (refer to materials and methods section for more details on this fluorophore) Excitation 320
wavelength is 405 nm for all the images while emission wavelength is 490 nm in (df) and 440 nm in (eg) 321
h) Full emission spectra obtained from the integration of various fluorescence images recorded from 412 322
nm to 600 nm (step 5 nm) at 90degC 80degC and 70degC i) Box plot of GP defined as 119918119927 =(120640120786120786120782minus120640120786120791120782)
120640120786120786120782+120640120786120791120782 with 120640120786120786120782 323
and 120640120786120791120782 being the emission wavelengths at 440 nm and 490 nm at 90degC 80degC and 70degC Each data point 324
l= 490 nm l= 440 nm
l= 490 nm l= 440 nm
10 μm400 450 500 550 600
00
02
04
06
08
10
No
rma
lize
d I
nte
nsity
l nm
90degC
80degC
80degC
70degC
70degC
400 450 500 550 60000
02
04
06
08
10
No
rma
lize
d I
nte
nsity
l nm
90degC
80degC
80degC
70degC
70degC
d) e)
f) g)
h)
i)
T= 80degC
Laurdan
T= 80degC
T= 80degC T= 80degC
T= 90degC T= 70degC T= 70degC
a) b) c)
1
1
1
14
corresponds to a set of regions of interest (ROIs) (54 at 90degC 65 at 80degC and 75 at 70degC) selected in the 325
corresponding fluorescence images ROIs were representatively selected so to include the entire image but 326
also vesicles alone tubes alone and mixtures of vesicles and tubes 327
328
Figure 5ab shows two typical confocal fluorescence microscopy images recorded on a 329
G-C181-OH solution (5 mgmL) in a flame-sealed capillary heat at T= 90degC and T= 70degC 330
Although the resolution of optical microscopy is not comparable with cryo-TEM the sample is 331
broadly composed of vesicles coexisting with nanotubes whereas in some cases the nanotube 332
starts from the vesicle itself (arrow Ndeg1) in good agreement with cryo-TEM data Furthermore 333
SANS recorded at T= 90degC (Figure S 6a) shows a scattering profile with a pronounced -2 334
dependence of the scattering intensity against the wavevector q in the log-log scale This 335
indicates the massive presence of a flat interface and it is expected typical of bilayers in 336
vesicular morphologies56 However the typical signature of nanotubes cannot be observed in 337
the SANS profile and this can be explained by both an argument related to the relative lower 338
amount of nanotubes with respect to vesicles at 90degC but also to the steeper slope of flat 339
morphologies (-2) compared to tubes (-1) the signal of the former masking the tube signal at 340
low wavevector values The SANS profile is characterized by a diffraction peak at q= 0167 Aring-341
1 of which the assignment is refined by WAXS data 342
Temperature-driven WAXS experiments in Figure S 6bc (5 mgmL-1 and 25 mgmL-1 343
respectively) show a lamellar order possibly attributed to a multilamellar structure of the 344
vesicles (dv Figure S 6d) at high temperature and to the interplanar arrangement of the 345
crystalline flat structures (dL Figure S 6d) at T= 25degC The sharp (001) reflection indicates 346
typical interlamellar distance of 353 Aring at 25degC although this value varies with temperature 347
(400 Aring at 111degC 372 Aring at 88degC) thus confirming its assignment to a hydration-dependent 348
interlamellar order More intriguing is the second broader peak at q= 0403 Aring-1 (d= 156 Aring) 349
and its reflection both clearly visible at 88degC below Tm2 We attribute it to the inter-glucolipid 350
arrangement inside the tubular phase (dt Figure S 6d) coexisting with the vesicle phase 351
between Tm1 and Tm2 and to the planar lipid arrangement (di Figure S 6d) in the rigid flat 352
lamellar structure below Tm2 Its temperature- hence hydration- independent position also 353
confirms its structural origin Finally besides the water-structure peak at about 2 Aring-1 we also 354
observe a broad peak at 144 Aring-1 characteristics of the lateral packing (d Figure S 6d) of lipids 355
in bilayers While its position could be consistent with an Lα phase5758 above Tm2 its broadness 356
and positional invariance as well as the coexistence between vesicles and tubes do not allow a 357
precise assignment 358
15
Does G-C181-OH assume a bilayer or interdigitated structure the latter being the one 359
found for other similar bolaform glucolipids4243 The size of G-C181-OH can be estimated to 360
be at the most 32 Aring given by the length L of the C16 tail (L = 22 Aring from the Tanford formula 361
L= 154 + 1265 times n (n= 16)59) and the sugar (about 10 Aring)4243 However the cis conformation 362
of the C=C bond imposes a ldquokinkrdquo of 60deg in the aliphatic chain which reduces the effective 363
length of the oleic backbone to about 17 Aring for an effective total G-C181-OH length of about 364
27 Aring Cryo-TEM provides a tube thickness varying from 35 Aring to 60 Aring and a vesicle membrane 365
thickness of at least 60 Aring WAXS suggests an interlamellar thickness (membrane and water) 366
between 40 Aring and 37 Aring and an inter-lipid distance in the tube of about 16 Aring In the absence of 367
a clear form factor oscillation profile as found for similar glucolipids4243 one must 368
acknowledge that these data pledge neither in favor of fully interdigitated nor a double layer 369
structure and might suggest a tilted lipid arrangement with partial interdigitation60 370
371
13C ssNMR demonstrates that G-C181-OH can assume two coexisting head-head and 372
head-tail configurations 373
Vesicles are characterized by low positive mean and gaussian curvatures while 374
nanotubes are described by a combination of a high positive mean and zero gaussian curvatures 375
In this regard the coexistence of vesicles and nanotubes requires glucolipids to adapt 376
themselves to both environments at the same time For this reason the formation of nanotube-377
vesicle networks generally requires a specific driving force able to impose a high mean and 378
zero gaussian curvature to the membrane In many systems insertion of at least a second 379
constituent (lipid surfactant protein) in the membrane becomes a necessary internal driving 380
force for the nucleation and growth of so-called membrane inclusions from which 381
topologically-connected nanotubes can form10ndash123261 as explained by orientational ordering 382
arguments62 It has also been shown that external driving forces such as use of laser 383
ldquotweezersrdquo30 osmotic pressure6 electroformation5ndash82829 or controlled suction13ndash16 are 384
otherwise necessary as also supported by theoretical studies19 385
The bending energy of tubes is higher than that of a vesicle membrane8 due to the 386
dependence of the membrane free energy from the principal curvatures For this reason 387
isotropic (rotational symmetry along the main axis) but also anisotropic33 lipids generally 388
stabilize low-curvature shapes like flat membranes or vesicles Lipid nanotubes are also a 389
common phase formed by amphiphiles but generally for lipids with a certain complexity in 390
their molecular structures as exampled by diacetylenic derivatives of phospholipids among 391
others262763ndash65 Negative contributions to the bending energy favoring the simultaneous 392
16
presence of interconnected vesicles and tubes was shown to be driven by the presence of 393
anisotropic lipids in a membrane continuum Spontaneous deviations to the elastic theory in the 394
presence of surfactants lipids and proteins with anisotropic structures favor the formation of 395
protrusions with radius of the order of the fraction of a micron9ndash1219ndash2362 396
In the absence of both internal and external driving forces mentioned above G-C181-397
OH should behave as a standard lipid Its DSC profile (Figure 2)536667 under both hydrated and 398
dry conditions identifies a hydration-independent transition (Tm1) slightly above room 399
temperature this is followed by one main transition at higher temperature (Tm2) in the dry 400
sample50 For such a profile one expects a gel phase (Lβ) below Tm1 and a liquid crystalline 401
structure possibly in the morphology of vesicles (L4 phase) possibly above Tm1 and most likely 402
above Tm231 as experimentally found On the basis of the thermogram recorded on the dry 403
powder one may also expect a ldquoripplerdquo (Pβ) phase between Tm1 and Tm2 characterized by 404
periodic undulations of the bilayer (generally addressed to as regions with both liquid order and 405
disorder)5455 406
In the present work instead of a Lβ phase we observe flat crystals below Tm1 and a 407
vesicle-nanotube network instead of the ldquoripplerdquo phase The latter is particularly unexpected 408
because the membrane is composed of a single-component (G-C181-OH) and no anisotropic 409
external force (osmotic hydrodynamic electric) is used to pull and stabilize the tubes In 410
addition the nanotubes are observed at fairly high temperatures above Tm1 (between about 411
60degC and 90degC) while this morphology is generally favored at low temperature (proportionality 412
with 1kT figure 5 in Ref 62) commonly below a given transition temperature characteristics 413
for each specific amphiphile27 Furthermore nanotubes of G-C181-OH seem to be stable in 414
time thus differing from what is found in electroformed vesicles78 They are also observed 415
away from phase transition events (may them be at Tm1 or Tm2) as otherwise reported before 416
for a diacetylenic derivative of phosphatidylcholine26 and many other systems27 417
A stable nanotube-vesicle network for a single-component phospholipid in the absence 418
of external driving forces is not expected and has never been reported before It could be 419
explained by the coexistence of two micro-separated phases of different rigidity This 420
hypothesis is excluded by confocal microscopy on Laurdan-labelled membranes and magic 421
angle spinning (MAS) solid-state NMR (ssNMR) experiments 422
Laurdan is a well-known fluorophore used to put in evidence the coexistence of rigid 423
and fluid domains in both model and biological membranes47ndash49 Laurdan was used here to label 424
the G-C181-OH membranes between Tm1 and Tm2 and to verify the possible micro-segregation 425
and coexistence of rigid (eg Lβ λem= 440 nm) and fluid (eg Lα λem= 490 nm) domains in 426
17
tubes and vesicles respectively A set of quantitative experiments performed on a 5 mgmL-1 427
solution summarized in Figure 5 shows an excess of fluorescence at only λem= 490 nm for 428
temperature between 90degC and 70degC (Figure 5h) The GP value which quantifies the rigidfluid 429
character of the membrane is systematically negative (Figure 5i) indicating an overall fluid 430
membrane at all temperatures GP is quantified on more than 50 regions of interest (ROIs) at 431
each temperature including vesicles and tubes alone as well as connected nanotube-vesicles 432
(Figure 5d-g) The dispersion of GP at 80degC and 70degC between -08 and -02 could suggest the 433
spurious presence of membranes with various degrees of flexibility although fluidity is always 434
predominant The combination of WAXS (broad peak d= 144 Aring-1 invariant with 435
temperature Figure S 6bc) and confocal fluorescence microscopy using Laurdan confirms the 436
single-phase of the membrane composed of G-C181-OH both in vesicles and nanotubes This 437
is also consistent with the lack of phase transitions in DSC experiments between ~85degC and 438
~60degC especially in hydrated samples We conclude that the vesicle-nanotube transition is not 439
driven by the local segregation of gel phase (Lβ) microdomains nor that the nanotubes are 440
composed of such phase 441
ssNMR is the best-suited approach to investigate the origin of the local driving force for 442
the nucleation of anisotropic inclusions of which the average orientation depends on the local 443
membrane and inclusion curvatures and was shown to promote tubing62 ssNMR can provide 444
information on the local molecular mobility eg through the nuclear spin relaxation behavior 445
but also on intermolecular interactions and stereochemistry eg through variations in the 446
chemical shift68ndash70 447
Ideally ssNMR should be performed on diluted G-C181-OH samples above Tm1 448
However fast MAS necessary for high resolution centrifuges the sample As a first 449
approximation hydrated G-C181-OH samples for instance at 50 wt as classically done for 450
phospholipids71 could be studied Unfortunately permeability of the sample holder combined 451
to heating (close to the boiling point of water) and MAS provoke dehydration and even sample 452
ejection After experiencing both of the above this approach was abandoned As a second 453
approximation the study of the dehydrated G-C181-OH powder avoids centrifugation and 454
evaporation If studying dried lipids may not reflect their exact behaviour under diluted 455
conditions valuable structural information can still be obtained in dehydrated molecular 456
systems like proteins thus illustrating that this approach is not unreasonable Furthermore if 457
DSC (Figure 2a) shows that hydration suppresses the Tm2 it also shows that the value of Tm1 is 458
not affected by water at concentrations as low as 10 wt For this reason performing a 459
structural analysis of dehydrated G-C181-OH by ssNMR above Tm1 may help understanding 460
18
the local arrangement of G-C181-OH in two morphologies vesicles and nanotubes having 461
sensibly different curvatures 462
To explore the local mobility of the most relevant chemical groups of G-C181-OH 463
above Tm2 (T= 110degC) and between Tm2 and Tm1 (70 lt T degC lt 90) we combine a series of 1H 464
and 13C experiments Single-pulse (SP) MAS experiments (1H and 13C) when recorded under 465
quantitative conditions allow the detection of all chemical species while cross-polarization 466
(CP) MAS (13C only) experiments are sensitive only to constrained groups for which the 1H-467
13C dipolar coupling is not averaged to zero by the molecular motions 468
469
Figure 6 ndash a) 1H MAS (10 kHz) ssNMR spectra recorded from 110degC to 70degC b) 13C MAS (10 kHz) ssNMR 470
spectra recorded using high power decoupling single pulse (SP) and cross-polarization (CP) pulse sequences 471
Contact time for CP experiments and corresponding temperatures are given on each spectrum Full spectra 472
are given in Figure S 7 473
The most relevant 1H and 13C spectra are given in Figure 6 (full range in Figure 7 and 474
Figure S 7) As expected the 1H solid-state SPMAS spectra show broader peaks compared to 475
the solution-state NMR spectrum (Figure 6a) reflecting the obvious solid-state character of the 476
sample at any temperature The sugar group and the C=C bond resonate in the 25-6 ppm range 477
and 535 ppm respectively while the OH groups of the sugar moiety are found below 45 ppm 478
(Figure 6a full assignment in Table S 1) Very broad (~1 ppm) at 100degC the position of the 479
OH peak varies with the temperature value and becomes narrower (lt~05 ppm) and visible at 480
δH= 464 ppm at T= 70degC Line narrowing and chemical shift variations of the OH resonance 481
in ssNMR is always a direct sign of H-bonding interactions whereas the strength of the H-482
bonding hence its OHhellipH distance is correlated to a dispersion in chemical shifts72ndash75 All other 483
60 55 50 45 40 35 30 25
ppm
110
90
80
70
910
1rsquo
6rsquo16
1
OH
134 132 130 128 126
ppm110 108 106 104 102 100
ppm
SP (T= 110degC)
SP (T= 70degC)
CP 50 ms (T= 70degC)
CP 3 ms (T= 70degC)
910 1rsquo
1H 13C
1
811
910
CH2 CH2
1rsquo
6rsquo
a) b)
C102
13024
C9101
13003
C92
12869 C1rsquo210382
C1rsquo110443
C1rsquo13035
2rsquo3rsquo4rsquo
T degC
5rsquo
19
resonances broaden from 110degC to 70degC thus indicating slower andor more anisotropic 484
reorientational motions of all chemical groups The specific dynamic behaviour of the sugar 485
headgroup is also reflected by its 1H transverse relaxation time T2 whereas the shorter the T2 486
the higher the rigidity Experiments performed between 110degC and 70degC shown and 487
commented in Figure S 8 in the Supporting Information globally show a single short (lt 1 ms 488
below 100degC) T2 relaxation component for H1rsquo H5rsquo and H6rsquo and two both short and long 489
(between 4 ms and 12 ms) T2 for the acyl chain (CH2 H910 H811) even below 100degC 490
At 110degC 13C SPMAS experiments (Figure 6b full range in Figure 7 and Figure S 7 491
assignments in Table 1) show a single peak at δC= 10335 ppm for C1rsquo and at δC= 13003 ppm 492
for C910 as expected for a symmetrical conformation with two chemically-equivalent 493
carbons76 At 70degC the C1rsquo peak disappears while C910 now shows two peaks around 128 494
ppm and 130 ppm (Table 1 full temperature series in Figure S 7b) attributed to C92 (δC= 12869 495
ppm) and C10 in a non-symmetric configuration respectively for which these two carbons are 496
chemically inequivalent76 More precisely the resonance at 130 ppm is actually the 497
superposition of two close resonances C9101 (δC= 13003 ppm) and C102 (δC= 13024 ppm) 498
where subscripts 1 and 2 stand for two different conformations of the cis-olefin group as 499
reported for various phases of oleic acid in the vicinity of 0degC76 500
501
Table 1 ndash 13C Chemical shifts of G-C181-OH in solution and solid-state Solid-state experiments are 502
recorded at MAS= 10 kHz All spectra are reported in Figure 7 and Figure S 7 The contact time for cross 503
polarization is 3 ms In all ssNMR experiments temperature is first raised at 110degC and then lowered to 504
either 90degC or 70degC Attribution of the 13C resonances in Table 1 is performed on the basis of the solution 505
spectrum (Figure S 1b) Additional peaks observed in both single pulse and cross polarization ssNMR 506
experiments are attributed when possible to a configuration effect of the given atom eg C9101 and C92 507
indicate two configurations of C9 All new peaks observed in solid-state and not detected in solution are 508
highlighted in red for convenience 509
510
511
δ ppm
Peak Liquid (DMSO-d6)
Solid Single Pulse
T= 110degC
Solid Single Pulse
T= 90degC
Solid Single Pulse
T= 70degC
Solid Cross Polarization
T= 70degC
C102
- - 13024 13024
C910C9101 13009 13003 13003 13003 13003
C1C9C10C1rsquo
C6rsquo
20
C92 - - - 12869 12869
C1rsquoC11 10329 10335 10335 - 10443
C12 - - - - 10382
C3 7724 7709 7702 - 7829
- 7634 7629 - 7621
7525
C2 7388 7398 7390 7370 7370
C4 7052 7077 7054 7041 7098
C16 6900 7016 - - 7029
- - - - 6793
C1C5C6 6153 6241 6236 6239 6262
C1C5C6 6117 - - - 5956
C2 3300 3290 3290 3283 3279
CH2(trans) - - - 3198 3196
CH2(gauche)C15 2941 2981 2987 3004 -
C811 2706 2747 2747 2832 2817
CH2 2597 2625 2628 2630 2817
512
13C CPMAS spectra at 70degC (Figure 6b full range in Figure 7 and Figure S 7d) at 513
increasing contact times confirm the presence of two cis-olefin environments one for which 514
C910 are equivalent labelled here C9101 and one for which they are inequivalent labelled 515
C92 C102 Both environments are rigid enough to be observed at short contact time (tc= 50 μs) 516
A similar double environment is also observed for the sugar C1rsquo CPMAS at 70degC shows two 517
peaks (C1rsquo1 at δC= 10443 ppm C1rsquo2 at δC= 10382 ppm Figure 6b Figure S 7d) These are 518
significantly shifted downfield from the C1rsquo peak observed at 110degC and are detected at contact 519
times as short as 50 μs thus indicating their rigid character One also finds that CPMAS is 520
totally inefficient at 100degC for short contact times (50 μs) and poorly efficient even at 3 ms 521
typical of fast-tumbling molecules (Figure S 7c) also both gauche (δC= 3004 ppm) and all-522
trans (δC= 3198 ppm) conformations of the CH2 carbons coexist at 70degC (Figure S 7b)77 523
According to ssNMR one main mobile molecular environment exists at 110degC as 524
shown by the well-resolved 1H spectrum single C=C (C9101) and anomeric (C1rsquo) resonances 525
gauche conformation of the aliphatic CH2 and single T2 of the aliphatic CH2 chain and sugar 526
protons The sugar group is certainly mobile (inefficient 1H13C CPMAS) but still more 527
constrainted than the acyl chain (shorter T2 (1H)) As the temperature is lowered the overall 528
rigidity increases (broadening of 1H NMR peaks faster 1H transverse relaxation and efficient 529
1H13C magnetization transfer during CPMAS) presumably driven by H-bonding 530
interactions (downfield shift and line narrowing of the OH 1H signal very short OH T2 loss of 531
the C1rsquo signal in SPMAS) At the same time a number of spectroscopic data (two concomitant 532
21
resonances for anomeric C1rsquo1 and C1rsquo2 cis-olefin C9101 and C92 C102 and CH2 gauche and 533
all-trans environments) and relaxation behaviour (fast and slow T2 relaxation components) 534
strongly suggests the coexistence of two molecular environments Further proofs of the 535
coexistence of two distinct molecular domains are given by a number of chemical shift 536
variations in the 13C CPMAS spectrum at 70degC compared to the one at 110degC 90degC and 537
solution This is shown in Figure 7 and in the list of 13C chemical shifts in Table 1 538
539
540
Figure 7 - Comparison between solution- and solid-state 13C NMR spectra of G-C181-OH Solid-state 541
experiments are recorded directly on the sample powder at a MAS of 10 kHz (4 mm zirconia rotor) SP 542
Single Pulse CP Cross Polarization In all the ssNMR experiments temperature is first raised at 110degC 543
and then lowered to either 90degC or 70degC Segmented lines are meant to highlight the known peak position 544
in solution thus stressing the strong chemical shift variations in the solid-state 545
546
NMR experiments above Tm2 suggest that vesicles could contain G-C181-OH with a 547
single family of mobile conformations characterized by chemically-equivalent C=C (red 548
Figure 8b) and a single C1rsquo conformation (green Figure 8b) Experiments between Tm1 and Tm2 549
otherwise suggest that two coexisting conformations characterized by chemically-equivalent 550
(red Figure 8b) and inequivalent (magenta Figure 8b) C=C could be associated to nanotubes 551
Two distinct C1rsquo sites (grey Figure 8b) also indicate two configurations of the sugar headgroup 552
A comment on this point will be given in the following paragraphs 553
The local (Aring-scale) variation of molecular mobility below Tm2 drives the coexistence of 554
two distinct molecular environments of the same G-C181-OH molecule This occurs within a 555
single-phase domain (as deduced by WAXS) of equivalent membrane rigidity (as derived from 556
Laurdan probe in confocal microscopy) Although never reported before the difference in the 557
local mobility of the same amphiphile (here G-C181-OH) could satisfy the theoretically-558
140 120 100 80 60 40 20
CP(3 ms)-70degC
SP-70degC
SP-90degC
SP-110degC
ppm
LiquidC910
C1rsquo
C2rsquo
C4rsquo
C3rsquo
C1
C6rsquoC5rsquo
C1
6
C8
11
C2 C
H2
C1
5
CH
2
DM
SO
13C
22
required conditions that induce local lipid segregation and formation of membrane inclusions 559
(Figure 8c) In case of their non-zero average orientation the local membrane curvature 560
increases62 and nanotubes can spontaneously form (Figure 8bc) More intriguing this 561
mechanism occurs at least 10degC above Tm1 although it should not be favored above the Tm27 562
From both experimental and theoretical backgrounds the conditions of topologically-563
connected vesicles-nanotubes systems are met only when either internal (two components) or 564
external driving forces are applied19 In the present single-lipid system of which the phase 565
behavior is summarized in Figure 8a the most plausible driving force could be explained by 566
the NMR results collected on the dry sample G-C181-OH concomitantly occupies two 567
molecular environments characterized by 1) two distinct conformations of the sugar 568
displaying equivalent mobility and 2) two conformations of the acyl chain unsaturation 569
570
23
571
Figure 8 ndash a) Thermotropic phase behavior of G-C181-OH at 5 mgmL-1 Note that Tm2 is observed on the 572
dry powder only b) Possible relationship between the molecular environment as derived from NMR and 573
membrane curvatures All the molecular drawings refer to the same G-C181-OH molecule (bulky ellipsoid 574
equiv sugar headgroup) while each color corresponds to a given configuration Grey of C1rsquo1 and C1rsquo2 indicates 575
the uncertainty about the assignment of the specific NMR peak The curvature C is defined as 1R R being 576
the curvature radius R1 R2 radius of curvature CG Gauss curvature CM Mean curvature c) Free 577
interpretation of the anisotropic high-curvature (CMgt 0 CG= 0) inclusions in the membrane (low CM and 578
CG) continuum driven by inter-sugar H-bonding and reduced intramembrane diffusion for a G-C181-OH 579
glucolipid 580
581
Flat crystalline structure
Nanotube-vesicle network
Vesicles
48degC
120deg
106 105 104 103 102 101
ppm
H9 H10H1rsquo
106 105 104 103 102 101
ppm106 105 104 103 102 101
ppm106 105 104 103 102 101
ppm
C=CC=C
C1rsquo1C1rsquo2
C1rsquo
Tm2(96degC)Tm1
a)
b)
c)
Same molecule different local orientations and sugar conformations
High curvature membrane
Low curvature inclusion
Flip-FlopStrong H-bonding
CG
CM ( + )
CG 0
CM 0 CG 0
CM 0
G-C181-OH
24
Two related questions are unanswered at the moment What actually drives nanotube 582
formation and is the organization of G-C181-OH within the vesicles and tubes the same Lipid 583
nanotubes have been studied for at least three decades over which broad experimental and 584
theoretical insight has been generated Despite this fact the actual understanding is still matter 585
of debate27 Micelle-to-nanotube and vesicle-to-nanotube phase transitions are generally 586
reported for single amphiphiles below a given Tm and intermediate phase composed of twisted 587
and flat fibers is concomitantly reported Initially thought to be a chirality-driven phenomenon 588
recent studies propose a more general mechanism involving crystallization and symmetry 589
breaking in the lipid packing driven by optimal packing27 If twisted ribbons were observed 590
before for a number of microbial glycolipid bolaamphiphiles44 they are not found for G-C181-591
OH This fact as well as the large body of cryo-TEM images and the observation of nanotubes 592
above Tm1 rather pledge in favour of a direct topological change from positive (vesicles) to 593
zero (nanotubes) Gaussian curvatures In this case vesicle-to-nanotube transitions could be 594
driven by external forces56307813ndash162829 595
Considering the absence of external forces in the present system there are only two 596
possibilities left spontaneous budding of the membrane or nanotube pulling after inter-vesicle 597
collisions due to Brownian motion Both are possible as inclusions composed of a different 598
arrangement of the same molecule in the membrane continuum can theoretically explain 599
spontaneous nanotube formation in an isotropic medium672223629ndash1218ndash21 However the second 600
one is probably more likely to prevail because it could explain the large number of nanotubes 601
connecting two distant vesicles Interestingly similar events occur for any phospholipid-based 602
vesicular solution but nanotubes are extremely rare unless at least two lipids of different 603
molecular structure are mixed together The spectroscopic 1H and 13C and relaxation (1H) 604
ssNMR data even if collected on a dry powder demonstrate that the coexistence of two G-605
C181-OH configurations involving both the sugar headgroup and fatty alcohol chain are 606
possible for this molecule As a matter of fact this is not so surprising as more than one energy 607
minima each corresponding to a given conformation are known for glucose its non-reducing 608
derivative methylglucose and carbohydrates in general78ndash80 609
The presence of two configurations could explain the coexistence between two 610
structures of different curvature but the data presented so far do not explain the origin of these 611
two configurations In other words what drives the change in the local structure of the sugar 612
headgroup and fatty alcohol within the membrane 613
The association of known self-assembled structures to spectroscopic 13C ssNMR data is 614
known for years in particular for gluconamides lipids having a linear sugar headgroup81ndash84 It 615
25
was found that gauche effects in some cases up to the γ position in the sugar chain induce 616
upfield chemical shifts while anti and trans conformations result in downfield shifts Each 617
structure (monolayer crystal bilayer crystal or micellar fiber) was then characterized by a given 618
organization of the gluconamide and a characteristic 13C ssNMR fingerprint which could be 619
explained by gauche γ-gauche anti and trans conformations of the headgroup Similar 620
structural-spectroscopic correlations have been collected over the years for much simpler cyclic 621
sugars85 whereas pyranoses can undergo important conformational changes (chair half-chair 622
boat skew) when the appropriate energy barriers are crossed78ndash8086 A quantitative 623
conformational study based on the 13C chemical shift variations shown in Table 1 would be 624
certainly helpful but very delicate in the context of the present state of the art because a 625
rigorous approach requires at least one known crystal structure8182 which is currently missing 626
for this compound A qualitative approach will then be adopted 627
G-C181-OH is a bolaform amphiphile and flip-flop could be a possible mechanism 628
involved in the nanotube stabilization whereas head-tail interactions have long been considered 629
as important in nanotube-forming bolaform amphiphiles6063 From mere considerations based 630
on T2 (1H) relaxation arguments one could exclude head-tail configurations if the R-CH2OH 631
endgroup (H1) was involved in a direct interaction with the sugar group its corresponding T2 632
would probably be comparable to the sugarrsquos one (OH and H1rsquo) but this does not seem to be 633
the case However this hypothesis would be based on the comparison of the relaxation from 634
CH and CH2 protons additionally involved in different kind of motions Besides the relaxation 635
of H1 is influenced by the strong overlap between H1 and H5rsquo For these reasons relaxation 636
arguments are not solid enough and will not be used 637
We then address this question by exploring intermolecular interactions in a direct 638
manner using 2D 1H-1H homonuclear ssNMR correlation spectroscopy At 90degC in the fast-639
tumbling domain of molecular motion (narrow 1H NMR peaks Figure 6a) and corresponding 640
to the vesicle-rich region spin diffusion (NOESY) experiments are preferred over dipolar 641
coupling based experiments because such interaction is averaged out by molecular motion 642
However when the molecular motion is more constrained in the domain of nanotube stability 643
at 70degC (broad 1H spectra Figure 6a) Double-Quantum Single-Quantum (DQ-SQ) correlation 644
experiments are best suited to probe interaction between close molecular neighbors These 645
experiments are reported in Figure 9 and the related interpretation is only briefly reported 646
below while a more detailed discussion can be found on Page 12 in the Supporting Information 647
26
648
Figure 9 ndash a) 2D 1H-1H NOESY NMR experiment performed at MAS= 10 kHz (4 mm probe) on a Bruker 649
300 MHz Avance III HD spectrometer using 300 ms of mixing time Sample temperature is regulated to 650
90degC reached by cooling from 110degC b) 2D 1H-1H DQ-SQ (BAck-to-BAck BABA pulse sequence used for 651
the DQ excitation scheme) NMR experiment performed at MAS= 22 kHz (25 mm probe) on a Bruker 700 652
MHz Avance III spectrometer using a DQ excitation time equal to 2 rotor periods Sample temperature is 653
regulated to 70degC reached by cooling from 110degC The typical schemes illustrating how to interpret these 654
2D experiments are reported above each experimental map Zooms of the sugar region and configurational 655
interpretation are given below each 2D map More information are given in the text below 656
H16-H16
H1-H1
H9-H10
H1rsquo-H1
H1rsquoH910 H16
H1
H1rsquo-H1rsquo
Hxrsquo-Hxrsquo
2
(pp
m)
(ppm)
315
811910 1rsquo
2rsquo2
3rsquo 4rsquo6rsquo
5rsquo
1rsquo2910
asymp asymp asympHDO MeOD Acetone
1
315
811 9101rsquo
2rsquo2
3rsquo4rsquo6rsquo
5rsquo
1rsquo2 9 10
asympasympasympHDOMeODAcetone
H1rsquo-H1
1rsquo
1
(p
pm
)
(ppm)
H1-H2
H1rsquo-H1
H1rsquo
H910
H1H5rsquo
H2
H1rsquo-H5rsquo
315
811910 1rsquo
2rsquo2
3rsquo 4rsquo6rsquo
5rsquo
1rsquo2910
asymp asymp asympHDO MeOD Acetone
1
H2rsquoH3rsquoH4rsquo
H2rsquoH3rsquoH4rsquo
X= 2rsquo3rsquo4rsquo
NOESY - T= 90degC
1H
1H
1H
1H
DQ-SQ - T= 70degC
a) b)
2
(pp
m)
(p
pm
)
(ppm)
A B
AhellipB
AhellipA
BhellipB
NOESY
(ppm)
A B
AhellipB
DQ-SQ
Single-quantum dimension
Do
ub
le-q
ua
ntu
m d
imen
sio
n
AhellipA
BhellipB
BhellipA
BhellipA
315
811910 1rsquo
2rsquo2
3rsquo 4rsquo6rsquo
5rsquo
1rsquo2910
asymp asymp asympHDO MeOD Acetone
1
lt 5 Aring
lt 5 Aring
H1-H2
H811
H15
H16
H6rsquo
H1rsquo
H1
H5rsquo
H2
H1-H2
H1rsquo-H1
H1rsquo-H5rsquo
H1rsquo
H1 H5rsquo
H1rsquo
H1
H5rsquo
H1H2rsquo H3rsquo H4rsquo
H1-H1
H1rsquo-H1
Hxrsquo-HxrsquoX= 2rsquo3rsquo4rsquo
H1-H2
H1rsquo
Zoom sugar region 28 ndash 45 ppmNOESY DQ-SQ
27
Head-tail or head-head configurations could be probed by the existence of H1rsquo-H1 657
interactions whereas H1 (δH= 356 ppm) is associated to the glucolipid tail and H1rsquo (δH= 432 658
ppm) to the sugar headgroup These atoms are more than 15 Aring apart and a direct interaction 659
could not be observed in both NOESY and DQ-SQ experiments NOESY experiments (Figure 660
9a) show that H1rsquo-H1 correlations are not observed Meanwhile clear-cut direct H1rsquo-H1 661
interactions are indeed observed are detected at T= 70degC (DQ cross-peaks related to H1rsquo-H1 662
correlation in DQ-SQ experiment shown in Figure 9b) Interestingly the absence of auto peaks 663
at δH= 432 ppm and δH= 335 ppm in the SQ dimension excludes H1rsquo-H1rsquo and Hxrsquo-Hxrsquo (x= 2 664
3 4) interactions respectively strengthening the idea that sugar headgroups from two nearest-665
neighbor G-C181-OH molecules are not adjacent in the nanotube-vesicle region 666
Homonuclear 2D ssNMR supports the idea according to which G-C181-OH can 667
undergo molecular flip-flops and a head-tail arrangement in the dry product Extrapolating these 668
conclusions in the lower concentration range lack of H1rsquo-H1 proximity at T= 90degC suggests a 669
head-head configuration in the vesicle-rich region and head-tail configuration within the 670
nanotubes It is however still unclear whether flip-flops are driven by spontaneous temperature-671
induced conformational changes in the glucolipid packing stimulating inclusions within the 672
membrane itself672223629ndash1218ndash21 or by defects generated by inter-vesicle collisions In fact a 673
combination of both is not unlikely Nanotubes are not stable when temperature is 20 to 30 674
degrees above Tm1 indicating that inter-vesicle collisions alone cannot explain the unusual 675
phenomenon In an energy landscape approach87 the head-head configuration is certainly 676
favored at high temperature while both head-head and head-tail configurations could be 677
favored in the mid-temperature region corresponding to the range between Tm1 and Tm2 in the 678
dry powder Both statistical and defect-induced flip-flop events contribute to form high mean 679
zero Gaussian curvature morphologies (nanotubes) for which the head-tail conformation 680
limiting the proximity between bulky sugar headgroups is probably more adapted (Figure 8c) 681
The flip-flop interpretation now reasonably explains the strong differences in the sugar and fatty 682
alcohol conformations deduced by the multiple NMR signals attributed to chemically-683
equivalent groups The existence of various low-energy conformations each having specific 684
NMR signature for sugars in solution78ndash8086 and solid-state81ndash84 further supports our 685
interpretation 686
One last point should be clarified Why between Tm1 and Tm2 are two molecular 687
environments able to coexist instead of a single one of average rigidity as found in the case of 688
ldquoripplerdquo phases50ndash54 We believe that this question can be answered based on the NMR results 689
the relatively short T2 values of the H1rsquo and OH protons shows the constrained mobility of the 690
28
sugar headgroup despite a certain flexibility of the chain (long T2 component) This trend may 691
suggest restrictions in translational mobility probably due to the sugar-OH hydrogen bonding 692
(Figure 8c) meaning that lipids are not able to diffuse within the membrane thus keeping two 693
different configurations stable 694
695
Conclusions 696
Topologically-connected nanotube-vesicle lipidic systems are commonly observed for 697
self-assembled membranes composed of at least two amphiphiles and spontaneously driven by 698
anisotropic inclusions andor by external directional forces This work shows that strong 699
differences in membrane curvature can spontaneously occur in single-lipid systems without 700
external anisotropic forces Coexistence and interconnection between nanotubes and vesicles 701
are evidenced via cryo-TEM and fluorescence confocal microscopy in a single-phase region at 702
temperature above a transition temperature Tm1= 483degC determined by DSC on the hydrated 703
sample but below the second transition temperature Tm2 (957degC) determined by DSC on the 704
dry powder X-ray diffraction (WAXS) also shows the coexistence of two lattice periods one 705
attributed to an inter-membrane repeating distance and the other possibly related to the intra-706
nanotube glucolipid arrangement Labelling the systems with Laurdan a fluorophore of which 707
the emission strongly varies with the local membrane rigidity excludes the presence of rigid 708
micro-separated phases (eg Lβ) 709
1H and 13C ssNMR despite the fact that it can only be performed on the dry powder 710
confirm the presence of one main fluid G-C181-OH environment above Tm2 Below Tm2 the 711
splitting of some 13C peaks and the coexistence of short and long 1H relaxation components 712
demonstrate that G-C181-OH can simultaneously pack into structurally and dynamically 713
inequivalent environments Combining advanced 2D 1H-1H correlation experiments based on 714
spin diffusion or double-quanta excitation suggests that vesicles could contain a preferred head-715
head configuration of the bolaform lipid while nanotubes a preferred head-tail assembly 716
The presence of two environments composed of the same molecule characterized by 717
different molecular configurations and rigidity fulfills the theoretical conditions necessary to 718
spontaneously nucleate a membrane inclusion of non-zero average orientation described as 719
necessary to observe topologically-connected nanotube-vesicle structures in the absence of 720
external forces This hypothesis could also be enriched by the possibility of nanotubes to be 721
pulled away between two vesicles after a collision event 722
This work expands the actual theoretical and experimental framework on lipid networks 723
stabilized by a different radius of curvature It could also motivate the synthesis or isolation 724
29
of new lipids providing a higher level of 3D architectural control in soft networks possibly in 725
the range of room temperature 726
727
Acknowledgements 728
Dr Andrea Lassenberger and Dr Sylvain Preacutevost at Institut Laue Langevin (ILL Grenoble 729
France) are kindly acknowledged for their assistance on the SANS experiment Confocal 730
images were performed at the Institut de Biologie Paris Seine (IBPS) imaging facility Jean-731
Franccedilois Gilles (Imaging Core Facility Institut de Biologie Paris Seine (IBPS) CNRS 732
Sorbonne Universiteacute Paris France) is kindly acknowledged for his assistance on the confocal 733
microscopy imaging Dr Guillaume Laurent (LCMCP Sorbonne Universiteacute Paris France) is 734
kindly acknowledged for helpful discussions The French region Ile-de-France SESAME 735
program is acknowledged for financial support (700 MHz NMR 736
spectrometer) Dr Olivier Diat (ICSM Marcoule France) Prof eronikaIglič and Prof V Aleš737
onsul discussi Slovenia) are kindly acknowledged for helpfUniversity of LjubljanaIglič (-Kralj 738
739
Financial support 740
WAXS experiments have been supported by Soleil Light Source Saint Aubin France proposal 741
Ndeg 20201747 SANS experiments have been supported by ILL proposal Ndeg9-13-778 742
743
References 744
1 D Kabaso N Bobrovska W Goacuteźdź E Gongadze V Kralj-Iglič R Zorec and A 745
Iglič Bioelectrochemistry 2012 87 204ndash210 746
2 C R Safinya U Raviv D J Needleman A Zidovska M C Choi M A Ojeda-747
Lopez K K Ewert Y Li H P Miller J Quispe B Carragher C S Potter M W 748
Kim S C Feinstein and L Wilson Adv Mater 2011 23 2260ndash2270 749
3 P Veranič M Lokar G J Schuumltz J Weghuber S Wieser H Haumlgerstrand V Kralj-750
Iglič and A Iglič Biophys J 2008 95 4416ndash4425 751
4 A Rustom R Saffrich I Markovic P Walther and H-H Gerdes Science (80- ) 752
2004 303 1007ndash1010 753
5 M I Angelova S Soleacuteau P Meacuteleacuteard F Faucon and P Bothorel Prog Colloid 754
Polym Sci 1992 89 127ndash131 755
6 L Mathivet S Cribier and P F Devaux Biophys J 1996 70 1112ndash1121 756
7 V Kralj-Iglič G Gomišček J Majhenc V Arrigler and S Svetina Colloids Surfaces 757
A Physicochem Eng Asp 2001 181 315ndash318 758
30
8 V Kralj-Iglič A Iglič G Gomišček F Sevšek V Arrigler and H Haumlgerstrand J 759
Phys A Math Gen 2002 35 1533ndash1549 760
9 M Drab D Stopar V Kralj-Iglič and A Iglič Cells 2019 8 626 761
10 A Zidovska K K Ewert J Quispe B Carragher C S Potter and C R Safinya 762
Langmuir 2009 25 2979ndash2985 763
11 A Zidovska K K Ewert J Quispe B Carragher C S Potter and C R Safinya Soft 764
Matter 2011 7 8363ndash8369 765
12 A Zidovska K K Ewert J Quispe B Carragher C S Potter and C R Safinya 766
Biochim Biophys Acta - Biomembr 2009 1788 1869ndash1876 767
13 M Karlsson K Sott M Davidson A S Cans P Linderholm D Chiu and O Orwar 768
Proc Natl Acad Sci U S A 2002 99 11573ndash11578 769
14 A Karlsson R Karlsson M Karlsson A-S Cans A Stromberg F Ryttsen and O 770
Orwar Nature 2001 409 150ndash152 771
15 M Karlsson K Sott A S Cans A Karlsson R Karlsson and O Orwar Langmuir 772
2001 17 6754ndash6758 773
16 E Evans H Bowman A Leung D Needham and D Tirrell Science (80- ) 1996 774
273 933ndash935 775
17 U Seifert Configurations of fluid membranes and vesicles 1997 vol 46 776
18 J Kaumls and E Sackmann Biophys J 1991 60 825ndash844 777
19 N Bobrovska W Goacuteźdź V Kralj-Iglič and A Iglič PLoS One 2013 8 e73941 778
20 A Iglič B Babnik K Bohinc M Fošnarič H Haumlgerstrand and V Kralj-Iglič J 779
Biomech 2007 40 579ndash585 780
21 K Bohinc T Slivnik A Iglič M Brumen and V Kralj-Iglič J Phys Chem C 2007 781
111 9709ndash9718 782
22 A Iglič H Haumlgerstrand P Veranič A Plemenitaš and V Kralj-Iglič J Theor Biol 783
2006 240 368ndash373 784
23 V Kralj-Iglič and P Veranič Adv Planar Lipid Bilayers Liposomes 2006 5 129ndash785
149 786
24 A Iglic and V Kralj-Iglic Adv Planar Lipid Bilayers Liposomes 2006 4 253ndash279 787
25 S Penič L Mesarec M Fošnarič L Mroacutewczyńska H Haumlgerstrand V Kralj-Iglič and 788
A Iglič Front Phys 2020 8 342 789
26 P Yager and P E Schoen Mol Cryst Liq Cryst 1984 106 371ndash381 790
27 T G Barclay K Constantopoulos and J Matisons Chem Rev 2014 114 10217ndash791
10291 792
31
28 B Božič G Gomišček V Kralj-Iglič S Svetina and B Žekš Eur Biophys J 2002 793
31 487ndash496 794
29 A Iglič H Haumlgerstrand M Bobrowska-Haumlgerstrand V Arrigler and V Kralj-Iglič 795
Phys Lett A 2003 310 493ndash497 796
30 R Bar-Ziv and E Moses Phys Rev Lett 1994 73 1392ndash1395 797
31 S Chiruvolu H E Warriner E Naranjo S H Idziak J O Raumldler R J Plano J A 798
Zasadzinski and C R Safinya Science (80- ) 1994 266 1222ndash1225 799
32 V Kralj-Iglič A Iglič H Haumlgerstrand and P Peterlin Phys Rev E 2000 61 4230ndash800
4234 801
33 L Mesarec M Drab S Penič V Kralj-Iglič and A Iglič Int J Mol Sci 2021 22 802
2348 803
34 L Van Renterghem S L K W Roelants N Baccile K Uyttersprot M C Taelman 804
B Everaert S Mincke S Ledegen S Debrouwer K Scholtens C V Stevens W 805
Soetaert L Van Renterghem S L K W Roelants N Baccile K Uytersprot M C 806
Taelman B Everaert S Mincke S Ledegen S Debrouwer K Scholtens C V 807
Stevens and W Soetaert Biotechnol Bioeng 2018 115 1195ndash1206 808
35 J Clark and F Deswarte Introduction to Chemicals from Biomass Second Edition 809
John Wiley amp Sons 2015 810
36 K V Sajna R Houmlfer R K Sukumaran L D Gottumukkala and A Pandey in 811
Industrial Biorefineries and White Biotechnology eds A Pandey R Houmlfer M 812
Taherzadeh K M Nampoothiri and C Larroche Amsterdam Oxford Waltham 813
Elsevier 2015 pp 499ndash521 814
37 R Marchant and I M Banat Trends Biotechnol 2012 30 558ndash565 815
38 K Hill and C LeHen-Ferrenbach in Sugar-Based Surfactants Fundamentals and 816
Applications ed C C Ruiz Boca Raton CRC Press 2009 pp 1ndash20 817
39 L Rodrigues I M Banat J Teixeira and R Oliveira J Antimicrob Chemother 818
2006 57 609ndash618 819
40 J D Desai and I M Banat Microbiol Mol Biol Rev 1997 61 47ndash64 820
41 S L K W Roelants K Ciesielska S L De Maeseneire H Moens B Everaert S 821
Verweire Q Denon B Vanlerberghe I N A Van Bogaert P Van der Meeren B 822
Devreese and W Soetaert Biotechnol Bioeng 2016 113 550ndash559 823
42 N Baccile M Selmane P Le Griel S Preacutevost J Perez C V Stevens E Delbeke S 824
Zibek M Guenther W Soetaert I N A Van Bogaert and S Roelants Langmuir 825
2016 32 6343ndash6359 826
32
43 N Baccile A-S Cuvier S Preacutevost C V Stevens E Delbeke J Berton W Soetaert 827
I N A Van Bogaert and S Roelants Langmuir 2016 32 10881ndash10894 828
44 N Baccile C Seyrig A Poirier S A Castro S L K W Roelants and S Abel Green 829
Chem 2021 23 3842ndash3944 830
45 A Salis L Cappai C Carucci D F Parsons and M Monduzzi J Phys Chem Lett 831
2020 11 6805ndash6811 832
46 J Schindelin I Arganda-Carreras E Frise V Kaynig M Longair T Pietzsch S 833
Preibisch C Rueden S Saalfeld B Schmid J-Y Tinevez D J White V 834
Hartenstein K Eliceiri P Tomancak and A Cardona Nat Methods 2012 9 676ndash835
682 836
47 T Parasassi and E Gratton J Fluoresc 1995 5 59ndash69 837
48 M M Dodes Traian F L Gonzaacutelez Flecha and V Levi J Lipid Res 2012 53 609ndash838
616 839
49 D M Owen C Rentero A Magenau A Abu-Siniyeh and K Gaus Nat Protoc 840
2012 7 24ndash35 841
50 W Stillwell in An Introduction to Biological Membranes Academic Press 2016 pp 842
135ndash180 843
51 W Stillwell in An Introduction to Biological Membranes Academic Press 2016 pp 844
181ndash220 845
52 B Tenchov Chem Phys Lipids 1991 57 165ndash177 846
53 R Koynova and M Caffrey Biochim Biophys Acta 1998 1376 91ndash145 847
54 F Schmid S Dolezel O Lenz and S Meinhardt J Phys Conf Ser 2014 487 848
012004 849
55 S Meinhardt R L C Vink and F Schmid Proc Natl Acad Sci U S A 2013 110 850
4476ndash4481 851
56 O Glatter and O Kratky Small Angle X-ray Scattering Academic Press London 852
1982 853
57 B A Cunningham A D Brown D H Wolfe W P Williams and A Brain Phys 854
Rev E 1998 58 3662ndash3672 855
58 M Nadler A Steiner T Dvir O Szekely P Szekely A Ginsburg R Asor R Resh 856
C Tamburu M Peres and U Raviv Soft Matter 2011 7 1512ndash1523 857
59 C Tanford The hydrophobic effect Formation of micelles and biological membranes 858
John Wiley amp Sons Inc New York 1973 859
60 M Masuda and T Shimizu Langmuir 2004 20 5969ndash5977 860
33
61 A Zidovska K K Ewert J Quispe B Carragher C S Potter and C R Safinya 861
Block Liposomes Vesicles of Charged Lipids with Distinctly Shaped Nanoscale 862
Sphere- Pear- Tube- or Rod-Segments Elsevier Inc 1st edn 2009 vol 465 863
62 A Iglic V Kralj-Iglic B Božič M Bobrowska-Haumlgerstrand B Isomaa and H 864
Haumlgerstrand Bioelectrochemistry 2000 52 203ndash211 865
63 T Shimizu M Masuda and H Minamikawa Chem Rev 2005 105 1401ndash1444 866
64 J V Selinger and J M Schnur Phys Rev Lett 1993 71 4091ndash4094 867
65 J M Schnur Science (80- ) 1993 262 1669ndash1676 868
66 B Tenchov R Koynova and G Rapp Biophys J 2001 80 1873ndash1890 869
67 R Koynova and B Tenchov Ser Biomech 2017 31 3ndash19 870
68 S J Angyal and R Le Fur Carbohydr Res 1984 126 15ndash26 871
69 J K Whitesell and M A Minton J Am Chem Soc 1987 109 225ndash228 872
70 T Takayama S Ando and I Ando J Mol Struct 1990 220 245ndash250 873
71 K Gawrisch N V Eldho and I V Polozov Chem Phys Lipids 2002 116 135ndash151 874
72 F Tielens C Gervais J F Lambert F Mauri and D Costa Chem Mater 2008 20 875
3336ndash3344 876
73 G A Jeffrey and Y Yeon Acta Crystallogr Sect B 1986 42 410ndash413 877
74 B Berglund and R W Vaughan J Chem Phys 1980 73 2037ndash2043 878
75 C Gervais C Coelho T Azaiumls J Maquet G Laurent F Pourpoint C Bonhomme 879
P Florian B Alonso G Guerrero P H Mutin and F Mauri J Magn Reson 2007 880
187 131ndash140 881
76 C Akita T Kawaguchi F Kaneko H Yamamoto and M Suzuki J Phys Chem B 882
2004 108 4862ndash4868 883
77 R N Purusottam L Seacutenicourt J J Lacapegravere and P Tekely Biochim Biophys Acta - 884
Biomembr 2015 1848 3134ndash3139 885
78 X Biarneacutes A Ardegravevol A Planas C Rovira A Laio and M Parrinello J Am Chem 886
Soc 2007 129 10686ndash10693 887
79 L M J Kroon‐Batenburg and J Kroon Biopolymers 1990 29 1243ndash1248 888
80 K N Kirschner and R J Woods Proc Natl Acad Sci U S A 2001 98 10541ndash889
10545 890
81 S Svenson B Kirste and J H Fuhrhop J Am Chem Soc 1994 116 11969ndash11975 891
82 I Sack S Macholl J H Fuhrhop and G Buntkowsky Phys Chem Chem Phys 892
2000 2 1781ndash1788 893
83 S Svenson J Koening and J H Fuhrhop J Phys Chem 1994 98 1022ndash1028 894
34
84 S Svenson A Schaefer and J H Fuhrhop J Chem Soc Perkin Trans 2 1994 2 895
1023ndash1028 896
85 K Bock and C Pedersen Adv Carbohydr Chem Biochem 1983 41 27ndash66 897
86 T B Grindley Structure and Conformation of Carbohydrates Springer Berlin 898
Heidelberg 2008 899
87 F Tantakitti J Boekhoven X Wang R V Kazantsev T Yu J Li E Zhuang R 900
Zandi J H Ortony C J Newcomb L C Palmer G S Shekhawat M O De La 901
Cruz G C Schatz and S I Stupp Nat Mater 2016 15 469ndash476 902
903
1
Supporting Information 904
905
Topological connection between vesicles and nanotubes in single-906
component lipid membranes driven by head-tail interactions 907
908
Niki Baccilea Ceacutedric Lorthioira Abdoul Aziz Baa Patrick Le Griela Cristina Coelhob Javier 909
Perezc Wim Soetaertd Sophie L K W Roelantsd 910
911
a Sorbonne Universiteacute Centre National de la Recherche Scientifique Laboratoire de Chimie de 912
la Matiegravere Condenseacutee de Paris LCMCP F-75005 Paris France 913
b Institut des Mateacuteriaux de Paris Centre Sorbonne Universiteacute Paris France 914
c Synchrotron Soleil LrsquoOrme des Merisiers Saint-Aubin BP48 91192 Gif-sur-Yvette Cedex 915
France 916
d InBio Department of Biotechnology Ghent University Ghent Belgium 917
918
919
Corresponding author 920
Dr Niki Baccile 921
E-mail address nikibaccilesorbonne-universitefr 922
Phone +33 1 44 27 56 77 923
924
925
926
2
a) 927
Parameter Method
Dry Matter (DM ) 996 Infrared balance 105degC
Glucose () 012 HPLC-Metacarb
Glycerol () nd HPLC-Metacarb
Free Fatty Acid content () lt001 Internal method BBEPP
GC with FID Detector
Oil () lt001 Internal method BBEPP
GC with FID Detector
Moulds (CFUg) lt10 3M-Nordval ndeg16 B
Yeasts (CFUg) lt10 3M-Nordval ndeg16 B
Anaerobic count (CFUg) lt10 SP-VG M005 B
Protein () tbd BCA protein assay
928
Figure S 1 - a) HPLC-ELSD chromatogram and composition table 929
930
931
932
933
3
b) 934
935
Group Ndeg δ ppm
CH2 1 354
CH2 2 153
CH2 3-712-14 132
CH2 811 203
CH 910 534
CH2 15 162
CH2 16 388
CH 1 424
CH 2 316
CH 3 334
CH 4 329
CH 5 354
CH2 6 366
Figure S 1 (next) ndash b) 1H NMR spectrum (MeOD-d4) recorded on the purified G-C181-OH compounds 936
and related assignment 937
938
2
811910 1rsquo
5rsquo1
3rsquo4rsquo
1rsquo1910
asymp asymp asympHDO MeOD Acetone
6rsquo2rsquo
1615
3-712-14
4
939
940
Figure S 2 ndash Cryo-TEM images recorded for a 5 mgmL G-C181-OH aqueous solution heat at T= 130degC 941
5
942
943
Figure S 3 - Cryo-TEM images recorded for a 5 mgmL G-C181-OH aqueous solution heat at T= 90degC 944
945
90degC
1
22
6
946
947
948
949
Figure S 4 ndash Cryo-TEM images recorded for a 5 mgmL G-C181-OH aqueous solution heat at T= 70degC 950
951
21
11
1
2
5
3
4
45
5
6
7
7
7
952
953
954
Figure S 5 ndash Cryo-TEM images recorded for a 5 mgmL G-C181-OH aqueous solution heat at T= 25degC 955
956
957
1
1 1
8
958
Figure S 6 ndash a) SANS experiment recorded at 90degC for a 5 mgmL G-C181-OH aqueous solution b-c) 959
WAXS experiments recorded on aqueous solutions of G-C181-OH at b) 5 mgmL and c) 25 mgmL d) 960
Structural interpretation of the repeating distances pointed out in c) 961
962
963
964
001 01 1
q Aring-1
25degC
68degC
88degC
111degC
01 1q Aring
-1
02 04 06 08 1q Aring
-1
001 01
10-1
100
101
Inte
nsity
cm
-1
q Aring-1
-2
T= 90degC
SANS WAXS WAXS
a) b) c)
dv
dL d= 144 Aring-1
di
ddH2O
dt
dvdL
dtdi d
d)
9
965
966
Figure S 7 ndash ssNMR MAS (10 kHz) experiments recorded on a G-C181-OH dry powder a) 1H spectra 967
recorded from 110degC to 70degC b) 13C single pulse (SP) spectra recorded with high power 1H decoupling from 968
110degC to 70degC c) 13C cross polarization (CP) spectra recorded at 110degC and contact time tc of 50 micros and 969
3000 micros d) 13C CP spectra recorded at 70degC and for 20 lt tc micros lt 3000 970
971
1
811
910
CH2 CH2
1rsquo
6rsquo
8 6 4 2 0 ppm
110
90
80
70
910
1rsquo
6rsquo16
1
2rsquo3rsquo4rsquo
811
OH
45 40 35 30 25 20 15
ppm
200 180 160 140 120 100 80 60 40 20 0
ppm140 120 100 80
ppm
CH2-gauche
3004
110
90
80
70
65
60
50
25
C91013003
C9 - 12869
CH2-all-trans
3198
C1rsquo10335
a) b)
1H
T degCT degC
13C Single Pulse MAS
A
B
A
B
70degC70degC
5rsquo
215
200 180 160 140 120 100 80 60 40 20 0
ppm
13C CPMAST= 110degC
200 180 160 140 120 100 80 60 40 20 0
ppm
132 131 130 129 128 127 126
ppm
106 105 104 103 102
ppm
13C CPMAST= 70degC
50
tc micros
3000
20
tc micros
50 500 1000 3000
tc micros
C102
13024 C910113003
C92
12869
C1rsquo213082
C1rsquo110443
A B
106 105 104 103 102
ppm
3000
1000
500
50
20
AB
c)
d)
10
972
Figure S 8 ndash a) Short and d) long T2 components displayed by the 1H transverse relaxation signal c) 1H 973
transverse relaxation signals recorded on a G-C181-OH dry powder from 110degC to 70degC The area of each 974
given resonance is plotted (log-lin) as a function of the echo time (CPMG pulse sequence) for each 975
temperature and fitted using the equation given above T2s and T2l indicate the short and long T2 relaxation 976
times respectively obtained by describing the 1H transverse relaxation signal using a biexponential decay 977
For H1rsquo H5rsquo and H6rsquo the 1H relaxation function could be described by a monoexponential decay 978
- Protons from the sugar group (H1rsquo H5rsquo H6rsquo) show a single T2 relaxation component (Figure 979
6c and Figure S 8) while protons of the acyl chain (CH2 H910 H811) show both short (Figure 980
6c) and long (Figure 6d) T2 relaxation component 981
- The short T2 relaxation time systematically decreases from 110degC to 70degC for all species by a 982
factor ranging from two to seven depending on the specific chemical group Very long T2 are 983
observed at 110degC for all acyl species while nearly unchanged values are measured below 984
90degC without any clear trend 985
- The sugar protons (H1rsquo H5rsquo H6rsquo) have the shortest set of T2 values (lt 1 ms) below 100degC 986
The long component of T2 generally ranges between 4 ms and 12 ms 987
0 1 2 3 4 5 6 7 8
00
05
10
15
20
25
30
35
40
45
Log
In
ten
sity
Time ms
0 1 2 3 4 5 6 7 8
00
05
10
15
20
25
30
35
40
45
Log
In
ten
sity
Time ms
0 1000 2000 3000 4000 5000 6000 7000 8000
00
05
10
15
20
25
30
35
40
45
Log
In
ten
sity
Time ms
0 1000 2000 3000 4000 5000 6000 7000 8000
00
05
10
15
20
25
30
35
40
45
Log
In
ten
sity
Time ms
0 1000 2000 3000 4000 5000 6000 7000 8000
00
05
10
15
20
25
30
35
40
45
Log
In
ten
sity
Time ms
0 1000 2000 3000 4000 5000 6000 7000 8000
00
05
10
15
20
25
30
35
40
45
Log
In
ten
sity
Time ms
H1
H8H11
H9H10
CH2
H1rsquo
H6rsquo
CH2
H910H811 H1CH2
H1rsquo H5rsquo6rsquo
0 1000 2000 3000 4000 5000 6000 7000 8000
00
05
10
15
20
25
30
35
40
45
Log
In
ten
sity
Time ms
OH
0 1000 2000 3000 4000 5000 6000 7000 8000
00
05
10
15
20
25
30
35
40
45 T= 110degC
T= 90degC
T= 80degC
T= 70degC
Log
In
ten
sity
Time ms
Fit
)
CH2 H910 H811 H1 H56 H1 OH
00
05
10
15
20
25
30
35
40
T2 m
s
T= 110degC
T= 90degC
T= 80degC
T= 70degC
CH2 H910 H811 H1
0
2
4
6
8
10
12
T2 m
s
T= 110degC
T= 90degC
T= 80degC
T= 70degC
Short T2(1H) Long T2(1H)
a) b)
c)
11
Table S 1 ndash 1H chemical shifts of G-C181-OH in solution and in the solid-state Solid-state spectra are 988
recorded at a MAS frequency of 10 kHz in DMSO-d6 broad peak 989
990
δH ppm
Group Ndeg Liquid
(MeOD-d4) Solid
(T= 110degC) Solid
(T= 70degC)
CH2 H1 354 357
CH2 H2 153 156
CH2 H3-712-14 132 135
CH2 H811 203 203
CH H910 534 534
CH2 H15 162 164
CH2 H16 388 383
CH H1 424 432
CH H2 316 335
CH H3 334 335
CH H4 329 335
CH H5 354 351 357
CH2 H6 366 383
OH OH1 432
45 463
OH OH2 492
OH OH3 490
OH OH4 487
OH OH6 445
991
992
H1H9H10H1rsquo
H6rsquo
OH2rsquo
OH1
12
Detailed discussion about the NOESY and DQ-SQ 2D 1H-1H ssNMR experiments presented in 993
Figure 9 994
995
2D 1H-1H ssNMR experiments are a unique tool to explore through-space proximities 996
between 1H nuclei ssNMR offers a large number of possibilities each adapted to a given 997
system The advantage of 2D maps with respect to a dynamics approach is their direct 998
readability in clear two nuclei which exchange their magnetization through-space (whichever 999
mechanism may be responsible for this exchange) will display a specific cross-peak However 1000
the way cross-peaks are presented and interpreted strictly depends on the nature of the pulse 1001
program which in turn is chosen according to the physical nature of the sample 1002
1D temperature-dependent 1H NMR experiments performed on G-C181-OH (Figure 1003
4a in the main text) indicate sharp peaks at 90degC and broad peaks at 70degC Narrow peaks 1004
indicate fast andor large-amplitude molecular tumbling averaging the strong 1H-1H dipolar 1005
interactions This excludes the use of pulse sequences like DQ-SQ which is not efficient under 1006
these conditions For this reason we employ spin-diffusion-based pulse sequences like 1007
NOESY which is more adapted for samples with high molecular mobility When mixing times 1008
are chosen to be short (lt 1 s) one generally explores through-space proximities within about 5 1009
10 Aring On the contrary when molecular motions are restricted dipolar coupling becomes 1010
significant 1H NMR peaks are broader and pulse sequences like DQ-SQ can now be used 1011
with a spatial resolution of less than 5 Aring 1012
Whenever possible DQ-SQ experiments are preferred over spin diffusion-based pulse 1013
sequences because they are more selective in particular for likewise interactions which are 1014
not discriminated in NOESY-type experiments This is illustrated by the typical interaction 1015
schemes for NOESY (top Figure 9a) and DQ-SQ (top Figure 9b) For two given A and B 1016
protons 2D NOESY maps will display two on-diagonal and two square-shaped symmetrical 1017
off-diagonal cross-peaks Off-diagonal cross-peaks illustrate the mutual A-B and B-A 1018
interaction but the on-diagonal peaks are systematic and do not prove any A-A or B-B 1019
interaction Similarly to NOESY 2D DQ-SQ maps display off-diagonal peaks (symmetric 1020
across the diagonal top Figure 9b) upon A-B and B-A interaction but in contrast they will 1021
display on-diagonal peaks only in the presence of self-interaction In the tutorial example of 1022
Figure 9b top the on-diagonal A-A peak indicates mutual A-A interaction while lack of on-1023
diagonal B-B peak evidences the absence of B-B proximities Combining NOESY and DQ-SQ 1024
experiments is capital to study the local arrangement of G-C181-OH and its evolution with 1025
temperature 1026
13
At T= 90degC the H1 and H5rsquo contributions are very close but possible to discriminate 1027
them (δ(H1)= 354 ppm δ(H5rsquo)= 351 ppm) according to 1H NMR chemical shifts in Table S 1028
1 2D 1H-1H NOESY in Figure 9a also discriminates between the two components attributed 1029
on the basis of the interactions with their mutual neighbors (green H1-H2 and H5rsquo-H1rsquo squares 1030
in Figure 9a) On this basis 2D NOESY does not show a direct H1rsquo-H1 correlation (blue red-1031
crossed) but rather an extensive network of intra-sugar interactions These features exclude 1032
suggest intra- and inter-sugar interactions and they exclude head-tail arrangements as a major 1033
molecular configuration at 90degC 1034
At 70degC the 1H NMR peaks are broader indicating a reduction of the T2 (1H) relaxation 1035
times andor residual homonuclear dipolar interactions excluding the use of NOESY In this 1036
case 1H-1H DQ-SQ correlation experiments are best suited Figure 9b presents the 1H-1H DQ-1037
SQ experiment on G-C181-OH at 70degC Peaks are broader than in NOESY and attribution may 1038
be cumbersome However the experiment is performed at 700 MHz and MAS= 22 kHz which 1039
improves spectral resolution with respect to the same experiment performed at 300 MHz and 1040
MAS= 10 kHz The auto-peak at δH= 356 ppm in the SQ dimension is attributed to H1-H1 spin 1041
pairs mainly resulting from intra CH2 interaction while the DQ cross-peaks at δH= 156-356 1042
ppm and δH= 432-356 ppm respectively origin from H2-H1 and H1rsquo-H1 interactions (Figure 1043
9b) DQ-SQ map does not show any auto-peak corresponding to H1rsquo-H1rsquo or Hxrsquo-Hxrsquo (x= 2rsquo 1044
3rsquo 4rsquo) interactions (red-crossed blue Figure 9b) thus excluding any proximity (lt 5 Aring) between 1045
close glucose neighbors On the contrary DQ-SQ maps (recorded both at 700 MHz Figure 9b 1046
or at 300 MHz not shown) systematically show DQ cross-peaks which can only be attributed 1047
to H1rsquo-H1 interactions (δH= 432-356) The presence of these H1rsquo-H1 interactions can only be 1048
explained by a head-tail arrangement of the G-C181-OH molecules as illustrated below the 1049
DQ-SQ map in Figure 9b 1050

12
vesicles while arrow Ndeg6 points at two vesicles fusing into the flat membrane Additional areas 302
where vesicle fusion is prominent are indicated by the oscillations at the outer skirt of broad 303
lamellae and pointed by arrow Ndeg7 304
Finally below Tm1 at T= 25degC for instance mainly flat crystals with no visible 305
exvaginations or tubes are visible (Figure S 5) by cryo-TEM and the material turns into an 306
insoluble precipitate Massive presence of flat crystalline structures is also clear from the bulk 307
iridescent behavior of a G-C181-OH solution under manual shear 308
In summary despite the uncertainty related to the actual state of equilibrium of the 309
glucolipids at the moment of cryofixation cryo-TEM depicts a vesicle phase at Tgt 100degC a 310
flat lamellar phase below Tm1 and an interconnected vesicle-nanotube network between Tm1 and 311
about 100degC The combination of statistically-relevant fluorescence microscopy and 312
scatteringdiffraction experiments provides an additional proof of the coexistence of 313
vesiclenanotube systems between the two transition temperatures Please note that the 314
experiments reported below have been performed under controlled conditions of temperature 315
which is then indicated by the use of T instead of T 316
13
317
Figure 5 ndash a-c) Confocal fluorescence microscopy images recorded at 90degC and 70degC for a 5 mgmL G-318
C181-OH aqueous solution d-g) Typical fluorescence microscopy images recorded at T= 80degC using 319
Laurdan (refer to materials and methods section for more details on this fluorophore) Excitation 320
wavelength is 405 nm for all the images while emission wavelength is 490 nm in (df) and 440 nm in (eg) 321
h) Full emission spectra obtained from the integration of various fluorescence images recorded from 412 322
nm to 600 nm (step 5 nm) at 90degC 80degC and 70degC i) Box plot of GP defined as 119918119927 =(120640120786120786120782minus120640120786120791120782)
120640120786120786120782+120640120786120791120782 with 120640120786120786120782 323
and 120640120786120791120782 being the emission wavelengths at 440 nm and 490 nm at 90degC 80degC and 70degC Each data point 324
l= 490 nm l= 440 nm
l= 490 nm l= 440 nm
10 μm400 450 500 550 600
00
02
04
06
08
10
No
rma
lize
d I
nte
nsity
l nm
90degC
80degC
80degC
70degC
70degC
400 450 500 550 60000
02
04
06
08
10
No
rma
lize
d I
nte
nsity
l nm
90degC
80degC
80degC
70degC
70degC
d) e)
f) g)
h)
i)
T= 80degC
Laurdan
T= 80degC
T= 80degC T= 80degC
T= 90degC T= 70degC T= 70degC
a) b) c)
1
1
1
14
corresponds to a set of regions of interest (ROIs) (54 at 90degC 65 at 80degC and 75 at 70degC) selected in the 325
corresponding fluorescence images ROIs were representatively selected so to include the entire image but 326
also vesicles alone tubes alone and mixtures of vesicles and tubes 327
328
Figure 5ab shows two typical confocal fluorescence microscopy images recorded on a 329
G-C181-OH solution (5 mgmL) in a flame-sealed capillary heat at T= 90degC and T= 70degC 330
Although the resolution of optical microscopy is not comparable with cryo-TEM the sample is 331
broadly composed of vesicles coexisting with nanotubes whereas in some cases the nanotube 332
starts from the vesicle itself (arrow Ndeg1) in good agreement with cryo-TEM data Furthermore 333
SANS recorded at T= 90degC (Figure S 6a) shows a scattering profile with a pronounced -2 334
dependence of the scattering intensity against the wavevector q in the log-log scale This 335
indicates the massive presence of a flat interface and it is expected typical of bilayers in 336
vesicular morphologies56 However the typical signature of nanotubes cannot be observed in 337
the SANS profile and this can be explained by both an argument related to the relative lower 338
amount of nanotubes with respect to vesicles at 90degC but also to the steeper slope of flat 339
morphologies (-2) compared to tubes (-1) the signal of the former masking the tube signal at 340
low wavevector values The SANS profile is characterized by a diffraction peak at q= 0167 Aring-341
1 of which the assignment is refined by WAXS data 342
Temperature-driven WAXS experiments in Figure S 6bc (5 mgmL-1 and 25 mgmL-1 343
respectively) show a lamellar order possibly attributed to a multilamellar structure of the 344
vesicles (dv Figure S 6d) at high temperature and to the interplanar arrangement of the 345
crystalline flat structures (dL Figure S 6d) at T= 25degC The sharp (001) reflection indicates 346
typical interlamellar distance of 353 Aring at 25degC although this value varies with temperature 347
(400 Aring at 111degC 372 Aring at 88degC) thus confirming its assignment to a hydration-dependent 348
interlamellar order More intriguing is the second broader peak at q= 0403 Aring-1 (d= 156 Aring) 349
and its reflection both clearly visible at 88degC below Tm2 We attribute it to the inter-glucolipid 350
arrangement inside the tubular phase (dt Figure S 6d) coexisting with the vesicle phase 351
between Tm1 and Tm2 and to the planar lipid arrangement (di Figure S 6d) in the rigid flat 352
lamellar structure below Tm2 Its temperature- hence hydration- independent position also 353
confirms its structural origin Finally besides the water-structure peak at about 2 Aring-1 we also 354
observe a broad peak at 144 Aring-1 characteristics of the lateral packing (d Figure S 6d) of lipids 355
in bilayers While its position could be consistent with an Lα phase5758 above Tm2 its broadness 356
and positional invariance as well as the coexistence between vesicles and tubes do not allow a 357
precise assignment 358
15
Does G-C181-OH assume a bilayer or interdigitated structure the latter being the one 359
found for other similar bolaform glucolipids4243 The size of G-C181-OH can be estimated to 360
be at the most 32 Aring given by the length L of the C16 tail (L = 22 Aring from the Tanford formula 361
L= 154 + 1265 times n (n= 16)59) and the sugar (about 10 Aring)4243 However the cis conformation 362
of the C=C bond imposes a ldquokinkrdquo of 60deg in the aliphatic chain which reduces the effective 363
length of the oleic backbone to about 17 Aring for an effective total G-C181-OH length of about 364
27 Aring Cryo-TEM provides a tube thickness varying from 35 Aring to 60 Aring and a vesicle membrane 365
thickness of at least 60 Aring WAXS suggests an interlamellar thickness (membrane and water) 366
between 40 Aring and 37 Aring and an inter-lipid distance in the tube of about 16 Aring In the absence of 367
a clear form factor oscillation profile as found for similar glucolipids4243 one must 368
acknowledge that these data pledge neither in favor of fully interdigitated nor a double layer 369
structure and might suggest a tilted lipid arrangement with partial interdigitation60 370
371
13C ssNMR demonstrates that G-C181-OH can assume two coexisting head-head and 372
head-tail configurations 373
Vesicles are characterized by low positive mean and gaussian curvatures while 374
nanotubes are described by a combination of a high positive mean and zero gaussian curvatures 375
In this regard the coexistence of vesicles and nanotubes requires glucolipids to adapt 376
themselves to both environments at the same time For this reason the formation of nanotube-377
vesicle networks generally requires a specific driving force able to impose a high mean and 378
zero gaussian curvature to the membrane In many systems insertion of at least a second 379
constituent (lipid surfactant protein) in the membrane becomes a necessary internal driving 380
force for the nucleation and growth of so-called membrane inclusions from which 381
topologically-connected nanotubes can form10ndash123261 as explained by orientational ordering 382
arguments62 It has also been shown that external driving forces such as use of laser 383
ldquotweezersrdquo30 osmotic pressure6 electroformation5ndash82829 or controlled suction13ndash16 are 384
otherwise necessary as also supported by theoretical studies19 385
The bending energy of tubes is higher than that of a vesicle membrane8 due to the 386
dependence of the membrane free energy from the principal curvatures For this reason 387
isotropic (rotational symmetry along the main axis) but also anisotropic33 lipids generally 388
stabilize low-curvature shapes like flat membranes or vesicles Lipid nanotubes are also a 389
common phase formed by amphiphiles but generally for lipids with a certain complexity in 390
their molecular structures as exampled by diacetylenic derivatives of phospholipids among 391
others262763ndash65 Negative contributions to the bending energy favoring the simultaneous 392
16
presence of interconnected vesicles and tubes was shown to be driven by the presence of 393
anisotropic lipids in a membrane continuum Spontaneous deviations to the elastic theory in the 394
presence of surfactants lipids and proteins with anisotropic structures favor the formation of 395
protrusions with radius of the order of the fraction of a micron9ndash1219ndash2362 396
In the absence of both internal and external driving forces mentioned above G-C181-397
OH should behave as a standard lipid Its DSC profile (Figure 2)536667 under both hydrated and 398
dry conditions identifies a hydration-independent transition (Tm1) slightly above room 399
temperature this is followed by one main transition at higher temperature (Tm2) in the dry 400
sample50 For such a profile one expects a gel phase (Lβ) below Tm1 and a liquid crystalline 401
structure possibly in the morphology of vesicles (L4 phase) possibly above Tm1 and most likely 402
above Tm231 as experimentally found On the basis of the thermogram recorded on the dry 403
powder one may also expect a ldquoripplerdquo (Pβ) phase between Tm1 and Tm2 characterized by 404
periodic undulations of the bilayer (generally addressed to as regions with both liquid order and 405
disorder)5455 406
In the present work instead of a Lβ phase we observe flat crystals below Tm1 and a 407
vesicle-nanotube network instead of the ldquoripplerdquo phase The latter is particularly unexpected 408
because the membrane is composed of a single-component (G-C181-OH) and no anisotropic 409
external force (osmotic hydrodynamic electric) is used to pull and stabilize the tubes In 410
addition the nanotubes are observed at fairly high temperatures above Tm1 (between about 411
60degC and 90degC) while this morphology is generally favored at low temperature (proportionality 412
with 1kT figure 5 in Ref 62) commonly below a given transition temperature characteristics 413
for each specific amphiphile27 Furthermore nanotubes of G-C181-OH seem to be stable in 414
time thus differing from what is found in electroformed vesicles78 They are also observed 415
away from phase transition events (may them be at Tm1 or Tm2) as otherwise reported before 416
for a diacetylenic derivative of phosphatidylcholine26 and many other systems27 417
A stable nanotube-vesicle network for a single-component phospholipid in the absence 418
of external driving forces is not expected and has never been reported before It could be 419
explained by the coexistence of two micro-separated phases of different rigidity This 420
hypothesis is excluded by confocal microscopy on Laurdan-labelled membranes and magic 421
angle spinning (MAS) solid-state NMR (ssNMR) experiments 422
Laurdan is a well-known fluorophore used to put in evidence the coexistence of rigid 423
and fluid domains in both model and biological membranes47ndash49 Laurdan was used here to label 424
the G-C181-OH membranes between Tm1 and Tm2 and to verify the possible micro-segregation 425
and coexistence of rigid (eg Lβ λem= 440 nm) and fluid (eg Lα λem= 490 nm) domains in 426
17
tubes and vesicles respectively A set of quantitative experiments performed on a 5 mgmL-1 427
solution summarized in Figure 5 shows an excess of fluorescence at only λem= 490 nm for 428
temperature between 90degC and 70degC (Figure 5h) The GP value which quantifies the rigidfluid 429
character of the membrane is systematically negative (Figure 5i) indicating an overall fluid 430
membrane at all temperatures GP is quantified on more than 50 regions of interest (ROIs) at 431
each temperature including vesicles and tubes alone as well as connected nanotube-vesicles 432
(Figure 5d-g) The dispersion of GP at 80degC and 70degC between -08 and -02 could suggest the 433
spurious presence of membranes with various degrees of flexibility although fluidity is always 434
predominant The combination of WAXS (broad peak d= 144 Aring-1 invariant with 435
temperature Figure S 6bc) and confocal fluorescence microscopy using Laurdan confirms the 436
single-phase of the membrane composed of G-C181-OH both in vesicles and nanotubes This 437
is also consistent with the lack of phase transitions in DSC experiments between ~85degC and 438
~60degC especially in hydrated samples We conclude that the vesicle-nanotube transition is not 439
driven by the local segregation of gel phase (Lβ) microdomains nor that the nanotubes are 440
composed of such phase 441
ssNMR is the best-suited approach to investigate the origin of the local driving force for 442
the nucleation of anisotropic inclusions of which the average orientation depends on the local 443
membrane and inclusion curvatures and was shown to promote tubing62 ssNMR can provide 444
information on the local molecular mobility eg through the nuclear spin relaxation behavior 445
but also on intermolecular interactions and stereochemistry eg through variations in the 446
chemical shift68ndash70 447
Ideally ssNMR should be performed on diluted G-C181-OH samples above Tm1 448
However fast MAS necessary for high resolution centrifuges the sample As a first 449
approximation hydrated G-C181-OH samples for instance at 50 wt as classically done for 450
phospholipids71 could be studied Unfortunately permeability of the sample holder combined 451
to heating (close to the boiling point of water) and MAS provoke dehydration and even sample 452
ejection After experiencing both of the above this approach was abandoned As a second 453
approximation the study of the dehydrated G-C181-OH powder avoids centrifugation and 454
evaporation If studying dried lipids may not reflect their exact behaviour under diluted 455
conditions valuable structural information can still be obtained in dehydrated molecular 456
systems like proteins thus illustrating that this approach is not unreasonable Furthermore if 457
DSC (Figure 2a) shows that hydration suppresses the Tm2 it also shows that the value of Tm1 is 458
not affected by water at concentrations as low as 10 wt For this reason performing a 459
structural analysis of dehydrated G-C181-OH by ssNMR above Tm1 may help understanding 460
18
the local arrangement of G-C181-OH in two morphologies vesicles and nanotubes having 461
sensibly different curvatures 462
To explore the local mobility of the most relevant chemical groups of G-C181-OH 463
above Tm2 (T= 110degC) and between Tm2 and Tm1 (70 lt T degC lt 90) we combine a series of 1H 464
and 13C experiments Single-pulse (SP) MAS experiments (1H and 13C) when recorded under 465
quantitative conditions allow the detection of all chemical species while cross-polarization 466
(CP) MAS (13C only) experiments are sensitive only to constrained groups for which the 1H-467
13C dipolar coupling is not averaged to zero by the molecular motions 468
469
Figure 6 ndash a) 1H MAS (10 kHz) ssNMR spectra recorded from 110degC to 70degC b) 13C MAS (10 kHz) ssNMR 470
spectra recorded using high power decoupling single pulse (SP) and cross-polarization (CP) pulse sequences 471
Contact time for CP experiments and corresponding temperatures are given on each spectrum Full spectra 472
are given in Figure S 7 473
The most relevant 1H and 13C spectra are given in Figure 6 (full range in Figure 7 and 474
Figure S 7) As expected the 1H solid-state SPMAS spectra show broader peaks compared to 475
the solution-state NMR spectrum (Figure 6a) reflecting the obvious solid-state character of the 476
sample at any temperature The sugar group and the C=C bond resonate in the 25-6 ppm range 477
and 535 ppm respectively while the OH groups of the sugar moiety are found below 45 ppm 478
(Figure 6a full assignment in Table S 1) Very broad (~1 ppm) at 100degC the position of the 479
OH peak varies with the temperature value and becomes narrower (lt~05 ppm) and visible at 480
δH= 464 ppm at T= 70degC Line narrowing and chemical shift variations of the OH resonance 481
in ssNMR is always a direct sign of H-bonding interactions whereas the strength of the H-482
bonding hence its OHhellipH distance is correlated to a dispersion in chemical shifts72ndash75 All other 483
60 55 50 45 40 35 30 25
ppm
110
90
80
70
910
1rsquo
6rsquo16
1
OH
134 132 130 128 126
ppm110 108 106 104 102 100
ppm
SP (T= 110degC)
SP (T= 70degC)
CP 50 ms (T= 70degC)
CP 3 ms (T= 70degC)
910 1rsquo
1H 13C
1
811
910
CH2 CH2
1rsquo
6rsquo
a) b)
C102
13024
C9101
13003
C92
12869 C1rsquo210382
C1rsquo110443
C1rsquo13035
2rsquo3rsquo4rsquo
T degC
5rsquo
19
resonances broaden from 110degC to 70degC thus indicating slower andor more anisotropic 484
reorientational motions of all chemical groups The specific dynamic behaviour of the sugar 485
headgroup is also reflected by its 1H transverse relaxation time T2 whereas the shorter the T2 486
the higher the rigidity Experiments performed between 110degC and 70degC shown and 487
commented in Figure S 8 in the Supporting Information globally show a single short (lt 1 ms 488
below 100degC) T2 relaxation component for H1rsquo H5rsquo and H6rsquo and two both short and long 489
(between 4 ms and 12 ms) T2 for the acyl chain (CH2 H910 H811) even below 100degC 490
At 110degC 13C SPMAS experiments (Figure 6b full range in Figure 7 and Figure S 7 491
assignments in Table 1) show a single peak at δC= 10335 ppm for C1rsquo and at δC= 13003 ppm 492
for C910 as expected for a symmetrical conformation with two chemically-equivalent 493
carbons76 At 70degC the C1rsquo peak disappears while C910 now shows two peaks around 128 494
ppm and 130 ppm (Table 1 full temperature series in Figure S 7b) attributed to C92 (δC= 12869 495
ppm) and C10 in a non-symmetric configuration respectively for which these two carbons are 496
chemically inequivalent76 More precisely the resonance at 130 ppm is actually the 497
superposition of two close resonances C9101 (δC= 13003 ppm) and C102 (δC= 13024 ppm) 498
where subscripts 1 and 2 stand for two different conformations of the cis-olefin group as 499
reported for various phases of oleic acid in the vicinity of 0degC76 500
501
Table 1 ndash 13C Chemical shifts of G-C181-OH in solution and solid-state Solid-state experiments are 502
recorded at MAS= 10 kHz All spectra are reported in Figure 7 and Figure S 7 The contact time for cross 503
polarization is 3 ms In all ssNMR experiments temperature is first raised at 110degC and then lowered to 504
either 90degC or 70degC Attribution of the 13C resonances in Table 1 is performed on the basis of the solution 505
spectrum (Figure S 1b) Additional peaks observed in both single pulse and cross polarization ssNMR 506
experiments are attributed when possible to a configuration effect of the given atom eg C9101 and C92 507
indicate two configurations of C9 All new peaks observed in solid-state and not detected in solution are 508
highlighted in red for convenience 509
510
511
δ ppm
Peak Liquid (DMSO-d6)
Solid Single Pulse
T= 110degC
Solid Single Pulse
T= 90degC
Solid Single Pulse
T= 70degC
Solid Cross Polarization
T= 70degC
C102
- - 13024 13024
C910C9101 13009 13003 13003 13003 13003
C1C9C10C1rsquo
C6rsquo
20
C92 - - - 12869 12869
C1rsquoC11 10329 10335 10335 - 10443
C12 - - - - 10382
C3 7724 7709 7702 - 7829
- 7634 7629 - 7621
7525
C2 7388 7398 7390 7370 7370
C4 7052 7077 7054 7041 7098
C16 6900 7016 - - 7029
- - - - 6793
C1C5C6 6153 6241 6236 6239 6262
C1C5C6 6117 - - - 5956
C2 3300 3290 3290 3283 3279
CH2(trans) - - - 3198 3196
CH2(gauche)C15 2941 2981 2987 3004 -
C811 2706 2747 2747 2832 2817
CH2 2597 2625 2628 2630 2817
512
13C CPMAS spectra at 70degC (Figure 6b full range in Figure 7 and Figure S 7d) at 513
increasing contact times confirm the presence of two cis-olefin environments one for which 514
C910 are equivalent labelled here C9101 and one for which they are inequivalent labelled 515
C92 C102 Both environments are rigid enough to be observed at short contact time (tc= 50 μs) 516
A similar double environment is also observed for the sugar C1rsquo CPMAS at 70degC shows two 517
peaks (C1rsquo1 at δC= 10443 ppm C1rsquo2 at δC= 10382 ppm Figure 6b Figure S 7d) These are 518
significantly shifted downfield from the C1rsquo peak observed at 110degC and are detected at contact 519
times as short as 50 μs thus indicating their rigid character One also finds that CPMAS is 520
totally inefficient at 100degC for short contact times (50 μs) and poorly efficient even at 3 ms 521
typical of fast-tumbling molecules (Figure S 7c) also both gauche (δC= 3004 ppm) and all-522
trans (δC= 3198 ppm) conformations of the CH2 carbons coexist at 70degC (Figure S 7b)77 523
According to ssNMR one main mobile molecular environment exists at 110degC as 524
shown by the well-resolved 1H spectrum single C=C (C9101) and anomeric (C1rsquo) resonances 525
gauche conformation of the aliphatic CH2 and single T2 of the aliphatic CH2 chain and sugar 526
protons The sugar group is certainly mobile (inefficient 1H13C CPMAS) but still more 527
constrainted than the acyl chain (shorter T2 (1H)) As the temperature is lowered the overall 528
rigidity increases (broadening of 1H NMR peaks faster 1H transverse relaxation and efficient 529
1H13C magnetization transfer during CPMAS) presumably driven by H-bonding 530
interactions (downfield shift and line narrowing of the OH 1H signal very short OH T2 loss of 531
the C1rsquo signal in SPMAS) At the same time a number of spectroscopic data (two concomitant 532
21
resonances for anomeric C1rsquo1 and C1rsquo2 cis-olefin C9101 and C92 C102 and CH2 gauche and 533
all-trans environments) and relaxation behaviour (fast and slow T2 relaxation components) 534
strongly suggests the coexistence of two molecular environments Further proofs of the 535
coexistence of two distinct molecular domains are given by a number of chemical shift 536
variations in the 13C CPMAS spectrum at 70degC compared to the one at 110degC 90degC and 537
solution This is shown in Figure 7 and in the list of 13C chemical shifts in Table 1 538
539
540
Figure 7 - Comparison between solution- and solid-state 13C NMR spectra of G-C181-OH Solid-state 541
experiments are recorded directly on the sample powder at a MAS of 10 kHz (4 mm zirconia rotor) SP 542
Single Pulse CP Cross Polarization In all the ssNMR experiments temperature is first raised at 110degC 543
and then lowered to either 90degC or 70degC Segmented lines are meant to highlight the known peak position 544
in solution thus stressing the strong chemical shift variations in the solid-state 545
546
NMR experiments above Tm2 suggest that vesicles could contain G-C181-OH with a 547
single family of mobile conformations characterized by chemically-equivalent C=C (red 548
Figure 8b) and a single C1rsquo conformation (green Figure 8b) Experiments between Tm1 and Tm2 549
otherwise suggest that two coexisting conformations characterized by chemically-equivalent 550
(red Figure 8b) and inequivalent (magenta Figure 8b) C=C could be associated to nanotubes 551
Two distinct C1rsquo sites (grey Figure 8b) also indicate two configurations of the sugar headgroup 552
A comment on this point will be given in the following paragraphs 553
The local (Aring-scale) variation of molecular mobility below Tm2 drives the coexistence of 554
two distinct molecular environments of the same G-C181-OH molecule This occurs within a 555
single-phase domain (as deduced by WAXS) of equivalent membrane rigidity (as derived from 556
Laurdan probe in confocal microscopy) Although never reported before the difference in the 557
local mobility of the same amphiphile (here G-C181-OH) could satisfy the theoretically-558
140 120 100 80 60 40 20
CP(3 ms)-70degC
SP-70degC
SP-90degC
SP-110degC
ppm
LiquidC910
C1rsquo
C2rsquo
C4rsquo
C3rsquo
C1
C6rsquoC5rsquo
C1
6
C8
11
C2 C
H2
C1
5
CH
2
DM
SO
13C
22
required conditions that induce local lipid segregation and formation of membrane inclusions 559
(Figure 8c) In case of their non-zero average orientation the local membrane curvature 560
increases62 and nanotubes can spontaneously form (Figure 8bc) More intriguing this 561
mechanism occurs at least 10degC above Tm1 although it should not be favored above the Tm27 562
From both experimental and theoretical backgrounds the conditions of topologically-563
connected vesicles-nanotubes systems are met only when either internal (two components) or 564
external driving forces are applied19 In the present single-lipid system of which the phase 565
behavior is summarized in Figure 8a the most plausible driving force could be explained by 566
the NMR results collected on the dry sample G-C181-OH concomitantly occupies two 567
molecular environments characterized by 1) two distinct conformations of the sugar 568
displaying equivalent mobility and 2) two conformations of the acyl chain unsaturation 569
570
23
571
Figure 8 ndash a) Thermotropic phase behavior of G-C181-OH at 5 mgmL-1 Note that Tm2 is observed on the 572
dry powder only b) Possible relationship between the molecular environment as derived from NMR and 573
membrane curvatures All the molecular drawings refer to the same G-C181-OH molecule (bulky ellipsoid 574
equiv sugar headgroup) while each color corresponds to a given configuration Grey of C1rsquo1 and C1rsquo2 indicates 575
the uncertainty about the assignment of the specific NMR peak The curvature C is defined as 1R R being 576
the curvature radius R1 R2 radius of curvature CG Gauss curvature CM Mean curvature c) Free 577
interpretation of the anisotropic high-curvature (CMgt 0 CG= 0) inclusions in the membrane (low CM and 578
CG) continuum driven by inter-sugar H-bonding and reduced intramembrane diffusion for a G-C181-OH 579
glucolipid 580
581
Flat crystalline structure
Nanotube-vesicle network
Vesicles
48degC
120deg
106 105 104 103 102 101
ppm
H9 H10H1rsquo
106 105 104 103 102 101
ppm106 105 104 103 102 101
ppm106 105 104 103 102 101
ppm
C=CC=C
C1rsquo1C1rsquo2
C1rsquo
Tm2(96degC)Tm1
a)
b)
c)
Same molecule different local orientations and sugar conformations
High curvature membrane
Low curvature inclusion
Flip-FlopStrong H-bonding
CG
CM ( + )
CG 0
CM 0 CG 0
CM 0
G-C181-OH
24
Two related questions are unanswered at the moment What actually drives nanotube 582
formation and is the organization of G-C181-OH within the vesicles and tubes the same Lipid 583
nanotubes have been studied for at least three decades over which broad experimental and 584
theoretical insight has been generated Despite this fact the actual understanding is still matter 585
of debate27 Micelle-to-nanotube and vesicle-to-nanotube phase transitions are generally 586
reported for single amphiphiles below a given Tm and intermediate phase composed of twisted 587
and flat fibers is concomitantly reported Initially thought to be a chirality-driven phenomenon 588
recent studies propose a more general mechanism involving crystallization and symmetry 589
breaking in the lipid packing driven by optimal packing27 If twisted ribbons were observed 590
before for a number of microbial glycolipid bolaamphiphiles44 they are not found for G-C181-591
OH This fact as well as the large body of cryo-TEM images and the observation of nanotubes 592
above Tm1 rather pledge in favour of a direct topological change from positive (vesicles) to 593
zero (nanotubes) Gaussian curvatures In this case vesicle-to-nanotube transitions could be 594
driven by external forces56307813ndash162829 595
Considering the absence of external forces in the present system there are only two 596
possibilities left spontaneous budding of the membrane or nanotube pulling after inter-vesicle 597
collisions due to Brownian motion Both are possible as inclusions composed of a different 598
arrangement of the same molecule in the membrane continuum can theoretically explain 599
spontaneous nanotube formation in an isotropic medium672223629ndash1218ndash21 However the second 600
one is probably more likely to prevail because it could explain the large number of nanotubes 601
connecting two distant vesicles Interestingly similar events occur for any phospholipid-based 602
vesicular solution but nanotubes are extremely rare unless at least two lipids of different 603
molecular structure are mixed together The spectroscopic 1H and 13C and relaxation (1H) 604
ssNMR data even if collected on a dry powder demonstrate that the coexistence of two G-605
C181-OH configurations involving both the sugar headgroup and fatty alcohol chain are 606
possible for this molecule As a matter of fact this is not so surprising as more than one energy 607
minima each corresponding to a given conformation are known for glucose its non-reducing 608
derivative methylglucose and carbohydrates in general78ndash80 609
The presence of two configurations could explain the coexistence between two 610
structures of different curvature but the data presented so far do not explain the origin of these 611
two configurations In other words what drives the change in the local structure of the sugar 612
headgroup and fatty alcohol within the membrane 613
The association of known self-assembled structures to spectroscopic 13C ssNMR data is 614
known for years in particular for gluconamides lipids having a linear sugar headgroup81ndash84 It 615
25
was found that gauche effects in some cases up to the γ position in the sugar chain induce 616
upfield chemical shifts while anti and trans conformations result in downfield shifts Each 617
structure (monolayer crystal bilayer crystal or micellar fiber) was then characterized by a given 618
organization of the gluconamide and a characteristic 13C ssNMR fingerprint which could be 619
explained by gauche γ-gauche anti and trans conformations of the headgroup Similar 620
structural-spectroscopic correlations have been collected over the years for much simpler cyclic 621
sugars85 whereas pyranoses can undergo important conformational changes (chair half-chair 622
boat skew) when the appropriate energy barriers are crossed78ndash8086 A quantitative 623
conformational study based on the 13C chemical shift variations shown in Table 1 would be 624
certainly helpful but very delicate in the context of the present state of the art because a 625
rigorous approach requires at least one known crystal structure8182 which is currently missing 626
for this compound A qualitative approach will then be adopted 627
G-C181-OH is a bolaform amphiphile and flip-flop could be a possible mechanism 628
involved in the nanotube stabilization whereas head-tail interactions have long been considered 629
as important in nanotube-forming bolaform amphiphiles6063 From mere considerations based 630
on T2 (1H) relaxation arguments one could exclude head-tail configurations if the R-CH2OH 631
endgroup (H1) was involved in a direct interaction with the sugar group its corresponding T2 632
would probably be comparable to the sugarrsquos one (OH and H1rsquo) but this does not seem to be 633
the case However this hypothesis would be based on the comparison of the relaxation from 634
CH and CH2 protons additionally involved in different kind of motions Besides the relaxation 635
of H1 is influenced by the strong overlap between H1 and H5rsquo For these reasons relaxation 636
arguments are not solid enough and will not be used 637
We then address this question by exploring intermolecular interactions in a direct 638
manner using 2D 1H-1H homonuclear ssNMR correlation spectroscopy At 90degC in the fast-639
tumbling domain of molecular motion (narrow 1H NMR peaks Figure 6a) and corresponding 640
to the vesicle-rich region spin diffusion (NOESY) experiments are preferred over dipolar 641
coupling based experiments because such interaction is averaged out by molecular motion 642
However when the molecular motion is more constrained in the domain of nanotube stability 643
at 70degC (broad 1H spectra Figure 6a) Double-Quantum Single-Quantum (DQ-SQ) correlation 644
experiments are best suited to probe interaction between close molecular neighbors These 645
experiments are reported in Figure 9 and the related interpretation is only briefly reported 646
below while a more detailed discussion can be found on Page 12 in the Supporting Information 647
26
648
Figure 9 ndash a) 2D 1H-1H NOESY NMR experiment performed at MAS= 10 kHz (4 mm probe) on a Bruker 649
300 MHz Avance III HD spectrometer using 300 ms of mixing time Sample temperature is regulated to 650
90degC reached by cooling from 110degC b) 2D 1H-1H DQ-SQ (BAck-to-BAck BABA pulse sequence used for 651
the DQ excitation scheme) NMR experiment performed at MAS= 22 kHz (25 mm probe) on a Bruker 700 652
MHz Avance III spectrometer using a DQ excitation time equal to 2 rotor periods Sample temperature is 653
regulated to 70degC reached by cooling from 110degC The typical schemes illustrating how to interpret these 654
2D experiments are reported above each experimental map Zooms of the sugar region and configurational 655
interpretation are given below each 2D map More information are given in the text below 656
H16-H16
H1-H1
H9-H10
H1rsquo-H1
H1rsquoH910 H16
H1
H1rsquo-H1rsquo
Hxrsquo-Hxrsquo
2
(pp
m)
(ppm)
315
811910 1rsquo
2rsquo2
3rsquo 4rsquo6rsquo
5rsquo
1rsquo2910
asymp asymp asympHDO MeOD Acetone
1
315
811 9101rsquo
2rsquo2
3rsquo4rsquo6rsquo
5rsquo
1rsquo2 9 10
asympasympasympHDOMeODAcetone
H1rsquo-H1
1rsquo
1
(p
pm
)
(ppm)
H1-H2
H1rsquo-H1
H1rsquo
H910
H1H5rsquo
H2
H1rsquo-H5rsquo
315
811910 1rsquo
2rsquo2
3rsquo 4rsquo6rsquo
5rsquo
1rsquo2910
asymp asymp asympHDO MeOD Acetone
1
H2rsquoH3rsquoH4rsquo
H2rsquoH3rsquoH4rsquo
X= 2rsquo3rsquo4rsquo
NOESY - T= 90degC
1H
1H
1H
1H
DQ-SQ - T= 70degC
a) b)
2
(pp
m)
(p
pm
)
(ppm)
A B
AhellipB
AhellipA
BhellipB
NOESY
(ppm)
A B
AhellipB
DQ-SQ
Single-quantum dimension
Do
ub
le-q
ua
ntu
m d
imen
sio
n
AhellipA
BhellipB
BhellipA
BhellipA
315
811910 1rsquo
2rsquo2
3rsquo 4rsquo6rsquo
5rsquo
1rsquo2910
asymp asymp asympHDO MeOD Acetone
1
lt 5 Aring
lt 5 Aring
H1-H2
H811
H15
H16
H6rsquo
H1rsquo
H1
H5rsquo
H2
H1-H2
H1rsquo-H1
H1rsquo-H5rsquo
H1rsquo
H1 H5rsquo
H1rsquo
H1
H5rsquo
H1H2rsquo H3rsquo H4rsquo
H1-H1
H1rsquo-H1
Hxrsquo-HxrsquoX= 2rsquo3rsquo4rsquo
H1-H2
H1rsquo
Zoom sugar region 28 ndash 45 ppmNOESY DQ-SQ
27
Head-tail or head-head configurations could be probed by the existence of H1rsquo-H1 657
interactions whereas H1 (δH= 356 ppm) is associated to the glucolipid tail and H1rsquo (δH= 432 658
ppm) to the sugar headgroup These atoms are more than 15 Aring apart and a direct interaction 659
could not be observed in both NOESY and DQ-SQ experiments NOESY experiments (Figure 660
9a) show that H1rsquo-H1 correlations are not observed Meanwhile clear-cut direct H1rsquo-H1 661
interactions are indeed observed are detected at T= 70degC (DQ cross-peaks related to H1rsquo-H1 662
correlation in DQ-SQ experiment shown in Figure 9b) Interestingly the absence of auto peaks 663
at δH= 432 ppm and δH= 335 ppm in the SQ dimension excludes H1rsquo-H1rsquo and Hxrsquo-Hxrsquo (x= 2 664
3 4) interactions respectively strengthening the idea that sugar headgroups from two nearest-665
neighbor G-C181-OH molecules are not adjacent in the nanotube-vesicle region 666
Homonuclear 2D ssNMR supports the idea according to which G-C181-OH can 667
undergo molecular flip-flops and a head-tail arrangement in the dry product Extrapolating these 668
conclusions in the lower concentration range lack of H1rsquo-H1 proximity at T= 90degC suggests a 669
head-head configuration in the vesicle-rich region and head-tail configuration within the 670
nanotubes It is however still unclear whether flip-flops are driven by spontaneous temperature-671
induced conformational changes in the glucolipid packing stimulating inclusions within the 672
membrane itself672223629ndash1218ndash21 or by defects generated by inter-vesicle collisions In fact a 673
combination of both is not unlikely Nanotubes are not stable when temperature is 20 to 30 674
degrees above Tm1 indicating that inter-vesicle collisions alone cannot explain the unusual 675
phenomenon In an energy landscape approach87 the head-head configuration is certainly 676
favored at high temperature while both head-head and head-tail configurations could be 677
favored in the mid-temperature region corresponding to the range between Tm1 and Tm2 in the 678
dry powder Both statistical and defect-induced flip-flop events contribute to form high mean 679
zero Gaussian curvature morphologies (nanotubes) for which the head-tail conformation 680
limiting the proximity between bulky sugar headgroups is probably more adapted (Figure 8c) 681
The flip-flop interpretation now reasonably explains the strong differences in the sugar and fatty 682
alcohol conformations deduced by the multiple NMR signals attributed to chemically-683
equivalent groups The existence of various low-energy conformations each having specific 684
NMR signature for sugars in solution78ndash8086 and solid-state81ndash84 further supports our 685
interpretation 686
One last point should be clarified Why between Tm1 and Tm2 are two molecular 687
environments able to coexist instead of a single one of average rigidity as found in the case of 688
ldquoripplerdquo phases50ndash54 We believe that this question can be answered based on the NMR results 689
the relatively short T2 values of the H1rsquo and OH protons shows the constrained mobility of the 690
28
sugar headgroup despite a certain flexibility of the chain (long T2 component) This trend may 691
suggest restrictions in translational mobility probably due to the sugar-OH hydrogen bonding 692
(Figure 8c) meaning that lipids are not able to diffuse within the membrane thus keeping two 693
different configurations stable 694
695
Conclusions 696
Topologically-connected nanotube-vesicle lipidic systems are commonly observed for 697
self-assembled membranes composed of at least two amphiphiles and spontaneously driven by 698
anisotropic inclusions andor by external directional forces This work shows that strong 699
differences in membrane curvature can spontaneously occur in single-lipid systems without 700
external anisotropic forces Coexistence and interconnection between nanotubes and vesicles 701
are evidenced via cryo-TEM and fluorescence confocal microscopy in a single-phase region at 702
temperature above a transition temperature Tm1= 483degC determined by DSC on the hydrated 703
sample but below the second transition temperature Tm2 (957degC) determined by DSC on the 704
dry powder X-ray diffraction (WAXS) also shows the coexistence of two lattice periods one 705
attributed to an inter-membrane repeating distance and the other possibly related to the intra-706
nanotube glucolipid arrangement Labelling the systems with Laurdan a fluorophore of which 707
the emission strongly varies with the local membrane rigidity excludes the presence of rigid 708
micro-separated phases (eg Lβ) 709
1H and 13C ssNMR despite the fact that it can only be performed on the dry powder 710
confirm the presence of one main fluid G-C181-OH environment above Tm2 Below Tm2 the 711
splitting of some 13C peaks and the coexistence of short and long 1H relaxation components 712
demonstrate that G-C181-OH can simultaneously pack into structurally and dynamically 713
inequivalent environments Combining advanced 2D 1H-1H correlation experiments based on 714
spin diffusion or double-quanta excitation suggests that vesicles could contain a preferred head-715
head configuration of the bolaform lipid while nanotubes a preferred head-tail assembly 716
The presence of two environments composed of the same molecule characterized by 717
different molecular configurations and rigidity fulfills the theoretical conditions necessary to 718
spontaneously nucleate a membrane inclusion of non-zero average orientation described as 719
necessary to observe topologically-connected nanotube-vesicle structures in the absence of 720
external forces This hypothesis could also be enriched by the possibility of nanotubes to be 721
pulled away between two vesicles after a collision event 722
This work expands the actual theoretical and experimental framework on lipid networks 723
stabilized by a different radius of curvature It could also motivate the synthesis or isolation 724
29
of new lipids providing a higher level of 3D architectural control in soft networks possibly in 725
the range of room temperature 726
727
Acknowledgements 728
Dr Andrea Lassenberger and Dr Sylvain Preacutevost at Institut Laue Langevin (ILL Grenoble 729
France) are kindly acknowledged for their assistance on the SANS experiment Confocal 730
images were performed at the Institut de Biologie Paris Seine (IBPS) imaging facility Jean-731
Franccedilois Gilles (Imaging Core Facility Institut de Biologie Paris Seine (IBPS) CNRS 732
Sorbonne Universiteacute Paris France) is kindly acknowledged for his assistance on the confocal 733
microscopy imaging Dr Guillaume Laurent (LCMCP Sorbonne Universiteacute Paris France) is 734
kindly acknowledged for helpful discussions The French region Ile-de-France SESAME 735
program is acknowledged for financial support (700 MHz NMR 736
spectrometer) Dr Olivier Diat (ICSM Marcoule France) Prof eronikaIglič and Prof V Aleš737
onsul discussi Slovenia) are kindly acknowledged for helpfUniversity of LjubljanaIglič (-Kralj 738
739
Financial support 740
WAXS experiments have been supported by Soleil Light Source Saint Aubin France proposal 741
Ndeg 20201747 SANS experiments have been supported by ILL proposal Ndeg9-13-778 742
743
References 744
1 D Kabaso N Bobrovska W Goacuteźdź E Gongadze V Kralj-Iglič R Zorec and A 745
Iglič Bioelectrochemistry 2012 87 204ndash210 746
2 C R Safinya U Raviv D J Needleman A Zidovska M C Choi M A Ojeda-747
Lopez K K Ewert Y Li H P Miller J Quispe B Carragher C S Potter M W 748
Kim S C Feinstein and L Wilson Adv Mater 2011 23 2260ndash2270 749
3 P Veranič M Lokar G J Schuumltz J Weghuber S Wieser H Haumlgerstrand V Kralj-750
Iglič and A Iglič Biophys J 2008 95 4416ndash4425 751
4 A Rustom R Saffrich I Markovic P Walther and H-H Gerdes Science (80- ) 752
2004 303 1007ndash1010 753
5 M I Angelova S Soleacuteau P Meacuteleacuteard F Faucon and P Bothorel Prog Colloid 754
Polym Sci 1992 89 127ndash131 755
6 L Mathivet S Cribier and P F Devaux Biophys J 1996 70 1112ndash1121 756
7 V Kralj-Iglič G Gomišček J Majhenc V Arrigler and S Svetina Colloids Surfaces 757
A Physicochem Eng Asp 2001 181 315ndash318 758
30
8 V Kralj-Iglič A Iglič G Gomišček F Sevšek V Arrigler and H Haumlgerstrand J 759
Phys A Math Gen 2002 35 1533ndash1549 760
9 M Drab D Stopar V Kralj-Iglič and A Iglič Cells 2019 8 626 761
10 A Zidovska K K Ewert J Quispe B Carragher C S Potter and C R Safinya 762
Langmuir 2009 25 2979ndash2985 763
11 A Zidovska K K Ewert J Quispe B Carragher C S Potter and C R Safinya Soft 764
Matter 2011 7 8363ndash8369 765
12 A Zidovska K K Ewert J Quispe B Carragher C S Potter and C R Safinya 766
Biochim Biophys Acta - Biomembr 2009 1788 1869ndash1876 767
13 M Karlsson K Sott M Davidson A S Cans P Linderholm D Chiu and O Orwar 768
Proc Natl Acad Sci U S A 2002 99 11573ndash11578 769
14 A Karlsson R Karlsson M Karlsson A-S Cans A Stromberg F Ryttsen and O 770
Orwar Nature 2001 409 150ndash152 771
15 M Karlsson K Sott A S Cans A Karlsson R Karlsson and O Orwar Langmuir 772
2001 17 6754ndash6758 773
16 E Evans H Bowman A Leung D Needham and D Tirrell Science (80- ) 1996 774
273 933ndash935 775
17 U Seifert Configurations of fluid membranes and vesicles 1997 vol 46 776
18 J Kaumls and E Sackmann Biophys J 1991 60 825ndash844 777
19 N Bobrovska W Goacuteźdź V Kralj-Iglič and A Iglič PLoS One 2013 8 e73941 778
20 A Iglič B Babnik K Bohinc M Fošnarič H Haumlgerstrand and V Kralj-Iglič J 779
Biomech 2007 40 579ndash585 780
21 K Bohinc T Slivnik A Iglič M Brumen and V Kralj-Iglič J Phys Chem C 2007 781
111 9709ndash9718 782
22 A Iglič H Haumlgerstrand P Veranič A Plemenitaš and V Kralj-Iglič J Theor Biol 783
2006 240 368ndash373 784
23 V Kralj-Iglič and P Veranič Adv Planar Lipid Bilayers Liposomes 2006 5 129ndash785
149 786
24 A Iglic and V Kralj-Iglic Adv Planar Lipid Bilayers Liposomes 2006 4 253ndash279 787
25 S Penič L Mesarec M Fošnarič L Mroacutewczyńska H Haumlgerstrand V Kralj-Iglič and 788
A Iglič Front Phys 2020 8 342 789
26 P Yager and P E Schoen Mol Cryst Liq Cryst 1984 106 371ndash381 790
27 T G Barclay K Constantopoulos and J Matisons Chem Rev 2014 114 10217ndash791
10291 792
31
28 B Božič G Gomišček V Kralj-Iglič S Svetina and B Žekš Eur Biophys J 2002 793
31 487ndash496 794
29 A Iglič H Haumlgerstrand M Bobrowska-Haumlgerstrand V Arrigler and V Kralj-Iglič 795
Phys Lett A 2003 310 493ndash497 796
30 R Bar-Ziv and E Moses Phys Rev Lett 1994 73 1392ndash1395 797
31 S Chiruvolu H E Warriner E Naranjo S H Idziak J O Raumldler R J Plano J A 798
Zasadzinski and C R Safinya Science (80- ) 1994 266 1222ndash1225 799
32 V Kralj-Iglič A Iglič H Haumlgerstrand and P Peterlin Phys Rev E 2000 61 4230ndash800
4234 801
33 L Mesarec M Drab S Penič V Kralj-Iglič and A Iglič Int J Mol Sci 2021 22 802
2348 803
34 L Van Renterghem S L K W Roelants N Baccile K Uyttersprot M C Taelman 804
B Everaert S Mincke S Ledegen S Debrouwer K Scholtens C V Stevens W 805
Soetaert L Van Renterghem S L K W Roelants N Baccile K Uytersprot M C 806
Taelman B Everaert S Mincke S Ledegen S Debrouwer K Scholtens C V 807
Stevens and W Soetaert Biotechnol Bioeng 2018 115 1195ndash1206 808
35 J Clark and F Deswarte Introduction to Chemicals from Biomass Second Edition 809
John Wiley amp Sons 2015 810
36 K V Sajna R Houmlfer R K Sukumaran L D Gottumukkala and A Pandey in 811
Industrial Biorefineries and White Biotechnology eds A Pandey R Houmlfer M 812
Taherzadeh K M Nampoothiri and C Larroche Amsterdam Oxford Waltham 813
Elsevier 2015 pp 499ndash521 814
37 R Marchant and I M Banat Trends Biotechnol 2012 30 558ndash565 815
38 K Hill and C LeHen-Ferrenbach in Sugar-Based Surfactants Fundamentals and 816
Applications ed C C Ruiz Boca Raton CRC Press 2009 pp 1ndash20 817
39 L Rodrigues I M Banat J Teixeira and R Oliveira J Antimicrob Chemother 818
2006 57 609ndash618 819
40 J D Desai and I M Banat Microbiol Mol Biol Rev 1997 61 47ndash64 820
41 S L K W Roelants K Ciesielska S L De Maeseneire H Moens B Everaert S 821
Verweire Q Denon B Vanlerberghe I N A Van Bogaert P Van der Meeren B 822
Devreese and W Soetaert Biotechnol Bioeng 2016 113 550ndash559 823
42 N Baccile M Selmane P Le Griel S Preacutevost J Perez C V Stevens E Delbeke S 824
Zibek M Guenther W Soetaert I N A Van Bogaert and S Roelants Langmuir 825
2016 32 6343ndash6359 826
32
43 N Baccile A-S Cuvier S Preacutevost C V Stevens E Delbeke J Berton W Soetaert 827
I N A Van Bogaert and S Roelants Langmuir 2016 32 10881ndash10894 828
44 N Baccile C Seyrig A Poirier S A Castro S L K W Roelants and S Abel Green 829
Chem 2021 23 3842ndash3944 830
45 A Salis L Cappai C Carucci D F Parsons and M Monduzzi J Phys Chem Lett 831
2020 11 6805ndash6811 832
46 J Schindelin I Arganda-Carreras E Frise V Kaynig M Longair T Pietzsch S 833
Preibisch C Rueden S Saalfeld B Schmid J-Y Tinevez D J White V 834
Hartenstein K Eliceiri P Tomancak and A Cardona Nat Methods 2012 9 676ndash835
682 836
47 T Parasassi and E Gratton J Fluoresc 1995 5 59ndash69 837
48 M M Dodes Traian F L Gonzaacutelez Flecha and V Levi J Lipid Res 2012 53 609ndash838
616 839
49 D M Owen C Rentero A Magenau A Abu-Siniyeh and K Gaus Nat Protoc 840
2012 7 24ndash35 841
50 W Stillwell in An Introduction to Biological Membranes Academic Press 2016 pp 842
135ndash180 843
51 W Stillwell in An Introduction to Biological Membranes Academic Press 2016 pp 844
181ndash220 845
52 B Tenchov Chem Phys Lipids 1991 57 165ndash177 846
53 R Koynova and M Caffrey Biochim Biophys Acta 1998 1376 91ndash145 847
54 F Schmid S Dolezel O Lenz and S Meinhardt J Phys Conf Ser 2014 487 848
012004 849
55 S Meinhardt R L C Vink and F Schmid Proc Natl Acad Sci U S A 2013 110 850
4476ndash4481 851
56 O Glatter and O Kratky Small Angle X-ray Scattering Academic Press London 852
1982 853
57 B A Cunningham A D Brown D H Wolfe W P Williams and A Brain Phys 854
Rev E 1998 58 3662ndash3672 855
58 M Nadler A Steiner T Dvir O Szekely P Szekely A Ginsburg R Asor R Resh 856
C Tamburu M Peres and U Raviv Soft Matter 2011 7 1512ndash1523 857
59 C Tanford The hydrophobic effect Formation of micelles and biological membranes 858
John Wiley amp Sons Inc New York 1973 859
60 M Masuda and T Shimizu Langmuir 2004 20 5969ndash5977 860
33
61 A Zidovska K K Ewert J Quispe B Carragher C S Potter and C R Safinya 861
Block Liposomes Vesicles of Charged Lipids with Distinctly Shaped Nanoscale 862
Sphere- Pear- Tube- or Rod-Segments Elsevier Inc 1st edn 2009 vol 465 863
62 A Iglic V Kralj-Iglic B Božič M Bobrowska-Haumlgerstrand B Isomaa and H 864
Haumlgerstrand Bioelectrochemistry 2000 52 203ndash211 865
63 T Shimizu M Masuda and H Minamikawa Chem Rev 2005 105 1401ndash1444 866
64 J V Selinger and J M Schnur Phys Rev Lett 1993 71 4091ndash4094 867
65 J M Schnur Science (80- ) 1993 262 1669ndash1676 868
66 B Tenchov R Koynova and G Rapp Biophys J 2001 80 1873ndash1890 869
67 R Koynova and B Tenchov Ser Biomech 2017 31 3ndash19 870
68 S J Angyal and R Le Fur Carbohydr Res 1984 126 15ndash26 871
69 J K Whitesell and M A Minton J Am Chem Soc 1987 109 225ndash228 872
70 T Takayama S Ando and I Ando J Mol Struct 1990 220 245ndash250 873
71 K Gawrisch N V Eldho and I V Polozov Chem Phys Lipids 2002 116 135ndash151 874
72 F Tielens C Gervais J F Lambert F Mauri and D Costa Chem Mater 2008 20 875
3336ndash3344 876
73 G A Jeffrey and Y Yeon Acta Crystallogr Sect B 1986 42 410ndash413 877
74 B Berglund and R W Vaughan J Chem Phys 1980 73 2037ndash2043 878
75 C Gervais C Coelho T Azaiumls J Maquet G Laurent F Pourpoint C Bonhomme 879
P Florian B Alonso G Guerrero P H Mutin and F Mauri J Magn Reson 2007 880
187 131ndash140 881
76 C Akita T Kawaguchi F Kaneko H Yamamoto and M Suzuki J Phys Chem B 882
2004 108 4862ndash4868 883
77 R N Purusottam L Seacutenicourt J J Lacapegravere and P Tekely Biochim Biophys Acta - 884
Biomembr 2015 1848 3134ndash3139 885
78 X Biarneacutes A Ardegravevol A Planas C Rovira A Laio and M Parrinello J Am Chem 886
Soc 2007 129 10686ndash10693 887
79 L M J Kroon‐Batenburg and J Kroon Biopolymers 1990 29 1243ndash1248 888
80 K N Kirschner and R J Woods Proc Natl Acad Sci U S A 2001 98 10541ndash889
10545 890
81 S Svenson B Kirste and J H Fuhrhop J Am Chem Soc 1994 116 11969ndash11975 891
82 I Sack S Macholl J H Fuhrhop and G Buntkowsky Phys Chem Chem Phys 892
2000 2 1781ndash1788 893
83 S Svenson J Koening and J H Fuhrhop J Phys Chem 1994 98 1022ndash1028 894
34
84 S Svenson A Schaefer and J H Fuhrhop J Chem Soc Perkin Trans 2 1994 2 895
1023ndash1028 896
85 K Bock and C Pedersen Adv Carbohydr Chem Biochem 1983 41 27ndash66 897
86 T B Grindley Structure and Conformation of Carbohydrates Springer Berlin 898
Heidelberg 2008 899
87 F Tantakitti J Boekhoven X Wang R V Kazantsev T Yu J Li E Zhuang R 900
Zandi J H Ortony C J Newcomb L C Palmer G S Shekhawat M O De La 901
Cruz G C Schatz and S I Stupp Nat Mater 2016 15 469ndash476 902
903
1
Supporting Information 904
905
Topological connection between vesicles and nanotubes in single-906
component lipid membranes driven by head-tail interactions 907
908
Niki Baccilea Ceacutedric Lorthioira Abdoul Aziz Baa Patrick Le Griela Cristina Coelhob Javier 909
Perezc Wim Soetaertd Sophie L K W Roelantsd 910
911
a Sorbonne Universiteacute Centre National de la Recherche Scientifique Laboratoire de Chimie de 912
la Matiegravere Condenseacutee de Paris LCMCP F-75005 Paris France 913
b Institut des Mateacuteriaux de Paris Centre Sorbonne Universiteacute Paris France 914
c Synchrotron Soleil LrsquoOrme des Merisiers Saint-Aubin BP48 91192 Gif-sur-Yvette Cedex 915
France 916
d InBio Department of Biotechnology Ghent University Ghent Belgium 917
918
919
Corresponding author 920
Dr Niki Baccile 921
E-mail address nikibaccilesorbonne-universitefr 922
Phone +33 1 44 27 56 77 923
924
925
926
2
a) 927
Parameter Method
Dry Matter (DM ) 996 Infrared balance 105degC
Glucose () 012 HPLC-Metacarb
Glycerol () nd HPLC-Metacarb
Free Fatty Acid content () lt001 Internal method BBEPP
GC with FID Detector
Oil () lt001 Internal method BBEPP
GC with FID Detector
Moulds (CFUg) lt10 3M-Nordval ndeg16 B
Yeasts (CFUg) lt10 3M-Nordval ndeg16 B
Anaerobic count (CFUg) lt10 SP-VG M005 B
Protein () tbd BCA protein assay
928
Figure S 1 - a) HPLC-ELSD chromatogram and composition table 929
930
931
932
933
3
b) 934
935
Group Ndeg δ ppm
CH2 1 354
CH2 2 153
CH2 3-712-14 132
CH2 811 203
CH 910 534
CH2 15 162
CH2 16 388
CH 1 424
CH 2 316
CH 3 334
CH 4 329
CH 5 354
CH2 6 366
Figure S 1 (next) ndash b) 1H NMR spectrum (MeOD-d4) recorded on the purified G-C181-OH compounds 936
and related assignment 937
938
2
811910 1rsquo
5rsquo1
3rsquo4rsquo
1rsquo1910
asymp asymp asympHDO MeOD Acetone
6rsquo2rsquo
1615
3-712-14
4
939
940
Figure S 2 ndash Cryo-TEM images recorded for a 5 mgmL G-C181-OH aqueous solution heat at T= 130degC 941
5
942
943
Figure S 3 - Cryo-TEM images recorded for a 5 mgmL G-C181-OH aqueous solution heat at T= 90degC 944
945
90degC
1
22
6
946
947
948
949
Figure S 4 ndash Cryo-TEM images recorded for a 5 mgmL G-C181-OH aqueous solution heat at T= 70degC 950
951
21
11
1
2
5
3
4
45
5
6
7
7
7
952
953
954
Figure S 5 ndash Cryo-TEM images recorded for a 5 mgmL G-C181-OH aqueous solution heat at T= 25degC 955
956
957
1
1 1
8
958
Figure S 6 ndash a) SANS experiment recorded at 90degC for a 5 mgmL G-C181-OH aqueous solution b-c) 959
WAXS experiments recorded on aqueous solutions of G-C181-OH at b) 5 mgmL and c) 25 mgmL d) 960
Structural interpretation of the repeating distances pointed out in c) 961
962
963
964
001 01 1
q Aring-1
25degC
68degC
88degC
111degC
01 1q Aring
-1
02 04 06 08 1q Aring
-1
001 01
10-1
100
101
Inte
nsity
cm
-1
q Aring-1
-2
T= 90degC
SANS WAXS WAXS
a) b) c)
dv
dL d= 144 Aring-1
di
ddH2O
dt
dvdL
dtdi d
d)
9
965
966
Figure S 7 ndash ssNMR MAS (10 kHz) experiments recorded on a G-C181-OH dry powder a) 1H spectra 967
recorded from 110degC to 70degC b) 13C single pulse (SP) spectra recorded with high power 1H decoupling from 968
110degC to 70degC c) 13C cross polarization (CP) spectra recorded at 110degC and contact time tc of 50 micros and 969
3000 micros d) 13C CP spectra recorded at 70degC and for 20 lt tc micros lt 3000 970
971
1
811
910
CH2 CH2
1rsquo
6rsquo
8 6 4 2 0 ppm
110
90
80
70
910
1rsquo
6rsquo16
1
2rsquo3rsquo4rsquo
811
OH
45 40 35 30 25 20 15
ppm
200 180 160 140 120 100 80 60 40 20 0
ppm140 120 100 80
ppm
CH2-gauche
3004
110
90
80
70
65
60
50
25
C91013003
C9 - 12869
CH2-all-trans
3198
C1rsquo10335
a) b)
1H
T degCT degC
13C Single Pulse MAS
A
B
A
B
70degC70degC
5rsquo
215
200 180 160 140 120 100 80 60 40 20 0
ppm
13C CPMAST= 110degC
200 180 160 140 120 100 80 60 40 20 0
ppm
132 131 130 129 128 127 126
ppm
106 105 104 103 102
ppm
13C CPMAST= 70degC
50
tc micros
3000
20
tc micros
50 500 1000 3000
tc micros
C102
13024 C910113003
C92
12869
C1rsquo213082
C1rsquo110443
A B
106 105 104 103 102
ppm
3000
1000
500
50
20
AB
c)
d)
10
972
Figure S 8 ndash a) Short and d) long T2 components displayed by the 1H transverse relaxation signal c) 1H 973
transverse relaxation signals recorded on a G-C181-OH dry powder from 110degC to 70degC The area of each 974
given resonance is plotted (log-lin) as a function of the echo time (CPMG pulse sequence) for each 975
temperature and fitted using the equation given above T2s and T2l indicate the short and long T2 relaxation 976
times respectively obtained by describing the 1H transverse relaxation signal using a biexponential decay 977
For H1rsquo H5rsquo and H6rsquo the 1H relaxation function could be described by a monoexponential decay 978
- Protons from the sugar group (H1rsquo H5rsquo H6rsquo) show a single T2 relaxation component (Figure 979
6c and Figure S 8) while protons of the acyl chain (CH2 H910 H811) show both short (Figure 980
6c) and long (Figure 6d) T2 relaxation component 981
- The short T2 relaxation time systematically decreases from 110degC to 70degC for all species by a 982
factor ranging from two to seven depending on the specific chemical group Very long T2 are 983
observed at 110degC for all acyl species while nearly unchanged values are measured below 984
90degC without any clear trend 985
- The sugar protons (H1rsquo H5rsquo H6rsquo) have the shortest set of T2 values (lt 1 ms) below 100degC 986
The long component of T2 generally ranges between 4 ms and 12 ms 987
0 1 2 3 4 5 6 7 8
00
05
10
15
20
25
30
35
40
45
Log
In
ten
sity
Time ms
0 1 2 3 4 5 6 7 8
00
05
10
15
20
25
30
35
40
45
Log
In
ten
sity
Time ms
0 1000 2000 3000 4000 5000 6000 7000 8000
00
05
10
15
20
25
30
35
40
45
Log
In
ten
sity
Time ms
0 1000 2000 3000 4000 5000 6000 7000 8000
00
05
10
15
20
25
30
35
40
45
Log
In
ten
sity
Time ms
0 1000 2000 3000 4000 5000 6000 7000 8000
00
05
10
15
20
25
30
35
40
45
Log
In
ten
sity
Time ms
0 1000 2000 3000 4000 5000 6000 7000 8000
00
05
10
15
20
25
30
35
40
45
Log
In
ten
sity
Time ms
H1
H8H11
H9H10
CH2
H1rsquo
H6rsquo
CH2
H910H811 H1CH2
H1rsquo H5rsquo6rsquo
0 1000 2000 3000 4000 5000 6000 7000 8000
00
05
10
15
20
25
30
35
40
45
Log
In
ten
sity
Time ms
OH
0 1000 2000 3000 4000 5000 6000 7000 8000
00
05
10
15
20
25
30
35
40
45 T= 110degC
T= 90degC
T= 80degC
T= 70degC
Log
In
ten
sity
Time ms
Fit
)
CH2 H910 H811 H1 H56 H1 OH
00
05
10
15
20
25
30
35
40
T2 m
s
T= 110degC
T= 90degC
T= 80degC
T= 70degC
CH2 H910 H811 H1
0
2
4
6
8
10
12
T2 m
s
T= 110degC
T= 90degC
T= 80degC
T= 70degC
Short T2(1H) Long T2(1H)
a) b)
c)
11
Table S 1 ndash 1H chemical shifts of G-C181-OH in solution and in the solid-state Solid-state spectra are 988
recorded at a MAS frequency of 10 kHz in DMSO-d6 broad peak 989
990
δH ppm
Group Ndeg Liquid
(MeOD-d4) Solid
(T= 110degC) Solid
(T= 70degC)
CH2 H1 354 357
CH2 H2 153 156
CH2 H3-712-14 132 135
CH2 H811 203 203
CH H910 534 534
CH2 H15 162 164
CH2 H16 388 383
CH H1 424 432
CH H2 316 335
CH H3 334 335
CH H4 329 335
CH H5 354 351 357
CH2 H6 366 383
OH OH1 432
45 463
OH OH2 492
OH OH3 490
OH OH4 487
OH OH6 445
991
992
H1H9H10H1rsquo
H6rsquo
OH2rsquo
OH1
12
Detailed discussion about the NOESY and DQ-SQ 2D 1H-1H ssNMR experiments presented in 993
Figure 9 994
995
2D 1H-1H ssNMR experiments are a unique tool to explore through-space proximities 996
between 1H nuclei ssNMR offers a large number of possibilities each adapted to a given 997
system The advantage of 2D maps with respect to a dynamics approach is their direct 998
readability in clear two nuclei which exchange their magnetization through-space (whichever 999
mechanism may be responsible for this exchange) will display a specific cross-peak However 1000
the way cross-peaks are presented and interpreted strictly depends on the nature of the pulse 1001
program which in turn is chosen according to the physical nature of the sample 1002
1D temperature-dependent 1H NMR experiments performed on G-C181-OH (Figure 1003
4a in the main text) indicate sharp peaks at 90degC and broad peaks at 70degC Narrow peaks 1004
indicate fast andor large-amplitude molecular tumbling averaging the strong 1H-1H dipolar 1005
interactions This excludes the use of pulse sequences like DQ-SQ which is not efficient under 1006
these conditions For this reason we employ spin-diffusion-based pulse sequences like 1007
NOESY which is more adapted for samples with high molecular mobility When mixing times 1008
are chosen to be short (lt 1 s) one generally explores through-space proximities within about 5 1009
10 Aring On the contrary when molecular motions are restricted dipolar coupling becomes 1010
significant 1H NMR peaks are broader and pulse sequences like DQ-SQ can now be used 1011
with a spatial resolution of less than 5 Aring 1012
Whenever possible DQ-SQ experiments are preferred over spin diffusion-based pulse 1013
sequences because they are more selective in particular for likewise interactions which are 1014
not discriminated in NOESY-type experiments This is illustrated by the typical interaction 1015
schemes for NOESY (top Figure 9a) and DQ-SQ (top Figure 9b) For two given A and B 1016
protons 2D NOESY maps will display two on-diagonal and two square-shaped symmetrical 1017
off-diagonal cross-peaks Off-diagonal cross-peaks illustrate the mutual A-B and B-A 1018
interaction but the on-diagonal peaks are systematic and do not prove any A-A or B-B 1019
interaction Similarly to NOESY 2D DQ-SQ maps display off-diagonal peaks (symmetric 1020
across the diagonal top Figure 9b) upon A-B and B-A interaction but in contrast they will 1021
display on-diagonal peaks only in the presence of self-interaction In the tutorial example of 1022
Figure 9b top the on-diagonal A-A peak indicates mutual A-A interaction while lack of on-1023
diagonal B-B peak evidences the absence of B-B proximities Combining NOESY and DQ-SQ 1024
experiments is capital to study the local arrangement of G-C181-OH and its evolution with 1025
temperature 1026
13
At T= 90degC the H1 and H5rsquo contributions are very close but possible to discriminate 1027
them (δ(H1)= 354 ppm δ(H5rsquo)= 351 ppm) according to 1H NMR chemical shifts in Table S 1028
1 2D 1H-1H NOESY in Figure 9a also discriminates between the two components attributed 1029
on the basis of the interactions with their mutual neighbors (green H1-H2 and H5rsquo-H1rsquo squares 1030
in Figure 9a) On this basis 2D NOESY does not show a direct H1rsquo-H1 correlation (blue red-1031
crossed) but rather an extensive network of intra-sugar interactions These features exclude 1032
suggest intra- and inter-sugar interactions and they exclude head-tail arrangements as a major 1033
molecular configuration at 90degC 1034
At 70degC the 1H NMR peaks are broader indicating a reduction of the T2 (1H) relaxation 1035
times andor residual homonuclear dipolar interactions excluding the use of NOESY In this 1036
case 1H-1H DQ-SQ correlation experiments are best suited Figure 9b presents the 1H-1H DQ-1037
SQ experiment on G-C181-OH at 70degC Peaks are broader than in NOESY and attribution may 1038
be cumbersome However the experiment is performed at 700 MHz and MAS= 22 kHz which 1039
improves spectral resolution with respect to the same experiment performed at 300 MHz and 1040
MAS= 10 kHz The auto-peak at δH= 356 ppm in the SQ dimension is attributed to H1-H1 spin 1041
pairs mainly resulting from intra CH2 interaction while the DQ cross-peaks at δH= 156-356 1042
ppm and δH= 432-356 ppm respectively origin from H2-H1 and H1rsquo-H1 interactions (Figure 1043
9b) DQ-SQ map does not show any auto-peak corresponding to H1rsquo-H1rsquo or Hxrsquo-Hxrsquo (x= 2rsquo 1044
3rsquo 4rsquo) interactions (red-crossed blue Figure 9b) thus excluding any proximity (lt 5 Aring) between 1045
close glucose neighbors On the contrary DQ-SQ maps (recorded both at 700 MHz Figure 9b 1046
or at 300 MHz not shown) systematically show DQ cross-peaks which can only be attributed 1047
to H1rsquo-H1 interactions (δH= 432-356) The presence of these H1rsquo-H1 interactions can only be 1048
explained by a head-tail arrangement of the G-C181-OH molecules as illustrated below the 1049
DQ-SQ map in Figure 9b 1050

13
317
Figure 5 ndash a-c) Confocal fluorescence microscopy images recorded at 90degC and 70degC for a 5 mgmL G-318
C181-OH aqueous solution d-g) Typical fluorescence microscopy images recorded at T= 80degC using 319
Laurdan (refer to materials and methods section for more details on this fluorophore) Excitation 320
wavelength is 405 nm for all the images while emission wavelength is 490 nm in (df) and 440 nm in (eg) 321
h) Full emission spectra obtained from the integration of various fluorescence images recorded from 412 322
nm to 600 nm (step 5 nm) at 90degC 80degC and 70degC i) Box plot of GP defined as 119918119927 =(120640120786120786120782minus120640120786120791120782)
120640120786120786120782+120640120786120791120782 with 120640120786120786120782 323
and 120640120786120791120782 being the emission wavelengths at 440 nm and 490 nm at 90degC 80degC and 70degC Each data point 324
l= 490 nm l= 440 nm
l= 490 nm l= 440 nm
10 μm400 450 500 550 600
00
02
04
06
08
10
No
rma
lize
d I
nte
nsity
l nm
90degC
80degC
80degC
70degC
70degC
400 450 500 550 60000
02
04
06
08
10
No
rma
lize
d I
nte
nsity
l nm
90degC
80degC
80degC
70degC
70degC
d) e)
f) g)
h)
i)
T= 80degC
Laurdan
T= 80degC
T= 80degC T= 80degC
T= 90degC T= 70degC T= 70degC
a) b) c)
1
1
1
14
corresponds to a set of regions of interest (ROIs) (54 at 90degC 65 at 80degC and 75 at 70degC) selected in the 325
corresponding fluorescence images ROIs were representatively selected so to include the entire image but 326
also vesicles alone tubes alone and mixtures of vesicles and tubes 327
328
Figure 5ab shows two typical confocal fluorescence microscopy images recorded on a 329
G-C181-OH solution (5 mgmL) in a flame-sealed capillary heat at T= 90degC and T= 70degC 330
Although the resolution of optical microscopy is not comparable with cryo-TEM the sample is 331
broadly composed of vesicles coexisting with nanotubes whereas in some cases the nanotube 332
starts from the vesicle itself (arrow Ndeg1) in good agreement with cryo-TEM data Furthermore 333
SANS recorded at T= 90degC (Figure S 6a) shows a scattering profile with a pronounced -2 334
dependence of the scattering intensity against the wavevector q in the log-log scale This 335
indicates the massive presence of a flat interface and it is expected typical of bilayers in 336
vesicular morphologies56 However the typical signature of nanotubes cannot be observed in 337
the SANS profile and this can be explained by both an argument related to the relative lower 338
amount of nanotubes with respect to vesicles at 90degC but also to the steeper slope of flat 339
morphologies (-2) compared to tubes (-1) the signal of the former masking the tube signal at 340
low wavevector values The SANS profile is characterized by a diffraction peak at q= 0167 Aring-341
1 of which the assignment is refined by WAXS data 342
Temperature-driven WAXS experiments in Figure S 6bc (5 mgmL-1 and 25 mgmL-1 343
respectively) show a lamellar order possibly attributed to a multilamellar structure of the 344
vesicles (dv Figure S 6d) at high temperature and to the interplanar arrangement of the 345
crystalline flat structures (dL Figure S 6d) at T= 25degC The sharp (001) reflection indicates 346
typical interlamellar distance of 353 Aring at 25degC although this value varies with temperature 347
(400 Aring at 111degC 372 Aring at 88degC) thus confirming its assignment to a hydration-dependent 348
interlamellar order More intriguing is the second broader peak at q= 0403 Aring-1 (d= 156 Aring) 349
and its reflection both clearly visible at 88degC below Tm2 We attribute it to the inter-glucolipid 350
arrangement inside the tubular phase (dt Figure S 6d) coexisting with the vesicle phase 351
between Tm1 and Tm2 and to the planar lipid arrangement (di Figure S 6d) in the rigid flat 352
lamellar structure below Tm2 Its temperature- hence hydration- independent position also 353
confirms its structural origin Finally besides the water-structure peak at about 2 Aring-1 we also 354
observe a broad peak at 144 Aring-1 characteristics of the lateral packing (d Figure S 6d) of lipids 355
in bilayers While its position could be consistent with an Lα phase5758 above Tm2 its broadness 356
and positional invariance as well as the coexistence between vesicles and tubes do not allow a 357
precise assignment 358
15
Does G-C181-OH assume a bilayer or interdigitated structure the latter being the one 359
found for other similar bolaform glucolipids4243 The size of G-C181-OH can be estimated to 360
be at the most 32 Aring given by the length L of the C16 tail (L = 22 Aring from the Tanford formula 361
L= 154 + 1265 times n (n= 16)59) and the sugar (about 10 Aring)4243 However the cis conformation 362
of the C=C bond imposes a ldquokinkrdquo of 60deg in the aliphatic chain which reduces the effective 363
length of the oleic backbone to about 17 Aring for an effective total G-C181-OH length of about 364
27 Aring Cryo-TEM provides a tube thickness varying from 35 Aring to 60 Aring and a vesicle membrane 365
thickness of at least 60 Aring WAXS suggests an interlamellar thickness (membrane and water) 366
between 40 Aring and 37 Aring and an inter-lipid distance in the tube of about 16 Aring In the absence of 367
a clear form factor oscillation profile as found for similar glucolipids4243 one must 368
acknowledge that these data pledge neither in favor of fully interdigitated nor a double layer 369
structure and might suggest a tilted lipid arrangement with partial interdigitation60 370
371
13C ssNMR demonstrates that G-C181-OH can assume two coexisting head-head and 372
head-tail configurations 373
Vesicles are characterized by low positive mean and gaussian curvatures while 374
nanotubes are described by a combination of a high positive mean and zero gaussian curvatures 375
In this regard the coexistence of vesicles and nanotubes requires glucolipids to adapt 376
themselves to both environments at the same time For this reason the formation of nanotube-377
vesicle networks generally requires a specific driving force able to impose a high mean and 378
zero gaussian curvature to the membrane In many systems insertion of at least a second 379
constituent (lipid surfactant protein) in the membrane becomes a necessary internal driving 380
force for the nucleation and growth of so-called membrane inclusions from which 381
topologically-connected nanotubes can form10ndash123261 as explained by orientational ordering 382
arguments62 It has also been shown that external driving forces such as use of laser 383
ldquotweezersrdquo30 osmotic pressure6 electroformation5ndash82829 or controlled suction13ndash16 are 384
otherwise necessary as also supported by theoretical studies19 385
The bending energy of tubes is higher than that of a vesicle membrane8 due to the 386
dependence of the membrane free energy from the principal curvatures For this reason 387
isotropic (rotational symmetry along the main axis) but also anisotropic33 lipids generally 388
stabilize low-curvature shapes like flat membranes or vesicles Lipid nanotubes are also a 389
common phase formed by amphiphiles but generally for lipids with a certain complexity in 390
their molecular structures as exampled by diacetylenic derivatives of phospholipids among 391
others262763ndash65 Negative contributions to the bending energy favoring the simultaneous 392
16
presence of interconnected vesicles and tubes was shown to be driven by the presence of 393
anisotropic lipids in a membrane continuum Spontaneous deviations to the elastic theory in the 394
presence of surfactants lipids and proteins with anisotropic structures favor the formation of 395
protrusions with radius of the order of the fraction of a micron9ndash1219ndash2362 396
In the absence of both internal and external driving forces mentioned above G-C181-397
OH should behave as a standard lipid Its DSC profile (Figure 2)536667 under both hydrated and 398
dry conditions identifies a hydration-independent transition (Tm1) slightly above room 399
temperature this is followed by one main transition at higher temperature (Tm2) in the dry 400
sample50 For such a profile one expects a gel phase (Lβ) below Tm1 and a liquid crystalline 401
structure possibly in the morphology of vesicles (L4 phase) possibly above Tm1 and most likely 402
above Tm231 as experimentally found On the basis of the thermogram recorded on the dry 403
powder one may also expect a ldquoripplerdquo (Pβ) phase between Tm1 and Tm2 characterized by 404
periodic undulations of the bilayer (generally addressed to as regions with both liquid order and 405
disorder)5455 406
In the present work instead of a Lβ phase we observe flat crystals below Tm1 and a 407
vesicle-nanotube network instead of the ldquoripplerdquo phase The latter is particularly unexpected 408
because the membrane is composed of a single-component (G-C181-OH) and no anisotropic 409
external force (osmotic hydrodynamic electric) is used to pull and stabilize the tubes In 410
addition the nanotubes are observed at fairly high temperatures above Tm1 (between about 411
60degC and 90degC) while this morphology is generally favored at low temperature (proportionality 412
with 1kT figure 5 in Ref 62) commonly below a given transition temperature characteristics 413
for each specific amphiphile27 Furthermore nanotubes of G-C181-OH seem to be stable in 414
time thus differing from what is found in electroformed vesicles78 They are also observed 415
away from phase transition events (may them be at Tm1 or Tm2) as otherwise reported before 416
for a diacetylenic derivative of phosphatidylcholine26 and many other systems27 417
A stable nanotube-vesicle network for a single-component phospholipid in the absence 418
of external driving forces is not expected and has never been reported before It could be 419
explained by the coexistence of two micro-separated phases of different rigidity This 420
hypothesis is excluded by confocal microscopy on Laurdan-labelled membranes and magic 421
angle spinning (MAS) solid-state NMR (ssNMR) experiments 422
Laurdan is a well-known fluorophore used to put in evidence the coexistence of rigid 423
and fluid domains in both model and biological membranes47ndash49 Laurdan was used here to label 424
the G-C181-OH membranes between Tm1 and Tm2 and to verify the possible micro-segregation 425
and coexistence of rigid (eg Lβ λem= 440 nm) and fluid (eg Lα λem= 490 nm) domains in 426
17
tubes and vesicles respectively A set of quantitative experiments performed on a 5 mgmL-1 427
solution summarized in Figure 5 shows an excess of fluorescence at only λem= 490 nm for 428
temperature between 90degC and 70degC (Figure 5h) The GP value which quantifies the rigidfluid 429
character of the membrane is systematically negative (Figure 5i) indicating an overall fluid 430
membrane at all temperatures GP is quantified on more than 50 regions of interest (ROIs) at 431
each temperature including vesicles and tubes alone as well as connected nanotube-vesicles 432
(Figure 5d-g) The dispersion of GP at 80degC and 70degC between -08 and -02 could suggest the 433
spurious presence of membranes with various degrees of flexibility although fluidity is always 434
predominant The combination of WAXS (broad peak d= 144 Aring-1 invariant with 435
temperature Figure S 6bc) and confocal fluorescence microscopy using Laurdan confirms the 436
single-phase of the membrane composed of G-C181-OH both in vesicles and nanotubes This 437
is also consistent with the lack of phase transitions in DSC experiments between ~85degC and 438
~60degC especially in hydrated samples We conclude that the vesicle-nanotube transition is not 439
driven by the local segregation of gel phase (Lβ) microdomains nor that the nanotubes are 440
composed of such phase 441
ssNMR is the best-suited approach to investigate the origin of the local driving force for 442
the nucleation of anisotropic inclusions of which the average orientation depends on the local 443
membrane and inclusion curvatures and was shown to promote tubing62 ssNMR can provide 444
information on the local molecular mobility eg through the nuclear spin relaxation behavior 445
but also on intermolecular interactions and stereochemistry eg through variations in the 446
chemical shift68ndash70 447
Ideally ssNMR should be performed on diluted G-C181-OH samples above Tm1 448
However fast MAS necessary for high resolution centrifuges the sample As a first 449
approximation hydrated G-C181-OH samples for instance at 50 wt as classically done for 450
phospholipids71 could be studied Unfortunately permeability of the sample holder combined 451
to heating (close to the boiling point of water) and MAS provoke dehydration and even sample 452
ejection After experiencing both of the above this approach was abandoned As a second 453
approximation the study of the dehydrated G-C181-OH powder avoids centrifugation and 454
evaporation If studying dried lipids may not reflect their exact behaviour under diluted 455
conditions valuable structural information can still be obtained in dehydrated molecular 456
systems like proteins thus illustrating that this approach is not unreasonable Furthermore if 457
DSC (Figure 2a) shows that hydration suppresses the Tm2 it also shows that the value of Tm1 is 458
not affected by water at concentrations as low as 10 wt For this reason performing a 459
structural analysis of dehydrated G-C181-OH by ssNMR above Tm1 may help understanding 460
18
the local arrangement of G-C181-OH in two morphologies vesicles and nanotubes having 461
sensibly different curvatures 462
To explore the local mobility of the most relevant chemical groups of G-C181-OH 463
above Tm2 (T= 110degC) and between Tm2 and Tm1 (70 lt T degC lt 90) we combine a series of 1H 464
and 13C experiments Single-pulse (SP) MAS experiments (1H and 13C) when recorded under 465
quantitative conditions allow the detection of all chemical species while cross-polarization 466
(CP) MAS (13C only) experiments are sensitive only to constrained groups for which the 1H-467
13C dipolar coupling is not averaged to zero by the molecular motions 468
469
Figure 6 ndash a) 1H MAS (10 kHz) ssNMR spectra recorded from 110degC to 70degC b) 13C MAS (10 kHz) ssNMR 470
spectra recorded using high power decoupling single pulse (SP) and cross-polarization (CP) pulse sequences 471
Contact time for CP experiments and corresponding temperatures are given on each spectrum Full spectra 472
are given in Figure S 7 473
The most relevant 1H and 13C spectra are given in Figure 6 (full range in Figure 7 and 474
Figure S 7) As expected the 1H solid-state SPMAS spectra show broader peaks compared to 475
the solution-state NMR spectrum (Figure 6a) reflecting the obvious solid-state character of the 476
sample at any temperature The sugar group and the C=C bond resonate in the 25-6 ppm range 477
and 535 ppm respectively while the OH groups of the sugar moiety are found below 45 ppm 478
(Figure 6a full assignment in Table S 1) Very broad (~1 ppm) at 100degC the position of the 479
OH peak varies with the temperature value and becomes narrower (lt~05 ppm) and visible at 480
δH= 464 ppm at T= 70degC Line narrowing and chemical shift variations of the OH resonance 481
in ssNMR is always a direct sign of H-bonding interactions whereas the strength of the H-482
bonding hence its OHhellipH distance is correlated to a dispersion in chemical shifts72ndash75 All other 483
60 55 50 45 40 35 30 25
ppm
110
90
80
70
910
1rsquo
6rsquo16
1
OH
134 132 130 128 126
ppm110 108 106 104 102 100
ppm
SP (T= 110degC)
SP (T= 70degC)
CP 50 ms (T= 70degC)
CP 3 ms (T= 70degC)
910 1rsquo
1H 13C
1
811
910
CH2 CH2
1rsquo
6rsquo
a) b)
C102
13024
C9101
13003
C92
12869 C1rsquo210382
C1rsquo110443
C1rsquo13035
2rsquo3rsquo4rsquo
T degC
5rsquo
19
resonances broaden from 110degC to 70degC thus indicating slower andor more anisotropic 484
reorientational motions of all chemical groups The specific dynamic behaviour of the sugar 485
headgroup is also reflected by its 1H transverse relaxation time T2 whereas the shorter the T2 486
the higher the rigidity Experiments performed between 110degC and 70degC shown and 487
commented in Figure S 8 in the Supporting Information globally show a single short (lt 1 ms 488
below 100degC) T2 relaxation component for H1rsquo H5rsquo and H6rsquo and two both short and long 489
(between 4 ms and 12 ms) T2 for the acyl chain (CH2 H910 H811) even below 100degC 490
At 110degC 13C SPMAS experiments (Figure 6b full range in Figure 7 and Figure S 7 491
assignments in Table 1) show a single peak at δC= 10335 ppm for C1rsquo and at δC= 13003 ppm 492
for C910 as expected for a symmetrical conformation with two chemically-equivalent 493
carbons76 At 70degC the C1rsquo peak disappears while C910 now shows two peaks around 128 494
ppm and 130 ppm (Table 1 full temperature series in Figure S 7b) attributed to C92 (δC= 12869 495
ppm) and C10 in a non-symmetric configuration respectively for which these two carbons are 496
chemically inequivalent76 More precisely the resonance at 130 ppm is actually the 497
superposition of two close resonances C9101 (δC= 13003 ppm) and C102 (δC= 13024 ppm) 498
where subscripts 1 and 2 stand for two different conformations of the cis-olefin group as 499
reported for various phases of oleic acid in the vicinity of 0degC76 500
501
Table 1 ndash 13C Chemical shifts of G-C181-OH in solution and solid-state Solid-state experiments are 502
recorded at MAS= 10 kHz All spectra are reported in Figure 7 and Figure S 7 The contact time for cross 503
polarization is 3 ms In all ssNMR experiments temperature is first raised at 110degC and then lowered to 504
either 90degC or 70degC Attribution of the 13C resonances in Table 1 is performed on the basis of the solution 505
spectrum (Figure S 1b) Additional peaks observed in both single pulse and cross polarization ssNMR 506
experiments are attributed when possible to a configuration effect of the given atom eg C9101 and C92 507
indicate two configurations of C9 All new peaks observed in solid-state and not detected in solution are 508
highlighted in red for convenience 509
510
511
δ ppm
Peak Liquid (DMSO-d6)
Solid Single Pulse
T= 110degC
Solid Single Pulse
T= 90degC
Solid Single Pulse
T= 70degC
Solid Cross Polarization
T= 70degC
C102
- - 13024 13024
C910C9101 13009 13003 13003 13003 13003
C1C9C10C1rsquo
C6rsquo
20
C92 - - - 12869 12869
C1rsquoC11 10329 10335 10335 - 10443
C12 - - - - 10382
C3 7724 7709 7702 - 7829
- 7634 7629 - 7621
7525
C2 7388 7398 7390 7370 7370
C4 7052 7077 7054 7041 7098
C16 6900 7016 - - 7029
- - - - 6793
C1C5C6 6153 6241 6236 6239 6262
C1C5C6 6117 - - - 5956
C2 3300 3290 3290 3283 3279
CH2(trans) - - - 3198 3196
CH2(gauche)C15 2941 2981 2987 3004 -
C811 2706 2747 2747 2832 2817
CH2 2597 2625 2628 2630 2817
512
13C CPMAS spectra at 70degC (Figure 6b full range in Figure 7 and Figure S 7d) at 513
increasing contact times confirm the presence of two cis-olefin environments one for which 514
C910 are equivalent labelled here C9101 and one for which they are inequivalent labelled 515
C92 C102 Both environments are rigid enough to be observed at short contact time (tc= 50 μs) 516
A similar double environment is also observed for the sugar C1rsquo CPMAS at 70degC shows two 517
peaks (C1rsquo1 at δC= 10443 ppm C1rsquo2 at δC= 10382 ppm Figure 6b Figure S 7d) These are 518
significantly shifted downfield from the C1rsquo peak observed at 110degC and are detected at contact 519
times as short as 50 μs thus indicating their rigid character One also finds that CPMAS is 520
totally inefficient at 100degC for short contact times (50 μs) and poorly efficient even at 3 ms 521
typical of fast-tumbling molecules (Figure S 7c) also both gauche (δC= 3004 ppm) and all-522
trans (δC= 3198 ppm) conformations of the CH2 carbons coexist at 70degC (Figure S 7b)77 523
According to ssNMR one main mobile molecular environment exists at 110degC as 524
shown by the well-resolved 1H spectrum single C=C (C9101) and anomeric (C1rsquo) resonances 525
gauche conformation of the aliphatic CH2 and single T2 of the aliphatic CH2 chain and sugar 526
protons The sugar group is certainly mobile (inefficient 1H13C CPMAS) but still more 527
constrainted than the acyl chain (shorter T2 (1H)) As the temperature is lowered the overall 528
rigidity increases (broadening of 1H NMR peaks faster 1H transverse relaxation and efficient 529
1H13C magnetization transfer during CPMAS) presumably driven by H-bonding 530
interactions (downfield shift and line narrowing of the OH 1H signal very short OH T2 loss of 531
the C1rsquo signal in SPMAS) At the same time a number of spectroscopic data (two concomitant 532
21
resonances for anomeric C1rsquo1 and C1rsquo2 cis-olefin C9101 and C92 C102 and CH2 gauche and 533
all-trans environments) and relaxation behaviour (fast and slow T2 relaxation components) 534
strongly suggests the coexistence of two molecular environments Further proofs of the 535
coexistence of two distinct molecular domains are given by a number of chemical shift 536
variations in the 13C CPMAS spectrum at 70degC compared to the one at 110degC 90degC and 537
solution This is shown in Figure 7 and in the list of 13C chemical shifts in Table 1 538
539
540
Figure 7 - Comparison between solution- and solid-state 13C NMR spectra of G-C181-OH Solid-state 541
experiments are recorded directly on the sample powder at a MAS of 10 kHz (4 mm zirconia rotor) SP 542
Single Pulse CP Cross Polarization In all the ssNMR experiments temperature is first raised at 110degC 543
and then lowered to either 90degC or 70degC Segmented lines are meant to highlight the known peak position 544
in solution thus stressing the strong chemical shift variations in the solid-state 545
546
NMR experiments above Tm2 suggest that vesicles could contain G-C181-OH with a 547
single family of mobile conformations characterized by chemically-equivalent C=C (red 548
Figure 8b) and a single C1rsquo conformation (green Figure 8b) Experiments between Tm1 and Tm2 549
otherwise suggest that two coexisting conformations characterized by chemically-equivalent 550
(red Figure 8b) and inequivalent (magenta Figure 8b) C=C could be associated to nanotubes 551
Two distinct C1rsquo sites (grey Figure 8b) also indicate two configurations of the sugar headgroup 552
A comment on this point will be given in the following paragraphs 553
The local (Aring-scale) variation of molecular mobility below Tm2 drives the coexistence of 554
two distinct molecular environments of the same G-C181-OH molecule This occurs within a 555
single-phase domain (as deduced by WAXS) of equivalent membrane rigidity (as derived from 556
Laurdan probe in confocal microscopy) Although never reported before the difference in the 557
local mobility of the same amphiphile (here G-C181-OH) could satisfy the theoretically-558
140 120 100 80 60 40 20
CP(3 ms)-70degC
SP-70degC
SP-90degC
SP-110degC
ppm
LiquidC910
C1rsquo
C2rsquo
C4rsquo
C3rsquo
C1
C6rsquoC5rsquo
C1
6
C8
11
C2 C
H2
C1
5
CH
2
DM
SO
13C
22
required conditions that induce local lipid segregation and formation of membrane inclusions 559
(Figure 8c) In case of their non-zero average orientation the local membrane curvature 560
increases62 and nanotubes can spontaneously form (Figure 8bc) More intriguing this 561
mechanism occurs at least 10degC above Tm1 although it should not be favored above the Tm27 562
From both experimental and theoretical backgrounds the conditions of topologically-563
connected vesicles-nanotubes systems are met only when either internal (two components) or 564
external driving forces are applied19 In the present single-lipid system of which the phase 565
behavior is summarized in Figure 8a the most plausible driving force could be explained by 566
the NMR results collected on the dry sample G-C181-OH concomitantly occupies two 567
molecular environments characterized by 1) two distinct conformations of the sugar 568
displaying equivalent mobility and 2) two conformations of the acyl chain unsaturation 569
570
23
571
Figure 8 ndash a) Thermotropic phase behavior of G-C181-OH at 5 mgmL-1 Note that Tm2 is observed on the 572
dry powder only b) Possible relationship between the molecular environment as derived from NMR and 573
membrane curvatures All the molecular drawings refer to the same G-C181-OH molecule (bulky ellipsoid 574
equiv sugar headgroup) while each color corresponds to a given configuration Grey of C1rsquo1 and C1rsquo2 indicates 575
the uncertainty about the assignment of the specific NMR peak The curvature C is defined as 1R R being 576
the curvature radius R1 R2 radius of curvature CG Gauss curvature CM Mean curvature c) Free 577
interpretation of the anisotropic high-curvature (CMgt 0 CG= 0) inclusions in the membrane (low CM and 578
CG) continuum driven by inter-sugar H-bonding and reduced intramembrane diffusion for a G-C181-OH 579
glucolipid 580
581
Flat crystalline structure
Nanotube-vesicle network
Vesicles
48degC
120deg
106 105 104 103 102 101
ppm
H9 H10H1rsquo
106 105 104 103 102 101
ppm106 105 104 103 102 101
ppm106 105 104 103 102 101
ppm
C=CC=C
C1rsquo1C1rsquo2
C1rsquo
Tm2(96degC)Tm1
a)
b)
c)
Same molecule different local orientations and sugar conformations
High curvature membrane
Low curvature inclusion
Flip-FlopStrong H-bonding
CG
CM ( + )
CG 0
CM 0 CG 0
CM 0
G-C181-OH
24
Two related questions are unanswered at the moment What actually drives nanotube 582
formation and is the organization of G-C181-OH within the vesicles and tubes the same Lipid 583
nanotubes have been studied for at least three decades over which broad experimental and 584
theoretical insight has been generated Despite this fact the actual understanding is still matter 585
of debate27 Micelle-to-nanotube and vesicle-to-nanotube phase transitions are generally 586
reported for single amphiphiles below a given Tm and intermediate phase composed of twisted 587
and flat fibers is concomitantly reported Initially thought to be a chirality-driven phenomenon 588
recent studies propose a more general mechanism involving crystallization and symmetry 589
breaking in the lipid packing driven by optimal packing27 If twisted ribbons were observed 590
before for a number of microbial glycolipid bolaamphiphiles44 they are not found for G-C181-591
OH This fact as well as the large body of cryo-TEM images and the observation of nanotubes 592
above Tm1 rather pledge in favour of a direct topological change from positive (vesicles) to 593
zero (nanotubes) Gaussian curvatures In this case vesicle-to-nanotube transitions could be 594
driven by external forces56307813ndash162829 595
Considering the absence of external forces in the present system there are only two 596
possibilities left spontaneous budding of the membrane or nanotube pulling after inter-vesicle 597
collisions due to Brownian motion Both are possible as inclusions composed of a different 598
arrangement of the same molecule in the membrane continuum can theoretically explain 599
spontaneous nanotube formation in an isotropic medium672223629ndash1218ndash21 However the second 600
one is probably more likely to prevail because it could explain the large number of nanotubes 601
connecting two distant vesicles Interestingly similar events occur for any phospholipid-based 602
vesicular solution but nanotubes are extremely rare unless at least two lipids of different 603
molecular structure are mixed together The spectroscopic 1H and 13C and relaxation (1H) 604
ssNMR data even if collected on a dry powder demonstrate that the coexistence of two G-605
C181-OH configurations involving both the sugar headgroup and fatty alcohol chain are 606
possible for this molecule As a matter of fact this is not so surprising as more than one energy 607
minima each corresponding to a given conformation are known for glucose its non-reducing 608
derivative methylglucose and carbohydrates in general78ndash80 609
The presence of two configurations could explain the coexistence between two 610
structures of different curvature but the data presented so far do not explain the origin of these 611
two configurations In other words what drives the change in the local structure of the sugar 612
headgroup and fatty alcohol within the membrane 613
The association of known self-assembled structures to spectroscopic 13C ssNMR data is 614
known for years in particular for gluconamides lipids having a linear sugar headgroup81ndash84 It 615
25
was found that gauche effects in some cases up to the γ position in the sugar chain induce 616
upfield chemical shifts while anti and trans conformations result in downfield shifts Each 617
structure (monolayer crystal bilayer crystal or micellar fiber) was then characterized by a given 618
organization of the gluconamide and a characteristic 13C ssNMR fingerprint which could be 619
explained by gauche γ-gauche anti and trans conformations of the headgroup Similar 620
structural-spectroscopic correlations have been collected over the years for much simpler cyclic 621
sugars85 whereas pyranoses can undergo important conformational changes (chair half-chair 622
boat skew) when the appropriate energy barriers are crossed78ndash8086 A quantitative 623
conformational study based on the 13C chemical shift variations shown in Table 1 would be 624
certainly helpful but very delicate in the context of the present state of the art because a 625
rigorous approach requires at least one known crystal structure8182 which is currently missing 626
for this compound A qualitative approach will then be adopted 627
G-C181-OH is a bolaform amphiphile and flip-flop could be a possible mechanism 628
involved in the nanotube stabilization whereas head-tail interactions have long been considered 629
as important in nanotube-forming bolaform amphiphiles6063 From mere considerations based 630
on T2 (1H) relaxation arguments one could exclude head-tail configurations if the R-CH2OH 631
endgroup (H1) was involved in a direct interaction with the sugar group its corresponding T2 632
would probably be comparable to the sugarrsquos one (OH and H1rsquo) but this does not seem to be 633
the case However this hypothesis would be based on the comparison of the relaxation from 634
CH and CH2 protons additionally involved in different kind of motions Besides the relaxation 635
of H1 is influenced by the strong overlap between H1 and H5rsquo For these reasons relaxation 636
arguments are not solid enough and will not be used 637
We then address this question by exploring intermolecular interactions in a direct 638
manner using 2D 1H-1H homonuclear ssNMR correlation spectroscopy At 90degC in the fast-639
tumbling domain of molecular motion (narrow 1H NMR peaks Figure 6a) and corresponding 640
to the vesicle-rich region spin diffusion (NOESY) experiments are preferred over dipolar 641
coupling based experiments because such interaction is averaged out by molecular motion 642
However when the molecular motion is more constrained in the domain of nanotube stability 643
at 70degC (broad 1H spectra Figure 6a) Double-Quantum Single-Quantum (DQ-SQ) correlation 644
experiments are best suited to probe interaction between close molecular neighbors These 645
experiments are reported in Figure 9 and the related interpretation is only briefly reported 646
below while a more detailed discussion can be found on Page 12 in the Supporting Information 647
26
648
Figure 9 ndash a) 2D 1H-1H NOESY NMR experiment performed at MAS= 10 kHz (4 mm probe) on a Bruker 649
300 MHz Avance III HD spectrometer using 300 ms of mixing time Sample temperature is regulated to 650
90degC reached by cooling from 110degC b) 2D 1H-1H DQ-SQ (BAck-to-BAck BABA pulse sequence used for 651
the DQ excitation scheme) NMR experiment performed at MAS= 22 kHz (25 mm probe) on a Bruker 700 652
MHz Avance III spectrometer using a DQ excitation time equal to 2 rotor periods Sample temperature is 653
regulated to 70degC reached by cooling from 110degC The typical schemes illustrating how to interpret these 654
2D experiments are reported above each experimental map Zooms of the sugar region and configurational 655
interpretation are given below each 2D map More information are given in the text below 656
H16-H16
H1-H1
H9-H10
H1rsquo-H1
H1rsquoH910 H16
H1
H1rsquo-H1rsquo
Hxrsquo-Hxrsquo
2
(pp
m)
(ppm)
315
811910 1rsquo
2rsquo2
3rsquo 4rsquo6rsquo
5rsquo
1rsquo2910
asymp asymp asympHDO MeOD Acetone
1
315
811 9101rsquo
2rsquo2
3rsquo4rsquo6rsquo
5rsquo
1rsquo2 9 10
asympasympasympHDOMeODAcetone
H1rsquo-H1
1rsquo
1
(p
pm
)
(ppm)
H1-H2
H1rsquo-H1
H1rsquo
H910
H1H5rsquo
H2
H1rsquo-H5rsquo
315
811910 1rsquo
2rsquo2
3rsquo 4rsquo6rsquo
5rsquo
1rsquo2910
asymp asymp asympHDO MeOD Acetone
1
H2rsquoH3rsquoH4rsquo
H2rsquoH3rsquoH4rsquo
X= 2rsquo3rsquo4rsquo
NOESY - T= 90degC
1H
1H
1H
1H
DQ-SQ - T= 70degC
a) b)
2
(pp
m)
(p
pm
)
(ppm)
A B
AhellipB
AhellipA
BhellipB
NOESY
(ppm)
A B
AhellipB
DQ-SQ
Single-quantum dimension
Do
ub
le-q
ua
ntu
m d
imen
sio
n
AhellipA
BhellipB
BhellipA
BhellipA
315
811910 1rsquo
2rsquo2
3rsquo 4rsquo6rsquo
5rsquo
1rsquo2910
asymp asymp asympHDO MeOD Acetone
1
lt 5 Aring
lt 5 Aring
H1-H2
H811
H15
H16
H6rsquo
H1rsquo
H1
H5rsquo
H2
H1-H2
H1rsquo-H1
H1rsquo-H5rsquo
H1rsquo
H1 H5rsquo
H1rsquo
H1
H5rsquo
H1H2rsquo H3rsquo H4rsquo
H1-H1
H1rsquo-H1
Hxrsquo-HxrsquoX= 2rsquo3rsquo4rsquo
H1-H2
H1rsquo
Zoom sugar region 28 ndash 45 ppmNOESY DQ-SQ
27
Head-tail or head-head configurations could be probed by the existence of H1rsquo-H1 657
interactions whereas H1 (δH= 356 ppm) is associated to the glucolipid tail and H1rsquo (δH= 432 658
ppm) to the sugar headgroup These atoms are more than 15 Aring apart and a direct interaction 659
could not be observed in both NOESY and DQ-SQ experiments NOESY experiments (Figure 660
9a) show that H1rsquo-H1 correlations are not observed Meanwhile clear-cut direct H1rsquo-H1 661
interactions are indeed observed are detected at T= 70degC (DQ cross-peaks related to H1rsquo-H1 662
correlation in DQ-SQ experiment shown in Figure 9b) Interestingly the absence of auto peaks 663
at δH= 432 ppm and δH= 335 ppm in the SQ dimension excludes H1rsquo-H1rsquo and Hxrsquo-Hxrsquo (x= 2 664
3 4) interactions respectively strengthening the idea that sugar headgroups from two nearest-665
neighbor G-C181-OH molecules are not adjacent in the nanotube-vesicle region 666
Homonuclear 2D ssNMR supports the idea according to which G-C181-OH can 667
undergo molecular flip-flops and a head-tail arrangement in the dry product Extrapolating these 668
conclusions in the lower concentration range lack of H1rsquo-H1 proximity at T= 90degC suggests a 669
head-head configuration in the vesicle-rich region and head-tail configuration within the 670
nanotubes It is however still unclear whether flip-flops are driven by spontaneous temperature-671
induced conformational changes in the glucolipid packing stimulating inclusions within the 672
membrane itself672223629ndash1218ndash21 or by defects generated by inter-vesicle collisions In fact a 673
combination of both is not unlikely Nanotubes are not stable when temperature is 20 to 30 674
degrees above Tm1 indicating that inter-vesicle collisions alone cannot explain the unusual 675
phenomenon In an energy landscape approach87 the head-head configuration is certainly 676
favored at high temperature while both head-head and head-tail configurations could be 677
favored in the mid-temperature region corresponding to the range between Tm1 and Tm2 in the 678
dry powder Both statistical and defect-induced flip-flop events contribute to form high mean 679
zero Gaussian curvature morphologies (nanotubes) for which the head-tail conformation 680
limiting the proximity between bulky sugar headgroups is probably more adapted (Figure 8c) 681
The flip-flop interpretation now reasonably explains the strong differences in the sugar and fatty 682
alcohol conformations deduced by the multiple NMR signals attributed to chemically-683
equivalent groups The existence of various low-energy conformations each having specific 684
NMR signature for sugars in solution78ndash8086 and solid-state81ndash84 further supports our 685
interpretation 686
One last point should be clarified Why between Tm1 and Tm2 are two molecular 687
environments able to coexist instead of a single one of average rigidity as found in the case of 688
ldquoripplerdquo phases50ndash54 We believe that this question can be answered based on the NMR results 689
the relatively short T2 values of the H1rsquo and OH protons shows the constrained mobility of the 690
28
sugar headgroup despite a certain flexibility of the chain (long T2 component) This trend may 691
suggest restrictions in translational mobility probably due to the sugar-OH hydrogen bonding 692
(Figure 8c) meaning that lipids are not able to diffuse within the membrane thus keeping two 693
different configurations stable 694
695
Conclusions 696
Topologically-connected nanotube-vesicle lipidic systems are commonly observed for 697
self-assembled membranes composed of at least two amphiphiles and spontaneously driven by 698
anisotropic inclusions andor by external directional forces This work shows that strong 699
differences in membrane curvature can spontaneously occur in single-lipid systems without 700
external anisotropic forces Coexistence and interconnection between nanotubes and vesicles 701
are evidenced via cryo-TEM and fluorescence confocal microscopy in a single-phase region at 702
temperature above a transition temperature Tm1= 483degC determined by DSC on the hydrated 703
sample but below the second transition temperature Tm2 (957degC) determined by DSC on the 704
dry powder X-ray diffraction (WAXS) also shows the coexistence of two lattice periods one 705
attributed to an inter-membrane repeating distance and the other possibly related to the intra-706
nanotube glucolipid arrangement Labelling the systems with Laurdan a fluorophore of which 707
the emission strongly varies with the local membrane rigidity excludes the presence of rigid 708
micro-separated phases (eg Lβ) 709
1H and 13C ssNMR despite the fact that it can only be performed on the dry powder 710
confirm the presence of one main fluid G-C181-OH environment above Tm2 Below Tm2 the 711
splitting of some 13C peaks and the coexistence of short and long 1H relaxation components 712
demonstrate that G-C181-OH can simultaneously pack into structurally and dynamically 713
inequivalent environments Combining advanced 2D 1H-1H correlation experiments based on 714
spin diffusion or double-quanta excitation suggests that vesicles could contain a preferred head-715
head configuration of the bolaform lipid while nanotubes a preferred head-tail assembly 716
The presence of two environments composed of the same molecule characterized by 717
different molecular configurations and rigidity fulfills the theoretical conditions necessary to 718
spontaneously nucleate a membrane inclusion of non-zero average orientation described as 719
necessary to observe topologically-connected nanotube-vesicle structures in the absence of 720
external forces This hypothesis could also be enriched by the possibility of nanotubes to be 721
pulled away between two vesicles after a collision event 722
This work expands the actual theoretical and experimental framework on lipid networks 723
stabilized by a different radius of curvature It could also motivate the synthesis or isolation 724
29
of new lipids providing a higher level of 3D architectural control in soft networks possibly in 725
the range of room temperature 726
727
Acknowledgements 728
Dr Andrea Lassenberger and Dr Sylvain Preacutevost at Institut Laue Langevin (ILL Grenoble 729
France) are kindly acknowledged for their assistance on the SANS experiment Confocal 730
images were performed at the Institut de Biologie Paris Seine (IBPS) imaging facility Jean-731
Franccedilois Gilles (Imaging Core Facility Institut de Biologie Paris Seine (IBPS) CNRS 732
Sorbonne Universiteacute Paris France) is kindly acknowledged for his assistance on the confocal 733
microscopy imaging Dr Guillaume Laurent (LCMCP Sorbonne Universiteacute Paris France) is 734
kindly acknowledged for helpful discussions The French region Ile-de-France SESAME 735
program is acknowledged for financial support (700 MHz NMR 736
spectrometer) Dr Olivier Diat (ICSM Marcoule France) Prof eronikaIglič and Prof V Aleš737
onsul discussi Slovenia) are kindly acknowledged for helpfUniversity of LjubljanaIglič (-Kralj 738
739
Financial support 740
WAXS experiments have been supported by Soleil Light Source Saint Aubin France proposal 741
Ndeg 20201747 SANS experiments have been supported by ILL proposal Ndeg9-13-778 742
743
References 744
1 D Kabaso N Bobrovska W Goacuteźdź E Gongadze V Kralj-Iglič R Zorec and A 745
Iglič Bioelectrochemistry 2012 87 204ndash210 746
2 C R Safinya U Raviv D J Needleman A Zidovska M C Choi M A Ojeda-747
Lopez K K Ewert Y Li H P Miller J Quispe B Carragher C S Potter M W 748
Kim S C Feinstein and L Wilson Adv Mater 2011 23 2260ndash2270 749
3 P Veranič M Lokar G J Schuumltz J Weghuber S Wieser H Haumlgerstrand V Kralj-750
Iglič and A Iglič Biophys J 2008 95 4416ndash4425 751
4 A Rustom R Saffrich I Markovic P Walther and H-H Gerdes Science (80- ) 752
2004 303 1007ndash1010 753
5 M I Angelova S Soleacuteau P Meacuteleacuteard F Faucon and P Bothorel Prog Colloid 754
Polym Sci 1992 89 127ndash131 755
6 L Mathivet S Cribier and P F Devaux Biophys J 1996 70 1112ndash1121 756
7 V Kralj-Iglič G Gomišček J Majhenc V Arrigler and S Svetina Colloids Surfaces 757
A Physicochem Eng Asp 2001 181 315ndash318 758
30
8 V Kralj-Iglič A Iglič G Gomišček F Sevšek V Arrigler and H Haumlgerstrand J 759
Phys A Math Gen 2002 35 1533ndash1549 760
9 M Drab D Stopar V Kralj-Iglič and A Iglič Cells 2019 8 626 761
10 A Zidovska K K Ewert J Quispe B Carragher C S Potter and C R Safinya 762
Langmuir 2009 25 2979ndash2985 763
11 A Zidovska K K Ewert J Quispe B Carragher C S Potter and C R Safinya Soft 764
Matter 2011 7 8363ndash8369 765
12 A Zidovska K K Ewert J Quispe B Carragher C S Potter and C R Safinya 766
Biochim Biophys Acta - Biomembr 2009 1788 1869ndash1876 767
13 M Karlsson K Sott M Davidson A S Cans P Linderholm D Chiu and O Orwar 768
Proc Natl Acad Sci U S A 2002 99 11573ndash11578 769
14 A Karlsson R Karlsson M Karlsson A-S Cans A Stromberg F Ryttsen and O 770
Orwar Nature 2001 409 150ndash152 771
15 M Karlsson K Sott A S Cans A Karlsson R Karlsson and O Orwar Langmuir 772
2001 17 6754ndash6758 773
16 E Evans H Bowman A Leung D Needham and D Tirrell Science (80- ) 1996 774
273 933ndash935 775
17 U Seifert Configurations of fluid membranes and vesicles 1997 vol 46 776
18 J Kaumls and E Sackmann Biophys J 1991 60 825ndash844 777
19 N Bobrovska W Goacuteźdź V Kralj-Iglič and A Iglič PLoS One 2013 8 e73941 778
20 A Iglič B Babnik K Bohinc M Fošnarič H Haumlgerstrand and V Kralj-Iglič J 779
Biomech 2007 40 579ndash585 780
21 K Bohinc T Slivnik A Iglič M Brumen and V Kralj-Iglič J Phys Chem C 2007 781
111 9709ndash9718 782
22 A Iglič H Haumlgerstrand P Veranič A Plemenitaš and V Kralj-Iglič J Theor Biol 783
2006 240 368ndash373 784
23 V Kralj-Iglič and P Veranič Adv Planar Lipid Bilayers Liposomes 2006 5 129ndash785
149 786
24 A Iglic and V Kralj-Iglic Adv Planar Lipid Bilayers Liposomes 2006 4 253ndash279 787
25 S Penič L Mesarec M Fošnarič L Mroacutewczyńska H Haumlgerstrand V Kralj-Iglič and 788
A Iglič Front Phys 2020 8 342 789
26 P Yager and P E Schoen Mol Cryst Liq Cryst 1984 106 371ndash381 790
27 T G Barclay K Constantopoulos and J Matisons Chem Rev 2014 114 10217ndash791
10291 792
31
28 B Božič G Gomišček V Kralj-Iglič S Svetina and B Žekš Eur Biophys J 2002 793
31 487ndash496 794
29 A Iglič H Haumlgerstrand M Bobrowska-Haumlgerstrand V Arrigler and V Kralj-Iglič 795
Phys Lett A 2003 310 493ndash497 796
30 R Bar-Ziv and E Moses Phys Rev Lett 1994 73 1392ndash1395 797
31 S Chiruvolu H E Warriner E Naranjo S H Idziak J O Raumldler R J Plano J A 798
Zasadzinski and C R Safinya Science (80- ) 1994 266 1222ndash1225 799
32 V Kralj-Iglič A Iglič H Haumlgerstrand and P Peterlin Phys Rev E 2000 61 4230ndash800
4234 801
33 L Mesarec M Drab S Penič V Kralj-Iglič and A Iglič Int J Mol Sci 2021 22 802
2348 803
34 L Van Renterghem S L K W Roelants N Baccile K Uyttersprot M C Taelman 804
B Everaert S Mincke S Ledegen S Debrouwer K Scholtens C V Stevens W 805
Soetaert L Van Renterghem S L K W Roelants N Baccile K Uytersprot M C 806
Taelman B Everaert S Mincke S Ledegen S Debrouwer K Scholtens C V 807
Stevens and W Soetaert Biotechnol Bioeng 2018 115 1195ndash1206 808
35 J Clark and F Deswarte Introduction to Chemicals from Biomass Second Edition 809
John Wiley amp Sons 2015 810
36 K V Sajna R Houmlfer R K Sukumaran L D Gottumukkala and A Pandey in 811
Industrial Biorefineries and White Biotechnology eds A Pandey R Houmlfer M 812
Taherzadeh K M Nampoothiri and C Larroche Amsterdam Oxford Waltham 813
Elsevier 2015 pp 499ndash521 814
37 R Marchant and I M Banat Trends Biotechnol 2012 30 558ndash565 815
38 K Hill and C LeHen-Ferrenbach in Sugar-Based Surfactants Fundamentals and 816
Applications ed C C Ruiz Boca Raton CRC Press 2009 pp 1ndash20 817
39 L Rodrigues I M Banat J Teixeira and R Oliveira J Antimicrob Chemother 818
2006 57 609ndash618 819
40 J D Desai and I M Banat Microbiol Mol Biol Rev 1997 61 47ndash64 820
41 S L K W Roelants K Ciesielska S L De Maeseneire H Moens B Everaert S 821
Verweire Q Denon B Vanlerberghe I N A Van Bogaert P Van der Meeren B 822
Devreese and W Soetaert Biotechnol Bioeng 2016 113 550ndash559 823
42 N Baccile M Selmane P Le Griel S Preacutevost J Perez C V Stevens E Delbeke S 824
Zibek M Guenther W Soetaert I N A Van Bogaert and S Roelants Langmuir 825
2016 32 6343ndash6359 826
32
43 N Baccile A-S Cuvier S Preacutevost C V Stevens E Delbeke J Berton W Soetaert 827
I N A Van Bogaert and S Roelants Langmuir 2016 32 10881ndash10894 828
44 N Baccile C Seyrig A Poirier S A Castro S L K W Roelants and S Abel Green 829
Chem 2021 23 3842ndash3944 830
45 A Salis L Cappai C Carucci D F Parsons and M Monduzzi J Phys Chem Lett 831
2020 11 6805ndash6811 832
46 J Schindelin I Arganda-Carreras E Frise V Kaynig M Longair T Pietzsch S 833
Preibisch C Rueden S Saalfeld B Schmid J-Y Tinevez D J White V 834
Hartenstein K Eliceiri P Tomancak and A Cardona Nat Methods 2012 9 676ndash835
682 836
47 T Parasassi and E Gratton J Fluoresc 1995 5 59ndash69 837
48 M M Dodes Traian F L Gonzaacutelez Flecha and V Levi J Lipid Res 2012 53 609ndash838
616 839
49 D M Owen C Rentero A Magenau A Abu-Siniyeh and K Gaus Nat Protoc 840
2012 7 24ndash35 841
50 W Stillwell in An Introduction to Biological Membranes Academic Press 2016 pp 842
135ndash180 843
51 W Stillwell in An Introduction to Biological Membranes Academic Press 2016 pp 844
181ndash220 845
52 B Tenchov Chem Phys Lipids 1991 57 165ndash177 846
53 R Koynova and M Caffrey Biochim Biophys Acta 1998 1376 91ndash145 847
54 F Schmid S Dolezel O Lenz and S Meinhardt J Phys Conf Ser 2014 487 848
012004 849
55 S Meinhardt R L C Vink and F Schmid Proc Natl Acad Sci U S A 2013 110 850
4476ndash4481 851
56 O Glatter and O Kratky Small Angle X-ray Scattering Academic Press London 852
1982 853
57 B A Cunningham A D Brown D H Wolfe W P Williams and A Brain Phys 854
Rev E 1998 58 3662ndash3672 855
58 M Nadler A Steiner T Dvir O Szekely P Szekely A Ginsburg R Asor R Resh 856
C Tamburu M Peres and U Raviv Soft Matter 2011 7 1512ndash1523 857
59 C Tanford The hydrophobic effect Formation of micelles and biological membranes 858
John Wiley amp Sons Inc New York 1973 859
60 M Masuda and T Shimizu Langmuir 2004 20 5969ndash5977 860
33
61 A Zidovska K K Ewert J Quispe B Carragher C S Potter and C R Safinya 861
Block Liposomes Vesicles of Charged Lipids with Distinctly Shaped Nanoscale 862
Sphere- Pear- Tube- or Rod-Segments Elsevier Inc 1st edn 2009 vol 465 863
62 A Iglic V Kralj-Iglic B Božič M Bobrowska-Haumlgerstrand B Isomaa and H 864
Haumlgerstrand Bioelectrochemistry 2000 52 203ndash211 865
63 T Shimizu M Masuda and H Minamikawa Chem Rev 2005 105 1401ndash1444 866
64 J V Selinger and J M Schnur Phys Rev Lett 1993 71 4091ndash4094 867
65 J M Schnur Science (80- ) 1993 262 1669ndash1676 868
66 B Tenchov R Koynova and G Rapp Biophys J 2001 80 1873ndash1890 869
67 R Koynova and B Tenchov Ser Biomech 2017 31 3ndash19 870
68 S J Angyal and R Le Fur Carbohydr Res 1984 126 15ndash26 871
69 J K Whitesell and M A Minton J Am Chem Soc 1987 109 225ndash228 872
70 T Takayama S Ando and I Ando J Mol Struct 1990 220 245ndash250 873
71 K Gawrisch N V Eldho and I V Polozov Chem Phys Lipids 2002 116 135ndash151 874
72 F Tielens C Gervais J F Lambert F Mauri and D Costa Chem Mater 2008 20 875
3336ndash3344 876
73 G A Jeffrey and Y Yeon Acta Crystallogr Sect B 1986 42 410ndash413 877
74 B Berglund and R W Vaughan J Chem Phys 1980 73 2037ndash2043 878
75 C Gervais C Coelho T Azaiumls J Maquet G Laurent F Pourpoint C Bonhomme 879
P Florian B Alonso G Guerrero P H Mutin and F Mauri J Magn Reson 2007 880
187 131ndash140 881
76 C Akita T Kawaguchi F Kaneko H Yamamoto and M Suzuki J Phys Chem B 882
2004 108 4862ndash4868 883
77 R N Purusottam L Seacutenicourt J J Lacapegravere and P Tekely Biochim Biophys Acta - 884
Biomembr 2015 1848 3134ndash3139 885
78 X Biarneacutes A Ardegravevol A Planas C Rovira A Laio and M Parrinello J Am Chem 886
Soc 2007 129 10686ndash10693 887
79 L M J Kroon‐Batenburg and J Kroon Biopolymers 1990 29 1243ndash1248 888
80 K N Kirschner and R J Woods Proc Natl Acad Sci U S A 2001 98 10541ndash889
10545 890
81 S Svenson B Kirste and J H Fuhrhop J Am Chem Soc 1994 116 11969ndash11975 891
82 I Sack S Macholl J H Fuhrhop and G Buntkowsky Phys Chem Chem Phys 892
2000 2 1781ndash1788 893
83 S Svenson J Koening and J H Fuhrhop J Phys Chem 1994 98 1022ndash1028 894
34
84 S Svenson A Schaefer and J H Fuhrhop J Chem Soc Perkin Trans 2 1994 2 895
1023ndash1028 896
85 K Bock and C Pedersen Adv Carbohydr Chem Biochem 1983 41 27ndash66 897
86 T B Grindley Structure and Conformation of Carbohydrates Springer Berlin 898
Heidelberg 2008 899
87 F Tantakitti J Boekhoven X Wang R V Kazantsev T Yu J Li E Zhuang R 900
Zandi J H Ortony C J Newcomb L C Palmer G S Shekhawat M O De La 901
Cruz G C Schatz and S I Stupp Nat Mater 2016 15 469ndash476 902
903
1
Supporting Information 904
905
Topological connection between vesicles and nanotubes in single-906
component lipid membranes driven by head-tail interactions 907
908
Niki Baccilea Ceacutedric Lorthioira Abdoul Aziz Baa Patrick Le Griela Cristina Coelhob Javier 909
Perezc Wim Soetaertd Sophie L K W Roelantsd 910
911
a Sorbonne Universiteacute Centre National de la Recherche Scientifique Laboratoire de Chimie de 912
la Matiegravere Condenseacutee de Paris LCMCP F-75005 Paris France 913
b Institut des Mateacuteriaux de Paris Centre Sorbonne Universiteacute Paris France 914
c Synchrotron Soleil LrsquoOrme des Merisiers Saint-Aubin BP48 91192 Gif-sur-Yvette Cedex 915
France 916
d InBio Department of Biotechnology Ghent University Ghent Belgium 917
918
919
Corresponding author 920
Dr Niki Baccile 921
E-mail address nikibaccilesorbonne-universitefr 922
Phone +33 1 44 27 56 77 923
924
925
926
2
a) 927
Parameter Method
Dry Matter (DM ) 996 Infrared balance 105degC
Glucose () 012 HPLC-Metacarb
Glycerol () nd HPLC-Metacarb
Free Fatty Acid content () lt001 Internal method BBEPP
GC with FID Detector
Oil () lt001 Internal method BBEPP
GC with FID Detector
Moulds (CFUg) lt10 3M-Nordval ndeg16 B
Yeasts (CFUg) lt10 3M-Nordval ndeg16 B
Anaerobic count (CFUg) lt10 SP-VG M005 B
Protein () tbd BCA protein assay
928
Figure S 1 - a) HPLC-ELSD chromatogram and composition table 929
930
931
932
933
3
b) 934
935
Group Ndeg δ ppm
CH2 1 354
CH2 2 153
CH2 3-712-14 132
CH2 811 203
CH 910 534
CH2 15 162
CH2 16 388
CH 1 424
CH 2 316
CH 3 334
CH 4 329
CH 5 354
CH2 6 366
Figure S 1 (next) ndash b) 1H NMR spectrum (MeOD-d4) recorded on the purified G-C181-OH compounds 936
and related assignment 937
938
2
811910 1rsquo
5rsquo1
3rsquo4rsquo
1rsquo1910
asymp asymp asympHDO MeOD Acetone
6rsquo2rsquo
1615
3-712-14
4
939
940
Figure S 2 ndash Cryo-TEM images recorded for a 5 mgmL G-C181-OH aqueous solution heat at T= 130degC 941
5
942
943
Figure S 3 - Cryo-TEM images recorded for a 5 mgmL G-C181-OH aqueous solution heat at T= 90degC 944
945
90degC
1
22
6
946
947
948
949
Figure S 4 ndash Cryo-TEM images recorded for a 5 mgmL G-C181-OH aqueous solution heat at T= 70degC 950
951
21
11
1
2
5
3
4
45
5
6
7
7
7
952
953
954
Figure S 5 ndash Cryo-TEM images recorded for a 5 mgmL G-C181-OH aqueous solution heat at T= 25degC 955
956
957
1
1 1
8
958
Figure S 6 ndash a) SANS experiment recorded at 90degC for a 5 mgmL G-C181-OH aqueous solution b-c) 959
WAXS experiments recorded on aqueous solutions of G-C181-OH at b) 5 mgmL and c) 25 mgmL d) 960
Structural interpretation of the repeating distances pointed out in c) 961
962
963
964
001 01 1
q Aring-1
25degC
68degC
88degC
111degC
01 1q Aring
-1
02 04 06 08 1q Aring
-1
001 01
10-1
100
101
Inte
nsity
cm
-1
q Aring-1
-2
T= 90degC
SANS WAXS WAXS
a) b) c)
dv
dL d= 144 Aring-1
di
ddH2O
dt
dvdL
dtdi d
d)
9
965
966
Figure S 7 ndash ssNMR MAS (10 kHz) experiments recorded on a G-C181-OH dry powder a) 1H spectra 967
recorded from 110degC to 70degC b) 13C single pulse (SP) spectra recorded with high power 1H decoupling from 968
110degC to 70degC c) 13C cross polarization (CP) spectra recorded at 110degC and contact time tc of 50 micros and 969
3000 micros d) 13C CP spectra recorded at 70degC and for 20 lt tc micros lt 3000 970
971
1
811
910
CH2 CH2
1rsquo
6rsquo
8 6 4 2 0 ppm
110
90
80
70
910
1rsquo
6rsquo16
1
2rsquo3rsquo4rsquo
811
OH
45 40 35 30 25 20 15
ppm
200 180 160 140 120 100 80 60 40 20 0
ppm140 120 100 80
ppm
CH2-gauche
3004
110
90
80
70
65
60
50
25
C91013003
C9 - 12869
CH2-all-trans
3198
C1rsquo10335
a) b)
1H
T degCT degC
13C Single Pulse MAS
A
B
A
B
70degC70degC
5rsquo
215
200 180 160 140 120 100 80 60 40 20 0
ppm
13C CPMAST= 110degC
200 180 160 140 120 100 80 60 40 20 0
ppm
132 131 130 129 128 127 126
ppm
106 105 104 103 102
ppm
13C CPMAST= 70degC
50
tc micros
3000
20
tc micros
50 500 1000 3000
tc micros
C102
13024 C910113003
C92
12869
C1rsquo213082
C1rsquo110443
A B
106 105 104 103 102
ppm
3000
1000
500
50
20
AB
c)
d)
10
972
Figure S 8 ndash a) Short and d) long T2 components displayed by the 1H transverse relaxation signal c) 1H 973
transverse relaxation signals recorded on a G-C181-OH dry powder from 110degC to 70degC The area of each 974
given resonance is plotted (log-lin) as a function of the echo time (CPMG pulse sequence) for each 975
temperature and fitted using the equation given above T2s and T2l indicate the short and long T2 relaxation 976
times respectively obtained by describing the 1H transverse relaxation signal using a biexponential decay 977
For H1rsquo H5rsquo and H6rsquo the 1H relaxation function could be described by a monoexponential decay 978
- Protons from the sugar group (H1rsquo H5rsquo H6rsquo) show a single T2 relaxation component (Figure 979
6c and Figure S 8) while protons of the acyl chain (CH2 H910 H811) show both short (Figure 980
6c) and long (Figure 6d) T2 relaxation component 981
- The short T2 relaxation time systematically decreases from 110degC to 70degC for all species by a 982
factor ranging from two to seven depending on the specific chemical group Very long T2 are 983
observed at 110degC for all acyl species while nearly unchanged values are measured below 984
90degC without any clear trend 985
- The sugar protons (H1rsquo H5rsquo H6rsquo) have the shortest set of T2 values (lt 1 ms) below 100degC 986
The long component of T2 generally ranges between 4 ms and 12 ms 987
0 1 2 3 4 5 6 7 8
00
05
10
15
20
25
30
35
40
45
Log
In
ten
sity
Time ms
0 1 2 3 4 5 6 7 8
00
05
10
15
20
25
30
35
40
45
Log
In
ten
sity
Time ms
0 1000 2000 3000 4000 5000 6000 7000 8000
00
05
10
15
20
25
30
35
40
45
Log
In
ten
sity
Time ms
0 1000 2000 3000 4000 5000 6000 7000 8000
00
05
10
15
20
25
30
35
40
45
Log
In
ten
sity
Time ms
0 1000 2000 3000 4000 5000 6000 7000 8000
00
05
10
15
20
25
30
35
40
45
Log
In
ten
sity
Time ms
0 1000 2000 3000 4000 5000 6000 7000 8000
00
05
10
15
20
25
30
35
40
45
Log
In
ten
sity
Time ms
H1
H8H11
H9H10
CH2
H1rsquo
H6rsquo
CH2
H910H811 H1CH2
H1rsquo H5rsquo6rsquo
0 1000 2000 3000 4000 5000 6000 7000 8000
00
05
10
15
20
25
30
35
40
45
Log
In
ten
sity
Time ms
OH
0 1000 2000 3000 4000 5000 6000 7000 8000
00
05
10
15
20
25
30
35
40
45 T= 110degC
T= 90degC
T= 80degC
T= 70degC
Log
In
ten
sity
Time ms
Fit
)
CH2 H910 H811 H1 H56 H1 OH
00
05
10
15
20
25
30
35
40
T2 m
s
T= 110degC
T= 90degC
T= 80degC
T= 70degC
CH2 H910 H811 H1
0
2
4
6
8
10
12
T2 m
s
T= 110degC
T= 90degC
T= 80degC
T= 70degC
Short T2(1H) Long T2(1H)
a) b)
c)
11
Table S 1 ndash 1H chemical shifts of G-C181-OH in solution and in the solid-state Solid-state spectra are 988
recorded at a MAS frequency of 10 kHz in DMSO-d6 broad peak 989
990
δH ppm
Group Ndeg Liquid
(MeOD-d4) Solid
(T= 110degC) Solid
(T= 70degC)
CH2 H1 354 357
CH2 H2 153 156
CH2 H3-712-14 132 135
CH2 H811 203 203
CH H910 534 534
CH2 H15 162 164
CH2 H16 388 383
CH H1 424 432
CH H2 316 335
CH H3 334 335
CH H4 329 335
CH H5 354 351 357
CH2 H6 366 383
OH OH1 432
45 463
OH OH2 492
OH OH3 490
OH OH4 487
OH OH6 445
991
992
H1H9H10H1rsquo
H6rsquo
OH2rsquo
OH1
12
Detailed discussion about the NOESY and DQ-SQ 2D 1H-1H ssNMR experiments presented in 993
Figure 9 994
995
2D 1H-1H ssNMR experiments are a unique tool to explore through-space proximities 996
between 1H nuclei ssNMR offers a large number of possibilities each adapted to a given 997
system The advantage of 2D maps with respect to a dynamics approach is their direct 998
readability in clear two nuclei which exchange their magnetization through-space (whichever 999
mechanism may be responsible for this exchange) will display a specific cross-peak However 1000
the way cross-peaks are presented and interpreted strictly depends on the nature of the pulse 1001
program which in turn is chosen according to the physical nature of the sample 1002
1D temperature-dependent 1H NMR experiments performed on G-C181-OH (Figure 1003
4a in the main text) indicate sharp peaks at 90degC and broad peaks at 70degC Narrow peaks 1004
indicate fast andor large-amplitude molecular tumbling averaging the strong 1H-1H dipolar 1005
interactions This excludes the use of pulse sequences like DQ-SQ which is not efficient under 1006
these conditions For this reason we employ spin-diffusion-based pulse sequences like 1007
NOESY which is more adapted for samples with high molecular mobility When mixing times 1008
are chosen to be short (lt 1 s) one generally explores through-space proximities within about 5 1009
10 Aring On the contrary when molecular motions are restricted dipolar coupling becomes 1010
significant 1H NMR peaks are broader and pulse sequences like DQ-SQ can now be used 1011
with a spatial resolution of less than 5 Aring 1012
Whenever possible DQ-SQ experiments are preferred over spin diffusion-based pulse 1013
sequences because they are more selective in particular for likewise interactions which are 1014
not discriminated in NOESY-type experiments This is illustrated by the typical interaction 1015
schemes for NOESY (top Figure 9a) and DQ-SQ (top Figure 9b) For two given A and B 1016
protons 2D NOESY maps will display two on-diagonal and two square-shaped symmetrical 1017
off-diagonal cross-peaks Off-diagonal cross-peaks illustrate the mutual A-B and B-A 1018
interaction but the on-diagonal peaks are systematic and do not prove any A-A or B-B 1019
interaction Similarly to NOESY 2D DQ-SQ maps display off-diagonal peaks (symmetric 1020
across the diagonal top Figure 9b) upon A-B and B-A interaction but in contrast they will 1021
display on-diagonal peaks only in the presence of self-interaction In the tutorial example of 1022
Figure 9b top the on-diagonal A-A peak indicates mutual A-A interaction while lack of on-1023
diagonal B-B peak evidences the absence of B-B proximities Combining NOESY and DQ-SQ 1024
experiments is capital to study the local arrangement of G-C181-OH and its evolution with 1025
temperature 1026
13
At T= 90degC the H1 and H5rsquo contributions are very close but possible to discriminate 1027
them (δ(H1)= 354 ppm δ(H5rsquo)= 351 ppm) according to 1H NMR chemical shifts in Table S 1028
1 2D 1H-1H NOESY in Figure 9a also discriminates between the two components attributed 1029
on the basis of the interactions with their mutual neighbors (green H1-H2 and H5rsquo-H1rsquo squares 1030
in Figure 9a) On this basis 2D NOESY does not show a direct H1rsquo-H1 correlation (blue red-1031
crossed) but rather an extensive network of intra-sugar interactions These features exclude 1032
suggest intra- and inter-sugar interactions and they exclude head-tail arrangements as a major 1033
molecular configuration at 90degC 1034
At 70degC the 1H NMR peaks are broader indicating a reduction of the T2 (1H) relaxation 1035
times andor residual homonuclear dipolar interactions excluding the use of NOESY In this 1036
case 1H-1H DQ-SQ correlation experiments are best suited Figure 9b presents the 1H-1H DQ-1037
SQ experiment on G-C181-OH at 70degC Peaks are broader than in NOESY and attribution may 1038
be cumbersome However the experiment is performed at 700 MHz and MAS= 22 kHz which 1039
improves spectral resolution with respect to the same experiment performed at 300 MHz and 1040
MAS= 10 kHz The auto-peak at δH= 356 ppm in the SQ dimension is attributed to H1-H1 spin 1041
pairs mainly resulting from intra CH2 interaction while the DQ cross-peaks at δH= 156-356 1042
ppm and δH= 432-356 ppm respectively origin from H2-H1 and H1rsquo-H1 interactions (Figure 1043
9b) DQ-SQ map does not show any auto-peak corresponding to H1rsquo-H1rsquo or Hxrsquo-Hxrsquo (x= 2rsquo 1044
3rsquo 4rsquo) interactions (red-crossed blue Figure 9b) thus excluding any proximity (lt 5 Aring) between 1045
close glucose neighbors On the contrary DQ-SQ maps (recorded both at 700 MHz Figure 9b 1046
or at 300 MHz not shown) systematically show DQ cross-peaks which can only be attributed 1047
to H1rsquo-H1 interactions (δH= 432-356) The presence of these H1rsquo-H1 interactions can only be 1048
explained by a head-tail arrangement of the G-C181-OH molecules as illustrated below the 1049
DQ-SQ map in Figure 9b 1050

15
Does G-C181-OH assume a bilayer or interdigitated structure the latter being the one 359
found for other similar bolaform glucolipids4243 The size of G-C181-OH can be estimated to 360
be at the most 32 Aring given by the length L of the C16 tail (L = 22 Aring from the Tanford formula 361
L= 154 + 1265 times n (n= 16)59) and the sugar (about 10 Aring)4243 However the cis conformation 362
of the C=C bond imposes a ldquokinkrdquo of 60deg in the aliphatic chain which reduces the effective 363
length of the oleic backbone to about 17 Aring for an effective total G-C181-OH length of about 364
27 Aring Cryo-TEM provides a tube thickness varying from 35 Aring to 60 Aring and a vesicle membrane 365
thickness of at least 60 Aring WAXS suggests an interlamellar thickness (membrane and water) 366
between 40 Aring and 37 Aring and an inter-lipid distance in the tube of about 16 Aring In the absence of 367
a clear form factor oscillation profile as found for similar glucolipids4243 one must 368
acknowledge that these data pledge neither in favor of fully interdigitated nor a double layer 369
structure and might suggest a tilted lipid arrangement with partial interdigitation60 370
371
13C ssNMR demonstrates that G-C181-OH can assume two coexisting head-head and 372
head-tail configurations 373
Vesicles are characterized by low positive mean and gaussian curvatures while 374
nanotubes are described by a combination of a high positive mean and zero gaussian curvatures 375
In this regard the coexistence of vesicles and nanotubes requires glucolipids to adapt 376
themselves to both environments at the same time For this reason the formation of nanotube-377
vesicle networks generally requires a specific driving force able to impose a high mean and 378
zero gaussian curvature to the membrane In many systems insertion of at least a second 379
constituent (lipid surfactant protein) in the membrane becomes a necessary internal driving 380
force for the nucleation and growth of so-called membrane inclusions from which 381
topologically-connected nanotubes can form10ndash123261 as explained by orientational ordering 382
arguments62 It has also been shown that external driving forces such as use of laser 383
ldquotweezersrdquo30 osmotic pressure6 electroformation5ndash82829 or controlled suction13ndash16 are 384
otherwise necessary as also supported by theoretical studies19 385
The bending energy of tubes is higher than that of a vesicle membrane8 due to the 386
dependence of the membrane free energy from the principal curvatures For this reason 387
isotropic (rotational symmetry along the main axis) but also anisotropic33 lipids generally 388
stabilize low-curvature shapes like flat membranes or vesicles Lipid nanotubes are also a 389
common phase formed by amphiphiles but generally for lipids with a certain complexity in 390
their molecular structures as exampled by diacetylenic derivatives of phospholipids among 391
others262763ndash65 Negative contributions to the bending energy favoring the simultaneous 392
16
presence of interconnected vesicles and tubes was shown to be driven by the presence of 393
anisotropic lipids in a membrane continuum Spontaneous deviations to the elastic theory in the 394
presence of surfactants lipids and proteins with anisotropic structures favor the formation of 395
protrusions with radius of the order of the fraction of a micron9ndash1219ndash2362 396
In the absence of both internal and external driving forces mentioned above G-C181-397
OH should behave as a standard lipid Its DSC profile (Figure 2)536667 under both hydrated and 398
dry conditions identifies a hydration-independent transition (Tm1) slightly above room 399
temperature this is followed by one main transition at higher temperature (Tm2) in the dry 400
sample50 For such a profile one expects a gel phase (Lβ) below Tm1 and a liquid crystalline 401
structure possibly in the morphology of vesicles (L4 phase) possibly above Tm1 and most likely 402
above Tm231 as experimentally found On the basis of the thermogram recorded on the dry 403
powder one may also expect a ldquoripplerdquo (Pβ) phase between Tm1 and Tm2 characterized by 404
periodic undulations of the bilayer (generally addressed to as regions with both liquid order and 405
disorder)5455 406
In the present work instead of a Lβ phase we observe flat crystals below Tm1 and a 407
vesicle-nanotube network instead of the ldquoripplerdquo phase The latter is particularly unexpected 408
because the membrane is composed of a single-component (G-C181-OH) and no anisotropic 409
external force (osmotic hydrodynamic electric) is used to pull and stabilize the tubes In 410
addition the nanotubes are observed at fairly high temperatures above Tm1 (between about 411
60degC and 90degC) while this morphology is generally favored at low temperature (proportionality 412
with 1kT figure 5 in Ref 62) commonly below a given transition temperature characteristics 413
for each specific amphiphile27 Furthermore nanotubes of G-C181-OH seem to be stable in 414
time thus differing from what is found in electroformed vesicles78 They are also observed 415
away from phase transition events (may them be at Tm1 or Tm2) as otherwise reported before 416
for a diacetylenic derivative of phosphatidylcholine26 and many other systems27 417
A stable nanotube-vesicle network for a single-component phospholipid in the absence 418
of external driving forces is not expected and has never been reported before It could be 419
explained by the coexistence of two micro-separated phases of different rigidity This 420
hypothesis is excluded by confocal microscopy on Laurdan-labelled membranes and magic 421
angle spinning (MAS) solid-state NMR (ssNMR) experiments 422
Laurdan is a well-known fluorophore used to put in evidence the coexistence of rigid 423
and fluid domains in both model and biological membranes47ndash49 Laurdan was used here to label 424
the G-C181-OH membranes between Tm1 and Tm2 and to verify the possible micro-segregation 425
and coexistence of rigid (eg Lβ λem= 440 nm) and fluid (eg Lα λem= 490 nm) domains in 426
17
tubes and vesicles respectively A set of quantitative experiments performed on a 5 mgmL-1 427
solution summarized in Figure 5 shows an excess of fluorescence at only λem= 490 nm for 428
temperature between 90degC and 70degC (Figure 5h) The GP value which quantifies the rigidfluid 429
character of the membrane is systematically negative (Figure 5i) indicating an overall fluid 430
membrane at all temperatures GP is quantified on more than 50 regions of interest (ROIs) at 431
each temperature including vesicles and tubes alone as well as connected nanotube-vesicles 432
(Figure 5d-g) The dispersion of GP at 80degC and 70degC between -08 and -02 could suggest the 433
spurious presence of membranes with various degrees of flexibility although fluidity is always 434
predominant The combination of WAXS (broad peak d= 144 Aring-1 invariant with 435
temperature Figure S 6bc) and confocal fluorescence microscopy using Laurdan confirms the 436
single-phase of the membrane composed of G-C181-OH both in vesicles and nanotubes This 437
is also consistent with the lack of phase transitions in DSC experiments between ~85degC and 438
~60degC especially in hydrated samples We conclude that the vesicle-nanotube transition is not 439
driven by the local segregation of gel phase (Lβ) microdomains nor that the nanotubes are 440
composed of such phase 441
ssNMR is the best-suited approach to investigate the origin of the local driving force for 442
the nucleation of anisotropic inclusions of which the average orientation depends on the local 443
membrane and inclusion curvatures and was shown to promote tubing62 ssNMR can provide 444
information on the local molecular mobility eg through the nuclear spin relaxation behavior 445
but also on intermolecular interactions and stereochemistry eg through variations in the 446
chemical shift68ndash70 447
Ideally ssNMR should be performed on diluted G-C181-OH samples above Tm1 448
However fast MAS necessary for high resolution centrifuges the sample As a first 449
approximation hydrated G-C181-OH samples for instance at 50 wt as classically done for 450
phospholipids71 could be studied Unfortunately permeability of the sample holder combined 451
to heating (close to the boiling point of water) and MAS provoke dehydration and even sample 452
ejection After experiencing both of the above this approach was abandoned As a second 453
approximation the study of the dehydrated G-C181-OH powder avoids centrifugation and 454
evaporation If studying dried lipids may not reflect their exact behaviour under diluted 455
conditions valuable structural information can still be obtained in dehydrated molecular 456
systems like proteins thus illustrating that this approach is not unreasonable Furthermore if 457
DSC (Figure 2a) shows that hydration suppresses the Tm2 it also shows that the value of Tm1 is 458
not affected by water at concentrations as low as 10 wt For this reason performing a 459
structural analysis of dehydrated G-C181-OH by ssNMR above Tm1 may help understanding 460
18
the local arrangement of G-C181-OH in two morphologies vesicles and nanotubes having 461
sensibly different curvatures 462
To explore the local mobility of the most relevant chemical groups of G-C181-OH 463
above Tm2 (T= 110degC) and between Tm2 and Tm1 (70 lt T degC lt 90) we combine a series of 1H 464
and 13C experiments Single-pulse (SP) MAS experiments (1H and 13C) when recorded under 465
quantitative conditions allow the detection of all chemical species while cross-polarization 466
(CP) MAS (13C only) experiments are sensitive only to constrained groups for which the 1H-467
13C dipolar coupling is not averaged to zero by the molecular motions 468
469
Figure 6 ndash a) 1H MAS (10 kHz) ssNMR spectra recorded from 110degC to 70degC b) 13C MAS (10 kHz) ssNMR 470
spectra recorded using high power decoupling single pulse (SP) and cross-polarization (CP) pulse sequences 471
Contact time for CP experiments and corresponding temperatures are given on each spectrum Full spectra 472
are given in Figure S 7 473
The most relevant 1H and 13C spectra are given in Figure 6 (full range in Figure 7 and 474
Figure S 7) As expected the 1H solid-state SPMAS spectra show broader peaks compared to 475
the solution-state NMR spectrum (Figure 6a) reflecting the obvious solid-state character of the 476
sample at any temperature The sugar group and the C=C bond resonate in the 25-6 ppm range 477
and 535 ppm respectively while the OH groups of the sugar moiety are found below 45 ppm 478
(Figure 6a full assignment in Table S 1) Very broad (~1 ppm) at 100degC the position of the 479
OH peak varies with the temperature value and becomes narrower (lt~05 ppm) and visible at 480
δH= 464 ppm at T= 70degC Line narrowing and chemical shift variations of the OH resonance 481
in ssNMR is always a direct sign of H-bonding interactions whereas the strength of the H-482
bonding hence its OHhellipH distance is correlated to a dispersion in chemical shifts72ndash75 All other 483
60 55 50 45 40 35 30 25
ppm
110
90
80
70
910
1rsquo
6rsquo16
1
OH
134 132 130 128 126
ppm110 108 106 104 102 100
ppm
SP (T= 110degC)
SP (T= 70degC)
CP 50 ms (T= 70degC)
CP 3 ms (T= 70degC)
910 1rsquo
1H 13C
1
811
910
CH2 CH2
1rsquo
6rsquo
a) b)
C102
13024
C9101
13003
C92
12869 C1rsquo210382
C1rsquo110443
C1rsquo13035
2rsquo3rsquo4rsquo
T degC
5rsquo
19
resonances broaden from 110degC to 70degC thus indicating slower andor more anisotropic 484
reorientational motions of all chemical groups The specific dynamic behaviour of the sugar 485
headgroup is also reflected by its 1H transverse relaxation time T2 whereas the shorter the T2 486
the higher the rigidity Experiments performed between 110degC and 70degC shown and 487
commented in Figure S 8 in the Supporting Information globally show a single short (lt 1 ms 488
below 100degC) T2 relaxation component for H1rsquo H5rsquo and H6rsquo and two both short and long 489
(between 4 ms and 12 ms) T2 for the acyl chain (CH2 H910 H811) even below 100degC 490
At 110degC 13C SPMAS experiments (Figure 6b full range in Figure 7 and Figure S 7 491
assignments in Table 1) show a single peak at δC= 10335 ppm for C1rsquo and at δC= 13003 ppm 492
for C910 as expected for a symmetrical conformation with two chemically-equivalent 493
carbons76 At 70degC the C1rsquo peak disappears while C910 now shows two peaks around 128 494
ppm and 130 ppm (Table 1 full temperature series in Figure S 7b) attributed to C92 (δC= 12869 495
ppm) and C10 in a non-symmetric configuration respectively for which these two carbons are 496
chemically inequivalent76 More precisely the resonance at 130 ppm is actually the 497
superposition of two close resonances C9101 (δC= 13003 ppm) and C102 (δC= 13024 ppm) 498
where subscripts 1 and 2 stand for two different conformations of the cis-olefin group as 499
reported for various phases of oleic acid in the vicinity of 0degC76 500
501
Table 1 ndash 13C Chemical shifts of G-C181-OH in solution and solid-state Solid-state experiments are 502
recorded at MAS= 10 kHz All spectra are reported in Figure 7 and Figure S 7 The contact time for cross 503
polarization is 3 ms In all ssNMR experiments temperature is first raised at 110degC and then lowered to 504
either 90degC or 70degC Attribution of the 13C resonances in Table 1 is performed on the basis of the solution 505
spectrum (Figure S 1b) Additional peaks observed in both single pulse and cross polarization ssNMR 506
experiments are attributed when possible to a configuration effect of the given atom eg C9101 and C92 507
indicate two configurations of C9 All new peaks observed in solid-state and not detected in solution are 508
highlighted in red for convenience 509
510
511
δ ppm
Peak Liquid (DMSO-d6)
Solid Single Pulse
T= 110degC
Solid Single Pulse
T= 90degC
Solid Single Pulse
T= 70degC
Solid Cross Polarization
T= 70degC
C102
- - 13024 13024
C910C9101 13009 13003 13003 13003 13003
C1C9C10C1rsquo
C6rsquo
20
C92 - - - 12869 12869
C1rsquoC11 10329 10335 10335 - 10443
C12 - - - - 10382
C3 7724 7709 7702 - 7829
- 7634 7629 - 7621
7525
C2 7388 7398 7390 7370 7370
C4 7052 7077 7054 7041 7098
C16 6900 7016 - - 7029
- - - - 6793
C1C5C6 6153 6241 6236 6239 6262
C1C5C6 6117 - - - 5956
C2 3300 3290 3290 3283 3279
CH2(trans) - - - 3198 3196
CH2(gauche)C15 2941 2981 2987 3004 -
C811 2706 2747 2747 2832 2817
CH2 2597 2625 2628 2630 2817
512
13C CPMAS spectra at 70degC (Figure 6b full range in Figure 7 and Figure S 7d) at 513
increasing contact times confirm the presence of two cis-olefin environments one for which 514
C910 are equivalent labelled here C9101 and one for which they are inequivalent labelled 515
C92 C102 Both environments are rigid enough to be observed at short contact time (tc= 50 μs) 516
A similar double environment is also observed for the sugar C1rsquo CPMAS at 70degC shows two 517
peaks (C1rsquo1 at δC= 10443 ppm C1rsquo2 at δC= 10382 ppm Figure 6b Figure S 7d) These are 518
significantly shifted downfield from the C1rsquo peak observed at 110degC and are detected at contact 519
times as short as 50 μs thus indicating their rigid character One also finds that CPMAS is 520
totally inefficient at 100degC for short contact times (50 μs) and poorly efficient even at 3 ms 521
typical of fast-tumbling molecules (Figure S 7c) also both gauche (δC= 3004 ppm) and all-522
trans (δC= 3198 ppm) conformations of the CH2 carbons coexist at 70degC (Figure S 7b)77 523
According to ssNMR one main mobile molecular environment exists at 110degC as 524
shown by the well-resolved 1H spectrum single C=C (C9101) and anomeric (C1rsquo) resonances 525
gauche conformation of the aliphatic CH2 and single T2 of the aliphatic CH2 chain and sugar 526
protons The sugar group is certainly mobile (inefficient 1H13C CPMAS) but still more 527
constrainted than the acyl chain (shorter T2 (1H)) As the temperature is lowered the overall 528
rigidity increases (broadening of 1H NMR peaks faster 1H transverse relaxation and efficient 529
1H13C magnetization transfer during CPMAS) presumably driven by H-bonding 530
interactions (downfield shift and line narrowing of the OH 1H signal very short OH T2 loss of 531
the C1rsquo signal in SPMAS) At the same time a number of spectroscopic data (two concomitant 532
21
resonances for anomeric C1rsquo1 and C1rsquo2 cis-olefin C9101 and C92 C102 and CH2 gauche and 533
all-trans environments) and relaxation behaviour (fast and slow T2 relaxation components) 534
strongly suggests the coexistence of two molecular environments Further proofs of the 535
coexistence of two distinct molecular domains are given by a number of chemical shift 536
variations in the 13C CPMAS spectrum at 70degC compared to the one at 110degC 90degC and 537
solution This is shown in Figure 7 and in the list of 13C chemical shifts in Table 1 538
539
540
Figure 7 - Comparison between solution- and solid-state 13C NMR spectra of G-C181-OH Solid-state 541
experiments are recorded directly on the sample powder at a MAS of 10 kHz (4 mm zirconia rotor) SP 542
Single Pulse CP Cross Polarization In all the ssNMR experiments temperature is first raised at 110degC 543
and then lowered to either 90degC or 70degC Segmented lines are meant to highlight the known peak position 544
in solution thus stressing the strong chemical shift variations in the solid-state 545
546
NMR experiments above Tm2 suggest that vesicles could contain G-C181-OH with a 547
single family of mobile conformations characterized by chemically-equivalent C=C (red 548
Figure 8b) and a single C1rsquo conformation (green Figure 8b) Experiments between Tm1 and Tm2 549
otherwise suggest that two coexisting conformations characterized by chemically-equivalent 550
(red Figure 8b) and inequivalent (magenta Figure 8b) C=C could be associated to nanotubes 551
Two distinct C1rsquo sites (grey Figure 8b) also indicate two configurations of the sugar headgroup 552
A comment on this point will be given in the following paragraphs 553
The local (Aring-scale) variation of molecular mobility below Tm2 drives the coexistence of 554
two distinct molecular environments of the same G-C181-OH molecule This occurs within a 555
single-phase domain (as deduced by WAXS) of equivalent membrane rigidity (as derived from 556
Laurdan probe in confocal microscopy) Although never reported before the difference in the 557
local mobility of the same amphiphile (here G-C181-OH) could satisfy the theoretically-558
140 120 100 80 60 40 20
CP(3 ms)-70degC
SP-70degC
SP-90degC
SP-110degC
ppm
LiquidC910
C1rsquo
C2rsquo
C4rsquo
C3rsquo
C1
C6rsquoC5rsquo
C1
6
C8
11
C2 C
H2
C1
5
CH
2
DM
SO
13C
22
required conditions that induce local lipid segregation and formation of membrane inclusions 559
(Figure 8c) In case of their non-zero average orientation the local membrane curvature 560
increases62 and nanotubes can spontaneously form (Figure 8bc) More intriguing this 561
mechanism occurs at least 10degC above Tm1 although it should not be favored above the Tm27 562
From both experimental and theoretical backgrounds the conditions of topologically-563
connected vesicles-nanotubes systems are met only when either internal (two components) or 564
external driving forces are applied19 In the present single-lipid system of which the phase 565
behavior is summarized in Figure 8a the most plausible driving force could be explained by 566
the NMR results collected on the dry sample G-C181-OH concomitantly occupies two 567
molecular environments characterized by 1) two distinct conformations of the sugar 568
displaying equivalent mobility and 2) two conformations of the acyl chain unsaturation 569
570
23
571
Figure 8 ndash a) Thermotropic phase behavior of G-C181-OH at 5 mgmL-1 Note that Tm2 is observed on the 572
dry powder only b) Possible relationship between the molecular environment as derived from NMR and 573
membrane curvatures All the molecular drawings refer to the same G-C181-OH molecule (bulky ellipsoid 574
equiv sugar headgroup) while each color corresponds to a given configuration Grey of C1rsquo1 and C1rsquo2 indicates 575
the uncertainty about the assignment of the specific NMR peak The curvature C is defined as 1R R being 576
the curvature radius R1 R2 radius of curvature CG Gauss curvature CM Mean curvature c) Free 577
interpretation of the anisotropic high-curvature (CMgt 0 CG= 0) inclusions in the membrane (low CM and 578
CG) continuum driven by inter-sugar H-bonding and reduced intramembrane diffusion for a G-C181-OH 579
glucolipid 580
581
Flat crystalline structure
Nanotube-vesicle network
Vesicles
48degC
120deg
106 105 104 103 102 101
ppm
H9 H10H1rsquo
106 105 104 103 102 101
ppm106 105 104 103 102 101
ppm106 105 104 103 102 101
ppm
C=CC=C
C1rsquo1C1rsquo2
C1rsquo
Tm2(96degC)Tm1
a)
b)
c)
Same molecule different local orientations and sugar conformations
High curvature membrane
Low curvature inclusion
Flip-FlopStrong H-bonding
CG
CM ( + )
CG 0
CM 0 CG 0
CM 0
G-C181-OH
24
Two related questions are unanswered at the moment What actually drives nanotube 582
formation and is the organization of G-C181-OH within the vesicles and tubes the same Lipid 583
nanotubes have been studied for at least three decades over which broad experimental and 584
theoretical insight has been generated Despite this fact the actual understanding is still matter 585
of debate27 Micelle-to-nanotube and vesicle-to-nanotube phase transitions are generally 586
reported for single amphiphiles below a given Tm and intermediate phase composed of twisted 587
and flat fibers is concomitantly reported Initially thought to be a chirality-driven phenomenon 588
recent studies propose a more general mechanism involving crystallization and symmetry 589
breaking in the lipid packing driven by optimal packing27 If twisted ribbons were observed 590
before for a number of microbial glycolipid bolaamphiphiles44 they are not found for G-C181-591
OH This fact as well as the large body of cryo-TEM images and the observation of nanotubes 592
above Tm1 rather pledge in favour of a direct topological change from positive (vesicles) to 593
zero (nanotubes) Gaussian curvatures In this case vesicle-to-nanotube transitions could be 594
driven by external forces56307813ndash162829 595
Considering the absence of external forces in the present system there are only two 596
possibilities left spontaneous budding of the membrane or nanotube pulling after inter-vesicle 597
collisions due to Brownian motion Both are possible as inclusions composed of a different 598
arrangement of the same molecule in the membrane continuum can theoretically explain 599
spontaneous nanotube formation in an isotropic medium672223629ndash1218ndash21 However the second 600
one is probably more likely to prevail because it could explain the large number of nanotubes 601
connecting two distant vesicles Interestingly similar events occur for any phospholipid-based 602
vesicular solution but nanotubes are extremely rare unless at least two lipids of different 603
molecular structure are mixed together The spectroscopic 1H and 13C and relaxation (1H) 604
ssNMR data even if collected on a dry powder demonstrate that the coexistence of two G-605
C181-OH configurations involving both the sugar headgroup and fatty alcohol chain are 606
possible for this molecule As a matter of fact this is not so surprising as more than one energy 607
minima each corresponding to a given conformation are known for glucose its non-reducing 608
derivative methylglucose and carbohydrates in general78ndash80 609
The presence of two configurations could explain the coexistence between two 610
structures of different curvature but the data presented so far do not explain the origin of these 611
two configurations In other words what drives the change in the local structure of the sugar 612
headgroup and fatty alcohol within the membrane 613
The association of known self-assembled structures to spectroscopic 13C ssNMR data is 614
known for years in particular for gluconamides lipids having a linear sugar headgroup81ndash84 It 615
25
was found that gauche effects in some cases up to the γ position in the sugar chain induce 616
upfield chemical shifts while anti and trans conformations result in downfield shifts Each 617
structure (monolayer crystal bilayer crystal or micellar fiber) was then characterized by a given 618
organization of the gluconamide and a characteristic 13C ssNMR fingerprint which could be 619
explained by gauche γ-gauche anti and trans conformations of the headgroup Similar 620
structural-spectroscopic correlations have been collected over the years for much simpler cyclic 621
sugars85 whereas pyranoses can undergo important conformational changes (chair half-chair 622
boat skew) when the appropriate energy barriers are crossed78ndash8086 A quantitative 623
conformational study based on the 13C chemical shift variations shown in Table 1 would be 624
certainly helpful but very delicate in the context of the present state of the art because a 625
rigorous approach requires at least one known crystal structure8182 which is currently missing 626
for this compound A qualitative approach will then be adopted 627
G-C181-OH is a bolaform amphiphile and flip-flop could be a possible mechanism 628
involved in the nanotube stabilization whereas head-tail interactions have long been considered 629
as important in nanotube-forming bolaform amphiphiles6063 From mere considerations based 630
on T2 (1H) relaxation arguments one could exclude head-tail configurations if the R-CH2OH 631
endgroup (H1) was involved in a direct interaction with the sugar group its corresponding T2 632
would probably be comparable to the sugarrsquos one (OH and H1rsquo) but this does not seem to be 633
the case However this hypothesis would be based on the comparison of the relaxation from 634
CH and CH2 protons additionally involved in different kind of motions Besides the relaxation 635
of H1 is influenced by the strong overlap between H1 and H5rsquo For these reasons relaxation 636
arguments are not solid enough and will not be used 637
We then address this question by exploring intermolecular interactions in a direct 638
manner using 2D 1H-1H homonuclear ssNMR correlation spectroscopy At 90degC in the fast-639
tumbling domain of molecular motion (narrow 1H NMR peaks Figure 6a) and corresponding 640
to the vesicle-rich region spin diffusion (NOESY) experiments are preferred over dipolar 641
coupling based experiments because such interaction is averaged out by molecular motion 642
However when the molecular motion is more constrained in the domain of nanotube stability 643
at 70degC (broad 1H spectra Figure 6a) Double-Quantum Single-Quantum (DQ-SQ) correlation 644
experiments are best suited to probe interaction between close molecular neighbors These 645
experiments are reported in Figure 9 and the related interpretation is only briefly reported 646
below while a more detailed discussion can be found on Page 12 in the Supporting Information 647
26
648
Figure 9 ndash a) 2D 1H-1H NOESY NMR experiment performed at MAS= 10 kHz (4 mm probe) on a Bruker 649
300 MHz Avance III HD spectrometer using 300 ms of mixing time Sample temperature is regulated to 650
90degC reached by cooling from 110degC b) 2D 1H-1H DQ-SQ (BAck-to-BAck BABA pulse sequence used for 651
the DQ excitation scheme) NMR experiment performed at MAS= 22 kHz (25 mm probe) on a Bruker 700 652
MHz Avance III spectrometer using a DQ excitation time equal to 2 rotor periods Sample temperature is 653
regulated to 70degC reached by cooling from 110degC The typical schemes illustrating how to interpret these 654
2D experiments are reported above each experimental map Zooms of the sugar region and configurational 655
interpretation are given below each 2D map More information are given in the text below 656
H16-H16
H1-H1
H9-H10
H1rsquo-H1
H1rsquoH910 H16
H1
H1rsquo-H1rsquo
Hxrsquo-Hxrsquo
2
(pp
m)
(ppm)
315
811910 1rsquo
2rsquo2
3rsquo 4rsquo6rsquo
5rsquo
1rsquo2910
asymp asymp asympHDO MeOD Acetone
1
315
811 9101rsquo
2rsquo2
3rsquo4rsquo6rsquo
5rsquo
1rsquo2 9 10
asympasympasympHDOMeODAcetone
H1rsquo-H1
1rsquo
1
(p
pm
)
(ppm)
H1-H2
H1rsquo-H1
H1rsquo
H910
H1H5rsquo
H2
H1rsquo-H5rsquo
315
811910 1rsquo
2rsquo2
3rsquo 4rsquo6rsquo
5rsquo
1rsquo2910
asymp asymp asympHDO MeOD Acetone
1
H2rsquoH3rsquoH4rsquo
H2rsquoH3rsquoH4rsquo
X= 2rsquo3rsquo4rsquo
NOESY - T= 90degC
1H
1H
1H
1H
DQ-SQ - T= 70degC
a) b)
2
(pp
m)
(p
pm
)
(ppm)
A B
AhellipB
AhellipA
BhellipB
NOESY
(ppm)
A B
AhellipB
DQ-SQ
Single-quantum dimension
Do
ub
le-q
ua
ntu
m d
imen
sio
n
AhellipA
BhellipB
BhellipA
BhellipA
315
811910 1rsquo
2rsquo2
3rsquo 4rsquo6rsquo
5rsquo
1rsquo2910
asymp asymp asympHDO MeOD Acetone
1
lt 5 Aring
lt 5 Aring
H1-H2
H811
H15
H16
H6rsquo
H1rsquo
H1
H5rsquo
H2
H1-H2
H1rsquo-H1
H1rsquo-H5rsquo
H1rsquo
H1 H5rsquo
H1rsquo
H1
H5rsquo
H1H2rsquo H3rsquo H4rsquo
H1-H1
H1rsquo-H1
Hxrsquo-HxrsquoX= 2rsquo3rsquo4rsquo
H1-H2
H1rsquo
Zoom sugar region 28 ndash 45 ppmNOESY DQ-SQ
27
Head-tail or head-head configurations could be probed by the existence of H1rsquo-H1 657
interactions whereas H1 (δH= 356 ppm) is associated to the glucolipid tail and H1rsquo (δH= 432 658
ppm) to the sugar headgroup These atoms are more than 15 Aring apart and a direct interaction 659
could not be observed in both NOESY and DQ-SQ experiments NOESY experiments (Figure 660
9a) show that H1rsquo-H1 correlations are not observed Meanwhile clear-cut direct H1rsquo-H1 661
interactions are indeed observed are detected at T= 70degC (DQ cross-peaks related to H1rsquo-H1 662
correlation in DQ-SQ experiment shown in Figure 9b) Interestingly the absence of auto peaks 663
at δH= 432 ppm and δH= 335 ppm in the SQ dimension excludes H1rsquo-H1rsquo and Hxrsquo-Hxrsquo (x= 2 664
3 4) interactions respectively strengthening the idea that sugar headgroups from two nearest-665
neighbor G-C181-OH molecules are not adjacent in the nanotube-vesicle region 666
Homonuclear 2D ssNMR supports the idea according to which G-C181-OH can 667
undergo molecular flip-flops and a head-tail arrangement in the dry product Extrapolating these 668
conclusions in the lower concentration range lack of H1rsquo-H1 proximity at T= 90degC suggests a 669
head-head configuration in the vesicle-rich region and head-tail configuration within the 670
nanotubes It is however still unclear whether flip-flops are driven by spontaneous temperature-671
induced conformational changes in the glucolipid packing stimulating inclusions within the 672
membrane itself672223629ndash1218ndash21 or by defects generated by inter-vesicle collisions In fact a 673
combination of both is not unlikely Nanotubes are not stable when temperature is 20 to 30 674
degrees above Tm1 indicating that inter-vesicle collisions alone cannot explain the unusual 675
phenomenon In an energy landscape approach87 the head-head configuration is certainly 676
favored at high temperature while both head-head and head-tail configurations could be 677
favored in the mid-temperature region corresponding to the range between Tm1 and Tm2 in the 678
dry powder Both statistical and defect-induced flip-flop events contribute to form high mean 679
zero Gaussian curvature morphologies (nanotubes) for which the head-tail conformation 680
limiting the proximity between bulky sugar headgroups is probably more adapted (Figure 8c) 681
The flip-flop interpretation now reasonably explains the strong differences in the sugar and fatty 682
alcohol conformations deduced by the multiple NMR signals attributed to chemically-683
equivalent groups The existence of various low-energy conformations each having specific 684
NMR signature for sugars in solution78ndash8086 and solid-state81ndash84 further supports our 685
interpretation 686
One last point should be clarified Why between Tm1 and Tm2 are two molecular 687
environments able to coexist instead of a single one of average rigidity as found in the case of 688
ldquoripplerdquo phases50ndash54 We believe that this question can be answered based on the NMR results 689
the relatively short T2 values of the H1rsquo and OH protons shows the constrained mobility of the 690
28
sugar headgroup despite a certain flexibility of the chain (long T2 component) This trend may 691
suggest restrictions in translational mobility probably due to the sugar-OH hydrogen bonding 692
(Figure 8c) meaning that lipids are not able to diffuse within the membrane thus keeping two 693
different configurations stable 694
695
Conclusions 696
Topologically-connected nanotube-vesicle lipidic systems are commonly observed for 697
self-assembled membranes composed of at least two amphiphiles and spontaneously driven by 698
anisotropic inclusions andor by external directional forces This work shows that strong 699
differences in membrane curvature can spontaneously occur in single-lipid systems without 700
external anisotropic forces Coexistence and interconnection between nanotubes and vesicles 701
are evidenced via cryo-TEM and fluorescence confocal microscopy in a single-phase region at 702
temperature above a transition temperature Tm1= 483degC determined by DSC on the hydrated 703
sample but below the second transition temperature Tm2 (957degC) determined by DSC on the 704
dry powder X-ray diffraction (WAXS) also shows the coexistence of two lattice periods one 705
attributed to an inter-membrane repeating distance and the other possibly related to the intra-706
nanotube glucolipid arrangement Labelling the systems with Laurdan a fluorophore of which 707
the emission strongly varies with the local membrane rigidity excludes the presence of rigid 708
micro-separated phases (eg Lβ) 709
1H and 13C ssNMR despite the fact that it can only be performed on the dry powder 710
confirm the presence of one main fluid G-C181-OH environment above Tm2 Below Tm2 the 711
splitting of some 13C peaks and the coexistence of short and long 1H relaxation components 712
demonstrate that G-C181-OH can simultaneously pack into structurally and dynamically 713
inequivalent environments Combining advanced 2D 1H-1H correlation experiments based on 714
spin diffusion or double-quanta excitation suggests that vesicles could contain a preferred head-715
head configuration of the bolaform lipid while nanotubes a preferred head-tail assembly 716
The presence of two environments composed of the same molecule characterized by 717
different molecular configurations and rigidity fulfills the theoretical conditions necessary to 718
spontaneously nucleate a membrane inclusion of non-zero average orientation described as 719
necessary to observe topologically-connected nanotube-vesicle structures in the absence of 720
external forces This hypothesis could also be enriched by the possibility of nanotubes to be 721
pulled away between two vesicles after a collision event 722
This work expands the actual theoretical and experimental framework on lipid networks 723
stabilized by a different radius of curvature It could also motivate the synthesis or isolation 724
29
of new lipids providing a higher level of 3D architectural control in soft networks possibly in 725
the range of room temperature 726
727
Acknowledgements 728
Dr Andrea Lassenberger and Dr Sylvain Preacutevost at Institut Laue Langevin (ILL Grenoble 729
France) are kindly acknowledged for their assistance on the SANS experiment Confocal 730
images were performed at the Institut de Biologie Paris Seine (IBPS) imaging facility Jean-731
Franccedilois Gilles (Imaging Core Facility Institut de Biologie Paris Seine (IBPS) CNRS 732
Sorbonne Universiteacute Paris France) is kindly acknowledged for his assistance on the confocal 733
microscopy imaging Dr Guillaume Laurent (LCMCP Sorbonne Universiteacute Paris France) is 734
kindly acknowledged for helpful discussions The French region Ile-de-France SESAME 735
program is acknowledged for financial support (700 MHz NMR 736
spectrometer) Dr Olivier Diat (ICSM Marcoule France) Prof eronikaIglič and Prof V Aleš737
onsul discussi Slovenia) are kindly acknowledged for helpfUniversity of LjubljanaIglič (-Kralj 738
739
Financial support 740
WAXS experiments have been supported by Soleil Light Source Saint Aubin France proposal 741
Ndeg 20201747 SANS experiments have been supported by ILL proposal Ndeg9-13-778 742
743
References 744
1 D Kabaso N Bobrovska W Goacuteźdź E Gongadze V Kralj-Iglič R Zorec and A 745
Iglič Bioelectrochemistry 2012 87 204ndash210 746
2 C R Safinya U Raviv D J Needleman A Zidovska M C Choi M A Ojeda-747
Lopez K K Ewert Y Li H P Miller J Quispe B Carragher C S Potter M W 748
Kim S C Feinstein and L Wilson Adv Mater 2011 23 2260ndash2270 749
3 P Veranič M Lokar G J Schuumltz J Weghuber S Wieser H Haumlgerstrand V Kralj-750
Iglič and A Iglič Biophys J 2008 95 4416ndash4425 751
4 A Rustom R Saffrich I Markovic P Walther and H-H Gerdes Science (80- ) 752
2004 303 1007ndash1010 753
5 M I Angelova S Soleacuteau P Meacuteleacuteard F Faucon and P Bothorel Prog Colloid 754
Polym Sci 1992 89 127ndash131 755
6 L Mathivet S Cribier and P F Devaux Biophys J 1996 70 1112ndash1121 756
7 V Kralj-Iglič G Gomišček J Majhenc V Arrigler and S Svetina Colloids Surfaces 757
A Physicochem Eng Asp 2001 181 315ndash318 758
30
8 V Kralj-Iglič A Iglič G Gomišček F Sevšek V Arrigler and H Haumlgerstrand J 759
Phys A Math Gen 2002 35 1533ndash1549 760
9 M Drab D Stopar V Kralj-Iglič and A Iglič Cells 2019 8 626 761
10 A Zidovska K K Ewert J Quispe B Carragher C S Potter and C R Safinya 762
Langmuir 2009 25 2979ndash2985 763
11 A Zidovska K K Ewert J Quispe B Carragher C S Potter and C R Safinya Soft 764
Matter 2011 7 8363ndash8369 765
12 A Zidovska K K Ewert J Quispe B Carragher C S Potter and C R Safinya 766
Biochim Biophys Acta - Biomembr 2009 1788 1869ndash1876 767
13 M Karlsson K Sott M Davidson A S Cans P Linderholm D Chiu and O Orwar 768
Proc Natl Acad Sci U S A 2002 99 11573ndash11578 769
14 A Karlsson R Karlsson M Karlsson A-S Cans A Stromberg F Ryttsen and O 770
Orwar Nature 2001 409 150ndash152 771
15 M Karlsson K Sott A S Cans A Karlsson R Karlsson and O Orwar Langmuir 772
2001 17 6754ndash6758 773
16 E Evans H Bowman A Leung D Needham and D Tirrell Science (80- ) 1996 774
273 933ndash935 775
17 U Seifert Configurations of fluid membranes and vesicles 1997 vol 46 776
18 J Kaumls and E Sackmann Biophys J 1991 60 825ndash844 777
19 N Bobrovska W Goacuteźdź V Kralj-Iglič and A Iglič PLoS One 2013 8 e73941 778
20 A Iglič B Babnik K Bohinc M Fošnarič H Haumlgerstrand and V Kralj-Iglič J 779
Biomech 2007 40 579ndash585 780
21 K Bohinc T Slivnik A Iglič M Brumen and V Kralj-Iglič J Phys Chem C 2007 781
111 9709ndash9718 782
22 A Iglič H Haumlgerstrand P Veranič A Plemenitaš and V Kralj-Iglič J Theor Biol 783
2006 240 368ndash373 784
23 V Kralj-Iglič and P Veranič Adv Planar Lipid Bilayers Liposomes 2006 5 129ndash785
149 786
24 A Iglic and V Kralj-Iglic Adv Planar Lipid Bilayers Liposomes 2006 4 253ndash279 787
25 S Penič L Mesarec M Fošnarič L Mroacutewczyńska H Haumlgerstrand V Kralj-Iglič and 788
A Iglič Front Phys 2020 8 342 789
26 P Yager and P E Schoen Mol Cryst Liq Cryst 1984 106 371ndash381 790
27 T G Barclay K Constantopoulos and J Matisons Chem Rev 2014 114 10217ndash791
10291 792
31
28 B Božič G Gomišček V Kralj-Iglič S Svetina and B Žekš Eur Biophys J 2002 793
31 487ndash496 794
29 A Iglič H Haumlgerstrand M Bobrowska-Haumlgerstrand V Arrigler and V Kralj-Iglič 795
Phys Lett A 2003 310 493ndash497 796
30 R Bar-Ziv and E Moses Phys Rev Lett 1994 73 1392ndash1395 797
31 S Chiruvolu H E Warriner E Naranjo S H Idziak J O Raumldler R J Plano J A 798
Zasadzinski and C R Safinya Science (80- ) 1994 266 1222ndash1225 799
32 V Kralj-Iglič A Iglič H Haumlgerstrand and P Peterlin Phys Rev E 2000 61 4230ndash800
4234 801
33 L Mesarec M Drab S Penič V Kralj-Iglič and A Iglič Int J Mol Sci 2021 22 802
2348 803
34 L Van Renterghem S L K W Roelants N Baccile K Uyttersprot M C Taelman 804
B Everaert S Mincke S Ledegen S Debrouwer K Scholtens C V Stevens W 805
Soetaert L Van Renterghem S L K W Roelants N Baccile K Uytersprot M C 806
Taelman B Everaert S Mincke S Ledegen S Debrouwer K Scholtens C V 807
Stevens and W Soetaert Biotechnol Bioeng 2018 115 1195ndash1206 808
35 J Clark and F Deswarte Introduction to Chemicals from Biomass Second Edition 809
John Wiley amp Sons 2015 810
36 K V Sajna R Houmlfer R K Sukumaran L D Gottumukkala and A Pandey in 811
Industrial Biorefineries and White Biotechnology eds A Pandey R Houmlfer M 812
Taherzadeh K M Nampoothiri and C Larroche Amsterdam Oxford Waltham 813
Elsevier 2015 pp 499ndash521 814
37 R Marchant and I M Banat Trends Biotechnol 2012 30 558ndash565 815
38 K Hill and C LeHen-Ferrenbach in Sugar-Based Surfactants Fundamentals and 816
Applications ed C C Ruiz Boca Raton CRC Press 2009 pp 1ndash20 817
39 L Rodrigues I M Banat J Teixeira and R Oliveira J Antimicrob Chemother 818
2006 57 609ndash618 819
40 J D Desai and I M Banat Microbiol Mol Biol Rev 1997 61 47ndash64 820
41 S L K W Roelants K Ciesielska S L De Maeseneire H Moens B Everaert S 821
Verweire Q Denon B Vanlerberghe I N A Van Bogaert P Van der Meeren B 822
Devreese and W Soetaert Biotechnol Bioeng 2016 113 550ndash559 823
42 N Baccile M Selmane P Le Griel S Preacutevost J Perez C V Stevens E Delbeke S 824
Zibek M Guenther W Soetaert I N A Van Bogaert and S Roelants Langmuir 825
2016 32 6343ndash6359 826
32
43 N Baccile A-S Cuvier S Preacutevost C V Stevens E Delbeke J Berton W Soetaert 827
I N A Van Bogaert and S Roelants Langmuir 2016 32 10881ndash10894 828
44 N Baccile C Seyrig A Poirier S A Castro S L K W Roelants and S Abel Green 829
Chem 2021 23 3842ndash3944 830
45 A Salis L Cappai C Carucci D F Parsons and M Monduzzi J Phys Chem Lett 831
2020 11 6805ndash6811 832
46 J Schindelin I Arganda-Carreras E Frise V Kaynig M Longair T Pietzsch S 833
Preibisch C Rueden S Saalfeld B Schmid J-Y Tinevez D J White V 834
Hartenstein K Eliceiri P Tomancak and A Cardona Nat Methods 2012 9 676ndash835
682 836
47 T Parasassi and E Gratton J Fluoresc 1995 5 59ndash69 837
48 M M Dodes Traian F L Gonzaacutelez Flecha and V Levi J Lipid Res 2012 53 609ndash838
616 839
49 D M Owen C Rentero A Magenau A Abu-Siniyeh and K Gaus Nat Protoc 840
2012 7 24ndash35 841
50 W Stillwell in An Introduction to Biological Membranes Academic Press 2016 pp 842
135ndash180 843
51 W Stillwell in An Introduction to Biological Membranes Academic Press 2016 pp 844
181ndash220 845
52 B Tenchov Chem Phys Lipids 1991 57 165ndash177 846
53 R Koynova and M Caffrey Biochim Biophys Acta 1998 1376 91ndash145 847
54 F Schmid S Dolezel O Lenz and S Meinhardt J Phys Conf Ser 2014 487 848
012004 849
55 S Meinhardt R L C Vink and F Schmid Proc Natl Acad Sci U S A 2013 110 850
4476ndash4481 851
56 O Glatter and O Kratky Small Angle X-ray Scattering Academic Press London 852
1982 853
57 B A Cunningham A D Brown D H Wolfe W P Williams and A Brain Phys 854
Rev E 1998 58 3662ndash3672 855
58 M Nadler A Steiner T Dvir O Szekely P Szekely A Ginsburg R Asor R Resh 856
C Tamburu M Peres and U Raviv Soft Matter 2011 7 1512ndash1523 857
59 C Tanford The hydrophobic effect Formation of micelles and biological membranes 858
John Wiley amp Sons Inc New York 1973 859
60 M Masuda and T Shimizu Langmuir 2004 20 5969ndash5977 860
33
61 A Zidovska K K Ewert J Quispe B Carragher C S Potter and C R Safinya 861
Block Liposomes Vesicles of Charged Lipids with Distinctly Shaped Nanoscale 862
Sphere- Pear- Tube- or Rod-Segments Elsevier Inc 1st edn 2009 vol 465 863
62 A Iglic V Kralj-Iglic B Božič M Bobrowska-Haumlgerstrand B Isomaa and H 864
Haumlgerstrand Bioelectrochemistry 2000 52 203ndash211 865
63 T Shimizu M Masuda and H Minamikawa Chem Rev 2005 105 1401ndash1444 866
64 J V Selinger and J M Schnur Phys Rev Lett 1993 71 4091ndash4094 867
65 J M Schnur Science (80- ) 1993 262 1669ndash1676 868
66 B Tenchov R Koynova and G Rapp Biophys J 2001 80 1873ndash1890 869
67 R Koynova and B Tenchov Ser Biomech 2017 31 3ndash19 870
68 S J Angyal and R Le Fur Carbohydr Res 1984 126 15ndash26 871
69 J K Whitesell and M A Minton J Am Chem Soc 1987 109 225ndash228 872
70 T Takayama S Ando and I Ando J Mol Struct 1990 220 245ndash250 873
71 K Gawrisch N V Eldho and I V Polozov Chem Phys Lipids 2002 116 135ndash151 874
72 F Tielens C Gervais J F Lambert F Mauri and D Costa Chem Mater 2008 20 875
3336ndash3344 876
73 G A Jeffrey and Y Yeon Acta Crystallogr Sect B 1986 42 410ndash413 877
74 B Berglund and R W Vaughan J Chem Phys 1980 73 2037ndash2043 878
75 C Gervais C Coelho T Azaiumls J Maquet G Laurent F Pourpoint C Bonhomme 879
P Florian B Alonso G Guerrero P H Mutin and F Mauri J Magn Reson 2007 880
187 131ndash140 881
76 C Akita T Kawaguchi F Kaneko H Yamamoto and M Suzuki J Phys Chem B 882
2004 108 4862ndash4868 883
77 R N Purusottam L Seacutenicourt J J Lacapegravere and P Tekely Biochim Biophys Acta - 884
Biomembr 2015 1848 3134ndash3139 885
78 X Biarneacutes A Ardegravevol A Planas C Rovira A Laio and M Parrinello J Am Chem 886
Soc 2007 129 10686ndash10693 887
79 L M J Kroon‐Batenburg and J Kroon Biopolymers 1990 29 1243ndash1248 888
80 K N Kirschner and R J Woods Proc Natl Acad Sci U S A 2001 98 10541ndash889
10545 890
81 S Svenson B Kirste and J H Fuhrhop J Am Chem Soc 1994 116 11969ndash11975 891
82 I Sack S Macholl J H Fuhrhop and G Buntkowsky Phys Chem Chem Phys 892
2000 2 1781ndash1788 893
83 S Svenson J Koening and J H Fuhrhop J Phys Chem 1994 98 1022ndash1028 894
34
84 S Svenson A Schaefer and J H Fuhrhop J Chem Soc Perkin Trans 2 1994 2 895
1023ndash1028 896
85 K Bock and C Pedersen Adv Carbohydr Chem Biochem 1983 41 27ndash66 897
86 T B Grindley Structure and Conformation of Carbohydrates Springer Berlin 898
Heidelberg 2008 899
87 F Tantakitti J Boekhoven X Wang R V Kazantsev T Yu J Li E Zhuang R 900
Zandi J H Ortony C J Newcomb L C Palmer G S Shekhawat M O De La 901
Cruz G C Schatz and S I Stupp Nat Mater 2016 15 469ndash476 902
903
1
Supporting Information 904
905
Topological connection between vesicles and nanotubes in single-906
component lipid membranes driven by head-tail interactions 907
908
Niki Baccilea Ceacutedric Lorthioira Abdoul Aziz Baa Patrick Le Griela Cristina Coelhob Javier 909
Perezc Wim Soetaertd Sophie L K W Roelantsd 910
911
a Sorbonne Universiteacute Centre National de la Recherche Scientifique Laboratoire de Chimie de 912
la Matiegravere Condenseacutee de Paris LCMCP F-75005 Paris France 913
b Institut des Mateacuteriaux de Paris Centre Sorbonne Universiteacute Paris France 914
c Synchrotron Soleil LrsquoOrme des Merisiers Saint-Aubin BP48 91192 Gif-sur-Yvette Cedex 915
France 916
d InBio Department of Biotechnology Ghent University Ghent Belgium 917
918
919
Corresponding author 920
Dr Niki Baccile 921
E-mail address nikibaccilesorbonne-universitefr 922
Phone +33 1 44 27 56 77 923
924
925
926
2
a) 927
Parameter Method
Dry Matter (DM ) 996 Infrared balance 105degC
Glucose () 012 HPLC-Metacarb
Glycerol () nd HPLC-Metacarb
Free Fatty Acid content () lt001 Internal method BBEPP
GC with FID Detector
Oil () lt001 Internal method BBEPP
GC with FID Detector
Moulds (CFUg) lt10 3M-Nordval ndeg16 B
Yeasts (CFUg) lt10 3M-Nordval ndeg16 B
Anaerobic count (CFUg) lt10 SP-VG M005 B
Protein () tbd BCA protein assay
928
Figure S 1 - a) HPLC-ELSD chromatogram and composition table 929
930
931
932
933
3
b) 934
935
Group Ndeg δ ppm
CH2 1 354
CH2 2 153
CH2 3-712-14 132
CH2 811 203
CH 910 534
CH2 15 162
CH2 16 388
CH 1 424
CH 2 316
CH 3 334
CH 4 329
CH 5 354
CH2 6 366
Figure S 1 (next) ndash b) 1H NMR spectrum (MeOD-d4) recorded on the purified G-C181-OH compounds 936
and related assignment 937
938
2
811910 1rsquo
5rsquo1
3rsquo4rsquo
1rsquo1910
asymp asymp asympHDO MeOD Acetone
6rsquo2rsquo
1615
3-712-14
4
939
940
Figure S 2 ndash Cryo-TEM images recorded for a 5 mgmL G-C181-OH aqueous solution heat at T= 130degC 941
5
942
943
Figure S 3 - Cryo-TEM images recorded for a 5 mgmL G-C181-OH aqueous solution heat at T= 90degC 944
945
90degC
1
22
6
946
947
948
949
Figure S 4 ndash Cryo-TEM images recorded for a 5 mgmL G-C181-OH aqueous solution heat at T= 70degC 950
951
21
11
1
2
5
3
4
45
5
6
7
7
7
952
953
954
Figure S 5 ndash Cryo-TEM images recorded for a 5 mgmL G-C181-OH aqueous solution heat at T= 25degC 955
956
957
1
1 1
8
958
Figure S 6 ndash a) SANS experiment recorded at 90degC for a 5 mgmL G-C181-OH aqueous solution b-c) 959
WAXS experiments recorded on aqueous solutions of G-C181-OH at b) 5 mgmL and c) 25 mgmL d) 960
Structural interpretation of the repeating distances pointed out in c) 961
962
963
964
001 01 1
q Aring-1
25degC
68degC
88degC
111degC
01 1q Aring
-1
02 04 06 08 1q Aring
-1
001 01
10-1
100
101
Inte
nsity
cm
-1
q Aring-1
-2
T= 90degC
SANS WAXS WAXS
a) b) c)
dv
dL d= 144 Aring-1
di
ddH2O
dt
dvdL
dtdi d
d)
9
965
966
Figure S 7 ndash ssNMR MAS (10 kHz) experiments recorded on a G-C181-OH dry powder a) 1H spectra 967
recorded from 110degC to 70degC b) 13C single pulse (SP) spectra recorded with high power 1H decoupling from 968
110degC to 70degC c) 13C cross polarization (CP) spectra recorded at 110degC and contact time tc of 50 micros and 969
3000 micros d) 13C CP spectra recorded at 70degC and for 20 lt tc micros lt 3000 970
971
1
811
910
CH2 CH2
1rsquo
6rsquo
8 6 4 2 0 ppm
110
90
80
70
910
1rsquo
6rsquo16
1
2rsquo3rsquo4rsquo
811
OH
45 40 35 30 25 20 15
ppm
200 180 160 140 120 100 80 60 40 20 0
ppm140 120 100 80
ppm
CH2-gauche
3004
110
90
80
70
65
60
50
25
C91013003
C9 - 12869
CH2-all-trans
3198
C1rsquo10335
a) b)
1H
T degCT degC
13C Single Pulse MAS
A
B
A
B
70degC70degC
5rsquo
215
200 180 160 140 120 100 80 60 40 20 0
ppm
13C CPMAST= 110degC
200 180 160 140 120 100 80 60 40 20 0
ppm
132 131 130 129 128 127 126
ppm
106 105 104 103 102
ppm
13C CPMAST= 70degC
50
tc micros
3000
20
tc micros
50 500 1000 3000
tc micros
C102
13024 C910113003
C92
12869
C1rsquo213082
C1rsquo110443
A B
106 105 104 103 102
ppm
3000
1000
500
50
20
AB
c)
d)
10
972
Figure S 8 ndash a) Short and d) long T2 components displayed by the 1H transverse relaxation signal c) 1H 973
transverse relaxation signals recorded on a G-C181-OH dry powder from 110degC to 70degC The area of each 974
given resonance is plotted (log-lin) as a function of the echo time (CPMG pulse sequence) for each 975
temperature and fitted using the equation given above T2s and T2l indicate the short and long T2 relaxation 976
times respectively obtained by describing the 1H transverse relaxation signal using a biexponential decay 977
For H1rsquo H5rsquo and H6rsquo the 1H relaxation function could be described by a monoexponential decay 978
- Protons from the sugar group (H1rsquo H5rsquo H6rsquo) show a single T2 relaxation component (Figure 979
6c and Figure S 8) while protons of the acyl chain (CH2 H910 H811) show both short (Figure 980
6c) and long (Figure 6d) T2 relaxation component 981
- The short T2 relaxation time systematically decreases from 110degC to 70degC for all species by a 982
factor ranging from two to seven depending on the specific chemical group Very long T2 are 983
observed at 110degC for all acyl species while nearly unchanged values are measured below 984
90degC without any clear trend 985
- The sugar protons (H1rsquo H5rsquo H6rsquo) have the shortest set of T2 values (lt 1 ms) below 100degC 986
The long component of T2 generally ranges between 4 ms and 12 ms 987
0 1 2 3 4 5 6 7 8
00
05
10
15
20
25
30
35
40
45
Log
In
ten
sity
Time ms
0 1 2 3 4 5 6 7 8
00
05
10
15
20
25
30
35
40
45
Log
In
ten
sity
Time ms
0 1000 2000 3000 4000 5000 6000 7000 8000
00
05
10
15
20
25
30
35
40
45
Log
In
ten
sity
Time ms
0 1000 2000 3000 4000 5000 6000 7000 8000
00
05
10
15
20
25
30
35
40
45
Log
In
ten
sity
Time ms
0 1000 2000 3000 4000 5000 6000 7000 8000
00
05
10
15
20
25
30
35
40
45
Log
In
ten
sity
Time ms
0 1000 2000 3000 4000 5000 6000 7000 8000
00
05
10
15
20
25
30
35
40
45
Log
In
ten
sity
Time ms
H1
H8H11
H9H10
CH2
H1rsquo
H6rsquo
CH2
H910H811 H1CH2
H1rsquo H5rsquo6rsquo
0 1000 2000 3000 4000 5000 6000 7000 8000
00
05
10
15
20
25
30
35
40
45
Log
In
ten
sity
Time ms
OH
0 1000 2000 3000 4000 5000 6000 7000 8000
00
05
10
15
20
25
30
35
40
45 T= 110degC
T= 90degC
T= 80degC
T= 70degC
Log
In
ten
sity
Time ms
Fit
)
CH2 H910 H811 H1 H56 H1 OH
00
05
10
15
20
25
30
35
40
T2 m
s
T= 110degC
T= 90degC
T= 80degC
T= 70degC
CH2 H910 H811 H1
0
2
4
6
8
10
12
T2 m
s
T= 110degC
T= 90degC
T= 80degC
T= 70degC
Short T2(1H) Long T2(1H)
a) b)
c)
11
Table S 1 ndash 1H chemical shifts of G-C181-OH in solution and in the solid-state Solid-state spectra are 988
recorded at a MAS frequency of 10 kHz in DMSO-d6 broad peak 989
990
δH ppm
Group Ndeg Liquid
(MeOD-d4) Solid
(T= 110degC) Solid
(T= 70degC)
CH2 H1 354 357
CH2 H2 153 156
CH2 H3-712-14 132 135
CH2 H811 203 203
CH H910 534 534
CH2 H15 162 164
CH2 H16 388 383
CH H1 424 432
CH H2 316 335
CH H3 334 335
CH H4 329 335
CH H5 354 351 357
CH2 H6 366 383
OH OH1 432
45 463
OH OH2 492
OH OH3 490
OH OH4 487
OH OH6 445
991
992
H1H9H10H1rsquo
H6rsquo
OH2rsquo
OH1
12
Detailed discussion about the NOESY and DQ-SQ 2D 1H-1H ssNMR experiments presented in 993
Figure 9 994
995
2D 1H-1H ssNMR experiments are a unique tool to explore through-space proximities 996
between 1H nuclei ssNMR offers a large number of possibilities each adapted to a given 997
system The advantage of 2D maps with respect to a dynamics approach is their direct 998
readability in clear two nuclei which exchange their magnetization through-space (whichever 999
mechanism may be responsible for this exchange) will display a specific cross-peak However 1000
the way cross-peaks are presented and interpreted strictly depends on the nature of the pulse 1001
program which in turn is chosen according to the physical nature of the sample 1002
1D temperature-dependent 1H NMR experiments performed on G-C181-OH (Figure 1003
4a in the main text) indicate sharp peaks at 90degC and broad peaks at 70degC Narrow peaks 1004
indicate fast andor large-amplitude molecular tumbling averaging the strong 1H-1H dipolar 1005
interactions This excludes the use of pulse sequences like DQ-SQ which is not efficient under 1006
these conditions For this reason we employ spin-diffusion-based pulse sequences like 1007
NOESY which is more adapted for samples with high molecular mobility When mixing times 1008
are chosen to be short (lt 1 s) one generally explores through-space proximities within about 5 1009
10 Aring On the contrary when molecular motions are restricted dipolar coupling becomes 1010
significant 1H NMR peaks are broader and pulse sequences like DQ-SQ can now be used 1011
with a spatial resolution of less than 5 Aring 1012
Whenever possible DQ-SQ experiments are preferred over spin diffusion-based pulse 1013
sequences because they are more selective in particular for likewise interactions which are 1014
not discriminated in NOESY-type experiments This is illustrated by the typical interaction 1015
schemes for NOESY (top Figure 9a) and DQ-SQ (top Figure 9b) For two given A and B 1016
protons 2D NOESY maps will display two on-diagonal and two square-shaped symmetrical 1017
off-diagonal cross-peaks Off-diagonal cross-peaks illustrate the mutual A-B and B-A 1018
interaction but the on-diagonal peaks are systematic and do not prove any A-A or B-B 1019
interaction Similarly to NOESY 2D DQ-SQ maps display off-diagonal peaks (symmetric 1020
across the diagonal top Figure 9b) upon A-B and B-A interaction but in contrast they will 1021
display on-diagonal peaks only in the presence of self-interaction In the tutorial example of 1022
Figure 9b top the on-diagonal A-A peak indicates mutual A-A interaction while lack of on-1023
diagonal B-B peak evidences the absence of B-B proximities Combining NOESY and DQ-SQ 1024
experiments is capital to study the local arrangement of G-C181-OH and its evolution with 1025
temperature 1026
13
At T= 90degC the H1 and H5rsquo contributions are very close but possible to discriminate 1027
them (δ(H1)= 354 ppm δ(H5rsquo)= 351 ppm) according to 1H NMR chemical shifts in Table S 1028
1 2D 1H-1H NOESY in Figure 9a also discriminates between the two components attributed 1029
on the basis of the interactions with their mutual neighbors (green H1-H2 and H5rsquo-H1rsquo squares 1030
in Figure 9a) On this basis 2D NOESY does not show a direct H1rsquo-H1 correlation (blue red-1031
crossed) but rather an extensive network of intra-sugar interactions These features exclude 1032
suggest intra- and inter-sugar interactions and they exclude head-tail arrangements as a major 1033
molecular configuration at 90degC 1034
At 70degC the 1H NMR peaks are broader indicating a reduction of the T2 (1H) relaxation 1035
times andor residual homonuclear dipolar interactions excluding the use of NOESY In this 1036
case 1H-1H DQ-SQ correlation experiments are best suited Figure 9b presents the 1H-1H DQ-1037
SQ experiment on G-C181-OH at 70degC Peaks are broader than in NOESY and attribution may 1038
be cumbersome However the experiment is performed at 700 MHz and MAS= 22 kHz which 1039
improves spectral resolution with respect to the same experiment performed at 300 MHz and 1040
MAS= 10 kHz The auto-peak at δH= 356 ppm in the SQ dimension is attributed to H1-H1 spin 1041
pairs mainly resulting from intra CH2 interaction while the DQ cross-peaks at δH= 156-356 1042
ppm and δH= 432-356 ppm respectively origin from H2-H1 and H1rsquo-H1 interactions (Figure 1043
9b) DQ-SQ map does not show any auto-peak corresponding to H1rsquo-H1rsquo or Hxrsquo-Hxrsquo (x= 2rsquo 1044
3rsquo 4rsquo) interactions (red-crossed blue Figure 9b) thus excluding any proximity (lt 5 Aring) between 1045
close glucose neighbors On the contrary DQ-SQ maps (recorded both at 700 MHz Figure 9b 1046
or at 300 MHz not shown) systematically show DQ cross-peaks which can only be attributed 1047
to H1rsquo-H1 interactions (δH= 432-356) The presence of these H1rsquo-H1 interactions can only be 1048
explained by a head-tail arrangement of the G-C181-OH molecules as illustrated below the 1049
DQ-SQ map in Figure 9b 1050
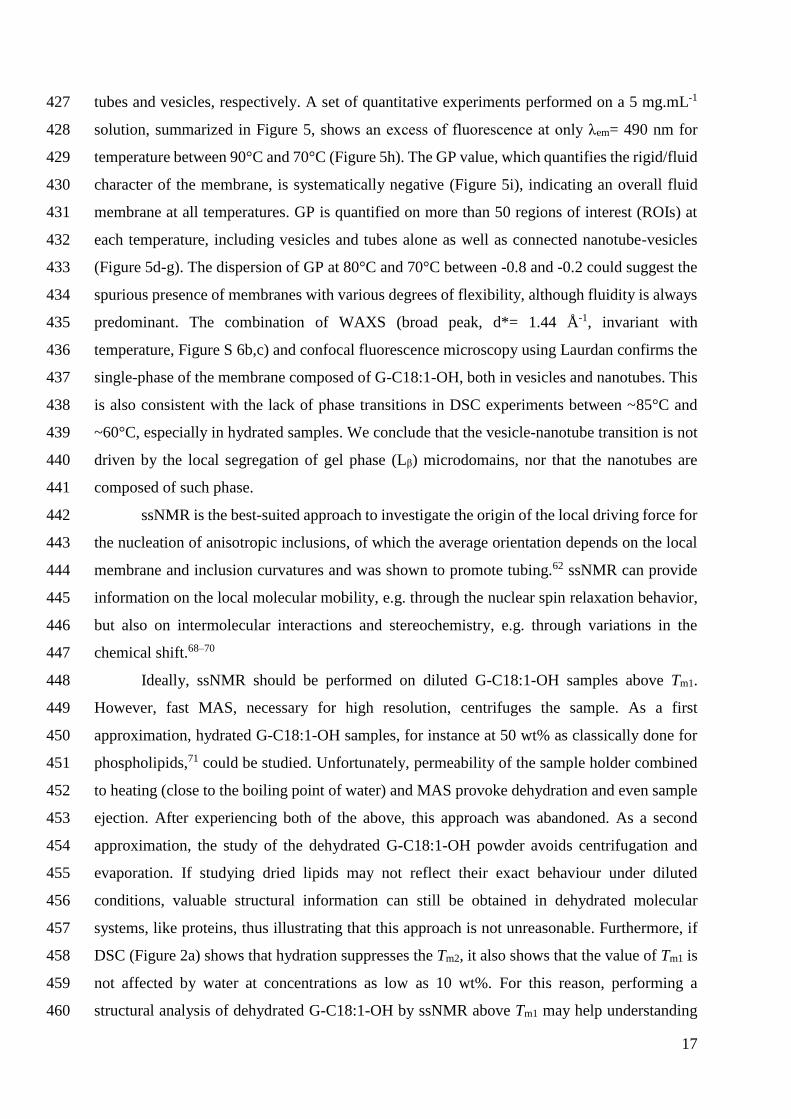
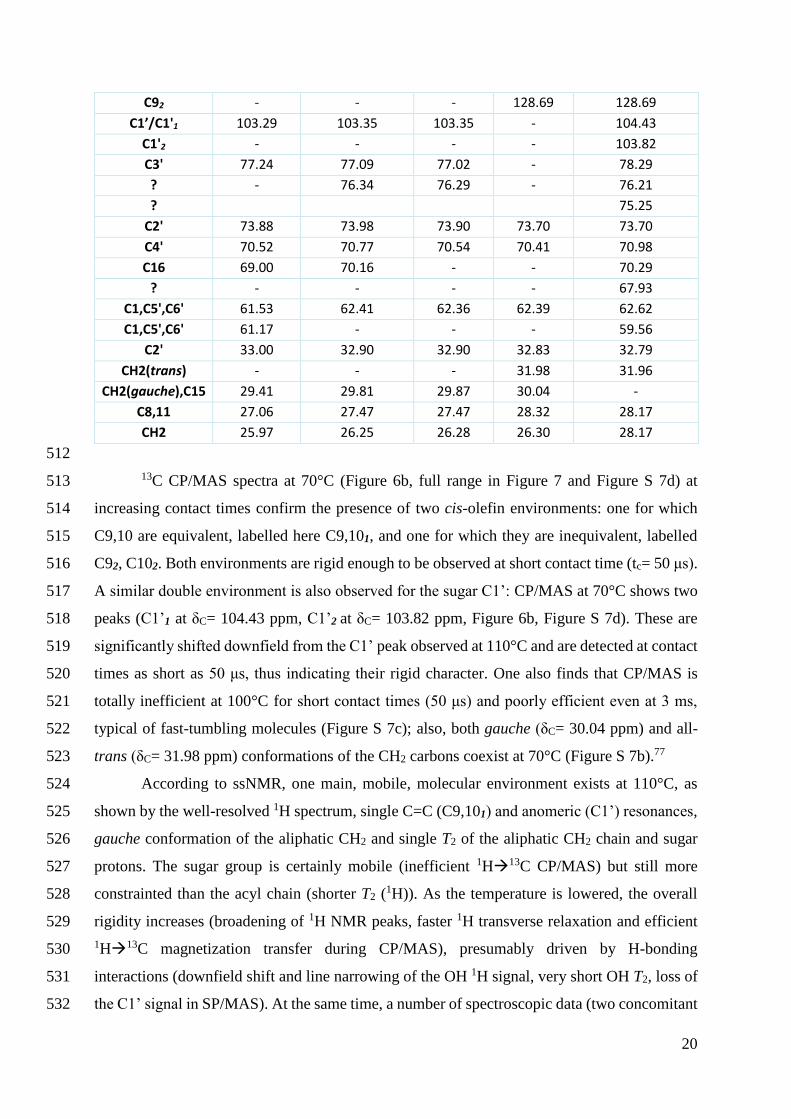
20
C92 - - - 12869 12869
C1rsquoC11 10329 10335 10335 - 10443
C12 - - - - 10382
C3 7724 7709 7702 - 7829
- 7634 7629 - 7621
7525
C2 7388 7398 7390 7370 7370
C4 7052 7077 7054 7041 7098
C16 6900 7016 - - 7029
- - - - 6793
C1C5C6 6153 6241 6236 6239 6262
C1C5C6 6117 - - - 5956
C2 3300 3290 3290 3283 3279
CH2(trans) - - - 3198 3196
CH2(gauche)C15 2941 2981 2987 3004 -
C811 2706 2747 2747 2832 2817
CH2 2597 2625 2628 2630 2817
512
13C CPMAS spectra at 70degC (Figure 6b full range in Figure 7 and Figure S 7d) at 513
increasing contact times confirm the presence of two cis-olefin environments one for which 514
C910 are equivalent labelled here C9101 and one for which they are inequivalent labelled 515
C92 C102 Both environments are rigid enough to be observed at short contact time (tc= 50 μs) 516
A similar double environment is also observed for the sugar C1rsquo CPMAS at 70degC shows two 517
peaks (C1rsquo1 at δC= 10443 ppm C1rsquo2 at δC= 10382 ppm Figure 6b Figure S 7d) These are 518
significantly shifted downfield from the C1rsquo peak observed at 110degC and are detected at contact 519
times as short as 50 μs thus indicating their rigid character One also finds that CPMAS is 520
totally inefficient at 100degC for short contact times (50 μs) and poorly efficient even at 3 ms 521
typical of fast-tumbling molecules (Figure S 7c) also both gauche (δC= 3004 ppm) and all-522
trans (δC= 3198 ppm) conformations of the CH2 carbons coexist at 70degC (Figure S 7b)77 523
According to ssNMR one main mobile molecular environment exists at 110degC as 524
shown by the well-resolved 1H spectrum single C=C (C9101) and anomeric (C1rsquo) resonances 525
gauche conformation of the aliphatic CH2 and single T2 of the aliphatic CH2 chain and sugar 526
protons The sugar group is certainly mobile (inefficient 1H13C CPMAS) but still more 527
constrainted than the acyl chain (shorter T2 (1H)) As the temperature is lowered the overall 528
rigidity increases (broadening of 1H NMR peaks faster 1H transverse relaxation and efficient 529
1H13C magnetization transfer during CPMAS) presumably driven by H-bonding 530
interactions (downfield shift and line narrowing of the OH 1H signal very short OH T2 loss of 531
the C1rsquo signal in SPMAS) At the same time a number of spectroscopic data (two concomitant 532
21
resonances for anomeric C1rsquo1 and C1rsquo2 cis-olefin C9101 and C92 C102 and CH2 gauche and 533
all-trans environments) and relaxation behaviour (fast and slow T2 relaxation components) 534
strongly suggests the coexistence of two molecular environments Further proofs of the 535
coexistence of two distinct molecular domains are given by a number of chemical shift 536
variations in the 13C CPMAS spectrum at 70degC compared to the one at 110degC 90degC and 537
solution This is shown in Figure 7 and in the list of 13C chemical shifts in Table 1 538
539
540
Figure 7 - Comparison between solution- and solid-state 13C NMR spectra of G-C181-OH Solid-state 541
experiments are recorded directly on the sample powder at a MAS of 10 kHz (4 mm zirconia rotor) SP 542
Single Pulse CP Cross Polarization In all the ssNMR experiments temperature is first raised at 110degC 543
and then lowered to either 90degC or 70degC Segmented lines are meant to highlight the known peak position 544
in solution thus stressing the strong chemical shift variations in the solid-state 545
546
NMR experiments above Tm2 suggest that vesicles could contain G-C181-OH with a 547
single family of mobile conformations characterized by chemically-equivalent C=C (red 548
Figure 8b) and a single C1rsquo conformation (green Figure 8b) Experiments between Tm1 and Tm2 549
otherwise suggest that two coexisting conformations characterized by chemically-equivalent 550
(red Figure 8b) and inequivalent (magenta Figure 8b) C=C could be associated to nanotubes 551
Two distinct C1rsquo sites (grey Figure 8b) also indicate two configurations of the sugar headgroup 552
A comment on this point will be given in the following paragraphs 553
The local (Aring-scale) variation of molecular mobility below Tm2 drives the coexistence of 554
two distinct molecular environments of the same G-C181-OH molecule This occurs within a 555
single-phase domain (as deduced by WAXS) of equivalent membrane rigidity (as derived from 556
Laurdan probe in confocal microscopy) Although never reported before the difference in the 557
local mobility of the same amphiphile (here G-C181-OH) could satisfy the theoretically-558
140 120 100 80 60 40 20
CP(3 ms)-70degC
SP-70degC
SP-90degC
SP-110degC
ppm
LiquidC910
C1rsquo
C2rsquo
C4rsquo
C3rsquo
C1
C6rsquoC5rsquo
C1
6
C8
11
C2 C
H2
C1
5
CH
2
DM
SO
13C
22
required conditions that induce local lipid segregation and formation of membrane inclusions 559
(Figure 8c) In case of their non-zero average orientation the local membrane curvature 560
increases62 and nanotubes can spontaneously form (Figure 8bc) More intriguing this 561
mechanism occurs at least 10degC above Tm1 although it should not be favored above the Tm27 562
From both experimental and theoretical backgrounds the conditions of topologically-563
connected vesicles-nanotubes systems are met only when either internal (two components) or 564
external driving forces are applied19 In the present single-lipid system of which the phase 565
behavior is summarized in Figure 8a the most plausible driving force could be explained by 566
the NMR results collected on the dry sample G-C181-OH concomitantly occupies two 567
molecular environments characterized by 1) two distinct conformations of the sugar 568
displaying equivalent mobility and 2) two conformations of the acyl chain unsaturation 569
570
23
571
Figure 8 ndash a) Thermotropic phase behavior of G-C181-OH at 5 mgmL-1 Note that Tm2 is observed on the 572
dry powder only b) Possible relationship between the molecular environment as derived from NMR and 573
membrane curvatures All the molecular drawings refer to the same G-C181-OH molecule (bulky ellipsoid 574
equiv sugar headgroup) while each color corresponds to a given configuration Grey of C1rsquo1 and C1rsquo2 indicates 575
the uncertainty about the assignment of the specific NMR peak The curvature C is defined as 1R R being 576
the curvature radius R1 R2 radius of curvature CG Gauss curvature CM Mean curvature c) Free 577
interpretation of the anisotropic high-curvature (CMgt 0 CG= 0) inclusions in the membrane (low CM and 578
CG) continuum driven by inter-sugar H-bonding and reduced intramembrane diffusion for a G-C181-OH 579
glucolipid 580
581
Flat crystalline structure
Nanotube-vesicle network
Vesicles
48degC
120deg
106 105 104 103 102 101
ppm
H9 H10H1rsquo
106 105 104 103 102 101
ppm106 105 104 103 102 101
ppm106 105 104 103 102 101
ppm
C=CC=C
C1rsquo1C1rsquo2
C1rsquo
Tm2(96degC)Tm1
a)
b)
c)
Same molecule different local orientations and sugar conformations
High curvature membrane
Low curvature inclusion
Flip-FlopStrong H-bonding
CG
CM ( + )
CG 0
CM 0 CG 0
CM 0
G-C181-OH
24
Two related questions are unanswered at the moment What actually drives nanotube 582
formation and is the organization of G-C181-OH within the vesicles and tubes the same Lipid 583
nanotubes have been studied for at least three decades over which broad experimental and 584
theoretical insight has been generated Despite this fact the actual understanding is still matter 585
of debate27 Micelle-to-nanotube and vesicle-to-nanotube phase transitions are generally 586
reported for single amphiphiles below a given Tm and intermediate phase composed of twisted 587
and flat fibers is concomitantly reported Initially thought to be a chirality-driven phenomenon 588
recent studies propose a more general mechanism involving crystallization and symmetry 589
breaking in the lipid packing driven by optimal packing27 If twisted ribbons were observed 590
before for a number of microbial glycolipid bolaamphiphiles44 they are not found for G-C181-591
OH This fact as well as the large body of cryo-TEM images and the observation of nanotubes 592
above Tm1 rather pledge in favour of a direct topological change from positive (vesicles) to 593
zero (nanotubes) Gaussian curvatures In this case vesicle-to-nanotube transitions could be 594
driven by external forces56307813ndash162829 595
Considering the absence of external forces in the present system there are only two 596
possibilities left spontaneous budding of the membrane or nanotube pulling after inter-vesicle 597
collisions due to Brownian motion Both are possible as inclusions composed of a different 598
arrangement of the same molecule in the membrane continuum can theoretically explain 599
spontaneous nanotube formation in an isotropic medium672223629ndash1218ndash21 However the second 600
one is probably more likely to prevail because it could explain the large number of nanotubes 601
connecting two distant vesicles Interestingly similar events occur for any phospholipid-based 602
vesicular solution but nanotubes are extremely rare unless at least two lipids of different 603
molecular structure are mixed together The spectroscopic 1H and 13C and relaxation (1H) 604
ssNMR data even if collected on a dry powder demonstrate that the coexistence of two G-605
C181-OH configurations involving both the sugar headgroup and fatty alcohol chain are 606
possible for this molecule As a matter of fact this is not so surprising as more than one energy 607
minima each corresponding to a given conformation are known for glucose its non-reducing 608
derivative methylglucose and carbohydrates in general78ndash80 609
The presence of two configurations could explain the coexistence between two 610
structures of different curvature but the data presented so far do not explain the origin of these 611
two configurations In other words what drives the change in the local structure of the sugar 612
headgroup and fatty alcohol within the membrane 613
The association of known self-assembled structures to spectroscopic 13C ssNMR data is 614
known for years in particular for gluconamides lipids having a linear sugar headgroup81ndash84 It 615
25
was found that gauche effects in some cases up to the γ position in the sugar chain induce 616
upfield chemical shifts while anti and trans conformations result in downfield shifts Each 617
structure (monolayer crystal bilayer crystal or micellar fiber) was then characterized by a given 618
organization of the gluconamide and a characteristic 13C ssNMR fingerprint which could be 619
explained by gauche γ-gauche anti and trans conformations of the headgroup Similar 620
structural-spectroscopic correlations have been collected over the years for much simpler cyclic 621
sugars85 whereas pyranoses can undergo important conformational changes (chair half-chair 622
boat skew) when the appropriate energy barriers are crossed78ndash8086 A quantitative 623
conformational study based on the 13C chemical shift variations shown in Table 1 would be 624
certainly helpful but very delicate in the context of the present state of the art because a 625
rigorous approach requires at least one known crystal structure8182 which is currently missing 626
for this compound A qualitative approach will then be adopted 627
G-C181-OH is a bolaform amphiphile and flip-flop could be a possible mechanism 628
involved in the nanotube stabilization whereas head-tail interactions have long been considered 629
as important in nanotube-forming bolaform amphiphiles6063 From mere considerations based 630
on T2 (1H) relaxation arguments one could exclude head-tail configurations if the R-CH2OH 631
endgroup (H1) was involved in a direct interaction with the sugar group its corresponding T2 632
would probably be comparable to the sugarrsquos one (OH and H1rsquo) but this does not seem to be 633
the case However this hypothesis would be based on the comparison of the relaxation from 634
CH and CH2 protons additionally involved in different kind of motions Besides the relaxation 635
of H1 is influenced by the strong overlap between H1 and H5rsquo For these reasons relaxation 636
arguments are not solid enough and will not be used 637
We then address this question by exploring intermolecular interactions in a direct 638
manner using 2D 1H-1H homonuclear ssNMR correlation spectroscopy At 90degC in the fast-639
tumbling domain of molecular motion (narrow 1H NMR peaks Figure 6a) and corresponding 640
to the vesicle-rich region spin diffusion (NOESY) experiments are preferred over dipolar 641
coupling based experiments because such interaction is averaged out by molecular motion 642
However when the molecular motion is more constrained in the domain of nanotube stability 643
at 70degC (broad 1H spectra Figure 6a) Double-Quantum Single-Quantum (DQ-SQ) correlation 644
experiments are best suited to probe interaction between close molecular neighbors These 645
experiments are reported in Figure 9 and the related interpretation is only briefly reported 646
below while a more detailed discussion can be found on Page 12 in the Supporting Information 647
26
648
Figure 9 ndash a) 2D 1H-1H NOESY NMR experiment performed at MAS= 10 kHz (4 mm probe) on a Bruker 649
300 MHz Avance III HD spectrometer using 300 ms of mixing time Sample temperature is regulated to 650
90degC reached by cooling from 110degC b) 2D 1H-1H DQ-SQ (BAck-to-BAck BABA pulse sequence used for 651
the DQ excitation scheme) NMR experiment performed at MAS= 22 kHz (25 mm probe) on a Bruker 700 652
MHz Avance III spectrometer using a DQ excitation time equal to 2 rotor periods Sample temperature is 653
regulated to 70degC reached by cooling from 110degC The typical schemes illustrating how to interpret these 654
2D experiments are reported above each experimental map Zooms of the sugar region and configurational 655
interpretation are given below each 2D map More information are given in the text below 656
H16-H16
H1-H1
H9-H10
H1rsquo-H1
H1rsquoH910 H16
H1
H1rsquo-H1rsquo
Hxrsquo-Hxrsquo
2
(pp
m)
(ppm)
315
811910 1rsquo
2rsquo2
3rsquo 4rsquo6rsquo
5rsquo
1rsquo2910
asymp asymp asympHDO MeOD Acetone
1
315
811 9101rsquo
2rsquo2
3rsquo4rsquo6rsquo
5rsquo
1rsquo2 9 10
asympasympasympHDOMeODAcetone
H1rsquo-H1
1rsquo
1
(p
pm
)
(ppm)
H1-H2
H1rsquo-H1
H1rsquo
H910
H1H5rsquo
H2
H1rsquo-H5rsquo
315
811910 1rsquo
2rsquo2
3rsquo 4rsquo6rsquo
5rsquo
1rsquo2910
asymp asymp asympHDO MeOD Acetone
1
H2rsquoH3rsquoH4rsquo
H2rsquoH3rsquoH4rsquo
X= 2rsquo3rsquo4rsquo
NOESY - T= 90degC
1H
1H
1H
1H
DQ-SQ - T= 70degC
a) b)
2
(pp
m)
(p
pm
)
(ppm)
A B
AhellipB
AhellipA
BhellipB
NOESY
(ppm)
A B
AhellipB
DQ-SQ
Single-quantum dimension
Do
ub
le-q
ua
ntu
m d
imen
sio
n
AhellipA
BhellipB
BhellipA
BhellipA
315
811910 1rsquo
2rsquo2
3rsquo 4rsquo6rsquo
5rsquo
1rsquo2910
asymp asymp asympHDO MeOD Acetone
1
lt 5 Aring
lt 5 Aring
H1-H2
H811
H15
H16
H6rsquo
H1rsquo
H1
H5rsquo
H2
H1-H2
H1rsquo-H1
H1rsquo-H5rsquo
H1rsquo
H1 H5rsquo
H1rsquo
H1
H5rsquo
H1H2rsquo H3rsquo H4rsquo
H1-H1
H1rsquo-H1
Hxrsquo-HxrsquoX= 2rsquo3rsquo4rsquo
H1-H2
H1rsquo
Zoom sugar region 28 ndash 45 ppmNOESY DQ-SQ
27
Head-tail or head-head configurations could be probed by the existence of H1rsquo-H1 657
interactions whereas H1 (δH= 356 ppm) is associated to the glucolipid tail and H1rsquo (δH= 432 658
ppm) to the sugar headgroup These atoms are more than 15 Aring apart and a direct interaction 659
could not be observed in both NOESY and DQ-SQ experiments NOESY experiments (Figure 660
9a) show that H1rsquo-H1 correlations are not observed Meanwhile clear-cut direct H1rsquo-H1 661
interactions are indeed observed are detected at T= 70degC (DQ cross-peaks related to H1rsquo-H1 662
correlation in DQ-SQ experiment shown in Figure 9b) Interestingly the absence of auto peaks 663
at δH= 432 ppm and δH= 335 ppm in the SQ dimension excludes H1rsquo-H1rsquo and Hxrsquo-Hxrsquo (x= 2 664
3 4) interactions respectively strengthening the idea that sugar headgroups from two nearest-665
neighbor G-C181-OH molecules are not adjacent in the nanotube-vesicle region 666
Homonuclear 2D ssNMR supports the idea according to which G-C181-OH can 667
undergo molecular flip-flops and a head-tail arrangement in the dry product Extrapolating these 668
conclusions in the lower concentration range lack of H1rsquo-H1 proximity at T= 90degC suggests a 669
head-head configuration in the vesicle-rich region and head-tail configuration within the 670
nanotubes It is however still unclear whether flip-flops are driven by spontaneous temperature-671
induced conformational changes in the glucolipid packing stimulating inclusions within the 672
membrane itself672223629ndash1218ndash21 or by defects generated by inter-vesicle collisions In fact a 673
combination of both is not unlikely Nanotubes are not stable when temperature is 20 to 30 674
degrees above Tm1 indicating that inter-vesicle collisions alone cannot explain the unusual 675
phenomenon In an energy landscape approach87 the head-head configuration is certainly 676
favored at high temperature while both head-head and head-tail configurations could be 677
favored in the mid-temperature region corresponding to the range between Tm1 and Tm2 in the 678
dry powder Both statistical and defect-induced flip-flop events contribute to form high mean 679
zero Gaussian curvature morphologies (nanotubes) for which the head-tail conformation 680
limiting the proximity between bulky sugar headgroups is probably more adapted (Figure 8c) 681
The flip-flop interpretation now reasonably explains the strong differences in the sugar and fatty 682
alcohol conformations deduced by the multiple NMR signals attributed to chemically-683
equivalent groups The existence of various low-energy conformations each having specific 684
NMR signature for sugars in solution78ndash8086 and solid-state81ndash84 further supports our 685
interpretation 686
One last point should be clarified Why between Tm1 and Tm2 are two molecular 687
environments able to coexist instead of a single one of average rigidity as found in the case of 688
ldquoripplerdquo phases50ndash54 We believe that this question can be answered based on the NMR results 689
the relatively short T2 values of the H1rsquo and OH protons shows the constrained mobility of the 690
28
sugar headgroup despite a certain flexibility of the chain (long T2 component) This trend may 691
suggest restrictions in translational mobility probably due to the sugar-OH hydrogen bonding 692
(Figure 8c) meaning that lipids are not able to diffuse within the membrane thus keeping two 693
different configurations stable 694
695
Conclusions 696
Topologically-connected nanotube-vesicle lipidic systems are commonly observed for 697
self-assembled membranes composed of at least two amphiphiles and spontaneously driven by 698
anisotropic inclusions andor by external directional forces This work shows that strong 699
differences in membrane curvature can spontaneously occur in single-lipid systems without 700
external anisotropic forces Coexistence and interconnection between nanotubes and vesicles 701
are evidenced via cryo-TEM and fluorescence confocal microscopy in a single-phase region at 702
temperature above a transition temperature Tm1= 483degC determined by DSC on the hydrated 703
sample but below the second transition temperature Tm2 (957degC) determined by DSC on the 704
dry powder X-ray diffraction (WAXS) also shows the coexistence of two lattice periods one 705
attributed to an inter-membrane repeating distance and the other possibly related to the intra-706
nanotube glucolipid arrangement Labelling the systems with Laurdan a fluorophore of which 707
the emission strongly varies with the local membrane rigidity excludes the presence of rigid 708
micro-separated phases (eg Lβ) 709
1H and 13C ssNMR despite the fact that it can only be performed on the dry powder 710
confirm the presence of one main fluid G-C181-OH environment above Tm2 Below Tm2 the 711
splitting of some 13C peaks and the coexistence of short and long 1H relaxation components 712
demonstrate that G-C181-OH can simultaneously pack into structurally and dynamically 713
inequivalent environments Combining advanced 2D 1H-1H correlation experiments based on 714
spin diffusion or double-quanta excitation suggests that vesicles could contain a preferred head-715
head configuration of the bolaform lipid while nanotubes a preferred head-tail assembly 716
The presence of two environments composed of the same molecule characterized by 717
different molecular configurations and rigidity fulfills the theoretical conditions necessary to 718
spontaneously nucleate a membrane inclusion of non-zero average orientation described as 719
necessary to observe topologically-connected nanotube-vesicle structures in the absence of 720
external forces This hypothesis could also be enriched by the possibility of nanotubes to be 721
pulled away between two vesicles after a collision event 722
This work expands the actual theoretical and experimental framework on lipid networks 723
stabilized by a different radius of curvature It could also motivate the synthesis or isolation 724
29
of new lipids providing a higher level of 3D architectural control in soft networks possibly in 725
the range of room temperature 726
727
Acknowledgements 728
Dr Andrea Lassenberger and Dr Sylvain Preacutevost at Institut Laue Langevin (ILL Grenoble 729
France) are kindly acknowledged for their assistance on the SANS experiment Confocal 730
images were performed at the Institut de Biologie Paris Seine (IBPS) imaging facility Jean-731
Franccedilois Gilles (Imaging Core Facility Institut de Biologie Paris Seine (IBPS) CNRS 732
Sorbonne Universiteacute Paris France) is kindly acknowledged for his assistance on the confocal 733
microscopy imaging Dr Guillaume Laurent (LCMCP Sorbonne Universiteacute Paris France) is 734
kindly acknowledged for helpful discussions The French region Ile-de-France SESAME 735
program is acknowledged for financial support (700 MHz NMR 736
spectrometer) Dr Olivier Diat (ICSM Marcoule France) Prof eronikaIglič and Prof V Aleš737
onsul discussi Slovenia) are kindly acknowledged for helpfUniversity of LjubljanaIglič (-Kralj 738
739
Financial support 740
WAXS experiments have been supported by Soleil Light Source Saint Aubin France proposal 741
Ndeg 20201747 SANS experiments have been supported by ILL proposal Ndeg9-13-778 742
743
References 744
1 D Kabaso N Bobrovska W Goacuteźdź E Gongadze V Kralj-Iglič R Zorec and A 745
Iglič Bioelectrochemistry 2012 87 204ndash210 746
2 C R Safinya U Raviv D J Needleman A Zidovska M C Choi M A Ojeda-747
Lopez K K Ewert Y Li H P Miller J Quispe B Carragher C S Potter M W 748
Kim S C Feinstein and L Wilson Adv Mater 2011 23 2260ndash2270 749
3 P Veranič M Lokar G J Schuumltz J Weghuber S Wieser H Haumlgerstrand V Kralj-750
Iglič and A Iglič Biophys J 2008 95 4416ndash4425 751
4 A Rustom R Saffrich I Markovic P Walther and H-H Gerdes Science (80- ) 752
2004 303 1007ndash1010 753
5 M I Angelova S Soleacuteau P Meacuteleacuteard F Faucon and P Bothorel Prog Colloid 754
Polym Sci 1992 89 127ndash131 755
6 L Mathivet S Cribier and P F Devaux Biophys J 1996 70 1112ndash1121 756
7 V Kralj-Iglič G Gomišček J Majhenc V Arrigler and S Svetina Colloids Surfaces 757
A Physicochem Eng Asp 2001 181 315ndash318 758
30
8 V Kralj-Iglič A Iglič G Gomišček F Sevšek V Arrigler and H Haumlgerstrand J 759
Phys A Math Gen 2002 35 1533ndash1549 760
9 M Drab D Stopar V Kralj-Iglič and A Iglič Cells 2019 8 626 761
10 A Zidovska K K Ewert J Quispe B Carragher C S Potter and C R Safinya 762
Langmuir 2009 25 2979ndash2985 763
11 A Zidovska K K Ewert J Quispe B Carragher C S Potter and C R Safinya Soft 764
Matter 2011 7 8363ndash8369 765
12 A Zidovska K K Ewert J Quispe B Carragher C S Potter and C R Safinya 766
Biochim Biophys Acta - Biomembr 2009 1788 1869ndash1876 767
13 M Karlsson K Sott M Davidson A S Cans P Linderholm D Chiu and O Orwar 768
Proc Natl Acad Sci U S A 2002 99 11573ndash11578 769
14 A Karlsson R Karlsson M Karlsson A-S Cans A Stromberg F Ryttsen and O 770
Orwar Nature 2001 409 150ndash152 771
15 M Karlsson K Sott A S Cans A Karlsson R Karlsson and O Orwar Langmuir 772
2001 17 6754ndash6758 773
16 E Evans H Bowman A Leung D Needham and D Tirrell Science (80- ) 1996 774
273 933ndash935 775
17 U Seifert Configurations of fluid membranes and vesicles 1997 vol 46 776
18 J Kaumls and E Sackmann Biophys J 1991 60 825ndash844 777
19 N Bobrovska W Goacuteźdź V Kralj-Iglič and A Iglič PLoS One 2013 8 e73941 778
20 A Iglič B Babnik K Bohinc M Fošnarič H Haumlgerstrand and V Kralj-Iglič J 779
Biomech 2007 40 579ndash585 780
21 K Bohinc T Slivnik A Iglič M Brumen and V Kralj-Iglič J Phys Chem C 2007 781
111 9709ndash9718 782
22 A Iglič H Haumlgerstrand P Veranič A Plemenitaš and V Kralj-Iglič J Theor Biol 783
2006 240 368ndash373 784
23 V Kralj-Iglič and P Veranič Adv Planar Lipid Bilayers Liposomes 2006 5 129ndash785
149 786
24 A Iglic and V Kralj-Iglic Adv Planar Lipid Bilayers Liposomes 2006 4 253ndash279 787
25 S Penič L Mesarec M Fošnarič L Mroacutewczyńska H Haumlgerstrand V Kralj-Iglič and 788
A Iglič Front Phys 2020 8 342 789
26 P Yager and P E Schoen Mol Cryst Liq Cryst 1984 106 371ndash381 790
27 T G Barclay K Constantopoulos and J Matisons Chem Rev 2014 114 10217ndash791
10291 792
31
28 B Božič G Gomišček V Kralj-Iglič S Svetina and B Žekš Eur Biophys J 2002 793
31 487ndash496 794
29 A Iglič H Haumlgerstrand M Bobrowska-Haumlgerstrand V Arrigler and V Kralj-Iglič 795
Phys Lett A 2003 310 493ndash497 796
30 R Bar-Ziv and E Moses Phys Rev Lett 1994 73 1392ndash1395 797
31 S Chiruvolu H E Warriner E Naranjo S H Idziak J O Raumldler R J Plano J A 798
Zasadzinski and C R Safinya Science (80- ) 1994 266 1222ndash1225 799
32 V Kralj-Iglič A Iglič H Haumlgerstrand and P Peterlin Phys Rev E 2000 61 4230ndash800
4234 801
33 L Mesarec M Drab S Penič V Kralj-Iglič and A Iglič Int J Mol Sci 2021 22 802
2348 803
34 L Van Renterghem S L K W Roelants N Baccile K Uyttersprot M C Taelman 804
B Everaert S Mincke S Ledegen S Debrouwer K Scholtens C V Stevens W 805
Soetaert L Van Renterghem S L K W Roelants N Baccile K Uytersprot M C 806
Taelman B Everaert S Mincke S Ledegen S Debrouwer K Scholtens C V 807
Stevens and W Soetaert Biotechnol Bioeng 2018 115 1195ndash1206 808
35 J Clark and F Deswarte Introduction to Chemicals from Biomass Second Edition 809
John Wiley amp Sons 2015 810
36 K V Sajna R Houmlfer R K Sukumaran L D Gottumukkala and A Pandey in 811
Industrial Biorefineries and White Biotechnology eds A Pandey R Houmlfer M 812
Taherzadeh K M Nampoothiri and C Larroche Amsterdam Oxford Waltham 813
Elsevier 2015 pp 499ndash521 814
37 R Marchant and I M Banat Trends Biotechnol 2012 30 558ndash565 815
38 K Hill and C LeHen-Ferrenbach in Sugar-Based Surfactants Fundamentals and 816
Applications ed C C Ruiz Boca Raton CRC Press 2009 pp 1ndash20 817
39 L Rodrigues I M Banat J Teixeira and R Oliveira J Antimicrob Chemother 818
2006 57 609ndash618 819
40 J D Desai and I M Banat Microbiol Mol Biol Rev 1997 61 47ndash64 820
41 S L K W Roelants K Ciesielska S L De Maeseneire H Moens B Everaert S 821
Verweire Q Denon B Vanlerberghe I N A Van Bogaert P Van der Meeren B 822
Devreese and W Soetaert Biotechnol Bioeng 2016 113 550ndash559 823
42 N Baccile M Selmane P Le Griel S Preacutevost J Perez C V Stevens E Delbeke S 824
Zibek M Guenther W Soetaert I N A Van Bogaert and S Roelants Langmuir 825
2016 32 6343ndash6359 826
32
43 N Baccile A-S Cuvier S Preacutevost C V Stevens E Delbeke J Berton W Soetaert 827
I N A Van Bogaert and S Roelants Langmuir 2016 32 10881ndash10894 828
44 N Baccile C Seyrig A Poirier S A Castro S L K W Roelants and S Abel Green 829
Chem 2021 23 3842ndash3944 830
45 A Salis L Cappai C Carucci D F Parsons and M Monduzzi J Phys Chem Lett 831
2020 11 6805ndash6811 832
46 J Schindelin I Arganda-Carreras E Frise V Kaynig M Longair T Pietzsch S 833
Preibisch C Rueden S Saalfeld B Schmid J-Y Tinevez D J White V 834
Hartenstein K Eliceiri P Tomancak and A Cardona Nat Methods 2012 9 676ndash835
682 836
47 T Parasassi and E Gratton J Fluoresc 1995 5 59ndash69 837
48 M M Dodes Traian F L Gonzaacutelez Flecha and V Levi J Lipid Res 2012 53 609ndash838
616 839
49 D M Owen C Rentero A Magenau A Abu-Siniyeh and K Gaus Nat Protoc 840
2012 7 24ndash35 841
50 W Stillwell in An Introduction to Biological Membranes Academic Press 2016 pp 842
135ndash180 843
51 W Stillwell in An Introduction to Biological Membranes Academic Press 2016 pp 844
181ndash220 845
52 B Tenchov Chem Phys Lipids 1991 57 165ndash177 846
53 R Koynova and M Caffrey Biochim Biophys Acta 1998 1376 91ndash145 847
54 F Schmid S Dolezel O Lenz and S Meinhardt J Phys Conf Ser 2014 487 848
012004 849
55 S Meinhardt R L C Vink and F Schmid Proc Natl Acad Sci U S A 2013 110 850
4476ndash4481 851
56 O Glatter and O Kratky Small Angle X-ray Scattering Academic Press London 852
1982 853
57 B A Cunningham A D Brown D H Wolfe W P Williams and A Brain Phys 854
Rev E 1998 58 3662ndash3672 855
58 M Nadler A Steiner T Dvir O Szekely P Szekely A Ginsburg R Asor R Resh 856
C Tamburu M Peres and U Raviv Soft Matter 2011 7 1512ndash1523 857
59 C Tanford The hydrophobic effect Formation of micelles and biological membranes 858
John Wiley amp Sons Inc New York 1973 859
60 M Masuda and T Shimizu Langmuir 2004 20 5969ndash5977 860
33
61 A Zidovska K K Ewert J Quispe B Carragher C S Potter and C R Safinya 861
Block Liposomes Vesicles of Charged Lipids with Distinctly Shaped Nanoscale 862
Sphere- Pear- Tube- or Rod-Segments Elsevier Inc 1st edn 2009 vol 465 863
62 A Iglic V Kralj-Iglic B Božič M Bobrowska-Haumlgerstrand B Isomaa and H 864
Haumlgerstrand Bioelectrochemistry 2000 52 203ndash211 865
63 T Shimizu M Masuda and H Minamikawa Chem Rev 2005 105 1401ndash1444 866
64 J V Selinger and J M Schnur Phys Rev Lett 1993 71 4091ndash4094 867
65 J M Schnur Science (80- ) 1993 262 1669ndash1676 868
66 B Tenchov R Koynova and G Rapp Biophys J 2001 80 1873ndash1890 869
67 R Koynova and B Tenchov Ser Biomech 2017 31 3ndash19 870
68 S J Angyal and R Le Fur Carbohydr Res 1984 126 15ndash26 871
69 J K Whitesell and M A Minton J Am Chem Soc 1987 109 225ndash228 872
70 T Takayama S Ando and I Ando J Mol Struct 1990 220 245ndash250 873
71 K Gawrisch N V Eldho and I V Polozov Chem Phys Lipids 2002 116 135ndash151 874
72 F Tielens C Gervais J F Lambert F Mauri and D Costa Chem Mater 2008 20 875
3336ndash3344 876
73 G A Jeffrey and Y Yeon Acta Crystallogr Sect B 1986 42 410ndash413 877
74 B Berglund and R W Vaughan J Chem Phys 1980 73 2037ndash2043 878
75 C Gervais C Coelho T Azaiumls J Maquet G Laurent F Pourpoint C Bonhomme 879
P Florian B Alonso G Guerrero P H Mutin and F Mauri J Magn Reson 2007 880
187 131ndash140 881
76 C Akita T Kawaguchi F Kaneko H Yamamoto and M Suzuki J Phys Chem B 882
2004 108 4862ndash4868 883
77 R N Purusottam L Seacutenicourt J J Lacapegravere and P Tekely Biochim Biophys Acta - 884
Biomembr 2015 1848 3134ndash3139 885
78 X Biarneacutes A Ardegravevol A Planas C Rovira A Laio and M Parrinello J Am Chem 886
Soc 2007 129 10686ndash10693 887
79 L M J Kroon‐Batenburg and J Kroon Biopolymers 1990 29 1243ndash1248 888
80 K N Kirschner and R J Woods Proc Natl Acad Sci U S A 2001 98 10541ndash889
10545 890
81 S Svenson B Kirste and J H Fuhrhop J Am Chem Soc 1994 116 11969ndash11975 891
82 I Sack S Macholl J H Fuhrhop and G Buntkowsky Phys Chem Chem Phys 892
2000 2 1781ndash1788 893
83 S Svenson J Koening and J H Fuhrhop J Phys Chem 1994 98 1022ndash1028 894
34
84 S Svenson A Schaefer and J H Fuhrhop J Chem Soc Perkin Trans 2 1994 2 895
1023ndash1028 896
85 K Bock and C Pedersen Adv Carbohydr Chem Biochem 1983 41 27ndash66 897
86 T B Grindley Structure and Conformation of Carbohydrates Springer Berlin 898
Heidelberg 2008 899
87 F Tantakitti J Boekhoven X Wang R V Kazantsev T Yu J Li E Zhuang R 900
Zandi J H Ortony C J Newcomb L C Palmer G S Shekhawat M O De La 901
Cruz G C Schatz and S I Stupp Nat Mater 2016 15 469ndash476 902
903
1
Supporting Information 904
905
Topological connection between vesicles and nanotubes in single-906
component lipid membranes driven by head-tail interactions 907
908
Niki Baccilea Ceacutedric Lorthioira Abdoul Aziz Baa Patrick Le Griela Cristina Coelhob Javier 909
Perezc Wim Soetaertd Sophie L K W Roelantsd 910
911
a Sorbonne Universiteacute Centre National de la Recherche Scientifique Laboratoire de Chimie de 912
la Matiegravere Condenseacutee de Paris LCMCP F-75005 Paris France 913
b Institut des Mateacuteriaux de Paris Centre Sorbonne Universiteacute Paris France 914
c Synchrotron Soleil LrsquoOrme des Merisiers Saint-Aubin BP48 91192 Gif-sur-Yvette Cedex 915
France 916
d InBio Department of Biotechnology Ghent University Ghent Belgium 917
918
919
Corresponding author 920
Dr Niki Baccile 921
E-mail address nikibaccilesorbonne-universitefr 922
Phone +33 1 44 27 56 77 923
924
925
926
2
a) 927
Parameter Method
Dry Matter (DM ) 996 Infrared balance 105degC
Glucose () 012 HPLC-Metacarb
Glycerol () nd HPLC-Metacarb
Free Fatty Acid content () lt001 Internal method BBEPP
GC with FID Detector
Oil () lt001 Internal method BBEPP
GC with FID Detector
Moulds (CFUg) lt10 3M-Nordval ndeg16 B
Yeasts (CFUg) lt10 3M-Nordval ndeg16 B
Anaerobic count (CFUg) lt10 SP-VG M005 B
Protein () tbd BCA protein assay
928
Figure S 1 - a) HPLC-ELSD chromatogram and composition table 929
930
931
932
933
3
b) 934
935
Group Ndeg δ ppm
CH2 1 354
CH2 2 153
CH2 3-712-14 132
CH2 811 203
CH 910 534
CH2 15 162
CH2 16 388
CH 1 424
CH 2 316
CH 3 334
CH 4 329
CH 5 354
CH2 6 366
Figure S 1 (next) ndash b) 1H NMR spectrum (MeOD-d4) recorded on the purified G-C181-OH compounds 936
and related assignment 937
938
2
811910 1rsquo
5rsquo1
3rsquo4rsquo
1rsquo1910
asymp asymp asympHDO MeOD Acetone
6rsquo2rsquo
1615
3-712-14
4
939
940
Figure S 2 ndash Cryo-TEM images recorded for a 5 mgmL G-C181-OH aqueous solution heat at T= 130degC 941
5
942
943
Figure S 3 - Cryo-TEM images recorded for a 5 mgmL G-C181-OH aqueous solution heat at T= 90degC 944
945
90degC
1
22
6
946
947
948
949
Figure S 4 ndash Cryo-TEM images recorded for a 5 mgmL G-C181-OH aqueous solution heat at T= 70degC 950
951
21
11
1
2
5
3
4
45
5
6
7
7
7
952
953
954
Figure S 5 ndash Cryo-TEM images recorded for a 5 mgmL G-C181-OH aqueous solution heat at T= 25degC 955
956
957
1
1 1
8
958
Figure S 6 ndash a) SANS experiment recorded at 90degC for a 5 mgmL G-C181-OH aqueous solution b-c) 959
WAXS experiments recorded on aqueous solutions of G-C181-OH at b) 5 mgmL and c) 25 mgmL d) 960
Structural interpretation of the repeating distances pointed out in c) 961
962
963
964
001 01 1
q Aring-1
25degC
68degC
88degC
111degC
01 1q Aring
-1
02 04 06 08 1q Aring
-1
001 01
10-1
100
101
Inte
nsity
cm
-1
q Aring-1
-2
T= 90degC
SANS WAXS WAXS
a) b) c)
dv
dL d= 144 Aring-1
di
ddH2O
dt
dvdL
dtdi d
d)
9
965
966
Figure S 7 ndash ssNMR MAS (10 kHz) experiments recorded on a G-C181-OH dry powder a) 1H spectra 967
recorded from 110degC to 70degC b) 13C single pulse (SP) spectra recorded with high power 1H decoupling from 968
110degC to 70degC c) 13C cross polarization (CP) spectra recorded at 110degC and contact time tc of 50 micros and 969
3000 micros d) 13C CP spectra recorded at 70degC and for 20 lt tc micros lt 3000 970
971
1
811
910
CH2 CH2
1rsquo
6rsquo
8 6 4 2 0 ppm
110
90
80
70
910
1rsquo
6rsquo16
1
2rsquo3rsquo4rsquo
811
OH
45 40 35 30 25 20 15
ppm
200 180 160 140 120 100 80 60 40 20 0
ppm140 120 100 80
ppm
CH2-gauche
3004
110
90
80
70
65
60
50
25
C91013003
C9 - 12869
CH2-all-trans
3198
C1rsquo10335
a) b)
1H
T degCT degC
13C Single Pulse MAS
A
B
A
B
70degC70degC
5rsquo
215
200 180 160 140 120 100 80 60 40 20 0
ppm
13C CPMAST= 110degC
200 180 160 140 120 100 80 60 40 20 0
ppm
132 131 130 129 128 127 126
ppm
106 105 104 103 102
ppm
13C CPMAST= 70degC
50
tc micros
3000
20
tc micros
50 500 1000 3000
tc micros
C102
13024 C910113003
C92
12869
C1rsquo213082
C1rsquo110443
A B
106 105 104 103 102
ppm
3000
1000
500
50
20
AB
c)
d)
10
972
Figure S 8 ndash a) Short and d) long T2 components displayed by the 1H transverse relaxation signal c) 1H 973
transverse relaxation signals recorded on a G-C181-OH dry powder from 110degC to 70degC The area of each 974
given resonance is plotted (log-lin) as a function of the echo time (CPMG pulse sequence) for each 975
temperature and fitted using the equation given above T2s and T2l indicate the short and long T2 relaxation 976
times respectively obtained by describing the 1H transverse relaxation signal using a biexponential decay 977
For H1rsquo H5rsquo and H6rsquo the 1H relaxation function could be described by a monoexponential decay 978
- Protons from the sugar group (H1rsquo H5rsquo H6rsquo) show a single T2 relaxation component (Figure 979
6c and Figure S 8) while protons of the acyl chain (CH2 H910 H811) show both short (Figure 980
6c) and long (Figure 6d) T2 relaxation component 981
- The short T2 relaxation time systematically decreases from 110degC to 70degC for all species by a 982
factor ranging from two to seven depending on the specific chemical group Very long T2 are 983
observed at 110degC for all acyl species while nearly unchanged values are measured below 984
90degC without any clear trend 985
- The sugar protons (H1rsquo H5rsquo H6rsquo) have the shortest set of T2 values (lt 1 ms) below 100degC 986
The long component of T2 generally ranges between 4 ms and 12 ms 987
0 1 2 3 4 5 6 7 8
00
05
10
15
20
25
30
35
40
45
Log
In
ten
sity
Time ms
0 1 2 3 4 5 6 7 8
00
05
10
15
20
25
30
35
40
45
Log
In
ten
sity
Time ms
0 1000 2000 3000 4000 5000 6000 7000 8000
00
05
10
15
20
25
30
35
40
45
Log
In
ten
sity
Time ms
0 1000 2000 3000 4000 5000 6000 7000 8000
00
05
10
15
20
25
30
35
40
45
Log
In
ten
sity
Time ms
0 1000 2000 3000 4000 5000 6000 7000 8000
00
05
10
15
20
25
30
35
40
45
Log
In
ten
sity
Time ms
0 1000 2000 3000 4000 5000 6000 7000 8000
00
05
10
15
20
25
30
35
40
45
Log
In
ten
sity
Time ms
H1
H8H11
H9H10
CH2
H1rsquo
H6rsquo
CH2
H910H811 H1CH2
H1rsquo H5rsquo6rsquo
0 1000 2000 3000 4000 5000 6000 7000 8000
00
05
10
15
20
25
30
35
40
45
Log
In
ten
sity
Time ms
OH
0 1000 2000 3000 4000 5000 6000 7000 8000
00
05
10
15
20
25
30
35
40
45 T= 110degC
T= 90degC
T= 80degC
T= 70degC
Log
In
ten
sity
Time ms
Fit
)
CH2 H910 H811 H1 H56 H1 OH
00
05
10
15
20
25
30
35
40
T2 m
s
T= 110degC
T= 90degC
T= 80degC
T= 70degC
CH2 H910 H811 H1
0
2
4
6
8
10
12
T2 m
s
T= 110degC
T= 90degC
T= 80degC
T= 70degC
Short T2(1H) Long T2(1H)
a) b)
c)
11
Table S 1 ndash 1H chemical shifts of G-C181-OH in solution and in the solid-state Solid-state spectra are 988
recorded at a MAS frequency of 10 kHz in DMSO-d6 broad peak 989
990
δH ppm
Group Ndeg Liquid
(MeOD-d4) Solid
(T= 110degC) Solid
(T= 70degC)
CH2 H1 354 357
CH2 H2 153 156
CH2 H3-712-14 132 135
CH2 H811 203 203
CH H910 534 534
CH2 H15 162 164
CH2 H16 388 383
CH H1 424 432
CH H2 316 335
CH H3 334 335
CH H4 329 335
CH H5 354 351 357
CH2 H6 366 383
OH OH1 432
45 463
OH OH2 492
OH OH3 490
OH OH4 487
OH OH6 445
991
992
H1H9H10H1rsquo
H6rsquo
OH2rsquo
OH1
12
Detailed discussion about the NOESY and DQ-SQ 2D 1H-1H ssNMR experiments presented in 993
Figure 9 994
995
2D 1H-1H ssNMR experiments are a unique tool to explore through-space proximities 996
between 1H nuclei ssNMR offers a large number of possibilities each adapted to a given 997
system The advantage of 2D maps with respect to a dynamics approach is their direct 998
readability in clear two nuclei which exchange their magnetization through-space (whichever 999
mechanism may be responsible for this exchange) will display a specific cross-peak However 1000
the way cross-peaks are presented and interpreted strictly depends on the nature of the pulse 1001
program which in turn is chosen according to the physical nature of the sample 1002
1D temperature-dependent 1H NMR experiments performed on G-C181-OH (Figure 1003
4a in the main text) indicate sharp peaks at 90degC and broad peaks at 70degC Narrow peaks 1004
indicate fast andor large-amplitude molecular tumbling averaging the strong 1H-1H dipolar 1005
interactions This excludes the use of pulse sequences like DQ-SQ which is not efficient under 1006
these conditions For this reason we employ spin-diffusion-based pulse sequences like 1007
NOESY which is more adapted for samples with high molecular mobility When mixing times 1008
are chosen to be short (lt 1 s) one generally explores through-space proximities within about 5 1009
10 Aring On the contrary when molecular motions are restricted dipolar coupling becomes 1010
significant 1H NMR peaks are broader and pulse sequences like DQ-SQ can now be used 1011
with a spatial resolution of less than 5 Aring 1012
Whenever possible DQ-SQ experiments are preferred over spin diffusion-based pulse 1013
sequences because they are more selective in particular for likewise interactions which are 1014
not discriminated in NOESY-type experiments This is illustrated by the typical interaction 1015
schemes for NOESY (top Figure 9a) and DQ-SQ (top Figure 9b) For two given A and B 1016
protons 2D NOESY maps will display two on-diagonal and two square-shaped symmetrical 1017
off-diagonal cross-peaks Off-diagonal cross-peaks illustrate the mutual A-B and B-A 1018
interaction but the on-diagonal peaks are systematic and do not prove any A-A or B-B 1019
interaction Similarly to NOESY 2D DQ-SQ maps display off-diagonal peaks (symmetric 1020
across the diagonal top Figure 9b) upon A-B and B-A interaction but in contrast they will 1021
display on-diagonal peaks only in the presence of self-interaction In the tutorial example of 1022
Figure 9b top the on-diagonal A-A peak indicates mutual A-A interaction while lack of on-1023
diagonal B-B peak evidences the absence of B-B proximities Combining NOESY and DQ-SQ 1024
experiments is capital to study the local arrangement of G-C181-OH and its evolution with 1025
temperature 1026
13
At T= 90degC the H1 and H5rsquo contributions are very close but possible to discriminate 1027
them (δ(H1)= 354 ppm δ(H5rsquo)= 351 ppm) according to 1H NMR chemical shifts in Table S 1028
1 2D 1H-1H NOESY in Figure 9a also discriminates between the two components attributed 1029
on the basis of the interactions with their mutual neighbors (green H1-H2 and H5rsquo-H1rsquo squares 1030
in Figure 9a) On this basis 2D NOESY does not show a direct H1rsquo-H1 correlation (blue red-1031
crossed) but rather an extensive network of intra-sugar interactions These features exclude 1032
suggest intra- and inter-sugar interactions and they exclude head-tail arrangements as a major 1033
molecular configuration at 90degC 1034
At 70degC the 1H NMR peaks are broader indicating a reduction of the T2 (1H) relaxation 1035
times andor residual homonuclear dipolar interactions excluding the use of NOESY In this 1036
case 1H-1H DQ-SQ correlation experiments are best suited Figure 9b presents the 1H-1H DQ-1037
SQ experiment on G-C181-OH at 70degC Peaks are broader than in NOESY and attribution may 1038
be cumbersome However the experiment is performed at 700 MHz and MAS= 22 kHz which 1039
improves spectral resolution with respect to the same experiment performed at 300 MHz and 1040
MAS= 10 kHz The auto-peak at δH= 356 ppm in the SQ dimension is attributed to H1-H1 spin 1041
pairs mainly resulting from intra CH2 interaction while the DQ cross-peaks at δH= 156-356 1042
ppm and δH= 432-356 ppm respectively origin from H2-H1 and H1rsquo-H1 interactions (Figure 1043
9b) DQ-SQ map does not show any auto-peak corresponding to H1rsquo-H1rsquo or Hxrsquo-Hxrsquo (x= 2rsquo 1044
3rsquo 4rsquo) interactions (red-crossed blue Figure 9b) thus excluding any proximity (lt 5 Aring) between 1045
close glucose neighbors On the contrary DQ-SQ maps (recorded both at 700 MHz Figure 9b 1046
or at 300 MHz not shown) systematically show DQ cross-peaks which can only be attributed 1047
to H1rsquo-H1 interactions (δH= 432-356) The presence of these H1rsquo-H1 interactions can only be 1048
explained by a head-tail arrangement of the G-C181-OH molecules as illustrated below the 1049
DQ-SQ map in Figure 9b 1050
21
resonances for anomeric C1rsquo1 and C1rsquo2 cis-olefin C9101 and C92 C102 and CH2 gauche and 533
all-trans environments) and relaxation behaviour (fast and slow T2 relaxation components) 534
strongly suggests the coexistence of two molecular environments Further proofs of the 535
coexistence of two distinct molecular domains are given by a number of chemical shift 536
variations in the 13C CPMAS spectrum at 70degC compared to the one at 110degC 90degC and 537
solution This is shown in Figure 7 and in the list of 13C chemical shifts in Table 1 538
539
540
Figure 7 - Comparison between solution- and solid-state 13C NMR spectra of G-C181-OH Solid-state 541
experiments are recorded directly on the sample powder at a MAS of 10 kHz (4 mm zirconia rotor) SP 542
Single Pulse CP Cross Polarization In all the ssNMR experiments temperature is first raised at 110degC 543
and then lowered to either 90degC or 70degC Segmented lines are meant to highlight the known peak position 544
in solution thus stressing the strong chemical shift variations in the solid-state 545
546
NMR experiments above Tm2 suggest that vesicles could contain G-C181-OH with a 547
single family of mobile conformations characterized by chemically-equivalent C=C (red 548
Figure 8b) and a single C1rsquo conformation (green Figure 8b) Experiments between Tm1 and Tm2 549
otherwise suggest that two coexisting conformations characterized by chemically-equivalent 550
(red Figure 8b) and inequivalent (magenta Figure 8b) C=C could be associated to nanotubes 551
Two distinct C1rsquo sites (grey Figure 8b) also indicate two configurations of the sugar headgroup 552
A comment on this point will be given in the following paragraphs 553
The local (Aring-scale) variation of molecular mobility below Tm2 drives the coexistence of 554
two distinct molecular environments of the same G-C181-OH molecule This occurs within a 555
single-phase domain (as deduced by WAXS) of equivalent membrane rigidity (as derived from 556
Laurdan probe in confocal microscopy) Although never reported before the difference in the 557
local mobility of the same amphiphile (here G-C181-OH) could satisfy the theoretically-558
140 120 100 80 60 40 20
CP(3 ms)-70degC
SP-70degC
SP-90degC
SP-110degC
ppm
LiquidC910
C1rsquo
C2rsquo
C4rsquo
C3rsquo
C1
C6rsquoC5rsquo
C1
6
C8
11
C2 C
H2
C1
5
CH
2
DM
SO
13C
22
required conditions that induce local lipid segregation and formation of membrane inclusions 559
(Figure 8c) In case of their non-zero average orientation the local membrane curvature 560
increases62 and nanotubes can spontaneously form (Figure 8bc) More intriguing this 561
mechanism occurs at least 10degC above Tm1 although it should not be favored above the Tm27 562
From both experimental and theoretical backgrounds the conditions of topologically-563
connected vesicles-nanotubes systems are met only when either internal (two components) or 564
external driving forces are applied19 In the present single-lipid system of which the phase 565
behavior is summarized in Figure 8a the most plausible driving force could be explained by 566
the NMR results collected on the dry sample G-C181-OH concomitantly occupies two 567
molecular environments characterized by 1) two distinct conformations of the sugar 568
displaying equivalent mobility and 2) two conformations of the acyl chain unsaturation 569
570
23
571
Figure 8 ndash a) Thermotropic phase behavior of G-C181-OH at 5 mgmL-1 Note that Tm2 is observed on the 572
dry powder only b) Possible relationship between the molecular environment as derived from NMR and 573
membrane curvatures All the molecular drawings refer to the same G-C181-OH molecule (bulky ellipsoid 574
equiv sugar headgroup) while each color corresponds to a given configuration Grey of C1rsquo1 and C1rsquo2 indicates 575
the uncertainty about the assignment of the specific NMR peak The curvature C is defined as 1R R being 576
the curvature radius R1 R2 radius of curvature CG Gauss curvature CM Mean curvature c) Free 577
interpretation of the anisotropic high-curvature (CMgt 0 CG= 0) inclusions in the membrane (low CM and 578
CG) continuum driven by inter-sugar H-bonding and reduced intramembrane diffusion for a G-C181-OH 579
glucolipid 580
581
Flat crystalline structure
Nanotube-vesicle network
Vesicles
48degC
120deg
106 105 104 103 102 101
ppm
H9 H10H1rsquo
106 105 104 103 102 101
ppm106 105 104 103 102 101
ppm106 105 104 103 102 101
ppm
C=CC=C
C1rsquo1C1rsquo2
C1rsquo
Tm2(96degC)Tm1
a)
b)
c)
Same molecule different local orientations and sugar conformations
High curvature membrane
Low curvature inclusion
Flip-FlopStrong H-bonding
CG
CM ( + )
CG 0
CM 0 CG 0
CM 0
G-C181-OH
24
Two related questions are unanswered at the moment What actually drives nanotube 582
formation and is the organization of G-C181-OH within the vesicles and tubes the same Lipid 583
nanotubes have been studied for at least three decades over which broad experimental and 584
theoretical insight has been generated Despite this fact the actual understanding is still matter 585
of debate27 Micelle-to-nanotube and vesicle-to-nanotube phase transitions are generally 586
reported for single amphiphiles below a given Tm and intermediate phase composed of twisted 587
and flat fibers is concomitantly reported Initially thought to be a chirality-driven phenomenon 588
recent studies propose a more general mechanism involving crystallization and symmetry 589
breaking in the lipid packing driven by optimal packing27 If twisted ribbons were observed 590
before for a number of microbial glycolipid bolaamphiphiles44 they are not found for G-C181-591
OH This fact as well as the large body of cryo-TEM images and the observation of nanotubes 592
above Tm1 rather pledge in favour of a direct topological change from positive (vesicles) to 593
zero (nanotubes) Gaussian curvatures In this case vesicle-to-nanotube transitions could be 594
driven by external forces56307813ndash162829 595
Considering the absence of external forces in the present system there are only two 596
possibilities left spontaneous budding of the membrane or nanotube pulling after inter-vesicle 597
collisions due to Brownian motion Both are possible as inclusions composed of a different 598
arrangement of the same molecule in the membrane continuum can theoretically explain 599
spontaneous nanotube formation in an isotropic medium672223629ndash1218ndash21 However the second 600
one is probably more likely to prevail because it could explain the large number of nanotubes 601
connecting two distant vesicles Interestingly similar events occur for any phospholipid-based 602
vesicular solution but nanotubes are extremely rare unless at least two lipids of different 603
molecular structure are mixed together The spectroscopic 1H and 13C and relaxation (1H) 604
ssNMR data even if collected on a dry powder demonstrate that the coexistence of two G-605
C181-OH configurations involving both the sugar headgroup and fatty alcohol chain are 606
possible for this molecule As a matter of fact this is not so surprising as more than one energy 607
minima each corresponding to a given conformation are known for glucose its non-reducing 608
derivative methylglucose and carbohydrates in general78ndash80 609
The presence of two configurations could explain the coexistence between two 610
structures of different curvature but the data presented so far do not explain the origin of these 611
two configurations In other words what drives the change in the local structure of the sugar 612
headgroup and fatty alcohol within the membrane 613
The association of known self-assembled structures to spectroscopic 13C ssNMR data is 614
known for years in particular for gluconamides lipids having a linear sugar headgroup81ndash84 It 615
25
was found that gauche effects in some cases up to the γ position in the sugar chain induce 616
upfield chemical shifts while anti and trans conformations result in downfield shifts Each 617
structure (monolayer crystal bilayer crystal or micellar fiber) was then characterized by a given 618
organization of the gluconamide and a characteristic 13C ssNMR fingerprint which could be 619
explained by gauche γ-gauche anti and trans conformations of the headgroup Similar 620
structural-spectroscopic correlations have been collected over the years for much simpler cyclic 621
sugars85 whereas pyranoses can undergo important conformational changes (chair half-chair 622
boat skew) when the appropriate energy barriers are crossed78ndash8086 A quantitative 623
conformational study based on the 13C chemical shift variations shown in Table 1 would be 624
certainly helpful but very delicate in the context of the present state of the art because a 625
rigorous approach requires at least one known crystal structure8182 which is currently missing 626
for this compound A qualitative approach will then be adopted 627
G-C181-OH is a bolaform amphiphile and flip-flop could be a possible mechanism 628
involved in the nanotube stabilization whereas head-tail interactions have long been considered 629
as important in nanotube-forming bolaform amphiphiles6063 From mere considerations based 630
on T2 (1H) relaxation arguments one could exclude head-tail configurations if the R-CH2OH 631
endgroup (H1) was involved in a direct interaction with the sugar group its corresponding T2 632
would probably be comparable to the sugarrsquos one (OH and H1rsquo) but this does not seem to be 633
the case However this hypothesis would be based on the comparison of the relaxation from 634
CH and CH2 protons additionally involved in different kind of motions Besides the relaxation 635
of H1 is influenced by the strong overlap between H1 and H5rsquo For these reasons relaxation 636
arguments are not solid enough and will not be used 637
We then address this question by exploring intermolecular interactions in a direct 638
manner using 2D 1H-1H homonuclear ssNMR correlation spectroscopy At 90degC in the fast-639
tumbling domain of molecular motion (narrow 1H NMR peaks Figure 6a) and corresponding 640
to the vesicle-rich region spin diffusion (NOESY) experiments are preferred over dipolar 641
coupling based experiments because such interaction is averaged out by molecular motion 642
However when the molecular motion is more constrained in the domain of nanotube stability 643
at 70degC (broad 1H spectra Figure 6a) Double-Quantum Single-Quantum (DQ-SQ) correlation 644
experiments are best suited to probe interaction between close molecular neighbors These 645
experiments are reported in Figure 9 and the related interpretation is only briefly reported 646
below while a more detailed discussion can be found on Page 12 in the Supporting Information 647
26
648
Figure 9 ndash a) 2D 1H-1H NOESY NMR experiment performed at MAS= 10 kHz (4 mm probe) on a Bruker 649
300 MHz Avance III HD spectrometer using 300 ms of mixing time Sample temperature is regulated to 650
90degC reached by cooling from 110degC b) 2D 1H-1H DQ-SQ (BAck-to-BAck BABA pulse sequence used for 651
the DQ excitation scheme) NMR experiment performed at MAS= 22 kHz (25 mm probe) on a Bruker 700 652
MHz Avance III spectrometer using a DQ excitation time equal to 2 rotor periods Sample temperature is 653
regulated to 70degC reached by cooling from 110degC The typical schemes illustrating how to interpret these 654
2D experiments are reported above each experimental map Zooms of the sugar region and configurational 655
interpretation are given below each 2D map More information are given in the text below 656
H16-H16
H1-H1
H9-H10
H1rsquo-H1
H1rsquoH910 H16
H1
H1rsquo-H1rsquo
Hxrsquo-Hxrsquo
2
(pp
m)
(ppm)
315
811910 1rsquo
2rsquo2
3rsquo 4rsquo6rsquo
5rsquo
1rsquo2910
asymp asymp asympHDO MeOD Acetone
1
315
811 9101rsquo
2rsquo2
3rsquo4rsquo6rsquo
5rsquo
1rsquo2 9 10
asympasympasympHDOMeODAcetone
H1rsquo-H1
1rsquo
1
(p
pm
)
(ppm)
H1-H2
H1rsquo-H1
H1rsquo
H910
H1H5rsquo
H2
H1rsquo-H5rsquo
315
811910 1rsquo
2rsquo2
3rsquo 4rsquo6rsquo
5rsquo
1rsquo2910
asymp asymp asympHDO MeOD Acetone
1
H2rsquoH3rsquoH4rsquo
H2rsquoH3rsquoH4rsquo
X= 2rsquo3rsquo4rsquo
NOESY - T= 90degC
1H
1H
1H
1H
DQ-SQ - T= 70degC
a) b)
2
(pp
m)
(p
pm
)
(ppm)
A B
AhellipB
AhellipA
BhellipB
NOESY
(ppm)
A B
AhellipB
DQ-SQ
Single-quantum dimension
Do
ub
le-q
ua
ntu
m d
imen
sio
n
AhellipA
BhellipB
BhellipA
BhellipA
315
811910 1rsquo
2rsquo2
3rsquo 4rsquo6rsquo
5rsquo
1rsquo2910
asymp asymp asympHDO MeOD Acetone
1
lt 5 Aring
lt 5 Aring
H1-H2
H811
H15
H16
H6rsquo
H1rsquo
H1
H5rsquo
H2
H1-H2
H1rsquo-H1
H1rsquo-H5rsquo
H1rsquo
H1 H5rsquo
H1rsquo
H1
H5rsquo
H1H2rsquo H3rsquo H4rsquo
H1-H1
H1rsquo-H1
Hxrsquo-HxrsquoX= 2rsquo3rsquo4rsquo
H1-H2
H1rsquo
Zoom sugar region 28 ndash 45 ppmNOESY DQ-SQ
27
Head-tail or head-head configurations could be probed by the existence of H1rsquo-H1 657
interactions whereas H1 (δH= 356 ppm) is associated to the glucolipid tail and H1rsquo (δH= 432 658
ppm) to the sugar headgroup These atoms are more than 15 Aring apart and a direct interaction 659
could not be observed in both NOESY and DQ-SQ experiments NOESY experiments (Figure 660
9a) show that H1rsquo-H1 correlations are not observed Meanwhile clear-cut direct H1rsquo-H1 661
interactions are indeed observed are detected at T= 70degC (DQ cross-peaks related to H1rsquo-H1 662
correlation in DQ-SQ experiment shown in Figure 9b) Interestingly the absence of auto peaks 663
at δH= 432 ppm and δH= 335 ppm in the SQ dimension excludes H1rsquo-H1rsquo and Hxrsquo-Hxrsquo (x= 2 664
3 4) interactions respectively strengthening the idea that sugar headgroups from two nearest-665
neighbor G-C181-OH molecules are not adjacent in the nanotube-vesicle region 666
Homonuclear 2D ssNMR supports the idea according to which G-C181-OH can 667
undergo molecular flip-flops and a head-tail arrangement in the dry product Extrapolating these 668
conclusions in the lower concentration range lack of H1rsquo-H1 proximity at T= 90degC suggests a 669
head-head configuration in the vesicle-rich region and head-tail configuration within the 670
nanotubes It is however still unclear whether flip-flops are driven by spontaneous temperature-671
induced conformational changes in the glucolipid packing stimulating inclusions within the 672
membrane itself672223629ndash1218ndash21 or by defects generated by inter-vesicle collisions In fact a 673
combination of both is not unlikely Nanotubes are not stable when temperature is 20 to 30 674
degrees above Tm1 indicating that inter-vesicle collisions alone cannot explain the unusual 675
phenomenon In an energy landscape approach87 the head-head configuration is certainly 676
favored at high temperature while both head-head and head-tail configurations could be 677
favored in the mid-temperature region corresponding to the range between Tm1 and Tm2 in the 678
dry powder Both statistical and defect-induced flip-flop events contribute to form high mean 679
zero Gaussian curvature morphologies (nanotubes) for which the head-tail conformation 680
limiting the proximity between bulky sugar headgroups is probably more adapted (Figure 8c) 681
The flip-flop interpretation now reasonably explains the strong differences in the sugar and fatty 682
alcohol conformations deduced by the multiple NMR signals attributed to chemically-683
equivalent groups The existence of various low-energy conformations each having specific 684
NMR signature for sugars in solution78ndash8086 and solid-state81ndash84 further supports our 685
interpretation 686
One last point should be clarified Why between Tm1 and Tm2 are two molecular 687
environments able to coexist instead of a single one of average rigidity as found in the case of 688
ldquoripplerdquo phases50ndash54 We believe that this question can be answered based on the NMR results 689
the relatively short T2 values of the H1rsquo and OH protons shows the constrained mobility of the 690
28
sugar headgroup despite a certain flexibility of the chain (long T2 component) This trend may 691
suggest restrictions in translational mobility probably due to the sugar-OH hydrogen bonding 692
(Figure 8c) meaning that lipids are not able to diffuse within the membrane thus keeping two 693
different configurations stable 694
695
Conclusions 696
Topologically-connected nanotube-vesicle lipidic systems are commonly observed for 697
self-assembled membranes composed of at least two amphiphiles and spontaneously driven by 698
anisotropic inclusions andor by external directional forces This work shows that strong 699
differences in membrane curvature can spontaneously occur in single-lipid systems without 700
external anisotropic forces Coexistence and interconnection between nanotubes and vesicles 701
are evidenced via cryo-TEM and fluorescence confocal microscopy in a single-phase region at 702
temperature above a transition temperature Tm1= 483degC determined by DSC on the hydrated 703
sample but below the second transition temperature Tm2 (957degC) determined by DSC on the 704
dry powder X-ray diffraction (WAXS) also shows the coexistence of two lattice periods one 705
attributed to an inter-membrane repeating distance and the other possibly related to the intra-706
nanotube glucolipid arrangement Labelling the systems with Laurdan a fluorophore of which 707
the emission strongly varies with the local membrane rigidity excludes the presence of rigid 708
micro-separated phases (eg Lβ) 709
1H and 13C ssNMR despite the fact that it can only be performed on the dry powder 710
confirm the presence of one main fluid G-C181-OH environment above Tm2 Below Tm2 the 711
splitting of some 13C peaks and the coexistence of short and long 1H relaxation components 712
demonstrate that G-C181-OH can simultaneously pack into structurally and dynamically 713
inequivalent environments Combining advanced 2D 1H-1H correlation experiments based on 714
spin diffusion or double-quanta excitation suggests that vesicles could contain a preferred head-715
head configuration of the bolaform lipid while nanotubes a preferred head-tail assembly 716
The presence of two environments composed of the same molecule characterized by 717
different molecular configurations and rigidity fulfills the theoretical conditions necessary to 718
spontaneously nucleate a membrane inclusion of non-zero average orientation described as 719
necessary to observe topologically-connected nanotube-vesicle structures in the absence of 720
external forces This hypothesis could also be enriched by the possibility of nanotubes to be 721
pulled away between two vesicles after a collision event 722
This work expands the actual theoretical and experimental framework on lipid networks 723
stabilized by a different radius of curvature It could also motivate the synthesis or isolation 724
29
of new lipids providing a higher level of 3D architectural control in soft networks possibly in 725
the range of room temperature 726
727
Acknowledgements 728
Dr Andrea Lassenberger and Dr Sylvain Preacutevost at Institut Laue Langevin (ILL Grenoble 729
France) are kindly acknowledged for their assistance on the SANS experiment Confocal 730
images were performed at the Institut de Biologie Paris Seine (IBPS) imaging facility Jean-731
Franccedilois Gilles (Imaging Core Facility Institut de Biologie Paris Seine (IBPS) CNRS 732
Sorbonne Universiteacute Paris France) is kindly acknowledged for his assistance on the confocal 733
microscopy imaging Dr Guillaume Laurent (LCMCP Sorbonne Universiteacute Paris France) is 734
kindly acknowledged for helpful discussions The French region Ile-de-France SESAME 735
program is acknowledged for financial support (700 MHz NMR 736
spectrometer) Dr Olivier Diat (ICSM Marcoule France) Prof eronikaIglič and Prof V Aleš737
onsul discussi Slovenia) are kindly acknowledged for helpfUniversity of LjubljanaIglič (-Kralj 738
739
Financial support 740
WAXS experiments have been supported by Soleil Light Source Saint Aubin France proposal 741
Ndeg 20201747 SANS experiments have been supported by ILL proposal Ndeg9-13-778 742
743
References 744
1 D Kabaso N Bobrovska W Goacuteźdź E Gongadze V Kralj-Iglič R Zorec and A 745
Iglič Bioelectrochemistry 2012 87 204ndash210 746
2 C R Safinya U Raviv D J Needleman A Zidovska M C Choi M A Ojeda-747
Lopez K K Ewert Y Li H P Miller J Quispe B Carragher C S Potter M W 748
Kim S C Feinstein and L Wilson Adv Mater 2011 23 2260ndash2270 749
3 P Veranič M Lokar G J Schuumltz J Weghuber S Wieser H Haumlgerstrand V Kralj-750
Iglič and A Iglič Biophys J 2008 95 4416ndash4425 751
4 A Rustom R Saffrich I Markovic P Walther and H-H Gerdes Science (80- ) 752
2004 303 1007ndash1010 753
5 M I Angelova S Soleacuteau P Meacuteleacuteard F Faucon and P Bothorel Prog Colloid 754
Polym Sci 1992 89 127ndash131 755
6 L Mathivet S Cribier and P F Devaux Biophys J 1996 70 1112ndash1121 756
7 V Kralj-Iglič G Gomišček J Majhenc V Arrigler and S Svetina Colloids Surfaces 757
A Physicochem Eng Asp 2001 181 315ndash318 758
30
8 V Kralj-Iglič A Iglič G Gomišček F Sevšek V Arrigler and H Haumlgerstrand J 759
Phys A Math Gen 2002 35 1533ndash1549 760
9 M Drab D Stopar V Kralj-Iglič and A Iglič Cells 2019 8 626 761
10 A Zidovska K K Ewert J Quispe B Carragher C S Potter and C R Safinya 762
Langmuir 2009 25 2979ndash2985 763
11 A Zidovska K K Ewert J Quispe B Carragher C S Potter and C R Safinya Soft 764
Matter 2011 7 8363ndash8369 765
12 A Zidovska K K Ewert J Quispe B Carragher C S Potter and C R Safinya 766
Biochim Biophys Acta - Biomembr 2009 1788 1869ndash1876 767
13 M Karlsson K Sott M Davidson A S Cans P Linderholm D Chiu and O Orwar 768
Proc Natl Acad Sci U S A 2002 99 11573ndash11578 769
14 A Karlsson R Karlsson M Karlsson A-S Cans A Stromberg F Ryttsen and O 770
Orwar Nature 2001 409 150ndash152 771
15 M Karlsson K Sott A S Cans A Karlsson R Karlsson and O Orwar Langmuir 772
2001 17 6754ndash6758 773
16 E Evans H Bowman A Leung D Needham and D Tirrell Science (80- ) 1996 774
273 933ndash935 775
17 U Seifert Configurations of fluid membranes and vesicles 1997 vol 46 776
18 J Kaumls and E Sackmann Biophys J 1991 60 825ndash844 777
19 N Bobrovska W Goacuteźdź V Kralj-Iglič and A Iglič PLoS One 2013 8 e73941 778
20 A Iglič B Babnik K Bohinc M Fošnarič H Haumlgerstrand and V Kralj-Iglič J 779
Biomech 2007 40 579ndash585 780
21 K Bohinc T Slivnik A Iglič M Brumen and V Kralj-Iglič J Phys Chem C 2007 781
111 9709ndash9718 782
22 A Iglič H Haumlgerstrand P Veranič A Plemenitaš and V Kralj-Iglič J Theor Biol 783
2006 240 368ndash373 784
23 V Kralj-Iglič and P Veranič Adv Planar Lipid Bilayers Liposomes 2006 5 129ndash785
149 786
24 A Iglic and V Kralj-Iglic Adv Planar Lipid Bilayers Liposomes 2006 4 253ndash279 787
25 S Penič L Mesarec M Fošnarič L Mroacutewczyńska H Haumlgerstrand V Kralj-Iglič and 788
A Iglič Front Phys 2020 8 342 789
26 P Yager and P E Schoen Mol Cryst Liq Cryst 1984 106 371ndash381 790
27 T G Barclay K Constantopoulos and J Matisons Chem Rev 2014 114 10217ndash791
10291 792
31
28 B Božič G Gomišček V Kralj-Iglič S Svetina and B Žekš Eur Biophys J 2002 793
31 487ndash496 794
29 A Iglič H Haumlgerstrand M Bobrowska-Haumlgerstrand V Arrigler and V Kralj-Iglič 795
Phys Lett A 2003 310 493ndash497 796
30 R Bar-Ziv and E Moses Phys Rev Lett 1994 73 1392ndash1395 797
31 S Chiruvolu H E Warriner E Naranjo S H Idziak J O Raumldler R J Plano J A 798
Zasadzinski and C R Safinya Science (80- ) 1994 266 1222ndash1225 799
32 V Kralj-Iglič A Iglič H Haumlgerstrand and P Peterlin Phys Rev E 2000 61 4230ndash800
4234 801
33 L Mesarec M Drab S Penič V Kralj-Iglič and A Iglič Int J Mol Sci 2021 22 802
2348 803
34 L Van Renterghem S L K W Roelants N Baccile K Uyttersprot M C Taelman 804
B Everaert S Mincke S Ledegen S Debrouwer K Scholtens C V Stevens W 805
Soetaert L Van Renterghem S L K W Roelants N Baccile K Uytersprot M C 806
Taelman B Everaert S Mincke S Ledegen S Debrouwer K Scholtens C V 807
Stevens and W Soetaert Biotechnol Bioeng 2018 115 1195ndash1206 808
35 J Clark and F Deswarte Introduction to Chemicals from Biomass Second Edition 809
John Wiley amp Sons 2015 810
36 K V Sajna R Houmlfer R K Sukumaran L D Gottumukkala and A Pandey in 811
Industrial Biorefineries and White Biotechnology eds A Pandey R Houmlfer M 812
Taherzadeh K M Nampoothiri and C Larroche Amsterdam Oxford Waltham 813
Elsevier 2015 pp 499ndash521 814
37 R Marchant and I M Banat Trends Biotechnol 2012 30 558ndash565 815
38 K Hill and C LeHen-Ferrenbach in Sugar-Based Surfactants Fundamentals and 816
Applications ed C C Ruiz Boca Raton CRC Press 2009 pp 1ndash20 817
39 L Rodrigues I M Banat J Teixeira and R Oliveira J Antimicrob Chemother 818
2006 57 609ndash618 819
40 J D Desai and I M Banat Microbiol Mol Biol Rev 1997 61 47ndash64 820
41 S L K W Roelants K Ciesielska S L De Maeseneire H Moens B Everaert S 821
Verweire Q Denon B Vanlerberghe I N A Van Bogaert P Van der Meeren B 822
Devreese and W Soetaert Biotechnol Bioeng 2016 113 550ndash559 823
42 N Baccile M Selmane P Le Griel S Preacutevost J Perez C V Stevens E Delbeke S 824
Zibek M Guenther W Soetaert I N A Van Bogaert and S Roelants Langmuir 825
2016 32 6343ndash6359 826
32
43 N Baccile A-S Cuvier S Preacutevost C V Stevens E Delbeke J Berton W Soetaert 827
I N A Van Bogaert and S Roelants Langmuir 2016 32 10881ndash10894 828
44 N Baccile C Seyrig A Poirier S A Castro S L K W Roelants and S Abel Green 829
Chem 2021 23 3842ndash3944 830
45 A Salis L Cappai C Carucci D F Parsons and M Monduzzi J Phys Chem Lett 831
2020 11 6805ndash6811 832
46 J Schindelin I Arganda-Carreras E Frise V Kaynig M Longair T Pietzsch S 833
Preibisch C Rueden S Saalfeld B Schmid J-Y Tinevez D J White V 834
Hartenstein K Eliceiri P Tomancak and A Cardona Nat Methods 2012 9 676ndash835
682 836
47 T Parasassi and E Gratton J Fluoresc 1995 5 59ndash69 837
48 M M Dodes Traian F L Gonzaacutelez Flecha and V Levi J Lipid Res 2012 53 609ndash838
616 839
49 D M Owen C Rentero A Magenau A Abu-Siniyeh and K Gaus Nat Protoc 840
2012 7 24ndash35 841
50 W Stillwell in An Introduction to Biological Membranes Academic Press 2016 pp 842
135ndash180 843
51 W Stillwell in An Introduction to Biological Membranes Academic Press 2016 pp 844
181ndash220 845
52 B Tenchov Chem Phys Lipids 1991 57 165ndash177 846
53 R Koynova and M Caffrey Biochim Biophys Acta 1998 1376 91ndash145 847
54 F Schmid S Dolezel O Lenz and S Meinhardt J Phys Conf Ser 2014 487 848
012004 849
55 S Meinhardt R L C Vink and F Schmid Proc Natl Acad Sci U S A 2013 110 850
4476ndash4481 851
56 O Glatter and O Kratky Small Angle X-ray Scattering Academic Press London 852
1982 853
57 B A Cunningham A D Brown D H Wolfe W P Williams and A Brain Phys 854
Rev E 1998 58 3662ndash3672 855
58 M Nadler A Steiner T Dvir O Szekely P Szekely A Ginsburg R Asor R Resh 856
C Tamburu M Peres and U Raviv Soft Matter 2011 7 1512ndash1523 857
59 C Tanford The hydrophobic effect Formation of micelles and biological membranes 858
John Wiley amp Sons Inc New York 1973 859
60 M Masuda and T Shimizu Langmuir 2004 20 5969ndash5977 860
33
61 A Zidovska K K Ewert J Quispe B Carragher C S Potter and C R Safinya 861
Block Liposomes Vesicles of Charged Lipids with Distinctly Shaped Nanoscale 862
Sphere- Pear- Tube- or Rod-Segments Elsevier Inc 1st edn 2009 vol 465 863
62 A Iglic V Kralj-Iglic B Božič M Bobrowska-Haumlgerstrand B Isomaa and H 864
Haumlgerstrand Bioelectrochemistry 2000 52 203ndash211 865
63 T Shimizu M Masuda and H Minamikawa Chem Rev 2005 105 1401ndash1444 866
64 J V Selinger and J M Schnur Phys Rev Lett 1993 71 4091ndash4094 867
65 J M Schnur Science (80- ) 1993 262 1669ndash1676 868
66 B Tenchov R Koynova and G Rapp Biophys J 2001 80 1873ndash1890 869
67 R Koynova and B Tenchov Ser Biomech 2017 31 3ndash19 870
68 S J Angyal and R Le Fur Carbohydr Res 1984 126 15ndash26 871
69 J K Whitesell and M A Minton J Am Chem Soc 1987 109 225ndash228 872
70 T Takayama S Ando and I Ando J Mol Struct 1990 220 245ndash250 873
71 K Gawrisch N V Eldho and I V Polozov Chem Phys Lipids 2002 116 135ndash151 874
72 F Tielens C Gervais J F Lambert F Mauri and D Costa Chem Mater 2008 20 875
3336ndash3344 876
73 G A Jeffrey and Y Yeon Acta Crystallogr Sect B 1986 42 410ndash413 877
74 B Berglund and R W Vaughan J Chem Phys 1980 73 2037ndash2043 878
75 C Gervais C Coelho T Azaiumls J Maquet G Laurent F Pourpoint C Bonhomme 879
P Florian B Alonso G Guerrero P H Mutin and F Mauri J Magn Reson 2007 880
187 131ndash140 881
76 C Akita T Kawaguchi F Kaneko H Yamamoto and M Suzuki J Phys Chem B 882
2004 108 4862ndash4868 883
77 R N Purusottam L Seacutenicourt J J Lacapegravere and P Tekely Biochim Biophys Acta - 884
Biomembr 2015 1848 3134ndash3139 885
78 X Biarneacutes A Ardegravevol A Planas C Rovira A Laio and M Parrinello J Am Chem 886
Soc 2007 129 10686ndash10693 887
79 L M J Kroon‐Batenburg and J Kroon Biopolymers 1990 29 1243ndash1248 888
80 K N Kirschner and R J Woods Proc Natl Acad Sci U S A 2001 98 10541ndash889
10545 890
81 S Svenson B Kirste and J H Fuhrhop J Am Chem Soc 1994 116 11969ndash11975 891
82 I Sack S Macholl J H Fuhrhop and G Buntkowsky Phys Chem Chem Phys 892
2000 2 1781ndash1788 893
83 S Svenson J Koening and J H Fuhrhop J Phys Chem 1994 98 1022ndash1028 894
34
84 S Svenson A Schaefer and J H Fuhrhop J Chem Soc Perkin Trans 2 1994 2 895
1023ndash1028 896
85 K Bock and C Pedersen Adv Carbohydr Chem Biochem 1983 41 27ndash66 897
86 T B Grindley Structure and Conformation of Carbohydrates Springer Berlin 898
Heidelberg 2008 899
87 F Tantakitti J Boekhoven X Wang R V Kazantsev T Yu J Li E Zhuang R 900
Zandi J H Ortony C J Newcomb L C Palmer G S Shekhawat M O De La 901
Cruz G C Schatz and S I Stupp Nat Mater 2016 15 469ndash476 902
903
1
Supporting Information 904
905
Topological connection between vesicles and nanotubes in single-906
component lipid membranes driven by head-tail interactions 907
908
Niki Baccilea Ceacutedric Lorthioira Abdoul Aziz Baa Patrick Le Griela Cristina Coelhob Javier 909
Perezc Wim Soetaertd Sophie L K W Roelantsd 910
911
a Sorbonne Universiteacute Centre National de la Recherche Scientifique Laboratoire de Chimie de 912
la Matiegravere Condenseacutee de Paris LCMCP F-75005 Paris France 913
b Institut des Mateacuteriaux de Paris Centre Sorbonne Universiteacute Paris France 914
c Synchrotron Soleil LrsquoOrme des Merisiers Saint-Aubin BP48 91192 Gif-sur-Yvette Cedex 915
France 916
d InBio Department of Biotechnology Ghent University Ghent Belgium 917
918
919
Corresponding author 920
Dr Niki Baccile 921
E-mail address nikibaccilesorbonne-universitefr 922
Phone +33 1 44 27 56 77 923
924
925
926
2
a) 927
Parameter Method
Dry Matter (DM ) 996 Infrared balance 105degC
Glucose () 012 HPLC-Metacarb
Glycerol () nd HPLC-Metacarb
Free Fatty Acid content () lt001 Internal method BBEPP
GC with FID Detector
Oil () lt001 Internal method BBEPP
GC with FID Detector
Moulds (CFUg) lt10 3M-Nordval ndeg16 B
Yeasts (CFUg) lt10 3M-Nordval ndeg16 B
Anaerobic count (CFUg) lt10 SP-VG M005 B
Protein () tbd BCA protein assay
928
Figure S 1 - a) HPLC-ELSD chromatogram and composition table 929
930
931
932
933
3
b) 934
935
Group Ndeg δ ppm
CH2 1 354
CH2 2 153
CH2 3-712-14 132
CH2 811 203
CH 910 534
CH2 15 162
CH2 16 388
CH 1 424
CH 2 316
CH 3 334
CH 4 329
CH 5 354
CH2 6 366
Figure S 1 (next) ndash b) 1H NMR spectrum (MeOD-d4) recorded on the purified G-C181-OH compounds 936
and related assignment 937
938
2
811910 1rsquo
5rsquo1
3rsquo4rsquo
1rsquo1910
asymp asymp asympHDO MeOD Acetone
6rsquo2rsquo
1615
3-712-14
4
939
940
Figure S 2 ndash Cryo-TEM images recorded for a 5 mgmL G-C181-OH aqueous solution heat at T= 130degC 941
5
942
943
Figure S 3 - Cryo-TEM images recorded for a 5 mgmL G-C181-OH aqueous solution heat at T= 90degC 944
945
90degC
1
22
6
946
947
948
949
Figure S 4 ndash Cryo-TEM images recorded for a 5 mgmL G-C181-OH aqueous solution heat at T= 70degC 950
951
21
11
1
2
5
3
4
45
5
6
7
7
7
952
953
954
Figure S 5 ndash Cryo-TEM images recorded for a 5 mgmL G-C181-OH aqueous solution heat at T= 25degC 955
956
957
1
1 1
8
958
Figure S 6 ndash a) SANS experiment recorded at 90degC for a 5 mgmL G-C181-OH aqueous solution b-c) 959
WAXS experiments recorded on aqueous solutions of G-C181-OH at b) 5 mgmL and c) 25 mgmL d) 960
Structural interpretation of the repeating distances pointed out in c) 961
962
963
964
001 01 1
q Aring-1
25degC
68degC
88degC
111degC
01 1q Aring
-1
02 04 06 08 1q Aring
-1
001 01
10-1
100
101
Inte
nsity
cm
-1
q Aring-1
-2
T= 90degC
SANS WAXS WAXS
a) b) c)
dv
dL d= 144 Aring-1
di
ddH2O
dt
dvdL
dtdi d
d)
9
965
966
Figure S 7 ndash ssNMR MAS (10 kHz) experiments recorded on a G-C181-OH dry powder a) 1H spectra 967
recorded from 110degC to 70degC b) 13C single pulse (SP) spectra recorded with high power 1H decoupling from 968
110degC to 70degC c) 13C cross polarization (CP) spectra recorded at 110degC and contact time tc of 50 micros and 969
3000 micros d) 13C CP spectra recorded at 70degC and for 20 lt tc micros lt 3000 970
971
1
811
910
CH2 CH2
1rsquo
6rsquo
8 6 4 2 0 ppm
110
90
80
70
910
1rsquo
6rsquo16
1
2rsquo3rsquo4rsquo
811
OH
45 40 35 30 25 20 15
ppm
200 180 160 140 120 100 80 60 40 20 0
ppm140 120 100 80
ppm
CH2-gauche
3004
110
90
80
70
65
60
50
25
C91013003
C9 - 12869
CH2-all-trans
3198
C1rsquo10335
a) b)
1H
T degCT degC
13C Single Pulse MAS
A
B
A
B
70degC70degC
5rsquo
215
200 180 160 140 120 100 80 60 40 20 0
ppm
13C CPMAST= 110degC
200 180 160 140 120 100 80 60 40 20 0
ppm
132 131 130 129 128 127 126
ppm
106 105 104 103 102
ppm
13C CPMAST= 70degC
50
tc micros
3000
20
tc micros
50 500 1000 3000
tc micros
C102
13024 C910113003
C92
12869
C1rsquo213082
C1rsquo110443
A B
106 105 104 103 102
ppm
3000
1000
500
50
20
AB
c)
d)
10
972
Figure S 8 ndash a) Short and d) long T2 components displayed by the 1H transverse relaxation signal c) 1H 973
transverse relaxation signals recorded on a G-C181-OH dry powder from 110degC to 70degC The area of each 974
given resonance is plotted (log-lin) as a function of the echo time (CPMG pulse sequence) for each 975
temperature and fitted using the equation given above T2s and T2l indicate the short and long T2 relaxation 976
times respectively obtained by describing the 1H transverse relaxation signal using a biexponential decay 977
For H1rsquo H5rsquo and H6rsquo the 1H relaxation function could be described by a monoexponential decay 978
- Protons from the sugar group (H1rsquo H5rsquo H6rsquo) show a single T2 relaxation component (Figure 979
6c and Figure S 8) while protons of the acyl chain (CH2 H910 H811) show both short (Figure 980
6c) and long (Figure 6d) T2 relaxation component 981
- The short T2 relaxation time systematically decreases from 110degC to 70degC for all species by a 982
factor ranging from two to seven depending on the specific chemical group Very long T2 are 983
observed at 110degC for all acyl species while nearly unchanged values are measured below 984
90degC without any clear trend 985
- The sugar protons (H1rsquo H5rsquo H6rsquo) have the shortest set of T2 values (lt 1 ms) below 100degC 986
The long component of T2 generally ranges between 4 ms and 12 ms 987
0 1 2 3 4 5 6 7 8
00
05
10
15
20
25
30
35
40
45
Log
In
ten
sity
Time ms
0 1 2 3 4 5 6 7 8
00
05
10
15
20
25
30
35
40
45
Log
In
ten
sity
Time ms
0 1000 2000 3000 4000 5000 6000 7000 8000
00
05
10
15
20
25
30
35
40
45
Log
In
ten
sity
Time ms
0 1000 2000 3000 4000 5000 6000 7000 8000
00
05
10
15
20
25
30
35
40
45
Log
In
ten
sity
Time ms
0 1000 2000 3000 4000 5000 6000 7000 8000
00
05
10
15
20
25
30
35
40
45
Log
In
ten
sity
Time ms
0 1000 2000 3000 4000 5000 6000 7000 8000
00
05
10
15
20
25
30
35
40
45
Log
In
ten
sity
Time ms
H1
H8H11
H9H10
CH2
H1rsquo
H6rsquo
CH2
H910H811 H1CH2
H1rsquo H5rsquo6rsquo
0 1000 2000 3000 4000 5000 6000 7000 8000
00
05
10
15
20
25
30
35
40
45
Log
In
ten
sity
Time ms
OH
0 1000 2000 3000 4000 5000 6000 7000 8000
00
05
10
15
20
25
30
35
40
45 T= 110degC
T= 90degC
T= 80degC
T= 70degC
Log
In
ten
sity
Time ms
Fit
)
CH2 H910 H811 H1 H56 H1 OH
00
05
10
15
20
25
30
35
40
T2 m
s
T= 110degC
T= 90degC
T= 80degC
T= 70degC
CH2 H910 H811 H1
0
2
4
6
8
10
12
T2 m
s
T= 110degC
T= 90degC
T= 80degC
T= 70degC
Short T2(1H) Long T2(1H)
a) b)
c)
11
Table S 1 ndash 1H chemical shifts of G-C181-OH in solution and in the solid-state Solid-state spectra are 988
recorded at a MAS frequency of 10 kHz in DMSO-d6 broad peak 989
990
δH ppm
Group Ndeg Liquid
(MeOD-d4) Solid
(T= 110degC) Solid
(T= 70degC)
CH2 H1 354 357
CH2 H2 153 156
CH2 H3-712-14 132 135
CH2 H811 203 203
CH H910 534 534
CH2 H15 162 164
CH2 H16 388 383
CH H1 424 432
CH H2 316 335
CH H3 334 335
CH H4 329 335
CH H5 354 351 357
CH2 H6 366 383
OH OH1 432
45 463
OH OH2 492
OH OH3 490
OH OH4 487
OH OH6 445
991
992
H1H9H10H1rsquo
H6rsquo
OH2rsquo
OH1
12
Detailed discussion about the NOESY and DQ-SQ 2D 1H-1H ssNMR experiments presented in 993
Figure 9 994
995
2D 1H-1H ssNMR experiments are a unique tool to explore through-space proximities 996
between 1H nuclei ssNMR offers a large number of possibilities each adapted to a given 997
system The advantage of 2D maps with respect to a dynamics approach is their direct 998
readability in clear two nuclei which exchange their magnetization through-space (whichever 999
mechanism may be responsible for this exchange) will display a specific cross-peak However 1000
the way cross-peaks are presented and interpreted strictly depends on the nature of the pulse 1001
program which in turn is chosen according to the physical nature of the sample 1002
1D temperature-dependent 1H NMR experiments performed on G-C181-OH (Figure 1003
4a in the main text) indicate sharp peaks at 90degC and broad peaks at 70degC Narrow peaks 1004
indicate fast andor large-amplitude molecular tumbling averaging the strong 1H-1H dipolar 1005
interactions This excludes the use of pulse sequences like DQ-SQ which is not efficient under 1006
these conditions For this reason we employ spin-diffusion-based pulse sequences like 1007
NOESY which is more adapted for samples with high molecular mobility When mixing times 1008
are chosen to be short (lt 1 s) one generally explores through-space proximities within about 5 1009
10 Aring On the contrary when molecular motions are restricted dipolar coupling becomes 1010
significant 1H NMR peaks are broader and pulse sequences like DQ-SQ can now be used 1011
with a spatial resolution of less than 5 Aring 1012
Whenever possible DQ-SQ experiments are preferred over spin diffusion-based pulse 1013
sequences because they are more selective in particular for likewise interactions which are 1014
not discriminated in NOESY-type experiments This is illustrated by the typical interaction 1015
schemes for NOESY (top Figure 9a) and DQ-SQ (top Figure 9b) For two given A and B 1016
protons 2D NOESY maps will display two on-diagonal and two square-shaped symmetrical 1017
off-diagonal cross-peaks Off-diagonal cross-peaks illustrate the mutual A-B and B-A 1018
interaction but the on-diagonal peaks are systematic and do not prove any A-A or B-B 1019
interaction Similarly to NOESY 2D DQ-SQ maps display off-diagonal peaks (symmetric 1020
across the diagonal top Figure 9b) upon A-B and B-A interaction but in contrast they will 1021
display on-diagonal peaks only in the presence of self-interaction In the tutorial example of 1022
Figure 9b top the on-diagonal A-A peak indicates mutual A-A interaction while lack of on-1023
diagonal B-B peak evidences the absence of B-B proximities Combining NOESY and DQ-SQ 1024
experiments is capital to study the local arrangement of G-C181-OH and its evolution with 1025
temperature 1026
13
At T= 90degC the H1 and H5rsquo contributions are very close but possible to discriminate 1027
them (δ(H1)= 354 ppm δ(H5rsquo)= 351 ppm) according to 1H NMR chemical shifts in Table S 1028
1 2D 1H-1H NOESY in Figure 9a also discriminates between the two components attributed 1029
on the basis of the interactions with their mutual neighbors (green H1-H2 and H5rsquo-H1rsquo squares 1030
in Figure 9a) On this basis 2D NOESY does not show a direct H1rsquo-H1 correlation (blue red-1031
crossed) but rather an extensive network of intra-sugar interactions These features exclude 1032
suggest intra- and inter-sugar interactions and they exclude head-tail arrangements as a major 1033
molecular configuration at 90degC 1034
At 70degC the 1H NMR peaks are broader indicating a reduction of the T2 (1H) relaxation 1035
times andor residual homonuclear dipolar interactions excluding the use of NOESY In this 1036
case 1H-1H DQ-SQ correlation experiments are best suited Figure 9b presents the 1H-1H DQ-1037
SQ experiment on G-C181-OH at 70degC Peaks are broader than in NOESY and attribution may 1038
be cumbersome However the experiment is performed at 700 MHz and MAS= 22 kHz which 1039
improves spectral resolution with respect to the same experiment performed at 300 MHz and 1040
MAS= 10 kHz The auto-peak at δH= 356 ppm in the SQ dimension is attributed to H1-H1 spin 1041
pairs mainly resulting from intra CH2 interaction while the DQ cross-peaks at δH= 156-356 1042
ppm and δH= 432-356 ppm respectively origin from H2-H1 and H1rsquo-H1 interactions (Figure 1043
9b) DQ-SQ map does not show any auto-peak corresponding to H1rsquo-H1rsquo or Hxrsquo-Hxrsquo (x= 2rsquo 1044
3rsquo 4rsquo) interactions (red-crossed blue Figure 9b) thus excluding any proximity (lt 5 Aring) between 1045
close glucose neighbors On the contrary DQ-SQ maps (recorded both at 700 MHz Figure 9b 1046
or at 300 MHz not shown) systematically show DQ cross-peaks which can only be attributed 1047
to H1rsquo-H1 interactions (δH= 432-356) The presence of these H1rsquo-H1 interactions can only be 1048
explained by a head-tail arrangement of the G-C181-OH molecules as illustrated below the 1049
DQ-SQ map in Figure 9b 1050

22
required conditions that induce local lipid segregation and formation of membrane inclusions 559
(Figure 8c) In case of their non-zero average orientation the local membrane curvature 560
increases62 and nanotubes can spontaneously form (Figure 8bc) More intriguing this 561
mechanism occurs at least 10degC above Tm1 although it should not be favored above the Tm27 562
From both experimental and theoretical backgrounds the conditions of topologically-563
connected vesicles-nanotubes systems are met only when either internal (two components) or 564
external driving forces are applied19 In the present single-lipid system of which the phase 565
behavior is summarized in Figure 8a the most plausible driving force could be explained by 566
the NMR results collected on the dry sample G-C181-OH concomitantly occupies two 567
molecular environments characterized by 1) two distinct conformations of the sugar 568
displaying equivalent mobility and 2) two conformations of the acyl chain unsaturation 569
570
23
571
Figure 8 ndash a) Thermotropic phase behavior of G-C181-OH at 5 mgmL-1 Note that Tm2 is observed on the 572
dry powder only b) Possible relationship between the molecular environment as derived from NMR and 573
membrane curvatures All the molecular drawings refer to the same G-C181-OH molecule (bulky ellipsoid 574
equiv sugar headgroup) while each color corresponds to a given configuration Grey of C1rsquo1 and C1rsquo2 indicates 575
the uncertainty about the assignment of the specific NMR peak The curvature C is defined as 1R R being 576
the curvature radius R1 R2 radius of curvature CG Gauss curvature CM Mean curvature c) Free 577
interpretation of the anisotropic high-curvature (CMgt 0 CG= 0) inclusions in the membrane (low CM and 578
CG) continuum driven by inter-sugar H-bonding and reduced intramembrane diffusion for a G-C181-OH 579
glucolipid 580
581
Flat crystalline structure
Nanotube-vesicle network
Vesicles
48degC
120deg
106 105 104 103 102 101
ppm
H9 H10H1rsquo
106 105 104 103 102 101
ppm106 105 104 103 102 101
ppm106 105 104 103 102 101
ppm
C=CC=C
C1rsquo1C1rsquo2
C1rsquo
Tm2(96degC)Tm1
a)
b)
c)
Same molecule different local orientations and sugar conformations
High curvature membrane
Low curvature inclusion
Flip-FlopStrong H-bonding
CG
CM ( + )
CG 0
CM 0 CG 0
CM 0
G-C181-OH
24
Two related questions are unanswered at the moment What actually drives nanotube 582
formation and is the organization of G-C181-OH within the vesicles and tubes the same Lipid 583
nanotubes have been studied for at least three decades over which broad experimental and 584
theoretical insight has been generated Despite this fact the actual understanding is still matter 585
of debate27 Micelle-to-nanotube and vesicle-to-nanotube phase transitions are generally 586
reported for single amphiphiles below a given Tm and intermediate phase composed of twisted 587
and flat fibers is concomitantly reported Initially thought to be a chirality-driven phenomenon 588
recent studies propose a more general mechanism involving crystallization and symmetry 589
breaking in the lipid packing driven by optimal packing27 If twisted ribbons were observed 590
before for a number of microbial glycolipid bolaamphiphiles44 they are not found for G-C181-591
OH This fact as well as the large body of cryo-TEM images and the observation of nanotubes 592
above Tm1 rather pledge in favour of a direct topological change from positive (vesicles) to 593
zero (nanotubes) Gaussian curvatures In this case vesicle-to-nanotube transitions could be 594
driven by external forces56307813ndash162829 595
Considering the absence of external forces in the present system there are only two 596
possibilities left spontaneous budding of the membrane or nanotube pulling after inter-vesicle 597
collisions due to Brownian motion Both are possible as inclusions composed of a different 598
arrangement of the same molecule in the membrane continuum can theoretically explain 599
spontaneous nanotube formation in an isotropic medium672223629ndash1218ndash21 However the second 600
one is probably more likely to prevail because it could explain the large number of nanotubes 601
connecting two distant vesicles Interestingly similar events occur for any phospholipid-based 602
vesicular solution but nanotubes are extremely rare unless at least two lipids of different 603
molecular structure are mixed together The spectroscopic 1H and 13C and relaxation (1H) 604
ssNMR data even if collected on a dry powder demonstrate that the coexistence of two G-605
C181-OH configurations involving both the sugar headgroup and fatty alcohol chain are 606
possible for this molecule As a matter of fact this is not so surprising as more than one energy 607
minima each corresponding to a given conformation are known for glucose its non-reducing 608
derivative methylglucose and carbohydrates in general78ndash80 609
The presence of two configurations could explain the coexistence between two 610
structures of different curvature but the data presented so far do not explain the origin of these 611
two configurations In other words what drives the change in the local structure of the sugar 612
headgroup and fatty alcohol within the membrane 613
The association of known self-assembled structures to spectroscopic 13C ssNMR data is 614
known for years in particular for gluconamides lipids having a linear sugar headgroup81ndash84 It 615
25
was found that gauche effects in some cases up to the γ position in the sugar chain induce 616
upfield chemical shifts while anti and trans conformations result in downfield shifts Each 617
structure (monolayer crystal bilayer crystal or micellar fiber) was then characterized by a given 618
organization of the gluconamide and a characteristic 13C ssNMR fingerprint which could be 619
explained by gauche γ-gauche anti and trans conformations of the headgroup Similar 620
structural-spectroscopic correlations have been collected over the years for much simpler cyclic 621
sugars85 whereas pyranoses can undergo important conformational changes (chair half-chair 622
boat skew) when the appropriate energy barriers are crossed78ndash8086 A quantitative 623
conformational study based on the 13C chemical shift variations shown in Table 1 would be 624
certainly helpful but very delicate in the context of the present state of the art because a 625
rigorous approach requires at least one known crystal structure8182 which is currently missing 626
for this compound A qualitative approach will then be adopted 627
G-C181-OH is a bolaform amphiphile and flip-flop could be a possible mechanism 628
involved in the nanotube stabilization whereas head-tail interactions have long been considered 629
as important in nanotube-forming bolaform amphiphiles6063 From mere considerations based 630
on T2 (1H) relaxation arguments one could exclude head-tail configurations if the R-CH2OH 631
endgroup (H1) was involved in a direct interaction with the sugar group its corresponding T2 632
would probably be comparable to the sugarrsquos one (OH and H1rsquo) but this does not seem to be 633
the case However this hypothesis would be based on the comparison of the relaxation from 634
CH and CH2 protons additionally involved in different kind of motions Besides the relaxation 635
of H1 is influenced by the strong overlap between H1 and H5rsquo For these reasons relaxation 636
arguments are not solid enough and will not be used 637
We then address this question by exploring intermolecular interactions in a direct 638
manner using 2D 1H-1H homonuclear ssNMR correlation spectroscopy At 90degC in the fast-639
tumbling domain of molecular motion (narrow 1H NMR peaks Figure 6a) and corresponding 640
to the vesicle-rich region spin diffusion (NOESY) experiments are preferred over dipolar 641
coupling based experiments because such interaction is averaged out by molecular motion 642
However when the molecular motion is more constrained in the domain of nanotube stability 643
at 70degC (broad 1H spectra Figure 6a) Double-Quantum Single-Quantum (DQ-SQ) correlation 644
experiments are best suited to probe interaction between close molecular neighbors These 645
experiments are reported in Figure 9 and the related interpretation is only briefly reported 646
below while a more detailed discussion can be found on Page 12 in the Supporting Information 647
26
648
Figure 9 ndash a) 2D 1H-1H NOESY NMR experiment performed at MAS= 10 kHz (4 mm probe) on a Bruker 649
300 MHz Avance III HD spectrometer using 300 ms of mixing time Sample temperature is regulated to 650
90degC reached by cooling from 110degC b) 2D 1H-1H DQ-SQ (BAck-to-BAck BABA pulse sequence used for 651
the DQ excitation scheme) NMR experiment performed at MAS= 22 kHz (25 mm probe) on a Bruker 700 652
MHz Avance III spectrometer using a DQ excitation time equal to 2 rotor periods Sample temperature is 653
regulated to 70degC reached by cooling from 110degC The typical schemes illustrating how to interpret these 654
2D experiments are reported above each experimental map Zooms of the sugar region and configurational 655
interpretation are given below each 2D map More information are given in the text below 656
H16-H16
H1-H1
H9-H10
H1rsquo-H1
H1rsquoH910 H16
H1
H1rsquo-H1rsquo
Hxrsquo-Hxrsquo
2
(pp
m)
(ppm)
315
811910 1rsquo
2rsquo2
3rsquo 4rsquo6rsquo
5rsquo
1rsquo2910
asymp asymp asympHDO MeOD Acetone
1
315
811 9101rsquo
2rsquo2
3rsquo4rsquo6rsquo
5rsquo
1rsquo2 9 10
asympasympasympHDOMeODAcetone
H1rsquo-H1
1rsquo
1
(p
pm
)
(ppm)
H1-H2
H1rsquo-H1
H1rsquo
H910
H1H5rsquo
H2
H1rsquo-H5rsquo
315
811910 1rsquo
2rsquo2
3rsquo 4rsquo6rsquo
5rsquo
1rsquo2910
asymp asymp asympHDO MeOD Acetone
1
H2rsquoH3rsquoH4rsquo
H2rsquoH3rsquoH4rsquo
X= 2rsquo3rsquo4rsquo
NOESY - T= 90degC
1H
1H
1H
1H
DQ-SQ - T= 70degC
a) b)
2
(pp
m)
(p
pm
)
(ppm)
A B
AhellipB
AhellipA
BhellipB
NOESY
(ppm)
A B
AhellipB
DQ-SQ
Single-quantum dimension
Do
ub
le-q
ua
ntu
m d
imen
sio
n
AhellipA
BhellipB
BhellipA
BhellipA
315
811910 1rsquo
2rsquo2
3rsquo 4rsquo6rsquo
5rsquo
1rsquo2910
asymp asymp asympHDO MeOD Acetone
1
lt 5 Aring
lt 5 Aring
H1-H2
H811
H15
H16
H6rsquo
H1rsquo
H1
H5rsquo
H2
H1-H2
H1rsquo-H1
H1rsquo-H5rsquo
H1rsquo
H1 H5rsquo
H1rsquo
H1
H5rsquo
H1H2rsquo H3rsquo H4rsquo
H1-H1
H1rsquo-H1
Hxrsquo-HxrsquoX= 2rsquo3rsquo4rsquo
H1-H2
H1rsquo
Zoom sugar region 28 ndash 45 ppmNOESY DQ-SQ
27
Head-tail or head-head configurations could be probed by the existence of H1rsquo-H1 657
interactions whereas H1 (δH= 356 ppm) is associated to the glucolipid tail and H1rsquo (δH= 432 658
ppm) to the sugar headgroup These atoms are more than 15 Aring apart and a direct interaction 659
could not be observed in both NOESY and DQ-SQ experiments NOESY experiments (Figure 660
9a) show that H1rsquo-H1 correlations are not observed Meanwhile clear-cut direct H1rsquo-H1 661
interactions are indeed observed are detected at T= 70degC (DQ cross-peaks related to H1rsquo-H1 662
correlation in DQ-SQ experiment shown in Figure 9b) Interestingly the absence of auto peaks 663
at δH= 432 ppm and δH= 335 ppm in the SQ dimension excludes H1rsquo-H1rsquo and Hxrsquo-Hxrsquo (x= 2 664
3 4) interactions respectively strengthening the idea that sugar headgroups from two nearest-665
neighbor G-C181-OH molecules are not adjacent in the nanotube-vesicle region 666
Homonuclear 2D ssNMR supports the idea according to which G-C181-OH can 667
undergo molecular flip-flops and a head-tail arrangement in the dry product Extrapolating these 668
conclusions in the lower concentration range lack of H1rsquo-H1 proximity at T= 90degC suggests a 669
head-head configuration in the vesicle-rich region and head-tail configuration within the 670
nanotubes It is however still unclear whether flip-flops are driven by spontaneous temperature-671
induced conformational changes in the glucolipid packing stimulating inclusions within the 672
membrane itself672223629ndash1218ndash21 or by defects generated by inter-vesicle collisions In fact a 673
combination of both is not unlikely Nanotubes are not stable when temperature is 20 to 30 674
degrees above Tm1 indicating that inter-vesicle collisions alone cannot explain the unusual 675
phenomenon In an energy landscape approach87 the head-head configuration is certainly 676
favored at high temperature while both head-head and head-tail configurations could be 677
favored in the mid-temperature region corresponding to the range between Tm1 and Tm2 in the 678
dry powder Both statistical and defect-induced flip-flop events contribute to form high mean 679
zero Gaussian curvature morphologies (nanotubes) for which the head-tail conformation 680
limiting the proximity between bulky sugar headgroups is probably more adapted (Figure 8c) 681
The flip-flop interpretation now reasonably explains the strong differences in the sugar and fatty 682
alcohol conformations deduced by the multiple NMR signals attributed to chemically-683
equivalent groups The existence of various low-energy conformations each having specific 684
NMR signature for sugars in solution78ndash8086 and solid-state81ndash84 further supports our 685
interpretation 686
One last point should be clarified Why between Tm1 and Tm2 are two molecular 687
environments able to coexist instead of a single one of average rigidity as found in the case of 688
ldquoripplerdquo phases50ndash54 We believe that this question can be answered based on the NMR results 689
the relatively short T2 values of the H1rsquo and OH protons shows the constrained mobility of the 690
28
sugar headgroup despite a certain flexibility of the chain (long T2 component) This trend may 691
suggest restrictions in translational mobility probably due to the sugar-OH hydrogen bonding 692
(Figure 8c) meaning that lipids are not able to diffuse within the membrane thus keeping two 693
different configurations stable 694
695
Conclusions 696
Topologically-connected nanotube-vesicle lipidic systems are commonly observed for 697
self-assembled membranes composed of at least two amphiphiles and spontaneously driven by 698
anisotropic inclusions andor by external directional forces This work shows that strong 699
differences in membrane curvature can spontaneously occur in single-lipid systems without 700
external anisotropic forces Coexistence and interconnection between nanotubes and vesicles 701
are evidenced via cryo-TEM and fluorescence confocal microscopy in a single-phase region at 702
temperature above a transition temperature Tm1= 483degC determined by DSC on the hydrated 703
sample but below the second transition temperature Tm2 (957degC) determined by DSC on the 704
dry powder X-ray diffraction (WAXS) also shows the coexistence of two lattice periods one 705
attributed to an inter-membrane repeating distance and the other possibly related to the intra-706
nanotube glucolipid arrangement Labelling the systems with Laurdan a fluorophore of which 707
the emission strongly varies with the local membrane rigidity excludes the presence of rigid 708
micro-separated phases (eg Lβ) 709
1H and 13C ssNMR despite the fact that it can only be performed on the dry powder 710
confirm the presence of one main fluid G-C181-OH environment above Tm2 Below Tm2 the 711
splitting of some 13C peaks and the coexistence of short and long 1H relaxation components 712
demonstrate that G-C181-OH can simultaneously pack into structurally and dynamically 713
inequivalent environments Combining advanced 2D 1H-1H correlation experiments based on 714
spin diffusion or double-quanta excitation suggests that vesicles could contain a preferred head-715
head configuration of the bolaform lipid while nanotubes a preferred head-tail assembly 716
The presence of two environments composed of the same molecule characterized by 717
different molecular configurations and rigidity fulfills the theoretical conditions necessary to 718
spontaneously nucleate a membrane inclusion of non-zero average orientation described as 719
necessary to observe topologically-connected nanotube-vesicle structures in the absence of 720
external forces This hypothesis could also be enriched by the possibility of nanotubes to be 721
pulled away between two vesicles after a collision event 722
This work expands the actual theoretical and experimental framework on lipid networks 723
stabilized by a different radius of curvature It could also motivate the synthesis or isolation 724
29
of new lipids providing a higher level of 3D architectural control in soft networks possibly in 725
the range of room temperature 726
727
Acknowledgements 728
Dr Andrea Lassenberger and Dr Sylvain Preacutevost at Institut Laue Langevin (ILL Grenoble 729
France) are kindly acknowledged for their assistance on the SANS experiment Confocal 730
images were performed at the Institut de Biologie Paris Seine (IBPS) imaging facility Jean-731
Franccedilois Gilles (Imaging Core Facility Institut de Biologie Paris Seine (IBPS) CNRS 732
Sorbonne Universiteacute Paris France) is kindly acknowledged for his assistance on the confocal 733
microscopy imaging Dr Guillaume Laurent (LCMCP Sorbonne Universiteacute Paris France) is 734
kindly acknowledged for helpful discussions The French region Ile-de-France SESAME 735
program is acknowledged for financial support (700 MHz NMR 736
spectrometer) Dr Olivier Diat (ICSM Marcoule France) Prof eronikaIglič and Prof V Aleš737
onsul discussi Slovenia) are kindly acknowledged for helpfUniversity of LjubljanaIglič (-Kralj 738
739
Financial support 740
WAXS experiments have been supported by Soleil Light Source Saint Aubin France proposal 741
Ndeg 20201747 SANS experiments have been supported by ILL proposal Ndeg9-13-778 742
743
References 744
1 D Kabaso N Bobrovska W Goacuteźdź E Gongadze V Kralj-Iglič R Zorec and A 745
Iglič Bioelectrochemistry 2012 87 204ndash210 746
2 C R Safinya U Raviv D J Needleman A Zidovska M C Choi M A Ojeda-747
Lopez K K Ewert Y Li H P Miller J Quispe B Carragher C S Potter M W 748
Kim S C Feinstein and L Wilson Adv Mater 2011 23 2260ndash2270 749
3 P Veranič M Lokar G J Schuumltz J Weghuber S Wieser H Haumlgerstrand V Kralj-750
Iglič and A Iglič Biophys J 2008 95 4416ndash4425 751
4 A Rustom R Saffrich I Markovic P Walther and H-H Gerdes Science (80- ) 752
2004 303 1007ndash1010 753
5 M I Angelova S Soleacuteau P Meacuteleacuteard F Faucon and P Bothorel Prog Colloid 754
Polym Sci 1992 89 127ndash131 755
6 L Mathivet S Cribier and P F Devaux Biophys J 1996 70 1112ndash1121 756
7 V Kralj-Iglič G Gomišček J Majhenc V Arrigler and S Svetina Colloids Surfaces 757
A Physicochem Eng Asp 2001 181 315ndash318 758
30
8 V Kralj-Iglič A Iglič G Gomišček F Sevšek V Arrigler and H Haumlgerstrand J 759
Phys A Math Gen 2002 35 1533ndash1549 760
9 M Drab D Stopar V Kralj-Iglič and A Iglič Cells 2019 8 626 761
10 A Zidovska K K Ewert J Quispe B Carragher C S Potter and C R Safinya 762
Langmuir 2009 25 2979ndash2985 763
11 A Zidovska K K Ewert J Quispe B Carragher C S Potter and C R Safinya Soft 764
Matter 2011 7 8363ndash8369 765
12 A Zidovska K K Ewert J Quispe B Carragher C S Potter and C R Safinya 766
Biochim Biophys Acta - Biomembr 2009 1788 1869ndash1876 767
13 M Karlsson K Sott M Davidson A S Cans P Linderholm D Chiu and O Orwar 768
Proc Natl Acad Sci U S A 2002 99 11573ndash11578 769
14 A Karlsson R Karlsson M Karlsson A-S Cans A Stromberg F Ryttsen and O 770
Orwar Nature 2001 409 150ndash152 771
15 M Karlsson K Sott A S Cans A Karlsson R Karlsson and O Orwar Langmuir 772
2001 17 6754ndash6758 773
16 E Evans H Bowman A Leung D Needham and D Tirrell Science (80- ) 1996 774
273 933ndash935 775
17 U Seifert Configurations of fluid membranes and vesicles 1997 vol 46 776
18 J Kaumls and E Sackmann Biophys J 1991 60 825ndash844 777
19 N Bobrovska W Goacuteźdź V Kralj-Iglič and A Iglič PLoS One 2013 8 e73941 778
20 A Iglič B Babnik K Bohinc M Fošnarič H Haumlgerstrand and V Kralj-Iglič J 779
Biomech 2007 40 579ndash585 780
21 K Bohinc T Slivnik A Iglič M Brumen and V Kralj-Iglič J Phys Chem C 2007 781
111 9709ndash9718 782
22 A Iglič H Haumlgerstrand P Veranič A Plemenitaš and V Kralj-Iglič J Theor Biol 783
2006 240 368ndash373 784
23 V Kralj-Iglič and P Veranič Adv Planar Lipid Bilayers Liposomes 2006 5 129ndash785
149 786
24 A Iglic and V Kralj-Iglic Adv Planar Lipid Bilayers Liposomes 2006 4 253ndash279 787
25 S Penič L Mesarec M Fošnarič L Mroacutewczyńska H Haumlgerstrand V Kralj-Iglič and 788
A Iglič Front Phys 2020 8 342 789
26 P Yager and P E Schoen Mol Cryst Liq Cryst 1984 106 371ndash381 790
27 T G Barclay K Constantopoulos and J Matisons Chem Rev 2014 114 10217ndash791
10291 792
31
28 B Božič G Gomišček V Kralj-Iglič S Svetina and B Žekš Eur Biophys J 2002 793
31 487ndash496 794
29 A Iglič H Haumlgerstrand M Bobrowska-Haumlgerstrand V Arrigler and V Kralj-Iglič 795
Phys Lett A 2003 310 493ndash497 796
30 R Bar-Ziv and E Moses Phys Rev Lett 1994 73 1392ndash1395 797
31 S Chiruvolu H E Warriner E Naranjo S H Idziak J O Raumldler R J Plano J A 798
Zasadzinski and C R Safinya Science (80- ) 1994 266 1222ndash1225 799
32 V Kralj-Iglič A Iglič H Haumlgerstrand and P Peterlin Phys Rev E 2000 61 4230ndash800
4234 801
33 L Mesarec M Drab S Penič V Kralj-Iglič and A Iglič Int J Mol Sci 2021 22 802
2348 803
34 L Van Renterghem S L K W Roelants N Baccile K Uyttersprot M C Taelman 804
B Everaert S Mincke S Ledegen S Debrouwer K Scholtens C V Stevens W 805
Soetaert L Van Renterghem S L K W Roelants N Baccile K Uytersprot M C 806
Taelman B Everaert S Mincke S Ledegen S Debrouwer K Scholtens C V 807
Stevens and W Soetaert Biotechnol Bioeng 2018 115 1195ndash1206 808
35 J Clark and F Deswarte Introduction to Chemicals from Biomass Second Edition 809
John Wiley amp Sons 2015 810
36 K V Sajna R Houmlfer R K Sukumaran L D Gottumukkala and A Pandey in 811
Industrial Biorefineries and White Biotechnology eds A Pandey R Houmlfer M 812
Taherzadeh K M Nampoothiri and C Larroche Amsterdam Oxford Waltham 813
Elsevier 2015 pp 499ndash521 814
37 R Marchant and I M Banat Trends Biotechnol 2012 30 558ndash565 815
38 K Hill and C LeHen-Ferrenbach in Sugar-Based Surfactants Fundamentals and 816
Applications ed C C Ruiz Boca Raton CRC Press 2009 pp 1ndash20 817
39 L Rodrigues I M Banat J Teixeira and R Oliveira J Antimicrob Chemother 818
2006 57 609ndash618 819
40 J D Desai and I M Banat Microbiol Mol Biol Rev 1997 61 47ndash64 820
41 S L K W Roelants K Ciesielska S L De Maeseneire H Moens B Everaert S 821
Verweire Q Denon B Vanlerberghe I N A Van Bogaert P Van der Meeren B 822
Devreese and W Soetaert Biotechnol Bioeng 2016 113 550ndash559 823
42 N Baccile M Selmane P Le Griel S Preacutevost J Perez C V Stevens E Delbeke S 824
Zibek M Guenther W Soetaert I N A Van Bogaert and S Roelants Langmuir 825
2016 32 6343ndash6359 826
32
43 N Baccile A-S Cuvier S Preacutevost C V Stevens E Delbeke J Berton W Soetaert 827
I N A Van Bogaert and S Roelants Langmuir 2016 32 10881ndash10894 828
44 N Baccile C Seyrig A Poirier S A Castro S L K W Roelants and S Abel Green 829
Chem 2021 23 3842ndash3944 830
45 A Salis L Cappai C Carucci D F Parsons and M Monduzzi J Phys Chem Lett 831
2020 11 6805ndash6811 832
46 J Schindelin I Arganda-Carreras E Frise V Kaynig M Longair T Pietzsch S 833
Preibisch C Rueden S Saalfeld B Schmid J-Y Tinevez D J White V 834
Hartenstein K Eliceiri P Tomancak and A Cardona Nat Methods 2012 9 676ndash835
682 836
47 T Parasassi and E Gratton J Fluoresc 1995 5 59ndash69 837
48 M M Dodes Traian F L Gonzaacutelez Flecha and V Levi J Lipid Res 2012 53 609ndash838
616 839
49 D M Owen C Rentero A Magenau A Abu-Siniyeh and K Gaus Nat Protoc 840
2012 7 24ndash35 841
50 W Stillwell in An Introduction to Biological Membranes Academic Press 2016 pp 842
135ndash180 843
51 W Stillwell in An Introduction to Biological Membranes Academic Press 2016 pp 844
181ndash220 845
52 B Tenchov Chem Phys Lipids 1991 57 165ndash177 846
53 R Koynova and M Caffrey Biochim Biophys Acta 1998 1376 91ndash145 847
54 F Schmid S Dolezel O Lenz and S Meinhardt J Phys Conf Ser 2014 487 848
012004 849
55 S Meinhardt R L C Vink and F Schmid Proc Natl Acad Sci U S A 2013 110 850
4476ndash4481 851
56 O Glatter and O Kratky Small Angle X-ray Scattering Academic Press London 852
1982 853
57 B A Cunningham A D Brown D H Wolfe W P Williams and A Brain Phys 854
Rev E 1998 58 3662ndash3672 855
58 M Nadler A Steiner T Dvir O Szekely P Szekely A Ginsburg R Asor R Resh 856
C Tamburu M Peres and U Raviv Soft Matter 2011 7 1512ndash1523 857
59 C Tanford The hydrophobic effect Formation of micelles and biological membranes 858
John Wiley amp Sons Inc New York 1973 859
60 M Masuda and T Shimizu Langmuir 2004 20 5969ndash5977 860
33
61 A Zidovska K K Ewert J Quispe B Carragher C S Potter and C R Safinya 861
Block Liposomes Vesicles of Charged Lipids with Distinctly Shaped Nanoscale 862
Sphere- Pear- Tube- or Rod-Segments Elsevier Inc 1st edn 2009 vol 465 863
62 A Iglic V Kralj-Iglic B Božič M Bobrowska-Haumlgerstrand B Isomaa and H 864
Haumlgerstrand Bioelectrochemistry 2000 52 203ndash211 865
63 T Shimizu M Masuda and H Minamikawa Chem Rev 2005 105 1401ndash1444 866
64 J V Selinger and J M Schnur Phys Rev Lett 1993 71 4091ndash4094 867
65 J M Schnur Science (80- ) 1993 262 1669ndash1676 868
66 B Tenchov R Koynova and G Rapp Biophys J 2001 80 1873ndash1890 869
67 R Koynova and B Tenchov Ser Biomech 2017 31 3ndash19 870
68 S J Angyal and R Le Fur Carbohydr Res 1984 126 15ndash26 871
69 J K Whitesell and M A Minton J Am Chem Soc 1987 109 225ndash228 872
70 T Takayama S Ando and I Ando J Mol Struct 1990 220 245ndash250 873
71 K Gawrisch N V Eldho and I V Polozov Chem Phys Lipids 2002 116 135ndash151 874
72 F Tielens C Gervais J F Lambert F Mauri and D Costa Chem Mater 2008 20 875
3336ndash3344 876
73 G A Jeffrey and Y Yeon Acta Crystallogr Sect B 1986 42 410ndash413 877
74 B Berglund and R W Vaughan J Chem Phys 1980 73 2037ndash2043 878
75 C Gervais C Coelho T Azaiumls J Maquet G Laurent F Pourpoint C Bonhomme 879
P Florian B Alonso G Guerrero P H Mutin and F Mauri J Magn Reson 2007 880
187 131ndash140 881
76 C Akita T Kawaguchi F Kaneko H Yamamoto and M Suzuki J Phys Chem B 882
2004 108 4862ndash4868 883
77 R N Purusottam L Seacutenicourt J J Lacapegravere and P Tekely Biochim Biophys Acta - 884
Biomembr 2015 1848 3134ndash3139 885
78 X Biarneacutes A Ardegravevol A Planas C Rovira A Laio and M Parrinello J Am Chem 886
Soc 2007 129 10686ndash10693 887
79 L M J Kroon‐Batenburg and J Kroon Biopolymers 1990 29 1243ndash1248 888
80 K N Kirschner and R J Woods Proc Natl Acad Sci U S A 2001 98 10541ndash889
10545 890
81 S Svenson B Kirste and J H Fuhrhop J Am Chem Soc 1994 116 11969ndash11975 891
82 I Sack S Macholl J H Fuhrhop and G Buntkowsky Phys Chem Chem Phys 892
2000 2 1781ndash1788 893
83 S Svenson J Koening and J H Fuhrhop J Phys Chem 1994 98 1022ndash1028 894
34
84 S Svenson A Schaefer and J H Fuhrhop J Chem Soc Perkin Trans 2 1994 2 895
1023ndash1028 896
85 K Bock and C Pedersen Adv Carbohydr Chem Biochem 1983 41 27ndash66 897
86 T B Grindley Structure and Conformation of Carbohydrates Springer Berlin 898
Heidelberg 2008 899
87 F Tantakitti J Boekhoven X Wang R V Kazantsev T Yu J Li E Zhuang R 900
Zandi J H Ortony C J Newcomb L C Palmer G S Shekhawat M O De La 901
Cruz G C Schatz and S I Stupp Nat Mater 2016 15 469ndash476 902
903
1
Supporting Information 904
905
Topological connection between vesicles and nanotubes in single-906
component lipid membranes driven by head-tail interactions 907
908
Niki Baccilea Ceacutedric Lorthioira Abdoul Aziz Baa Patrick Le Griela Cristina Coelhob Javier 909
Perezc Wim Soetaertd Sophie L K W Roelantsd 910
911
a Sorbonne Universiteacute Centre National de la Recherche Scientifique Laboratoire de Chimie de 912
la Matiegravere Condenseacutee de Paris LCMCP F-75005 Paris France 913
b Institut des Mateacuteriaux de Paris Centre Sorbonne Universiteacute Paris France 914
c Synchrotron Soleil LrsquoOrme des Merisiers Saint-Aubin BP48 91192 Gif-sur-Yvette Cedex 915
France 916
d InBio Department of Biotechnology Ghent University Ghent Belgium 917
918
919
Corresponding author 920
Dr Niki Baccile 921
E-mail address nikibaccilesorbonne-universitefr 922
Phone +33 1 44 27 56 77 923
924
925
926
2
a) 927
Parameter Method
Dry Matter (DM ) 996 Infrared balance 105degC
Glucose () 012 HPLC-Metacarb
Glycerol () nd HPLC-Metacarb
Free Fatty Acid content () lt001 Internal method BBEPP
GC with FID Detector
Oil () lt001 Internal method BBEPP
GC with FID Detector
Moulds (CFUg) lt10 3M-Nordval ndeg16 B
Yeasts (CFUg) lt10 3M-Nordval ndeg16 B
Anaerobic count (CFUg) lt10 SP-VG M005 B
Protein () tbd BCA protein assay
928
Figure S 1 - a) HPLC-ELSD chromatogram and composition table 929
930
931
932
933
3
b) 934
935
Group Ndeg δ ppm
CH2 1 354
CH2 2 153
CH2 3-712-14 132
CH2 811 203
CH 910 534
CH2 15 162
CH2 16 388
CH 1 424
CH 2 316
CH 3 334
CH 4 329
CH 5 354
CH2 6 366
Figure S 1 (next) ndash b) 1H NMR spectrum (MeOD-d4) recorded on the purified G-C181-OH compounds 936
and related assignment 937
938
2
811910 1rsquo
5rsquo1
3rsquo4rsquo
1rsquo1910
asymp asymp asympHDO MeOD Acetone
6rsquo2rsquo
1615
3-712-14
4
939
940
Figure S 2 ndash Cryo-TEM images recorded for a 5 mgmL G-C181-OH aqueous solution heat at T= 130degC 941
5
942
943
Figure S 3 - Cryo-TEM images recorded for a 5 mgmL G-C181-OH aqueous solution heat at T= 90degC 944
945
90degC
1
22
6
946
947
948
949
Figure S 4 ndash Cryo-TEM images recorded for a 5 mgmL G-C181-OH aqueous solution heat at T= 70degC 950
951
21
11
1
2
5
3
4
45
5
6
7
7
7
952
953
954
Figure S 5 ndash Cryo-TEM images recorded for a 5 mgmL G-C181-OH aqueous solution heat at T= 25degC 955
956
957
1
1 1
8
958
Figure S 6 ndash a) SANS experiment recorded at 90degC for a 5 mgmL G-C181-OH aqueous solution b-c) 959
WAXS experiments recorded on aqueous solutions of G-C181-OH at b) 5 mgmL and c) 25 mgmL d) 960
Structural interpretation of the repeating distances pointed out in c) 961
962
963
964
001 01 1
q Aring-1
25degC
68degC
88degC
111degC
01 1q Aring
-1
02 04 06 08 1q Aring
-1
001 01
10-1
100
101
Inte
nsity
cm
-1
q Aring-1
-2
T= 90degC
SANS WAXS WAXS
a) b) c)
dv
dL d= 144 Aring-1
di
ddH2O
dt
dvdL
dtdi d
d)
9
965
966
Figure S 7 ndash ssNMR MAS (10 kHz) experiments recorded on a G-C181-OH dry powder a) 1H spectra 967
recorded from 110degC to 70degC b) 13C single pulse (SP) spectra recorded with high power 1H decoupling from 968
110degC to 70degC c) 13C cross polarization (CP) spectra recorded at 110degC and contact time tc of 50 micros and 969
3000 micros d) 13C CP spectra recorded at 70degC and for 20 lt tc micros lt 3000 970
971
1
811
910
CH2 CH2
1rsquo
6rsquo
8 6 4 2 0 ppm
110
90
80
70
910
1rsquo
6rsquo16
1
2rsquo3rsquo4rsquo
811
OH
45 40 35 30 25 20 15
ppm
200 180 160 140 120 100 80 60 40 20 0
ppm140 120 100 80
ppm
CH2-gauche
3004
110
90
80
70
65
60
50
25
C91013003
C9 - 12869
CH2-all-trans
3198
C1rsquo10335
a) b)
1H
T degCT degC
13C Single Pulse MAS
A
B
A
B
70degC70degC
5rsquo
215
200 180 160 140 120 100 80 60 40 20 0
ppm
13C CPMAST= 110degC
200 180 160 140 120 100 80 60 40 20 0
ppm
132 131 130 129 128 127 126
ppm
106 105 104 103 102
ppm
13C CPMAST= 70degC
50
tc micros
3000
20
tc micros
50 500 1000 3000
tc micros
C102
13024 C910113003
C92
12869
C1rsquo213082
C1rsquo110443
A B
106 105 104 103 102
ppm
3000
1000
500
50
20
AB
c)
d)
10
972
Figure S 8 ndash a) Short and d) long T2 components displayed by the 1H transverse relaxation signal c) 1H 973
transverse relaxation signals recorded on a G-C181-OH dry powder from 110degC to 70degC The area of each 974
given resonance is plotted (log-lin) as a function of the echo time (CPMG pulse sequence) for each 975
temperature and fitted using the equation given above T2s and T2l indicate the short and long T2 relaxation 976
times respectively obtained by describing the 1H transverse relaxation signal using a biexponential decay 977
For H1rsquo H5rsquo and H6rsquo the 1H relaxation function could be described by a monoexponential decay 978
- Protons from the sugar group (H1rsquo H5rsquo H6rsquo) show a single T2 relaxation component (Figure 979
6c and Figure S 8) while protons of the acyl chain (CH2 H910 H811) show both short (Figure 980
6c) and long (Figure 6d) T2 relaxation component 981
- The short T2 relaxation time systematically decreases from 110degC to 70degC for all species by a 982
factor ranging from two to seven depending on the specific chemical group Very long T2 are 983
observed at 110degC for all acyl species while nearly unchanged values are measured below 984
90degC without any clear trend 985
- The sugar protons (H1rsquo H5rsquo H6rsquo) have the shortest set of T2 values (lt 1 ms) below 100degC 986
The long component of T2 generally ranges between 4 ms and 12 ms 987
0 1 2 3 4 5 6 7 8
00
05
10
15
20
25
30
35
40
45
Log
In
ten
sity
Time ms
0 1 2 3 4 5 6 7 8
00
05
10
15
20
25
30
35
40
45
Log
In
ten
sity
Time ms
0 1000 2000 3000 4000 5000 6000 7000 8000
00
05
10
15
20
25
30
35
40
45
Log
In
ten
sity
Time ms
0 1000 2000 3000 4000 5000 6000 7000 8000
00
05
10
15
20
25
30
35
40
45
Log
In
ten
sity
Time ms
0 1000 2000 3000 4000 5000 6000 7000 8000
00
05
10
15
20
25
30
35
40
45
Log
In
ten
sity
Time ms
0 1000 2000 3000 4000 5000 6000 7000 8000
00
05
10
15
20
25
30
35
40
45
Log
In
ten
sity
Time ms
H1
H8H11
H9H10
CH2
H1rsquo
H6rsquo
CH2
H910H811 H1CH2
H1rsquo H5rsquo6rsquo
0 1000 2000 3000 4000 5000 6000 7000 8000
00
05
10
15
20
25
30
35
40
45
Log
In
ten
sity
Time ms
OH
0 1000 2000 3000 4000 5000 6000 7000 8000
00
05
10
15
20
25
30
35
40
45 T= 110degC
T= 90degC
T= 80degC
T= 70degC
Log
In
ten
sity
Time ms
Fit
)
CH2 H910 H811 H1 H56 H1 OH
00
05
10
15
20
25
30
35
40
T2 m
s
T= 110degC
T= 90degC
T= 80degC
T= 70degC
CH2 H910 H811 H1
0
2
4
6
8
10
12
T2 m
s
T= 110degC
T= 90degC
T= 80degC
T= 70degC
Short T2(1H) Long T2(1H)
a) b)
c)
11
Table S 1 ndash 1H chemical shifts of G-C181-OH in solution and in the solid-state Solid-state spectra are 988
recorded at a MAS frequency of 10 kHz in DMSO-d6 broad peak 989
990
δH ppm
Group Ndeg Liquid
(MeOD-d4) Solid
(T= 110degC) Solid
(T= 70degC)
CH2 H1 354 357
CH2 H2 153 156
CH2 H3-712-14 132 135
CH2 H811 203 203
CH H910 534 534
CH2 H15 162 164
CH2 H16 388 383
CH H1 424 432
CH H2 316 335
CH H3 334 335
CH H4 329 335
CH H5 354 351 357
CH2 H6 366 383
OH OH1 432
45 463
OH OH2 492
OH OH3 490
OH OH4 487
OH OH6 445
991
992
H1H9H10H1rsquo
H6rsquo
OH2rsquo
OH1
12
Detailed discussion about the NOESY and DQ-SQ 2D 1H-1H ssNMR experiments presented in 993
Figure 9 994
995
2D 1H-1H ssNMR experiments are a unique tool to explore through-space proximities 996
between 1H nuclei ssNMR offers a large number of possibilities each adapted to a given 997
system The advantage of 2D maps with respect to a dynamics approach is their direct 998
readability in clear two nuclei which exchange their magnetization through-space (whichever 999
mechanism may be responsible for this exchange) will display a specific cross-peak However 1000
the way cross-peaks are presented and interpreted strictly depends on the nature of the pulse 1001
program which in turn is chosen according to the physical nature of the sample 1002
1D temperature-dependent 1H NMR experiments performed on G-C181-OH (Figure 1003
4a in the main text) indicate sharp peaks at 90degC and broad peaks at 70degC Narrow peaks 1004
indicate fast andor large-amplitude molecular tumbling averaging the strong 1H-1H dipolar 1005
interactions This excludes the use of pulse sequences like DQ-SQ which is not efficient under 1006
these conditions For this reason we employ spin-diffusion-based pulse sequences like 1007
NOESY which is more adapted for samples with high molecular mobility When mixing times 1008
are chosen to be short (lt 1 s) one generally explores through-space proximities within about 5 1009
10 Aring On the contrary when molecular motions are restricted dipolar coupling becomes 1010
significant 1H NMR peaks are broader and pulse sequences like DQ-SQ can now be used 1011
with a spatial resolution of less than 5 Aring 1012
Whenever possible DQ-SQ experiments are preferred over spin diffusion-based pulse 1013
sequences because they are more selective in particular for likewise interactions which are 1014
not discriminated in NOESY-type experiments This is illustrated by the typical interaction 1015
schemes for NOESY (top Figure 9a) and DQ-SQ (top Figure 9b) For two given A and B 1016
protons 2D NOESY maps will display two on-diagonal and two square-shaped symmetrical 1017
off-diagonal cross-peaks Off-diagonal cross-peaks illustrate the mutual A-B and B-A 1018
interaction but the on-diagonal peaks are systematic and do not prove any A-A or B-B 1019
interaction Similarly to NOESY 2D DQ-SQ maps display off-diagonal peaks (symmetric 1020
across the diagonal top Figure 9b) upon A-B and B-A interaction but in contrast they will 1021
display on-diagonal peaks only in the presence of self-interaction In the tutorial example of 1022
Figure 9b top the on-diagonal A-A peak indicates mutual A-A interaction while lack of on-1023
diagonal B-B peak evidences the absence of B-B proximities Combining NOESY and DQ-SQ 1024
experiments is capital to study the local arrangement of G-C181-OH and its evolution with 1025
temperature 1026
13
At T= 90degC the H1 and H5rsquo contributions are very close but possible to discriminate 1027
them (δ(H1)= 354 ppm δ(H5rsquo)= 351 ppm) according to 1H NMR chemical shifts in Table S 1028
1 2D 1H-1H NOESY in Figure 9a also discriminates between the two components attributed 1029
on the basis of the interactions with their mutual neighbors (green H1-H2 and H5rsquo-H1rsquo squares 1030
in Figure 9a) On this basis 2D NOESY does not show a direct H1rsquo-H1 correlation (blue red-1031
crossed) but rather an extensive network of intra-sugar interactions These features exclude 1032
suggest intra- and inter-sugar interactions and they exclude head-tail arrangements as a major 1033
molecular configuration at 90degC 1034
At 70degC the 1H NMR peaks are broader indicating a reduction of the T2 (1H) relaxation 1035
times andor residual homonuclear dipolar interactions excluding the use of NOESY In this 1036
case 1H-1H DQ-SQ correlation experiments are best suited Figure 9b presents the 1H-1H DQ-1037
SQ experiment on G-C181-OH at 70degC Peaks are broader than in NOESY and attribution may 1038
be cumbersome However the experiment is performed at 700 MHz and MAS= 22 kHz which 1039
improves spectral resolution with respect to the same experiment performed at 300 MHz and 1040
MAS= 10 kHz The auto-peak at δH= 356 ppm in the SQ dimension is attributed to H1-H1 spin 1041
pairs mainly resulting from intra CH2 interaction while the DQ cross-peaks at δH= 156-356 1042
ppm and δH= 432-356 ppm respectively origin from H2-H1 and H1rsquo-H1 interactions (Figure 1043
9b) DQ-SQ map does not show any auto-peak corresponding to H1rsquo-H1rsquo or Hxrsquo-Hxrsquo (x= 2rsquo 1044
3rsquo 4rsquo) interactions (red-crossed blue Figure 9b) thus excluding any proximity (lt 5 Aring) between 1045
close glucose neighbors On the contrary DQ-SQ maps (recorded both at 700 MHz Figure 9b 1046
or at 300 MHz not shown) systematically show DQ cross-peaks which can only be attributed 1047
to H1rsquo-H1 interactions (δH= 432-356) The presence of these H1rsquo-H1 interactions can only be 1048
explained by a head-tail arrangement of the G-C181-OH molecules as illustrated below the 1049
DQ-SQ map in Figure 9b 1050

25
was found that gauche effects in some cases up to the γ position in the sugar chain induce 616
upfield chemical shifts while anti and trans conformations result in downfield shifts Each 617
structure (monolayer crystal bilayer crystal or micellar fiber) was then characterized by a given 618
organization of the gluconamide and a characteristic 13C ssNMR fingerprint which could be 619
explained by gauche γ-gauche anti and trans conformations of the headgroup Similar 620
structural-spectroscopic correlations have been collected over the years for much simpler cyclic 621
sugars85 whereas pyranoses can undergo important conformational changes (chair half-chair 622
boat skew) when the appropriate energy barriers are crossed78ndash8086 A quantitative 623
conformational study based on the 13C chemical shift variations shown in Table 1 would be 624
certainly helpful but very delicate in the context of the present state of the art because a 625
rigorous approach requires at least one known crystal structure8182 which is currently missing 626
for this compound A qualitative approach will then be adopted 627
G-C181-OH is a bolaform amphiphile and flip-flop could be a possible mechanism 628
involved in the nanotube stabilization whereas head-tail interactions have long been considered 629
as important in nanotube-forming bolaform amphiphiles6063 From mere considerations based 630
on T2 (1H) relaxation arguments one could exclude head-tail configurations if the R-CH2OH 631
endgroup (H1) was involved in a direct interaction with the sugar group its corresponding T2 632
would probably be comparable to the sugarrsquos one (OH and H1rsquo) but this does not seem to be 633
the case However this hypothesis would be based on the comparison of the relaxation from 634
CH and CH2 protons additionally involved in different kind of motions Besides the relaxation 635
of H1 is influenced by the strong overlap between H1 and H5rsquo For these reasons relaxation 636
arguments are not solid enough and will not be used 637
We then address this question by exploring intermolecular interactions in a direct 638
manner using 2D 1H-1H homonuclear ssNMR correlation spectroscopy At 90degC in the fast-639
tumbling domain of molecular motion (narrow 1H NMR peaks Figure 6a) and corresponding 640
to the vesicle-rich region spin diffusion (NOESY) experiments are preferred over dipolar 641
coupling based experiments because such interaction is averaged out by molecular motion 642
However when the molecular motion is more constrained in the domain of nanotube stability 643
at 70degC (broad 1H spectra Figure 6a) Double-Quantum Single-Quantum (DQ-SQ) correlation 644
experiments are best suited to probe interaction between close molecular neighbors These 645
experiments are reported in Figure 9 and the related interpretation is only briefly reported 646
below while a more detailed discussion can be found on Page 12 in the Supporting Information 647
26
648
Figure 9 ndash a) 2D 1H-1H NOESY NMR experiment performed at MAS= 10 kHz (4 mm probe) on a Bruker 649
300 MHz Avance III HD spectrometer using 300 ms of mixing time Sample temperature is regulated to 650
90degC reached by cooling from 110degC b) 2D 1H-1H DQ-SQ (BAck-to-BAck BABA pulse sequence used for 651
the DQ excitation scheme) NMR experiment performed at MAS= 22 kHz (25 mm probe) on a Bruker 700 652
MHz Avance III spectrometer using a DQ excitation time equal to 2 rotor periods Sample temperature is 653
regulated to 70degC reached by cooling from 110degC The typical schemes illustrating how to interpret these 654
2D experiments are reported above each experimental map Zooms of the sugar region and configurational 655
interpretation are given below each 2D map More information are given in the text below 656
H16-H16
H1-H1
H9-H10
H1rsquo-H1
H1rsquoH910 H16
H1
H1rsquo-H1rsquo
Hxrsquo-Hxrsquo
2
(pp
m)
(ppm)
315
811910 1rsquo
2rsquo2
3rsquo 4rsquo6rsquo
5rsquo
1rsquo2910
asymp asymp asympHDO MeOD Acetone
1
315
811 9101rsquo
2rsquo2
3rsquo4rsquo6rsquo
5rsquo
1rsquo2 9 10
asympasympasympHDOMeODAcetone
H1rsquo-H1
1rsquo
1
(p
pm
)
(ppm)
H1-H2
H1rsquo-H1
H1rsquo
H910
H1H5rsquo
H2
H1rsquo-H5rsquo
315
811910 1rsquo
2rsquo2
3rsquo 4rsquo6rsquo
5rsquo
1rsquo2910
asymp asymp asympHDO MeOD Acetone
1
H2rsquoH3rsquoH4rsquo
H2rsquoH3rsquoH4rsquo
X= 2rsquo3rsquo4rsquo
NOESY - T= 90degC
1H
1H
1H
1H
DQ-SQ - T= 70degC
a) b)
2
(pp
m)
(p
pm
)
(ppm)
A B
AhellipB
AhellipA
BhellipB
NOESY
(ppm)
A B
AhellipB
DQ-SQ
Single-quantum dimension
Do
ub
le-q
ua
ntu
m d
imen
sio
n
AhellipA
BhellipB
BhellipA
BhellipA
315
811910 1rsquo
2rsquo2
3rsquo 4rsquo6rsquo
5rsquo
1rsquo2910
asymp asymp asympHDO MeOD Acetone
1
lt 5 Aring
lt 5 Aring
H1-H2
H811
H15
H16
H6rsquo
H1rsquo
H1
H5rsquo
H2
H1-H2
H1rsquo-H1
H1rsquo-H5rsquo
H1rsquo
H1 H5rsquo
H1rsquo
H1
H5rsquo
H1H2rsquo H3rsquo H4rsquo
H1-H1
H1rsquo-H1
Hxrsquo-HxrsquoX= 2rsquo3rsquo4rsquo
H1-H2
H1rsquo
Zoom sugar region 28 ndash 45 ppmNOESY DQ-SQ
27
Head-tail or head-head configurations could be probed by the existence of H1rsquo-H1 657
interactions whereas H1 (δH= 356 ppm) is associated to the glucolipid tail and H1rsquo (δH= 432 658
ppm) to the sugar headgroup These atoms are more than 15 Aring apart and a direct interaction 659
could not be observed in both NOESY and DQ-SQ experiments NOESY experiments (Figure 660
9a) show that H1rsquo-H1 correlations are not observed Meanwhile clear-cut direct H1rsquo-H1 661
interactions are indeed observed are detected at T= 70degC (DQ cross-peaks related to H1rsquo-H1 662
correlation in DQ-SQ experiment shown in Figure 9b) Interestingly the absence of auto peaks 663
at δH= 432 ppm and δH= 335 ppm in the SQ dimension excludes H1rsquo-H1rsquo and Hxrsquo-Hxrsquo (x= 2 664
3 4) interactions respectively strengthening the idea that sugar headgroups from two nearest-665
neighbor G-C181-OH molecules are not adjacent in the nanotube-vesicle region 666
Homonuclear 2D ssNMR supports the idea according to which G-C181-OH can 667
undergo molecular flip-flops and a head-tail arrangement in the dry product Extrapolating these 668
conclusions in the lower concentration range lack of H1rsquo-H1 proximity at T= 90degC suggests a 669
head-head configuration in the vesicle-rich region and head-tail configuration within the 670
nanotubes It is however still unclear whether flip-flops are driven by spontaneous temperature-671
induced conformational changes in the glucolipid packing stimulating inclusions within the 672
membrane itself672223629ndash1218ndash21 or by defects generated by inter-vesicle collisions In fact a 673
combination of both is not unlikely Nanotubes are not stable when temperature is 20 to 30 674
degrees above Tm1 indicating that inter-vesicle collisions alone cannot explain the unusual 675
phenomenon In an energy landscape approach87 the head-head configuration is certainly 676
favored at high temperature while both head-head and head-tail configurations could be 677
favored in the mid-temperature region corresponding to the range between Tm1 and Tm2 in the 678
dry powder Both statistical and defect-induced flip-flop events contribute to form high mean 679
zero Gaussian curvature morphologies (nanotubes) for which the head-tail conformation 680
limiting the proximity between bulky sugar headgroups is probably more adapted (Figure 8c) 681
The flip-flop interpretation now reasonably explains the strong differences in the sugar and fatty 682
alcohol conformations deduced by the multiple NMR signals attributed to chemically-683
equivalent groups The existence of various low-energy conformations each having specific 684
NMR signature for sugars in solution78ndash8086 and solid-state81ndash84 further supports our 685
interpretation 686
One last point should be clarified Why between Tm1 and Tm2 are two molecular 687
environments able to coexist instead of a single one of average rigidity as found in the case of 688
ldquoripplerdquo phases50ndash54 We believe that this question can be answered based on the NMR results 689
the relatively short T2 values of the H1rsquo and OH protons shows the constrained mobility of the 690
28
sugar headgroup despite a certain flexibility of the chain (long T2 component) This trend may 691
suggest restrictions in translational mobility probably due to the sugar-OH hydrogen bonding 692
(Figure 8c) meaning that lipids are not able to diffuse within the membrane thus keeping two 693
different configurations stable 694
695
Conclusions 696
Topologically-connected nanotube-vesicle lipidic systems are commonly observed for 697
self-assembled membranes composed of at least two amphiphiles and spontaneously driven by 698
anisotropic inclusions andor by external directional forces This work shows that strong 699
differences in membrane curvature can spontaneously occur in single-lipid systems without 700
external anisotropic forces Coexistence and interconnection between nanotubes and vesicles 701
are evidenced via cryo-TEM and fluorescence confocal microscopy in a single-phase region at 702
temperature above a transition temperature Tm1= 483degC determined by DSC on the hydrated 703
sample but below the second transition temperature Tm2 (957degC) determined by DSC on the 704
dry powder X-ray diffraction (WAXS) also shows the coexistence of two lattice periods one 705
attributed to an inter-membrane repeating distance and the other possibly related to the intra-706
nanotube glucolipid arrangement Labelling the systems with Laurdan a fluorophore of which 707
the emission strongly varies with the local membrane rigidity excludes the presence of rigid 708
micro-separated phases (eg Lβ) 709
1H and 13C ssNMR despite the fact that it can only be performed on the dry powder 710
confirm the presence of one main fluid G-C181-OH environment above Tm2 Below Tm2 the 711
splitting of some 13C peaks and the coexistence of short and long 1H relaxation components 712
demonstrate that G-C181-OH can simultaneously pack into structurally and dynamically 713
inequivalent environments Combining advanced 2D 1H-1H correlation experiments based on 714
spin diffusion or double-quanta excitation suggests that vesicles could contain a preferred head-715
head configuration of the bolaform lipid while nanotubes a preferred head-tail assembly 716
The presence of two environments composed of the same molecule characterized by 717
different molecular configurations and rigidity fulfills the theoretical conditions necessary to 718
spontaneously nucleate a membrane inclusion of non-zero average orientation described as 719
necessary to observe topologically-connected nanotube-vesicle structures in the absence of 720
external forces This hypothesis could also be enriched by the possibility of nanotubes to be 721
pulled away between two vesicles after a collision event 722
This work expands the actual theoretical and experimental framework on lipid networks 723
stabilized by a different radius of curvature It could also motivate the synthesis or isolation 724
29
of new lipids providing a higher level of 3D architectural control in soft networks possibly in 725
the range of room temperature 726
727
Acknowledgements 728
Dr Andrea Lassenberger and Dr Sylvain Preacutevost at Institut Laue Langevin (ILL Grenoble 729
France) are kindly acknowledged for their assistance on the SANS experiment Confocal 730
images were performed at the Institut de Biologie Paris Seine (IBPS) imaging facility Jean-731
Franccedilois Gilles (Imaging Core Facility Institut de Biologie Paris Seine (IBPS) CNRS 732
Sorbonne Universiteacute Paris France) is kindly acknowledged for his assistance on the confocal 733
microscopy imaging Dr Guillaume Laurent (LCMCP Sorbonne Universiteacute Paris France) is 734
kindly acknowledged for helpful discussions The French region Ile-de-France SESAME 735
program is acknowledged for financial support (700 MHz NMR 736
spectrometer) Dr Olivier Diat (ICSM Marcoule France) Prof eronikaIglič and Prof V Aleš737
onsul discussi Slovenia) are kindly acknowledged for helpfUniversity of LjubljanaIglič (-Kralj 738
739
Financial support 740
WAXS experiments have been supported by Soleil Light Source Saint Aubin France proposal 741
Ndeg 20201747 SANS experiments have been supported by ILL proposal Ndeg9-13-778 742
743
References 744
1 D Kabaso N Bobrovska W Goacuteźdź E Gongadze V Kralj-Iglič R Zorec and A 745
Iglič Bioelectrochemistry 2012 87 204ndash210 746
2 C R Safinya U Raviv D J Needleman A Zidovska M C Choi M A Ojeda-747
Lopez K K Ewert Y Li H P Miller J Quispe B Carragher C S Potter M W 748
Kim S C Feinstein and L Wilson Adv Mater 2011 23 2260ndash2270 749
3 P Veranič M Lokar G J Schuumltz J Weghuber S Wieser H Haumlgerstrand V Kralj-750
Iglič and A Iglič Biophys J 2008 95 4416ndash4425 751
4 A Rustom R Saffrich I Markovic P Walther and H-H Gerdes Science (80- ) 752
2004 303 1007ndash1010 753
5 M I Angelova S Soleacuteau P Meacuteleacuteard F Faucon and P Bothorel Prog Colloid 754
Polym Sci 1992 89 127ndash131 755
6 L Mathivet S Cribier and P F Devaux Biophys J 1996 70 1112ndash1121 756
7 V Kralj-Iglič G Gomišček J Majhenc V Arrigler and S Svetina Colloids Surfaces 757
A Physicochem Eng Asp 2001 181 315ndash318 758
30
8 V Kralj-Iglič A Iglič G Gomišček F Sevšek V Arrigler and H Haumlgerstrand J 759
Phys A Math Gen 2002 35 1533ndash1549 760
9 M Drab D Stopar V Kralj-Iglič and A Iglič Cells 2019 8 626 761
10 A Zidovska K K Ewert J Quispe B Carragher C S Potter and C R Safinya 762
Langmuir 2009 25 2979ndash2985 763
11 A Zidovska K K Ewert J Quispe B Carragher C S Potter and C R Safinya Soft 764
Matter 2011 7 8363ndash8369 765
12 A Zidovska K K Ewert J Quispe B Carragher C S Potter and C R Safinya 766
Biochim Biophys Acta - Biomembr 2009 1788 1869ndash1876 767
13 M Karlsson K Sott M Davidson A S Cans P Linderholm D Chiu and O Orwar 768
Proc Natl Acad Sci U S A 2002 99 11573ndash11578 769
14 A Karlsson R Karlsson M Karlsson A-S Cans A Stromberg F Ryttsen and O 770
Orwar Nature 2001 409 150ndash152 771
15 M Karlsson K Sott A S Cans A Karlsson R Karlsson and O Orwar Langmuir 772
2001 17 6754ndash6758 773
16 E Evans H Bowman A Leung D Needham and D Tirrell Science (80- ) 1996 774
273 933ndash935 775
17 U Seifert Configurations of fluid membranes and vesicles 1997 vol 46 776
18 J Kaumls and E Sackmann Biophys J 1991 60 825ndash844 777
19 N Bobrovska W Goacuteźdź V Kralj-Iglič and A Iglič PLoS One 2013 8 e73941 778
20 A Iglič B Babnik K Bohinc M Fošnarič H Haumlgerstrand and V Kralj-Iglič J 779
Biomech 2007 40 579ndash585 780
21 K Bohinc T Slivnik A Iglič M Brumen and V Kralj-Iglič J Phys Chem C 2007 781
111 9709ndash9718 782
22 A Iglič H Haumlgerstrand P Veranič A Plemenitaš and V Kralj-Iglič J Theor Biol 783
2006 240 368ndash373 784
23 V Kralj-Iglič and P Veranič Adv Planar Lipid Bilayers Liposomes 2006 5 129ndash785
149 786
24 A Iglic and V Kralj-Iglic Adv Planar Lipid Bilayers Liposomes 2006 4 253ndash279 787
25 S Penič L Mesarec M Fošnarič L Mroacutewczyńska H Haumlgerstrand V Kralj-Iglič and 788
A Iglič Front Phys 2020 8 342 789
26 P Yager and P E Schoen Mol Cryst Liq Cryst 1984 106 371ndash381 790
27 T G Barclay K Constantopoulos and J Matisons Chem Rev 2014 114 10217ndash791
10291 792
31
28 B Božič G Gomišček V Kralj-Iglič S Svetina and B Žekš Eur Biophys J 2002 793
31 487ndash496 794
29 A Iglič H Haumlgerstrand M Bobrowska-Haumlgerstrand V Arrigler and V Kralj-Iglič 795
Phys Lett A 2003 310 493ndash497 796
30 R Bar-Ziv and E Moses Phys Rev Lett 1994 73 1392ndash1395 797
31 S Chiruvolu H E Warriner E Naranjo S H Idziak J O Raumldler R J Plano J A 798
Zasadzinski and C R Safinya Science (80- ) 1994 266 1222ndash1225 799
32 V Kralj-Iglič A Iglič H Haumlgerstrand and P Peterlin Phys Rev E 2000 61 4230ndash800
4234 801
33 L Mesarec M Drab S Penič V Kralj-Iglič and A Iglič Int J Mol Sci 2021 22 802
2348 803
34 L Van Renterghem S L K W Roelants N Baccile K Uyttersprot M C Taelman 804
B Everaert S Mincke S Ledegen S Debrouwer K Scholtens C V Stevens W 805
Soetaert L Van Renterghem S L K W Roelants N Baccile K Uytersprot M C 806
Taelman B Everaert S Mincke S Ledegen S Debrouwer K Scholtens C V 807
Stevens and W Soetaert Biotechnol Bioeng 2018 115 1195ndash1206 808
35 J Clark and F Deswarte Introduction to Chemicals from Biomass Second Edition 809
John Wiley amp Sons 2015 810
36 K V Sajna R Houmlfer R K Sukumaran L D Gottumukkala and A Pandey in 811
Industrial Biorefineries and White Biotechnology eds A Pandey R Houmlfer M 812
Taherzadeh K M Nampoothiri and C Larroche Amsterdam Oxford Waltham 813
Elsevier 2015 pp 499ndash521 814
37 R Marchant and I M Banat Trends Biotechnol 2012 30 558ndash565 815
38 K Hill and C LeHen-Ferrenbach in Sugar-Based Surfactants Fundamentals and 816
Applications ed C C Ruiz Boca Raton CRC Press 2009 pp 1ndash20 817
39 L Rodrigues I M Banat J Teixeira and R Oliveira J Antimicrob Chemother 818
2006 57 609ndash618 819
40 J D Desai and I M Banat Microbiol Mol Biol Rev 1997 61 47ndash64 820
41 S L K W Roelants K Ciesielska S L De Maeseneire H Moens B Everaert S 821
Verweire Q Denon B Vanlerberghe I N A Van Bogaert P Van der Meeren B 822
Devreese and W Soetaert Biotechnol Bioeng 2016 113 550ndash559 823
42 N Baccile M Selmane P Le Griel S Preacutevost J Perez C V Stevens E Delbeke S 824
Zibek M Guenther W Soetaert I N A Van Bogaert and S Roelants Langmuir 825
2016 32 6343ndash6359 826
32
43 N Baccile A-S Cuvier S Preacutevost C V Stevens E Delbeke J Berton W Soetaert 827
I N A Van Bogaert and S Roelants Langmuir 2016 32 10881ndash10894 828
44 N Baccile C Seyrig A Poirier S A Castro S L K W Roelants and S Abel Green 829
Chem 2021 23 3842ndash3944 830
45 A Salis L Cappai C Carucci D F Parsons and M Monduzzi J Phys Chem Lett 831
2020 11 6805ndash6811 832
46 J Schindelin I Arganda-Carreras E Frise V Kaynig M Longair T Pietzsch S 833
Preibisch C Rueden S Saalfeld B Schmid J-Y Tinevez D J White V 834
Hartenstein K Eliceiri P Tomancak and A Cardona Nat Methods 2012 9 676ndash835
682 836
47 T Parasassi and E Gratton J Fluoresc 1995 5 59ndash69 837
48 M M Dodes Traian F L Gonzaacutelez Flecha and V Levi J Lipid Res 2012 53 609ndash838
616 839
49 D M Owen C Rentero A Magenau A Abu-Siniyeh and K Gaus Nat Protoc 840
2012 7 24ndash35 841
50 W Stillwell in An Introduction to Biological Membranes Academic Press 2016 pp 842
135ndash180 843
51 W Stillwell in An Introduction to Biological Membranes Academic Press 2016 pp 844
181ndash220 845
52 B Tenchov Chem Phys Lipids 1991 57 165ndash177 846
53 R Koynova and M Caffrey Biochim Biophys Acta 1998 1376 91ndash145 847
54 F Schmid S Dolezel O Lenz and S Meinhardt J Phys Conf Ser 2014 487 848
012004 849
55 S Meinhardt R L C Vink and F Schmid Proc Natl Acad Sci U S A 2013 110 850
4476ndash4481 851
56 O Glatter and O Kratky Small Angle X-ray Scattering Academic Press London 852
1982 853
57 B A Cunningham A D Brown D H Wolfe W P Williams and A Brain Phys 854
Rev E 1998 58 3662ndash3672 855
58 M Nadler A Steiner T Dvir O Szekely P Szekely A Ginsburg R Asor R Resh 856
C Tamburu M Peres and U Raviv Soft Matter 2011 7 1512ndash1523 857
59 C Tanford The hydrophobic effect Formation of micelles and biological membranes 858
John Wiley amp Sons Inc New York 1973 859
60 M Masuda and T Shimizu Langmuir 2004 20 5969ndash5977 860
33
61 A Zidovska K K Ewert J Quispe B Carragher C S Potter and C R Safinya 861
Block Liposomes Vesicles of Charged Lipids with Distinctly Shaped Nanoscale 862
Sphere- Pear- Tube- or Rod-Segments Elsevier Inc 1st edn 2009 vol 465 863
62 A Iglic V Kralj-Iglic B Božič M Bobrowska-Haumlgerstrand B Isomaa and H 864
Haumlgerstrand Bioelectrochemistry 2000 52 203ndash211 865
63 T Shimizu M Masuda and H Minamikawa Chem Rev 2005 105 1401ndash1444 866
64 J V Selinger and J M Schnur Phys Rev Lett 1993 71 4091ndash4094 867
65 J M Schnur Science (80- ) 1993 262 1669ndash1676 868
66 B Tenchov R Koynova and G Rapp Biophys J 2001 80 1873ndash1890 869
67 R Koynova and B Tenchov Ser Biomech 2017 31 3ndash19 870
68 S J Angyal and R Le Fur Carbohydr Res 1984 126 15ndash26 871
69 J K Whitesell and M A Minton J Am Chem Soc 1987 109 225ndash228 872
70 T Takayama S Ando and I Ando J Mol Struct 1990 220 245ndash250 873
71 K Gawrisch N V Eldho and I V Polozov Chem Phys Lipids 2002 116 135ndash151 874
72 F Tielens C Gervais J F Lambert F Mauri and D Costa Chem Mater 2008 20 875
3336ndash3344 876
73 G A Jeffrey and Y Yeon Acta Crystallogr Sect B 1986 42 410ndash413 877
74 B Berglund and R W Vaughan J Chem Phys 1980 73 2037ndash2043 878
75 C Gervais C Coelho T Azaiumls J Maquet G Laurent F Pourpoint C Bonhomme 879
P Florian B Alonso G Guerrero P H Mutin and F Mauri J Magn Reson 2007 880
187 131ndash140 881
76 C Akita T Kawaguchi F Kaneko H Yamamoto and M Suzuki J Phys Chem B 882
2004 108 4862ndash4868 883
77 R N Purusottam L Seacutenicourt J J Lacapegravere and P Tekely Biochim Biophys Acta - 884
Biomembr 2015 1848 3134ndash3139 885
78 X Biarneacutes A Ardegravevol A Planas C Rovira A Laio and M Parrinello J Am Chem 886
Soc 2007 129 10686ndash10693 887
79 L M J Kroon‐Batenburg and J Kroon Biopolymers 1990 29 1243ndash1248 888
80 K N Kirschner and R J Woods Proc Natl Acad Sci U S A 2001 98 10541ndash889
10545 890
81 S Svenson B Kirste and J H Fuhrhop J Am Chem Soc 1994 116 11969ndash11975 891
82 I Sack S Macholl J H Fuhrhop and G Buntkowsky Phys Chem Chem Phys 892
2000 2 1781ndash1788 893
83 S Svenson J Koening and J H Fuhrhop J Phys Chem 1994 98 1022ndash1028 894
34
84 S Svenson A Schaefer and J H Fuhrhop J Chem Soc Perkin Trans 2 1994 2 895
1023ndash1028 896
85 K Bock and C Pedersen Adv Carbohydr Chem Biochem 1983 41 27ndash66 897
86 T B Grindley Structure and Conformation of Carbohydrates Springer Berlin 898
Heidelberg 2008 899
87 F Tantakitti J Boekhoven X Wang R V Kazantsev T Yu J Li E Zhuang R 900
Zandi J H Ortony C J Newcomb L C Palmer G S Shekhawat M O De La 901
Cruz G C Schatz and S I Stupp Nat Mater 2016 15 469ndash476 902
903
1
Supporting Information 904
905
Topological connection between vesicles and nanotubes in single-906
component lipid membranes driven by head-tail interactions 907
908
Niki Baccilea Ceacutedric Lorthioira Abdoul Aziz Baa Patrick Le Griela Cristina Coelhob Javier 909
Perezc Wim Soetaertd Sophie L K W Roelantsd 910
911
a Sorbonne Universiteacute Centre National de la Recherche Scientifique Laboratoire de Chimie de 912
la Matiegravere Condenseacutee de Paris LCMCP F-75005 Paris France 913
b Institut des Mateacuteriaux de Paris Centre Sorbonne Universiteacute Paris France 914
c Synchrotron Soleil LrsquoOrme des Merisiers Saint-Aubin BP48 91192 Gif-sur-Yvette Cedex 915
France 916
d InBio Department of Biotechnology Ghent University Ghent Belgium 917
918
919
Corresponding author 920
Dr Niki Baccile 921
E-mail address nikibaccilesorbonne-universitefr 922
Phone +33 1 44 27 56 77 923
924
925
926
2
a) 927
Parameter Method
Dry Matter (DM ) 996 Infrared balance 105degC
Glucose () 012 HPLC-Metacarb
Glycerol () nd HPLC-Metacarb
Free Fatty Acid content () lt001 Internal method BBEPP
GC with FID Detector
Oil () lt001 Internal method BBEPP
GC with FID Detector
Moulds (CFUg) lt10 3M-Nordval ndeg16 B
Yeasts (CFUg) lt10 3M-Nordval ndeg16 B
Anaerobic count (CFUg) lt10 SP-VG M005 B
Protein () tbd BCA protein assay
928
Figure S 1 - a) HPLC-ELSD chromatogram and composition table 929
930
931
932
933
3
b) 934
935
Group Ndeg δ ppm
CH2 1 354
CH2 2 153
CH2 3-712-14 132
CH2 811 203
CH 910 534
CH2 15 162
CH2 16 388
CH 1 424
CH 2 316
CH 3 334
CH 4 329
CH 5 354
CH2 6 366
Figure S 1 (next) ndash b) 1H NMR spectrum (MeOD-d4) recorded on the purified G-C181-OH compounds 936
and related assignment 937
938
2
811910 1rsquo
5rsquo1
3rsquo4rsquo
1rsquo1910
asymp asymp asympHDO MeOD Acetone
6rsquo2rsquo
1615
3-712-14
4
939
940
Figure S 2 ndash Cryo-TEM images recorded for a 5 mgmL G-C181-OH aqueous solution heat at T= 130degC 941
5
942
943
Figure S 3 - Cryo-TEM images recorded for a 5 mgmL G-C181-OH aqueous solution heat at T= 90degC 944
945
90degC
1
22
6
946
947
948
949
Figure S 4 ndash Cryo-TEM images recorded for a 5 mgmL G-C181-OH aqueous solution heat at T= 70degC 950
951
21
11
1
2
5
3
4
45
5
6
7
7
7
952
953
954
Figure S 5 ndash Cryo-TEM images recorded for a 5 mgmL G-C181-OH aqueous solution heat at T= 25degC 955
956
957
1
1 1
8
958
Figure S 6 ndash a) SANS experiment recorded at 90degC for a 5 mgmL G-C181-OH aqueous solution b-c) 959
WAXS experiments recorded on aqueous solutions of G-C181-OH at b) 5 mgmL and c) 25 mgmL d) 960
Structural interpretation of the repeating distances pointed out in c) 961
962
963
964
001 01 1
q Aring-1
25degC
68degC
88degC
111degC
01 1q Aring
-1
02 04 06 08 1q Aring
-1
001 01
10-1
100
101
Inte
nsity
cm
-1
q Aring-1
-2
T= 90degC
SANS WAXS WAXS
a) b) c)
dv
dL d= 144 Aring-1
di
ddH2O
dt
dvdL
dtdi d
d)
9
965
966
Figure S 7 ndash ssNMR MAS (10 kHz) experiments recorded on a G-C181-OH dry powder a) 1H spectra 967
recorded from 110degC to 70degC b) 13C single pulse (SP) spectra recorded with high power 1H decoupling from 968
110degC to 70degC c) 13C cross polarization (CP) spectra recorded at 110degC and contact time tc of 50 micros and 969
3000 micros d) 13C CP spectra recorded at 70degC and for 20 lt tc micros lt 3000 970
971
1
811
910
CH2 CH2
1rsquo
6rsquo
8 6 4 2 0 ppm
110
90
80
70
910
1rsquo
6rsquo16
1
2rsquo3rsquo4rsquo
811
OH
45 40 35 30 25 20 15
ppm
200 180 160 140 120 100 80 60 40 20 0
ppm140 120 100 80
ppm
CH2-gauche
3004
110
90
80
70
65
60
50
25
C91013003
C9 - 12869
CH2-all-trans
3198
C1rsquo10335
a) b)
1H
T degCT degC
13C Single Pulse MAS
A
B
A
B
70degC70degC
5rsquo
215
200 180 160 140 120 100 80 60 40 20 0
ppm
13C CPMAST= 110degC
200 180 160 140 120 100 80 60 40 20 0
ppm
132 131 130 129 128 127 126
ppm
106 105 104 103 102
ppm
13C CPMAST= 70degC
50
tc micros
3000
20
tc micros
50 500 1000 3000
tc micros
C102
13024 C910113003
C92
12869
C1rsquo213082
C1rsquo110443
A B
106 105 104 103 102
ppm
3000
1000
500
50
20
AB
c)
d)
10
972
Figure S 8 ndash a) Short and d) long T2 components displayed by the 1H transverse relaxation signal c) 1H 973
transverse relaxation signals recorded on a G-C181-OH dry powder from 110degC to 70degC The area of each 974
given resonance is plotted (log-lin) as a function of the echo time (CPMG pulse sequence) for each 975
temperature and fitted using the equation given above T2s and T2l indicate the short and long T2 relaxation 976
times respectively obtained by describing the 1H transverse relaxation signal using a biexponential decay 977
For H1rsquo H5rsquo and H6rsquo the 1H relaxation function could be described by a monoexponential decay 978
- Protons from the sugar group (H1rsquo H5rsquo H6rsquo) show a single T2 relaxation component (Figure 979
6c and Figure S 8) while protons of the acyl chain (CH2 H910 H811) show both short (Figure 980
6c) and long (Figure 6d) T2 relaxation component 981
- The short T2 relaxation time systematically decreases from 110degC to 70degC for all species by a 982
factor ranging from two to seven depending on the specific chemical group Very long T2 are 983
observed at 110degC for all acyl species while nearly unchanged values are measured below 984
90degC without any clear trend 985
- The sugar protons (H1rsquo H5rsquo H6rsquo) have the shortest set of T2 values (lt 1 ms) below 100degC 986
The long component of T2 generally ranges between 4 ms and 12 ms 987
0 1 2 3 4 5 6 7 8
00
05
10
15
20
25
30
35
40
45
Log
In
ten
sity
Time ms
0 1 2 3 4 5 6 7 8
00
05
10
15
20
25
30
35
40
45
Log
In
ten
sity
Time ms
0 1000 2000 3000 4000 5000 6000 7000 8000
00
05
10
15
20
25
30
35
40
45
Log
In
ten
sity
Time ms
0 1000 2000 3000 4000 5000 6000 7000 8000
00
05
10
15
20
25
30
35
40
45
Log
In
ten
sity
Time ms
0 1000 2000 3000 4000 5000 6000 7000 8000
00
05
10
15
20
25
30
35
40
45
Log
In
ten
sity
Time ms
0 1000 2000 3000 4000 5000 6000 7000 8000
00
05
10
15
20
25
30
35
40
45
Log
In
ten
sity
Time ms
H1
H8H11
H9H10
CH2
H1rsquo
H6rsquo
CH2
H910H811 H1CH2
H1rsquo H5rsquo6rsquo
0 1000 2000 3000 4000 5000 6000 7000 8000
00
05
10
15
20
25
30
35
40
45
Log
In
ten
sity
Time ms
OH
0 1000 2000 3000 4000 5000 6000 7000 8000
00
05
10
15
20
25
30
35
40
45 T= 110degC
T= 90degC
T= 80degC
T= 70degC
Log
In
ten
sity
Time ms
Fit
)
CH2 H910 H811 H1 H56 H1 OH
00
05
10
15
20
25
30
35
40
T2 m
s
T= 110degC
T= 90degC
T= 80degC
T= 70degC
CH2 H910 H811 H1
0
2
4
6
8
10
12
T2 m
s
T= 110degC
T= 90degC
T= 80degC
T= 70degC
Short T2(1H) Long T2(1H)
a) b)
c)
11
Table S 1 ndash 1H chemical shifts of G-C181-OH in solution and in the solid-state Solid-state spectra are 988
recorded at a MAS frequency of 10 kHz in DMSO-d6 broad peak 989
990
δH ppm
Group Ndeg Liquid
(MeOD-d4) Solid
(T= 110degC) Solid
(T= 70degC)
CH2 H1 354 357
CH2 H2 153 156
CH2 H3-712-14 132 135
CH2 H811 203 203
CH H910 534 534
CH2 H15 162 164
CH2 H16 388 383
CH H1 424 432
CH H2 316 335
CH H3 334 335
CH H4 329 335
CH H5 354 351 357
CH2 H6 366 383
OH OH1 432
45 463
OH OH2 492
OH OH3 490
OH OH4 487
OH OH6 445
991
992
H1H9H10H1rsquo
H6rsquo
OH2rsquo
OH1
12
Detailed discussion about the NOESY and DQ-SQ 2D 1H-1H ssNMR experiments presented in 993
Figure 9 994
995
2D 1H-1H ssNMR experiments are a unique tool to explore through-space proximities 996
between 1H nuclei ssNMR offers a large number of possibilities each adapted to a given 997
system The advantage of 2D maps with respect to a dynamics approach is their direct 998
readability in clear two nuclei which exchange their magnetization through-space (whichever 999
mechanism may be responsible for this exchange) will display a specific cross-peak However 1000
the way cross-peaks are presented and interpreted strictly depends on the nature of the pulse 1001
program which in turn is chosen according to the physical nature of the sample 1002
1D temperature-dependent 1H NMR experiments performed on G-C181-OH (Figure 1003
4a in the main text) indicate sharp peaks at 90degC and broad peaks at 70degC Narrow peaks 1004
indicate fast andor large-amplitude molecular tumbling averaging the strong 1H-1H dipolar 1005
interactions This excludes the use of pulse sequences like DQ-SQ which is not efficient under 1006
these conditions For this reason we employ spin-diffusion-based pulse sequences like 1007
NOESY which is more adapted for samples with high molecular mobility When mixing times 1008
are chosen to be short (lt 1 s) one generally explores through-space proximities within about 5 1009
10 Aring On the contrary when molecular motions are restricted dipolar coupling becomes 1010
significant 1H NMR peaks are broader and pulse sequences like DQ-SQ can now be used 1011
with a spatial resolution of less than 5 Aring 1012
Whenever possible DQ-SQ experiments are preferred over spin diffusion-based pulse 1013
sequences because they are more selective in particular for likewise interactions which are 1014
not discriminated in NOESY-type experiments This is illustrated by the typical interaction 1015
schemes for NOESY (top Figure 9a) and DQ-SQ (top Figure 9b) For two given A and B 1016
protons 2D NOESY maps will display two on-diagonal and two square-shaped symmetrical 1017
off-diagonal cross-peaks Off-diagonal cross-peaks illustrate the mutual A-B and B-A 1018
interaction but the on-diagonal peaks are systematic and do not prove any A-A or B-B 1019
interaction Similarly to NOESY 2D DQ-SQ maps display off-diagonal peaks (symmetric 1020
across the diagonal top Figure 9b) upon A-B and B-A interaction but in contrast they will 1021
display on-diagonal peaks only in the presence of self-interaction In the tutorial example of 1022
Figure 9b top the on-diagonal A-A peak indicates mutual A-A interaction while lack of on-1023
diagonal B-B peak evidences the absence of B-B proximities Combining NOESY and DQ-SQ 1024
experiments is capital to study the local arrangement of G-C181-OH and its evolution with 1025
temperature 1026
13
At T= 90degC the H1 and H5rsquo contributions are very close but possible to discriminate 1027
them (δ(H1)= 354 ppm δ(H5rsquo)= 351 ppm) according to 1H NMR chemical shifts in Table S 1028
1 2D 1H-1H NOESY in Figure 9a also discriminates between the two components attributed 1029
on the basis of the interactions with their mutual neighbors (green H1-H2 and H5rsquo-H1rsquo squares 1030
in Figure 9a) On this basis 2D NOESY does not show a direct H1rsquo-H1 correlation (blue red-1031
crossed) but rather an extensive network of intra-sugar interactions These features exclude 1032
suggest intra- and inter-sugar interactions and they exclude head-tail arrangements as a major 1033
molecular configuration at 90degC 1034
At 70degC the 1H NMR peaks are broader indicating a reduction of the T2 (1H) relaxation 1035
times andor residual homonuclear dipolar interactions excluding the use of NOESY In this 1036
case 1H-1H DQ-SQ correlation experiments are best suited Figure 9b presents the 1H-1H DQ-1037
SQ experiment on G-C181-OH at 70degC Peaks are broader than in NOESY and attribution may 1038
be cumbersome However the experiment is performed at 700 MHz and MAS= 22 kHz which 1039
improves spectral resolution with respect to the same experiment performed at 300 MHz and 1040
MAS= 10 kHz The auto-peak at δH= 356 ppm in the SQ dimension is attributed to H1-H1 spin 1041
pairs mainly resulting from intra CH2 interaction while the DQ cross-peaks at δH= 156-356 1042
ppm and δH= 432-356 ppm respectively origin from H2-H1 and H1rsquo-H1 interactions (Figure 1043
9b) DQ-SQ map does not show any auto-peak corresponding to H1rsquo-H1rsquo or Hxrsquo-Hxrsquo (x= 2rsquo 1044
3rsquo 4rsquo) interactions (red-crossed blue Figure 9b) thus excluding any proximity (lt 5 Aring) between 1045
close glucose neighbors On the contrary DQ-SQ maps (recorded both at 700 MHz Figure 9b 1046
or at 300 MHz not shown) systematically show DQ cross-peaks which can only be attributed 1047
to H1rsquo-H1 interactions (δH= 432-356) The presence of these H1rsquo-H1 interactions can only be 1048
explained by a head-tail arrangement of the G-C181-OH molecules as illustrated below the 1049
DQ-SQ map in Figure 9b 1050
30
8 V Kralj-Iglič A Iglič G Gomišček F Sevšek V Arrigler and H Haumlgerstrand J 759
Phys A Math Gen 2002 35 1533ndash1549 760
9 M Drab D Stopar V Kralj-Iglič and A Iglič Cells 2019 8 626 761
10 A Zidovska K K Ewert J Quispe B Carragher C S Potter and C R Safinya 762
Langmuir 2009 25 2979ndash2985 763
11 A Zidovska K K Ewert J Quispe B Carragher C S Potter and C R Safinya Soft 764
Matter 2011 7 8363ndash8369 765
12 A Zidovska K K Ewert J Quispe B Carragher C S Potter and C R Safinya 766
Biochim Biophys Acta - Biomembr 2009 1788 1869ndash1876 767
13 M Karlsson K Sott M Davidson A S Cans P Linderholm D Chiu and O Orwar 768
Proc Natl Acad Sci U S A 2002 99 11573ndash11578 769
14 A Karlsson R Karlsson M Karlsson A-S Cans A Stromberg F Ryttsen and O 770
Orwar Nature 2001 409 150ndash152 771
15 M Karlsson K Sott A S Cans A Karlsson R Karlsson and O Orwar Langmuir 772
2001 17 6754ndash6758 773
16 E Evans H Bowman A Leung D Needham and D Tirrell Science (80- ) 1996 774
273 933ndash935 775
17 U Seifert Configurations of fluid membranes and vesicles 1997 vol 46 776
18 J Kaumls and E Sackmann Biophys J 1991 60 825ndash844 777
19 N Bobrovska W Goacuteźdź V Kralj-Iglič and A Iglič PLoS One 2013 8 e73941 778
20 A Iglič B Babnik K Bohinc M Fošnarič H Haumlgerstrand and V Kralj-Iglič J 779
Biomech 2007 40 579ndash585 780
21 K Bohinc T Slivnik A Iglič M Brumen and V Kralj-Iglič J Phys Chem C 2007 781
111 9709ndash9718 782
22 A Iglič H Haumlgerstrand P Veranič A Plemenitaš and V Kralj-Iglič J Theor Biol 783
2006 240 368ndash373 784
23 V Kralj-Iglič and P Veranič Adv Planar Lipid Bilayers Liposomes 2006 5 129ndash785
149 786
24 A Iglic and V Kralj-Iglic Adv Planar Lipid Bilayers Liposomes 2006 4 253ndash279 787
25 S Penič L Mesarec M Fošnarič L Mroacutewczyńska H Haumlgerstrand V Kralj-Iglič and 788
A Iglič Front Phys 2020 8 342 789
26 P Yager and P E Schoen Mol Cryst Liq Cryst 1984 106 371ndash381 790
27 T G Barclay K Constantopoulos and J Matisons Chem Rev 2014 114 10217ndash791
10291 792
31
28 B Božič G Gomišček V Kralj-Iglič S Svetina and B Žekš Eur Biophys J 2002 793
31 487ndash496 794
29 A Iglič H Haumlgerstrand M Bobrowska-Haumlgerstrand V Arrigler and V Kralj-Iglič 795
Phys Lett A 2003 310 493ndash497 796
30 R Bar-Ziv and E Moses Phys Rev Lett 1994 73 1392ndash1395 797
31 S Chiruvolu H E Warriner E Naranjo S H Idziak J O Raumldler R J Plano J A 798
Zasadzinski and C R Safinya Science (80- ) 1994 266 1222ndash1225 799
32 V Kralj-Iglič A Iglič H Haumlgerstrand and P Peterlin Phys Rev E 2000 61 4230ndash800
4234 801
33 L Mesarec M Drab S Penič V Kralj-Iglič and A Iglič Int J Mol Sci 2021 22 802
2348 803
34 L Van Renterghem S L K W Roelants N Baccile K Uyttersprot M C Taelman 804
B Everaert S Mincke S Ledegen S Debrouwer K Scholtens C V Stevens W 805
Soetaert L Van Renterghem S L K W Roelants N Baccile K Uytersprot M C 806
Taelman B Everaert S Mincke S Ledegen S Debrouwer K Scholtens C V 807
Stevens and W Soetaert Biotechnol Bioeng 2018 115 1195ndash1206 808
35 J Clark and F Deswarte Introduction to Chemicals from Biomass Second Edition 809
John Wiley amp Sons 2015 810
36 K V Sajna R Houmlfer R K Sukumaran L D Gottumukkala and A Pandey in 811
Industrial Biorefineries and White Biotechnology eds A Pandey R Houmlfer M 812
Taherzadeh K M Nampoothiri and C Larroche Amsterdam Oxford Waltham 813
Elsevier 2015 pp 499ndash521 814
37 R Marchant and I M Banat Trends Biotechnol 2012 30 558ndash565 815
38 K Hill and C LeHen-Ferrenbach in Sugar-Based Surfactants Fundamentals and 816
Applications ed C C Ruiz Boca Raton CRC Press 2009 pp 1ndash20 817
39 L Rodrigues I M Banat J Teixeira and R Oliveira J Antimicrob Chemother 818
2006 57 609ndash618 819
40 J D Desai and I M Banat Microbiol Mol Biol Rev 1997 61 47ndash64 820
41 S L K W Roelants K Ciesielska S L De Maeseneire H Moens B Everaert S 821
Verweire Q Denon B Vanlerberghe I N A Van Bogaert P Van der Meeren B 822
Devreese and W Soetaert Biotechnol Bioeng 2016 113 550ndash559 823
42 N Baccile M Selmane P Le Griel S Preacutevost J Perez C V Stevens E Delbeke S 824
Zibek M Guenther W Soetaert I N A Van Bogaert and S Roelants Langmuir 825
2016 32 6343ndash6359 826
32
43 N Baccile A-S Cuvier S Preacutevost C V Stevens E Delbeke J Berton W Soetaert 827
I N A Van Bogaert and S Roelants Langmuir 2016 32 10881ndash10894 828
44 N Baccile C Seyrig A Poirier S A Castro S L K W Roelants and S Abel Green 829
Chem 2021 23 3842ndash3944 830
45 A Salis L Cappai C Carucci D F Parsons and M Monduzzi J Phys Chem Lett 831
2020 11 6805ndash6811 832
46 J Schindelin I Arganda-Carreras E Frise V Kaynig M Longair T Pietzsch S 833
Preibisch C Rueden S Saalfeld B Schmid J-Y Tinevez D J White V 834
Hartenstein K Eliceiri P Tomancak and A Cardona Nat Methods 2012 9 676ndash835
682 836
47 T Parasassi and E Gratton J Fluoresc 1995 5 59ndash69 837
48 M M Dodes Traian F L Gonzaacutelez Flecha and V Levi J Lipid Res 2012 53 609ndash838
616 839
49 D M Owen C Rentero A Magenau A Abu-Siniyeh and K Gaus Nat Protoc 840
2012 7 24ndash35 841
50 W Stillwell in An Introduction to Biological Membranes Academic Press 2016 pp 842
135ndash180 843
51 W Stillwell in An Introduction to Biological Membranes Academic Press 2016 pp 844
181ndash220 845
52 B Tenchov Chem Phys Lipids 1991 57 165ndash177 846
53 R Koynova and M Caffrey Biochim Biophys Acta 1998 1376 91ndash145 847
54 F Schmid S Dolezel O Lenz and S Meinhardt J Phys Conf Ser 2014 487 848
012004 849
55 S Meinhardt R L C Vink and F Schmid Proc Natl Acad Sci U S A 2013 110 850
4476ndash4481 851
56 O Glatter and O Kratky Small Angle X-ray Scattering Academic Press London 852
1982 853
57 B A Cunningham A D Brown D H Wolfe W P Williams and A Brain Phys 854
Rev E 1998 58 3662ndash3672 855
58 M Nadler A Steiner T Dvir O Szekely P Szekely A Ginsburg R Asor R Resh 856
C Tamburu M Peres and U Raviv Soft Matter 2011 7 1512ndash1523 857
59 C Tanford The hydrophobic effect Formation of micelles and biological membranes 858
John Wiley amp Sons Inc New York 1973 859
60 M Masuda and T Shimizu Langmuir 2004 20 5969ndash5977 860
33
61 A Zidovska K K Ewert J Quispe B Carragher C S Potter and C R Safinya 861
Block Liposomes Vesicles of Charged Lipids with Distinctly Shaped Nanoscale 862
Sphere- Pear- Tube- or Rod-Segments Elsevier Inc 1st edn 2009 vol 465 863
62 A Iglic V Kralj-Iglic B Božič M Bobrowska-Haumlgerstrand B Isomaa and H 864
Haumlgerstrand Bioelectrochemistry 2000 52 203ndash211 865
63 T Shimizu M Masuda and H Minamikawa Chem Rev 2005 105 1401ndash1444 866
64 J V Selinger and J M Schnur Phys Rev Lett 1993 71 4091ndash4094 867
65 J M Schnur Science (80- ) 1993 262 1669ndash1676 868
66 B Tenchov R Koynova and G Rapp Biophys J 2001 80 1873ndash1890 869
67 R Koynova and B Tenchov Ser Biomech 2017 31 3ndash19 870
68 S J Angyal and R Le Fur Carbohydr Res 1984 126 15ndash26 871
69 J K Whitesell and M A Minton J Am Chem Soc 1987 109 225ndash228 872
70 T Takayama S Ando and I Ando J Mol Struct 1990 220 245ndash250 873
71 K Gawrisch N V Eldho and I V Polozov Chem Phys Lipids 2002 116 135ndash151 874
72 F Tielens C Gervais J F Lambert F Mauri and D Costa Chem Mater 2008 20 875
3336ndash3344 876
73 G A Jeffrey and Y Yeon Acta Crystallogr Sect B 1986 42 410ndash413 877
74 B Berglund and R W Vaughan J Chem Phys 1980 73 2037ndash2043 878
75 C Gervais C Coelho T Azaiumls J Maquet G Laurent F Pourpoint C Bonhomme 879
P Florian B Alonso G Guerrero P H Mutin and F Mauri J Magn Reson 2007 880
187 131ndash140 881
76 C Akita T Kawaguchi F Kaneko H Yamamoto and M Suzuki J Phys Chem B 882
2004 108 4862ndash4868 883
77 R N Purusottam L Seacutenicourt J J Lacapegravere and P Tekely Biochim Biophys Acta - 884
Biomembr 2015 1848 3134ndash3139 885
78 X Biarneacutes A Ardegravevol A Planas C Rovira A Laio and M Parrinello J Am Chem 886
Soc 2007 129 10686ndash10693 887
79 L M J Kroon‐Batenburg and J Kroon Biopolymers 1990 29 1243ndash1248 888
80 K N Kirschner and R J Woods Proc Natl Acad Sci U S A 2001 98 10541ndash889
10545 890
81 S Svenson B Kirste and J H Fuhrhop J Am Chem Soc 1994 116 11969ndash11975 891
82 I Sack S Macholl J H Fuhrhop and G Buntkowsky Phys Chem Chem Phys 892
2000 2 1781ndash1788 893
83 S Svenson J Koening and J H Fuhrhop J Phys Chem 1994 98 1022ndash1028 894
34
84 S Svenson A Schaefer and J H Fuhrhop J Chem Soc Perkin Trans 2 1994 2 895
1023ndash1028 896
85 K Bock and C Pedersen Adv Carbohydr Chem Biochem 1983 41 27ndash66 897
86 T B Grindley Structure and Conformation of Carbohydrates Springer Berlin 898
Heidelberg 2008 899
87 F Tantakitti J Boekhoven X Wang R V Kazantsev T Yu J Li E Zhuang R 900
Zandi J H Ortony C J Newcomb L C Palmer G S Shekhawat M O De La 901
Cruz G C Schatz and S I Stupp Nat Mater 2016 15 469ndash476 902
903
1
Supporting Information 904
905
Topological connection between vesicles and nanotubes in single-906
component lipid membranes driven by head-tail interactions 907
908
Niki Baccilea Ceacutedric Lorthioira Abdoul Aziz Baa Patrick Le Griela Cristina Coelhob Javier 909
Perezc Wim Soetaertd Sophie L K W Roelantsd 910
911
a Sorbonne Universiteacute Centre National de la Recherche Scientifique Laboratoire de Chimie de 912
la Matiegravere Condenseacutee de Paris LCMCP F-75005 Paris France 913
b Institut des Mateacuteriaux de Paris Centre Sorbonne Universiteacute Paris France 914
c Synchrotron Soleil LrsquoOrme des Merisiers Saint-Aubin BP48 91192 Gif-sur-Yvette Cedex 915
France 916
d InBio Department of Biotechnology Ghent University Ghent Belgium 917
918
919
Corresponding author 920
Dr Niki Baccile 921
E-mail address nikibaccilesorbonne-universitefr 922
Phone +33 1 44 27 56 77 923
924
925
926
2
a) 927
Parameter Method
Dry Matter (DM ) 996 Infrared balance 105degC
Glucose () 012 HPLC-Metacarb
Glycerol () nd HPLC-Metacarb
Free Fatty Acid content () lt001 Internal method BBEPP
GC with FID Detector
Oil () lt001 Internal method BBEPP
GC with FID Detector
Moulds (CFUg) lt10 3M-Nordval ndeg16 B
Yeasts (CFUg) lt10 3M-Nordval ndeg16 B
Anaerobic count (CFUg) lt10 SP-VG M005 B
Protein () tbd BCA protein assay
928
Figure S 1 - a) HPLC-ELSD chromatogram and composition table 929
930
931
932
933
3
b) 934
935
Group Ndeg δ ppm
CH2 1 354
CH2 2 153
CH2 3-712-14 132
CH2 811 203
CH 910 534
CH2 15 162
CH2 16 388
CH 1 424
CH 2 316
CH 3 334
CH 4 329
CH 5 354
CH2 6 366
Figure S 1 (next) ndash b) 1H NMR spectrum (MeOD-d4) recorded on the purified G-C181-OH compounds 936
and related assignment 937
938
2
811910 1rsquo
5rsquo1
3rsquo4rsquo
1rsquo1910
asymp asymp asympHDO MeOD Acetone
6rsquo2rsquo
1615
3-712-14
4
939
940
Figure S 2 ndash Cryo-TEM images recorded for a 5 mgmL G-C181-OH aqueous solution heat at T= 130degC 941
5
942
943
Figure S 3 - Cryo-TEM images recorded for a 5 mgmL G-C181-OH aqueous solution heat at T= 90degC 944
945
90degC
1
22
6
946
947
948
949
Figure S 4 ndash Cryo-TEM images recorded for a 5 mgmL G-C181-OH aqueous solution heat at T= 70degC 950
951
21
11
1
2
5
3
4
45
5
6
7
7
7
952
953
954
Figure S 5 ndash Cryo-TEM images recorded for a 5 mgmL G-C181-OH aqueous solution heat at T= 25degC 955
956
957
1
1 1
8
958
Figure S 6 ndash a) SANS experiment recorded at 90degC for a 5 mgmL G-C181-OH aqueous solution b-c) 959
WAXS experiments recorded on aqueous solutions of G-C181-OH at b) 5 mgmL and c) 25 mgmL d) 960
Structural interpretation of the repeating distances pointed out in c) 961
962
963
964
001 01 1
q Aring-1
25degC
68degC
88degC
111degC
01 1q Aring
-1
02 04 06 08 1q Aring
-1
001 01
10-1
100
101
Inte
nsity
cm
-1
q Aring-1
-2
T= 90degC
SANS WAXS WAXS
a) b) c)
dv
dL d= 144 Aring-1
di
ddH2O
dt
dvdL
dtdi d
d)
9
965
966
Figure S 7 ndash ssNMR MAS (10 kHz) experiments recorded on a G-C181-OH dry powder a) 1H spectra 967
recorded from 110degC to 70degC b) 13C single pulse (SP) spectra recorded with high power 1H decoupling from 968
110degC to 70degC c) 13C cross polarization (CP) spectra recorded at 110degC and contact time tc of 50 micros and 969
3000 micros d) 13C CP spectra recorded at 70degC and for 20 lt tc micros lt 3000 970
971
1
811
910
CH2 CH2
1rsquo
6rsquo
8 6 4 2 0 ppm
110
90
80
70
910
1rsquo
6rsquo16
1
2rsquo3rsquo4rsquo
811
OH
45 40 35 30 25 20 15
ppm
200 180 160 140 120 100 80 60 40 20 0
ppm140 120 100 80
ppm
CH2-gauche
3004
110
90
80
70
65
60
50
25
C91013003
C9 - 12869
CH2-all-trans
3198
C1rsquo10335
a) b)
1H
T degCT degC
13C Single Pulse MAS
A
B
A
B
70degC70degC
5rsquo
215
200 180 160 140 120 100 80 60 40 20 0
ppm
13C CPMAST= 110degC
200 180 160 140 120 100 80 60 40 20 0
ppm
132 131 130 129 128 127 126
ppm
106 105 104 103 102
ppm
13C CPMAST= 70degC
50
tc micros
3000
20
tc micros
50 500 1000 3000
tc micros
C102
13024 C910113003
C92
12869
C1rsquo213082
C1rsquo110443
A B
106 105 104 103 102
ppm
3000
1000
500
50
20
AB
c)
d)
10
972
Figure S 8 ndash a) Short and d) long T2 components displayed by the 1H transverse relaxation signal c) 1H 973
transverse relaxation signals recorded on a G-C181-OH dry powder from 110degC to 70degC The area of each 974
given resonance is plotted (log-lin) as a function of the echo time (CPMG pulse sequence) for each 975
temperature and fitted using the equation given above T2s and T2l indicate the short and long T2 relaxation 976
times respectively obtained by describing the 1H transverse relaxation signal using a biexponential decay 977
For H1rsquo H5rsquo and H6rsquo the 1H relaxation function could be described by a monoexponential decay 978
- Protons from the sugar group (H1rsquo H5rsquo H6rsquo) show a single T2 relaxation component (Figure 979
6c and Figure S 8) while protons of the acyl chain (CH2 H910 H811) show both short (Figure 980
6c) and long (Figure 6d) T2 relaxation component 981
- The short T2 relaxation time systematically decreases from 110degC to 70degC for all species by a 982
factor ranging from two to seven depending on the specific chemical group Very long T2 are 983
observed at 110degC for all acyl species while nearly unchanged values are measured below 984
90degC without any clear trend 985
- The sugar protons (H1rsquo H5rsquo H6rsquo) have the shortest set of T2 values (lt 1 ms) below 100degC 986
The long component of T2 generally ranges between 4 ms and 12 ms 987
0 1 2 3 4 5 6 7 8
00
05
10
15
20
25
30
35
40
45
Log
In
ten
sity
Time ms
0 1 2 3 4 5 6 7 8
00
05
10
15
20
25
30
35
40
45
Log
In
ten
sity
Time ms
0 1000 2000 3000 4000 5000 6000 7000 8000
00
05
10
15
20
25
30
35
40
45
Log
In
ten
sity
Time ms
0 1000 2000 3000 4000 5000 6000 7000 8000
00
05
10
15
20
25
30
35
40
45
Log
In
ten
sity
Time ms
0 1000 2000 3000 4000 5000 6000 7000 8000
00
05
10
15
20
25
30
35
40
45
Log
In
ten
sity
Time ms
0 1000 2000 3000 4000 5000 6000 7000 8000
00
05
10
15
20
25
30
35
40
45
Log
In
ten
sity
Time ms
H1
H8H11
H9H10
CH2
H1rsquo
H6rsquo
CH2
H910H811 H1CH2
H1rsquo H5rsquo6rsquo
0 1000 2000 3000 4000 5000 6000 7000 8000
00
05
10
15
20
25
30
35
40
45
Log
In
ten
sity
Time ms
OH
0 1000 2000 3000 4000 5000 6000 7000 8000
00
05
10
15
20
25
30
35
40
45 T= 110degC
T= 90degC
T= 80degC
T= 70degC
Log
In
ten
sity
Time ms
Fit
)
CH2 H910 H811 H1 H56 H1 OH
00
05
10
15
20
25
30
35
40
T2 m
s
T= 110degC
T= 90degC
T= 80degC
T= 70degC
CH2 H910 H811 H1
0
2
4
6
8
10
12
T2 m
s
T= 110degC
T= 90degC
T= 80degC
T= 70degC
Short T2(1H) Long T2(1H)
a) b)
c)
11
Table S 1 ndash 1H chemical shifts of G-C181-OH in solution and in the solid-state Solid-state spectra are 988
recorded at a MAS frequency of 10 kHz in DMSO-d6 broad peak 989
990
δH ppm
Group Ndeg Liquid
(MeOD-d4) Solid
(T= 110degC) Solid
(T= 70degC)
CH2 H1 354 357
CH2 H2 153 156
CH2 H3-712-14 132 135
CH2 H811 203 203
CH H910 534 534
CH2 H15 162 164
CH2 H16 388 383
CH H1 424 432
CH H2 316 335
CH H3 334 335
CH H4 329 335
CH H5 354 351 357
CH2 H6 366 383
OH OH1 432
45 463
OH OH2 492
OH OH3 490
OH OH4 487
OH OH6 445
991
992
H1H9H10H1rsquo
H6rsquo
OH2rsquo
OH1
12
Detailed discussion about the NOESY and DQ-SQ 2D 1H-1H ssNMR experiments presented in 993
Figure 9 994
995
2D 1H-1H ssNMR experiments are a unique tool to explore through-space proximities 996
between 1H nuclei ssNMR offers a large number of possibilities each adapted to a given 997
system The advantage of 2D maps with respect to a dynamics approach is their direct 998
readability in clear two nuclei which exchange their magnetization through-space (whichever 999
mechanism may be responsible for this exchange) will display a specific cross-peak However 1000
the way cross-peaks are presented and interpreted strictly depends on the nature of the pulse 1001
program which in turn is chosen according to the physical nature of the sample 1002
1D temperature-dependent 1H NMR experiments performed on G-C181-OH (Figure 1003
4a in the main text) indicate sharp peaks at 90degC and broad peaks at 70degC Narrow peaks 1004
indicate fast andor large-amplitude molecular tumbling averaging the strong 1H-1H dipolar 1005
interactions This excludes the use of pulse sequences like DQ-SQ which is not efficient under 1006
these conditions For this reason we employ spin-diffusion-based pulse sequences like 1007
NOESY which is more adapted for samples with high molecular mobility When mixing times 1008
are chosen to be short (lt 1 s) one generally explores through-space proximities within about 5 1009
10 Aring On the contrary when molecular motions are restricted dipolar coupling becomes 1010
significant 1H NMR peaks are broader and pulse sequences like DQ-SQ can now be used 1011
with a spatial resolution of less than 5 Aring 1012
Whenever possible DQ-SQ experiments are preferred over spin diffusion-based pulse 1013
sequences because they are more selective in particular for likewise interactions which are 1014
not discriminated in NOESY-type experiments This is illustrated by the typical interaction 1015
schemes for NOESY (top Figure 9a) and DQ-SQ (top Figure 9b) For two given A and B 1016
protons 2D NOESY maps will display two on-diagonal and two square-shaped symmetrical 1017
off-diagonal cross-peaks Off-diagonal cross-peaks illustrate the mutual A-B and B-A 1018
interaction but the on-diagonal peaks are systematic and do not prove any A-A or B-B 1019
interaction Similarly to NOESY 2D DQ-SQ maps display off-diagonal peaks (symmetric 1020
across the diagonal top Figure 9b) upon A-B and B-A interaction but in contrast they will 1021
display on-diagonal peaks only in the presence of self-interaction In the tutorial example of 1022
Figure 9b top the on-diagonal A-A peak indicates mutual A-A interaction while lack of on-1023
diagonal B-B peak evidences the absence of B-B proximities Combining NOESY and DQ-SQ 1024
experiments is capital to study the local arrangement of G-C181-OH and its evolution with 1025
temperature 1026
13
At T= 90degC the H1 and H5rsquo contributions are very close but possible to discriminate 1027
them (δ(H1)= 354 ppm δ(H5rsquo)= 351 ppm) according to 1H NMR chemical shifts in Table S 1028
1 2D 1H-1H NOESY in Figure 9a also discriminates between the two components attributed 1029
on the basis of the interactions with their mutual neighbors (green H1-H2 and H5rsquo-H1rsquo squares 1030
in Figure 9a) On this basis 2D NOESY does not show a direct H1rsquo-H1 correlation (blue red-1031
crossed) but rather an extensive network of intra-sugar interactions These features exclude 1032
suggest intra- and inter-sugar interactions and they exclude head-tail arrangements as a major 1033
molecular configuration at 90degC 1034
At 70degC the 1H NMR peaks are broader indicating a reduction of the T2 (1H) relaxation 1035
times andor residual homonuclear dipolar interactions excluding the use of NOESY In this 1036
case 1H-1H DQ-SQ correlation experiments are best suited Figure 9b presents the 1H-1H DQ-1037
SQ experiment on G-C181-OH at 70degC Peaks are broader than in NOESY and attribution may 1038
be cumbersome However the experiment is performed at 700 MHz and MAS= 22 kHz which 1039
improves spectral resolution with respect to the same experiment performed at 300 MHz and 1040
MAS= 10 kHz The auto-peak at δH= 356 ppm in the SQ dimension is attributed to H1-H1 spin 1041
pairs mainly resulting from intra CH2 interaction while the DQ cross-peaks at δH= 156-356 1042
ppm and δH= 432-356 ppm respectively origin from H2-H1 and H1rsquo-H1 interactions (Figure 1043
9b) DQ-SQ map does not show any auto-peak corresponding to H1rsquo-H1rsquo or Hxrsquo-Hxrsquo (x= 2rsquo 1044
3rsquo 4rsquo) interactions (red-crossed blue Figure 9b) thus excluding any proximity (lt 5 Aring) between 1045
close glucose neighbors On the contrary DQ-SQ maps (recorded both at 700 MHz Figure 9b 1046
or at 300 MHz not shown) systematically show DQ cross-peaks which can only be attributed 1047
to H1rsquo-H1 interactions (δH= 432-356) The presence of these H1rsquo-H1 interactions can only be 1048
explained by a head-tail arrangement of the G-C181-OH molecules as illustrated below the 1049
DQ-SQ map in Figure 9b 1050
1
Supporting Information 904
905
Topological connection between vesicles and nanotubes in single-906
component lipid membranes driven by head-tail interactions 907
908
Niki Baccilea Ceacutedric Lorthioira Abdoul Aziz Baa Patrick Le Griela Cristina Coelhob Javier 909
Perezc Wim Soetaertd Sophie L K W Roelantsd 910
911
a Sorbonne Universiteacute Centre National de la Recherche Scientifique Laboratoire de Chimie de 912
la Matiegravere Condenseacutee de Paris LCMCP F-75005 Paris France 913
b Institut des Mateacuteriaux de Paris Centre Sorbonne Universiteacute Paris France 914
c Synchrotron Soleil LrsquoOrme des Merisiers Saint-Aubin BP48 91192 Gif-sur-Yvette Cedex 915
France 916
d InBio Department of Biotechnology Ghent University Ghent Belgium 917
918
919
Corresponding author 920
Dr Niki Baccile 921
E-mail address nikibaccilesorbonne-universitefr 922
Phone +33 1 44 27 56 77 923
924
925
926
2
a) 927
Parameter Method
Dry Matter (DM ) 996 Infrared balance 105degC
Glucose () 012 HPLC-Metacarb
Glycerol () nd HPLC-Metacarb
Free Fatty Acid content () lt001 Internal method BBEPP
GC with FID Detector
Oil () lt001 Internal method BBEPP
GC with FID Detector
Moulds (CFUg) lt10 3M-Nordval ndeg16 B
Yeasts (CFUg) lt10 3M-Nordval ndeg16 B
Anaerobic count (CFUg) lt10 SP-VG M005 B
Protein () tbd BCA protein assay
928
Figure S 1 - a) HPLC-ELSD chromatogram and composition table 929
930
931
932
933
3
b) 934
935
Group Ndeg δ ppm
CH2 1 354
CH2 2 153
CH2 3-712-14 132
CH2 811 203
CH 910 534
CH2 15 162
CH2 16 388
CH 1 424
CH 2 316
CH 3 334
CH 4 329
CH 5 354
CH2 6 366
Figure S 1 (next) ndash b) 1H NMR spectrum (MeOD-d4) recorded on the purified G-C181-OH compounds 936
and related assignment 937
938
2
811910 1rsquo
5rsquo1
3rsquo4rsquo
1rsquo1910
asymp asymp asympHDO MeOD Acetone
6rsquo2rsquo
1615
3-712-14
4
939
940
Figure S 2 ndash Cryo-TEM images recorded for a 5 mgmL G-C181-OH aqueous solution heat at T= 130degC 941
5
942
943
Figure S 3 - Cryo-TEM images recorded for a 5 mgmL G-C181-OH aqueous solution heat at T= 90degC 944
945
90degC
1
22
6
946
947
948
949
Figure S 4 ndash Cryo-TEM images recorded for a 5 mgmL G-C181-OH aqueous solution heat at T= 70degC 950
951
21
11
1
2
5
3
4
45
5
6
7
7
7
952
953
954
Figure S 5 ndash Cryo-TEM images recorded for a 5 mgmL G-C181-OH aqueous solution heat at T= 25degC 955
956
957
1
1 1
8
958
Figure S 6 ndash a) SANS experiment recorded at 90degC for a 5 mgmL G-C181-OH aqueous solution b-c) 959
WAXS experiments recorded on aqueous solutions of G-C181-OH at b) 5 mgmL and c) 25 mgmL d) 960
Structural interpretation of the repeating distances pointed out in c) 961
962
963
964
001 01 1
q Aring-1
25degC
68degC
88degC
111degC
01 1q Aring
-1
02 04 06 08 1q Aring
-1
001 01
10-1
100
101
Inte
nsity
cm
-1
q Aring-1
-2
T= 90degC
SANS WAXS WAXS
a) b) c)
dv
dL d= 144 Aring-1
di
ddH2O
dt
dvdL
dtdi d
d)
9
965
966
Figure S 7 ndash ssNMR MAS (10 kHz) experiments recorded on a G-C181-OH dry powder a) 1H spectra 967
recorded from 110degC to 70degC b) 13C single pulse (SP) spectra recorded with high power 1H decoupling from 968
110degC to 70degC c) 13C cross polarization (CP) spectra recorded at 110degC and contact time tc of 50 micros and 969
3000 micros d) 13C CP spectra recorded at 70degC and for 20 lt tc micros lt 3000 970
971
1
811
910
CH2 CH2
1rsquo
6rsquo
8 6 4 2 0 ppm
110
90
80
70
910
1rsquo
6rsquo16
1
2rsquo3rsquo4rsquo
811
OH
45 40 35 30 25 20 15
ppm
200 180 160 140 120 100 80 60 40 20 0
ppm140 120 100 80
ppm
CH2-gauche
3004
110
90
80
70
65
60
50
25
C91013003
C9 - 12869
CH2-all-trans
3198
C1rsquo10335
a) b)
1H
T degCT degC
13C Single Pulse MAS
A
B
A
B
70degC70degC
5rsquo
215
200 180 160 140 120 100 80 60 40 20 0
ppm
13C CPMAST= 110degC
200 180 160 140 120 100 80 60 40 20 0
ppm
132 131 130 129 128 127 126
ppm
106 105 104 103 102
ppm
13C CPMAST= 70degC
50
tc micros
3000
20
tc micros
50 500 1000 3000
tc micros
C102
13024 C910113003
C92
12869
C1rsquo213082
C1rsquo110443
A B
106 105 104 103 102
ppm
3000
1000
500
50
20
AB
c)
d)
10
972
Figure S 8 ndash a) Short and d) long T2 components displayed by the 1H transverse relaxation signal c) 1H 973
transverse relaxation signals recorded on a G-C181-OH dry powder from 110degC to 70degC The area of each 974
given resonance is plotted (log-lin) as a function of the echo time (CPMG pulse sequence) for each 975
temperature and fitted using the equation given above T2s and T2l indicate the short and long T2 relaxation 976
times respectively obtained by describing the 1H transverse relaxation signal using a biexponential decay 977
For H1rsquo H5rsquo and H6rsquo the 1H relaxation function could be described by a monoexponential decay 978
- Protons from the sugar group (H1rsquo H5rsquo H6rsquo) show a single T2 relaxation component (Figure 979
6c and Figure S 8) while protons of the acyl chain (CH2 H910 H811) show both short (Figure 980
6c) and long (Figure 6d) T2 relaxation component 981
- The short T2 relaxation time systematically decreases from 110degC to 70degC for all species by a 982
factor ranging from two to seven depending on the specific chemical group Very long T2 are 983
observed at 110degC for all acyl species while nearly unchanged values are measured below 984
90degC without any clear trend 985
- The sugar protons (H1rsquo H5rsquo H6rsquo) have the shortest set of T2 values (lt 1 ms) below 100degC 986
The long component of T2 generally ranges between 4 ms and 12 ms 987
0 1 2 3 4 5 6 7 8
00
05
10
15
20
25
30
35
40
45
Log
In
ten
sity
Time ms
0 1 2 3 4 5 6 7 8
00
05
10
15
20
25
30
35
40
45
Log
In
ten
sity
Time ms
0 1000 2000 3000 4000 5000 6000 7000 8000
00
05
10
15
20
25
30
35
40
45
Log
In
ten
sity
Time ms
0 1000 2000 3000 4000 5000 6000 7000 8000
00
05
10
15
20
25
30
35
40
45
Log
In
ten
sity
Time ms
0 1000 2000 3000 4000 5000 6000 7000 8000
00
05
10
15
20
25
30
35
40
45
Log
In
ten
sity
Time ms
0 1000 2000 3000 4000 5000 6000 7000 8000
00
05
10
15
20
25
30
35
40
45
Log
In
ten
sity
Time ms
H1
H8H11
H9H10
CH2
H1rsquo
H6rsquo
CH2
H910H811 H1CH2
H1rsquo H5rsquo6rsquo
0 1000 2000 3000 4000 5000 6000 7000 8000
00
05
10
15
20
25
30
35
40
45
Log
In
ten
sity
Time ms
OH
0 1000 2000 3000 4000 5000 6000 7000 8000
00
05
10
15
20
25
30
35
40
45 T= 110degC
T= 90degC
T= 80degC
T= 70degC
Log
In
ten
sity
Time ms
Fit
)
CH2 H910 H811 H1 H56 H1 OH
00
05
10
15
20
25
30
35
40
T2 m
s
T= 110degC
T= 90degC
T= 80degC
T= 70degC
CH2 H910 H811 H1
0
2
4
6
8
10
12
T2 m
s
T= 110degC
T= 90degC
T= 80degC
T= 70degC
Short T2(1H) Long T2(1H)
a) b)
c)
11
Table S 1 ndash 1H chemical shifts of G-C181-OH in solution and in the solid-state Solid-state spectra are 988
recorded at a MAS frequency of 10 kHz in DMSO-d6 broad peak 989
990
δH ppm
Group Ndeg Liquid
(MeOD-d4) Solid
(T= 110degC) Solid
(T= 70degC)
CH2 H1 354 357
CH2 H2 153 156
CH2 H3-712-14 132 135
CH2 H811 203 203
CH H910 534 534
CH2 H15 162 164
CH2 H16 388 383
CH H1 424 432
CH H2 316 335
CH H3 334 335
CH H4 329 335
CH H5 354 351 357
CH2 H6 366 383
OH OH1 432
45 463
OH OH2 492
OH OH3 490
OH OH4 487
OH OH6 445
991
992
H1H9H10H1rsquo
H6rsquo
OH2rsquo
OH1
12
Detailed discussion about the NOESY and DQ-SQ 2D 1H-1H ssNMR experiments presented in 993
Figure 9 994
995
2D 1H-1H ssNMR experiments are a unique tool to explore through-space proximities 996
between 1H nuclei ssNMR offers a large number of possibilities each adapted to a given 997
system The advantage of 2D maps with respect to a dynamics approach is their direct 998
readability in clear two nuclei which exchange their magnetization through-space (whichever 999
mechanism may be responsible for this exchange) will display a specific cross-peak However 1000
the way cross-peaks are presented and interpreted strictly depends on the nature of the pulse 1001
program which in turn is chosen according to the physical nature of the sample 1002
1D temperature-dependent 1H NMR experiments performed on G-C181-OH (Figure 1003
4a in the main text) indicate sharp peaks at 90degC and broad peaks at 70degC Narrow peaks 1004
indicate fast andor large-amplitude molecular tumbling averaging the strong 1H-1H dipolar 1005
interactions This excludes the use of pulse sequences like DQ-SQ which is not efficient under 1006
these conditions For this reason we employ spin-diffusion-based pulse sequences like 1007
NOESY which is more adapted for samples with high molecular mobility When mixing times 1008
are chosen to be short (lt 1 s) one generally explores through-space proximities within about 5 1009
10 Aring On the contrary when molecular motions are restricted dipolar coupling becomes 1010
significant 1H NMR peaks are broader and pulse sequences like DQ-SQ can now be used 1011
with a spatial resolution of less than 5 Aring 1012
Whenever possible DQ-SQ experiments are preferred over spin diffusion-based pulse 1013
sequences because they are more selective in particular for likewise interactions which are 1014
not discriminated in NOESY-type experiments This is illustrated by the typical interaction 1015
schemes for NOESY (top Figure 9a) and DQ-SQ (top Figure 9b) For two given A and B 1016
protons 2D NOESY maps will display two on-diagonal and two square-shaped symmetrical 1017
off-diagonal cross-peaks Off-diagonal cross-peaks illustrate the mutual A-B and B-A 1018
interaction but the on-diagonal peaks are systematic and do not prove any A-A or B-B 1019
interaction Similarly to NOESY 2D DQ-SQ maps display off-diagonal peaks (symmetric 1020
across the diagonal top Figure 9b) upon A-B and B-A interaction but in contrast they will 1021
display on-diagonal peaks only in the presence of self-interaction In the tutorial example of 1022
Figure 9b top the on-diagonal A-A peak indicates mutual A-A interaction while lack of on-1023
diagonal B-B peak evidences the absence of B-B proximities Combining NOESY and DQ-SQ 1024
experiments is capital to study the local arrangement of G-C181-OH and its evolution with 1025
temperature 1026
13
At T= 90degC the H1 and H5rsquo contributions are very close but possible to discriminate 1027
them (δ(H1)= 354 ppm δ(H5rsquo)= 351 ppm) according to 1H NMR chemical shifts in Table S 1028
1 2D 1H-1H NOESY in Figure 9a also discriminates between the two components attributed 1029
on the basis of the interactions with their mutual neighbors (green H1-H2 and H5rsquo-H1rsquo squares 1030
in Figure 9a) On this basis 2D NOESY does not show a direct H1rsquo-H1 correlation (blue red-1031
crossed) but rather an extensive network of intra-sugar interactions These features exclude 1032
suggest intra- and inter-sugar interactions and they exclude head-tail arrangements as a major 1033
molecular configuration at 90degC 1034
At 70degC the 1H NMR peaks are broader indicating a reduction of the T2 (1H) relaxation 1035
times andor residual homonuclear dipolar interactions excluding the use of NOESY In this 1036
case 1H-1H DQ-SQ correlation experiments are best suited Figure 9b presents the 1H-1H DQ-1037
SQ experiment on G-C181-OH at 70degC Peaks are broader than in NOESY and attribution may 1038
be cumbersome However the experiment is performed at 700 MHz and MAS= 22 kHz which 1039
improves spectral resolution with respect to the same experiment performed at 300 MHz and 1040
MAS= 10 kHz The auto-peak at δH= 356 ppm in the SQ dimension is attributed to H1-H1 spin 1041
pairs mainly resulting from intra CH2 interaction while the DQ cross-peaks at δH= 156-356 1042
ppm and δH= 432-356 ppm respectively origin from H2-H1 and H1rsquo-H1 interactions (Figure 1043
9b) DQ-SQ map does not show any auto-peak corresponding to H1rsquo-H1rsquo or Hxrsquo-Hxrsquo (x= 2rsquo 1044
3rsquo 4rsquo) interactions (red-crossed blue Figure 9b) thus excluding any proximity (lt 5 Aring) between 1045
close glucose neighbors On the contrary DQ-SQ maps (recorded both at 700 MHz Figure 9b 1046
or at 300 MHz not shown) systematically show DQ cross-peaks which can only be attributed 1047
to H1rsquo-H1 interactions (δH= 432-356) The presence of these H1rsquo-H1 interactions can only be 1048
explained by a head-tail arrangement of the G-C181-OH molecules as illustrated below the 1049
DQ-SQ map in Figure 9b 1050

2
a) 927
Parameter Method
Dry Matter (DM ) 996 Infrared balance 105degC
Glucose () 012 HPLC-Metacarb
Glycerol () nd HPLC-Metacarb
Free Fatty Acid content () lt001 Internal method BBEPP
GC with FID Detector
Oil () lt001 Internal method BBEPP
GC with FID Detector
Moulds (CFUg) lt10 3M-Nordval ndeg16 B
Yeasts (CFUg) lt10 3M-Nordval ndeg16 B
Anaerobic count (CFUg) lt10 SP-VG M005 B
Protein () tbd BCA protein assay
928
Figure S 1 - a) HPLC-ELSD chromatogram and composition table 929
930
931
932
933
3
b) 934
935
Group Ndeg δ ppm
CH2 1 354
CH2 2 153
CH2 3-712-14 132
CH2 811 203
CH 910 534
CH2 15 162
CH2 16 388
CH 1 424
CH 2 316
CH 3 334
CH 4 329
CH 5 354
CH2 6 366
Figure S 1 (next) ndash b) 1H NMR spectrum (MeOD-d4) recorded on the purified G-C181-OH compounds 936
and related assignment 937
938
2
811910 1rsquo
5rsquo1
3rsquo4rsquo
1rsquo1910
asymp asymp asympHDO MeOD Acetone
6rsquo2rsquo
1615
3-712-14
4
939
940
Figure S 2 ndash Cryo-TEM images recorded for a 5 mgmL G-C181-OH aqueous solution heat at T= 130degC 941
5
942
943
Figure S 3 - Cryo-TEM images recorded for a 5 mgmL G-C181-OH aqueous solution heat at T= 90degC 944
945
90degC
1
22
6
946
947
948
949
Figure S 4 ndash Cryo-TEM images recorded for a 5 mgmL G-C181-OH aqueous solution heat at T= 70degC 950
951
21
11
1
2
5
3
4
45
5
6
7
7
7
952
953
954
Figure S 5 ndash Cryo-TEM images recorded for a 5 mgmL G-C181-OH aqueous solution heat at T= 25degC 955
956
957
1
1 1
8
958
Figure S 6 ndash a) SANS experiment recorded at 90degC for a 5 mgmL G-C181-OH aqueous solution b-c) 959
WAXS experiments recorded on aqueous solutions of G-C181-OH at b) 5 mgmL and c) 25 mgmL d) 960
Structural interpretation of the repeating distances pointed out in c) 961
962
963
964
001 01 1
q Aring-1
25degC
68degC
88degC
111degC
01 1q Aring
-1
02 04 06 08 1q Aring
-1
001 01
10-1
100
101
Inte
nsity
cm
-1
q Aring-1
-2
T= 90degC
SANS WAXS WAXS
a) b) c)
dv
dL d= 144 Aring-1
di
ddH2O
dt
dvdL
dtdi d
d)
9
965
966
Figure S 7 ndash ssNMR MAS (10 kHz) experiments recorded on a G-C181-OH dry powder a) 1H spectra 967
recorded from 110degC to 70degC b) 13C single pulse (SP) spectra recorded with high power 1H decoupling from 968
110degC to 70degC c) 13C cross polarization (CP) spectra recorded at 110degC and contact time tc of 50 micros and 969
3000 micros d) 13C CP spectra recorded at 70degC and for 20 lt tc micros lt 3000 970
971
1
811
910
CH2 CH2
1rsquo
6rsquo
8 6 4 2 0 ppm
110
90
80
70
910
1rsquo
6rsquo16
1
2rsquo3rsquo4rsquo
811
OH
45 40 35 30 25 20 15
ppm
200 180 160 140 120 100 80 60 40 20 0
ppm140 120 100 80
ppm
CH2-gauche
3004
110
90
80
70
65
60
50
25
C91013003
C9 - 12869
CH2-all-trans
3198
C1rsquo10335
a) b)
1H
T degCT degC
13C Single Pulse MAS
A
B
A
B
70degC70degC
5rsquo
215
200 180 160 140 120 100 80 60 40 20 0
ppm
13C CPMAST= 110degC
200 180 160 140 120 100 80 60 40 20 0
ppm
132 131 130 129 128 127 126
ppm
106 105 104 103 102
ppm
13C CPMAST= 70degC
50
tc micros
3000
20
tc micros
50 500 1000 3000
tc micros
C102
13024 C910113003
C92
12869
C1rsquo213082
C1rsquo110443
A B
106 105 104 103 102
ppm
3000
1000
500
50
20
AB
c)
d)
10
972
Figure S 8 ndash a) Short and d) long T2 components displayed by the 1H transverse relaxation signal c) 1H 973
transverse relaxation signals recorded on a G-C181-OH dry powder from 110degC to 70degC The area of each 974
given resonance is plotted (log-lin) as a function of the echo time (CPMG pulse sequence) for each 975
temperature and fitted using the equation given above T2s and T2l indicate the short and long T2 relaxation 976
times respectively obtained by describing the 1H transverse relaxation signal using a biexponential decay 977
For H1rsquo H5rsquo and H6rsquo the 1H relaxation function could be described by a monoexponential decay 978
- Protons from the sugar group (H1rsquo H5rsquo H6rsquo) show a single T2 relaxation component (Figure 979
6c and Figure S 8) while protons of the acyl chain (CH2 H910 H811) show both short (Figure 980
6c) and long (Figure 6d) T2 relaxation component 981
- The short T2 relaxation time systematically decreases from 110degC to 70degC for all species by a 982
factor ranging from two to seven depending on the specific chemical group Very long T2 are 983
observed at 110degC for all acyl species while nearly unchanged values are measured below 984
90degC without any clear trend 985
- The sugar protons (H1rsquo H5rsquo H6rsquo) have the shortest set of T2 values (lt 1 ms) below 100degC 986
The long component of T2 generally ranges between 4 ms and 12 ms 987
0 1 2 3 4 5 6 7 8
00
05
10
15
20
25
30
35
40
45
Log
In
ten
sity
Time ms
0 1 2 3 4 5 6 7 8
00
05
10
15
20
25
30
35
40
45
Log
In
ten
sity
Time ms
0 1000 2000 3000 4000 5000 6000 7000 8000
00
05
10
15
20
25
30
35
40
45
Log
In
ten
sity
Time ms
0 1000 2000 3000 4000 5000 6000 7000 8000
00
05
10
15
20
25
30
35
40
45
Log
In
ten
sity
Time ms
0 1000 2000 3000 4000 5000 6000 7000 8000
00
05
10
15
20
25
30
35
40
45
Log
In
ten
sity
Time ms
0 1000 2000 3000 4000 5000 6000 7000 8000
00
05
10
15
20
25
30
35
40
45
Log
In
ten
sity
Time ms
H1
H8H11
H9H10
CH2
H1rsquo
H6rsquo
CH2
H910H811 H1CH2
H1rsquo H5rsquo6rsquo
0 1000 2000 3000 4000 5000 6000 7000 8000
00
05
10
15
20
25
30
35
40
45
Log
In
ten
sity
Time ms
OH
0 1000 2000 3000 4000 5000 6000 7000 8000
00
05
10
15
20
25
30
35
40
45 T= 110degC
T= 90degC
T= 80degC
T= 70degC
Log
In
ten
sity
Time ms
Fit
)
CH2 H910 H811 H1 H56 H1 OH
00
05
10
15
20
25
30
35
40
T2 m
s
T= 110degC
T= 90degC
T= 80degC
T= 70degC
CH2 H910 H811 H1
0
2
4
6
8
10
12
T2 m
s
T= 110degC
T= 90degC
T= 80degC
T= 70degC
Short T2(1H) Long T2(1H)
a) b)
c)
11
Table S 1 ndash 1H chemical shifts of G-C181-OH in solution and in the solid-state Solid-state spectra are 988
recorded at a MAS frequency of 10 kHz in DMSO-d6 broad peak 989
990
δH ppm
Group Ndeg Liquid
(MeOD-d4) Solid
(T= 110degC) Solid
(T= 70degC)
CH2 H1 354 357
CH2 H2 153 156
CH2 H3-712-14 132 135
CH2 H811 203 203
CH H910 534 534
CH2 H15 162 164
CH2 H16 388 383
CH H1 424 432
CH H2 316 335
CH H3 334 335
CH H4 329 335
CH H5 354 351 357
CH2 H6 366 383
OH OH1 432
45 463
OH OH2 492
OH OH3 490
OH OH4 487
OH OH6 445
991
992
H1H9H10H1rsquo
H6rsquo
OH2rsquo
OH1
12
Detailed discussion about the NOESY and DQ-SQ 2D 1H-1H ssNMR experiments presented in 993
Figure 9 994
995
2D 1H-1H ssNMR experiments are a unique tool to explore through-space proximities 996
between 1H nuclei ssNMR offers a large number of possibilities each adapted to a given 997
system The advantage of 2D maps with respect to a dynamics approach is their direct 998
readability in clear two nuclei which exchange their magnetization through-space (whichever 999
mechanism may be responsible for this exchange) will display a specific cross-peak However 1000
the way cross-peaks are presented and interpreted strictly depends on the nature of the pulse 1001
program which in turn is chosen according to the physical nature of the sample 1002
1D temperature-dependent 1H NMR experiments performed on G-C181-OH (Figure 1003
4a in the main text) indicate sharp peaks at 90degC and broad peaks at 70degC Narrow peaks 1004
indicate fast andor large-amplitude molecular tumbling averaging the strong 1H-1H dipolar 1005
interactions This excludes the use of pulse sequences like DQ-SQ which is not efficient under 1006
these conditions For this reason we employ spin-diffusion-based pulse sequences like 1007
NOESY which is more adapted for samples with high molecular mobility When mixing times 1008
are chosen to be short (lt 1 s) one generally explores through-space proximities within about 5 1009
10 Aring On the contrary when molecular motions are restricted dipolar coupling becomes 1010
significant 1H NMR peaks are broader and pulse sequences like DQ-SQ can now be used 1011
with a spatial resolution of less than 5 Aring 1012
Whenever possible DQ-SQ experiments are preferred over spin diffusion-based pulse 1013
sequences because they are more selective in particular for likewise interactions which are 1014
not discriminated in NOESY-type experiments This is illustrated by the typical interaction 1015
schemes for NOESY (top Figure 9a) and DQ-SQ (top Figure 9b) For two given A and B 1016
protons 2D NOESY maps will display two on-diagonal and two square-shaped symmetrical 1017
off-diagonal cross-peaks Off-diagonal cross-peaks illustrate the mutual A-B and B-A 1018
interaction but the on-diagonal peaks are systematic and do not prove any A-A or B-B 1019
interaction Similarly to NOESY 2D DQ-SQ maps display off-diagonal peaks (symmetric 1020
across the diagonal top Figure 9b) upon A-B and B-A interaction but in contrast they will 1021
display on-diagonal peaks only in the presence of self-interaction In the tutorial example of 1022
Figure 9b top the on-diagonal A-A peak indicates mutual A-A interaction while lack of on-1023
diagonal B-B peak evidences the absence of B-B proximities Combining NOESY and DQ-SQ 1024
experiments is capital to study the local arrangement of G-C181-OH and its evolution with 1025
temperature 1026
13
At T= 90degC the H1 and H5rsquo contributions are very close but possible to discriminate 1027
them (δ(H1)= 354 ppm δ(H5rsquo)= 351 ppm) according to 1H NMR chemical shifts in Table S 1028
1 2D 1H-1H NOESY in Figure 9a also discriminates between the two components attributed 1029
on the basis of the interactions with their mutual neighbors (green H1-H2 and H5rsquo-H1rsquo squares 1030
in Figure 9a) On this basis 2D NOESY does not show a direct H1rsquo-H1 correlation (blue red-1031
crossed) but rather an extensive network of intra-sugar interactions These features exclude 1032
suggest intra- and inter-sugar interactions and they exclude head-tail arrangements as a major 1033
molecular configuration at 90degC 1034
At 70degC the 1H NMR peaks are broader indicating a reduction of the T2 (1H) relaxation 1035
times andor residual homonuclear dipolar interactions excluding the use of NOESY In this 1036
case 1H-1H DQ-SQ correlation experiments are best suited Figure 9b presents the 1H-1H DQ-1037
SQ experiment on G-C181-OH at 70degC Peaks are broader than in NOESY and attribution may 1038
be cumbersome However the experiment is performed at 700 MHz and MAS= 22 kHz which 1039
improves spectral resolution with respect to the same experiment performed at 300 MHz and 1040
MAS= 10 kHz The auto-peak at δH= 356 ppm in the SQ dimension is attributed to H1-H1 spin 1041
pairs mainly resulting from intra CH2 interaction while the DQ cross-peaks at δH= 156-356 1042
ppm and δH= 432-356 ppm respectively origin from H2-H1 and H1rsquo-H1 interactions (Figure 1043
9b) DQ-SQ map does not show any auto-peak corresponding to H1rsquo-H1rsquo or Hxrsquo-Hxrsquo (x= 2rsquo 1044
3rsquo 4rsquo) interactions (red-crossed blue Figure 9b) thus excluding any proximity (lt 5 Aring) between 1045
close glucose neighbors On the contrary DQ-SQ maps (recorded both at 700 MHz Figure 9b 1046
or at 300 MHz not shown) systematically show DQ cross-peaks which can only be attributed 1047
to H1rsquo-H1 interactions (δH= 432-356) The presence of these H1rsquo-H1 interactions can only be 1048
explained by a head-tail arrangement of the G-C181-OH molecules as illustrated below the 1049
DQ-SQ map in Figure 9b 1050

3
b) 934
935
Group Ndeg δ ppm
CH2 1 354
CH2 2 153
CH2 3-712-14 132
CH2 811 203
CH 910 534
CH2 15 162
CH2 16 388
CH 1 424
CH 2 316
CH 3 334
CH 4 329
CH 5 354
CH2 6 366
Figure S 1 (next) ndash b) 1H NMR spectrum (MeOD-d4) recorded on the purified G-C181-OH compounds 936
and related assignment 937
938
2
811910 1rsquo
5rsquo1
3rsquo4rsquo
1rsquo1910
asymp asymp asympHDO MeOD Acetone
6rsquo2rsquo
1615
3-712-14
4
939
940
Figure S 2 ndash Cryo-TEM images recorded for a 5 mgmL G-C181-OH aqueous solution heat at T= 130degC 941
5
942
943
Figure S 3 - Cryo-TEM images recorded for a 5 mgmL G-C181-OH aqueous solution heat at T= 90degC 944
945
90degC
1
22
6
946
947
948
949
Figure S 4 ndash Cryo-TEM images recorded for a 5 mgmL G-C181-OH aqueous solution heat at T= 70degC 950
951
21
11
1
2
5
3
4
45
5
6
7
7
7
952
953
954
Figure S 5 ndash Cryo-TEM images recorded for a 5 mgmL G-C181-OH aqueous solution heat at T= 25degC 955
956
957
1
1 1
8
958
Figure S 6 ndash a) SANS experiment recorded at 90degC for a 5 mgmL G-C181-OH aqueous solution b-c) 959
WAXS experiments recorded on aqueous solutions of G-C181-OH at b) 5 mgmL and c) 25 mgmL d) 960
Structural interpretation of the repeating distances pointed out in c) 961
962
963
964
001 01 1
q Aring-1
25degC
68degC
88degC
111degC
01 1q Aring
-1
02 04 06 08 1q Aring
-1
001 01
10-1
100
101
Inte
nsity
cm
-1
q Aring-1
-2
T= 90degC
SANS WAXS WAXS
a) b) c)
dv
dL d= 144 Aring-1
di
ddH2O
dt
dvdL
dtdi d
d)
9
965
966
Figure S 7 ndash ssNMR MAS (10 kHz) experiments recorded on a G-C181-OH dry powder a) 1H spectra 967
recorded from 110degC to 70degC b) 13C single pulse (SP) spectra recorded with high power 1H decoupling from 968
110degC to 70degC c) 13C cross polarization (CP) spectra recorded at 110degC and contact time tc of 50 micros and 969
3000 micros d) 13C CP spectra recorded at 70degC and for 20 lt tc micros lt 3000 970
971
1
811
910
CH2 CH2
1rsquo
6rsquo
8 6 4 2 0 ppm
110
90
80
70
910
1rsquo
6rsquo16
1
2rsquo3rsquo4rsquo
811
OH
45 40 35 30 25 20 15
ppm
200 180 160 140 120 100 80 60 40 20 0
ppm140 120 100 80
ppm
CH2-gauche
3004
110
90
80
70
65
60
50
25
C91013003
C9 - 12869
CH2-all-trans
3198
C1rsquo10335
a) b)
1H
T degCT degC
13C Single Pulse MAS
A
B
A
B
70degC70degC
5rsquo
215
200 180 160 140 120 100 80 60 40 20 0
ppm
13C CPMAST= 110degC
200 180 160 140 120 100 80 60 40 20 0
ppm
132 131 130 129 128 127 126
ppm
106 105 104 103 102
ppm
13C CPMAST= 70degC
50
tc micros
3000
20
tc micros
50 500 1000 3000
tc micros
C102
13024 C910113003
C92
12869
C1rsquo213082
C1rsquo110443
A B
106 105 104 103 102
ppm
3000
1000
500
50
20
AB
c)
d)
10
972
Figure S 8 ndash a) Short and d) long T2 components displayed by the 1H transverse relaxation signal c) 1H 973
transverse relaxation signals recorded on a G-C181-OH dry powder from 110degC to 70degC The area of each 974
given resonance is plotted (log-lin) as a function of the echo time (CPMG pulse sequence) for each 975
temperature and fitted using the equation given above T2s and T2l indicate the short and long T2 relaxation 976
times respectively obtained by describing the 1H transverse relaxation signal using a biexponential decay 977
For H1rsquo H5rsquo and H6rsquo the 1H relaxation function could be described by a monoexponential decay 978
- Protons from the sugar group (H1rsquo H5rsquo H6rsquo) show a single T2 relaxation component (Figure 979
6c and Figure S 8) while protons of the acyl chain (CH2 H910 H811) show both short (Figure 980
6c) and long (Figure 6d) T2 relaxation component 981
- The short T2 relaxation time systematically decreases from 110degC to 70degC for all species by a 982
factor ranging from two to seven depending on the specific chemical group Very long T2 are 983
observed at 110degC for all acyl species while nearly unchanged values are measured below 984
90degC without any clear trend 985
- The sugar protons (H1rsquo H5rsquo H6rsquo) have the shortest set of T2 values (lt 1 ms) below 100degC 986
The long component of T2 generally ranges between 4 ms and 12 ms 987
0 1 2 3 4 5 6 7 8
00
05
10
15
20
25
30
35
40
45
Log
In
ten
sity
Time ms
0 1 2 3 4 5 6 7 8
00
05
10
15
20
25
30
35
40
45
Log
In
ten
sity
Time ms
0 1000 2000 3000 4000 5000 6000 7000 8000
00
05
10
15
20
25
30
35
40
45
Log
In
ten
sity
Time ms
0 1000 2000 3000 4000 5000 6000 7000 8000
00
05
10
15
20
25
30
35
40
45
Log
In
ten
sity
Time ms
0 1000 2000 3000 4000 5000 6000 7000 8000
00
05
10
15
20
25
30
35
40
45
Log
In
ten
sity
Time ms
0 1000 2000 3000 4000 5000 6000 7000 8000
00
05
10
15
20
25
30
35
40
45
Log
In
ten
sity
Time ms
H1
H8H11
H9H10
CH2
H1rsquo
H6rsquo
CH2
H910H811 H1CH2
H1rsquo H5rsquo6rsquo
0 1000 2000 3000 4000 5000 6000 7000 8000
00
05
10
15
20
25
30
35
40
45
Log
In
ten
sity
Time ms
OH
0 1000 2000 3000 4000 5000 6000 7000 8000
00
05
10
15
20
25
30
35
40
45 T= 110degC
T= 90degC
T= 80degC
T= 70degC
Log
In
ten
sity
Time ms
Fit
)
CH2 H910 H811 H1 H56 H1 OH
00
05
10
15
20
25
30
35
40
T2 m
s
T= 110degC
T= 90degC
T= 80degC
T= 70degC
CH2 H910 H811 H1
0
2
4
6
8
10
12
T2 m
s
T= 110degC
T= 90degC
T= 80degC
T= 70degC
Short T2(1H) Long T2(1H)
a) b)
c)
11
Table S 1 ndash 1H chemical shifts of G-C181-OH in solution and in the solid-state Solid-state spectra are 988
recorded at a MAS frequency of 10 kHz in DMSO-d6 broad peak 989
990
δH ppm
Group Ndeg Liquid
(MeOD-d4) Solid
(T= 110degC) Solid
(T= 70degC)
CH2 H1 354 357
CH2 H2 153 156
CH2 H3-712-14 132 135
CH2 H811 203 203
CH H910 534 534
CH2 H15 162 164
CH2 H16 388 383
CH H1 424 432
CH H2 316 335
CH H3 334 335
CH H4 329 335
CH H5 354 351 357
CH2 H6 366 383
OH OH1 432
45 463
OH OH2 492
OH OH3 490
OH OH4 487
OH OH6 445
991
992
H1H9H10H1rsquo
H6rsquo
OH2rsquo
OH1
12
Detailed discussion about the NOESY and DQ-SQ 2D 1H-1H ssNMR experiments presented in 993
Figure 9 994
995
2D 1H-1H ssNMR experiments are a unique tool to explore through-space proximities 996
between 1H nuclei ssNMR offers a large number of possibilities each adapted to a given 997
system The advantage of 2D maps with respect to a dynamics approach is their direct 998
readability in clear two nuclei which exchange their magnetization through-space (whichever 999
mechanism may be responsible for this exchange) will display a specific cross-peak However 1000
the way cross-peaks are presented and interpreted strictly depends on the nature of the pulse 1001
program which in turn is chosen according to the physical nature of the sample 1002
1D temperature-dependent 1H NMR experiments performed on G-C181-OH (Figure 1003
4a in the main text) indicate sharp peaks at 90degC and broad peaks at 70degC Narrow peaks 1004
indicate fast andor large-amplitude molecular tumbling averaging the strong 1H-1H dipolar 1005
interactions This excludes the use of pulse sequences like DQ-SQ which is not efficient under 1006
these conditions For this reason we employ spin-diffusion-based pulse sequences like 1007
NOESY which is more adapted for samples with high molecular mobility When mixing times 1008
are chosen to be short (lt 1 s) one generally explores through-space proximities within about 5 1009
10 Aring On the contrary when molecular motions are restricted dipolar coupling becomes 1010
significant 1H NMR peaks are broader and pulse sequences like DQ-SQ can now be used 1011
with a spatial resolution of less than 5 Aring 1012
Whenever possible DQ-SQ experiments are preferred over spin diffusion-based pulse 1013
sequences because they are more selective in particular for likewise interactions which are 1014
not discriminated in NOESY-type experiments This is illustrated by the typical interaction 1015
schemes for NOESY (top Figure 9a) and DQ-SQ (top Figure 9b) For two given A and B 1016
protons 2D NOESY maps will display two on-diagonal and two square-shaped symmetrical 1017
off-diagonal cross-peaks Off-diagonal cross-peaks illustrate the mutual A-B and B-A 1018
interaction but the on-diagonal peaks are systematic and do not prove any A-A or B-B 1019
interaction Similarly to NOESY 2D DQ-SQ maps display off-diagonal peaks (symmetric 1020
across the diagonal top Figure 9b) upon A-B and B-A interaction but in contrast they will 1021
display on-diagonal peaks only in the presence of self-interaction In the tutorial example of 1022
Figure 9b top the on-diagonal A-A peak indicates mutual A-A interaction while lack of on-1023
diagonal B-B peak evidences the absence of B-B proximities Combining NOESY and DQ-SQ 1024
experiments is capital to study the local arrangement of G-C181-OH and its evolution with 1025
temperature 1026
13
At T= 90degC the H1 and H5rsquo contributions are very close but possible to discriminate 1027
them (δ(H1)= 354 ppm δ(H5rsquo)= 351 ppm) according to 1H NMR chemical shifts in Table S 1028
1 2D 1H-1H NOESY in Figure 9a also discriminates between the two components attributed 1029
on the basis of the interactions with their mutual neighbors (green H1-H2 and H5rsquo-H1rsquo squares 1030
in Figure 9a) On this basis 2D NOESY does not show a direct H1rsquo-H1 correlation (blue red-1031
crossed) but rather an extensive network of intra-sugar interactions These features exclude 1032
suggest intra- and inter-sugar interactions and they exclude head-tail arrangements as a major 1033
molecular configuration at 90degC 1034
At 70degC the 1H NMR peaks are broader indicating a reduction of the T2 (1H) relaxation 1035
times andor residual homonuclear dipolar interactions excluding the use of NOESY In this 1036
case 1H-1H DQ-SQ correlation experiments are best suited Figure 9b presents the 1H-1H DQ-1037
SQ experiment on G-C181-OH at 70degC Peaks are broader than in NOESY and attribution may 1038
be cumbersome However the experiment is performed at 700 MHz and MAS= 22 kHz which 1039
improves spectral resolution with respect to the same experiment performed at 300 MHz and 1040
MAS= 10 kHz The auto-peak at δH= 356 ppm in the SQ dimension is attributed to H1-H1 spin 1041
pairs mainly resulting from intra CH2 interaction while the DQ cross-peaks at δH= 156-356 1042
ppm and δH= 432-356 ppm respectively origin from H2-H1 and H1rsquo-H1 interactions (Figure 1043
9b) DQ-SQ map does not show any auto-peak corresponding to H1rsquo-H1rsquo or Hxrsquo-Hxrsquo (x= 2rsquo 1044
3rsquo 4rsquo) interactions (red-crossed blue Figure 9b) thus excluding any proximity (lt 5 Aring) between 1045
close glucose neighbors On the contrary DQ-SQ maps (recorded both at 700 MHz Figure 9b 1046
or at 300 MHz not shown) systematically show DQ cross-peaks which can only be attributed 1047
to H1rsquo-H1 interactions (δH= 432-356) The presence of these H1rsquo-H1 interactions can only be 1048
explained by a head-tail arrangement of the G-C181-OH molecules as illustrated below the 1049
DQ-SQ map in Figure 9b 1050

4
939
940
Figure S 2 ndash Cryo-TEM images recorded for a 5 mgmL G-C181-OH aqueous solution heat at T= 130degC 941
5
942
943
Figure S 3 - Cryo-TEM images recorded for a 5 mgmL G-C181-OH aqueous solution heat at T= 90degC 944
945
90degC
1
22
6
946
947
948
949
Figure S 4 ndash Cryo-TEM images recorded for a 5 mgmL G-C181-OH aqueous solution heat at T= 70degC 950
951
21
11
1
2
5
3
4
45
5
6
7
7
7
952
953
954
Figure S 5 ndash Cryo-TEM images recorded for a 5 mgmL G-C181-OH aqueous solution heat at T= 25degC 955
956
957
1
1 1
8
958
Figure S 6 ndash a) SANS experiment recorded at 90degC for a 5 mgmL G-C181-OH aqueous solution b-c) 959
WAXS experiments recorded on aqueous solutions of G-C181-OH at b) 5 mgmL and c) 25 mgmL d) 960
Structural interpretation of the repeating distances pointed out in c) 961
962
963
964
001 01 1
q Aring-1
25degC
68degC
88degC
111degC
01 1q Aring
-1
02 04 06 08 1q Aring
-1
001 01
10-1
100
101
Inte
nsity
cm
-1
q Aring-1
-2
T= 90degC
SANS WAXS WAXS
a) b) c)
dv
dL d= 144 Aring-1
di
ddH2O
dt
dvdL
dtdi d
d)
9
965
966
Figure S 7 ndash ssNMR MAS (10 kHz) experiments recorded on a G-C181-OH dry powder a) 1H spectra 967
recorded from 110degC to 70degC b) 13C single pulse (SP) spectra recorded with high power 1H decoupling from 968
110degC to 70degC c) 13C cross polarization (CP) spectra recorded at 110degC and contact time tc of 50 micros and 969
3000 micros d) 13C CP spectra recorded at 70degC and for 20 lt tc micros lt 3000 970
971
1
811
910
CH2 CH2
1rsquo
6rsquo
8 6 4 2 0 ppm
110
90
80
70
910
1rsquo
6rsquo16
1
2rsquo3rsquo4rsquo
811
OH
45 40 35 30 25 20 15
ppm
200 180 160 140 120 100 80 60 40 20 0
ppm140 120 100 80
ppm
CH2-gauche
3004
110
90
80
70
65
60
50
25
C91013003
C9 - 12869
CH2-all-trans
3198
C1rsquo10335
a) b)
1H
T degCT degC
13C Single Pulse MAS
A
B
A
B
70degC70degC
5rsquo
215
200 180 160 140 120 100 80 60 40 20 0
ppm
13C CPMAST= 110degC
200 180 160 140 120 100 80 60 40 20 0
ppm
132 131 130 129 128 127 126
ppm
106 105 104 103 102
ppm
13C CPMAST= 70degC
50
tc micros
3000
20
tc micros
50 500 1000 3000
tc micros
C102
13024 C910113003
C92
12869
C1rsquo213082
C1rsquo110443
A B
106 105 104 103 102
ppm
3000
1000
500
50
20
AB
c)
d)
10
972
Figure S 8 ndash a) Short and d) long T2 components displayed by the 1H transverse relaxation signal c) 1H 973
transverse relaxation signals recorded on a G-C181-OH dry powder from 110degC to 70degC The area of each 974
given resonance is plotted (log-lin) as a function of the echo time (CPMG pulse sequence) for each 975
temperature and fitted using the equation given above T2s and T2l indicate the short and long T2 relaxation 976
times respectively obtained by describing the 1H transverse relaxation signal using a biexponential decay 977
For H1rsquo H5rsquo and H6rsquo the 1H relaxation function could be described by a monoexponential decay 978
- Protons from the sugar group (H1rsquo H5rsquo H6rsquo) show a single T2 relaxation component (Figure 979
6c and Figure S 8) while protons of the acyl chain (CH2 H910 H811) show both short (Figure 980
6c) and long (Figure 6d) T2 relaxation component 981
- The short T2 relaxation time systematically decreases from 110degC to 70degC for all species by a 982
factor ranging from two to seven depending on the specific chemical group Very long T2 are 983
observed at 110degC for all acyl species while nearly unchanged values are measured below 984
90degC without any clear trend 985
- The sugar protons (H1rsquo H5rsquo H6rsquo) have the shortest set of T2 values (lt 1 ms) below 100degC 986
The long component of T2 generally ranges between 4 ms and 12 ms 987
0 1 2 3 4 5 6 7 8
00
05
10
15
20
25
30
35
40
45
Log
In
ten
sity
Time ms
0 1 2 3 4 5 6 7 8
00
05
10
15
20
25
30
35
40
45
Log
In
ten
sity
Time ms
0 1000 2000 3000 4000 5000 6000 7000 8000
00
05
10
15
20
25
30
35
40
45
Log
In
ten
sity
Time ms
0 1000 2000 3000 4000 5000 6000 7000 8000
00
05
10
15
20
25
30
35
40
45
Log
In
ten
sity
Time ms
0 1000 2000 3000 4000 5000 6000 7000 8000
00
05
10
15
20
25
30
35
40
45
Log
In
ten
sity
Time ms
0 1000 2000 3000 4000 5000 6000 7000 8000
00
05
10
15
20
25
30
35
40
45
Log
In
ten
sity
Time ms
H1
H8H11
H9H10
CH2
H1rsquo
H6rsquo
CH2
H910H811 H1CH2
H1rsquo H5rsquo6rsquo
0 1000 2000 3000 4000 5000 6000 7000 8000
00
05
10
15
20
25
30
35
40
45
Log
In
ten
sity
Time ms
OH
0 1000 2000 3000 4000 5000 6000 7000 8000
00
05
10
15
20
25
30
35
40
45 T= 110degC
T= 90degC
T= 80degC
T= 70degC
Log
In
ten
sity
Time ms
Fit
)
CH2 H910 H811 H1 H56 H1 OH
00
05
10
15
20
25
30
35
40
T2 m
s
T= 110degC
T= 90degC
T= 80degC
T= 70degC
CH2 H910 H811 H1
0
2
4
6
8
10
12
T2 m
s
T= 110degC
T= 90degC
T= 80degC
T= 70degC
Short T2(1H) Long T2(1H)
a) b)
c)
11
Table S 1 ndash 1H chemical shifts of G-C181-OH in solution and in the solid-state Solid-state spectra are 988
recorded at a MAS frequency of 10 kHz in DMSO-d6 broad peak 989
990
δH ppm
Group Ndeg Liquid
(MeOD-d4) Solid
(T= 110degC) Solid
(T= 70degC)
CH2 H1 354 357
CH2 H2 153 156
CH2 H3-712-14 132 135
CH2 H811 203 203
CH H910 534 534
CH2 H15 162 164
CH2 H16 388 383
CH H1 424 432
CH H2 316 335
CH H3 334 335
CH H4 329 335
CH H5 354 351 357
CH2 H6 366 383
OH OH1 432
45 463
OH OH2 492
OH OH3 490
OH OH4 487
OH OH6 445
991
992
H1H9H10H1rsquo
H6rsquo
OH2rsquo
OH1
12
Detailed discussion about the NOESY and DQ-SQ 2D 1H-1H ssNMR experiments presented in 993
Figure 9 994
995
2D 1H-1H ssNMR experiments are a unique tool to explore through-space proximities 996
between 1H nuclei ssNMR offers a large number of possibilities each adapted to a given 997
system The advantage of 2D maps with respect to a dynamics approach is their direct 998
readability in clear two nuclei which exchange their magnetization through-space (whichever 999
mechanism may be responsible for this exchange) will display a specific cross-peak However 1000
the way cross-peaks are presented and interpreted strictly depends on the nature of the pulse 1001
program which in turn is chosen according to the physical nature of the sample 1002
1D temperature-dependent 1H NMR experiments performed on G-C181-OH (Figure 1003
4a in the main text) indicate sharp peaks at 90degC and broad peaks at 70degC Narrow peaks 1004
indicate fast andor large-amplitude molecular tumbling averaging the strong 1H-1H dipolar 1005
interactions This excludes the use of pulse sequences like DQ-SQ which is not efficient under 1006
these conditions For this reason we employ spin-diffusion-based pulse sequences like 1007
NOESY which is more adapted for samples with high molecular mobility When mixing times 1008
are chosen to be short (lt 1 s) one generally explores through-space proximities within about 5 1009
10 Aring On the contrary when molecular motions are restricted dipolar coupling becomes 1010
significant 1H NMR peaks are broader and pulse sequences like DQ-SQ can now be used 1011
with a spatial resolution of less than 5 Aring 1012
Whenever possible DQ-SQ experiments are preferred over spin diffusion-based pulse 1013
sequences because they are more selective in particular for likewise interactions which are 1014
not discriminated in NOESY-type experiments This is illustrated by the typical interaction 1015
schemes for NOESY (top Figure 9a) and DQ-SQ (top Figure 9b) For two given A and B 1016
protons 2D NOESY maps will display two on-diagonal and two square-shaped symmetrical 1017
off-diagonal cross-peaks Off-diagonal cross-peaks illustrate the mutual A-B and B-A 1018
interaction but the on-diagonal peaks are systematic and do not prove any A-A or B-B 1019
interaction Similarly to NOESY 2D DQ-SQ maps display off-diagonal peaks (symmetric 1020
across the diagonal top Figure 9b) upon A-B and B-A interaction but in contrast they will 1021
display on-diagonal peaks only in the presence of self-interaction In the tutorial example of 1022
Figure 9b top the on-diagonal A-A peak indicates mutual A-A interaction while lack of on-1023
diagonal B-B peak evidences the absence of B-B proximities Combining NOESY and DQ-SQ 1024
experiments is capital to study the local arrangement of G-C181-OH and its evolution with 1025
temperature 1026
13
At T= 90degC the H1 and H5rsquo contributions are very close but possible to discriminate 1027
them (δ(H1)= 354 ppm δ(H5rsquo)= 351 ppm) according to 1H NMR chemical shifts in Table S 1028
1 2D 1H-1H NOESY in Figure 9a also discriminates between the two components attributed 1029
on the basis of the interactions with their mutual neighbors (green H1-H2 and H5rsquo-H1rsquo squares 1030
in Figure 9a) On this basis 2D NOESY does not show a direct H1rsquo-H1 correlation (blue red-1031
crossed) but rather an extensive network of intra-sugar interactions These features exclude 1032
suggest intra- and inter-sugar interactions and they exclude head-tail arrangements as a major 1033
molecular configuration at 90degC 1034
At 70degC the 1H NMR peaks are broader indicating a reduction of the T2 (1H) relaxation 1035
times andor residual homonuclear dipolar interactions excluding the use of NOESY In this 1036
case 1H-1H DQ-SQ correlation experiments are best suited Figure 9b presents the 1H-1H DQ-1037
SQ experiment on G-C181-OH at 70degC Peaks are broader than in NOESY and attribution may 1038
be cumbersome However the experiment is performed at 700 MHz and MAS= 22 kHz which 1039
improves spectral resolution with respect to the same experiment performed at 300 MHz and 1040
MAS= 10 kHz The auto-peak at δH= 356 ppm in the SQ dimension is attributed to H1-H1 spin 1041
pairs mainly resulting from intra CH2 interaction while the DQ cross-peaks at δH= 156-356 1042
ppm and δH= 432-356 ppm respectively origin from H2-H1 and H1rsquo-H1 interactions (Figure 1043
9b) DQ-SQ map does not show any auto-peak corresponding to H1rsquo-H1rsquo or Hxrsquo-Hxrsquo (x= 2rsquo 1044
3rsquo 4rsquo) interactions (red-crossed blue Figure 9b) thus excluding any proximity (lt 5 Aring) between 1045
close glucose neighbors On the contrary DQ-SQ maps (recorded both at 700 MHz Figure 9b 1046
or at 300 MHz not shown) systematically show DQ cross-peaks which can only be attributed 1047
to H1rsquo-H1 interactions (δH= 432-356) The presence of these H1rsquo-H1 interactions can only be 1048
explained by a head-tail arrangement of the G-C181-OH molecules as illustrated below the 1049
DQ-SQ map in Figure 9b 1050
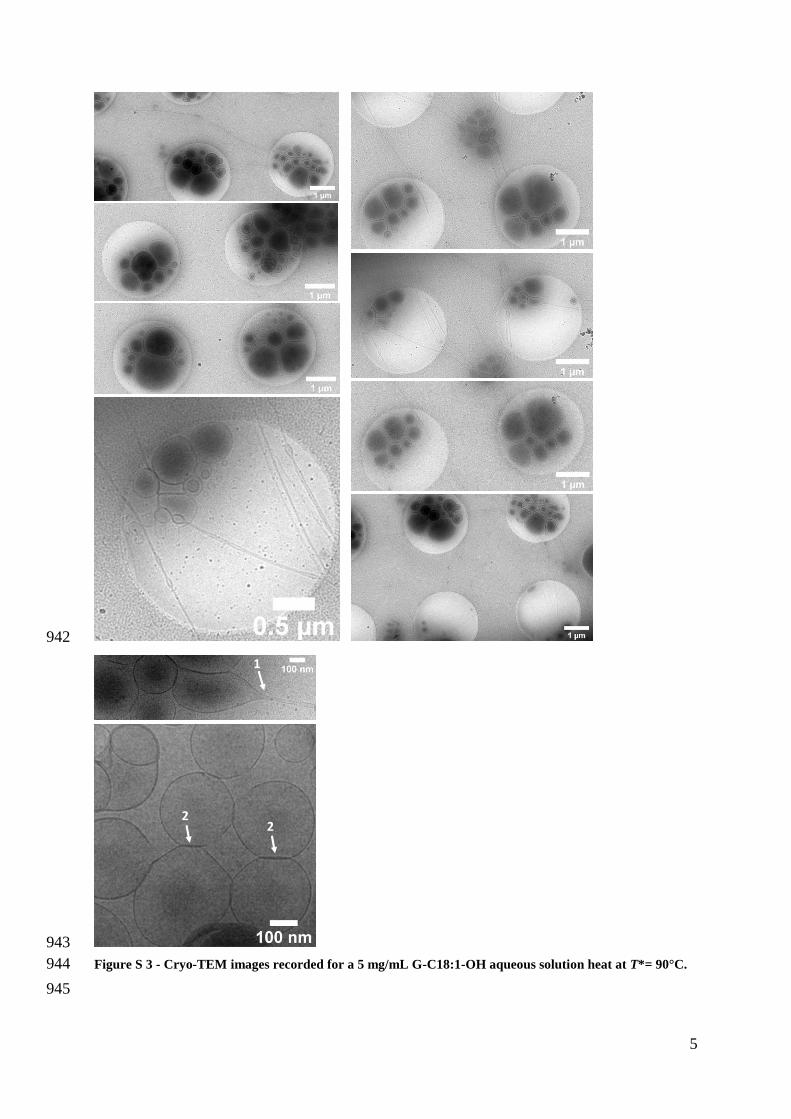
5
942
943
Figure S 3 - Cryo-TEM images recorded for a 5 mgmL G-C181-OH aqueous solution heat at T= 90degC 944
945
90degC
1
22
6
946
947
948
949
Figure S 4 ndash Cryo-TEM images recorded for a 5 mgmL G-C181-OH aqueous solution heat at T= 70degC 950
951
21
11
1
2
5
3
4
45
5
6
7
7
7
952
953
954
Figure S 5 ndash Cryo-TEM images recorded for a 5 mgmL G-C181-OH aqueous solution heat at T= 25degC 955
956
957
1
1 1
8
958
Figure S 6 ndash a) SANS experiment recorded at 90degC for a 5 mgmL G-C181-OH aqueous solution b-c) 959
WAXS experiments recorded on aqueous solutions of G-C181-OH at b) 5 mgmL and c) 25 mgmL d) 960
Structural interpretation of the repeating distances pointed out in c) 961
962
963
964
001 01 1
q Aring-1
25degC
68degC
88degC
111degC
01 1q Aring
-1
02 04 06 08 1q Aring
-1
001 01
10-1
100
101
Inte
nsity
cm
-1
q Aring-1
-2
T= 90degC
SANS WAXS WAXS
a) b) c)
dv
dL d= 144 Aring-1
di
ddH2O
dt
dvdL
dtdi d
d)
9
965
966
Figure S 7 ndash ssNMR MAS (10 kHz) experiments recorded on a G-C181-OH dry powder a) 1H spectra 967
recorded from 110degC to 70degC b) 13C single pulse (SP) spectra recorded with high power 1H decoupling from 968
110degC to 70degC c) 13C cross polarization (CP) spectra recorded at 110degC and contact time tc of 50 micros and 969
3000 micros d) 13C CP spectra recorded at 70degC and for 20 lt tc micros lt 3000 970
971
1
811
910
CH2 CH2
1rsquo
6rsquo
8 6 4 2 0 ppm
110
90
80
70
910
1rsquo
6rsquo16
1
2rsquo3rsquo4rsquo
811
OH
45 40 35 30 25 20 15
ppm
200 180 160 140 120 100 80 60 40 20 0
ppm140 120 100 80
ppm
CH2-gauche
3004
110
90
80
70
65
60
50
25
C91013003
C9 - 12869
CH2-all-trans
3198
C1rsquo10335
a) b)
1H
T degCT degC
13C Single Pulse MAS
A
B
A
B
70degC70degC
5rsquo
215
200 180 160 140 120 100 80 60 40 20 0
ppm
13C CPMAST= 110degC
200 180 160 140 120 100 80 60 40 20 0
ppm
132 131 130 129 128 127 126
ppm
106 105 104 103 102
ppm
13C CPMAST= 70degC
50
tc micros
3000
20
tc micros
50 500 1000 3000
tc micros
C102
13024 C910113003
C92
12869
C1rsquo213082
C1rsquo110443
A B
106 105 104 103 102
ppm
3000
1000
500
50
20
AB
c)
d)
10
972
Figure S 8 ndash a) Short and d) long T2 components displayed by the 1H transverse relaxation signal c) 1H 973
transverse relaxation signals recorded on a G-C181-OH dry powder from 110degC to 70degC The area of each 974
given resonance is plotted (log-lin) as a function of the echo time (CPMG pulse sequence) for each 975
temperature and fitted using the equation given above T2s and T2l indicate the short and long T2 relaxation 976
times respectively obtained by describing the 1H transverse relaxation signal using a biexponential decay 977
For H1rsquo H5rsquo and H6rsquo the 1H relaxation function could be described by a monoexponential decay 978
- Protons from the sugar group (H1rsquo H5rsquo H6rsquo) show a single T2 relaxation component (Figure 979
6c and Figure S 8) while protons of the acyl chain (CH2 H910 H811) show both short (Figure 980
6c) and long (Figure 6d) T2 relaxation component 981
- The short T2 relaxation time systematically decreases from 110degC to 70degC for all species by a 982
factor ranging from two to seven depending on the specific chemical group Very long T2 are 983
observed at 110degC for all acyl species while nearly unchanged values are measured below 984
90degC without any clear trend 985
- The sugar protons (H1rsquo H5rsquo H6rsquo) have the shortest set of T2 values (lt 1 ms) below 100degC 986
The long component of T2 generally ranges between 4 ms and 12 ms 987
0 1 2 3 4 5 6 7 8
00
05
10
15
20
25
30
35
40
45
Log
In
ten
sity
Time ms
0 1 2 3 4 5 6 7 8
00
05
10
15
20
25
30
35
40
45
Log
In
ten
sity
Time ms
0 1000 2000 3000 4000 5000 6000 7000 8000
00
05
10
15
20
25
30
35
40
45
Log
In
ten
sity
Time ms
0 1000 2000 3000 4000 5000 6000 7000 8000
00
05
10
15
20
25
30
35
40
45
Log
In
ten
sity
Time ms
0 1000 2000 3000 4000 5000 6000 7000 8000
00
05
10
15
20
25
30
35
40
45
Log
In
ten
sity
Time ms
0 1000 2000 3000 4000 5000 6000 7000 8000
00
05
10
15
20
25
30
35
40
45
Log
In
ten
sity
Time ms
H1
H8H11
H9H10
CH2
H1rsquo
H6rsquo
CH2
H910H811 H1CH2
H1rsquo H5rsquo6rsquo
0 1000 2000 3000 4000 5000 6000 7000 8000
00
05
10
15
20
25
30
35
40
45
Log
In
ten
sity
Time ms
OH
0 1000 2000 3000 4000 5000 6000 7000 8000
00
05
10
15
20
25
30
35
40
45 T= 110degC
T= 90degC
T= 80degC
T= 70degC
Log
In
ten
sity
Time ms
Fit
)
CH2 H910 H811 H1 H56 H1 OH
00
05
10
15
20
25
30
35
40
T2 m
s
T= 110degC
T= 90degC
T= 80degC
T= 70degC
CH2 H910 H811 H1
0
2
4
6
8
10
12
T2 m
s
T= 110degC
T= 90degC
T= 80degC
T= 70degC
Short T2(1H) Long T2(1H)
a) b)
c)
11
Table S 1 ndash 1H chemical shifts of G-C181-OH in solution and in the solid-state Solid-state spectra are 988
recorded at a MAS frequency of 10 kHz in DMSO-d6 broad peak 989
990
δH ppm
Group Ndeg Liquid
(MeOD-d4) Solid
(T= 110degC) Solid
(T= 70degC)
CH2 H1 354 357
CH2 H2 153 156
CH2 H3-712-14 132 135
CH2 H811 203 203
CH H910 534 534
CH2 H15 162 164
CH2 H16 388 383
CH H1 424 432
CH H2 316 335
CH H3 334 335
CH H4 329 335
CH H5 354 351 357
CH2 H6 366 383
OH OH1 432
45 463
OH OH2 492
OH OH3 490
OH OH4 487
OH OH6 445
991
992
H1H9H10H1rsquo
H6rsquo
OH2rsquo
OH1
12
Detailed discussion about the NOESY and DQ-SQ 2D 1H-1H ssNMR experiments presented in 993
Figure 9 994
995
2D 1H-1H ssNMR experiments are a unique tool to explore through-space proximities 996
between 1H nuclei ssNMR offers a large number of possibilities each adapted to a given 997
system The advantage of 2D maps with respect to a dynamics approach is their direct 998
readability in clear two nuclei which exchange their magnetization through-space (whichever 999
mechanism may be responsible for this exchange) will display a specific cross-peak However 1000
the way cross-peaks are presented and interpreted strictly depends on the nature of the pulse 1001
program which in turn is chosen according to the physical nature of the sample 1002
1D temperature-dependent 1H NMR experiments performed on G-C181-OH (Figure 1003
4a in the main text) indicate sharp peaks at 90degC and broad peaks at 70degC Narrow peaks 1004
indicate fast andor large-amplitude molecular tumbling averaging the strong 1H-1H dipolar 1005
interactions This excludes the use of pulse sequences like DQ-SQ which is not efficient under 1006
these conditions For this reason we employ spin-diffusion-based pulse sequences like 1007
NOESY which is more adapted for samples with high molecular mobility When mixing times 1008
are chosen to be short (lt 1 s) one generally explores through-space proximities within about 5 1009
10 Aring On the contrary when molecular motions are restricted dipolar coupling becomes 1010
significant 1H NMR peaks are broader and pulse sequences like DQ-SQ can now be used 1011
with a spatial resolution of less than 5 Aring 1012
Whenever possible DQ-SQ experiments are preferred over spin diffusion-based pulse 1013
sequences because they are more selective in particular for likewise interactions which are 1014
not discriminated in NOESY-type experiments This is illustrated by the typical interaction 1015
schemes for NOESY (top Figure 9a) and DQ-SQ (top Figure 9b) For two given A and B 1016
protons 2D NOESY maps will display two on-diagonal and two square-shaped symmetrical 1017
off-diagonal cross-peaks Off-diagonal cross-peaks illustrate the mutual A-B and B-A 1018
interaction but the on-diagonal peaks are systematic and do not prove any A-A or B-B 1019
interaction Similarly to NOESY 2D DQ-SQ maps display off-diagonal peaks (symmetric 1020
across the diagonal top Figure 9b) upon A-B and B-A interaction but in contrast they will 1021
display on-diagonal peaks only in the presence of self-interaction In the tutorial example of 1022
Figure 9b top the on-diagonal A-A peak indicates mutual A-A interaction while lack of on-1023
diagonal B-B peak evidences the absence of B-B proximities Combining NOESY and DQ-SQ 1024
experiments is capital to study the local arrangement of G-C181-OH and its evolution with 1025
temperature 1026
13
At T= 90degC the H1 and H5rsquo contributions are very close but possible to discriminate 1027
them (δ(H1)= 354 ppm δ(H5rsquo)= 351 ppm) according to 1H NMR chemical shifts in Table S 1028
1 2D 1H-1H NOESY in Figure 9a also discriminates between the two components attributed 1029
on the basis of the interactions with their mutual neighbors (green H1-H2 and H5rsquo-H1rsquo squares 1030
in Figure 9a) On this basis 2D NOESY does not show a direct H1rsquo-H1 correlation (blue red-1031
crossed) but rather an extensive network of intra-sugar interactions These features exclude 1032
suggest intra- and inter-sugar interactions and they exclude head-tail arrangements as a major 1033
molecular configuration at 90degC 1034
At 70degC the 1H NMR peaks are broader indicating a reduction of the T2 (1H) relaxation 1035
times andor residual homonuclear dipolar interactions excluding the use of NOESY In this 1036
case 1H-1H DQ-SQ correlation experiments are best suited Figure 9b presents the 1H-1H DQ-1037
SQ experiment on G-C181-OH at 70degC Peaks are broader than in NOESY and attribution may 1038
be cumbersome However the experiment is performed at 700 MHz and MAS= 22 kHz which 1039
improves spectral resolution with respect to the same experiment performed at 300 MHz and 1040
MAS= 10 kHz The auto-peak at δH= 356 ppm in the SQ dimension is attributed to H1-H1 spin 1041
pairs mainly resulting from intra CH2 interaction while the DQ cross-peaks at δH= 156-356 1042
ppm and δH= 432-356 ppm respectively origin from H2-H1 and H1rsquo-H1 interactions (Figure 1043
9b) DQ-SQ map does not show any auto-peak corresponding to H1rsquo-H1rsquo or Hxrsquo-Hxrsquo (x= 2rsquo 1044
3rsquo 4rsquo) interactions (red-crossed blue Figure 9b) thus excluding any proximity (lt 5 Aring) between 1045
close glucose neighbors On the contrary DQ-SQ maps (recorded both at 700 MHz Figure 9b 1046
or at 300 MHz not shown) systematically show DQ cross-peaks which can only be attributed 1047
to H1rsquo-H1 interactions (δH= 432-356) The presence of these H1rsquo-H1 interactions can only be 1048
explained by a head-tail arrangement of the G-C181-OH molecules as illustrated below the 1049
DQ-SQ map in Figure 9b 1050
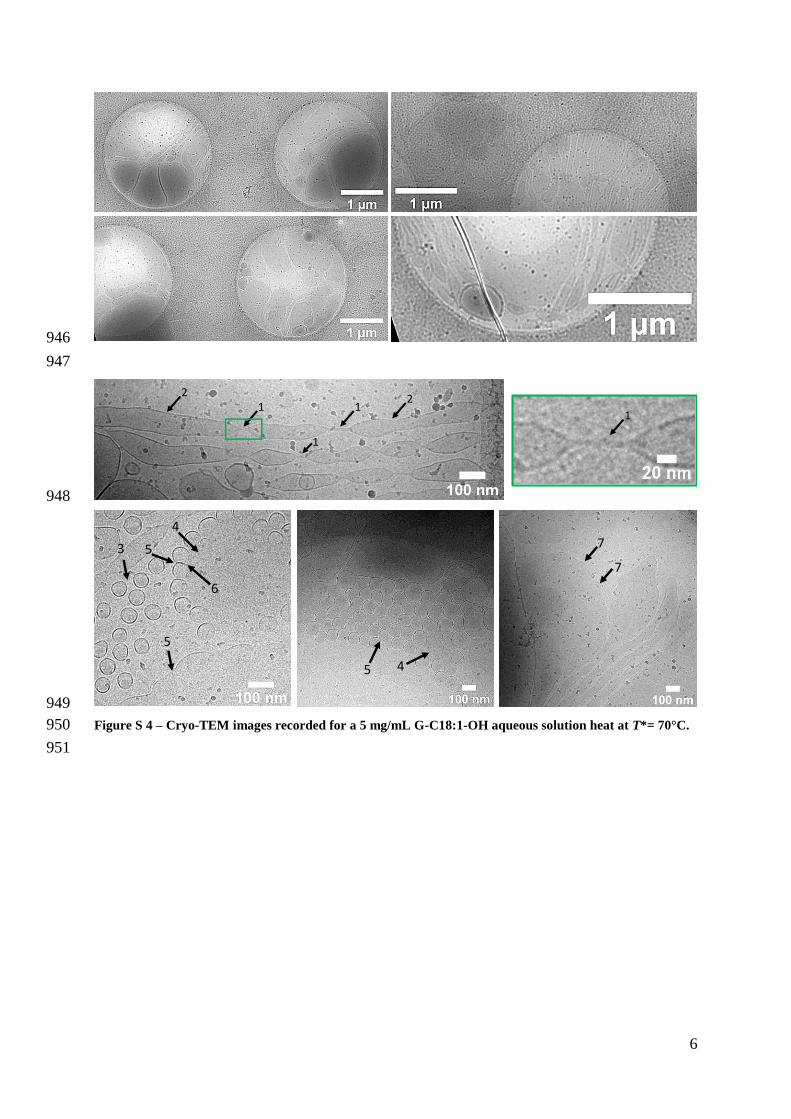
6
946
947
948
949
Figure S 4 ndash Cryo-TEM images recorded for a 5 mgmL G-C181-OH aqueous solution heat at T= 70degC 950
951
21
11
1
2
5
3
4
45
5
6
7
7
7
952
953
954
Figure S 5 ndash Cryo-TEM images recorded for a 5 mgmL G-C181-OH aqueous solution heat at T= 25degC 955
956
957
1
1 1
8
958
Figure S 6 ndash a) SANS experiment recorded at 90degC for a 5 mgmL G-C181-OH aqueous solution b-c) 959
WAXS experiments recorded on aqueous solutions of G-C181-OH at b) 5 mgmL and c) 25 mgmL d) 960
Structural interpretation of the repeating distances pointed out in c) 961
962
963
964
001 01 1
q Aring-1
25degC
68degC
88degC
111degC
01 1q Aring
-1
02 04 06 08 1q Aring
-1
001 01
10-1
100
101
Inte
nsity
cm
-1
q Aring-1
-2
T= 90degC
SANS WAXS WAXS
a) b) c)
dv
dL d= 144 Aring-1
di
ddH2O
dt
dvdL
dtdi d
d)
9
965
966
Figure S 7 ndash ssNMR MAS (10 kHz) experiments recorded on a G-C181-OH dry powder a) 1H spectra 967
recorded from 110degC to 70degC b) 13C single pulse (SP) spectra recorded with high power 1H decoupling from 968
110degC to 70degC c) 13C cross polarization (CP) spectra recorded at 110degC and contact time tc of 50 micros and 969
3000 micros d) 13C CP spectra recorded at 70degC and for 20 lt tc micros lt 3000 970
971
1
811
910
CH2 CH2
1rsquo
6rsquo
8 6 4 2 0 ppm
110
90
80
70
910
1rsquo
6rsquo16
1
2rsquo3rsquo4rsquo
811
OH
45 40 35 30 25 20 15
ppm
200 180 160 140 120 100 80 60 40 20 0
ppm140 120 100 80
ppm
CH2-gauche
3004
110
90
80
70
65
60
50
25
C91013003
C9 - 12869
CH2-all-trans
3198
C1rsquo10335
a) b)
1H
T degCT degC
13C Single Pulse MAS
A
B
A
B
70degC70degC
5rsquo
215
200 180 160 140 120 100 80 60 40 20 0
ppm
13C CPMAST= 110degC
200 180 160 140 120 100 80 60 40 20 0
ppm
132 131 130 129 128 127 126
ppm
106 105 104 103 102
ppm
13C CPMAST= 70degC
50
tc micros
3000
20
tc micros
50 500 1000 3000
tc micros
C102
13024 C910113003
C92
12869
C1rsquo213082
C1rsquo110443
A B
106 105 104 103 102
ppm
3000
1000
500
50
20
AB
c)
d)
10
972
Figure S 8 ndash a) Short and d) long T2 components displayed by the 1H transverse relaxation signal c) 1H 973
transverse relaxation signals recorded on a G-C181-OH dry powder from 110degC to 70degC The area of each 974
given resonance is plotted (log-lin) as a function of the echo time (CPMG pulse sequence) for each 975
temperature and fitted using the equation given above T2s and T2l indicate the short and long T2 relaxation 976
times respectively obtained by describing the 1H transverse relaxation signal using a biexponential decay 977
For H1rsquo H5rsquo and H6rsquo the 1H relaxation function could be described by a monoexponential decay 978
- Protons from the sugar group (H1rsquo H5rsquo H6rsquo) show a single T2 relaxation component (Figure 979
6c and Figure S 8) while protons of the acyl chain (CH2 H910 H811) show both short (Figure 980
6c) and long (Figure 6d) T2 relaxation component 981
- The short T2 relaxation time systematically decreases from 110degC to 70degC for all species by a 982
factor ranging from two to seven depending on the specific chemical group Very long T2 are 983
observed at 110degC for all acyl species while nearly unchanged values are measured below 984
90degC without any clear trend 985
- The sugar protons (H1rsquo H5rsquo H6rsquo) have the shortest set of T2 values (lt 1 ms) below 100degC 986
The long component of T2 generally ranges between 4 ms and 12 ms 987
0 1 2 3 4 5 6 7 8
00
05
10
15
20
25
30
35
40
45
Log
In
ten
sity
Time ms
0 1 2 3 4 5 6 7 8
00
05
10
15
20
25
30
35
40
45
Log
In
ten
sity
Time ms
0 1000 2000 3000 4000 5000 6000 7000 8000
00
05
10
15
20
25
30
35
40
45
Log
In
ten
sity
Time ms
0 1000 2000 3000 4000 5000 6000 7000 8000
00
05
10
15
20
25
30
35
40
45
Log
In
ten
sity
Time ms
0 1000 2000 3000 4000 5000 6000 7000 8000
00
05
10
15
20
25
30
35
40
45
Log
In
ten
sity
Time ms
0 1000 2000 3000 4000 5000 6000 7000 8000
00
05
10
15
20
25
30
35
40
45
Log
In
ten
sity
Time ms
H1
H8H11
H9H10
CH2
H1rsquo
H6rsquo
CH2
H910H811 H1CH2
H1rsquo H5rsquo6rsquo
0 1000 2000 3000 4000 5000 6000 7000 8000
00
05
10
15
20
25
30
35
40
45
Log
In
ten
sity
Time ms
OH
0 1000 2000 3000 4000 5000 6000 7000 8000
00
05
10
15
20
25
30
35
40
45 T= 110degC
T= 90degC
T= 80degC
T= 70degC
Log
In
ten
sity
Time ms
Fit
)
CH2 H910 H811 H1 H56 H1 OH
00
05
10
15
20
25
30
35
40
T2 m
s
T= 110degC
T= 90degC
T= 80degC
T= 70degC
CH2 H910 H811 H1
0
2
4
6
8
10
12
T2 m
s
T= 110degC
T= 90degC
T= 80degC
T= 70degC
Short T2(1H) Long T2(1H)
a) b)
c)
11
Table S 1 ndash 1H chemical shifts of G-C181-OH in solution and in the solid-state Solid-state spectra are 988
recorded at a MAS frequency of 10 kHz in DMSO-d6 broad peak 989
990
δH ppm
Group Ndeg Liquid
(MeOD-d4) Solid
(T= 110degC) Solid
(T= 70degC)
CH2 H1 354 357
CH2 H2 153 156
CH2 H3-712-14 132 135
CH2 H811 203 203
CH H910 534 534
CH2 H15 162 164
CH2 H16 388 383
CH H1 424 432
CH H2 316 335
CH H3 334 335
CH H4 329 335
CH H5 354 351 357
CH2 H6 366 383
OH OH1 432
45 463
OH OH2 492
OH OH3 490
OH OH4 487
OH OH6 445
991
992
H1H9H10H1rsquo
H6rsquo
OH2rsquo
OH1
12
Detailed discussion about the NOESY and DQ-SQ 2D 1H-1H ssNMR experiments presented in 993
Figure 9 994
995
2D 1H-1H ssNMR experiments are a unique tool to explore through-space proximities 996
between 1H nuclei ssNMR offers a large number of possibilities each adapted to a given 997
system The advantage of 2D maps with respect to a dynamics approach is their direct 998
readability in clear two nuclei which exchange their magnetization through-space (whichever 999
mechanism may be responsible for this exchange) will display a specific cross-peak However 1000
the way cross-peaks are presented and interpreted strictly depends on the nature of the pulse 1001
program which in turn is chosen according to the physical nature of the sample 1002
1D temperature-dependent 1H NMR experiments performed on G-C181-OH (Figure 1003
4a in the main text) indicate sharp peaks at 90degC and broad peaks at 70degC Narrow peaks 1004
indicate fast andor large-amplitude molecular tumbling averaging the strong 1H-1H dipolar 1005
interactions This excludes the use of pulse sequences like DQ-SQ which is not efficient under 1006
these conditions For this reason we employ spin-diffusion-based pulse sequences like 1007
NOESY which is more adapted for samples with high molecular mobility When mixing times 1008
are chosen to be short (lt 1 s) one generally explores through-space proximities within about 5 1009
10 Aring On the contrary when molecular motions are restricted dipolar coupling becomes 1010
significant 1H NMR peaks are broader and pulse sequences like DQ-SQ can now be used 1011
with a spatial resolution of less than 5 Aring 1012
Whenever possible DQ-SQ experiments are preferred over spin diffusion-based pulse 1013
sequences because they are more selective in particular for likewise interactions which are 1014
not discriminated in NOESY-type experiments This is illustrated by the typical interaction 1015
schemes for NOESY (top Figure 9a) and DQ-SQ (top Figure 9b) For two given A and B 1016
protons 2D NOESY maps will display two on-diagonal and two square-shaped symmetrical 1017
off-diagonal cross-peaks Off-diagonal cross-peaks illustrate the mutual A-B and B-A 1018
interaction but the on-diagonal peaks are systematic and do not prove any A-A or B-B 1019
interaction Similarly to NOESY 2D DQ-SQ maps display off-diagonal peaks (symmetric 1020
across the diagonal top Figure 9b) upon A-B and B-A interaction but in contrast they will 1021
display on-diagonal peaks only in the presence of self-interaction In the tutorial example of 1022
Figure 9b top the on-diagonal A-A peak indicates mutual A-A interaction while lack of on-1023
diagonal B-B peak evidences the absence of B-B proximities Combining NOESY and DQ-SQ 1024
experiments is capital to study the local arrangement of G-C181-OH and its evolution with 1025
temperature 1026
13
At T= 90degC the H1 and H5rsquo contributions are very close but possible to discriminate 1027
them (δ(H1)= 354 ppm δ(H5rsquo)= 351 ppm) according to 1H NMR chemical shifts in Table S 1028
1 2D 1H-1H NOESY in Figure 9a also discriminates between the two components attributed 1029
on the basis of the interactions with their mutual neighbors (green H1-H2 and H5rsquo-H1rsquo squares 1030
in Figure 9a) On this basis 2D NOESY does not show a direct H1rsquo-H1 correlation (blue red-1031
crossed) but rather an extensive network of intra-sugar interactions These features exclude 1032
suggest intra- and inter-sugar interactions and they exclude head-tail arrangements as a major 1033
molecular configuration at 90degC 1034
At 70degC the 1H NMR peaks are broader indicating a reduction of the T2 (1H) relaxation 1035
times andor residual homonuclear dipolar interactions excluding the use of NOESY In this 1036
case 1H-1H DQ-SQ correlation experiments are best suited Figure 9b presents the 1H-1H DQ-1037
SQ experiment on G-C181-OH at 70degC Peaks are broader than in NOESY and attribution may 1038
be cumbersome However the experiment is performed at 700 MHz and MAS= 22 kHz which 1039
improves spectral resolution with respect to the same experiment performed at 300 MHz and 1040
MAS= 10 kHz The auto-peak at δH= 356 ppm in the SQ dimension is attributed to H1-H1 spin 1041
pairs mainly resulting from intra CH2 interaction while the DQ cross-peaks at δH= 156-356 1042
ppm and δH= 432-356 ppm respectively origin from H2-H1 and H1rsquo-H1 interactions (Figure 1043
9b) DQ-SQ map does not show any auto-peak corresponding to H1rsquo-H1rsquo or Hxrsquo-Hxrsquo (x= 2rsquo 1044
3rsquo 4rsquo) interactions (red-crossed blue Figure 9b) thus excluding any proximity (lt 5 Aring) between 1045
close glucose neighbors On the contrary DQ-SQ maps (recorded both at 700 MHz Figure 9b 1046
or at 300 MHz not shown) systematically show DQ cross-peaks which can only be attributed 1047
to H1rsquo-H1 interactions (δH= 432-356) The presence of these H1rsquo-H1 interactions can only be 1048
explained by a head-tail arrangement of the G-C181-OH molecules as illustrated below the 1049
DQ-SQ map in Figure 9b 1050
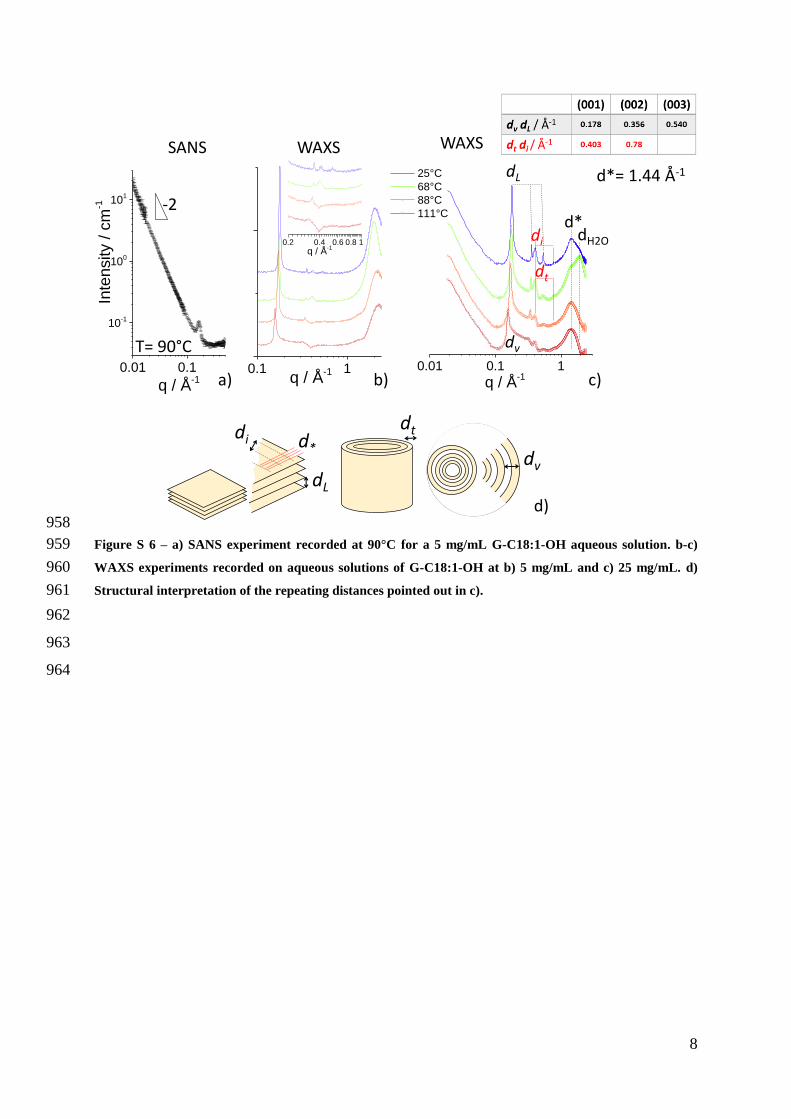
8
958
Figure S 6 ndash a) SANS experiment recorded at 90degC for a 5 mgmL G-C181-OH aqueous solution b-c) 959
WAXS experiments recorded on aqueous solutions of G-C181-OH at b) 5 mgmL and c) 25 mgmL d) 960
Structural interpretation of the repeating distances pointed out in c) 961
962
963
964
001 01 1
q Aring-1
25degC
68degC
88degC
111degC
01 1q Aring
-1
02 04 06 08 1q Aring
-1
001 01
10-1
100
101
Inte
nsity
cm
-1
q Aring-1
-2
T= 90degC
SANS WAXS WAXS
a) b) c)
dv
dL d= 144 Aring-1
di
ddH2O
dt
dvdL
dtdi d
d)
9
965
966
Figure S 7 ndash ssNMR MAS (10 kHz) experiments recorded on a G-C181-OH dry powder a) 1H spectra 967
recorded from 110degC to 70degC b) 13C single pulse (SP) spectra recorded with high power 1H decoupling from 968
110degC to 70degC c) 13C cross polarization (CP) spectra recorded at 110degC and contact time tc of 50 micros and 969
3000 micros d) 13C CP spectra recorded at 70degC and for 20 lt tc micros lt 3000 970
971
1
811
910
CH2 CH2
1rsquo
6rsquo
8 6 4 2 0 ppm
110
90
80
70
910
1rsquo
6rsquo16
1
2rsquo3rsquo4rsquo
811
OH
45 40 35 30 25 20 15
ppm
200 180 160 140 120 100 80 60 40 20 0
ppm140 120 100 80
ppm
CH2-gauche
3004
110
90
80
70
65
60
50
25
C91013003
C9 - 12869
CH2-all-trans
3198
C1rsquo10335
a) b)
1H
T degCT degC
13C Single Pulse MAS
A
B
A
B
70degC70degC
5rsquo
215
200 180 160 140 120 100 80 60 40 20 0
ppm
13C CPMAST= 110degC
200 180 160 140 120 100 80 60 40 20 0
ppm
132 131 130 129 128 127 126
ppm
106 105 104 103 102
ppm
13C CPMAST= 70degC
50
tc micros
3000
20
tc micros
50 500 1000 3000
tc micros
C102
13024 C910113003
C92
12869
C1rsquo213082
C1rsquo110443
A B
106 105 104 103 102
ppm
3000
1000
500
50
20
AB
c)
d)
10
972
Figure S 8 ndash a) Short and d) long T2 components displayed by the 1H transverse relaxation signal c) 1H 973
transverse relaxation signals recorded on a G-C181-OH dry powder from 110degC to 70degC The area of each 974
given resonance is plotted (log-lin) as a function of the echo time (CPMG pulse sequence) for each 975
temperature and fitted using the equation given above T2s and T2l indicate the short and long T2 relaxation 976
times respectively obtained by describing the 1H transverse relaxation signal using a biexponential decay 977
For H1rsquo H5rsquo and H6rsquo the 1H relaxation function could be described by a monoexponential decay 978
- Protons from the sugar group (H1rsquo H5rsquo H6rsquo) show a single T2 relaxation component (Figure 979
6c and Figure S 8) while protons of the acyl chain (CH2 H910 H811) show both short (Figure 980
6c) and long (Figure 6d) T2 relaxation component 981
- The short T2 relaxation time systematically decreases from 110degC to 70degC for all species by a 982
factor ranging from two to seven depending on the specific chemical group Very long T2 are 983
observed at 110degC for all acyl species while nearly unchanged values are measured below 984
90degC without any clear trend 985
- The sugar protons (H1rsquo H5rsquo H6rsquo) have the shortest set of T2 values (lt 1 ms) below 100degC 986
The long component of T2 generally ranges between 4 ms and 12 ms 987
0 1 2 3 4 5 6 7 8
00
05
10
15
20
25
30
35
40
45
Log
In
ten
sity
Time ms
0 1 2 3 4 5 6 7 8
00
05
10
15
20
25
30
35
40
45
Log
In
ten
sity
Time ms
0 1000 2000 3000 4000 5000 6000 7000 8000
00
05
10
15
20
25
30
35
40
45
Log
In
ten
sity
Time ms
0 1000 2000 3000 4000 5000 6000 7000 8000
00
05
10
15
20
25
30
35
40
45
Log
In
ten
sity
Time ms
0 1000 2000 3000 4000 5000 6000 7000 8000
00
05
10
15
20
25
30
35
40
45
Log
In
ten
sity
Time ms
0 1000 2000 3000 4000 5000 6000 7000 8000
00
05
10
15
20
25
30
35
40
45
Log
In
ten
sity
Time ms
H1
H8H11
H9H10
CH2
H1rsquo
H6rsquo
CH2
H910H811 H1CH2
H1rsquo H5rsquo6rsquo
0 1000 2000 3000 4000 5000 6000 7000 8000
00
05
10
15
20
25
30
35
40
45
Log
In
ten
sity
Time ms
OH
0 1000 2000 3000 4000 5000 6000 7000 8000
00
05
10
15
20
25
30
35
40
45 T= 110degC
T= 90degC
T= 80degC
T= 70degC
Log
In
ten
sity
Time ms
Fit
)
CH2 H910 H811 H1 H56 H1 OH
00
05
10
15
20
25
30
35
40
T2 m
s
T= 110degC
T= 90degC
T= 80degC
T= 70degC
CH2 H910 H811 H1
0
2
4
6
8
10
12
T2 m
s
T= 110degC
T= 90degC
T= 80degC
T= 70degC
Short T2(1H) Long T2(1H)
a) b)
c)
11
Table S 1 ndash 1H chemical shifts of G-C181-OH in solution and in the solid-state Solid-state spectra are 988
recorded at a MAS frequency of 10 kHz in DMSO-d6 broad peak 989
990
δH ppm
Group Ndeg Liquid
(MeOD-d4) Solid
(T= 110degC) Solid
(T= 70degC)
CH2 H1 354 357
CH2 H2 153 156
CH2 H3-712-14 132 135
CH2 H811 203 203
CH H910 534 534
CH2 H15 162 164
CH2 H16 388 383
CH H1 424 432
CH H2 316 335
CH H3 334 335
CH H4 329 335
CH H5 354 351 357
CH2 H6 366 383
OH OH1 432
45 463
OH OH2 492
OH OH3 490
OH OH4 487
OH OH6 445
991
992
H1H9H10H1rsquo
H6rsquo
OH2rsquo
OH1
12
Detailed discussion about the NOESY and DQ-SQ 2D 1H-1H ssNMR experiments presented in 993
Figure 9 994
995
2D 1H-1H ssNMR experiments are a unique tool to explore through-space proximities 996
between 1H nuclei ssNMR offers a large number of possibilities each adapted to a given 997
system The advantage of 2D maps with respect to a dynamics approach is their direct 998
readability in clear two nuclei which exchange their magnetization through-space (whichever 999
mechanism may be responsible for this exchange) will display a specific cross-peak However 1000
the way cross-peaks are presented and interpreted strictly depends on the nature of the pulse 1001
program which in turn is chosen according to the physical nature of the sample 1002
1D temperature-dependent 1H NMR experiments performed on G-C181-OH (Figure 1003
4a in the main text) indicate sharp peaks at 90degC and broad peaks at 70degC Narrow peaks 1004
indicate fast andor large-amplitude molecular tumbling averaging the strong 1H-1H dipolar 1005
interactions This excludes the use of pulse sequences like DQ-SQ which is not efficient under 1006
these conditions For this reason we employ spin-diffusion-based pulse sequences like 1007
NOESY which is more adapted for samples with high molecular mobility When mixing times 1008
are chosen to be short (lt 1 s) one generally explores through-space proximities within about 5 1009
10 Aring On the contrary when molecular motions are restricted dipolar coupling becomes 1010
significant 1H NMR peaks are broader and pulse sequences like DQ-SQ can now be used 1011
with a spatial resolution of less than 5 Aring 1012
Whenever possible DQ-SQ experiments are preferred over spin diffusion-based pulse 1013
sequences because they are more selective in particular for likewise interactions which are 1014
not discriminated in NOESY-type experiments This is illustrated by the typical interaction 1015
schemes for NOESY (top Figure 9a) and DQ-SQ (top Figure 9b) For two given A and B 1016
protons 2D NOESY maps will display two on-diagonal and two square-shaped symmetrical 1017
off-diagonal cross-peaks Off-diagonal cross-peaks illustrate the mutual A-B and B-A 1018
interaction but the on-diagonal peaks are systematic and do not prove any A-A or B-B 1019
interaction Similarly to NOESY 2D DQ-SQ maps display off-diagonal peaks (symmetric 1020
across the diagonal top Figure 9b) upon A-B and B-A interaction but in contrast they will 1021
display on-diagonal peaks only in the presence of self-interaction In the tutorial example of 1022
Figure 9b top the on-diagonal A-A peak indicates mutual A-A interaction while lack of on-1023
diagonal B-B peak evidences the absence of B-B proximities Combining NOESY and DQ-SQ 1024
experiments is capital to study the local arrangement of G-C181-OH and its evolution with 1025
temperature 1026
13
At T= 90degC the H1 and H5rsquo contributions are very close but possible to discriminate 1027
them (δ(H1)= 354 ppm δ(H5rsquo)= 351 ppm) according to 1H NMR chemical shifts in Table S 1028
1 2D 1H-1H NOESY in Figure 9a also discriminates between the two components attributed 1029
on the basis of the interactions with their mutual neighbors (green H1-H2 and H5rsquo-H1rsquo squares 1030
in Figure 9a) On this basis 2D NOESY does not show a direct H1rsquo-H1 correlation (blue red-1031
crossed) but rather an extensive network of intra-sugar interactions These features exclude 1032
suggest intra- and inter-sugar interactions and they exclude head-tail arrangements as a major 1033
molecular configuration at 90degC 1034
At 70degC the 1H NMR peaks are broader indicating a reduction of the T2 (1H) relaxation 1035
times andor residual homonuclear dipolar interactions excluding the use of NOESY In this 1036
case 1H-1H DQ-SQ correlation experiments are best suited Figure 9b presents the 1H-1H DQ-1037
SQ experiment on G-C181-OH at 70degC Peaks are broader than in NOESY and attribution may 1038
be cumbersome However the experiment is performed at 700 MHz and MAS= 22 kHz which 1039
improves spectral resolution with respect to the same experiment performed at 300 MHz and 1040
MAS= 10 kHz The auto-peak at δH= 356 ppm in the SQ dimension is attributed to H1-H1 spin 1041
pairs mainly resulting from intra CH2 interaction while the DQ cross-peaks at δH= 156-356 1042
ppm and δH= 432-356 ppm respectively origin from H2-H1 and H1rsquo-H1 interactions (Figure 1043
9b) DQ-SQ map does not show any auto-peak corresponding to H1rsquo-H1rsquo or Hxrsquo-Hxrsquo (x= 2rsquo 1044
3rsquo 4rsquo) interactions (red-crossed blue Figure 9b) thus excluding any proximity (lt 5 Aring) between 1045
close glucose neighbors On the contrary DQ-SQ maps (recorded both at 700 MHz Figure 9b 1046
or at 300 MHz not shown) systematically show DQ cross-peaks which can only be attributed 1047
to H1rsquo-H1 interactions (δH= 432-356) The presence of these H1rsquo-H1 interactions can only be 1048
explained by a head-tail arrangement of the G-C181-OH molecules as illustrated below the 1049
DQ-SQ map in Figure 9b 1050
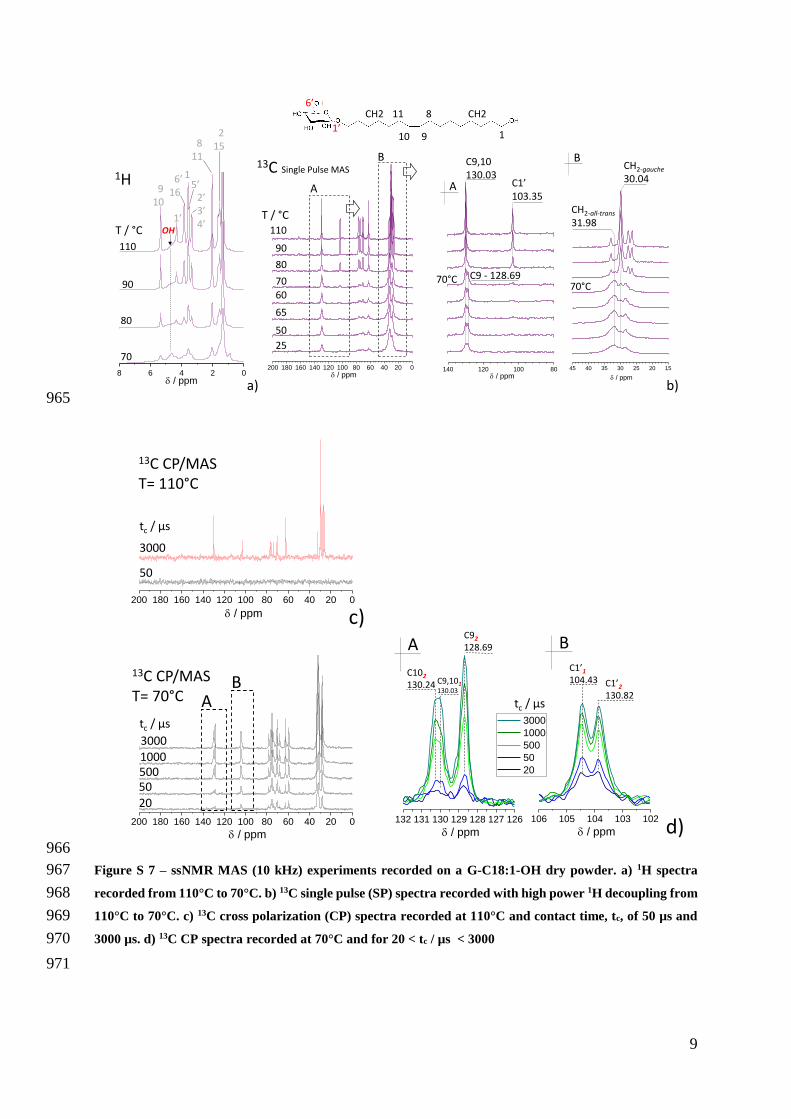
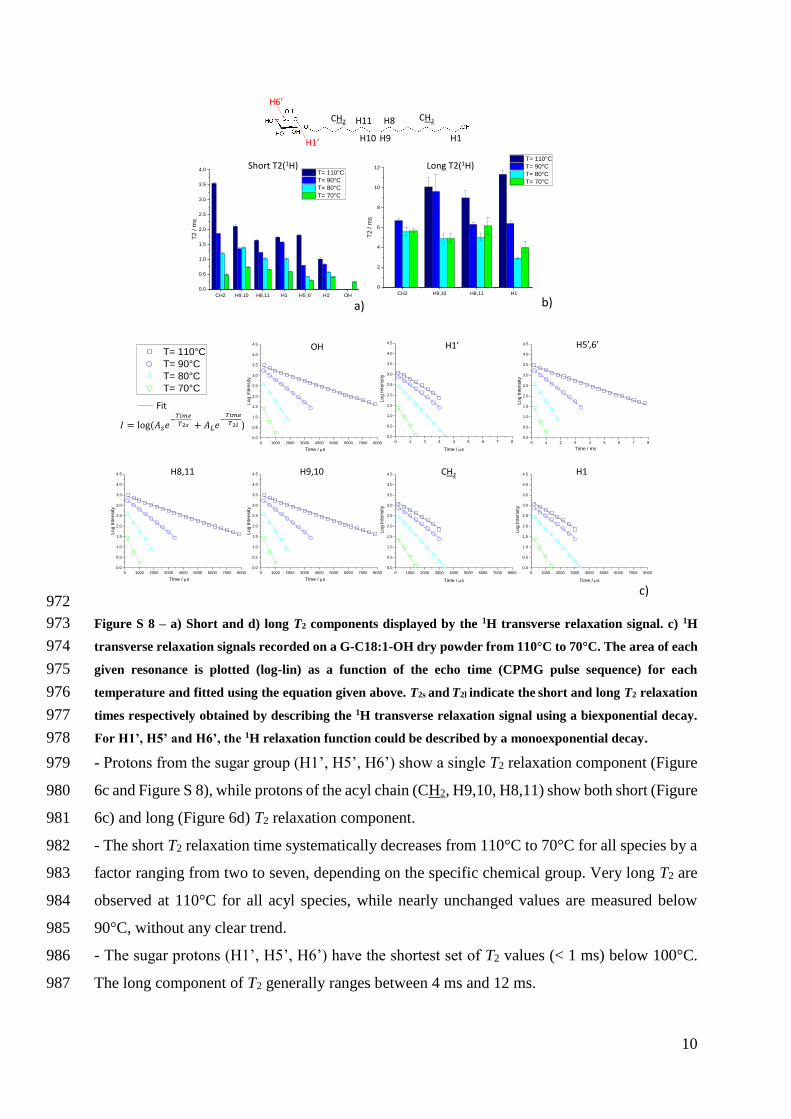
10
972
Figure S 8 ndash a) Short and d) long T2 components displayed by the 1H transverse relaxation signal c) 1H 973
transverse relaxation signals recorded on a G-C181-OH dry powder from 110degC to 70degC The area of each 974
given resonance is plotted (log-lin) as a function of the echo time (CPMG pulse sequence) for each 975
temperature and fitted using the equation given above T2s and T2l indicate the short and long T2 relaxation 976
times respectively obtained by describing the 1H transverse relaxation signal using a biexponential decay 977
For H1rsquo H5rsquo and H6rsquo the 1H relaxation function could be described by a monoexponential decay 978
- Protons from the sugar group (H1rsquo H5rsquo H6rsquo) show a single T2 relaxation component (Figure 979
6c and Figure S 8) while protons of the acyl chain (CH2 H910 H811) show both short (Figure 980
6c) and long (Figure 6d) T2 relaxation component 981
- The short T2 relaxation time systematically decreases from 110degC to 70degC for all species by a 982
factor ranging from two to seven depending on the specific chemical group Very long T2 are 983
observed at 110degC for all acyl species while nearly unchanged values are measured below 984
90degC without any clear trend 985
- The sugar protons (H1rsquo H5rsquo H6rsquo) have the shortest set of T2 values (lt 1 ms) below 100degC 986
The long component of T2 generally ranges between 4 ms and 12 ms 987
0 1 2 3 4 5 6 7 8
00
05
10
15
20
25
30
35
40
45
Log
In
ten
sity
Time ms
0 1 2 3 4 5 6 7 8
00
05
10
15
20
25
30
35
40
45
Log
In
ten
sity
Time ms
0 1000 2000 3000 4000 5000 6000 7000 8000
00
05
10
15
20
25
30
35
40
45
Log
In
ten
sity
Time ms
0 1000 2000 3000 4000 5000 6000 7000 8000
00
05
10
15
20
25
30
35
40
45
Log
In
ten
sity
Time ms
0 1000 2000 3000 4000 5000 6000 7000 8000
00
05
10
15
20
25
30
35
40
45
Log
In
ten
sity
Time ms
0 1000 2000 3000 4000 5000 6000 7000 8000
00
05
10
15
20
25
30
35
40
45
Log
In
ten
sity
Time ms
H1
H8H11
H9H10
CH2
H1rsquo
H6rsquo
CH2
H910H811 H1CH2
H1rsquo H5rsquo6rsquo
0 1000 2000 3000 4000 5000 6000 7000 8000
00
05
10
15
20
25
30
35
40
45
Log
In
ten
sity
Time ms
OH
0 1000 2000 3000 4000 5000 6000 7000 8000
00
05
10
15
20
25
30
35
40
45 T= 110degC
T= 90degC
T= 80degC
T= 70degC
Log
In
ten
sity
Time ms
Fit
)
CH2 H910 H811 H1 H56 H1 OH
00
05
10
15
20
25
30
35
40
T2 m
s
T= 110degC
T= 90degC
T= 80degC
T= 70degC
CH2 H910 H811 H1
0
2
4
6
8
10
12
T2 m
s
T= 110degC
T= 90degC
T= 80degC
T= 70degC
Short T2(1H) Long T2(1H)
a) b)
c)
11
Table S 1 ndash 1H chemical shifts of G-C181-OH in solution and in the solid-state Solid-state spectra are 988
recorded at a MAS frequency of 10 kHz in DMSO-d6 broad peak 989
990
δH ppm
Group Ndeg Liquid
(MeOD-d4) Solid
(T= 110degC) Solid
(T= 70degC)
CH2 H1 354 357
CH2 H2 153 156
CH2 H3-712-14 132 135
CH2 H811 203 203
CH H910 534 534
CH2 H15 162 164
CH2 H16 388 383
CH H1 424 432
CH H2 316 335
CH H3 334 335
CH H4 329 335
CH H5 354 351 357
CH2 H6 366 383
OH OH1 432
45 463
OH OH2 492
OH OH3 490
OH OH4 487
OH OH6 445
991
992
H1H9H10H1rsquo
H6rsquo
OH2rsquo
OH1
12
Detailed discussion about the NOESY and DQ-SQ 2D 1H-1H ssNMR experiments presented in 993
Figure 9 994
995
2D 1H-1H ssNMR experiments are a unique tool to explore through-space proximities 996
between 1H nuclei ssNMR offers a large number of possibilities each adapted to a given 997
system The advantage of 2D maps with respect to a dynamics approach is their direct 998
readability in clear two nuclei which exchange their magnetization through-space (whichever 999
mechanism may be responsible for this exchange) will display a specific cross-peak However 1000
the way cross-peaks are presented and interpreted strictly depends on the nature of the pulse 1001
program which in turn is chosen according to the physical nature of the sample 1002
1D temperature-dependent 1H NMR experiments performed on G-C181-OH (Figure 1003
4a in the main text) indicate sharp peaks at 90degC and broad peaks at 70degC Narrow peaks 1004
indicate fast andor large-amplitude molecular tumbling averaging the strong 1H-1H dipolar 1005
interactions This excludes the use of pulse sequences like DQ-SQ which is not efficient under 1006
these conditions For this reason we employ spin-diffusion-based pulse sequences like 1007
NOESY which is more adapted for samples with high molecular mobility When mixing times 1008
are chosen to be short (lt 1 s) one generally explores through-space proximities within about 5 1009
10 Aring On the contrary when molecular motions are restricted dipolar coupling becomes 1010
significant 1H NMR peaks are broader and pulse sequences like DQ-SQ can now be used 1011
with a spatial resolution of less than 5 Aring 1012
Whenever possible DQ-SQ experiments are preferred over spin diffusion-based pulse 1013
sequences because they are more selective in particular for likewise interactions which are 1014
not discriminated in NOESY-type experiments This is illustrated by the typical interaction 1015
schemes for NOESY (top Figure 9a) and DQ-SQ (top Figure 9b) For two given A and B 1016
protons 2D NOESY maps will display two on-diagonal and two square-shaped symmetrical 1017
off-diagonal cross-peaks Off-diagonal cross-peaks illustrate the mutual A-B and B-A 1018
interaction but the on-diagonal peaks are systematic and do not prove any A-A or B-B 1019
interaction Similarly to NOESY 2D DQ-SQ maps display off-diagonal peaks (symmetric 1020
across the diagonal top Figure 9b) upon A-B and B-A interaction but in contrast they will 1021
display on-diagonal peaks only in the presence of self-interaction In the tutorial example of 1022
Figure 9b top the on-diagonal A-A peak indicates mutual A-A interaction while lack of on-1023
diagonal B-B peak evidences the absence of B-B proximities Combining NOESY and DQ-SQ 1024
experiments is capital to study the local arrangement of G-C181-OH and its evolution with 1025
temperature 1026
13
At T= 90degC the H1 and H5rsquo contributions are very close but possible to discriminate 1027
them (δ(H1)= 354 ppm δ(H5rsquo)= 351 ppm) according to 1H NMR chemical shifts in Table S 1028
1 2D 1H-1H NOESY in Figure 9a also discriminates between the two components attributed 1029
on the basis of the interactions with their mutual neighbors (green H1-H2 and H5rsquo-H1rsquo squares 1030
in Figure 9a) On this basis 2D NOESY does not show a direct H1rsquo-H1 correlation (blue red-1031
crossed) but rather an extensive network of intra-sugar interactions These features exclude 1032
suggest intra- and inter-sugar interactions and they exclude head-tail arrangements as a major 1033
molecular configuration at 90degC 1034
At 70degC the 1H NMR peaks are broader indicating a reduction of the T2 (1H) relaxation 1035
times andor residual homonuclear dipolar interactions excluding the use of NOESY In this 1036
case 1H-1H DQ-SQ correlation experiments are best suited Figure 9b presents the 1H-1H DQ-1037
SQ experiment on G-C181-OH at 70degC Peaks are broader than in NOESY and attribution may 1038
be cumbersome However the experiment is performed at 700 MHz and MAS= 22 kHz which 1039
improves spectral resolution with respect to the same experiment performed at 300 MHz and 1040
MAS= 10 kHz The auto-peak at δH= 356 ppm in the SQ dimension is attributed to H1-H1 spin 1041
pairs mainly resulting from intra CH2 interaction while the DQ cross-peaks at δH= 156-356 1042
ppm and δH= 432-356 ppm respectively origin from H2-H1 and H1rsquo-H1 interactions (Figure 1043
9b) DQ-SQ map does not show any auto-peak corresponding to H1rsquo-H1rsquo or Hxrsquo-Hxrsquo (x= 2rsquo 1044
3rsquo 4rsquo) interactions (red-crossed blue Figure 9b) thus excluding any proximity (lt 5 Aring) between 1045
close glucose neighbors On the contrary DQ-SQ maps (recorded both at 700 MHz Figure 9b 1046
or at 300 MHz not shown) systematically show DQ cross-peaks which can only be attributed 1047
to H1rsquo-H1 interactions (δH= 432-356) The presence of these H1rsquo-H1 interactions can only be 1048
explained by a head-tail arrangement of the G-C181-OH molecules as illustrated below the 1049
DQ-SQ map in Figure 9b 1050
Copyright © 2022 FDOKUMEN