Automated Identification of Subcellular Organelles by Coherent Anti-Stokes Raman Scattering
20
Automated Identification of Subcellular Organelles by Coherent Anti- Stokes Raman Scattering Samir F. El-Mashtoly, † Daniel Niedieker, † Dennis Petersen, † Sascha D. Krauss, † Erik Freier, † Abdelouahid Maghnouj, ‡ Axel Mosig, † Stephan Hahn, ‡ Carsten Ko ¨ tting, † and Klaus Gerwert † * † Department of Biophysics and ‡ Department of Molecular GI-Oncology, Clinical Research Center, Ruhr-University Bochum, Bochum, Germany ABSTRACT Coherent anti-Stokes Raman scattering (CARS) is an emerging tool for label-free characterization of living cells. Here, unsupervised multivariate analysis of CARS datasets was used to visualize the subcellular compartments. In addition, a supervised learning algorithm based on the ‘‘random forest’’ ensemble learning method as a classifier, was trained with CARS spectra using immunofluorescence images as a reference. The supervised classifier was then used, to our knowledge for the first time, to automatically identify lipid droplets, nucleus, nucleoli, and endoplasmic reticulum in datasets that are not used for training. These four subcellular components were simultaneously and label-free monitored instead of using several fluorescent labels. These results open new avenues for label-free time-resolved investigation of subcellular components in different cells, especially cancer cells. INTRODUCTION Microscopic imaging of cellular compartments based on various spectroscopic signals is a topic of wide interest. The most common methods for imaging the subcellular or- ganelles are fluorescence microscopy, electron microscopy, and cryoelectron microscopy. Several difficulties are encountered with fluorescence microscopy such as exten- sive sample preparations and photobleaching. Furthermore, the fluorescent label may be toxic or perturbative and change the biochemical properties of the specimen. The electron microscopic methods are invasive and also require extensive sample preparation and they are not suitable for live cell imaging under physiological conditions. There is growing interest in applying label-free imaging methods such as autofluorescence (1) and second harmonic generation (2) without introducing any external labels or dyes. However, these techniques are limited to relatively few specific molecular signatures. On the other hand, vibra- tional microscopy including infrared absorption and Raman scattering have been used as label-free imaging methods based on the identification of molecular vibrations that are characteristic of distinct functional groups (3–12). In cells, vibrational fingerprints arise from the functional groups of proteins, nucleic acids, lipids, phospholipids, and carbohy- drates, which are the basic building blocks of cells. Thus, vibrational microscopy probes the molecular composition. Infrared microscopy has a limited spatial resolution (~10 mm at 1000 cm 1 ) due to its long wavelengths, whereas Raman microscopy has higher spatial resolution due to shorter excitation wavelengths. Therefore, Raman microscopy is superior for spatial resolving of subcellular components. Several methods based on Raman scattering have been applied for label-free cell imaging (5,13,14). For instance, it has been shown that spontaneous Raman microscopy may resolve subcellular organelles such as the nucleus or chromatin (4,9) and lipid droplets (7,8,15). Raman imaging of mitochondrial distribution in cells was also reported by Mattha ¨us et al. (5), who presented a combination of Raman, fluorescence, and multivariate analysis. The authors used visible excitation, and surprisingly, the Raman data were free of autofluorescence. In addition, Klein et al. (16) demonstrated recently the Raman imaging of nucleus, mito- chondria, endoplasmic reticulum, and Golgi apparatus in an LN-18 glioma cell-line using immunofluorescence as a reference. However, the authors only used unsupervised methods for the data evaluation, and the simultaneous iden- tification of several subcellular organelles by Raman micro- scopy, to our knowledge, has not yet been reported. Coherent anti-Stokes Raman scattering (CARS) is a variant of Raman microscopy. It is a nonlinear optical four-wave mixing process, which is resonantly enhanced if the frequency difference between pump and Stokes waves matches a vibrational resonance of the specimen. Because of its coherency, CARS produces a strong and directed signal compared with spontaneous Raman. When coupled to laser scanning microscopes, CARS imag- ing can be performed at a speed up to a video rate (13,14,17–19). Most of the CARS applications in cell biology were investigations of lipids that play a pivotal role in biological membranes (20–23). CARS detects lipids in cells due to their high local concentration. The abundant C-H 2 contents in lipids cause a strong CARS signal near 2850 cm 1 . CARS microscopy has also been used to probe live cells undergoing mitosis and live cells in interphase (24). In addition, a combination of spontaneous Raman mi- crospectroscopy, CARS, and fluorescence imaging was Submitted December 6, 2013, and accepted for publication March 14, 2014. *Correspondence: [email protected] Samir F. El-Mashtoly and Daniel Niedieker contributed equally to this work. Editor: Paul Wiseman. Ó 2014 by the Biophysical Society 0006-3495/14/05/1910/11 $2.00 http://dx.doi.org/10.1016/j.bpj.2014.03.025 1910 Biophysical Journal Volume 106 May 2014 1910–1920
-
Upload
independent -
Category
Documents
-
view
0 -
download
0
Transcript of Automated Identification of Subcellular Organelles by Coherent Anti-Stokes Raman Scattering

1910 Biophysical Journal Volume 106 May 2014 1910–1920
Automated Identification of Subcellular Organelles by Coherent Anti-Stokes Raman Scattering
Samir F. El-Mashtoly,† Daniel Niedieker,† Dennis Petersen,† Sascha D. Krauss,† Erik Freier,†
Abdelouahid Maghnouj,‡ Axel Mosig,† Stephan Hahn,‡ Carsten Kotting,† and Klaus Gerwert†*†Department of Biophysics and ‡Department of Molecular GI-Oncology, Clinical Research Center, Ruhr-University Bochum, Bochum,Germany
ABSTRACT Coherent anti-Stokes Raman scattering (CARS) is an emerging tool for label-free characterization of living cells.Here, unsupervised multivariate analysis of CARS datasets was used to visualize the subcellular compartments. In addition, asupervised learning algorithm based on the ‘‘random forest’’ ensemble learning method as a classifier, was trained with CARSspectra using immunofluorescence images as a reference. The supervised classifier was then used, to our knowledge for thefirst time, to automatically identify lipid droplets, nucleus, nucleoli, and endoplasmic reticulum in datasets that are not used fortraining. These four subcellular components were simultaneously and label-free monitored instead of using several fluorescentlabels. These results open new avenues for label-free time-resolved investigation of subcellular components in different cells,especially cancer cells.
INTRODUCTION
Microscopic imaging of cellular compartments based onvarious spectroscopic signals is a topic of wide interest.The most common methods for imaging the subcellular or-ganelles are fluorescence microscopy, electron microscopy,and cryoelectron microscopy. Several difficulties areencountered with fluorescence microscopy such as exten-sive sample preparations and photobleaching. Furthermore,the fluorescent label may be toxic or perturbative andchange the biochemical properties of the specimen. Theelectron microscopic methods are invasive and also requireextensive sample preparation and they are not suitable forlive cell imaging under physiological conditions.
There is growing interest in applying label-free imagingmethods such as autofluorescence (1) and second harmonicgeneration (2) without introducing any external labels ordyes. However, these techniques are limited to relativelyfew specific molecular signatures. On the other hand, vibra-tional microscopy including infrared absorption and Ramanscattering have been used as label-free imaging methodsbased on the identification of molecular vibrations that arecharacteristic of distinct functional groups (3–12). In cells,vibrational fingerprints arise from the functional groups ofproteins, nucleic acids, lipids, phospholipids, and carbohy-drates, which are the basic building blocks of cells. Thus,vibrational microscopy probes the molecular composition.Infrared microscopy has a limited spatial resolution(~10 mm at 1000 cm�1) due to its long wavelengths, whereasRamanmicroscopyhashigher spatial resolutiondue to shorterexcitation wavelengths. Therefore, Raman microscopy issuperior for spatial resolving of subcellular components.
Submitted December 6, 2013, and accepted for publication March 14, 2014.
*Correspondence: [email protected]
Samir F. El-Mashtoly and Daniel Niedieker contributed equally to this work.
Editor: Paul Wiseman.
� 2014 by the Biophysical Society
0006-3495/14/05/1910/11 $2.00
Several methods based on Raman scattering have beenapplied for label-free cell imaging (5,13,14). For instance,it has been shown that spontaneous Raman microscopymay resolve subcellular organelles such as the nucleus orchromatin (4,9) and lipid droplets (7,8,15). Raman imagingof mitochondrial distribution in cells was also reported byMatthaus et al. (5), who presented a combination of Raman,fluorescence, and multivariate analysis. The authors usedvisible excitation, and surprisingly, the Raman data werefree of autofluorescence. In addition, Klein et al. (16)demonstrated recently the Raman imaging of nucleus, mito-chondria, endoplasmic reticulum, and Golgi apparatus in anLN-18 glioma cell-line using immunofluorescence as areference. However, the authors only used unsupervisedmethods for the data evaluation, and the simultaneous iden-tification of several subcellular organelles by Raman micro-scopy, to our knowledge, has not yet been reported.
Coherent anti-Stokes Raman scattering (CARS) is avariant of Raman microscopy. It is a nonlinear opticalfour-wave mixing process, which is resonantly enhancedif the frequency difference between pump and Stokeswaves matches a vibrational resonance of the specimen.Because of its coherency, CARS produces a strong anddirected signal compared with spontaneous Raman.When coupled to laser scanning microscopes, CARS imag-ing can be performed at a speed up to a video rate(13,14,17–19). Most of the CARS applications in cellbiology were investigations of lipids that play a pivotalrole in biological membranes (20–23). CARS detects lipidsin cells due to their high local concentration. The abundantC-H2 contents in lipids cause a strong CARS signal near2850 cm�1. CARS microscopy has also been used to probelive cells undergoing mitosis and live cells in interphase(24). In addition, a combination of spontaneous Raman mi-crospectroscopy, CARS, and fluorescence imaging was
http://dx.doi.org/10.1016/j.bpj.2014.03.025

CARS Imaging of Subcellular Organelles 1911
used to investigate the macromolecular organization of thenucleus through the cell-cycle (24).
Several studies have combined coherent Raman imagingof cells and tissues with unsupervised multivariate analysessuch as principle component analysis (PCA), nonnegativematrix factorization (NMF), and multivariate curve resolu-tion (25–30). For instance, PCA of CARS datasets wasused to classify individual mesenchymal stem cells into ad-ipocytes, osteoblasts, and undifferentiated stem cells groups(30). In addition, Pohling et al. (26) have shown that PCA ofCARS spectra can be used to differentiate between plantcellular components. However, the ability of CARS micro-scopy to set a supervised classifier that can be used for auto-mated and simultaneous identification of several subcellularorganelles in a bioinformatics approach has not yet beenestablished.
Here, we report CARS hyperspectral images of MIAPaCa-2 pancreatic cancer cells generated via unsupervisedmultivariate methods such as hierarchical cluster analysis(HCA). We also demonstrate the feasibility of usingCARS coupled with HCA to colocalize the subcellular or-ganelles by comparing the HCA images with those obtainedusing immunofluorescence staining. With these data, a su-pervised learning algorithm based on the ensemble method‘‘random forest’’ as a classifier was trained and used, for thefirst time to our knowledge, to identify simultaneously andautomatically the nucleus, nucleolus, lipid droplets, andendoplasmic reticulum.
MATERIALS AND METHODS
Cell culture
Human pancreatic cancer MIA PaCa-2 (CRL-1420) and colorectal adeno-
carcinoma HT29 (HTB-38) cells were obtained from the American Type
Culture Collection (Manassas, VA). The cells were grown in Dulbecco’s
modified Eagle’s medium (Invitrogen, Carlsbad, CA) supplemented with
10% fetal bovine serum (Invitrogen) and 0.1% penicillin/streptomycin,
incubated at 37�C in 10% CO2 atmosphere. The cells were plated out on
glass coverslips (Menzel Glas, Braunschweig, Germany) for 1 day, fixed
with 4% paraformaldehyde (VWR International, Darmstadt, Germany),
and subsequently submerged into phosphate-buffered saline (PBS;
Invitrogen).
Confocal Raman microscopy
Raman micro-spectroscopy was acquired using a confocal Raman micro-
scope (Alpha300AR; WITec, Ulm, Germany) as described in details given
previously in Mavarani et al. (11) and El-Mashtoly et al. (31).
CARS data acquisition
The CARS-images were obtained using a commercial setup consisting of a
picosecond-pulsed laser system that generates two synchronized beams col-
linearly aligned in an inverted confocal microscope (TCS SP5 II CARS;
Leica Microsystems, Heidelberg, Germany). A fraction of the fundamental
light of an Nd:YVO4 (HighQ Laser, Rankweil, Austria) at 1064 nm is
directly coupled into the microscope and used as a Stokes beam in the
CARS imaging process. The frequency-doubled output (532 nm) is used
to synchronously pump an optical parametric oscillator (picoEmerald;
APE, Berlin, Germany), which is tunable in the range of 780–960 nm.
The laser beams are focused into the sample using an HCX IRAPO L water
immersion objective (40�/1.1 W CORR; Leica Microsystems). The epi-
and forward-detected CARS signals are measured simultaneously, via
non-descanned detectors. In this study, we will present only the forward-
CARS signals.
The mean laser power was measured at the sample position and found to
be 28 and 21 mW at 816 and 1064 nm, respectively. The power was kept
stable during the wavelength tuning of the laser. A typical pixel dwell
time of 200 ms per scan was selected (51 s per image, 512 � 512 pixels
covering up to 150 � 150 mm sample area, pixel resolution 200–
300 nm). The total time needed to collect a CARS hyperspectral image is
~50 min, which is much faster than the corresponding spontaneous Raman
measurement (~5 h) with the same pixel resolution (16). Even faster CARS
measurements can be achieved by measuring selected wavelengths only.
The CARS hyperspectral images of cells were measured between 826–
806 nm, corresponding to a vibrational range of 2700–3000 cm�1 with
~5 cm�1 spectral resolution. In case of live cell imaging, the CARS hyper-
spectral dataset is measured (2800–3000 cm�1) within 17 min (17 s per im-
age, 512 � 512 pixels covering at ~150 � 150 mm sample area, pixel
resolution 200–300 nm).
Immunofluorescence staining and imaging
The formalin-fixed cells were permeabilized with 0.2% Triton X-100 for
5 min at room temperature. After washing with PBS, cells were blocked
with 1% bovine serum albumin for 30 min. The primary antibodies were
incubated overnight at 4�C. Rabbit monoclonal anti-Calnexin (Jackson Im-
munoResearch, West Grove, PA), mouse monoclonal anti-Syntaxin 6 (BD
Biosciences, Franklin Lakes, NJ), and anti-COX IV (Abcam, Cambridge,
UK) antibodies were used for endoplasmic reticulum, Golgi apparatus,
and mitochondria, respectively. Excess antibodies were removed by
washing three times with PBS, followed by the incubation of the secondary
antibodies for 1 h at room temperature. The secondary antibodies conju-
gated to TRITC (tetramethyl rhodamine) and FITC (fluorescein) from Jack-
son ImmunoResearch were used. Excess antibodies were removed by again
washing three times with PBS. Cells (living or fixed) were incubated with
DRAQ-5 (1,5-bis{[2-(di-methylamino)ethyl]amino}-4,8-dihydroxyanthra-
cene-9,10-dione; Cell Signaling Technology, Danvers, MA) or LD540
(4,4-difluoro-2,3,5,6-bis-tetramethylene-4-bora-3a,4a-diaza-s-indacene)
for 10 and 30 min, respectively, followed by washing with PBS.
Fluorescence measurements were performed all the time sequentially on
double- or triple-stained specimen with a confocal laser-scanning micro-
scope (TCS SP5 II; Leica Microsystems) using an HCX IRAPO L (25�/
0.95 W) water immersion objective (Leica Microsystems). To enable an
optimal match with CARS images, stacks of fluorescence images were re-
corded and the distance between each layer was 0.5 mm.
Data analysis
The raw data and image processing was implemented in the software MAT-
LAB Ver. 8.1 along with the Image Processing and Statistics Toolboxes
(The MathWorks, Inc., Natick, MA). To obtain representative spectra for
different cellular compartments, a colocalization approach motivated by
fluorescence colocalization statistics was employed (32). Hereby a best-
matching cluster is identified in a hierarchical clustering of the normalized
spectral image data (S.D. Krauss, D. Petersen, D. Niedieker, E. Freier, S.F.
El-Mashtoly, K. Gerwert, and A. Mosig, unpublished). Therefore, HCA im-
ages of CARS spectra were manually overlaid with the corresponding fluo-
rescence images. For every possible combination of a cluster and a
fluorescence color channel, the degree of colocalization is calculated ac-
cording to Pearson’s correlation coefficient (PCC) (32–34) and the cluster
Biophysical Journal 106(9) 1910–1920

1912 El-Mashtoly et al.
with the highest PCC value was kept. After that, 100 thresholds were tested
on the fluorescence from 1 to 100% intensity, and the image was binarized
with the threshold showing the highest correlation with the best matching
cluster from the HCA. Spectra were used for training of a random forest
method from image positions whenever the fluorescence intensity was
above the threshold value and was covered by the best matching cluster.
Supervised classification by random forestmethod
The comparison of different datasets is disturbed by intensity fluctuation of
the laser system caused by tuning the pump laser and requires a correction.
The CARS signal intensity is proportional to the third order of the suscep-
tibility c, the Stokes laser intensity, and the square of the pump laser inten-
sity. Disregarding the nonresonant background, intensity fluctuations can be
handled as an additive factor of the logarithmic signal intensity. The inten-
sity of the laser can be measured directly or can be reconstructed by an in-
ternal standard, which, in this case, is the PBS buffer around the cell. The
logarithmic mean spectrum of the buffer was subtracted from the logarith-
mic hyperspectral dataset. Afterwards, the data was reexponentiated. The
SNR was enhanced by a Gaussian filter in image space with a window
size of 3 � 3 pixels.
The spectral data was automatically classified by the random forest
method (35). Training spectra were acquired from the colocalization step
by selecting the spectra from the overlap of the best matching cluster and
the fluorescence. The training spectra for lipid droplets were selected based
on the spectral image at 2850 cm�1 if the fluorescence staining for lipid
droplets was not performed. The classification was performed on vector-
normalized spectral datasets after the correction of the laser fluctuation
and was validated by estimating the colocalization with the corresponding
fluorescence image.
RESULTS AND DISCUSSION
Label-free Raman imaging of pancreatic cancercells
Fig. 1 depicts the Raman results of MIA PaCa-2 cells. Fig. 1A displays a univariate image based on the integrated Ramanintensities of the C-H stretching vibration (2800–3100 cm�1). This image shows the nucleus in the middle
Biophysical Journal 106(9) 1910–1920
of the cell, three nucleoli within the nucleus, and lipid drop-lets in the cytoplasm. Fig. 1 B displays the automatedcomputed HCA, which is an unsupervised clustering methodand used to generate an index-colored image from theRaman hyperspectral dataset. An algorithm is searchingfor similar spectra and merges them into a new object desig-nated as a cluster. The merging process is repeated until allRaman spectra are combined into a small number of clustersand each cluster is assigned a color, constructing an index-colored image based on spectral similarity (36). HCA inFig. 1 B was performed on the spectral range of 1200–1800 and 2800–3100 cm�1. These regions exhibit the mostpredominant bands of amino acids, protein backbones, nu-cleotides, nucleic acid backbones, carbohydrates, and lipids.It contains sufficient spectral information to provide excel-lent clustering results (36,37). Sixteen clusters were chosento reproduce the position of nucleus with nucleoli, as wellas several regions within the cytoplasm, reflecting differentcompositions of the cytoplasmwith various subcellular com-ponents. Alternatively, HCA was also performed on eitherthe 1200–1800 cm�1 (Fig. 1 C) or 2800–3100 cm�1 regions(C-H stretching, Fig. 1 D). The results are similar to those ofFig. 1 B, implying that the different spectral ranges (Fig. 1,B–D) at which HCA is performed are sufficient to produceexcellent and comparable clustering results. However, theminor differences in Fig. 1, B–D, might originate from thecontribution of different spectral regions.
Fig. 1 E shows the mean cluster spectra of only a few sub-cellular organelles, where morphology and topology of theirrepresentative clusters clearly suggest that they are associ-ated with cytoplasm (a), nucleus (b), nucleoli (c), and lipiddroplets (d). The most pronounced Raman bands result fromthe C-H stretching vibrations among 2850 and 3020 cm�1,the carbonyl stretching (amide I) located at ~1662 cm�1,C-H and CH2 bending deformations at 1450 cm�1, amideIII of the peptide linkages between 1200 and 1400 cm�1,
FIGURE 1 Hierarchical cluster analysis of
Raman dataset. (A) Raman image reconstructed
from the C-H stretching intensity. HCA is performed
in the following ranges: (B) 1200–1800 and 2800–
3100 cm�1; (C) 1200–1800 cm�1; and (D) 2800–
3100 cm�1. The morphology and topology of
some clusters suggest that they are associated with
the cytoplasm (green), nucleus (blue), nucleoli
(brown), and lipid droplets (red). Other clusters in
panels B–D cannot be assigned in this manner. (E)
The mean cluster Raman spectra are also shown.

CARS Imaging of Subcellular Organelles 1913
and the ring-breathing mode of phenylalanine at 1008 cm�1
(5,38,39).Spectrum d is significantly different from the others with
strong intensity. Note that, due to normalization, the strongintensity is not seen in Fig. 1 E. By comparing the meancluster spectrum d with the lipid and phospholipid spectra(7,40–42), it is clear that the spectrum d arises from highlipid or phospholipid content. The high C-H stretching in-tensities in the spectral range of 2850–2935 cm�1 are dueto long alkane chains. Only the spectrum of lipid droplets(d) exhibits a Raman band at 1750 cm�1, which is assignedto the C¼O stretching vibration of the ester form of fattyacids, probably triglyceride (which is the dominant compo-nent of lipid droplets).
The above results indicate that Raman microspectroscopycoupled with HCA has a potential for the label-free identi-fication of subcellular compartments of MIA PaCa-2 cells.This is in agreement with previous studies that had shownthe distribution of lipid droplets and mitochondria inCaco-2 and HeLa cells, respectively (5,15). In addition,the 1750 cm�1 band can be used as a marker-free bandfor imaging of lipid droplets.
Hierarchical cluster analysis of CARS datasets asan unsupervised method
Lipids are rich in C-H2 groups and have high local concen-trations. In addition, the CARS signal is proportional to thesquare of the concentration of the specimen (43). Thus,lipids cause a very strong CARS signal at 2850 cm�1, andimaging of lipid droplets in cells is the most common appli-cation of CARS microscopy (13,17,19,44). Fig. 2 A depictsthe CARS image taken at 2850 cm�1 of the MIA PaCa-2cells. It is obvious that lipid droplets significantly emit astronger CARS signal compared to the other cellular com-partments. Fig. 1 E indicates that lipid droplets (spectrumd) exhibit a Raman band at 1750 cm�1, which is assignedto the C¼O stretching vibration of the ester form of fattyacids. Thus, we have performed CARS imaging taken at
FIGURE 2 Hierarchical cluster analysis of CARS dataset. (A) CARS im-
aging taken at 2850 cm�1 of the MIA PaCa-2 cells. (B) HCA of CARS data-
set of MIA PaCa-2 cells. Spectra were normalized in the 2700–3000 cm�1
region and HCA was performed on the same spectral range. The
morphology and topology of some clusters suggest that they are associated
with the cytoplasm (yellow), nucleus (green), nucleoli (brown), and lipid
droplets (pink). Other clusters in panel B cannot be assigned in this manner.
both 2850 and 1750 cm�1 and the results are depicted inFig. S1 (see the Supporting Material). Identification of thesebright spots as lipid droplets was confirmed by confocalfluorescence microscopy, which was performed subsequentto CARS data acquisition. Results of CARS imaging of lipiddroplets taken at 2850 cm�1 are consistent with those of pre-vious studies (13,45); however, to the best of our knowl-edge, we have shown for the first time that the C¼Ostretching vibration of the ester form of fatty acids canalso be used as a label-free marker for imaging the lipiddroplets by CARS microscopy.
The HCA of the spontaneous Raman spectral dataset(Fig. 1) has shown that it is a powerful method to visualizedifferent cellular components and that the spectral region of2700–3000 cm�1 is sufficient to produce good clustering re-sults. These results were encouraging to perform HCA onCARS datasets in the C-H stretching region only. Restric-tion to this region has an additional advantage that thebroad Raman band of the glass coverslips, on which cellsare grown, does not interfere (16).
In CARS measurements, the pump wave was tunedseveral times between 826 and 806 nm, corresponding toa vibrational range of 2700–3000 cm�1 with ~5 cm�1 spec-tral resolution. CARS datasets were obtained with a pixelresolution of 200–300 nm. The region of interest wasselected by masking the area outside cells to reduce thenumber of spectra. The data were vector-normalized inthe 2700–3000 cm�1 range and HCA was performed inthe same spectral range. Fig. 2 B displays the HCA of aCARS dataset of MIA PaCa-2 cells. Twenty-four clusterswere chosen to reproduce the position of the nucleus withnucleoli and lipid droplets, as well as reflecting the compo-sitions of the cytoplasm with several organelles.
Recently, PCA and NMF analyses of CARS datasets wereused to visualize cellular components (26,29,30). Further,this study shows the potential of HCA of CARS datasetsin visualizing several subcellular organelles and opens anavenue toward their label-free identification. An advantageof HCA over other clustering methods is that it clearly visu-alizes several cellular components, as shown very recentlyfor the HCA of spontaneous Raman dataset (31).
Automatic identification of subcellular organelles
In this study, we believe that we have established, for the firsttime, a supervised algorithm for automated identification ofpancreatic cancer subcellular organelles by using label-freeCARS imaging based on the random forest method as a clas-sifier. Basically, the data analysis involves two stages as de-picted in Fig. 3, i.e., the training and validation stages.
Training stage
The aim of the training phase is to obtain representativespectra for different cellular compartments to train a
Biophysical Journal 106(9) 1910–1920

FIGURE 3 Workflow for spectral image classifier.
The procedure consists of two stages—training (left
side) and validation (right side) stages.
1914 El-Mashtoly et al.
supervised classifier. Therefore, the dissimilarity of thenormalized space-resolved CARS spectra is determined byHCA.
The PCC value of each combination of the spectra iscalculated and a hierarchy of clusters is built up by theuse of Ward’s method. In this hierarchy of clusters, an algo-rithm searches for the cluster best matching with the fluores-cence image of the corresponding organelle. This is becausethe standard method in life sciences for imaging the subcel-lular organelles and their dynamics is fluorescence micro-scopy (46). Figs. 4 and 5 show the colocalization ofseveral organelles in the HCA results.
FIGURE 4 Colocalization of the nucleus and lipid droplets. (A) Fluores-
cence imaging of the nucleus and lipid droplets. (B) HCA of CARS dataset.
Overlaid images of lipid droplets and the nucleus fluorescence (red) from
panel Awith their corresponding HCA clusters (green) from panel B are dis-
played in panels C and D, respectively. (yellow) Overlapping regions. (D,
inset) Overlay region of the nucleolus between the fluorescence (red) and
HCA (green).)
Biophysical Journal 106(9) 1910–1920
Fluorescence staining was carried out on the lipid drop-lets and the nucleus after CARS measurements and the re-sults are depicted in Fig. 4 A. In this study, we usedDRAQ-5 to stain the nucleus as well as nucleolus (47),and LD540 fluorescent dye for lipid droplets (48). Lipiddroplets are displayed in olive, whereas the nucleus is shownin blue. It is noted that the nucleolus gives stronger fluores-cence intensity than the nucleus; the regions above thethreshold in the nucleus fluorescence images are classifiedas nucleolus. Best matching clusters from HCA results ac-cording to the overlap with the fluorescence are shown inFig. 4 B. Fig. 4, C and D, illustrates the overlay of theHCA clusters (green) with their corresponding fluorescencechannels (red) for the lipid droplets and the nucleus, respec-tively, and the regions of agreements are shown in yellow.
The overlapping regions fit well and the PCC values werecalculated to be ~0.6 for lipid droplets and ~0.78 for the nu-cleus. Fig. 4 D (inset) also displays similar overlay for thenucleolus and good agreement is observed with a PCC valueat ~0.69. The blue, cyan, and olive clusters in the HCA(Fig. 4 B) are assigned to the nucleus, nucleolus, and lipiddroplets, respectively. In addition, the mean CARS spectrumof lipid droplets has a maximum peak at 2850 cm�1 (seeFig. S2), which is in agreement with previous results(13,45).
In a previous spontaneous Raman study (16), the con-structed fluorescence images based on selected Raman spec-tral features in the 80–3040 cm�1 regime containcontributions from a broad glass band near 1100 cm�1.This band obscures the DNA band at ~1094 cm�1 (39),and it creates artifacts in the spectral images, especiallyfor the nucleus and nucleolus. The constructed images de-pict regions within the nucleus with strong signal, whichwere absent in the fluorescence. These regions were

FIGURE 5 Colocalization of the endoplasmic re-
ticulum, Golgi apparatus, and mitochondria. (A1–
C1) Fluorescence images of the nucleus (blue),
endoplasmic reticulum (A1), Golgi apparatus (B1),
and mitochondria (C1). (A2–C2) HCA of CARS da-
tasets. (A3–C3) Overlaid images of endoplasmic re-
ticulum, Golgi apparatus, and mitochondria staining
(red) from panels A1–C1 with their corresponding
HCA (green) from A2–C2 and the overlapping re-
gions (yellow).
CARS Imaging of Subcellular Organelles 1915
assumed to be the nucleoli (16). The CARS measurements,however, were performed on the C-H region, which is freefrom the glass contribution. The colocalization of the nucle-olus here is based on fluorescence.
Furthermore, immunofluorescence staining was per-formed after CARS measurements for several cells usingeither anti-Calnexin for endoplasmic reticulum, anti-Syn-taxin-6 for Golgi apparatus, or anti-COX IV for mitochon-dria to illustrate other subcellular organelles in addition tothe nucleus. Panels A1–C1 in Fig. 5 show two-channelimmunofluorescence images of MIA PaCa-2 cells. In addi-tion to the nucleus (blue), they describe the distribution ofendoplasmic reticulum (Fig. 5 A1), Golgi apparatus(Fig. 5 B1), or mitochondria (Fig. 5 C1), as illustrated inred. In general, the endoplasmic reticulum is surroundingthe nucleus in high concentration accompanied by Golgiapparatus, whereas the mitochondria are spread in the cyto-plasm. A visual assessment indicates that the best matchingclusters from the HCA (Fig. 5, A2–C2) share informationwith their corresponding fluorescence images (Fig. 5, A1–C1). For instance, there is a great match of the blue channelsin both HCA and fluorescence staining.
For the colocalization of the cellular components in theHCA results, the fluorescence channels were overlaid withtheir corresponding HCA clusters in detail. For instance,the matching regions (yellow) of the fluorescence imaging(red) with the HCA (green) for the endoplasmic reticulum,Golgi apparatus, and mitochondria are displayed in Fig. 5,A3–C3. Good overlay is observed with PCC values at~0.55 for these three organelles. Furthermore, mitochon-drial distribution in glioma and HeLa cells has been detectedpreviously by spontaneous Raman microscopy (5,16). Spec-tral differences between the mitochondria and the nucleus
were observed in the C-H region. Specifically, the shoulderat the region at ~2850 cm�1 is more distinct for mitochon-dria than for the nucleus (5). Similar results were observedin the mean CARS spectra for MIA PaCa-2 cells (seeFig. S2). Thus, the above results shown in Figs. 4 and 5 pro-duced a set of spectral training datasets for six classes ofsubcellular organelles including the nucleus, nucleolus,lipid droplets, endoplasmic reticulum, Golgi apparatus,and mitochondria.
Several reports have demonstrated the feasibility of usingCARS microscopy coupled with unsupervised multivariateanalyses such as PCA and NMF (25,26,29,30), but noneof them have reported the supervised classifications ofcellular organelles. Further, in this study, we first applied un-supervised HCA on CARS datasets to visualize cellularcomponents, which are identified using fluorescence imagesas a reference. More importantly, we have obtained repre-sentative CARS spectra for different cellular componentsto train a supervised classifier, which is an unprecedentedstep in comparison with previous publications of multivar-iate analyses of CARS datasets (25,26,29,30). The super-vised classifier is then used for an automatic identificationof the subcellular organelles, as explained below in the vali-dation stage.
It is noted that the PCC values for the colocalization arehigher for the nucleus than the other subcellular organelles,which are lower than those of the nucleus. This might be dueto the size of the cellular components, where the nucleus isthe largest component in the cell. This implies that the prob-ability of probing a pure component in the confocal volumebecomes higher as the size of the subcellular organellesincreases. In the case of small organelles, more than onecomponent might be present in the confocal volume. In
Biophysical Journal 106(9) 1910–1920
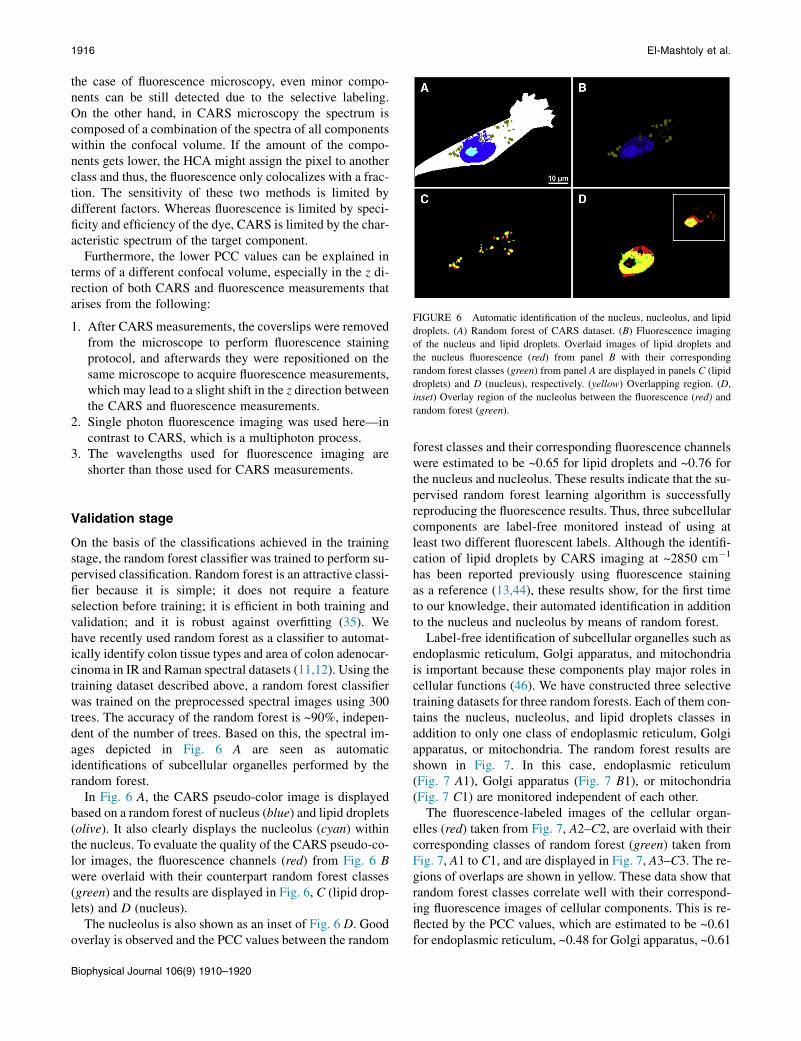
FIGURE 6 Automatic identification of the nucleus, nucleolus, and lipid
droplets. (A) Random forest of CARS dataset. (B) Fluorescence imaging
of the nucleus and lipid droplets. Overlaid images of lipid droplets and
the nucleus fluorescence (red) from panel B with their corresponding
random forest classes (green) from panel A are displayed in panels C (lipid
droplets) and D (nucleus), respectively. (yellow) Overlapping region. (D,
inset) Overlay region of the nucleolus between the fluorescence (red) and
random forest (green).
1916 El-Mashtoly et al.
the case of fluorescence microscopy, even minor compo-nents can be still detected due to the selective labeling.On the other hand, in CARS microscopy the spectrum iscomposed of a combination of the spectra of all componentswithin the confocal volume. If the amount of the compo-nents gets lower, the HCA might assign the pixel to anotherclass and thus, the fluorescence only colocalizes with a frac-tion. The sensitivity of these two methods is limited bydifferent factors. Whereas fluorescence is limited by speci-ficity and efficiency of the dye, CARS is limited by the char-acteristic spectrum of the target component.
Furthermore, the lower PCC values can be explained interms of a different confocal volume, especially in the z di-rection of both CARS and fluorescence measurements thatarises from the following:
1. After CARS measurements, the coverslips were removedfrom the microscope to perform fluorescence stainingprotocol, and afterwards they were repositioned on thesame microscope to acquire fluorescence measurements,which may lead to a slight shift in the z direction betweenthe CARS and fluorescence measurements.
2. Single photon fluorescence imaging was used here—incontrast to CARS, which is a multiphoton process.
3. The wavelengths used for fluorescence imaging areshorter than those used for CARS measurements.
Validation stage
On the basis of the classifications achieved in the trainingstage, the random forest classifier was trained to perform su-pervised classification. Random forest is an attractive classi-fier because it is simple; it does not require a featureselection before training; it is efficient in both training andvalidation; and it is robust against overfitting (35). Wehave recently used random forest as a classifier to automat-ically identify colon tissue types and area of colon adenocar-cinoma in IR and Raman spectral datasets (11,12). Using thetraining dataset described above, a random forest classifierwas trained on the preprocessed spectral images using 300trees. The accuracy of the random forest is ~90%, indepen-dent of the number of trees. Based on this, the spectral im-ages depicted in Fig. 6 A are seen as automaticidentifications of subcellular organelles performed by therandom forest.
In Fig. 6 A, the CARS pseudo-color image is displayedbased on a random forest of nucleus (blue) and lipid droplets(olive). It also clearly displays the nucleolus (cyan) withinthe nucleus. To evaluate the quality of the CARS pseudo-co-lor images, the fluorescence channels (red) from Fig. 6 Bwere overlaid with their counterpart random forest classes(green) and the results are displayed in Fig. 6, C (lipid drop-lets) and D (nucleus).
The nucleolus is also shown as an inset of Fig. 6 D. Goodoverlay is observed and the PCC values between the random
Biophysical Journal 106(9) 1910–1920
forest classes and their corresponding fluorescence channelswere estimated to be ~0.65 for lipid droplets and ~0.76 forthe nucleus and nucleolus. These results indicate that the su-pervised random forest learning algorithm is successfullyreproducing the fluorescence results. Thus, three subcellularcomponents are label-free monitored instead of using atleast two different fluorescent labels. Although the identifi-cation of lipid droplets by CARS imaging at ~2850 cm�1
has been reported previously using fluorescence stainingas a reference (13,44), these results show, for the first timeto our knowledge, their automated identification in additionto the nucleus and nucleolus by means of random forest.
Label-free identification of subcellular organelles such asendoplasmic reticulum, Golgi apparatus, and mitochondriais important because these components play major roles incellular functions (46). We have constructed three selectivetraining datasets for three random forests. Each of them con-tains the nucleus, nucleolus, and lipid droplets classes inaddition to only one class of endoplasmic reticulum, Golgiapparatus, or mitochondria. The random forest results areshown in Fig. 7. In this case, endoplasmic reticulum(Fig. 7 A1), Golgi apparatus (Fig. 7 B1), or mitochondria(Fig. 7 C1) are monitored independent of each other.
The fluorescence-labeled images of the cellular organ-elles (red) taken from Fig. 7, A2–C2, are overlaid with theircorresponding classes of random forest (green) taken fromFig. 7, A1 to C1, and are displayed in Fig. 7, A3–C3. The re-gions of overlaps are shown in yellow. These data show thatrandom forest classes correlate well with their correspond-ing fluorescence images of cellular components. This is re-flected by the PCC values, which are estimated to be ~0.61for endoplasmic reticulum, ~0.48 for Golgi apparatus, ~0.61

FIGURE 7 Automatic identification of the endo-
plasmic reticulum, Golgi apparatus, and mitochon-
dria. (A1–C1) Random forests of CARS datasets.
(A2–C2) Fluorescence images of the nucleus
(blue), endoplasmic reticulum (A2), Golgi apparatus
(B2), and mitochondria (C2). (A3–C3) Overlaid im-
ages of endoplasmic reticulum, Golgi apparatus,
and mitochondria fluorescence (red) from panels
A2–C2 with their corresponding random forest
(green) and from panels A1–C1 with overlapping
regions (yellow).
CARS Imaging of Subcellular Organelles 1917
for mitochondria, and ~0.86 for the nucleus. Similar resultshave been observed for the calculated artificial fluorescenceimages based on Raman data for the subcellular componentsof glioma cells using a different approach (16).
However, when the classes of different random forests forendoplasmic reticulum, Golgi apparatus, or mitochondria(Fig. 7, A1–C1) are overlaid, the PCC values for the corre-lation of any two of these classes are found to be quite high(~0.84). This indicates that these classes are quite similar,and the selective random forests display very little differen-tiation between any of these three organelles (see alsoFig. S3).
To improve the differentiation between these three organ-elles and identify the subcellular organelles simultaneously,we have created one training dataset that includes all classesfor a single random forest. Fig. 8 shows the simultaneousidentification of endoplasmic reticulum, Golgi apparatus,and mitochondria in addition to the nucleus, nucleoli, andlipid droplets (see also Fig. S4). The simultaneous identifi-cation of several subcellular organelles is one of thebelieved novel findings in this study and was not reportedpreviously.
Correlation between the random forest classes and theircounterpart fluorescence channels is reflected by PCC,which is ~0.57 for endoplasmic reticulum (Fig. 7 A),~0.29 for Golgi apparatus (Fig. 7 B), and ~0.23 for mito-chondria (Fig. 7 C). The average PCC value of the nucleusin Fig. 7, A–C, was estimated to be ~0.87. Because the stain-ing of lipid droplets was not performed for these cells(Fig. 7), the lipid droplets class was overlaid with theCARS image at 2850 cm�1, which is a lipid droplets markerband (13,17,19).
Perfect overlays were observed (data not shown). Thus,the simultaneous identification of subcellular organellesgives satisfactory results for nucleus, nucleoli, lipid droplets,and endoplasmic reticulum. The random forest is also able todistinguish among endoplasmic reticulum, Golgi apparatus,and mitochondria. However, the PCC values for the correla-tion among the random forest classes of Golgi apparatus andmitochondria and their corresponding fluorescence channelsare lower than expected. Both endoplasmic reticulum andGolgi apparatus belong to the endomembrane system, andare colocalized (49). Endoplasmic reticulum is also colocal-ized with mitochondria at certain positions in cells (49,50).
FIGURE 8 Simultaneous automatic identification
of subcellular components in MIA PaCa-2 cells.
Biophysical Journal 106(9) 1910–1920

1918 El-Mashtoly et al.
Indeed, the fluorescence results of MIA PaCa-2 cells and thecalculated PCC values have indicated the colocalization ofthese components (see Fig. S5 and Fig. S6). Thus, thecolocalization of these three subcellular organelles makesthe simultaneous identification of Golgi apparatus and mito-chondria difficult, leading to lower PCC values. This isbecause the classifier has to decide on one assignment foreach pixel even though, in the corresponding confocal vol-ume, more than one component is present.
In this study, we have used CARS microscopy ratherthan spontaneous Raman measurements because CARS isa much faster method. Even faster time resolution ispossible by using instruments capable of line scanning(51) or fast wavelength tunability (52). This point is critical,especially for live cell imaging, due to the viability of cellsand the dynamical behavior of most subcellular organelles.CARS imaging of living MIA PaCa-2 cells has been per-formed in addition to fluorescence imaging of nucleus andlipid droplets (see Fig. S7). The PCC values for the correla-tion between random forest classes of lipid droplets and nu-cleus with their corresponding fluorescence channels arecalculated to be 0.58 and 0.62, respectively. These resultsimply that the current trained classifier can also be appliedon live cells.
Furthermore, to examine whether this trained classifiercan be applied on different cell types, we have performedCARS and fluorescence measurements of human colorectaladenocarcinoma cells, HT29, and the results are depicted inFig. S8. The PCC values for the correlation betweenrandom forest classes of nucleus and lipid droplets withtheir corresponding fluorescence channels are satisfactory.These results suggest that the trained classifier is probablyapplicable to a variety of human cancer cells as well.
In summary, the nucleus, nucleoli, lipid droplets, andendoplasmic reticulum can be automatically and marker-free identified. This is based not only on visual inspection,but also on quantitative evaluation, which demonstratesthat random forest is a powerful tool to identify the subcel-lular organelles. The random forest classifier can also differ-entiate among endoplasmic reticulum, Golgi apparatus, andmitochondria. Methods that can assign a combination ofcomponents to each pixel (e.g., NMF) might furtherimprove the correlation (36). In addition, the trained classi-fier is probably applicable on different human cancer cells.
Prospective of an automated label-freeidentification of subcellular organelles
An automatic identification of pancreatic cancer subcellularorganelles by CARS microscopy opens new avenues forseveral applications. For instance, lipid droplets are highlydynamical organelles and perform several diverse functionssuch as regulating storage and release of cholesterol andfatty acids (20–23,53). It was observed that the number oflipid droplets is increased in neoplastic cells and tissues,
Biophysical Journal 106(9) 1910–1920
implying that lipid droplets have a high potential as diseasemarkers (54). It has also been suggested that lipid dropletsare potential targets to produce new drugs for cancer treat-ment (55). Thus, the automatic identification of lipid drop-lets by CARS microscopy can be used for lipid dropletsquantification and to evaluate the response of these newdrugs.
Finally, CARS microscopy promises an attractiveapproach for the label-free characterization of themorphology of nuclei, which are of high relevance inhigh-throughput microscopy. Contemporary protocols forstudying the cell-cycle using quantitative analysis of time-lapse microscopy (56) or tumor microenvironments (57)are based on either fluorescence or hematoxylin-eosin-stain-ing protocols, to extract the morphology of nuclei. CARSmicroscopy as a label-free approach may greatly simplifythese protocols by eliminating the need for staining inhigh-throughput microscopic studies.
CONCLUSIONS
CARS imaging coupled with HCA have been used for whatwe believe is the first time to visualize the cellular compo-nents without the need for external markers. Furthermore,we have established an algorithm for automatic label-freeidentification of the cellular components such as nucleus,nucleolus, lipid droplets, and endoplasmic reticulum usingthe random forest method. This study opens an avenue forthe label-free simultaneous imaging of the dynamics ofseveral subcellular organelles. Furthermore, in the future,we aim to identify several subcellular components in livingcells by CARS imaging by using only a few wavenumbers,to make the measurements much faster than this study. Thiscan be achieved, for instance, using wavenumber feature se-lection by means of the random forest method.
SUPPORTING MATERIAL
Eight figures are available at http://www.biophysj.org/biophysj/
supplemental/S0006-3495(14)00325-7.
We thank Professor Ralf Erdmann for providing us with LD540 staining
material and Hesham K. Yosef for the preparation of HT29 cells.
This research was supported by the Protein Research Unit Ruhr within
Europe, Ministry of Innovation, Science and Research of North-Rhine
Westphalia, Germany (to K.G.) and the Center for Vibrational Microscopy,
European Regional Development Fund, European Union and North-Rhine
Westphalia, Germany.
REFERENCES
1. Konig, K., A. Ehlers, ., M. Kaatz. 2007. Clinical two-photon micro-endoscopy. Microsc. Res. Tech. 70:398–402.
2. Llewellyn, M. E., R. P. J. Barretto,., M. J. Schnitzer. 2008. Minimallyinvasive high-speed imaging of sarcomere contractile dynamics inmice and humans. Nature. 454:784–788.

CARS Imaging of Subcellular Organelles 1919
3. Marcsisin, E. J., C. M. Uttero, ., M. Diem. 2010. Infrared micro-spectroscopy of live cells in aqueous media. Analyst (Lond.).135:3227–3232.
4. Matthaus, C., S. Boydston-White, ., M. Diem. 2006. Raman andinfrared microspectral imaging of mitotic cells. Appl. Spectrosc.60:1–8.
5. Matthaus, C., T. Chernenko, ., M. Diem. 2007. Label-free detectionof mitochondrial distribution in cells by nonresonant Raman micro-spectroscopy. Biophys. J. 93:668–673.
6. Popp, J. 2011. Handbook of Biophotonics: Vol. 2, Photonics for HealthCare. Wiley-VCH/John Wiley, Weinheim, Germany.
7. Krafft, C., T. Knetschke,., R. Salzer. 2006. Studies on stress-inducedchanges at the subcellular level by Raman microspectroscopic map-ping. Anal. Chem. 78:4424–4429.
8. van Manen, H.-J., Y. M. Kraan, ., C. Otto. 2005. Single-cell Ramanand fluorescence microscopy reveal the association of lipid bodieswith phagosomes in leukocytes. Proc. Natl. Acad. Sci. USA.102:10159–10164.
9. Uzunbajakava, N., A. Lenferink, ., C. Otto. 2003. Nonresonantconfocal Raman imaging of DNA and protein distribution in apoptoticcells. Biophys. J. 84:3968–3981.
10. Boydston-White, S., M. Romeo,., M. Diem. 2006. Cell-cycle-depen-dent variations in FTIR micro-spectra of single proliferating HeLacells: principal component and artificial neural network analysis. Bio-chim. Biophys. Acta. 1758:908–914.
11. Mavarani, L., D. Petersen, ., K. Gerwert. 2013. Spectral histopa-thology of colon cancer tissue sections by Raman imaging with532 nm excitation provides label free annotation of lymphocytes,erythrocytes and proliferating nuclei of cancer cells. Analyst(Lond.). 138:4035–4039.
12. Kallenbach-Thieltges, A., F. Grosseruschkamp, ., K. Gerwert. 2013.Immunohistochemistry, histopathology and infrared spectral histopa-thology of colon cancer tissue sections. J. Biophoton. 6:88–100.
13. Nan, X., J.-X. Cheng, and X. S. Xie. 2003. Vibrational imaging of lipiddroplets in live fibroblast cells with coherent anti-Stokes Raman scat-tering microscopy. J. Lipid Res. 44:2202–2208.
14. Saar, B. G., C. W. Freudiger, ., X. S. Xie. 2010. Video-rate molec-ular imaging in vivo with stimulated Raman scattering. Science.330:1368–1370.
15. Scalfi-Happ, C., M. Udart, ., A. Ruck. 2011. Investigation of lipidbodies in a colon carcinoma cell line by confocal Raman microscopy.Med. Laser Appl. 26:152–157.
16. Klein, K., A. M. Gigler, ., J. Schlegel. 2012. Label-free live-cell im-aging with confocal Raman microscopy. Biophys. J. 102:360–368.
17. Cheng, J.-X., Y. K. Jia, ., X. S. Xie. 2002. Laser-scanning coherentanti-Stokes Raman scattering microscopy and applications to cellbiology. Biophys. J. 83:502–509.
18. Jungst, C., M. J. Winterhalder, and A. Zumbusch. 2011. Fast and longterm lipid droplet tracking with CARS microscopy. J. Biophoton.4:435–441.
19. Krafft, C., B. Dietzek, and J. Popp. 2009. Raman and CARSmicrospec-troscopy of cells and tissues. Analyst (Lond.). 134:1046–1057.
20. Welte, M. A., S. Cermelli, ., S. P. Gross. 2005. Regulation of lipid-droplet transport by the perilipin homolog LSD2. Curr. Biol.15:1266–1275.
21. Fernandez, M. A., C. Albor, ., A. Pol. 2006. Caveolin-1 is essentialfor liver regeneration. Science. 313:1628–1632.
22. Welte, M. A. 2007. Proteins under new management: lipid dropletsdeliver. Trends Cell Biol. 17:363–369.
23. Bostrom, P., L. Andersson, ., S. O. Olofsson. 2007. SNARE proteinsmediate fusion between cytosolic lipid droplets and are implicated ininsulin sensitivity. Nat. Cell Biol. 9:1286–1293.
24. Pliss, A., A. N. Kuzmin, ., P. N. Prasad. 2010. Nonlinear optical im-aging and Raman microspectrometry of the cell nucleus throughout thecell cycle. Biophys. J. 99:3483–3491.
25. Lin, C.-Y., J. L. Suhalim, ., E. O. Potma. 2011. Picosecond spectralcoherent anti-Stokes Raman scattering imaging with principal compo-nent analysis of meibomian glands. J. Biomed. Opt. 16:021104.
26. Pohling, C., T. Buckup, and M. Motzkus. 2011. Hyperspectral dataprocessing for chemoselective multiplex coherent anti-Stokes Ramanscattering microscopy of unknown samples. J. Biomed. Opt.16:021105.
27. Chung, C.-Y., and E. O. Potma. 2013. Biomolecular imaging withcoherent nonlinear vibrational microscopy. Annu. Rev. Phys. Chem.64:77–99.
28. Zhang, D., P. Wang,., J. X. Cheng. 2013. Quantitative vibrational im-aging by hyperspectral stimulated Raman scattering microscopy andmultivariate curve resolution analysis. Anal. Chem. 85:98–106.
29. Masia, F., A. Glen, ., W. Langbein. 2013. Quantitative chemicalimaging and unsupervised analysis using hyperspectral coherentanti-Stokes Raman scattering microscopy. Anal. Chem. 85:10820–10828.
30. Lee, Y. J., S. L. Vega,., M. T. Cicerone. 2013. Quantitative, label-freecharacterization of stem cell differentiation at the single-cell level bybroadband coherent anti-Stokes Raman scattering microscopy. TissueEng. Part C Methods.: 2013 Dec 31 [Epub ahead of print].
31. El-Mashtoly, S. F., D. Petersen,., K. Gerwert. 2014. Label-free imag-ing of drug distribution and metabolism in colon cancer cells by Ramanmicroscopy. Analyst (Lond.). 139:1155–1161.
32. Manders, E. M., J. Stap, ., J. A. Aten. 1992. Dynamics of three-dimensional replication patterns during the S-phase, analyzed bydouble labeling of DNA and confocal microscopy. J. Cell Sci.103:857–862.
33. Manders, E. M. M., F. J. Verbeek, and J. A. Aten. 1993. Measurementof co-localization of objects in dual-color confocal images. J. Microsc.169:375–382.
34. Costes, S. V., D. Daelemans,., S. Lockett. 2004. Automatic and quan-titative measurement of protein-protein colocalization in live cells.Biophys. J. 86:3993–4003.
35. Breiman, L. 2001. Random forests. Mach. Learn. 45:5–32.
36. Miljkovi�c, M., T. Chernenko, ., M. Diem. 2010. Label-free imagingof human cells: algorithms for image reconstruction of Raman hyper-spectral datasets. Analyst (Lond.). 135:2002–2013.
37. Hedegaard, M., C. Matthaus,., J. Popp. 2011. Spectral unmixing andclustering algorithms for assessment of single cells by Raman micro-scopic imaging. Theor. Chem. Acc. 130:1249–1260.
38. Salzer, R. 2009. Infrared and Raman Spectroscopic Imaging. Wiley-VCH, Weinheim, Germany.
39. Diem, M., J. M. Chalmers, and P. R. Griffiths. 2008. Vibrational Spec-troscopy for Medical Diagnosis. John Wiley, Hoboken, NJ.
40. Krafft, C., L. Neudert,., R. Salzer. 2005. Near infrared Raman spectraof human brain lipids. Spectrochim. Acta A Mol. Biomol. Spectrosc.61:1529–1535.
41. Huang, Y.-S., T. Karashima, ., H. O. Hamaguchi. 2005. Molecular-level investigation of the structure, transformation, and bioactivity ofsingle living fission yeast cells by time- and space-resolved Ramanspectroscopy. Biochemistry. 44:10009–10019.
42. Matthaus, C., C. Krafft, ., J. Popp. 2012. Noninvasive imaging ofintracellular lipid metabolism in macrophages by Raman microscopyin combination with stable isotopic labeling. Anal. Chem. 84:8549–8556.
43. Dogariu, A., A. Goltsov,., M. O. Scully. 2008. Concentration depen-dence in coherent Raman scattering. J. Mod. Opt. 55:3255–3261.
44. Paar, M., C. Jungst, ., H. Wolinski. 2012. Remodeling of lipid drop-lets during lipolysis and growth in adipocytes. J. Biol. Chem.287:11164–11173.
45. Rinia, H. A., K. N. J. Burger, ., M. Muller. 2008. Quantitative label-free imaging of lipid composition and packing of individual cellularlipid droplets using multiplex CARS microscopy. Biophys. J.95:4908–4914.
Biophysical Journal 106(9) 1910–1920

1920 El-Mashtoly et al.
46. Lakowicz, J. R. 2006. Principles of Fluorescence Spectroscopy.Springer, New York.
47. Smith, P. J., N. Blunt, ., L. H. Patterson. 2000. Characteristics of anovel deep red/infrared fluorescent cell-permeant DNA probe,DRAQ5, in intact human cells analyzed by flow cytometry, confocaland multiphoton microscopy. Cytometry. 40:280–291.
48. Spandl, J., D. J. White,., C. Thiele. 2009. Live cell multicolor imag-ing of lipid droplets with a new dye, LD540. Traffic. 10:1579–1584.
49. Alberts, B. 2008. Molecular Biology of the Cell. Garland Science,New York.
50. Bravo, R., J. M. Vicencio, ., S. Lavandero. 2011. Increased ER-mitochondrial coupling promotes mitochondrial respiration andbioenergetics during early phases of ER stress. J. Cell Sci.124:2143–2152.
51. Hamada, K., K. Fujita, ., S. Kawata. 2008. Raman microscopy fordynamic molecular imaging of living cells. J. Biomed. Opt. 13:044027.
Biophysical Journal 106(9) 1910–1920
52. Ozeki, Y., W. Umemura,., K. Itoh. 2012. High-speed molecular spec-tral imaging of tissue with stimulated Raman scattering. Nat. Photon.6:845–851.
53. Martin, S., and R. G. Parton. 2006. Lipid droplets: a unified view of adynamic organelle. Nat. Rev. Mol. Cell Biol. 7:373–378.
54. Bozza, P. T., and J. P. B. Viola. 2010. Lipid droplets in inflammationand cancer. Prostaglandins Leukot. Essent. Fatty Acids. 82:243–250.
55. Accioly, M. T., P. Pacheco, ., J. P. Viola. 2008. Lipid bodies are res-ervoirs of cyclooxygenase-2 and sites of prostaglandin-E2 synthesis incolon cancer cells. Cancer Res. 68:1732–1740.
56. Neumann, B., T. Walter,., J. Ellenberg. 2010. Phenotypic profiling ofthe human genome by time-lapse microscopy reveals cell divisiongenes. Nature. 464:721–727.
57. Yuan, Y., H. Failmezger, ., F. Markowetz. 2012. Quantitative imageanalysis of cellular heterogeneity in breast tumors complementsgenomic profiling. Sci. Transl. Med. 4:157ra143.

Supporting Material
Automated Identification of Subcellular Organelles by Coherent Anti-
Stokes Raman Scattering
Samir F. El-Mashtoly,#,§ Daniel Niedieker,#,§ Dennis Petersen,§ Sascha Krauß,§ Erik Freier,§ Abdelouahid Maghnouj,‡ Axel Mosig,§ Stephan Hahn,‡ Carsten Kötting,§ and Klaus Gerwert*,§
§Department of Biophysics, and ‡Department of Molecular GI-Oncology, Clinical Research Center, Ruhr-University Bochum, 44780 Bochum, Germany
1

2
Fig. S1. CARS images were recorded at (A) 2850 cm-1 and (B) 1750 cm-1. (C) Overlay of panels (A) and (B). (D) HCA of Raman dataset in the range of 2800-3100 cm-1. (E) Fluorescence image of lipid droplets. (F), (G), and (H) panels display the overlay (A) and (E), (B) and (E), and lipid droplet cluster from (D) and (E) panels, respectively. The overlapped regions are shown in yellow.

3
Fig. S2. Mean CARS spectra of subcellular organelles.

4
Fig. S3. Automatic identification of the endoplasmic reticulum, Golgi apparatus, and mitochondria. Selective random forests of CARS datasets in which the endoplasmic reticulum (A1-C1), Golgi apparatus (A2-C2), and mitochondria (A3-C3) are displayed in green. (A4-C4) Fluorescence staining (red) of endoplasmic reticulum (A4), Golgi apparatus (B4), and mitochondria (C4) in addition to the nucleus staining (blue). (A5-C5) Overlaid images of random forest classes of endoplasmic reticulum, Golgi apparatus, and mitochondria and the overlapping regions of the three organelles are shown in white.

5
Fig. S4. Simultaneous automatic identification of the endoplasmic reticulum, Golgi apparatus, and mitochondria. (A1-C1) random forest of CARS datasets. (A2-C2) Fluorescence images of the nucleus (blue), endoplasmic reticulum (A2), Golgi apparatus (B2), and mitochondria (C2). (A3-C3) Overlaid images of endoplasmic reticulum, Golgi apparatus, and mitochondria fluorescence (red) from (A2-C2) with their corresponding random forest (green) from (A1-C1) and the overlapping regions are shown in yellow.

6
Fig. S5. Colocalization of endoplasmic reticulum and Golgi apparatus. (A) Fluorescence image of nucleus (blue), endoplasmic reticulum (red), and Golgi apparatus (green). The overlay of endoplasmic reticulum and Golgi apparatus (B), endoplasmic reticulum and nucleus (C), and Golgi apparatus and the nucleus (D) are also shown. The overlaid regions are shown in yellow (B), purple (C) and cyan (D).

7
Fig. S6. Colocalization of endoplasmic reticulum and mitochondria. (A) Fluorescence image of nucleus (blue), endoplasmic reticulum (red), and mitochondria (green). The overlay of endoplasmic reticulum and mitochondria (B), endoplasmic reticulum and nucleus (C), and mitochondria and the nucleus (D) are also shown. The overlaid regions are shown in yellow (B), purple (C) and cyan (D).

8
Fig. S7. Automatic identification of the nucleus and lipid droplets in the living cell. (A) Random forest of CARS dataset of the MIA PaCa-2 cell. (B) Fluorescence imaging of the nucleus (blue) and lipid droplets (olive) of the living MIA PaCa-2 cell. Overlaid images of lipid droplets and the nucleus fluorescence (red) from B with their corresponding random forest classes (green) from A are displayed in C (lipid droplets) and D (nucleus), respectively. The overlapping regions are shown in yellow.

9
Fig. S8. Automatic identification of the nucleus and lipid droplets of HT29 cells based on a classifier trained on MIA PaCa-2 cells. (A) Random forest of CARS dataset of HT29 cells. (B) Fluorescence imaging of the nucleus (blue) and lipid droplets (olive) of HT29 cells. Overlaid images of lipid droplets and the nucleus fluorescence (red) from B with their corresponding random forest classes (green) from A are displayed in C (lipid droplets) and D (nucleus), respectively. The overlapping regions are shown in yellow.