Dosing of Gentamicin in Patients With End-Stage Renal Disease Receiving Hemodialysis
Upload
independentCategory
view
4download
0
Available online at www.sciencedirect.com
08) 450–459www.elsevier.com/locate/lifescie
Life Sciences 82 (20
Time dependent effects of gentamicin on the enzymes of carbohydratemetabolism, brush border membrane and oxidative stress in rat kidney tissues
Anees A. Banday, Neelam Farooq, Shubha Priyamvada, Ahad N.K. Yusufi ⁎, Farah Khan
Department of Biochemistry, Faculty of Life Sciences, Aligarh Muslim University, Aligarh, 202002, India
Received 25 July 2007; accepted 28 November 2007
Abstract
Gentamicin (GM), an antibiotic against life threatening bacterial infection, induces remarkable toxicity in the kidney. Histological studies haveindicated that mitochondria, microsomes, lysosomes and plasma membranes of renal proximal convoluted tubules in particular are major GMtargets. Despite numerous investigations, the biochemical/cellular basis of GM nephrotoxicity is not well understood. Recently reactive oxygenspecies (ROS) are considered to be important mediators of GM-induced nephrotoxicity. We hypothesize that GM causes damage to intracellularorganelles and affects their structural integrity and alters metabolic and other functional capabilities. To address above hypothesis a long-term,time-dependent effect of GM has been studied on blood/urine parameters, enzymes of carbohydrate metabolism, brush border membrane (BBM)and basolateral (BLM), lysosomes and oxidative stress in renal tissues. A nephrotoxic dose of GM (80 mg/kg body weight) was administered torats daily for 15 days. The long-term treatment with GM induced a significant increase in serum creatinine, blood urea nitrogen followed bymassive proteinuria, glucosuria, enzymuria along with loss of electrolytes in the urine. The activities of the enzymes of carbohydrate metabolism,plasma membranes, lysosomes significantly declined. The activities of antioxidant enzymes e.g. superoxide dismutase, catalase and glutathioneperoxidase were severely depressed and lipid peroxidation was significantly increased in the renal cortex and medulla. We conclude that GMadministration induced oxidative damage to renal tissues that resulted in impaired carbohydrate metabolism and decreased activities of BBM,BLM and lysosomes associated with increased lipid peroxides.© 2007 Elsevier Inc. All rights reserved.
Keywords: Gentamicin; Nephrotoxicity; Brush border membrane; Carbohydrate metabolism; Oxidative stress
Introduction
Aminoglycoside antibiotics including gentamicin (GM) arewidely used in the treatment of life threatening gram-negativebacterial infections but their use is sometimes complicated byacute nephrotoxicity (Humes, 1988; Tulkens, 1989). Thespecificity of GM for renal toxicity is apparently related to itsaccumulation in the renal proximal convoluted tubule causing anumber of morphological and biochemical alterations inhumans and experimental animals (Kacew and Bergeron,1990; Ali, 1995; Mingeot-Leclercq et al., 1999). The adverseinteraction of the drugs with critical intracellular processes leadsto renal cortical phospholipidosis disrupting functions ofmembranes and organelles including brush border membrane,mitochondria, lysosomes and microsomes (Mingeot-Leclercq
⁎ Corresponding author. Tel.: +91 571 2700741; fax: +91 571 2706002.E-mail address: [email protected] (A.N.K. Yusufi).
0024-3205/$ - see front matter © 2007 Elsevier Inc. All rights reserved.doi:10.1016/j.lfs.2007.11.014
et al., 1999; Cronin and Henrich, 1996). The biochemical basisof GM toxicity has been the subject of numerous investigationsand has increased our understanding of the drug interaction withrenal tubule cells and the effects of their interactions on cellularfunction and integrity. However, the biochemical eventsunderlying the proximal tubule injury and subsequent renaldysfunction are further complicated due to structural andfunctional heterogeneity of the kidney (Yusufi et al., 1994). Themechanisms involved in GM induced cell injury are not clearlyunderstood. However, reactive oxygen species are considered tobe one of the important mediators of GM nephropathy (Walkeret al., 1999).
Considering potential use of GM as effective antibacterialdrug the present studies were undertaken to gain an insight onthe nephrotoxic effect of GM on the structural integrity andmetabolic functions of the kidney. We propose a hypothesis thatGM exerts its deleterious effects by the disruption of cellularmembranous structures causing impaired cellular metabolism,
451A.A. Banday et al. / Life Sciences 82 (2008) 450–459
ionic imbalances by perturbation of antioxidant defense system.To address this hypothesis, a comprehensive long-term time-dependent effects of (up to 15 days) of a nephrotoxic dose ofGM were determined on various biochemical parameters andvarious enzymes in the blood, urine and different kidney tissuesof rats. The results indicate that various serum/urine biochem-ical parameters, the activities of certain enzymes of carbohy-drate metabolism, brush border membranes and oxidative stresswere selectively altered in a time-dependent manner. The effectswere differentially observed in different renal tissues e.g. insuperficial and juxtamedullary cortex and medulla.
Materials and methods
Materials
Wistar rats were purchased from All India Institute ofMedical sciences (New Delhi, India). p-nitrophenyl phosphate,NADH and NADP+ were purchased from Sigma Chemical Co.(St Louis, MO, USA). Gentamicin was purchased fromNicholas Chemical Co. (Mumbai, India). All other chemicalsused were of analytical grade and were purchased from SigmaChemical Co (St Louis, MO, USA) unless otherwise stated.
Experimental design
Adult male Wistar rats weighing 180–200 g, fed with astandard pellet diet (Amrut Laboratories, Pune, India) and wereallowed free access to water were conditioned for 7 days beforethe start of the experiment. All animals were kept and utilizedunder conditions that prevented them from experiencingunnecessary pain and discomfort according to the guidelinesapproved by Institution Ethical Committee. Rats were separatedinto five groups. Gentamicin sulphate (80 mg/kg body weight/day) was injected intraperitonially (i.p) in one daily dose toGM-treated rats for 5, 9, 12 or 15 days. The rats in the controlgroup and GM-treated rats (for period not treated with GM)received, i.p same volume of 0.9% saline. The experiment wasdesigned in such a way that the animals were sacrificed on sameday i.e. after 15 days from the start of the experiment. Theweights of the animals were recorded at the beginning and endof the experiment. The urine samples from control andexperimental rats were collected for 4 h on the last day ofexperiment. The animals were sacrificed under light etheranesthesia. Blood was withdrawn, kidneys were harvested andcortex and medulla were separated and homogenates and BBMvesicles (BBMV) were prepared according to the methoddescribed below.
Preparation of homogenates to determine enzymes ofcarbohydrate metabolism
After completion of experiment, kidneys were removed,decapsulated and kept in ice cold buffered saline (154 mmol/lNaCl, 5 mmol/l Tris–HCl, pH 7.4). The cortex was carefullyseparated from medulla and a 15% (w/v) homogenate wasprepared in ice cold 100 mmol/l Tris–HCl, pH 7.4, using
Potter–Elvehejem homogenizer (Remi motors, Mumbai, India)by passing 5 pulses. The homogenate was centrifuged at 2000 gat 4 °C for 10 min to remove cell debris and the supernatant thusobtained was saved in aliquots and kept at −20 °C for enzymeanalysis (Khundmiri et al., 2004).
Preparation of brush border membrane
Brush border membrane vesicles (BBMV) fractions wereprepared at 4 °C from homogenates of whole cortex (BBMV-WC), superficial cortex (BBMV-SC) and juxtamedullary cortex(BBMV-JMC) from the pool of same kidneys simultaneouslyusing MgCl2 precipitation techniques exactly as previouslydescribed (Khundmiri et al., 2005). Briefly, freshly mincedtissues were homogenized in 50 mmol/l mannitol, 5 mmol/lTris–HEPES buffer, pH 7.0, in a glass Teflon homogenizer(Thomas PA, USA) with 5 complete passes. The homogenatewas then subjected to high speed Ultra-Turrex Kunkelhomogenizer (Type T-25, Janke & Kunkel GMBH & Co. KG.Staufen) for 3 passes of 15 s each with an interval of 15 sbetween each pass. MgCl2 was added to the homogenate to afinal concentration of 10 mmol/l and the mixture stirred for20 min on ice. The homogenate was centrifuged at 2000 g in aBeckman centrifuge (J2 MI, Beckman instruments. Inc PaloAlto, CA, USA) using JA-17 rotor. The supernatant was thenrecentrifuged at 35,000 g for 30 min. The pellet wasresuspended in 300 mmol/l mannitol, 5 mmol/l Tris–HEPESbuffer, pH 7.4, with 4 passes by a loose fitting Douncehomogenizer (Wheaton IL., USA) in a 15 ml corex tube andcentrifuged at 35,000 g for 20 min. The outer white fluffy pelletof BBM was resuspended in buffered 300 mmol/l mannitol.Aliquots of homogenates (after high speed homogenization)and BBMV thus prepared were saved and stored at −20 °C untilfurther analysis for BBM enzymes.
Enzyme assays
The activities of marker enzymes in the homogenate andBBM fraction were determined by standard methods asdescribed in a previous study (Khundmiri et al., 2005, 1997).Km and Vmax were determined by assaying these enzymes atvarious substrate concentrations, 0.6–5.0 mmol/l for alkalinephosphatase (AlkPase), 0.1–0.6 mmol/l for γ-glutamyl trans-peptidase (GGTase), 0.1–0.71 mmol/l for leucine aminopepti-dase (LAP), 2.5–100 mmol/l for maltase and analyzing the databy Lineweaver–Burk plot. Protein concentrations in BBMVpreparations and homogenates were determined by the methodof Lowry et al. (1951) as modified by Yusufi et al. (1994).
The activities of lactate dehydrogenase (LDH), malatedehydrogenase (MDH), isocitrate dehydrogenase (ICDH),succinate dehydrogenase (SDH), glucose-6-phosphate dehy-drogenase (G6PDH), malic enzyme (ME), Na+K+ATPase,glucose-6-phosphatase (G6Pase), fructose-1,6-bisphosphatase(F1,6BPase), acid phosphatase (Acid Pase) were determined ina spectrophotometer (Cintra 5, GBC, Scientific Equipment. Pty.Australia) as previously described (Khundmiri et al., 2004;Farooq et al., 2006).
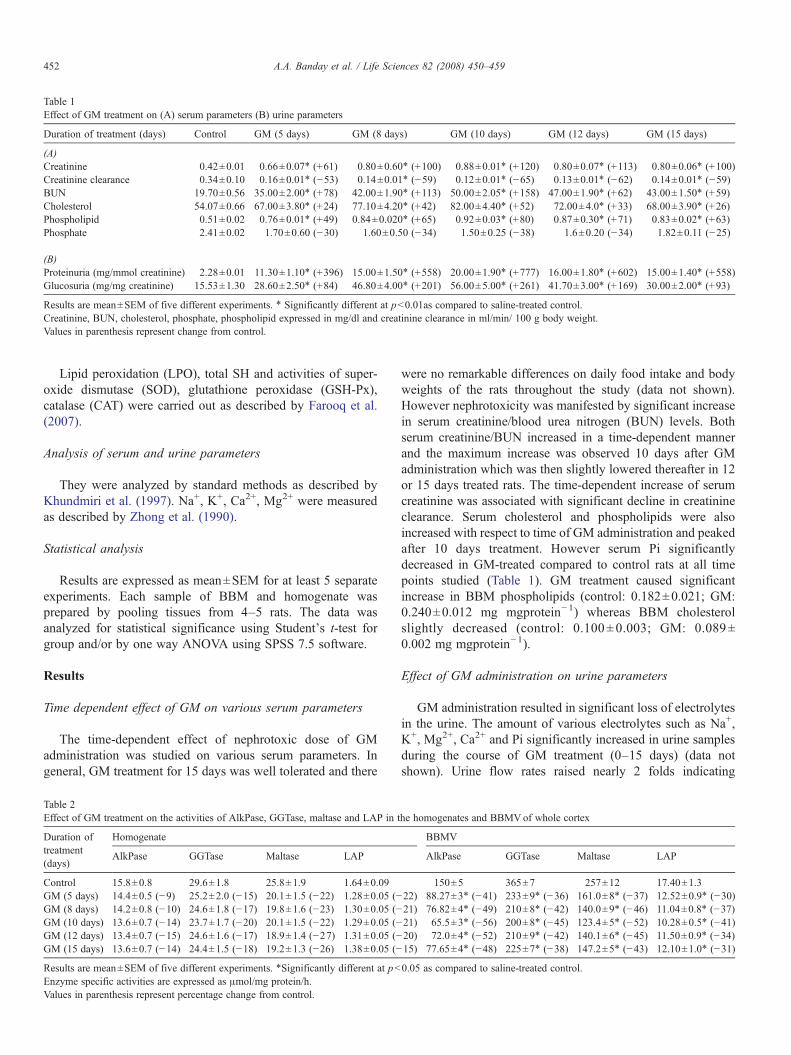
Table 1Effect of GM treatment on (A) serum parameters (B) urine parameters
Duration of treatment (days) Control GM (5 days) GM (8 days) GM (10 days) GM (12 days) GM (15 days)
(A)Creatinine 0.42±0.01 0.66±0.07⁎ (+61) 0.80±0.60⁎ (+100) 0.88±0.01⁎ (+120) 0.80±0.07⁎ (+113) 0.80±0.06⁎ (+100)Creatinine clearance 0.34±0.10 0.16±0.01⁎ (−53) 0.14±0.01⁎ (−59) 0.12±0.01⁎ (−65) 0.13±0.01⁎ (−62) 0.14±0.01⁎ (−59)BUN 19.70±0.56 35.00±2.00⁎ (+78) 42.00±1.90⁎ (+113) 50.00±2.05⁎ (+158) 47.00±1.90⁎ (+62) 43.00±1.50⁎ (+59)Cholesterol 54.07±0.66 67.00±3.80⁎ (+24) 77.10±4.20⁎ (+42) 82.00±4.40⁎ (+52) 72.00±4.0⁎ (+33) 68.00±3.90⁎ (+26)Phospholipid 0.51±0.02 0.76±0.01⁎ (+49) 0.84±0.020⁎ (+65) 0.92±0.03⁎ (+80) 0.87±0.30⁎ (+71) 0.83±0.02⁎ (+63)Phosphate 2.41±0.02 1.70±0.60 (−30) 1.60±0.50 (−34) 1.50±0.25 (−38) 1.6±0.20 (−34) 1.82±0.11 (−25)
(B)Proteinuria (mg/mmol creatinine) 2.28±0.01 11.30±1.10⁎ (+396) 15.00±1.50⁎ (+558) 20.00±1.90⁎ (+777) 16.00±1.80⁎ (+602) 15.00±1.40⁎ (+558)Glucosuria (mg/mg creatinine) 15.53±1.30 28.60±2.50⁎ (+84) 46.80±4.00⁎ (+201) 56.00±5.00⁎ (+261) 41.70±3.00⁎ (+169) 30.00±2.00⁎ (+93)
Results are mean±SEM of five different experiments. ⁎ Significantly different at pb0.01as compared to saline-treated control.Creatinine, BUN, cholesterol, phosphate, phospholipid expressed in mg/dl and creatinine clearance in ml/min/ 100 g body weight.Values in parenthesis represent change from control.
452 A.A. Banday et al. / Life Sciences 82 (2008) 450–459
Lipid peroxidation (LPO), total SH and activities of super-oxide dismutase (SOD), glutathione peroxidase (GSH-Px),catalase (CAT) were carried out as described by Farooq et al.(2007).
Analysis of serum and urine parameters
They were analyzed by standard methods as described byKhundmiri et al. (1997). Na+, K+, Ca2+, Mg2+ were measuredas described by Zhong et al. (1990).
Statistical analysis
Results are expressed as mean±SEM for at least 5 separateexperiments. Each sample of BBM and homogenate wasprepared by pooling tissues from 4–5 rats. The data wasanalyzed for statistical significance using Student's t-test forgroup and/or by one way ANOVA using SPSS 7.5 software.
Results
Time dependent effect of GM on various serum parameters
The time-dependent effect of nephrotoxic dose of GMadministration was studied on various serum parameters. Ingeneral, GM treatment for 15 days was well tolerated and there
Table 2Effect of GM treatment on the activities of AlkPase, GGTase, maltase and LAP in t
Duration oftreatment(days)
Homogenate
AlkPase GGTase Maltase LAP
Control 15.8±0.8 29.6±1.8 25.8±1.9 1.64±0.09GM (5 days) 14.4±0.5 (−9) 25.2±2.0 (−15) 20.1±1.5 (−22) 1.28±0.05 (−GM (8 days) 14.2±0.8 (−10) 24.6±1.8 (−17) 19.8±1.6 (−23) 1.30±0.05 (−GM (10 days) 13.6±0.7 (−14) 23.7±1.7 (−20) 20.1±1.5 (−22) 1.29±0.05 (−GM (12 days) 13.4±0.7 (−15) 24.6±1.6 (−17) 18.9±1.4 (−27) 1.31±0.05 (−GM (15 days) 13.6±0.7 (−14) 24.4±1.5 (−18) 19.2±1.3 (−26) 1.38±0.05 (−
Results are mean±SEM of five different experiments. ⁎Significantly different at pbEnzyme specific activities are expressed as μmol/mg protein/h.Values in parenthesis represent percentage change from control.
were no remarkable differences on daily food intake and bodyweights of the rats throughout the study (data not shown).However nephrotoxicity was manifested by significant increasein serum creatinine/blood urea nitrogen (BUN) levels. Bothserum creatinine/BUN increased in a time-dependent mannerand the maximum increase was observed 10 days after GMadministration which was then slightly lowered thereafter in 12or 15 days treated rats. The time-dependent increase of serumcreatinine was associated with significant decline in creatinineclearance. Serum cholesterol and phospholipids were alsoincreased with respect to time of GM administration and peakedafter 10 days treatment. However serum Pi significantlydecreased in GM-treated compared to control rats at all timepoints studied (Table 1). GM treatment caused significantincrease in BBM phospholipids (control: 0.182±0.021; GM:0.240±0.012 mg mgprotein−1) whereas BBM cholesterolslightly decreased (control: 0.100±0.003; GM: 0.089±0.002 mg mgprotein−1).
Effect of GM administration on urine parameters
GM administration resulted in significant loss of electrolytesin the urine. The amount of various electrolytes such as Na+,K+, Mg2+, Ca2+ and Pi significantly increased in urine samplesduring the course of GM treatment (0–15 days) (data notshown). Urine flow rates raised nearly 2 folds indicating
he homogenates and BBMVof whole cortex
BBMV
AlkPase GGTase Maltase LAP
150±5 365±7 257±12 17.40±1.322) 88.27±3⁎ (−41) 233±9⁎ (−36) 161.0±8⁎ (−37) 12.52±0.9⁎ (−30)21) 76.82±4⁎ (−49) 210±8⁎ (−42) 140.0±9⁎ (−46) 11.04±0.8⁎ (−37)21) 65.5±3⁎ (−56) 200±8⁎ (−45) 123.4±5⁎ (−52) 10.28±0.5⁎ (−41)20) 72.0±4⁎ (−52) 210±9⁎ (−42) 140.1±6⁎ (−45) 11.50±0.9⁎ (−34)15) 77.65±4⁎ (−48) 225±7⁎ (−38) 147.2±5⁎ (−43) 12.10±1.0⁎ (−31)
0.05 as compared to saline-treated control.
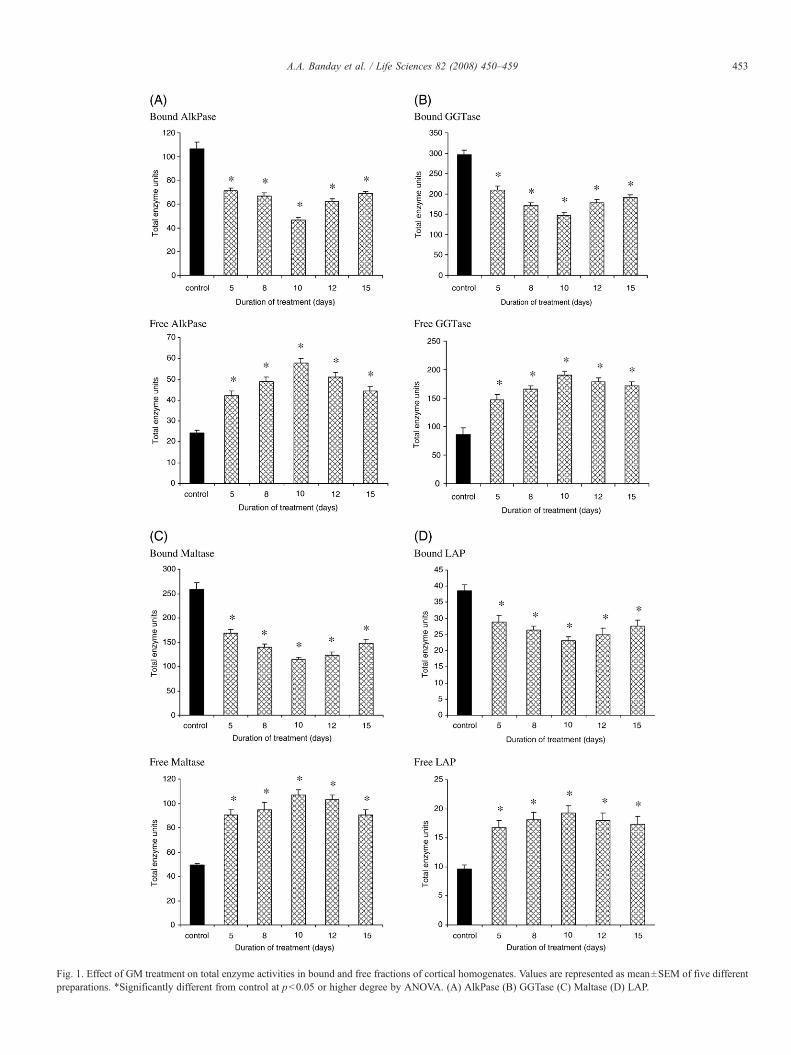
Fig. 1. Effect of GM treatment on total enzyme activities in bound and free fractions of cortical homogenates. Values are represented as mean±SEM of five differentpreparations. ⁎Significantly different from control at pb0.05 or higher degree by ANOVA. (A) AlkPase (B) GGTase (C) Maltase (D) LAP.
453A.A. Banday et al. / Life Sciences 82 (2008) 450–459
454 A.A. Banday et al. / Life Sciences 82 (2008) 450–459
polyuria. This was accompanied by GM-induced massiveproteinuria and glucosuria (Table 1). The changes producedby GM in electrolytes, protein and glucose excretion were alsomaximally observed 10 days after GM administration and wereslightly lowered thereafter. In addition several cellular enzymesespecially belonging to BBM, lysosomes and cytosol e.g.AlkPase, GGTase, AcidPase and LDH were profoundlyexcreted in the urine by GM treatment in a time-dependentfashion. Similar to loss of electrolyte, glucose and protein themaximum loss of enzymes was also observed after 10 days GMadministration (data not shown).
Effect of GM administration on BBM enzymes in different renaltissues and isolated BBMV
The time-dependent effect of GM was determined on BBMmarker enzymes in the homogenates and BBMV prepared fromwhole, superficial and juxtamedullary cortex. The activities ofAlkPase, GGTase, maltase and LAP were not affectedsignificantly by GM during the course of the treatment in thehomogenates. However, the activities of these enzymes weresignificantly decreased by GM administration compared tocontrol in BBMV isolated from whole cortex. The decrease inthe activities was linearly proportional to the time of thetreatment and the maximum decrease in all the enzymes wasobserved after 10 days GM treatment (Table 2). The activities ofAlkPase and maltase appeared to be decreased to greater extentthan those of GGTase and LAP in BBMV prepared from totalcortex. After 12 and 15 days of GM administration extent ofdecrease was less as compared to 10 day treated rats (Table 2).As the enzyme specific activities (activity/mg protein) werefound to be altered in BBMV fractions and not in thehomogenates, further analysis of homogenates after centrifuga-tion showed that the total enzyme activities (expressed asenzyme units) significantly declined in the membrane-boundfractions whereas increased in the supernatant fractions (Fig. 1).The changes observed were found to be in proportion to theduration of GM treatment showing maximum alterations in theenzyme activities after 10 days GM administration. The results
Table 3Effect of 10 days GM treatment on the activities of AlkPase, GGTase, maltase and LAcortex (JMC)
Homogenate
SC JMC
AlkPase Control 15.2±1.0 13.1±GM 13.4±0.9 (−12) 11.8±
GGTase Control 29.4±2.0 55.4±GM 25.4±2.1 (−14) 47.4±
Maltase Control 28.4±2.0 19.2±GM 23.2±2.0 (−18) 17.8±
LAP Control 1.5±0.10 3.5±GM 1.3±0.11 (−13) 2.9±
Results are mean±SEM of five different experiments.⁎Significantly different at pb0.05 as compared to saline-treated control.Enzyme specific activities are expressed as μmol/mg protein/h.Values in parenthesis represent percentage change from control.
clearly demonstrate that GM caused severe damage to BBM dueto which the enzymes were dissociated/released from themembrane and appeared in the supernatant in free soluble formmay have excreted in the urine.
As morphologic studies indicated that proximal convolutedtubules (located in superficial cortex) compared to proximalstraight tubules (located in juxtamedullary cortex) are greatlydamaged by GM, the effect of GM (10 days) on these enzymeswas studied in the BBMV isolated from whole (BBMV-WC),superficial (BBMV-SC) and juxtamedullary (BBMV-JMC)cortices. As shown in Table 3, the activities of BBM enzymesdecreased both in BBMV-SC and BBMV-JMC by GMcompared with respective control values. However the decreasein enzyme activities was much greater in BBMV-SC than inBBMV-JMC indicating greater damage to superficial thanjuxtamedullary nephrons as reported by morphologic studies.Similar to whole cortex, the activities of AlkPase, maltase,GGTase and LAP were decreased in both superficial andjuxtamedullary homogenates in membrane-bound enzymes(data not shown). The decrease in BBM enzyme activities invarious BBM populations was manifested by kinetic features ofthe enzymes. Apparent Km and Vmax values were determinedgraphically from double reciprocal plots. The results (Table 4)indicate that the decrease in the enzyme activities was attributedmainly due to decrease in maximal velocity (Vmax) of theenzyme activities rather than in Michaelis constant (Km) values.The decrease in Vmax values was always greater in BBMV-SCthan in BBMV-JMC.
Effect of GM on enzymes of carbohydrate metabolism
The main function of kidney i.e. reabsorption of variousions and solutes depends on the continuous energy supply asATP which is generated by various metabolic pathwaysincluding glycolysis and oxidative metabolism. The acuterenal failure produced by toxic insult leads to reduce oxygenconsumption due to damage caused to mitochondria and otherorganelles (Mingeot-Leclercq et al., 1999; Humes and Wein-berg, 1983). A time-dependent effect of GM administration
P in the homogenates and BBMVof superficial cortex (SC) and juxtamedullary
MV
SC JMC
1.1 151.51±5.0 126.33±3.00.9 (−10) 53.05±4.0⁎ (−65) 88.16±2.0⁎ (−30)3.0 300.30±18 600.50±223.1 (−14) 150.60±10⁎ (−50) 371.87±15⁎ (−38)1.5 300.00±18 201.50±121.2 (−7) 120.00±8⁎ (−60) 145.08±9⁎ (−28)0.2 14.50±1.0 37.03±3.00.1 (−17) 7.75±0.5⁎ (−47) 25.16±1.6⁎ (−32)
Table 4Effect of 10 days GM treatment on kinetic parameters of BBM enzymes: AlkPase, GGTase, maltase, LAP isolated from whole cortex (WC), superficial cortex (SC)and juxtamedullary cortex (JMC)
BBMV-WC BBMV-SC BBMV-JMC
Vmax (μmol/mg protein/h) Km (×10−3 M) Vmax (μmol/mg protein/h) Km (×10−3 M) Vmax (μmol/mg protein/h) Km (×10−3 M)
AlkPase Control 150.00±7 0.114±0.005 250.00±10 0.190±0.009 156.25±8 0.200±0.009GM 88.23±4⁎ 0.119±0.006 136.36±6⁎ 0.200±0.010 117.00±7⁎ 0.200±0.010
GGTase Control 250.00±12 0.800±0.040 272.15±15 0.057±0.001 500.00±20 0.800±0.010GM 176.47±9⁎ 0.760±0.040 166.66±9⁎ 0.055±0.001 375.00±18⁎ 0.880±0.050
Maltase Control 157.90±8 20.00±1.0 358.85±15 10.00±0.5 187.50±8 13.330±0.5GM 98.70±4⁎ 20.00±1.8 209.80±11⁎ 10.00±0.4 150.01±7⁎ 13.330±0.4
LAP Control 18.75±1.3 0.40±0.20 17.75±1.1 0.400±0.02 38.46±2.0 0.260±0.02GM 11.53±0.5⁎ 0.39±0.01 10.03±0.5⁎ 0.400±0.01 26.31±1.9⁎ 0.250±0.02
Values are mean±SEM of three different experiments.Values are calculated from Lineweaver–Burk Plots (data not shown).⁎Significantly different at pb0.01 as compared to saline-treated control.
455A.A. Banday et al. / Life Sciences 82 (2008) 450–459
has been studied on the enzymes of various metabolicpathways in the homogenates prepared from renal wholecortex (WC) and medulla to delineate GM effect on renalmetabolic functions. The activities of lactate (LDH, glycoly-sis); isocitrate (ICDH), succinate (SDH) and malate dehydro-genases (TCA cycle), glucose-6-(G6Pase) and fructose 1,6 bis(FBPase) phosphatases (gluconeogenesis) and glucose-6-phos-phate dehydrogenase (G6PDH, HMP-Shunt pathway) andmalic enzyme (ME) were determined simultaneously underidentical experimental conditions to rule out any day to dayvariations. The activities of various enzymes altered differen-tially during the course of GM treatment both in the cortex andmedulla. The activity of LDH significantly increased after 5, 8and 10 days GM treatment compared to control rats both in
Table 5Effect of GM treatment on the activities of LDH, MDH, ICDH and SDH (A) 5–15treatment in the homogenates of superficial cortex and juxtamedullary cortex
Duration oftreatment(days)
Whole cortex
LDH MDH ICDH SDH
(A)Control 20.01±0.03 109.26±3.0 8.2±0.32 12.02±GM (5 days) 24.20±0.05⁎
(+21)89.60±2.0⁎
(−18)6.1±0.19⁎
(−26)7.80±0(−35)
GM (8 days) 26.40±0.06⁎
(+32)75.40±2.5⁎
(−31)5.8±0.21⁎
(−29)7.10±0(−41)
GM (10 days) 28.38±0.08⁎
(+42)67.70±2.0⁎
(−38)5.0±0.17⁎
(−39)6.10±0(−50)
GM (12 days) 27.06±0.06⁎
(+35)85.25±3.0⁎
(−22)5.3±0.17⁎
(−35)6.40±0(−47)
GM (15 days) 26.52±0.05⁎
(+33)89.48±3.0⁎
(−18)4.7±0.19⁎
(−43)7.00±0(−42)
Superficial cortex
LDH MDH ICDH SDH
(B)Control 21.40±0.4 107.31±5.0 9.50±0.12 14.00±GM 31.03±0.8⁎
(+45)66.50±2.0⁎
(−38)5.22± .09⁎
(−45)6.72±0(−52)
Results are mean±SEM of five different experiments. ⁎Significantly different at pbEnzyme specific activities are expressed as μmol/mg protein/h. Values in parenthesi
cortex and medulla however, slightly declined after 12 and15 days treatment and remained significantly higher thancontrol values (Table 5A). In contrast to LDH, the activities ofICDH, SDH and MDH (TCA cycle enzymes) markedlydecreased in a time-dependent manner showing maximumdecrease after 10 days GM treatment. However the decrease inthe enzyme activities appeared to be greater in the cortex thanin medulla at all time points. Further analysis showed that theincrease of LDH and respective decrease of ICDH, SDH andMDH activities were more pronounced in the superficialcompared to juxtamedullary cortex after 10 days GM treatment(Table 5B).
The effect of GM was also determined on the activities ofG6Pase and FBPase representative enzymes of gluconeogenesis.
days treatment in the homogenates of whole cortex and medulla (B) 10 days
Medulla
LDH MDH ICDH SDH
0.42 31.06±1.0 102.84±2.0 6.20±0.01 9.20±0.36.29⁎ 37.18±0.9⁎
(+20)86.56±3.0⁎
(−16)4.96±0.09⁎
(−20)7.30±0.3⁎
(−21).24⁎ 39.00±1.0⁎
(+26)72.73±2.0⁎
(−29)4.50±0.08⁎
(−27)6.67±0.29⁎
(−28).22 44.60±1.0⁎
(+44)70.20±2.0⁎
(−32)4.50±0.07⁎
(−27)6.31±0.31⁎
(−31).25⁎ 40.26±1.0⁎
(+30)84.78±3.0⁎
(−18)4.27±0.08⁎
(−31)6.75±0.35⁎
(−27).28⁎ 39.90±0.8⁎
(+29)88.43±2.0(−14)
4.75±0.05⁎
(−23)6.97±0.28⁎
(−24)
Juxtamedullary cortex
LDH MDH ICDH SDH
0.9 29.85±0.6 100.03±3.0 6.00± .09 8.52±0.89.9⁎ 39.70±1.0⁎
(+33)72.96±2.0(−27)
4.08± .07⁎
(−32)5.52±0.68⁎
(−35)
0.05 as compared to saline-treated control.s represents percentage change from control.
Table 6Effect of GM treatment on the activities of G6Pase, FBPase, G6PDH and ME (A) 5–15 days treatment in the homogenates of whole cortex and medulla (B) 10 daystreatment in the homogenates of superficial cortex and juxtamedullary cortex
Duration oftreatment(days)
Whole cortex Medulla
G6Pase FBPase G6PDH ME G6Pase FBPase G6PDH ME
(A)Control 0.296±0.012 0.856±0.080 1.29±0.050 12.92±0.51 0.197±0.006 0.740±0.054 0.942±0.030 9.20±0.22GM (5 days) 0.250±0.010⁎
(−16)0.688±0.520⁎
(−20)1.54±0.070⁎
(+26)9.10±0.38⁎
(−30)0.180±0.006(−9)
0.620±0.055⁎
(−16)0.980±0.040(+4)
7.80±0.12⁎
(−15)GM (8 days) 0.240±0.012⁎
(19)0.650±0.053⁎
(−24)1.62±0.060⁎
(+26)8.70±0.35⁎
(−33)0.170±0.005⁎
(−14)0.600±0.051⁎
(−19)1.080±0.060⁎
(+15)7.70±0.18⁎
(−16)GM (10 days) 0.200±0.008⁎
(−32)0.620±0.053⁎
(−28)1.68±0.060⁎
(−28)8.20±0.32⁎
(−37)0.158±0.005⁎
(−20)0.580±0.059⁎
(−22)1.180±0.06⁎
(+26)6.84±0.13⁎
(−26)GM (12 days) 0.210±0.008⁎
(−22)0.670±0.050⁎
(−22)1.50±0.040⁎
(+16)8.40±0.35(−35)
0.160±0.007⁎
(−19)0.600±0.058⁎
(−19)1.150±0.04⁎
(+22)6.76±0.13⁎
(−27)GM (15 days) 0.230±0.009⁎
(−22)0.680±0.510⁎
(−20)1.45±0.050⁎
(+12)8.68±0.36(−33)
0.160±0.007⁎
(−19)0.610±0.062⁎
(−18)1.140±0.05(+21)
7.28±0.01⁎
(−21)
Superficial cortex Juxtamedullary cortex
G6Pase FBPase G6PDH ME G6Pase FBPase G6PDH ME
(B)Control 0.35±0.02 0.86±0.09 1.32±0.03 13.4±0.33 0.26±0.01 0.75±0.02 0.924±0.06 9.2±0.31GM 0.22±0.01⁎
(−37)0.56±0.04⁎
(−35)1.78±0.04(+35)
7.8±0.11(−42)
0.18±0.01⁎
(−29)0.55±0.04⁎
(−26)1.16±0.02(+26)
6.44±0.13⁎
(−30)
Results are mean±SEM of five different experiments.⁎Significantly different at pb0.05 as compared to saline-treated control.Enzyme specific activities are expressed as μmol/mg protein/h. Values in parenthesis represents percentage change from control.
456 A.A. Banday et al. / Life Sciences 82 (2008) 450–459
The activities of these enzymes also decreased in a time-dependent manner and the maximum decrease like TCA cycleenzymes was observed after 10 days GM treatment. Theenzymes were affected to much greater extent in the cortexthan in medulla (Table 6A). Likewise the activity of both theenzymes was greatly decreased in the superficial than injuxtamedullary cortex (Table 6B). In addition, GM effect wasalso determined on the activities of G6PDH, an enzyme of HMP-Shunt pathway and malic enzyme (ME), both supplyingNADPH for biosynthesis of lipids and in the maintenance of
Table 7(A): Effect of 5–15 days GM treatment on the activities of Na+–K ATPase and ACPtreatment on the activities of Na+–ATPase and ACPase in the homogenates of SC a
Duration oftreatment(Days)
Whole cortex
Na+–K ATPase AcidPase
(A)Control 5.02±0.19 10.42±0.40GM (5 days) 4.21±0.18⁎ (−16%) 7.68±0.20⁎ (−2GM (8 days) 3.10±0.13 (−38%) 7.40±0.25⁎ (−2GM (10 days) 2.85±0.12⁎ (−43%) 7.21±0.23⁎ (−3GM (12 days) 2.95±0.12⁎ (41%) 8.73±0.24⁎ (−1GM(15 days) 3.40±0.15⁎ (−32%) 8.95±0.22⁎ (−1
Superficial cortex
Na+–K ATPase AcidPase
(B)Control 5.30±0.25 10.50±0.40GM 2.33±0.20⁎ (−56) 7.39±0.31⁎ (−30
Results are mean±SEM of three different experiments. ⁎Significantly different at pEnzyme specific activities are expressed as μmol/mg protein/h. Values in parenthesi
higher reduction potential in the cell. The activity of G6PDHsignificantly increased whereas ME activity decreased in a time-dependent fashion in GM-treated compared to control rats andthe effect was more pronounced in the superficial than injuxtamedullary cortex. The activity of Na+K+ATPase, enzyme ofBLM declined significantly after GM treatment the maximumeffect was observed after 10 days GM exposure and the effectwas more pronounced in the superficial compared to juxtame-dullary cortex. Activity of lysosomal enzyme, acidphosphatasealso declined in a similar manner (Table 7).
ase in the homogenates of whole cortex and medulla (B) Effect of 10 days GMnd JMC
Medulla
Na+–K ATPase AcidPase
4.30±0.09 6.24±0.305.4%) 3.87±0.05 (−10%) 4.88±0.58⁎ (−21%)9%) 3.36±0.06⁎ (−22%) 4.75±0.14⁎ (−23%)1%) 3.20±0.06⁎ (−21%) 4.62±0.16 (−15%)6%) 3.38±0.06⁎ (−21%) 5.30±0.18⁎ (−15%)4%) 3.62±0.08⁎ (−16%) 5.40±0.17 (−13%)
Juxtamedullary cortex
Na+–K ATPase AcidPase
4.89±0.40 7.20±0.30) 3.27±0.40⁎ (−33) 5.56±0.21⁎ (−23)
b0.05 as compared to saline-treated control.s represent percent change from control.
Table 8Effect of 10 days GM treatment on enzymatic and non-enzymatic antioxidant parameters in homogenates of whole cortex and medulla
LPO(nmol g tissue−1)
Total-SH(µmol g tissue−1)
SOD(units mg protein−1)
CAT(µmol mg protein−1min−1)
GSH-Peroxidase(µmol mg protein−1min−1)
Whole cortexControl 162.06±5.96 5.01±0.57 14.44±0.66 203.42±2.60 0.377±0.01GM 237.50±8.31⁎ (+47) 3.37±0.10 (−33) 4.78±0.57⁎ (−67) 113.76±2.38⁎ (−44) 0.227±0.02⁎ (−40)
MedullaControl 108.98±5.57 1.90±0.03 20.90±0.47 103.25±4.32 0.508±0.04GM 127.18±1.12⁎ (+17) 1.36±0.04⁎ (−29) 8.64±0.97⁎ (−59) 77.02±0.59⁎ (−25) 0.323±0.04⁎ (−36)
Results are mean±SEM of three different experiments.⁎Significantly different at pb0.05 as compared to saline-treated control.Values in parenthesis represent percent change from control.
457A.A. Banday et al. / Life Sciences 82 (2008) 450–459
Effect of GM treatment on non-enzymatic and enzymaticantioxidant parameters
The effect of GM was determined on various antioxidantparameters after 10 days treatment in the renal cortex andmedulla. As shown in Table 8, lipid peroxidation (LPO)measured in terms of malondialdehyde (MDA) significantlyincreased whereas total thiol (SH-content) decreased both in thecortex and medulla indicating GM-induced renal injury whichwas more apparent in the cortex compared to medulla. GMadministration caused profound decrease in the activities ofantioxidant enzymes. The activities of Cu, Zn superoxidedismutase (SOD), catalase (CAT) and glutathione peroxidase(GSH-Px) decline to much greater extent in the cortex than inmedulla.
Discussion
Gentamicin, an effective and widely used aminoglycosideantibiotic is known to be potentially nephrotoxic despite closeattention to the pharmacokinetics and dosing schedules of thedrug (Kaloyanides and Pastoriza-Munoz, 1980; Ishikawa et al.,1985). GM has been shown to cause marked histologicaldamage in particular to renal proximal convoluted tubules(Humes and Connor, 1988; Abdel-Gayoum et al., 1994)resulting in swelling, vacuolization and necrosis of epithelialcells and accumulation of myelin-like bodies (Pedraza-Chaverriet al., 2000; Ali and Bashir, 1994). The proximal tubule injuryand subsequent renal dysfunction has been attributed to theaccumulation of the drug (Hori and Inui, 1989) in the tubulecells and its interactions with brush border and basolateralmembranes and other organelles leading to disruption of theirfunctions. Despite the accumulations of large body of data inlast few decades on histological and morphological renaldamage, the biochemical events and or/mechanisms involved inthe cellular response to renal injury are not completelyelucidated, neither those participating in inflammation, necrosisand oxidative stress or energy yielding metabolic activities. Theprimary purpose of the present studies was to investigate time-dependent long-term effects of GM on various serum/urinebiochemical parameters and on the activities of variousenzymes of carbohydrate metabolism, brush border membranesand oxidative stress representing the functional capacity and
structural integrity of many intracellular organelles in the ratkidney. Since kidney demonstrates structural and functionalheterogeneity, the studies were extended to observe the effect ofGM in various tissue zones of rat kidney to delineate the majorsite of its action.
The present results demonstrate that GM administrationproduced a typical pattern of nephrotoxicity as characterizedby marked increase in serum creatinine and blood ureanitrogen (BUN) followed by a variety of functional alterationsin the kidney. These alterations were manifested by massiveenzymuria (e.g. brush border membrane enzymes, lysosomalenzymes and LDH), associated with profound glycosuria,phosphaturia and tubular proteinuria with marked loss ofvarious electrolytes such as Na+, K+, Ca 2+, Mg2+. Some ofabove results are in partial agreement with previouslypublished reports (Humes and Connor, 1988). Taken togetherthe present results indicate that significant kidney damage hasoccurred and that GM administration has caused alterations inboth plasma membrane structure and function. It is apparentthat GM-induced renal damage has initiated as early as 5 daysafter treatment and maximum effect was observed after10 days GM administration followed by a slight regenerationas indicated in 12 and 15 days GM-treated compared withcontrol rats.
The structural/functional integrity of proximal tubular BBMand BLM and lysosomes as assessed by the status of theirrespective biomarker enzymes showed a marked reduction inthe activities of AlkPase, GGTase, maltase, LAP (BBMenzymes); Na+–K+ ATPase (BLM enzyme) and AcidPase(lysosomal enzyme) indicating GM-induced damage to BBM,BLM and lysosomes, respectively. The decrease in theactivities of BBM enzymes was much greater in BBMVscompared to respective cortical homogenates. This is supportedby the fact that the activities of BBM marker enzymesdecreased only in the pellet of homogenates (membrane-bound fractions) accompanied by a proportional increase in thesupernatants as shown in Fig. 1. This implies that BBM wasseverely damaged and may have been partially effaced/lost inthe lumen by toxic GM insult as reported in histological studies(Ali, 1995; Abdel-Gayoum et al., 1999; Abu-Speton andAbdel-Gayoum, 2001). The enzymes and other proteiniccomponents appeared to be dissociated from the membranes,released and accumulated in the lumen and later excreted in the
458 A.A. Banday et al. / Life Sciences 82 (2008) 450–459
urine as evident from massive enzymuria and proteinuria. GMinduced greater decrease of BBM enzyme activities in BBMV-SC compared to BBMV-JMC is consistent with the fact thatGM causes greater damage to proximal convoluted tubules(PCT; S1-subsegments) (Ali, 1995; Mingeot-Leclercq et al.,1999) located in superficial cortex in comparison to proximalstraight tubules (PST; S3-subsegment) located mostly in thejuxtamedullary cortex). Kinetic studies strengthen this view-point as the decrease in BBM marker enzyme activities waslargely due to decrease in Vmax with little or no effect on Km
values indicating reduction/loss of active enzyme moleculesfrom the membranes. The AlkPase and maltase to some extentare considered to be marker enzymes of PCT (superficialcortex) whereas GGTase and LAP for PST (juxtamedullarycortex) as evident by their relative enrichment (Yusufi et al.,1994). The greater decrease in AlkPase and maltase activitiesand reduction in Vmax values in BBMV-SC compared toBBMV-JMC by GM provide evidence for its preferred effect onPCT.
The reabsorption of Na+ ions by proximal tubular BBM isconsidered to be the major function of the kidney because thetransport of other ions and various solutes depends directly orindirectly on Na+ reabsorption (Coux et al., 2001). Since thesetransports depends on structural integrity of BBM and availableenergy as ATP which is supplied by various metabolicpathways, it is imperative that any alterations to these pathwayscaused by toxic insult would determine the rate of renaltransport functions (Khundmiri et al., 2004, 2005; Fatima et al.,2005). As shown in the Results, the activities of variousenzymes in glycolysis, TCA cycle, gluconeogenesis and HMPshunt pathway were differentially altered during the course ofGM treatment. GM caused significant increase of LDH andG6PDH activities whereas the activities of ICDH, SDH MDH(TCA cycle); and FBPase, G6Pase (gluconeogenesis) markedlydecreased in a time-dependent manner. GM caused greateralterations in the cortex than in medulla and superficialcompared to juxtamedullary cortex. Although the actual ratesof glycolysis and other pathways were not determined, howevermarked decrease in TCA cycle enzymes indicates an impairedoxidative metabolism of glucose/fatty acids that will lead tolower ATP production most likely due to mitochondrialdysfunction. The marked increase in LDH activity suggests ashift in energy metabolism from aerobic metabolism alterna-tively to anaerobic glycolysis also due to GM-inducedmitochondrial damage. The decrease in TCA cycle enzymesmay have caused decrease in gluconeogenic enzymes. This canbe explained by the fact that lower TCA cycle enzyme activitiesespecially that of MDH will result in lower oxaloaceteteproduction from malate which is required not only for thecontinuation of TCA cycle but also for gluconeogenesis.Thus GM-induced toxicity appeared to be primarily due torenal mitochondrial damage as suggested by morphologicalstudies (Mingeot-Leclercq et al., 1999; Cronin and Henrich,1996).
The activities of G6PDH (HMP-Shunt) and NADP-malicenzyme (ME), which act to produce NADPH to support manyreducing anabolic reactions especially lipid biosynthesis and in
maintaining high GSH levels required under oxidative stressand inflammatory conditions (Carlberg and Mannervik, 1975)were differentially affected by GM. Whereas the activity ofG6PDH profoundly increased, ME activity significantlydecreased. GM induced increase in G6PDH activity may reflectcompensatory glucose oxidation by HMP-Shunt pathway whenTCA cycle enzymes were depressed. The underlying mechan-ism by which GM causes nephrotoxicity is not well understood.However, a large body of evidences indicates that reactiveoxygen species (ROS) are important mediators of GMnephropathy (Walker et al., 1999; Cuzzocrea et al., 2002; Ali,2003). ROS by-products of aerobic metabolism produce cellularinjury and necrosis via several mechanisms including peroxida-tion of lipids, proteins and DNA (Dean et al., 1991; Szabo et al.,1997). Glutathione (GSH) and its redox cycle enzymes e.g.,SOD, catalase, GSH-Px are important cellular defense systemagainst oxidative stress. It has been reported that GM suppressesantioxidant defense enzymes and increases lipid peroxidation inthe kidney (Ali and Bashir, 1996; Parlakpinar et al., 2004;Sandhya et al., 1995). The present results confirm earlierfindings (Walker et al., 1999; Yazar et al., 2003; Karahan et al.,2005) and show that GM administration to normal rats causedsevere damage to renal tissues most likely by ROS mediatedmechanism as evident by decreased activities of aboveantioxidant enzymes and total SH levels that led to increasedlipid peroxidation (LPO). The severity of the damage appearedto be more pronounced in renal cortex than in medulla. Most ofthe present results are in partial agreement with recentlypublished toxico-genomic studies (Amin et al., 2004) in whichGM treatment resulted in the decreased expressions of multiplegenes. Taken together, these studies may be helpful in theelucidation of putative new sensitive biomarkers of GMnephropathy.
Conclusion
The results of the present studies indicate that GM eliciteddeleterious nephrotoxic effects by causing major damage tomitochondria, lysosomes, and basolateral and brush bordermembranes as reflected by significant decrease in the activitiesof specific biomarkers of these intracellular organelles. GMcaused greater damage to cortex compared to medullaespecially to superficial cortex confirming the morphologicaland toxico-genomic observations that showed proximal con-voluted tubules as predominant target of GM nephrotoxicity.GM induced deleterious nephrotoxic effects appeared to bemediated in part due to GM elicited oxidative damage.
Acknowledgements
Research grant (SP/SO/B-93/89) from Department ofScience and Technology (DST), Government of India toANKY and to the department from University Grants Commis-sion (UGC-DRF, DST-FIST) is gratefully acknowledged. AABand NF are recipients of fellowship from Council of Scientificand Industrial Research and SP from Indian Council of MedicalResearch, New Delhi, India.
459A.A. Banday et al. / Life Sciences 82 (2008) 450–459
References
Abdel-Gayoum, A.A., Ali, B.H., Abdel-Razig, K.M., Bashir, A.A., Ghywarsha,K., 1994. Effect of gentamicin-induced nephrotoxicity on some carbohy-drate metabolic pathways in rat renal cortex. Archieves of Toxicology 68,643–647.
Abdel-Gayoum, A.A., El-Jenjan, K.B., Gwarsha, K.A., 1999. Hyperlipidaemiain cisplatin induced nephrotic rats. Human and Experimental Toxicology 18,454–459.
Abu-Speton, K.A., Abddel-Gayoum, A.A., 2001. Effect of fish oil treatment ongentamicin induced nephrotoxicity in rabbits. Archieves of Toxicology 75,284–290.
Ali, B.H., 1995. Gentamicin nephrotoxicity in humans and animals: some recentresearch. General Pharmacology 26, 1477–1487.
Ali, B.H., 2003. Agents ameliorating or augmenting experimental gentamicinnephrotoxicity: some recent research. Food and Chemical Toxicology 41,1447–1452.
Ali, B.H., Bashir, A.A., 1994. Effect of fish oil treatment on gentamicinnephrotoxicity in rats. Annals of Nutrition and Metabolism 38, 336–339.
Ali, B.H., Bashir, A.A., 1996. Effect of superoxide dismutase treatment ongentamicin nephrotoxicity in rats. General Pharmacology 27, 349–353.
Amin, R.P., Vickers, A.E., Sistare, F., Thompson, K.L., Roman, R.J., Lawton,M., Kramer, J., Hamadeh, H.K., Collins, J., Grissom, S., Bennett, L., Tucker,C.J., Wild, S., Kind, C., Oreffo, V., Davis II, J.W., Curtiss, S., Naciff, J.M.,Cunningham, M., Tennant, R., Stevens, J., Car, B., Bertram, T.A., Afshari,C.A., 2004. Identification of putative gene-based markers of renal toxicity.Environmental Health Perspectives 112, 465–479.
Carlberg, I., Mannervik, B., 1975. Purification and characterization of the flavorenzyme glutathione reductase from rat liver. Journal of Biological Chemistry250, 5475–5480.
Coux, G., Trurumper, L., Elias, M.M., 2001. Cortical Na+K+ATPase activity,abundance and distribution after in vivo renal ischemia without reperfusionin rats. Nephron 89, 82–89.
Cronin, R.E., Henrich, W.L., 1996. Toxic nephropathy. In: Brenner, B.M.,Rector, F.C. (Eds.), The kidney, vol. 2. WB. Saunders Co, pp. 1680–1711.
Cuzzocrea, S., Mazzon, E., Dugo, L., Serraino, I., Di Paola, R., Britti, D., DeSarro, A., et al., 2002. A role for superoxide in gentamicin mediatednephropathy in rats. European Journal of Pharmacology 450, 67–76.
Dean, R.T., Hunt, J.V., Grant, A.J., Yamamoto, Y., Niki, E., 1991. Free radicaldamage to proteins: the influence of the relative localization of radicalgeneration, antioxidants and the target proteins. Free Radical Biology andMedicine 11, 161–168.
Farooq, N., Priyamvada, S., Arivarasu, N.A., Salim, S., Khan, F., Yusufi,A.N.K., 2006. Influence of Ramadan type fasting on enzymes ofcarbohydrate metabolism and brush border membrane in small intestineand liver of rat used as a model. British Journal of Nutrition 96, 1087–1094.
Farooq, N., Priyamvada, S., Khan, F., Yusufi, A.N.K., 2007. Time dependenteffect of gentamicin on enzymes of carbohydrate metabolism and terminaldigestion in rat intestine. Human and Experimental Toxicology 26, 1–7.
Fatima, S., Arivarasu, N.A., Banday, A.A., Yusufi, A.N.K., Mahmood, R., 2005.Effect of potassium dichromate on renal brush border membrane enzymesand phosphate transport in rats. Human and Experimental Toxicology 24,631–638.
Hori, R., Inui, K., 1989. Cellular basis of aminoglycoside nephrotoxicity. NewsIn Physiological Sciences 4, 181–184.
Humes, H.D., 1988. Aminoglycoside nephrotoxicity. Kidney International 33,900–911.
Humes, H.D., Connor, R.P.O., 1988. Aminoglycoside nephrotoxicity, In:Schrier, R.W., Gottschalk, C.W. (Eds.), 4th ed. Diseases of the kidney, vol 2.Little Brown, Boston, MA, pp. 1229–1273.
Humes, H.D., Weinberg, J.M., 1983. Alterations in renal tubular cellmetabolism in acute renal failure. Mineral and Electrolyte Metabolism 9,290–305.
Ishikawa, Y., Inui, K., Hori, R., 1985. Gentamicin binding to brush border andbasolateral membranes isolated from rat kidney cortex. Journal ofPharmacobio-Dynamics 8, 931–941.
Kacew, S., Bergeron, M.G., 1990. Pathogenic factors in aminoglycoside-induced nephrotoxicity. Toxicology Letters 51, 241–259.
Kaloyanides, G.J., Pastoriza-Munoz, E., 1980. Aminoglycoside nephrotoxicity.Kidney International 18, 571–582.
Karahan, I., Atessahin, A., Yilmaz, S., Ceribasi, A.O., Sakin, F., 2005.Protective effect of lycopene on gentamicin induced oxidative stress andnephrotoxicity in rats. Toxicology 215, 198–204.
Khundmiri, S.J., Asghar, M., Banday, A.A., Khan, F., Salim, S., Levi, M.,Yusufi, A.N.K., 2005. Effect of reperfusion on sodium dependent phosphatetransport in renal brush border membranes. Biochimica et Biophysica Acta1716, 19–28.
Khundmiri, S.J., Asghar, M., Khan, F., Salim, S., Yusufi, A.N.K., 1997. Effectof reversible and irreversible ischemia on marker enzymes of BBM fromrenal cortical PT subpopulations. American Journal of Physiology 273,F849–F856.
Khundmiri, S.J., Asghar, M., Khan, F., Salim, S., Yusufi, A.N.K., 2004. Effectof ischemia and reperfusion on enzymes of carbohydrate metabolism in ratkidney. Journal of Nephrology 17, 1–7.
Lowry, O.H., Rosebrough, N.J., Randall, R.J., 1951. Protein measurement withfolin phenol reagent. Journal of Biological Chemistry 193, 265–275.
Mingeot-Leclercq, M.P., Glupczynski, Y., Tulkens, P., 1999. Aminoglycoside:activity and resistance. Antimicrobial Agents and Chemotherapy 43,727–737.
Parlakpinar, H., Tasdemir, S., Polat, A., Bay-Karabulut, A., Vardi, N., Uear, M.,et al., 2004. Protective effect of chelerrythrine on gentamicin-inducednephrotoxicity. Cell Biochemistry and Function 24, 41–48.
Pedraza-Chaverri, J., Maldonado, P.D., Medina-Campos, O.N., Olivares-Corichi, I.M., Grandos- Silvestre, M., Hernandez- Pando, R., Ibarra-Rubio, M.E., 2000. Garlic ameliorates gentamicin nephrotoxicity: relation toantioxidants. Free Radical Biology and Medicine 29, 602–611.
Sandhya, P., Mohandass, S., Varalakshmi, P., 1995. Role of DL-lipoic acid ingentamicin induced nephrotoxicity. Molecular and Cellular Biochemistry145, 11–17.
Szabo, C., Cuzzocrea, S., Zingarelli, B., Connor, M., Salzman, A.L., 1997.Endothelial dysfunction in a rat model of endotoxic shock. Journal ofClinical Investigations 100, 723–735.
Tulkens, P.M., 1989. Nephrotoxicity of aminoglycoside antibiotics. ToxicologyLetters 46, 107–123.
Walker, P.D., Barri, Y., Shah, S.V., 1999. Oxidant mechanisms on gentamicinnephrotoxicity. Renal Failure 21, 433–442.
Yazar, E., Elmas, M., Altunok, V., Sivrikaya, A., Oztekin, E., 2003. Effects ofaminoglycoside antibiotic on renal antioxidants, malondialdehyde levels andsome biochemical parameters. Canadian Journal of Veterinary Research 67,239–240.
Yusufi, A.N.K., Murayama, N., Gapstur, S.M., Szczepanska-Konkel, M.,Dousa, T.P., 1994. Differential properties of brush border membrane vesiclesfrom early and late proximal tubules of rat kidney. Biochimica et BiophysicaActa 1191, 113–117.
Zhong, L.F., Zhang, J.G., Ma, S.L., Xia, Y.X., 1990. Protection against cisplatininduced lipid peroxidation and kidney damage by procaine in rats. Archivesof Toxicology 64, 599–600.
Copyright © 2022 FDOKUMEN