differentiation of carbohydrate stereoisomers by infrared
172
DIFFERENTIATION OF CARBOHYDRATE STEREOISOMERS BY INFRARED MULTIPLE PHOTON DISSOCIATION USING A FREE ELECTRON LASER AND A FOURIER TRANSFORM ION CYCLOTRON RESONANCE MASS SPECTROMETER By JOSE J.VALLE A DISSERTATION PRESENTED TO THE GRADUATE SCHOOL OF THE UNIVERSITY OF FLORIDA IN PARTIAL FULFILLMENT OF THE REQUIREMENTS FOR THE DEGREE OF DOCTOR OF PHILOSOPHY UNIVERSITY OF FLORIDA 2005
-
Upload
khangminh22 -
Category
Documents
-
view
0 -
download
0
Transcript of differentiation of carbohydrate stereoisomers by infrared

DIFFERENTIATION OF CARBOHYDRATE STEREOISOMERS BY INFRARED
MULTIPLE PHOTON DISSOCIATION USING A FREE ELECTRON LASER AND A FOURIER TRANSFORM ION CYCLOTRON
RESONANCE MASS SPECTROMETER
By
JOSE J.VALLE
A DISSERTATION PRESENTED TO THE GRADUATE SCHOOL OF THE UNIVERSITY OF FLORIDA IN PARTIAL FULFILLMENT
OF THE REQUIREMENTS FOR THE DEGREE OF DOCTOR OF PHILOSOPHY
UNIVERSITY OF FLORIDA
2005

Copyright 2005
by
José J. Valle

This dissertation is dedicated to my dear friend, Jessica Soto

iv
ACKNOWLEDGMENTS
Many people have supported, guided, helped, and inspired me during the five years
I spent at the University of Florida, and I would like to thank them all for a wonderful
graduate school experience. First, I want to thank Dr. John R. Eyler, my dissertation
advisor, who not only guided my research, but also served as a very patient teaching
mentor and a role model. His suggestions and careful reviews of this dissertation have
improved it greatly. Second, I want to thank my teaching assistant supervisor, Dr.
Kathryn Williams, for her guidance and always sincere help with my English writing.
She was always a person who, in the middle of her busy schedule was, willing to have a
pleasant conversation with me and give me her advice on many things. Additionally, I
would like to thank the members of my dissertation committee, Rick Yost, Jim
Winefordner, Will Harrison, and Charles Telesco, who in one way or another have made
possible the completion of this dissertation.
My research project was a very large effort, involving the collaboration with people
from several different institutions. All of them have in some way contributed to this
dissertation and I want to thank them here. I would like to express special gratitude to
Dr. Jos Oomens from the FOM Institute for Plasma Physics "Rijnhuizen" in the
Netherlands, where the greatest part of this project was carried out. Dr. Oomens’
expertise in IRMPD and lasers was always crucial for the success of this project. Other
people at the FOM Institute devoted substantial time, energy and expertise to make this
work possible. These are Dave Moore, Nick Polfer, Jan Pluygers, and Han de Witte; to

v
them I am very grateful. From the National High Magnetic Field Laboratory (NHMFL),
I want to thank the director of the Ion Cyclotron Resonance (ICR) program, Dr. Alan G.
Marshall, for the financial and technical support that served as one of the initial
incentives to begin this research. My sincere gratitude to Dr. Brad Bendiak from
University of Colorado Health Sciences Center, for his collaboration and for providing
the samples for this work. In addition, I must also thank the staff of the Chemistry
Department at the University of Florida, especially the machine shop (Joe Shalosky and
Todd Prox) for their help in designing and constructing some components of the FTICR
mass spectrometer and the electronics shop (Larry Hartley and Steve Miles). I am also
very grateful to Dr. Jan Szczepanski for his generous assistance in obtaining FTIR spectra
of neutral carbohydrates and for helping me with his expertise on IR-spectroscopy
computer programs.
Graduate life can be tough, but I managed to make it not all work, and I would like
to thank my dear friend, Wilfredo Ortiz, for keeping things fun during those times out of
the lab. I could not have asked for a better friend during my years in Gainesville. Other
friends I want to thank are old college buddies Enid Martinez and Jessica Soto, for
always being on the other side of the phone willing to talk when I needed to hear from a
friend. I want to dedicate this dissertation to Jessica because I know how much she
wanted to finish hers; rest in peace with GOD.
I owe a huge debt of gratitude to my parents for their love, support, and for always
being so proud of me not only throughout the course of my Ph.D. studies but throughout
my entire life.

vi
Finally, but by no means least, I am enormously grateful to my wife, Marie, for her
support and encouragement and for not letting me give up in the worst moments. Her
love and companionship during my graduate life are appreciated more than she knows.
Without her, I could not have come this far.

vii
TABLE OF CONTENTS page
ACKNOWLEDGMENTS ................................................................................................. iv
LIST OF TABLES............................................................................................................. ix
LIST OF FIGURES .............................................................................................................x
ABSTRACT..................................................................................................................... xiii
CHAPTER
1 INTRODUCTION ........................................................................................................1
Carbohydrates: Monosaccharides and Disaccharides...................................................2 Analysis of Carbohydrates by Mass Spectrometry.....................................................11 Differentiation of Carbohydrate Isomers by MS ........................................................17 Objective of this Research ..........................................................................................21 Overview.....................................................................................................................25
2 FOURIER TRANSFORM ION CYCLOTRON RESONANCE MASS SPECTROMETRY.....................................................................................................27
Basic Instrumentation .................................................................................................29 Natural Motion of Trapped Ions .................................................................................35
Cyclotron Motion. ...............................................................................................35 Trapping Motion..................................................................................................38 Magnetron Motion...............................................................................................39
Basics of Operation for the FTICR-MS Technique....................................................40 Mass Resolution..........................................................................................................44 Ion Manipulation and MS/MS....................................................................................47 Conclusion ..................................................................................................................50
3 INFRARED MULTIPLE PHOTON DISSOCIATION .............................................52
Introduction.................................................................................................................52 Infrared Multiple Photon Dissociation Mechanism....................................................54 IRMPD Spectroscopy of Gas-Phase Ions trapped in FTICR Cells ............................58

viii
4 IRMPD BY FEL-FTICR-MS: METHODOLOGY....................................................66
Introduction.................................................................................................................66 Experimental Apparatus .............................................................................................70 Experimental Design and Examples of IRMPD Spectra Obtained by this
Approach................................................................................................................74 Instrumental Modifications for the Study of Carbohydrate Isomers. .........................85 Conclusion ..................................................................................................................86
5 DIFFERENTIATION OF MONOSACCHARIDE ISOMERS..................................89
Introduction.................................................................................................................89 Experimental Procedure..............................................................................................93 Results and Discussion ...............................................................................................95
Hexoses: D-glucose and D-fructose ....................................................................95 Glycosides: O-methylated Monosaccharides ......................................................99
Dependence of the IRMPD Process on FELIX-Irradiation Conditions. ..................102 Reproducibility of this Differentiation Method........................................................105 Conclusion ................................................................................................................108
6 DIFFERENTIATION OF DISACCHARIDE ISOMERS........................................110
Introduction...............................................................................................................110 Experimental Procedure............................................................................................113 Results and Discussion .............................................................................................114
IRMPD Spectroscopic Evaluation of Alkali Metal Complexes ........................114 Differentiation of Glucopyranosyl Disaccharides with Different Linkage
Positions by IRMPD ......................................................................................118 Differentiation of Glucopyranosyl Disaccharides with Different Linkage
Anomeric Configurations by IRMPD............................................................119 Conclusion ................................................................................................................121
7 DETERMINATION OF LINKAGE POSITION AND ANOMERICITY OF GLYCOSIDIC BONDS............................................................................................124
Introduction...............................................................................................................124 Experimental Procedure............................................................................................125 Results and Discussion .............................................................................................126
Linkage Position................................................................................................133 Anomericity Determination...............................................................................134
Conclusion ................................................................................................................135
8 CONCLUDING REMARKS....................................................................................138
LIST OF REFERENCES.................................................................................................143
BIOGRAPHICAL SKETCH ...........................................................................................158

ix
LIST OF TABLES
page 1 List of disaccharides investigated in this study......................................................125
2 Relative IRMPD fragment ion intensities at 9.2 µm..............................................128
3 Relative IRMPD fragment ion intensities at 9.6 µm..............................................128

x
LIST OF FIGURES
Figure page 1.1 Fisher projections for the D stereoisomers of the aldose family................................4
1.2 Monosaccharides predominantly exist as cyclic structures formed through the nucleophilic attack of the carbonyl carbon (open chain) by one of the hydroxyl groups along the chain................................................................................................5
1.3 Structures of some of the most important naturally occurring sugar derivatives.......7
1.4 Disaccharides consist of two monosaccharides joined by an O-glycosidic bond. . ...................................................................................................................................9
1.5 General approaches used for the analysis of glycans ...............................................13
2.1 FTICR-MS performance parameters that increase either linearly (left) or quadratically (right) with stronger magnetic field ...................................................31
2.2 Cubic FTICR cell and cylindrical open-ended FTICR cell......................................33
2.3 Principles of ion cyclotron motion. ........................................................................36
2.4 Representation of the three natural motions of an ion trapped in an FTICR cell.. ..40
2.5 Basics of operation of FTICR-MS. ........................................................................43
2.6 Simple pulse sequence used in a typical FTICR-MS experiment. .........................45
2.7 Dependence of resolution on acquisition time or number of data points. ..............48
3.1 Multiple photon absorption mechanisms. . .............................................................55
3.2 IRMPD study of the Mn(CO)4CF3- ion . .................................................................60
3.3 IRMPD spectrum of the methanol solvated chloride ion (CH3OHCl-). . ................62
3.4 IR spectra of the naphthalene cation. .....................................................................64
4.1 Schematic representation of the FEL-FTICR-MS instrumentation used to obtain IRMPD spectra of gaseous ions. . ...........................................................................71

xi
4.2 Expanded view of the laser optics system and the Penning trap in the vacuum chamber. .................................................................................................................74
4.3 FTICR experimental event sequence used to obtain IRMPD spectra of the fluorene cation..........................................................................................................77
4.4 IRMPD mass spectra of fluorene.. ...........................................................................78
4.5 IRMPD spectrum of the fluorene cation obtained by scanning FELIX in the 700-1600 cm-1 (14.2-6.25 µm) wavelength region. .......................................................79
4.6 IRMPD spectrum of Cr+(C4H10O)2.. ........................................................................82
4.7 IRMPD spectra of gas-phase species with bridging protons, along with calculated structures (MP2/cc-pVDZ): a) (Me2O)2H+ b) (Et2O)2H+ c) protonated diglyme. ..................................................................................................................84
4.8 Top view of the FTICR instrument showing the additional hardware (ion optics, vacuum system components, ion sources) necessary to obtain IRMPD spectra of gas-phase ions produced external to the magnetic field...........................................87
5.1 Mass spectra of the sodiated ion (no isolation) of D-glucose and D-fructose. The peak at m/z 219 corresponds to the monosaccharide coordinated with K+, which was present as a contamination from previous runs. .....................................95
5.2 IRMPD spectra of the K+ and Rb+ coordinated D-fructose. . .................................97
5.3 IRMPD spectra of the Rb-coordinated complexes of the structural isomers D-glucose and D-fructose.............................................................................................98
5.4 Structures of the glycosides investigated to demonstrate anomeric differentiation in a mass spectrometer. ........................................................................................100
5.5 IRMPD spectra of Rb+-coordinated glycoside isomers. ......................................101
5.6 Photodissociation mass spectra of Rb+-β-methyl-galactopyranoside complex (m/z = 279) using different numbers of FELIX pulses. ........................................103
5.7 IRMPD spectra of β-methyl-glucopyranoside obtained under different experimental conditions. ........................................................................................105
5.8 IRMPD spectra of Rb+-coordinated α-methyl-D-galactopyranoside obtained with two different laser alignments.. ......................................................................107
6.1 IRMPD spectra of sucrose-alkali metal complexes. ............................................115
6.2 IRMPD spectra of disaccharide isomers (C12H22O11+ Rb+, m/z = 427), obtained by monitoring the Rb+ loss channel. ......................................................................118

xii
6.3 IRMPD spectra of Rb+-disaccharide stereoisomeric complexes containing the same glycosidic bond position with a different anomeric configuration: cellobiose (β 1-4) and maltose (α 1-4). ..................................................................120
6.4 IRMPD spectra of Rb+-disaccharide stereoisomeric complexes containing the same glycosidic bond position with a different anomeric configuration: gentiobiose (β 1-6) and isomaltose (α 1-6). ...........................................................122
7.1 IRMPD mass spectrum of lithiated (A) maltose (at 9.6 µm) and (B) gentiobiose (at 9.6 µm). .............................................................................................................127
7.2 Wavelength-dependent IRMPD fragmentations of the glucopyranosyl disaccharides investigated in this work. .................................................................130
7.3 Wavelength-dependent IRMPD fragmentations of selected dissociation products. . ..............................................................................................................132
7.4 Wavelength-dependent IRMPD intensities for the anomer-specific fragment channels m/z 187 and m/z 169 for (A) kojibiose, (B) sophorose, (C) nigerose, (D) laminaribiose, (E) isomaltose and (F) gentiobiose. .........................................136

xiii
Abstract of Dissertation Presented to the Graduate School of the University of Florida in Partial Fulfillment of the Requirements for the Degree of Doctor of Philosophy
DIFFERENTIATION OF CARBOHYDRATE STEREOISOMERS BY INFRARED MULTIPLE PHOTON DISSOCIATION USING A FREE ELECTRON LASER AND A
FOURIER TRANSFORM ION CYCLOTRON RESONANCE MASS SPECTROMETER
By
José J. Valle
August 2005
Chairman: John R. Eyler Major Department: Chemistry
The carbohydrate groups that are covalently attached to glycoproteins (glycans) are
known to play key roles in many biological processes. The increasing appreciation of the
importance of glycan structures in these processes has been the driving force behind the
development of methods for analyzing the structure and stereochemistry of glycans.
Structural determination of carbohydrates is more complicated than for other
biomolecules mainly due to the isomeric nature of many of their constituent
monosaccharides and the several possible linkages for their glycosidic bonds.
Mass spectrometry is one of the most rapid and sensitive methods used for analysis
of carbohydrates, but its main drawback is its inability to differentiate isomers. To this
end, we have explored wavelength-tunable infrared multiple photon dissociation
(IRMPD) as a tool for differentiation of carbohydrate isomers in a Fourier transform ion
cyclotron resonance mass spectrometer (FTICR-MS).

xiv
This IRMPD differentiation was accomplished by using a widely tunable free
electron laser (FEL) as the source of infrared light. This laser is coupled to an FTICR
mass spectrometer that is capable of high mass resolving power and versatile ion
manipulation. This combination has made it possible to differentiate isomers based on
their vibrational spectra rather than fragmentation patterns. Ions are trapped in the
FTICR cell and sequentially fragmented with the intense radiation of the FEL. By
monitoring fragmentation yield as function of laser wavelength, the vibrational spectrum
of a particular isomer can be obtained, providing a means of differentiation.
The IRMPD spectra of carbohydrates obtained show the ability of this
instrumentation to unquestionably differentiate carbohydrate isomers in an FTICR cell.
Molecules for which IRMPD spectra have been obtained include O-methylated
monosaccharides, glucose and fructose, and a set of glucopyranosyl disaccharides. These
carbohydrate isomers were intentionally selected in order to demonstrate differentiation
between anomers (α and β), epimers, conformers (pyranose and furanose) and glycosidic
bond positions. By comparing spectra of different alkali metal ion adducts, additional
information about the binding strength of the metal and insights into the interaction of
carbohydrates with specific alkali ions can be obtained.

1
CHAPTER 1 INTRODUCTION
Carbohydrates and their derivatives represent one of the most important and
widespread classes of biomolecules in nature. Carbohydrates are mostly found as
polysaccharides that play key roles in many biological processes for both animal and
vegeorganisms.1 Research has shown that polysaccharides joined through glycosidic
linkages to lipids (glycolipids) and to proteins (glycoproteins), generally known as
glycoconjugates, have functions that span the entire spectrum of activities in the cell.2,3
Examples of these functions are aiding in the conformation and stability of proteins,
modulating the functions of proteins, acting as target structures for microorganisms,
toxins, and antibodies, serving as ligands for specific binding events that mediate protein
targeting, and cell-cell interactions. In addition, these biomolecules have also been
demonstrated to be essential in fertilization, cell growth, inflammation, and post-
translational protein modification, to name but a few of their many roles.4-9 Increasing
research evidence shows that oligosaccharide functionality is closely related to structural
features such as sequence, glycosidic linkage, stereochemistry and branching. Therefore,
for complete understanding of the biological function of oligosaccharides, detailed
characterization of their structure is required.
Unlike DNA and proteins, where sequence provides nearly all of the primary
structure, the study of oligosaccharides presents a more difficult task because of the
several linkage sites in a monosaccharide unit (monomer). This makes possible
numerous linkage combinations (glycosidic bonds) and branching, which occurs when at

2
least two monomers are bound to a single central monosaccharide. These carbohydrate
features emphasize the need for a combination of several structure elucidation steps in
order to obtain a complete characterization of polysaccharide structure. A list of the steps
usually required includes: i) identification of monosaccharide units, ii) determination of
the anomericity (α and β) and ring size of each monosaccharide, iii) determination of
monosaccharide sequence, and iv) determination of configuration of glycosidic bonds.10
This list suggests that for the study of carbohydrates the foremost consideration should be
given to the monosaccharides, which constitute the building blocks of oligosaccharides,
and then to disaccharides. An accurate determination of the monosaccharide composition
of an oligosaccharide is generally the first step in learning about its structure and
functionality. On the other side, disaccharides require special consideration as well
because they carry the important piece of oligosaccharide structural information, the
nature of the glycosidic bond. Therefore, the following section presents a detailed
explanation of carbohydrates with an emphasis on monosaccharides and disaccharides
and a brief description of polysaccharides.
Carbohydrates: Monosaccharides and Disaccharides
Monosaccharides, the simplest carbohydrates, are polyhydroxy aldehydes or
ketones with the general empirical formula (CH2O)n. It is well known that they serve as
the main source of the energy for cell activity and form part of the structural framework
of RNA and DNA.1-3 The smallest monosaccharides, for which n = 3, are referred to as
trioses. Examples of these are dihydroxyacetone and D- and L- glyceraldehyde.
Dihydroxyacetone is called a ketose because it contains a keto group, whereas
glyceraldehyde is called an aldose because it contains an aldehyde group.
Monosaccharides with four, five, six, and seven carbon atoms in their backbones are

3
called tetroses, pentoses, hexoses, and heptoses, respectively. Figure 1.1 shows the
structures of the D stereoisomers of the aldose family having three to six carbon atoms.
The aldoses of different chain lengths are known as aldotrioses, aldotetroses,
aldopentoses, and so on, with similar nomenclature for the ketoses. The carbons of a
sugar are numbered beginning at the end of the chain nearest to the carbonyl group.
Since these molecules have multiple asymmetric carbons, they can exist as different
stereoisomers. In general, a molecule with X chiral centers can have 2X stereoisomers.
The aldohexoses with four chiral centers have 24=16 stereoisomers. Already, we can
start understanding the complexity and wide variety of these biomolecules.
The stereoisomers of monosaccharides of each chain length can be divided into two
groups that differ in the configuration about the chiral center most distant from the
carbonyl carbon. When the hydroxyl group on the reference carbon is on the right in the
Fisher projection (figure.1.1), the sugar is the D isomer; when on the left, it is the L
isomer. Of the 16 possible aldohexoses, eight have a D configuration and eight have the
L. In nature, most of the hexoses present in living organism contain the D configuration.
Each of the eight D-aldohexoses, which differs in stereochemistry at the C-2, C-3, or C-4
positions, has its own name: D-glucose, D-galactose, D-mannose, and so forth. Two
sugars that differ only in the configuration about one carbon are called epimers. For
example, D-glucose and D-mannose, where the only difference is the configuration at C-
2, are epimers, as are D-glucose and D-galactose, that differ at C-4.
The majority of carbohydrates do not exist in their straight-chain (open-chain)
form. In fact, in aqueous solution, monosaccharides (mainly n >5) cyclize through
nucleophilic attack of the carbonyl carbon by one of the hydroxyl groups along the chain.

4
Figure 1.1 Fisher projections for the D stereoisomers of the aldose family
The formation of these ring structures is the result of a general reaction between
aldehydes or ketones and alcohols to form derivatives called hemiacetals or hemiketals.
For example, D-glucose exists as an intramolecular hemiacetal in which the free hydroxyl
group (alcohol) at C-5 has reacted with the aldehyde group at C-1 to produce two new
stereoisomers, designated α and β (fig 1.2 top). These six-membered ring compounds are
called pyranoses because they resemble the six-membered ring compound pyran. The
systematic names for the two ring forms of D-glucose are α-D-glucopyranose and β-D-
glucopyranose. Similarly, the C-2 keto group in the open chain form of a ketohexose,
such as fructose, can form an intramolecular hemiketal by reacting with either the C-6
hydroxyl group to form a six-membered cyclic hemiketal or the C-5 hydroxyl group to

5
form a five-membered cyclic hemiketal (fig. 1.2 bottom). The five-membered ring is
called a furanose because of its similarity to furan.
Figure 1.2 Monosaccharides predominantly exist as cyclic structures formed through the nucleophilic attack of the carbonyl carbon (open chain) by one of the hydroxyl groups along the chain. This equilibrium process is known as mutarotation.
Every time a monosaccharide cyclizes into a five or six-membered ring, the
carbonyl carbon atom in the open-chain form becomes a new asymmetric (stereogenic)
center. This new stereogenic center produces two new isomers that differ only in their
configuration about the hemiacetal or hemiketal carbon atom. The new pair of isomers is
referred to as an anomeric pair, which have α and β configurations on the anomeric
carbon. As seen on the Haworth projection of D-glucose in figure 1.2, the designation α
means that the hydroxyl group attached to C-1 is below the plane of the ring; β means
that it is above the plane of the ring. The same nomenclature applies to the furanose ring
of fructose, except that α and β refer to the hydroxyl group attached to C-2.
The α and β anomers of D-glucose interconvert in aqueous solution through the
open-chain form by a process called mutarotation. Thus a solution of α-D-glucose and a
OHHO
H
H2C
HO
H
OH
O
OHH
H
HO
H
H2C
HO
H
OH
OH
OHH
H
OHHO
H
H2C
HO
H
OH
O
OHH
OH
HH
O
OH
CH2OHHOH2C
H
HO
OH
H
H O
CH2OH
OHHOH2C
H
HO
OH
H
HOH
CH2OH
OHOH2C
H
HO
OH
H
H
β-D-glucoseα-D-glucose
α-D-fructose β-D-fructose
open form
open form
HOHHO
H
H2C
HO
H
OH
O
OHH
H
HO
H
H2C
HO
H
OH
OH
OHH
H
OHHO
H
H2C
HO
H
OH
O
OHH
OH
HH
O
OH
CH2OHHOH2C
H
HO
OH
H
H O
CH2OH
OHHOH2C
H
HO
OH
H
HOH
CH2OH
OHOH2C
H
HO
OH
H
H
β-D-glucoseα-D-glucose
α-D-fructose β-D-fructose
open form
open form
H

6
solution of β-D-glucose eventually form identical equilibrium mixtures having identical
optical properties. This equilibrium mixture contains approximately one-third α anomer,
two-third β anomer, and < 1% of the open and five-membered ring (glucofuranose)
forms.11 Likewise, fructose forms both pyranose and furanose rings. The pyranose form
predominates when fructose is free in solution (67% pyranose and 33% furanose), and the
furanose form predominates in many fructose derivatives.
When unmodified sugars are present in an aqueous solution they can be oxidized
by relatively mild oxidizing agents such as ferric (Fe3+) or cupric (Cu2+) ions. For
example, glucose can react with cupric ion (Cu2+) because the open-chain form present in
equilibrium has a free aldehyde group that is readily oxidized. Therefore, glucose and
other sugars capable of reducing cupric ions are called reducing sugars. This property is
the basis of Fehling’s reaction, a qualitative test for the presence of reducing sugars. For
many years, this test was used to detect and measure elevated glucose levels in blood and
urine in the diagnosis of diabetes mellitus.
In addition to hexoses, which are the most abundant sugars, there are a number of
sugar derivatives that are very common in living organism. In these sugar derivatives a
hydroxyl group in the parent compound is replaced with another substituent, or a carbon
atom is oxidized to a carboxyl group. Some of the most important sugar derivatives are
presented in figure 1.3. The substitution of a hydrogen for the hydroxyl group at C-6 of
L-galactose produces L-fucose; this deoxy monosaccharide is found in plant
polysaccharides and in the complex oligosaccharide components of glycoproteins and
glycolipids. In α-D-acetylglucosamine and α-D-acetylgalactosamine, the hydroxyl at C-2
of the parent sugar (glucose and galactose) is replaced with an amino group that is

7
condensed with acetic acid. These derivatives are part of many structural polymers
including those that are often expressed on cell surfaces. There are also some acidic
hexose derivatives, including N-acetylneuraminic acid (sialic acid), which is a major
component of glycoproteins and glycolipids in animals.
Figure 1.3 Structures of some of the most important naturally occurring sugar derivatives
Because sugars contain many hydroxyl groups, monosaccharides can join together
through a covalent linkage called a “glycosidic bond.” Such a linkage is formed when a
hydroxyl group of one sugar reacts with the anomeric carbon of another.
Oligosaccharides are built by the linkage of two or more monosaccharides by O-
glycosidic bonds. Another type of glycosidic bond joins the anomeric carbon of a sugar
to a nitrogen atom in glycoproteins. These linkages are called N-glycosidic bonds and
are also found in all nucleotides. The fact that monosaccharides have multiple hydroxyl
groups means that several glycosidic linkages are possible. Indeed, the wide array of
these linkages in combination with the wide variety of monosaccharides and their many
isomeric forms makes the analysis of oligosaccharides a very challenging task.

8
Figure 1.4 shows some common disaccharides, the simplest oligosaccharides.
When an anomeric carbon of one of the monosaccharides takes part in a glycosidic bond,
it cannot be oxidized by ferric or cupric ion. The sugar containing that anomeric carbon
cannot exist in open-chain form and no longer acts as a reducing sugar. In describing
disaccharides or polysaccharides, the end containing the free anomeric carbon is
commonly called the reducing end. In maltose, for example, two D-glucose residues are
joined by a glycosidic bond between the α-anomeric form of C-1 on one sugar and the
hydroxyl oxygen atom on C-4 of the adjacent sugar. Such a linkage is called an α-1-4-
glycosidic bond. Because the free anomeric carbon at the reducing end can be oxidized,
maltose is a reducing disaccharide. Therefore, this glucose residue on the right of the
maltose structure (fig 1.4) is capable of existing in α and β- pyranose forms.
To name reducing disaccharides unambiguously, and specifically to name more
complex oligosaccharides, several rules are followed. By convention, the name describes
the compound with its nonreducing end to the left, and the name is generated in the
following order. (1) The configuration (α or β) at the anomeric carbon joining the first
monosaccharide unit (on the left) to the second is given. (2) The nonreducing residue is
named using the furan or pyran nomination. (3) The two carbon atoms participating in the
glycosidic bond are indicated in parentheses and an arrow connecting the two numbers
[for example, (1→4)] shows that C-1 of the nonreducing sugar is connected to C-4 of the
second residue. (4) The second residue is named. If there is a third residue, the second
linkage is named next using the same nomenclature. Following this system for naming
oligosaccharides, maltose is α-D-glucopyranosyl-(1→4)-D-glucopyranose.

9
Figure 1.4 Disaccharides consist of two monosaccharides joined by an O-glycosidic bond. Maltose and lactose are classified as reducing sugars, whereas sucrose does not contain a reducing end (free anomeric carbon) and is known as a non-reducing sugar.
Lactose, the disaccharide of milk, consists of galactose joined to glucose by a β-
1→4-glycosidic linkage (fig.1.4). In human beings, lactose is hydrolyzed to its
constituent monosaccharides by the enzyme lactase and by β-galactosidase in bacteria.
The anomeric carbon of the glucose residue is accessible for oxidation, and thus lactose is
a reducing disaccharide. Sucrose (common sugar) is a disaccharide in which the
anomeric carbon atoms of a glucose unit and a fructose unit are linked; the configuration
of this glycosidic linkage is (α-1↔2β). It is produced by plants but not by higher
animals. Sucrose can be cleaved into its component monosaccharides by the enzyme
sucrase. In contrast to maltose and lactose, sucrose contains no free anomeric carbon
atoms; therefore it is a non-reducing disaccharide. In its nomenclature, a double-headed

10
arrow is used to specify the two anomeric carbons and their configuration. Sucrose is a
major intermediate product of photosynthesis; in many plants it is the principal form in
which sugar is transported from the leaves to other parts of the plant body. Trehalose
(figure not shown) is a disaccharide (α-1↔1α) of D-glucose that, like sucrose is a
nonreducing sugar. It is a major constituent of the circulating fluid of insects, in which it
serves as an energy storage compound.
Large polymeric oligosaccharides, formed by the linkage of multiple
monosaccharides, are called polysaccharides. Some of these biopolymers, also known as
glycans, play vital roles in energy storage and in maintaining the structural integrity of
organisms. The most common polysaccharides in animal and plant cells are glycogen
and starch, respectively, which act as storage forms for monosaccharides eventually used
as energy. Both glycogen and starch are very large, branched polymers formed by
glucose residues. More than half of the carbohydrates ingested by human beings are in
the form of starch. Other polysaccharides, for example cellulose and chitin, serve as
structural elements in plant cell walls and animal exoskeletons. Cellulose is the most
abundant organic compound in the biosphere. It is an unbranched polymer of glucose
residues joined by β-1→4 linkages. Similarly, chitin is also an unbranched polymer built
by β-1→4 linkages that consist of N-acetylglucosamine residues.
In addition to their important roles as stored energy and as structural elements,
glycans can also be found covalently attached to a protein (glycoprotein) or a lipid
(glycolipid) to form a glycoconjugate. Glycoproteins have one or several glycans of
varying complexity joined covalently to a protein by an O- or N-glycosidic bond. O-
glycans have a common structure of N-acetylgalactosamine(GalNAc) with reducing

11
terminals linked to serine or threonine residues, whereas N-glycans have a structure of
N-acetylglucosamine(GlcNAc) with the reducing terminal linked to asparagines.
Glycoproteins are found on the outer face of the plasma membrane, in the extracellular
matrix, and in blood. It is generally known that the oligosaccharide portions of
glycoproteins are very rich in information and form highly specific sites for recognition
and high-affinity binding by other proteins. Glycolipids are membrane lipids in which
the hydrophilic head groups are oligosaccharides, which, as in glycoproteins, act as
specific sites for recognition by carbohydrate-binding proteins.
Glycobiology, the study of the structure and function of glycoconjugates, is one of
the most active and exciting areas of biochemistry and cell biology. Scientists in the
glycobiology field are aided by a wide variety of structural determination tools, ranging
from simple wet-chemistry procedures to more sophisticated analytical techniques. In the
following section, some techniques used for the study of carbohydrates will be mentioned
with an emphasis on the use of mass spectrometry.
Analysis of Carbohydrates by Mass Spectrometry
Given the large diversity of glycan structures and the many possible points of
attachment to proteins and lipids, it seems obvious that a combination of different
approaches is necessary for a complete characterization of these molecules. Most of
these approaches are based on the use of either chemical or enzymatic methods to release
intact glycans for separation and structural analysis. Biochemists have tended to favor
enzymatic methods, due to the mild conditions required for the analysis. For example N-
linked oligosaccharides can be released from proteins by enzymes such as peptide N-
glycosidase F (PNGaseF) and endo-β-N-acetylglucosidases, which cleave the N-
glycosidic bonds linking the oligosaccharide to the protein. Once the oligosaccharides

12
are released, they are separated and characterized by different purification methods
before further analysis.12-14 Figure 1.5 shows some general approaches that follow these
separation steps. Classical chemical reactions involving acid hydrolysis, oxidation,
reduction, permethylation and peracetylation, are still currently used in combination with
analytical techniques. For example, in the analysis of simple oligosaccharides, the
glycosidic bond can be determined by methylation of the intact polysaccharide in a
strongly basic medium to convert all free hydroxyls into methyl ethers. Glycosidic bonds
are readily hydrolyzed by strong acids, but resist cleavage by base. Thus the
permethylated oligosaccharides can be hydrolyzed to yield their free monosaccharide
residues by boiling with dilute acid. The only free hydroxyl present in the
monosaccharides after the hydrolysis are those involved in the glycosidic bond.15,16
Hydrolysis of glycans yields a mixture of monosaccharides, which after conversion to
suitable derivatives can be separated, identified, and quantified by high-performance
liquid chromatography (HPLC) or gas chromatography (GC).14,17 To determine the
sequence of monosaccharides and branching, enzymes such as exoglycosidases of known
specificity are used to remove residues sequentially from the nonreducing end.18-21 The
specificity of these enzymes often allows for deduction of the position and
stereochemistry of glycosidic linkages.
Although these classical methods are still quite feasible and routinely used, many
are cumbersome, require large amounts of sample, demand long analysis time, and often
do not provide 100% unequivocal information. A wide variety of structural
determination tools, ranging from chemical to spectroscopic is available, but often these
methods require long and tedious separations procedures while still being limited in

13
Figure 1.5 General approaches used for the analysis of glycans
sensitivity and structural information. In past years, many efficient methods have been
developed for the analysis of oligosaccharides by reverse-phase HPLC (RP-HPLC).22
However, since oligosaccharides are very hydrophilic, and lack a specific chromophore,
virtually all of the RP-HPLC methods have entailed use of chemical derivatization to
Glycoconjugate
Glycanmixture
SeparatedGlycans
MonosaccharidesFully methylatedcarbohydrates
SmallerGlycans
Hydrolysis with strong acid
Methylationwith CH3I,strong base
Hydrolysis with specific enzimes
NMR&
MS
Monosaccharide ContentTypes and amountsof monosaccharideunits
HPLC or derivatizationand GC and LC
configuration of glycosidic bonds
Acid hydrolysis yields monosaccharidesmethylated at every OH except those involved in glycosidic linkage
Monosaccharide SequencePosition and configuration of glycosidic bond
Glycans subjected to methylation or enzymatic analysis
Monosaccharide SequencePosition and configuration of glycosidic bond
Release glycan by chemical or enzymatic methods
Purification:-Chromatography (HPLC)-Gel filtration

14
introduce a hydrophobic chromophore or fluorophore. On the other hand, the conditions
required for the derivatization may be harsh and time consuming, and degradation of the
oligosaccharide may occur. Considerable progress has been made toward the structural
elucidation of biologically active oligosaccharides using nuclear magnetic resonance
(NMR).23,24 Unfortunately, the biggest limitations in using NMR are sample purity and
concentration requirements for complex two-dimensional experiments. In some cases as
much as 10 mg were needed to acquire a COSY spectrum of a sialic acid
polysaccharide.25 As we can see, the structural elucidation of oligosaccharides by NMR
requires minimally micromoles of material when only picomoles or less may be
available, as is usually the case in glycobiology.
During the last two decades, mass spectrometry (MS) has played an increasingly
important role in the study of biomolecules, including carbohydrates. As seen in figure
1.5, the analysis of oligosaccharides by MS is favored over other approaches because in
many cases it requires fewer steps, which can substantially reduce the labor and analysis
time. In addition, MS provides many advantages over other analytical methods, such as
low sample consumption, high sensitivity, and the ability to obtain structural information
by MS/MS or MSn experiments. Mass spectrometry is probably one of the most broadly
applied analytical tools in the glycobiology and proteomics sciences. This is mainly the
result of the development of “soft” ionization techniques such as electrospray ionization
(ESI)26 and matrix-assisted laser desorption/ionization (MALDI)27 that allow the
production of ions from thermally labile oligosaccharides. MALDI and ESI are now the
preferred ionization techniques for proteomics work, providing sensitivity in the low
pmole to high fmole range.

15
One of the most intriguing of the MS technologies is MALDI-MS. This technique
requires the oligosaccharide sample to be co-crystallized within a UV-absorbing matrix
prior to irradiation with a UV laser. It has been proposed that the matrix absorbs the laser
light and transfers the energy to the sample in order to desorb it and ionize it. The
resulting ions are generally examined with a time-of-flight (TOF) mass spectrometer
although other MS variants like Fourier transform ion cyclotron resonance mass
spectrometry (FTICR-MS) have also been used. The technique is ideally suited for the
analysis of carbohydrates because, unlike other analytical methods, there is no need for
derivatization. Since the unmodified neutral oligosaccharides lack basic sites in their
structures, these ions are generally produced as alkali adducts, (i.e., [M+Na]+) with
detection levels in the 1 pmol range.28-30 Typical spectra of acidic glycans, those
containing sialic acid residues, are generally weaker than spectra of neutral sugars as both
positive and negative ([M-H]-) ions are produced. However, in many cases negative ion
spectra of acidic glycans are preferred, where ion formation involves loss of a proton
from an anionic group. Little or no variation in signal intensity is observed with glycans
of different structure or mass, allowing the technique to be implemented for rapid
profiling of glycan mixtures.31,32 N-linked glycans from many glycoproteins have been
studied by MALDI-MS. For example, analysis of peptides from glycoproteins of human
urinary erythropoietin has shown that Asn-38 and 83 are occupied mainly by fucosylated
tetra-antennary glycans whereas Asn-24 contains a mixture of fucosyl bi-,tri- and tetra
antennary glycans.33 Over 130 N-linked glycans with up to 25 monosaccharide
residues34 have been identified in human erythrocyte CD59 and equally large glycans
have been found in the β-subunit of (Na,K)-ATPase.35

16
Electrospray ionization MS (ESI-MS) has become a popular method for analysis of
recombinant glycoproteins.36 Until recently, ESI of oligosaccharides has received less
attention than MALDI due to issues with sensitivity. However, permethylation37 and
reducing-terminal derivatization have been used to improve this situation, both with
respect to absolute sensitivity and mass discrimination. Additionally, different
configurations of the ESI technique (i.e., nano-ESI) have become available38 that can also
be applied to overcome the sensitivity limitation of ESI for the analysis of glycans.39 The
ESI technique involves spraying the glycan solution through a capillary held at about 2-4
kV at atmospheric pressure and transferring the resulting ions into a mass spectrometer
for analysis. Typical solvents are 1:1 methanol or acetonitrile and water. Similar to
MALDI, underivatized neutral glycans generally produce the sugar+alkali adducts,
mainly [M+Na]+, as the most abundant ions. Protonated [M+H]+ can also be generated
with addition of formic or acetic acid, particularly when analyzing glycans derivatized at
the reducing end with an amino-linking group which attracts the proton. Recently, some
studies have also appeared for the analysis of neutral underivatised oligosaccharides in
the negative ion mode.40 Since the electrospray interface requires a continuous infusion
of solvent, it is compatible with on-line LC-MS or CE-MS, thus enhancing the data
obtained from a chromatographic "fingerprint" of a tryptic digest or a pool of released
oligosaccharides. Since electrospray ionization produces families of multiply-charged
ions, mass spectrometers with relatively modest mass ranges can be employed to analyze
even large glycoproteins such as immunoglobulins with excellent intrinsic mass
resolution. Thus, electrospray methods can, and have, been used to look at the
glycosylation heterogeneity of intact glycoproteins such as ribonuclease.41 The

17
combination of ESI-MS with LC provides a powerful tool for mixture analysis of both
glycopeptides and released glycans.42,43
“Soft” ionization methods such as MALDI produce predominantly molecular ions
from the released glycans with little or no fragmentation. Consequently, the information
obtained from MS is mainly a profile or a pool of all released glycans in a given
glycoprotein. MS now provides one of the most sensitive methods for the analysis of
carbohydrates. However, while MS can provide very accurate mass measurements its
main drawback as an analytical tool is in its inability to differentiate isomers. This
limitation is further aggravated in the analysis of polysaccharides. For example, the
monosaccharides (building blocks) exhibit very similar structures (same m/z); thus, their
differentiation is more involved than that of amino acids. Therefore, the following
section is dedicated to an account of the different approaches that have been employed to
address this limitation in MS.
Differentiation of Carbohydrate Isomers by MS
The application of MS to the analysis of the complex mixtures often encountered
with biological samples has been to some extent hindered by an inability to differentiate
isomers. A simple mass measurement does not distinguish between isomers, thus their
discrimination by MS has relied on the implementation of complex MS procedures or
additional reliance on other analytical tools (chromatographic). This is further
complicated in the study of carbohydrates due to the variability of monosaccharide units
and the different combinations of glycosidic linkages and branching. For example, it has
been calculated that the combination of all possible linear and branching isomers of a
hexasaccharide44 can reach an astronomical figure in the order of 1012. Because of this so
called “isomer barrier”, there is no universal methodology that can be applied to

18
determine complete oligosaccharide structures, in particular for samples available in
mixtures or in very limited amounts, as is usually the case in glycobiology. Thus it seems
that a very sensitive approach with the capacity to differentiate isomers is a desirable tool
in any analytical technique applied to the study of carbohydrates. In recent years, many
research efforts have been devoted to overcome this limitation of MS. Since the
differentiation of isomers is not possible by simple mass measurements, the identification
of oligosaccharide isomeric structures has been based mainly on their distinctive
fragmentation pattern by different tandem mass spectrometry (MSn) techniques. While
mass measurements provide rudimentary information regarding composition, tandem MS
is very powerful for providing sequence information and connectivity.
One of these MSn techniques that has been applied to the differentiation of
oligosaccharide isomers is MALDI-TOF post-source decay (PSD).45 This method
utilizes the spontaneous (metastable) decomposition of ions occurring between the ion
source and the reflectron in a TOF-MS instrument. The level of fragmentation depends
to some extent on the type of matrix employed for MALDI. Some matrices, such as 4-
HCCA, are known as “hot” matrices and are likely to produce extensive fragmentation,
but are often inefficient in the ionization of carbohydrates. On the other hand, DHB,
which has become the matrix of choice for the analysis of carbohydrates, is a “cooler”
matrix with high ionization effiency, resulting in stronger PSD signals. Yamagaki et al.
have applied this technique for the characterization of two analogous structural isomers
of xyloglucan octasaccharides from tamarin seed.46 The fragments observed were mainly
due to glycosidic bond cleavages from almost all linkages in these isomers. A detailed
investigation of relative intensities of fragments ions allowed definite differentiation of

19
the octasaccharide isomers. Garozzo et al. have also been successful in the application of
PSD for differentiation of isomeric oligosaccharides.47 In this investigation the
diagnostic PSD fragments also corresponded to glycosidic bond cleavage in addition to
some ring fragmentation.
Another technique widely applied to the differentiation of isomeric carbohydrates
is collision induced dissociation (CID), also known as collisionally activated dissociation
(CAD). In the structural elucidation of oligosaccharides, CID is the most commonly
applied tandem MS technique for obtaining sequence, connectivity and even
stereochemistry.48-53 The basics of this method can be interpreted based on ion/neutral
interactions wherein a projectile (accelerated) ion is dissociated as a result of collision
with a target neutral species (i.e., inert gas like He and Ar). This is brought about by
conversion of part of the translational energy of the ion into internal energy during the
collision process. This type of fragmentation is more reproducible than PSD as both the
extent of fragmentation and the energy deposited into the ion can be controlled. Many
researchers have been very successful implementing this technique for the differentiation
of oligosaccharides. For example, the Roepstorff group were able to characterize a
mixture of arabinoxylan oligosaccharide isomers extracted from wheat seedlings.54 The
sample of interest, consisting of isomeric structures differing in their degree of branching
and position of the branched residue, was analyzed by ESI ion trap MS (IT-MS) and GC-
MS. Differentiation of human milk oligosaccharide isomers has also been the subject of
investigation in several studies.40,55 Other studies have required the permethylation53 and
complexation52 of the isomers with transition metals in order to differentiate based on
linkage positions and configuration of glycosidic bonds. These investigations often are

20
significantly aided by execution of sequential tandem mass spectrometry and 18O and 2H
labeling experiments.
The technique known as infrared multi-photon dissociation (IRMPD) is another
type of MSn used to induce fragmentation of ions. In this approach, ions are confined in
ion-storage mass analyzers (Penning or Paul traps) for relatively long times at very low
pressures, irradiated with infrared sources (most often CO2 lasers), and undergo slow,
sequential absorption of infrared photons. For particular ions the initial photons are
absorbed between well-defined energy levels, increasing the internal energy of the
molecule. This absorbed energy is randomized into all normal modes of the ion, and
eventually fragmentation via the lowest activation energy dissociation pathway is seen.
IRMPD is a general dissociation technique because all organic molecules tend to readily
absorb IR photons. Fragmentation obtained by IRMPD can be very similar to CID and
in many cases complementary.56,57 Still, CID remains the most commonly applied MSn
method for structure determination due to its simplicity of performance. CID does not
require additional hardware other than the method of introduction of the target gas. On
the other hand, IRMPD requires instrumental modifications to accommodate a laser and
the necessary optics for its alignment.
With the advent of more sophisticated and commercially available infrared laser
sources, IRMPD has become a more widely used technique, especially for the study of
proteins and nucleotides.58-65 More recently, studies of oligosaccharides employing
IRMPD have also been reported, although not for the differentiation of oligosaccharide
isomers.57,66-69 The investigation of intact glycoproteins has been reported where the
monosaccharide composition and the presence of glycan branch sites could be

21
determined from the IRMPD fragments.67 A similar capability of IRMPD for sequence
determination of 15 sugar residues without the use of traditional prior permethylation was
also demonstrated.68 In the analysis of oligosaccharides, the formation of alkali metal
coordinated species has received particular attention. In fact, studies using alkali metal
ions have facilitated the determination of sequence, branching and linkage type of
oligosaccharides.50,70,71 Lebrilla and co-workers reported a systematic IRMPD study of
alkali metal-coordinated oligosaccharides where they revealed that IRMPD could be used
as a complementary method to CID to obtain structural information.57 This study also
presented, to this author’s knowledge, the first and only application of IRMPD for the
differentiation of oligosaccharide isomers. IRMPD experiments were performed on two
sets of isomeric milk oligosaccharides and the dissociation threshold, which differed for
each isomer, was used as the means of differentiation. Thus, while IRMPD appears to be
a unique analytical tool for elucidating the structure of sugars, applications to the
differentiation of isomers are still lacking.
Objective of this Research
When performing tandem MS, the use of ion-storage mass analyzers can present
some advantages over multisector instruments. For example, while a multisector
instrument separates the fragment ions from their precursor ions in the spatial dimension,
this separation in ion-storage devices is performed temporally. MSn experiments with ion
beam mass spectrometers use one electric, magnetic or quadrupole sector to isolate the
ions of interest from extraneous ionic species, and another sector to detect the fragment
products. Thus, by this manner, an MSn experiment would require as many as “n”
analyzers. On the other hand, MSn experiments can be performed in a single stage with
ion-storage analyzers (IT-MS or FTICR-MS)72,73 because ion isolation, fragmentation,

22
excitation, and detection of fragments all occur in a single mass spectrometer. CID and
IRMPD experiments can be performed without additional hardware, simply by addition
of extra events to standard MS procedures. The capabilities of IT-MS to perform MSn
experiments were first demonstrated by Cooks and coworkers.74 These mass analyzers
are greatly preferred in many cases due to the simplicity of their instrumental design
(bench-top). However, these instruments require high operating pressure conditions and
for some applications are still limited by their resolution.75 Alternatively, FTICR-MS
provides advantages not readily obtained in other MS techniques such as ultrahigh mass
resolving power (106 at m/z >5000) and accurate mass measurement (< 5ppm at up to m/z
2000).76-78 In addition, the longer trapping times (10-3 to 102 s) and the versatility of ion
manipulation are intrinsic capabilities of FTICR which present several advantages for
investigation of the dissociation of complex molecules.
The efficiency of FTICR-MSn in CID experiments is restricted by several factors.
The high pressure (>10-6 torr) required for collision with the target gas adds an extra
pump-down event to reach the low pressures necessary for ultra high resolution (< 10-8
torr). The maximum translational energy imparted to the ions is limited by the strength
of the magnetic field and the dimensions of the cell. Moreover, the rf excitation
necessary for the CID process takes the ions away from the center of the cell and
consequently the fragment ions are produced off-axis. This in turn, decreases the
efficiency with which the ions are reisolated or detected.79 IRMPD provides essentially
the same fragments as CID,56,57 but the technique has distinct advantages when
implemented with FTICR-MS. The IRMPD experiments have higher duty cycles
because the fragmentation is induced by a laser; therefore no target gas need to be used.

23
With proper laser alignment, the fragment ions are formed close to the center of the cell,
facilitating their reisolation and detection. Tonner et al. have demonstrated that IRMPD
can be successfully applied in MS4 experiments while simultaneously retaining high
product ion recovery efficiencies.80 Additionally, these experiments suggested that
IRMPD can be, in particular cases, much more energy selective than CID.
Therefore, the objective of the investigations presented in this thesis was to study
the combination of IRMPD and FTICR-MS techniques for differentiation of carbohydrate
isomers. Research performed by the Lebrilla lab. has demonstrated that FTICR-MS is an
extremely powerful tool for the elucidation of carbohydrate structures from the viewpoint
of sensitivity and fragment ion yield.71,78,81-85 IRMPD, on the other hand, although not so
widely applied in glycobiology studies, shows promising potential for the differentiation
of carbohydrate isomers. Traditional IRMPD experiments have been carried out using
mainly CO2 lasers, which provide a narrow (~9.17-10.9 µm) infrared wavelength range.
Thus, these experiments have been constrained to molecules absorbing within this IR
wavelength region and have provided limited structural information. However, with the
development of free electron lasers (FEL),86-88 intense, widely tunable infrared laser
sources have become available that can expand the capabilities of the IRMPD technique.
Indeed, these versatile lasers have proven successful in the application of IRMPD over a
wider IR wavelength range in order to obtain spectroscopic (vibrational) information
about gas-phase ions.75,89 Hence, this research effort was devoted to exploring the
potential of wavelength-tunable IRMPD as a tool for differentiation of carbohydrate
isomers.

24
To this end, an FTICR-mass spectrometer was constructed with a specific design
and installed at the Free Electron Laser for Infrared eXperiments (FELIX) facility in The
Netherlands. This unique FEL is a continuously-tunable IR source that covers the
wavelength region from 5 to 250 µm, while the FTICR instrument (4.7T) permits facile
formation, isolation, trapping, and high resolution detection of a wide range of ion
classes. This combination has made it possible to differentiate isomeric carbohydrate
ions based on their vibrational spectra rather than just simple fragmentation patterns. Ions
are trapped in the FTICR cell and sequentially fragmented with the radiation from the
FEL. By monitoring the appearance and disappearance of fragment ions while scanning
the radiation wavelength of the laser, spectroscopic information for a particular isomer
can be obtained, providing a means for differentiation.
The aforementioned investigations have shown that MSn experiments can be
successfully applied to the characterization of large oligosaccharides (up to 25
monosaccharides residues) that differ in branching, and connectivity (glycosidic linkage
type). These differentiation studies are essentially based on fragmentation involving the
glycosidic bond or the ring structure of the monosaccharide units (cross-ring cleavage).
These fragments give important structural information, like for example; glycosidic bond
cleavage can give information about branching while cross-ring cleavages give
information about linkage type. Few of these MS studies, if any, have paid attention to
differentiation of the constituent monosaccharide residues that compose an
oligosaccharide. This is mainly due to the fact that when the analysis has gotten to the
point of differentiation between monosaccharide residues (i.e., hexoses = glucose,
mannose, galactose) there is no further fragmentation that can differentiate these isomers.

25
Particular interest should be given to the monosaccharide composition of an
oligosaccharide as it is necessary to confirm the residue sequence. Moreover, studies
have demonstrated that the functionality of a glycan is closely related to its
monosaccharide content.3 For example, it has been shown that glycans with a high
content of mannose residues are found on the surface of the gp120 HIV.90,91 This
extensive glycosylation has been suggested to protect the virus from immune responses,
but may also provide sites for interactions with endogenous glycoproteins.92 A close
inspection of figure 1.5 reveals that the final goal of all the approaches presented in this
figure, including MS, is either determination of monosaccharide composition or
determination of configurations of glycosic bonds. Therefore, examining all past
experiments, the main goal of the new approach presented in this thesis was to focus on
differentiation of monosaccharide and disaccharide units. The latter contain important
information about the glycosidic bond, which provide linkage type and configuration.
Overview
The next chapter is dedicated to a description of Fourier Transform Ion Cyclotron
Resonance Mass Spectrometry (FTICR-MS). Principles of operation, along with an
explanation of the inherent features that make this technique so suitable for these
experiments, will be presented. This will be followed in chapter 3 by the theory and
mechanism of the IRMPD method. Previous IRMPD experiments using FTICR-MS with
CO2 lasers in conjunction with limitations of this laser are also discussed. Chapter 4 is a
detailed description of the instrumentation developed for these experiments. This section
shows preliminary results, where IRMPD spectra for ions of less biological interest were
obtained. These ions include: proton-bound dimers, Cr-aniline complexes, and the
molecular ion of fluorene. The experiments performed for the differentiation of

26
monosaccharides are introduced in Chapter 5. These experiments accomplished the
unambiguous differentiation of the hexose monosacharides D-glucose and D-fructose.
Additionally, a set of O-methylated hexoses were studied in order to show the capabilities
of this method for the differentiation of anomeric and epimeric isomers. Chapter 6
discusses IRMPD spectra for a series of glucopyranosyl disaccharides. These isomers
were intentionally selected to demonstrate differentiation based solely on glycosidic bond
position and anomericity. An innovative mode of IRMPD differentiation, where a
fragmentation “fingerprint” instead of fragmentation yield is obtained at different
wavelengths of the laser, is discussed in Chapter 7. This new approach was applied to the
disaccharides in order to obtain a more precise determination of linkage type and
anomericity. Finally, a conclusion with a summary of strengths and weaknesses in
addition to some proposed future work is presented.

27
CHAPTER 2 FOURIER TRANSFORM ION CYCLOTRON RESONANCE MASS
SPECTROMETRY
Fourier transform ion cyclotron resonance mass spectrometry (FTICR-MS) is an
exciting technique whose evolution and development can be traced back to the 1930’s
when E.O. Lawrence introduced the theory of ion cyclotron motion.93 Lawrence built the
“cyclotron”, which was used as a mass selector in many experiments where targets were
bombarded with ions of various masses in order to study the fundamental properties of
atoms. However, it was almost two decades later when Hipple et al. first incorporated
the mass selective characteristics of ion cyclotron resonance (ICR) into a mass
spectrometer called the “omegatron”.94 Over the next 20 years, the development of
instrumentation and applications of ICR-MS expanded rapidly, mainly due to the work of
researchers like Wobschall et al. and Baldeschwieler et al.95-98 Perhaps the most
important of the early developments of the ICR-MS technique was that of the trapped ion
cell by McIver in 1970.99 This new cell was designed with trapping plates at each end to
constrain the ions and prevent them from drifting out of the analyzer region as opposed to
the dual-region cell of the omegatron (source and analyzer). The benefit of this was the
ability to trap ions and thus increase the number of analytical experiments that could be
carried out on them. The application of this trapped ion cell had huge implications for
the future development of the ICR-MS technique. High resolution and sensitivity became
inherent characteristics and the technique saw many new applications, especially in the
field of low-energy gaseous ion-molecule interactions.

28
In spite of an increasing number of developments and applications of ICR-MS, the
technique remained primarily a research tool employed in many academic laboratories.
A new period of evolution was initiated by application of Fourier transform (FT)
methods100 by Alan Marshall and Melvin Comisarow in the 1970’s.101-103 The incredible
scope and advantages of the FT-ICR technique soon became apparent. It retained all the
characteristics of the standard ICR approach and added the extensive enhancements of FT
data acquisition. The advantages of speed, high resolution, and effective computer data
processing that accompanied the introduction of FT techniques made the instrument
much more attractive as an analytical MS tool.
The advent of superconducting magnets capable of producing magnetic field
strengths inaccessible by electromagnets contributed to the increasing attention that
FTICR-MS was receiving from the MS community.104 In 1981 Nicolet Instruments
commercialized the first FTICR-MS instrument with a superconducting magnet and the
1980’s witnessed a rapid rise in sale and installation of FTICR instruments around the
world. This fast diffusion of the FTICR-MS technique provided for further instrumental
modifications and advances. The development of external 'soft' ionization sources and
implementation of them with the FTICR instrument can be considered the final stage in
the development of FTICR-MS105 responsible for most of this technique’s current
popularity. With the addition of external ionization techniques like electrospray
ionization (ESI)26 and matrix-assisted laser desorption/ionization (MALDI),27 FTICR-MS
began to be successfully applied to the analysis of biologically important compounds like
saccharides, proteins and nucleotides and industrially important man-made polymers.106-
108

29
FTICR-MS is now one of the most sensitive and accurate methods of ion detection
in existence. The considerable attention it is receiving today is to a great extent owed to
its ability to make mass measurements with a combination of resolution and accuracy that
is higher than any other mass spectrometer.109-113 It is a versatile technique that can be
adapted to a variety of analytical and physical chemistry measurements and also applied
to ion chemistry and photochemistry studies. It has been used with essentially every
known ionization method and widely applied with tandem MS experiments.114 One of its
most significant characteristics is the fact that it involves ion trapping, as does the rf
quadrupole ion trap mass spectrometer, an important feature that endows this technique
with the versatile capability of ion manipulation. The FTICR instrument mass analyzes
and detects ions using methods which are unique among mass spectrometers.
This chapter is intended to serve as a brief overview of the general principles and
features of FTICR-MS. A description of the basic instrumentation and experimental
procedure used in standard FTICR experiments will also be provided. Capabilities such
as its high resolution and extraordinary ion manipulation (i.e., long trapping time), which
make this technique very suitable for the IRMPD experiments presented in this research,
will be specifically highlighted. For a more detailed overview of this technique, several
books and reviews have been published that present many other aspects and
applications.73,107,115-117
Basic Instrumentation
FTICR mass spectrometry is probably the most complex method of mass analysis
to date, yet mechanically simple. Technically, the operating principle of most mass
spectrometers is based on the spatial separation of ions through a mass-dependent feature
of their motion in a magnetic or electric field followed by separate collection of ions with

30
a different m/z onto a detector. On the other hand, the mass analysis of FTICR is based
on the original technique of ion-cyclotron resonance (ICR) which states that a charged
particle will precess in a magnetic field at a frequency related to its m/z. Energy can be
transferred to this precessing ion provided that energy is available at its specific cyclotron
frequency (i.e., that a resonance condition is satisfied). This resonant energy absorption
constitutes the basis of detecting the ions (described in more detail below), and thus
complete mass analysis can occur in the same place without separation and collection of
ions with a different m/z. This method of detection renders FTICR-MS as a very unique
approach in the mass spectrometry world.
In spite of all the different fields in which this technique is being implemented and
the technological advances and modifications it has experienced, typical FTICR
instruments share in common four main components. First, all instruments are equipped
with a magnet that can be either a permanent magnet, electromagnet or superconducting
magnet. Permanent magnets produce the lowest field strength of all three, which limits
the performance of FTICR-MS. As a consequence, only a few instruments have been
built using this kind of magnet118 including the currently commercial QuantraTM FTICR
mass spectrometer (1Tesla) manufactured by Siemens Inc. Before Nicolet Instruments’
commercial offering, most FTICR mass spectrometers were built using iron-core
electromagnets that could provide field strengths up to ~ 2.3Tesla. At these fields FTICR
instruments can give useful performance for ions of relatively low m/z. However,
according to Marshall et al. (figure 2.1) nine FTICR primary performance parameters
theoretically increase either linearly or quadratically with increasing magnetic field (B).73
There is an obvious improvement with high magnetic field; therefore, the trend has been

31
to design instruments with stronger fields using superconducting magnets. Today,
FTICR instruments are commercially available with superconducting magnets whose
field strengths typically range from 4.7 to 9.4T, although 12T systems are now becoming
available. There is, indeed, a trade-off between high magnetic fields and large volume
magnets and the consequent increase in size of these instruments renders them into bulky
equipment, which is very far from a bench-top analytical tool. Although performance is
significantly improved with strong magnets, these high fields may also impose a hazard
to electronic media, equipment, and people. However, a solution for this is
implementation of proper magnetic shielding that can be either passive or active. For an
efficient operation these state-of-the-art magnets need operating temperatures of ~4.2K,
thus requiring a supply of liquid helium. A recent improvement is a closed refrigeration
system that recirculates helium, instead of the usual method that boils it off, leading to
more cost-effective magnets.
Figure 2.1 FTICR-MS performance parameters that increase either linearly (left) or quadratically (right) with stronger magnetic field . Figure adapted from reference 73.

32
The second component, which is the heart of the FTICR instruments, is the
trapping cell. Virtually all FTICR-MS experiments are based on ion confinement in a
Penning trap: namely, a spatially homogeneous static magnetic field B, and a three-
dimensional axial (along B) quadrupolar electrostatic trapping potential. This cell is
positioned inside (at the center of) the bore of the superconducting magnet where there is
a uniform magnetic field. The essential requirements for any ICR cell are a pair of
electrodes (negatively or positively charged depending on the ions of interest) to trap the
ions and two pairs of opposing electrodes to provide cyclotron excitation and to receive
the ICR signal produced by the ions. Experience with a number of cell configurations
has shown that almost any geometry meeting these requirements should be able to
perform relatively well.119-123
The first FTICR cells were of a cubic design like the one shown in figure 2.2 (left).
This consists of six plate electrodes, where two of these are positioned perpendicular to
the direction of the magnetic and the other four are arranged parallel with the field lines.
The ones perpendicular to the field are the trapping plates, which have holes to permit the
entrance of ions produced outside the cell or electrons to ionize neutral gas molecules that
have entered the cell. The other four plates are used for excitation and detection, as will
be explained below. The size of these cubic cells is generally determined by the
dimension of the bore in the magnet. There is certainly a limit for the number of ions that
can be contained in a cell of a given size. This limit is governed mainly by the
electrostatic capacity of the trap, so that for too many ions the coulombic repulsion
pushes the ions away from each other and onto the plates.

33
Figure 2.2 Cubic FTICR cell and cylindrical open-ended FTICR cell. Both cells consist of the same six electrodes and are aligned with the magnetic field lines (z axis)
Cells have tended to become larger, because larger cells can trap more ions, reduce
coulombic repulsion, increase sensitivity and provide more dynamic range. For these
reasons open cylindrical cells (Figure 2.2 (right)) have become a favored alternative for
cubic cells.124,125 This trap consists of the same six electrodes as in the cubic cell but with
a cylindrical shape. The trapping electrodes are the two cylinders at each end of the cell
and the center cylinder is divided into four electrodes that function as the excitation and
detection plates. The cylindrical shape makes this cell more suited to fit inside the
magnet, thus reaching the maximum size allowed by the bore of the magnet and
increasing the ion capacity. The open cell geometry offers improved access to the cell
Open-Ended Cylindrical Cell
Cubic Cell
Z
X
Y
B
Open-Ended Cylindrical Cell
Cubic Cell
Z
X
Y
B

34
interior with obvious benefit for introduction of ions produced outside the cell.
Additionally, this configuration allows for better pumping efficiency and facilitates
performance in experiments that require laser alignment through the interior of the cell.
This cylindrical cell has become the trap of choice for many current commercial and
research-oriented FTICR instruments.
The third intrinsic component of all FTICR instruments is an ultra-high vacuum
system. In order to obtain the most efficient performance, particularly ultra-high mass
resolving power, pressures of 10-8 – 10-10 Torr are required. To achieve these low
pressures, cryogenic or turbo-molecular pumps are frequently employed, with a few
instruments still using diffusion pumps. Low pressures are required only for ion
detection, so that these instruments can operate at high pressures during certain
experimental events like ion formation and reaction delays. For implementation of high-
pressure ion sources (i.e., ESI) the current approach is to place the source in a region
outside the magnet without the complications of ion formation near the cell and then to
transport the ions into the cell. For transportation of ions into the cell, ion optics such as
quadrupole (or multipole) guides and einzel lenses are commonly used. In order to
maintain a low analyzer cell pressure the ion optics region requires an efficient
differential pumping system that sometimes can use as many as four pumps with different
pumping speeds. Most FTICR instruments are equipped with pulsed valves that allow a
brief increase in pressure for experiment that require gas loads such as collision induced
dissociation (CID) and ion-molecule reaction studies.
The fourth common component of all FTICR instruments is a complex data
acquisition and processing system. The remarkable capabilities of today’s computers

35
combined with the many advantages of FT processing have facilitated the development of
sophisticated data stations. These include a frequency synthesizer, delay pulse generator,
broadband r.f. amplifier and pre-amplifier, a fast transient digitizer and a computer
software that integrates all electronic devices during the data acquisition and analysis
process. Many of these data stations implement graphical user interfaces capable of
supporting the most sophisticated ICR pulse sequences. Tandem (MSn) experiments can
be easily designed and performed by viewing the graphical display of the experiment
sequence. With the continual increase in computer performances there is no doubt that
FTICR technology will continue to improve in the near future.
Natural Motion of Trapped Ions
Cyclotron Motion.
The circular orbit of an ion undergoing cyclotron motion arises from the magnetic
force that acts on the ion. For example, an ion with a charge q moving in the presence of
both a magnetic ( Br
) and electric field ( Er
) is subjected to a force (Lorentz Force) given
by equation 1.
BvqEqdtvdmonacceleratimassForce
rrrr
×+==⋅= (1)
In this equation m is the mass of an ion moving at a velocity v. Consider the case
of a positive ion moving in the xy-plane with velocity v, in the absence of electric fields,
and in a uniform magnetic field along the z axis as shown in figure 2.3. As suggested by
the vector cross product in equation 1, the direction of the Lorentz force is perpendicular
to the plane determined by v and B. The Lorentz force will therefore act as a centripetal
force that bends the ion path into a circular motion of radius r without changing the
magnitude of the velocity (provided there are no collisions).

36
Figure 2.3 Principles of ion cyclotron motion. An ion with a positive charge is moving perpendicular to the magnetic field (x represents the direction of the magnetic field pointing inward through the plane of the paper) which causes the ion to move in a circular motion (dashed line). FL represents the Lorentz force pointing toward the center of the circular orbit. An ion with a negative charge will move in the opposite direction.
For such an ion to undergo a circular motion, the Lorentz force must be equal to the
centrifugal force. Therefore, if the velocity of an ion moving in the xy-plane is denoted
as vxy and the angular acceleration (dvxy/dt) as v2xy/r, equation 1 becomes:
rv
mBqv xyxy
2
=. (2)
rc
++
+
v
v
v
FL
FL
FL
Bz
y
x
+ ++ + +
+ + ++ +
+ ++++
++++
++
+
++ +
rc
++++
++
vv
vv
vv
FLFL
FLFL
FLFL
Bz
y
x
y
x
+ ++ + +
+ + ++ +
+ ++++
++++
++
+
++ +

37
This equation immediately gives the radius of the cyclotron motion:
qBmv
r xyc =
. (3)
Because the angular velocity (in rad/s) is defined by ω=vxy/r, equation 2 becomes:
mω2r=qBωr, (4)
so that cyclotron frequency can be defined as:
mqB
c =ω. (5)
Since ω=2π/t=2πf, an expression for the linear cyclotron frequency is given by
mqBf c
c ππω
22==
. (6)
For example, at 9Tesla an ion of m/q=1000 will have a cyclotron frequency of 138.2 kHz
2.138
10673.11000200.910602.1
127
19
=×××××
−−
−
kguuTC
π kHz.
Inspection of these equations reveals several important aspects of the ICR
technique. First, the cyclotron frequency is determined by only three physical
parameters, the charge of the ion (q), the magnitude of the magnetic field (B), and the
mass of the ion (m). Second, all ions of a given m/z have the same frequency
independent of their initial velocity. Thus, the mass of an ion can be obtained by simply
measuring its cyclotron frequency. Third, following from equation 6 it can be calculated
that at representative magnetic field strengths, the ICR frequencies for ions of typical
molecules lie within a detection range (few kHz to few MHz) that is very convenient for
today’s electronics.

38
Trapping Motion.
The presence of a uniform magnetic field in the z direction effectively confines the
natural motion of the ions in the xy-plane. However, ions are still free to drift out of the
cell along the z-axis. Confinement of the ions along the z-axis is ensured by application
of a repulsive electrostatic potential (Vtrap) to both of the trapping plates described in the
previous section. This results in a three-dimensional axial quadrupolar trapping potential
inside the cell with the form
))2(
2(),( 22
2 rza
Vzr trap −+=Φαγ
. (7)
Here, r is the radial position of the ion in the xy-plane, a is a measure of the trap size, and
γ and α are constants that depend on the trap shape.73,120,126
The electric field in the axial direction can be obtained from the negative z-
derivative of the electrostatic potential:
z
aV
dzdzE trap
2
2)(
α−=
Φ−=
. (8)
From the inclusion of this electric field strength into equation 1, it is straightforward to
solve the equation for the motion of the ion in the z direction:
za
qVdt
dvmzF trapz2
2)(
α== . (9)
Equation 9 represents an harmonic oscillator that describe the z-motion of an ion that
oscillates at a frequency:
2
2ma
qVtrapz
αω =
(S.I. units). (10)

39
Magnetron Motion.
The simultaneous presence of the magnetic and electric fields creates a three-
dimensional ion trap, albeit the trapping and cyclotron motion are not coupled. However,
the combination of these two fields introduces a third natural motion of the ion, called
magnetron motion. The electrostatic trapping potential of equation 7 produces a radial
force:
.)()( 2 r
aqV
rqErF trapα== (11)
This force acts upon the ions in an outward direction (thus, opposite sign) that is
opposed to the Lorentz magnetic force from the applied magnetic field. Therefore, by
combination of equation 11 and 4, we can now obtain the equation for ion motion
subjected to a uniform magnetic field and a three-dimensional axial quadrupolar
electrostatic potential:
r
aqV
rqBrmF trap2
2 αωω −==
(12)
or
.02
2 =+−ma
qVm
qB trapαωω (13)
The solution of this quadratic equation in ω gives two natural rotational frequencies. The
first one, equation 14, is the perturbed “reduced” cyclotron frequency that is observed in
the presence of a d.c. trapping potential. The second one, equation 15, is the so-called
magnetron frequency that belongs to a circular motion superimposed on the cyclotron
motion.

40
)
2()
2(
2
22 zcc ωωω
ω −+=+ (14)
)
2()
2(
2
22 zcc ωωω
ω −−=− (15)
Both motions are superimposed on the oscillation along the z axis with a frequency
ωz (equation 10). Usually, in typical ICR experiments, the relation ω+ » ωz » ω- holds
true so that only the cyclotron frequency ω+ is detected. The three natural ion motional
modes are depicted in figure 2.4.
Figure 2.4 Representation of the three natural motions of an ion trapped in an FTICR cell: cyclotron motion (vc), magnetron motion (vm), and trapping motion (vT). Magnetic field is aligned with the z axis. Figure adapted from reference 73.
Basics of Operation for the FTICR-MS Technique
In the FTICR-MS technique, as with other MS techniques, the experiments are
typically initiated by the production of gas-phase ions. These ions are either formed
inside the cell, or externally produced and transferred into the cell. Once in the cell, ions
are confined in the radial direction (xy-plane) by the magnetic field and along the axis of

41
the magnetic field (z-axis) by small voltages (typically 0.5-5V) applied to the trapping
electrodes. Both positive and negative ions can be trapped in the ICR cell simply by
changing the polarity of the voltage applied to the trapping electrodes. Ions of different
m/z values may be trapped, each oscillating at its particular cyclotron frequency, defined
by equation 6.
In classical ICR mass spectrometry operation, energy at a specific frequency (for
example, that corresponding to the cyclotron frequency of an ion m/z= 103) is transmitted
into the ICR cell. If an ion of m/z= 103 is present in the cell, it will absorb the energy
(resonance condition) and move to a larger radius while maintaining its characteristic
cyclotron frequency. Once the radius of the cyclotron motion has exceeded a certain
dimension inside the ICR cell, a measurable electrical signal is induced on the detection
plates. In this classical approach, only ions of specific m/z can be detected under a
specific set of experimental condition.
A more efficient and faster mode of operation is achieved with the FT approach, as
presented in figure 2.5. In this mode of operation, a wide range of frequencies is applied
to the excitation electrodes in the form of a very short, high intensity, broadband radio
frequency signal (“chirp”). When ions in the cell are irradiated with energy at a
frequency that is identical to their natural cyclotron frequency, the ions absorb the
energy, which accelerates them into larger orbits and causes them to move together
(coherent motion) or in phase with the excitation field. Without this coherent motion, a
signal cannot be detected. The “chirp” irradiation has to be very brief, so that the
coherent ensemble of ions will not achieve a cyclotron radius that exceeds the dimensions
of the cell. The orbiting packet of ions induces a small alternating current (“image

42
current”) on the detection electrodes, the amplitude of which can be related to the
abundance of the ions. The frequency of this “image current” can be detected, amplified,
digitized, and related to the m/z value of the ions in the cell. The frequency components
of this signal correspond to the cyclotron frequencies of the ions present in the cell.
Given that the “chirp” is a short, broadband rf signal, all ions in the cell are virtually
excited and detected simultaneously. Thus, the resulting time domain spectrum is very
complex because it contains the signals of all the ions in the cell. In order to decompose
this complex signal into all of its frequency components, the time domain spectrum is
subjected to a Fourier transform algorithm. This generates a frequency domain spectrum,
which can be readily transformed into the familiar mass spectrum using a calibration
formula derived from the cyclotron frequency equation. This FT approach greatly
reduces the acquisition time, an obvious advantage over the classical operation of ICR
described above, in which only ions of a single m/z can be detected at any given time.
Because frequency is a physical parameter that can be very easily and accurately
measured, FTICR has the highest potential for mass accuracy determination in MS.
Typically, low parts-per-million accuracy can be achieved in the presence or even in the
absence of an internal mass calibrant. Additionally, FTMS is very unique in that
increased measurement time increases both sensitivity and resolution. This advantage
derives from the fact that during the detection process the ions are not consumed, so
remeasurment of the ions is possible.
The FTICR-MS instrument operates in a manner that is very distinctive when
compared to other types of mass spectrometers. In practice, the basic experiment is
conducted using a series of experimental events that are controlled by its data acquisition

43
Figure 2.5 Basics of operation of FTICR-MS. A broad band of frequencies (chirp) is applied to the excitation plate (top left). Ions which are in resonance with the excitation frequency absorb energy and spiral outward from the center of the cell into a larger cyclotron orbit (top right). Coherent motion of ions in the cell induces an image current on the detection electrodes. The time domain signal is subjected to a Fourier transform algorithm to yield a frequency spectrum, which is converted to a mass spectrum.
and processing system. Figure 2.6 shows a typical sequence of events implemented in a
basic FTICR-MS experiment. In the FTICR approach, the ion formation and detection
occur in the same space but separated in time. This is in contrast to other types of mass
spectrometry (i.e., using quadrupoles or magnetic sectors) that rely on spatial separation
of ions in different parts of the mass spectrometer. The sequence presented in figure 2.6
is initiated by a quench. This event is used to rid the cell of ions formed in the previous
experimental cycle. This is accomplished by applying opposite voltages (i.e., +10 and -
+ ++++
+ +
m/z35030025020015010050
Rel
ativ
e In
tens
ity
time (ms)1009080706050403020100
+++++
++
Excitation chirp
Excitation Detection
Fourier transform
+ ++++
+ ++ ++
+++ +
+ ++++
+ +
m/z35030025020015010050
Rel
ativ
e In
tens
ity
time (ms)1009080706050403020100
+++++
+++++++
+++++++
+++++++
++
Excitation chirp
Excitation Detection
Fourier transform

44
10V) to the trapping electrodes, so ions of different polarities are axially ejected from the
cell. This is followed by the ionization event. Ions can either be formed in the cell using,
for example, a common internal electron impact ionization source, or formed externally
(with ESI, MALDI, etc) and transferred into the cell during the ionization event. After a
variable delay (up to seconds), a frequency sweep excitation pulse is used to bring the
ions into coherent motion, as described previously. Next is the detection period during
which the “image current” from the ions is received. Another quench pulse is then
applied to initiate a subsequent experiment. The entire experiment sequence can take less
than a second (depending on time delays used) and a number of experiments can be
repeated as many time as desired for signal averaging and enhanced signal-to-noise ratio
(S/N). Additional events, for example MS/MS pulses (dashed-line pulse in figure 2.6),
may be inserted in this basic sequence to perform more sophisticated (i.e.,
photodissociation) experiments. For a more complex sequence of events, see figure 3 in
chapter 4.
Mass Resolution
FTICR-MS instruments are best known for the outstanding high resolution they can
achieve when performing mass analysis. High mass resolving power (m/∆m50%,) and
high mass resolution (m2-m1 ≥ ∆m50%, where m1 and m2 are the closest masses that can
just be resolved, and ∆m50% is the mass spectral peak full width at half-maximum peak
height) can significantly improve the quality of the experimental data in more than one
way. For example, as mass resolving power increases, so does the maximum number of
components that may be resolved in a mixture. As result, it can be possible to distinguish
all chemically distinct components of a mixture (except isomers) without prior
separation. Another advantage of high resolution is that with proper calibration, the

45
Figure 2.6 Simple pulse sequence used in a typical FTICR-MS experiment. A quench pulse is used to rid the cell of ions and initiate every cycle of events. A time delay between ionization and excitation can be used for ion storage and manipulation by adding extra events, as described in the text.
decreasing peak width can lead to more accurate mass determination. The ability to use
instruments with high resolution can sometimes make the difference between identifying
the species of interest or not.
Of all the mass spectrometry methods, FTICR offers the highest mass resolving
power and highest mass accuracy for ions of m/z < 5000. ICR has the advantage over ion
beam methods (i.e., electric or magnetic sectors, linear quadrupoles, TOF’s) that the
cyclotron frequency is independent of ion kinetic energy and position during
measurement. Relative to quadrupole ion traps, the ICR frequency is relatively more
stable (because the magnetic field of a superconducting magnet is more stable than the
magnitude of the rf voltage applied to the ion trap) and less sensitive to ion-neutral
collisions and coulomb interactions. While the resolution of commercial TOF
Quench
Ionizatio
n
Excita
tion
Detecti
on
Quench
MS/MS Pulse
Time delay
Time
Quench
Ionizatio
n
Excita
tion
Detecti
on
Quench
MS/MS Pulse
Time delay
Time

46
instruments may approach 10,000, and many commercial magnetic sectors may achieve
100,000, FT-ICR mass spectrometry can routinely achieve resolutions of hundreds of
thousands in broadband mode operation (normal experimental conditions)110 or even
higher (few millions) when operated in the heterodyne mode (where narrow m/z ranges
are studied).109
With the FTICR method of detection, mass spectra are recorded as a finite number
of data points that can be selected prior to acquisition. This finite number determines the
number of data points available in the time-domain spectrum, or transient. These time-
domain data will be obtained at a rate determined by the sampling frequency used.
According to the Nyquist theorem, the sampling frequency must be at least twice that of
the highest frequency (lowest m/z) being recorded. Therefore, the duration of the
acquisition time is determined by the number of data points and the sampling frequency
determined by the low m/z cut-off. The length of the transient “acquisition time” is given
by equation 16,
SNTacq = (16)
where, N is the number of data points and S is the sampling frequency (Hz). Mass
resolution improves in direct proportion to the length of the transient that is recorded.
The maximum resolution that can be achieved for a number of data points is determined
by
2
acqcTfR = . (17)
In this equation, R is resolving power, fc is the cyclotron frequency and Tacq is the
acquisition time (duration of a transient). Figure 2.7 shows the dependence of resolution

47
on acquisition time or number of data points. It can be seen that although performing the
Fourier transform on any portion of the transient would give the same spectrum, there is
an obvious advantage to processing the entire duration of the transient. The resolution
obtained with the longer transient is clearly much higher than that obtained from the
shorter transient. Therefore, longer transients increase resolution as suggested by
equation 17. However, there are physical limitations to the length of the transient that
can be obtained. The amplitude of the transient signal decays as collision with other ions
and neutrals in cell deteriorate the coherence of the ion packet. This is the reason that
FTICR-MS requires ultra-high vacuum in the cell region, so the collision frequency can
be lowered. Another aspect that can affect the resolution of FTICR is space charge
effects. Having a large number of different ion packets in the cell can cause coulombic
interactions (repulsions) between ions. These interactions typically decrease mass
accuracy and resolution, so an FTICR user must be aware of such effects and try to
minimize them.
Ion Manipulation and MS/MS
In addition to its high mass resolution, another FTICR-MS feature that makes this
technique so suited for the kind of experiments presented in this dissertation is its ion
manipulation capabilities. After production of the ions, these can be trapped within the
ICR cell for very long times104 (up to hours) before detection. During this trapping time
and prior to excitation, a number of experimental events (pulses and delays) can be added
to probe the chemical nature of the ions of interest. For example, brief gas pulses can be
introduced at specific times during the experiment sequence to activate or thermalize ions
by collision, or to allow the trapped ions to undergo neutral-ion reactions. Time delays

48
Figure 2.7 Dependence of resolution on acquisition time or number of data points. All three spectra are obtained by processing different numbers of data points (32K, 128K, and 512K) from the same transient. The improvement in resolution shows the advantage of obtaining long transients.
play very important roles in this type of experiment. Different types of excitation
waveforms can be applied to the cell electrodes to selectively manipulate the ions in the
cell. Ions of specific m/z (or groups of ions) can be excited to sufficiently large cyclotron
orbits to cause neutralization with the cell electrodes, while others remain in the center of
the cell for further experiments. Excitation events can also be used to condense ions into
the center of the cell (quadrupolar excitation).127 Trapping voltages can be changed
during the experiment to either capture ions produced outside the cell (gating trapping)128
time (ms)1009080706050403020100 m/z
278277276275274273272271270269
Rela
tive
Inte
nsity
m/z278277276275274273272271270269
Rel
ativ
e In
tens
ity
m/z278277276275274273272271270269
Rel
ativ
e In
tens
ity
time (ms)2520151050
time (ms)6543210
32K
128K
512K
time (ms)1009080706050403020100 m/z
278277276275274273272271270269
Rela
tive
Inte
nsity
m/z278277276275274273272271270269
Rel
ativ
e In
tens
ity
m/z278277276275274273272271270269
Rel
ativ
e In
tens
ity
time (ms)2520151050
time (ms)6543210
32K
128K
512K

49
or to allow certain ions present in the cell to escape (suspended trapping).129 By
application of relatively high voltages to the cell electrodes ions with different kinetic
energy (different m/z) can be decelerated, providing a means for mass selection.130 Laser
pulses or electron beams can also be introduced to dissociate mass-selected ions.
With all these ion manipulation capabilities, FTICR is indeed a very versatile tool
for tandem mass spectrometry (MS/MS) experiments. Typical MS/MS experiments
involve mass selection of the ions of interest in the first MS stage followed by activation,
dissociation, and subsequent mass analysis of the fragments in the second MS stage.
With conventional MS/MS instruments, these experiments are performed in a tandem-in-
space fashion where several types of mass analyzer are linked together to perform the
isolation and mass analysis. These kinds of experiments can be characterized by short
observation times (hundreds of µs). On the other hand, the trapping capabilities of ion
trap devices (like FTICR-MS) allow for MS/MS experiments to be performed in a single
analyzer cell (tandem-in-time). These experiments permit for longer observation time
which is very important for activation and dissociation of polyatomic ions. It should be
noted that MS/MS experiments can be performed in a quadrupole ion trap instrument,
which uses collisional gas cooling to confine the ions into the center of the trap. The
indispensable presence of this collision gas introduces additional cooling of activated
ions by collision with the bath gas as opposed to activation in FTICR, where the only
cooling mechanism is radiative decay of excited ions (at ultra-high vacuum). This is
however, without considering the ultra high resolution of FTICR, the only fundamental
difference when performing MS/MS experiments in FTICR-MS and quadrupole MS.

50
During the last two decades there has been great interest in MS/MS studies of
relatively large molecules (biomolecules), in particular with FTICR-MS. This has been
mainly due to the development of “soft” ionization techniques, like ESI and MALDI that
produce molecular ions with very little fragmentation. In an FTICR instrument,
activation is commonly achieved by collision of ions with neutrals131 (CID) or surfaces
(surface-induced dissociation (SID)),132 ultraviolet photodissociation (UVPD),133 infrared
multiple-photon dissociation,134 (IRMPD) or blackbody infrared dissociation (BIRD).135
More recently, electron capture dissociation (ECD) is another activation technique that is
gaining popularity in proteomics studies.136,137 Of these many activation methods, the
most popular for the activation of biomolecules is CID. However, the one emphasized in
this thesis is the photodissociation technique IRMPD. Typically, IR (10.6 µm) laser
photons are used for “slow heating” of the ions and dissociation occurs when sufficient
internal excitation is absorbed by the ions. IRMPD can provide fragments very similar to
those obtained by CID with the advantage that no gas pulse is required. This in
combination with the ICR instrument’s capability for ion manipulation, and its
convenience for providing a photolysis target environment with few or no neutral
collisions has led to an increasing popularity of the coupling of FTICR and IRMPD.
Conclusion
Over the last three decades, FTICR-MS has matured to become an almost
indispensable tool for bioanalysis studies, including proteomics, glycobiology, and
natural products. This has been mostly the result of technological advances (hardware
and electronics), development of more general and versatile MS/MS methodology, and

51
the advent of ionization techniques more suitable for molecules of biological interest (ESI
& MALDI). Its unique capabilities have made it the method of choice for different
analytical applications. It offers much higher resolution (106) and mass accuracy (< 0.5
ppm) than any other mass spectrometer, which makes it very useful for unequivocal mass
assignment. In seeking even higher performance, the most obvious direction seems to be
even higher magnetic fields. FTICR instruments are now available with superconducting
magnets up to 12 T and the trend is to continue increasing the field strength. With the
increasing advancement of electronics and computer power, it seems assured that the
field of FTICR-MS will continue to attract and stimulate the interest of diverse
researchers that make this technique and even more valuable mass spectrometric tool in
the future.

52
CHAPTER 3 INFRARED MULTIPLE PHOTON DISSOCIATION
Introduction
It has been known for many years that the absorption of light by matter can result
in many different processes. One of these processes is the photodissociation of molecules
by absorption of ultraviolet (UV) radiation. A. N. Terenin is considered a pioneer who
studied and described this phenomenon in detail during the decades of the 1920s and
1930s. The absorption of the UV light imparts an excess of internal energy that brings the
internal energy of the molecule above a minimum value necessary for dissociation. The
occurrence of this process is possible because the UV photons are of such a high energy
that they can induce transitions between electronic states, therefore raising the molecule’s
internal energy above a dissociation threshold. In principle, there is another possibility
for increasing the internal energy of a molecule to the point where it will dissociate.
Rather intense infrared (IR) radiation may induce molecular vibrational excitation of a
molecule that will cause dissociation just as can be done by exciting molecular electronic
states with UV light. But in contrast, since IR photons are less energetic (0.001-1.7 eV)
than UV photons (3.1-124 eV), many IR photons are required for this process to occur.
After absorption of several IR photons, the internal energy can build up to levels where
photodissociation is observed. However, this potential of IR light was not realized until
after the development of high-power IR lasers. So, in the early 1970s, experiments
showing the capabilities of the newly invented high-power pulsed CO2 laser began to
appear.138-141 These successful experiments demonstrated that polyatomic molecules

53
could be effectively dissociated by absorption of several low-energy IR photons.
Observations in these early experiments and the ones that followed142-145 gave rise to this
new phenomenon called infrared multiple photon dissociation (IRMPD).146
Considerable experimental and theoretical work147 has been done toward
understanding the process of IRMPD, so now it is one of the most applicable methods
used in the new field of photodissociation spectroscopy (PDS).148,149 Similar to other
PDS methods, IRMPD has emerged as a very convenient method to obtain spectroscopic
information on gas-phase polyatomic ions. In this approach the low-abundance ions
absorb several IR photons, if the photons are in resonance with a particular vibrational
mode, and the polyatomic ions can dissociate as a result of the absorption event. In most
cases, fragmentation is observed when the internal energy of the ion exceeds the
dissociation energy of the weakest bond. Thus, by plotting the photodissociation
probability (or absorption cross section) versus wavelength the IRMPD spectrum can be
obtained.
Clearly, this kind of spectroscopy shows some differences when compared to the
direct investigation of ions by optical absorption spectroscopy (see chapter 4). IRMPD
requires high intensity IR sources that will put many photons in the ion in order to
observe fragmentation. On the other hand, with the low-intensity sources employed in
optical spectroscopy, relatively small numbers of photons delicately probe individual
low-energy transitions. Typically, ions are known to occupy a given equilibrium
distribution of energy states and for a given absorption frequency only a small fraction
are moved into a single excited state. Conversely, IRMPD affects large fractions of ions
driving them through many energy transitions. In fact, this absorption is converted into

54
vibrational energy that alters the chemical nature of the ion and raises the internal energy
to the point that it fragments. Also note that polyatomic ions at high internal energies
generally exhibit anharmonicities in their vibrational potential that can lead to red-
shifting and broadening of infrared absorption bands. Additionally, a given absorption
feature in an IRMPD spectrum represents the sum effect of many energy transitions in a
collection of ions that interact with the IR laser, which complicates even further the
picture of the process. Therefore, dissociation data as well as absorption data are
necessary to characterize the entire IRMPD process. In light of these differences it
comes as no surprise that the application of IRMPD spectroscopy requires a more careful
interpretation than normal absorption spectroscopy.
This chapter is intended to describe in detail the mechanism by which gas phase
ions undergo IRMPD and to present some experimental work to date. Although initial
applications of this technique were mainly for isotope separations144,146,150 and now it is
becoming a versatile analytical tool for sequencing of important biomolecules, the
experiments presented here give emphasis to its utility to obtain infrared spectra of gas
phase ions. Additionally this outline of investigations stresses the outstanding
performance of this technique in conjunction with ion traps, mainly ICR, and free
electron lasers (FEL) as irradiation sources.
Infrared Multiple Photon Dissociation Mechanism
A polyatomic ion (or neutral molecule) that is irradiated with IR light absorbs this
energy by interaction of its vibrating electric dipoles with the oscillating electric field of
the radiation. Thus radiant energy becomes vibrational energy in the ion. Since energy is
quantized, the absorption of light is best depicted as a transition between energy levels

55
that match exactly the energy of the photon absorbed. This process is frequently
described by using the potential-energy well of a diatomic molecule presented in figure
3.1a. The horizontal
Figure 3.1 Multiple photon absorption mechanisms. Stepwise (A) is a coherent mechanism, ladder climbing in one vibrational mode, which is unrealistic due to anharmonicity of the vibrational potential. Stepwise (B) is an incoherent, IVR mediated mechanism, which requires multiple absorption of photons in one vibrational mode in addition to a high state density.
lines represent the quantized vibrational energy levels with the ground state labeled by
vi=0. As the molecular bond stretches, the potential energy curve become less steep and
the energy levels merge into a so called “quasi-continum”. Near the ground state the
potential-energy well behaves approximately harmonic and the energy levels are
approximately evenly spaced. Therefore, absorption of the first few IR photons that
match these gaps is possible. As the molecule keeps climbing this ladder by absorption
of several photons, it reaches the quasi-continuum, where the levels are so closely spaced
that it is very likely any gap will match the energy of the incoming photons. At the top of

56
the ladder, the bond breaks and the diatomic molecule dissociates. Molecular vibrations
of polyatomic molecules are rather more complex than diatomic molecules.
Nevertheless, as a judicious approximation, one can resolve their complex vibrational
motions into a superposition of several distinct vibrations called normal modes. To a
certain extent, each normal mode vibrates independently and maintains the characteristics
of a vibrating, anharmonic diatomic molecule.
This is how the infrared multiphoton absorption mechanism was initially pictured
to occur for polyatomic molecules. However, a close inspection of this ladder-climbing
process in a diatomic molecule reveals it to be unrealistic. Although the first few photons
can be absorbed because the molecule shows a harmonic behavior (vi=0 → vi=1 → vi =2
→…), it will eventually reach a mismatch where absorption of the next photon will be
prohibited. This mismatch becomes progressively larger with increasing vibrational
excitation, such that an “anharmonic” bottleneck will preclude the absorption of many
photons. Therefore, this vibrational anharmonicity restricts the absorption of many
photons by polyatomic molecules in basically the same way it does for diatomic
molecules.
In view of this unrealistic process of a stepwise multiphoton excitation, a more
likely mechanism that involves the sequential absorption of photons mediated by a rather
fast intramolecular vibrational redistribution (IVR)151,152 process has been
proposed.146,153-155 Such a mechanism has been previously described for fullerenes156,157
and polycyclic aromatic hydrocarbons (PAHs),75,89 where it explains the absorption of up
to hundreds of IR photons. Figure 3.1b illustrates the mechanism by which this process
most likely proceeds. For ions in the ground state, the first photon is absorbed by the

57
vibrational fundamental vi =0 → vi =1. Provided that at room temperature (which ensures
a high population of the ground state) the density of vibrational states (DOS)158 is high
enough to facilitate IVR, this absorption is followed by rapid energy redistribution into a
bath of vibrational states. If the lifetime of the IVR process is short enough (i.e., ns to ps
range), the absorbing vibrational state is de-excited in a time short enough that the
fundamental can absorb a subsequent photon of the same energy. This is possible, of
course, if the fundamental does not shift out of resonance with irradiation source
(wavelength of the laser).
After absorption of a few photons the internal energy is such that the ions enter the
quasi-continuum. This region is characterized by a DOS that corresponds to a
convolution of background vibrational states that are indirectly coupled to the absorbing
mode. Consequently, this leads to an effective broadening of the line which enhances the
photon absorption rate. Thus, once the quasi-continuum is reached, there is an increase
in the absorption efficiency. At this point, if there is sufficient laser fluence and
favorable absorption strength, multiple absorptions (10-100s) can occur that will bring
the ion to higher internal temperatures where the dissociation starts to occur.
Note that the DOS rapidly increases as the internal energy continues to go up and
the coupling between these many states due to the vibrational anharmonicities results in
even higher IVR rates. Therefore this bath of vibrational states not only contributes to a
more efficient sequential absorption process but it also causes the ion to lose its
awareness of the vibrational mode that was initially in resonance with the IR source.
Consequently, this results in a more uniform fragmentation efficiency of the ion which

58
depends only on its total internal energy in spite of the vibrational mode through which
the energy is pumped into the ion.
This IVR-mediated, sequential absorption model is the basic explanation used for
the IRMPD process in polyatomic systems (e.g., carbohydrates). However, in order to
present the simplest description of this mechanism other competing processes were
excluded from the picture of how the mechanism proceeds. The internal energy that is
gained by the ion during and after the absorption progression can be released by
processes like collisional quenching, IR emission or dissociation. If experiments are
performed at low pressures (~10-6 torr), the collisional cooling is likely to occur in a 10-2-
10-3s time scale. Also, the IR radiative decay of thermalized species can be expected to
occur on a 10-3s scale or even longer.159 Therefore in order to have a feasible dissociation
process, a few systematic conditions need to be satisfied. For example, with the account
of necessary events described this far, it is evident that the dissociation process has to
take place on a time scale shorter than the lifetime of collisions and radiation, otherwise
fragments will not be observed. Additionally, early in the process it is also crucial to
have IVR occurring at a faster rate than absorption. The latter is necessary to avoid a
shift in resonance of the absorbing mode with respect to the wavelength of the incoming
photons.
IRMPD Spectroscopy of Gas-Phase Ions trapped in FTICR Cells
It has been more than thirty years since R.C. Dunbar performed the first experiment
showing the photodissociation of gaseous ions in an ICR cell.160 These experiments were
feasible by utilization of a simple slide projector as light-source and an antiquated coarse
cutoff filter as wavelength selector. However, with the many technological advances
added to ICR and the development of sophisticated lasers, more complex experiments

59
including IRMPD have been possible.161,162 In the early 1990s the IRMPD of ionic
species stored in an ICR cell was first shown to be possible using powerful line-tunable
CO2 lasers. This was mainly the result of experiments performed in the Beauchamp and
Eyler laboratories.134,163-166 These studies were experimentally straightforward due to the
convenient ion manipulation capabilities of ICR instruments that provided a trapped-ion
photolysis target in an environment with few or no collisions with neutral species. Ions
of interest were prepared by means of electron impact ionization and ion-molecule
reaction and subsequently trapped in the ICR cell. Irradiation of the trapped ions with
CO2 lasers tuned to specific wavelengths led to dissociation. The result of the
photodissociation was monitored using the FT-ICR detection mechanism. As a result, by
plotting percent of photodissociation or depletion of parent ion signal versus wavelength
of the CO2 laser the IRMPD spectra could be obtained.
Figure 3.2 shows the photodissociation mass spectra and IRMPD spectra of
organometallic complexes reported by Beauchamp et al.163 Figure 3.2a presents the mass
spectrum of the isolated Mn(CO)4CF3- without irradiation of the CO2 laser. Figure 3b
shows the appearance of the fragments, Mn(CO)3CF3- and Mn(CO)2CF3
- after irradiation
with the laser tuned on the 944 cm-1 line. IRMPD spectra are presented in figures c and
figure d. These spectra, corresponding to Mn(CO)4CF3- ions derived from different
precursors (CF3COMn(CO)5 and CF3Mn(CO)5), show identical infrared multiphoton
dissociation spectral features within experimental errors. These observations supported
the idea of identical structures for Mn(CO)4CF3- ions from the two different precursors.
The spectra were obtained by taking the ratio of the parent ion intensity to the total ion
intensity (data points in figure 3c and 3d) as the laser was line-tuned to various

60
wavelengths. The two absorption maxima at 1052 and 945 cm-1 were assigned as
infrared expression of two different types of C-F stretching. In a related work presented
by this same group of investigators164 it was demonstrated that substitution of one NO in
place of CO caused an increase in the C-F stretching frequency expressed at 945 cm-1.
Figure 3.2 IRMPD study of the Mn(CO)4CF3- ion (a) Mass selection of the
Mn(CO)4CF3- ion derived from CF3COMn(CO)5. (b) Photodissociation of the
Mn(CO)4CF3- ion with laser irradiation at 944 cm-1. (c) and (d) IRMPD
spectra of Mn(CO)4CF3- ion derived from different precursors. In these
spectra, the y axis corresponds to the ratio (in percentage) of the intensity of the mass-selected parent peak (Mn(CO)4CF3
-) to the total ion intensity (Mn(CO)4CF3
- + Mn(CO)3CF3- + Mn(CO)2CF3
-). The x axis represents the spectral range of the CO2 laser. Figure adapted from reference 163.
In a different laboratory, additional work performed by the Eyler group was
reported on IRMPD spectroscopic studies of methanol-attached anions and proton-bound

61
dimer cations.166 An example of these experiments showing the IRMPD spectrum of a
chloride anion solvated by a single methanol molecule is presented in figure 3.3. This
spectrum was obtained by plotting the percentage of photodissociation as the laser was
tuned to various wavelengths covering partially the spectral range between 920-1060.
The percent of photodissociation was calculated from the difference in intensities of the
parent ion (laser off minus laser on) divided by the intensity of the parent ion (CH3OHCl-
), therefore, plotting depletion of parent peak as function of laser wavelength. In an effort
to overcome some limitations of this technique, for example the low output power of a
tunable-pulsed CO2 lasers, this group has also reported investigations where both
continuous-wave (cw) and pulsed CO2 lasers are implemented in the same
experiment.134,167 In this approach a low-power pulsed (probe) laser tuned to a resonant
infrared absorption band promoted trapped ions to vibrationally excited states, but with
insufficient energy to cause photodissociation. Subsequent irradiation of the excited ions
with a fixed-frequency, nonresonant, cw (pump) laser induced photofragmentation.
Photodissociation spectra were obtained by varying the wavelength of the probe laser.
Ions for which IRMPD spectra were collected by this method include: the protonated
molecular ion of diglyme, the positive molecular ion of 3-bromopropene, and the
negative molecular ion of gallium hexafluoroacetylacetonate.
Photodissociation with a tunable CO2 laser has been shown to be a useful approach
for dealing with the difficult task of acquiring spectroscopic information for gas-phase
ions. IRMPD is commonly observed for trapped ions and the wavelength dependence of
the process gives a view of the IR absorption spectra of the ions which in some cases can
be very similar to the linear IR absorption spectra obtained by conventional optical

62
Figure 3.3 IRMPD spectrum of the methanol solvated chloride ion (CH3OHCl-). The gaps (?) between the ranges 958-966cm-1 and 980-1038cm-1 are spectral regions where the CO2 either had insufficient energy to produce photofragmentation or produced no laser output at all. Figure taken from ref. 166.
spectroscopy. However, this technique still suffers from intrinsic technological
limitations imparted by the CO2 lasers. While very powerful CO2 lasers (10-400Watts)
are commercially available, their spectral tunability is still inconsistent and restricted to a
narrow wavelength range within the IR region. This only gives a partial picture of the IR
spectrum in the 920-1060 cm-1 region which is still far from resembling results from a
conventional IR spectrometer. With this respect, the implementation of free electron
lasers (FEL’s) presents an alternative to overcome these drawbacks imposed by CO2
lasers.86,87,168
An FEL generates tunable, coherent, high power radiation that can commonly span
a wavelenght range from millimeters (far-IR) to hundreds of nanometers (visible light).
CH3OHCl- + nhν (ir) → Cl- + CH3OHCH3OHCl- + nhν (ir) → Cl- + CH3OH

63
It can present the same optical properties typical of conventional lasers (i.e., CO2 lasers)
such as high spatial coherence and a near diffraction limited radiation beam. On the other
hand, it differs from conventional lasers in using a relativistic electron beam (free
electrons) as its lasing medium, as opposed to electrons bound into atomic or molecular
states. Thus, this makes possible its wide tuning range within the electromagnetic
spectrum. Its broadband and continuous tunability lasing-properties in the IR region have
been used to bring about IRMPD of trapped ions. In 2000 Oomens et al. reported the
first application of a FEL to obtain the IRMPD spectra of gas phase ions.89 This study
was devoted particularly to the acquisition of IR spectra of PAH’s selectively isolated in
an ion trap mass spectrometer. An example of an IRMPD spectrum obtained using an
FEL within the IR range of 500-1600 cm-1 is depicted in figure 3.4a. This spectrum was
plotted by monitoring the fragmentation (loss of C2Hn) as the FEL was tuned in
resonance with different vibrational modes in the naphthalene cation. Of notable interest
in figure 3.4 is the agreement of the IRMPD spectrum (top) with the calculated spectra
(middle) and the jet-cooled linear IR absorption spectra of the cationic naphthalene-Ar
van der Waals complex (bottom). In view of the good agreement of band intensities
between the IRMPD spectrum and the one-photon linear gas-phase absorption spectrum,
the authors of this publication suggested that this is an indication of the sequential
absorption of multiple photons as described in section 3.2.75 Thus, nonlinearities in the
IRMPD process can be assumed to be negligible as suggested by the investigation of
PAHs.
In spite of the remarkable results for the study of PAHs ions using an FEL, the
acquisition of these spectra was still troublesome due to the low mass resolution of the

64
Figure 3.4 IR spectra of the naphthalene cation. (top) IRMPD spectrum of the naphthalene cation obtained in a quadrupole ion trap. (center) Calculated IR spectrum convoluted with a 30 cm-1 Lorentzian line shape. (bottom) Linear absorption spectrum of the cationic naphthalene-Ar van der Waals complex. Figure adapted from reference 89
IT-MS used in these experiments. The implementation of a more sophisticated mass-
spectrometry technique with higher mass resolving power seemed necessary in order to
enhance the capabilities of this method. Therefore, in 2002 a joint FELIX- National High
Magnetic Field Laboratory (NHMFL) effort coupled an FEL with an FTICR-MS to
obtain IRMPD spectra of gaseous ions with quite high mass resolving power.169 (See
figure 4.4 QIT vs FTICR in chapter 4) At present, this combination is the basis of a user

65
facility that has made possible the acquisition of IRMPD spectra for a number of ionic
species.170-173 Concurrently with this research collaboration, another FEL-FTICR-MS
facility was established that has allowed comparable IRMPD experiments on ionic
species prepared under somewhat different mass-spectrometry conditions.174-176 The
McLafferty lab. has also reported IR-PDS of ions trapped in an ICR cell.177 These
experiments, however, use the IR radiation of an optical parametric oscillator (OPO) laser
which can permit IR spectra at wavelengths inaccessible by the FEL experiments
mentioned above. It seems like the continuous emergence of novel approaches like these,
combined with the capabilities of FTICR-MS, promises accelerating progress in the IR
spectroscopy of ions.

66
CHAPTER 4 IRMPD BY FEL-FTICR-MS: METHODOLOGY
Introduction
The low densities typically obtained in production of gas-phase molecular ions
make the measurement of their infrared spectra challenging. Such spectra are useful in a
wide variety of scientific fields ranging from astrophysics, where the spectral
characterization of ionic polyaromatics is required to verify their hypothesized
occurrence in the interstellar medium,178 to biochemistry, where the structure of
protonated species is of key interest179 to fundamental chemistry problems such as the
study of reaction intermediates,180 differentiation of isomeric ions in mass spectrometry,
and the study of metal cation binding to organic molecules,181 which is key to
understanding many catalytic and biochemical reactions.
Small molecular ions can often be generated with relatively high densities in
discharge and electron impact sources so that they can be studied directly by laser
absorption spectroscopy, with sensitive detection methods employing, for instance, lock-
in techniques. Direct absorption has been applied to ions in cells,182-184 fast ion
beams,185,186 and supersonic expansions.187-189 Large molecular ions usually suffer from
severe fragmentation in these sources so that other ionization sources and/or mass
selectivity are required. However, ion densities may thereby be reduced such that direct
laser absorption techniques become quite difficult, if not impossible, to apply.
One solution is to isolate the ions in a cryogenic inert matrix and subsequently
record the infrared spectrum with, e.g., a Fourier transform infrared (FTIR) spectrometer.

67
The ions can be generated in situ in the matrix by ultraviolet (UV) photoionization of the
corresponding neutrals,190-192 or by mass-selective deposition of the ions into the
matrix.193,194 Although matrix isolation spectroscopy has provided a vast amount of
infrared data on ionic (and otherwise unstable) systems, drawbacks include the inability
to distinguish absorption features of the ionic species from those of their neutral
precursors and incomplete knowledge of the effect of the matrix on the infrared
spectrum.195
The application of sophisticated “action spectroscopy” schemes, as opposed to
direct optical absorption experiments, has greatly expanded the field of gas phase infrared
spectroscopy of mass-selected ions over the past decade.196 Most of these methods
combine laser-based infrared dissociation spectroscopy with mass spectrometric
detection. Early studies include the work on hydrogen and hydronium cluster ions by
Lee and co-workers.197-199 Since then, attaching a weakly-bound “messenger” atom (or
small molecule) to the ion of interest and detecting photodissociation of the complex as
an indication of infrared absorption has become popular because relatively low-power
laser sources will suffice such experiments. In particular, noble gas atoms have been
used as messengers since they are often detached following single photon absorption and,
moreover, their weak interactions with the chromophore typically result in a spectrum
which is virtually identical to that of the bare ion.200-203 However, the weak binding
energy of these van der Waals complexes usually restricts their studies to low
temperature techniques, such as molecular beam sources or cooled ion traps. More
strongly bound ions, such as coordination complexes and molecular ions, typically
require absorption of multiple photons before the dissociation threshold can be

68
reached.204-208 Nonetheless, mass-resolved photofragmentation spectroscopy can still be
applied to such systems by the mechanism of infrared multiphoton dissociation (IRMPD)
if sufficiently intense laser sources are available.
IRMPD, as described in the previous chapter, is a non-coherent, multiple photon
absorption process that can be used to bring about dissociation of complex molecular
systems.146,153,154 After its inception in the early 1970s, most of the initial interest in
IRMPD spectroscopy was due to its potential for inducing isotopically selective
dissociation,144,146,150 which could enable isotope enrichment. However, subsequent
experimentation have shown its extraordinary capability to obtain IR spectra of gas phase
ions. In order to overcome the typical dissociation thresholds of several eV, the
absorption of many (tens to hundreds of) infrared photons is necessary, requiring a
powerful laser source, such as a gas discharge laser. The CO2 laser has mainly been used
for this purpose, having as a main drawback its limited and discrete wavelength
tunability. Two-laser methods, in which a tunable low-power laser is used to excite into
the quasi-continuum and subsequently a high power CO2 laser is used to induce
photodissociation, have been applied to overcome this limitations.167,199,209,210 However,
with the advent of infrared free electron lasers (FELs), it is now possible to apply IRMPD
as a true wideband spectroscopic method.211
Unbound electrons form an ideal lasing medium, allowing FELs to be tuned
continuously over a wide wavelength range.86,88,212,213 Their spectral properties are often
combined with high pulse energy. Particularly in the infrared, for which large segments
of the spectral range are not accessible to conventional lasers, the FEL is a unique source.
However, because of their high cost and special instrumentation infrared FEL’s around

69
the world are typically operated as national/international user facilities.214 Historically,
research with these lasers has mainly focused on condensed matter and optical physics,
but more recently various applications in the fields of gas-phase molecular physics and
spectroscopy have appeared.213 The FEL for Infrared eXperiments (FELIX) at the FOM-
Institute for Plasma Physics Rijnhuizen168 has a high micropulse repetition rate (up to 1
GHz) and a macropulse length on the order of a few µs, which corresponds roughly to the
residence time of a room-temperature gas-phase molecule in a typical mm-sized laser
focus. This particular feature renders FELIX very suifor gas phase studies of neutral
molecules.
IRMPD spectroscopy of molecular ions has been implemented mostly with tandem
mass spectrometers and ion traps.148 These devices allow for mass-selective isolation of
the parent ion and subsequent mass resolved detection of product ions generated by
IRMPD. In the 1980’s and early 1990’s, IRMPD of stored ions by use of line tunable
CO2 lasers was reported mainly by Beauchamp and coworkers163,215,216 and by Eyler and
coworkers.134,166 In 2002, the first FEL-based ion IRMPD study,89 employing a simple
radiofrequency quadrupole ion trap, was reported. Various ionic PAH systems have been
investigated with that apparatus,75,89,217,218 motivated by their likely occurrence in the
interstellar medium.
Based on these successful applications of an FEL to IRMPD spectroscopy of
molecular ions, more sophisticated mass spectrometers have been installed at FEL
facilities, most notably tandem mass spectrometers219,220 and Fourier transform ion
cyclotron resonance (FTICR) mass spectrometer.170,172,221,222 Ion trapping in combined
magnetic and electric fields coupled with FT-ICR mass analysis leads to unparalleled

70
mass resolving power and mass accuracy, and a multitude of ion formation, manipulation
and isolation techniques have been developed.73,114,117 A wide range of ions whose IR
spectra are of interest can be formed by direct ionization or by ion-molecule reactions in
the FTICR mass spectrometer, and then cleanly isolated so that there is only one species
giving rise to the photodissociation spectrum.
This chapter describes the coupling of an FT-ICR mass spectrometer built at
University of Florida to the infrared beamline of FELIX in the Netherlands. A detailed
description of the instrumentation and experimental protocols implemented on the
acquisition of preliminary IRMPD-spectra results, including the fluorene molecular ion
(C13H10+), the chromium-bound dimer of diethyl ether (Cr(C4H10O)2
+), and a series of
proton-bound dimers ions, is presented. Instrumental modifications necessitated in order
to obtain the IRMPD spectra of the carbohydrate isomers are also described.
Experimental Apparatus
Ion trapping and mass analysis are carried out with a laboratory-constructed FT-
ICR mass spectrometer (Figure 4.1), featuring a 4.7 T actively shielded superconducting
magnet (Cryomagnetics, Inc., Oak Ridge, TN) with a 128 mm I.D. horizontal bore. Ion
formation, irradiation, and detection, as well as pulse sequencing, are controlled by a
modular ICR data acquisition system (MIDAS)223 developed at the National High
Magnetic Field Laboratory (NHMFL). As initially configured, the instrument was
provided with an electron ionization (EI) source positioned inside the magnetic field in
the vicinity of the FT-ICR analyzer cell, and a solids insertion probe to facilitate internal
laser desorption and matrix assisted laser desorption ionization (MALDI) experiments.

71
Figure 4.1 Schematic representation of the FEL-FTICR-MS instrumentation used to obtain IRMPD spectra of gaseous ions. ASSM- actively shielded superconducting magnet; SIP-solids insertion probe; 6-WC-six-way cross; GV1, GV2, GV3-gate valves; SSLC-solid samples loading chamber; TP1, TP2-turbopumps; LV-leak valves; GBC-gas ballast chamber; EFBT-evacuated FELIX beam tube; N2 PB-nitrogen purged box; LO-laser optics; MP-mechanical pumps; LWF-laser window flange; PT-Penning trap.
The vacuum system includes a six-way cross (with 8 in. O.D. vacuum flanges) and
three manual gates valves (Kurt J. Lesker Co., Clairton, PA). Two of these gate valves
(GV1 and GV2 in fig.4.1, with 4.5 and 2.75 in. O.D. vacuum flanges) are attached to the
solid sample loading chamber (SSLC in fig.4.1) to permit venting and subsequent pump
down during sample loading while maintaining a high vacuum in the main region. The
third gate valve (GV3) permits isolation of the main turbomolecular pump from the
vacuum chamber. High vacuum is achieved by use of a turbopump (500L/s, Pfeiffer
Vacuum Co., Nashua, NH) and a second turbopump (70L/s), which provides backing of

72
the first pump and roughing of the solid sample loading chamber. The background
pressure achieved by these pumps after all modifications made to the vacuum system
(feedthroughs and windows) is in the low 10-10 torr range after several days of baking at
~120 0C. To provide maximum flexibility for laser alignment and vacuum system
maintenance, both the vacuum system and the magnet are mounted on two customized
aluminum frame carts (A-Line, Inc., Charlotte, NC) which slide on ball bearing-shaft rail
assemblies (Thomson Inc., Port Washington, NY).
Gas phase species, either from gaseous samples or sufficiently volatile liquid or
solid samples, are introduced via either of two precision leak valves (Varian Inc.,
Lexington, MA – LV in fig. 4.1), which are provided with pulsed valves and gas ballast
chambers to ensure a sbackground pressure during sample introduction. Solid samples of
low vapor pressure are introduced on the solids insertion probe (SIP in fig.4.1). The
pressure is monitored by ConvecTorr gauges (Varian Inc.) on the inlet system and two
inverted magnetron gauges (Varian Inc.) in the main vacuum region and the sample
loading chamber.
The FEL used for these experiments (FELIX) has been the core of a user facility
since its first operation in the early 1990’s. A detailed description has been published
elsewhere.168 Briefly, the wavelength is continuously tunable between 5 and 250 µm,
(2000-40 cm-1) and the bandwidth can be varied between 0.4 and 7% of the central
wavelength. To cover this wavelength range, FELIX utilizes two lasers, FEL-1 and FEL-
2, working at different electron beam energies. The electrons are produced by an electron
gun (injector) and are accelerated by two radiofrequency linear accelerators (r.f. Linacs)
to energies of 15 to 25 MeV and 25 to 45 MeV to cover the ranges of 25-250 µm (FEL-1)

73
and 5-30 µm (FEL-2) respectively. The wavelength range of FEL-2 can be extended to
2.7 µm by using mirrors with a dielectric coating to allow lasing on the third harmonic.
The output of FELIX consists of 5-10 µs duration macropulses with a total energy of up
to 100 mJ, at a repetition rate up to 10 Hz. Each macropulse consists of a train of
micropulses of adjuslength (0.3-5 ps) separated by 1ns. The linewidth of the laser is
Fourier-limited according to the micropulse duration. The average power in the
macropulse is of the order of 10 kW and peak power in the micropulse is in the MW
range.
This laser is housed in a secure underground vault in the basement of the F.O.M.
Institute Rijnhuizen building. The main laser beam is distributed into different user
stations by means of an array of windows and mirrors in a vacuum evacuated tube (EFBT
in fig.4.1). To interface the FELIX laser light exiting this tube with the FT-ICR mass
spectrometer a nitrogen purge box containing the necessary beam steering and focusing
optics was constructed (N2 PB and LO in fig.4.1). This purge box and optics facilitate
the alignment of both FELIX and a second laser used for laser desorption or multiphoton
ionization (MPI) experiments, while keeping a dry atmosphere, thus preventing possible
absorption of infrared radiation by water vapor in air.
The FELIX laser beam (5-10 mm beam diameter) is introduced into the vacuum
chamber of the mass spectrometer via a ZnSe window sealed to the laser window flange
(figure 4.2). This laser beam is aligned to pass underneath the ICR cell and then
redirected with a 1 m radius curvature polished copper mirror (CM 1 in fig.4.2) to
produce fragmentation of ions trapped in the center of the cell (Penning trap). A second
polished copper mirror (CM 2 in Fig.4.2) with a 0.5 m radius of curvature reflects the

74
laser back through the ICR cell, thereby doubling the fluence and ensuring that a larger
fraction of ions is subjected to laser irradiation. An additional window (CaF2) located in
the center of the laser introduction flange allows a second laser (UV-VIS LB) to pass
along the symmetry axis of the open cylindrical cell for laser desorption or multiphoton
ionization (MPI) experiments.
Figure 4.2 Expanded view of the laser optics system and the Penning trap in the vacuum chamber. FELIX beam; ZnSe W-ZnSe window for introduction of FELIX beam; LWF-laser window flange; CM1, CM2- copper mirrors; PT-Penning trap; CaF2 W- CaF2 window for introduction of UV and Visible lasers; UV-VIS LB-ultraviolet or visible laser beam; ASSM- actively shielded superconducting magnet.
Experimental Design and Examples of IRMPD Spectra Obtained by this Approach
In order to test the capabilities of this instrumental set-up to obtain IRMPD spectra,
preliminary experiments were performed on ionic systems readily prepared by the ion
sources provided by its initial configuration. Molecular systems for which infrared
spectra are presented include: the fluorene molecular ion (C13H10+), the singly-charged

75
chromium-bound dimer of diethyl ether (Cr(C4H10O)2+), and a series of proton-bound
dimers. The IRMPD results obtained for the fluorene ion are used to compare
performance of this instrumentation with a previously reported approach that utilized a
QIT. The IRMPD spectra presented in this section correspond to a series of experiments
that preceded the investigations on carbohydrate isomers.
All experiments are controlled using a version of the Modular ICR data Acquisition
System (MIDAS) software223,224 which can be externally triggered. The MIDAS system
is triggered by a pulse synchronized with the FELIX macropulse train; a shutter blocks
FELIX pulses until the desired irradiation period in the FT-ICR experimental event
sequence. Typical duty cycles range from 3 to 5s depending on ion-molecule reaction
times and number of FELIX macropulses used for irradiation. Eight transient response
signals (100K data points) per wavelength are typically acquired and signal averaged
while FELIX is scanned by increments of 2-4 cm-1 in the 500– 1800 cm-1 range. All
experimental transients are digitized and averaged with a digital oscilloscope (Yokogawa
DL4200, Tokyo, Japan) prior to storage in a computer by use of LabVIEW software
(National Instruments, Austin, TX). After the experiment, the averaged time-domain
transients for each wavelength are Fourier transformed. Typically, each 100 K transient
from the oscilloscope is zero-filled to 131,072 (=217) points, apodized using a Hanning
window function and then subjected to FFT and magnitude calculation.
The IRMPD spectrum of the fluorene molecular ion (C13H10+) was obtained by
loading a solid fluorene sample (Sigma-Aldrich, 99.0%) into the solids insertion probe
and introducing it into the high vacuum region for analysis. The vapor pressure of the
sample at room temperature was sufficient to maintain a pressure in the vacuum chamber

76
of 9.0 x 10⁻⁸ torr. Positive ions were generated by electron ionization with a 70 eV
electron beam of 50-300 ms duration, producing minimal fragmentation and an adequate
signal for analysis. After an ionization event, the ions were trapped radially by the
magnetic field imposed by the superconducting magnet and axially by applying positive
potentials in the range of 1.25-3.0 V to both trapping electrodes. The parent ion (C13H10+,
m/z =166) was isolated by a stored waveform inverse Fourier Transform (SWIFT)
waveform,225,226 to eject unwanted fragment ions formed during the ionization event.
Trapped ions were next irradiated with 5 to 20 FELIX macropulses, separated by 200 ms,
over a time period of 1 to 4 s. The average macropulse energy was 70 mJ. Following the
irradiation period, an excitation pulse (~10V p-p, ~1 GHz/s sweep rate) typically
covering the frequency range from 200kHz to 4.4MHz excited both parent and fragment
ions to larger cyclotron radii, and after a delay of 2 ms the ions were detected by
digitizing and processing 100K time-domain data points (as discussed above). The pulse
sequence employed for these experiments is depicted in figure 4.3.
Figure 4.4b shows a photodissociation mass spectra (obtained by the following
process C13H10+ + nhν → C13H9
+ + H) of the fluorene cation. When FELIX is tuned to
1500 cm-1, resonance with an allowed infrared mode occurs and photodissociation (loss
of one H atom) is observed. The mass spectrum with FELIX off (figure 4.4a) is
essentially the same as that obtained when FELIX is tuned off-resonance. For fluorene,
as well as numerous other PAHs, the main fragmentation channel is loss of one or two
hydrogen atoms,227 which (see figure 4.4b) is observed with baseline resolution with the
present mass spectrometer. The IRMPD spectrum of the fluorene cation in a QIT has
been obtained at FELIX in the past.75 However, the mass resolution in those experiments

77
Figure 4.3 FTICR experimental event sequence used to obtain IRMPD spectra of the fluorene cation
was limited to m/∆m = 50, thus providing insufficient mass resolution to distinguish two
peaks 1 Da apart in the m/z 100-200 range. Figures 4.4 c and d show the mass spectrum
and photodissociation mass spectrum of the fluorene cation obtained with the
aforementioned QIT. As seen in figure 4.4 c, the capabilities of this apparatus also did
not permit ejection of background fragments (loss of 2H and 3H) without affecting the
signal of the parent ion (C13H10+). Those limitations reduced the signal-to-noise ratio for
species such as fluorene that exhibit H-loss as the main fragmentation pathway.228 The
present FT-ICR mass spectrometer has a mass resolving power, m/∆m50%, up to 50,000,
in which ∆m50% is peak full width at half-maximun peak height, clearly sufficient to
resolve fragment peaks of 1 Da difference.
200 ms
Quench (50ms)
Ionization (50-300ms)
Trapping Potential
SWIFT Ejection (5ms)
FELIX Irradiation (1-4s)
Excitation (2ms)
Detection (12ms)
Time
200 ms
Quench (50ms)
Ionization (50-300ms)
Trapping Potential
SWIFT Ejection (5ms)
FELIX Irradiation (1-4s)
Excitation (2ms)
Detection (12ms)
Time

78
Figure 4.4 IRMPD mass spectra of fluorene. a) Isolation of the fluorene cation (C13H10+,
m/z = 166) with the constructed FTICR-MS, showing a mass spectrum free of background ions. b) Photodissociation mass spectrum with FELIX tuned to an allowed vibrational mode at 1500 cm-1. c) Isolation of fluorene cation with a QIT, showing poor resolution and presence of background ions. (d) Photodissociation in the QIT, showing appearance of higher energy dissociation-channels.
The IRMPD spectrum is generated by obtaining a series of mass spectra collected
as a function of laser wavelength and then plotting fragmentation yield versus
wavelength. Figure 4.5 shows IRMPD spectra of the fluorene cation obtained with
FELIX coupled to either a QIT or the FT-ICR mass spectrometer described in this
chapter. Comparison of spectra obtained with two different mass spectrometers yields
general agreement in peak positions but with definite differences. Both spectra reveal a
strong band in the vicinity of 1500cm-1 typical of cationic PAHs species, due to coupling

79
Figure 4.5 IRMPD spectrum of the fluorene cation obtained by scanning FELIX in the 700-1600 cm-1 (14.2-6.25 µm) wavelength region. (Top) Spectrum recorded monitoring the C2Hn loss channel in a QIT from ref 75. (Center) Spectrum recorded monitoring the H-loss channel in the FTICR mass spectrometer described in this chapter. The vertical axes represent fragmentation yield. (Bottom) Theoretically calculated (Becke’s Three Parameter Hybrid Functional using the Lee, Yang, and Parr Correlation Functional with Dunning/Huzinaga full double zeta basis sets including diffuse and polarization functions-B3LYP/D95(d,p)) spectrum convoluted with a 30 cm-1 Lorentzian line profile.
of C-C stretching modes, and several other weaker absorption lines at lower energies
(746, 977, and 1149 cm-1). See reference 75 for a more detailed explanation of the
spectrum.
One obvious difference between these two spectra is the presence of the broad
peak(s) near 1060 cm-1 in the QIT spectrum, which is clearly missing in the FT-ICR
spectrum. As mentioned above, as a result of the poor mass resolution of the QIT it was

80
difficult to obtain the spectrum of the isolated fluorene ion. Therefore the spectrum
shown in figure 4.5 (top) was reported as an assumed observation of a combination (4/1)
of the infrared spectrum of fluorene cation (C13H10+) and that of the dehydrogenated
fluorene ion (C13H9+) (see reference 75). As illustrated in figure 4.4b the mass spectra
obtained with the FT-ICR mass spectrometer achieve isolation of the parent peak with
baseline resolution for the fragment ion, thereby limiting the observation of
photodissociation to the fluorene cation (C13H10+) only. Therefore, the absence of the
1060 cm-1 peak in the FT-ICR spectrum supports the conclusion that the spectrum
obtained with the QIT was a combination of those for both the C13H10+ and the C13H9
+
ion. Another evident difference is the presence of the new band at 1220 cm-1 in the FT-
ICR spectrum, marked with a *, which also seems to be present at low intensity in the
QIT spectrum, but does not match any peak in the corresponding calculation.
Investigations of its exact origin are ongoing and will be reported in a future publication.
One striking feature of the FT-ICR-derived infrared spectrum is that the peaks are
significantly narrower than those in the spectrum obtained using the QIT. Since the H-
loss channel cannot be observed directly in the QIT experiment, the FELIX beam must be
focused more tightly (f = 7.5 cm) in order to access higher energy fragmentation channels
involving carbon loss. As mentioned in the introduction of chapter 3, the resulting higher
internal energies of the ions cause the spectral lines to broaden. In contrast, lower
internal energies are required to observe dissociation when using the FT-ICR mass
spectrometer, since the lowest energy (2.7 eV binding energy)228 H-loss channel can be
resolved. One other factor potentially contributing to the narrower lines in the FT-ICR

81
experiment is considerably longer trapping between ion formation and FELIX irradiation,
allowing more complete radiative cooling of the ions.
For chromium ion experiments, a 1”-diameter chromium sputter target
(Goodfellow, 99.98%) was mounted on the solids insertion probe and slid into the
vacuum can to a position ~50 cm away from the FT-ICR cell. The fundamental output
(1064 nm, ~6 ns laser pulse width) of a Nd:YAG laser (Eksma NL301G, Vilnius,
Lithuania), with the pulse energy set to about 10 mJ, was used as an ablation source. The
laser beam was mildly focused (using a lens of f = 1000 mm) and coupled into the
vacuum can through the center window (CaF2) on the laser introduction flange (UV-VIS
LB shown in fig.4.2). The trap electrode closest to the metal target was kept at 0V during
the ablation laser pulse and was the switched to its static value typically 3ms later,
thereby “catching” the Cr+ ions. A delay of 3s was allowed for chromium ion-molecule
reactions with the ether vapor in the cell (at 3 x 10⁻⁸ – 1 x 10⁻⁷ Torr), forming
predominantly the Cr+ (ether)2 complex (Cr+ + C4H10O → Cr(C4H10O)+, Cr(C4H10O)+ +
C4H10O → Cr(C4H10O)2+). This species at m/z = 200 was subsequently isolated by a
SWIFT waveform to eject unwanted ions, most notably the Cr+ and Cr+(ether) ions,
which serve as the signal channels in the IRMPD spectrum.
Figure 4.6 shows the IRMPD spectrum of Cr+(C4H10O)2 in the 750 -1250 cm-1
range, where ethers are known to posses strong absorption bands. Evidence for the
process Cr(C4H10O)2+ + nhν → Cr(C4H10O)+ + C4H10O and → Cr+ + C4H10O is seen.
The inset shows mass spectra of the isolated parent species at m/z = 200 with FELIX off
resonance, and with FELIX on the strong resonance near 1010 cm-1. Mass scale
expansion clearly reveals the fragment resulting from the loss of a single and both ether

82
Figure 4.6 IRMPD spectrum of Cr+(C4H10O)2. The inset shows mass spectra taken with the FEL off and on resonance near 1010 cm-1. Observed dissociation channels at m/z = 126 and m/z = 52 correspond to detachment of one and two ether ligands, respectively. Zooming in on the m/z = 126 channel reveals the pattern due to the naturally occurring Cr isotopes, showing the level of detail typically obtainable with FTICR mass spectrometry.
ligands and even peaks due to the minor Cr isotopes. The IR action spectra is obtained
by dividing the total fragment yield (in mass channels 126 and 52) by the total ion signal
as the wavelength of FELIX is scanned.
Motivated by the important roles that hydrogen bonding plays in many chemical
and biological processes a series of ions with a common hydrogen bond (O-H+-O) were
also investigated as part of these preliminary studies. The gas-phase ions of interest for
these experiments include: the protonated dimers of dimethyl and diethyl ether

83
(denominated (Me2O)2H+ and (Et2O)2H+ respectively) and protonated molecular ion of
diglyme (1,1’-oxybis(2-methoxy-ethane). Gaseous methyl ether (99.5%) and the ambient
vapor over liquid samples of ethyl ether (99%) and diglyme (99%) were introduced into
the vacuum chamber via a leak valve (LV). Chemicals were purchased from Sigma-
Aldrich and used without further purification, except for a freeze-pump-thaw cycle on the
liquid samples to remove dissolved gases. Gas-phase samples (~ 10-7 torr) were ionized
in the ICR cell by means of the internal electron ionization source (30-70 eV). The
species of interest were formed by ion-molecule reactions with background gas during a
reaction delay of 3-5 s, and then isolated by ejecting unwanted species from the ICR cell
using a SWIFT waveform pulse. Immediately thereafter, the parent species were
irradiated with several pulses from FELIX, and the fragments and parent ions were
detected in a similar manner as presented in figure 4.3 to determine the extent of
photofragmentation.
Shown in figure 4.7 a-c are the IRMPD spectra of the protonated methyl and ethyl
ether dimers as well as of protonated diglyme. The spectra were generated by plotting
the ratio of the fragment to the total ion (fragment + parent) peak height as a function of
the wavelength of FELIX. The photofragment channels for (Me2O)2H+ and (Et2O)2H+
were m/z = 47 and 75, corresponding to loss of neutral Me2O and Et2O monomers,
respectively. The photofragment channel for protonated diglyme was m/z = 103,
corresponding to loss of one methanol unit. A linear correction on these spectra, as well
as on the previous ones, was also applied to account for power variations in FELIX.
In a recent IRMPD study, Asmis and coworkers obtained the first spectra for the
protonated water dimer (H5O2+) in the region corresponding to direct excitation of the

84
Figure 4.7 IRMPD spectra of gas-phase species with bridging protons, along with calculated structures (MP2/cc-pVDZ): a) (Me2O)2H+ b) (Et2O)2H+ c) protonated diglyme. The upper panel shows the IRMPD spectrum of protonated water dimer (H5O2
+) (adapted from reference 220).
vibrational modes of the bound proton between 600 and 1900 cm-1.220 This spectrum,
presented in the top panel of figure 4.7, shares an intriguing similarity with that of the O-
H+-O-bound species, suggesting that this type of OHO proton-bridge may present a
“spectral signature” in this region of the infrared. All spectra presented in figure 4.7 are
qualitatively similar, although the complexity clearly increases with the size of the
systems, as expected. All three spectra (a-c) show a well resolved peak at low frequency
(700-850 cm-1), as well as a strong band between 900-1100 cm-1, and a weaker band
around 1500-1600 cm-1. The significance of these conserved spectral features can further
be appreciated by comparison with the spectrum of H5O2+. The similarities in the band-

85
spacing and relative intensities is striking, particularly in comparison to the (Me2O)2H+
spectrum. There is also an interesting trend in the spectra of the proton-bound dimers
(H5O2+, (Me2O)2H+, and (Et2O)2H+), where the main bands show an increasing red shift
with increasing mass of the monomer unit. The general similarities of the four spectra
suggests that a particular structural motif is common to all of the systems, and an obvious
candidate is the OHO proton bridge. Ab initio calculations and assignation of the
spectral band are explained in more detail in reference 170.
Instrumental Modifications for the Study of Carbohydrate Isomers.
IRMPD spectra presented thus far have shown the remarkable performance of this
instrumentation for the infrared study of gas-phase ions. However, these experiments
have been limited to ions produced either by internal EI, which normally requires
samples with high vapor pressures, or by internal metal ion ablation. The study of
carbohydrate ions formed by electron ionization can be a feasible approach when used in
conjunction with derivatization procedures that enable thermally stable and volatile
saccharides samples.229,230 Although practical, these procedures require time-consuming
protocols and even then intact quasi-molecular ions may not be observed. It has been the
development of “soft” ionization methods (i.e., ESI, MALDI, FAB) that has allowed
more successful studies of underivatized carbohydrates.231-234 The use of these methods,
in particular ESI, produces predominantly molecular ions with little or no fragmentation
in both positive and negative modes. The analysis of carbohydrates in the positive ion
mode by production of [M+H]+, is often rather difficult due to the lack of basic sites in
the saccharide molecules; nonetheless, a great body of work have been reported on alkali
metal coordinated species. Indeed, ESI-produced ions of underivatized (neutral)
carbohydrates are typically alkali metal-coordinated species. Sugars appear to be strong

86
ligands for alkali metal ions and the strength of their interaction can play an important
role in both the intensity of the quasimolecular ions and the extent of fragmentation when
performing tandem MS experiments. To this end, instrumental modifications were
carried out on the original apparatus set-up (fig 4.1) that permitted the IRMPD study of
ESI-generated carbohydrate ions in the positive mode. These modifications have also
facilitated the adaptation of an external EI source and potentially a MALDI source.
Figure 4.8 shows a schematic representation (top view) of the new instrumental set-
up after the addition of the external ion sources. Each of these sources is connected to a
newly-added vacuum chamber containing a quadrupole ion deflector (ABB Extrel, DC
voltage controlled), so that ions from any of the sources can be directed into an octopole
ion guide (RF-only controlled) for transport into the FTICR analyzer cell. Additional
pumping is achieved by use of a second turbomolecular pump (500L/s, Pfeiffer Vacuum
Co., Nashua, NH) and the background pressure after addition of this extra hardware is
approximately 9 x 10⁻⁹ torr. The pumping in the ESI region, which is isolated from the
main chamber by a manual gate valve, is accomplished by another two turbo pumps as
presented in figure 4.8. Construction of an additional aluminum frame cart was
necessary to provide support of these new ion sources. This cart also slides on the ball
bearing-shaft rail assemblies as previously described in figure 4.1.
Conclusion
This FELIX-FT-ICR instrumental coupling provides substantially improved
capabilities for obtaining infrared spectra of gaseous ions. Spectra of fluorene ions
reported here were recorded in the 700-1600 cm-1 infrared region, a range unavailable in
previous IRMPD experiments based on CO2 lasers. The high resolution of the FT-ICR
mass detection scheme permits access to spectra of ions whose masses are known

87
Figure 4.8 Top view of the FTICR instrument showing the additional hardware (ion optics, vacuum system components, ion sources) necessary to obtain IRMPD spectra of gas-phase ions produced external to the magnetic field.
unambiguously, thus allowing acquisition of IRMPD spectra corresponding to precisely
known loss channels. This capability is very important for species which present main
fragmentation losses of one or two mass unit from the parent. Additionally, as was seen
from the comparison of fluorene spectra obtained by QIT and FT-ICR mass detection, in
cases where H- or H2-loss processes are the lowest energy dissociation channels, the
ability of the FT-ICR instrumentation to resolve them can result in significant narrowing
of the observed lines and a better quality spectrum.
This facility at FELIX has extended the field of infrared spectroscopy to many
interesting molecular systems. Its operation to date has also been demonstrated by
obtaining the IRMPD spectra of a number of organometalic complexes and other
molecules with biological interest including peptides and proteins. Several of these

88
studies have been published elsewhere.170-173 The ability to differentiate isomeric ions
based on their vibrational spectra will greatly expand the capabilities of mass
spectrometry, both as a research tool and for solving more routine analytical problems.

89
CHAPTER 5 DIFFERENTIATION OF MONOSACCHARIDE ISOMERS
Introduction
Various forms of carbohydrates have been central to a wide variety of biological
functions.2,3 A growing body of research has shown that most of this functionality is
strongly related to carbohydrate structure. For this reason, many structural elucidation
studies have been implemented in order understand this structure-function relation. For a
complete characterization of carbohydrate functionality, such structure-elucidation
studies require knowledge of monosaccharide composition and sequence, linkage
position, and branch point, as well as anomeric configuration of each glycosidic bond.
With monosaccharides constituting the building blocks of complex carbohydrates, it is
crucial to come up with analytical methods capable of specific characterization and
differentiation of these monomer units. This task is challenging for the carbohydrate
chemist because the most common monosaccharide units, pentoses and hexoses, each
have many possible stereoisomeric and conformational forms. Consequently, structure
elucidation of carbohydrates must include a method to determine the stereochemistry of
each of these monosaccharide units.
Mass spectrometry has become a widely applied technique for the study of
carbohydrates due to its potential for providing a rapid, accurate, and sensitive method of
analysis. However, traditional mass spectrometry has not often been considered as a
technique capable of stereochemical determination. The implementation of tandem mass
spectrometry (MS/MS) has allowed this stereoisomer-differentiation limitation of MS to

90
be overcome. Thus, several investigations have been published demonstrating the
differentiation of stereoisomeric monosaccharides using mass spectrometry.235-243 The
majority of these studies have relied on the derivatization of the monosaccharides (to help
retain a rigid and stable conformation) and complexation with transition and alkali metals
as a tool for stereochemical differentiation.
The production of multicoordinated metallocomplexes with “soft” ionization
techniques has indeed facilitated the differentiation of carbohydrate isomers. Of
particular interest is the research reported by Leary and coworkers for the differentiation
of aldohexoses under Fast Atom Bombardment (FAB) and ESI conditions.238,240,243-248 In
this work it was demonstrated that the derivatization of aldohexoses with polyamines in
combination with transition metal cationization can lead to an unequivocal differentiation
of hexose,237 hexosamines,246,247 and N-acetylhexosamines239,248 based on the
characterization of their C-2 and C-4 stereocenters. Additional research has also shown
that underivatized carbohydrates can form stable complexes with transition metals which
can be very useful for stereoisomer differentiation.236,242 These studies have been mainly
conducted by Tortajada and co-workers, where lead (Pb2+), silver (Ag+), and copper
(Cu+) cationization was used for the structural characterization of hexoses (D-glucose, D-
galactose, D-fructose), methylglycosides (1-O-methyl-α-D-glucose and 1-O-methyl-β-D-
glucose) and pentoses (D-ribose, D-xylose, D-arabinose).
Alkali metals coordinated to sugars have received most of the attention in the
analysis of carbohydrates by mass spectrometry. With so many hydroxyl groups present
in their structure, carbohydrates happen to be very strong chelators for alkali metals.
Thus, when sugars are subjected to MS analysis they mainly ionize by attachment of

91
alkali cations (most likely Na+ present at trace levels) forming very stable complexes. It
is well known that the binding strength between alkali metals and organic molecules
decreases as the atomic radii of the alkali metal increases (Li = 0.76Å, Na = 1.02Å, K =
1.38Å, Rb = 1.52Å, Cs = 1.67Å. A number of studies have shown that carbohydrates are
no exception, with Li+ forming more strongly bound complexes than Cs+, which is not as
strongly bound, under identical conditions.57,249-251 In an effort to gain insight into the
nature of carbohydrate/alkali cation complexes, Siuzdak and coworkers performed
experiments focused on the cation binding strength of underivatized carbohydrates.241 A
qualitative assessment based on the signal intensity of fragment peaks revealed that
different isomeric conformations of hexoses (D-glucose, D-galactose, D-mannose, and D-
fructose) were influencing the ability of the alkali ions to complex the monosaccharides,
resulting in preferential cation binding. In similar work, Morin-Allory et.al. investigated
the mechanism of attachment of Na+ to D-glucose and its isomer galactose and their
respective methylated derivatives.252 For this they measured the ion yields for the
sodiated complexes formed by MALDI and ESI, which indicated higher ion yields for the
monosaccharide galactose and its derivatives.
In most of the studies mentioned above, the ultimate goal was the development of
an MS technique capable of stereochemistry differentiation. This was essentially
accomplished by relying on the ion intensities obtained for individual isomers or based
on the presence/absence of fragment ions produced by MS/MS methods, mainly CID.
For example, if a dissociation pattern for each sugar complex is unique, this can be used
as evidence to differentiate one stereoisomer from another. However, although an
effective differentiation of several monosaccharides by this methods is “in principle”

92
possible, the experimental fluctuations in the ion abundance of parent and fragment ions
may not allow for an unequivocal differentiation. Additionally, the use of many of these
methods as an analytical tool for monosaccharide isomer differentiation can be difficult
on a routine basis due to the derivatization steps, which are often time consuming and
somewhat troublesome.
The following pages of this chapter introduce a new method for carbohydrate
stereochemical differentiation using a free electron laser to obtain IRMPD spectra of ions
trapped in an FTICR mass spectrometer. This combination has made it possible to
unambiguously differentiate stereoisomeric ions based on their vibrational spectra rather
than just simple fragmentation. Ions are trapped in the FTICR cell and sequentially
fragmented with the intense radiation of the FEL. By monitoring fragmentation yield
while scanning the radiation wavelength of the laser, the vibrational spectrum of each
individual isomer can be obtained. This technique can provide a rapid method of
differentiation because only tagging with alkali metals is required instead of time-
consuming derivatization procedures. The carbohydrate isomers for which IRMPD
spectra are presented include: D-glucose, D-fructose, and the O-methylated derivatives of
glucose and galactose. These isomers were intentionally selected in order to demonstrate
the capabilities of this technique for the differentiation of conformers (pyranose and
furanose) as well as anomeric (α and β) and epimeric differentiation. Ions studied in this
research were alkali metal ion adducts, generated with an ESI source. By comparing
spectra of different alkali metal ion adducts additional information about the binding
strength of the metal and insights into the interaction of carbohydrates with specific alkali
ions can be obtained.

93
Experimental Procedure
The carbohydrates and alkali metal chlorides (XCl, X =Li+, Na+, K+, Rb+, and Cs+)
were dissolved in deionized water and mixed to a carbohydrate:alkali ratio of 1:1. These
solutions were typically diluted to a concentration range of 0.1-1 mM in a 80:20 HPLC-
grade methanol:H2O solvent prior to being subjected to ESI. The carbohydrate ions
studied were produced with a commercial ESI source (Z-spray, Micromass UK Ltd.).
Solutions were introduced by a Harvard Apparatus (Holliston, MA, USA) Model 11
syringe pump at flow-rates of 10-25 µl/min. The source temperature was held at 52 °C
and the desolvation gas temperature at 125 °C. The flow-rates of the nebulizer gas and of
the desolvation gas (N2) were 32 and 155 lh-1, respectively. The voltage applied to the
capillary was varied from 3-3.5 kV and the voltage applied to the sample cone was varied
from 80 to 100 V.
The ions produced by the Z-spray were immediately accumulated in a hexapole for
a period of time of 0.250-0.8s. After this accumulation time the ions were extracted and
fed into the quadrupole ion deflector and transferred into the FTICR cell via the octopole
ion guide. The hexapole and octopole were independently controlled by a function
generator (Models 3310A Hewlett-Packard and DS345 Stanford Research System,
respectively) and high power rf-amplifier (Models 240L ENI Inc, and Ultra 2021 T&C
Power Conversion Inc., respectively) and operated at 900KHz (~20Vp-p) and 1120KHz
(.350Vp-p), respectively. Ions transferred to the ICR cell by the octopole were captured
by gating the front trap electrode to ground for 0.1ms, followed by return of the trapping
potential of 6V. Once the ions were trapped in the cell they were subjected to ejection of
unwanted ions, fragmentation, and subsequent dipolar excitation and detection. All

94
aspects of the FTICR experiments, including gating of the hexapole and octopole,
continued to be controlled by the MIDAS data system as described in chapter 4.
The execution of these experiments was significantly enhanced by the
implementation of external accumulation of the ions in the hexapole. This accumulation
period was highly dependent on the binding strength of the alkali metal to the
carbohydrates. By using this accumulation event the experiment could be carried out
without the need to pulse a gas in order to stop the ions and trap them in the ICR cell.
Dispensing with this gas-assisted accumulation allowed for faster duty cycle by
eliminating the pump-down time necessary to reach a pressure low enough for optimal
data acquisition. In addition, the ions were more efficiently trapped by avoiding the
fragmentation associated with the gas, thus providing more vibrationaly cooled ions for
the IRMPD experiments.
After the ejection of background ions and a relaxation delay the ions of interest
were irradiated with 1-5 pulses of FELIX operating at 5Hz (~ 60 mJ/pulse). During the
analysis of K+, Rb+, and Cs+ complexes, the only fragmentation channel observed was
loss of the alkali metal ion. Higher energy dissociation channels (glycosidic bond
cleavage) were required for the IRMPD study of the smaller alkali metals (Li+, Na+) as
they were bound more strongly to the sugars. Spectra were obtained by plotting the
fragmentation yield as FELIX was scanned in the 600-1600 cm-1 wavenumber range. A
linear correction was applied to all spectra to account for power variations in the output
of FELIX.

95
Figure 5.1 Mass spectra of the sodiated ion (no isolation) of D-glucose and D-fructose. The peak at m/z 219 corresponds to the monosaccharide coordinated with K+, which was present as a contamination from previous runs.
Results and Discussion
Hexoses: D-glucose and D-fructose.
Carbohydrates that contain six carbons in their structure are known as hexoses. D-
glucose and D-fructose are two of the most familiar hexoses that, in fact, can be further
classified as aldohexoses and ketohexoses, respectively. These two hexoses have a
common structural formula, C6H12O6, with a formula weight of 180 Da. When these two
monosaccharides are in solution, glucose is found in a pyranose conformation and
fructose can be found as both furanose and pyranose forms. Figure 5.1 shows the
structures and mass spectra of the sodiated cation (M+Na+, M = hexose, m/z = 203) for
these two structural isomers. The spectra were obtained under similar preparation
(0.1mM, 1:1 sugar:Na) and instrument parameter conditions. A qualitative comparison
of these two spectra does not allow an identification of D-glucose or D-fructose.

96
Implementation of a tandem MS experiment (i.e., IRMPD) is therefore required in order
to achieve a more precise identification and differentiation of these isomers.
Previous experiments have shown that when monosaccharide/alkali metal
complexes of Na+, K+, Rb+, and Cs+ (m/z 203, 219, 265, and 313, respectively) are
subjected to CID they dissociate by losing the alkali metal as the main fragmentation
channel.57,250 The Li+ complexes, on the other hand, are more strongly bound and
produce a higher degree of covalent bond fragmentation. This suggested to us that the
strength of the interaction between the alkali metal and the monosaccharides might have
a significant influence on the outcome of IRMPD experiments as well. Figure 5.2
presents the IRMPD spectra of D-fructose tagged with two different alkali metals. To
produce these spectra, both the appearance of the bare alkali ion and the depletion of the
complex ion (monosaccharide + alkali metal) as a result of the IRMPD process were
monitored while scanning the wavelength of the FEL. This provided us with a spectrum
from which specific infrared information about the ion in question could be obtained.
The spectra presented in figure 5.2, although obtained under identical conditions, present
noteworthy dissimilarities which arise from the different interactions between the alkali
metal and the monosaccharide. Potassium, with a smaller atomic radius, has a stronger
binding interaction with D-fructose than rubidium and as a result produces less
fragmentation (loss of K+). Alternatively, the weaker interaction between D-fructose and
Rb+ allows for higher fragmentation yield and a better quality IRMPD spectrum. It
should be pointed out that a higher fragmentation yield can be obtained with the K+
complex if higher laser fluence (more FEL pulses) is used, but this will result in an
excess of internal energy (hotter ions) that can cause the ionic complex to lose its

97
intrinsic vibrational structure and result in an even lower quality IRMPD spectrum.
Therefore, tagging a monosaccharide with a weakly attached alkali metal is a more gentle
way to probe its natural vibrational structure.
Figure 5.2 IRMPD spectra of the K+ and Rb+ coordinated D-fructose. Spectra were obtained with irradiation by one FEL macropulse. K+ and Rb+ were ejected prior to irradiation to insure all fragmentation was induced by the IRMPD process. Fragmentation yield is obtained by calculating the ratio of the intensity of the bare alkali cation to the total ion intensity (bare ion + parent ion).
In light of the enhanced IRMPD spectra obtained with the D-fructose + Rb+
complex, the spectrum of D-glucose was also obtained under the same conditions in order
to test if this method was efficient for the differentiation of monosaccharide isomers in a
mass spectrometer. A comparison of the IRMPD spectra for both structural isomers is
presented in figure 5.3. It can be clearly seen that each isomer has a distinctive spectrum
600 800 1000 1200 1400 1600
0.00
0.05
0.10
0.15
0.20
0.25
0.30
0.35
0.40
K+
Rb+
wavenumber (cm-1)
Frag
men
tatio
n Yi
eld
600 800 1000 1200 1400 1600
0.00
0.05
0.10
0.15
0.20
0.25
0.30
0.35
0.40
K+
Rb+
wavenumber (cm-1)
Frag
men
tatio
n Yi
eld

98
Figure 5.3 IRMPD spectra of the Rb-coordinated complexes of the structural isomers D-glucose and D-fructose. These spectra show the capability of this method to differentiate carbohydrate structural isomers in a mass spectrometer.
and their differentiation is therefore possible with this method. An inspection of these
two infrared spectra reveals obvious differences which are very likely to occur as
expressions of their different conformations (pyranose and furanose). For example, the
spectrum for D-fructose shows two resolved bands in the vicinity of 815 and 927 cm-1,
which are clearly missing in the spectrum of D-glucose. Another obvious difference is
the spectral shift of the two maxima present in the infrared regions of 1000-1100 and
1200-1310 cm-1. It can be seen that D-fructose is red-shifted in comparison with D-
glucose. This infrared region, 600-1600 cm-1, represents a portion of the mid-IR that is
associated principally with C-C, C-O and C-O-C stretching modes of organic molecules.
Frag
men
tatio
n Yi
eld
600 800 1000 1200 1400 1600wavenumber (cm-1)
glucose fructose
Wavenumber (cm-1)
Frag
men
tatio
n Yi
eld
600 800 1000 1200 1400 1600wavenumber (cm-1)
glucose fructose
Frag
men
tatio
n Yi
eld
600 800 1000 1200 1400 1600wavenumber (cm-1)
glucose fructose
Wavenumber (cm-1)

99
However, the assignment of these bands to their corresponding vibrational modes is an
endeavor out of the actual scope of this research, which is solely focused on the
differentiation of carbohydrate isomers in a mass spectrometer.
Glycosides: O-methylated Monosaccharides.
At this point it should be pointed out that reducing sugars, like D-glucose and D-
fructose, are known to exist as an equilibrium mixture of isomers when present in an
aqueous solution. This equilibrium, as presented in figure 2 of chapter 1, is known as
mutarotation. For example, a solution of D-glucose consists of a mixture of
approximately 33% of the α anomer and 67% of the β.11 Although this interconvertion
(mutarotation) process is well characterized in the condensed phase, no experiments have
been done to date to prove to what extent this equilibrium holds for the gas phase.
Consequently, the spectra shown in figure 5.3 demonstrate differentiation of structural
isomers, but do not provide any information about differentiation of stereoisomeric ions
(α and β). Additional experiments were required in order to prove if this type of
differentiation was also feasible in a mass spectrometer.
Monosaccharides can be modified by reaction with alcohols and amines to form
adducts. For example, D-glucose will react with methanol in an acid-catalyzed process
where the anomeric carbon reacts with the hydroxyl group of methanol to form two
products, methyl alpha-D-glucopyranoside and beta-D-glucopyranoside. These two
glucopyranoside (glycosides) differ only in the configuration at the anomeric carbon
atom. The new bond formed between the anomeric carbon atom and the hydroxyl
oxygen atom of methanol is called a glycosidic bond, specifically, an O-glycosidic bond.
The anomeric carbon atom of a sugar can also be linked to the nitrogen atom of an amine

100
Figure 5.4 Structures of the glycosides investigated to demonstrate anomeric differentiation in a mass spectrometer. (1) β-methyl-glucopyranoside, (2) β-methyl-galactopyranoside, (3) α-methyl-glucopyranoside, (4) α-methyl-galactopyranoside.
to form an N-glycosidic bond. When such a glycosidic bond is formed, the
interconvertion between anomeric forms is precluded and the glycoside is said to be
locked into one configuration, either α or β. Therefore, it is possible to have a solution
where the configuration of the stereoisomer is known with certainty and no equilibrium
between the anomers is occurring.
For the purpose of investigating the potential of this method for differentiation of
carbohydrate anomers, we chose the four glycosides shown in figure 5.4. These isomers
have the molecular formula C7H14O6 and readily form rubidium complexes with an m/z
of 279 Da. The main differences that need to be emphasized correspond to
configurations at the anomeric carbon C1 (structure 1 shows the numbering convention
for the C’s) and the stereogenic carbon C4. For example, β-methyl-glucopyranoside (1)

101
Figure 5.5 IRMPD spectra of Rb+-coordinated glycoside isomers. Spectra are stacked for simplicity of comparison.
and β-methyl-galactopyranoside (2) differ in their configuration at C4 and to their
respective anomers: (α-methyl-glucopyranoside (3) and α-methyl-galactopyranoside (4),
in their configuration at C1.
Figure 5.5 illustrates the IRMPD spectra of the four carbohydrate isomers selected
in this part of the study. A simple qualitative examination of these spectra reveals
obvious differences. For example, the spectrum for β-methyl-glucopyranoside (in the left
panel) is distinguished by an ensemble of five resolved bands in the region between 1130
and 1450 cm-1, whereas, in the case of α-methyl-glucopyranoside this region presents
fewer and broader bands. The latter, however, exhibits a band at 885 cm-1 and a resolved
shoulder peak at 999 cm-1, which are clearly missing in the spectrum of it isomeric
counterpart. In the case of the galactopyranoside isomers (right panel), the region from
600 700 800 900 1000 1100 1200 1300 1400 1500 1600
wavenumber cm-1
α-D-methylgalactopyranoside β-D-methylgalactopyranoside
700 800 900 1000 1100 1200 1300 1400 1500 1600
Rel
ativ
e Fr
agm
enta
tion
Yiel
d
wavenumber cm-1
α-D-methylglucopyranoside β-D-methylglucopyranoside
wavenumber (cm-1) wavenumber (cm-1)600 700 800 900 1000 1100 1200 1300 1400 1500 1600
wavenumber cm-1
α-D-methylgalactopyranoside β-D-methylgalactopyranoside
700 800 900 1000 1100 1200 1300 1400 1500 1600
Rel
ativ
e Fr
agm
enta
tion
Yiel
d
wavenumber cm-1
α-D-methylglucopyranoside β-D-methylglucopyranoside
wavenumber (cm-1) wavenumber (cm-1)

102
1130 to 1450 cm-1 is also characterized by distinctive peaks that can distinguish each
isomer, in addition to a broader and less resolved central-band for β-methyl-
galactopyranoside. Finally, a comparison of both panels in figure 5.5 reveals the
presence of characteristic bands for the galactopyranosides in the region between 700 and
900 cm-1. So, in conclusion, the method presented here allows not only for the
differentiation of anomeric isomers but of epimers (galactose and glucose) as well.
Dependence of the IRMPD Process on FELIX-Irradiation Conditions.
Throughout the execution of these experiments, it was observed that there was an
influence of longer irradiation time (multiple FEL pulses) on the outcome of IRMPD
experiments. Therefore, additional experiments were carried out in order to examine this
dependence on irradiation time. The photodissociation mass spectra shown in figure 5.6
demonstrate how the intensity of the photo-fragment (Rb+) increases with the number of
FELIX pulses used. The pulse structure of FELIX consists of 5µs long macropulses,
each with a picosecond micropulse substructure. The laser operated at 5 Hz repetition
rate (for macropulses) and an output energy of 60 mJ/macropulse. Thus, by increasing
the irradiation delay (number of FELIX pulses) more of the ions trapped in the FTICR
cell were allowed to interact with the laser and a higher fragmentation yield was
obtained. This is clearly seen in figure 5.6e, where irradiation with 4 pulses causes
depletion higher than 50% of the parent peak (m/z = 279) as opposed to an 18% depletion
obtained with 1 pulse (figure 5.6b). Another effect that irradiation time can have on the
outcome of the IRMPD spectra is related with reaching a dissociation threshold. For
instance, some ions can have dissociation thresholds that may not be reached with the

103
Figure 5.6 Photodissociation mass spectra of Rb+-β-methyl-galactopyranoside complex (m/z = 279) using different numbers of FELIX pulses. a) Isolation of parent ion (no FELIX), b) 1 pulse, c) 2 pulses, d) 3 pulses, d) 4 pulses. FELIX tuned to 1069 cm-1 and operated at 5 Hz and 60 mJ/pulse.
energy that is imparted with just one FELIX pulse, requiring more pulses in order to
dissociate. This is, however, not the case presented in figure 5.6 where one pulse imparts
enough energy for dissociation. The main reason for this is the fact that in this particular
photodissociation, FELIX was tuned to a frequency (1069 cm-1) that corresponds to the
absorption maxima in the IRMPD spectra (see figure 5.5). With such absorption
resonance, the energy is absorbed more efficiently and one FELIX pulse seems to be
enough energy to reach a dissociation threshold.
m/z30025020015010050
Abu
ndan
ce
50
45
40
35
30
25
20
15
10
5
m/z30025020015010050
Abu
ndan
ce
40
35
30
25
20
15
10
5
m/z30025020015010050
Abun
danc
e
35
30
25
20
15
10
5
m/z30025020015010050
Abu
ndan
ce
35
30
25
20
15
10
5
m/z30025020015010050
Abu
ndan
ce
35
30
25
20
15
10
5
a)
b) c)
d) e)
m/z30025020015010050
Abu
ndan
ce
50
45
40
35
30
25
20
15
10
5
m/z30025020015010050
Abu
ndan
ce
40
35
30
25
20
15
10
5
m/z30025020015010050
Abun
danc
e
35
30
25
20
15
10
5
m/z30025020015010050
Abu
ndan
ce
35
30
25
20
15
10
5
m/z30025020015010050
Abu
ndan
ce
35
30
25
20
15
10
5
a)
b) c)
d) e)

104
Although with a higher fragmentation yield a better IRMPD spectrum can be
obtained, some potential problems can arise by utilization of a greater number of FEL-
pulses. These problems are made evident with the spectra of K+-β-methyl-
glucopyranoside complex presented in figure 5.7. It can be seen that the spectrum
obtained with 6 FEL-pulses produces more intense infrared bands (~ 67% fragmentation
yield), but this in turn leads to a broader IRMPD spectrum. This observation can be
rationalized by the fact that an excess of internal energy is imparted by multiple FEL-
pulses and as result the spectra are representative of ions which are “hotter”. This
condition can be slightly different if an attenuation of 50% (3dB, blue trace in left panel)
is applied to the FEL laser beam. In this case enough thermal energy is imparted to the
ions to dissociate them but it can be seen how infrared information can be lost, in
particular the absorption band present at 1400 cm-1 in the green trace. Another adverse
result of using multiple pulses is the longer FTICR duty cycle, which can substantially
increase the experiment time when spectra are obtained in a wide IR range (i.e., 600-1600
cm-1). Furthermore, performing these photodissociation experiments with fewer FEL
pulses can also result in poorer IRMPD spectra quality. For example, the spectrum
obtained with one pulse (red trace) shows how useful infrared information can be
continuosly lost due to insufficient thermal heating of the ion. This is seen in the region
from 1170 to 1400 cm-1, where the presence of low-intensity vibrational modes does not
provide for an efficient absorption of the laser radiation. It should to noted that spectra
presented in the left panel of figure 5.7 correspond to K+ complexes and it was previously
shown that a more informative spectrum can be obtained with Rb+ complexes. Thus, a
comparison of spectra obtained for both complexes is presented in the right panel of

105
figure 5.7. Note how the complexation of this carbohydrate with an alkali metal ion that
has a weaker binding strength can provide more information, in particular in the region
from 1170 to 1400 cm-1. A study of the Rb+ complex under multiple FEL-pulses
conditions was not carried out; however, a behavior similar to the K+ complex should be
expected with more non-specific dissociation and broader bands.
Figure 5.7 IRMPD spectra of β-methyl-glucopyranoside obtained under different experimental conditions: (left) K+-complex spectra obtained with different irradiation conditions (number of FEL pulses and laser power). (right) Comparison of Rb+ and K+ complexes obtained under similar conditions. K+-complex spectra smoothed for simplicity of comparison.
Reproducibility of this Differentiation Method
Establishing the potential of this IRMPD approach for the differentiation of
carbohydrate isomers requires a detailed evaluation of both the short-term (same day) and
long-term (months/years) reproducibility of these IRMPD spectra. Unfortunately, the
limited FELIX beam time available for these experiments and the considerable time
needed to obtain each IRMPD spectrum did not allow for such a detailed evaluation.
600 800 1000 1200 1400 16000.0
0.1
0.2
0.3
0.4
0.5
0.6
0.7
6 pulses - 0 dB 6 pulses - 3 dB 1 pulse - 0 dB (3 pt smooth)
wavenumber (cm-1)
Frag
men
tatio
n Yi
eld
600 800 1000 1200 1400 1600
0.0
0.1
0.2
0.3
0.4
0.5
K+ complex, 1 pulse - 0 dB (3 pt smooth) Rb+ complex, 1 pulse - 0 dB
wavenumber (cm-1)wavenumber (cm-1) wavenumber (cm-1)600 800 1000 1200 1400 1600
0.0
0.1
0.2
0.3
0.4
0.5
0.6
0.7
6 pulses - 0 dB 6 pulses - 3 dB 1 pulse - 0 dB (3 pt smooth)
wavenumber (cm-1)
Frag
men
tatio
n Yi
eld
600 800 1000 1200 1400 1600
0.0
0.1
0.2
0.3
0.4
0.5
K+ complex, 1 pulse - 0 dB (3 pt smooth) Rb+ complex, 1 pulse - 0 dB
wavenumber (cm-1)600 800 1000 1200 1400 1600
0.0
0.1
0.2
0.3
0.4
0.5
0.6
0.7
6 pulses - 0 dB 6 pulses - 3 dB 1 pulse - 0 dB (3 pt smooth)
wavenumber (cm-1)
Frag
men
tatio
n Yi
eld
600 800 1000 1200 1400 1600
0.0
0.1
0.2
0.3
0.4
0.5
K+ complex, 1 pulse - 0 dB (3 pt smooth) Rb+ complex, 1 pulse - 0 dB
wavenumber (cm-1)wavenumber (cm-1) wavenumber (cm-1)

106
However, a cautious and consistent experimental procedure was always followed in order
to assess the reliability and reproducibility of the infrared bands that distinguished the
individual isomers. Each infrared spectrum presented in this and following sections
represents an average of at least two FELIX scans (full scan) within the entire infrared
region of interest, usually 700-1600 cm-1. In those regions where a spectrum showed a
particular absorption feature that would differentiate one isomer from another, for
example the band at 895 cm-1 in the IRMPD spectrum of α-D-methyl-glucopyranoside
(figure 5.5), FELIX was scanned several times (at least 3) in order to guarantee the
reproducibility of the appearance or absence, respectively, of this distinguishable feature
in the spectrum of each isomer. In the application of this method for the differentiation
of carbohydrate isomers, it is these distinguishable bands that require particular attention
so that the scan of entire spectrum is not necessary.
An example of the short term reproducibility of this approach can be observed in
figure 7.3. These plots represent the average of five FELIX scans with generally small
and quite acceptable standard deviations for each data point. As already mentioned, this
type of assessment was not performed in this part of the study (monosaccharides) due to
the limited time. Figure 5.8 shows an example of the long term reproducibility of the
spectra obtained with this FEL-FTICR method. As initially designed, the laser-alignment
configuration was intended to provide a double pass through the center of the cell to
interact with as many ions as possible present within the ion cloud. In order to increase
both the fraction of ions interacting with the laser beam and the laser fluence to induce
the photodissociation, a new configuration was used in which the laser was aligned
providing multiple interactions (laser passes). Spectra obtained with these two alignment

107
configurations are illustrated in the following picture. These two spectra were obtained
five months apart from each other using the same experimental conditions (except for
laser alignment) and samples. A linear power correction was performed on both spectra
to correct for laser power fluctuations on both dates. Overall, we can observe very
similar spectra except for the relative intensities of a few bands, including the central
band at 1050 cm-1. However, most important is the reproduction of all absorption bands
at their respective frequencies which are the characteristic features used for the
differentiation of carbohydrate isomers.
Figure 5.8 IRMPD spectra of Rb+-coordinated α-methyl-D-galactopyranoside obtained with two different laser alignments. The multi-pass alignment spectrum has been translated on the positive y-direction for simplicity of comparison.
600 700 800 900 1000 1100 1200 1300 1400 1500 1600 1700
Multi-pass Alignment (03/2005) Double-pass Alignment (10/2004)
wavenumber (cm-1)
Frag
men
tatio
n Yi
eld
600 700 800 900 1000 1100 1200 1300 1400 1500 1600 1700
Multi-pass Alignment (03/2005) Double-pass Alignment (10/2004)
wavenumber (cm-1)
Frag
men
tatio
n Yi
eld

108
Conclusion
These IRMPD studies have demonstrated that carbohydrate isomers can be
differentiated in a mass spectrometer using alkali metal cationization, without any
preliminary derivatization. Moreover, experiments carried out on 1-O-methyl-glycosides
showed that stereochemistry of the anomeric center can be easily distinguished. The
strength of the interaction between alkali metals and carbohydrates can play an important
role in the outcome of IRMPD spectra. A strongly bound cation will produce poorly
resolved spectra unable to provide an unambiguous isomeric differentiation, whereas a
weakly bound cation can produce a spectrum that will provide more structurally useful
infrared information. For the purpose of optimization of irradiation conditions, results
presented here suggest a trade-off between sensitivity and quality of spectra. A higher
fragmentation yield can result, but with the concomitant formation of hotter ions, which
in turn leads to a broader and more poorly resolved spectrum. On the other hand, lower
laser irradiation intensities can result in an incomplete spectra uncapable of a definitive
differentiation and in loss of spectroscopic information necessary for a precise
differentiation.
Some theoretical calculations have been carried out in an effort to better understand
the nature of interaction between monosaccharides and alkali metals.241,249,252 Although
experimentally supported, these studies do not agree among themselves and still provide
only tentative information about the interaction between alkali cations and
monosacharides). Therefore, computational experiments are currently underway and
directed primarly toward calculation of the vibrational spectra of the carbohydrate/alkali
metal complexes for which infrared spectra have already been obtained. These
theoretical spectra should assist us by providing a better idea of the coordination sites of

109
these monosaccharide complexes and, most importantly, in assignment of the infrared
bands.

110
CHAPTER 6 DIFFERENTIATION OF DISACCHARIDE ISOMERS
Introduction
In addition to ring conformation and stereochemistry of monosaccharide units
another very important piece of information necessary during the structural analysis of
carbohydrates is the nature of the glycosidic bond. The determination of this
carbohydrate feature is crucial for structural elucidation, because it gives substantial
information about sequence and branching of complex carbohydrates. This kind of bond
occurs when two monosaccharides are joined together by a linkage between the anomeric
carbon C1 of one sugar and the hydroxyl group located at any position on the other sugar.
Therefore, characterization of this linkage requires knowledge not only of its anomericity
(α or β) but also its position on the monosaccharide ring (C1, C2, C3, C4, and C6).
In nature there are certain circumstances that emphasize the importance of
glycosidic bonds. This can be exemplified by the common case of cellulose, starch, and
glycogen. These polysaccharides are homopolymers of D-glucose units bound together
by different types of glycosidic linkages. The configurations of their glycosidic bonds
influence both the structure and the role of these macromolecules, showing the wide
diversity of carbohydrate chemistry. For example, cellulose and starch can be hydrolyzed
in enzyme-catalyzed reactions in living organisms to obtain their constituent disaccharide
units cellobiose and maltose, respectively. These disaccharides consist of two D-glucose
units joined by a 1-4 linkage but differ only in the anomeric configuration. Despite the
similarities of their structure, cellobiose (β 1-4) and maltose (α 1-4) have dramatically

111
different biological properties. Cellobiose cannot be digested by humans and cannot be
fermented by yeast. Maltose, on the other hand, is readily digested with the help of
specific enzymes like α-amylase and can be fermented with no difficulties.
Glycosidic bonds have also been shown to be a key factor in the energy systems of
some organisms. Glycogen is a polysaccharide that serves the same role of energy
storage in animals that starch serves in plants. Glycogen, however, has a higher content
of 1-6 linkages that allows this molecule to have a more branched structure and to contain
more glucose units (up to 500,000). It is this type of glycosidic bond that is thought to
facilitate the rapid breakdown of glycogen into glucose when energy is required.
In view of the specificity that certain biological processes exhibit for the
configuration of glycosidic bonds, it seems necessary to come up with convenient
analytical methods for determination of both anomericity and linkage position. Indeed, a
wide variety of mass spectrometric techniques has been applied to this end, with varying
degrees of success. Laser desorption mass spectrometry (LDMS) was one of the earliest
techniques applied for the structural analysis of carbohydrates, providing both
fragmentation of glycosidic bonds and cross-ring cleavages.253 It has been applied in
conjunction with Fourier transform ion cyclotron resonance mass spectrometry (LD-
FTICR)254 and in different modalities including infrared laser desorption (IRLD).255 A
study reported by Spengler and coworkers demonstrated the applicability of IRLD for the
determination of glycosidic bonds in alkali metal-cationized (Na+, and K+)
disaccharides.233 Moreover, IRLD provided a distinctive approach to the structural
analysis of carbohydrates, since fragmentation occurs primarily at the sugar ring rather
than at the glycosidic bond.

112
Fast atom bombardment (FAB), although rarely used these days, has been widely
applied for glycosidic bond determination in carbohydrates. This technique, considered
one of the earliest “soft” ionization methods, requires the presence of a liquid matrix to
hold the analytes. Therefore, in order to remove interferences from matrix ions and to
induce fragmentation it has been necessary to complement FAB with tandem mass
spectrometric techniques such as collision induced dissociation (CID) and mass-analyzed
ion kinetic energy (MIKE) spectra. By this means it has been possible to determine the
type of glycosidic bond in disaccharides on the basis of distinctive fragmentation of their
negative quasi-molecular ion (m/z = 341).234,256 FAB has also been implemented for the
analysis of carbohydrates in the positive ion mode by CID fragmentation of both
protonated257 and sodiated quasi-molecular ions.49 Additional work presented by the
Leary group has focused on the investigation of mono- and di-lithiated disaccharides,
showing that these types of complexes can produce fragmentation patterns equivalent to
those in the negative mode.258,259 These studies have been aided by 18O and 2H labeling
experiments and semiempirical calculations to provide insight into the mechanism of
dissociation and coordination sites on the disaccharide molecules.
Electrospray ionization (ESI) is another MS technique that, as opposed to FAB, is
becoming increasingly applied to the structural analysis of carbohydrates. By
implementation of both ESI in the negative ion mode and in-source fragmentation,
Garozzo and co-workers and Mulroney and co-workers were able to determine the
position and anomeric configuration of glycosidic bonds in disaccharides.232,260 They
demonstrated that by using the characteristic fragmentation patterns, which were
analogous to those obtained by FAB, a precise differentiation of the entire series of

113
glucopyranosyl disaccharides was possible. In a more recent study, Jiang et al.
investigated the attachment of anionic species to disaccharides in order to probe their
specific linkage configuration.261 It was demonstrated that chloride adducts ([M+Cl]-, M
= disaccharide) produced the most intense quasi-molecular ions and that the ratio of Cl-
:non-Cl-containing product ions obtained in CID spectra can be used to differentiate
anomeric configuration of disaccharides.
Motivated by the results obtained with the IRMPD differentiation of alkali metal-
monosaccharide complexes, in the work reported in this chapter we decided to explore
the capabilities of our approach for the differentiation of disaccharide isomers. The
isomeric system studied consisted of a set of disaccharides (glycosidic bonds:1-2, 1-3, 1-
4, 1-6, including both anomers) composed of D-glucose units only, so their
differentiation was based strictly on the type of linkage present. Prior to attempting the
differentiation, IRMPD spectra of different alkali metal complexes were obtained in order
to appraise which metal-disaccharide complex would provide the best differentiation.
This assessment was followed first by experiments intended to differentiate between
linkage positions and second by the differentiation of anomeric disaccharides.
Experimental Procedure
Experimental parameters used in these studies were similar to those employed in
the differentiation of monosaccharides (reported in chapter 5) except for minor changes.
Briefly, solutions of disaccharides and alkali metal chlorides (XCl, X =Li+, K+, Rb+, and
Cs+) were prepared in a carbohydrate:alkali ratio of 1:1 with a 80:20 HPLC-grade
methanol:H2O solvent at typical concentrations of 0.1-1 mM. Solutions were ESI
sprayed under the same conditions as for the previous experiments but the mass-analysis
pulse timing, in particular irradiation delays and hexapole accumulation, was performed

114
under slightly different conditions. In fact, these experiments required longer irradiation
times (more FELIX pulses) in order to fragment the ions as opposed to experiments with
monosaccharides. The latter can be explained in terms of the binding strength that
disaccharides can present for alkali metals. With more hydroxyl groups around the two
glucose units, disaccharides are stronger ligands for alkali metal cations, therefore
requiring 3 to 5 FELIX pulses to obtain a more efficient dissociation (better IRMPD
spectra). Additionally, this stronger interaction results in more stable complexes capable
of surviving the high pressure conditions at which ions are trapped in the hexapole. This
allows for longer hexapole accumulation delays (up to 850 ms) that can lead to more
intense quasi-molecular ion signals.
Results and Discussion
IRMPD Spectroscopic Evaluation of Alkali Metal Complexes
To assess the value of this technique of differentiating carbohydrate isomers by
IRMPD, experiments were performed with sucrose+alkali metal complexes. This
disaccharide was chosen to evaluate this method because its IRMPD spectrum (figure
6.1) was found to have clearly resolved infrared features that would allow a qualitative
comparison between spectra obtained with different complexes. Sucrose is a non-
reducing sugar which consists of a D-glucose unit in its pyranose form (6-member ring)
and a D-fructose unit in its furanose form (5-member ring). These two monosaccharide
units are connected by a glycosidic bridge between the C1 in glucose and the C2 in
fructose. By the fact that this molecule is composed of these two monosaccharides, its
spectrum could be interpreted as a combination of infrared bands present in the spectra of
both individual units (see figure 3 in chapter 5). This could explain its distinctive

115
spectrum; however, we did not pursue any experiments with the purpose of proving these
speculations.
Figure 6.1 IRMPD spectra of sucrose-alkali metal complexes. Spectra for Cs+, Rb+, and K+ complexes were obtained through loss of alkali metal. The Li+-complex spectrum was obtained by monitoring cleavage of the glycosidic bond and magnified (x2) for better inspection.
Figure 6.1 presents the spectra acquired for different sucrose+alkali metal
complexes, including Li+, K+, Rb+, and Cs+. The Cs+ and Rb+ spectra were obtained
under identical conditions, namely 3 FELIX pulses. The other two spectra required
different irradiation delays, with the K+-complex using 5 FELIX pulses and the Li+-
complex using 7 pulses. In these spectra one can again observe how the strength of the
800 900 1000 1100 1200 1300 1400 1500
wavenumber (cm-1)
Li+
K+
Rb+
Cs+
x2
Frag
men
tatio
n Yi
eld
H OHO
H OH
O
OH
H
HO
H2C
H
HO
O
HH
HOH
CH2OH
HCH2OH
800 900 1000 1100 1200 1300 1400 1500
wavenumber (cm-1)
Li+
K+
Rb+
Cs+
x2
Frag
men
tatio
n Yi
eld
H OHO
H OH
O
OH
H
HO
H2C
H
HO
O
HH
HOH
CH2OH
HCH2OH
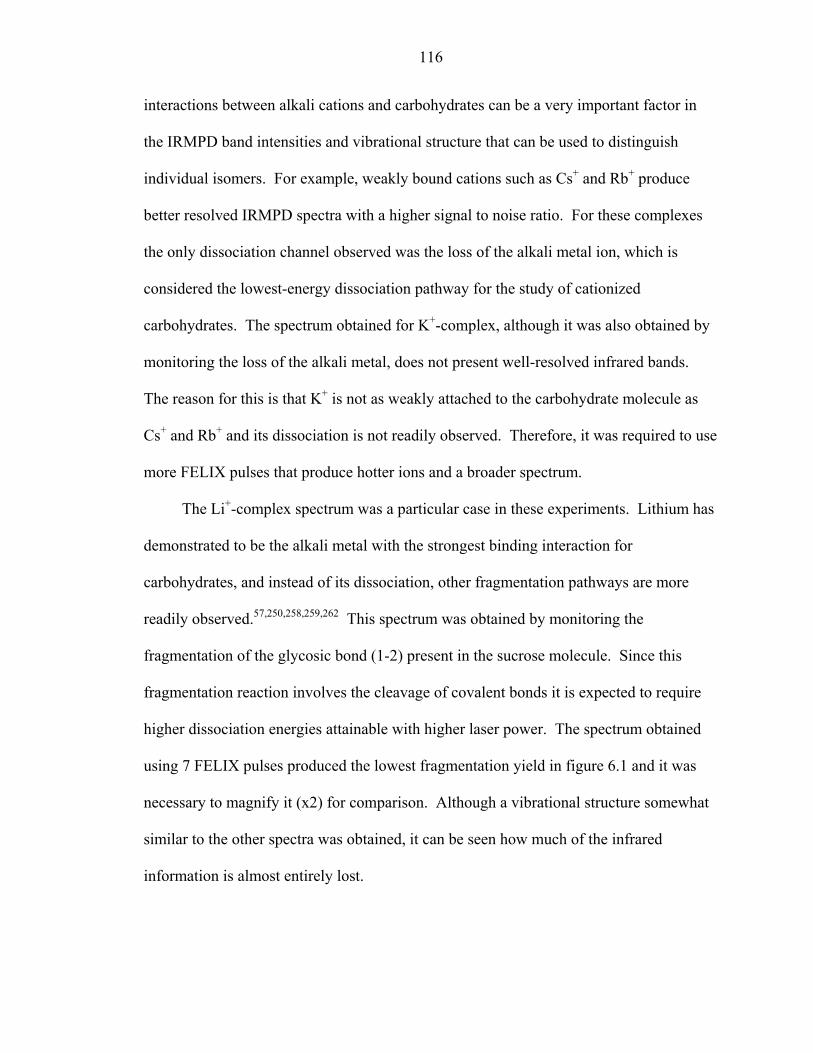
116
interactions between alkali cations and carbohydrates can be a very important factor in
the IRMPD band intensities and vibrational structure that can be used to distinguish
individual isomers. For example, weakly bound cations such as Cs+ and Rb+ produce
better resolved IRMPD spectra with a higher signal to noise ratio. For these complexes
the only dissociation channel observed was the loss of the alkali metal ion, which is
considered the lowest-energy dissociation pathway for the study of cationized
carbohydrates. The spectrum obtained for K+-complex, although it was also obtained by
monitoring the loss of the alkali metal, does not present well-resolved infrared bands.
The reason for this is that K+ is not as weakly attached to the carbohydrate molecule as
Cs+ and Rb+ and its dissociation is not readily observed. Therefore, it was required to use
more FELIX pulses that produce hotter ions and a broader spectrum.
The Li+-complex spectrum was a particular case in these experiments. Lithium has
demonstrated to be the alkali metal with the strongest binding interaction for
carbohydrates, and instead of its dissociation, other fragmentation pathways are more
readily observed.57,250,258,259,262 This spectrum was obtained by monitoring the
fragmentation of the glycosic bond (1-2) present in the sucrose molecule. Since this
fragmentation reaction involves the cleavage of covalent bonds it is expected to require
higher dissociation energies attainable with higher laser power. The spectrum obtained
using 7 FELIX pulses produced the lowest fragmentation yield in figure 6.1 and it was
necessary to magnify it (x2) for comparison. Although a vibrational structure somewhat
similar to the other spectra was obtained, it can be seen how much of the infrared
information is almost entirely lost.

117
Of noticeable interest in figure 6.1 is how the infrared bands in the regions of 900
cm-1 and 1150 to 1450 cm-1 turn out to be more intense and resolved as the size of the
alkali metal increases. The Cs+-sucrose complex provides the most informative and
highest signal-to-noise ratio spectrum of them all. Evidently, the weak binding
interaction between Cs+ and sucrose positively favors the IRMPD process by facilitating
the dissociation process and increasing the sensitivity of this technique. These results
suggest that the Cs+-carbohydrate complex is the combination which permits the most
definitive IRMPD differentiation; however, there are some adverse situations that can
arise from using this complex partnership. For example, although weak binding
interactions produce more intense infrared bands it is also true that these interactions can
result in unwanted non-wavelength-dependent dissociations. This can be seen in Cs+-
sucrose spectrum shown in figure 6.1, where it can be observed how in addition to the
more intense bands the spectrum also has a higher spectral baseline, in particular in the
region from 800 to 900 cm-1. Another inconvenience that can be confronted when using
cesium is the stability of its complexes. This ion forms the least stable complexes of all
alkali metal cations, a condition that brings about metastable fragmentation either during
hexapole accumulation or while trapped in the FTICR cell. As a result a mass spectrum
for a Cs+ complex could be characterized by unstable and low intensity parent ion
signals. For these reasons and based on the results obtained for the differentiation of
monosaccharides in the previous chapter, it was decided to continue these experiments
using Rb+ complexes.

118
Figure 6.2. IRMPD spectra of disaccharide isomers (C12H22O11+ Rb+, m/z = 427), obtained by monitoring the Rb+ loss channel.
Differentiation of Glucopyranosyl Disaccharides with Different Linkage Positions by IRMPD
In order to insure that these experiments were strictly focused on the
differentiation of linkage position, we selected a set of disaccharides composed of two D-
glucose units connected by glycosidic bonds with the same configuration (α). This set
includes the disaccharides kojibiose, nigerose, maltose and isomaltose, with glycosidic
bonds α1-2, α1-3, α1-4, and α1-6, respectively. The IRMPD spectra for each of these
disaccharides are presented in figure 6.2. These spectra correspond to Rb+-disaccharide
complexes (m/z = 427) and were obtained by monitoring the loss of the alkali metal under
similar conditions. Given the fact that the only difference between these molecules is
their linkage position, it is reasonable to assume that the dissimilarities observed in the
IRMPD spectra of these isomers arise from infrared expression of their linkages.
700 800800 900 10001000 1100 12001200 1300 14001400 1500 16001600
W avenum ber (cm -1)
isom altose (α1-6) m altose (α1-4) n igerose (α1-3) kojib iose (α1-2)
Frag
men
tatio
n Y
ield
700 800800 900 10001000 1100 12001200 1300 14001400 1500 16001600
W avenum ber (cm -1)
isom altose (α1-6) m altose (α1-4) n igerose (α1-3) kojib iose (α1-2)
Frag
men
tatio
n Y
ield

119
Comparison of these spectra reveals some differences mainly in the regions of 750-925
and 1200-1400 cm-1, suggesting the infrared features that correspond to their particular
glycosidic bond position. For example, the spectra for kojibiose and maltose present two
weakly resolved bands in the region between 1200 and 1400 cm-1, whereas, nigerose and
isomaltose present only a broad and unresolved hump-like feature. It can also be seen
how in the region from 750 to 925 cm-1 the spectra for isomaltose is characterized by the
lack of any infrared feature, as opposed to the other spectra that show a few low intensity
bands. Other characteristic features can be observed in the shape of the central band.
Overall, although these spectra do not present the most pronounced differences, they still
have minor spectral features which make them slightly distinguishable from each other
based on their IRMPD spectra.
Differentiation of Glucopyranosyl Disaccharides with Different Linkage Anomeric Configurations by IRMPD
The capabilities of this method were also tested for the differentiation of the
anomeric configuration of the glycosidic bond. The disaccharides investigated had the
same glycosidic bond position but a different stereochemistry, so that the differentiation
experiments were based only on anomericity. The structures and IRMPD spectra of the
first pair of sterereoisomeric disaccharides, cellobiose and maltose, are presented in
figure 6.3. As seen in the structures, these two molecules consist of the same
monosaccharides (D-glucose) connected by a 1-4 bond in a β configuration for cellobiose
and α configuration in maltose. However, their spectra do not show significant
differences except for the frequency range between 800 and 960 cm-1. In this region a
low-intensity and well resolved band at 860 cm-1 is observed for cellobiose as opposed to
maltose, which presents a rather poorly resolved band at 912 cm-1. Also, in the cellobiose

120
spectrum, a weak shoulder at 1004 cm-1 can be observed that is red-shifted in reference to
the one observed for maltose at 1028 cm-1. As for the other frequency ranges, the most
striking feature is the similarities that these two spectra present, in particular the
reproduction of the two bands in the region between 1200 and 1400 cm-1. The
appearance of these two bands in both spectra could be interpreted as an infrared
expression of the 1-4 glycosidic bonds.
Figure 6.3 IRMPD spectra of Rb+-disaccharide stereoisomeric complexes containing the
same glycosidic bond position with a different anomeric configuration: cellobiose (β 1-4) and maltose (α 1-4).
The case of the isomeric pair with a 1-6 glycosidic bond presents a different
situation. As seen in figure 6.4, the spectrum of gentiobiose (β 1-6) has more infrared
features that emphasize the difference in anomericity of this molecule and its isomeric
counterpart isomaltose (α 1-6). Such features can be observed in the region between
700 800 900 1000 1100 1200 1300 1400 1500 1600 1700
Wavenumber (cm-1)
Cellobiose (β1-4) Maltose (α1-4)
H OH
O
OH
HH2C
H
HOH
H
HHHO
H
H2C
HO
H
OH
O
OH
OOH
H
H OH
O
OH
HH2C
H
HOH
H
H
OH
HO
H
H2C
HO
H
OH
O
OH
O
H
OH
Frag
men
tatio
n Yi
eld
700 800 900 1000 1100 1200 1300 1400 1500 1600 1700
Wavenumber (cm-1)
Cellobiose (β1-4) Maltose (α1-4)
H OH
O
OH
HH2C
H
HOH
H
HHHO
H
H2C
HO
H
OH
O
OH
OOH
H
H OH
O
OH
HH2C
H
HOH
H
H
OH
HO
H
H2C
HO
H
OH
O
OH
O
H
OH
Frag
men
tatio
n Yi
eld

121
1200 and 1400 cm-1 where three bands appear for gentiobiose as opposed to a broad and
hump-like feature for isomaltose. Another striking difference is the low intensity band at
891 cm-1 that appears only in the gentiobiose spectrum. As suggested by these IRMPD
experiments, the differentiation of the 1-6 isomers can be considered as more definitive
than that of the 1-4 isomers. A possible reason for this conspicuous difference could be
explained in terms of the character of the glycosidic bonds. For example, while the 1-4
linkage consists of an oxygen “bridge” type of bond the 1-6 has a more flexible
configuration that adds an extra connection (-CH2-) to this linkage. This flexibility can
provide more freedom of rotation around this bond allowing the 1-6 isomers (isomaltose
and gentiobiose) to arrange in markedly different 3-dimensional structures when
coordinating the Rb+ ion.
Conclusion
The differentiation of stereoisomeric disaccharides based on the position and
anomericity of the glycosidic bond may be possible in a mass spectrometer using IRMPD
spectroscopy. It has been shown that in the 750-925 and 1200-1400 cm-1 spectral ranges
the IRMPD spectra of the investigated disaccharides had several absorption bands that
could be attributed to the non-equivalences of the glycosidic linkage configurations.
Although Rb+ cationization can produce distinguishable spectra for disaccharides,
this differentiation can still be considered rather tentative. The main reason for this has to
do with the difficulties of investigating the vibrational spectra of these compounds. These
difficulties are related to both the complex character of vibrations in the frequency range
under consideration (mid-IR) and the significant values for the line-widths of the
absorption bands being investigated. Additionally, the complexity of the spectral contour

122
Figure 6.4 IRMPD spectra of Rb+-disaccharide stereoisomeric complexes containing the
same glycosidic bond position with a different anomeric configuration: gentiobiose (β 1-6) and isomaltose (α 1-6).
often permits the assumption of the presence of significant coupling and the overlap of
individual vibrational modes.
A higher resolution spectrum is obviously an alternative that could provide more
accurate differentiation. However, it has to be noted that due to the multi-photon nature
of the IRMPD process this technique is by necessity a low resolution spectroscopy,
indicating its main weakness. Another alternative could be extending these types of
experiments into other spectral ranges, like the near-IR, where less overlap of vibrational
modes can be expected263 and therefore it is more likely to obtain a more distinctive
spectrum for each isomer. The latter, however, will require the implementation of other
H
O
OH
H
HO
H2C
H
HOH
H
HHHO
H
H2C
HO
H
OH
O
OH
O
OH
H
H
HOHO
H
H2C
HO
H
OH
O
OH
H
H
O
OH
H
HO
H2C
H
HOH
OH
H
Frag
men
tatio
n Y
ield
700 800 900 1000 1100 1200 1300 1400 1500 1600 1700
wavenumber (cm-1)
Gentiobiose (β1-6) Isomaltose (α1-6)
H
O
OH
H
HO
H2C
H
HOH
H
HHHO
H
H2C
HO
H
OH
O
OH
O
OH
H
H
HOHO
H
H2C
HO
H
OH
O
OH
H
H
O
OH
H
HO
H2C
H
HOH
OH
H
Frag
men
tatio
n Y
ield
700 800 900 1000 1100 1200 1300 1400 1500 1600 1700
wavenumber (cm-1)
Gentiobiose (β1-6) Isomaltose (α1-6)

123
types of lasers (i.e., optical parametric oscillators, OPO’s) since this is a frequency range
inaccessible with FELIX.

124
CHAPTER 7 DETERMINATION OF LINKAGE POSITION AND ANOMERICITY OF
GLYCOSIDIC BONDS
Introduction
In the search for a more accurate method to distinguish glycosidic bonds we
decided to explore a different approach which involves fragmentation through higher-
energy pathways. For carbohydrates, these dissociation channels include glycosidic bond
and cross-ring cleavages, with the latter being the more energetic.250 The fragmentation
of carbohydrates has been shown to be the preferred way of establishing their primary
structure, and a systematic nomenclature has been proposed for naming the fragments by
Domon and Costello.264 It is important to have a high abundance of diagnostic cross-ring
cleavage fragments in order to establish the linkage pattern.234,265,266 The nature of the
ionized species significantly affects the dissociation pathways that are available to the
molecule. Unlike protonated carbohydrates, alkali metal ion coordinated species can
produce cross-ring cleavages. Of the alkali-cationized ions the smallest metal ion gives
the highest abundance of cross-link cleavages. This type of fragmentation is useful for
determining linkages between component monosaccharides and branching arrangements.
In fact, previous dissociation studies have demonstrated that lithium-coordinated
carbohydrates highly favor cross-ring cleavages that are specific to the glycosidic
bonds.258,259,267 These studies, however, used CID as the means of ion activation and
were directed only toward the determination of linkage position with no attempt
whatsoever to determine anomericity.

125
In this part of the study, we again approached the differentiation of glycosidic
bonds but with a variation of the IRMPD method described previously. This approach
consists of implementation of wavelength-tunable IRMPD mass spectra to determine the
position and anomericity of the glycosidic bond. This is to our knowledge the first time
IRMPD has been implemented toward the elucidation of glycosidic bond configuration.
These experiments were performed on unmodified lithiated glucose disaccharides which
are cross-linked 1-2, 1-3, 1-4 and 1-6 with their respective anomeric linkages (see table1).
We have found that the relative intensity of the fragments is dependent on the wavelength
of FELIX used for dissociation and that the fragmentation pattern of these disaccharides
allows linkage-specific and anomer-specific differentiation.
Table 1. List of disaccharides investigated in this study Name Linkage Position Anomericity kojibiose 1-2 αsophorose 1-2 βnigerose 1-3 αlaminaribiose 1-3 βmaltose 1-4 αcellobiose 1-4 βisomaltose 1-6 αgentiobiose 1-6 β
Experimental Procedure
These experiments were performed in a similar fashion to experiments described
in the two previous chapters with only minor variations. Since higher fragmentation
channels were being investigated, it was necessary to use higher laser fluences. Thus, the
lithiated precursor ion (m/z = 349) was mass isolated and then irradiated with 20
macropulses from FELIX operated at a 10 Hz repetition rate, which corresponds to
irradiation times of 2 seconds. A total of eight mass spectra were averaged per

126
wavelength corresponding to sample times on the order of 20 seconds per point. FELIX
was scanned between 7 and 11 µm (~900-1400 cm-1) and a total of five scans were
averaged in order to assess the reproducibility of this approach. Fragmentation yield was
not monitored but instead intensity of fragments was plotted as a function of FELIX
wavelength. Each of the disaccharides investigated showed specific fragmentation
patterns and dependence of the intensity of fragments on irradiation wavelength.
Results and Discussion
The IRMPD mass spectra of lithiated maltose and gentiobiose are shown in
Figure 7.1. The dissociation chemistry is very rich, as 9 and 11 different dissociation
channels can clearly be distinguished. The higher mass (> 160 m/z) fragment channels
are in agreement with the study of lithiated disaccharides performed by Leary and
coworkers, however, the lower mass fragmentation channels (127, 109, 97, 91 and 67)
were not reported.258 Aided by mechanistic 18O isotope labeling studies these earlier
works demonstrated that the water loss (peak at m/z = 331) and cross-ring cleavages only
occur on the reducing ring, and the glycosidic bond cleavage (peaks at m/z = 169 and
187) predominantly takes place between the non-reducing ring C1 and the glycosidic
bond oxygen. Additionally, they proposed a dissociation mechanism in which the cross-
ring cleavage proceeds by opening of the reducing ring followed by neutral loss of
C2H4O2 (peak at m/z = 289), C3H6O3 (peak at m/z = 259), and C4H8O4 (peak at m/z =
229). 258 By assuming the same mechanistic behavior we tentatively suggest the
fragmentation schemes (insets to Figures 7.1a and b). It is clear that this fragmentation
scheme is incomplete, since it cannot account for some of the observed fragments: 127
(in the case of maltose), 109 and 91 (for both disaccharides). This may suggest that either

127
sequential fragmentation accounts for the appearance of some of these fragments and/or
that cross-ring cleavage can also take place on the non-reducing ring. Additional labeling
studies (2H and 18O) and/or experiments where the continuous ejection of certain
fragments is performed during irradiation should shed some light into these assumptions;
however these experiments have not been carried out as of this moment.
Figure 7.1 IRMPD mass spectrum of lithiated (A) maltose (at 9.6 µm) and (B) gentiobiose (at 9.6 µm). A dissociation scheme is shown in the inset of each mass spectrum, based on the mechanistic 18O isotope labeling studies by Hofmeister et al.258
The IRMPD mass spectra for each glucopyranosyl disaccharide are summarized in
Tables 2 and 3. The fragmentation observed in the IRMPD mass spectra is very similar
to, but not identical with, that obtained by the CID studies of lithiated disaccharides
presented by Leary and coworkers.258 The main difference is the m/z = 229 fragment ion,
m/z m/zm/z m/z

128
which is found to be diagnostic of a (1-2) and (1-6) linkage position, but is also observed
(although at low intensity) for the (1-4) in these IRMPD experiments. Unfortunately, the
relative intensities of the CID fragments seen in the earlier work were not reported (only
their appearance), so a more systematic comparison cannot be made. Note, however, that
different ionization methods were used in both studies (FAB vs. ESI), which may affect
the internal energy of the precursor ions and thence their fragmentation chemistry.
Table 2. Relative IRMPD fragment ion intensities at 9.2 µm name kojibiose sophorose nigerose laminaribiose maltose cellobiose isomaltose gentiobiose
linkage α-1,2 β-1,2 α-1,3 β-1,3 α-1,4 β-1,4 α-1,6 β-1,6 331 0 0 45 22 18 24 8 11 289 0 0 0 0 34 19 95 64 259 0 0 9 22 0 0 50 42 229 96 100 0 0 3 8 31 52 187 80 11 45 23 95 28 100 25 169 53 58 100 100 100 100 57 100 127 100 40 47 36 62 26 90 5 109 47 16 53 17 33 10 39 10 97 66 28 57 35 34 19 43 19 91 65 20 80 23 35 11 42 10 67 53 23 46 19 17 10 21 10
Table 3. Relative IRMPD fragment ion intensities at 9.6 µm
name kojibiose sophorose nigerose laminaribiose maltose cellobiose isomaltose gentiobiose linkage α-1,2 β-1,2 α-1,3 β-1,3 α-1,4 β-1,4 α-1,6 β-1,6
331 0 0 36 18 9 19 10 9 289 0 0 0 0 25 15 70 53 259 0 0 6 18 0 0 43 32 229 79 100 0 0 1 6 24 37 187 65 10 34 18 87 28 100 21 169 49 70 87 100 100 100 80 100 127 100 44 39 30 61 22 100 12 109 48 20 41 15 42 13 59 13 97 87 41 61 36 52 22 75 23 91 97 28 100 26 55 20 87 20 67 71 34 56 19 30 12 56 16
Although similar fragmentation can be obtained with both CID and IRMPD, these
two techniques are known to work under completely different energy absorption

129
mechanisms. While in CID the kinetic energy of an ion is transformed into internal
energy by collision with a target gas, in IRMPD the increase in internal energy is
achieved by the resonance absorption of infrared photons. Typical IRMPD experiments
to date have made use of the most intense IR line at 10.6 µm generated by CO2 lasers.
Fortunately, the great majority of organic compounds present absorptions at this
wavelength, which makes IRMPD as widely-applicable as CID. However, we have
already shown that with the tunable capabilities of FELIX, the IRMPD experiments can
be performed over a wide range of infrared wavelengths. By consideration of the
inherent infrared-resonance condition of the IRMPD process, it can be expected that
fragmentation would show some dependence on wavelength. Therefore, experiments
were undertaken to investigate the relative intensity of the fragments as a function of
FELIX wavelength. These types of experiments not only produce a fragmentation
fingerprint particular to each disaccharide but can also provide a third-dimension of
analysis that can provide a more unambiguous differentiation of the disaccharide isomers.
The wavelength-dependent IRMPD fragmentations for each lithiated disaccharide
studied in these experiments are presented in figure 7.2. Here, only fragments are
presented with the lithiated precursor ion (m/z = 349) excluded, since its high intensity
would complicated the drawing of this picture. It can be seen that each disaccharide
present a distinctive fragmentation behavior that correspond to its specific structure,
namely its glycosidic bond configuration. The fragmentation intensities are generally
observed to reach a maximum between 8.8 and 10 µm and fall off sharply, in most cases,
at either end of the spectral range under consideration. The relative intensities of certain
fragments, for instance those with m/z 169 and 187 (resulting from linkage cleavage),

130
Figure 7.2 Wavelength-dependent IRMPD fragmentations of the glucopyranosyl disaccharides investigated in this work.
Kojibiose (α 1-2) sophorose (β 1-2)
nigerose (α 1-3) laminaribiose (β 1-3)
m/z m/z
m/z m/z
wavelength (µm)
wavelength (µm)
wavelength (µm)
wavelength (µm)
rela
tive
inte
nsity
rela
tive
inte
nsity
rela
tive
inte
nsity
rela
tive
inte
nsity
Kojibiose (α 1-2) sophorose (β 1-2)
nigerose (α 1-3) laminaribiose (β 1-3)
Kojibiose (α 1-2) sophorose (β 1-2)
nigerose (α 1-3) laminaribiose (β 1-3)
m/z m/z
m/z m/z
wavelength (µm)
wavelength (µm)
wavelength (µm)
wavelength (µm)
rela
tive
inte
nsity
rela
tive
inte
nsity
rela
tive
inte
nsity
rela
tive
inte
nsity
maltose (α 1-4) cellobiose (β 1-4)
isomaltose (α 1-6) gentiobiose (β 1-6)
m/z
m/z
m/z
m/z
wavelength (µm)
wavelength (µm)
wavelength (µm)
wavelength (µm)
rela
tive
inte
nsity
rela
tive
inte
nsity
rela
tive
inte
nsity
rela
tive
inte
nsity
maltose (α 1-4) cellobiose (β 1-4)
isomaltose (α 1-6) gentiobiose (β 1-6)
maltose (α 1-4) cellobiose (β 1-4)
isomaltose (α 1-6) gentiobiose (β 1-6)
m/z
m/z
m/z
m/z
wavelength (µm)
wavelength (µm)
wavelength (µm)
wavelength (µm)
rela
tive
inte
nsity
rela
tive
inte
nsity
rela
tive
inte
nsity
rela
tive
inte
nsity
Kojibiose (α 1-2) sophorose (β 1-2)
nigerose (α 1-3) laminaribiose (β 1-3)
m/z m/z
m/z m/z
wavelength (µm)
wavelength (µm)
wavelength (µm)
wavelength (µm)
rela
tive
inte
nsity
rela
tive
inte
nsity
rela
tive
inte
nsity
rela
tive
inte
nsity
Kojibiose (α 1-2) sophorose (β 1-2)
nigerose (α 1-3) laminaribiose (β 1-3)
Kojibiose (α 1-2) sophorose (β 1-2)
nigerose (α 1-3) laminaribiose (β 1-3)
m/z m/z
m/z m/z
wavelength (µm)
wavelength (µm)
wavelength (µm)
wavelength (µm)
rela
tive
inte
nsity
rela
tive
inte
nsity
rela
tive
inte
nsity
rela
tive
inte
nsity
maltose (α 1-4) cellobiose (β 1-4)
isomaltose (α 1-6) gentiobiose (β 1-6)
m/z
m/z
m/z
m/z
wavelength (µm)
wavelength (µm)
wavelength (µm)
wavelength (µm)
rela
tive
inte
nsity
rela
tive
inte
nsity
rela
tive
inte
nsity
rela
tive
inte
nsity
maltose (α 1-4) cellobiose (β 1-4)
isomaltose (α 1-6) gentiobiose (β 1-6)
maltose (α 1-4) cellobiose (β 1-4)
isomaltose (α 1-6) gentiobiose (β 1-6)
m/z
m/z
m/z
m/z
wavelength (µm)
wavelength (µm)
wavelength (µm)
wavelength (µm)
rela
tive
inte
nsity
rela
tive
inte
nsity
rela
tive
inte
nsity
rela
tive
inte
nsity

131
show a particular variation as a function of wavelength that can be indicative of the
anomericity. This will be discussed later in this chapter. Other relative intensities (lower
mass fragments) also change as a function of wavelength, although these intensities may
be less reliable given the lower signal-to-noise ratio in some cases. Note also that
changing the glycosidic position from 1-2 to 1-6 results in an increase in the number of
fragments, going from 8 to 11 fragments, respectively.
Although the spectra presented in figure 7.2 can indeed be very informative and
indicative of specific linkage configuration, their interpretation can be rather complex
when analyzed at a glance. For this reason, figure 7.3 shows the case of the 1-4 isomeric
pair (maltose and cellobiose) with the purpose of facilitating the presentation and
interpretation of these data. This picture illustrates curves for the relative intensity of
selected fragments as a function of FELIX wavelengths. The fragment pairs under
consideration correspond to complementary fragments where Li+ is retained on both sides
of the cleavage site (see inset in figure 7.1 a). In order to asses the reproducibility of
these fragment intensities the experiment was repeated five times (FELIX scans) for each
disaccharide isomer. Therefore, each data point in figure 7.3 represents an average of
five scans with their respective standard deviation. An inspection of the error bars
reveals that the curves corresponding to m/z = 67 and m/z = 289 fragments have an
inferior reproducibility compared to the m/z = 187 and m/z = 169 curves. This can be
expected given the low abundance of these fragments (see figure 7.2). However, it is
clear that all the fragments display a wavelength-dependent behavior with considerable
reproducibility. For the high-abundance dissociation products, while the ratio of m/z
169/187 peaks differs greatly for each isomer, both fragments display a similar behavior

132
Figure 7.3 Wavelength-dependent IRMPD fragmentations of selected dissociation products. (A) maltose- m/z 187 and m/z 169, (B) cellobiose- m/z 187 and m/z 169, (C) maltose- m/z 289 and m/z 67, and (D) cellobiose- m/z 289 and m/z 67.
over the main absorption band between 8.5 to 10.5 µm. For example, with maltose the
intensities of 187 and 169 are similar over this wavelength region, whereas for cellobiose
169 is consistently more abundant than 187. For the lower-abundance dissociation
products, 289 and 67, the IRMPD spectra of both are very different: whereas 67 shows a
maximum at ~9.5 µm, 289 shows two maxima, at ~8.7 and 10 µm, and a dip at 9.5 µm.
Note that this behavior is observed for both anomers, maltose and cellobiose.
wavelength (µm)wavelength (µm)

133
The reason for the wavelength-dependent dissociation behavior can be understood
in terms of differences in the average energy that is absorbed in the molecule as a
function of wavelength. This absorbed energy is likely to be maximized at the maximum
dissociation yield; i.e.,, ~9.6 µm in the case of lithiated maltose and ~9.3 µm for lithiated
cellobiose. The many dissociation channels available in these molecules each have
different dissociation barriers and hence, depending on the total energy deposited in the
molecule, different dissociation pathways are accessible to the molecule, with different
rates of dissociation. For instance, while at lower deposited energies merely lower
dissociation channels are accessible, at higher energies all the channels, including the
higher barrier channels, become accessible. Therefore, the glycosidic-cleavage
dissociation channels are considered lower barrier channels, whereas the cross-ring-
cleavage channels are higher barrier channels.
Linkage Position
From an inspection of the mass spectra in figure 7.2, (summarized in 2 and 3)
certain fragments, or groups of fragments, are suggested to be diagnostic of linkage
position. These fragments can be found, particularly, in the m/z region between the
glycosidic bond cleavage peak 169 and the intact quasimolecular ion 349 (not shown).
For instance, with the exception of the 1-2 isomers (kojibiose and sophorose), the rest of
the disaccharides produce a fragment at m/z = 331 that corresponds to the loss of water.
Within this region of 169 to 341 this isomer pair only presents two peaks: m/z = 187,
which as mentioned before is the complement of the m/z = 169 (both present in all
disaccharides) and m/z = 229 indicative of the neutral loss of 120 mass units (-C4H8O4).
The 1-2 isomers produce a total of 8 photo-fragments. In the case of 1-3 isomers, the m/z

134
= 229 fragment does not appear but instead two other fragments are produced at m/z =
331 and 259 for a total of 9 fragments. The m/z = 259 fragment represents the loss of
C3H6O3 (90 mass units). The disaccharides with a 1-4 linkage position exhibit a new
peak at m/z = 289 (-C2H4O2) but are missing the peak at m/z = 259. Additionally, this
pair also exhibits the appearance of the m/z = 229 fragment, although at low relative
abundance, for a total of 10 fragments. The 1-6 isomers are a particular case in which all
fragments in the previous disaccharides are present, due to the loss of C2, C3, and C4
units. This pair has the richest dissociation chemistry with a total of 11 fragments. The
appearance of diagnostic fragments together with the number of fragments obtained,
result in separate criteria that can be used for the unambiguous identification of the
linkage position.
Anomericity Determination
With the linkage position assigned, the next step would be to determine the
anomericity of the glycosidic bond. Again, from figure 7.2 the glucose disaccharides
with the same linkage, but different anomericity, have significant differences in their
IRMPD mass spectra. These differences are further emphasized by their wavelength
dependence. For example, the most striking difference between maltose (α 1-4) and
cellobiose (β 1-4) is the relative abundance of the glycosidic-bond cleavage fragments
m/z = 169 and m/z = 187 (figure 7.3). The β anomer has a significantly more abundant
fragment at m/z =169 compared to the fragment at m/z = 187. Similarly, differentiation
between the anomeric pairs for the other glucose disaccharides can be made (figure 7.4).
Comparing the relative intensities of the m/z = 187 and m/z = 169 fragment intensities for
the α- and β-anomers, a consistent trend can be seen, in that the β-anomers have much

135
increased m/z = 169 fragment intensities compared to the α-anomers (by a factor of 2-9).
Only for one α-anomer, namely nigerose, is the m/z 169/187 ratio considerably larger
than 1, yet, for the corresponding β-anomer, laminaribiose, this ratio is even higher.
Given the high abundances of the 187 and 169 fragment channels, the relative ratios of
these can be accurately determined and hence the disaccharide anomericity can be
established. Moreover, in order to see differences between different anomers it does not
seem necessary to obtain a whole scan, in fact it is more advisable to tune onto the
specific main absorption band of each anomer pair, i.e.,, 9.2 – 9.4 µm for maltose and
cellobiose. Note that these differences become minimal at the edges of the main
absorption bands (7.5 to 10.5) and are impossible to determine at 10.6 µm (the natural
line of a commercial non-tunable CO2 laser) given the very low signal-to-noise ratios.
Additionally, a detailed inspection of figure 7.2 reveals another difference between
anomeric pairs. It can be observed that the α anomers (left-hand side of figure 7.2) seem
to favor for higher relative intensities of the low-mass fragments (< m/z =160). This
differentiation, however, can be considered more qualitative and not as diagnostic as the
m/z 169/187 intensity ratio.
Conclusion
It is clear that the relative fragment intensities for these lithiated disaccharides
are very reproducible and their IRMPD mass spectra allow for a more precise
differentiation. The diagnostic cross-link cleavages that allow the linkage position to be
established agree well with previous CID studies.258 Moreover, a clear trend in the
fragmentation behavior is seen that permits anomeric linkage differentiation: β-anomers
consistently have much higher 169:187 ratios than α-anomers. While recent studies have

136
Figure 7.4 Wavelength-dependent IRMPD intensities for the anomer-specific fragment channels m/z 187 and m/z 169 for (A) kojibiose, (B) sophorose, (C) nigerose, (D) laminaribiose, (E) isomaltose and (F) gentiobiose.
permitted an anomeric differentiation of disaccharides,261 this is the first study that
demonstrates a clear trend in the fragmentation behavior of anomer pairs that appears to
be general and may hence be applicable to other disaccharide systems and possibly even
larger oligosaccharides; the study of larger carbohydrate systems by IRMPD is currently
being investigated and will be the subject of future work. In this light, the wavelength
variability gives IRMPD another “dimension” that should aid anomeric differentiation.
It is as yet unclear if the same anomer-specific dissociation pattern could also be
generated with commercial CO2 lasers at 10.6 µm or if the wavelength-specificity really

137
plays a crucial role in the dissociation dynamics. Therefore, a comparative study using a
line-tunable CO2 laser should provide more insight toward the general applicability of
this method. Since such laser systems are readily available the implications for
carbohydrate characterization and therefore glycomics could be immense.

138
CHAPTER 8 CONCLUDING REMARKS
The preceding chapters of this dissertation have proven that combining a free
electron laser (FEL) and a Fourier transform ion cyclotron resonance mass spectrometer
(FTICR-MS) can result in an unsurpassed match for obtaining infrared spectra of gas-
phase ions. The IRMPD spectra reported here were obtained in the 600-1600 cm-1
infrared region, a range unavailable in previous IRMPD experiments based on CO2
lasers. The high resolution of the FT-ICR mass detection scheme permits access to
spectra of ions whose masses are known unambiguously, thus allowing acquisition of
IRMPD spectra corresponding to precisely known loss channels. This was clearly
demonstrated in chapter 4 with the IRMPD spectra of fluorene. For this molecule, as for
many other polycyclic aromatic hydrocarbons (PAH’s), the lowest energy dissociation
channels correspond to loss of one H, which can be easily resolved in our FTICR-MS
experiments as opposed to previous experiments using a Quadrupole Ion Trap (QIT). In
the IRMPD process, obtaining spectra through low-energy dissociation channels is
important to obtain better resolved infrared bands, which can lead to more informative
infrared spectra.
For studies of carbohydrates, it was demonstrated that is possible to differentiate
carbohydrate isomers in a mass spectrometer by obtaining their distinctive IRMPD
spectra. It was shown in chapter 5 that isomeric ions with different ring conformations
(furanose and pyranose) can be precisely distinguished by the photodissociation study of
their alkali coordinated complexes. This differentiation was shown for the isomeric pair

139
fructose, with a five-member ring, and glucose, with a six-member ring. Moreover, the
study of O-methylated monosacharides demonstrated that differentiation of
stereoisomeric ions is also possible. By substitution of the anomeric hydroxyl group by a
–OCH3, the mutarotation process can be prevented ensuring that isomers are locked in a
known configuration, either α or β. The stereoisomers differentiated include: α-methyl-
glucopyranoside and its anomer β-methyl-glucopyranoside as well as α-methyl-
galactopyranoside and its anomer β-methyl-galactopyranoside. The IRMPD spectra of
these monosaccharides also established that the epimers glucose and galactose, which
differ in configuration at C4, can be readily distinguished by this method.
The irradiation conditions were found to be an important factor influencing the
quality of the IRMPD spectra. Experiments presented here suggested a trade-off between
sensitivity and the quality of the spectrum. For example, harsh irradiation conditions
(large numbers of FELIX pulses and high laser fluence) would produce higher
fragmentation yields at the expense of a better resolved and more informative IRMPD
spectrum. On the other hand, gentler irradiation conditions could result in loss of
valuable infrared information. Another experimental aspect of great influence was
selection of the most appropriate alkali metal for complexation. The strength of the
interactions between alkali cations and carbohydrates was demonstrated to be a very
important factor in the IRMPD band intensities and vibrational structure that distinguish
individual isomers. Among the alkali metals investigated, the weakly bound ions of Rb+
and Cs+ were shown to produce the most intense and best resolved IRMPD spectra
obtained through the lowest energy dissociation channel (loss of the alkali ion). Strongly
bound ions like Li+, on the contrary, produced low quality IRMPD spectra obtained

140
through higher energy dissociation channels like covalent bond cleavages. The
distinctiveness and resolution of the IRMPD spectra is the key factor that distinguishes
one isomer from another. Therefore in order to obtain a successful differentiation it is
necessary to combine weakly-bound alkali cationization with a careful optimization of
the irradiation conditions.
In chapter 6, the differentiation of disaccharide isomers with different glycosidic
bonds was also examined using the approach of IRMPD spectroscopy. However,
although distinguishable spectra were in some cases obtained, the differentiation of these
isomers was considered to some extent indefinite, more obvious when differentiating
linkage positions. The foremost reason for this rather inefficient differentiation lies in the
complexity of the vibrational spectra presented by these molecules in the spectral region
being investigated. The mid-IR spectra of carbohydrates are characterized by the
presence of many vibrational modes and substantial overlapping of infrared bands,
resulting in significant values for the half-width of the absorption bands. This suggests
that higher resolution spectra are needed to obtain a successful differentiation. However,
this points out the main drawback of this methodology: low spectral resolution of the free
electron laser and the IRMPD process.
The need for a more efficient method for differentiation of glycosidic bonds led us
to investigate a different approach in which wavelength-dependent fragmentation patterns
were obtained instead of IRMPD spectra. It was shown in chapter 7 that IRMPD of Li+-
complexes produced very informative fragmentations that involved glycosidic bond
cleavages and cross-ring cleavages. This approach allowed not only differentiation of the
glycosidic bonds but the unequivocal determination of linkage position and anomericity.

141
Fragments related to cross-ring cleavage were diagnostic of linkage position, whereas
anomericity was determined by the relative intensities of fragments involved in
glycosidic bond cleavage. Furthermore, this technique would not be successful without
formation of the Li+-complexes.
The focus of this work dealt mainly with the IRMPD differentiation of
carbohydrate isomers. With monosaccharides being simpler molecules than
disaccharides, it seems logical to think of their infrared spectra as being less complex.
This would explain the success of the low-resolution IRMPD spectroscopy for
differentiation of monosaccharides isomers. On the other hand, for the study of
disaccharides fragmentation by IRMPD is a more efficient means of differentiation. Note
here that these two approaches require considerably different conditions. While for the
spectroscopy approach, weakly bound alkali metals and gentle irradiation conditions are
required, in the fragmentation approach a strongly bound alkali metal and harsh
irradiation conditions are necessary for a successful characterization.
From a biological point of view, one of the most important properties of
carbohydrates is their capacity to form very stable complexes with alkali metal ions,
because of their large number of basic sites presents in these molecules. Still, the basic
mechanisms of these carbohydrate/cation interactions are not clearly understood,
especially those interactions involving the simplest sugars, monosaccharides and
disaccharides. To this purpose, computational calculations are currently underway aimed
at gaining a better understanding of the intrinsic complexation properties of several
carbohydrates toward alkali metals. These calculations should not only provide insight
into the coordination sites on sugars but, more importantly, by obtaining the theoretical

142
infrared spectra we should be able to assign bands to their respective vibrational modes.
Another important piece of information that is expected from computational work is the
preferential binding site(s) of Li+ on the glucose disaccharides, which would help to
clarify if cross-ring cleavage occurs only on the reducing end.
Another subject of potential future investigation should be the IRMPD study of
negative (deprotonated) carbohydrate ions. Both theoretical and experimental spectra of
these negative ions should contribute even more toward the understanding of the
interaction between carbohydrates and ions. Carbohydrates in their deprotonated
negative form are believed to retain their natural comformation as opposed to the
cationized form which is expected to distort three-dimensionally when coordinating the
alkali metal. Therefore, it should be of great interest to compare both negative and
positive spectra and look for different features.
As the final remark, in this dissertation it was demonstrated that the differentiation
of isomeric ions based on their IRMPD spectra is a feature that strengthens even more the
applicability of mass spectrometry for the analysis of carbohydrates. In fact, this
capability represents a solution for the differentiation of monosaccharides, the main
drawback of MS when studying carbohydrates. The methodology described in this
dissertation should extend the field of infrared spectroscopy to ions of many interesting
molecular systems and will render IRMPD a more effective analytical tool for solving
more routine problems.

143
LIST OF REFERENCES
(1) Varki, A.; Cummings, R.; Esko, J. Essentials of Glycobiology; Cold Spring Harbor, New York, NY 1999.
(2) Varki, A. Glycobiology 1993, 3, 97-130.
(3) Helenius, A.; Aebi, M. Science 2001, 291, 2364-2369.
(4) Mori, T.; Guo, M. W.; Sato, E.; Baba, T.; Takasaki, S.; Mori, E. J. Reprod. Immunol. 2000, 47, 139-158.
(5) Sugahara, K.; Yamada, S. Trends Glycosci. Glycotechnol. 2000, 12, 321-349.
(6) Kimura, Y. Trends Glycosci. Glycotechnol. 2000, 12, 103-112.
(7) Simanek, E. E.; McGarvey, G. J.; Jablonowski, J. A.; Wong, C. H. Chem. Rev. 1998, 98, 833-862.
(8) Dwek, R. A. Chem. Rev. 1996, 96, 683-720.
(9) Parodi, A. J. Annu. Rev. Biochem. 2000, 69, 69-93.
(10) Harvey, D.J., Proteomics, 2001, 1, 311-328
(11) McMurry, J.Organic Chemistry, Brooks-Cole Publishing Co.Pacific Groove, CA 1996, 1022-1023
(12) Kuster, B.; Wheeler, S. F.; Hunter, A. P.; Dwek, R. A.; Harvey, D. J., Anal. Biochem. 1997, 250, 82-101.
(13) Kuster, B.; Hunter, A. P.; Wheeler, S. F.; Dwek, R. A.; Harvey, D. J. Electrophoresis 1998, 19, 1950-1959.
(14) Charlwood, J.; Birrell, H.; Camilleri, P. J. Chromatogr. B 1999, 734, 169-174.
(15) Hellerqvist, C. G. Method Enzymol. 1990, 193, 554-573.
(16) Gray, G. R. Method Enzymol. 1990, 193, 573-587.
(17) Zhang, Y.-H. P.; Lynd, L. R. Anal. Biochem. 2003, 322, 225-232.
(18) Morita, T.; Lim, H. J.; Karube, I. J. Biotech. 1995, 38, 253-261.

144
(19) Bergstrom, N.; Nair, G. B.; Weintraub, A.; Jansson, P.-E. Carbohydrate Res. 2002, 337, 813-817.
(20) Sutton, C. W.; Oneill, J. A.; Cottrell, J. S. Anal. Biochem. 1994, 218, 34-46.
(21) Edge, C. J.; Rademacher, T. W.; Wormald, M. R.; Parekh, R. B.; Butters, T. D.; Wing, D. R.; Dwek, R. A. Proc. Natl. Acad. Sci. U. S. A. 1992, 89, 6338-6342.
(22) Lee, Y. C. Anal. Biochem. 1990, 189, 151-162.
(23) Jiménez-Barbero, J.; Peters, T. NMR Spectroscopy of Glycoconjugates; John Wiley & Sons, Inc., Weinheim, 2002.
(24) Bendiak, B. Carbohydrate Res. 1999, 315, 206-221.
(25) Yamasaki, R.; Bacon, B. Biochemistry 1991, 30, 851-857.
(26) Fenn, J. B.; Mann, M.; Meng, C. K.; Wong, S. F.; Whitehouse, C. M. Science 1989, 246, 64-71.
(27) Karas, M.; Hillenkamp, F. Anal. Chem. 1988, 60, 2299-2301.
(28) Harvey, D. J.; Rudd, P. M.; Bateman, R. H.; Bordoli, R. S.; Howes, K.; Hoyes, J. B.; Vickers, R. G. Org. Mass Spectrom. 1994, 29, 753-766.
(29) Mock, K. K.; Davey, M.; Cottrell, J. S. Biochem. Biophys. Res. Commun. 1991, 177, 644-651.
(30) Stahl, B.; Steup, M.; Karas, M.; Hillenkamp, F. Anal. Chem. 1991, 63, 1463-1466.
(31) Harvey, D. J. Rapid Commun. Mass Spectrom. 1993, 7, 614-619.
(32) Naven, T. J. P.; Harvey, D. J. Rapid Commun. Mass Spectrom. 1996, 10, 1361-1366.
(33) RahbekNielsen, H.; Roepstorff, P.; Reischl, H.; Wozny, M.; Koll, H.; Haselbeck, A. J. Mass Spectrom. 1997, 32, 948-958.
(34) Rudd, P. M.; Morgan, B. P.; Wormald, M. R.; Harvey, D. J.; vandenBerg, C. W.; Davis, S. J.; Ferguson, M. A. J.; Dwek, R. A. J. Biol. Chem. 1997, 272, 7229-7244.
(35) Treuheit, M. J.; Costello, C. E.; Kirley, T. L. J. Biol. Chem. 1993, 268, 13914-13919.
(36) Carr, S. A.; Hemling, M. E.; Bean, M. F.; Roberts, G. D. Anal. Chem. 1991, 63, 2802-2824.
(37) Costello, C. E. Biophys. Chem. 1997, 68, 173-188.

145
(38) Hendrickson, C. L.; Emmett, M. R. Annu. Rev. Phys. Chem. 1999, 50, 517-536.
(39) Bahr, U.; Pfenninger, A.; Karas, M.; Stahl, B. Anal. Chem. 1997, 69, 4530-4535.
(40) Pfenninger, A.; Karas, M.; Finke, B.; Stahl, B. J. Am. Soc. Mass Spectrom. 2002, 13, 1341-1348.
(41) Dwek, R. A.; Edge, C. J.; Harvey, D. J.; Wormald, M. R.; Parekh, R. B. Annu. Rev. Biochem. 1993, 62, 65-100.
(42) Medzihradszky, K. F.; Maltby, D. A.; Hall, S. C.; Settineri, C. A.; Burlingame, A. L. J. Am. Soc. Mass Spectrom. 1994, 5, 350-358.
(43) Medzihradszky, K. F.; Besman, M. J.; Burlingame, A. L. Rapid Commun. Mass Spectrom. 1998, 12, 472-478.
(44) Laine, R. A. Glycobiology 1994, 4, 759-767.
(45) Harvey, D. J.; Naven, T. J. P.; Kuster, B.; Bateman, R. H.; Green, M. R.; Critchley, G. Rapid Commun. Mass Spectrom. 1995, 9, 1556-1561.
(46) Yamagaki, T.; Mitsuishi, Y.; Nakanishi, H. Tetrahedron Letters 1998, 39, 4051-4054.
(47) Garozzo, D.; Nasello, V.; Spina, E.; Sturiale, L. Rapid Commun. Mass Spectrom. 1997, 11, 1561-1566.
(48) Domon, B.; Muller, D. R.; Richter, W. J. Org. Mass Spectrom. 1989, 24, 357-359.
(49) Orlando, R.; Bush, C. A.; Fenselau, C. Biomed. Environm. Mass Spectrom. 1990, 19, 747-754.
(50) Tseng, K.; Lindsay, L. L.; Penn, S.; Hedrick, J. L.; Lebrilla, C. B. Anal. Biochem. 1997, 250, 18-28.
(51) Weiskopf, A. S.; Vouros, P.; Harvey, D. J. Rapid Commun. Mass Spectrom. 1997, 11, 1493-1504.
(52) Konig, S.; Leary, J. A. J. Am. Soc. Mass Spectrom. 1998, 9, 1125-1134.
(53) Viseux, N.; de Hoffmann, E.; Domon, B. Anal. Chem. 1998, 70, 4951-4959.
(54) Matamoros Fernandez, L. E.; Obel, N.; Scheller, H. V.; Roepstorff, P. Carbohydrate Res. 2004, 339, 655-664.
(55) Fura, A.; Leary, J. A. Anal. Chem. 1993, 65, 2805-2811.
(56) Gauthier, J. W.; Trautman, T. R.; Jacobson, D. B. Anal. Chim. Acta 1991, 246, 211-225.

146
(57) Xie, Y. M.; Lebrilla, C. B. Anal. Chem. 2003, 75, 1590-1598.
(58) Little, D. P.; Speir, J. P.; Senko, M. W.; Oconnor, P. B.; McLafferty, F. W. Anal. Chem. 1994, 66, 2809-2815.
(59) Aaserud, D. J.; Little, D. P.; Oconnor, P. B.; McLafferty, F. W. Rapid Commun. Mass Spectrom. 1995, 9, 871-876.
(60) Keller, K. M.; Brodbelt, J. S. Anal. Biochem. 2004, 326, 200-210.
(61) Flora, J. W.; Muddiman, D. C. Anal. Chem. 2001, 73, 3305-3311.
(62) Hofstadler, S. A.; Griffey, R. H.; Pasa-Tolic, L.; Smith, R. D. Rapid Commun. Mass Spectrom. 1998, 12, 1400-1404.
(63) Hofstadler, S. A.; Sannes-Lowery, K. A.; Griffey, R. H. J. Mass Spectrom. 2000, 35, 62-70.
(64) Dufresne, C. P.; Wood, T. D.; Hendrickson, C. L. J. Am. Soc. Mass Spectrom. 1998, 9, 1222-1225.
(65) Little, D. P.; McLafferty, F. W. J. Am. Soc. Mass Spectrom. 1996, 7, 209-210.
(66) Zhang, J. H.; Schubothe, K.; Li, B. S.; Russell, S.; Lebrilla, C. B. Anal. Chem. 2005, 77, 208-214.
(67) Hakansson, K.; Cooper, H. J.; Emmett, M. R.; Costello, C. E.; Marshall, A. G.; Nilsson, C. L. Anal. Chem. 2001, 73, 4530-4536.
(68) Shi, S. D. H.; Hendrickson, C. L.; Marshall, A. G.; Siegel, M. M.; Kong, F. M.; Carter, G. T. J. Am. Soc. Mass Spectrom. 1999, 10, 1285-1290.
(69) Kondakova, A. N.; Vinogradov, E.; Lindner, B.; Knirel, Y. A.; Amano, K. Carbohydrate Res. 2003, 338, 2697-2709.
(70) Harvey, D. J. Mass Spectrom. Rev. 1999, 18, 349-450.
(71) Cancilla, M. T.; Penn, S. G.; Carroll, J. A.; Lebrilla, C. B. J. Am. Chem. Soc. 1996, 118, 6736-6745.
(72) March, R. E. J. Mass Spectrom. 1997, 32, 351-369.
(73) Marshall, A. G.; Hendrickson, C. L.; Jackson, G. S. Mass Spectrom. Rev. 1998, 17, 1-35.
(74) Louris, J. N.; Cooks, R. G.; Syka, J. E. P.; Kelley, P. E.; Stafford, G. C.; Todd, J. F. J. Anal. Chem. 1987, 59, 1677-1685.
(75) Oomens, J.; Meijer, G.; von Helden, G. J. Phys. Chem. A 2001, 105, 8302-8309.

147
(76) Li, Y. Z.; McIver, R. T.; Hunter, R. L. Anal. Chem. 1994, 66, 2077-2083.
(77) McIver, R. T.; Li, Y. Z.; Hunter, R. L. Rapid Commun. Mass Spectrom. 1994, 8, 237-241.
(78) Wu, J. Y.; Fannin, S. T.; Franklin, M. A.; Molinski, T. F.; Lebrilla, C. A. Anal. Chem. 1995, 67, 3788-3792.
(79) Guan, S. H.; Marshall, A. G.; Wahl, M. C. Anal. Chem. 1994, 66, 1363-1367.
(80) Tonner, D. S.; McMahon, T. B. Anal. Chem. 1997, 69, 4735-4740.
(81) Penn, S. G.; Cancilla, M. T.; Lebrilla, C. B. Anal. Chem. 1996, 68, 2331-2339.
(82) Franz, A. H.; Lebrilla, C. B. J. Am. Soc. Mass Spectrom. 2002, 13, 325-337.
(83) Cancilla, M. T.; Penn, S. G.; Lebrilla, C. B. Anal. Chem. 1998, 70, 663-672.
(84) Franz, A. H.; Molinski, T. F.; Lebrilla, C. B. J. Am. Soc. Mass Spectrom. 2001, 12, 1254-1261.
(85) Tseng, K.; Hedrick, J. L.; Lebrilla, C. B. Anal. Chem. 1999, 71, 3747-3754.
(86) Colson, W. B.; Sessler, A. M. Annu. Rev. Nucl. Part. Sci. 1985, 35, 25-54.
(87) Sessler, A. M.; Vaughan, D. Am. Scientist 1987, 75, 34-43.
(88) O'Shea, P. G.; Freund, H. P. Science 2001, 292, 1853-1858.
(89) Oomens, J.; van Roij, A. J. A.; Meijer, G.; von Helden, G. Astrophys. J. 2000, 542, 404-410.
(90) Ezekowitz, R. A. B.; Kuhlman, M.; Groopman, J. E.; Byrn, R. A. J. Exp. Med. 1989, 169, 185-196.
(91) Haurum, J. S.; Thiel, S.; Jones, I. M.; Fischer, P. B.; Laursen, S. B.; Jensenius, J. C. Aids 1993, 7, 1307-1313.
(92) Means, R. E.; Desrosiers, R. C. J. Virol. 2000, 74, 11181-11190.
(93) Lawrence, E. O.; Edlefsen, N. E. Science 1930, 72, 376.
(94) Hipple, J. A.; Sommer, H.; Thomas, H. A. Phys. Rev 1949, 76, 1877-1878.
(95) Baldeschwieler.J.D. Science 1968, 159, 263-&.
(96) Beaucham.Jl; Anders, L. R.; Baldeschwieler .J.D. J. Am. Chem. Soc. 1967, 89, 4569-&.

148
(97) Anders, L. R.; Beaucham.Jl; Dunbar, R. C.; Baldeschwieler .J.D. J. Chem. Phys. 1966, 45, 1062-&.
(98) Wobschal.D Rev. Sci. Instrum. 1965, 36, 466-&.
(99) McIver, R. T. Rev. Sci. Instrum. 1970, 41, 555-&.
(100) Cooley, J. W.; Tukey, J. W. Math. Comput. 1965, 19, 297-&.
(101) Comisarow, M. B.; Marshall, A. G. J. Chem. Phys. 1975, 62, 293-295.
(102) Comisarow, M. B.; Marshall, A. G. J. Chem. Phys. 1976, 64, 110-119.
(103) Comisaro.Mb; Marshall, A. G. Chem. Phys. Lett. 1974, 25, 282-283.
(104) Allemann, M.; Kellerhals, H.; Wanczek, K. P. Chem. Phys. Lett. 1980, 75, 328-331.
(105) Beu, S. C.; Senko, M. W.; Quinn, J. P.; McLafferty, F. W. J. Am. Soc. Mass Spectrom. 1993, 4, 190-192.
(106) Bogdanov, B.; Smith, R. D. Mass Spectrom. Rev. 2005, 24, 168-200.
(107) Barrow, M. P.; Burkitt, W. I.; Derrick, P. J. Analyst 2005, 130, 18-28.
(108) Laskin, J.; Futrell, J. H. Mass Spectrom. Rev. 2005, 24, 135-167.
(109) He, F.; Hendrickson, C. L.; Marshall, A. G. Anal. Chem. 2001, 73, 647-650.
(110) Rodgers, R. P.; White, F. M.; Hendrickson, C. L.; Marshall, A. G.; Andersen, K. V. Anal. Chem. 1998, 70, 4743-4750.
(111) Rodgers, R. P.; Blumer, E. N.; Hendrickson, C. L.; Marshall, A. G. J. Am. Soc. Mass Spectrom. 2000, 11, 835-840.
(112) Shi, S. D. H.; Hendrickson, C. L.; Marshall, A. G. Proc. Natl. Acad. Sci. U. S. A. 1998, 95, 11532-11537.
(113) Gorshkov, M. V.; Guan, S. H.; Marshall, A. G. Int. J. Mass Spectrom. Ion Process. 1993, 128, 47-60.
(114) Marshall, A. G. Int. J. Mass Spectrom. 2000, 200, 331-356.
(115) Asamoto, B. FT-ICR/MS: Analytical Applications of Fourier Transform Ion Cyclotron Resonance Mass Spectrometry; VCH Publisher, Inc.: New York, NY, 1991.
(116) Buchanan, M. Fourier Transform Mass Spectrometry; American Chemical Society: Anaheim, Calif., 1987.

149
(117) Amster, I. J. J. Mass Spectrom. 1996, 31, 1325-1337.
(118) Zeller, L. C.; Kennady, J. M.; Kenttamaa, H.; Campana, J. E. Anal. Chem. 1993, 65, 2116-2118.
(119) Jackson, G. S.; Hendrickson, C. L.; Reinhold, B. B.; Marshall, A. G. Int. J. Mass Spectrom. 1997, 165, 327-338.
(120) Jackson, G. S.; Canterbury, J. D.; Guan, S. H.; Marshall, A. G. J. Am. Soc. Mass Spectrom. 1997, 8, 283-293.
(121) Kuhnen, F.; Spiess, I.; Wanczek, K. P. Int. J. Mass Spectrom. 1997, 167, 761-769.
(122) Nikolaev, E. N.; Rakova, V. S.; Futrell, J. H. Int. J. Mass Spectrom. Ion Process. 1996, 158, 215-232.
(123) Guan, S. H.; Marshall, A. G. Int. J. Mass Spectrom. Ion Process. 1995, 146, 261-296.
(124) Kuhnen, F.; Wanczek, K. P. Int. J. Mass Spectrom. 1998, 173, 81-90.
(125) Beu, S. C.; Laude, D. A. Int. J. Mass Spectrom. Ion Process. 1992, 112, 215-230.
(126) Dehmelt, H. Rev. Mod. Phys. 1990, 62, 525-530.
(127) Guan, S. H.; Kim, H. S.; Marshall, A. G.; Wahl, M. C.; Wood, T. D.; Xiang, X. Z. Chem. Rev. 1994, 94, 2161-2182.
(128) Kofel, P.; Allemann, M.; Kellerhals, H.; Wanczek, K. P. Int. J. Mass Spectrom. Ion Process. 1986, 72, 53-61.
(129) Cooper, B. T.; Buckner, S. W. Org. Mass Spectrom. 1993, 28, 914-918.
(130) Frankevich, V.; Zenobi, R. Rapid Commun. Mass Spectrom. 2001, 15, 2035-2040.
(131) Cody, R. B.; Burnier, R. C.; Cassady, C. J.; Freiser, B. S. Anal. Chem. 1982, 54, 2225-2228.
(132) Ijames, C. F.; Wilkins, C. L. Anal. Chem. 1990, 62, 1295-1299.
(133) Bowers, W. D.; Delbert, S. S.; Hunter, R. L.; McIver, R. T. J. Am. Chem. Soc. 1984, 106, 7288-7289.
(134) Peiris, D. M.; Cheeseman, M. A.; Ramanathan, R.; Eyler, J. R. J. Phys. Chem. 1993, 97, 7839-7843.
(135) Dunbar, R. C.; McMahon, T. B. Science 1998, 279, 194-197.

150
(136) Zubarev, R. A.; Haselmann, K. F.; Budnik, B.; Kjeldsen, F.; Jensen, F. Eur. J. Mass Spectrom. 2002, 8, 337-349.
(137) Zubarev, R. A. Curr. Opin. Biotechnol. 2004, 15, 12-16.
(138) Lyman, J. L.; Jensen, R. J. Chem. Phys. Lett. 1972, 13, 421-424.
(139) Isenor, N. R.; Merchant, V.; Hallsworth, R. S.; Richardson, M. C. Canadian J. Phys. 1973, 51, 1281.
(140) Ambartzumian, R. V.; Furzikov, N. P.; Gorokhov, Y. A.; Letokhov, V. S.; Makarov, G. N.; Puretzky, A. A. Optics Comm. 1976, 18, 517-521.
(141) Letokhov, V. S.; Makarov, A. A. Optics Comm. 1976, 17, 250-253.
(142) Steel, C.; Schatzberger, R.; Kimel, S. Spectrochimica Acta Part A: Molecular Spectroscopy 1987, 43, 149-154.
(143) King, D. S.; Stephenson, J. C. Chem. Phys. Lett. 1985, 114, 461-466.
(144) Arai, S.; Watanabe, T.; Ishikawa, Y.; Oyama, T.; Hayashi, O.; Ishii, T. Chem. Phys. Lett. 1984, 112, 224-227.
(145) Ishikawa, Y.-i.; Arai, S. Chem. Phys. Lett. 1983, 103, 68-72.
(146) Bagratashvili, V. N.; Letokhov, V. S.; Makarov, A. A.; Ryabov, E. A. Multiple Photon Infrared Laser Photophysics and Photochemistry; Hardwood Academic Publishers: Amsterdam, 1985.
(147) Jones, D. A.; Percival, I. C. J. Phys. B 1983, 16, 2981-2996.
(148) Dunbar, R. C. Int. J. Mass Spectrom. 2000, 200, 571-589.
(149) Bieske, E. J.; Maier, J. P. Chem. Rev. 1993, 93, 2603-2621.
(150) Kamioka, M.; Arai, S.; Ishikawa, Y.; Isomura, S.; Takamiya, N. Chem. Phys. Lett. 1985, 119, 357-360.
(151) Nesbitt, D. J.; Field, R. W. J. Phys. Chem. 1996, 100, 12735-12756.
(152) Lehmann, K. K.; Scoles, G.; Pate, B. H. Annu. Rev. Phys. Chem. 1994, 45, 241-274.
(153) Black, J. G.; Yablonovitch, E.; Bloembergen, N.; Mukamel, S. Phys. Rev. Lett. 1977, 38, 1131-1134.
(154) Grant, E. R.; Schulz, P. A.; Sudbo, A. S.; Shen, Y. R.; Lee, Y. T. Phys. Rev. Lett. 1978, 40, 115-118.

151
(155) Rashev, S. Phys. Lett. A 1985, 109, 265-267.
(156) von Helden, G.; Holleman, I.; Knippels, G. M. H.; van der Meer, A. F. G.; Meijer, G. Phys. Rev. Lett. 1997, 79, 5234-5237.
(157) von Helden, G.; Holleman, I.; Meijer, G.; Sartakov, B. Opt. Express 1999, 4, 46-52.
(158) Parneix, P.; Van-Oanh, N. T.; Brechignac, P. Chem. Phys. Lett. 2002, 357, 78-84.
(159) Lev, N. B.; Dunbar, R. C. Chemical Physics 1983, 80, 367-378.
(160) Dunbar, R. C. J. Am. Chem. Soc. 1971, 93, 4354 - 4358.
(161) Honovich, J.; Dunbar, R. C. J. Phys. Chem. 1983, 87, 3755-3758.
(162) Bensimon, M.; Rapin, J.; Gaumann, T. Int. J. Mass Spectrom. Ion Process. 1986, 72, 125-135.
(163) Shin, S. K.; Beauchamp, J. L. J. Am. Chem. Soc. 1990, 112, 2057-2066.
(164) Shin, S. K.; Beauchamp, J. L. J. Am. Chem. Soc. 1990, 112, 2066-2069.
(165) Shin, S. K.; Beauchamp, J. L. J. Mol. Struct. 1991, 249, 1-9.
(166) Peiris, D. M.; Riveros, J. M.; Eyler, J. R. Int. J. Mass Spectrom. Ion Process. 1996, 159, 169-183.
(167) Watson, C. H.; Zimmerman, J. A.; Bruce, J. E.; Eyler, J. R. J. Phys. Chem. 1991, 95, 6081-6086.
(168) Oepts, D.; Vandermeer, A. F. G.; Vanamersfoort, P. W. Infrared Phys. Technol. 1995, 36, 297-308.
(169) Valle, J.; Hendrickson, C. L.; Emmett, M.; Marshall, A.; Eyler, J. R. In 50 th ASMS Conference on Mass Spectrometry and Allied Topics: Orlando, FL, 2002.
(170) Moore, D. T.; Oomens, J.; Van Der Meer, L.; Von Helden, G.; Meijer, G.; Valle, J.; Marshall, A. G.; Eyler, J. R. ChemPhysChem 2004, 5, 740-743.
(171) Moore, D. T.; Oomens, J.; Eyler, J. R.; Meijer, G.; von Helden, G.; Ridge, D. P. J. Am. Chem. Soc. 2004, 126, 14726-14727.
(172) Oomens, J.; Moore, D. T.; von Helden, G.; Meijer, G.; Dunbar, R. C. J. Am. Chem. Soc. 2004, 126, 724-725.
(173) Oomens, J.; Polfer, N.; Moore, D. T.; van der Meer, L.; Marshall, A. G.; Eyler, J. R.; Meijer, G.; von Helden, G. Phys. Chem. Chem. Phys. 2005, 7, 1345-1348.

152
(174) Chiavarino, B.; Crestoni, M. E.; Fornarini, S.; Lemaire, J.; Mac Aleese, L.; Maitre, P. ChemPhysChem 2004, 5, 1679-1685.
(175) Kapota, C.; Lemaire, J.; Maitre, P.; Ohanessian, G. J. Am. Chem. Soc. 2004, 126, 1836-1842.
(176) Simon, A.; Jones, W.; Ortega, J. M.; Boissel, P.; Lemaire, J.; Maitre, P. J. Am. Chem. Soc. 2004, 126, 11666-11674.
(177) Oh, H. B.; Lin, C.; Hwang, H. Y.; Zhai, H. L.; Breuker, K.; Zabrouskov, V.; Carpenter, B. K.; McLafferty, F. W. J. Am. Chem. Soc. 2005, 127, 4076-4083.
(178) Allamandola, L. J.; Tielens, A.; Barker, J. R. Astrophys. J. Suppl. Ser. 1989, 71, 733-775.
(179) Gerlt, J. A.; Kreevoy, M. M.; Cleland, W. W.; Frey, P. A. Chem. & Biol. 1997, 4, 259-267.
(180) Olah, G. A. "My Search for Carbocations and Their Role in Chemistry", in Nobel Lectures Chemistry, 1991-1995; World Scientific Publishing Co., Singapore, 1996.
(181) Leary, J. A.; Armentrout, P. B. Int. J. Mass Spectrom. 2001, 204, ix-ix.
(182) Schwarz, H. A. J. Chem. Phys. 1977, 67, 5525-5534.
(183) Oka, T. Phys. Rev. Lett. 1980, 45, 531-534.
(184) Gudeman, C. S.; Begemann, M. H.; Pfaff, J.; Saykally, R. J. Phys. Rev. Lett. 1983, 50, 727-731.
(185) Keim, E. R.; Polak, M. L.; Owrutsky, J. C.; Coe, J. V.; Saykally, R. J. J. Chem. Phys. 1990, 93, 3111-3119.
(186) Kim, H. S.; Saykally, R. J. Rev. Sci. Instrum. 2003, 74, 2488-2494.
(187) Hilpert, G.; Linnartz, H.; Havenith, M.; Termeulen, J. J.; Meerts, W. L. Chem. Phys. Lett. 1994, 219, 384-388.
(188) Speck, T.; Linnartz, H.; Maier, J. P. J. Chem. Phys. 1997, 107, 8706-8708.
(189) Linnartz, H.; Verdes, D.; Speck, T. Rev. Sci. Instrum. 2000, 71, 1811-1815.
(190) Szczepanski, J.; Vala, M. J. Phys. Chem. 1991, 95, 2792-2798.
(191) Zhou, M. F.; Andrews, L.; Bauschlicher, C. W. Chem. Rev. 2001, 101, 1931-1961.
(192) Hudgins, D. M.; Sandford, S. A.; Allamandola, L. J. J. Phys. Chem. 1994, 98, 4243-4253.

153
(193) Freivogel, P.; Fulara, J.; Lessen, D.; Forney, D.; Maier, J. P. Chem. Phys.1994, 189, 335-341.
(194) Smith-Gicklhorn, A. M.; Lorenz, M.; Kolos, R.; Bondybey, V. E. J. Chem. Phys. 2001, 115, 7534-7542.
(195) Jobling, C.; d'Hendercourt, L.; Léger, A.; Deforneau, D. Astron. and Astroph. 1994, 281, 923.
(196) Duncan, M. A. Int. J. Mass Spectrom. 2000, 200, 545-569.
(197) Okumura, M.; Yeh, L. I.; Lee, Y. T. J. Chem. Phys. 1985, 83, 3705-3706.
(198) Okumura, M.; Yeh, L. I.; Myers, J. D.; Lee, Y. T. J. Chem. Phys. 1986, 85, 2328-2329.
(199) Yeh, L. I.; Okumura, M.; Myers, J. D.; Price, J. M.; Lee, Y. T. J. Chem. Phys. 1989, 91, 7319-7330.
(200) Nizkorodov, S. A.; Dopfer, O.; Ruchti, T.; Meuwly, M.; Maier, J. P.; Bieske, E. J. J. Phys. Chem. 1995, 99, 17118-17129.
(201) Piest, H.; von Helden, G.; Meijer, G. J. Chem. Phys. 1999, 110, 2010-2015.
(202) Bakker, J. M.; Satink, R. G.; von Helden, G.; Meijer, G. Phys. Chem. Chem. Phys. 2002, 4, 24-33.
(203) Solca, N.; Dopfer, O. Angewandte Chemie, International Edition 2002, 41, 3628-3631.
(204) Sawamura, T.; Fujii, A.; Sato, S.; Ebata, T.; Mikami, N. J. Phys. Chem. 1996, 100, 8131-8138.
(205) van Heijnsbergen, D.; von Helden, G.; Meijer, G.; Maitre, P.; Duncan, M. A. J. Am. Chem. Soc. 2002, 124, 1562-1563.
(206) Solca, N.; Dopfer, O. J. Am. Chem. Soc. 2003, 125, 1421-1430.
(207) Honkawa, Y.; Inokuchi, Y.; Ohashi, K.; Nishi, N.; Sekiya, H. Chem. Phys. Lett. 2003, 376, 244-250.
(208) Jiang, J.-C.; Wang, Y.-S.; Chang, H.-C.; Lin, S. H.; Lee, Y. T.; Niedner-Schatteburg, G.; Chang, H.-C. J. Am. Chem. Soc. 2000, 122, 1398-1410.
(209) Settle, R. D. F.; Rizzo, T. R. J. Chem. Phys. 1992, 97, 2823-2825.
(210) Polianski, M.; Boyarkin, O. V.; Rizzo, T. R.; Apatin, V. M.; Laptev, V. B.; Ryabov, E. A. J. Phys. Chem. A 2003, 107, 8578-8583.

154
(211) Lyman, J. L.; Newnam, B. E.; Early, J. W.; van der Meer, A. F. G. J. Phys. Chem. A 1997, 101, 49-54.
(212) Freund, H. P.; Parker, R. K. Sci.Am. 1989, 260, 84-89.
(213) Colson, W. B.; Johnson, E. D.; Kelley, M. J.; Schwettman, H. A. Phys. Today 2002, 55, 35-41.
(214) http://www.elettra.trieste.it/projects/roundtable/facilities.html. Deiuri, S. European Round Table of SR and FEL, Accessed 07/11/05
(215) Wight, C. A.; Beauchamp, J. L. J. Am. Chem. Soc. 1981, 103, 6499 - 6501.
(216) Thorne, L.; Beauchamp, J. Gas Phase Ion Chemistry Vol. 3 Ions and Light; Academic Press, Inc: Orlando FL, 1984.
(217) Oomens, J.; Tielens, A. G. G. M.; Sartakov, B. G.; von Helden, G.; Meijer, G. Astrophys. J. 2003, 591, 968-985.
(218) Oomens, J.; Sartakov, B. G.; Tielens, A.; Meijer, G.; von Helden, G. Astrophys. J. 2001, 560, L99-L103.
(219) Asmis, K. R.; Bruemmer, M.; Kaposta, C.; Santambrogio, G.; von Helden, G.; Meijer, G.; Rademann, K.; Woeste, L. Phys. Chem. Chem. Phys. 2002, 4, 1101-1104.
(220) Asmis, K. R.; Pivonka, N. L.; Santambrogio, G.; Brummer, M.; Kaposta, C.; Neumark, D. M.; Woste, L. Science 2003, 299, 1375-1377.
(221) Lemaire, J.; Boissel, P.; Heninger, M.; Mauclaire, G.; Bellec, G.; Mestdagh, H.; Simon, A.; Caer, S. L.; Ortega, J. M.; Glotin, F.; Maitre, P. Phys. Rev. Lett. 2002, 89.
(222) Maitre, P.; Le Caer, S.; Simon, A.; Jones, W.; Lemaire, J.; Mestdagh, H. N.; Heninger, M.; Mauclaire, G.; Boissel, P.; Prazeres, R.; Glotin, F.; Ortega, J. M. Nucl. Instrum. Methods Phys. Res. Sect. A-Accel. Spectrom. Dect. Assoc. Equip. 2003, 507, 541-546.
(223) Senko, M. W.; Canterbury, J. D.; Guan, S. H.; Marshall, A. G. Rapid Commun. Mass Spectrom. 1996, 10, 1839-1844.
(224) Blakney, G. T.; van der Rest, G.; Johnson, J. R.; Freitas, M. A.; Drader, J. J.; Shi, S. D.-H.; Hendrickson, C. L.; Kelleher, N. L.; Marshall, A. G. "Further Improvements to the MIDAS Data Station for FT-ICR Mass Spectrometry,"49th Amer. Soc. Mass Spectrom. Conf. on Mass Spectrom. & Allied Topics, Chicago, IL, May 2001.

155
(225) Marshall, A. G.; Wang, T. C. L.; Ricca, T. L. J. Am. Chem. Soc. 1985, 107, 7893-7897.
(226) Guan, S. H.; Marshall, A. G. Int. J. Mass Spectrom. Ion Process. 1996, 158, 5-37.
(227) Ekern, S. P.; Marshall, A. G.; Szczepanski, J.; Vala, M. J. Phys. Chem. A 1998, 102, 3498-3504.
(228) Szczepanski, J.; Dibben, M. J.; Pearson, W.; Eyler, J. R.; Vala, M. J. Phys. Chem. A 2001, 105, 9388-9395.
(229) Schoots, A. C.; Leclercq, P. A. Biomed. Mass Spectrom. 1979, 6, 502-507.
(230) Ando, S.; Kon, K.; Nagai, Y.; Murata, T. J. Biochem. (Tokyo) 1977, 82, 1623-1631.
(231) Cerny, R. L.; Tomer, K. B.; Gross, M. L. Org. Mass Spectrom. 1986, 21, 655-660.
(232) Mulroney, B.; Traeger, J. C.; Stone, B. A. J. Mass Spectrom. 1995, 30, 1277-1283.
(233) Spengler, B.; Dolce, J. W.; Cotter, R. J. Anal. Chem. 1990, 62, 1731-1737.
(234) Garozzo, D.; Giuffrida, M.; Impallomeni, G.; Ballistreri, A.; Montaudo, G. Anal. Chem. 1990, 62, 279-286.
(235) Puzo, G.; Fournie, J. J.; Prome, J. C. Anal. Chem. 1985, 57, 892-894.
(236) Boutreau, L.; Leon, E.; Salpin, J. Y.; Amekraz, B.; Moulin, C.; Tortajada, J. Eur. J. Mass Spectrom. 2003, 9, 377-390.
(237) Gaucher, S. P.; Leary, J. A. Anal. Chem. 1998, 70, 3009-3014.
(238) Smith, G.; Leary, J. A. J. Am. Chem. Soc. 1998, 120, 13046-13056.
(239) Desaire, H.; Leary, J. A. Anal. Chem. 1999, 71, 1997-2002.
(240) Smith, G.; Leary, J. A. J. Am. Chem. Soc. 1996, 118, 3293-3294.
(241) Bothner, B.; Carmitchel, L.; Staniszewski, K.; Sonderegger, M.; Siuzdak, G. Spectr.-Int. J. 2002, 16, 71-79.
(242) Salpin, J. Y.; Tortajada, J. J. Mass Spectrom. 2002, 37, 379-388.
(243) Gaucher, S. P.; Leary, J. A. Int. J. Mass Spectrom. 2000, 197, 139-148.
(244) Smith, G.; Leary, J. A. Int. J. Mass Spectrom. 1999, 193, 153-160.
(245) Smith, G.; Kaffashan, A.; Leary, J. A. Int. J. Mass Spectrom. 1999, 182-183, 299-310.

156
(246) Desaire, H.; Leary, J. A. Anal. Chem. 1999, 71, 4142-4147.
(247) Desaire, H.; Leary, J. A. Int. J. Mass Spectrom. 2001, 209, 171-184.
(248) Desaire, H.; Leary, J. A. J. Am. Soc. Mass Spectrom. 2000, 11, 1086-1094.
(249) Botek, E.; Debrun, J. L.; Hakim, B.; Morin-Allory, L. Rapid Commun. Mass Spectrom. 2001, 15, 273-276.
(250) Cancilla, M. T.; Wang, A. W.; Voss, L. R.; Lebrilla, C. B. Anal. Chem. 1999, 71, 3206-3218.
(251) Angyal, S. J. Adv. Carbohydr. Chem. Biochem. 1989, 47, 1-43.
(252) Antonopoulos, A.; Bonnet, P.; Botek, E.; Debrun, J. L.; Hakim, B.; Herbreteau, B.; Morin-Allory, L. Rapid Commun. Mass Spectrom. 2003, 17, 122-125.
(253) Coates, M. L.; Wilkins, C. L. Biomed.Mass Spectrom.1985, 12, 424-428.
(254) Lam, Z.; Comisarow, M. B.; Dutton, G. G. S.; Parolis, H.; Parolis, L. A. S.; Bjarnason, A.; Weil, D. A. Anal. Chim. Acta 1990, 241, 187-199.
(255) Lam, Z.; Comisarow, M. B.; Dutton, G. G. S. Anal. Chem. 1988, 60, 2304-2306.
(256) Dallinga, J. W.; Heerma, W. Biol. Mass Spectrom. 1991, 20, 215-231.
(257) Dallinga, J. W.; Heerma, W. Biol. Mass Spectrom. 1991, 20, 99-108.
(258) Hofmeister, G. E.; Zhou, Z.; Leary, J. A. J. Am. Chem. Soc. 1991, 113, 5964-5970.
(259) Staempfli, A.; Zhou, Z. R.; Leary, J. A. J. Org. Chem. 1992, 57, 3590-3594.
(260) Garozzo, D.; Impallomeni, G.; Spina, E.; Green, B. N.; Hutton, T. Carbohydrate Res. 1991, 221, 253-257.
(261) Jiang, Y. J.; Cole, R. B. J. Am. Soc. Mass Spectrom. 2005, 16, 60-70.
(262) Harvey, D. J. J. Mass Spectrom. 2000, 35, 1178-1190.
(263) Jockusch, R. A.; Kroemer, R. T.; Talbot, F. O.; Snoek, L. C.; Carcabal, P.; Simons, J. P.; Havenith, M.; Bakker, J. M.; Compagnon, I.; Meijer, G.; von Helden, G. J. Am. Chem. Soc. 2004, 126, 5709-5714.
(264) Domon, B.; Costello, C. E. Glycoconjugate J. 1988, 5, 397-409.
(265) Dell, A.; Morris, H. R.; Egge, H.; Vonnicolai, H.; Strecker, G. Carbohydrate Res. 1983, 115, 41-52.

157
(266) Dell, A.; Oates, J. E.; Morris, H. R.; Egge, H. Int. J. Mass Spectrom. Ion Process. 1983, 46, 415-418.
(267) Zhou, Z. R.; Ogden, S.; Leary, J. A. J. Org. Chem. 1990, 55, 5444-5446.

158
BIOGRAPHICAL SKETCH
On April 10, 1975, José J. Valle was born to Juan J. Valle and Blanca I. Mercado.
He grew up in Hormigueros, a small town on the west side of the island of Puerto Rico,
where he and his four siblings had a pleasant childhood and enjoyed the pleasures of a
rural environment. José was educated at the public elementary, middle, and high schools
of his hometown. It was in high school that he discovered his interest in science thanks
to Mr. Feliciano and Mr. Fajardo, his algebra and physics teachers.
After high school, José attended the University of Puerto Rico, Mayaguez campus.
It was there that his interest in chemistry began and developed under the guidance of his
undergraduate research advisor, Samuel Hernandez. He graduated in May, 1998, with a
B.S. degree in chemistry, and immediately began graduate studies at the same university.
Under the direction of Felix Roman, he carried out studies in the field of analytical
chemistry and decided to pursue a doctoral degree in the same area.
In August, 2000, he moved to Gainesville, Florida, to enroll in a Ph.D. program at
the University of Florida. While attending the University of Florida, José decided to try
the wonderful field of mass spectrometry, so he joined the research group of John R.
Eyler. His current research interests are in the differentiation of isomeric ions in a
Fourier transform ion cyclotron resonance mass spectrometer by obtaining their infrared
spectra utilizing a free electron laser.