Variation of carbohydrate intake in ... - Archive ouverte HAL
29
HAL Id: hal-03485661 https://hal.archives-ouvertes.fr/hal-03485661 Submitted on 20 Dec 2021 HAL is a multi-disciplinary open access archive for the deposit and dissemination of sci- entific research documents, whether they are pub- lished or not. The documents may come from teaching and research institutions in France or abroad, or from public or private research centers. L’archive ouverte pluridisciplinaire HAL, est destinée au dépôt et à la diffusion de documents scientifiques de niveau recherche, publiés ou non, émanant des établissements d’enseignement et de recherche français ou étrangers, des laboratoires publics ou privés. Distributed under a Creative Commons Attribution - NonCommercial| 4.0 International License Variation of carbohydrate intake in diabetic children on carbohydrate counting Robart Elise, Giovannini-Chami Lisa, Savoldelli Charles, Baechler-Sadoul Elysabeth, Gastaud Frédérique, Tran Antoine, Chevalier Nicolas, Hoflack Marie To cite this version: Robart Elise, Giovannini-Chami Lisa, Savoldelli Charles, Baechler-Sadoul Elysabeth, Gastaud Frédérique, et al.. Variation of carbohydrate intake in diabetic children on carbohydrate counting. Dia- betes Research and Clinical Practice, Elsevier, 2019, 150, pp.227 - 235. 10.1016/j.diabres.2019.03.010. hal-03485661
-
Upload
khangminh22 -
Category
Documents
-
view
2 -
download
0
Transcript of Variation of carbohydrate intake in ... - Archive ouverte HAL

HAL Id: hal-03485661https://hal.archives-ouvertes.fr/hal-03485661
Submitted on 20 Dec 2021
HAL is a multi-disciplinary open accessarchive for the deposit and dissemination of sci-entific research documents, whether they are pub-lished or not. The documents may come fromteaching and research institutions in France orabroad, or from public or private research centers.
L’archive ouverte pluridisciplinaire HAL, estdestinée au dépôt et à la diffusion de documentsscientifiques de niveau recherche, publiés ou non,émanant des établissements d’enseignement et derecherche français ou étrangers, des laboratoirespublics ou privés.
Distributed under a Creative Commons Attribution - NonCommercial| 4.0 InternationalLicense
Variation of carbohydrate intake in diabetic children oncarbohydrate counting
Robart Elise, Giovannini-Chami Lisa, Savoldelli Charles, Baechler-SadoulElysabeth, Gastaud Frédérique, Tran Antoine, Chevalier Nicolas, Hoflack
Marie
To cite this version:Robart Elise, Giovannini-Chami Lisa, Savoldelli Charles, Baechler-Sadoul Elysabeth, GastaudFrédérique, et al.. Variation of carbohydrate intake in diabetic children on carbohydrate counting. Dia-betes Research and Clinical Practice, Elsevier, 2019, 150, pp.227 - 235. �10.1016/j.diabres.2019.03.010�.�hal-03485661�

Variation of carbohydrate intake in diabetic children on carbohydrate counting
Robart E 1, Giovannini-Chami L 1, Savoldelli C1, Baechler-Sadoul E 1, Gastaud F 1, Tran A 1,
Chevalier N 2, Hoflack M 1
1: Pediatric Department, Hôpitaux Pédiatriques de Nice CHU Lenval, Nice, France
2: Endocrinology Department, Hôpital l’Archet, CHU Nice, France
Robart Elise, MD
Pediatrics Department, Hôpitaux Pédiatriques de Nice CHU Lenval, Nice, France
Giovannini-Chami Lisa, MD, PhD
Pediatrics Department, Hôpitaux Pédiatriques de Nice CHU Lenval, Nice, France
Savoldelli Charles, MD
Pediatrics Department, Hôpitaux Pédiatriques de Nice CHU Lenval, Nice, France
Baechler-Sadoul Elysabeth, MD
Pediatrics Department, Hôpitaux Pédiatriques de Nice CHU Lenval, Nice, France
Gastaud Frédérique, MD
Pediatrics Department, Hôpitaux Pédiatriques de Nice CHU Lenval, Nice, France
Tran Antoine, MD
Pediatrics Department, Hôpitaux Pédiatriques de Nice CHU Lenval, Nice, France
Chevalier Nicolas, MD, PhD
Endocrinology Department, Hôpital l’Archet, CHU Nice, France
Hoflack Marie, MD
Pediatrics Department, Hôpitaux Pédiatriques de Nice CHU Lenval, Nice, France
© 2019 published by Elsevier. This manuscript is made available under the CC BY NC user licensehttps://creativecommons.org/licenses/by-nc/4.0/
Version of Record: https://www.sciencedirect.com/science/article/pii/S0168822718313871Manuscript_5577937b2b20aef295816eeadc707e8f
Running title : carbohydrate variation in diabetic children
Word count: 3999 number of tables: 3; number of figures: 1
Corresponding author : Robart Elise
Telephone number : 04 92 03 00 26; Fax number : 04 92 03 05 58

ABSTRACT:
Aims: Carbohydrate counting (CC) is a technique for managing diabetes particularly based on the
counting of carbohydrates. It allows diabetic patients to vary their amount of carbohydrates from
one meal to another by adjusting their insulin dose. The primary objective was to determine the
variation of carbohydrate intake (CI) in children on CC.
Method: This was a prospective study conducted between 2014 and 2016. We collected the amount
of carbohydrates eaten at each meal by 77 diabetic over a period of 28 days (i.e. 8,068 data). We
analyzed the number and percentage of significant CI variation rates from one day to another, both
for the whole day and for each meal. The CI variation rate was deemed significant if it was greater
than or equal to 30%.
Results: The percentage of significant CI variation rates was 30% at the daily level, 34% for
breakfast, 44% for lunch and dinner, and 53% for snack. The percentage of significant variation
rates varied according to age, treatment and occurrence of events.
Conclusion: Children varied their CI significantly from one meal to another more than one in three
times. CC offers flexibility and a better quality of life for children using this method.
KEYWORDS :
Carbohydrate counting / Type 1 diabetes / Childhood diabetes / Education / Diabetes treatment /
Quality of life

INTRODUCTION
Nutritional management is one of the key elements in treating type 1 diabetes and education (1).
The International Society for Pediatric and Adolescent Diabetes (ISPAD) recommends that 50 to
55% of the daily energy intake consists of carbohydrates. Carbohydrates are therefore the main
element in the diet of the diabetic patient. Blood glucose control is defined by a hemoglobinA1c
(HbA1c) target of less than 7.5% (58 mmol/mol) according to ISPAD (2). The recommendations
also include the absence of severe or frequent moderate hypoglycemia and pre- and postprandial
blood glucose targets.
The carbohydrate content of a meal is the main factor modulating postprandial blood glucose levels
(3). Carbohydrate counting (CC), consists especially in adapting the fast insulin dose to the
carbohydrate content of a meal. Each child will have an insulin/carbohydrate ratio (I/C ratio), which
depends on age, sex, duration of diabetes, weight, activity and pubertal stage (1). The calculation
of the insulin dose can be automatic thanks to the insulin pump (IP) bolus wizard (4). CC has been
adopted by many international consensus recommendations in routine care. For the American
Diabetes Association, most patients with type 1 diabetes must be educated in CC (5). It tends to
improve HbA1c, reduce the risk of severe hypoglycemia, and seems to have little effect on weight
(6-8). CC also helps prevent postprandial hyperglycemia, which causes microvascular
complications. It allows more flexibility in the choice, time point and frequency of meals (3), gives
more freedom to patients (9), and seems to improve their quality of life (10,11). The benefit of CC
is therefore recognized.
Studies of the patients’ practical use of CC have highlighted the factors that influence its efficacy
(9). The use of instruments such as the pump bolus wizard or, for patients on multiple injections,

automatic insulin dose calculators based on the calculation of carbohydrates, are among these
factors.
The accuracy of the calculation of carbohydrates also has an impact on the blood sugar balance
(12-14). A margin of error close to 30% seems to affect the postprandial blood glucose control,
which is not always the case when this estimate is close to 20% (15,16). Thus a variation of the
carbohydrate intake (CI) of 30% or more without a corresponding adjustment of the insulin dose
entails a risk of postprandial hypoglycemia or hyperglycemia.
Children and adolescents are particularly subject to changes in lifestyle.
CC is recognized, but is sometimes still debated, especially in pediatrics, because of the lack of
prospective studies in this population. At present, there is no study regarding its main benefit, which
is to be able to vary the amount of carbohydrates during meals.
Analyzing the variation and distribution of CI of diabetic children will allow a better understanding
of the use of the possibilities offered by CC in order to optimize this method.
We hypothesize that pediatric patients in particular can take advantage of these possibilities.
The primary objective of this study was to determine how children treated with CC used the ability
to vary their CI from one day to another and from one meal to another.

PATIENTS AND METHODS
Study type and population:
It was an observational, prospective and descriptive study conducted in of the Nice Pediatric
University Hospital (FRANCE) between November 2014 and June 2016.
The study was proposed to all auto-antibody-positive type 1 diabetic patients aged 1 to 17 years,
treated with CC for more than nine months, with less than three missed boluses (or injections) of
insulin per week in the month before enrollment.
This study was approved by the Ethics Committee (under number 14.067). The written consent of
one of the legally authorized representatives was obtained.
Course of the study:
During the enrollment visit, which corresponded to a follow-up visit, the child’s primary physician
gave the child and their parents a self-monitoring diary. In this diary, they had to collect for 28
consecutive days, the number of carbohydrates per meal, the place of the meal and the occurrence
or not of a particular event. The four meals were: breakfast, lunch, snack time, and dinner. If the
child ate a meal without carbohydrates, it also had to be reported. On the other hand, in the event
of a meal not taken, the corresponding box had to be crossed out.
The follow-up visit, took place between the 29th day and the 3rd month after enrollment, During
this visit, the self-monitoring diary was retrieved together with the IP data for the patients treated
with this method.
For each patient, the study could be discontinued temporarily or permanently and their data have
not been used. In addition to the self-monitoring diary data, each child’s demographic and
anthropometric data

were collected, along with the HbA1c values at enrollment and at three months. Finally, for the
patients treated by IP, the average daily insulin dose over 28 days was collected.
Definition of the variables studied:
* Age: Three age groups have been defined: 1 to 6, 7 to 11 and 12 to 17 years old.
* Events: We considered any meal eaten outside the home or a meal eaten at home but with an
event notified. We were able to group the events into six categories:
- Group meals: nanny, nursery, school, self-service restaurant.
- Meals for Special Occasions: parties, birthdays, invitations.
- Meals eaten outside: restaurant, fast-food, bakery, public place.
- Meals before, during or just after any physical activities.
- Meals during illnesses or episodes of stress, various annoyances expressed by the child.
- Meals during vacations.
Each meal could be subject to up to two events.
* Body mass index (BMI): For each patient, the Body mass index (BMI) was plotted on the
corpulence curves of the 2010 National Nutrition and Health Program (PNNS) and thus we defined
three groups (17): BMI ≥ 97th percentile , normal BMI if the child had a corpulence between the
[3rd ≤ BMI <97th] percentile; BMI <3rd.
* Treatment method and blood sugar control:
Children with type 1 diabetes were treated with a basal bolus regimen by an IP or subcutaneous
insulin injections (SII). Insulin doses were reported in units per kilogram per day (IU/kg/d). Blood
sugar control was represented by the HbA1c (%).

Carbohydrate distribution (18):
The recommended daily carbohydrate distribution is 25% for breakfast, 30% for lunch and dinner,
15% for snack. The daily amount of carbohydrates to consume is estimated between 115 and 220
grams for 1 to 6-year-olds. For 7 to 11-year-olds, this amount varies from 215 to 285 grams per
day. It reaches 285 to 380 grams per day for 12 to 17-year-olds.
Statistical analysis:
The statistical analysis included, first of all, the description of the study population with an
assessment of absolute and relative frequencies for categorical variables and assessment of means
and standard deviations, medians and interquartiles for quantitative variables.
The primary objective was to describe the variations in significant CI for each day and each meal.
The rate of variation of CI during meals (breakfast, lunch, snack, dinner) was calculated by
subtracting the carbohydrate value of the previous day’s meal from the carbohydrate value of the
meal of the day, and then dividing this difference by the carbohydrate value of the previous day’s
meal.
�����ℎ���� �� � �� ℎ �� ���� − �����ℎ���� �� � �� ℎ �� ��� − 1�
�����ℎ���� �� � �� ℎ �� ��� − 1�,
i = 2 to 28
The daily carbohydrate value was obtained by calculating the sum of the carbohydrate values of all
meals of the same day. Then, the daily variation rate was calculated similarly to the variation rate
per meal:

�����ℎ���� �� � �� ��� ��� − �����ℎ���� �� � �� ����� − 1�
�����ℎ���� �� � �� ����� − 1�, i = 2 to 28
If the previous value of the meal (or daily value) was not known or was equal to zero (meal without
carbohydrates), the last known value was used, so as not to overestimate the average variation.
Thus, for each patient we obtained a maximum of 27 CI variation rates per day and per meal. A
variation was deemed significant if it was greater than or equal to 30%, because this variation value
systematically impacts postprandial blood glucose. Then, the number of significant CI variation
rates (VN) was calculated, which corresponds to the addition of all significant CI variations over
28 days. Based on this number, the percentage of significant CI variation rates (VP) was determined
by calculating the ratio between the VN and the number of rates calculated over the follow-up
period. The result was expressed as the number of significant meals and then as the percentage of
significant meals. (For example, if a patient had two variations greater than or equal to 30% at
breakfast over 26 breakfasts, the VN was 2 while the VP was 8% (2/25*100)).
The first secondary objective was to analyze the VN and VP by age and certain biomedical factors
(BMI, HbA1c, insulin injection method, and mean insulin dose). The comparison between the
various factors was performed using the Chi-squared test or the Mann-Whitney U test according to
their normal value.
A second analysis was carried out in order to compare the VN and the VP according to the presence
or absence of events at each meal. The meals with and without events were distinguished based on
the significant CI variation rates. The same way as in the above objective, the VN and VP were
calculated for each patient in each group, i.e. two numbers (one for meals with event and one for
meals without event) and two percentages per patient. These significant CI variation rates were
compared using the Wilcoxon test for related data.

The last secondary objective was to analyze the daily distribution of carbohydrates.
It was calculated for each patient by dividing the CI for each meal over the sum of 28 days by the
CI over the 28 days. We obtained a percentage for each meal, the sum of which was 100%. The
carbohydrate distribution in our cohort was compared to the nationally-recommended daily
carbohydrate distribution using a Student’s t-test (normal distribution of data).

RESULTS
Between November 17, 2014 and March 29, 2016, 82 patients were enrolled. Among them, five
did not wish to continue in the study. Our total population was therefore 77 children.
Characteristics of the population:
The clinical characteristics of our 77 diabetic patients aged 2 to 17 years are listed in Table 1. The
proportion of girls was 43% and that of boys was 57%. The average duration of the disease of 4
years. Of the entire population, 64 patients (83%) were treated by IP. This proportion reached 100%
in the 1 to 6 years age group. The median number of hypoglycemia episodes was 5 in 28 days. The
average insulin dose of patients treated by IP was 0.8 IU/kg/day.
Number of meals collected:
The amount of carbohydrates ingested at each meal over 28 days was collected for our 77 patients,
i.e. 8,068 meals with carbohydrates. In addition, 14 meals with zero grams of carbohydrates were
eaten. Finally, The data from 288 meals could not be used.
Analysis of the CI variation for each day and for each meal:
The daily VN and VP were 8.04 and 30%, respectively (Figure 1 and Table 2). These values were
8.01 and 34% respectively for breakfast; 10.97 and 44% for lunch; 10.19 and 53% for snack time
and 11.17 and 44% for dinner.

Analysis of the CI variation by age group:
The daily VN (Table 2) was 6.04 for the 1 to 6-year-olds, 6.08 for the 7 to 11-year-olds and 9.8 for
the 12 to 17-year-olds (p = 0.001). The daily VP was 22%, 24% and 37% for our three successive
groups (p = 0.002). For the same age groups, the VN at snack time was 12.09; 9.88 and 8.86
respectively (p = 0.035), i.e. a VP of 52%, 52% and 56% (p = 0.614).
Analysis of the CI variation according to the insulin injection method:
The daily VN was 11.08 for patients on SII and 7.42 for patients on IP (p = 0.01). The daily VP
was 40% and 26%, respectively (p = 0.004). At snack time (Table 2), the VN was 7.5 for patients
on SII and 10.7 for patients on IP (p = 0.024).
Analysis of the CI variation according to the occurrence of events:
At snack time, of the 58 patients, in the presence of events the VN and the VP were 4.71 and 61%,
while in the absence of events, they were 5.97 and 49%, respectively (p = 0.11 and p = 0.002) (table
2). In the case of meals with events, the CI variation rate did not differ by age group for any of the
meals (p = 0.15 at breakfast, p = 0.62 at lunch, p = 0.34 at snack time and p = 0.19 at dinner). The
2,435 events are included in Table 3.
Analysis of the CI variation according to the BMI:
No statistically significant differences were found between the VN and the BMI (Table 2). The
same was true for the VP and the BMI.

Analysis of the CI variation according to the blood sugar balance and the insulin dose:
The median HbA1c at enrollment was 7.2% (55 mmol/mol) (min: 5.2% (33 mmol/mol) - max:
9.3% (78 mmol/mol)). The VP for the HbA1c ≤ 7.2% group and the HbA1c > 7.2% group were as
follows: at breakfast: 35% and 33% (p = 0.786); at lunch: 43% and 45% (p = 0.813); at snack time:
51% and 56% (p =0.272); at dinner: 46% and 43% (p = 0.472); daily: 27% and 29% (p = 0.53).
The median HbA1c at 3 months was 7.5% (58 mmol/mol) (min: 5.8% (40 mmol/mol) - max: 9.8%
(84 mmol/mol)). The VP for the HbA1c ≤ 7.5% group and the HbA1c > 7.5% group were as
follows: at breakfast: 34% and 34% (p = 1); at lunch: 43% and 45% (p = 0.605); at snack time:
54% and 52% (p =0.708); at dinner: 44% and 45% (p = 0.595); daily: 28% and 29% (p = 0.751).
No statistically significant relationship was found regarding the insulin dose (Table 2).
Analysis of the CI distribution:
The distribution of the CI of our 77 patients was 16.7% at snack time, while the French
recommendations stipulate a rate of 15% for this meal (p = 0.005). It was 23.8% at breakfast while
recommendations stipulate a rate of 25% (p = 0.27), 29.2% at lunch (recommendations 30%) (p =
0.72) and 28.9% at dinner (p = 0.31) (recommendations 30%). The distribution of carbohydrates
of our population include 3.3% of extra meals.
The age groups 1 to 6 years, 7 to 11 years, and 12 to 17 years had the following distribution
respectively: at breakfast: 24%, 25% and 22% (p = 0.275); at lunch: 28%, 27%, 32% (p = 0.003);
at snack time: 19%, 17%, 15% (p = 0.052); at dinner 27%, 29%, 30% (p = 0.023).

DISCUSSION:
Our study has shown that children and adolescents with diabetes varied their CI significantly from
one day to another and from one meal to another, while having an HbA1c level at enrollment and
at three months within recommended targets.
The characteristics of our population were reasonably balanced in terms of sex ratio, with a
predominance of boys as in the literature (19,20). The group of adolescents was larger than the
group of 1 to 6 and 7 to 11-year-olds. On the other hand, our population was not balanced with
regard to the treatment methods. The proportion of patients on pump in our study (83%) was close
to the proportion of diabetic patients on pump monitored in our hospital. Several studies show that
the use of bolus wizard improves blood sugar balance compared to other dose calculation methods.
Pump bolus wizards are easier to use. In addition, it appears that children on IP have a better
knowledge of CC than patients on SII (21).
We chose a variation defined as significant if it was at least 30%. This value seems consistent when
it is known that a variation of 10 grams of carbohydrates for a meal containing 60 grams of
carbohydrates, or about 20%, does not always affect the postprandial blood sugar balance.
Conversely, a variation of 20 grams of carbohydrates for the same meal, i.e. about 30%, would
impact this balance (16).
Our patients varied the amount of carbohydrates at snack time the most (VP = 53%). It is therefore
during this meal that CC must be the most controlled and best applied in order to obtain a better
postprandial blood glucose and a better blood sugar balance (13,14,22). A VP of 44% was found
for lunch and dinner, meals for which recommendations for CI are identical. On the other hand,

despite a real variation, the 28-day average of the carbohydrate distribution of these two meals was
statistically no different from the French recommendations. We therefore believe that this variation
adapts to physiology.
If we look at the variation of CI by age group, it appears that the youngest children had the highest
VN (VN = 12.09) at snack time. However, the VP among 1 to 6-year-olds was not higher (52%)
compared to the other groups (52% and 56%). This was due to less frequent snacking among older
children. Finally, adolescents varied their CI as much as younger children when they had a snack.
For children aged 1 to 11 years, the VP at different meals was quite high, ranging from 30 to 52%
depending on the age group and the meal. On the other hand, at the daily level, this percentage was
lower for these two groups (VP of 22% for 1 to 6-year-olds and 24% for 7 to 11-year-olds). This
difference was not found in adolescents. The VP at meals ranged from 38% to 56%, with a daily
VP of 37%. The CI variation from one meal to another in younger children tends to be more
balanced throughout the day than in older children. Adolescents was the one that varied the amount
of carbohydrates the most from one day to another. The literature does not help us understand
whether this variation by age group is specific to our children with diabetes or if it is similar for
children in general and if there is a link to the blood sugar balance.
Patients on SII varied their daily amount of carbohydrates (VP = 40%) more than patients on IP
(VP = 26%) because the majority of patients on SII were adolescents. At snack time, the VN was
higher in patients on IP (VN = 10.7) compared to SII (VN = 7.5) while there was no statistically
significant difference in VP. Indeed, the youngest children, treated preferentially by pump, snacked
more frequently.

The VP was significantly higher in the presence of events during snack time (61% vs 49%). Snack
time was the meal with the most important variation of carbohydrates. Moreover, it was the second
meal (after lunch) to have the most events. The other meals were not significantly impacted by the
occurrence of events. This finding suggests that it is rather the appetite of the child that modulates
the amount of carbohydrates during meals. This seems consistent and would suggest that CC is
actually a more suitable method. A more detailed study of events or environmental factors could
be conducted to confirm or disprove a link to the carbohydrate variation.
The mean daily carbohydrate distribution over 28 days at the main meals was very similar to the
French recommendations despite a statistically significant carbohydrate variation from one meal to
another. We did not analyze the other nutrients that make up these meals. On the other hand, at
snack time, the distribution of ingested carbohydrates was greater than recommended (16.7% vs.
15%). If we look at the data in detail, it was the 1 to 11-year-olds and mainly the 1 to 6-year-olds
who had too many carbohydrates at this meal. This point emphasizes once again that special
significance must be given to snacks in our population of diabetic children. Studies in the literature
show that diabetic children have a dietary balance similar to that of non-diabetic children. Some
studies even show that diabetic children have healthier eating habits (23), and that they have more
regular meals (24). Our population, however, seemed to have a diet too low in carbohydrates. This
could be studied in a control group (siblings for example).
The lack of correlation between the BMI and the significance of the variation was demonstrated in
our study. This result is consistent with those in the literature stating that CC does not seem to be
responsible for excess weight or overeating (6,7,11,22).

The main limitation of our study is that we deliberately chose patients with good therapeutic
compliance and therefore better balanced than other patients. Thus, our population was not
representative of all children with diabetes. It might be interesting to analyze the carbohydrate
variation in patients with poor compliance. The problem of pediatric diabetes treatment is
compliance (25) and this study does not open a perspective on improving in.
On the other hand, it was a single-center study without a control group. It might be possible to
compare our population to non-diabetic children of the same age and thus compare the variation of
CI to that of healthy children. If the variation appears equivalent, it would show that our diabetic
children on CC have, as regards the choice of meals, a quality of life (11,22) quite comparable to
children without diabetes. We believe that such a study could be conducted in the siblings of our
cohort of diabetic children.
We suggested that the counting of carbohydrates for all of our enrolled patients was optimal and
controlled because in our center, our team practically only uses CC, and has for many years. In
addition, they were well-balanced patients. However, at no time was the carbohydrate count for 28
days checked by a nutritionist. In the pediatric population, the accuracy with which carbohydrates
are counted varies depending on the study. In 2009, Smart C.E et al. (26) showed that 73% of
children with type 1 diabetes had a relatively reasonable margin of error in their carbohydrate
calculations, with 10 to 15 grams per meal. However, other studies have shown that adolescents
had poor overall knowledge of carbohydrate counting (12,27). In 2015, O’Gorman (28) showed
that medical and paramedical staff had a good knowledge (75.5%) in terms of identification of
carbohydrates in a meal, but that when they had to calculate the number of carbohydrates in a meal,
only 29% succeeded. However, our primary objective was the variation of CI per day and per meal.

Presumably, even if a child made a mistake about the carbohydrate content of a food, the error for
the same food would be repeated but the rate of variation between two meals would not be affected.
Our study was not intended to provide information on the impact of CC on blood sugar balance.
Nevertheless, we show that regular use of CC with significant variation of CI does not prevent a
blood glucose control. The mean HbA1c at enrollment and at three months was within the
recommended targets. In addition, there is no significant difference between HbA1c and VP. A
Holter monitor recording in these patients could reinforce this result.
This is, to our knowledge, the first study on the variation of CI in diabetic children with a good
average balance treated by CC. Our prospective study confirmed the main benefit of CC, which is
to allow a carbohydrate variation from one day to another and from one meal to another. We are
unable to compare our main results with those in the literature since no other study analyzing the
variation of CI in diabetic children has yet been conducted.
Pediatric patients take particular advantage of CC by significantly varying their amount of
carbohydrates from one day to another but also from one meal to another. Adolescents were the
ones who varied their daily amount of carbohydrates the most. The detailed analysis of the
variations provides us with elements to help improve the technique and to best advise our patients
at each meal. Thus, we can see that snack time is the meal where the counting of carbohydrates
must be the most controlled. Our study shows that the use of CC is justified in the pediatric
population.

ACKNOWLEDGEMENTS
The authors thank the children and their parent who participated in this study.
Funding: none
Duality of Interest. No potential conflicts of interest relevant to this article were reported.
Author Contributions.
E.R researched the data, contributed to the discussion, and wrote, reviewed, and edited the
manuscript.
E.B.S and F.G participated in the inclusion of their patients in the study
C.S and A.T carried out all statistical analysis, conceived the statistical aspects of study design.
L.G-C and N.C contributed to the discussion and reviewed and edited the manuscript
M.H. is the guarantor of this work and, as such, had full access to all of the data in the study and
takes responsibility for the integrity of the data and the accuracy of the data analysis.

REFERENCES
1. Smart CE, Annan F, Bruno LPC, Higgins LA, Acerini CL, International Society for
Pediatric and Adolescent Diabetes. ISPAD Clinical Practice Consensus Guidelines 2014.
Nutritional management in children and adolescents with diabetes. Pediatr Diabetes. sept 2014;15
Suppl 20:135‑53.
2. Rewers MJ, Pillay K, de Beaufort C, Craig ME, Hanas R, Acerini CL, et al. ISPAD Clinical
Practice Consensus Guidelines 2014. Assessment and monitoring of glycemic control in children
and adolescents with diabetes. Pediatr Diabetes. sept 2014;15 Suppl 20:102‑14.
3. Kawamura T. The importance of carbohydrate counting in the treatment of children with
diabetes. Pediatr Diabetes. oct 2007;8 Suppl 6:57‑62.
4. Enander R, Gundevall C, Strömgren A, Chaplin J, Hanas R. Carbohydrate counting with a
bolus calculator improves post-prandial blood glucose levels in children and adolescents with type
1 diabetes using insulin pumps. Pediatr Diabetes. nov 2012;13(7):545‑51.
5. American Diabetes Association. Standards of Medical Care in Diabetes--2013. Diabetes
Care. 1 janv 2013;36(Supplement_1):S11‑66.
6. Schmidt S, Schelde B, Nørgaard K. Effects of advanced carbohydrate counting in patients
with Type 1 diabetes: a systematic review. Diabet Med J Br Diabet Assoc. 21 mars 2014;
7. Bell KJ, Barclay AW, Petocz P, Colagiuri S, Brand-Miller JC. Efficacy of carbohydrate
counting in type 1 diabetes: a systematic review and meta-analysis. Lancet Diabetes Endocrinol.
févr 2014;2(2):133‑40.
8. Fu S, Li L, Deng S, Zan L, Liu Z. Effectiveness of advanced carbohydrate counting in type
1 diabetes mellitus: a systematic review and meta-analysis. Sci Rep. 14 nov 2016;6:37067.
9. Rankin D, Cooke DD, Clark M, Heller S, Elliott J, Lawton J, et al. How and why do patients
with Type 1 diabetes sustain their use of flexible intensive insulin therapy? A qualitative
longitudinal investigation of patients’ self-management practices following attendance at a Dose
Adjustment for Normal Eating (DAFNE) course. Diabet Med J Br Diabet Assoc. mai
2011;28(5):532‑8.
10. Hayes RL, Garnett SP, Clarke SL, Harkin NM, Chan AKF, Ambler GR. A flexible diet
using an insulin to carbohydrate ratio for adolescents with type 1 diabetes - a pilot study. Clin Nutr
Edinb Scotl. oct 2012;31(5):705‑9.
11. Tascini G, Berioli MG, Cerquiglini L, Santi E, Mancini G, Rogari F, et al. Carbohydrate
Counting in Children and Adolescents with Type 1 Diabetes. Nutrients. 22 janv 2018;10(1).
12. Bishop FK, Maahs DM, Spiegel G, Owen D, Klingensmith GJ, Bortsov A, et al. The
Carbohydrate Counting in Adolescents With Type 1 Diabetes (CCAT) Study. Diabetes Spectr. 1
janv 2009;22(1):56‑62.
13. Mehta SN, Quinn N, Volkening LK, Laffel LMB. Impact of carbohydrate counting on
glycemic control in children with type 1 diabetes. Diabetes Care. juin 2009;32(6):1014‑6.
14. Deeb A, Al Hajeri A, Alhmoudi I, Nagelkerke N. Accurate Carbohydrate Counting Is an
Important Determinant of Postprandial Glycemia in Children and Adolescents With Type 1
Diabetes on Insulin Pump Therapy. J Diabetes Sci Technol. 20 nov 2016;
15. Smart CE, Ross K, Edge JA, Collins CE, Colyvas K, King BR. Children and adolescents

on intensive insulin therapy maintain postprandial glycaemic control without precise carbohydrate
counting. Diabet Med J Br Diabet Assoc. mars 2009;26(3):279‑85.
16. Smart CE, King BR, McElduff P, Collins CE. In children using intensive insulin therapy, a
20-g variation in carbohydrate amount significantly impacts on postprandial glycaemia. Diabet
Med J Br Diabet Assoc. juill 2012;29(7):e21-24.
17. obesite_enfant_et_adolescent_reco HAS 2003 act 2011.pdf.
18. Martin A. Apports nutritionnels conseillés pour la population française. 3e édition. (afssa).
19. Gale EA, Gillespie KM. Diabetes and gender. Diabetologia. janv 2001;44(1):3‑15.
20. Piffaretti C, Mandereau-Brulo L, Guilmin-Crepon S, Choleau C, Coutant R. Incidence du
diabète de type 1 chez l’enfant en France en 2013-2015, à partir du système national des données
de santé (SNDS). Variations régionales. Bull Epidémiol Hebd. 2017;(27-28):571-8.
21. Finner N, Quinn A, Donovan A, O’Leary O, O’Gorman CS. Knowledge of carbohydrate
counting and insulin dose calculations in paediatric patients with type 1 diabetes mellitus. BBA
Clin. déc 2015;4:99‑101.
22. Marigliano M, Morandi A, Maschio M, Sabbion A, Contreas G, Tomasselli F, et al.
Nutritional education and carbohydrate counting in children with type 1 diabetes treated with
continuous subcutaneous insulin infusion: the effects on dietary habits, body composition and
glycometabolic control. Acta Diabetol. déc 2013;50(6):959‑64.
23. Lodefalk M, Aman J. Food habits, energy and nutrient intake in adolescents with Type 1
diabetes mellitus. Diabet Med J Br Diabet Assoc. nov 2006;23(11):1225‑32.

24. Baechle C, Hoyer A, Castillo-Reinado K, Stahl-Pehe A, Kuss O, Holl RW, et al. Eating
Frequency and Carbohydrate Intake in Adolescents with Type 1 Diabetes Differ from Those in
Their Peers and are Associated with Glycemic Control. Exp Clin Endocrinol Diabetes [Internet].
11 sept 2017 [cité 26 janv 2018]; Disponible sur: http://www.thieme-
connect.de/DOI/DOI?10.1055/s-0043-115010
25. Morris AD, Boyle DI, McMahon AD, Greene SA, MacDonald TM, Newton RW.
Adherence to insulin treatment, glycaemic control, and ketoacidosis in insulin-dependent diabetes
mellitus. The DARTS/MEMO Collaboration. Diabetes Audit and Research in Tayside Scotland.
Medicines Monitoring Unit. Lancet Lond Engl. 22 nov 1997;350(9090):1505‑10.
26. Smart CE, Ross K, Edge JA, King BR, McElduff P, Collins CE. Can children with Type 1
diabetes and their caregivers estimate the carbohydrate content of meals and snacks? Diabet Med
J Br Diabet Assoc. mars 2010;27(3):348‑53.
27. Spiegel G, Bortsov A, Bishop FK, Owen D, Klingensmith GJ, Mayer-Davis EJ, et al.
Randomized nutrition education intervention to improve carbohydrate counting in adolescents with
type 1 diabetes study: is more intensive education needed? J Acad Nutr Diet. nov
2012;112(11):1736‑46.
28. O’Gorman JR, O’Leary O, Finner N, Quinn A, O’Gorman CS. Knowledge of carbohydrate
counting and insulin dose calculations among hospital staff in a regional general paediatrics unit.
SpringerPlus. 2015;4:727.

Table 1: Characteristics of the population
Total
population
(N = 77)
Age range
1 - 6 years
(N = 23)
7 - 11 years
(N = 24)
12 - 17 years
(N = 30)
Sex
Female N (%) 33 (42.9) 6 (7.8) 12 (15.6) 15 (19.5)
Male N (%) 44 (57.1) 17 (22) 12 (15.6) 15 (19.5)
Age
(years)
Mean 9.6 4.4 8.4 14.5
Min 2 2 7 12
Max 17 6 11 17
Weight
(kg)
Mean 37.4 19.6 30 57
Min 12.3 12.3 18 37.5
Max 81 27.4 39 81
Height
(cm)
Mean 137.6 108.7 133.5 162.9
Min 89.7 89.7 110 151
Max 184 126 156 184
BMI
(kg/m2)
Mean 18.4 16.4 16.7 21.2
Min 13.2 14.6 13.2 16.4
Max 29.8 20.4 21.4 29.8
BMI ≥ 97th p N (%) 9 (11.7) 3 (3.9) 1 (1.3) 5 (6.5)
BMI < 3rd p N (%) 1 (1.3) 0 1 (1.3) 0
Normal BMI N (%) 67 (87) 20 (26) 22 (28.6) 25 (32.4)
Med. history
None N (%) 67 (87) 22 (28.5) 21 (27.3) 24 (31.2)
Dysthyroidism N (%) 3 (3.9) 0 0 3 (3.9)
Celiac disease N (%) 1 (1.3) 0 0 1 (1.3)
Trisomy 21 N (%) 1 (1.3) 0 0 1 (1.3)
Other N (%) 5 (6.5) 1 (1.3) 3 (3.9) 1 (1.3)
Treatment method
Injections (SII) N (%) 13 (16.9) 0 5 (6.5) 8 (10.4)
Pump (IP) N (%) 64 (83.1) 23 (29.9) 19 (24.7) 22 (28.5)
HbA1c level at enrollment %
(mmol/mol)
Mean 7.3 (56) 7.2 (55) 7.2 (55) 7.3 (56)
Min 5.2 (33) 6.4 (46) 5.2 (33) 5.8 (40)
Max 9.3 (78) 8.4 (68) 8.4 (68) 9.3 (78)
HbA1c level at 3 months %
(mmol/mol)
Mean
Min
Max
7.5 (58)
5.8 (40)
9.8 (84)
7.5 (58)
6.5 (48)
8.4 (68)
7.5 (58)
5.8 (40)
9.1 (76)
7.6 (60)
6 (42)
9.8 (84)
Diabetes duration
(years)
Mean 4.3 2.3 3.8 6.2
Min 0.8 0.8 0.8 1.2
Max 16.1 6.3 8.8 16.1
Daily insulin dose over 28
days (IU/kg/d) - Patients on
pump
Mean 0.8 0.7 0.8 0.8
Min 0.5 0.6 0.5 0.6
Max 1.1 0.9 1.1 1
Daily average carbohydrate
intake over 28 days (g/d)
Mean 185.8 148.5 176.5 223.1
Min 106.3 106.3 131 150.7
Max 375.4 219.7 301.2 375.4
BMI: body mass index; Mean: mean; Min: minimum; Max: maximum

Table 2: Number (and percentage) of significant carbohydrate intake variation rates at
different meals and at daily level.
Daily Breakfast Lunch Snack time Dinner
Total population (N = 77) 8.04 (30%) 8.01 (34%) 10.97 (44%) 10.19 (53%) 11.17 (44%)
By age group
1 - 6 years (N = 23) 6.04 (22%) 9.04 (34%) 11.83 (44%) 12.09 (52%) 11.65 (45%)
7 – 11 years (N = 24) 6.08 (24%) 7.29 (30%) 10.92 (46%) 9.88 (52%) 10.29 (41%)
12 – 17 years (N =
30) 9.8 (37%) 7.80 (38%) 10.37(42%) 8.86 (56%) 11.5 (47%)
p value 0.001 (0.002) 0.508 (0.408) 0.538 (0.732) 0.035 (0.614) 0.565 (0.451)
Insulin injection
method
Injections (N = 13) 11.08 (40%) 9 (39%) 10.08 (47%) 7.5 (52%) 11.46 (48%)
Pump (N = 64) 7.42 (26%) 7.81 (33%) 11.16 (43%) 10.7 (54%) 11.11 (44%)
p value 0.01 (0.004) 0.462 (0.366) 0.453 (0.489) 0.024 (0.693) 0.812 (0.385)
Occurrence of
events
N = 50 N = 66 N = 58 N = 57
Yes 1.58 (35%) 5.06 (44%) 4.71 (61%) 2.89 (51%)
No 6.9 (34%) 5.59 (45%) 5.97 (49%) 8.75 (43%)
p value <0.0001 (0.88) 0.37 (0.668) 0.11 (0.002) <0.0001 (0.06)
BMI
≥ 97th p (N = 9) 5.56 (21%) 4.67 (19%) 9.22 (36%) 8.25 (51%) 9.11 (35%)
< 3rd p (N = 1) 7 (26%) 11.5 (44%) 10 (41%) 13.5 (53%) 10.5 (40%)
Normal (N = 67) 7.8 (29%) 8.36 (36%) 11.24 (45%) 10.31 (54%) 11.47 (46%)
p value 0.366 (0.352) 0.089 (0.075) 0.465 (0.35) 0.235 (0.944) 0.386 (0.228)
Mean insulin
dose (IU/kg/d)
< 0.8 (N = 24) 6.63 (25%) 8.04 (34%) 12.08 (47%) 11.04 (52%) 11.96 (47%)
[0.8-1.2] (N=17) 6.82 (25%) 8.29 (34%) 11.18 (44%) 10.53 (54%) 11.24 (43%)
p value 0.892 (0.915) 0.887 (0.981) 0.501 (0.566) 0.725 (0.732) 0.620 (0.535)

Table 3: Number and type of events by meal.
2,435 events
Breakfast N = 335
(14%)
Lunch N = 964
(39%)
Snack
time N = 687
(28%)
Dinner N = 358
(15%)
Extra meals N = 91
(4%)
Group meals
N = 710 (29%) 14 482 172 1 41
Meals for Special Occasions N = 486 (20%)
86 142 142 106 10
Vacations N = 374 (15%)
92 98 78 95 11
Restaurants or meals eaten outside N = 344 (14%)
9 149 115 54 17
Meals during physical activity N = 263 (11%)
71 28 125 37 2
Meals during illnesses or stress N = 258 (11%)
63 65 55 65 10

Figure 1: Significant carbohydrate intake variation (N = 77)
VP: Percentage of significant carbohydrate intake variation rates (rate ≥ 30%)
VN: Number of significant carbohydrate intake variation rates (rate ≥ 30%)
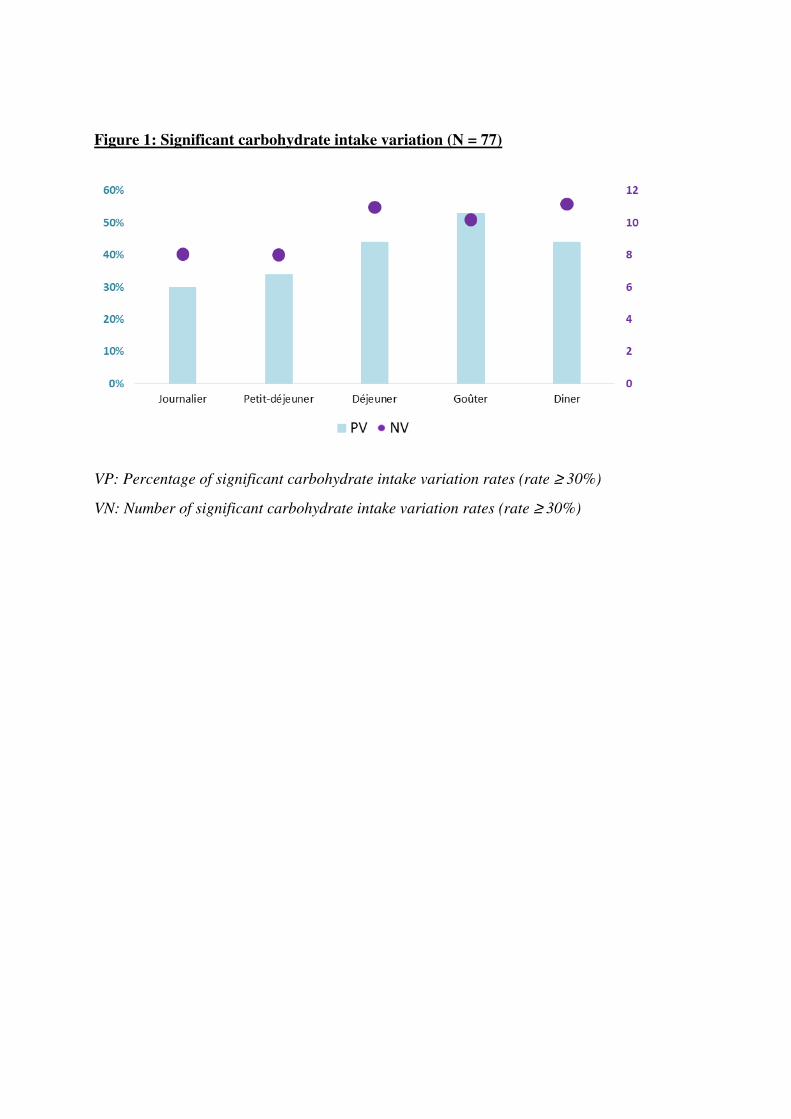
Figure 1: Significant carbohydrate intake variation (N = 77)
VP: Percentage of significant carbohydrate intake variation rates (rate ≥ 30%)
VN: Number of significant carbohydrate intake variation rates (rate ≥ 30%)