Standardisation of in vitro carbohydrate digestion methods for ...
15
Copyright is owned by the Author of the thesis. Permission is given for a copy to be downloaded by an individual for the purpose of research and private study only. The thesis may not be reproduced elsewhere without the permission of the Author.
-
Upload
khangminh22 -
Category
Documents
-
view
1 -
download
0
Transcript of Standardisation of in vitro carbohydrate digestion methods for ...

Copyright is owned by the Author of the thesis. Permission is given for a copy to be downloaded by an individual for the purpose of research and private study only. The thesis may not be reproduced elsewhere without the permission of the Author.

STANDARDISATION OF IN VITRO
CARBOHYDRATE DIGESTION METHODS FOR
PREDICTING THE RELATIVE GLYCEMIC
RESPONSE TO FOODS
A thesis presented in partial fulfilment of the requirements for the
degree of doctor of philosophy in the nutritional sciences
Massey University
Palmerston North Campus
James William Woolnough
2011
ii
ABSTRACT
Global incidence of type II diabetes is driving the need for communication, via food-
labelling, of the likely glycemic effects of foods. In vivo methods for measuring the
glycemic response are costly, time-consuming and hence unsuitable for routine food
analysis. In vitro carbohydrate digestion methods offer an alternative to in vivo testing.
Foods are incubated sequentially with pepsin and pancreatin under simulated in vivo
conditions and the pattern of sugar release used as a predictor of the food’s likely
glycemic effect. In vitro methods are well-suited to routine food analysis since they are
inexpensive, high-throughput and yield highly precise results. Application of in vitro
technology is hindered by the lack of standardised methodology. Countless in vitro
methods are described in the literature. All differ in their approach to replicating in vivo
conditions. It is not known what effect such differences in methodology might exert on
relative estimates of glycemic response.
A systematic investigation was undertaken to characterise the relative effect of method
variables on subsequent in vitro digestion results, using five standard test foods.
Variables investigated include mode of comminution, pepsin inclusion versus omission,
amylolytic enzyme concentration, incubatum pH and stirring method. A rudimentary
framework for a standardised in vitro method is proposed. Comminution and stirring
were the method factors most influential to in vitro starch digestion kinetics. Thus, the
standardised method features differing approaches to comminution and incubatum
stirring depending on the structural properties of the food to be analysed.
In vitro methods, in their current format, do not account for the effect of gastric
emptying rate on the glycemic response. The glycemic response and gastric emptying
rate of 13C-labelled flatbreads containing either 5, 15 or 30 % fat, known to slow gastric
emptying, was measured in ten healthy subjects via a GI test and breath testing. The
objective was to obtain in vivo data for gastric emptying that might be applied as a
correction to parallel in vitro digests of the flatbreads improving their predictive power.
Gastric emptying rate reduced significantly with increased flatbread fat content. There
was no difference in the glycemic response to each flatbread. Due to the lack of
glycemic effect in vivo, no adjustments to in vitro curves could be made.

iii
ACKNOWLEDGEMENTS
I wish to express my sincere gratitude to my supervisors Dr John Monro, Professor
Charles Brennan, Dr Tony Bird and Dr Alistair Carr, who, through their expert
guidance and input as well as continual patience, understanding and support, have
brought me through the entire of this most challenging PhD training exercise. Their
rich experience as qualified researchers was certainly a source of inspiration to me as I
learned what it was to become a researcher myself. This PhD entailed two migrations
for my wife and I and I appreciate the extra moral support that my supervisors afforded
us above and beyond what was expected of them as PhD supervisors. Many thanks also
go to Dr Damien Belobrajdic and Dr Shusuke Toden who stepped up as unofficial
supplementary PhD supervisors, providing me with much valued support, help and
advice as well as great friendship, during the later stages of my thesis.
Thank you to Mr Bradley Klingner for providing my wife and I with much practical
advice as we prepared to move to Adelaide as well as quickly familiarising me with the
CSIRO research laboratories upon my arrival.
The human study comprising the second half of this PhD thesis could not have been
conducted if it weren’t for the assistance from the professional and very capable staff of
the CSIRO nutrition research clinics. Thank you to Mrs Vanessa Courage for helping
me in volunteer recruitment and liaison. Thank you to Mrs Lindy Lawson and Mrs
Debbie Davies for their excellent blood sampling – not a single sample was missed
despite the hectic sampling schedule. I’m immensely thankful to Mrs Sharyn Zrna and
Mrs Jennifer Giles who faithfully arrived at work early each test day morning, assisting
me in greeting my volunteers, looking after them as they progressed through each clinic
visit as well as collecting all the breath samples. Of course a big thank you goes to the
volunteers themselves who selflessly devoted much of their time to this study and who
were so interested and enthusiastic about the application of the research in which they
were involved.

iv
I’d like to thank biostatisticians Mr Duncan Hedderley and Mrs Kylie Lange, who, with
much patience, taught me how to conduct all the statistical analyses present in this
thesis. I’d also like to thank Dr Zhong Khai Zhou who was more than happy to help me
with the scanning electron microscopy of my samples.
The pursuit of this degree would have been all the more challenging if it weren’t for the
loving support I received from all of my family. My dear wife and friend, Jessica, stood
faithfully by me and supported me every single day of this project. At least half of this
degree belongs to her. I’d like to thank my parents, Keith and Eveline as well as my
parents-in-law, Paul and Gretchen, for all of their support for Jessica and I these last
four years.
James Woolnough
Ethics approval for the human study performed during the second phase of this thesis
was granted by the CSIRO Human Research Ethics Committee on the 23rd of October,
2008. (Proposal number: 08/09).
Financial support for this research came from GlycANZ – an alliance between CSIRO
Food and Nutritional Sciences and the New Zealand Institute for Plant and Food
Research (formerly the New Zealand Institute for Crop and Food Research).

v
TABLE OF CONTENTS
PUBLICATIONS, PRESENTATIONS ARISING FROM THIS THESIS………viii
LIST OF FIGURES…………………………………………………………………….x
LIST OF TABLES………………………………………………………………….....xii
LIST OF ABBREVIATIONS………………………………………………………..xiii
CHAPTER 1: INTRODUCTION
1.1 Dietary Carbohydrates…………………………………………………………1
1.2 Carbohydrate Classification…………………………………………………...1
1.2.1 Chemical Classification………………………………………………….1
1.2.2 Nutritional Classification………………………………………………...4
1.3 Carbohydrate Digestion………………………………………………………..6
1.4 The Glycemic Response………………………………………….......................8
1.5 Factors Affecting the Glycemic Response to Foods…………………………..8
1.6 Expressions of the Glycemic Response: Definitions………………………...11
CHAPTER 2: LITERATURE REVIEW
PART I: SIMULATING HUMAN CARBOHYDRATE DIGESTION IN
VITRO: A REVIEW OF METHODS AND THE NEED FOR
STANDARDISATION………………………………………………………………..16
2.1 Introduction…………………………………………………………………...16
2.2 Background……………………………………………………………………17
2.3 Current In Vitro Methods…………………………………………………….18
2.3.1 Oral Phase………………………………………………………………18
2.3.2 Gastric Phase…………………………………………………………...22
2.3.3. Small Intestinal Phase…………………………………………………..23
2.4 The Need for Standardisation………………………………..........................30
2.5 Conclusion……………………………………………………………………..34
PART II: THE EFFECT OF FAT ON THE GLYCEMIC RESPONSE IN
VIVO: REFLECTING THIS EFFECT IN VITRO………………………………….35
2.6 The Effect of Fat In Vivo……………………………………………………...35
2.7 The Effect of Fat In Vitro……………………………………………………..36

vi
2.8 Aligning In Vivo and In Vitro Data…………………………………………...37
CHAPTER 3: MATERIALS AND METHODS
3.1 Phase 1: In Vitro Digestion Methods Investigation…………………………39
3.1.1 The In Vitro Method Template, Test Foods and Calculations Used…....39
3.1.2 Method Variables and Conditions Investigated………………………...43
3.1.2.1 Mode of Comminution in the Oral Phase………………..……..44
3.1.2.2 Comparing Chewing and Chopping…………...………….........45
3.1.2.3 Starch-Digesting Capacity of Salivary α-Amylase….………….45
3.1.2.4 Pepsin Inclusion and Omission...……………………………….46
3.1.2.5 Starch-Digesting Capacity of Pancreatin (PG starch)………….48
3.1.2.6 Starch-Digesting Capacity of Pancreatin (test foods)...…...……48
3.1.2.7 Pancreatin and pH………………………………………………48
3.1.2.8 Method of Stirring…...……..…………………………………...49
3.2 Phase 2: Human Glycemic Index (GI) Study……………………………….50
3.2.1 Volunteers………………………………………………………………50
3.2.2 Flatbread Test Foods and Glucose Reference….………………………51
3.2.3 Testing Procedure………………………………………………………52
3.2.4 GI Calculation…………………………………………………………..52
3.2.5 Measurement of Gastric Emptying Rate……………………………….53
3.2.6 In Vitro Analysis of Flatbreads…………………………………………54
3.2.7 Scanning Electron Microscopy of Flatbreads…………………………..54
3.2.8 Assessing the Strength of the Flatbread Starch-Fat Emulsion…………..55
3.3 Statistics………………………………………………………………………..56
CHAPTER 4: RESULTS AND DISCUSSION
4.1 Phase 1: In Vitro Digestion Methods Investigation…………………………58
4.1.1 Mode of Comminution in the Oral Phase………………………………58
4.1.2 Comparing Chewing and Chopping……………………………………64
4.1.3 Starch-Digesting Capacity of Salivary α-Amylase……………………..73
4.1.4 Pepsin Inclusion and Omission…………………………………………82
4.1.5 Starch-Digesting Capacity of Pancreatin……………………………….87
4.1.6 Pancreatin and pH………………………………………………………91
4.1.7 Method of Stirring……………………………………………………...93

vii
4.2 Phase 2: Human Glycemic Index (GI) Study………………………………..99
4.2.1 Fat Dose and the Glycemic Response………………………………….99
4.2.2 Fat Dose and Gastric Emptying Rate…………………………………105
4.2.3 In Vitro Digestion Analysis of Flatbreads…………………………….112
4.3 Toward Standardisation…………………………………………………….116
CHAPTER 5: CONCLUSION………………………………………………120
APPENDICES………………………………………………………………………..124
Appendix A Literature Review (Part I) Publication………………………………...124
Appendix B Starch-Digesting Capacity of Salivary α-Amylase Publication……….138
Appendix C CSIRO Human Research Ethics Committee Approval Letter………...151
Appendix D Mode of Comminution in the Oral Phase Data……………………….153
Appendix E Comparing Chewing and Chopping Data……………………………..157
Appendix F Starch-Digesting Capacity of Salivary Amylase Data………………..161
Appendix G Pepsin Inclusion and Omission Data………………………………….167
Appendix H Starch-Digesting Capacity of Pancreatin Data………………………..169
Appendix I Stirring Method Data………………………………………………….173
Appendix J Glycemic Response/Gastric Emptying Data………………………….177
REFERENCES………………………………………………………………………182
viii
PUBLICATIONS, PRESENTATIONS ARISING FROM
THIS THESIS
Glycemic Carbohydrates: Standardisation of In Vitro Methods
J W Woolnough, J A Monro, A R Bird, C S Brennan
Asia Pacific Journal of Clinical Nutrition
Volume 16 Supplement 3, Page S47, 2007
Simulating Human Carbohydrate Digestion In Vitro: a Review of Methods and the Need
for Standardisation
J W Woolnough, J A Monro, C S Brennan, A R Bird
International Journal of Food Science and Technology
Volume 43 Issue 12, Pages 2245 – 2256, 2008
Impact of Guar and Wheat Bran on the Physical and Nutritional Quality of Extruded
Breakfast Cereals
M A Brennan, I Merts, J A Monro, J W Woolnough, C S Brennan
Starch/Stärke
Volume 60 Issue 5, Pages 248 – 256, 2008
The Effect of a Brief Salivary α-Amylase Exposure During Chewing on Subsequent In
Vitro Starch Digestion Curve Profiles
J W Woolnough, A R Bird, J A Monro, C S Brennan
International Journal of Molecular Sciences
Volume 11 Issue 8, Pages 2780 – 2790, 2010
Predicting Glycemic Response In Vitro – Oral Presentation
NZIFST Annual Conference
Wellington, NZ
June 2007

ix
Glycemic Carbohydrates: Standardisation of In Vitro Methods – Oral Presentation
Joint NZ & Australian Nutrition Societies Conference and Annual Scientific Meeting
Auckland, NZ
December 2007
Physiological Determinants of the Glycemic Response to Foods – Oral Presentation
CSIRO Food Futures Flagship Annual Scientific Meeting
Canberra, ACT
March 2010
A Comparison of the Effect of Comminution Techniques and Stirring Methods on
Subsequent In vitro Starch Digestion Kinetics
J W Woolnough, C S Brennan, J A Monro, A R Bird
2011 – yet to be submitted
The Effect of Fat on Gastric Emptying Rate and the Glycemic Response to Flatbreads:
Reflecting this Effect In Vitro
J W Woolnough, A R Bird, J A Monro, C S Brennan
2011 – yet to be submitted

x
LIST OF FIGURES
Figure 1.1 Nutritional divisions of carbohydrates
Figure 1.2 Carbohydrate digestion in the human upper gastrointestinal tract
Figure 1.3 A typical glycemic response curve
Figure 1.4 Nutritionally important starch fractions
Figure 2.1 Evolutionary relationships of common in vitro digestion methods
Figure 3.1 The in vitro carbohydrate digestion method template
Figure 3.2 Method for DNS measurement of reducing sugars
Figure 3.3 Experiment design to assess the starch-digesting capacity of salivary α-
amylase
Figure 4.1 Mode of comminution in the oral phase – BREAD in vitro digestion
Figure 4.2 Mode of comminution in the oral phase – WHEAT in vitro digestion
Figure 4.3 Mode of comminution in the oral phase – PASTA in vitro digestion
Figure 4.4 Comparing chewing and chopping – BREAD in vitro digestion
Figure 4.5 Comparing chewing and chopping – PASTA in vitro digestion
Figure 4.6 Comparing chewing and chopping – WHEAT in vitro digestion
Figure 4.7 Aligning digestion curves for PASTA following chewing or chopping
Figure 4.8 Aligning digestion curves for WHEAT following chewing or chopping
Figure 4.9 Salivary amylase pre-exposure – BREAD in vitro digestion
Figure 4.10 Salivary amylase pre-exposure – PASTA in vitro digestion
Figure 4.11 In vitro T0 aliquots following salivary pre-exposure – BREAD/PASTA
Figure 4.12 Salivary amylase pre-exposure – BREAD digestible starch fractions
Figure 4.13 Pepsin inclusion and omission – PASTA in vitro digestion
Figure 4.14 Pepsin inclusion and omission – CHICKPEA in vitro digestion
Figure 4.15 Pepsin inclusion and omission – POTATO in vitro digestion
Figure 4.16 Starch-digesting capacity of pancreatin – PG starch in vitro digestion
Figure 4.17 Starch-digesting capacity of pancreatin – BREAD in vitro digestion
Figure 4.18 Pancreatin and pH – PG starch in vitro digestion
Figure 4.19 Stirring method – BREAD in vitro digestion
Figure 4.20 Stirring method – POTATO in vitro digestion
Figure 4.21 Stirring method – PASTA in vitro digestion
Figure 4.22 Flatbread glycemic response curves

xi
Figure 4.23 Flatbread GI values
Figure 4.24 Flatbread CPDR curves
Figure 4.25 Flatbread gastric half-emptying times
Figure 4.26 Illustration of fat separation from flatbread matrix
Figure 4.27 Flatbread in vitro digestion curves
Figure 4.28 SEM images of flatbreads during in vitro digestion
Figure 4.29 Framework for the standardised in vitro method

xii
LIST OF TABLES
Table 1.1 Chemical divisions of dietary carbohydrates
Table 2.1 Summary of the main in vitro starch digestion methods
Table 4.1 Total starch hydrolysed to glucose by salivary amylase
Table 4.2 Total starch hydrolysed to glucose plus dextrins by salivary amylase
Table 4.3 Summary of glucose response data
Table 4.4 Summary of gastric emptying data
xiii
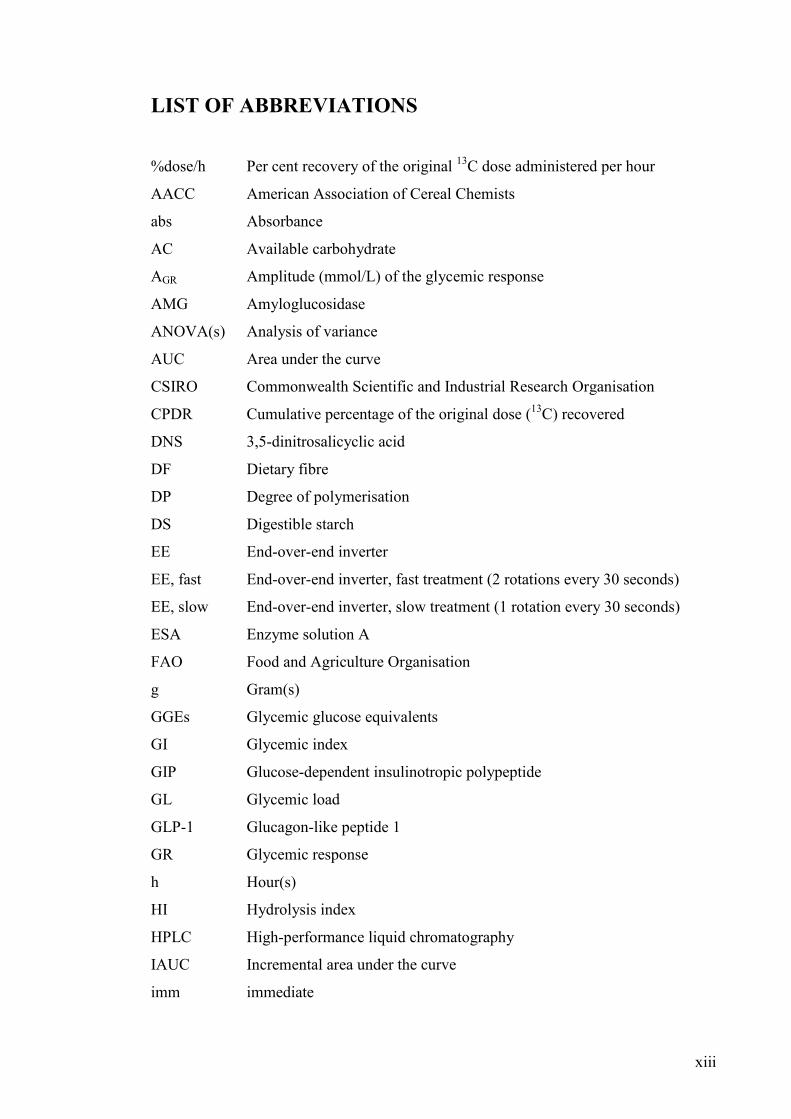
LIST OF ABBREVIATIONS
%dose/h Per cent recovery of the original 13C dose administered per hour
AACC American Association of Cereal Chemists
abs Absorbance
AC Available carbohydrate
AGR Amplitude (mmol/L) of the glycemic response
AMG Amyloglucosidase
ANOVA(s) Analysis of variance
AUC Area under the curve
CSIRO Commonwealth Scientific and Industrial Research Organisation
CPDR Cumulative percentage of the original dose (13C) recovered
DNS 3,5-dinitrosalicyclic acid
DF Dietary fibre
DP Degree of polymerisation
DS Digestible starch
EE End-over-end inverter
EE, fast End-over-end inverter, fast treatment (2 rotations every 30 seconds)
EE, slow End-over-end inverter, slow treatment (1 rotation every 30 seconds)
ESA Enzyme solution A
FAO Food and Agriculture Organisation
g Gram(s)
GGEs Glycemic glucose equivalents
GI Glycemic index
GIP Glucose-dependent insulinotropic polypeptide
GL Glycemic load
GLP-1 Glucagon-like peptide 1
GR Glycemic response
h Hour(s)
HI Hydrolysis index
HPLC High-performance liquid chromatography
IAUC Incremental area under the curve
imm immediate

xiv
inv Invertase
min Minute(s)
mmol/L Millimoles per litre
MS Magnetic stirrer
MS, fast Magnetic stirring, fast treatment (260 rpm)
MS, slow Magnetic stirring, slow treatment (130 rpm)
NSP(s) Non-starch polysaccharides
PG pregelatinised (starch)
RDS Rapidly digestible starch
ReS Reducing sugar(s)
rpm Rotations per minute
RS Resistant starch
s Seconds
sal Salivary
SD Starch digestion
SDS Slowly digestible starch
SE Standard error of the mean
SEM Scanning electron microscopy
SWB Shaking water bath
SWB, fast Shaking water bath, fast treatment (140 strokes/min)
SWB, slow Shaking water bath, slow treatment (70 strokes/min)
T0 Time zero
T20 20 min of pancreatic digestion
T120 120 min of pancreatic digestion
T1/2GE Gastric half-emptying time (min)
TGRP Time (min) to glycemic response peak
Tlag Gastric emptying lag time (min)
Tmax Peak gastric excretion time (min)
TS Total starch
U Units (of enzyme)
WHO World Health Organisation