Three-dimensional numerical simulation of wind-driven flows in closed channels and basins
10
Three-dimensional numerical simulation of wind-induced barotropic circulation in the Gulf of Patras Nikolaos Th. Fourniotis, Georgios M. Horsch Department of Civil Engineering, University of Patras, GR-26500 Patras, Greece article info Article history: Received 3 April 2009 Accepted 4 January 2010 Available online 7 January 2010 Keywords: Three-dimensional MIKE 3 FM (HD) Wind-induced circulation Barotropic Patras Gulf Straits Residence time abstract The barotropic, wind-induced circulation, which develops in the Gulf of Patras in Western Greece during the winter, is studied using three-dimensional numerical simulations. The simulations are performed using the numerical code MIKE 3 FM (HD). The Gulf’s basin is bracketed between two sills, one on the west at the opening with the Ionian Sea and the other on the east at the Straits of Rio-Antirio at the opening with the Gulf of Corinth. The simulations show that the wind-induced flow creates strong currents near the coasts, which determine the sense of rotation of the gyres that develop in the Gulf. Strong currents are also created at the Rio-Antirio Straits. The wind-induced, barotropic currents do not seem to contribute to the direct replenishment of bottom waters, which recirculate between the two sills. Depending on the wind-speed forcing of the flow, the residence time of the waters in the Gulf of Patras is estimated to range from one week to one month. & 2010 Elsevier Ltd. All rights reserved. 1. Introduction 1.1. Generalities The modern way of life makes it unavoidable for densely populated coastal societies to be faced with the problem of preventing the degradation of their coastal environment. The problem is likely to be more acute for coastal regions along transport routes, and this is the case with the Gulf of Patras, where the port of the city of Patras connects Western Greece with the rest of Europe. The Gulf of Patras (Fig. 1, also referred to, below, as ‘‘the Gulf’’, for brevity) is vulnerable to pollution, particularly at its southeastern region, where the city of Patras is located. The environmental pollution hazards include many continuous sources such as municipal sewage discharge, distributed sources such as agricultural waste water, and sporadic ones such as oil spills and shipping accidents. The existence of pollution at specific locations in the Gulf has been quantified by Kalpaxis et al. (2004) and Pytharopoulou, et al. (2008), while Leotsinidis and Sazakli (2008), used two different approaches to assess the contamination of sediments. Finally, the types, abundance and sources of benthic marine litter in the Gulf of Patras, has been studied by Stefatos et al. (1999) and Koutsodendris et al. (2008), who identified in their respective studies the sources of litter. Clearly, then, the effective management of the multiple and often conflicting uses of the Gulf (i.e. industry, shipping and wastewater treatment vs. tourism and recreation) and main- tenance of the delicate ecological balance requires a detailed understanding of the physical oceanography of the region. Knowledge of the hydrodynamic circulation and its variability is crucial for predicting both the ultimate distribution of any pollution scenario into this Gulf, and also of the transport of sediment. The latter is expected to be particularly useful for the maintenance of the new port of Patras. Herein, we propose to study the hydrodynamic circulation in the Gulf of Patras through numerical simulations. To this end, we use the three-dimensional, finite volume code MIKE 3 FM (HD), (DHI, 2007) which has been developed for applications within oceanographic, coastal and estuarine environments. Since no simulation of the circulation in the Gulf of Patras has been reported in the literature, we begin with the case of the wind- driven, barotropic circulation, which develops during the winter months (Papailiou, 1982). 1.2. Available field measurements for the Gulf of Patras The only comprehensive collection of field measurements of hydrodynamic quantities and observations, performed through- out the entire Gulf of Patras during the winter months is that of Papailiou (1982); the study of Friligos et al. (1985), also reports measurements taken at a large number of stations that cover the entire range of the Gulf, but these were taken during the summer. ARTICLE IN PRESS Contents lists available at ScienceDirect journal homepage: www.elsevier.com/locate/oceaneng Ocean Engineering 0029-8018/$ - see front matter & 2010 Elsevier Ltd. All rights reserved. doi:10.1016/j.oceaneng.2010.01.002 Corresponding author. Tel.: + 30 2610 996519; fax: + 30 2610 996572. E-mail addresses: [email protected] (N.Th. Fourniotis), [email protected] (G.M. Horsch). Ocean Engineering 37 (2010) 355–364
-
Upload
independent -
Category
Documents
-
view
1 -
download
0
Transcript of Three-dimensional numerical simulation of wind-driven flows in closed channels and basins
ARTICLE IN PRESS
Ocean Engineering 37 (2010) 355–364
Contents lists available at ScienceDirect
Ocean Engineering
0029-80
doi:10.1
� Corr
E-m
(G.M. H
journal homepage: www.elsevier.com/locate/oceaneng
Three-dimensional numerical simulation of wind-induced barotropiccirculation in the Gulf of Patras
Nikolaos Th. Fourniotis, Georgios M. Horsch �
Department of Civil Engineering, University of Patras, GR-26500 Patras, Greece
a r t i c l e i n f o
Article history:
Received 3 April 2009
Accepted 4 January 2010Available online 7 January 2010
Keywords:
Three-dimensional
MIKE 3 FM (HD)
Wind-induced circulation
Barotropic
Patras Gulf
Straits
Residence time
18/$ - see front matter & 2010 Elsevier Ltd. A
016/j.oceaneng.2010.01.002
esponding author. Tel.: +30 2610 996519; fa
ail addresses: [email protected] (N.Th. Fournio
orsch).
a b s t r a c t
The barotropic, wind-induced circulation, which develops in the Gulf of Patras in Western Greece
during the winter, is studied using three-dimensional numerical simulations. The simulations are
performed using the numerical code MIKE 3 FM (HD). The Gulf’s basin is bracketed between two sills,
one on the west at the opening with the Ionian Sea and the other on the east at the Straits of Rio-Antirio
at the opening with the Gulf of Corinth. The simulations show that the wind-induced flow creates
strong currents near the coasts, which determine the sense of rotation of the gyres that develop in the
Gulf. Strong currents are also created at the Rio-Antirio Straits. The wind-induced, barotropic currents
do not seem to contribute to the direct replenishment of bottom waters, which recirculate between the
two sills. Depending on the wind-speed forcing of the flow, the residence time of the waters in the Gulf
of Patras is estimated to range from one week to one month.
& 2010 Elsevier Ltd. All rights reserved.
1. Introduction
1.1. Generalities
The modern way of life makes it unavoidable for denselypopulated coastal societies to be faced with the problem ofpreventing the degradation of their coastal environment. Theproblem is likely to be more acute for coastal regions alongtransport routes, and this is the case with the Gulf of Patras,where the port of the city of Patras connects Western Greece withthe rest of Europe.
The Gulf of Patras (Fig. 1, also referred to, below, as ‘‘the Gulf’’,for brevity) is vulnerable to pollution, particularly at itssoutheastern region, where the city of Patras is located. Theenvironmental pollution hazards include many continuoussources such as municipal sewage discharge, distributed sourcessuch as agricultural waste water, and sporadic ones such as oilspills and shipping accidents. The existence of pollution at specificlocations in the Gulf has been quantified by Kalpaxis et al. (2004)and Pytharopoulou, et al. (2008), while Leotsinidis and Sazakli(2008), used two different approaches to assess thecontamination of sediments. Finally, the types, abundance andsources of benthic marine litter in the Gulf of Patras, has beenstudied by Stefatos et al. (1999) and Koutsodendris et al. (2008),who identified in their respective studies the sources of litter.
ll rights reserved.
x: +30 2610 996572.
tis), [email protected]
Clearly, then, the effective management of the multiple andoften conflicting uses of the Gulf (i.e. industry, shipping andwastewater treatment vs. tourism and recreation) and main-tenance of the delicate ecological balance requires a detailedunderstanding of the physical oceanography of the region.Knowledge of the hydrodynamic circulation and its variability iscrucial for predicting both the ultimate distribution of anypollution scenario into this Gulf, and also of the transport ofsediment. The latter is expected to be particularly useful for themaintenance of the new port of Patras.
Herein, we propose to study the hydrodynamic circulation inthe Gulf of Patras through numerical simulations. To this end, weuse the three-dimensional, finite volume code MIKE 3 FM (HD),(DHI, 2007) which has been developed for applications withinoceanographic, coastal and estuarine environments. Since nosimulation of the circulation in the Gulf of Patras has beenreported in the literature, we begin with the case of the wind-driven, barotropic circulation, which develops during the wintermonths (Papailiou, 1982).
1.2. Available field measurements for the Gulf of Patras
The only comprehensive collection of field measurements ofhydrodynamic quantities and observations, performed through-out the entire Gulf of Patras during the winter months is that ofPapailiou (1982); the study of Friligos et al. (1985), also reportsmeasurements taken at a large number of stations that cover theentire range of the Gulf, but these were taken during the summer.
ARTICLE IN PRESS
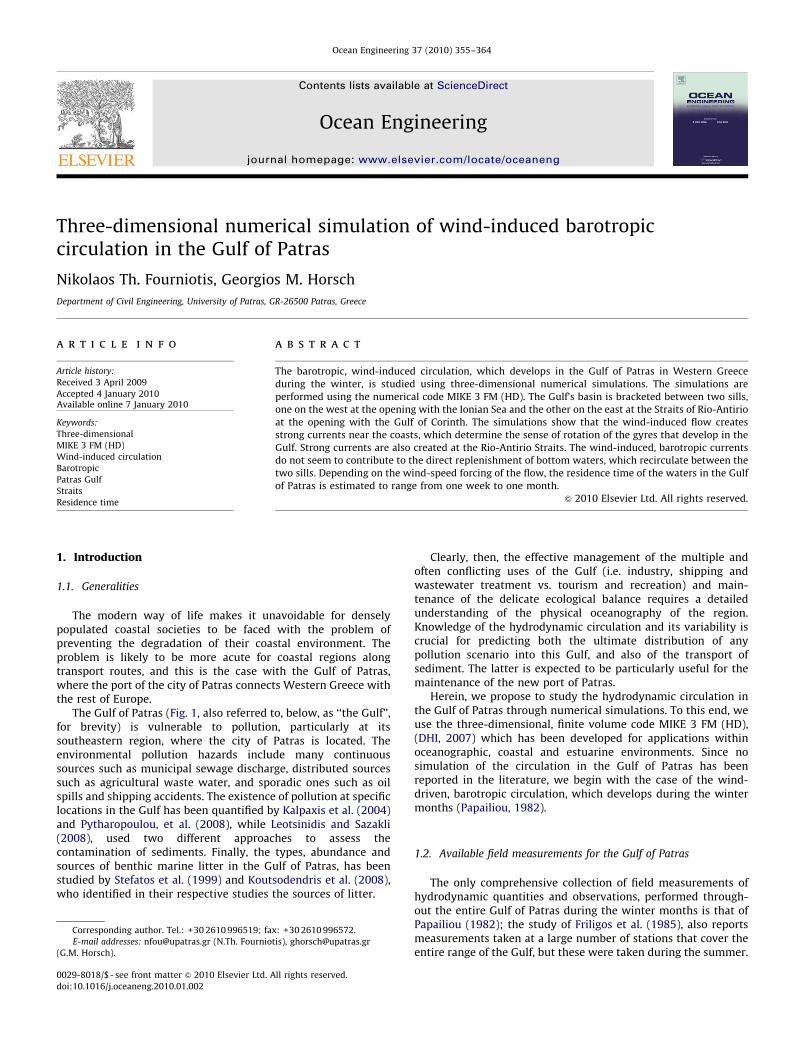
Fig. 1. The Gulf of Patras (Imray, 2004) lies between the Peloponnesus and Western Greece. The depths are in meters. The locations of open boundaries of the numerical
simulations are marked with black dashed lines as OB1 (in the west) and OB2 (in the east). Insert: the Gulf within Greece.
N.Th. Fourniotis, G.M. Horsch / Ocean Engineering 37 (2010) 355–364356
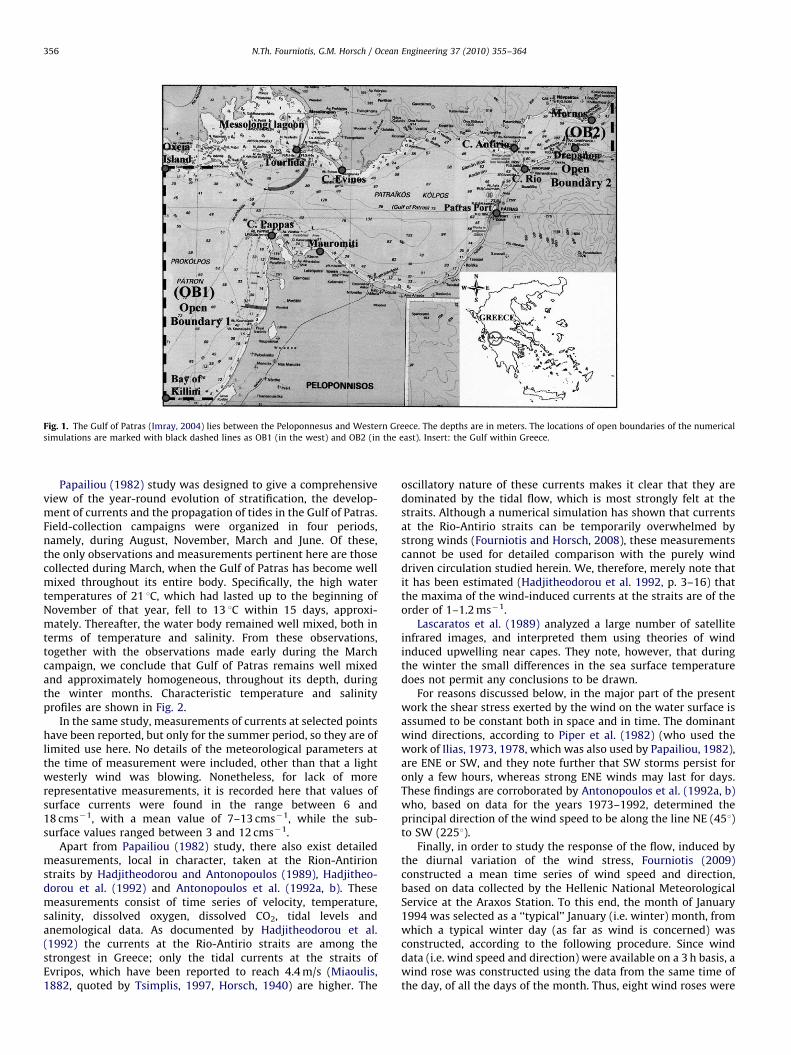
Papailiou (1982) study was designed to give a comprehensiveview of the year-round evolution of stratification, the develop-ment of currents and the propagation of tides in the Gulf of Patras.Field-collection campaigns were organized in four periods,namely, during August, November, March and June. Of these,the only observations and measurements pertinent here are thosecollected during March, when the Gulf of Patras has become wellmixed throughout its entire body. Specifically, the high watertemperatures of 21 1C, which had lasted up to the beginning ofNovember of that year, fell to 13 1C within 15 days, approxi-mately. Thereafter, the water body remained well mixed, both interms of temperature and salinity. From these observations,together with the observations made early during the Marchcampaign, we conclude that Gulf of Patras remains well mixedand approximately homogeneous, throughout its depth, duringthe winter months. Characteristic temperature and salinityprofiles are shown in Fig. 2.
In the same study, measurements of currents at selected pointshave been reported, but only for the summer period, so they are oflimited use here. No details of the meteorological parameters atthe time of measurement were included, other than that a lightwesterly wind was blowing. Nonetheless, for lack of morerepresentative measurements, it is recorded here that values ofsurface currents were found in the range between 6 and18 cms�1, with a mean value of 7–13 cms�1, while the sub-surface values ranged between 3 and 12 cms�1.
Apart from Papailiou (1982) study, there also exist detailedmeasurements, local in character, taken at the Rion-Antirionstraits by Hadjitheodorou and Antonopoulos (1989), Hadjitheo-dorou et al. (1992) and Antonopoulos et al. (1992a, b). Thesemeasurements consist of time series of velocity, temperature,salinity, dissolved oxygen, dissolved CO2, tidal levels andanemological data. As documented by Hadjitheodorou et al.(1992) the currents at the Rio-Antirio straits are among thestrongest in Greece; only the tidal currents at the straits ofEvripos, which have been reported to reach 4.4 m/s (Miaoulis,1882, quoted by Tsimplis, 1997, Horsch, 1940) are higher. The
oscillatory nature of these currents makes it clear that they aredominated by the tidal flow, which is most strongly felt at thestraits. Although a numerical simulation has shown that currentsat the Rio-Antirio straits can be temporarily overwhelmed bystrong winds (Fourniotis and Horsch, 2008), these measurementscannot be used for detailed comparison with the purely winddriven circulation studied herein. We, therefore, merely note thatit has been estimated (Hadjitheodorou et al. 1992, p. 3–16) thatthe maxima of the wind-induced currents at the straits are of theorder of 1–1.2 ms�1.
Lascaratos et al. (1989) analyzed a large number of satelliteinfrared images, and interpreted them using theories of windinduced upwelling near capes. They note, however, that duringthe winter the small differences in the sea surface temperaturedoes not permit any conclusions to be drawn.
For reasons discussed below, in the major part of the presentwork the shear stress exerted by the wind on the water surface isassumed to be constant both in space and in time. The dominantwind directions, according to Piper et al. (1982) (who used thework of Ilias, 1973, 1978, which was also used by Papailiou, 1982),are ENE or SW, and they note further that SW storms persist foronly a few hours, whereas strong ENE winds may last for days.These findings are corroborated by Antonopoulos et al. (1992a, b)who, based on data for the years 1973–1992, determined theprincipal direction of the wind speed to be along the line NE (451)to SW (2251).
Finally, in order to study the response of the flow, induced bythe diurnal variation of the wind stress, Fourniotis (2009)constructed a mean time series of wind speed and direction,based on data collected by the Hellenic National MeteorologicalService at the Araxos Station. To this end, the month of January1994 was selected as a ‘‘typical’’ January (i.e. winter) month, fromwhich a typical winter day (as far as wind is concerned) wasconstructed, according to the following procedure. Since winddata (i.e. wind speed and direction) were available on a 3 h basis, awind rose was constructed using the data from the same time ofthe day, of all the days of the month. Thus, eight wind roses were
ARTICLE IN PRESS
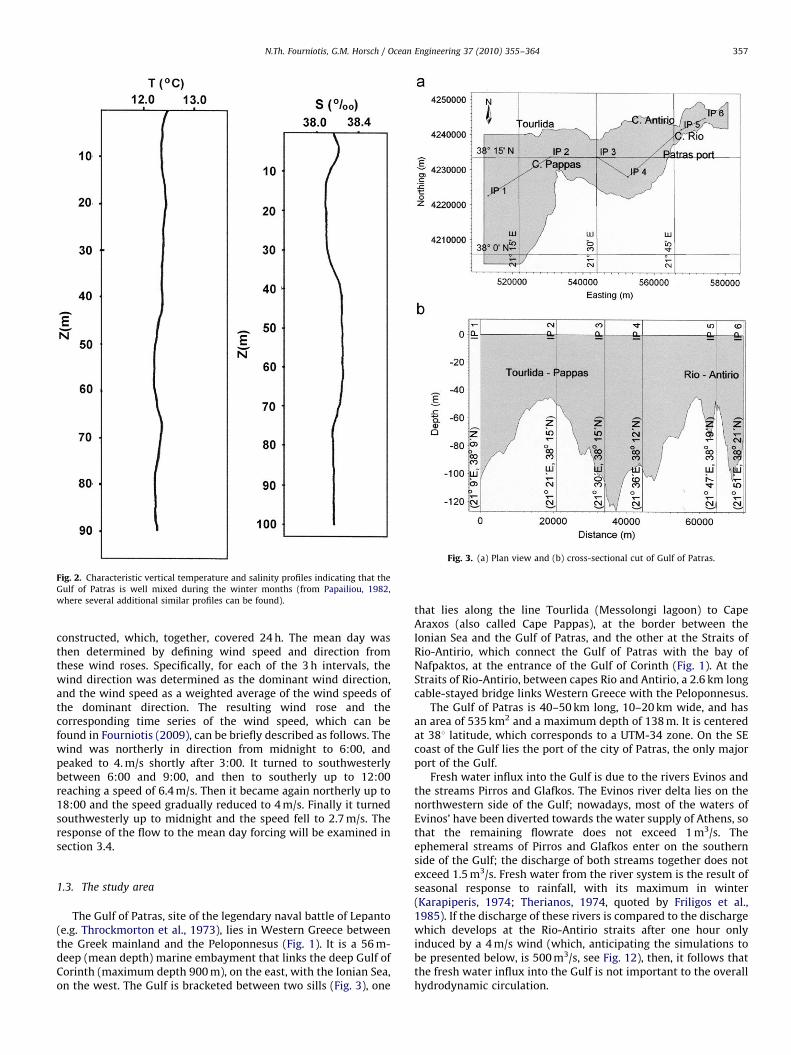
Fig. 3. (a) Plan view and (b) cross-sectional cut of Gulf of Patras.
Fig. 2. Characteristic vertical temperature and salinity profiles indicating that the
Gulf of Patras is well mixed during the winter months (from Papailiou, 1982,
where several additional similar profiles can be found).
N.Th. Fourniotis, G.M. Horsch / Ocean Engineering 37 (2010) 355–364 357
constructed, which, together, covered 24 h. The mean day wasthen determined by defining wind speed and direction fromthese wind roses. Specifically, for each of the 3 h intervals, thewind direction was determined as the dominant wind direction,and the wind speed as a weighted average of the wind speeds ofthe dominant direction. The resulting wind rose and thecorresponding time series of the wind speed, which can befound in Fourniotis (2009), can be briefly described as follows. Thewind was northerly in direction from midnight to 6:00, andpeaked to 4. m/s shortly after 3:00. It turned to southwesterlybetween 6:00 and 9:00, and then to southerly up to 12:00reaching a speed of 6.4 m/s. Then it became again northerly up to18:00 and the speed gradually reduced to 4 m/s. Finally it turnedsouthwesterly up to midnight and the speed fell to 2.7 m/s. Theresponse of the flow to the mean day forcing will be examined insection 3.4.
1.3. The study area
The Gulf of Patras, site of the legendary naval battle of Lepanto(e.g. Throckmorton et al., 1973), lies in Western Greece betweenthe Greek mainland and the Peloponnesus (Fig. 1). It is a 56 m-deep (mean depth) marine embayment that links the deep Gulf ofCorinth (maximum depth 900 m), on the east, with the Ionian Sea,on the west. The Gulf is bracketed between two sills (Fig. 3), one
that lies along the line Tourlida (Messolongi lagoon) to CapeAraxos (also called Cape Pappas), at the border between theIonian Sea and the Gulf of Patras, and the other at the Straits ofRio-Antirio, which connect the Gulf of Patras with the bay ofNafpaktos, at the entrance of the Gulf of Corinth (Fig. 1). At theStraits of Rio-Antirio, between capes Rio and Antirio, a 2.6 km longcable-stayed bridge links Western Greece with the Peloponnesus.
The Gulf of Patras is 40–50 km long, 10–20 km wide, and hasan area of 535 km2 and a maximum depth of 138 m. It is centeredat 381 latitude, which corresponds to a UTM-34 zone. On the SEcoast of the Gulf lies the port of the city of Patras, the only majorport of the Gulf.
Fresh water influx into the Gulf is due to the rivers Evinos andthe streams Pirros and Glafkos. The Evinos river delta lies on thenorthwestern side of the Gulf; nowadays, most of the waters ofEvinos’ have been diverted towards the water supply of Athens, sothat the remaining flowrate does not exceed 1 m3/s. Theephemeral streams of Pirros and Glafkos enter on the southernside of the Gulf; the discharge of both streams together does notexceed 1.5 m3/s. Fresh water from the river system is the result ofseasonal response to rainfall, with its maximum in winter(Karapiperis, 1974; Therianos, 1974, quoted by Friligos et al.,1985). If the discharge of these rivers is compared to the dischargewhich develops at the Rio-Antirio straits after one hour onlyinduced by a 4 m/s wind (which, anticipating the simulations tobe presented below, is 500 m3/s, see Fig. 12), then, it follows thatthe fresh water influx into the Gulf is not important to the overallhydrodynamic circulation.
ARTICLE IN PRESS
N.Th. Fourniotis, G.M. Horsch / Ocean Engineering 37 (2010) 355–364358
2. The numerical model
2.1. The hydrodynamic code
The simulations presented herein have been performed usingthe commercially available CFD code MIKE 3 Flow Model FM(where FM stands for flexible mesh). This is a new modelingsystem, developed at the Danish Hydraulic Institute (DHI), basedon a finite volume, unstructured mesh approach. The hydro-dynamic module (HD) extracts numerical solutions from thethree-dimensional continuity, momentum, temperature, salinity,and density equations. The momentum equations are used in theincompressible, Reynolds averaged form of the Navier–Stokesequations (RANS), invoking the Boussinesq assumption and thehypothesis of hydrostatic pressure in the vertical. The turbulenceclosure is achieved using the Smagorinsky formulation fordiffusion in the horizontal and the standard k–e model in thevertical direction. To account for the Coriolis force an f-plane hasbeen used. The free surface is taken into account using a sigma-coordinate transformation.
The spatial discretization of the primitive equations isperformed using a cell-centered finite volume method. In thehorizontal plane an unstructured grid is used while in the verticaldirection the discretization is structured. The elements are prismsor bricks whose horizontal faces are triangles or quadrilateralelements, respectively. A Riemann solver is used for computationof the convective fluxes, which makes it possible to handlediscontinuous solutions. For the time integration a semi-implicitapproach is used, where the horizontal terms are treatedimplicitly (DHI, 2007).
2.2. Verification of the code
Since no studies have been found in the literature using theMIKE 3 Flow Model FM, before applying the numerical code to thecomplex natural basin of the Gulf of Patras, the solution of twoclosely related problems in idealized geometries was firstexamined. The first problem concerned the numerical simulationof three-dimensional wind-driven flow in a closed laboratoryflume, for which laboratory measurements are available. Second,the simulation of three-dimensional, unsteady, turbulent flow inan open channel of rectangular cross section over a mild slope.Numerical solutions to both problems were found to converge
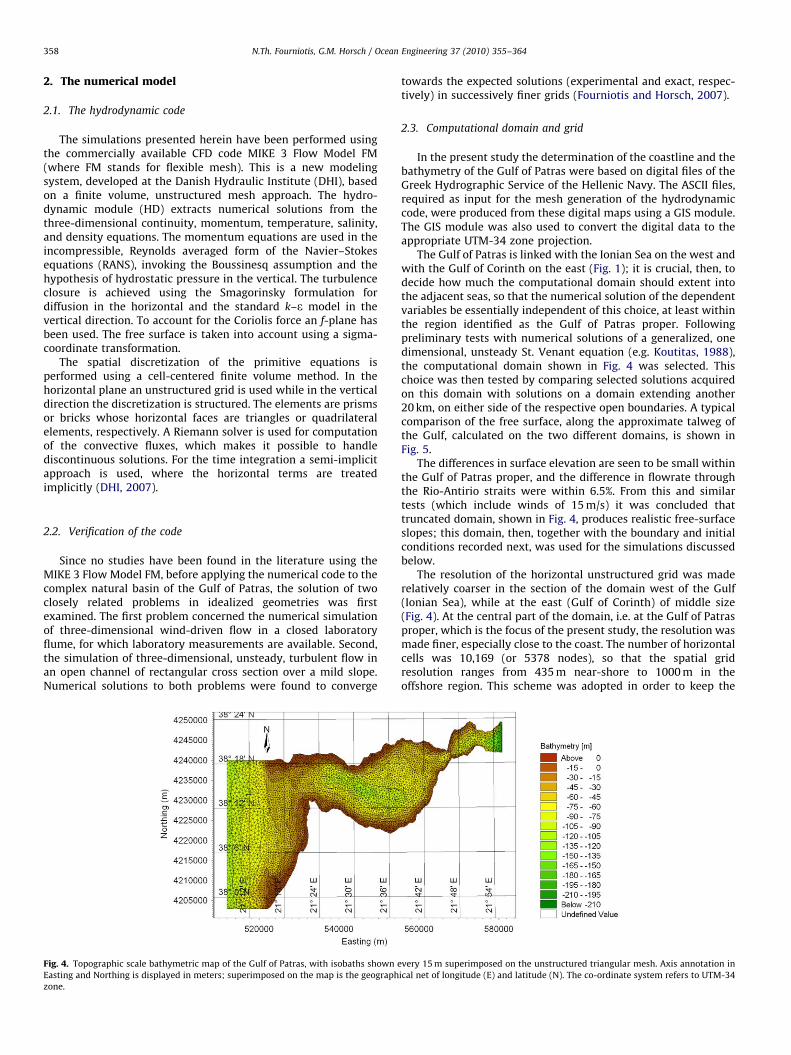
Fig. 4. Topographic scale bathymetric map of the Gulf of Patras, with isobaths shown e
Easting and Northing is displayed in meters; superimposed on the map is the geograph
zone.
towards the expected solutions (experimental and exact, respec-tively) in successively finer grids (Fourniotis and Horsch, 2007).
2.3. Computational domain and grid
In the present study the determination of the coastline and thebathymetry of the Gulf of Patras were based on digital files of theGreek Hydrographic Service of the Hellenic Navy. The ASCII files,required as input for the mesh generation of the hydrodynamiccode, were produced from these digital maps using a GIS module.The GIS module was also used to convert the digital data to theappropriate UTM-34 zone projection.
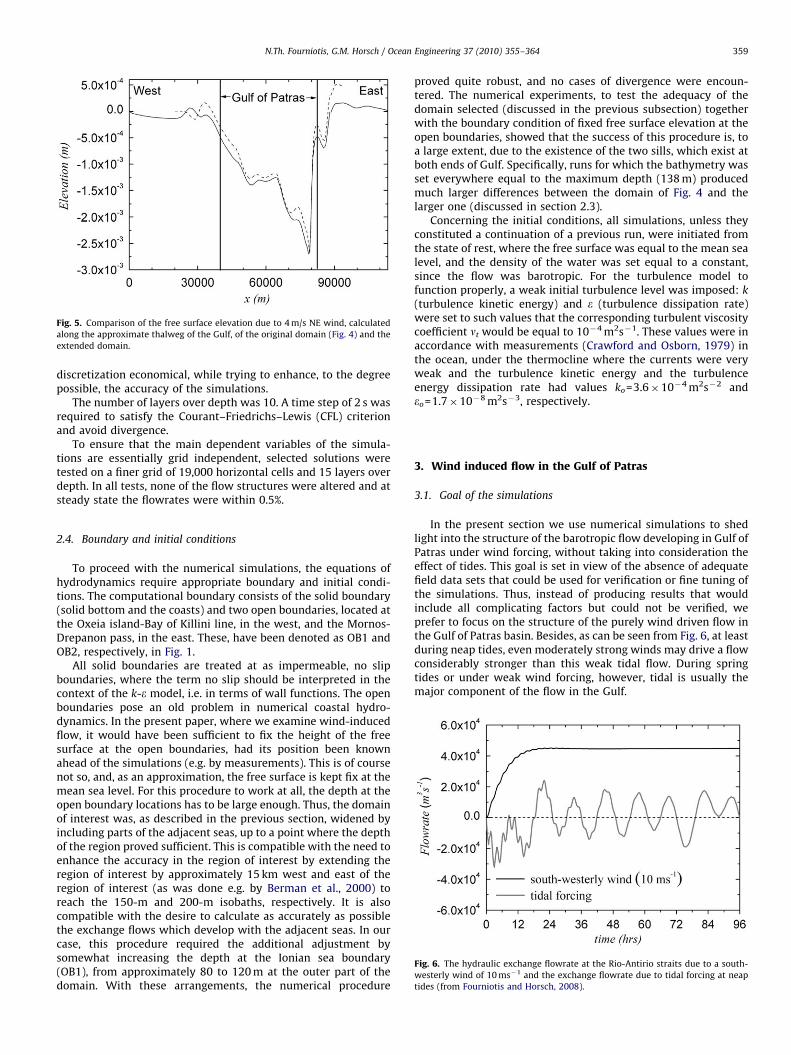
The Gulf of Patras is linked with the Ionian Sea on the west andwith the Gulf of Corinth on the east (Fig. 1); it is crucial, then, todecide how much the computational domain should extent intothe adjacent seas, so that the numerical solution of the dependentvariables be essentially independent of this choice, at least withinthe region identified as the Gulf of Patras proper. Followingpreliminary tests with numerical solutions of a generalized, onedimensional, unsteady St. Venant equation (e.g. Koutitas, 1988),the computational domain shown in Fig. 4 was selected. Thischoice was then tested by comparing selected solutions acquiredon this domain with solutions on a domain extending another20 km, on either side of the respective open boundaries. A typicalcomparison of the free surface, along the approximate talweg ofthe Gulf, calculated on the two different domains, is shown inFig. 5.
The differences in surface elevation are seen to be small withinthe Gulf of Patras proper, and the difference in flowrate throughthe Rio-Antirio straits were within 6.5%. From this and similartests (which include winds of 15 m/s) it was concluded thattruncated domain, shown in Fig. 4, produces realistic free-surfaceslopes; this domain, then, together with the boundary and initialconditions recorded next, was used for the simulations discussedbelow.
The resolution of the horizontal unstructured grid was maderelatively coarser in the section of the domain west of the Gulf(Ionian Sea), while at the east (Gulf of Corinth) of middle size(Fig. 4). At the central part of the domain, i.e. at the Gulf of Patrasproper, which is the focus of the present study, the resolution wasmade finer, especially close to the coast. The number of horizontalcells was 10,169 (or 5378 nodes), so that the spatial gridresolution ranges from 435 m near-shore to 1000 m in theoffshore region. This scheme was adopted in order to keep the
very 15 m superimposed on the unstructured triangular mesh. Axis annotation in
ical net of longitude (E) and latitude (N). The co-ordinate system refers to UTM-34
ARTICLE IN PRESS
Fig. 5. Comparison of the free surface elevation due to 4 m/s NE wind, calculated
along the approximate thalweg of the Gulf, of the original domain (Fig. 4) and the
extended domain.
N.Th. Fourniotis, G.M. Horsch / Ocean Engineering 37 (2010) 355–364 359
discretization economical, while trying to enhance, to the degreepossible, the accuracy of the simulations.
The number of layers over depth was 10. A time step of 2 s wasrequired to satisfy the Courant–Friedrichs–Lewis (CFL) criterionand avoid divergence.
To ensure that the main dependent variables of the simula-tions are essentially grid independent, selected solutions weretested on a finer grid of 19,000 horizontal cells and 15 layers overdepth. In all tests, none of the flow structures were altered and atsteady state the flowrates were within 0.5%.
Fig. 6. The hydraulic exchange flowrate at the Rio-Antirio straits due to a south-
westerly wind of 10 ms�1 and the exchange flowrate due to tidal forcing at neap
tides (from Fourniotis and Horsch, 2008).
2.4. Boundary and initial conditions
To proceed with the numerical simulations, the equations ofhydrodynamics require appropriate boundary and initial condi-tions. The computational boundary consists of the solid boundary(solid bottom and the coasts) and two open boundaries, located atthe Oxeia island-Bay of Killini line, in the west, and the Mornos-Drepanon pass, in the east. These, have been denoted as OB1 andOB2, respectively, in Fig. 1.
All solid boundaries are treated at as impermeable, no slipboundaries, where the term no slip should be interpreted in thecontext of the k-e model, i.e. in terms of wall functions. The openboundaries pose an old problem in numerical coastal hydro-dynamics. In the present paper, where we examine wind-inducedflow, it would have been sufficient to fix the height of the freesurface at the open boundaries, had its position been knownahead of the simulations (e.g. by measurements). This is of coursenot so, and, as an approximation, the free surface is kept fix at themean sea level. For this procedure to work at all, the depth at theopen boundary locations has to be large enough. Thus, the domainof interest was, as described in the previous section, widened byincluding parts of the adjacent seas, up to a point where the depthof the region proved sufficient. This is compatible with the need toenhance the accuracy in the region of interest by extending theregion of interest by approximately 15 km west and east of theregion of interest (as was done e.g. by Berman et al., 2000) toreach the 150-m and 200-m isobaths, respectively. It is alsocompatible with the desire to calculate as accurately as possiblethe exchange flows which develop with the adjacent seas. In ourcase, this procedure required the additional adjustment bysomewhat increasing the depth at the Ionian sea boundary(OB1), from approximately 80 to 120 m at the outer part of thedomain. With these arrangements, the numerical procedure
proved quite robust, and no cases of divergence were encoun-tered. The numerical experiments, to test the adequacy of thedomain selected (discussed in the previous subsection) togetherwith the boundary condition of fixed free surface elevation at theopen boundaries, showed that the success of this procedure is, toa large extent, due to the existence of the two sills, which exist atboth ends of Gulf. Specifically, runs for which the bathymetry wasset everywhere equal to the maximum depth (138 m) producedmuch larger differences between the domain of Fig. 4 and thelarger one (discussed in section 2.3).
Concerning the initial conditions, all simulations, unless theyconstituted a continuation of a previous run, were initiated fromthe state of rest, where the free surface was equal to the mean sealevel, and the density of the water was set equal to a constant,since the flow was barotropic. For the turbulence model tofunction properly, a weak initial turbulence level was imposed: k
(turbulence kinetic energy) and e (turbulence dissipation rate)were set to such values that the corresponding turbulent viscositycoefficient nt would be equal to 10�4 m2s�1. These values were inaccordance with measurements (Crawford and Osborn, 1979) inthe ocean, under the thermocline where the currents were veryweak and the turbulence kinetic energy and the turbulenceenergy dissipation rate had values ko=3.6�10�4 m2s�2 andeo=1.7�10�8 m2s�3, respectively.
3. Wind induced flow in the Gulf of Patras
3.1. Goal of the simulations
In the present section we use numerical simulations to shedlight into the structure of the barotropic flow developing in Gulf ofPatras under wind forcing, without taking into consideration theeffect of tides. This goal is set in view of the absence of adequatefield data sets that could be used for verification or fine tuning ofthe simulations. Thus, instead of producing results that wouldinclude all complicating factors but could not be verified, weprefer to focus on the structure of the purely wind driven flow inthe Gulf of Patras basin. Besides, as can be seen from Fig. 6, at leastduring neap tides, even moderately strong winds may drive a flowconsiderably stronger than this weak tidal flow. During springtides or under weak wind forcing, however, tidal is usually themajor component of the flow in the Gulf.
ARTICLE IN PRESS
N.Th. Fourniotis, G.M. Horsch / Ocean Engineering 37 (2010) 355–364360
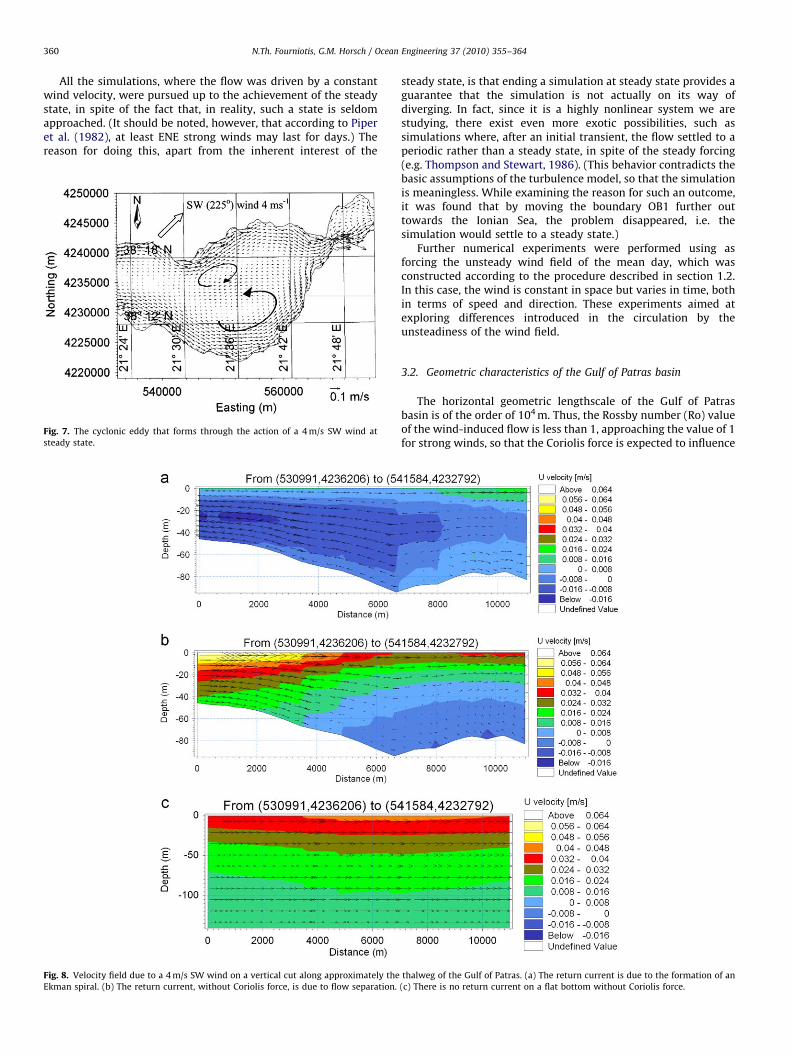
All the simulations, where the flow was driven by a constantwind velocity, were pursued up to the achievement of the steadystate, in spite of the fact that, in reality, such a state is seldomapproached. (It should be noted, however, that according to Piperet al. (1982), at least ENE strong winds may last for days.) Thereason for doing this, apart from the inherent interest of the
Fig. 7. The cyclonic eddy that forms through the action of a 4 m/s SW wind at
steady state.
Fig. 8. Velocity field due to a 4 m/s SW wind on a vertical cut along approximately the
Ekman spiral. (b) The return current, without Coriolis force, is due to flow separation.
steady state, is that ending a simulation at steady state provides aguarantee that the simulation is not actually on its way ofdiverging. In fact, since it is a highly nonlinear system we arestudying, there exist even more exotic possibilities, such assimulations where, after an initial transient, the flow settled to aperiodic rather than a steady state, in spite of the steady forcing(e.g. Thompson and Stewart, 1986). (This behavior contradicts thebasic assumptions of the turbulence model, so that the simulationis meaningless. While examining the reason for such an outcome,it was found that by moving the boundary OB1 further outtowards the Ionian Sea, the problem disappeared, i.e. thesimulation would settle to a steady state.)
Further numerical experiments were performed using asforcing the unsteady wind field of the mean day, which wasconstructed according to the procedure described in section 1.2.In this case, the wind is constant in space but varies in time, bothin terms of speed and direction. These experiments aimed atexploring differences introduced in the circulation by theunsteadiness of the wind field.
3.2. Geometric characteristics of the Gulf of Patras basin
The horizontal geometric lengthscale of the Gulf of Patrasbasin is of the order of 104 m. Thus, the Rossby number (Ro) valueof the wind-induced flow is less than 1, approaching the value of 1for strong winds, so that the Coriolis force is expected to influence
thalweg of the Gulf of Patras. (a) The return current is due to the formation of an
(c) There is no return current on a flat bottom without Coriolis force.
ARTICLE IN PRESS
N.Th. Fourniotis, G.M. Horsch / Ocean Engineering 37 (2010) 355–364 361
the flow over the whole range of wind speeds. Because, however,the Gulf is a restricted area of variable depth, the effect of rotationis reduced with increasing wind speed.
The Gulf is bracketed between two sills (at cross-sections IP2and IP5 in Fig. 3), one along the Tourlida-Pappas direction at theopening with the Ionian Sea, and the other along the Rio-Antiriostraits at opening with the Gulf of Corinth. The depth of theformer sill is around 50–55 m and that of the latter around 60 m.Thus, the shape of the bathymetry of the Gulf will be seen to playa decisive role in the renewal of the bottom waters.
Finally, another important characteristic of the basin of theGulf is that the opening with the Ionian Sea is 15 km wide,whereas the opening of the Rio-Antirio straits is only 2.4 km wide.Thus, the importance of the Coriolis force is suppressed at thestraits, the overall value of Ro notwithstanding, and the behaviorof the flow at the straits will be seen, below, to resemble that of ahydraulic flow at a constriction of an open channel.
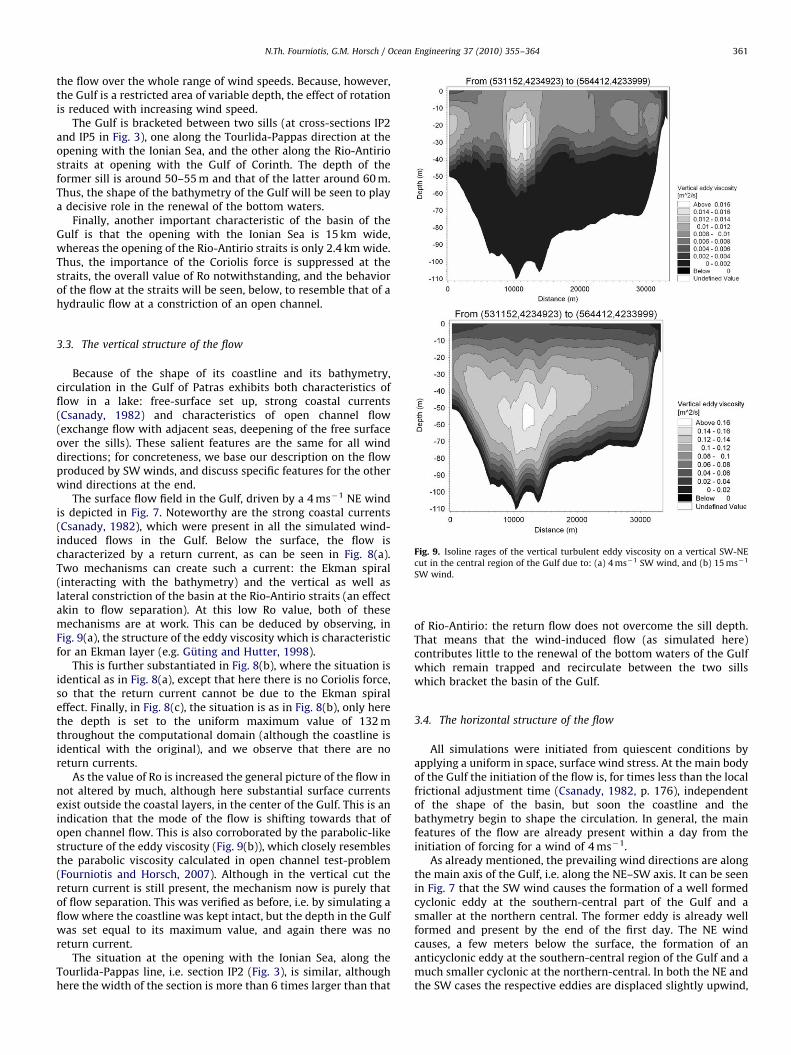
Fig. 9. Isoline rages of the vertical turbulent eddy viscosity on a vertical SW-NE
cut in the central region of the Gulf due to: (a) 4 ms�1 SW wind, and (b) 15 ms�1
SW wind.
3.3. The vertical structure of the flow
Because of the shape of its coastline and its bathymetry,circulation in the Gulf of Patras exhibits both characteristics offlow in a lake: free-surface set up, strong coastal currents(Csanady, 1982) and characteristics of open channel flow(exchange flow with adjacent seas, deepening of the free surfaceover the sills). These salient features are the same for all winddirections; for concreteness, we base our description on the flowproduced by SW winds, and discuss specific features for the otherwind directions at the end.
The surface flow field in the Gulf, driven by a 4 ms�1 NE windis depicted in Fig. 7. Noteworthy are the strong coastal currents(Csanady, 1982), which were present in all the simulated wind-induced flows in the Gulf. Below the surface, the flow ischaracterized by a return current, as can be seen in Fig. 8(a).Two mechanisms can create such a current: the Ekman spiral(interacting with the bathymetry) and the vertical as well aslateral constriction of the basin at the Rio-Antirio straits (an effectakin to flow separation). At this low Ro value, both of thesemechanisms are at work. This can be deduced by observing, inFig. 9(a), the structure of the eddy viscosity which is characteristicfor an Ekman layer (e.g. Guting and Hutter, 1998).
This is further substantiated in Fig. 8(b), where the situation isidentical as in Fig. 8(a), except that here there is no Coriolis force,so that the return current cannot be due to the Ekman spiraleffect. Finally, in Fig. 8(c), the situation is as in Fig. 8(b), only herethe depth is set to the uniform maximum value of 132 mthroughout the computational domain (although the coastline isidentical with the original), and we observe that there are noreturn currents.
As the value of Ro is increased the general picture of the flow innot altered by much, although here substantial surface currentsexist outside the coastal layers, in the center of the Gulf. This is anindication that the mode of the flow is shifting towards that ofopen channel flow. This is also corroborated by the parabolic-likestructure of the eddy viscosity (Fig. 9(b)), which closely resemblesthe parabolic viscosity calculated in open channel test-problem(Fourniotis and Horsch, 2007). Although in the vertical cut thereturn current is still present, the mechanism now is purely thatof flow separation. This was verified as before, i.e. by simulating aflow where the coastline was kept intact, but the depth in the Gulfwas set equal to its maximum value, and again there was noreturn current.
The situation at the opening with the Ionian Sea, along theTourlida-Pappas line, i.e. section IP2 (Fig. 3), is similar, althoughhere the width of the section is more than 6 times larger than that
of Rio-Antirio: the return flow does not overcome the sill depth.That means that the wind-induced flow (as simulated here)contributes little to the renewal of the bottom waters of the Gulfwhich remain trapped and recirculate between the two sillswhich bracket the basin of the Gulf.
3.4. The horizontal structure of the flow
All simulations were initiated from quiescent conditions byapplying a uniform in space, surface wind stress. At the main bodyof the Gulf the initiation of the flow is, for times less than the localfrictional adjustment time (Csanady, 1982, p. 176), independentof the shape of the basin, but soon the coastline and thebathymetry begin to shape the circulation. In general, the mainfeatures of the flow are already present within a day from theinitiation of forcing for a wind of 4 ms�1.
As already mentioned, the prevailing wind directions are alongthe main axis of the Gulf, i.e. along the NE–SW axis. It can be seenin Fig. 7 that the SW wind causes the formation of a well formedcyclonic eddy at the southern-central part of the Gulf and asmaller at the northern central. The former eddy is already wellformed and present by the end of the first day. The NE windcauses, a few meters below the surface, the formation of ananticyclonic eddy at the southern-central region of the Gulf and amuch smaller cyclonic at the northern-central. In both the NE andthe SW cases the respective eddies are displaced slightly upwind,
ARTICLE IN PRESS
N.Th. Fourniotis, G.M. Horsch / Ocean Engineering 37 (2010) 355–364362
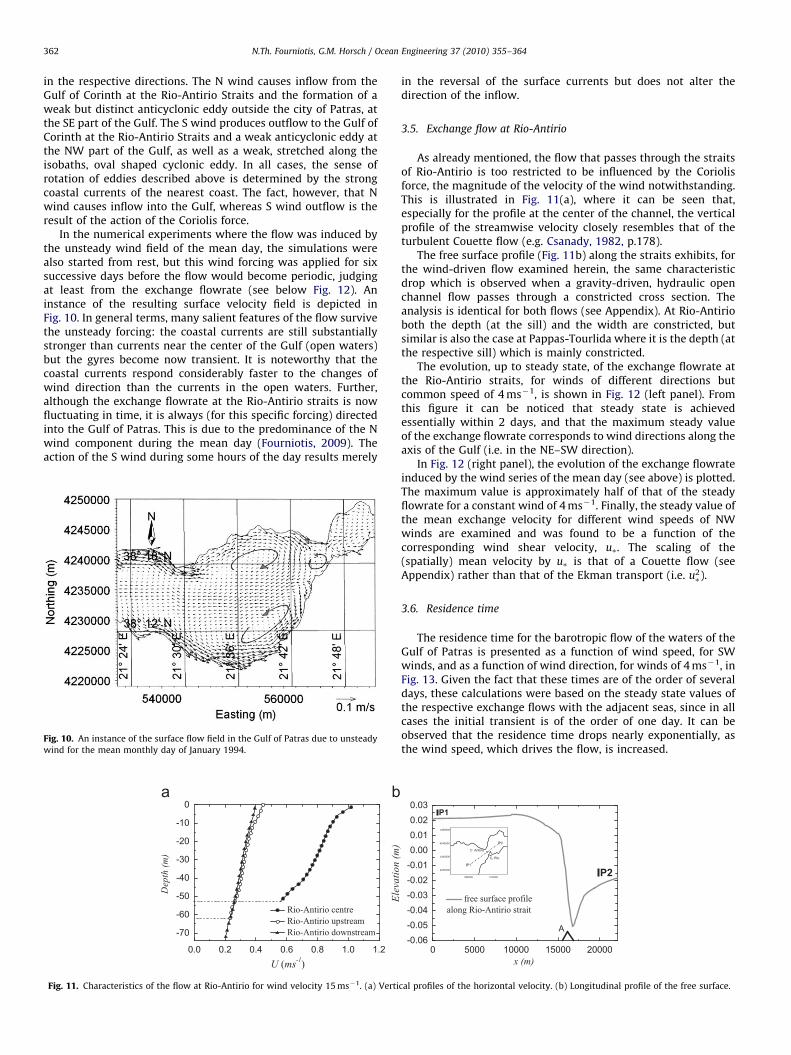
in the respective directions. The N wind causes inflow from theGulf of Corinth at the Rio-Antirio Straits and the formation of aweak but distinct anticyclonic eddy outside the city of Patras, atthe SE part of the Gulf. The S wind produces outflow to the Gulf ofCorinth at the Rio-Antirio Straits and a weak anticyclonic eddy atthe NW part of the Gulf, as well as a weak, stretched along theisobaths, oval shaped cyclonic eddy. In all cases, the sense ofrotation of eddies described above is determined by the strongcoastal currents of the nearest coast. The fact, however, that Nwind causes inflow into the Gulf, whereas S wind outflow is theresult of the action of the Coriolis force.
In the numerical experiments where the flow was induced bythe unsteady wind field of the mean day, the simulations werealso started from rest, but this wind forcing was applied for sixsuccessive days before the flow would become periodic, judgingat least from the exchange flowrate (see below Fig. 12). Aninstance of the resulting surface velocity field is depicted inFig. 10. In general terms, many salient features of the flow survivethe unsteady forcing: the coastal currents are still substantiallystronger than currents near the center of the Gulf (open waters)but the gyres become now transient. It is noteworthy that thecoastal currents respond considerably faster to the changes ofwind direction than the currents in the open waters. Further,although the exchange flowrate at the Rio-Antirio straits is nowfluctuating in time, it is always (for this specific forcing) directedinto the Gulf of Patras. This is due to the predominance of the Nwind component during the mean day (Fourniotis, 2009). Theaction of the S wind during some hours of the day results merely
Fig. 10. An instance of the surface flow field in the Gulf of Patras due to unsteady
wind for the mean monthly day of January 1994.
Fig. 11. Characteristics of the flow at Rio-Antirio for wind velocity 15 ms�1. (a) Verti
in the reversal of the surface currents but does not alter thedirection of the inflow.
3.5. Exchange flow at Rio-Antirio
As already mentioned, the flow that passes through the straitsof Rio-Antirio is too restricted to be influenced by the Coriolisforce, the magnitude of the velocity of the wind notwithstanding.This is illustrated in Fig. 11(a), where it can be seen that,especially for the profile at the center of the channel, the verticalprofile of the streamwise velocity closely resembles that of theturbulent Couette flow (e.g. Csanady, 1982, p.178).
The free surface profile (Fig. 11b) along the straits exhibits, forthe wind-driven flow examined herein, the same characteristicdrop which is observed when a gravity-driven, hydraulic openchannel flow passes through a constricted cross section. Theanalysis is identical for both flows (see Appendix). At Rio-Antirioboth the depth (at the sill) and the width are constricted, butsimilar is also the case at Pappas-Tourlida where it is the depth (atthe respective sill) which is mainly constricted.
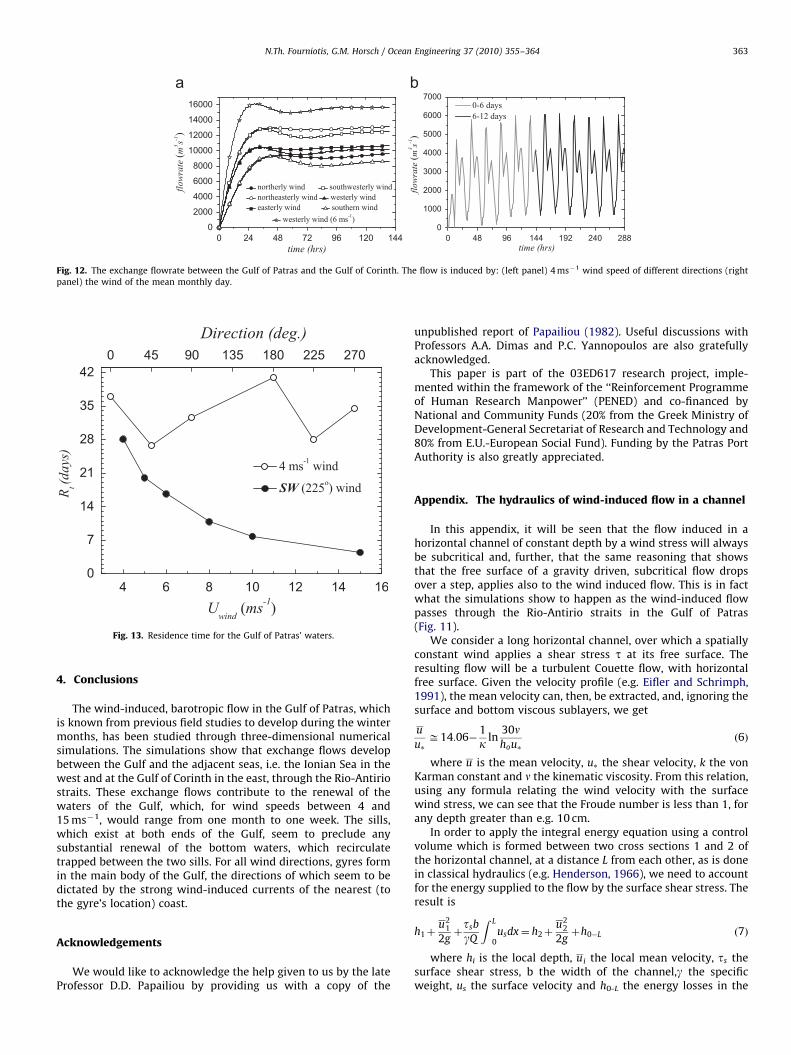
The evolution, up to steady state, of the exchange flowrate atthe Rio-Antirio straits, for winds of different directions butcommon speed of 4 ms�1, is shown in Fig. 12 (left panel). Fromthis figure it can be noticed that steady state is achievedessentially within 2 days, and that the maximum steady valueof the exchange flowrate corresponds to wind directions along theaxis of the Gulf (i.e. in the NE–SW direction).
In Fig. 12 (right panel), the evolution of the exchange flowrateinduced by the wind series of the mean day (see above) is plotted.The maximum value is approximately half of that of the steadyflowrate for a constant wind of 4 ms�1. Finally, the steady value ofthe mean exchange velocity for different wind speeds of NWwinds are examined and was found to be a function of thecorresponding wind shear velocity, u�. The scaling of the(spatially) mean velocity by u� is that of a Couette flow (seeAppendix) rather than that of the Ekman transport (i.e. u2
�).
3.6. Residence time
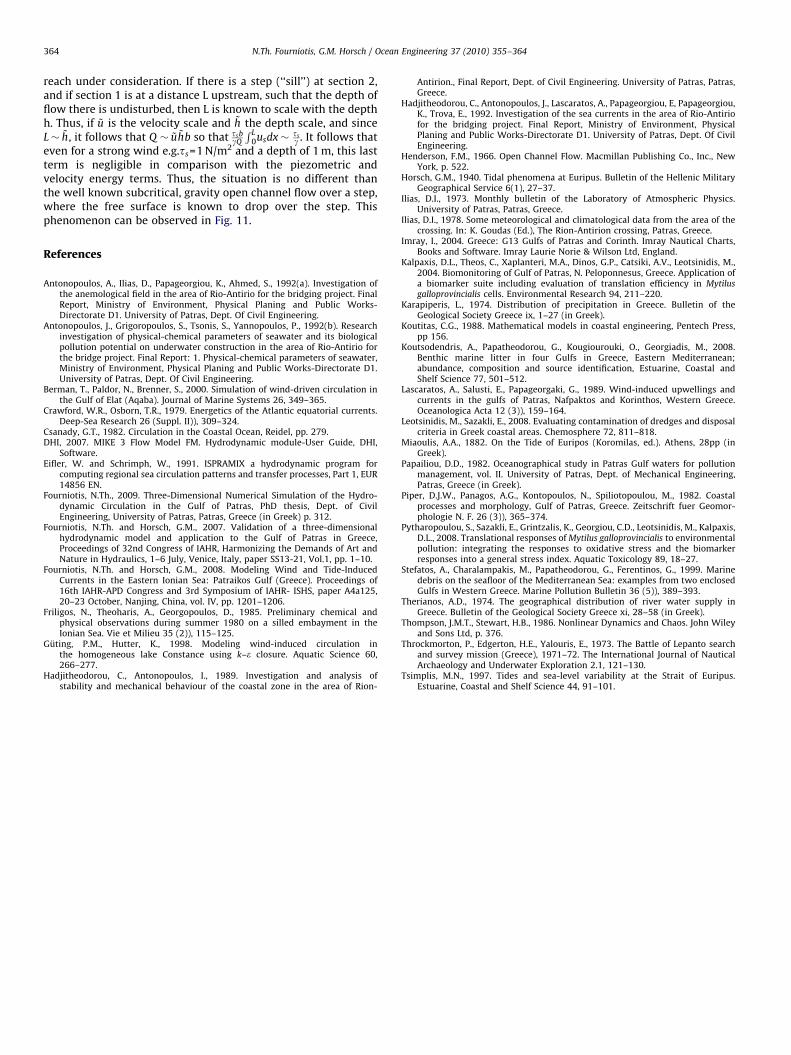
The residence time for the barotropic flow of the waters of theGulf of Patras is presented as a function of wind speed, for SWwinds, and as a function of wind direction, for winds of 4 ms�1, inFig. 13. Given the fact that these times are of the order of severaldays, these calculations were based on the steady state values ofthe respective exchange flows with the adjacent seas, since in allcases the initial transient is of the order of one day. It can beobserved that the residence time drops nearly exponentially, asthe wind speed, which drives the flow, is increased.
cal profiles of the horizontal velocity. (b) Longitudinal profile of the free surface.
ARTICLE IN PRESS
Fig. 12. The exchange flowrate between the Gulf of Patras and the Gulf of Corinth. The flow is induced by: (left panel) 4 ms�1 wind speed of different directions (right
panel) the wind of the mean monthly day.
Fig. 13. Residence time for the Gulf of Patras’ waters.
N.Th. Fourniotis, G.M. Horsch / Ocean Engineering 37 (2010) 355–364 363
4. Conclusions
The wind-induced, barotropic flow in the Gulf of Patras, whichis known from previous field studies to develop during the wintermonths, has been studied through three-dimensional numericalsimulations. The simulations show that exchange flows developbetween the Gulf and the adjacent seas, i.e. the Ionian Sea in thewest and at the Gulf of Corinth in the east, through the Rio-Antiriostraits. These exchange flows contribute to the renewal of thewaters of the Gulf, which, for wind speeds between 4 and15 ms�1, would range from one month to one week. The sills,which exist at both ends of the Gulf, seem to preclude anysubstantial renewal of the bottom waters, which recirculatetrapped between the two sills. For all wind directions, gyres formin the main body of the Gulf, the directions of which seem to bedictated by the strong wind-induced currents of the nearest (tothe gyre’s location) coast.
Acknowledgements
We would like to acknowledge the help given to us by the lateProfessor D.D. Papailiou by providing us with a copy of the
unpublished report of Papailiou (1982). Useful discussions withProfessors A.A. Dimas and P.C. Yannopoulos are also gratefullyacknowledged.
This paper is part of the 03ED617 research project, imple-mented within the framework of the ‘‘Reinforcement Programmeof Human Research Manpower’’ (PENED) and co-financed byNational and Community Funds (20% from the Greek Ministry ofDevelopment-General Secretariat of Research and Technology and80% from E.U.-European Social Fund). Funding by the Patras PortAuthority is also greatly appreciated.
Appendix. The hydraulics of wind-induced flow in a channel
In this appendix, it will be seen that the flow induced in ahorizontal channel of constant depth by a wind stress will alwaysbe subcritical and, further, that the same reasoning that showsthat the free surface of a gravity driven, subcritical flow dropsover a step, applies also to the wind induced flow. This is in factwhat the simulations show to happen as the wind-induced flowpasses through the Rio-Antirio straits in the Gulf of Patras(Fig. 11).
We consider a long horizontal channel, over which a spatiallyconstant wind applies a shear stress t at its free surface. Theresulting flow will be a turbulent Couette flow, with horizontalfree surface. Given the velocity profile (e.g. Eifler and Schrimph,1991), the mean velocity can, then, be extracted, and, ignoring thesurface and bottom viscous sublayers, we get
u
u�ffi14:06�
1
k ln30nhou�
ð6Þ
where u is the mean velocity, u� the shear velocity, k the vonKarman constant and n the kinematic viscosity. From this relation,using any formula relating the wind velocity with the surfacewind stress, we can see that the Froude number is less than 1, forany depth greater than e.g. 10 cm.
In order to apply the integral energy equation using a controlvolume which is formed between two cross sections 1 and 2 ofthe horizontal channel, at a distance L from each other, as is donein classical hydraulics (e.g. Henderson, 1966), we need to accountfor the energy supplied to the flow by the surface shear stress. Theresult is
h1þu2
1
2gþtsb
gQ
Z L
0usdx¼ h2þ
u22
2gþh0�L ð7Þ
where hi is the local depth, ui the local mean velocity, ts thesurface shear stress, b the width of the channel,g the specificweight, us the surface velocity and h0-L the energy losses in the
ARTICLE IN PRESS
N.Th. Fourniotis, G.M. Horsch / Ocean Engineering 37 (2010) 355–364364
reach under consideration. If there is a step (‘‘sill’’) at section 2,and if section 1 is at a distance L upstream, such that the depth offlow there is undisturbed, then L is known to scale with the depthh. Thus, if ~u is the velocity scale and ~h the depth scale, and sinceL� ~h, it follows that Q � ~u ~hb so that tsb
gQ
R L0usdx� ts
g . It follows thateven for a strong wind e.g.ts=1 N/m2 and a depth of 1 m, this lastterm is negligible in comparison with the piezometric andvelocity energy terms. Thus, the situation is no different thanthe well known subcritical, gravity open channel flow over a step,where the free surface is known to drop over the step. Thisphenomenon can be observed in Fig. 11.
References
Antonopoulos, A., Ilias, D., Papageorgiou, K., Ahmed, S., 1992(a). Investigation ofthe anemological field in the area of Rio-Antirio for the bridging project. FinalReport, Ministry of Environment, Physical Planing and Public Works-Directorate D1. University of Patras, Dept. Of Civil Engineering.
Antonopoulos, J., Grigoropoulos, S., Tsonis, S., Yannopoulos, P., 1992(b). Researchinvestigation of physical-chemical parameters of seawater and its biologicalpollution potential on underwater construction in the area of Rio-Antirio forthe bridge project. Final Report: 1. Physical-chemical parameters of seawater,Ministry of Environment, Physical Planing and Public Works-Directorate D1.University of Patras, Dept. Of Civil Engineering.
Berman, T., Paldor, N., Brenner, S., 2000. Simulation of wind-driven circulation inthe Gulf of Elat (Aqaba). Journal of Marine Systems 26, 349–365.
Crawford, W.R., Osborn, T.R., 1979. Energetics of the Atlantic equatorial currents.Deep-Sea Research 26 (Suppl. II)), 309–324.
Csanady, G.T., 1982. Circulation in the Coastal Ocean, Reidel, pp. 279.DHI, 2007. MIKE 3 Flow Model FM. Hydrodynamic module-User Guide, DHI,
Software.Eifler, W. and Schrimph, W., 1991. ISPRAMIX a hydrodynamic program for
computing regional sea circulation patterns and transfer processes, Part 1, EUR14856 EN.
Fourniotis, N.Th., 2009. Three-Dimensional Numerical Simulation of the Hydro-dynamic Circulation in the Gulf of Patras, PhD thesis, Dept. of CivilEngineering, University of Patras, Patras, Greece (in Greek) p. 312.
Fourniotis, N.Th. and Horsch, G.M., 2007. Validation of a three-dimensionalhydrodynamic model and application to the Gulf of Patras in Greece,Proceedings of 32nd Congress of IAHR, Harmonizing the Demands of Art andNature in Hydraulics, 1–6 July, Venice, Italy, paper SS13-21, Vol.1, pp. 1–10.
Fourniotis, N.Th. and Horsch, G.M., 2008. Modeling Wind and Tide-InducedCurrents in the Eastern Ionian Sea: Patraikos Gulf (Greece). Proceedings of16th IAHR-APD Congress and 3rd Symposium of IAHR- ISHS, paper A4a125,20–23 October, Nanjing, China, vol. IV, pp. 1201–1206.
Friligos, N., Theoharis, A., Georgopoulos, D., 1985. Preliminary chemical andphysical observations during summer 1980 on a silled embayment in theIonian Sea. Vie et Milieu 35 (2)), 115–125.
Guting, P.M., Hutter, K., 1998. Modeling wind-induced circulation inthe homogeneous lake Constance using k–e closure. Aquatic Science 60,266–277.
Hadjitheodorou, C., Antonopoulos, I., 1989. Investigation and analysis ofstability and mechanical behaviour of the coastal zone in the area of Rion-
Antirion., Final Report, Dept. of Civil Engineering. University of Patras, Patras,Greece.
Hadjitheodorou, C., Antonopoulos, J., Lascaratos, A., Papageorgiou, E, Papageorgiou,K., Trova, E., 1992. Investigation of the sea currents in the area of Rio-Antiriofor the bridging project. Final Report, Ministry of Environment, PhysicalPlaning and Public Works-Directorate D1. University of Patras, Dept. Of CivilEngineering.
Henderson, F.M., 1966. Open Channel Flow. Macmillan Publishing Co., Inc., NewYork, p. 522.
Horsch, G.M., 1940. Tidal phenomena at Euripus. Bulletin of the Hellenic MilitaryGeographical Service 6(1), 27–37.
Ilias, D.I., 1973. Monthly bulletin of the Laboratory of Atmospheric Physics.University of Patras, Patras, Greece.
Ilias, D.I., 1978. Some meteorological and climatological data from the area of thecrossing. In: K. Goudas (Ed.), The Rion-Antirion crossing, Patras, Greece.
Imray, I., 2004. Greece: G13 Gulfs of Patras and Corinth. Imray Nautical Charts,Books and Software. Imray Laurie Norie & Wilson Ltd, England.
Kalpaxis, D.L., Theos, C., Xaplanteri, M.A., Dinos, G.P., Catsiki, A.V., Leotsinidis, M.,2004. Biomonitoring of Gulf of Patras, N. Peloponnesus, Greece. Application ofa biomarker suite including evaluation of translation efficiency in Mytilusgalloprovincialis cells. Environmental Research 94, 211–220.
Karapiperis, L., 1974. Distribution of precipitation in Greece. Bulletin of theGeological Society Greece ix, 1–27 (in Greek).
Koutitas, C.G., 1988. Mathematical models in coastal engineering, Pentech Press,pp 156.
Koutsodendris, A., Papatheodorou, G., Kougiourouki, O., Georgiadis, M., 2008.Benthic marine litter in four Gulfs in Greece, Eastern Mediterranean;abundance, composition and source identification, Estuarine, Coastal andShelf Science 77, 501–512.
Lascaratos, A., Salusti, E., Papageorgaki, G., 1989. Wind-induced upwellings andcurrents in the gulfs of Patras, Nafpaktos and Korinthos, Western Greece.Oceanologica Acta 12 (3)), 159–164.
Leotsinidis, M., Sazakli, E., 2008. Evaluating contamination of dredges and disposalcriteria in Greek coastal areas. Chemosphere 72, 811–818.
Miaoulis, A.A., 1882. On the Tide of Euripos (Koromilas, ed.). Athens, 28pp (inGreek).
Papailiou, D.D., 1982. Oceanographical study in Patras Gulf waters for pollutionmanagement, vol. II. University of Patras, Dept. of Mechanical Engineering,Patras, Greece (in Greek).
Piper, D.J.W., Panagos, A.G., Kontopoulos, N., Spiliotopoulou, M., 1982. Coastalprocesses and morphology, Gulf of Patras, Greece. Zeitschrift fuer Geomor-phologie N. F. 26 (3)), 365–374.
Pytharopoulou, S., Sazakli, E., Grintzalis, K., Georgiou, C.D., Leotsinidis, M., Kalpaxis,D.L., 2008. Translational responses of Mytilus galloprovincialis to environmentalpollution: integrating the responses to oxidative stress and the biomarkerresponses into a general stress index. Aquatic Toxicology 89, 18–27.
Stefatos, A., Charalampakis, M., Papatheodorou, G., Ferentinos, G., 1999. Marinedebris on the seafloor of the Mediterranean Sea: examples from two enclosedGulfs in Western Greece. Marine Pollution Bulletin 36 (5)), 389–393.
Therianos, A.D., 1974. The geographical distribution of river water supply inGreece. Bulletin of the Geological Society Greece xi, 28–58 (in Greek).
Thompson, J.M.T., Stewart, H.B., 1986. Nonlinear Dynamics and Chaos. John Wileyand Sons Ltd, p. 376.
Throckmorton, P., Edgerton, H.E., Yalouris, E., 1973. The Battle of Lepanto searchand survey mission (Greece), 1971–72. The International Journal of NauticalArchaeology and Underwater Exploration 2.1, 121–130.
Tsimplis, M.N., 1997. Tides and sea-level variability at the Strait of Euripus.Estuarine, Coastal and Shelf Science 44, 91–101.