Adsorption of Glimepiride on Activated Charcoal and Iraqi Kaolin from Aqueous Solution
Upload
khangminh22Category
view
0download
0
University of Tennessee, Knoxville University of Tennessee, Knoxville
TRACE: Tennessee Research and Creative TRACE: Tennessee Research and Creative
Exchange Exchange
Doctoral Dissertations Graduate School
5-2004
Three-Dimensional Mechanical Behavior of Kaolin Clay with Three-Dimensional Mechanical Behavior of Kaolin Clay with
Controlled Microfabric Using True Triaxial Testing Controlled Microfabric Using True Triaxial Testing
Amit Prashant University of Tennessee - Knoxville
Follow this and additional works at: https://trace.tennessee.edu/utk_graddiss
Part of the Civil and Environmental Engineering Commons
Recommended Citation Recommended Citation Prashant, Amit, "Three-Dimensional Mechanical Behavior of Kaolin Clay with Controlled Microfabric Using True Triaxial Testing. " PhD diss., University of Tennessee, 2004. https://trace.tennessee.edu/utk_graddiss/3013
This Dissertation is brought to you for free and open access by the Graduate School at TRACE: Tennessee Research and Creative Exchange. It has been accepted for inclusion in Doctoral Dissertations by an authorized administrator of TRACE: Tennessee Research and Creative Exchange. For more information, please contact [email protected].
To the Graduate Council:
I am submitting herewith a dissertation written by Amit Prashant entitled "Three-Dimensional
Mechanical Behavior of Kaolin Clay with Controlled Microfabric Using True Triaxial Testing." I
have examined the final electronic copy of this dissertation for form and content and
recommend that it be accepted in partial fulfillment of the requirements for the degree of Doctor
of Philosophy, with a major in Civil Engineering.
Dayakar Penumadau, Major Professor
We have read this dissertation and recommend its acceptance:
Eric C. Drumm, Edwin G. Brudette, Christopher D. Pionke, Y. Jack Weitsman
Accepted for the Council:
Carolyn R. Hodges
Vice Provost and Dean of the Graduate School
(Original signatures are on file with official student records.)
To the Graduate Council:
I am submitting herewith a dissertation written by Amit Prashant entitled "Three
Dimensional Mechanical Behavior of Kaolin Clay with Controlled Micro fabric Using
True Triaxial Testing ... I have examined the final paper copy of this dissertation for
form and content and recommend that it be accepted in partial fulfillment of the
requirements for the degree of Doctor of Philosophy, with a major in Civil
Engineering.
We have read this dissertation
and recommend its acceptance:
Dr. Eric C. Drumm
e--�JL� GJ.�
Dr. Dayakar Penumadu, Major Professor
Dr. Edwin G. B"£ 1... 0 €::::
Dr. Chifstopher D. Pionke
Dr. Y. Jack Weitsman
Accepted for the Council:
Graduate Studies
' . · ·
THREE-DIMENSIONAL MECHANICAL BEHAVIOR OF
KAOLIN CLAY WITH CONTROLLED MICROFABRIC
USING TRUE TRIAXIAL TESTING
A Dissertation Presented for the
Doctor of Philosophy
Degree
The University of Tennessee, Knoxville
Amit Prashant
May2004

Copyright© 2004 by Amit Prashant
All rights reserved
--
11
Acknowledgements
I wish to express my sincere gratitude to all those who contributed in the
successful completion of this research. I gratefully acknowledge the financial support
provided by the National Science Foundation.
I am indebted to my research advisor, Dr. Dayakar Penumadu, for offering me the
opportunity to be a part of his excellent research group, encouraging me throughout this
study, giving me the flexibility in my research, and even providing help in my daily life.
I would also like to thank the other members of my committee, Dr. Edwin G.
Burdette, Dr. Eric Drumm, Dr, Chris Pionke, and Dr. Jack Y. Weitsman, for giving me a
chance to have their valuable inputs in my dissertation.
I extend my sincere thanks to my friends and colleagues, Doug Mandeville, Greg
Goyette, Kelly Clawson, Dr. Rangda Zhao, Mr. Tedd Ritzko,Han Lin, Amal Dutta, Xin
Chen, Alex Devis-Smith, Michael Parham, Mr. Ken Thomas for their help and
friendship.
My parents, Dr. S. S. Kanaujia and Artika Kanaujia, and my sisters, Alpana
Singh, Archana Singh, Apama Singh, deserve special recognition for encouraging my
education over the years. Their love and faith in me brought me to this point.
I would like to dedicate this thesis to my wife, Ajanta Sachan, for her love and
moral support, and to my little angel Ishika Prashant for bringing new colors in my life.
lll
Abstract
Clays in their natural state are mostly anisotropic because of their modes of
deposition. Many boundary value problems in geotechnical engineering involve soil
elements that are subjected to stress paths with varying relative magnitudes and
orientation of principal stresses. In clay, these soil elements may also have different
orientations of its microfabric. It is a well-known fact that the variation in relative
magnitudes and orientation of principal stresses and the microfabric of clay have
significant effect on the stress-strain, pore pressure and shear strength behavior of clay. In
order to study this behavior of clay from a normally consolidated to heavily over
consolidated state, a series of strain controlled true triaxial undrained tests with constant
intermediate principal stress ratio (b-value) are performed on cubical specimens of
Kaolin clay with controlled microfabric. The true triaxial device used in the present
research has flexible boundaries and uses three-axis electro-pneumatic Proportional
Integral-Derivative (PID) based real-time feedback control. A custom developed
software that can automatically saturate, consolidate and apply shear stresses along
predetermined stress or strain paths is also developed for this study. The cubical
specimens are prepared in the laboratory with two distinct microfabric of Kaolin clay;
flocculated and dispersed.
A comprehensive analysis of the observed three-dimensional behavior of clay is
presented in this dissertation with its emphasis on the following factors; the effect of
relative magnitudes and orientation of principal stresses, the influence of consolidation
history and its role in the anisotropy of clay, and the effect of change in soil's microfabric
IV
on its mechanical response. Strain localization issues are discussed in light of the
experimental observations. A method for determining the onset of localization is
proposed, which is eventually used in the identification of failure state of stress and
strain. The effect of change in the test boundary conditions and specimen shape on the
observed mechanical response of clay is evaluated by comparing the results obtained
from true triaxial tests using cubical specimens, conventional triaxial tests using
cylindrical specimens, and combined axial-torsional tests using hollow cylinder
specimens. Two well-recognized constitutive models (modified cam clay model and
single hardening model) are evaluated for the present true triaxial test data, and
limitations in predicting various aspects of soil behavior within reasonable accuracy are
identified. Based on the experimental observations and the past theories on the
normalized behavior of clays, a dynamic failure surface as a function of stress state and
the pre-consolidation history is proposed. Formulation of a new rate independent elasto
plasticity model is presented, which is based on the normalized clay behavior observed in
this study. Validation of the proposed model from this study shows significant potential
for predicting the three-dimensional mechanical response of clay.
v
Table of Contents
Chapter Page
1. Introduction . . . . . . . . . . . . . . . . . . . . . . . . . . . . . . . . . . . . . . . . . . . . . . . . . . . . . . . . . . . . . . . . . . .. 1
2. Description of True Triaxial Device and Specimen P reparation
Procedure....................................................................... 8
Introduction . . . . . . . . . . . . . . . . . . . . . . . . . . . . . . . . . . . . . . . . . . . . . . . . . . . . . . . . . . . . . . . . . . .. .. 8
True Triaxial Testing System- Hardware . . . .. .. . .. .. . .. .. .. .. . .. .. .. . .. .. . 10
True Triaxial Testing System- Software . . . . . . . . . . . . . . . . . . . . . . . . . . . . . . . . . . . . . 1 6
Membrane Compliance in Strain Calculation . . . . . . . . . . . . . . . . . . . . . . . . . . . . . . 22
Preparing Remolded Cubical Specimens of Kaolin Clay . . . . . . . . . . . . . . . . . 23
Assembly and Saturation . . . . . . . . . . . . . . . . . . . . . . . . . . . . . . . . .... . . . . . . . . . . . . . . . . . . . 28
Summary . . . . . . . . . . . . . . . . . . . . . . . . . . . . . . . . . . . . . . . . . . . . . . . . . . . . . . . . . . . . . . .. . . . . . . . . . 32
3. Three-Dimensional Behavior of Normally Consolidated Kaolin
Clay................................................................................. 33
Abstract . . . . . . . . . . . . . . . . . . . . . . . . . . . . . . . . . . . . . . . . . . . . . . . . . . . . . . . . . . . . . . . . . ........ ... 33
Introduction . . . . . . . . .. . .. . . . . .. .. . . .. . .. . .. . . . .. . .. .. .. . . . .. . .. .. .. . . . . . .. . . . . ... . 34
Specimens for Testing . . . . . . . . . . . . .. . . . . . . . . . . . . . . . . . . . . . . . . . . . . . . . . . . . . . . . . . . . 3 7
Test Systems and Testing Procedures . . . . . . . . . . . . . . . . . . . . . . . . . . . . . . . . . . . . . . . 38
True Triaxial System . . . . . . . . . . . . . . . . . . . . . . . . . . . . . . . . . . . . . . . . . . . . . . . . . . . .. . 38
Lubricated end Triaxial and Axial-Torsional Test Setup . . . . . . . . . . . . 39
Isotropic Consolidation . . . . . . . . . . . . . . . . . . . . . . . . . . . . . . . . . . . . . . . . . . . . . . . . . . . . . ... 42
Results from True Triaxial Tests on Cubical Specimens . . . . . . . . . . . . . . . ... 43
Vl
Stress-Strain and Pore Pressure Behavior . . . . . . . . . . . . . . . . . . . . . . . . . . . . . . 44
Failure Conditions . . . . . . . . . . . . . . . . . . . . . . . . . . . . . . . . . . . . . . . . . . . . . . . . . . . . . . . . . 49
Observations from Three Different Laboratory Shear Testing Methods 55
Conclusions . . . . . . . . . . . . . . . . . . . . . . . . . . . . . . . . . . . . . . . . . . . . . . . . . . . . . . . . . . . . . . . . . . . . . . 61
4. Effect of Intermediate Principal Stress on Overconsolidated Kaolin
C lay................................................................................. 64
Abstract . . . . . . . . . . . . . . . . . . . . . . . . . . . . . . . . . . . . . . . . . . . . . . . . . . . . . . . . . . . . . . . . . . . . . . . . . : . . 64
Introduction .. . . . . . . .. . . . . . . . . . . . . . . . . . . . . . . . . . . . . . . . . . . . . . . . . . . . . . . . . . . . . . . . . . . . . 65
Previous Investigations . . . . . . . . . . . . . . . . . . . . . . . . . . . . . . . . . . . . . . . . . . . . . . . . . . . . . . . . 66
True Triaxial Testing . . . . . . . . . . . . . . . . . . . . . . . . . . . . . . . . . . . . . . . . . . . . . . . . . . . . . . . . . .. 69
PID Feedback Control during Overconsolidated Clay Testing . . . . . . . . . . . 72
Stress-Strain and Pore Pressure Behavior .. . . . . . . . . . . . . . . . . . . . . . . . . . . . . . . . . 76
Yield Behavior . . . . . . . . . . . . . . . . . . . . . . . . . . . . . . . . . . . . . . . . . . . . . . . . . . . . . . . . . . . . . . . . .. 78
Failure Criteria .. . . . . . . . . . . . . . . . . . . . . . . . . . . . . . . . . . . . . . . . . . . . . . . . . . . . . . . . . . . . . . . . . 8 1
Strain Analysis and Localization Phenomenon . . . . . . . . . . . . . . . . . . . . . . . . . . . . . 85
Bifurcation and Undrained Instability . . . . . . . . . . . . . . . . . . . . . . . . . . . . . . . . . . 85
Sum of Principal Strains . . . . . . . . . . . . . . . . . . . . . . . . . . . . . . . . . . . . . . . . . . . . . . . . . 87
Localization with Shear Band Formation . . . . . . . . . . . . . . . . . . . . . . . . . . . . . . 92
Variation of Principal Strains and Strain Rates .. . . . . . . . . . . . . . . . . . . . . . 93
Conclusions . . . . . . . . . . . . . . . . . . . . . . . . . . . . . . . . . . . . . . . . . . . . . . . . . . . . . . . . . . . . . . . . . .. ... 97
5. Development of Suitable Three-Dimensional Y ield and Failure
Surfaces from Ex perimental Data . . . . . . . . . . . . . . . . . . . . . . . . . . . . . . . . . . . . . . . .. 99
Abstract . . . . . . . . . . . . . . . . . . . . . . . . . . . . . . . . . . . . . . . . . . . . . . . . . . . . . . . . . . . . . . . . . . .. ... . . . .. 99
Vll

Introduction . . . . . . . . . . . . . . . . . . . . . . . . . . . . . . . . . . . . . . . . . . . . . . . . . . . . . . . . . . . . . . . . . . . . . . 1 00
Consolidation Behavior of Clay . . . . . . . . . . . . . . . . . . . . . . . . . . . . . . . . . . . . . . . . . . . . . . I 02
Shear Failure and Localization . . . . . . . . . . . . . . . . . . . . . . . . . . . . . . . . . . . . . . . . . . . . . . . . 1 05
Undrained Shear Behavior from Triaxial Compression Tests at
Different 'OCR' Values . . . . . . . . . . . . . . . . . . . . . . . . . . . . . . . . . . . . . . . . . . . . . . . . . . . . . . . 1 06
Influence of Intermediate Principal Stress . . . . . . . . . . . . . . . . . . . . . . . . . . . . . . . . . . 1 1 3
Shear Strength of Clay . . . . . . . . . . . . . . . . . . . . . . . . . . . . . . . . . . . . . . . . . . . . . . . . . . . . . . . . . 1 1 5
Failure surface in triaxial plane . . . . . . . . . . . . . . . . . . . . . . . . . . . . . . . . . . . . . . . . . . 1 1 7
Failure surface in deviatoric plane . . . . . . . . . . . . . . . . . . . . . . . . . . . . . . . . . . . . . . 1 2 1
Conclusions . . . . . . . . . . . . . . . . . . . . . . . . . . . . . . . . . . . . . . . . . . . . . . . . . . . . . . . . . . . . . . . . . . . . . . 1 23
6. Eff ect of Microfabric on the Three-Dimensional Behavior of
Kaolin Clay . . . . . . . . . . . . . . . . . . . . . . . . . . . . . . . . . . . . . . . . . . . . . . . . . . . . . . . . . . . . . . . . . . . . . 1 26
Abstract . . . . . . . . . . . . . . . . . . . . . . . . . . . . . . . . . . . . . . . . . . . . . . . . . . . . . . . . . . . . . . . . . . . . . . . . . . . . 1 26
Introduction . . . . . . . . . . . . . . . . . . . . . . . . . . . . . . . . . . . . . . . . . . . . . . . . . . . . . . . . . . . . . . . . . . . . . . 1 27
Obtaining Pre-conceived Micro fabric of Clay in Laboratory . . . . . . . . . . . . . . 130
Preparing Cubical Specimens . . . . . . . . . . . . . . . . . . . . . . . . . . . . . . . . . . . . . . . . . . . . . . . . . 1 33
Consolidation Behavior for Flocculated and Dispersed Microfabric . . . . 1 35
Experimental Observation from True Triaxial Tests . . . . . . . . . . . . . . . . . . . . . . . 142
Stress-Strain Relationship and Shear Failure . . . . . . . . . . . . . . . . . . . . . . . . . . 144
Evolution of Excess Pore Pressure and Stress Paths in q-p' Space 149
Strength and Pore Pressure Parameters . . . . . . . . . . . . . . . . . . . . . . . . . . . . . . . . . 1 54
Failure Surface and Plastic Strain Increment Vectors in Deviatoric
Plane . . . . . . . . . . . . . . . . . . . . . . . . . . . . . . . . . . . . . . . . . . . . . . . . . . . . . . . . . . . . . . . . . . . . . . . . . . . 1 56
Conclusions . . . . . . . . . . . . . . . . . . . . . . . . . . . . . . . . . . . . . . . . . . . . . . . . . . . . . . . . . . . . . . . . . . . . . . . 1 58
viii
7. Evaluation of Existing Constitutive Mod els for Cohesive Soil:
Review, Formulation, and Predictions . . . . . . . . . . . . . . . . . . . . . . . . . . . . . . . . . 1 60
Introduction . . . . . . . . . . . . . . . . . . . . . . . . . . . . . . . . . . . . . . . . . . . . . . . . . . . . . . . . . . . . . . . . . . . . . . . 1 60
Elasto -Plasticity Theory . . . . . . . . . . . . . . . . . . . . . . . . . . . . . . . . . . . . . . . . . . . . . . . . . . . . . . . . 1 6 1
Three-Dimensional Stress Space . . . . . . . . . . . . . . . . . . . . . . . . . . . . . . . . . . . . . . . . . . . . . . 164
Summery of Constitutive Theories Proposed to Describe Soil Behavior 164
Modified Cam-Clay Model . . . . . . . . . . . . . . . . . . . . . . . . . . . . . . . . . . . . . . . . . . . . . . . . . . . . 1 68
Modified Cam Clay Model Predictions for Kaolin Clay . . . . . . . . . . . . . 1 7 1
Critical State Concept and Failure Criteria . . . . . . . . . . . . . . . . . . . . . . . . . . . . . 1 77
Single Hardening Model . . . . . . . . . . . . . . . . . . . . . . . . . . . . . . . . . . . . . . . . . . . . . . . . . . . . . . . 1 78
Determination of Single Hardening Model Parameters for Kaolin
Clay . . . . . . . . . . . . . . . . . . . . . . . . . . . . . . . . . . . . . . . . . . . . . . . . . . . . . . . . . . . . . . . . . . . . . . . . . . . . 1 79
Computing Hardening Parameter from Plastic Work . . . . . . . . . . . . . . . . . 1 87
Single Hardening Model Predictions for Kaolin Clay . . . . . . . . . . . . . . . . 1 89
Conclusions . . . . . . . . . . . . . . . . . . . . . . . . . . . . . . . . . . . . . . . . . . . . . . . . . . . . . . . . . . . . . . . . . . . . . . . 194
8. A N ew Unified Elasto-Plastic Three-Dimensional Constitutive
Model for Cohesive Soil . . . . . . . . . . . . . . . . . . . . . . . . . . . . . . . . . . . . . . . . . . . . . . . . . . . . . . . 198
Introduction . . . . . . . . . . . . . . . . . . . . . . . . . . . . . . . . . . . . . . . . . . . . . . . . . . . . . . . . . . . . . . . . . . . . . . . 1 98
Framework of the Proposed Model in Triaxial Compression Plane . . . . . . 200
Determination of Parameters for Kaolin Clay . . . . . . . . . . . . . . . . . . . . . . . . . . . . . . . 2 1 0
Model Prediction for Kaolin Clay . . . . . . . . . . . . . . . . . . . . . . . . . . . . . . . . . . . . . . . . . . . . . 2 1 5
Extension of the Proposed Model i n Deviatoric Plane . . . . . . . . . . . . . . . . . . . . . 2 19
Influence oflntermediate Principal Stress . . . . . . . . . . . . . . . . . . . . . . . . . . . . . 220
lX
Model Predictions for Constant b -value True Triaxial Tests
(o = 0°) . . . . . . . . . . . . . . . . . . . . . . . . . . . . . . . . . . . . . . . . . . . . . . . . . . . . . . . . . . . . . . . . . ...... 222
Influence of Principal Stress Rotation . . . . . . . . . . . . . . . . . . . . . . . . . . . . . . . . . . 222
Model Predictions for extension tests (o = 90°) . . . . . . . . . . . . . . . . . . . . . .. 226
Conclusions . .. . . .. .. .. . .. .. .. .. .. . .. .. . .. .. .. . .. . .. . .. .. . .. . . .. .. . .. .. .. .. .. . ..... 227
9. Conclusions and Recommendations . . . . . . . . . . . . . . . . . . . . . . . . . . . . . . . . . . . . . . . 229
Summary and Conclusions . . . . . . . . . . . . . . . . . . . . . . . . . . . . . . . . . . . . . . . . . . . . . . . . . . . .. 229
Recommendations for Future Research .. .. . .. . . .. . .. . .. .. .. .. .. .. .. . .. .. .. ... 232
List of References . . . . . .. . . . . . . . . . . . . . . . . . . . . . . . . . . . . . . . . . . . . . . . . . . . . . . . . . . . . ... 23 7
App endices . . .. . .. . .. . .. . .. .. .. .. .. . .. . .. . . .. .. .. . .. .. . .. . .. .. .. .. .. . . . .. .. .. .. .. 252
Appendix 1 : Stress Invariants . . . . . . . . . . . . . . . . . . . . . . . . . . . . . . . . . . . . . . . . . . . . . . . . . 253
Appendix 2: Modified Cam- Clay Model: Formulation in Principal
Stress Space . . . . . . . . . . . . . . . . . . . . . . . . . . . . . . . . . . . . . . . . . . . . . . . . . . . . . . 255
Appendix 3: Single Hardening Model Formulation . . . . . . . . . . . . . . . . . . . . . . . 257
Appendix 4: Relationship between Third Invariant of Stress Tensor
and Shear Stress Ratio . . .. . .. . .. . .. .. . .. . .. .. .. .. .. .. .. .. .. . .... 26 1
Appendix -5 Procedure for Pro jecting Principal Stress State onto an
Octahedral /Deviatoric Plane . . . . . . . . . . . . . . . . . . . . . . . . . . . . . . . . . . 264
Vita................................................................................ 268
X
List of Tables
T able Page
3 . 1 Properties of Kaolin Clay . . . . . . . . . . . . . . . . . . . . . . . . . . . . . . . . . . . . . . . . . . . . . . . . . . . . . . 37
3 .2 Tests Performed on Normally Consolidated Specimens of Kaolin Clay 45
3 .3 Strength Behavior Observed in Three Testing Methods . . . . . . . . . . . . . . . . . 58
4. 1 Summary on the In fluence of Intermediate Principal Stress from Prior
Research . . . . . . . . . . . . . . . . . . . . . . . . . . . . . . . . . . . . . . . . . . . . . . . . . . . . . . . . . . . . . . . . . . . . . . . . . . . . 70
4.2 Mean Effective Stress Values at Failure .. . . . . . . . . . . . . . . . . . . . . . . . . . . . . . . . . . . . . 8 1
6. 1 Summary of Tests . . . . . . . . . . . . . . . . . . . . . . . . . . . . . . . . . . . . . . . . . . . . . . . . . . . . . . . . . . . . . . . 143
7. 1 Summary of Constitutive Models for Soil . . . . . . . . . . . . . . . . . . . . . . . . . . . . . . . . . . . . 166
7.2 Calculation of Yield Parameter h . . . . . . . . . . . . . . . . . . . . . . . . . . . . . . . . . . . . . . . . . . . . . 1 86
7.3 Single Hardening Model Parameters for Kaolin Clay . . . . . . . . . . . . . . . . . . . . . . 190
8. 1 Model parameters for Kaolin Clay . . . . . . . . . . . . . . . . . . . . . . . . . . . . . . . . . . . . . . . . . . . . 2 14
XI

List of Figures
Figure P age
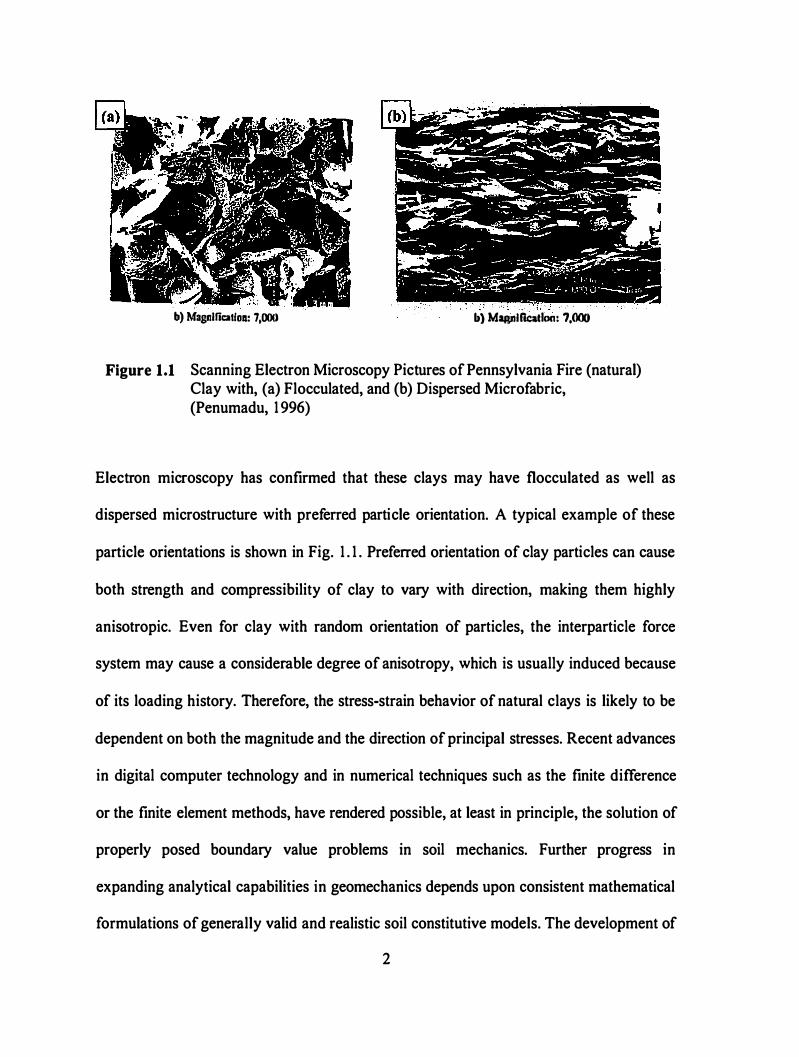
1 . 1 Scanning Electron Microscopy Pictures of Pennsylvania Fire (natural)
Clay with, (a) Flocculated, and (b) Dispersed Microfabric,
(Penumadu, 1 996) . . . . . . . . . ..................................................................... 2
1 .2 Orientation of Principal Stress during True Triaxial Testing
(Direction of Soil Deposition or Axis of Cross-anisotropy along
z-axis) . . . . . . . . . . . . . . . . . . . . . . . . . . . . . . . . . . . . . . . . . . . . . . . . . . . . . . . . . . . . . . . . . . . . . . . . . . . . 5
2. 1 Configuration of the True Triaxial Device . . . . . . . . . . . . . . . . . . . . . . . . . . . . . . . . . 1 1
2.2 True Triaxial Device . . . . . . . . . . . . . . . . . . . . . . . . . . . . . . . . . . . . . . . . . . . . . . . . . . . . . . . . . 1 1
2.3 Closeup Views o f, (a) Space Frame, (b) Flexible Membranes, (c)
Pressure Housing, and (d) Assembled Setup. . . . . . . . . . . . . . . . . . . .. . . . . .. . ... . . 12
2.4 Mold and Membrane used in Test Setup . . . . . . . . . . . . . . . . . . . . . . . . . . . . . . . . . . . . 1 5
2.5 Overview ofthe PID Control Loop . . . . . . . . . . . . . . . . . . . . . . . . . . . . . . . . . . . . . . . . . . 1 8
2.6 Logic Used in PID Control Setup . . . . . . . . . . . . . . . . . . . . . . . . . . . . . . . . . . . . . . . . . . . . 20
2.7 Membrane Compliance Tests, (a) crz and crx = cry = constant, and
(b) crz = cry and crx = constant . . . . . . . . . . . . . . . . . . . . . . . . . . . . . . . . . . . . . . . . . . . . . . . . . . 24
2.8 Consolidometer used for Specimen Preparation, (a) Consolidometer,
(b) Prepared Specimen ( 4 inch cube), and (c) Dimensions of Cubical
Specimen . . . . . . . . . . . . . . . . . . . . . . . . . . . . . . . . . . . . . . . . . . . . . . . . . . . . . . . . . . . . . . . . . . . . . . . . 25
2.9 Water Content Analysis at the End of Slurry Consolidation
(From Mandville and Penumadu, 2003) . . . . . . . . . . . . . . . . . . . . . . . . . . . . . . . . . . . . 27
2. 1 0 Assembling the Specimen in True Triaxial Device . . . . . . . . . . . . . . . . . . . . . . . . 29
3 . 1 Principal Stresses Acting on Cubical Element during Shearing . . . . . . . . . 40
Xll
3.2 Principal Stresses Acting on the Element from (a) Hollow,
(b) Solid Cylinder Specimen during Shearing . .. ..... .... ... . .. ... ... . .... 42
3.3 Isotropic Consolidation Curves for Different Specimen Shapes . . . . . . . . 43
3.4 Maximum Shear Stress, 't = ( u1 -o-3) /2 , and Excess Pore Pressure
�u Evolution with Major Principal Strain for Different b-values-
Cubical Specimen ....... .... .......... ............ ......... ...... ... ...... ..... 46
3.5 Variation of Deviatoric Stress, Pore Pressure due to Shear, and Shear
Stress Ratio with Shear Strain for Different b-values -Cubical
Specimen . . . . . . . . . . . . . . . . . . . . . . . . . . . . . . . . . . . . . . . . . . . . . . . . . . . . . . . . . . . . . . . . . . . . .... 47
3 .6 Stress Path in q-p Space for the Loadings Applied on Cubical
Specimens . . . . . . . . . . . . . . . . . . . . . . . . . . . . . . . . . . . . . . . . . . . . . . . . . . . . . . . . . . . . . . . ......... 49
3 .7 Three Dimensional Failure Surface for Kaolin Clay in Octahedral
Plane (Symbols without Test Numbers are Located by Symmetry) 51
3 .8 Angle of Internal Friction, ljl', and Shear Stress Ratio at Failure, M,
with b-values -Cubical Specimens . .. .. . . .. . .. .. . . .. . .. .. . .. . . . . . .. .. . .. ... 53
3.9 Variation Pore Pressure Parameters, Ar and ar, with b-values .. .. ... .... 56
3.10 Stress-Strain and Pore Pressure Response for Tests on Cubical, HC .
and SC Specimens (b=O and 1) . . . .. . . .. . . .. .. . .. .. .. . . . . . .. .. . .. . .. . . . . . ..... 57
3.11 Stress-Strain and Pore Pressure Response for Tests on Cubical and HC
Specimens (b=0.2 5, 0.5 and 0.75) . .. . .. .. .. .. . . . . . . . . .. . . . . .. .. .. .. . . . .. . . .. 60
4.1 Parameter Ar for Undrained Compression and Extension Test Data
[From Parry (1960)] ........... ... .............. ....... .......... ... .. ......... 67
4.2 Effect of PID Coefficients on Feedback Control, (a) Major Principal
Strain Evolution, (b) Major Principal Strain Rate . . .. .. .. ........... ....... 74
4.3 Effect of PID Control on the Observed Stress-Strain Relationship ..... 75
4.4 Stress-Strain Response for Different b-values 77
X Ill
4.5 Excess Pore-Pressure during Shearing for Different b-values . . . . . . . . . . . 79
4.6 Variation of Pore Pressure Parameter Ar with b-values . . . . . . . . . . . . . . . . . . 79
4.7 Determination of Yield Points from Strain Energy Approach . . . . . . . . . . . 80
4.8 Three Dimensional Failure Surface in Octahedral Plane . . . . . . . . . . . . . . . . . 83
4.9 Angle of Internal Friction Compared with Different Failure Criteria ... 85
4. 1 0 Sum of Principal Strains during Undrained Shear Test for Different b-
values . . . . . . . . . . . . . . . . . . . . . . . . . . . . . . . . . . . . . . . . . . . . . . . . . . . . . . . . . . . . . . . . . . . . . . . . . . . . . . . 88
4. 1 1 Deformation to Failure in Cubical Specimen, (a) Undeformed
Specimen, (b) Deformed Specimen, (c) Strain Variation at Edges and
Comers, (d) Strain Localization (Shear band), and (e) Deformation
Zones in Cubical Specimen . . . . . . . . . . . . . . . . . . . . . . . . . . . . . . . . . . . . . . . . . . . . . . . . . . . . 90
4. 1 2 Variation of Principal Strain with Time during Shear Test . . . . . . . . . . . . . . . 94
4. 1 3 Strain Rate Variation in Three Principal Directions during Shear Test
(b = 0.5, 0.75 and 1 .0) . . . . . . . . . . . . . . . . . . . . . . . . . . . . . . . . . . . . . . . . . . . . . . . . . . . . . . 95
5 . 1 Direction of Ko Consolidation for Vertical (V), and Horizontal (H)
Specimens . . . . . . . . . . . . . . . . . . . . . . . . . . . . . . . . . . . . . . . . . . . . . . . . . . . . . . . . . . . . . . . . . . . . . . . . 1 04
5.2 Consolidation Curves for Vertical (V) and Horizontal (H) Specimens
5.3 Shear Stress-Strain Behavior from Undrained Compression Tests
1 04
(b=O) at Various OCR Values . . . . . . . . . . . . . . . . . . . . . . . . . . . . . . . . . . . . . . . . . . . . . . . . 1 07
5.4 Effective Stress Path for Undrained Compression Tests (b=O) at
Various OCR Values . . . . . . . . . . . . . . . . . . . . . . . . . . . . . . . . . . . . . . . . . . . . . . . . . . . . . . . . . . . 1 08
5.5 Excess Pore Pressure (a) Total, and (b) Part due to Shear for
Undrained Compression Tests (b=O) at Various OCR Values
5.6 Influence of Intermediate Principal Stress and Anisotropy on the Shear
1 1 1
Stress-Strain Behavior of Clay . . . . . . . . . . . . . . . . . . . . . . . . . . . . . . . . . . . . . . . . . . . . . . . 1 12
5.7 Variation of Normalized Undrained Strength with OCR 1 17
XIV
5 .8 Isotropic Consolidation Cu rve for a T ypical Cla y . . .. .. ... . . .. .. . .. .. .. .. 118 5.9 Failure Sur face in Normalized q-p' Plane . .. . . . . . . . . . . . . . .. . . . . . . . . . . . . .. . . 1 20
5. 1 0 Failure Surface in De viatoric Plane .. . . . . . . . . . . . . . . . . . . . . . . . . . . . . . . . . . . . . . . . . 1 22
6. 1 Mineral Structure o f Kaolin Cla y . . . . . . . . . . . . . . . . . . . . . . . . . . . . . . . . . . . . . . . . . . . . 1 32
6.2 Ionic Distribution on Kaolin Cla y Platelet in Aqueous Medium . . . . . . . . 1 32
6.3 Arran gement of Particles or Pa rticle Groups for Flocculated and
Dispersed Micro fabric .. . . . . . . . . . . . . . . . . . . . . . . . . . . . . . . . . . . . . . . . . . . . . . . . . . . . . . . . 1 32
6.4 SEM Pictures of Cla y for (a ) Flocculated , and (b ) Dispersed
Microfab ric . . . . . . . . . . . . . . . . . . . . . . . . . . . . . . . . . . . . . . . . . . . . . . . . . . . . . . . . . . . . . . . . . . . . . 1 35
6.5 Consolidation Beha vior f rom CR S Tests . . . . . . . . . . . . . . . . . . . . . . . . . . . . . . . . . . . 1 37
6.6 Isotropic Consolidation Cur ves for Flocculated and Dispersed
Microfabric, (a ) Void Ratio , (b ) Volumetric Strain . .. . . . . . . . .. .. . . . . . . . . . 1 39
6.7 Individual Normal Strains alon g the Three Axes of Cubical Specimen
durin g Isotropic Consolidation Cur ves for Flocculated and Dispersed
Micro fabric . . . . . . . . . . . . . . . . . . . . . . . . . . . . . . . . . . . . . . . . . . . . . . . . . . . . . . . . . . . . . . . . . . . . . . 1 4 1
6.8 Shear Stress- Strain Relationship for N C Cla y . . . . . . . . . . . . . . . . . . . . . . . . . . . . . 146
6.9 Shear Stress and Strain at Fail ure: (a ) Shear Strain at Failure ,
(b ) Undrained Shear Stren gth . . . . . . . . . . . . . . . . . . . . . . . . . . . . . . . . . . . . . . . . . . . . . . . . 1 47
6. 1 0 Shear Stress- Strain Relationship for OC Cla y . . . . . . . . . . . . . . . . . . . . . . . . . . . . . 148
6 . 1 1 Excess Pore Pressure E volution for N C Cla y 1 5 1
6. 1 2 Excess Pore Press ure Evolution for OC Cla y . .. . . . . . . . . . . . . . . . . . . . . . . . . . . . 1 52
6. 1 3 Effecti ve Stress Paths for N C and OC Cla y . . . . . . . . . . . . . . . . . . . . . . . . . . . . . . . . 1 53
6. 14 Stren gth Parameters , (a ) Effecti ve F riction An gle, Shear Stress Ratio ,
(b ) Pore Pressure Parameters , A r and a r . . . . . . . . . . . . . . . . . . . . . . . . . . . . . . . .. . . . 1 55
6. 1 5 Failure Su rface and Strain Increment Vectors in De viatoric Plane 1 57
7. 1 Triaxial and De viato ric Plane in Three-Dimensional Stress Space 164
XV
7.2 Stable State Boundary Surface in p' -q -v Space . . . . . . . . . . . . . . . . . . . . . . . . . . . . 1 69
7.3 Yield Surface and CS L in q-p' Plane . . . . . . . . . . . . . . . . . . . . . . . . . . . . . . . . . . . . . . . . 1 69
7.4 N CL, UR L, and CS L in Compression Plane . . . . . . . . . . . . . . . . . . . . . . . . . . . . . . . 1 70
7.5 M CC Predictions and Experimental Data from True T riaxial
Undrained Tests on N C Kaolin Clay (b=O , 0.5 . 1 ) . . . . . . . . . . . . . . . . . . . . . . . . 1 73
7.6 M CC Predictions and Experimental Data from True Triaxial
Undrained Compression Tests ( b=O) on O C Kaolin Clay . . . . . . . . . . . . . . . . 1 75
7.7 Stress Paths in q-p ' Plane: M CC Predictions and Experimental Data
from True Triaxial Undrained Compression Tests (b=O) on Kaolin
Clay ............ ........................ ...... . ......... .......................... 1 76
7.8 Determination of Elastic Parameters for SH Model . . . . . . . . . . . . . . . . . . . . . . . 1 8 1
7.9 Determination of Parameters for Failure Criterion for SH Model . . . . . . 1 8 1
7 . 1 0 Dete rmination of Plastic Potential Function Parameters from Three
Traditional Triaxial Tests . . . . . . . . . . . . . . . . . . . . . . . . . . . . . . . . . . . . . . . . . . . . . . . . . . . . . 1 83
7. 1 1 Determination of Hardenin g Parameters from Isotropic Consolidation
Test . (a) Plastic Wor k Computation . (b) Hardenin g Parameters . . . . . . . . . 1 85
7 . 1 2 Determination of Yield Function Parameter ex from Three Traditional
Triaxial Tests . . . . . . . . . . . . . . . . . . . . . . . . . . . . . . . . . . . . . . . . . . . . . . . . . . . . . . . . . . . . . . . . . . . . 1 87
7 . 1 3 Determination of Hardenin g Parameters From Isotropic Consolidation
Test usin g Incremental Plastic Work Method . . . . . . . . . . . . . . . . . . . . . . . . . . . . . . 1 89
7 . 14 Sin gle Hardenin g Model Predictions and Experimental Data from
True Triaxial Undrained Tests on N C Kaolin Clay . . . . . . . . . . . . . . . . . . . . . . . 1 9 1
7. 1 5 Sin gle Hardenin g Model Predictions and Experimenta l Data from
True Triaxial Undrained Compression Tests ( b=O) on O C Kaolin Clay
(O CR=l.5 and 2.0) . . . . . . . . . . . . . . . . . . . . . . . . . . . . . . . . . . . . . . . . . . . . . . . . . . . . . . . . . . . . 1 95
XVl
7. 1 6 Stress Paths in q-p' Plane: Single Hardening Model Predictions and
Experimental Data from True Triaxial Undrained Compression Tests
(b=O) on Kaolin Clay . . . . . . . . . . . . . . . . . . . . . . . . . . . . . . . . . . . . . . . . . . . . . . . . . . . . . . . . . . 1 96
8. 1 Shape ofYield Surface in q-p' Stress Space, (a) Growth of Yield
Surface with Change in Consolidation History Po', and (b) Growth of
Yield Surface with Change in State Variable L. . . . . . . . . . . . . . . . . . . . . . . . . . . 202
8.2 Typical Shapes of Yield Surface, Failure Surface, and Reference
Surface in q-p' Stress Space . . . . . . . . . . . . . . . . . . . . . . . . . . . . . . . . . . . . . . . . . . . . . . . . . . 204
8.3 Components of Stress State Mapping Function � . . . . . . . . . . . . . . . . . . . . . . . . . 206
8 .4 Derivatives of Plastic Potential with respect to (a) Mean Effective
Stress p', and (b) Deviatoric Stress q . . . . . . . . . . . . . . . . . . . . . . . . . . . . . . . . . . . . . . . . 207
8.5 Determination of Hardening Parameter nL, and Initial L Value (L 0) • • • 2 13
8.6 Determination of Plastic Potential Parameter ng . . . . . . . . . . . . . . . . . . . . . . . . . . . 2 14
8. 7 Proposed Model Predictions and Experimental Data from True
Triaxial Undrained Compression Tests (b=O) on O C Kaolin Clay 2 16
8.8 Stress Paths in q-p' Plane: Proposed Model Predictions and
Experimental Data from True Triaxial Undrained Compression Tests
(b=O) on Kaolin Clay . . . . . . . . . . . . . . . . . . . . . . . . . . . . . . . . . . . . . . . . . . . . . . . . . . . . . . . . . . 2 1 8
8.9 Constraining Failure surface to Positive Effective Stress Quadrant of
Three-Dimensional Stress Space , (Triaxial Compression Plane) 22 1
8. 1 0 Proposed Model Predictions and Experimental Data from T rue
Triaxial Undrained Tests on N C Kaolin Clay . . . . . . . . . . . . . . . . . . . . . . . . . . . .. . 223
8. 1 1 Proposed Model Predictions and Experimental Data from True
Triaxial Undrained Tests on OC Kaolin Clay (O CR = 5) . . . . . . . . . . . . . . . . 224
8. 1 2 Proposed Model Predictions and Experimental Data from True
Triaxial Undrained Tests on O C Kaolin Clay (O CR = 1 0) . . . . . . . . . . . . . . 225
xvii
8.13 Proposed Model Predictions and Experimental Data from True
Triaxial Undrained Tests on N C Kaolin clay (b=l , o=90°) ........ . . . . . . 227
A4. 1 Lode Angle in Deviatoric Plane . . . . . . . . . . . . . . . . . . . . . . . . . . . . . . . . . . . . . . . . . . . . . 261
A5.1 Three-dimensional Stress Space : Pro jection of Point P on cr1-axis in
Octahedral Plane . . . . . . . . . . . . . . . . . . . . . . . . . . . . . . . . . . . . . . . . . . . . . . . . . . . . . . . . . . . . . . . 265
A5.2 Triaxial Plane: Offset of Point P along cr1-axis from Origin in
Octahedral Plane . . . . . . . . . . . . . . . . . . . . . . . . . . . . . . . . . . . . . . . . . . . . . . . . . . . . . . . . . . . . . . . 265
A5.3 Co-ordinates of Stress Point P in Octahedral Plane with Basis along
cr., cr2, and cr3 .. . . . . . . . . . . . . . . . . . . . . . . . . . . . . . . . . . . . . . . . . . . . . . . . . . . . . . . . . . . . . . . . . . 267
A5.4 Co-ordinates of Stress Point P in Oct ahedral Plane with Basis along x
and y ................... . . . ....................................................... 267
xviii
List of Symbols and/or Abbreviations
a Hen kel 's pore-pressure parameter for deviatoric loading
A S kempton's pore-pressure parameter for deviato ric loading
ar At failure Hen kel 's pore-pressure parameter for deviatoric loading
Ar At failure S kempton's pore-pressure parameter for deviatoric loading
b Intermediate principal stress ratio
B S kempton' s pore-pressure parameter
P Angle of p rincipal stress rotation from axis of cylindrical specimen
Cae Coefficient of secondary compression
Cc Compression index
C1 Failure surface parameter in proposed model
C5 Swelling index
CY Reference surface parameter in proposed model
CI Hydrostatically consolidated
CKo Anisotropically consolidated
CRS Constant rate of strain consolidation test
DS C Directional shear cell
d A. Loading factor
8 Angle of p rincipal stress rotation from axis of cross-anisotropy
E Elastic Young's modulus
XlX
e Void ratio
& Total strain
&e Recoverable (elastic) strain
sP Pennanent (plastic) strain
&P Volumetric strain
&q Shear strain in invariant form
&1 Major principal strain rate
�&1 Major principal strains
!l&2 Intermediate principal strains
!ls3 Minor principal strains
!lsm Mean of major, intennediate and minor principal strains
¢' Angle of internal friction
y Plastic potential parameter in proposed model
r Specific volume at unit pressure on critical state line
H Material Hardening
11 First invariant of stress tensor
/2 Second invariant of stress tensor
/3 Third invariant of stress tensor
J� Second invariant of deviatoric stress tensor
J; Third invariant of deviatoric stress tensor
XX

K'
k
K
L
LC
LSSV
v
11
OCR
p
PID
PSE
Coefficient of earth pressure at rest condition
Elastic bulk modulus
Parameter for failure surface based on third invariant
Parameter for failure surface based on third invariant
Slope of unload-reload line
State variable in proposed model
Anisotropic state variable in proposed model
Lateral compression test
Length of stress vector in three dimensional space
Failure surface model in proposed model, plasticity ratio
Slope of normal compression line
Shear stress ratio at failure
Hardening parameter in proposed model
Plastic potential parameter in proposed model
Poisson's ratio
Shear stress ratio
Overconsolidation ratio
Mean total stress in invariant form
Proportional-Integral-Derivative based logarithm
Plain strain extension test
XXI
PSC Plain strain compression test
p ' Mean effective stress in invariant form
p: Pre-consolidation mean effective stress
q Deviatoric stress in invariant form
qY Shear stress value at reference surface in proposed model
Su Undrained shear strength
o-1 Major principal total stress
a 2 Intermediate principal total stress
o-3 Minor principal total stress
u oct Octahedral normal stress
u; Major principal effective stress
u� Intermediate principal effective stress
u; Minor principal effective stress
u; Effective confining stress
a� Effective pre-consolidation stress
a; Normal effective stress along specimen's x-axis
u� Normal effective stress along specimen's y-axis
u; Normal effective stress along specimen's z-axis
u;'O Pre-consolidation vertical effective stress
u� Normal effective stress along specimen's axial direction
xxii

a; Normal effective stress along specimen's tangential direction
a; Normal effective stress along specimen's radial direction
T 100 Time for end of primary consolidation
TC Triaxial compression test
TE Triaxial extension test
TTT True triaxial test
r (Jz Shear stress applied from torque
l:lu Excess pore-pressure
l:lu 1 Excess pore-pressure at failure
l:lu P Part of excess pore-pressure due to change in mean stress
l:luq Part of excess pore-pressure due to change in shear stress
v Specific volume
v ..t Specific volume at unit pressure on normal compression line
W Internal strain energy
WP Plastic work
(J)a Lode angle
� 1 State variable
xxiii

Chapter 1. Introduction
Soils consist of an assemblage of particles with different sizes and shapes, which
form a skeleton, whose voids are filled with water and air or gas. However, a soil mass is
commonly treated as a continuum for analysis and design, in which it is considered that
the deformation process is dominated by displacements between particles and not by
deformation of particles themselves. The interparticle deformations largely depend on the
structure of soil, which represents the combined effect of the arrangements of particles,
particle groups and pore spaces, and the interparticle forces. The structure and
mechanical behavior of natural soil deposits are the result of their geologic history, and in
particular of their depositional environment, pre-consolidation history, aging effects and
thixotropic hardening, cementation, weathering, leaching and other chemical phenomena.
These factors may have their independent or a combined influence on the mechanical
properties of soil, which makes the study of soil behavior to be a rather complex task.
Problems such as specimen repeatability, inhomogenity, and large volume change or pore
pressure generation have further made soil a difficult material to "capture" or model
under three dimensional stress conditions.
Soil particles which are finer than 2 J.lm are generally termed as clay particles as
per the Unified Soil Classification System. Clay particles usually have a plate-like shape,
which is formed with crystalline structures of minerals. The soil mass containing a
majority of these particles is known as clay soil. Clays in their natural state are mostly
anisotropic because of their modes of deposition. Most clays that were deposited in post
glacial age are over-consolidated and have varved, laminated or banded structures.
b) Magnllicatloa: 7,000 b) Ma,v�IRcatloa: 7,000
Figure 1.1 Scanning Electron Microscopy Pictures of Pennsylvania Fire (natural) Clay with, (a) Flocculated, and (b) Dispersed Microfabric, (Penumadu, 1 996)
Electron microscopy has confirmed that these clays may have flocculated as well as
dispersed microstructure with preferred particle orientation. A typical example of these
particle orientations is shown in Fig. 1 . 1 . Preferred orientation of clay particles can cause
both strength and compressibility of clay to vary with direction, making them highly
anisotropic. Even for clay with random orientation of particles, the interparticle force
system may cause a considerable degree of anisotropy, which is usually induced because
of its loading history. Therefore, the stress-strain behavior of natural clays is likely to be
dependent on both the magnitude and the direction of principal stresses. Recent advances
in digital computer technology and in numerical techniques such as the finite difference
or the finite element methods, have rendered possible, at least in principle, the solution of
properly posed boundary value problems in soil mechanics. Further progress in
expanding analytical capabilities in geomechanics depends upon consistent mathematical
formulations of generally valid and realistic soil constitutive models. The development of
2
realistic constitutive relationships for clay requires a comprehensive knowledge about its
behavior based on accumulation of data relating to its response when subjected to a wide
range of stress paths, giving a proper consideration to its anisotropy.
An increasing effort has been devoted since the 1 950's to a comprehensive
description of the fundamental behavior of clay. These tests often involved single axis
loading conditions and formed the basis for several existing theories such as Critical State
Soil Mechanics (Roscoe and Burland 1 968) that attempt to explain the complex
mechanical behavior of soil. However, the applicability of single axis tests (e.g. triaxial
compression test) to model soil behavior is limited. The insitu stress conditions often
involves three unequal principal stresses i.e. the intermediate principal stress ( u2') varies
from the major ( u/) or minor ( a3') principal stress (e.g., slope stability, excavations, and
soil-foundation interactions). Recent advances in testing systems, data acquisition, and
control methods provide an opportunity for evaluating the deformation and strength
behavior of clay under truly three-dimensional states of stress and strain. Early devices
that were capable of performing three-dimensional tests were l imited in their capabilities.
They were cumbersome, difficult to operate and typically required some sort of manual
control to perform the tests. This made it difficult to be able to perform true stress and
strain control tests, the results were not reproducible, and the accuracy of the test was
significantly dependent on its operator. Recent advances in control hardware and
software has allowed high-speed closed loop control to be used in soil testing. This
allows accurate and repeatable tests to be performed on the soil specimens under true
target state of stress/strain in real time.
3
Most experimental studies performed in the past are not conclusive on many
facets of the generalized behavior of anisotropic clays. They are incomplete in many
aspects of the soil behavior, such as the consideration of localized deformation within the
specimens during shearing, consistency of the testing methods, and repeatability of the
specimens tested for evaluating normally consolidated to highly overconsolidated clay
behavior, influence of microstructure, and a clear understanding of the stress induced
anisotropy and its influence on the soil's mechanical properties. A comprehensive
experimental database for an identical clay soil under generalized stress conditions
(especially true triaxial tests with minimal interference of loading boundaries), which can
be used to understand the influence of various factors involved in the complex behavior
of clays, is lacking from prior research, and is the motivation for the current study.
A need exists for good quality data using an experimental device built with an
advanced feedback control system. The true triaxial device used in the present research
performs tests on a 1 02mm cubical cohesive soil specimens. This device has flexible
boundaries and uses three-axis electro-pneumatic Proportional - Integral - Derivative
(PID) control with custom developed software that can automatically saturate,
consolidate and apply shear stresses along predetermined stress or strain paths. With this
fully automated testing system, the soil specimens can be subjected to a wide variety of
stress paths to evaluate the three dimensional (30) mechanical behavior of clays. The
specimen can be subjected to three orientations of principal stress with respect to the
direction of soil deposition as shown in Fig. 1 .2. The relative magnitudes of principal
stresses acting on the specimen can be varied, or a proportional loading can be applied to
4

z
/ ... .....
X
zj ! l
, .
..... .,..X
z
Figure 1.2 Orientation of Principal Stress during True Triaxial Testing (Direction of Soil Deposition or Axis of Cross-anisotropy along z-axis)
the specimen, which is usually defined by the intermediate principal stress ratio b-value
as shown in equation 1.1.
I I b=(J"2-(J"l a'- a'
I 3 ( 1 . 1 )
In the current study, a series of strain controlled constant b-value true triaxial
undrained tests were performed on remolded cubical specimens of Kaolin clay with
controlled microfabric (microfabric: arrangement of particles or particle groups).
Specimens with two distinct microfabrics, flocculated and dispersed, were obtained by
consolidating the Kaolin clay slurry under Ko condition (at 207kPa axial stress). The
procedure for specimen preparation was developed such that reproducible and
homogeneous specimens with controlled microfabric could be obtained. This IS a
necessary condition in evaluating the influence of a particular factor (such as loading
history) on soil behavior with minimal interference of the other uncertainities. The
specimens were first hydrostatically consolidated to their virgin consolidation stage (at
5
275 k.Pa isotropic stress), and then unloaded to attain various overconsolidation ratios
before shearing.
This dissertation presents the results obtained from the above-mentioned series of
true triaxial tests. A comprehensive analysis of the observed clay behavior is presented
considering the following factors: effect of relative magnitudes and orientation of
principal stresses, influence of consolidation history and its role in the anisotropy of clay,
and the effect of change in soil's microfabric on its mechanical response. Chapter 2
describes the true triaxial device that was developed to test the cubical specimens of
cohesive soils. It also includes details related to control methods employed for testing, the
steps involved in the assembly of setup, and the procedure used for preparing the
remolded specimens of Kaolin clay. Chapter 3 addresses the influence of stress
anisotropy on the shear stress-strain-strength and pore pressure behavior of normally
consolidated Kaolin clay, and evaluates the effect of change in the test boundary
conditions and the specimen shapes on its observed mechanical response. Chapter 4
concentrates on the effect of intermediate principal stress on the undrained shear behavior
of overconsolidated clay and the importance of identifying localized deformation within
the specimen. A method for determination of onset of strain localization is proposed in
this chapter based on the true triaxial test data. Chapter 5 evaluates the mechanical
behavior of normally consolidated to heavily overconsolidated clay in three-dimensional
stress space. Based on the experimental observations and from past knowledge on the
normalized behavior of clays, a dynamic failure surface is proposed in this chapter, which
is a function of stress state and the pre-consolidation history. Chapter 6 presents the
influence of microfabric and fabric-induced anisotropy on the consolidation and shear
6
behavior of soil by comparing the experimental data obtained from the tests performed on
Kaolin clay with flocculated and dispersed microfabric. Chapter 7 gives a brief summary
of the constitutive models developed for geomaterials using classical elasto-plasticity
theory, and evaluates the validity of two well-recognized constitutive theories (modified
cam clay model and single hardening model) using present experimental data. Chapter 8
presents a new rate independent elasto-plasticity model that was developed in this study
based on the analysis of normalized clay behavior presented in previous chapters. A
procedure for determining the model parameters for Kaolin clay, and validation of the
new model (by comparing the predictions with the experimental data obtained in the
current study) is also included in chapter 8.
7
Chapter 2. Description of True Triaxial Device and Specimen
Preparation Procedure
Introduction
The magnitude and orientation of the principal stresses acting on a soil element
can change with the loading situation. Conventional triaxial testing on cylindrical
specimens is often used to study the stress-strain behavior of soil in the laboratory.
However, the soil element is only subjected to axi-symmetric state of stress in this type of
testing. A true triaxial test with independent control of the three principal stresses can
evaluate the effect of intermediate principal stress ( cr2) on the mechanical behavior of
soil. It is important to study the effect of cr2 on the yield and failure behavior of soil to
accurately model certain boundary value problems associated with slope stability and
foundation design.
A number of laboratory testing devices have been developed in the past four
decades that facilitate testing of soil specimens in three dimensions. A true triaxial testing
device applies three mutually perpendicular principal stresses on a cubical soil specimen
using rigid end plates, flexible membranes, or a combination of rigid and flexible
boundaries. Kjellman ( 1 936) employed rigid platens to apply three normal stresses on a
soil specimen. Ko and Scott ( 1 967), Sture and Desai ( 1979), Sivakugan et al. ( 1988),
Reddy et at . ( 1 992) aJI used flexible boundaries. Lade ( 1 978) used a combination of rigid
and flexible boundaries. Lade and Musante ( 1978), and Kirkgard and Lade ( 1993) used a
combination of flexible and rigid boundaries to perform tests on normally consolidated
clay specimens. Callisto and Calabresi ( 1998) recently used flexible boundaries to
8
perform tests on natural Pisa clay. The advantages and disadvantages of different
boundary conditions used in various true triaxial devices were summarized by Sture and
Desai ( 1979), Jamiolkowski et al. ( 1985) and Arthur ( 1988). The main drawback of using
rigid boundaries is the potential for a non-uniform stress state to exist at the comers of a
deforming cubical specimen. For a flexible boundary system, the potential for non
uniformity of deformations at large strains is a concern. A discussion of the potential
constraints at the comers in cubical triaxial devices is given by Arthur ( 1 988).
The device described herein was recently developed by Mandeville and
Penumadu (2004); which performs tests on a 1 02 mm cubical cohesive soil specimen.
The system consists of a control panel, computer console, hardware to interface between
the computer, space frame and six pressure housings. Currently, the device is capable of
performing isotropic and Ko consolidation and shear testing via stress or strain control .
Several modifications to specimen saturation, consolidation, and shear testing were made
in the present study to evaluate the effect of intermediate principal stress on both
normally and overconsolidated clay specimens. The issues related to hardware and
software used in the system, and performance of tests, are described in this chapter. One
of the main improvements with the current testing system is the development of three
axis electro-pneumatic PID control and software that can automatically saturate,
consolidate, and apply shear stresses along predetermined stress paths. Using this fully
automated true triaxial system, the cubical soil element can be subjected to a wide variety
of stress or strain paths to evaluate the three dimensional mechanical behavior of clays.
The remolded cubical specimens of kaolin clay were obtained using a consolidometer
9
with 1 02x 1 02mm square base. The procedure used for preparing the specimen, and
assembling it in the true triaxial system for further testing, are described in this chapter.
True Triaxial Testing System - Hardware
The true triaxial device described in this chapter is similar to the one developed
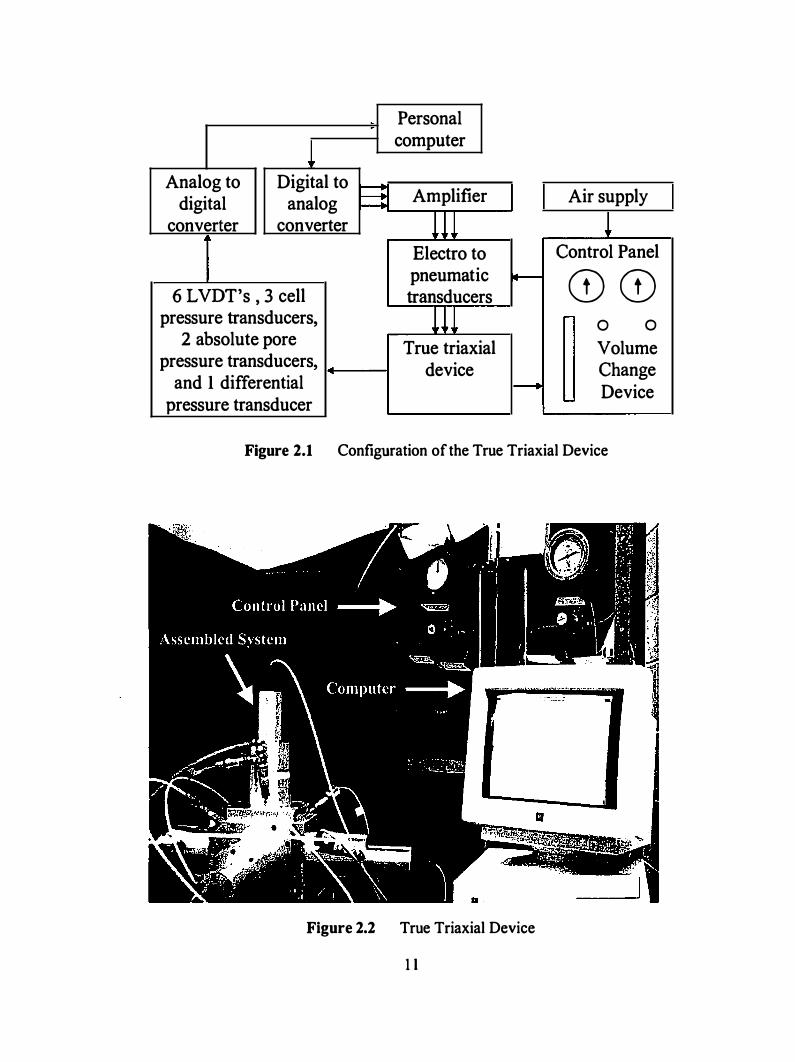
by Sture and Desai ( 1979) and Sivakugan et al. ( 1988). Figure 2 . 1 shows the overall
configuration of the PID controlled true triaxial test setup developed in this study. Figure
2.2 and 2.3 show photographs of the true triaxial testing device used in this study. The
main structural part of the device consists of a space frame (Fig. 2.3a) and six pressure
housings. The space frame holds a cubical soil specimen. The six cylindrical pressure
housings (Fig. 2.3c) are attached to the six faces of the space frame. A flexible rubber
membrane (Fig. 2 .3b) separates each face of the soil specimen and the pressure housing.
Each pressure housing contains an L VDT (Linear Voltage Differential Transformer,
Schaevitz, model GPD- 1 2 1 -500, 1 5 volts DC bi polar excitation) displacement
transducer, for measuring the deformation at the center of each face of the specimen, and
two access holes to pressurize the small volume between the housing and the membrane.
There are three electro-pneumatic transducers (Fairchild T6000, 0-840 kPa), one for each
axis of the space frame. An air supply line connects each axis of the frame to the
corresponding electro-pneumatic transducer. Measurement of the total stress in each
direction of the cubical sample is accomplished using pressure transducers (Ellison
GS4002, 0- 1 034 kPa). Internal and external pore pressures are measured through the use
of absolute pressure transducers (Data Instruments, AB-4, 0- 1 375 kPa). A photograph of
the assembled setup is shown in Fig. 2.3(d). At four comers of the space frame, a
diagonal access hole is provided that allows for saturation and drainage attachments. One 1 0
Personal
! computer
Analog to Digital to 3 Amplifier Air supply digital analog converter converter !!! !
Electro to Control Panel
pneumatic 4-- CD CD 6 L VDT's , 3 cell transducers pressure transducers, !!! 0 0
2 absolute pore True triaxial Volume pressure transducers,
device Change and 1 differential � Device
pressure transducer
Figure 2.1 Configuration of the True Triaxial Device
Figure 2.2 True Triaxial Device
I I
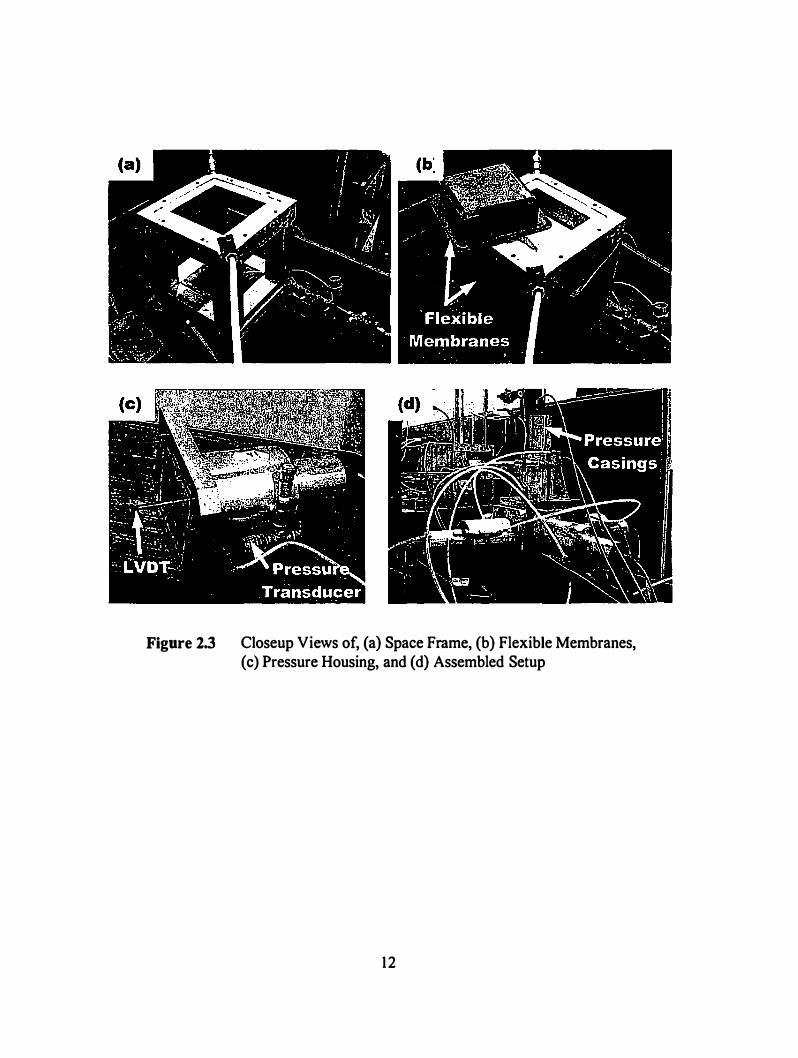
Figure 2.3 Closeup Views of, (a) Space Frame, (b) Flexible Membranes, (c) Pressure Housing, and (d) Assembled Setup
12

of these ports allows for the insertion of a piezometer needle into the specimen so that the
internal pore pressure can be measured at all stages of testing. The needle has an outside
diameter of 1 .8 mm and a length of 150 mm. A porous plastic plug is inserted into the
end of the water saturated needle before the needle is inserted into the clay sample
diagonally through one of the access holes. This porous plastic plug prevents the needle
from getting clogged with clay and allows for accurate measurement of the internal pore
pressure. This piezometer allows for measuring the internal pore pressure at the center of
the cubical clay specimen at all times during saturation, consolidation, and shearing. Two
flexible drain lines lie against the specimen, one on the top face and one on the bottom
face of the specimen. These flexible drain lines extend into the holes drilled in the space
frame. These lines have a notch cut on the side that rests against the rubber membrane.
The notch allows water to flow through the drain line and saturate the interface between
the specimen and membrane. Before the specimen is inserted, the lines are wrapped in
filter paper to prevent them from being clogged by the clay during saturation and
consolidation stages of testing.
The control panel shown in Fig. 2.2 is used to manually regulate the supply air
pressure as well as the back pressure in the system. Attached to the control panel are two
low air flow pressure regulators and display gages (one for cell pressure and one for back
pressure), and a volume change device. The volume change device consists of a
differential pressure transducer and a burette. The differential pressure transducer
(Validyne, model P3050, can measure a water height of 50 em) measures the change in
height of the water column as water is expelled from the specimen during consolidation
to precisely monitor volumetric strains.
1 3
One of the important issues to be carefully considered with the flexible boundary
setup is that of interference of membranes at the comers of the specimen. This is a
particular concern at the maximum stress levels experienced during the application of
shear stresses. The membranes need to meet to prevent the soil from squeezing between
the membranes. At the same time, the membranes should not push into adjacent pressure
cavities during application of unequal stresses around the sample. One way to overcome
this problem is given by Sture and Desai ( 1 979). In their study, membranes made of
silicone rubber were made slightly thicker at the comers. Additionally, Teflon strips were
placed at the contact points of the membranes. This prevents the membranes from
bulging into the adjacent cavities. Teflon also provides a frictionless surface between the
membranes so that no shear stress exists on the membranes. Sture and Desai also
evaluated the uniformity of strains for a clay specimen tested with flexible boundaries.
The specimen was tested in triaxial compression and direct, physical measurements were
made on the sample after testing. The sample was measured along the edges and
midplanes of the sample. They presented both the final dimension and the corresponding
value of the axial strain at 24 different locations on the specimen. It was reported that the
specimen remained prismatic with minimal boundary interference.
For the true triaxial testing system described in this chapter, the membranes are 3
mm thick at all points. Initially, silicone RTV was usedas the membrane material. RTV
based elastomeric compounds have relatively high water vapor transmission (WVT)
rates; this indicates that the RTV compound can let air diffuse across its surface. Air
diffusion across the membrane during the consolidation and shear testing phases caused
problems related to keeping the clay specimens fully saturated. Membranes with similar
14
elastic properties but with much more resistance to air diffusion were needed. Butyl
rubber was selected as the membrane material and has a WVT rate approximately 2 10
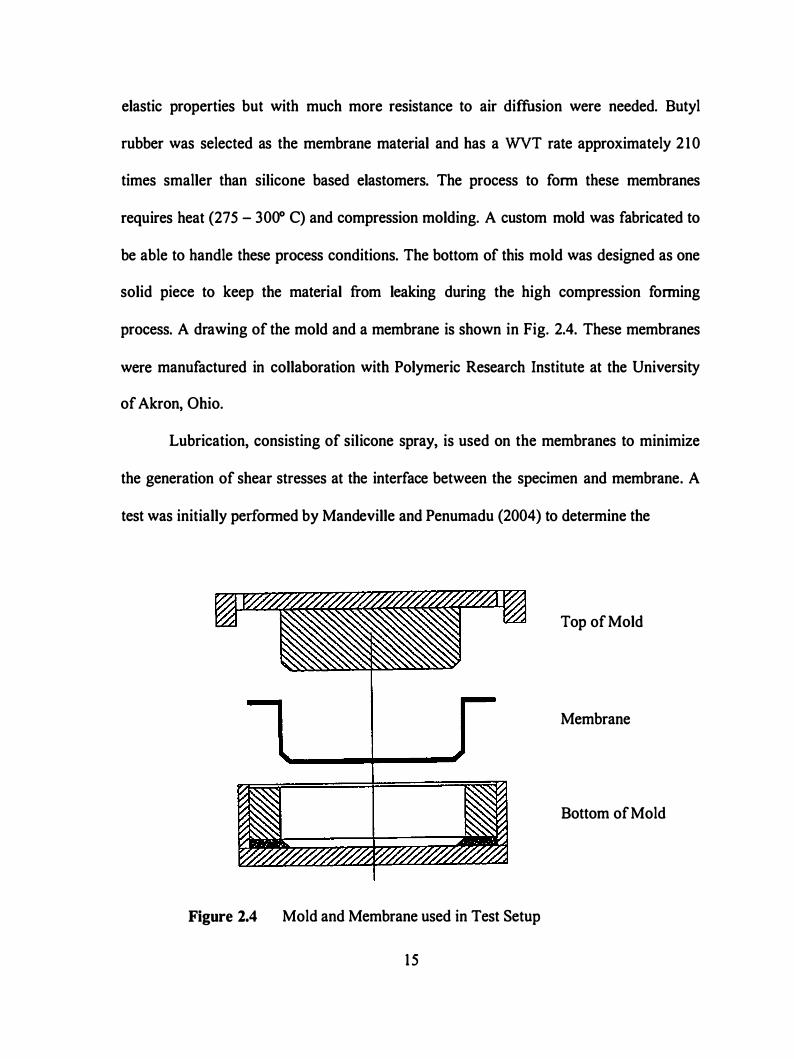
times smaller than silicone based elastomers. The process to form these membranes
requires heat (275 - 300° C) and compression molding. A custom mold was fabricated to
be able to handle these process conditions. The bottom of this mold was designed as one
solid piece to keep the material from leaking during the high compression fonning
process. A drawing of the mold and a membrane is shown in Fig. 2.4. These membranes
were manufactured in collaboration with Polymeric Research Institute at the University
of Akron, Ohio.
Lubrication, consisting of silicone spray, is used on the membranes to minimize
the generation of shear stresses at the interface between the specimen and membrane. A
test was initially performed by Mandeville and Penumadu (2004) to determine the
Figure 2.4 Mold and Membrane used in Test Setup
1 5
Top of Mold
Membrane
Bottom of Mold
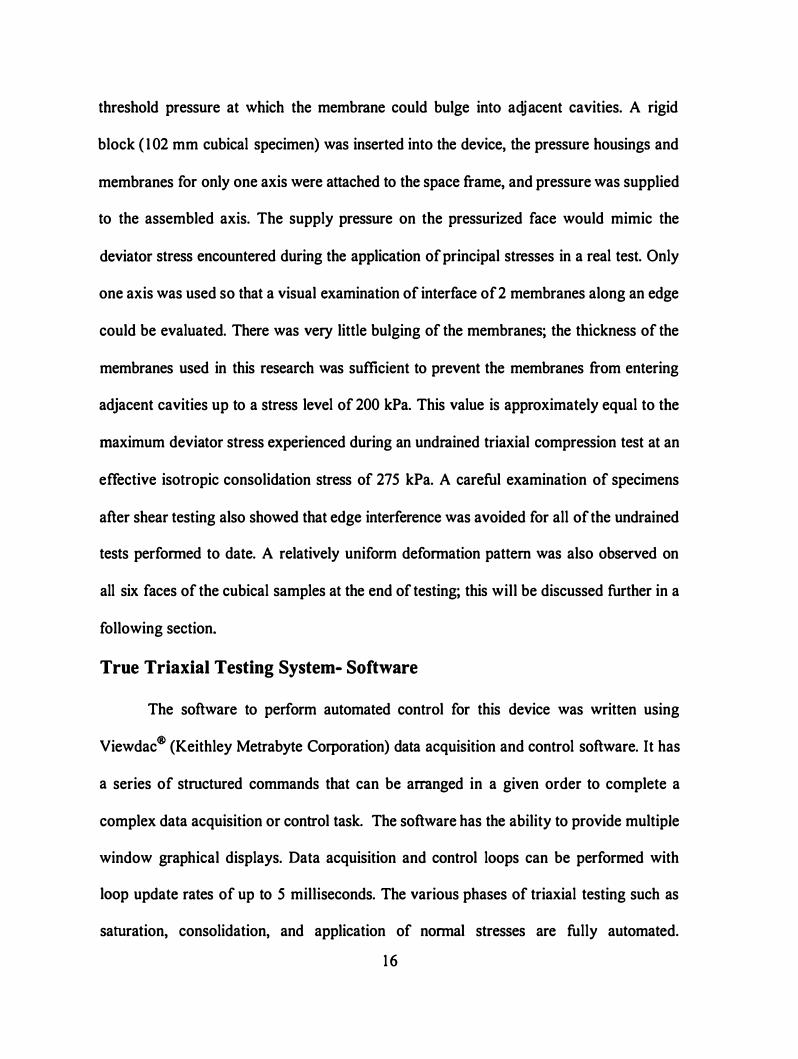
threshold pressure at which the membrane could bulge into adjacent cavities. A rigid
block ( 1 02 mm cubical specimen) was inserted into the device, the pressure housings and
membranes for only one axis were attached to the space frame, and pressure was supplied
to the assembled axis. The supply pressure on the pressurized face would mimic the
deviator stress encountered during the application of principal stresses in a real test. Only
one axis was used so that a visual examination of interface of 2 membranes along an edge
could be evaluated. There was very little bulging of the membranes; the thickness of the
membranes used in this research was sufficient to prevent the membranes from entering
adjacent cavities up to a stress level of 200 kPa. This value is approximately equal to the
maximum deviator stress experienced during an undrained triaxial compression test at an
effective isotropic consolidation stress of 275 kPa. A careful examination of specimens
after shear testing also showed that edge interference was avoided for all of the undrained
tests performed to date. A relatively uniform deformation pattern was also observed on
all six faces of the cubical samples at the end of testing; this will be discussed further in a
following section.
True Triaxial Testing System- Software
The software to perform automated control for this device was written using
Viewdac® (Keithley Metrabyte Corporation) data acquisition and control software. It has
a series of structured commands that can be arranged in a given order to complete a
complex data acquisition or control task. The software has the ability to provide multiple
window graphical displays. Data acquisition and control loops can be performed with
loop update rates of up to 5 milliseconds. The various phases of triaxial testing such as
saturation, consolidation, and application of normal stresses are fully automated. 1 6
Mandeville and Penumadu (2000) compared three techniques of control procedures in
torsional tests in order to maintain a constant b-value throughout the shear test and
showed the variation of strength parameters with different techniques of control. They
concluded that the PID based closed loop control appeared to give the best overall
control. Therefore, the control in this setup is maintained through the use of the PID
algorithm. The algorithm is based on adjusting the output channel to match a target
command using three terms: a proportional term P, an integral term I, and a differential
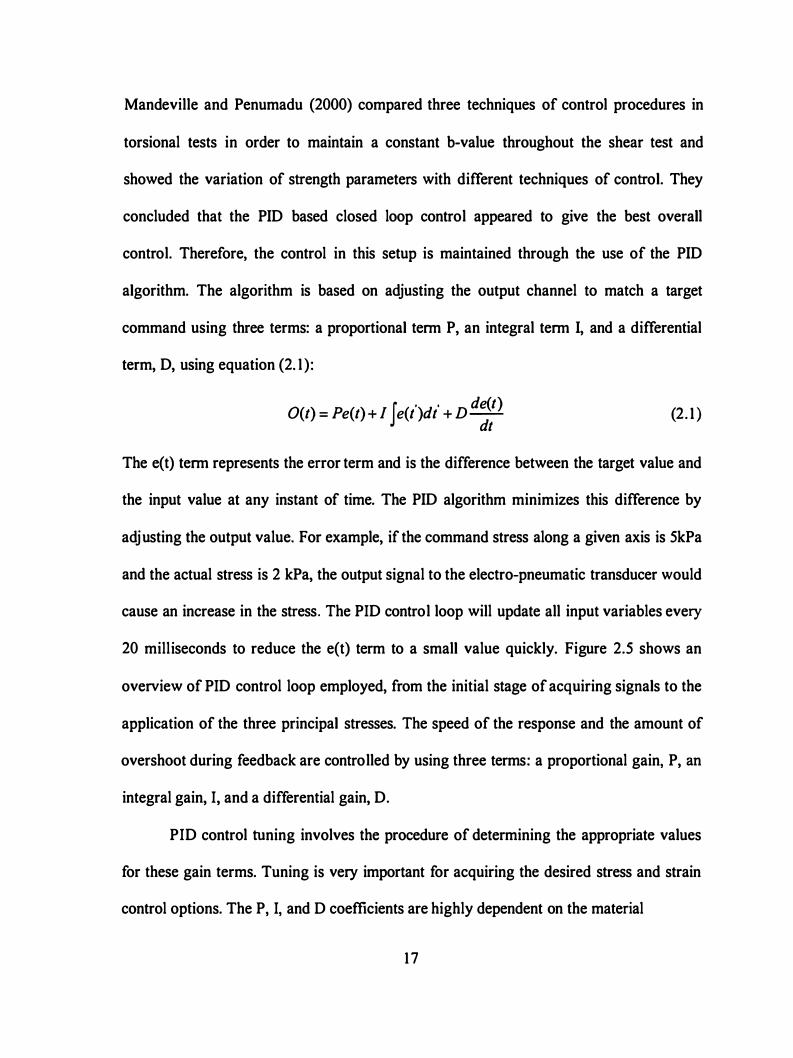
term, D, using equation (2. 1 ) :
I . . de(t) O(t) = Pe(t) + I e(t )dt + D
dt (2. 1 )
The e(t) term represents the error term and is the difference between the target value and
the input value at any instant of time. The PID algorithm minimizes this difference by
adjusting the output value. For example, if the command stress along a given axis is 5kPa
and the actual stress is 2 kPa, the output signal to the electro-pneumatic transducer would
cause an increase in the stress. The PID control loop will update all input variables every
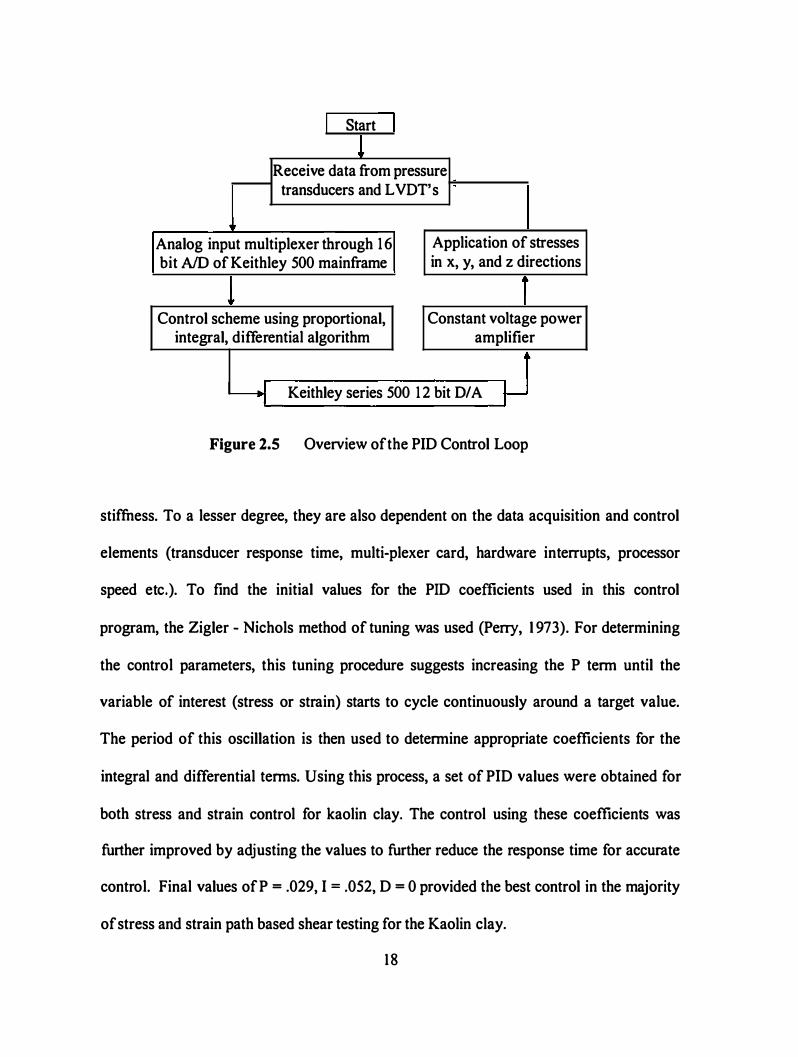
20 milliseconds to reduce the e(t) term to a small value quickly. Figure 2.5 shows an
overview of PID control loop employed, from the initial stage of acquiring signals to the
application of the three principal stresses. The speed of the response and the amount of
overshoot during feedback are controlled by using three terms: a proportional gain, P, an
integral gain, I, and a differential gain, D.
PID control tuning involves the procedure of determining the appropriate values
for these gain terms. Tuning is very important for acquiring the desired stress and strain
control options. The P, I, and D coefficients are highly dependent on the material
1 7
I Start !
Receive data from pressure transducers and L VDT' s
Analog input multiplexer through 16 Application of stresses bit ND of Keithley 500 mainframe in x, y, and z directions
Control scheme using proportional, Constant voltage power integral, differential algorithm amplifier
y Keithley series 500 1 2 bit D/A t-Figure 2.5 Overview of the PID Control Loop
stiffness. To a lesser degree, they are also dependent on the data acquisition and control
elements (transducer response time, multi-plexer card, hardware interrupts, processor
speed etc.). To find the initial values for the PID coefficients used in this control
program, the Zigler - Nichols method of tuning was used (Perry, 1 973). For determining
the control parameters, this tuning procedure suggests increasing the P term until the
variable of interest (stress or strain) starts to cycle continuously around a target value.
The period of this oscillation is then used to determine appropriate coefficients for the
integral and differential terms. Using this process, a set of PID values were obtained for
both stress and strain control for kaolin clay. The control using these coefficients was
further improved by adjusting the values to further reduce the response time for accurate
control. Final values ofP = .029, I = .052, D = 0 provided the best control in the majority
of stress and strain path based shear testing for the Kaolin clay.
18
At several stages during a true triaxial test for cohesive soil, the type of PID
control had to be varied from stress to strain control or a combination of both stress and
strain control. This posed a unique problem in implementing PID control in various
phases of soil testing. Figure 2.6 shows testing options, along with the information on the
input and target signals that are currently being used. The PID algorithm can be used to
maintain either a desired stress or strain, depending on how the input and target values
are setup. For a stress controlled mode, such as applying a hydrostatic stress around the
cubical sample during isotropic consolidation, an effective confining pressure of 275 kPa
is maintained in excess of the existing back pressure. In a strain controlled mode, the
input is the strain along a given axis and the target follows a ramp at a specified rate. The
PID control will change the stress on the desired axis so that the target strain and actual
strain match. A difficult problem that was encountered during control software
development was changing between control modes (stress to strain) and at the same time,
maintaining the target pressure during primary consolidation stage. For shear testing,
under triaxial compression mode, the stress on one axis is increased to follow a target
strain ramp. At this stage, for this axis, control needs to switch from stress control
(maintaining constant strain rate) to strain control. A method was developed in Viewdac,
whereby the type of control can be changed, and the desired initial stress state was
maintained. This development was found to be crucial in being able to achieve precise
stress or strain paths and fully automate the three stages of triaxial testing (saturation,
consolidation, and application of shear).
The initial PID tuning for the current setup was performed on specimens in a
drained condition at an isotropic normally consolidated (NC) state of stress. These values
1 9

Saturation Phase
Saturation PID Input
PID Target
current cell pressure on each axis (x, y, and z) back pressure plus confining pressure for each axis
B Value Check PID Input current cell pressure on
each axis (x, y, and z) PID Target ramps upward at a rate
of 14 kPa/min until an additional 34 kPa is placed on specimen
Consolidation Isotropic PID Input current cell pressure on each axis (x, y, and z)
f----+ PID Target ramps up for each axis at 14 kPa/min until consolidation pressure is reached
Ko
� PID Input x and y axis strain z axts pressure PID Target 0% strain with a z axis target ramps up at 2
tolerance of0.025% kPa/min until desired maximum vertical stress is reached
Shear Testing Strain Control CIUC PID Input x and y axis pressure z axis CIDC strain CKoUC PID Target x and y axis pressure at end of CKoDC consolidation ramps up at desired
strain rate
Stress Control ClUE PID Input current cell pressure on each axis CIDE (x, y, and z) other stress paths l...-..+ PID Target x and y axis pressure at end of
consolidation, z axis target ramps up at desired stress rate
Figure 2.6 Logic Used in PID Control Setup
20
correspond to P=0.029, 1=0.052 and D=O. During an undrained test, excess pore pressures
are generated when the deviator stress is applied to the specimen. This results in lower
mean effective stresses as the shear deformation increases and a corresponding decrease
in the stiffness of the soil specimen with increasing deviator stress. The decrease in soil
stiffness affects the accuracy of the PID control algorithm. As the soil stiffness decreases,
a small increase in stress can cause a large increase in strain. Use of constant PID
coefficient throughout shearing causes the PID control to overshoot the desired target, as
the specimen deforms to higher shear strains. Mandville and Penumadu (2003) suggested
that the values of P and I could be reduced by a factor of 10 at a threshold major principal
strain of 3.5% to correct this probl�m. However, in the current study it was found that a
better control could be achieved if the threshold axial strain was defined at l %. During
undrained shearing on NC specimens, close to l% axial strain in the major principal
stress axis, the PID coefficients were gradually decreased to their final values ofP=.0029,
1=.0052, and D=O. If the PID values were decreased too soon, the measured strain rate
lagged behind the desired strain rate. Changing the PID values at 1% axial strain
provided the best overall control, the desired and actual strain rates match well, resulting
in a smoother stress strain curve. Test results for a true triaxial system employing
pneumatic control with a combination of normally closed and normally open servovalves
(Penumadu et al., 1 998) could not achieve this precise control, and further demonstrates
the potential of the present testing system. One of the main advantages in using PID
control is that the target can be constant or a variable. The PID algorithm will always
follow the target when accurately tuned parameters are used; which makes it relatively
2 1
easy to perform complex stress or strain paths (both monotonic and cyclic) under a true
triaxial state of stress.
Membrane Compliance in Strain Calculation
The flexible membranes used in this setup are made of butyl rubber and have a
uniform thickness of 3 mm. The deformability of flexible membranes can affect the
observed strain values during shearing of a soil specimen. It is essential to measure this
membrane deformation at a given value of normal stress and correct the soil strain
information form L VDT measurements. In this study, the membrane compliance for
strain measurement was determined by using a high strength cubical metal specimen and
monitoring three normal strains as a function of stress amplitude within the working
range of the device. The size of metal specimen was the same as the cubical clay
specimens.
The metal specimen was assembled in the true triaxial setup, in which the stress
was applied on the specimen through the flexible membranes. The deformation was
recorded on all faces of the specimen, and the deformations on opposite faces were then
averaged to calculate the strains along three principal axes of the specimen: x, y, and z.
The recorded deformation was essentially from the membranes because the comparative
stiffuess of metal block was much higher. The strain calculation was based on the size of
metal specimen (instead of membrane thickness), so that it could be directly related to the
required strain corrections in soil test data.
Axial compression tests were performed on the metal specimens by increasing the
stress along z-axis, u= , and maintaining constant stress along x-, and y-axis ( u .. , and
22
CTY ). Three such tests were performed to cover the range of stress amplitudes used in
current research: az = 40- 1 30 kPa, 200-425 kPa, and 4 10-650 kPa. A lateral compression
tests was performed, in which O"z = O"Y was increased from 410-650 kPa, and O"x was
kept constant. The calculated strain values from these tests are shown in Fig. 2. 7 as a
function of the applied stress along z-axis of the specimen. These values give a measure
of the error induced in the observed and actual stain values for the soil specimens during
shearing. Figure 2. 7a shows that the strain correction required in the loading direction
during a compression test should be approximately 0.03%/100kPa. The normal strain
correction for lateral compression (See Fig. 2. 7b) remains same as for axial compression;
however, volumetric strain correction doubles (0.06%/1 OOkPa) due to biaxial loading.
Strain corrections for the membranes used in current study were incorporated in
strain computations during soil testing, although they were found to be very small
(compared to soil specimen) within the stress range used in this study.
Preparing Remolded Cubical Specimens of Kaolin Clay
The cubical clay specimens used for all the tests performed in this study were
prepared in a slurry consolidometer similar to the one described by Penumadu et al.
( 1998). The consolidometer and the prepared specimen are shown in Fig. 2.8. The soil
specimens (See Fig. 2.8b, and Fig. 2.8c) were 102 mm cubes made of Kaolin clay. The
slurry consolidometer (Fig. 2.8a) was made from Plexiglas. It consists of five major
parts: a base plate, a 1 02 mm high bottom, a 356 mm extension, a loading plate, and a
load piston. Drainage is provided at the top and bottom of this slurry consolidometer.
Both parts of mold (the 102 mm and the 356 mm) are also reinforced with Plexiglas to
23
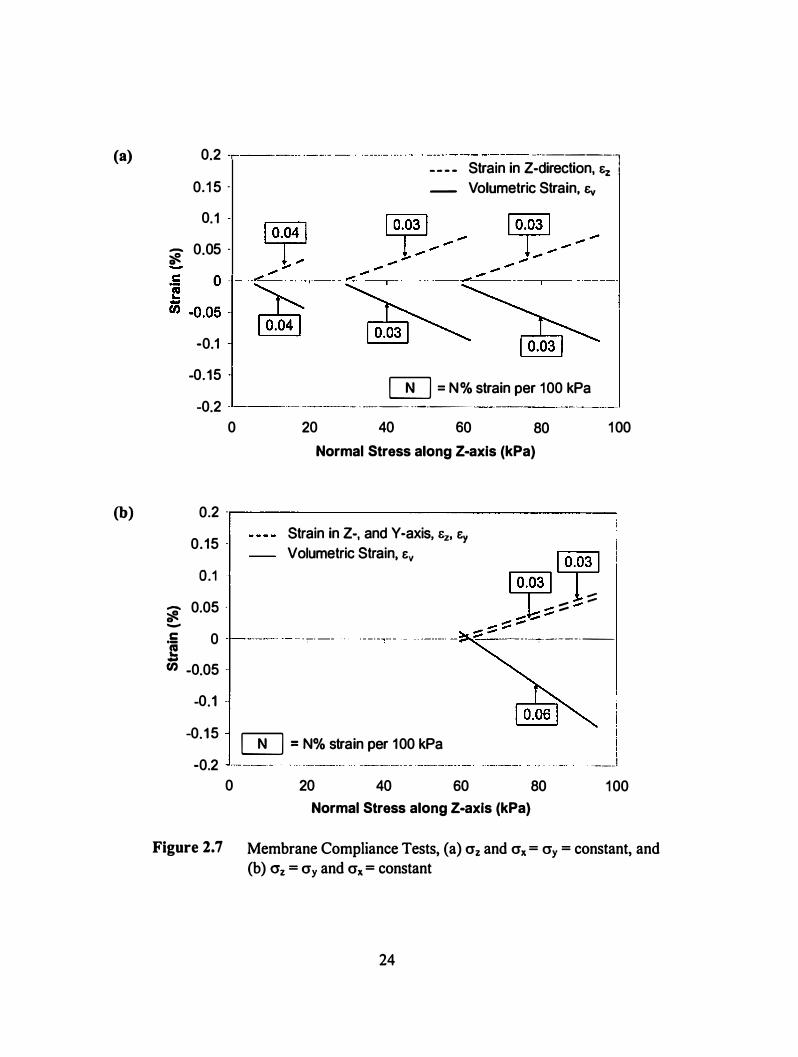
(a) 0.2 ..,------ -------------------- ------ --------l ---- Strain in Z-direction, � ,
0. 1 5 -
0.1
_ Volumetric Strain, ev
� 0.05 --
-0.1
-0.15 [EJ = N% strain per 1 00 kPa -0.2 -'--------- ------ - ---- ------
0 20 40 60 80 1 00
Normal Stress along Z-axis (kPa)
(b) 0.2 -r------------------
Strain in Z-, and Y-axis, �. &y 0·1 5
Volumetric Strain, &v � o.1 I o
j
-::;1 __ 1_ ==-- 0.05 . � _ -::; _ -; 0 -1--- -----, - - -- - - ----,---- __ ___ ,.....,-::;=--::;--_ _ _ _ ' -- - - - · --
'i! -U) -0.05 -
-0.1 -
-0.1 5 [EJ = N% strain per 1 00 kPa I -0.2 __ _I
0 20 40 60 80 1 00 Normal Stress along Z-axis (kPa)
Figure 2. 7 Membrane Compliance Tests, (a) Oz and Ox= oy = constant, and (b) <:rz = Oy and Ox= constant
24
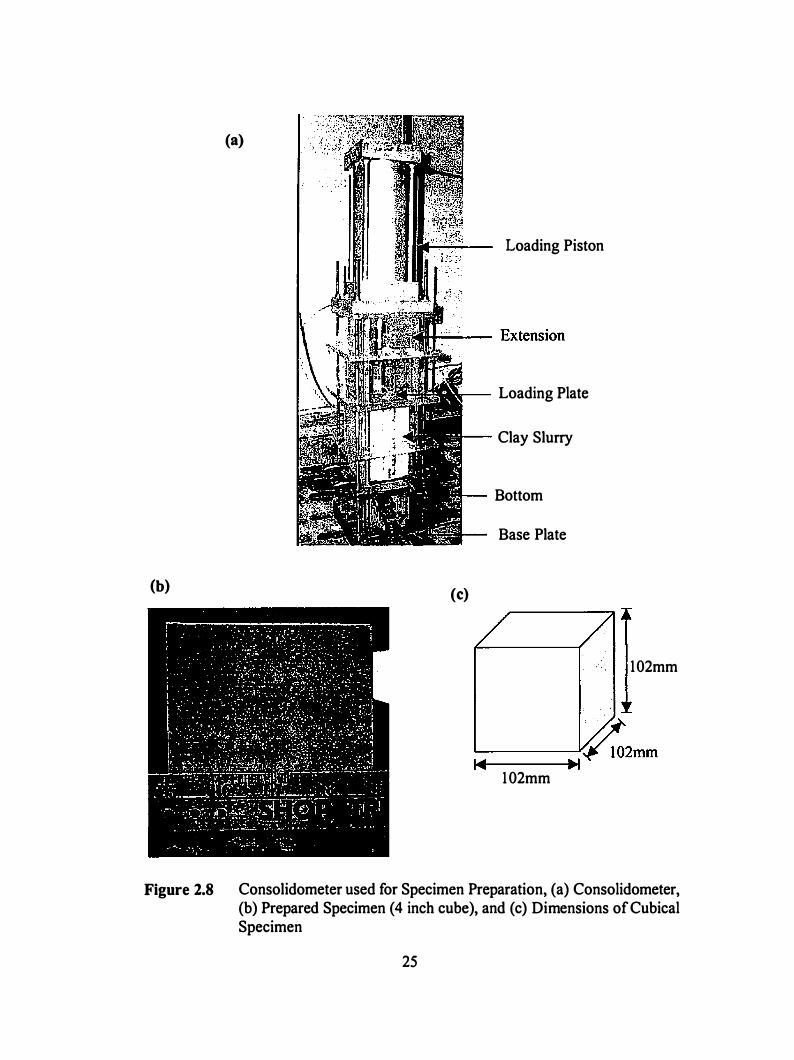
(a)
(b) (c)
Loading Piston
Loading Plate
Clay Slurry
Bottom
Base Plate
/ /
102mm
102mm
Figure 2.8 Consolidometer used for Specimen Preparation, (a) Consolidometer, (b) Prepared Specimen (4 inch cube), and (c) Dimensions of Cubical Specimen
25
limit lateral deformations and ensure Ko consolidation of initial slurry. A rubber gasket is
used between adjacent Plexiglas pieces to prevent any leakage at the interface. Threaded
rods are used to attach the loading piston to the Plexiglas mold.
The method of slurry preparation affects the quality of the specimen obtained at
the end of consolidation. Uniform specimens are a condition necessary for
therepeatability of tests. Sheeran and Krizek [ 197 1 ] found that specimens prepared from
a higher water content slurry would not be influenced by the method of placement of
slurry into the consolidometer. They also found that a water content of 2 to 2.5 times the
liquid limit of the soil would be appropriate for slurry preparation. A water content of
155%, corresponding to 2.5 times the liquid limit, was used to make the slurry in the
present research. The high water content slurry was transferred into the consolidometer
using a funnel. Friction between the consolidometer wall and the slurry plays a major role
in consolidation of the slurry. In order to minimize the frictional effects between the
consolidometer and the slurry, the bottom of the consolidometer was lined with Teflon in
this research. The inner walls of both the bottom and its extension were also sprayed with
silicon before the transfer of the slurry.
Initially, the slurry was consolidated under Ko conditions at a vertical effective
stress ( crv') of 25 kPa. The slurry was allowed to consolidate at this stress state for 1 hour.
This serves two purposes: ensures that no leaks exist in the assembly of the consolidator,
and allows a cake to build up which will help prevent leaks during consolidation at higher
stresses. The vertical effective stress on the specimen of kaolin clay was then increased to
207kPa, and the specimens were consolidated under Ko conditions until the completion of
26
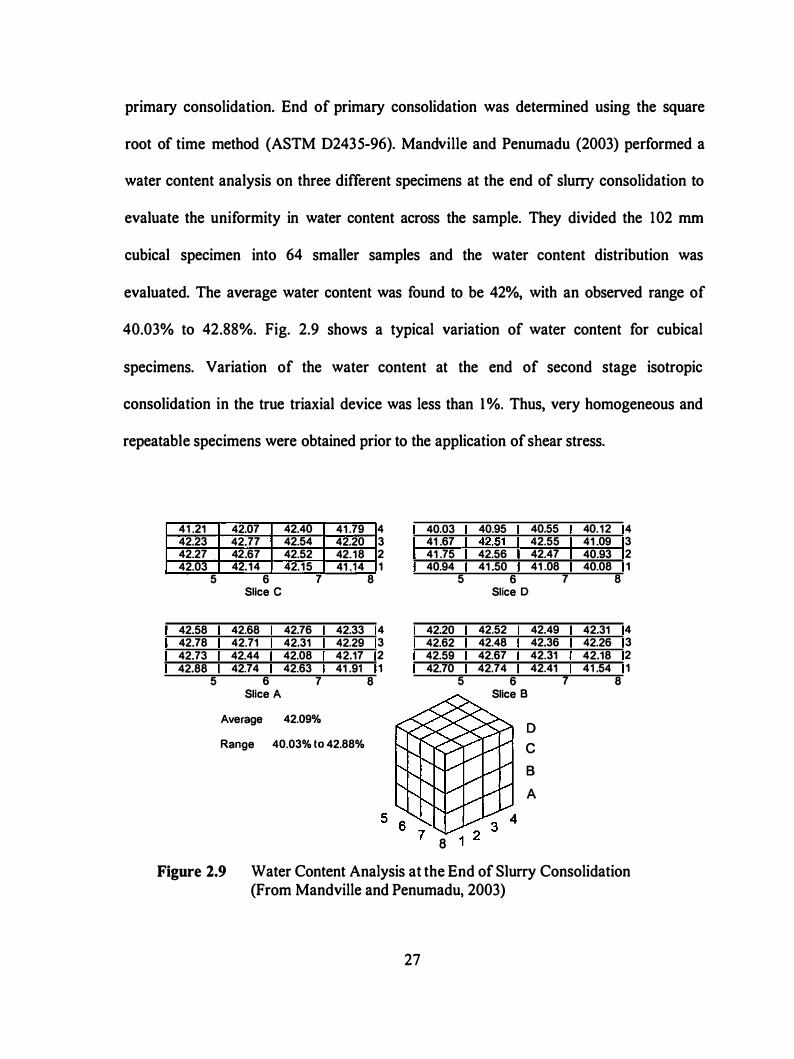
primary consolidation. End of primary consolidation was determined using the square
root of time method (ASTM 02435-96). Mandville and Penumadu (2003) performed a
water content analysis on three different specimens at the end of slurry consolidation to
evaluate the uniformity in water content across the sample. They divided the 102 mm
cubical specimen into 64 smaller samples and the water content distribution was
evaluated. The average water content was found to be 42%, with an observed range of
40.03% to 42.88%. Fig. 2.9 shows a typical variation of water content for cubical
specimens. Variation of the water content at the end of second stage isotropic
consolidation in the true triaxial device was less than 1%. Thus, very homogeneous and
repeatable specimens were obtained prior to the application of shear stress.
41 .21 42.23 42.27 42.03
5
42.58 42.78 42.73 42.88
5
42.07 42.77 42.67 42.14
6 Slice C
42.68 42.71 42.44 42.74
6 Slice A
42.40 42.54 42.52 42.15
7
42.76 42.31 42.08 42.63
7
Average 42.09%
41 .79 42.20 42.18 41 .14
42.33 42.29 42.17 41 .91
Range 40.03% to 42.88%
8
8
4 3 2 1
4 3 2 1
40.03 41 .67 41 .75 40.94
5
42.20 42.62 42.59 42.70
5
8 1
40.95 40.55 42.51 42.55 42.56 42.47 41 .50 41 .08
6 Slice D
42.52 42.49 42.48 42.36 42.67 42.31 42.74 42.41
6 Slice B
D
c
B
A
40.12 41 .09 40.93 40.08
7
42.31 42.26 42.18 41 .54
7
8
8
4 3 2 1
4 3 2 1
Figure 2.9 Water Content Analysis at the End of Slurry Consolidation (From Mandville and Penumadu, 2003)
27
Assembly and Saturation
After one dimensional slurry consolidation, the cubical clay spectmen was
assembled in the true triaxial device with minimum disturbance. Figure 2. 1 0 shows the
details of the procedure that was followed during the assembly.
(a) The dimension along each principal axis of the specimen was measured at three
different locations, and then averaged to get a representative length.
(b) Filter paper was applied on the six faces of specimen for proper drainage during
the consolidation stage. The size of filter paper was kept slightly larger than the
size of specimen face in order to have them interconnected by overlapping. This
arrangement allowed the water collected from each face during consolidation to
move freely towards the outlet drain. The specimen faces were then wetted with
de-aired and deionized water to keep the specimen faces saturated and to stop the
filter paper movement during the handling of the specimen.
(c) Filter paper was applied on the inlet and outlet drain lines to protect them from
getting clogged from clay particles. Three axes were identified on the space
frame, x, y and z, and the specimen was placed on the space frame such that the
cr1-axis at the end of slurry consolidation coincided with z-axis.
(d) The location of the specimen was then adjusted to make it approximately at the
center of the cuboidal space frame. The outlet drain line was allowed to rest on
top face of the specimen.
28
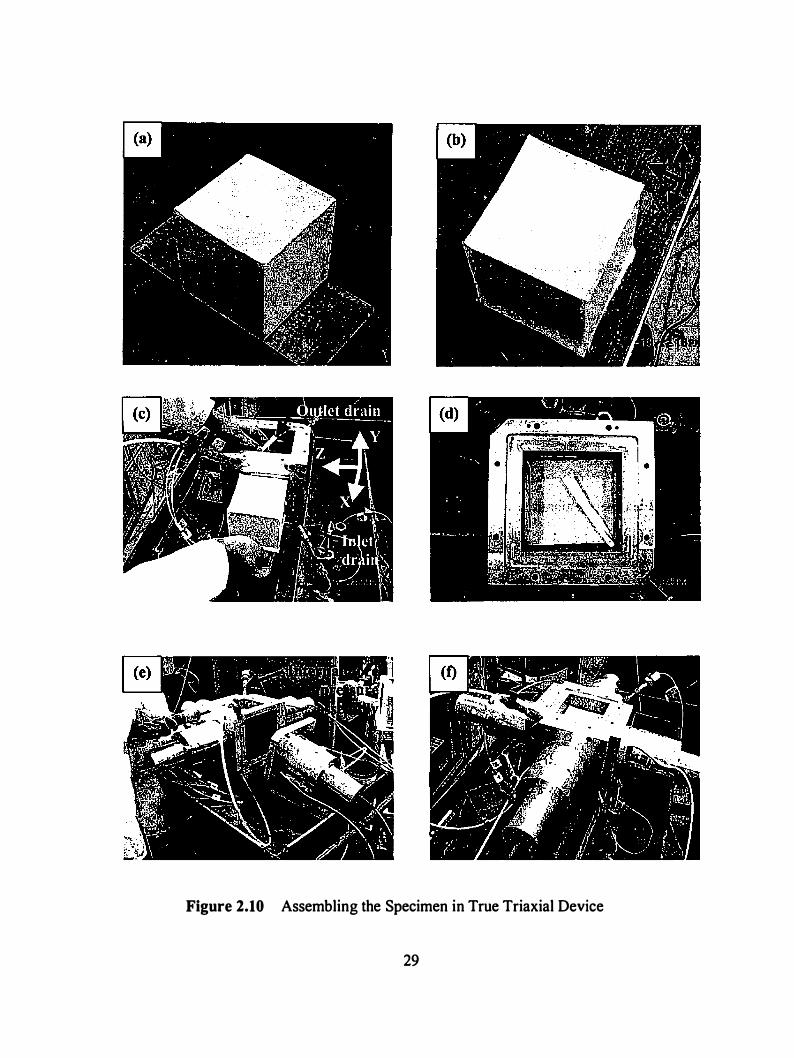
Figure 2.10 Assembling the Specimen in True Triaxial Device
29
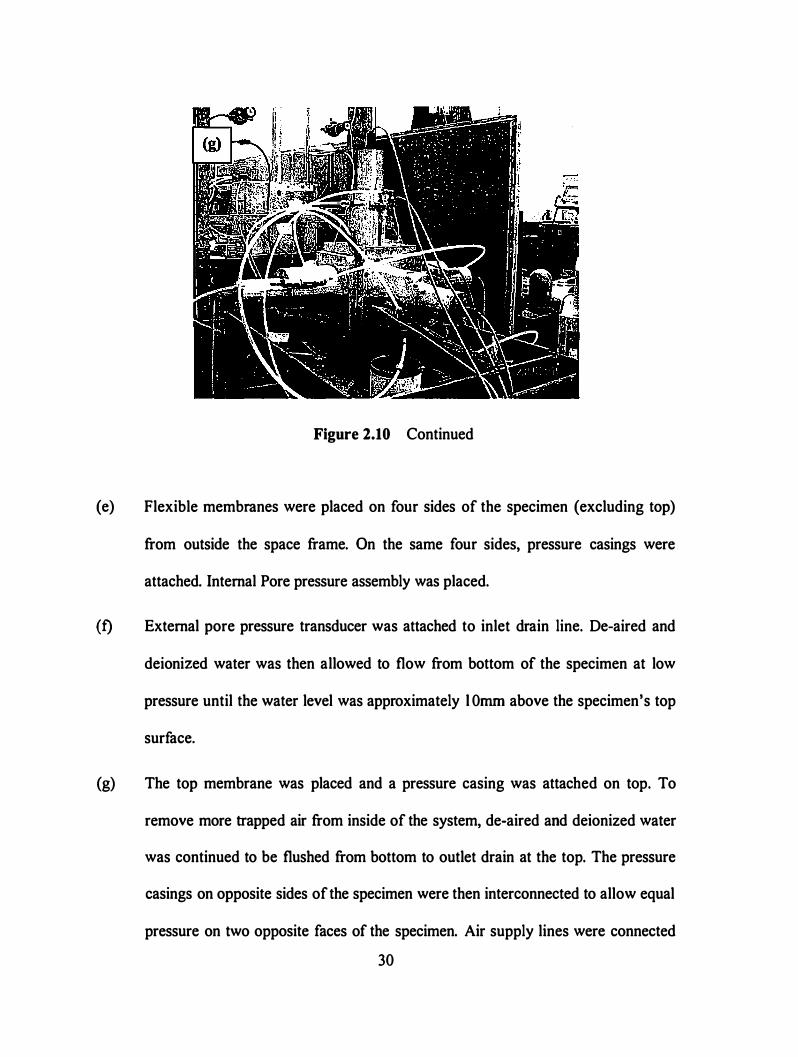
Figure 2.10 Continued
(e) Flexible membranes were placed on four sides of the specimen (excluding top)
from outside the space frame. On the same four sides, pressure casings were
attached. Internal Pore pressure assembly was placed.
(f) External pore pressure transducer was attached to inlet drain line. De-aired and
deionized water was then allowed to flow from bottom of the specimen at low
pressure until the water level was approximately l Omm above the specimen's top
surface.
(g) The top membrane was placed and a pressure casing was attached on top. To
remove more trapped air from inside of the system, de-aired and deionized water
was continued to be flushed from bottom to outlet drain at the top. The pressure
casings on opposite sides of the specimen were then interconnected to allow equal
pressure on two opposite faces of the specimen. Air supply lines were connected 30
to each axis of the frame, and the corresponding pressure transducers were
attached. All transducers and L VDTs were then connected to the Data Acquisition
System; which connected the computer to the assembled system.
Using the controls from computer, a small pressure of 1 kPa was applied
isotropically on the specimen, while the inlet drain was closed. This allowed the water
and the remaining air bubbles from around the specimen to come out through the outlet
drain at top. After reaching an equilibriated state (water stopped coming out from top),
more water was flushed from the bottom. This whole process was then repeated at the
isotropic seating pressure of 35kPa. At the end of this process, it was ensured that no
more air bubbles were observed in the drain lines. The specimens were left in this state
for few hours to reach equilibrium at an isotropic confining pressure of 35 kPa.
After assembly, the specimens were saturated using backpressure. In this process,
the back pressure was increased incrementally. For each backpressure increment, the
specimen was allowed to equilibriate, and then the Skempton's pore pressure parameter
B was checked by increasing confining pressure on the specimen by an increment of 35
kPa under undrained condition. Skempton's parameter B obtained from the internal pore
pressure measurements using a hypodermic needle agreed well with that obtained from
the external pore pressure measurements. A minimum B-value of 0.98 was used as the
criteria for ensuring full saturation. A constant back pressure of 1 38 kPa was used during
saturation stage for all the tests performed in this study, at which the condition for desired
B-value was achieved.
3 1
Summary
A flexible boundary electro-pneumatic true triaxial system with independent
control of the three principal stresses was used in the current study to evaluate the three
dimensional mechanical behavior of a cohesive soil. This device uses a Proportional -
Integral - Differential (PID) based closed loop control algorithm to maintain the desired
testing conditions. A wide range of stress or strain states can be achieved using this
system. The use of PID algorithm allows for precise, repeatable control with minimal
operator involvement. It was found that the PID parameters should be properly tuned for
accurate control, and they need to be changed with the specimen's stiffuess. This device
has the ability to measure both the internal and external pore pressures for a I 02 mm
cubical specimen and uses custom developed Butyl rubber membranes. Measurement of
the internal pore pressure was accomplished using a needle piezometer. Issues related to
the interference of the flexible membranes, and the air diffusion across flexible
membranes were avoided. A 3mm thick membrane made of butyl rubber was found to be
adequate. Membrane compliance in strain computations was determined by performing
compression tests on high strength metal block specimen. The strain corrections
corresponding to membrane compliance were found to have little influence on the
accuracy of total strain measured during a test on soil specimen.
The remolded cubical specimens of kaolin clay were obtained by Ko consolidation
of 1 55% water content slurry, and the procedure was described in this chapter. The
specimens obtained from this procedure were found to be uniform and homogeneous.
The specimens used for testing were saturated using backpressure; and the Skemption's
parameter B=0.98 was used as the minimum criteria to ensure full saturation. 32
Chapter 3. Three-Dimensional Behavior of Normally
Consolidated Kaolin Clay
This chapter is a slightly revised version of a paper submitted to the Canadian
Geotechnical Journal in 2003 by Amit Prashant and Dayakar Penumadu:
Prashant, A., and Penumadu, D. "A laboratory study of normally consolidated
Kaolin clay." In review, Canadian Geotechnical Journal.
My primary contribution to this paper includes ( I ) selection of the topic and
development of the problem into a work relevant to my study of constitutive behavior of
cohesive soils, (2) identification of the study areas, (3) gathering and interpretation of
literature, (4) performing laboratory experiments, (5) interpretation and analysis of test
results, (6) associated writing.
Abstract
In recent years many researchers have attempted to address the need for a
comprehensive understanding of the three dimensional mechanical behavior of frictional
materials. Advances in testing methods have added the capability of studying various
aspects of generalized stress-strain behavior in a controlled environment. Strain
controlled true triaxial undrained tests on normally consolidated kaolin clay are
performed in this study using a fully automated flexible boundary experimental setup
with real-time feedback control system. Influence of the intermediate principal stress and
principal stress rotation on the stress-strain-strength and pore pressure behavior is
investigated considering the occurrence of strain localization within the specimen. The
strength behavior observed in this study for kaolin clay is used to evaluate existing failure
33
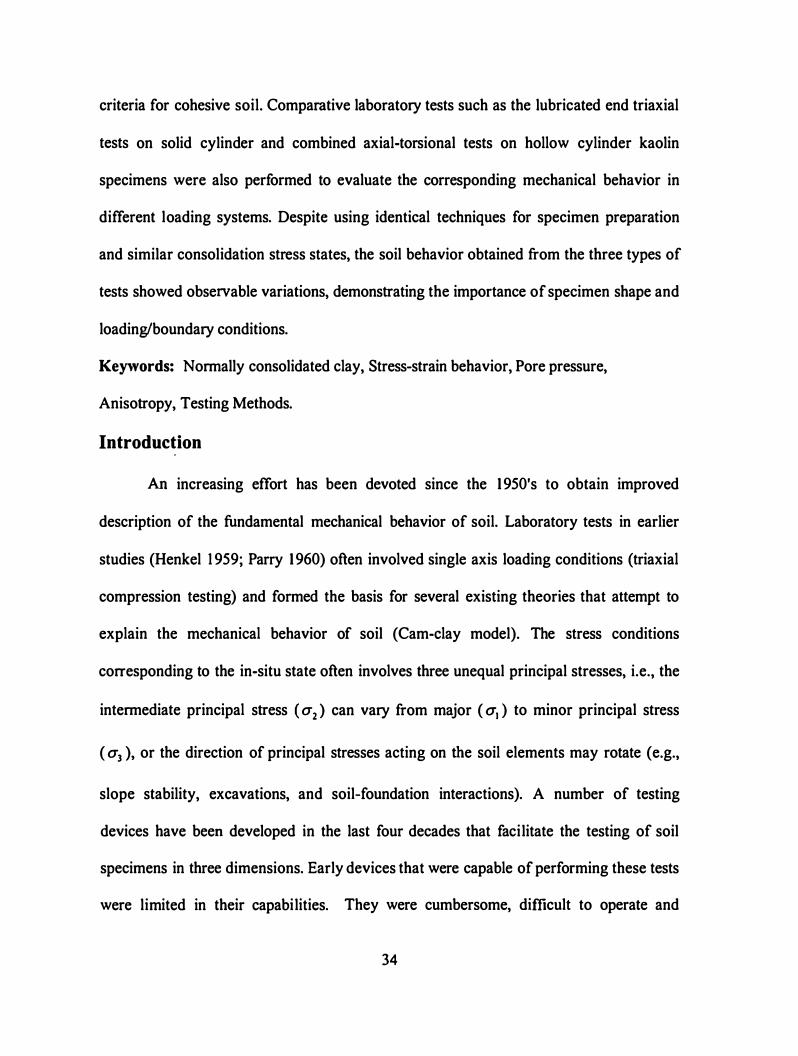
criteria for cohesive soil. Comparative laboratory tests such as the lubricated end triaxial
tests on solid cylinder and combined axial-torsional tests on hollow cylinder kaolin
specimens were also performed to evaluate the corresponding mechanical behavior in
different loading systems. Despite using identical techniques for specimen preparation
and similar consolidation stress states, the soil behavior obtained from the three types of
tests showed observable variations, demonstrating the importance of specimen shape and
loading/boundary conditions.
Keywords: Normally consolidated clay, Stress-strain behavior, Pore pressure,
Anisotropy, Testing Methods.
Introduction
An increasing effort has been devoted since the 1 950's to obtain improved
description of the fundamental mechanical behavior of soil. Laboratory tests in earlier
studies (Henkel 1 959; Parry 1960) often involved single axis loading conditions (triaxial
compression testing) and formed the basis for several existing theories that attempt to
explain the mechanical behavior of soil (Cam-clay model). The stress conditions
corresponding to the in-situ state often involves three unequal principal stresses, i.e., the
intermediate principal stress ( a 2 ) can vary from major ( a1 ) to minor principal stress
( a3 ), or the direction of principal stresses acting on the soil elements may rotate (e.g.,
slope stability, excavations, and soil-foundation interactions). A number of testing
devices have been developed in the last four decades that facilitate the testing of soil
specimens in three dimensions. Early devices that were capable of performing these tests
were limited in their capabilities. They were cumbersome, difficult to operate and
34
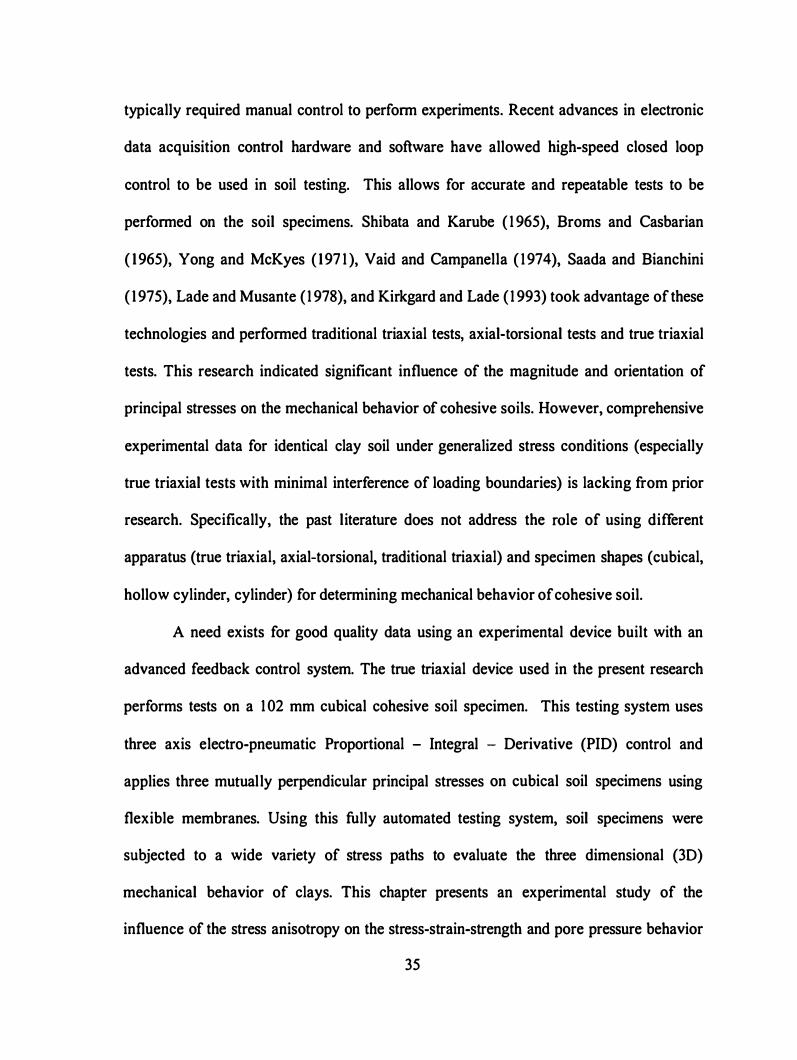
typically required manual control to perform experiments. Recent advances in electronic
data acquisition control hardware and software have allowed high-speed closed loop
control to be used in soil testing. This allows for accurate and repeatable tests to be
performed on the soil specimens. Shibata and Karube ( 1 965), Broms and Casbarian
( 1 965), Yong and McKyes ( 197 1 ), Vaid and Campanella ( 1 974), Saada and Bianchini
( 1 975), Lade and Musante ( 1 978), and Kirkgard and Lade ( 1 993) took advantage of these
technologies and performed traditional triaxial tests, axial-torsional tests and true triaxial
tests. This research indicated significant influence of the magnitude and orientation of
principal stresses on the mechanical behavior of cohesive soils. However, comprehensive
experimental data for identical clay soil under generalized stress conditions (especially
true triaxial tests with minimal interference of loading boundaries) is lacking from prior
research. Specifically, the past literature does not address the role of using different
apparatus (true triaxial, axial-torsional, traditional triaxial) and specimen shapes (cubical,
hollow cylinder, cylinder) for determining mechanical behavior of cohesive soil.
A need exists for good quality data using an experimental device built with an
advanced feedback control system. The true triaxial device used in the present research
performs tests on a 1 02 mm cubical cohesive soil specimen. This testing system uses
three axis electro-pneumatic Proportional - Integral - Derivative (PID) control and
applies three mutually perpendicular principal stresses on cubical soil specimens using
flexible membranes. Using this fully automated testing system, soil specimens were
subjected to a wide variety of stress paths to evaluate the three dimensional (3D)
mechanical behavior of clays. This chapter presents an experimental study of the
influence of the stress anisotropy on the stress-strain-strength and pore pressure behavior
35
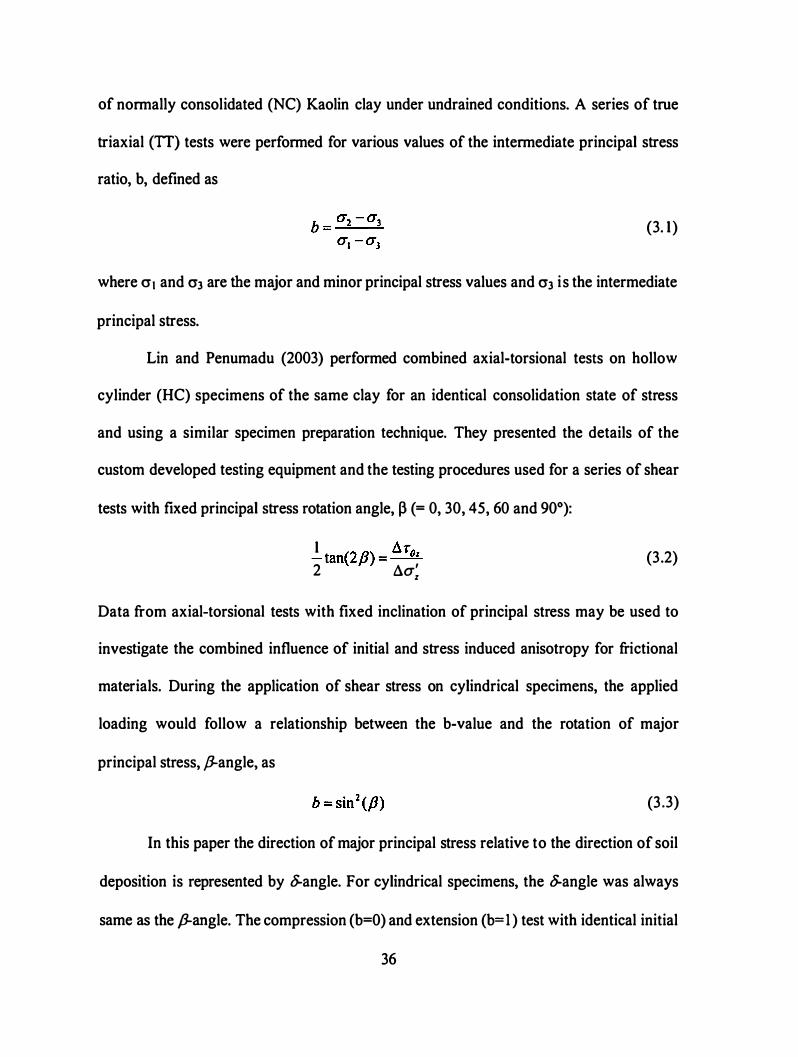
of normally consolidated (NC) Kaolin clay under undrained conditions. A series of true
triaxial {TT) tests were performed for various values of the intermediate principal stress
ratio, b, defined as
(3. 1 )
where crt and 0'3 are the major and minor principal stress values and 0'3 i s the intermediate
principal stress.
Lin and Penumadu (2003) performed combined axial-torsional tests on hollow
cylinder (HC) specimens of the same clay for an identical consolidation state of stress
and using a similar specimen preparation technique. They presented the details of the
custom developed testing equipment and the testing procedures used for a series of shear
tests with fixed principal stress rotation angle, � (= 0, 30, 45, 60 and 90°):
I 6:r - tan(2P) = � 2 !:J.a'
z
(3.2)
Data from axial-torsional tests with fixed inclination of principal stress may be used to
investigate the combined influence of initial and stress induced anisotropy for frictional
materials. During the application of shear stress on cylindrical specimens, the applied
loading would follow a relationship between the b-value and the rotation of major
principal stress, P-angle, as
(3 .3)
In this paper the direction of major principal stress relative to the direction of soil
deposition is represented by 8-angle. For cylindrical specimens, the 8-angle was always
same as the p.angle. The compression (b=O) and extension (b= 1 ) test with identical initial
36
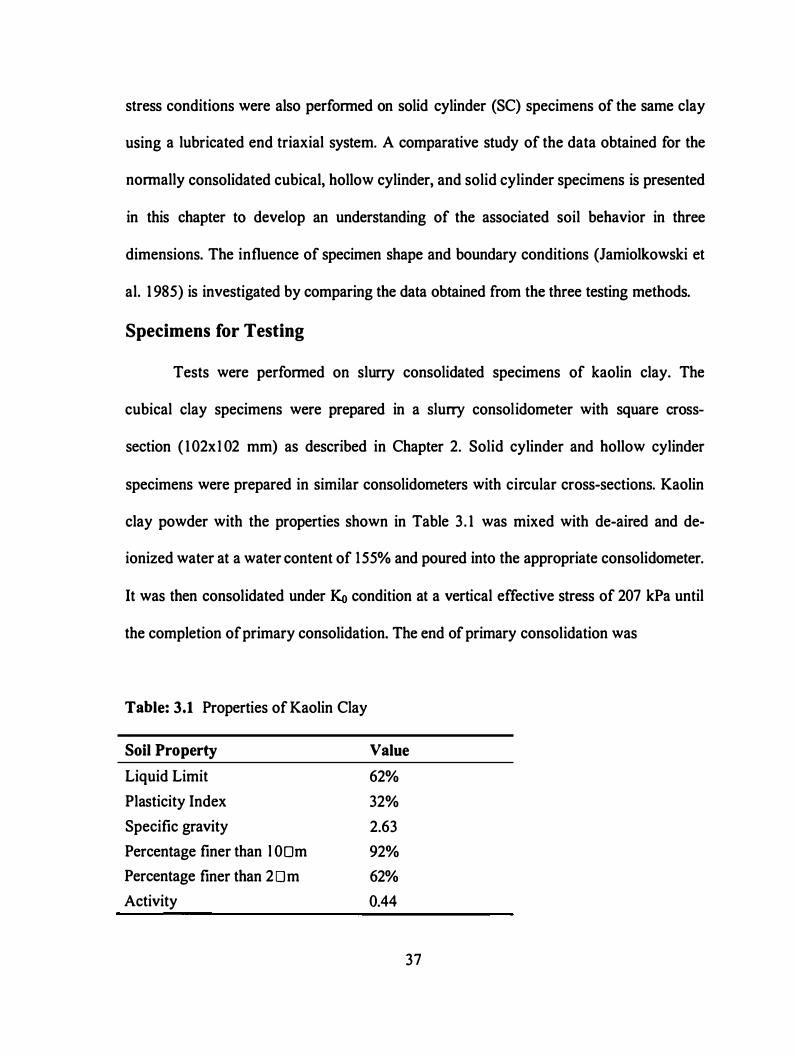
stress conditions were also perfonned on solid cylinder (SC) specimens of the same clay
using a lubricated end triaxial system. A comparative study of the data obtained for the
nonnally consolidated cubical, hollow cylinder, and solid cylinder specimens is presented
in this chapter to develop an understanding of the associated soil behavior in three
dimensions. The influence of specimen shape and boundary conditions (Jamiolkowski et
al. 1 985) is investigated by comparing the data obtained from the three testing methods.
Specimens for Testing
Tests were perfonned on slurry consolidated specimens of kaolin clay. The
cubical clay specimens were prepared in a slurry consolidometer with square cross-
section ( 1 02x 1 02 mm) as described in Chapter 2. Solid cylinder and hollow cylinder
specimens were prepared in similar consolidometers with circular cross-sections. Kaolin
clay powder with the properties shown in Table 3. 1 was mixed with de-aired and de-
ionized water at a water content of 155% and poured into the appropriate consolidometer.
It was then consolidated under Ko condition at a vertical effective stress of 207 kPa until
the completion of primary consolidation. The end of primary consolidation was
T able: 3.1 Properties of Kaolin Clay
Soil P rop erty
Liquid Limit
Plasticity Index
Specific gravity
Percentage finer than l OOm
Percentage finer than 2 D m
Activity
Value
62%
32%
2.63
92%
62%
0.44
37
determined using the square root of time method (ASTM 02435-96) from consolidation
test data. The specimen was then extruded with minimum disturbance and the desired
height of the specimen was obtained by carefully trimming the excess material. In this
research, the cubical specimen had three sides of 1 02 mm long, and full cylinder
specimen had a height of l OOmm and base diameter of 100 mm (HID= 1 ). Rowe and
Barden ( 1964) showed that the lubricated end triaxial tests performed best for the
cylindrical specimens with slender ness ratio (HID) of 1 . The HID = I provided
appreciably stable geometry, which led to uniform distribution of stress and deformation
throughout the test. The typical height of the HC specimen was about 230 mm, outer
radius, 50.8 mm and inner radius, 35.6 mm. The dimensions of HC specimen were
chosen as per the procedure.recommended by Saada (1 988).
Test Systems and Testing Procedures
T rue T riaxial System
True triaxial tests were performed using a device recently developed by
Mandeville and Penumadu (2003) that applies three mutually perpendicular principal
stresses on cubical soil specimens using flexible membrane boundaries. Three axes were
identified on the space frame, x, y and z, and the specimens were placed on the space
frame such that the cr1-axis at the end of slurry consolidation coincides with the z-axis.
Details of the true triaxial device and the procedure of specimen assembly were discussed
in Chapter 2. After assembly, the specimens were saturated using backpressure. A
minimum B-value (Skempton's pore pressure parameter) of 0.98 was used as the criteria
for ensuring full saturation. The Kaolin clay specimens were then hydrostatically
38
(isotropically) consolidated to 275 kPa resulting in NC cubical clay specimens. A strain .
rate of 0.05%/min along crt-axis was found suitable for present clay to ensure pore
pressure equilibrium under undrained condition. In order to ensure a constant b value
(equation 3 . 1 ), the required cr2 was generated along the y-axis in a stress control mode.
During shearing, the normal stress was recorded in all the three principal directions.
Deformation was recorded on all the six faces of the specimen and the values along
opposite faces were averaged to get the strain in three directions.
A series of consolidated undrained cubical triaxial tests (Tl -5) on remolded NC
Kaolin clay specimen was performed for b=O, 0.25, 0.5, 0. 75 and 1 .0, and the tests were
repeated for each b-value in order to ensure the reproducibility of experimental data. All
of these tests were compressive in nature in terms of total stress applied on the specimens
during shearing. This means that even for the b= I case, the shear stress was applied by
increasing the same amount of normal stress in crt and cr2 directions and maintaining a
constant total stress in the cr3 direction. An extension test (T6) was also performed on the
cubical specimen, which is another case of b= I . For this test, at the end of isotropic
consolidation, principal stress along z-direction was decreased to simulate the extension
stress path that is often used for cylindrical specimens. The directions of principal
stresses acting on the specimen during shearing in the T1-5 and T6 tests are shown in Fig
3. 1 .
Lubricated end T riaxial and Axial-Torsional T est Setup
Lubricated end triaxial tests with radial drainage were performed on cylindrical
kaolin clay specimens with diameter of 100 mm and a height of I 00 mm (HID = 1 .0).
39
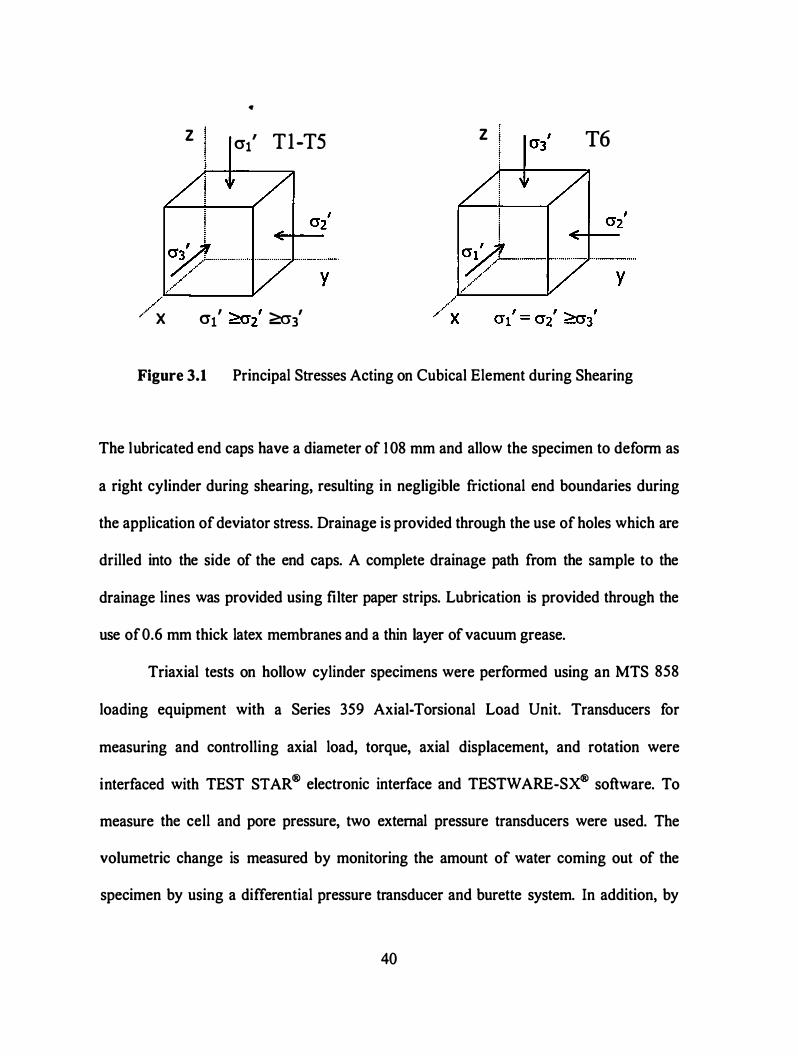
z
•
crt' Tl-T5
Y--- - -_:� / ,..... X cr1' '?!cr2' '?!cr3'
z T6
Figure 3.1 Principal Stresses Acting on Cubical Element during Shearing
The lubricated end caps have a diameter of 1 08 mm and allow the specimen to deform as
a right cylinder during shearing, resulting in negligible frictional end boundaries during
the application of deviator stress. Drainage is provided through the use of holes which are
drilled into the side of the end caps. A complete drainage path from the sample to the
drainage lines was provided using filter paper strips. Lubrication is provided through the
use of0.6 mm thick latex membranes and a thin layer of vacuum grease.
Triaxial tests on hollow cylinder specimens were performed using an MTS 858
loading equipment with a Series 359 Axial-Torsional Load Unit. Transducers for
measuring and controlling axial load, torque, axial displacement, and rotation were
interfaced with TEST STAR® electronic interface and TESTW ARE-SX® software. To
measure the cell and pore pressure, two external pressure transducers were used. The
volumetric change is measured by monitoring the amount of water coming out of the
specimen by using a differential pressure transducer and burette system. In addition, by
40
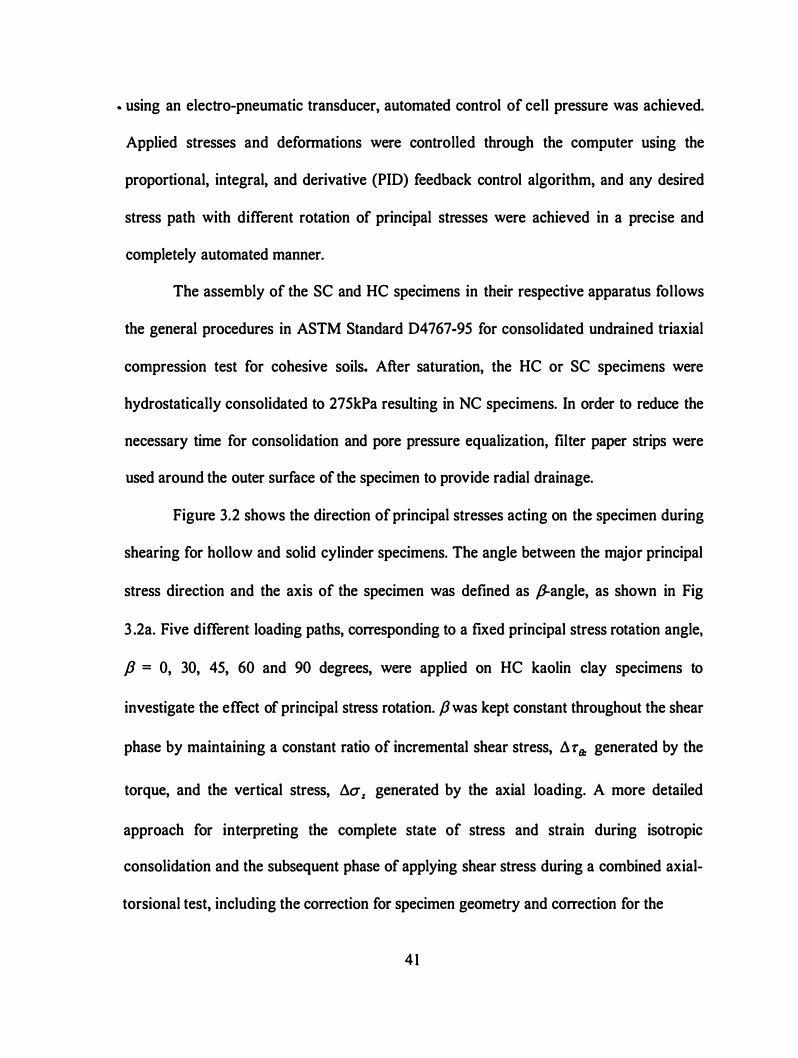
.. using an electro-pneumatic transducer, automated control of cell pressure was achieved.
Applied stresses and deformations were controlled through the computer using the
proportional, integral, and derivative (PID) feedback control algorithm, and any desired
stress path with different rotation of principal stresses were achieved in a precise and
completely automated manner.
The assembly of the SC and HC specimens in their respective apparatus follows
the general procedures in ASTM Standard 04767-95 for consolidated undrained triaxial
compression test for cohesive soils. After saturation, the HC or SC specimens were
hydrostatically consolidated to 275kPa resulting in NC specimens. In order to reduce the
necessary time for consolidation and pore pressure equalization, filter paper strips were
used around the outer surface of the specimen to provide radial drainage.
Figure 3.2 shows the direction of principal stresses acting on the specimen during
shearing for hollow and solid cylinder specimens. The angle between the major principal
stress direction and the axis of the specimen was defined as ,B-angle, as shown in Fig
3 .2a. Five different loading paths, corresponding to a fixed principal stress rotation angle,
P = 0, 30, 45, 60 and 90 degrees, were applied on HC kaolin clay specimens to
investigate the effect of principal stress rotation. p was kept constant throughout the shear
phase by maintaining a constant ratio of incremental shear stress, .6. r a: generated by the
torque, and the vertical stress, .6.a z generated by the axial loading. A more detailed
approach for interpreting the complete state of stress and strain during isotropic
consolidation and the subsequent phase of applying shear stress during a combined axial
torsional test, including the correction for specimen geometry and correction for the
4 1
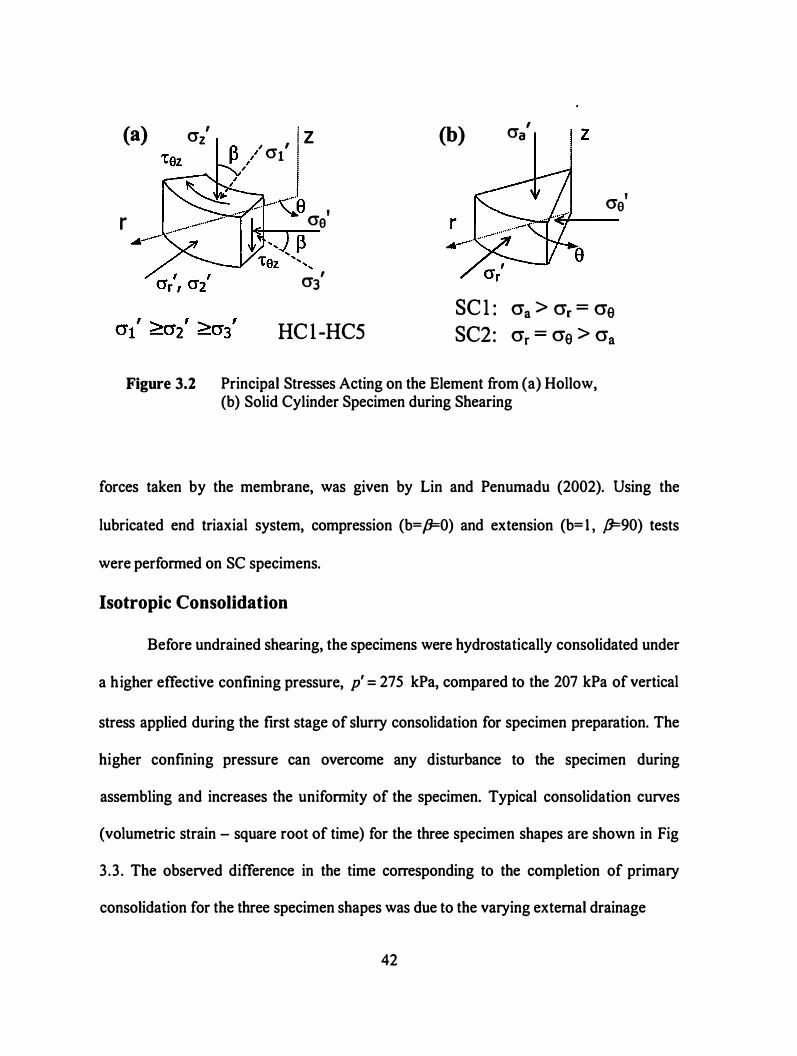
(a)
r
' O'z l z A ' cr I i 1-' / l j , :
- -�� � cre'
O'J '
HC 1 -HC5
(b) I O'a
cre'
SC I : cra > crr = cre
SC2: crr = cre > cra
Figure 3.2 Principal Stresses Acting on the Element from (a) Hollow, (b) Solid Cylinder Specimen during Shearing
forces taken by the membrane, was given by Lin and Penumadu (2002). Using the
lubricated end triaxial system, compression (b=.D=O) and extension (b= I , .8=90) tests
were performed on SC specimens.
Isotropic Consolidation
Before undrained shearing, the specimens were hydrostatically consolidated under
a higher effective confining pressure, p' = 275 kPa, compared to the 207 kPa of vertical
stress applied during the first stage of slurry consolidation for specimen preparation. The
higher confining pressure can overcome any disturbance to the specimen during
assembling and increases the uniformity of the specimen. Typical consolidation curves
(volumetric strain - square root of time) for the three specimen shapes are shown in Fig
3 .3 . The observed difference in the time corresponding to the completion of primary
consolidation for the three specimen shapes was due to the varying external drainage
42
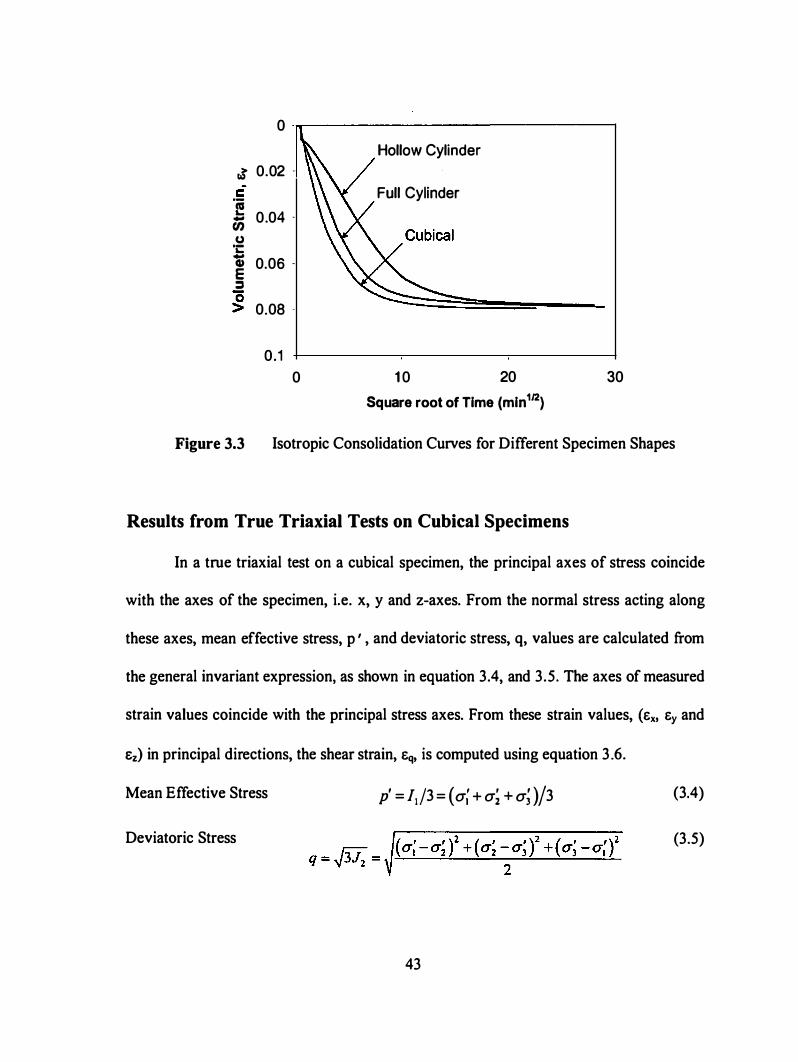
0 -�-------------------------------,
rl 0.02 . c ·� - 0 .04 . tn u
'L: -; E =
�
0.06 -
0.08 .
0.1 0
Hollow Cylinder
Full Cylinder
1 0 20 Square root of Time (min 112)
30
Figure 3.3 Isotropic Consolidation Curves for Different Specimen Shapes
Results from True Triaxial Tests on Cubical Specimens
In a true triaxial test on a cubical specimen, the principal axes of stress coincide
with the axes of the specimen, i.e. x, y and z-axes. From the normal stress acting along
these axes, mean effective stress, p ' , and deviatoric stress, q, values are calculated from
the general invariant expression, as shown in equation 3.4, and 3.5. The axes of measured
strain values coincide with the principal stress axes. From these strain values, (Ex, Ey and
Ez) in principal directions, the shear strain, Eq, is computed using equation 3 .6.
Mean Effective Stress p' = !J3 = (a; + a; + a; )j3 (3.4)
Deviatoric Stress (3.5)
43
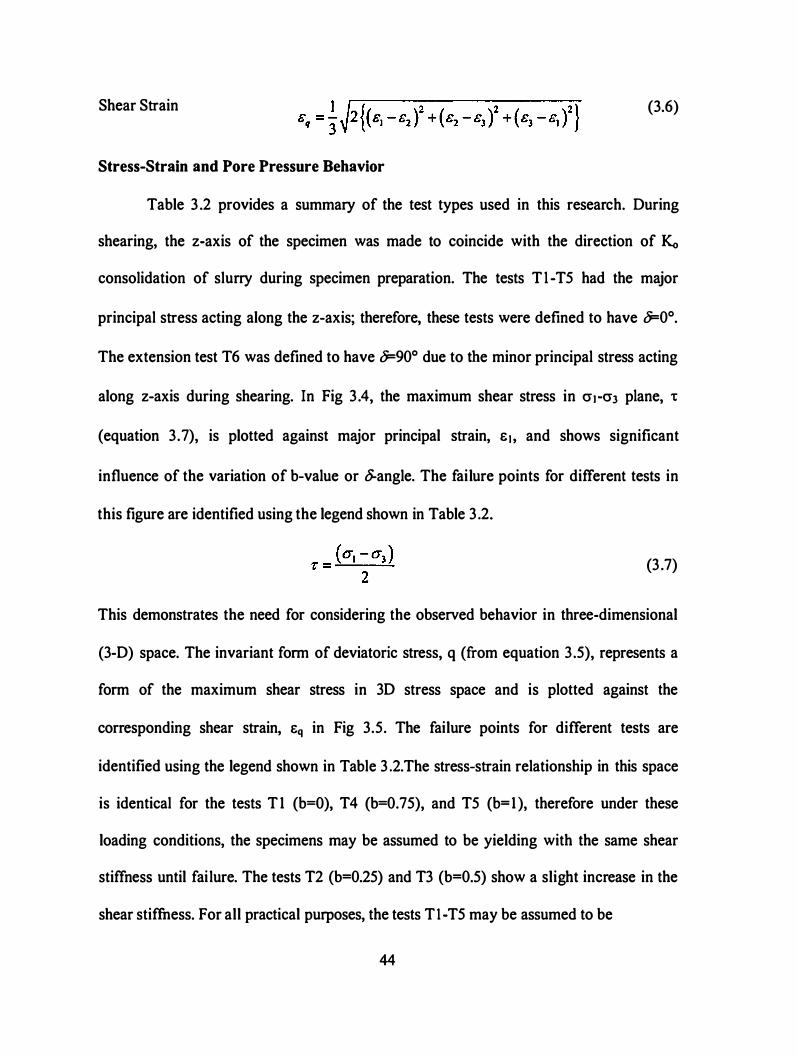
Shear Strain (3.6)
Stress-Strain and P ore P ressure Behavior
Table 3 .2 provides a summary of the test types used in this research. During
shearing, the z-axis of the specimen was made to coincide with the direction of Ko
consolidation of slurry during specimen preparation. The tests Tl -T5 had the major
principal stress acting along the z-axis; therefore, these tests were defined to have 0:0°.
The extension test T6 was defined to have 0:90° due to the minor principal stress acting
along z-axis during shearing. In Fig 3 .4, the maximum shear stress in cr1 -cr3 plane, -r
(equation 3.7), is plotted against major principal strain, s � , and shows significant
influence of the variation of b-value or 8-angle. The failure points for different tests in
this figure are identified using the legend shown in Table 3 .2.
(3 .7)
This demonstrates the need for considering the observed behavior in three-dimensional
(3-0) space. The invariant form of deviatoric stress, q (from equation 3 .5), represents a
form of the maximum shear stress in 30 stress space and is plotted against the
corresponding shear strain, Eq in Fig 3.5. The failure points for different tests are
identified using the legend shown in Table 3 .2.The stress-strain relationship in this space
is identical for the tests T l (b=O), T4 (b=0.75), and T5 (b=l ), therefore under these
loading conditions, the specimens may be assumed to be yielding with the same shear
stiffness until failure. The tests T2 (b=0.25) and T3 (b=0.5) show a slight increase in the
shear stiffness. For all practical purposes, the tests Tl -T5 may be assumed to be
44
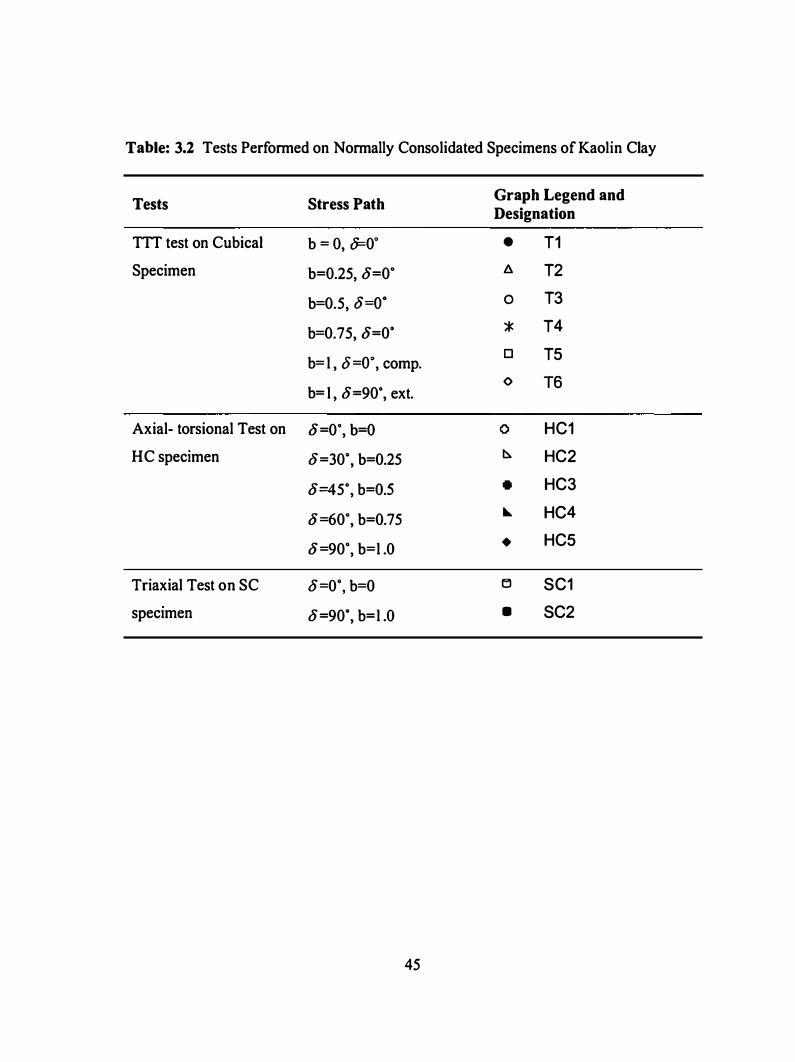
Table: 3.2 Tests Performed on Normally Consolidated Specimens of Kaolin Clay
T ests Stress P ath Grap h Legend and Designation
TTT test on Cubical b = 0, 0=0" • T1
Specimen b=0.25, §=0" fl. T2
b=0.5, o=o· 0 T3
b=0.75, §=0" '* T4
b= l , o=o·, comp. D T5
<> T6 b= l , §=90", ext.
Axial- torsional Test on §=0", b=O 0 HC1
HC specimen b =30"' b=0.25 � HC2
§=45", b=O.S • HC3
§=60", b=0.75 � HC4
§=90", b=l .O • HC5
Triaxial Test on SC §=0", b=O 1:) SC1
spectmen §=90", b=l .O • SC2
45
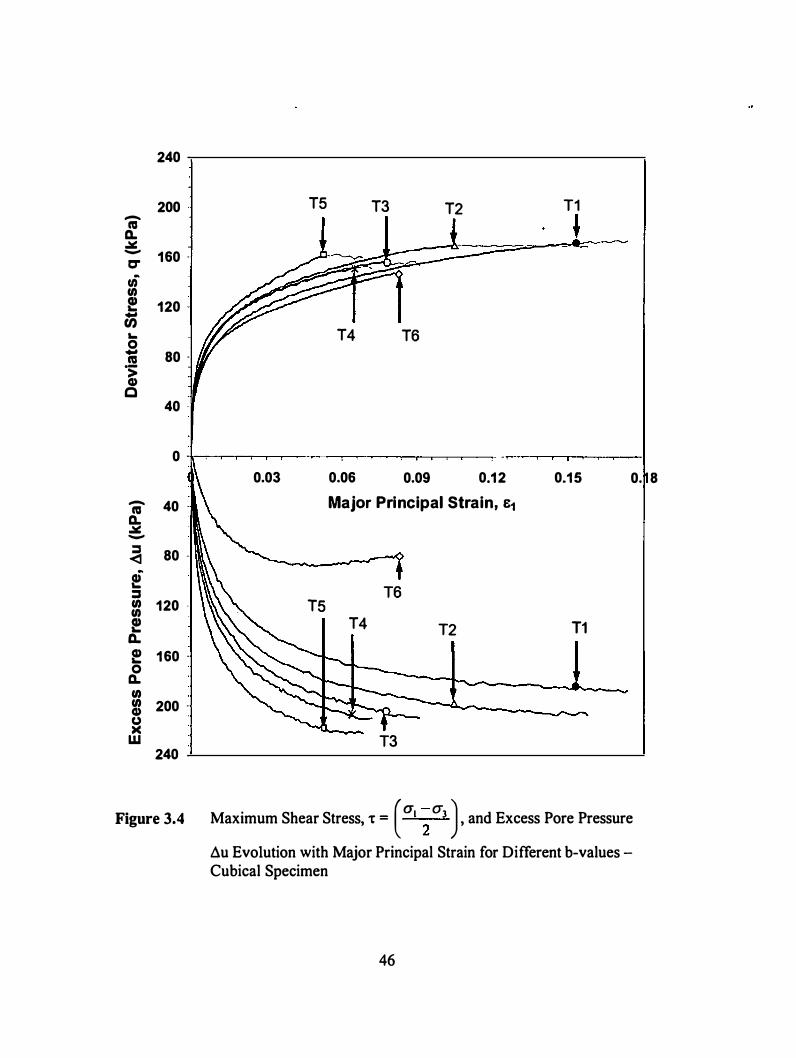
240 -
200 -ca ll. � - 160 -C" ti en l! 120 -rn ... 0 - 80 -ca ·:;: G) c
40
0 -
- 40 -ca ll. � -:::::J 80 -<:1 i :::::J en 120 -en l! ll. ! 1 60 -0 ll. en en 200 -G) u )(
w 240 -
T5
0.03
T5
T3
T4 T6
0.06 0.09
T2
0.1 2 Major Principal Strain, £1
T6 T4 T2
T3
T1 '
0.1 5 0. 8
T1
Figure 3.4 Maximum Shear Stress, 't = (a, ; o-3 ) , and Excess Pore Pressure
.6.u Evolution with Major Principal Strain for Different b-values Cubical Specimen
46
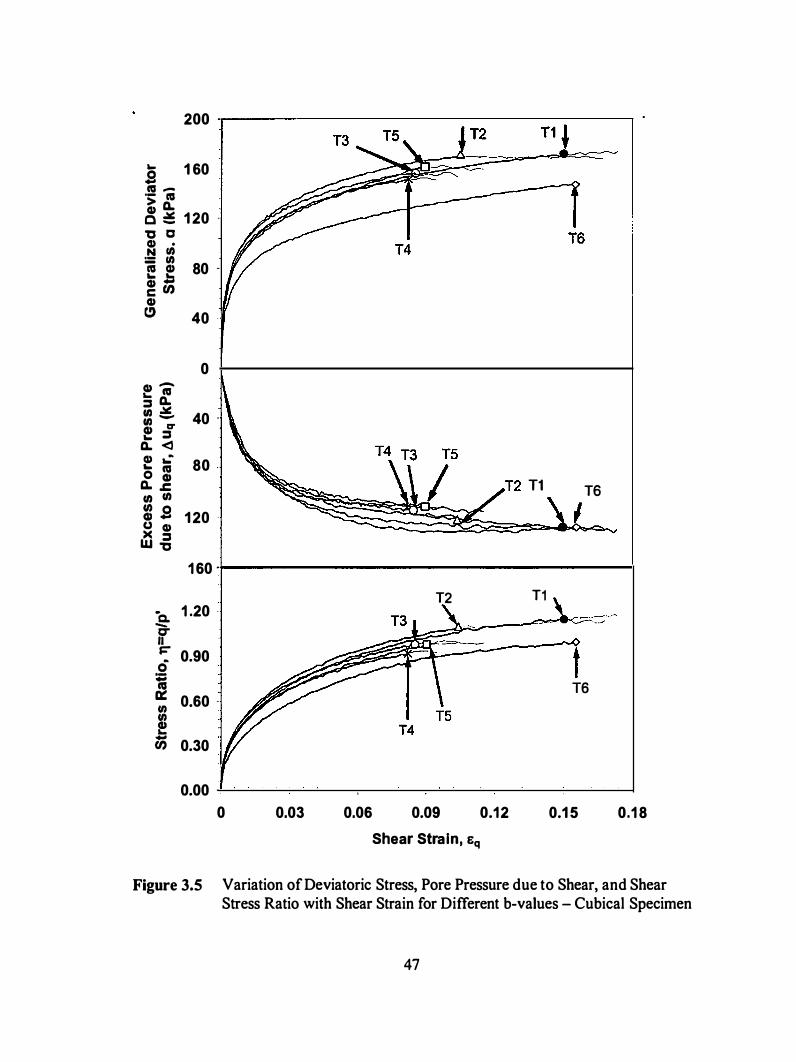
200
... 1 60 s ca -·- ca > a.. Q) c ::!: 1 20 -, c Q) •
N en = en ca Gl ... ,::, ! tn Q) e,
Q) -... ca = a.. , � , -Q) D" ... = a.. <l Q) .: ._ ca 0 Q)
O.. .c U) U) : s (J Q) >< = w ,
·a. -C" II � 0 :; a:: U) U) � -
(I)
80 -
40 -
0
40
80
1 20 -
1 60 -
1 .20 -
0.90
0.60 -
0.30
0.00 -
0
T2
0.03 0.06 0.09
Shear Strain, Eq
T2 T1 T6
T1
t T6
0.1 2 0.1 5 0.1 8
Figure 3.5 Variation ofDeviatoric Stress, Pore Pressure due to Shear, and Shear Stress Ratio with Shear Strain for Different b-values - Cubical Specimen
47
providing identical shear stress-strain response until failure when compared with the
response from the extension test, T6. Tests T l-T5 had the same orientation of principal
stress (o-angle) whereas the T6 had a rotation of 90°. It gives an indication that the stress
anisotropy under undrained condition may not have significant influence on the shear
behavior of soil when compared to the inherent anisotropy (induced during the specimen
preperation). A shear stress ratio can be defined by l'J, as the ratio of the shear stress, q,
and the mean effective stress, p ' . Soil is a pressure dependent material; therefore, in
order to study or characterize the shear behavior of soils, the shear stress ratio, l'J, can be
plotted against tq, as in Fig 3.5. A decreasing trend for l1 evolution may be observed with
increasing b-value from tests T 1 -T5, and the test T6 shows the lower limit of this trend.
Figure 3 .4 shows the variation of excess pore pressure, 6-u, generated during
shearing for different stress paths indicating a significant influence of b-value for
normally consolidated clay. Excess pore pressure increased with b-value for the tests with
compressive loading (Tl -T5) and showed much lower values for the extension test (T6).
During an undrained test on saturated soil specimen, the excess pore pressure is generated
in part due to a change in mean total stress applied to the specimen, while the other part is
related to the shear deformation (Henkel 1 960). When a saturated isotropic soil is
subjected to hydrostatic loading under undrained condition, the change in excess pore
pressure is equal to the change in mean total stress. Figure 3.6 shows the total and
effective stress paths followed during different types of undrained shear loading in this
study. The difference between the mean total stress and effective stress, at a given shear
stress level, corresponds to the pore pressure generated within the specimen. The change
48

200 �---------------------�--------� �u from
-lU � 1 50
-
C" -
U)
U) e 1 oo -U) '-0 -lU ·� 50
c
T1 T2
--- Total Stress Path - Effective Stress Path
0 �----�------------����----�--�
0 80 1 60 240 320 400
Mean Stress, p and p' (kPa)
Figure 3.6 Stress Path in q-p Space for the Loadings Applied on Cubical Specimens
in pore pressure due to the change in mean total stress is represented by Aup, and due to
the applied shear is represented by Auq (= -l:lp' ) . Figure 3.5 shows the evolution of Auq
with the shear strain. A decreasing trend of AUq evolution may be observed with the
increasing b-values; however, the extension test (T6) shows Auq close to T l test.
Failure Conditions
The failure point in this analysis is defined as the point of peak deviator stress just
before the specimen shears to large strains with negligible change in shear stress. The
specimens were observed to have strain localization at or beyond the peak deviator stress
location. Prashant and Penumadu (2003), for overconsolidated clay specimens, found that
a method for determining the onset of strain localization was to plot the variation of
49
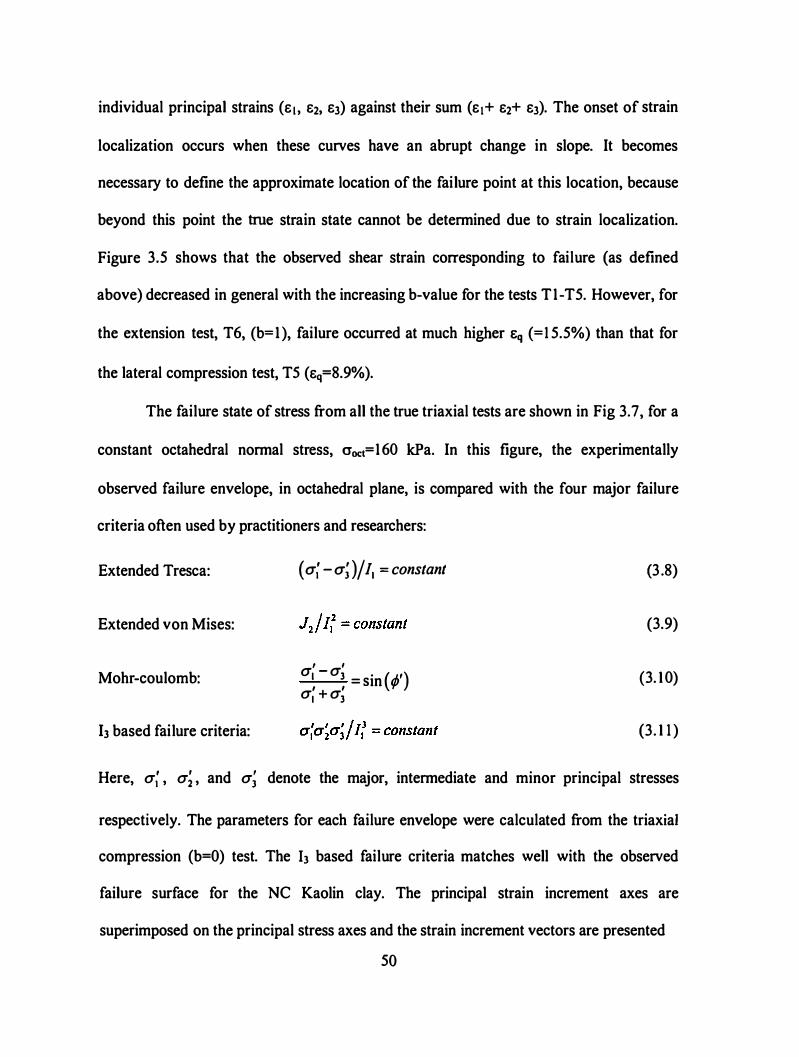
individual principal strains (s 1 , s2, s3) against their sum (s 1+ s2+ s3). The onset of strain
localization occurs when these curves have an abrupt change in slope. It becomes
necessary to define the approximate location of the failure point at this location, because
beyond this point the true strain state cannot be determined due to strain localization.
Figure 3.5 shows that the observed shear strain corresponding to failure (as defined
above) decreased in general with the increasing b-value for the tests Tl-T5. However, for
the extension test, T6, (b=l ), failure occurred at much higher Eq (=1 5.5%) than that for
the lateral compression test, TS (sq=8.9%).
The failure state of stress from all the true triaxial tests are shown in Fig 3.7, for a
constant octahedral normal stress, O"oct=160 kPa. In this figure, the experimentally
observed failure envelope, in octahedral plane, is compared with the four major failure
criteria often used by practitioners and researchers:
Extended Tresca:
Extended von Mises:
Mohr-coulomb:
h based failure criteria:
(a; -a; )/ /1 = constant
, , a, - a3 = sin (¢/) a' + a' I 3
(3 .8)
(3.9)
(3. 1 0)
(3. 1 1 )
Here, a; , a� , and a; denote the major, intermediate and minor principal stresses
respectively. The parameters for each failure envelope were calculated from the triaxial
compression (b=O) test. The h based failure criteria matches well with the observed
failure surface for the NC Kaolin clay. The principal strain increment axes are
superimposed on the principal stress axes and the strain increment vectors are presented 50
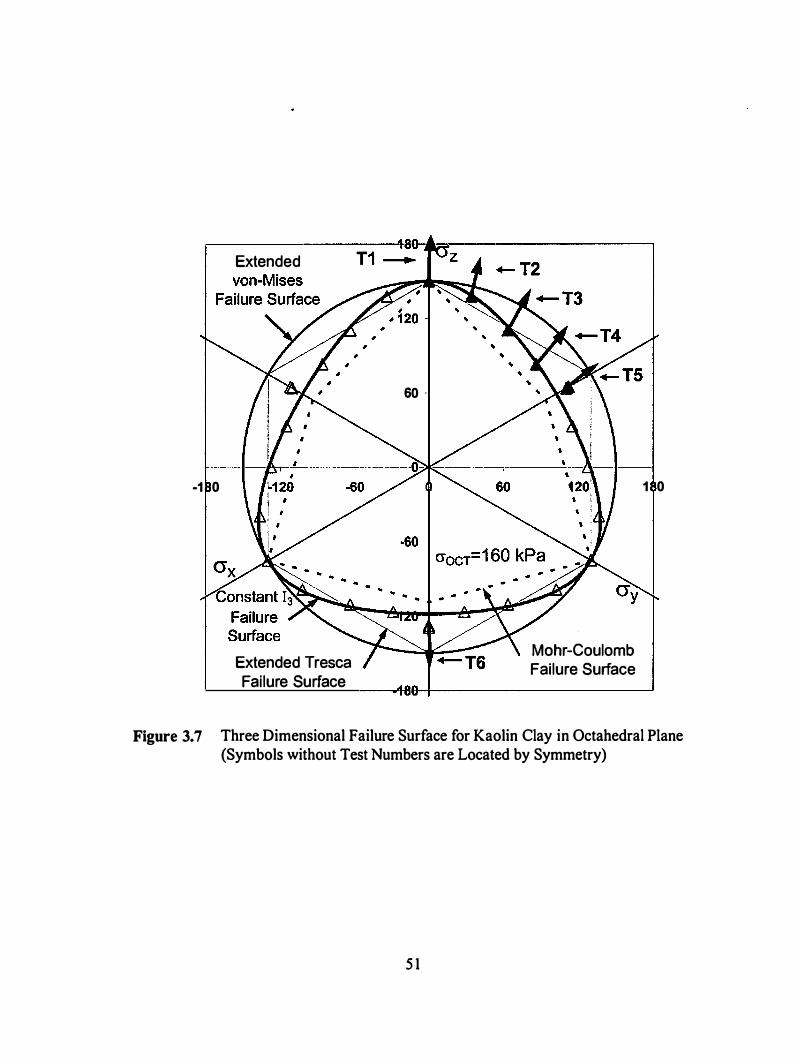
-1 0
Extended
Extended Tresca Failure Surface
, ..
60 -
Mohr-Coulomb Failure Surface
1 0
Figure 3.7 Three Dimensional Failure Surface for Kaolin Clay in Octahedral Plane (Symbols without Test Numbers are Located by Symmetry)
5 1
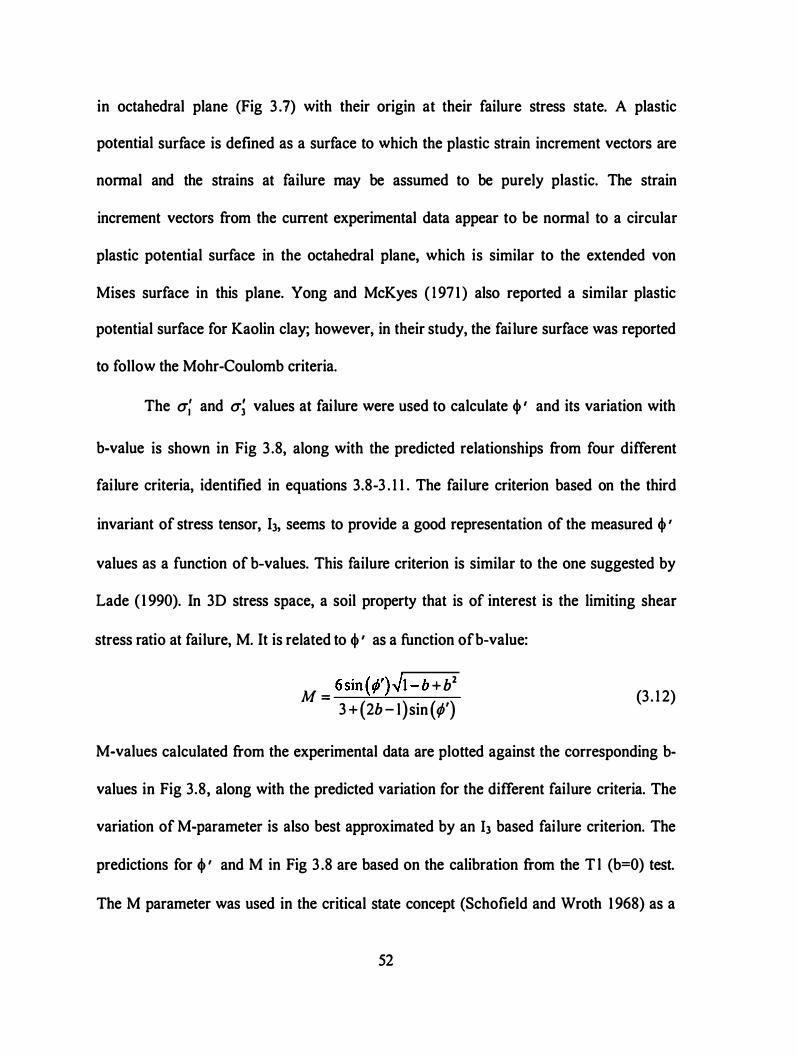
in octahedral plane (Fig 3 .7) with their origin at their failure stress state. A plastic
potential surface is defined as a surface to which the plastic strain increment vectors are
normal and the strains at failure may be assumed to be purely plastic. The strain
increment vectors from the current experimental data appear to be normal to a circular
plastic potential surface in the octahedral plane, which is similar to the extended von
Mises surface in this plane. Yong and McKyes ( 1 97 1 ) also reported a similar plastic
potential surface for Kaolin clay; however, in their study, the failure surface was reported
to follow the Mohr-Coulomb criteria.
The cr; and cr� values at failure were used to calculate <j) ' and its variation with
b-value is shown in Fig 3 .8, along with the predicted relationships from four different
failure criteria, identified in equations 3.8-3 . 1 1 . The failure criterion based on the third
invariant of stress tensor, 13, seems to provide a good representation of the measured <j) '
values as a function of b-values. This failure criterion is similar to the one suggested by
Lade ( 1 990). In 3D stress space, a soil property that is of interest is the limiting shear
stress ratio at failure, M. It is related to <j) ' as a function ofb-value:
M = 6sin {¢').JI -b +b2 3 + (2b - l)sin (¢')
(3 . 1 2)
M-values calculated from the experimental data are plotted against the corresponding b-
values in Fig 3.8, along with the predicted variation for the different failure criteria. The
variation of M-parameter is also best approximated by an h based failure criterion. The
predictions for <j) ' and M in Fig 3 .8 are based on the calibration from the T l (b=O) test.
The M parameter was used in the critical state concept (Schofield and Wroth 1 968) as a
52
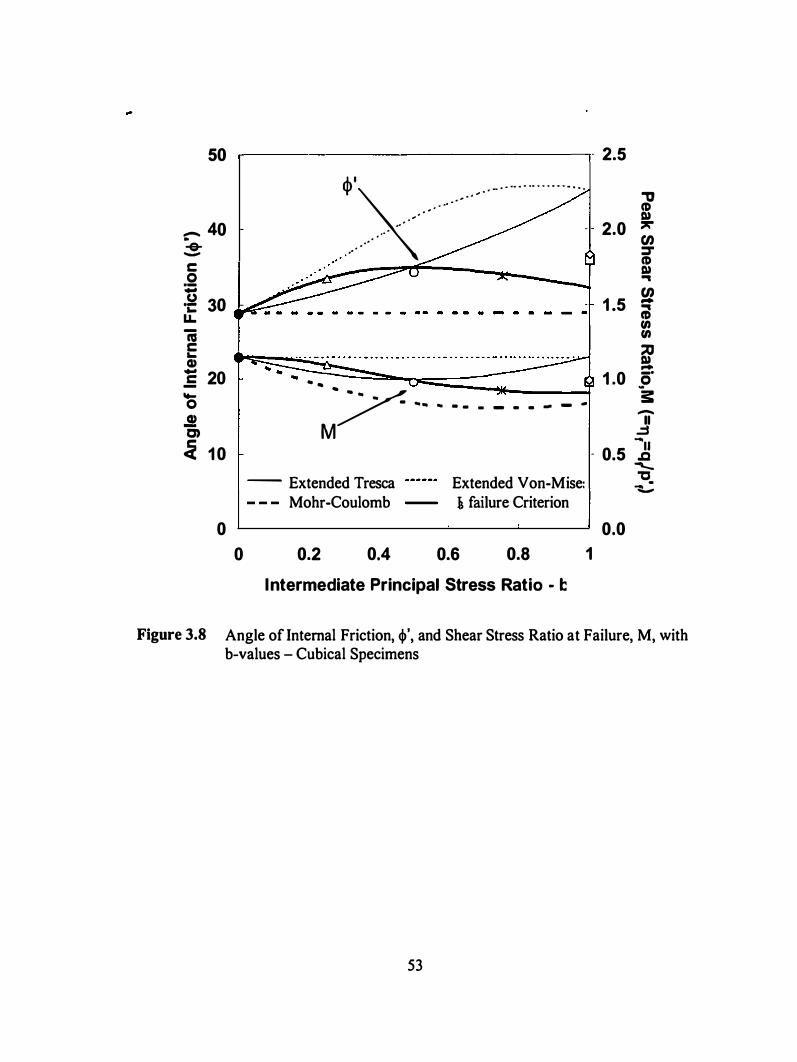
50
� 40 -e--c 0 � "i: 30
LL ni c
... CD :5 20
0 .!!! D)
.:t 1 0
0
.-------------------,- 2.5
0
<I>'� . . � · · - · · ·· · · ·· · · · · · · · · · ·
. . ... .. . � . .
. /
.. .. ... ,. -. ·
. . ·· .. . ·
.. .. .. /" . . - .. .. .. .. . _ _ _ _ _ _ _
M
-- Extended Tresca Mohr-Coulomb
Extended Von-Mise: i failure Criterion
., CD I» 2.0 � en :::r CD I» ..
� 1 .5 CiJ (/) (/) :::0 I» -
1 .0 fi s:
-II
..::s ....
- 0.5 ..g
0.0
"'"C.
�
0.2 0.4 0.6 0.8 1
Intermediate Principal Stress Ratio - 1::
Figure 3.8 Angle of lnternal Friction, cp', and Shear Stress Ratio at Failure, M, with b-values - Cubical Specimens
53
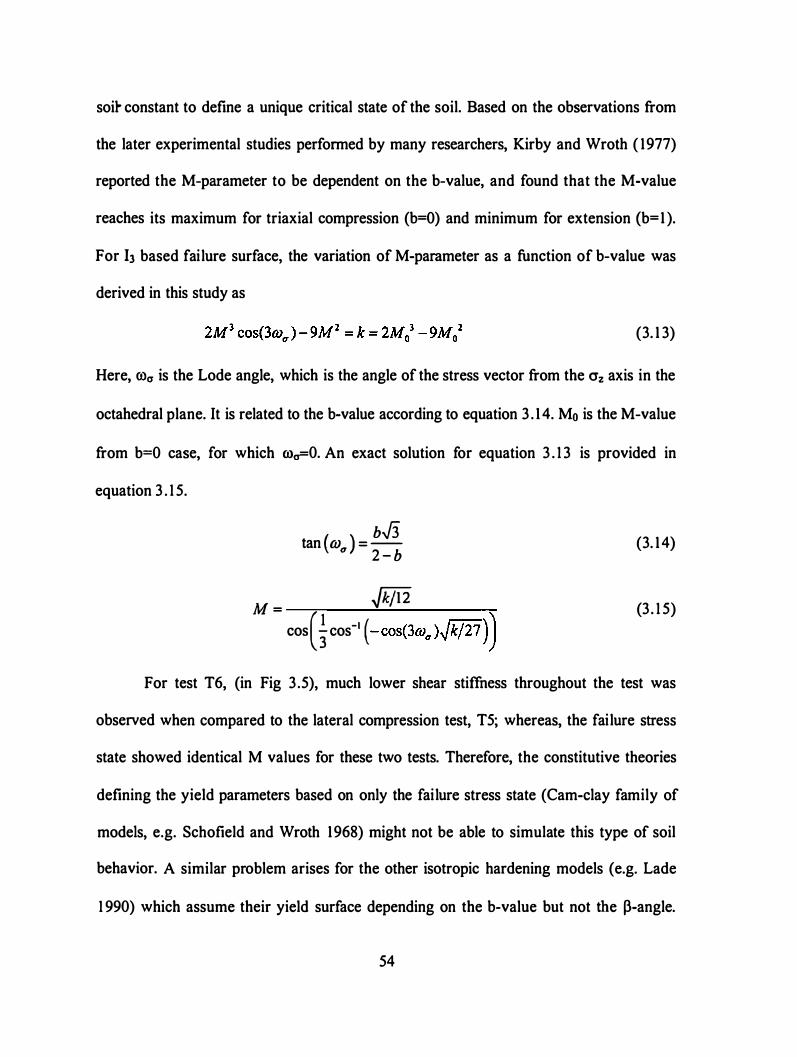
soir constant to define a unique critical state of the soil. Based on the observations from
the later experimental studies performed by many researchers, Kirby and Wroth ( 1977)
reported the M-parameter to be dependent on the b-value, and found that the M-value
reaches its maximum for triaxial compression (b=O) and minimum for extension {b= 1 ).
For h based failure surface, the variation of M-parameter as a function of b-value was
derived in this study as
(3. 1 3)
Here, COa is the Lode angle, which is the angle of the stress vector from the O'z axis in the
octahedral plane. It is related to the b-value according to equation 3 . 1 4. Mo is the M-value
from b=O case, for which roa=O. An exact solution for equation 3 . 1 3 is provided in
equation 3 . 1 5.
bJ3 tan (w ) =
a 2 - b
M = Jk71i cos(tcos-' ( - cos(3wa))k/27 ))
(3. 14)
(3 . 1 5)
For test T6, (in Fig 3 .5), much lower shear stiffness throughout the test was
observed when compared to the lateral compression test, T5; whereas, the failure stress
state showed identical M values for these two tests. Therefore, the constitutive theories
defining the yield parameters based on only the failure stress state (Cam-clay family of
models, e.g. Schofield and Wroth 1968) might not be able to simulate this type of soil
behavior. A similar problem arises for the other isotropic hardening models (e.g. Lade
1 990) which assume their yield surface depending on the b-value but not the �-angle.
54
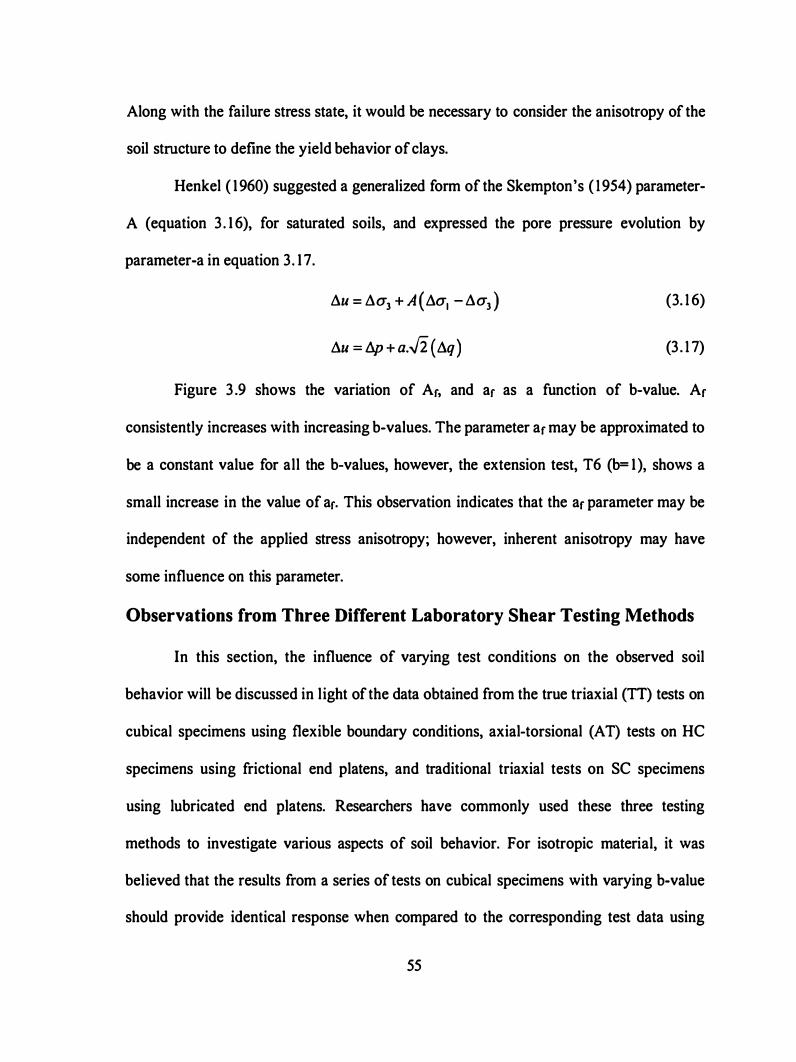
Along with the failure stress state, it would be necessary to consider the anisotropy of the
soil structure to define the yield behavior of clays.
Henkel ( 1 960) suggested a generalized form of the Skempton's ( 1 954) parameter
A (equation 3 . 1 6), for saturated soils, and expressed the pore pressure evolution by
parameter-a in equation 3. 1 7.
11u = 11a3 + A ( 11a1 -11a3 ) 11u = l1p + a.J2 ( 11q)
(3. 1 6)
(3 . 1 7)
Figure 3 .9 shows the variation of Ar, and ar as a function of b-value. Ar
consistently increases with increasing b-values. The parameter ar may be approximated to
be a constant value for all the b-values, however, the extension test, T6 (b= I ), shows a
small increase in the value of ar. This observation indicates that the ar parameter may be
independent of the applied stress anisotropy; however, inherent anisotropy may have
some influence on this parameter.
Observations from Three Different Laboratory Shear Testing Methods
In this section, the influence of varying test conditions on the observed soil
behavior will be discussed in light of the data obtained from the true triaxial (TT) tests on
cubical specimens using flexible boundary conditions, axial-torsional (AT) tests on HC
specimens using frictional end platens, and traditional triaxial tests on SC specimens
using lubricated end platens. Researchers have commonly used these three testing
methods to investigate various aspects of soil behavior. For isotropic material, it was
believed that the results from a series of tests on cubical specimens with varying b-value
should provide identical response when compared to the corresponding test data using
55

ci 1 .6 -------------�--
, 1 .4 I: ca cf 1 .2
a I!! ! 1
E � 0.8
a. ar� I!! 0.6 � ; T-------�--------�------��------� en I!! 0.4
a. I!! 0 0.2
a.
0
0 0.2 0.4 0.6 0.8 1
Intermediate Principal Stress Ratio - b
Figure 3.9 Variation Pore Pressure Parameters, Ar and ar, with b-values
HC or SC specimens. However, for a cross-anisotropic material the response from the
three types of tests would be identical for triaxial compression (b=O) and extension (b= I )
tests only. Among all the tests performed in this study only the compression and
extension tests would have the same orientation of principal stresses about the axis of
cross-anisotropy ( 8-angle) for the three testing methods and for such a material the 8-
angle may have significant influence on the observed behavior. The specimens used in
this study have a small degree of cross-anisotropy as the specimens were initially
subjected to 1 -D slurry consolidation (Ko condition), prior to a second stage isotropic
consolidation at 275 kPa, during sample preparation.
In Fig 3 . 1 0, the deviatoric stress, q, and part of the excess pore pressure generated
due to applied shear, �Uq, are plotted against the shear strain, Eq, for b=O and b= 1 tests on
56
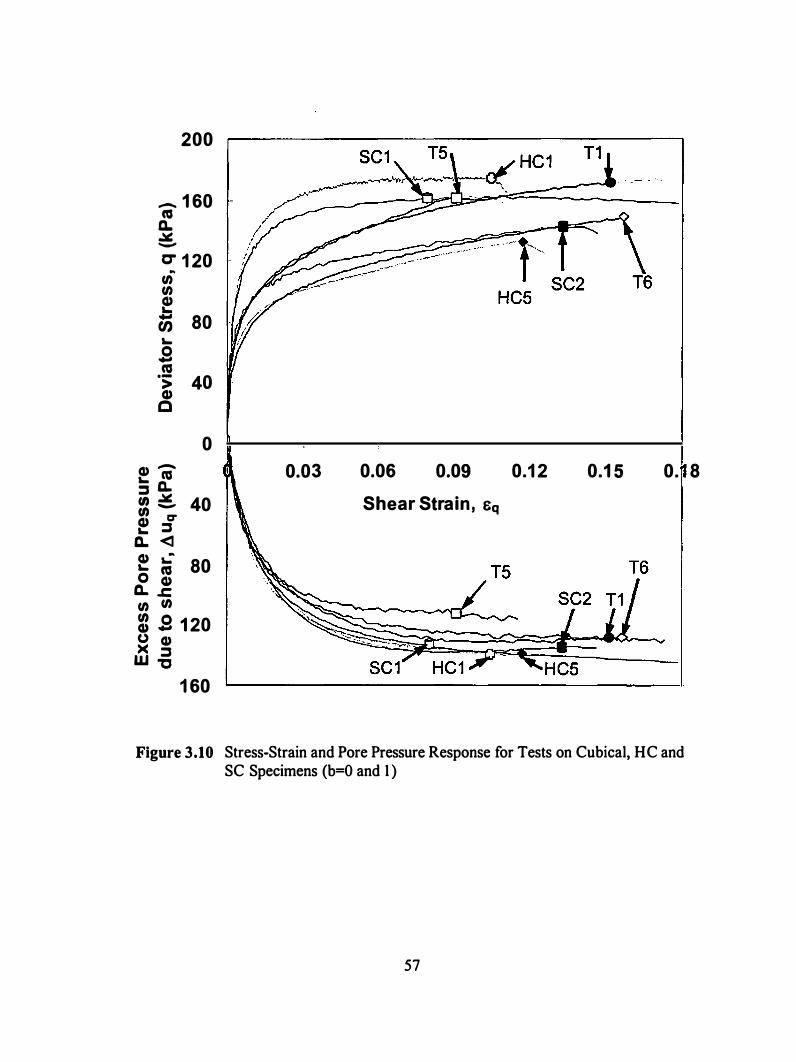
200
- 1 60 ca c. .:.:: -
CT 1 20 ..
tn tn � ;;; 80 '-.s ca ·s; 40 CD c
0 CD '- n:s :l c.. = e. 40 � .g
C.. <l Q) � '- ca 80 0 Q)
C.. .c tn tn
� .s 1 20 (.) CD >< ::s W -e 1 60
0.03 0.06 0.09 Shear Strain, sq
0.1 2 0.1 5 0. 8
Figure 3.10 Stress-Strain and Pore Pressure Response for Tests on Cubical, HC and SC Specimens (b=O and 1 )
57
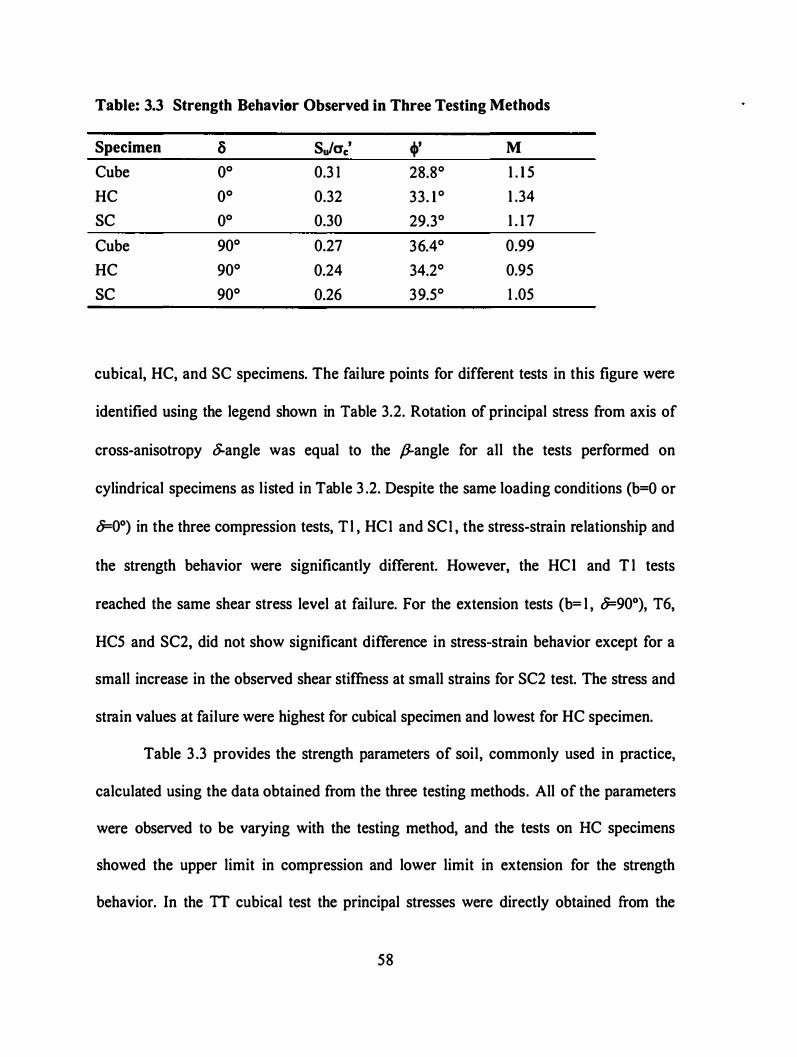
T able: 3.3 Strength Behavier Observed in T hree T esting Methods
Sp ecimen a Sulac' 4»' M
Cube oo 0.3 1 28.8° 1 . 1 5
HC oo 0.32 33. 1 ° 1 .34
sc oo 0.30 29.3° 1 . 1 7
Cube 90° 0.27 36.4° 0.99
HC 90° 0.24 34.2° 0.95
sc 90° 0.26 39.5° 1 .05
cubical, HC, and SC specimens. The failure points for different tests in this figure were
identified using the legend shown in Table 3.2. Rotation of principal stress from axis of
cross-anisotropy S.angle was equal to the ,B-angle for all the tests performed on
cylindrical specimens as listed in Table 3 .2. Despite the same loading conditions (b=O or
�0°) in the three compression tests, T l , HCI and SCI , the stress-strain relationship and
the strength behavior were significantly different. However, the HCI and T l tests
reached the same shear stress level at failure. For the extension tests (b= l , �90°), T6,
HC5 and SC2, did not show significant difference in stress-strain behavior except for a
small increase in the observed shear stiffuess at small strains for SC2 test. The stress and
strain values at failure were highest for cubical specimen and lowest for HC specimen.
Table 3 .3 provides the strength parameters of soil, commonly used in practice,
calculated using the data obtained from the three testing methods. All of the parameters
were observed to be varying with the testing method, and the tests on HC specimens
showed the upper limit in compression and lower limit in extension for the strength
behavior. In the TT cubical test the principal stresses were directly obtained from the
58
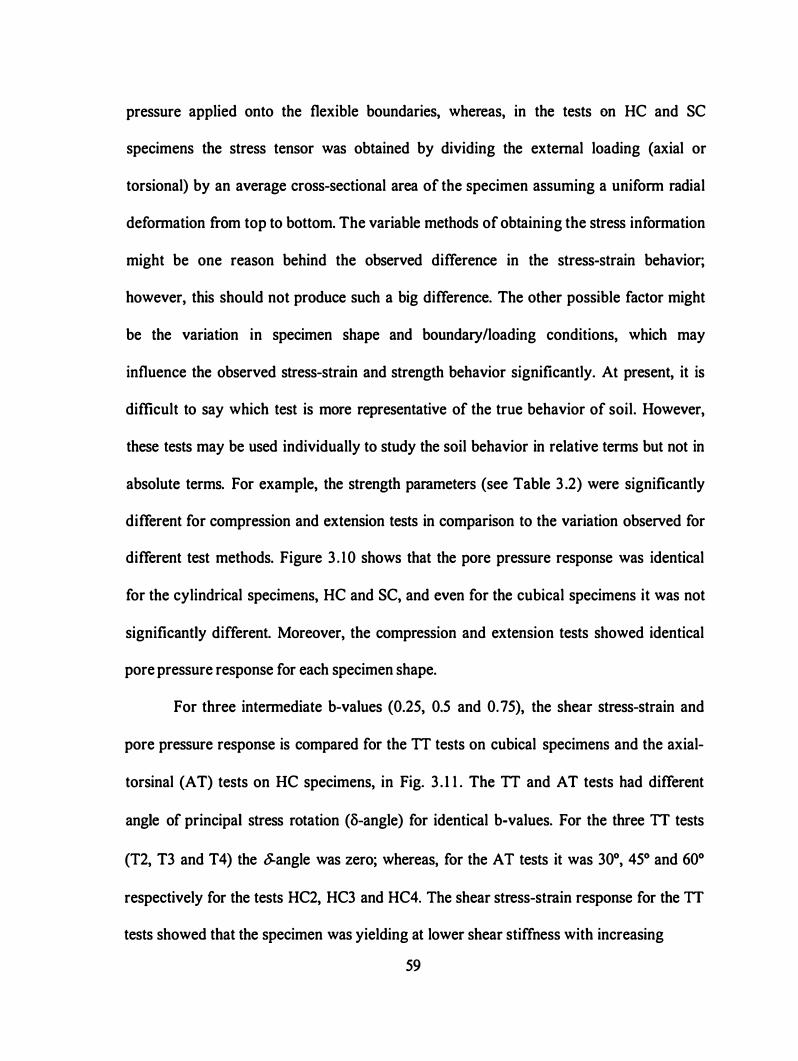
pressure applied onto the flexible boundaries, whereas, in the tests on HC and SC
specimens the stress tensor was obtained by dividing the external loading (axial or
torsional) by an average cross-sectional area of the specimen assuming a uniform radial
deformation from top to bottom. The variable methods of obtaining the stress information
might be one reason behind the observed difference in the stress-strain behavior;
however, this should not produce such a big difference. The other possible factor might
be the variation in specimen shape and boundary/loading conditions, which may
influence the observed stress-strain and strength behavior significantly. At present, it is
difficult to say which test is more representative of the true behavior of soil. However,
these tests may be used individually to study the soil behavior in relative terms but not in
absolute terms. For example, the strength parameters (see Table 3 .2) were significantly
different for compression and extension tests in comparison to the variation observed for
different test methods. Figure 3 . 10 shows that the pore pressure response was identical
for the cylindrical specimens, HC and SC, and even for the cubical specimens it was not
significantly different. Moreover, the compression and extension tests showed identical
pore pressure response for each specimen shape.
For three intermediate b-values (0.25, 0.5 and 0. 75), the shear stress-strain and
pore pressure response is compared for the TT tests on cubical specimens and the axial
torsinal (AT) tests on HC specimens, in Fig. 3 . 1 1 . The TT and AT tests had different
angle of principal stress rotation (B-angle) for identical b-values. For the three TT tests
(T2, T3 and T4) the 0-angle was zero; whereas, for the AT tests it was 30°, 45° and 60°
respectively for the tests HC2, HC3 and HC4. The shear stress-strain response for the TT
tests showed that the specimen was yielding at lower shear stiffness with increasing
59
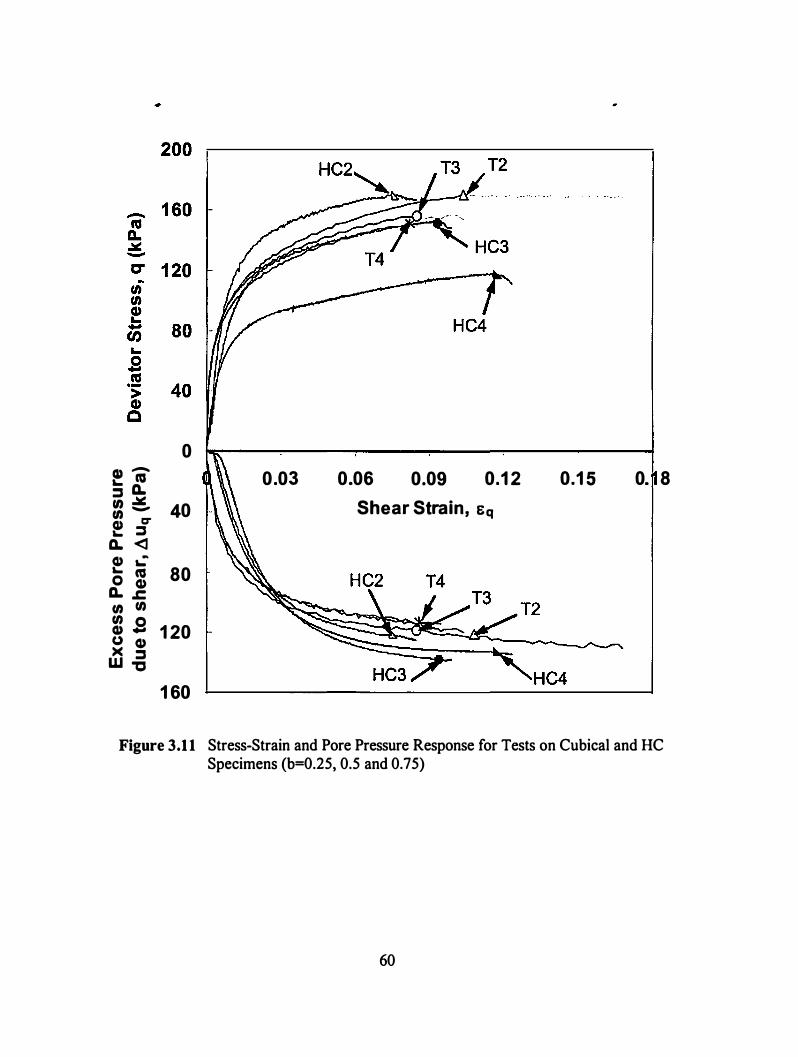
0 Q) � "' :l Q. = c 40 e .g
Q. <J G) ..: � ca 80 0 Q)
O. J: 0 U)
� s 1 20 -CJ G) >< :l W -o
1 60
0.03 0.06 0.09 0.1 2 0.1 5 0. 8 Shear Strain, Eq
HC4
Figure 3.1 1 Stress-Strain and Pore Pressure Response for Tests on Cubical and HC Specimens (b=0.25, 0.5 and 0.75)
60
b-values. Similar observation can be made for HC specimens too but in this case, the
reduction in shear stiffuess with increasing �value is more significant. The variation in
observed soil behavior from two testing methods may be in part due to the influence of
specimen shapes and boundary conditions; however, the principal stress rotation in HC
testing would also influence the behavior significantly. This observation was also
supported by the significant variation found in the stress-strain and pore pressure
response from the tests T5 and T6 on cubical specimens, as shown in Fig 3. 1 0. Tests T5
and T6 had the same b-value (b= I ), however, the angle of major principal direction with
the z-axis of the specimen was changed from 8=0° for T5 to 8=90° for T6 test. This
significant variation in the observed shear behavior, due to principal stress rotation, may
be a result of the initial anisotropy of the specimen's structure (geometric arrangement of
clay particles). The initial anisotropy in the structure of the specimen was induced during
the specimen preparation when the slurry was consolidated to 207 kPa effective vertical
stress along z-axis under Ko condition. In fact a similar cross-anisotropy in the structure
of the soil may be found in most of the soil deposits. At higher initial confining stress, the
influence of this anisotropy may not be that significant for varying b-values but the
rotation of principal stresses may produce significant change in the response. At lower
initial confining stress values, even the change in b-value may be able to cause significant
variation in the observed shear response.
Conclusions
A series of true triaxial undrained tests on cubical normally consolidated kaolin
clay specimens were performed to study the influence of the intermediate principal stress
6 1
value relative to the major and minor principal stresses: The experimental shear behavior
could be summarized with the following observations.
1 . The stress-strain relationship, with the shear stress and strain defined in their three
dimensional invariant form, was not significantly different for various b-values if the
principal stresses had a fixed orientation relative to the axis of deposition. However,
the rotation of principal stresses may have significant influence on the observed
behavior.
2. The shear strength of the soil was strongly dependent on the relative magnitude of cr2.
The observed failure criterion may be defined by the third invariant of the stress
tensor, regardless of the principal stress rotation. Internal friction angle, 4» ' , and the
limiting shear stress ratio, M, were also found to be described by this model. The
plastic potential surface at failure was circular in shape on the octahedral plane.
3 . Excess pore pressure due to shear, �Uq, i s used to compare the pore pressure response
from various stress paths. Evolution of �uq with shear strain was observed to have a
decreasing trend with increasing b-value when they were compared at a fixed rotation
of principal stresses. Henkel 's ( 1 960) generalized pore pressure parameter, ar, shows
a constant value for the loadings with fixed principal stress rotation.
The stress-strain behavior observed from the three types of laboratory tests, axial
torsional tests on hollow cylinder, lubricated end triaxial tests on full cylinder and true
triaxial tests on cubical specimens, was significantly different. The specimen shape and
the influence of different boundary conditions played a role in this observation. However,
the pore pressure response did not show a significant influence due to the changing
62
testing methods and specimen shapes. Comparison of the test data from HC and cubical
specimens indicated that the rotation of principal stresses have much more significant
influence on the observed shear behavior of an anisotropic soil than the influence of the
changing relative magnitude of 0"2.
63
Chapter 4. Effect of Intermediate Principal Stress on
Overconsolidated Kaolin Clay
This chapter is a slightly revised version of a paper by Amit Prashant and Dayakar
Penumadu with the same title, published in the Journal of Geotechnical and
Geoenvironmental Engineering, ASCE, in March 2004:
Prashant, A., and Penumadu, D. "Effect of Intermediate Principal Stress on
Overconsolidated Kaolin Clay." In print , Journal of Geotechnical and Geoenvironmental
Engineering, ASCE.
My primary contributions to this paper include: ( 1 ) selection of the topic and
development of the problem to study the three-dimensional constitutive behavior of
cohesive materials, (2) identification of the study topics, (3) gathering and interpretation
of published l iterature, (4) performing all the laboratory experiments, (5) interpretation
and analysis of test results, and (6) part of the writing related to manuscript preparation.
Abstract
The influence of intermediate principal stress on the mechanical behavior of
overconsolidated kaolin clay is investigated using three-dimensional true triaxial testing
on cubical specimens. A flexible boundary, true triaxial setup with a real-time feedback
control system was used to test soil specimens under stress and strain-control modes. The
importance of properly tuning PID control and adapting gain terms as a function of
specimen stiffness for undrained testing is presented. Undrained tests on kaolin clay show
that the following shear strength parameters vary with the magnitude of intermediate
principal stress: stiffness at small strains, excess pore pressure generated during shear,
64

sttength and strain to failure. Failure occurred at peak deviator stress followed by shear
band formation and localized bulging. Prior theoretical formulations of bifurcation and
undrained instability support these experimental observations. Analysis of data in the
octahedral plane indicates that kaolin clay follows a non-associative flow rule, which is
described by a constant third stress invariant failure criterion with von Mises plastic
potential surface.
CE Database keywords: Bifurcation, Localization, Overconsolidated clays, Shear
deformation, Strain, Three-dimensional analysis, Undrained shear tests, Yield surface.
Introduction
The influence of cr2 variation on the shear strength and pore-pressure parameters
of cohesive soils was initially studied by Rendulic ( 1936), Habib ( 1 953 ), Henkel ( 1 959),
Parry ( 1960) and Wu et at. ( 1 963). These studies included the traditional triaxial
compression and extension tests on solid cylindrical specimens, and torsional tests on
solid or hollow cylinder specimens. These studies were not conclusive regarding the
effect of cr2 on the soil 's mechanical behavior. Later studies performed by Shibata and
Karube ( 1 965), Broms and Casbarian ( 1 965), Y ong and McKyes ( 1 97 1 ), Vaid and
Campanella ( 1 974), Lade and Musante ( 1 978), and Kirkgard and Lade ( 1 993), all agree
that the intermediate principal stress plays a significant role in stress-strain-strength
behavior and pore pressure response of clay. The laboratory tests in the above studies
were performed using traditional triaxial tests, torsional tests, and true triaxial tests with
varying b-values (equation 3. 1 ) on cubical specimens.
65
Most of these studies were performed on normally consolidated (NC) clays. Past
studies related to evaluating the shear strength behavior of overconsolidated (OC) clay
was limited to traditional triaxial compression and extension testing, and only provided
the shear strength behavior for two extreme b-values, 0 and 1 . This chapter presents an
experimental study of the influence of cr2 on the stress-strain-strength behavior and pore
pressure response of OC Kaolin clay under undrained conditions. Strain localization
issues are discussed in light of the experimental observations and in identifying the
failure state of stress and strain. True triaxial tests on cubical specimens were performed
using a device described in previous chapter. This device uses three-axis electro
pneumatic, PID based real-time feedback control system. The influence of feedback
control parameters on the observed shear strength behavior of over-consolidated clay is
also presented in this study.
Previous Investigations
Henkel ( 1959) performed strain controlled triaxial compression and extension
tests on normally consolidated as well as overconsolidated specimens of remolded
London clay and Weald clay. The undrained strengths ((cr1-cr3)r] obtained in extension
tests were reported to be 14% lower than those obtained in compression test (as
interpreted by Lade and Musante, 1 978). However, if the undrained strength values are
normalized by the corresponding mean effective stress values ( u� ) for these tests at
failure, the shear strength in extension (b=l ) is 25% lower than that for compression
(b=O). This is based on the assumption that the failure surface varies linearly with the
mean effective stress. Parry ( 1960) studied the behavior of the same clay along various
66
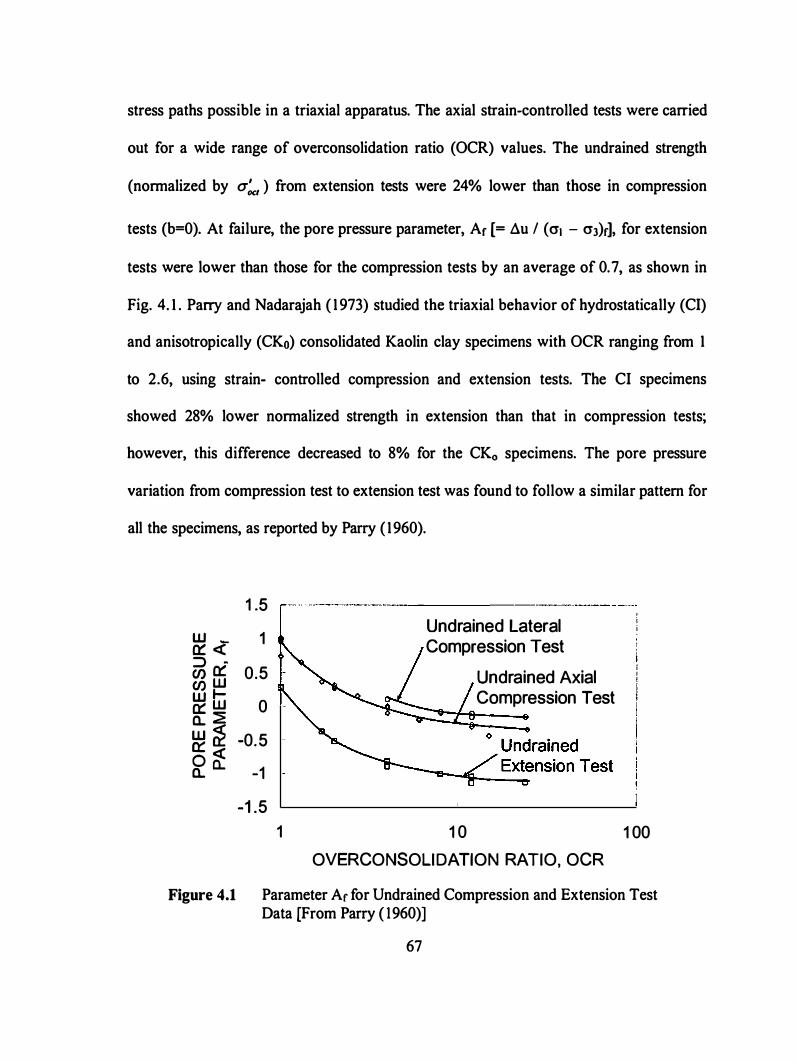
stress paths possible in a triaxial apparatus. The axial strain-controlled tests were carried
out for a wide range of overconsolidation ratio (OCR) values. The undrained strength
(normalized by a�, ) from extension tests were 24% lower than those in compression
tests (b=O). At failure, the pore pressure parameter, Ar [ = du I ( cr1 - cr3)r), for extension
tests were lower than those for the compression tests by an average of 0. 7, as shown in
Fig. 4. 1 . Parry and Nadarajah ( 1 973) studied the triaxial behavior of hydrostatically (CI)
and anisotropically (CKo) consolidated Kaolin clay specimens with OCR ranging from 1
to 2.6, using strain- controlled compression and extension tests. The CI specimens
showed 28% lower normalized strength in extension than that in compression tests;
however, this difference decreased to 8% for the CKo specimens. The pore pressure
variation from compression test to extension test was found to follow a similar pattern for
all the specimens, as reported by Parry ( 1960).
1 .5
w -0:: <( 1 ::::> -(/) 0:: 0.5 CJ) W w to:: W Q. � 0 -
� � -0.5 <(
O a. 1 Q. -
-1 .5
1
--------------·
Undrained Lateral Compression Test
Undrained Axial Compression Test
1 0
OVERCONSOLIDATION RATIO, OCR
1 00
Figure 4.1 Parameter Ar for Undrained Compression and Extension Test Data [From Parry ( 1960)]
67
Wu et al. ( 1 963) performed stress-controlled consolidated undrained torsional
tests on hollow cylindrical specimens, and triaxial compression and extension tests on
Sault Ste Marie clay using an axial strain rate ( &1 ) of 0.05%/min. The clay strength was
found to agree with the Mohr-Coulomb failure envelope using Hvorslev's effective
strength parameters, and the a2 was reported to have no influence on stress-strain
behavior.
Shibata and Karube ( 1 965) conducted three-dimensional (3D) strain-controlled
undrained tests on NC rectangular specimens (60x35x20 mm) of remolded Osaka alluvial
clay using a modified triaxial apparatus, with two pairs of rigid boundaries in the a1 and
a2 directions and a pair of flexible boundaries in the a3 direction. Yong and McKyes
( 1967, 1 97 1 ) also performed similar strain-controlled (i1 = 0.075%/min) tests on
remolded NC Kaolinite clay specimens ( 102x5 1x38 mm) using additional modifications,
using a pair of rigid boundaries in the a1 direction and two pairs of flexible boundaries in
the a2 and a3 directions. They showed significant influence of a2 on deformation, pore
pressure and shear strength. In the later paper, they concluded that a2 affects pre-failure
behavior and the failure envelope is best described by the Mohr-Coulomb criterion.
Vaid and Cmpanella ( 1974) performed strain-controlled consolidated undrained
tests on undisturbed NC Haney clay using plane strain compression and extension. Lade
and Musante ( 1 978) and Kirkgard and Lade ( 1 993) ran a series of strain-controlled true
triaxial tests on cubical specimens of NC clay. Lade and Musante ( 1 978) used remolded
grundite clay, whereas Kirkgard and Lade ( 1 993) used remolded San Francisco Bay mud.
The apparatus used in both studies had lubricated end platens on the specimen top and
68
bottom with flexible membranes on the sides; the lubricated end platens were used to
apply cr1 • These studies concluded that cr2 has a significant influence on mechanical
properties of clay and the failure envelope was located outside the Mohr-Coulomb failure
surface in the octahedral plane.
Germaine ( 1 982) and Seah ( 1990) investigated the influence of principal stress
rotation on the undrained behavior of remolded Boston blue clay using a directional shear
cell . Whittle et al. ( 1 994) found that the data from this work was in agreement with the
MIT-E3 anisotropic constitutive model (Whittle and Kavvadas 1 994) for OC clays. These
studies support the assertion that stress anisotropy has a significant role in the observed
stress-strain and strength behavior of clay. Callisto and Calabresi ( 1 998) conducted
strain-controlled true triaxial tests on cubical specimens of natural Pisa clay
reconsolidated to its natural OC stress state. The specimens were tested using different
stress paths under flexible boundary conditions. The failure envelope in the octahedral
plane was found to deviate from the Mohr-Coulomb and Lade's ( 1 990) failure surface.
Table 4. 1 summarizes the key observations from all the above studies and illustrates the
need for a more comprehensive study of the influence of cr2 on clay behavior.
True Triaxial Testing
Using the true triaxial system described in Chapter 2, a series of consolidated
undrained tests was performed on slurry consolidated Kaolin clay specimens in which cr2
was varied to produce b-values of 0, 0.25, 0.5, 0. 75 and 1 .0. For a given value of b, two
tests were performed to evaluate the repeatability of experimental data. The description
of Kaolin clay used in the current study was provided in Table 3. 1 . The specimen
69
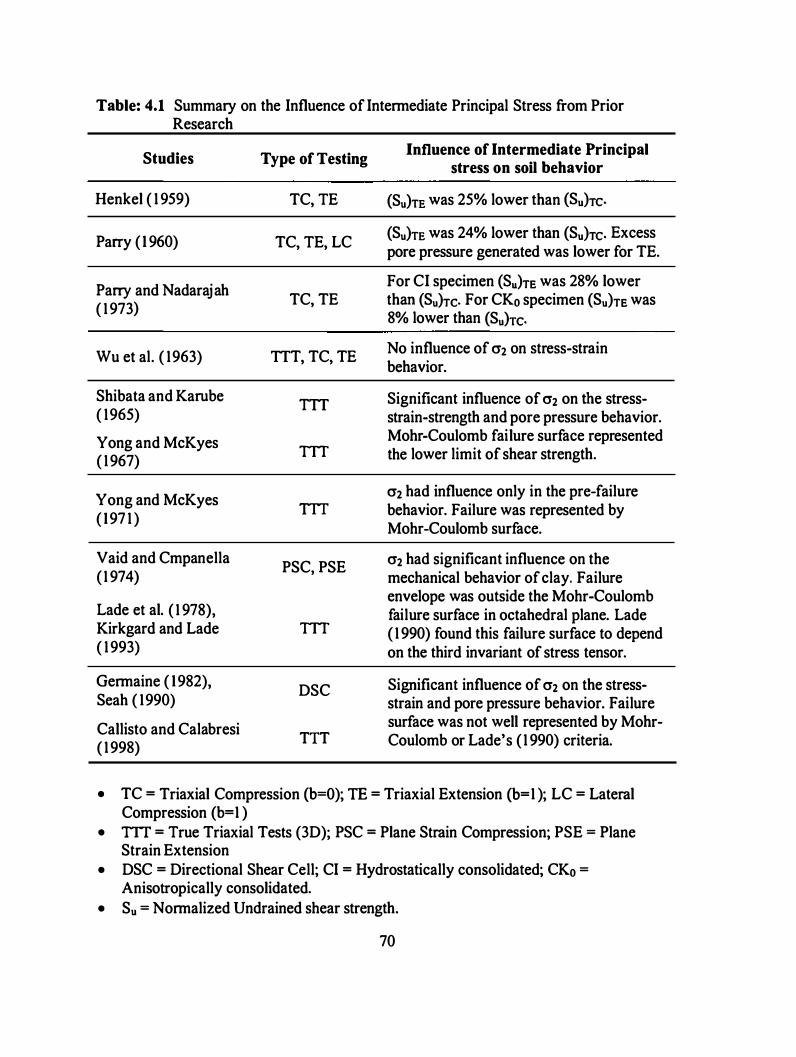
T able: 4.1 Summary on the Influence of Intennediate Principal Stress from Prior Research
Studies
Henkel ( 1 959)
Parry ( 1 960)
Parry and Nadarajah ( 1 973)
Wu et al. ( 1963)
Shibata and Karube ( 1965)
Yong and McKyes ( 1 967)
Yong and McKyes ( 1 97 1 )
Vaid and Cmpanella ( 1 974)
Lade et al. ( 1 978), Kirkgard and Lade ( 1 993)
Gennaine ( 1 982), Seah ( 1990)
Callisto and Calabresi ( 1 998)
Typ e of Testing
TC, TE
TC, TE, LC
TC, TE
TIT, TC, TE
TTI
TIT
TIT
PSC, PSE
TIT
DSC
TIT
Influence of Intermediate P rincip al stress on soil behavior
(Su}rE was 25% lower than (Su}rc. (Su}rE was 24% lower than (Su}rc. Excess pore pressure generated was lower for TE.
For CI specimen (Su}rE was 28% lower than (Su}rc. For CKo specimen (Su}rE was 8% lower than (Su}rc. No influence of cr2 on stress-strain behavior.
Significant influence of cr2 on the stressstrain-strength and pore pressure behavior. Mohr-Coulomb failure surface represented the lower limit of shear strength.
cr2 had influence only in the pre-failure behavior. Failure was represented by Mohr-Coulomb surface.
cr2 had significant influence on the mechanical behavior of clay. Failure envelope was outside the Mohr-Coulomb failure surface in octahedral plane. Lade ( 1 990) found this failure surface to depend on the third invariant of stress tensor.
Significant influence of cr2 on the stressstrain and pore pressure behavior. Failure surface was not well represented by MohrCoulomb or Lade's ( 1 990) criteria.
• TC = Triaxial Compression (b=O); TE = Triaxial Extension (b= 1 ); LC = Lateral Compression (b= 1 )
• TTf = True Triaxial Tests (3D); PSC = Plane Strain Compression; PSE = Plane Strain Extension
• DSC = Directional Shear Cell; CI = Hydrostatically consolidated; CKo = Anisotropically consolidated.
• Su = Nonnalized Undrained shear strength.
70
preparation procedure and its assembly in the true triaxial device were discussed in
Chapter 2. Three axes are identified on the space frame, x, y and z, and the specimens
were placed on the space frame such that the cr1-axis at the end of slurry consolidation
coincides with the z-axis. After assembly, the specimens were saturated using
backpressure technique, and values of Skempton's pore pressure parameter B
(=6u/6crconfining) obtained from the internal pore pressure measurements agreed closely
with that obtained from the external pore pressure measurements. A minimum B-value of
0.98 was used as the criterion for ensuring full saturation. The Kaolin specimens were
hydrostatically consolidated to 275 k.Pa and the stress was then decreased to 55 k.Pa to
obtain OCR=5. During the shear stage, deviator stress was induced on the specimen by
applying a constant strain rate of 0.05 %/min in the z-direction; this strain rate ensured
pore pressure equilibrium under undrained conditions. In order to ensure a constant b
value (equation 3 . 1 ), the required cr2 was generated along the y-axis in a stress control
mode.
All of the tests were compressive in nature in terms of total stress applied on the
specimens during the shearing stage. This means that even for test corresponding to b= I
(lateral compression) case, the shear stress was applied by increasing the same amount of
normal stress in cr, and cr2 directions, and maintaining a constant total stress in the cr3
direction. The major strain in the cr1 direction, s � , was increased at a rate of 0.05% per
minute and the total stress in the other two directions was maintained by feedback control
using the PID algorithm. During shearing, normal stress was recorded in all the three
principal directions and the pore pressure generated was recorded using external and
7 1
internal pore pressure transducers. For 81 = 0.05 %/min, the internal pore pressure
readings obtained from a needle piezometer, whose tip was located approximately at the
center of the cubical specimen, was found to be equal to the external pore pressure data.
Deformation was recorded on all six faces of the specimen, and the values at opposite
faces were averaged to attain the strain in three principal directions. During these tests,
the principal axes of stress coincided with the x, y and z axes of the specimen. Three-
dimensional deviator stress value, q , is calculated from the general invariant expression,
as shown in equation A 1 .8 of Appendix- I . For comparison of results, the deviator stress
q and the excess pore pressure are normalized with pre-consolidation pressure ( p: = 275
kPa).
PID Feedback Control during Overconsolidated Clay Testing
It was discussed in Chapter 2 that the tuning of P, I and D coefficients in PID
algorithm plays an important role in the observed stress-strain, pore pressure, and shear
strength behavior of clay. The values of PID coefficients needed for a good control
depend on experimental setup, material type, and stiffness of the specimens. Initially in
this study on overconsolidated clay, a series of tests were performed using PID values
developed from a previous study for normally consolidated Kaolinite clay specimens.
These values correspond to P=0.029, 1=0.052 and D=O. These PID values were reduced
to 1 1 1 o•h of their initial values after major principal strain reached a value of 1%, to
maintain desired control in the three axes. Repeated tests in the present research showed
that these PID values employed in first series of tests on overconsolidated clay appeared
to overshoot the set point values, which resulted in relatively poor control of target value 72
of major principal strain rate (See Fig 4.2). With this observation, separate tuning was
performed for PID values suitable for overconsolidated specimens. Tuning experiments
resulted in lower PID values, i.e. P=0.0 145, 1=0.026 and D=O, at the early phase of
shearing. These PID values were then reduced to l/ 101h of their initial values at s 1=1% to
account for a change in stiffness of the specimen during shear with increasing amplitude
of major principal strain. This leads to the conclusion that the PID values depend not only
on the experimental setup and soil type but also on the stress history of the soil. Thus, a
second series of tests were performed with these specific PID values found suitable for
Kaolinite specimens with OCR=5, whereas the first series was performed using the PID
values suitable for normally consolidated Kaolinite clay. Therefore, the tests of first
series in the figures 4.2, and 4.3are referred to as 'NC gain PID control tests' and the tests
of second series are referred to as 'OC gain PID control tests' .
The pore pressure generated during shear for OC clay specimen differs from that
for NC clay specimen (Henkel, 1959). Therefore, the effective stress path and thus the
variation in stiffness of the specimens in these two cases are different. This variation of
stiffness of specimen affects the accuracy of the PID control and thus requires separate
tuning for the PID values. Improper tuning of PID coefficients causes the PID control to
deviate from the desired target of maintaining a particular b-value resulting in
fluctuations in the applied intermediate principal stress (cr2) with increasing e J . These
stress rate changes in cr2 direction affect the observed stiffness and overall shear strength
of the specimens. These fluctuations disappear in 'OC gain PID control tests' and typical
results are compared with 'NC gain PID control tests' in Fig. 4.3. Therefore, proper
73
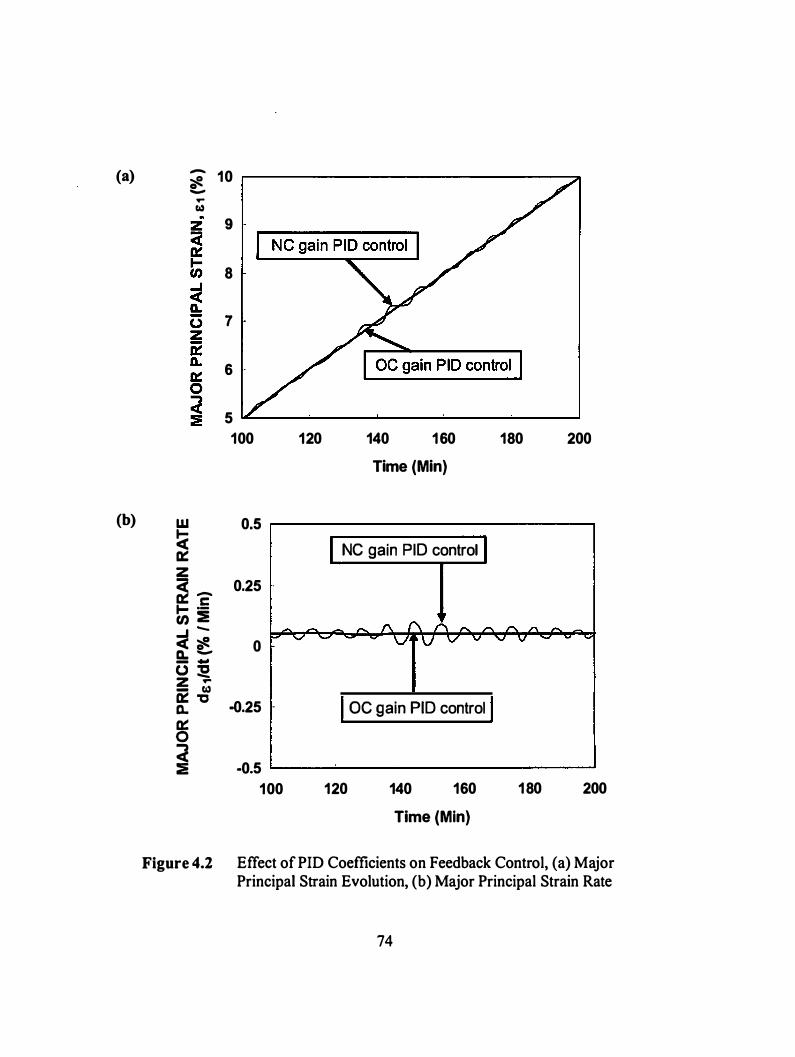
(a) � 1 0 ,.------------------""2
(b) w � a::: z
-... Cl)
� c .... ·-rn :E .... -<( � a. -- -0 :2 z ... - Cl) D::: "C D. a::: 0 �
9
8
7
6
5 �--�--�--��--�--� 100 120 140 1 60 180 200
Time (Min)
0.5 ....-------------------
NC gain PID control
0.25 .
0
·0.25 - OC gain PID control
-0.5 L-..---'----�------------l
1 00 120 140 160 1 80 200
Time (Min)
Figure 4.2 Effect ofPID Coefficients on Feedback Control, (a) Major Principal Strain Evolution, (b) Major Principal Strain Rate
74
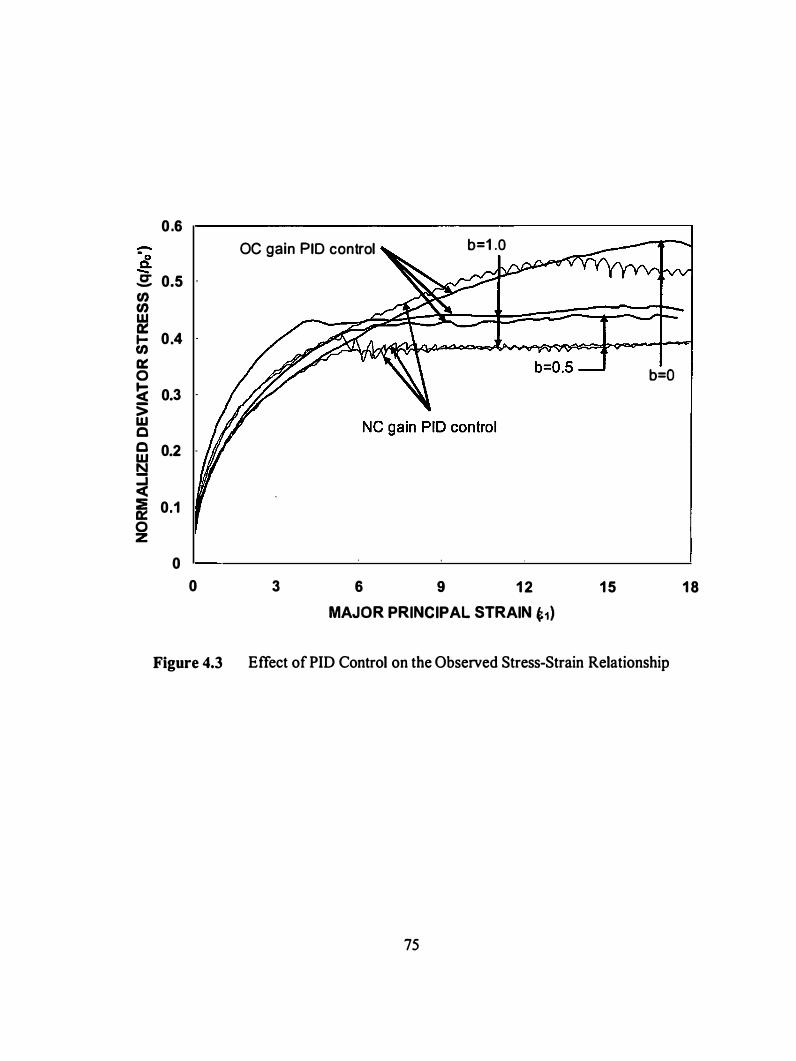
0 .6
-
l: ..E: 0.5 rn rn � t; 0.4
a:: 0 � 0.3 -
> w Q Q 0.2 -� Ci! � 0.1
0 z 0
0
OC gain PID control b=1 .0
b=O
3 6 9 1 2 1 5
MAJOR PRINCIPAL STRAIN t1)
Figure 4.3 Effect of PID Control on the Observed Stress-Strain Relationship
75
1 8
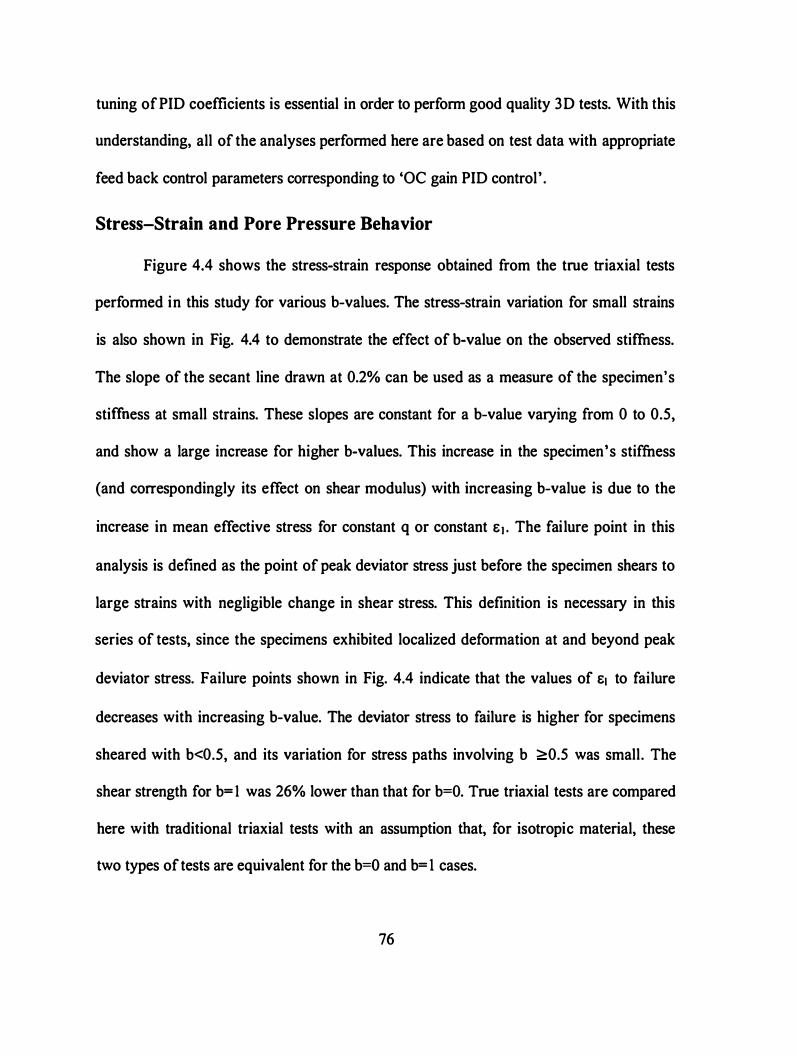
tuning ofPID coefficients is essential in order to perform good quality 3D tests. With this
understanding, all of the analyses performed here are based on test data with appropriate
feed back control parameters corresponding to 'OC gain PID control' .
Stress-Strain and Pore Pressure Behavior
Figure 4.4 shows the stress-strain response obtained from the true triaxial tests
performed in this study for various b-values. The stress-strain variation for small strains
is also shown in Fig. 4.4 to demonstrate the effect of b-value on the observed stiffuess.
The slope of the secant line drawn at 0.2% can be used as a measure of the specimen's
stiffhess at small strains. These slopes are constant for a b-value varying from 0 to 0.5,
and show a large increase for higher b-values. This increase in the specimen's stiffness
(and correspondingly its effect on shear modulus) with increasing b-value is due to the
increase in mean effective stress for constant q or constant E 1 • The failure point in this
analysis is defined as the point of peak deviator stress just before the specimen shears to
large strains with negligible change in shear stress. This definition is necessary in this
series of tests, since the specimens exhibited localized deformation at and beyond peak
deviator stress. Failure points shown in Fig. 4.4 indicate that the values of EJ to failure
decreases with increasing b-value. The deviator stress to failure is higher for specimens
sheared with b<0.5, and its variation for stress paths involving b >0.5 was small. The
shear strength for b= 1 was 26% lower than that for b=O. True triaxial tests are compared
here with traditional triaxial tests with an assumption that, for isotropic material, these
two types of tests are equivalent for the b=O and b= l cases.
76
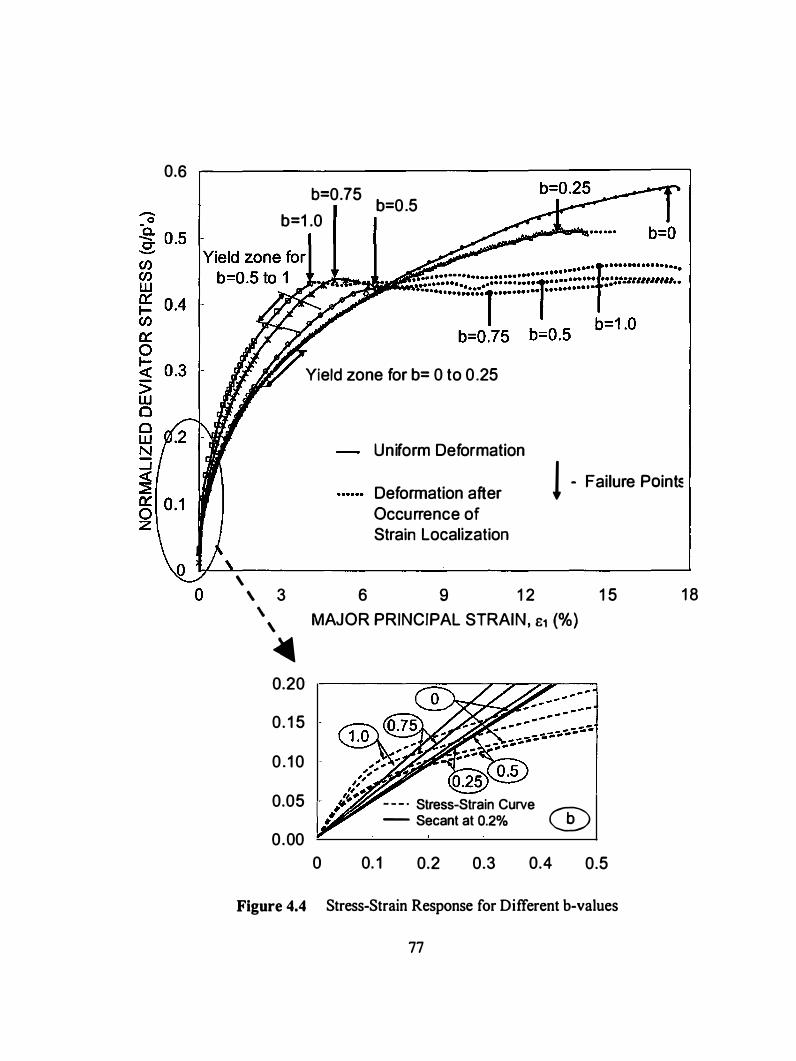
0.6 b=0.75
b=0.5 b=1 .0
Yield zone for b= 0 to 0 .25
Uniform Deformation
Deformation after Occurrence of Strain Localization
! - Failure Pain�
' ' 3 6 9 1 2 1 5
' ' MAJOR PRINCIPAL STRAIN, t1 (%)
� 0.20
0. 1 5
0 . 1 0 -
0.05
0.00 0 0. 1
- - - · Stress-Strain Curve - Secant at 0.2% (D
0.2 0.3 0.4 0.5
Figure 4.4 Stress-Strain Response for Different b-values
77
1 8
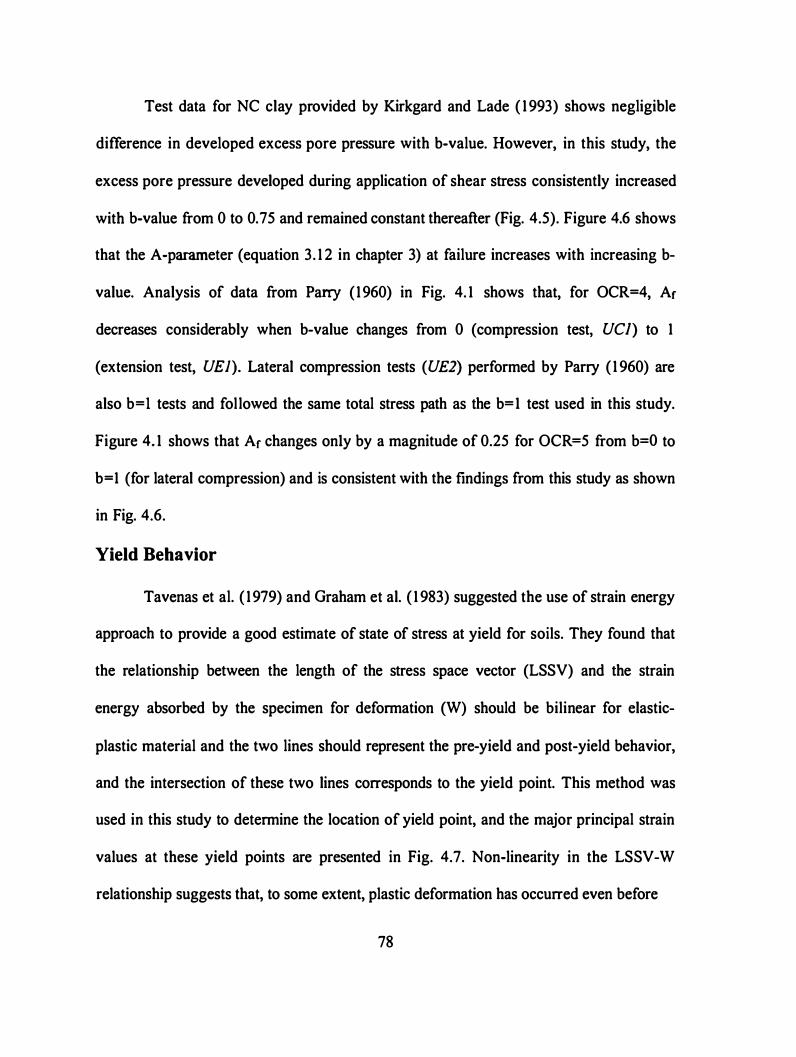
Test data for NC clay provided by Kirkgard and Lade ( 1 993) shows negligible
difference in developed excess pore pressure with b-value. However, in this study, the
excess pore pressure developed during application of shear stress consistently increased
with b-value from 0 to 0. 75 and remained constant thereafter (Fig. 4.5). Figure 4.6 shows
that the A-parameter (equation 3. 1 2 in chapter 3) at failure increases with increasing b
value. Analysis of data from Parry (1960) in Fig. 4. 1 shows that, for OCR=4, Ar
decreases considerably when b-value changes from 0 (compression test, UCJ) to 1
(extension test, UE 1). Lateral compression tests ( U£2) performed by Parry ( 1 960) are
also b=l tests and followed the same total stress path as the b=l test used in this study.
Figure 4. 1 shows that Ar changes only by a magnitude of 0.25 for OCR=5 from b=O to
b=1 (for lateral compression) and is consistent with the findings from this study as shown
in Fig. 4.6.
Yield Behavior
Tavenas et al. ( 1 979) and Graham et at. ( 1 983) suggested the use of strain energy
approach to provide a good estimate of state of stress at yield for soils. They found that
the relationship between the length of the stress space vector (LSSV) and the strain
energy absorbed by the specimen for deformation (W) should be bilinear for elastic
plastic material and the two lines should represent the pre-yield and post-yield behavior,
and the intersection of these two lines corresponds to the yield point. This method was
used in this study to determine the location of yield point, and the major principal strain
values at these yield points are presented in Fig. 4.7. Non-linearity in the LSSV-W
relationship suggests that, to some extent, plastic deformation has occurred even before
78
- 0.2 0 c. -:l <:] -
u.i 0. 1 6 a: ::> en en 0. 1 2 w a: a.. w 0::: 0.08 0 a.. 0 w 0.04 N -.:/. .:E 0::: 0 0 z 0
b=0.75
b=1 � .... �· -.. ·�····
b=0.5 b=O. 75 b=1
..... ........ ................ .... l... ..... .. J .................... .
/--==:-=��=-==��==�=-==:.;::::
_�_::;::..
- - - - - · , .... - b=O b=0.25 o - Failure Location
3 6 9 1 2 1 5 MAJOR PRINCI PAL STRAIN,e1 (%)
1 8
Figure 4.5 Excess Pore-Pressure during Shearing for Different b-values
0.40
.-:::-
� � � 0.30 ::> II � � � c£ 0.20 a.. w w la: w o .:E a.. � <( 0.1 0
a..
0 0.2 0.4 0.6 0.8 INTERMEDIATE PRINCI PAL STRESS RATIO - b
Figure 4.6 Variation of Pore Pressure Parameter Ar with b-values
79
1
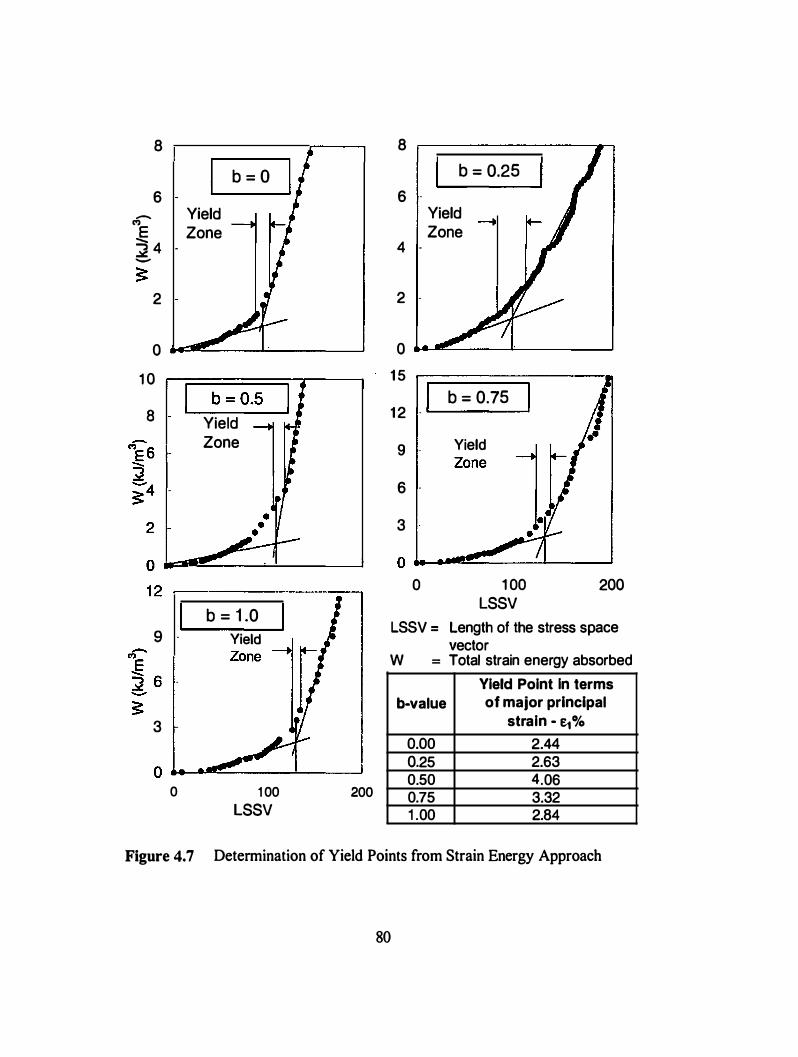
-C'?
E
8
6
� 4 -
2
Yield Zone
b = O
0 ��----�------�
1 0 r--;:======;�-�
8 Yield Zone
o -==-�=--.._!_ __ ___j 1 2 �------------------,
9
3
0
b = 1 .0 Yield
1 00 LSSV
200
8
6
4 -
2
b = 0.25
Yield Zone
0 ��----��------�
1 5 I b = 0.75 1 2 - '-------1
9 Yield
6
3
0 1 00 LSSV
200
LSSV = Length of the stress space vector
W = Total strain energy absorbed
Yield Point In terms
b-value of major principal
strain - e..o/o 0.00 2.44 0.25 2.63 0.50 4.06 0.75 3.32 1 .00 2.84
Figure 4.7 Determination of Yield Points from Strain Energy Approach
80
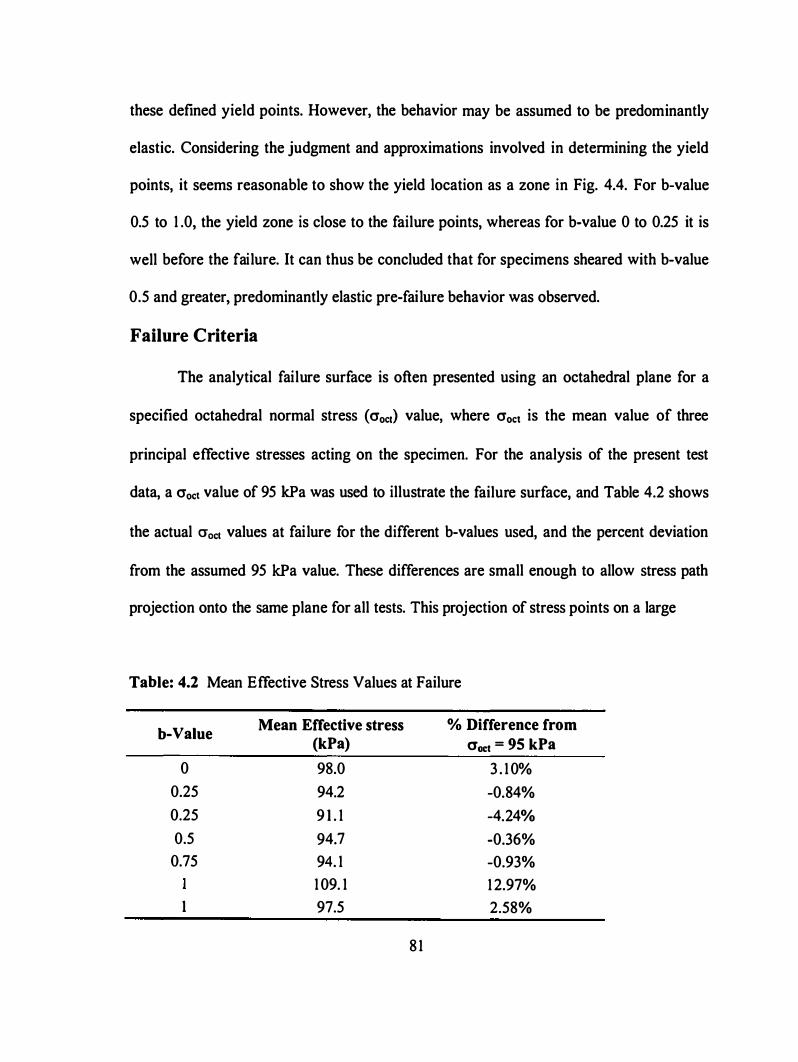
these defined yield points. However, the behavior may be assumed to be predominantly
elastic. Considering the judgment and approximations involved in determining the yield
points, it seems reasonable to show the yield location as a zone in Fig. 4.4. For b-value
0.5 to 1 .0, the yield zone is close to the failure points, whereas for b-value 0 to 0.25 it is
well before the failure. It can thus be concluded that for specimens sheared with b-value
0.5 and greater, predominantly elastic pre-failure behavior was observed.
Failure Criteria
The analytical failure surface is often presented using an octahedral plane for a
specified octahedral normal stress ( O'oc1) value, where O'oct is the mean value of three
principal effective stresses acting on the specimen. For the analysis of the present test
data, a O'oct value of 95 kPa was used to illustrate the failure surface, and Table 4.2 shows
the actual O'oct values at failure for the different b-values used, and the percent deviation
from the assumed 95 kPa value. These differences are small enough to allow stress path
projection onto the same plane for all tests. This projection of stress points on a large
T able: 4.2 Mean Effective Stress Values at Failure
b-Value Mean Effective stress (kPa)
0 98.0
0.25 94.2
0.25 9 1 . 1
0.5 94.7
0.75 94. 1
1 09. 1
I 97.5
8 1
% Difference from O'oct = 95 kPa
3 . 1 0%
-0.84%
-4.24%
-0.36%
-0.93%
1 2.97%
2.58%
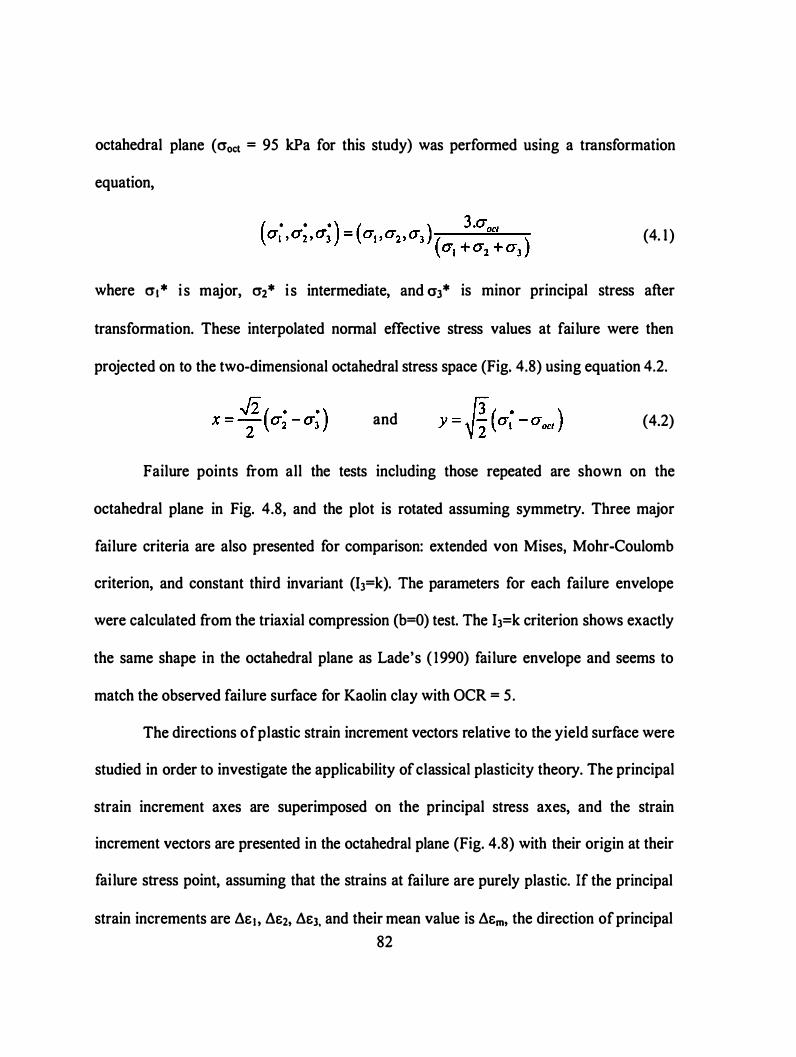
octahedral plane ( croct = 95 kPa for this study) was performed using a transformation
equation,
(4. 1 )
where cr, * i s maJor, cr2* i s intermediate, and cr3* is minor principal stress after
transformation. These interpolated normal effective stress values at failure were then
projected on to the two-dimensional octahedral stress space (Fig. 4.8) using equation 4.2.
and (4.2)
Failure points from all the tests including those repeated are shown on the
octahedral plane in Fig. 4.8, and the plot is rotated assuming symmetry. Three major
failure criteria are also presented for comparison: extended von Mises, Mohr-Coulomb
criterion, and constant third invariant (h=k). The parameters for each failure envelope
were calculated from the triaxial compression (b=O) test. The I3=k criterion shows exactly
the same shape in the octahedral plane as Lade's ( 1990) failure envelope and seems to
match the observed failure surface for Kaolin clay with OCR = 5.
The directions of plastic strain increment vectors relative to the yield surface were
studied in order to investigate the applicability of classical plasticity theory. The principal
strain increment axes are superimposed on the principal stress axes, and the strain
increment vectors are presented in the octahedral plane (Fig. 4.8) with their origin at their
failure stress point, assuming that the strains at failure are purely plastic. If the principal
strain increments are �E 1 , �E2, �EJ, and their mean value is �Em, the direction of principal
82
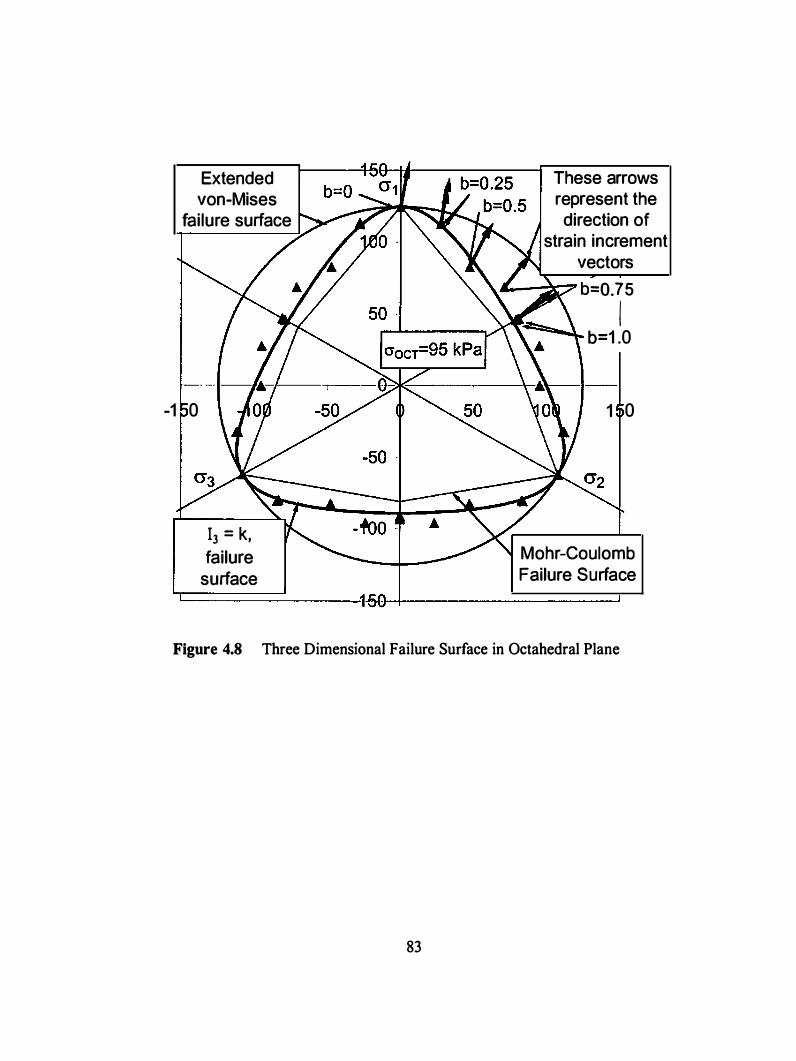
Extended von-Mises
failure surface
-1 0
13 = k, failure
surface
These arrows represent the
direction of strain increment
vectors
&.-----::r-7 b=O. 75
I b=1 .0
1 0
Mohr-Coulomb Failure Surface
'1:::=======------'1-5 ·1-+-----------.J
Figure 4.8 Three Dimensional Failure Surface in Octahedral Plane
83
strain increment vector in octahedral plane can be determined according to
where, (4.3)
For the associative flow rule, the yield surface acts as a plastic potential surface
(surface to which the strain increment vectors are normal), therefore the strain increment
vectors are supposed to be normal to the yield/fai lure surface. However, Fig. 4.8 shows
that the strain increment vectors from the current experimental data are more likely to be
normal to a circular potential surface in octahedral plane as represented by extended von-
Mises surface shown in the figure. Y ong and McKyes ( 1 97 1 ) reported similar plastic
potential surface for Kaolinite clay, however the failure surface was reported to follow
the Mohr-Coulomb criterion as opposed to 13 = k surface as observed in this study.
Callisto and Calabresi ( 1998), in the tests on natural Pisa clay, found that the strain
increment vectors follow a circular potential surface more closely than the yield surface
suggested in their paper. The experimental observations from the current study indicate
that for OC Kaolin clay, a circular plastic potential surfaces with failure criterion
corresponding to h=k surface was appropriate for varying intermediate principal stress
values. Therefore, this clay exhibits a non-associative flow rule.
The Mohr-Coulomb criterion defines the angle of internal friction, «!>', as a soil
parameter with no dependence on cr2• Other failure criteria previously noted are
dependent on cr2• The variation in «j>' with b-value from the experimental data is shown in
Fig. 4.9 and compared with the predicted relationships from different failure criteria. This
figure also confirms that the l3=k gives a reasonable prediction of measured data.
84

70 - - - - -- - --- - -
Extended von Mises
<l. 60 z _ o:: · w -e-1- -: z z - 0 50 u. -o t;
criterion
h = k, criterion
• I :
• � 0:: (!) LL � 40 - - - - - - 7- - - - - - - - - - - - - - l Mohr-Coulomb criterion I
30 0 0.2 0.4 0.6 0.8
I NTERMEDIATE PRINCIPAL STRESS RATIO - b
1
Figure 4.9 Angle of Internal Friction Compared with Different Failure Criteria
Strain Analysis and Localization Phenomenon
Bifurcation and Undrained Instability
Vardoulakis ( 1 982) defined bifurcation as "a critical state in deformation process
when deformation does not follow its 'straight ahead ' continuation but turns to an
entirely different mode." Under 'perfect' boundary conditions, a 'perfectly' homogeneous
material may undergo non-homogeneous defonnation, as various 'bifurcation' modes of
defonnation can develop. Hill ( 1962) proposed that the weak stationary discontinuities of
the velocity gradient during this bifurcation mode must be understood as localizations of
the defonnation into shear bands. Hvorslev ( 1960) observed these shear bands in a series
of unconfined compression tests on clay specimens with particle orientation different
from the geometric axis of specimen. In other series, the specimen with clay particle
85

orientation normal to the specimen axis showed considerable post fai lure bulging with
non-uniformity in axial as well as radial direction. It was reported that the degree of this
non-uniformity at large strains was much larger than theoretically expected non
uniformity due to the influence of frictional end restraint. Later Vardoulakis ( 1 982)
explained that "these 'additional non-uniformities ' are bifurcation and post-bifurcation
phenomena which are linked by the constitutive properties of the soil, specimen geometry
and boundary conditions, and by geometrical and/or material imperfections. " Hambly
( 1 972) performed strain controlled, plane strain tests with NC kaolin clay and reported
that shear bands were observed when the stress path reached the Mohr-Coulomb limit
surface, forming a rhombic pattern. First formulation for localization with shear band
formation in OC clay was given by Palmer and Rice ( 1 973 ).
Vardoulakis and Sulem ( 1 995) formulated that even for plastically incompressible
poro-elastoplastic material, undrained shear banding goes hand in hand with pore-water
pressure shocks. Under locally undrained condition when the fluid flow is zero
everywhere in the considered domain, these pressure shocks diffuse so quickly that in
actual time scale of any soil testing it can be concluded that no pore-pressure shocks can
develop across shear band boundaries and therefore undrained shear banding or
bifurcation mode can not be sustained. Vardoulakis ( 1985) showed that under locally
undrained condition Rice's ( 1 975) linear stability analysis at the state of maximum
deviator stress leads to a sharp transition from infinitely stable to infinitely unstable
behavior. In globally undrained condition when internal flow of pore-water can be
assumed to take place, shear banding is possible with global stability condition satisfied,
86
if the amount of water that has to flow across the shear band boundaries due to small
shear band dilation or contraction can be accommodated by elastic deformation of the
surrounding band soil mass. This phenomenon was further investigated and found to be
possible only at large deformations. Han and Vardoulakis ( 1 99 1 ) and Vardoulakis ( 1996)
supported this experimentally by performing undrained biaxial tests.
Sum of P rincip al Strains
In most of the previous studies, principal strains were measured only in two
directions and third principal strain was calculated from the volumetric strain information
(sum of principal strains). In such an approach, the error in strain measurements for any
non-uniformity in the deformed specimen is forced into the third principal strain only,
whereas this non-uniformity might have equally affected all the three principal strains.
Considering the fact that it is difficult to define the actual shape of deformed specimens
in various test methods, this assumption was good at small strains when the deviation
from actual deformation profile is considerably small. At larger strains when the level of
deviation increases, it becomes necessary to measure all the three principal strains and
analyze the data with these values only. In this process, at least the error is distributed
equally among all the three principal strains.
In this study, the normal strains were measured at the center of six faces on a
cubical specimen in all three principal directions. Summation of these normal strains in
three principal directions is plotted against the major principal strain in Fig. 4. 1 0. During
an undrained shear test, the volumetric strain should be zero for incompressible pore
fluid. The sum of principal strains would give the first approximation of this volumetric
87
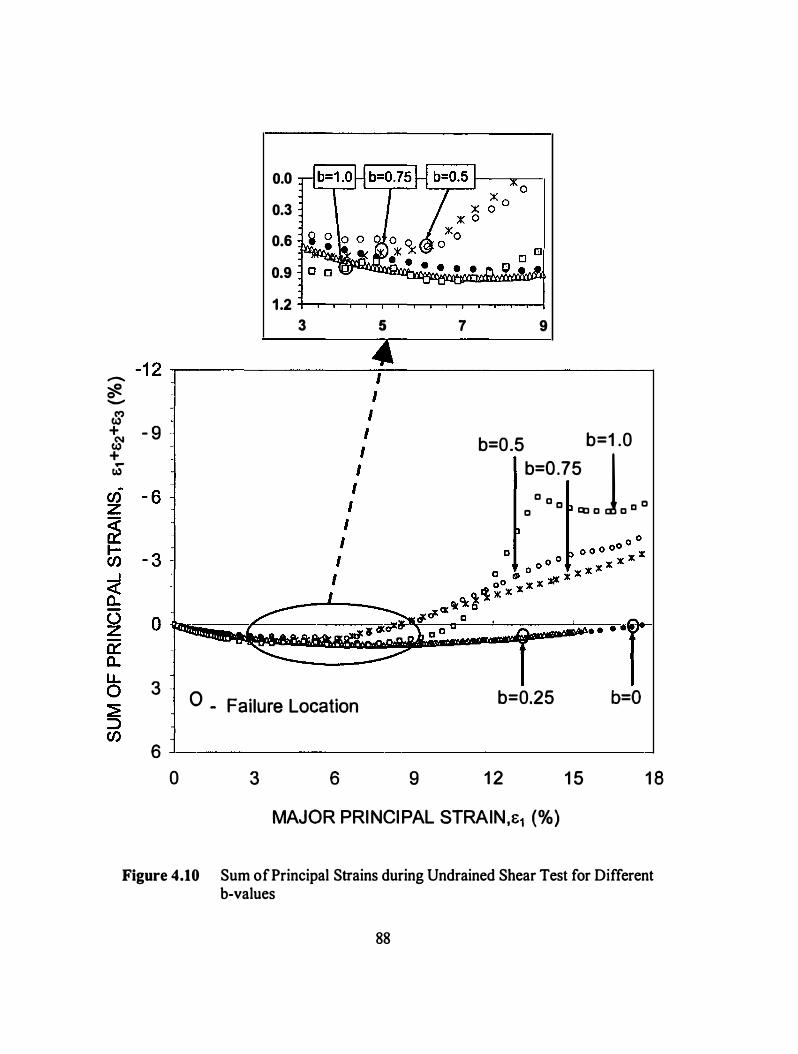
-
'#. -
� + - 9 -� +
... tl)
3 -
0.0
0.3
0.6
0.9 r������� 1 .2 +-r--T--r---r-�T"""""T---r---r--r-..-.r--r--r-�
3 5 7
0 - Failure Location
9
b=0.5 b=1 .0 b=Q .75 j
0 D a D 0 ctl a a 0
b=0.25 b=O
6 �--------------------------------------------�
0 3 6 9 1 2 1 5 1 8
MAJOR PRINCIPAL STRAIN,e1 (%)
Figure 4.10 Sum of Principal Strains during Undrained Shear Test for Different b-values
88
strain. In this study, the sum of observed principal strains was found to provide nonzero
values for all b-values. In fact these summation values were consistently larger than zero.
The reason for this can be explained by the setup used for measuring strains on the
cubical specimens. With a flexible membrane, true triaxial system, the deformation
profile is not completely uniform on each face of the cube (Mandeville and Penumadu,
2003). In order to see the profile of deformed specimen at different stages in stress-strain
curve, the b=l test (most critical case) was repeated several times. A few tests were
stopped just before the failure and others just after the failure. Fig. 4. l l (a) shows the
undeformed cubical specimen, which was later sheared to s1 = 4.2% (just past failure)
and then unloaded to zero stress state with the same strain rate as in loading. Fig. 4. 1 1 (b),
4. 1 1 (c) and 4. 1 1 (d) show pictures of the same deformed specimen. Edges and corners in
Fig 4. 1 1 (b) confirm that their overall configuration remains intact during shear; however,
Fig. 4. 1 1 (c) shows that the center of each face deforms slightly more than the edges and
corners. The system used in this study calculates the strain values on each face based on
the deformations measured at the center of the specimen and those may be slightly
different from the average strains on the entire face of the cube. Therefore, the sum of the
normal strains measured in all principal directions was found to be nonzero. The edges
and corners responsible for this small strain difference covered a very small area of each
face. The measured strain in each of the three directions was uniform for a large central
area as shown in Fig. 4. 1 1 (e). Therefore, the sum of the three principal strains should not
be large during controlled undrained shear. The strain rate at the edges or corners would
also be much smaller than the strain rate at the center representing most of the area of
89
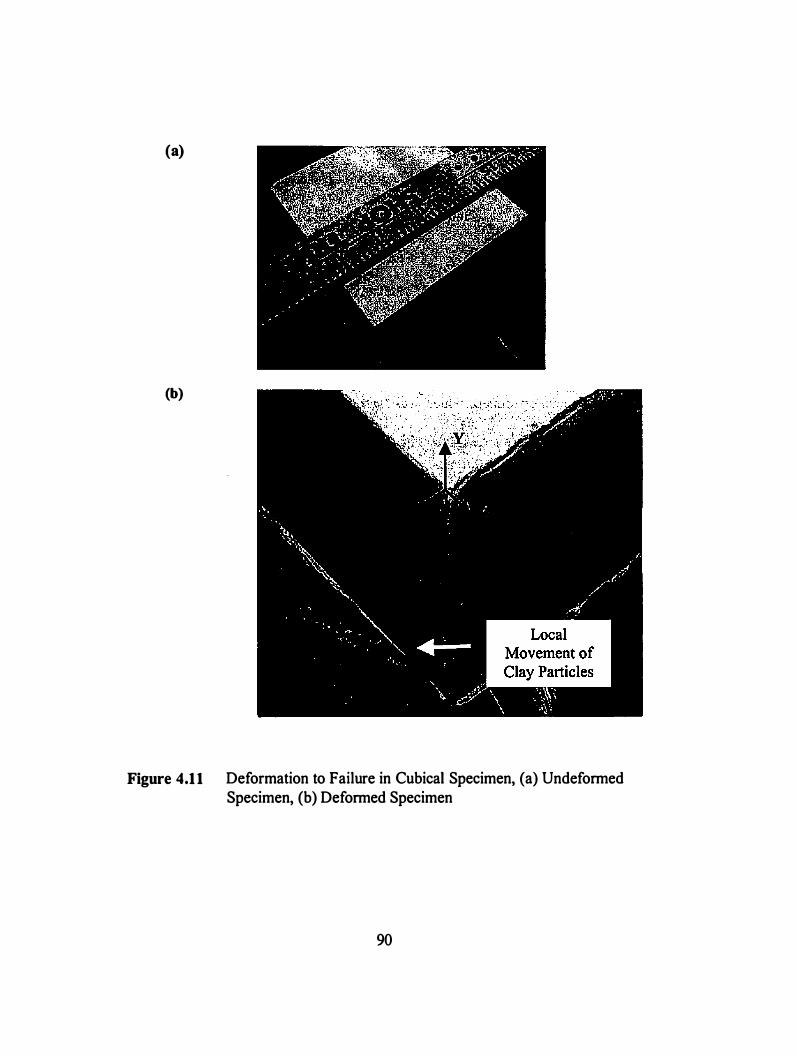
(a)
(b)
Figure 4.1 1 Deformation to Failure in Cubical Specimen, (a) Undeformed Specimen, (b) Deformed Specimen
90
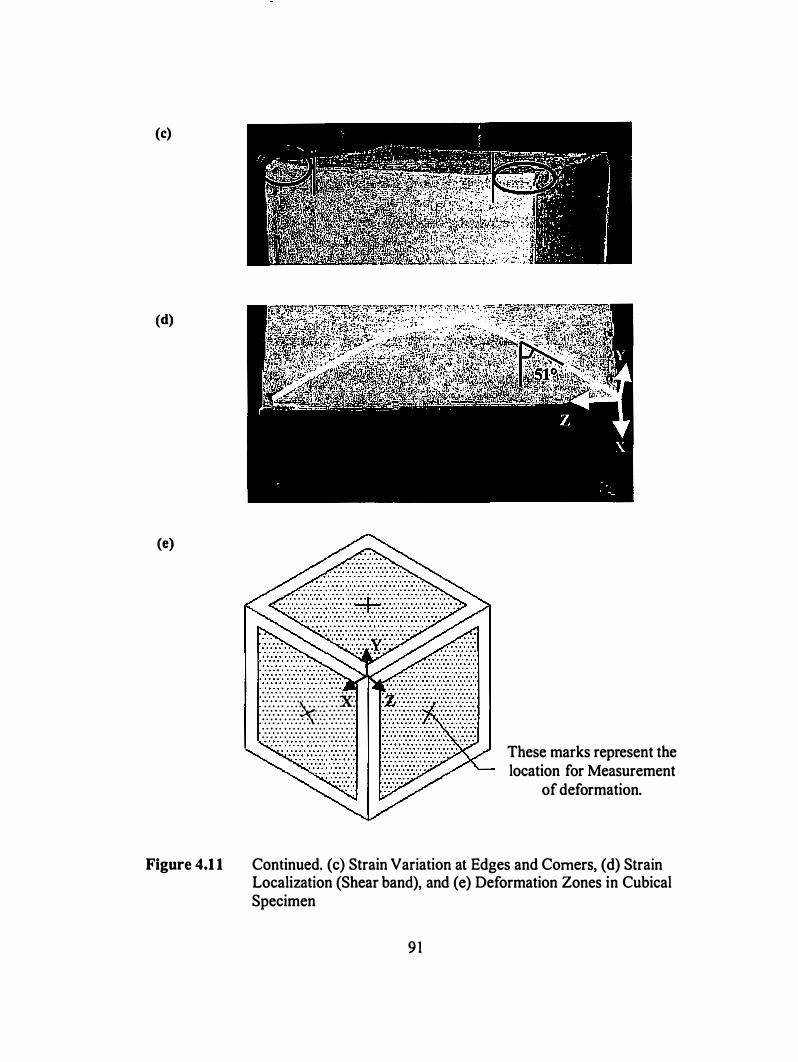
(c)
(d)
(e)
Figure 4.1 1
· · · · · · · · · · · · · · · · · · · · ·
: :�:�:�:�:� :}}��{:� :�:�:�� · · · · · · · · · · · · · · · · · · · · ·
· · · · · · · · · · · · · · · · · · · · · · . . . . . . . . . . . . . . . . . . . . .
These marks represent the location for Measurement
of deformation.
Continued. (c) Strain Variation at Edges and Comers, (d) Strain Localization (Shear band), and (e) Deformation Zones in Cubical Specimen
9 1
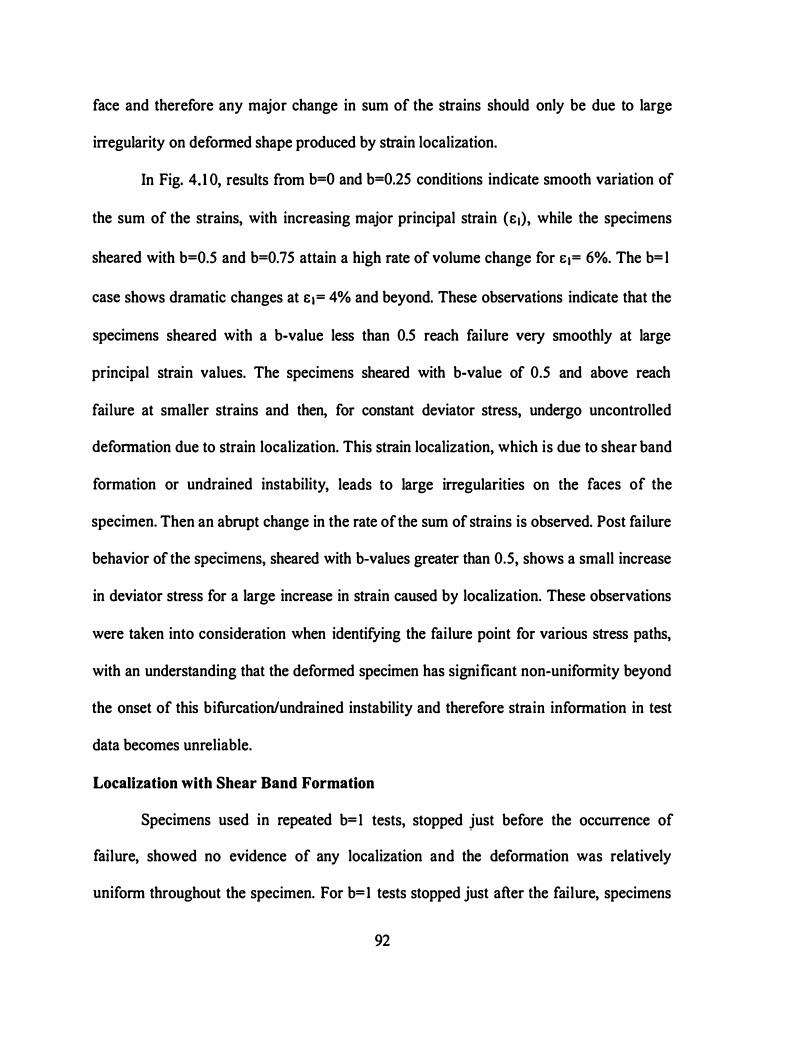
face and therefore any major change in sum of the strains should only be due to large
irregularity on deformed shape produced by strain localization.
In Fig. 4. 1 0, results from b=O and b=0.25 conditions indicate smooth variation of
the sum of the strains, with increasing major principal strain (&1), while the specimens
sheared with b=O.S and b=0.75 attain a high rate of volume change for e1= 6%. The b= l
case shows dramatic changes at &1= 4% and beyond. These observations indicate that the
specimens sheared with a b-value less than 0.5 reach failure very smoothly at large
principal strain values. The specimens sheared with b-value of 0.5 and above reach
failure at smaller strains and then, for constant deviator stress, undergo uncontrolled
deformation due to strain localization. This strain localization, which is due to shear band
formation or undrained instability, leads to large irregularities on the faces of the
specimen. Then an abrupt change in the rate of the sum of strains is observed. Post failure
behavior of the specimens, sheared with b-values greater than 0.5, shows a small increase
in deviator stress for a large increase in strain caused by localization. These observations
were taken into consideration when identifying the failure point for various stress paths,
with an understanding that the deformed specimen has significant non-uniformity beyond
the onset of this bifurcation/undrained instability and therefore strain information in test
data becomes unreliable.
Localization with Shear Band Formation
Specimens used in repeated b= 1 tests, stopped just before the occurrence of
failure, showed no evidence of any localization and the deformation was relatively
uniform throughout the specimen. For b= 1 tests stopped just after the failure, specimens
92

showed clear localization and was also confirmed by observing the variation of the sum
of principal strains. The circled area in Fig. 4. 1 1 (b) shows defused localization on the z
face with a barely visible shear band formation, which moves the soil particles locally
from the cube's z-face (cr1 -dir) to the x-face (cr3-dir). The y-face (cr2-dir) had more clear
shear band formation as shown in Fig. 4. 1 1 (d). These shear bands were inclined at an
angle of 5 1 o (approx.) from the cr3 direction. The specimens observed well after reaching
failure in the original series of tests, showed similar but more complex shear-band
formations for b=0.5 and higher, and they also had localized bulging in the 0'3 direction.
For b<0.5, the specimen extruded after failure showed no visible non-uniformities.
Variation of Principal Strains and Strain Rates
In order to maintain a constant strain rate in the cr1 direction (z-axis), total stress
( O'z) was applied on the corresponding face of cubical specimen through PID control. The
total stress in the 0'3 direction (x-axis) was maintained constant and the total stress in the
cr2 direction (y-axis) was applied through PID control to maintain a target b-value. Figure
4. 1 2 shows the variation of three principal strains with time. Figure 4. 1 3 shows the time
variation of the rates of these strains. The observed variation in &1 is identical for all the
b-values ( &1 =0.05%/min. ), which confirms the excellent strain rate control provided by
the PID algorithm employed in this test series. Pre-failure &2 and &3 values were observed
to have linear relationships with time, while these strains (and their rates) at failure
experienced abrupt changes. For the b=1 case, cr1 and cr2 had the same magnitude
throughout the duration of the test, and assuming that the specimen was approximately
isotropic, the corresponding strains also should have relatively close values. A similar
93
6
0
1 8
<i. 1 2 a.. (.) . z - 6 c::: '#. 0.. ';:; w Co) � z o
fn g � (/.) -6
� -1 2
...J < -[;k cfl.
-1 8
0
u -z f3 -6 c::: -a.. Z
5 g -1 2 Z (f.) ::E
-1 8
b=0.7 b=0.5
b=O
.---------------1 Arrows represent Failure Location
0
b=1 .0 b=0.5
b=0.75
b=0.75 b=0.5
1 00 200 Time (Min)
b=0.25 b=O
300
Figure 4.12 Variation of Principal Strain with Time during Shear Test
94
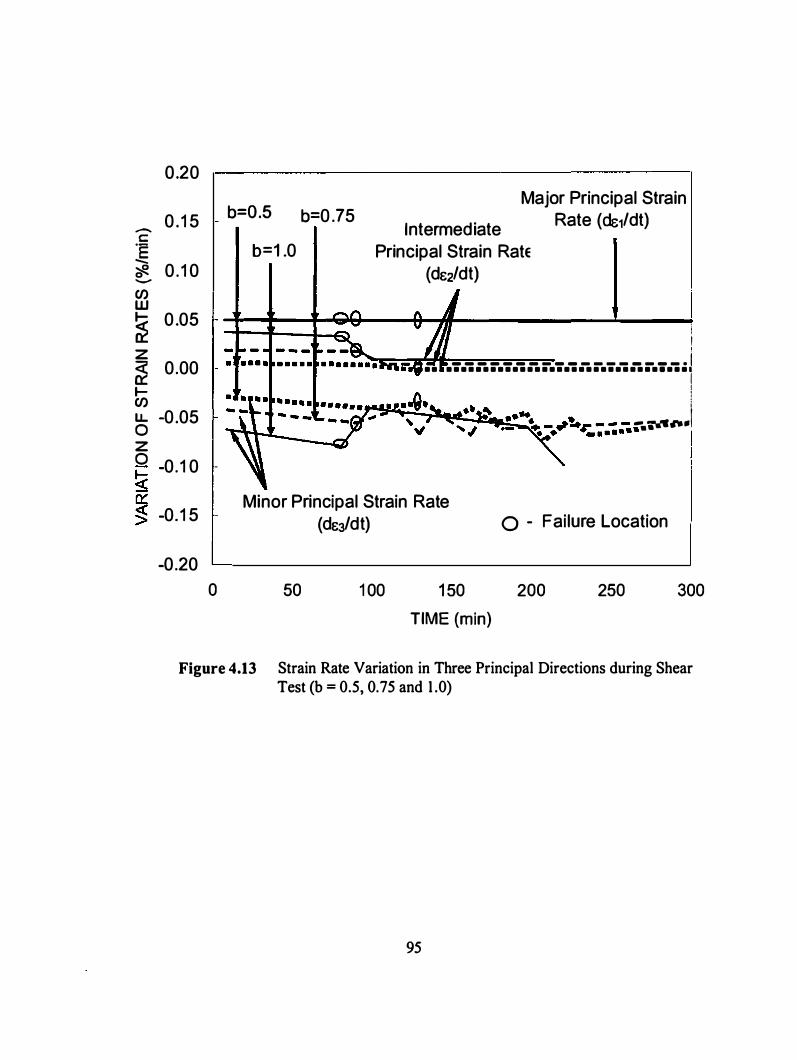
0.20
0 . 1 5 -c: � '#. 0 . 1 0
-
(f) w � 0 .05
z � 0.00
1-(f) u. -0.05 0 z 0 -0 . 1 0 -� � -0. 1 5 -
-0 .20
0
b=O.S b=0 .75
b=1 .0
Major Principal Strain
Rate (cls1/dt) Intermediate
Principal Strain Rate
(de2/dt)
i I I
- - - - - - - - - - - - - - - - - - · 1 • • • • • • • • • • • • • • • • • • • • • • • • • • • • • • • • • • • •
I i �������·�·�� • I ' - - � - ., ... _ - - - -.';'li'W.,... • • • •• • • • • ••
I I Minor Principal Strain Rate
(deJ/dt) 0 - Failure Location
50 1 00 1 50
TIME (min)
200 250 300
Figure 4.13 Strain Rate Variation in Three Principal Directions during Shear Test (b = 0.5, 0. 75 and 1 .0)
95
observation was expected between 62 and 63 for b=O case. Experimental observations in
Fig. 4. 1 2 in fact show that the pre-failure strains closely followed this expected behavior
and, because of the strain localization due to bifurcation or undrained instability in the
soil, post-failure strains deviated from the expected behavior. Variation of 62 and 63 for
the b=0.25 case show some fluctuation after failure. This indicates a possibility of
localization after this point, but it was not prominent enough to be visible in this case. In
the b=0.5 case, 62 was negligible until it reached the failure point, then after the failure, it
showed an expansion with a rate of 0.005%/min. Therefore the b=0.5 case can beassumed
to follow the plane strain condition. However, the Mohr-Coulomb criterion implicitly
assumes the plane strain condition for all b-values. Tests with b-values of 0.5 and higher
show significant changes in strain rate close to failure; therefore, only these tests are
shown in Fig. 4. 13 . This figure indicates that for all these b-values, minor principal strain
rates after the failure was approximately equal for varying stress paths, and the strain
rates in the intermediate principal direction equal zero. This observation leads to a
reasonable argument that, after fai lure, the deformation becomes inceasingly localized in
shear band formation. The soil particles in other zones start to move from the cr1 to cr3
direction, and the cr2 direction becomes more or less inactive. In a recent study, Wang and
Lade (200 1 ) observed a similar tendency along the cr2 direction for drained tests on Santa
Monica beach sand.
96
Conclusions
A three-dimensional flexible boundary true triaxial system with real time PID
feedback control system is a good experimental tool to obtain reliable three-dimensional
constitutive data. In this system, PID coefficients have to be chosen carefully with due
consideration to the effect of specimen stiffuess variation during shear. These control
parameters should be tuned independently for a given soil type with different stress
history. Present research shows that they do not need to be retuned for simulating
different stress paths for a given OCR value.
The stress paths applied under 3-D conditions significantly affect the stress-strain
strength behavior and pore pressure response of OC clay. Key observations from this
study are the following:
• Stiffness of the clay at small strains increases with the increasing value of cr2•
• Shear strain to failure decreases with the increasing b-value.
• For kaolin clay with OCR=5, excess pore pressure generated during undrained shear
is relatively small for all the b-values. The peak excess pore pressure increases with
increasing b-value.
• Yield locations from stress-strain curves suggest that specimens sheared with b � 0.5,
have predominantly elastic pre-failure behavior, whereas, for the specimens sheared
with b<0.5, the elastic zone ends well before the failure.
Identification of strain localization onset is an important aspect in defining the
failure point precisely, because, beyond this point, the test data without exact information
about specimen deformation is not reliable. This study suggests that the following
97
information can be used as a possible tool for identification of strain localization in
undrained true-triaxial testing:
• A sudden change in the variation of the sum of principal strains, ultimately reaching
large values.
• An abrupt change or fluctuation in the evolution of intermediate and minor principal
strains.
Under undrained conditions, shear banding was observed to occur on or after the peak
shear stress location.
Experimental data for the failure stress states in the octahedral plane closely
follows a constant third invariant failure criterion (h=k). Strain increment vectors drawn
at corresponding failure points in the octahedral plane suggest that the plastic potential
surface appears to be circular in shape and is supported by the findings of Yong and
McKyes { 1 97 1 ) and Callisto and Calabresi ( 1998). Based on the experimental data
presented, h=k, yield/failure criterion with extended von Mises plastic potential surface
is suggested for modeling the 3-D shear behavior of the OC Kaolin clay used in this
study.
98
Chapter 5. Development of Suitable Three-Dimensional Yield
and Failure Surfaces from Experimental Data
This chapter is a slightly revised version of a paper submitted to the Journal Soils
and Foundations in 2004 by Amit Prashant and Dayakar Penumadu:
Prashant, A., and Penumadu, D. "Three-Dimensional Mechanical Behavior of
Kaolin Clay." In review , Soils and Foundations.
My primary contribution to this paper include: ( 1 ) selection of the topic and
development of the problem to study the three-dimensional constitutive behavior of
cohesive materials, (2) identification of the study topics, (3) gathering and interpretation
of published literature, (4) performing all the laboratory experiments, (5) interpretation
and analysis of test results, and (6) part of the writing related to manuscript preparation.
Abstract
A series of strain controlled undrained true triaxial tests on cubical specimens
have been performed using a fully automated flexible boundary experimental setup, with
real-time feedback control system to evaluate the three-dimensional mechanical behavior
of kaolin clay. This chapter concentrates on the relative response of the soil elements
under monotonic shear loading observed at various overconsolidation levels. A possible
shape of the initial yield surface is explored based on the limit of purely elastic
deformations. The discussion includes the influence of the relative magnitudes of the
principal stresses on the clay behavior observed at different overconsolidation ratio
values. Failure condition is shown to be governed by the onset of localizations developed
within the specimens, and because of which the specimens show brittle response at
99
failure. Based on the experimental observations, a 3D dynamic failure criterion is
developed, which involves a failure surface that grows in size as a function of pre
consolidation stress. A reference surface constraining the ultimate yielding of clay,
commonly used in bounding surface plasticity, is found to be different from the observed
failure surface, due to the brittle response of the clay.
Keywords: Localization, Overconsolidated clays, Shear deformation, Strain, Three
dimensional analysis, Undrained shear tests, Yielding.
Introduction
Cohesive frictional materials show complex mechanical behavior. The stress
strain behavior depends on the size, shape, mineral composition and packing of the
particles, past stress history, type of pore fluid, magnitude and orientation of principal
stresses during loading, rate of loading, and other factors. Single element laboratory tests
were often used to characterize various aspects of the observed soil behavior, and the
experimental data obtained was used to formulate constitutive equations (Roscoe and
Burland 1 968, Schofield and Wroth 1 968, Prevost 1 98 1 , Defalias 1 987, Lade 1990,
Whittle and Kavvadas 1 994 and many others). Laboratory tests in earlier studies for a
comprehensive description of normally consolidated and overconsolidated clays (e.g.,
Henkel 1 959; Parry 1960) often involved single axis loading conditions (e.g., triaxial
compression testing). However, for better simulation of field conditions, the laboratory
tests had to be designed to evaluate three-dimensional yield and failure behavior by
subjecting a soil element to a true triaxial state of stress and strain. Early devices that
were developed to perform these tests were cumbersome, difficult to operate and
typically required manual control to perform experiments. Recent advances in control
100
hardware and software have allowed high-speed digital closed loop control to be used in
soil testing. This allows accurate and repeatable tests to be performed on the soil
specimens. Shibata and Karube ( 1965), Broms and Casbarian ( 1 965), Yong and McKyes
( 1971 ), Vaid and Campanella ( 1 974), Saada and Bianchini ( 1 975), Lade and Musante
( 1 978), and Germaine ( 1982) took advantage of these technologies in parts and
performed traditional triaxial, plane strain, axial-torsional and true triaxial tests.
However, most of these studies were limited to the description of normally consolidated
clay behavior and the primary discussion was about the influence of the changing
magnitudes and directions of the principal stresses. For a complete description of the clay
behavior, it is essential to perform similar studies at various overconsolidation ratio
(OCR) values using the same testing apparatus. Use of same testing apparatus should
eliminate the influence of specimen shape and boundary conditions on the observed
relative response of the clay.
The objective of the current research is to evaluate the relative response of the
three-dimensional mechanical behavior of normally consolidated to heavily
overconsolidated kaolin clay using the true triaxial device described in chapter 2. The
influence of anisotropy on the consolidation behavior of clay was evaluated by
performing two constant rate of strain (CRS) tests. In one test, the axial load for Ko
consolidation was applied in the direction of initial slurry consolidation; whereas in the
other test the axial load was perpendicular to it.
The true triaxial tests were performed on the cubical specimens at vanous
intermediate principal stress ratio, b = 0, 0.25, 0.5, 0. 75 and 1 .0. Keeping the same initial
isotropic pre-consolidation stress value (275 kPa}, the tests were repeated for three OCR
10 1
values, OCR=l , 5 and 1 0. The observed stress-strain, pore pressure and strength behavior
in a series of tests on nonnally consolidated (OCR=l), and moderately overconsolidated
(OCR=5) kaolin clay were presented chapter 3 and 4, and the results were discussed to
evaluate the influence of the relative magnitude of intennediate principal stress ( cr2) and
the onset of localization. The influence of cr2 for lightly overconsolidated clays may be
assumed to be observed between these two OCR values (OCR= I and 5), however for
heavily overconsolidated clay the stress anisotropy might show significantly different
behavior. Results obtained from a similar series of tests on heavily overconsolidated
(OCR=I O) kaolin clay are included in this chapter in order to compare them with the
observations at OCR=l and 5 . To complete the description of overconsolidated clay, two
triaxial compression {b=O) tests were also perfonned on the cubical specimens with
lightly overconsolidated initial stress state i.e. with OCR= 1 .5 and 2. All of these tests
were compressive in nature in tenns of total stress applied on the specimens during
shearing. This means that even for the b=l case, the shear stress was applied by
increasing the same amount of nonnal stress in cr1 and cr2 directions and maintaining a
constant total stress in the cr3 direction.
Consolidation Behavior of Clay
During the specimen preparation, the slurry was initially consolidated to 207 kPa
effective vertical stress under Ko condition, and the direction of loading was marked as
the z-axis of each specimen. As a result, the specimens were supposed to have a certain
degree of cross-anisotropy (both stress induced and inherent) about the z- axis. In order to
assess the influence of this anisotropy on the consolidation behavior of clay, a constant
102
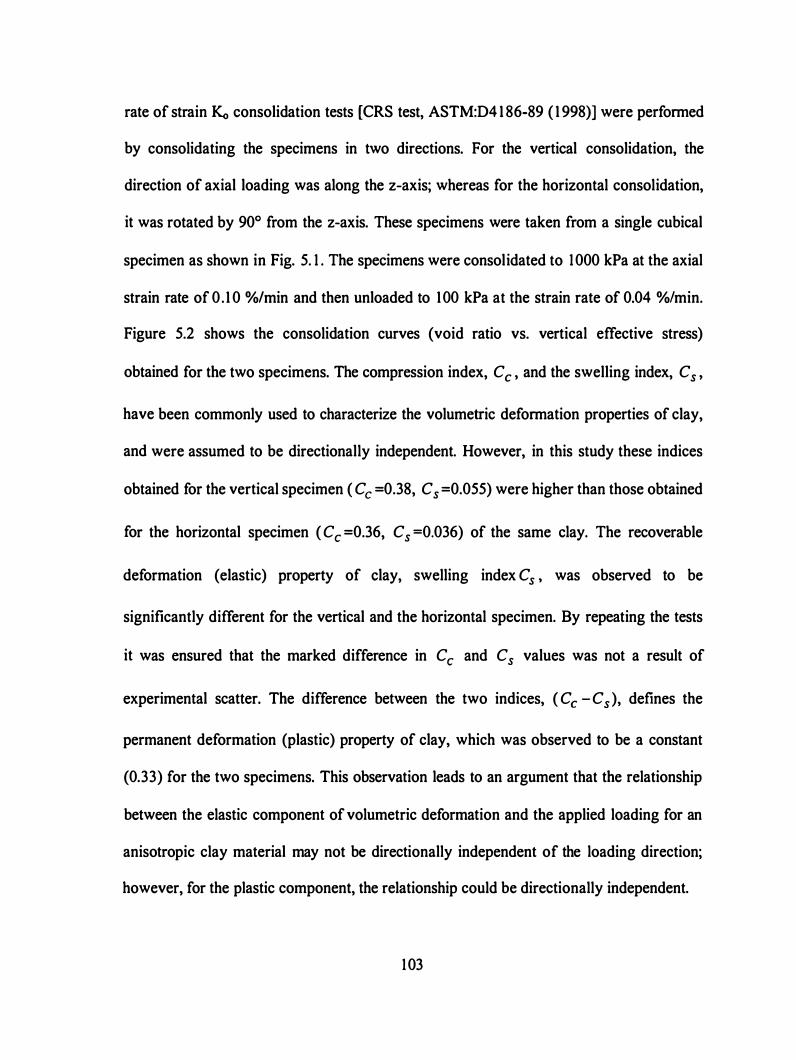
rate of strain Ko consolidation tests [CRS test, ASTM:D4 1 86-89 ( 1 998)] were performed
by consolidating the specimens in two directions. For the vertical consolidation, the
direction of axial loading was along the z-axis; whereas for the horizontal consolidation,
it was rotated by 90° from the z-axis. These specimens were taken from a single cubical
specimen as shown in Fig. 5. 1 . The specimens were consolidated to 1000 kPa at the axial
strain rate of 0 . 1 0 %/min and then unloaded to 100 kPa at the strain rate of 0.04 %/min.
Figure 5.2 shows the consolidation curves (void ratio vs. vertical effective stress)
obtained for the two specimens. The compression index, Cc , and the swelling index, C5 ,
have been commonly used to characterize the volumetric deformation properties of clay,
and were assumed to be directionally independent. However, in this study these indices
obtained for the vertical specimen ( Cc =0.38, C5 =0.055) were higher than those obtained
for the horizontal specimen ( c, =0.36, C5 =0.036) of the same clay. The recoverable
deformation (elastic) property of clay, swelling index C5 , was observed to be
significantly different for the vertical and the horizontal specimen. By repeating the tests
it was ensured that the marked difference in c, and C5 values was not a result of
experimental scatter. The difference between the two indices, ( Cc -C5 ), defines the
permanent deformation (plastic) property of clay, which was observed to be a constant
(0.33) for the two specimens. This observation leads to an argument that the relationship
between the elastic component of volumetric deformation and the applied loading for an
anisotropic clay material may not be directionally independent of the loading direction;
however, for the plastic component, the relationship could be directionally independent.
103
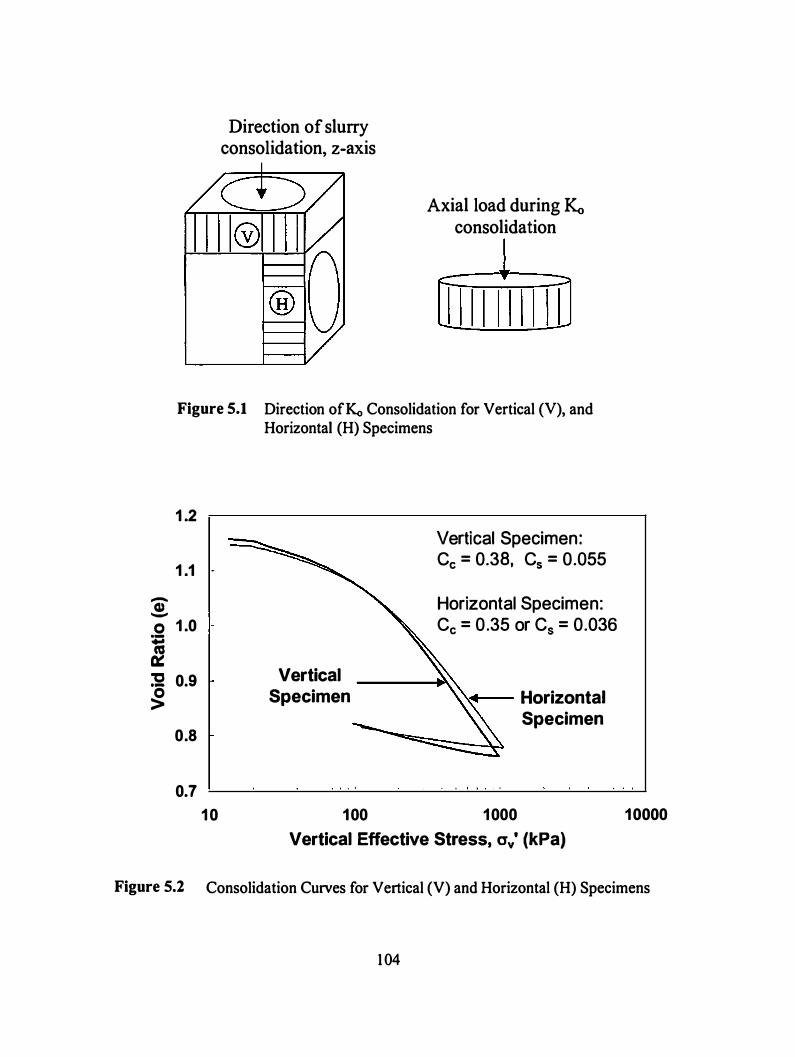
-G) -
0 ;: ca 0:: "0 ·-0 >
Direction of slurry consolidation, z-axis
Axial load during Ko consolidation
1 1 1 1 1 1 1 1 1 [ Figure 5.1 Direction ofKo Consolidation for Vertical (V), and
Horizontal (H) Specimens
1 .2
Vertical Specimen:
1 .1 -Cc = 0.38, C5 = 0.055
Horizontal Specimen: 1 .0 Cc = 0.35 or C5 = 0.036
0.9 Vertical Specimen Horizontal
Specimen 0.8
0.7
1 0 100 1000
Vertical Effective Stress, av' (kPa)
10000
Figure 5.2 Consolidation Curves for Vertical (V) and Horizontal (H) Specimens
1 04
Shear Failure and Localization
During the shear behavior analysis of undrained true triaxial test data, the failure
point was defined as the point of peak deviator stress just before the specimen sheared to
large strains, with negligible change in shear stress. This definition of failure point was
suitable in this series of true triaxial tests, because the specimens were observed to have
localized deformation at and beyond peak deviator stress. A method of identifying the
onset of localization using the strain information obtained from a true triaxial shear test
was presented in Chapter 4. Shear bands and defused localizations observed in the
specimens sheared from initial hydrostatic stress state corresponding to OCR=5 were
presented in previous chapter. Similar patterns were observed for the specimens sheared
with normally consolidated (OCR=l ) to heavily overconsolidated (OCR=I O) stress state.
Hvorslev ( 1960) observed shear bands and/or post failure bulging in a series of
unconfined compression tests on clay specimens. Vardoulakis ( 1982) explained that these
non-uniformities are "bifurcation and post-bifurcation phenomena which are linked by
the constitutive properties of the soil, specimen geometry and boundary conditions, and
by geometrical and/or material imperfections. " Bifurcation was defined as "a critical
state in deformation process when deformation does not follow its 'straight ahead '
continuation but turns to an entirely different mode., Under "perfect" boundary
conditions, a "perfectly" homogeneous material may undergo non-homogeneous
deformation, as various bifurcation modes of deformation develop. Because of this
phenomenon, we can say that the single element testing methods with different boundary
conditions and specimen shapes may show different post-bifurcation shear behavior.
Moreover, in the presence of the localized deformation, the strain state cannot be
105
detennined accurately using global measurements of defonnation, which is the case in
most of the single element testing apparatuses used by researchers. In light of these
observations and based on the data available to date in literature, one can say that the
constitutive equations may only be developed to define the pre-localization behavior of
clay, and the fai lure condition in such a model should be assumed at the onset of
localization .. However, in most of the previous studies, this phenomenon was overlooked
and was not considered during the development of various theories, which attempt to
propose the use of nonnalized strength behavior for cohesive soil.
Undrained Shear Behavior from Triaxial Compression Tests at
Different 'OCR' Values
Undrained triaxial compression (b=O) tests were perfonned by shearing the
cubical specimens from the initial hydrostatic stress states corresponding to OCR= 1 , 1 .5,
2, 5, and 1 0. The pre-consolidation stress before shearing was the same for all the
specimens, as p: =275 kPa. The shear stress-strain behavior and the effective stress paths
observed during these tests are shown in Fig. 5.3 and 5.4 respectively. The mean effective
stress, p' , deviator stress, q, and the shear strain, Eq, were calculated from the general
invariant expression shown in equation A. l , A.2, and A.3 of Appendix-A.
For each OCR value, the observed stress-strain relationship (Fig. 5.3) was
nonlinear from start to failure. With due consideration to classical elasto-plasticity
theories, the elastic zone (to define a yield surface) of shear defonnation, for
overconsolidated clays, was identified to correspond to small magnitude of shear strain
values, where the stress-strain relationship was approximately linear. An approximate
1 06
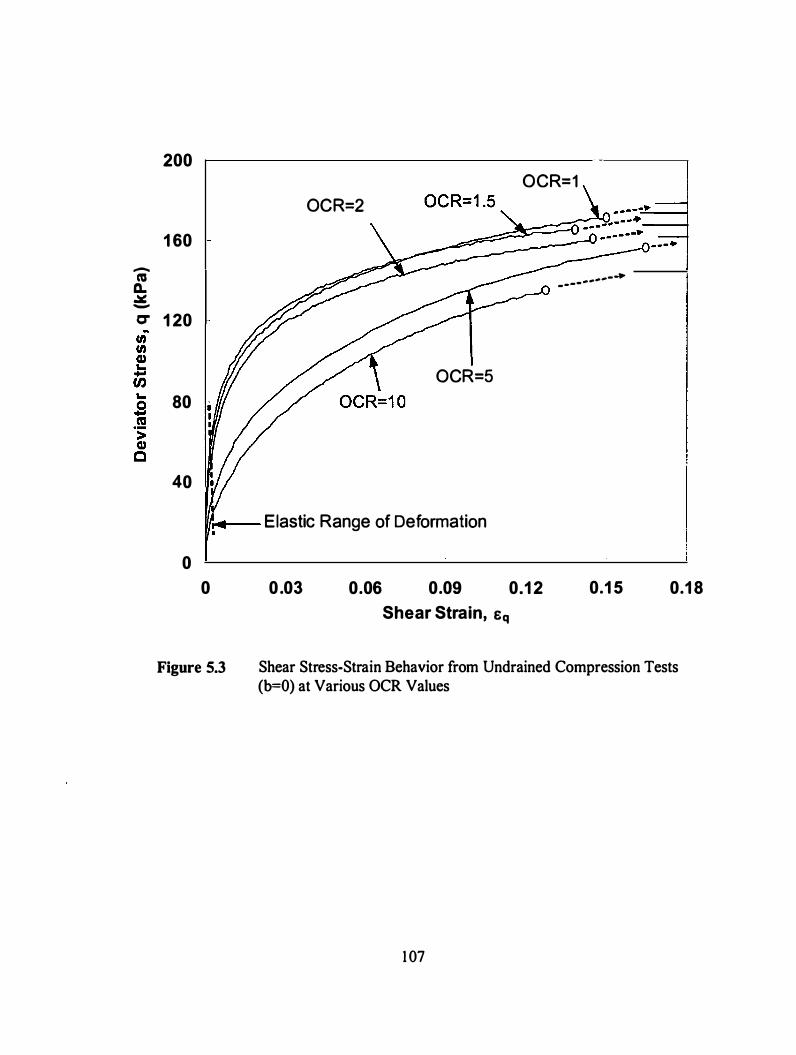
200 OCR=1
OCR=2
1 60
-cu Q. _ _ _ _ _ _ _ ___
_.
.:.:: -
CT 1 20
OCR=5
80
40
�,.,. __ Elastic Range of Deformation
0
0
Figure 5.3
0 .03 0.06 0.09 0.1 2 0.1 5 0.1 8
Shear Strain, sq
Shear Stress-Strain Behavior from Undrained Compression Tests (b=O) at Various OCR Values
1 07
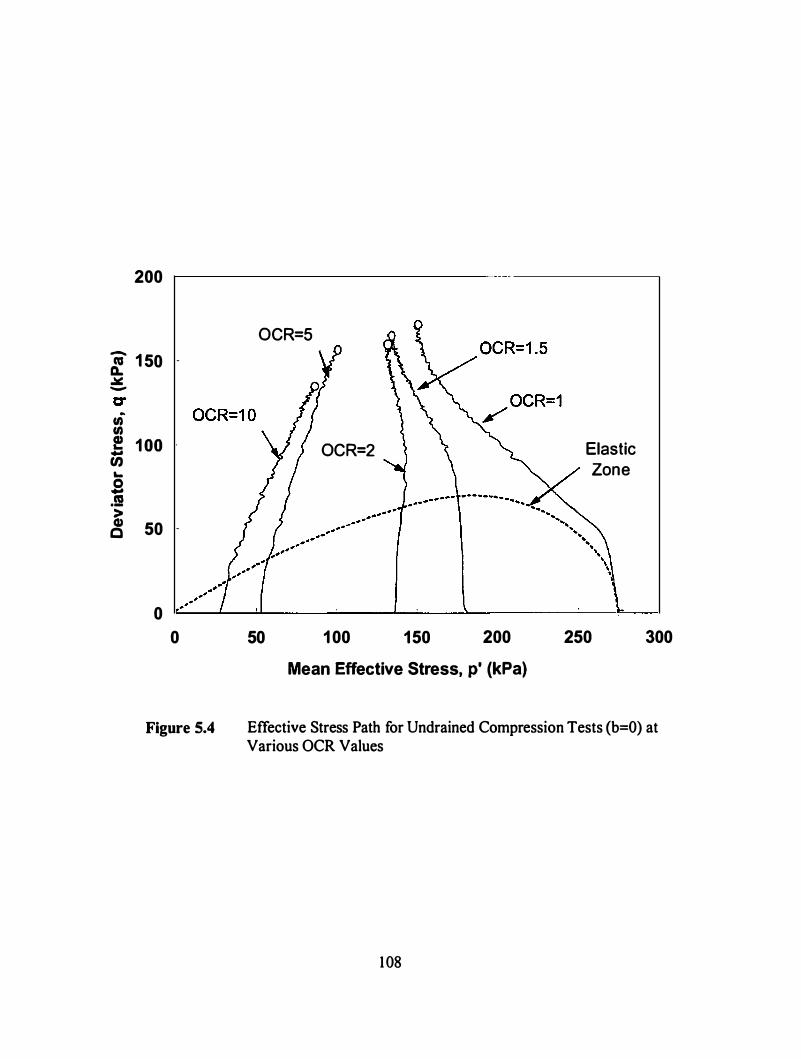
200
Ci 1 50 -£L .llll:: -
.. tn tn e 1 oo -U) ..
.s .m i; c 50 -
0
0
Figure 5.4
OCR=5
OCR=2
50 1 00 150 200
Mean Effective Stress, p' (kPa)
Elastic Zone
250 300
Effective Stress Path for Undrained Compression Tests {b=O) at Various OCR Values
108
limit of this elastic zone (defining yield points) is shown in Fig. 5.3. In elasto-plasticity
theory, a yield surface was defined in the stress space as the limit of elastic deformation,
and the stress state at this surface was assumed to be normally consolidated. A probable
yield surface in q- p' stress space is shown in Fig. 5 .4, by mapping the yield points
determined from the stress-strain curves in Fig. 5.3 . In 3D stress space, this surface
defines the cross-section of a 3D yield surface of clay in triaxial compression plane; the
p' axis would be along the hydrostatic stress line. The shape of this yield surface can be
visualized as a teardrop; which is similar to the one suggested by Lade ( 1990) based on
the contours of plastic work.
Considering the simplicity of formulation, most constitutive theories assume
isotropic elasticity and define the elastic deformation to be uncoupled for volumetric and
shear components. In such a case, the elastic volumetric deformation can be assumed to
occur in the specimen, only if there was a change in the mean effective stress. During
undrained shear, the total volumetric deformation (combined elastic and plastic
componants) remains zero throughout the shearing; and therefore, in the elastic zone, the
mean effective stress should remain constant to maintain zero elastic volumetric
deformation. Within the limit of the initial yield surface shown in Fig. 5.4, the stress
paths for the tests at various OCRs can reasonably be assumed to have constant mean
effective stress. However, due to a combined influence of the specimen anisotropy and
transitional plasticity, a small change in mean effective stress p' was observed before
reaching the initial yield surface. In elasto-plastic region (beyond the initial yield
surface), the change in mean effective stress p' during shearing shows the dilatancy
109
behavior of the clay. The change in mean effective stress, - llp' , during an undrained test
on saturated soil represents a part of the excess pore pressure �Uq that developed due to
the applied shear stress (discussed in Chapter 3). The rest of the pore pressure develops
due to the change in mean total stress. Figure 5.5 shows the evolution of total excess pore
pressure �u, and its part generated due to shear �uq with increasing shear strain Sq. This
figure shows same pattern of variation for both �u, and �uq, because the loading pattern
(b=O, and cr1 along the axis of cross-anisotropy) was same for all five tests. The decrease
in p' (+�uq) during undrained shearing indicates the tendency of volumetric
compression; whereas, the increase in p' (-�Uq) gives the dilative potential of clay. The
specimens sheared from OCR=l to 2 showed consistent decrease in p' during yielding;
however, the total change in p' through failure, as a result of the contractive nature,
decreases with the increasing OCR. For higher OCR values (OCR=5 and I 0), p' was
increasing (dilative) throughout the shearing. From the data presented in Fig. 5 .4, a
threshold value of OCR=2.2 may be approximated at which the dilatancy potential can be
assumed to be zero.
The specimen sheared at various OCR values showed failure at the shear strain of
1 3%-1 5%. During most of the tests, the specimen sheared at constant shear stress beyond
failure; however, the shear stiffness just before the failure was not zero. The stress-strain
relationship reached the failure smoothly and showed a sudden change in the slope at
failure (See stress-strain relationships shown in Fig. 5 .6). The reason behind this brittle
behavior was probably the localization developed within the specimens at failure points.
The specimen might have reached a higher shear stress level in the absence of
1 10
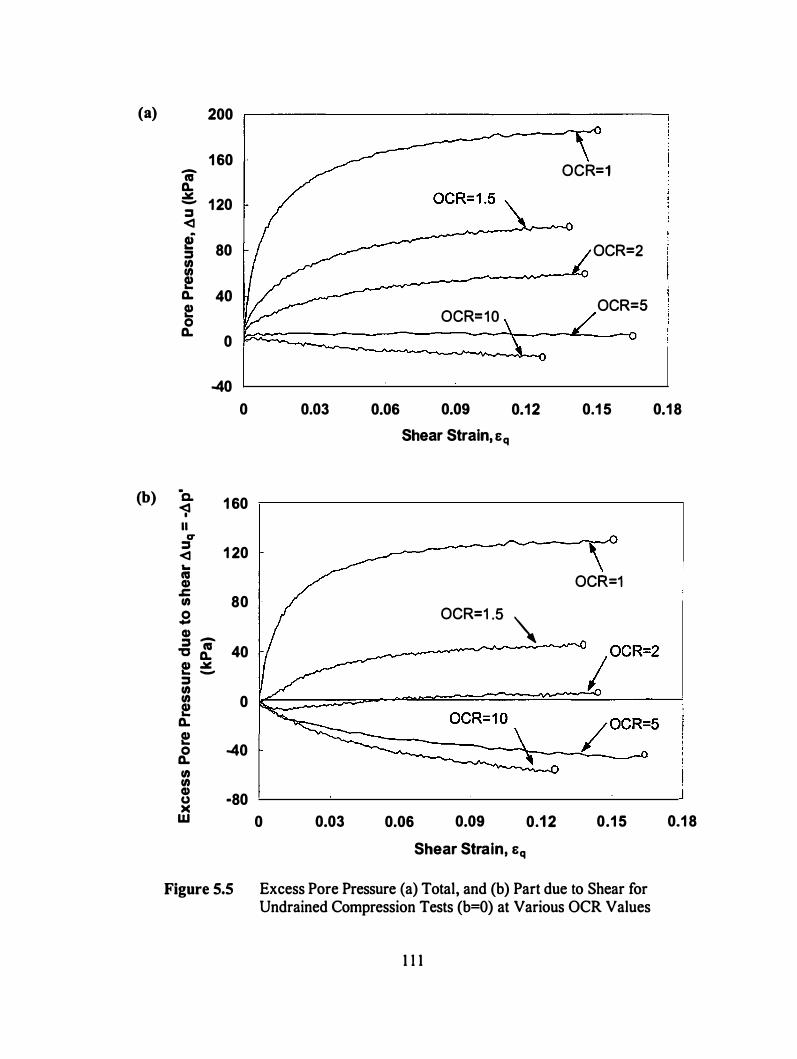
(a)
(b)
200
1 60 OCR=1 -ca Q. .¥
1 20 -:::s <I ! 80 OCR=2 :::s (I) (I) e Q. 40
e OCR= 1 0 OCR=S
0 Q. 0
-40
0 0.03 0.06 0.09 0.12 0.1 5
Shear Strain, E q
·a. 1 60 �
II r:r :::s
1 20 <I .. ca Q) OCR=1 �
80 (I) 0 .... Q) -:::s ca
40 "C Q.
OCR=1 .5 '\ e .¥ -:::s (I) (I) 0 e Q. e
-40 0 Q. (I) (I) Q)
-80 u )(
w 0 0.03 0.06 0.09 0.1 2 0.1 5
Shear Strain, Eq
Figure 5.5 Excess Pore Pressure (a) Total, and (b) Part due to Shear for Undrained Compression Tests (b=O) at Various OCR Values
1 1 1
0.1 8
0.1 8
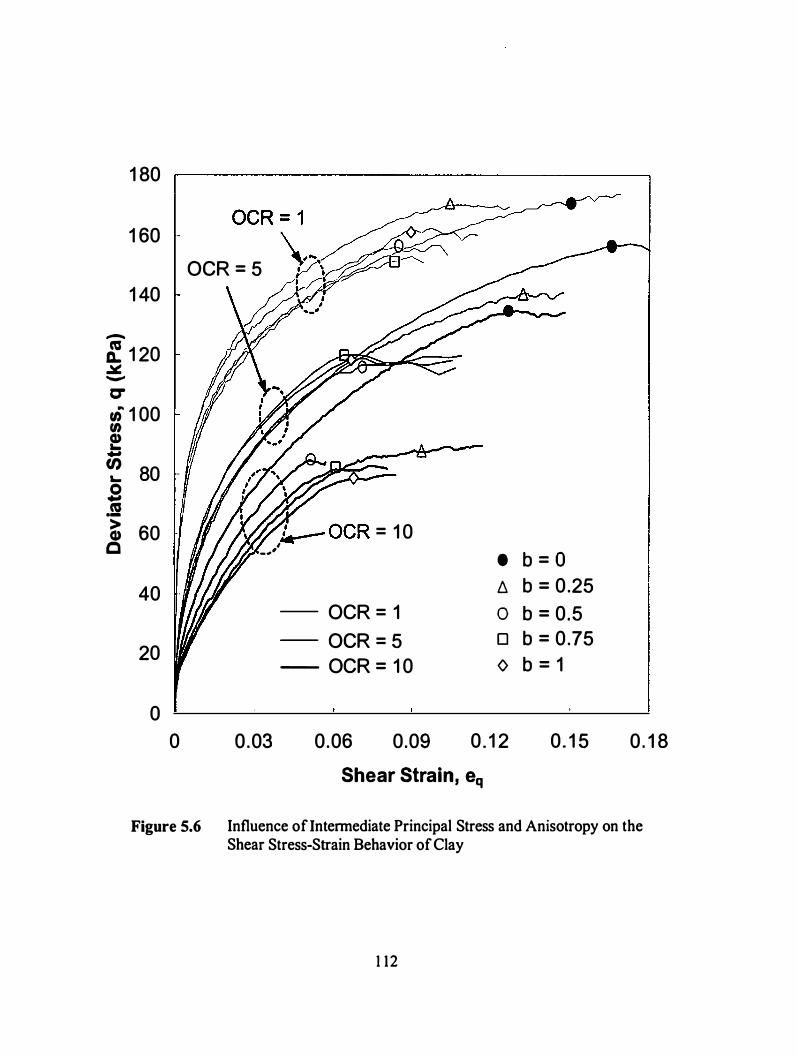
1 80
1 60 -
1 40 -� 1 20 � -
C" ci 1 00 tn e
.. � 80 -
.s «S ·-> Q) c 60
40
20
0 0
OCR = 5
_<#,
0.03
k--OCR = 1 0 I
• b = O D. b = 0 .25
- OCR = 1 0 b = 0 .5 - OCR = 5 0 b = 0 .75 - OCR = 1 0 0 b = 1
0.06 0.09 0. 1 2 0. 1 5 0 . 1 8 Shear Strain, eq
Figure 5.6 Influence oflntennediate Principal Stress and Anisotropy on the Shear Stress-Strain Behavior of Clay
1 12
localization. These hypothetical peak shear stress levels were determined for each test by
extrapolating the stress-strain relationship to a point of zero shear stiffuess and they are
shown in Fig. 5.3, using straight lines in front of the curves. Based on these observations,
one can say that a constitutive theory developed for such clay should define its limiting
yield surface independent of the failure surface. Such types of reference surfaces
constraining the ultimate yield surface have been commonly used in many bounding
surface plasticity theories (Mroz 1963 , Dafalias 1 986), however, they did not differentiate
between the reference surface and the failure surface. From the experimental observations
in this study, the failure surface may be defined as a lower bound for the reference
surface, and that would ensure the applicability of the definition of failure at peak
deviatoric stress.
Influence of Intermediate Principal Stress
To study the influence of intermediate principal stress (a; ) on the clay behavior,
a series of constant b-value true triaxial undrained tests were performed for b=O, 0.25,
0.5, 0.75, and I , at various OCR values. The data obtained from the series of tests
performed on the normally consolidated (NC), and moderately overconsolidated
(OCR=5) cubical specimens of kaolin clay was presented in Chapter 3 and 4, including a
detailed discussion about the observed influence of a; on the stress-strain, pore pressure
and strength behavior. A similar series of flexible boundary true triaxial tests were
performed on heavily overconsolidated cubical specimens with the initial hydrostatic
stress state corresponding to OCR=I O. For all the three series of tests (OCR= I , 5, and
1 0), the maximum pre-consolidation stress was the same as p; =275 k.Pa.
1 1 3
Figure 5.6 compares the undrained shear stress-strain behavior observed at
OCR= l O to the observed behavior at NC and OCR=5 initial stress state. The variation in
the shear stress-strain relationship for different b-values was more significant at OCR= I O
than it was observed at OCR=l or 5 . The inherent anisotropy induced in the specimens
during preparation can be used to explain this experimental observation. From the
observed consolidation behavior of clay, it was determined that the elastic deformation
had more significant influence from the inherent anisotropy than the plastic deformation.
Based on this observation, one can also say that a part of the inherent anisotropy remains
in the memory of soil during loading-unloading but the significance of its influence
depends on the applied effective confining stress. Under this assumption, the increasing
mean effective stress would reduce the influence of inherent anisotropy, and
consequently reduce the variation in the stress-strain behavior for a change in the b-value.
For a large reduction in the mean effective stress (such as in the case of heavily
overconsolidated clay), a part of anisotropy of the specimen may recover and influence
the stress-strain behavior.
The specimens sheared with higher b-values failed at lower shear strain values
and the shear strain to failure decreased with the increasing overconsolidation. In the
previous section, the triaxial compression tests were shown to have somewhat brittle
failure behavior. With the increasing b-value, this brittleness in the failure behavior
increased dramatically. For b � 0.5, the shear stiffuess just before the failure was
significantly higher than zero. As a result, there would be a remarkable difference
between the shear stress values at the reference surface (bounding the ultimate yield
surface for zero shear stiffness) defined in the previous section, and the failure surface.
1 14
Based on the experimental observations, the reference surface may be defined to have the
same shape as the failure surface along the hydrostatic stress line; however, in the
deviatoric plane these surfaces would have significantly different shapes.
Shear Strength of Clay
Over the last few decades, researchers have investigated various clays to establish
a relationship that can define the shear failure in terms of the three-dimensional stress
state and void ratio. Hvorslev ( 1 937) showed that "the peak shear stress at failure r1 of
clay is a function of the effective normal stress a� on, and the void ratio e1 in, the plane
of failure at the moment of failure and this function is independent of the stress history".
Roscoe et al. ( 1 958) extended Hvorslev's theory and derived a relationship for failure
surface in e-q- p' space using the critical state void ratio concept. This relationship
showed that the critical state was reached by the clay at a constant shear stress ratio, M
( = q 1 j p� ), which may be different from the peak shear stress ratio or the shear stress
ratio at the peak shear stress level. Egan ( 1 977) explained the relative positions of the
"peak" and "critical" states of failure for soils. It is difficult to say if the specimens tested
for the experimental data used in critical state concept had any localization before
reaching the critical state void ratio. Mayne ( 1979) summarized the results from 60
different clays reported throughout the geotechnical literature and confirmed the finding
of Ladd and Foott ( 1974) that the normalized strengths (S, ja'w, ) are a function of OCR.
They defined the failure as the undrained strength at maximum deviator stress, and
critical state strengths were not reported. This definition of failure is consistent with the
1 1 5
definition used in current research after considering the localization issues discussed
earlier.
Mayne and Swanson ( 1 98 1 ) compiled the data from 90 different clay and silt
soils and showed that the undrained shear strength for overconsolidated clays, normalized
with overburden pressure, Su /a� could be expressed relative to the S" /a� for the
normally consolidated clay using a simple relationship:
(5. 1 )
where the parameter A0 is a soil constant, which is determined from hydrostatically
consolidated or anisotropically consolidated shear tests or both, and the subscripts OC
and NC denote "overconsolidated" and "normally consolidated" respectively. The
normalized undrained strengths obtained from the compression tests (b=O) conducted at
various OCR values in the current study were used to evaluate this relationship (equation
5. 1) . Figure 5.7 shows that the strength data follows this relationship, and provides a
constant value of A0 = 0.90. Based on the Cam-Clay theory (Schofield and Wroth 1 968),
A0 was referred to the critical state pore pressure ratio and was defined by
(5.2)
where Cc and C5 were defined as the slopes of normal compression line (NCL) and
unloading-reloading line (URL) in (log p' -v) compression plane. The discrepancy in Ao
values obtained experimentally from equation 5. 1 , and theoretically from equation 5.2
was explained to be due to the assumption of a constant K value for a nonlinear unload
reload line in compression plane. To overcome this issue Mayne and Swanson
1 1 6
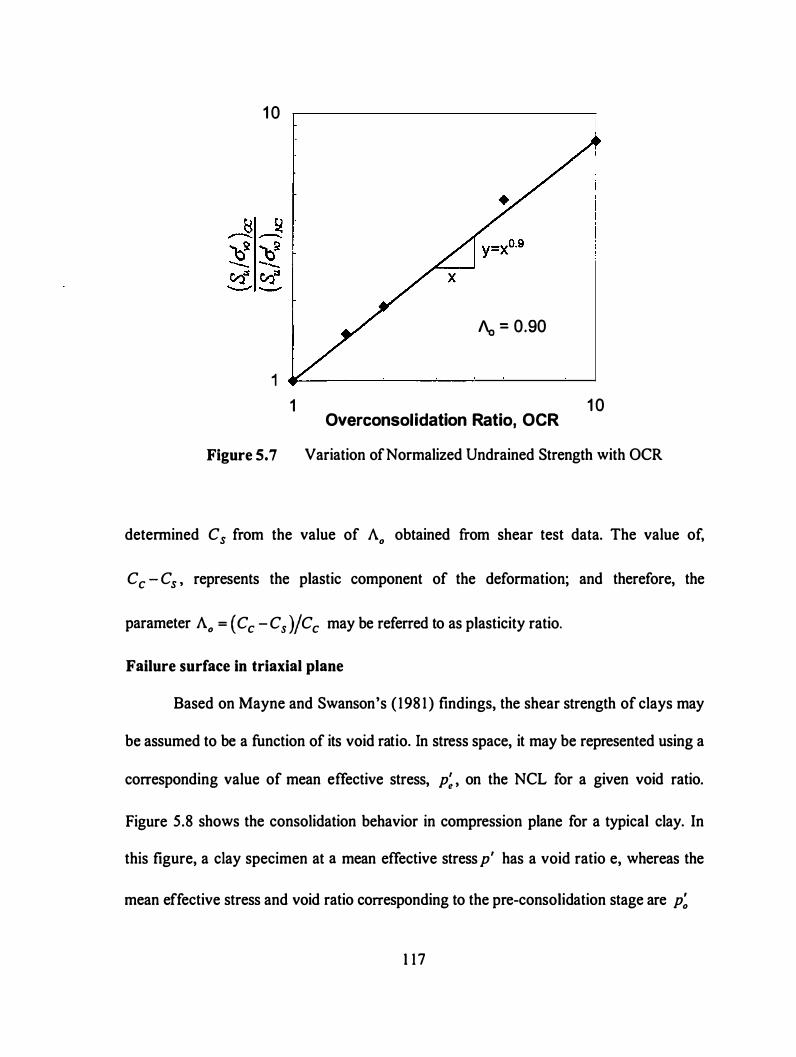
1 0
Aa = 0.90
1
1 1 0 Overconsolidation Ratio, OCR
Figure 5.7 Variation ofNormalized Undrained Strength with OCR
determined Cs from the value of Ao obtained from shear test data. The value of,
Cc - Cs , represents the plastic component of the deformation; and therefore, the
parameter A0 = ( Cc - Cs )fCc may be referred to as plasticity ratio.
Failure surface in triaxial plane
Based on Mayne and Swanson's ( 198 1 ) findings, the shear strength of clays may
be assumed to be a function of its void ratio. In stress space, it may be represented using a
corresponding value of mean effective stress, p; , on the NCL for a given void ratio.
Figure 5.8 shows the consolidation behavior in compression plane for a typical clay. In
this figure, a clay specimen at a mean effective stress p' has a void ratio e, whereas the
mean effective stress and void ratio corresponding to the pre-consolidation stage are p;
1 1 7
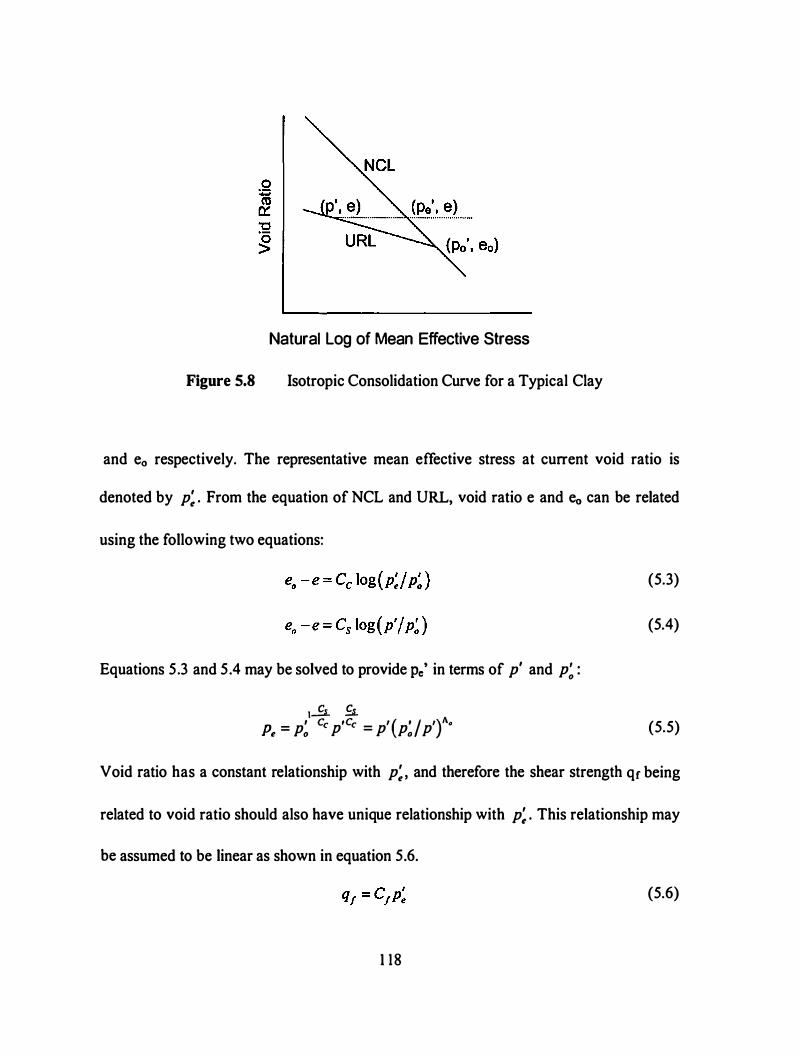
Natural Log of Mean Effective Stress
Figure 5.8 Isotropic Consolidation Curve for a Typical Clay
and eo respectively. The representative mean effective stress at current void ratio is
denoted by p; . From the equation of NCL and URL, void ratio e and e0 can be related
using the following two equations:
Equations 5 .3 and 5 .4 may be solved to provide Pe, in terms of p' and p: : I..£L �
Pe = p: Cc p'Cc = p'(p:J p')"'•
(5.3)
(5.4)
(5.5)
Void ratio has a constant relationship with p; , and therefore the shear strength qr being
related to void ratio should also have unique relationship with p; . This relationship may
be assumed to be linear as shown in equation 5.6.
(5.6)
1 18
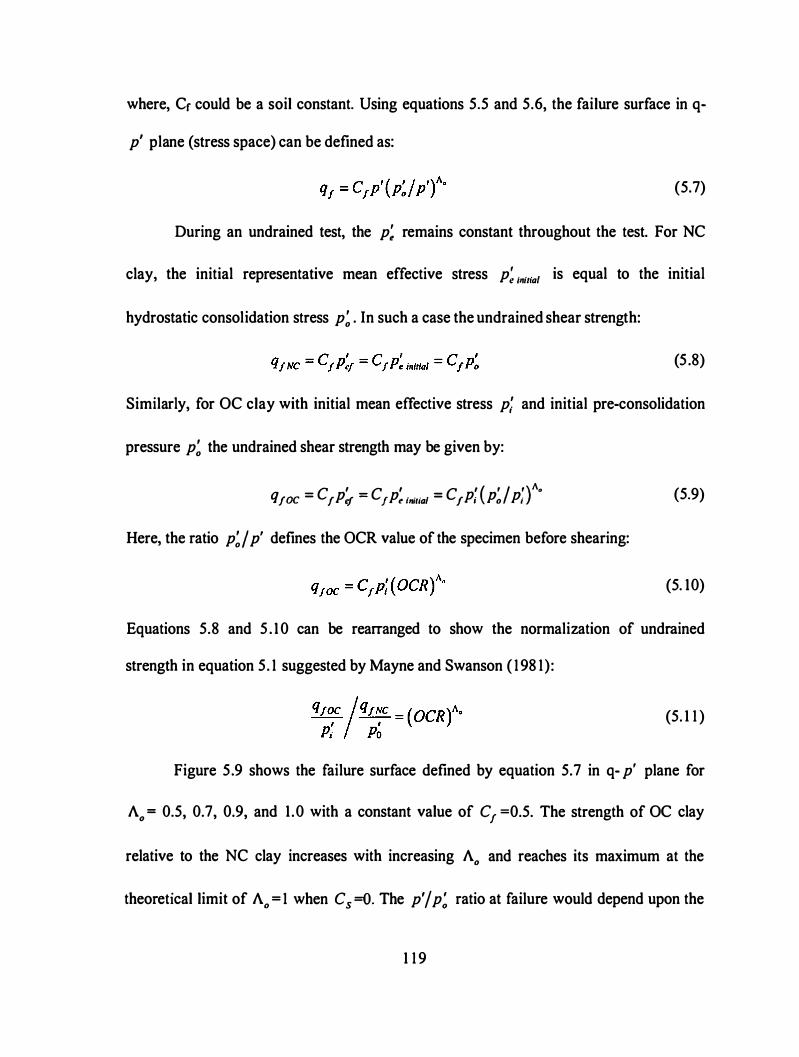
where, Cr could be a soil constant. Using equations 5.5 and 5.6, the failure surface in q-
p1 plane (stress space) can be defined as:
(5.7)
During an undrained test, the p; remains constant throughout the test. For NC
clay, the initial representative mean effective stress p; Initial is equal to the initial
hydrostatic consolidation stress p; . In such a case the undrained shear strength:
(5 .8)
Similarly, for OC clay with initial mean effective stress p; and initial pre-consolidation
pressure p; the undrained shear strength may be given by:
c I c I c I ( , I ' )"· qfoc = rPeJ = fPdnitiat = /pi Po Pt
Here, the ratio p;j p1 defines the OCR value of the specimen before shearing:
(5.9)
(5. 10)
Equations 5.8 and 5 . 1 0 can be rearranged to show the normalization of undrained
strength in equation 5 . 1 suggested by Mayne and Swanson ( 1 98 1) :
(5. 1 1 )
Figure 5 .9 shows the failure surface defined by equation 5.7 in q- p' plane for
A0 = 0.5, 0.7, 0.9, and 1 .0 with a constant value of C1 =0.5. The strength of OC clay
relative to the NC clay increases with increasing Ao and reaches its maximum at the
theoretical limit of Ao = 1 when C5 =0. The p'f p; ratio at failure would depend upon the
1 1 9

0 Q. '"":. CT
0.6 1\ = 1 .0 1\ = 0.9 1------'"---�--r-----==-.-...-+ --
_,_ ......... ----
rA 0.4 �#��
.
-----_..,..
en � ... "' CD .c
VJ
I
e o.2 ..2 ·; u.
c, = o.s
0 �----�------�------�------L-----�
0.0 0.2 0.4 0.6 0.8 1 .0
Mean Effective Stress, p'/p0'
Figure 5.9 Failure Surface in Nonnalized q-p' Plane
dilative behavior of clay. The size of the defined failure surface increases with the pre-
consolidation stress p: ; therefore, it may be referred to as a dynamic failure surface. In
the Modified Cam-Clay (MCC) model, soil was assumed to reach critical state at the
mean stress ratio p'f p; = 2. The stress state attained at the critical state, during an
undrained shear test on nonnally consolidated (NC) clay, did also correspond to the peak
shear stress state and the state of peak shear stress ratio. The peak shear stress ratio at
critical state was defined by a soil parameter M. To incorporate the current failure surface
(equation 5.7) into the MCC constitutive framework, the parameter M can be related to
parameter Cr based on the p'f p; ratio at failure, as shown in equation 5 . 1 2.
(5. 1 2)
1 20
The dilative behavior at failure of clay may differ from a constant relationship of
(p'f p; ) 1 =2 assumed in the MCC model. The current failure surface provides the
freedom of p' J p; ratio being a soil property and that facilitates better prediction of pore
pressure or volumetric strains at failure during shearing of clays.
Failure surface in deviatoric plane
In the previous section, the failure surface was defined in the triaxial compression
plane, which described the influence of overconsolidation and the variation of pre
consolidation stress along the hydrostatic stress axis. In order to complete the description
of failure surface in three-dimensional stress space, the strength of clay would now be
considered in deviatoric plane (around the hydrostatic axis). For isotropic material, the
shear strength may be assumed constant in a deviatoric plane and the failure surface
would assume a circular shape in this plane similar to the extended von-Mises failure
surface. However, soils are known to be cross-anisotropic about their axis of deposition
due to the preferred orientation of deposited soil particles and the unidirectional (vertical)
loading during and after the deposition. In the presence of this anisotropy, the strength of
soil may be described as a function of the relative magnitudes of the principal stresses
and their orientation about the direction of deposition.
Lade ( 1 990) used the third invariant of the stress tensor (13) to describe the
strength behavior of soil and showed the consistency of this assumption over a range of
the types of soil. In chapter 3 and 4, the author presented the undrained strength data
obtained from true triaxial tests on the specimens with initial stress state corresponding to
OCR= I and 5. They showed that the kaolin clay used in the current research follows the
1 2 1
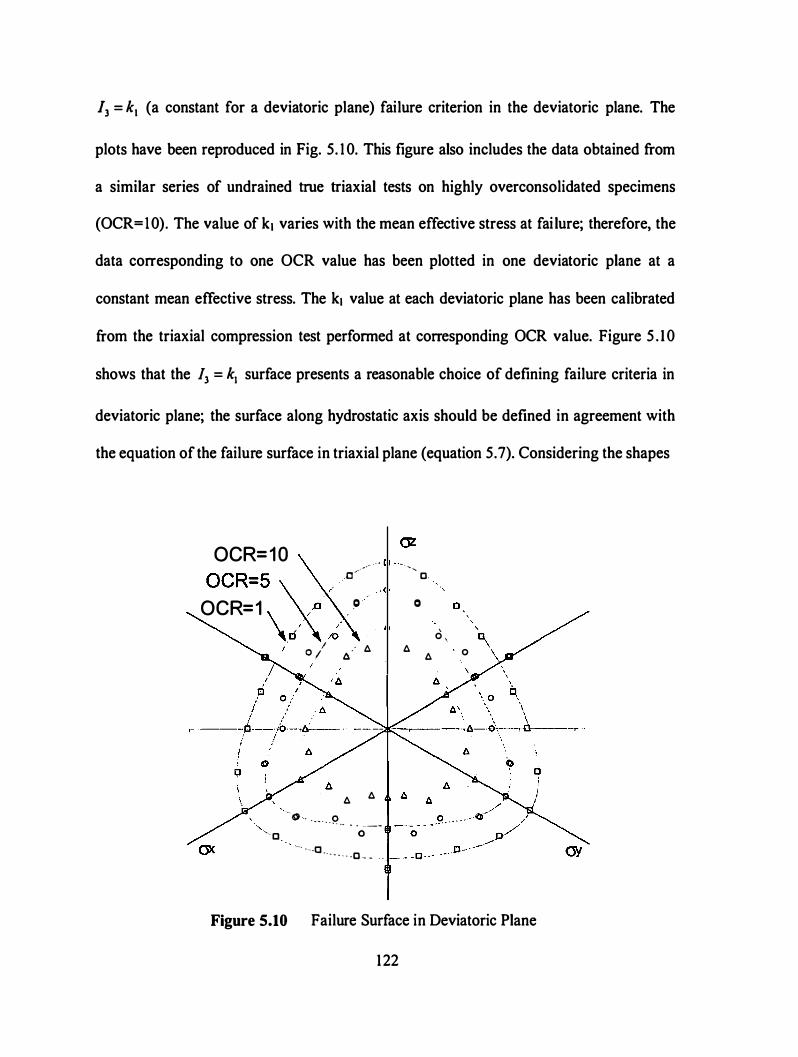
/3 = k1 (a constant for a deviatoric plane) failure criterion in the deviatoric plane. The
plots have been reproduced in Fig. 5. 1 0. This figure also includes the data obtained from
a similar series of undrained true triaxial tests on highly overconsolidated specimens
(OCR=lO). The value of k1 varies with the mean effective stress at failure; therefore, the
data corresponding to one OCR value has been plotted in one deviatoric plane at a
constant mean effective stress. The k1 value at each deviatoric plane has been calibrated
from the triaxial compression test performed at corresponding OCR value. Figure 5 . 1 0
shows that the /3 = k1 surface presents a reasonable choice of defining failure criteria in
deviatoric plane; the surface along hydrostatic axis should be defined in agreement with
the equation of the failure surface in triaxial plane (equation 5.7). Considering the shapes
OCR=10 OCR=5 . o/
OCR=1 <X�. ·· .o · .
."
, I O .f t:J. . · A
A A · ·o .. - - - - - .9 .. - - ---'· o o -- ·---o . _ _ _ _ _ _ _ c _ _
', c. ·-
0 0
' 0 \
A 0 A
Figure 5.10 Failure Surface in Deviatoric Plane
122
in triaxial compression and deviatoric plane a failure surface in three-dimensional (30)
stress space can be defined as
(5. 1 3)
where,
(5. 14)
Here, q1 j p' was a function of mean effective stress in equation 5 .7; therefore, it would
be a constant for a deviatoric plane. Note that the parameter C 1 should only be calibrated
using triaxial compression tests in order to avoid the complexities of involving equation
5. 1 4 along with equation 5 .7 during its determination. The failure surface defined by
equation 5. 14 may be constrained to the positive quadrant of the 3D stress space where
all principal stresses are compressive. This would correspond to the widely accepted
assumption of no cohesion in frictional materials such as clay. In this case the k -value
may be restricted to range from 0 � k � 27 .
Conclusions
In this chapter, the influence of overconsolidation and the relative magnitudes of
principal stresses on the true triaxial behavior of kaolin clay was evaluated using the data
obtained from a series of flexible boundary undrained tests on remolded cubical
specimens. To study the influence of inherent anisotropy on the consolidation behavior of
clay, the constant rate of strain Ko consolidation tests were performed by applying the
axial stress along (vertical) and perpendicular (horizontal) to the axis of cross-anisotropy
123
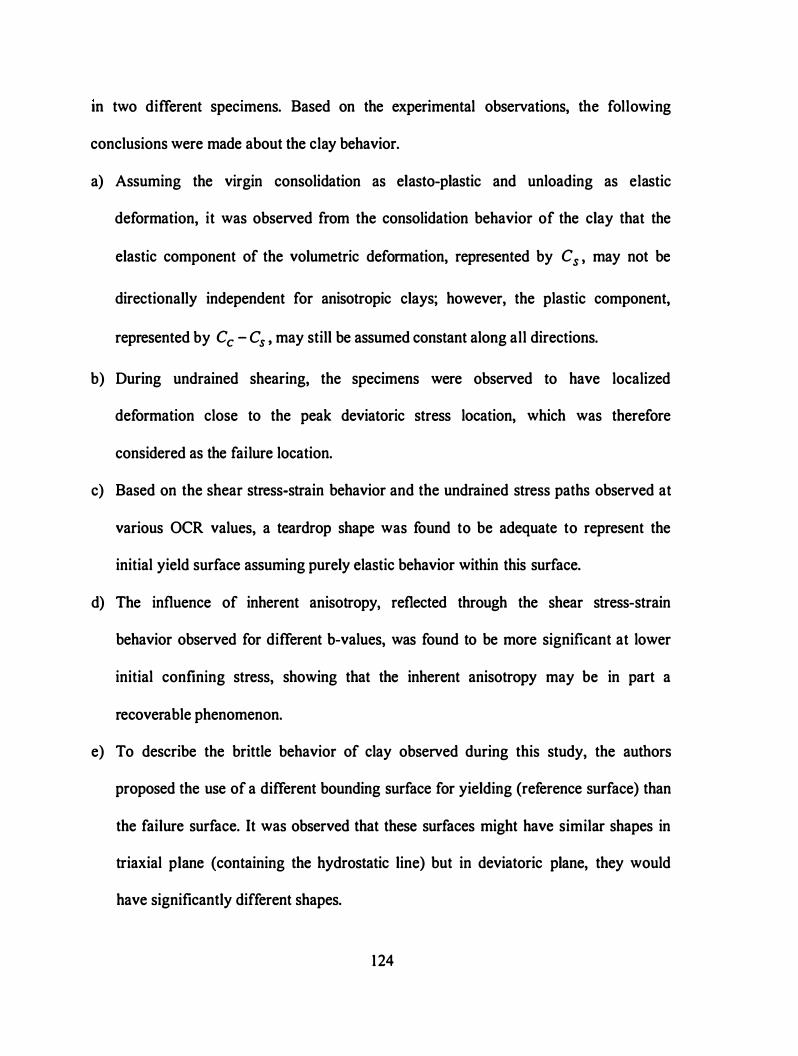
m two different spec1mens. Based on the experimental observations, the following
conclusions were made about the clay behavior.
a) Assuming the virgin consolidation as elasto-plastic and unloading as elastic
deformation, it was observed from the consolidation behavior of the clay that the
elastic component of the volumetric deformation, represented by Cs , may not be
directionally independent for anisotropic clays; however, the plastic component,
represented by Cc - Cs , may still be assumed constant along all directions.
b) During undrained shearing, the specimens were observed to have localized
deformation close to the peak deviatoric stress location, which was therefore
considered as the failure location.
c) Based on the shear stress-strain behavior and the undrained stress paths observed at
various OCR values, a teardrop shape was found to be adequate to represent the
initial yield surface assuming purely elastic behavior within this surface.
d) The influence of inherent anisotropy, reflected through the shear stress-strain
behavior observed for different b-values, was found to be more significant at lower
initial confining stress, showing that the inherent anisotropy may be in part a
recoverable phenomenon.
e) To describe the brittle behavior of clay observed during this study, the authors
proposed the use of a different bounding surface for yielding (reference surface) than
the failure surface. It was observed that these surfaces might have similar shapes in
triaxial plane (containing the hydrostatic line) but in deviatoric plane, they would
have significantly different shapes.
124
f) Extending the concept of normalization of the undrained strength of clays proposed
by Ladd and Foott ( 1 974), the authors have formulated a dynamic failure surface for
clays as a function of the pre-consolidation mean effective stress. It was observed
from the tests performed at each OCR value that the failure surface in the deviatoric
plane could be defined using constant third invariant of stress tensor, and it was
incorporated in the formulation of the proposed failure surface to complete its
description in 3D stress space.
125

Chapter 6. Effect of Micro fabric on the Three-Dimensional
Behavior of Kaolin Clay
This chapter is a slightly revised version of a paper with the same title submitted
to the Journal of Geotechnical and Geoenvironmental Engineering of ASCE in 2004 by
Amit Prashant and Dayakar Penumadu:
Prashant, A., and Penumadu, D. "Effect of Microfabric on Mechanical Behavior
of Kaolin clay using Cubical True Triaxial Testing." In review , Journal of Geotechnical
and Geoenvironmental Engineering, ASCE.
My primary contribution to this paper include: ( 1 ) selection of the topic and
development of the problem to study the effect of microfabric on three-dimensional
behavior of cohesive soils, (2) gathering and interpretation of published literature, (3)
performing all the laboratory experiments, (4) interpretation and analysis of test results,
and (5) part of the writing related to manuscript preparation.
Abstract
Various aspects of the mechanical behavior of Kaolin clay are discussed in light
of experimental observations from a series of strain controlled true-triaxial undrained
tests, performed on cubical Kaolin clay specimens with flocculated and dispersed
microfabric, using a fully automated flexible boundary experimental setup with real-time
feedback control system. The laboratory procedures used to prepare flocculated and
dispersed microfabric specimens are presented. The influence of microfabric on the
consolidation behavior of Kaolin clay is evaluated based on the data obtained from Ko
consolidation during constant rate of strain tests and the isotropic consolidation during
126
true triaxial tests. Undrained tests on Kaolin clay show that the following vary with
microfabric of specimen: the shear stiffness, excess pore pressure generated during shear,
brittleness, and strength and strain to failure. For both microfabrics, the observed strength
behavior using cubical triaxial testing shows a similar pattern of variation with applied
stress anisotropy; hence, only a marginal influence of fabric-induced anisotropy.
Keywords: Consolidation, Failure surface, Microstructure, Shear deformation, Soil
dispersion, Soil structure, Three-dimensional analysis, Undrained shear tests.
Introduction
The structure of soil is composed of fabric and interparticle force system that is
governed by soil composition, history, present state, and environment. The influence of
soil structure on the engineering behavior has been recognized from the early stages of
soil mechanics, and many authors (e.g. Mitchell ( 1956), Lambe 1958a; Seed and Chan
1 959; Mitchell 1 964; Olson and Mesri 1 970) have attempted to explain various aspects of
the engineering properties of clays on the basis of its structure. The geometric
arrangement of particles, particle groups, and pore spaces is usually defined as the
"microfabric" of clays (Mitchell 1 993); the existing interparticle force system is referred
to as the "stability" of fabric; and, the term "structure" is used to define the combined
effect of clay microfabric and its stability (Soga 1994). Various studies have been
performed using structured and destructured specimens of natural clays, and the
quantifying methods have been established to relate the fabric stability of clays to its
engineering behavior (e.g. Houston and Mitchell, 1968; Burland, 1 990). The concept of
fabric has been used to explain the anisotropy, and its influence on the observed
mechanical behavior of natural clays (e.g. Kirkgard and Lade, 1 993). Also, the changes in
127
microfabric associated with shear planes and zones have been examined by the
researchers (e.g. Morgenstern and Tchalenko, 1 967; McKyes and Yang, 1 97 1 ). However,
the effect of deferent types of micro fabric on the mechanical behavior (consolidation,
anisotropy, shear stiffness, strength, etc.) of clay is relatively less understood, and that is
the motivation of the current study.
There has been a proliferation of terms for the description of micro fabric. Barden
and Sides ( 197 1 ) reviewed and clarified many of the terms used in previous literature.
They described the general terms of microfabric such as "flocculated,.-which described
any soil that has an open-ended structure with edge-to-face contacts or random
orientation of the platelets -and "dispersed'' -which described a soil with a closed
structure that consists of many face-to-face contact or preferred orientation of platelets.
These two terms essentially define two extremes of the microfabric that can exist in
nature. A method of quantifying intermediate microfabrics (maybe as a degree of
dispersion) has not been established which can be used to directly relate the microfabric
to its mechanical properties. Promising efforts have been made in this direction using the
two extreme microfabrics as references (Penumadu, 1 996). Since natural clays of the
same mineral composition but different microfabric are difficult to find, it is preferred to
prepare the specimens for research in the laboratory. The flocculated and dispersed
specimens of Kaolin clay are prepared in this study using the recent techniques suggested
by Saga ( 1994), and Hazen and Penumadu ( 1999). A brief review of the efforts made in
the past to obtain flocculated and dispersed microfabric of Kaolin, and a possible
mechanism of fabric formation in aqueous medium, are presented in this chapter. The
influence of micro fabric on the compressibility behavior of Kaolin clay is evaluated using
1 28
the data obtained from constant rate of strain Ko consolidation tests (ASTM: D41 86-89,
1 998) that were performed on both the flocculated and dispersed micro fabric specimens
It has been recognized that the arrangement of particles or particle groups plays a
significant role in the inherent anisotropy of the soil deposits. This results in the observed
variation of shear behavior with the change in magnitude and orientation of principal
stresses. Various studies (e.g. Broms and Casbarian, 1 965; Lade and Musante, 1 978)
have been performed to investigate the effect of change in magnitude and orientation of
principal stresses on the observed shear behavior of natural and remolded clays.
However, different researchers have not collaborated to determine the effect of clay
microfabric on the observed three-dimensional shear behavior. As an objective of the
current research, the influence of microfabric on the three-dimensional mechanical
behavior Kaolin clay was investigated using the previously described true triaxial device.
During undrained shear, the strain rate of 0.05%/min for flocculated, and 0.008%/min for
dispersed specimens along cr1 -axis was found suitable to ensure pore pressure equilibrium
within the specimens. During shearing, the normal stress and strain were recorded in the
three principal directions.
The results obtained from a series of constant b-value true-triaxial undrained tests
(at overconsolidation ratio, OCR=l , and OCR=5) on the flocculated microfabric
specimens of Kaolin clay were presented in chapters 3 and 4, and the experimental
observations were discussed in terms of the influence of intermediate principal stress, and
the inherent and stress induced anisotropy of the specimens. The b-value,
b = ( u2 - 0"3 )/( 0"1 - 0"3 ) , was defined as the relative magnitude of intermediate principal
129
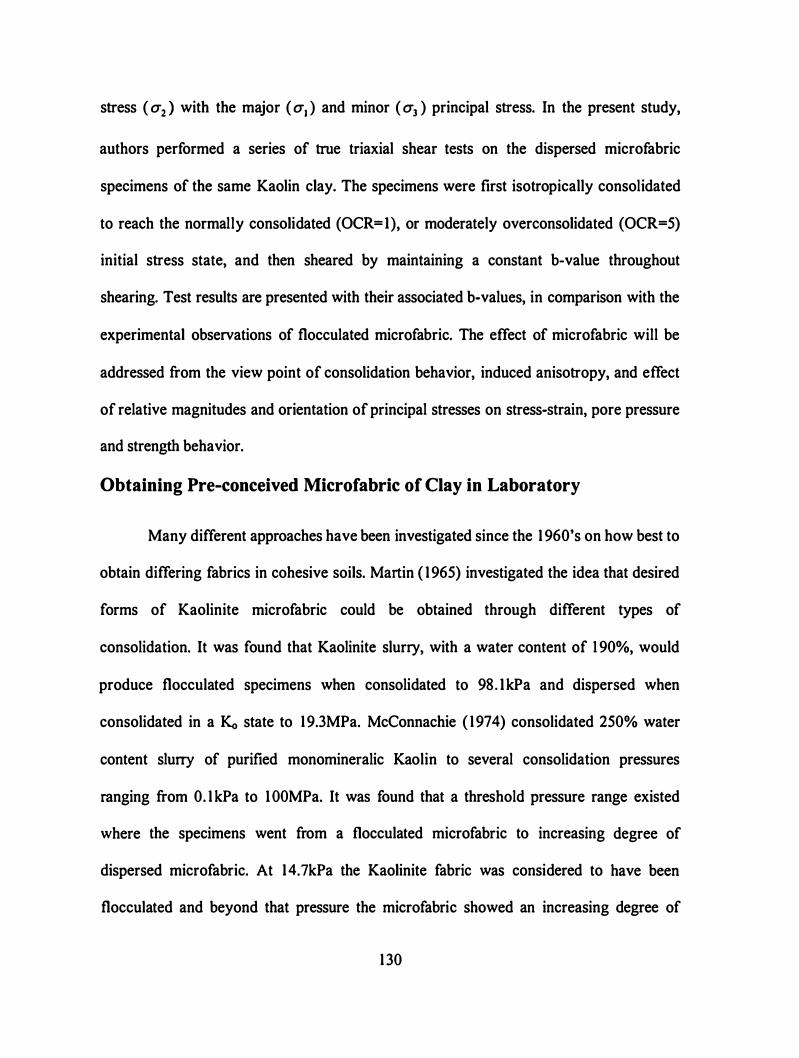
stress ( u 2 ) with the major ( u1 ) and minor ( u3 ) principal stress. In the present study,
authors performed a series of true triaxial shear tests on the dispersed microfabric
specimens of the same Kaolin clay. The specimens were first isotropically consolidated
to reach the normally consolidated (OCR=l), or moderately overconsolidated (OCR=5)
initial stress state, and then sheared by maintaining a constant b-value throughout
shearing. Test results are presented with their associated b-values, in comparison with the
experimental observations of flocculated microfabric. The effect of microfabric will be
addressed from the view point of consolidation behavior, induced anisotropy, and effect
of relative magnitudes and orientation of principal stresses on stress-strain, pore pressure
and strength behavior.
Obtaining Pre-conceived Microfabric of Clay in Laboratory
Many different approaches have been investigated since the 1 960's on how best to
obtain differing fabrics in cohesive soils. Martin ( 1 965) investigated the idea that desired
forms of Kaolinite microfabric could be obtained through different types of
consolidation. It was found that Kaolinite slurry, with a water content of 1 90%, would
produce flocculated specimens when consolidated to 98. lkPa and dispersed when
consolidated in a Ko state to 1 9.3MPa. McConnachie ( 1 974) consolidated 250% water
content slurry of purified monomineralic Kaolin to several consolidation pressures
ranging from 0. 1 kPa to 1 OOMPa. It was found that a threshold pressure range existed
where the specimens went from a flocculated microfabric to increasing degree of
dispersed microfabric. At 14.7kPa the Kaolinite fabric was considered to have been
flocculated and beyond that pressure the microfabric showed an increasing degree of
1 30
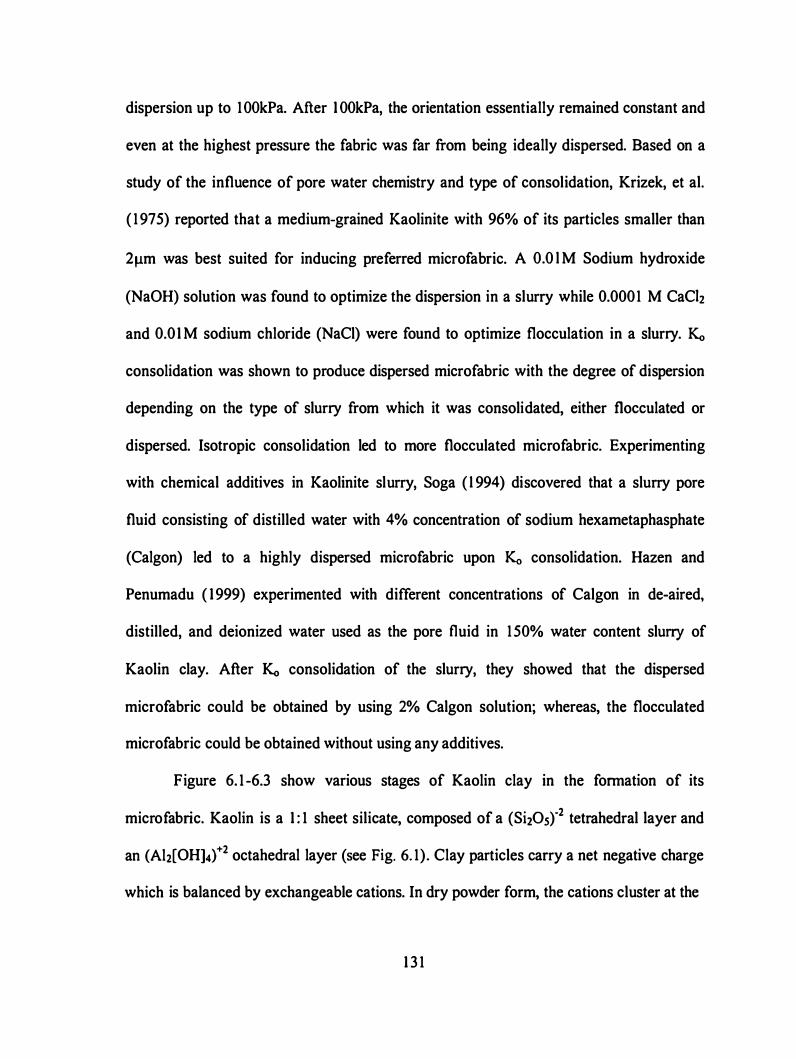
dispersion up to 1 OOkPa. After 1 OOkPa, the orientation essentially remained constant and
even at the highest pressure the fabric was far from being ideally dispersed. Based on a
study of the influence of pore water chemistry and type of consolidation, Krizek, et al.
( 1 975) reported that a medium-grained Kaolinite with 96% of its particles smaller than
21J.m was best suited for inducing preferred microfabric. A O.O l M Sodium hydroxide
(NaOH) solution was found to optimize the dispersion in a slurry while 0.0001 M CaCh
and 0.01 M sodium chloride (NaCl) were found to optimize flocculation in a slurry. Ko
consolidation was shown to produce dispersed micro fabric with the degree of dispersion
depending on the type of slurry from which it was consolidated, either flocculated or
dispersed. Isotropic consolidation led to more flocculated microfabric. Experimenting
with chemical additives in Kaolinite slurry, Soga ( 1 994) discovered that a slurry pore
fluid consisting of distilled water with 4% concentration of sodium hexametaphasphate
(Calgon) led to a highly dispersed microfabric upon Ko consolidation. Hazen and
Penumadu ( 1 999) experimented with different concentrations of Calgon in de-aired,
distilled, and deionized water used as the pore fluid in 1 50% water content slurry of
Kaolin clay. After Ko consolidation of the slurry, they showed that the dispersed
microfabric could be obtained by using 2% Calgon solution; whereas, the flocculated
micro fabric could be obtained without using any additives.
Figure 6. 1 -6.3 show various stages of Kaolin clay in the formation of its
micro fabric. Kaolin is a 1 : 1 sheet silicate, composed of a (Sh05)"2 tetrahedral layer and
an (Al2[0H]4t2 octahedral layer (see Fig. 6. 1) . Clay particles carry a net negative charge
which is balanced by exchangeable cations. In dry powder form, the cations cluster at the
1 3 1
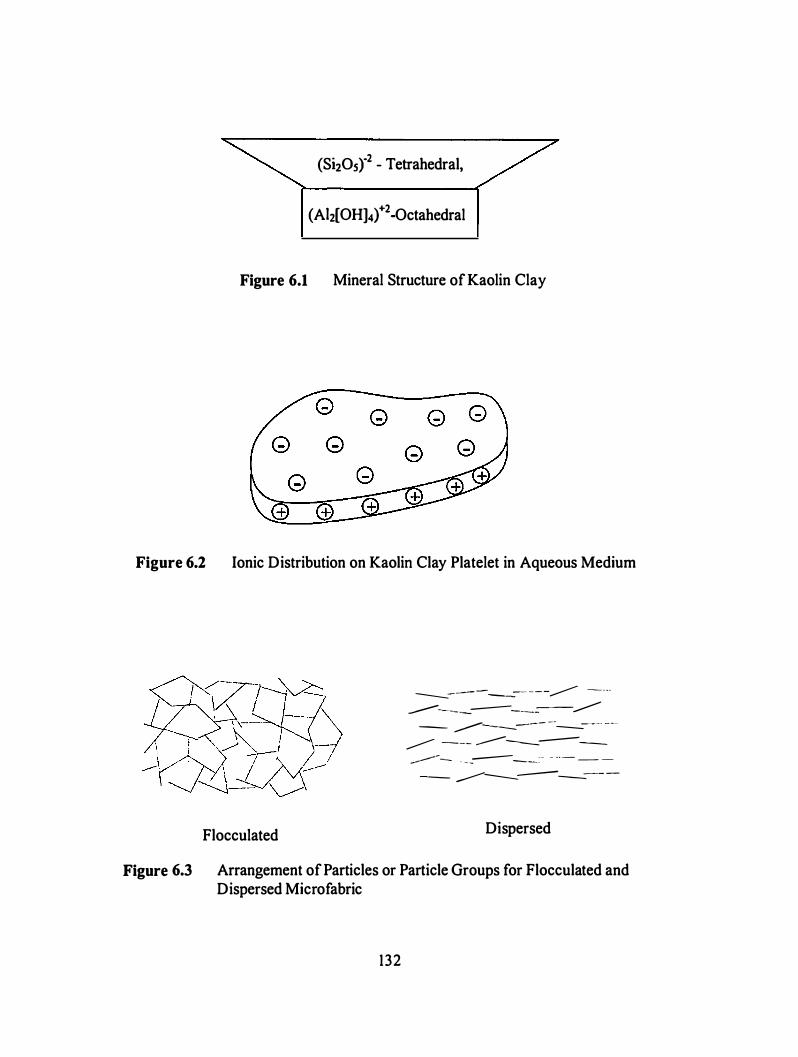
(Sh0s)"2 - Tetrahedral,
(Ah[OH]4t2 -Octahedral
Figure 6.1 Mineral Structure of Kaolin Clay
Figure 6.2 Ionic Distribution on Kaolin Clay Platelet in Aqueous Medium
--- --�- - - -------- -��-
-----�-----.:-----::---------- .--------:------- -�-----· --
------- --- ---------:---�
------- . _:-----:- - ··- - --- .-----.:-�- -
Flocculated Dispersed
Figure 6.3 Arrangement of Particles or Particle Groups for Flocculated and Dispersed Microfabric
132
clay surfaces and cause zero effective charge on the clay particles or particle groups
(Lambe 1 958a). As shown in Fig. 6.2, the nature of Kaolin in an aqueous medium (mixed
in distilled and deionized water) changes; the faces of the particles (or platelets) get
negatively charged, whereas the edges get positively charged (Carty 1999). Under this
arrangement, edges ( +ve) of a platelet get attracted to the faces ( -ve) of another platelet;
whereas, the faces of the two platelets try to repel each other as far as possible. As a
result, these platelets form a flocculated microfabric of Kaolin clay. Additions of
dispersants (Calgon) may change the ionic arrangement significantly. Carty ( 1999)
showed that the dispersants, which are added to the pore fluid, get adsorbed by the
positively charged particle edges only, when the edge thickness is significant enough.
Consequently, when a desired amount of dispersant is dissolved in distilled and deionized
water to make the slurry of Kaolin clay, the ionic distribution leaves the clay platelets
with negatively charged faces only. Since the faces of all the particles are negatively
charged, they try to repel each other and give the minimum free energy in parallelism.
Under external loading condition (gravitational load or axial load during consolidation),
they stack up on each other in the direction of loading due to the flaky shape of the
particles, and form a dispersed microfabric of the clay. A typical arrangement of clay
particles, normal to the loading direction, for flocculated and dispersed microfabric, is
shown in Fig. 6.3.
Preparing Cubical Specimens
The batch of Kaolin clay powder used in the current study to make the cubical
specimen was obtained from the same lot of clay used by Hazen and Penumadu ( 1 999),
with a liquid limit of 62%, a plasticity index of 0.32, and a specific gravity of 2.63. To
133

obtain flocculated microfabric, the 1 55% water content slurry was prepared by mixing
Kaolin clay powder with de-aired, distilled, and deionized water; whereas, to obtain
dispersed microfabric, 2% Calgon by weight of the water was mixed in the same slurry.
The slurry was then consolidated under Ko condition using a consolidometer with
1 02x 1 02mm square base. In order to minimize the frictional effects between the
consolidometer and the slurry, the inner walls of the consolidometer were lined with
teflon and were also sprayed with silicon before the transfer of the slurry. Initially, the
slurry was consolidated under Ko conditions at a vertical stress of 30 kPa and allowed to
consolidate for 1 hour; which helped prevent leaks during consolidation at higher
stresses. This was especially a critical issue for the slurry made with dispersant (Calgon),
due to the reduced particle-group size from deflocculation. The vertical stress was then
increased to 207 kPa and consolidated until the completion of primary consolidation. The
specimen was then extruded from the consolidometer; and the axis of uniaxial loading
during Ko slurry consolidation was marked for future reference. Figure 6.4 shows the
digital images of (a) flocculated and (b) dispersed microfabric of the cubical specimens,
taken by Scanning Electron Microscope (SEM) at a magnification of 6000x along the
direction of Ko consolidation.
Mandeville and Penumadu (2004) presented a water content analysis on the
flocculated microfabric cubical specimens, obtained after Ko consolidation of slurry, to
evaluate the uniformity in water content across the specimen. The average water content
was found to be 42%, with an observed range of 40.03% to 42.88%. For the specimens
with dispersed micro fabric, a similar analysis was performed on several specimens, and
1 34
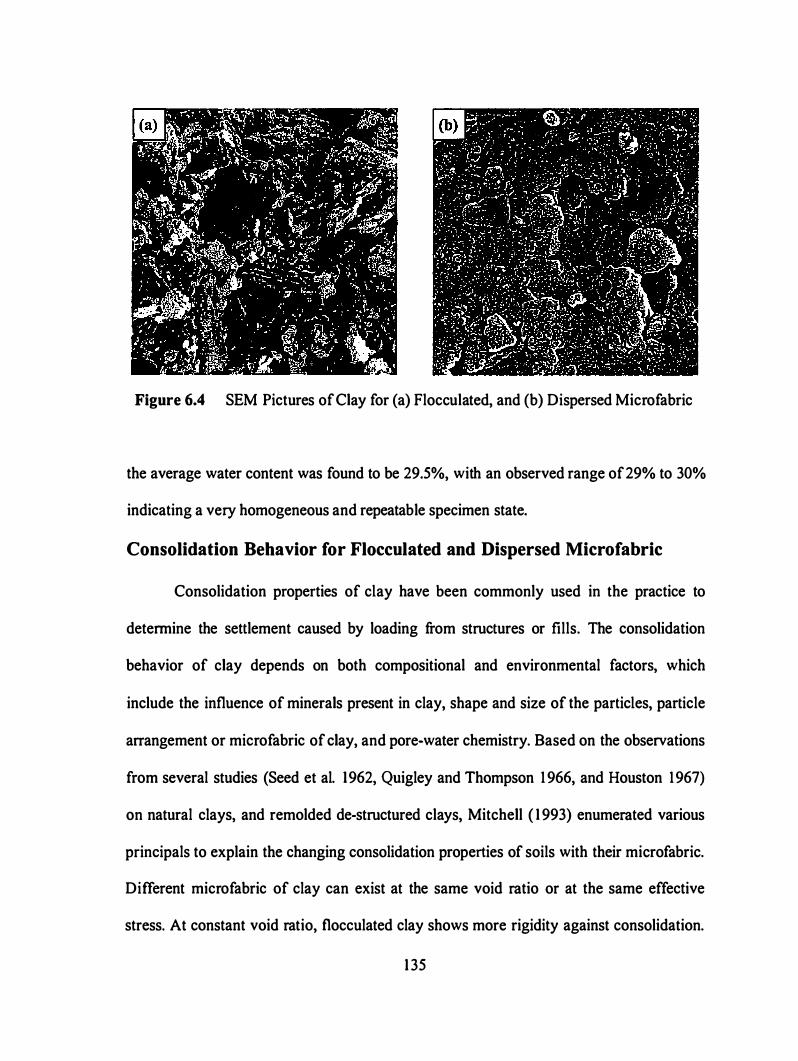
Figure 6.4 SEM Pictures of Clay for (a) Flocculated, and (b) Dispersed Microfabric
the average water content was found to be 29.5%, with an observed range of29% to 30%
indicating a very homogeneous and repeatable specimen state.
Consolidation Behavior for Flocculated and Dispersed Microfabric
Consolidation properties of clay have been commonly used in the practice to
determine the settlement caused by loading from structures or fills. The consolidation
behavior of clay depends on both compositional and environmental factors, which
include the influence of minerals present in clay, shape and size of the particles, particle
arrangement or microfabric of clay, and pore-water chemistry. Based on the observations
from several studies (Seed et al. 1962, Quigley and Thompson 1 966, and Houston 1967)
on natural clays, and remolded de-structured clays, Mitchell ( 1 993) enumerated various
principals to explain the changing consolidation properties of soils with their microfabric.
Different microfabric of clay can exist at the same void ratio or at the same effective
stress. At constant void ratio, flocculated clay shows more rigidity against consolidation.
1 35
During Ko consolidation, the platy particles or particle groups of clay orient themselves
with their long axes along the plane normal to applied axial stress. At constant effective
stress, the change in micro fabric of clay accompanies a change in void ratio, and the clay
with dispersed microfabric, with lower void ratio, shows slower consolidation process.
To evaluate the consolidation behavior of the clay used in the current study,
constant rate of strain Ko consolidation tests [CRS test, ASTM: 041 86-89 ( 1998)] were
performed on both flocculated and dispersed microfabric specimens obtained after the
slurry consolidation. The average initial void ratio of the flocculated and dispersed
specimens was determined to be 1 . 1 8 and 0.78 respectively. Using CRS test cell and load
frame, the flocculated specimens were subjected to an axial stress of I 000 kPa at a strain
rate 0. 1 %/min and then unloaded to 200 kPa at a strain rate of 0.05%/min. For dispersed
specimens, the strain rate of 0. 1 %/min caused much higher pore pressure evolution ( Aub )
at the bottom of the specimen, and pore pressure ratio ( Aubfu� ) exceeded a suggested
maximum value of 0.3 by ASTM. The acceptable strain rate for loading of the dispersed
specimen was found to be 0.0 1 5% per minute and for unloading to be 0.0 1 % per minute.
The void ratio vs. vertical effective stress relationship for the two types of micro fabrics is
shown in Fig. 6.5 using the data points recorded at 2 min interval. Assuming the
relationship between the void ratio and log of the effective consolidation pressure to be
linear, the volumetric deformation behavior is usually defined using two consolidation
parameters, ( 1 ) compression index , Cc , and (2) recompression or swelling index, Cs .
The dispersed specimen showed a much lower value of compression index ( Cc =0. 1 8)
than the flocculated specimen ( Cc =0.38). The swelling index observed for the dispersed
136
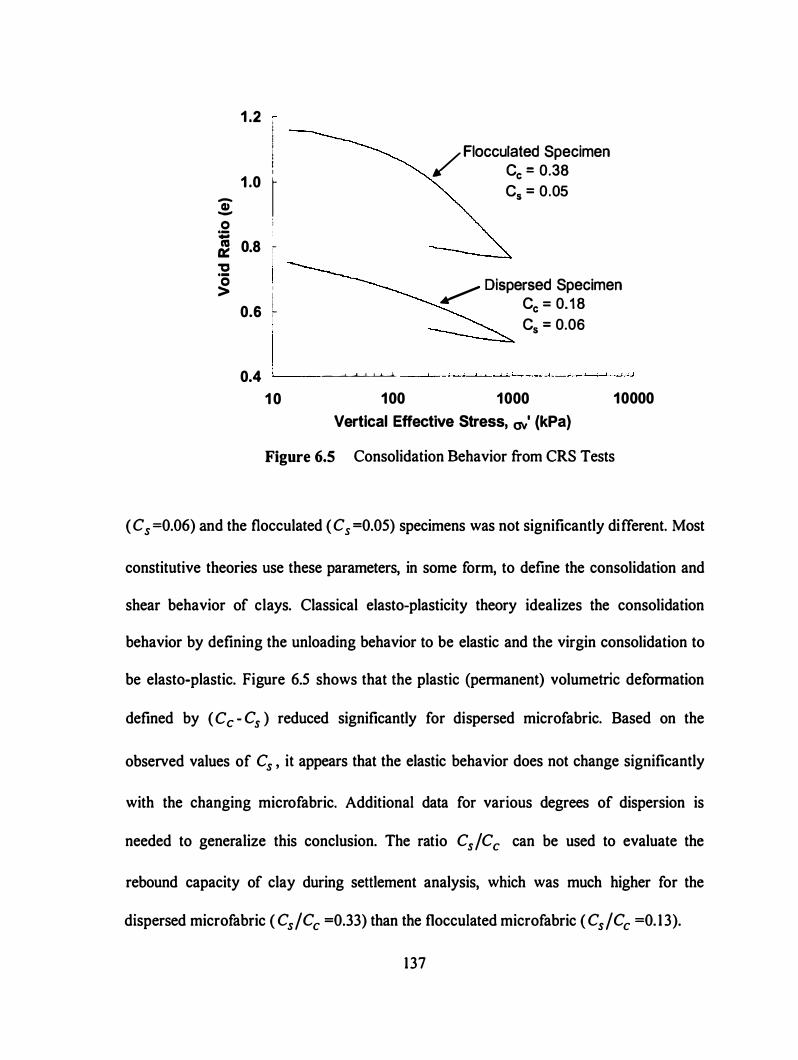
1 .2 .
I I I
:!: 1 .0
1
0 '
� 0.8 -
'C I l 0,6 I
�
L __ 0.4 -�-L'-'---L
1 0 1 00
/ Flocculat:_d Specimen Cc - 0.38 C5 = 0.05
� Dispersed Specimen Cc = 0. 18 C5 = 0.06
1 000 1 0000
Vertical Effective Stress, av' (kPa)
Figure 6.5 Consolidation Behavior from CRS Tests
( Cs =0.06) and the flocculated ( C5 =0.05) specimens was not significantly different. Most
constitutive theories use these parameters, in some form, to define the consolidation and
shear behavior of clays. Classical elasto-plasticity theory idealizes the consolidation
behavior by defining the unloading behavior to be elastic and the virgin consolidation to
be elasto-plastic. Figure 6.5 shows that the plastic (permanent) volumetric deformation
defined by ( Cc - C5 ) reduced significantly for dispersed microfabric. Based on the
observed values of Cs , it appears that the elastic behavior does not change significantly
with the changing microfabric. Additional data for various degrees of dispersion is
needed to generalize this conclusion. The ratio C5/Cc can be used to evaluate the
rebound capacity of clay during settlement analysis, which was much higher for the
dispersed microfabric ( Cs/Cc =0.33) than the flocculated microfabric (C5/Cc =0. 1 3).
137
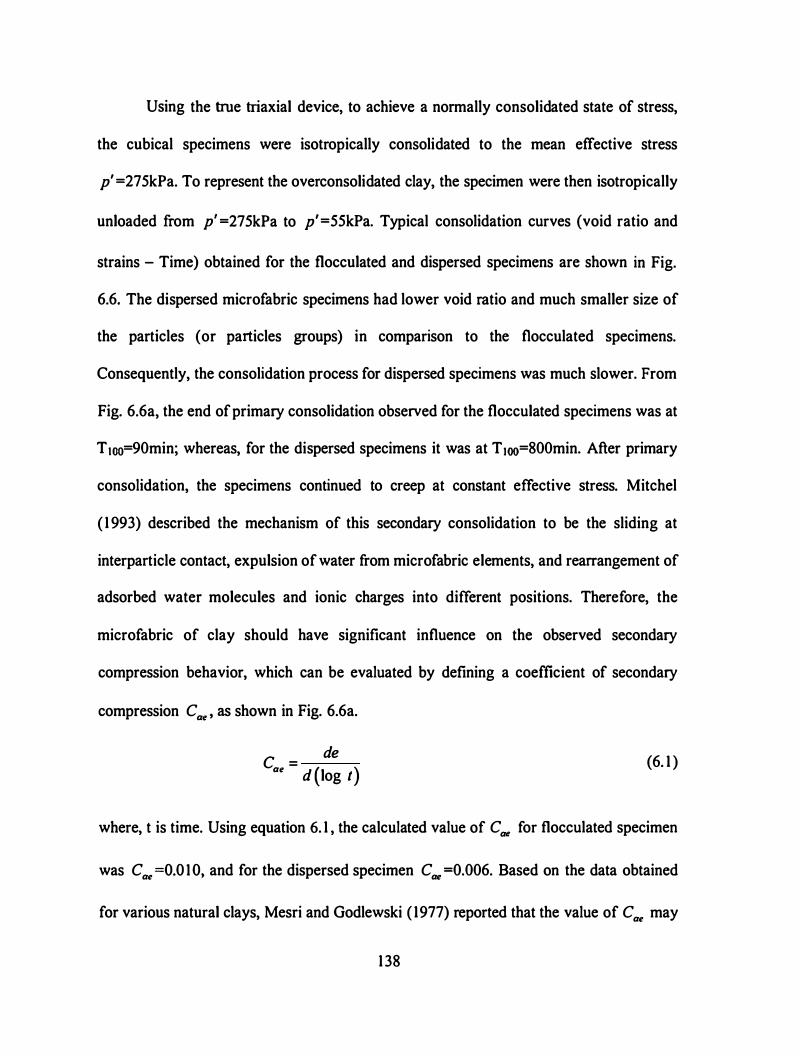
Using the true triaxial device, to achieve a normally consolidated state of stress,
the cubical specimens were isotropically consolidated to the mean effective stress
p' =275kPa. To represent the overconsolidated clay, the specimen were then isotropically
unloaded from p' =275kPa to p' =55kPa. Typical consolidation curves (void ratio and
strains - Time) obtained for the flocculated and dispersed specimens are shown in Fig.
6.6. The dispersed microfabric specimens had lower void ratio and much smaller size of
the particles (or particles groups) in comparison to the flocculated specimens.
Consequently, the consolidation process for dispersed specimens was much slower. From
Fig. 6.6a, the end of primary consolidation observed for the flocculated specimens was at
T too=90min; whereas, for the dispersed specimens it was at T tao=800min. After primary
consolidation, the specimens continued to creep at constant effective stress. Mitchel
( 1 993) described the mechanism of this secondary consolidation to be the sliding at
interparticle contact, expulsion of water from micro fabric elements, and rearrangement of
adsorbed water molecules and ionic charges into different positions. Therefore, the
microfabric of clay should have significant influence on the observed secondary
compression behavior, which can be evaluated by defining a coefficient of secondary
compression Cae , as shown in Fig. 6.6a.
C = de
ae d (log t)
(6. 1 )
where, t is time. Using equation 6. 1 , the calculated value of Cae for flocculated specimen
was Cae=O.O IO, and for the dispersed specimen Cae =0.006. Based on the data obtained
for various natural clays, Mesri and Godlewski ( 1977) reported that the value of Cae may
1 38
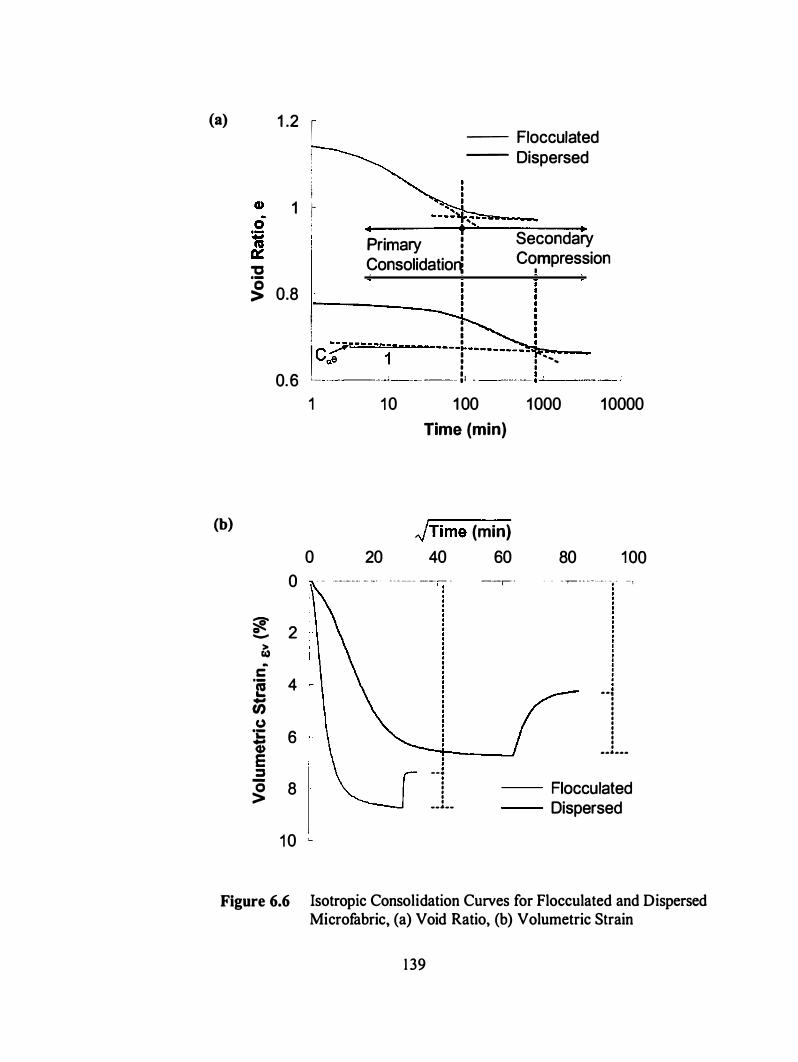
(a)
(b)
:2
1 .2 I i
1 [-
Primary ! Consolidatior1
-- Flocculated -- Dispersed
Secondary Compression
I
� 0.8
0.6
0
'"0' e;::: 2 -� a
c 'i! 4 -tn (,)
·c 6 Q; E ::::J 0 8 >
1 0
' I
I :
I Co.S�':i-r..::'"·=�-=�-'"-"
1•....,•·.....,-- I � - --
·---� ---- - ------� ��--: I - ....
I I L_ ' ·-- :1 - :.-· ----1 1 0 1 00
Time (min)
1 000 1 0000
0
I I
I
. .
: ,_
- - 20 -------· - --
,)Time (min)
40
- ----- --.-- +
- - · I I • . • •
--�--
60 --,-·
80 1 00 - - - � - - --------- -. - -,
. .. • I • • I • • • • • I
..•...
Flocculated Dispersed
Figure 6.6 Isotropic Consolidation Curves for Flocculated and Dispersed Microfabric, (a) Void Ratio, (b) Volumetric Strain
1 39
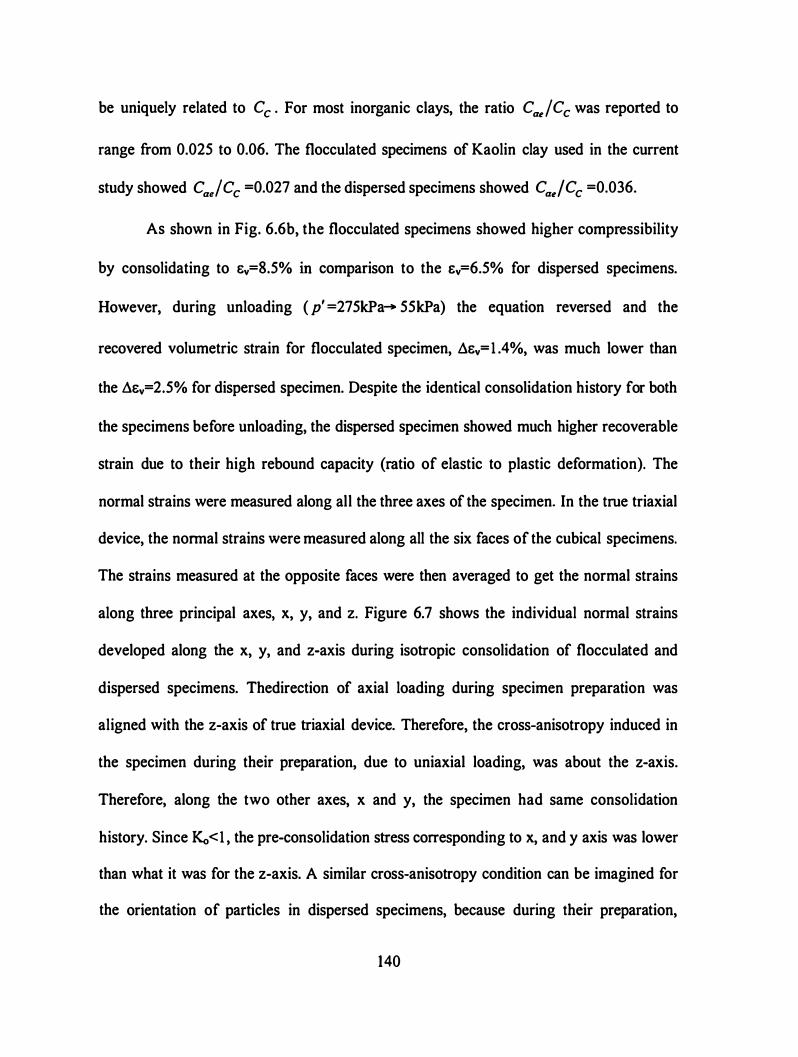
be uniquely related to Cc . For most inorganic clays, the ratio CaefCc was reported to
range from 0.025 to 0.06. The flocculated specimens of Kaolin clay used in the current
study showed CaefCc =0.027 and the dispersed specimens showed Cae/Cc =0.036.
As shown in Fig. 6.6b, the flocculated specimens showed higher compressibility
by consolidating to ev=8.5% in comparison to the Ev=6.5% for dispersed specimens.
However, during unloading ( p' =275kPa- 55kPa) the equation reversed and the
recovered volumetric strain for flocculated specimen, �ev=l .4%, was much lower than
the �ev=2.5% for dispersed specimen. Despite the identical consolidation history for both
the specimens before unloading, the dispersed specimen showed much higher recoverable
strain due to their high rebound capacity (ratio of elastic to plastic deformation). The
normal strains were measured along all the three axes of the specimen. In the true triaxial
device, the normal strains were measured along all the six faces of the cubical specimens.
The strains measured at the opposite faces were then averaged to get the normal strains
along three principal axes, x, y, and z. Figure 6.7 shows the individual normal strains
developed along the x, y, and z-axis during isotropic consolidation of flocculated and
dispersed specimens. Thedirection of axial loading during specimen preparation was
aligned with the z-axis of true triaxial device. Therefore, the cross-anisotropy induced in
the specimen during their preparation, due to uniaxial loading, was about the z-axis.
Therefore, along the two other axes, x and y, the specimen had same consolidation
history. Since Ko<l , the pre-consolidation stress corresponding to x, and y axis was lower
than what it was for the z-axis. A similar cross-anisotropy condition can be imagined for
the orientation of particles in dispersed specimens, because during their preparation,
140
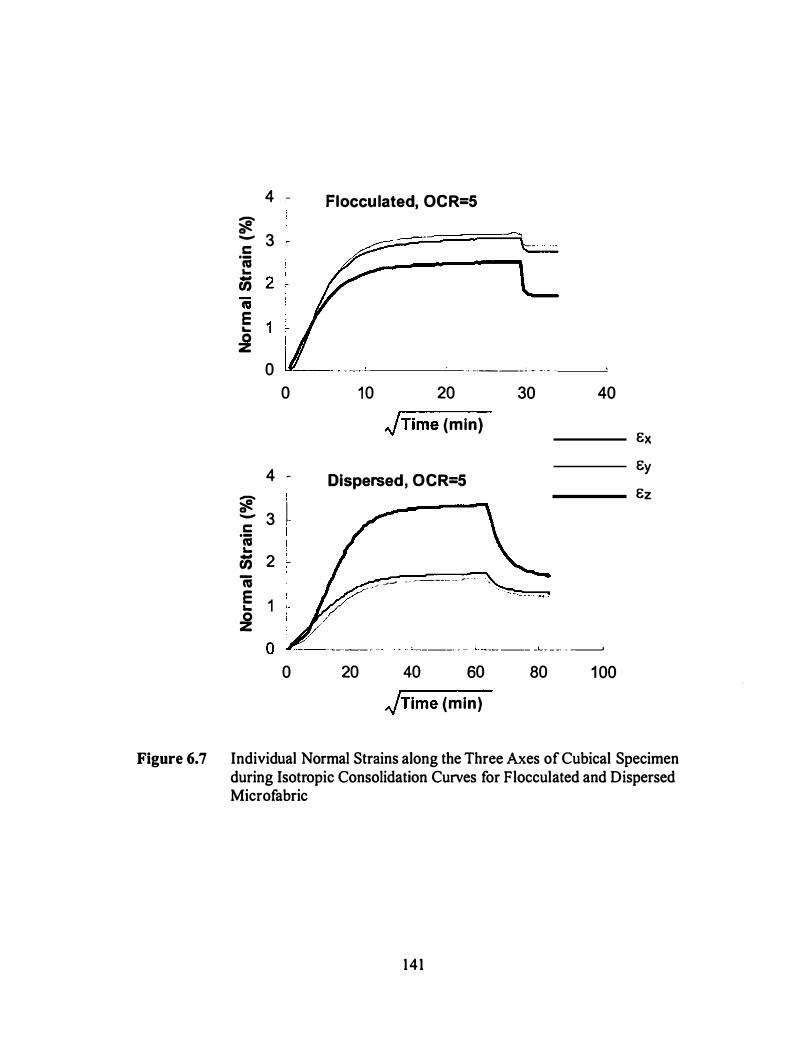
4 Flocculated, OCR=5 7 � - 3 c ·ca
...
us ca E ... :i
0 ·· ····--� · -· - - -
0 1 0 20 30 40
,jTime (min) Bx By
4 -Dispersed, OCR=5
I Bz 7 � l - 3 c I ·ca ...
us 2 -I 'CO _r- ---'- _ _ _ .-___ __ ,- - .
E 1 ... 0 z .1- - �
0 20 40 60 80 1 00
,jTime (min)
Figure 6.7 Individual Normal Strains along the Three Axes of Cubical Specimen during Isotropic Consolidation Curves for Flocculated and Dispersed Microfabric
14 1
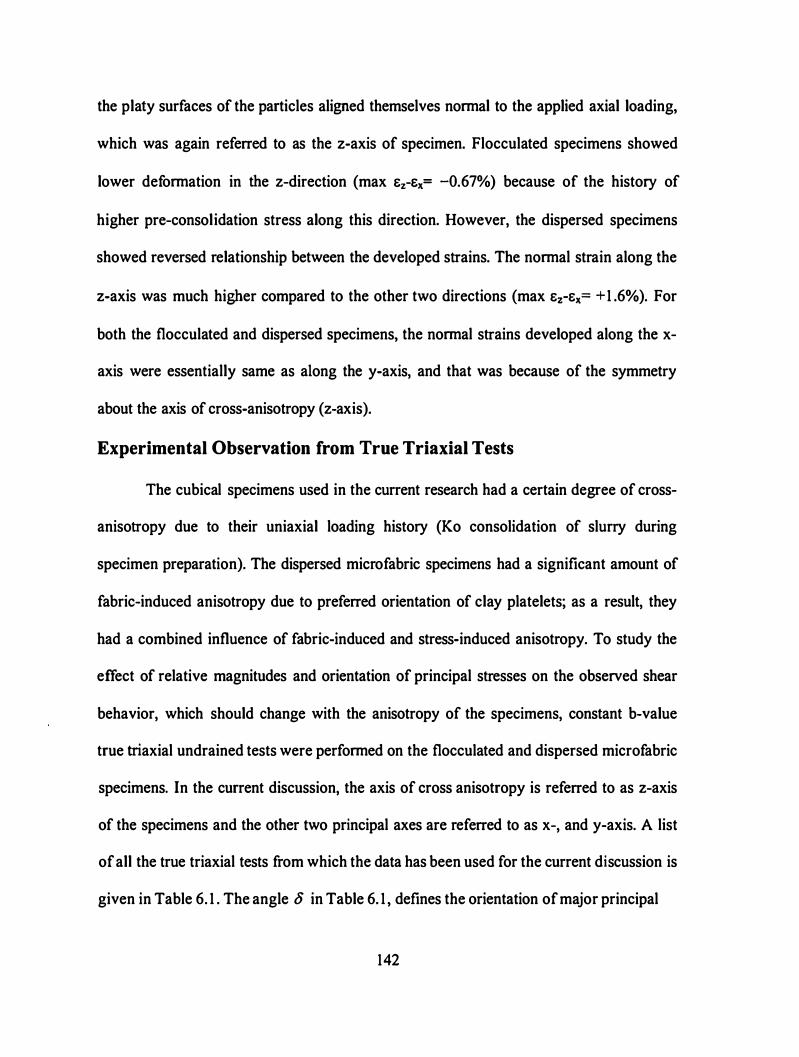
the platy surfaces of the particles aligned themselves nonnal to the applied axial loading,
which was again referred to as the z-axis of specimen. Flocculated specimens showed
lower defonnation in the z-direction (max Ez-Ex= -0.67%) because of the history of
higher pre-consolidation stress along this direction. However, the dispersed specimens
showed reversed relationship between the developed strains. The nonnal strain along the
z-axis was much higher compared to the other two directions (max Ez-Ex= + 1 .6%). For
both the flocculated and dispersed specimens, the nonnal strains developed along the x
axis were essentially same as along the y-axis, and that was because of the symmetry
about the axis of cross-anisotropy (z-axis).
Experimental Observation from True Triaxial Tests
The cubical specimens used in the current research had a certain degree of cross
anisotropy due to their uniaxial loading history (Ko consolidation of slurry during
specimen preparation). The dispersed microfabric specimens had a significant amount of
fabric-induced anisotropy due to preferred orientation of clay platelets; as a result, they
had a combined influence of fabric-induced and stress-induced anisotropy. To study the
effect of relative magnitudes and orientation of principal stresses on the observed shear
behavior, which should change with the anisotropy of the specimens, constant b-value
true triaxial undrained tests were perfonned on the flocculated and dispersed microfabric
specimens. In the current discussion, the axis of cross anisotropy is referred to as z-axis
of the specimens and the other two principal axes are referred to as x-, and y-axis. A list
of all the true triaxial tests from which the data has been used for the current discussion is
given in Table 6. 1 . The angle 8 in Table 6. 1 , defines the orientation of major principal
142
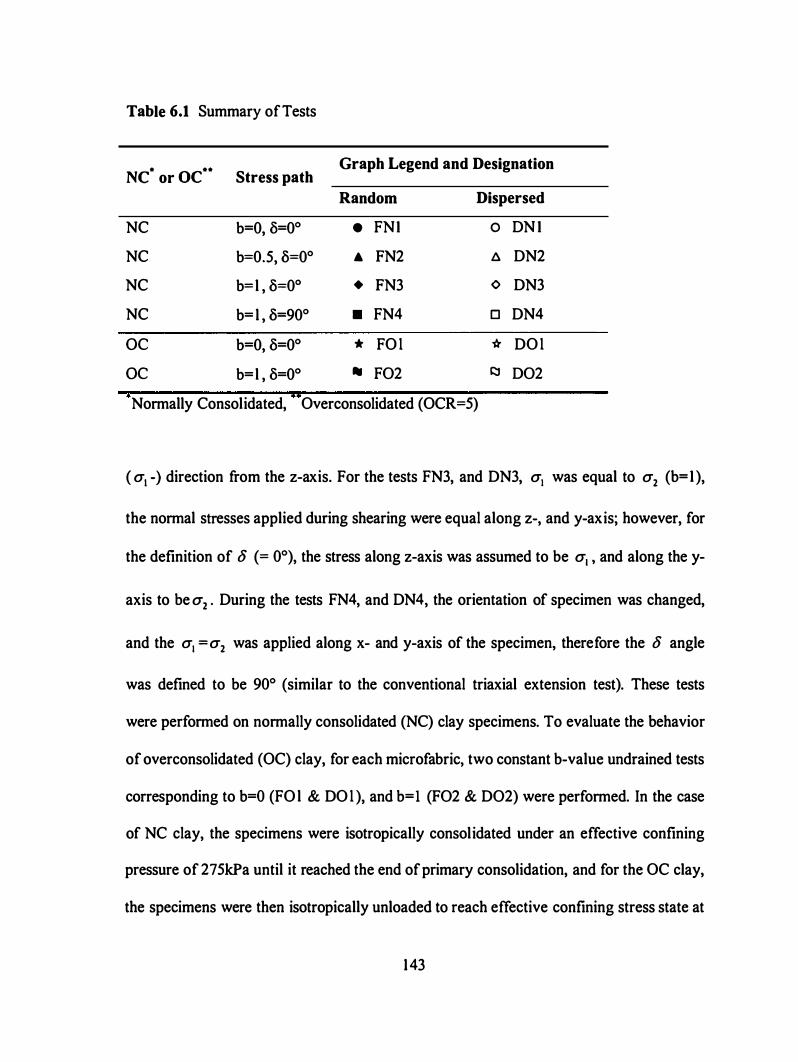
Table 6.1 Summary of Tests
NC* or oc** Stress path Graph Legend and Designation
Random Dispersed
NC b=0, 8=0° • FNI 0 DN I
NC b=0.5, 8=0° A FN2 /::;. DN2
NC b=l , 8=0° • FN3 ¢ DN3
NC b= l , 8=90° • FN4 0 DN4
oc b=0, 8=0° * FO l tr DO l
oc b=l , 8=0° .. F02 1::1 D02
Nonnally Consolidated, Overconsolidated (OCR=5)
( a1 -) direction from the z-axis. For the tests FN3, and DN3, a1 was equal to a 2 (b= 1 ),
the nonnal stresses applied during shearing were equal along z-, and y-axis; however, for
the definition of o (= 0°), the stress along z-axis was assumed to be a1 , and along the y-
axis to be a2 • During the tests FN4, and DN4, the orientation of specimen was changed,
and the a1 = a2 was applied along x- and y-axis of the specimen, therefore the o angle
was defined to be 90° (similar to the conventional triaxial extension test). These tests
were perfonned on nonnally consolidated (NC) clay specimens. To evaluate the behavior
of overconsolidated (OC) clay, for each microfabric, two constant b-value undrained tests
corresponding to b=O (FO l & DO l ), and b=l (F02 & D02) were perfonned. In the case
of NC clay, the specimens were isotropically consolidated under an effective confining
pressure of 275kPa until it reached the end of primary consolidation, and for the OC clay,
the specimens were then isotropically unloaded to reach effective confining stress state at
143
55kPa (OCR=S). The orientation ofprincipal stresses in b= l tests on OC clay was, 6=0°,
same as it was in the FN3, and DN3 tests. The deviator stress, q , shear strain, &q , and
mean effective stress, p' , are defined in their invariant form of stress or strain tensor
form.
Stress-Strain Relationship and Shear Failure
The stress-strain relationship in Fig. 6.8 shows that when the specimens were
sheared from NC stress state the overall shear stiffness of dispersed specimens, in
comparison with the flocculated specimens, was much higher. For the flocculated
specimens, a close relationship between the stress strain behavior was observed for the
tests performed with o =0°, FNl , FN2, and FN3. However, the corresponding tests on
dispersed specimens, DN 1 , DN2, and DN3, showed a significant variation in the stress
strain relationship. Because of higher stiffness along z-axis of the specimen, induced
from their uniaxial loading history (induced during slurry consolidation), the test FN4
( a1 normal to z-axis) showed much lower shear stiffness throughout shearing in
comparison to the other tests on NC flocculated specimens. Although, the flocculated and
dispersed microfabric specimens experienced identical slurry consolidation followed by
isotropic consolidation with identical stress level and same type of loading paths, the
stiffness anisotropy from z-axis to x-axis was significantly different for the two
microfabrics because of the difference in arrangement of particles. In the dispersed
specimens, a part of the anisotropy induced by the loading history was compensated by
the fabric induced anisotropy, which resulted in smaller difference between the stress-
144

strain relationship obtained from the test DN4 and from the other tests performed on
dispersed specimens.
The failure point was defined as the point of peak deviator stress just before the
specimen sheared to large strains with negligible change in shear stress. This definition of
failure point was suitable for the current study, because the specimens were observed to
have localized deformation at and beyond peak deviator stress. Prashant and Penumadu
(2003a) presented a method of identifying the onset of localization using the strain
information obtained from a true triaxial shear test. They documented the shear bands and
defused localizations observed in the flocculated specimens sheared from initial
hydrostatic stress state corresponding to OCR=5. Similar patterns were observed in the
test data obtained for both flocculated and dispersed specimens. In Fig. 6.8, the failure
points on the stress-strain curves are shown by using the legends listed in Table 6. 1 .
Figure 6.9 shows the observed shear strain values at failure and the normalized undrained
shear strength, Su /a; . Note that Su was defined as the undrained shear strength in
a1 -a3 plane, S" = ( a1 - a3 )/2 , and normalized with the initial confining stress, a; .
From Fig. 6.8b, and 6.9a, it can be observed that the dispersed specimens showed
relatively more of brittle failure behavior, and failed at much lower shear strain values
than the flocculated specimens. However, both the microfabrics shared a common trend
that the shear strains at failure decreased as b-value increased, and the shear strains at
failure for b=l test with o =90° and for b=O test were close to each other. As shown in
Fig. 6.9b, the dispersed specimens showed higher shear strength than the flocculated
specimens. However, it is well known that the clay strength strongly depends on its void
145
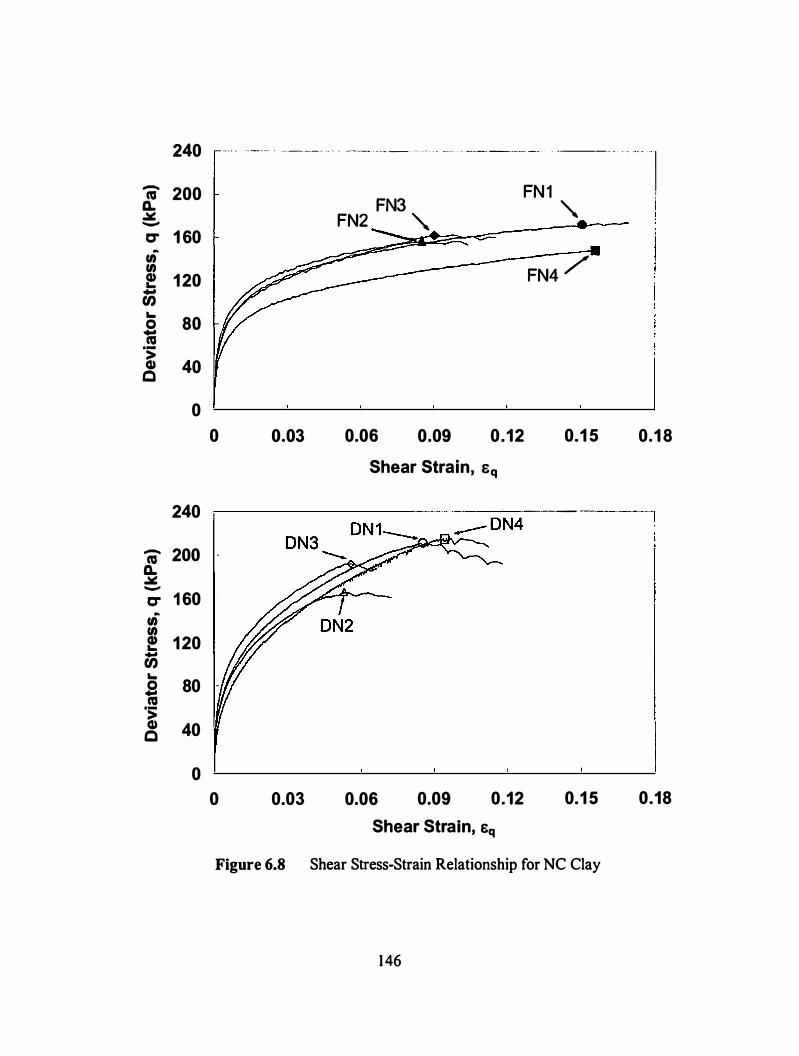
240
-200 ca ll.
� -
0'" 1 60 �
en en ! 120
-U) ...
80 0 -ca ·s; Q) 40 c
0
240
- 200 ca ll. � -
0'" 1 60 fi en ! 120
-U) ... 0 80 .. ca
·-> Q) 40 c
0
0
-
0
�� · - - �-- -�-- -- - -- - . ------- -------- -- - - - �-
FN3 FN2 '
0.03 0.06 0.09
- ----- ---- -- · - - ---- -
FN1 '
FN4 /
0.12 0.1 5
Shear Strain, Sq
·-----
0.03 0.06 0.09 0.12 0.1 5
Shear Strain, sq
Figure 6.8 Shear Stress-Strain Relationship for NC Clay
146
- - · - - I
I I I l
0.1 8
0.18
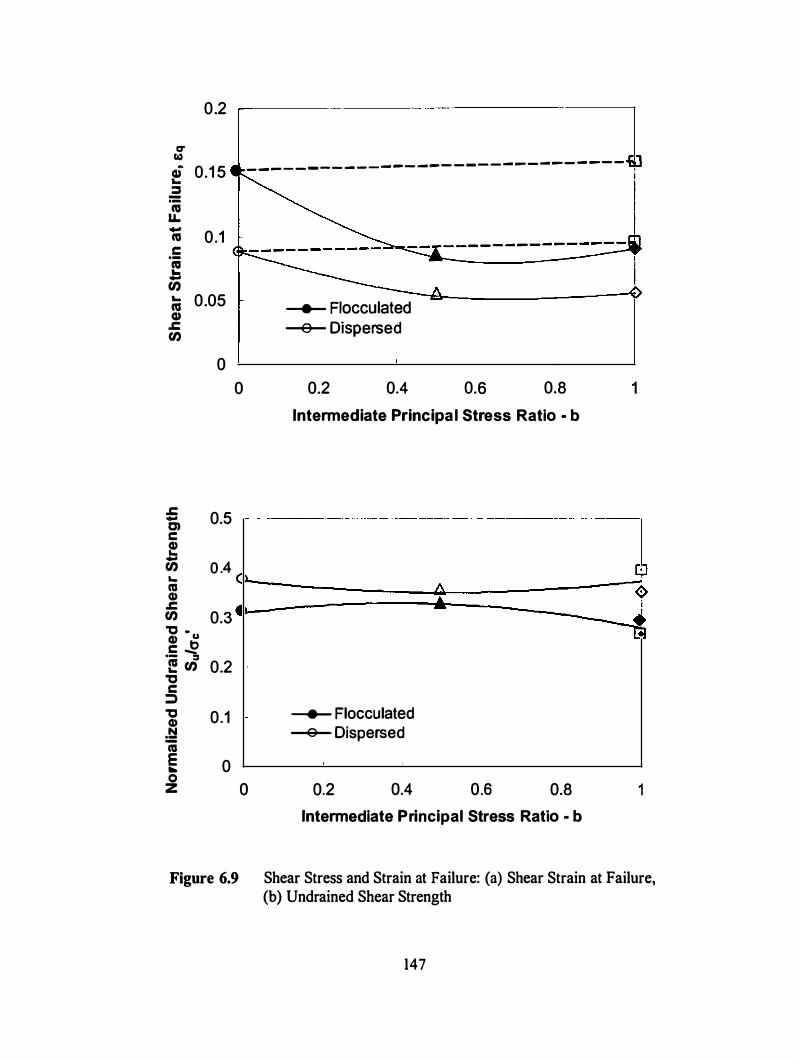
CT Col)
0.2
o; 0.1 5 ... �
-·-
C\1 u.. -C\1 0.1 .5 � en ; 0.05 C1)
.c en
.c -CJ c Q) ... -en ... C\1 C1)
.c en "C -Q) u c � ·- :II t! en "C c ::J "C C1) � C\1 E ... 0 z
0
0.5
0 .4
0.3
0.2
0.1
0
- � � - - - - --
- - � � - � � - - - - - - - - - - - - - - -
0
- �
0
----- Flocculated -e- Dispersed
0.2 0.4 0.6 0.8 1
Intermediate Principal Stress Ratio - b
--�--- - - - --� � - - - -- - - - ------·-- - - ---
----- Flocculated � Dispersed
0.2 0.4 0.6 0.8
Intermediate Principal Stress Ratio - b 1
Figure 6.9 Shear Stress and Strain at Failure: (a) Shear Strain at Failure, (b) Undrained Shear Strength
147
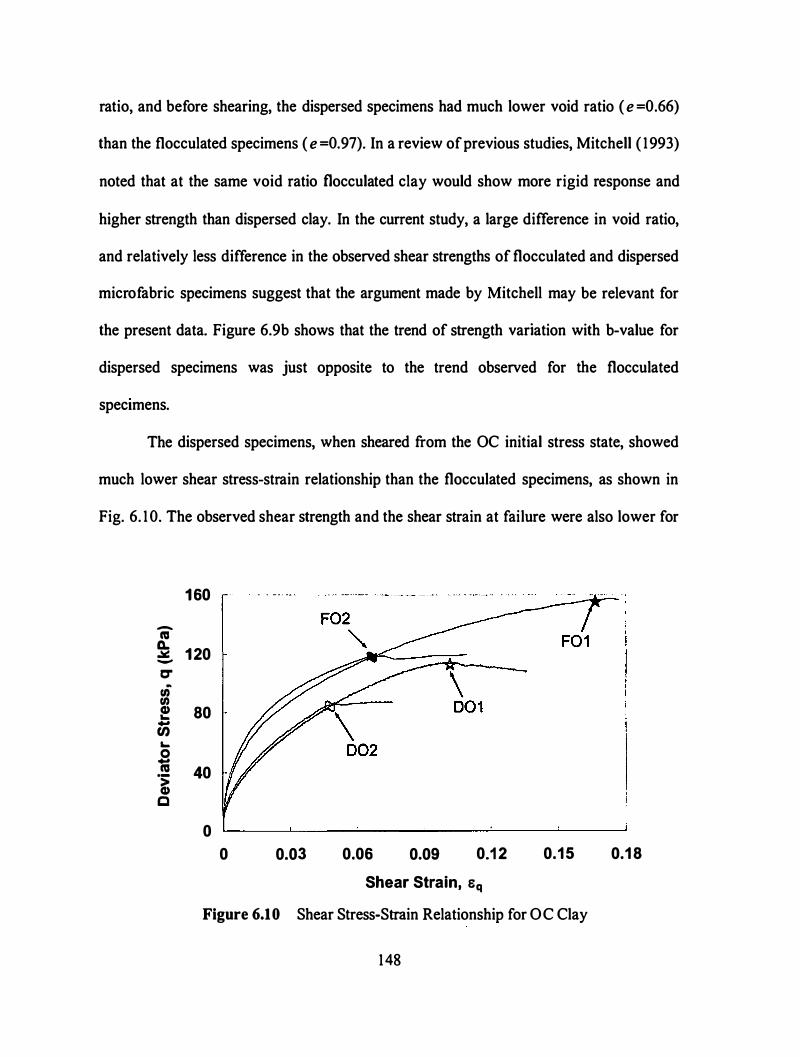
ratio, and before shearing, the dispersed specimens had much lower void ratio ( e =0.66)
than the flocculated specimens ( e =0.97). In a review of previous studies, Mitchell ( 1993)
noted that at the same void ratio flocculated clay would show more rigid response and
higher strength than dispersed clay. In the current study, a large difference in void ratio,
and relatively less difference in the observed shear strengths of flocculated and dispersed
microfabric specimens suggest that the argument made by Mitchell may be relevant for
the present data. Figure 6.9b shows that the trend of strength variation with b-value for
dispersed specimens was just opposite to the trend observed for the flocculated
spectmens.
The dispersed specimens, when sheared from the OC initial stress state, showed
much lower shear stress-strain relationship than the flocculated specimens, as shown in
Fig. 6. 1 0. The observed shear strength and the shear strain at failure were also lower for
-ca Q. ..lll:: -
C" a fl) fl) G)
... -rn ... 0
-ca ·s: G) c
160
120
80
40
0
0 0.03 0.06 0.09 0.1 2 0.15
Shear Strain, Sq
Figure 6.10 Shear Stress-Strain Relationship for OC Clay
148
0.1 8

the dispersed specimens. However, for both flocculated and dispersed specimens, b=1
tests (F02 and 002), in comparison with the b=O tests (FO 1 and F02), showed much
lower shear strength and shear strain at failure. Excluding the test FO 1 , all other tests
showed significantly brittle failure. After reviewing the data available in literature for
several clays, Mayne and Swanson ( 1979) showed that the undrained shear strength of
OC clay can be normalized with the NC undrained shear strength of the same clay, as a
function of OCR value, using a soil constant Ao . They found a correlation between the
A0 value and the consolidation properties of clays, ( A0 = 1 - C s / Cc ). In the current
study, the A0 values for flocculated and dispersed microfabric obtained from their
consolidation properties were A0 =0.87, and 0.67 respectively. A much lower value of
A0 for dispersed specimen explains the significant drop in undrained strength of OC
clay.
Evolution of Excess Pore Pressure and Stress Paths in q-p' Space
The excess pore pressure developed during undrained deformation represents the
volume change tendency of soil. It is well known that for incompressible saturated soils,
the change in mean total stress, llp , develops equal amount of pore pressure under
undrained condition, and on application of various stress paths, additional pore pressure
develops due to particle rearrangement during shearing. For various stress paths, the pore
pressure developed solely due to shear (or particle rearrangement), l!.uq , can be separated
from the total excess pore pressure, l:lu , which is essentially equal to the negative change
in mean effective stress, !!.p' , during undrained shear.
149
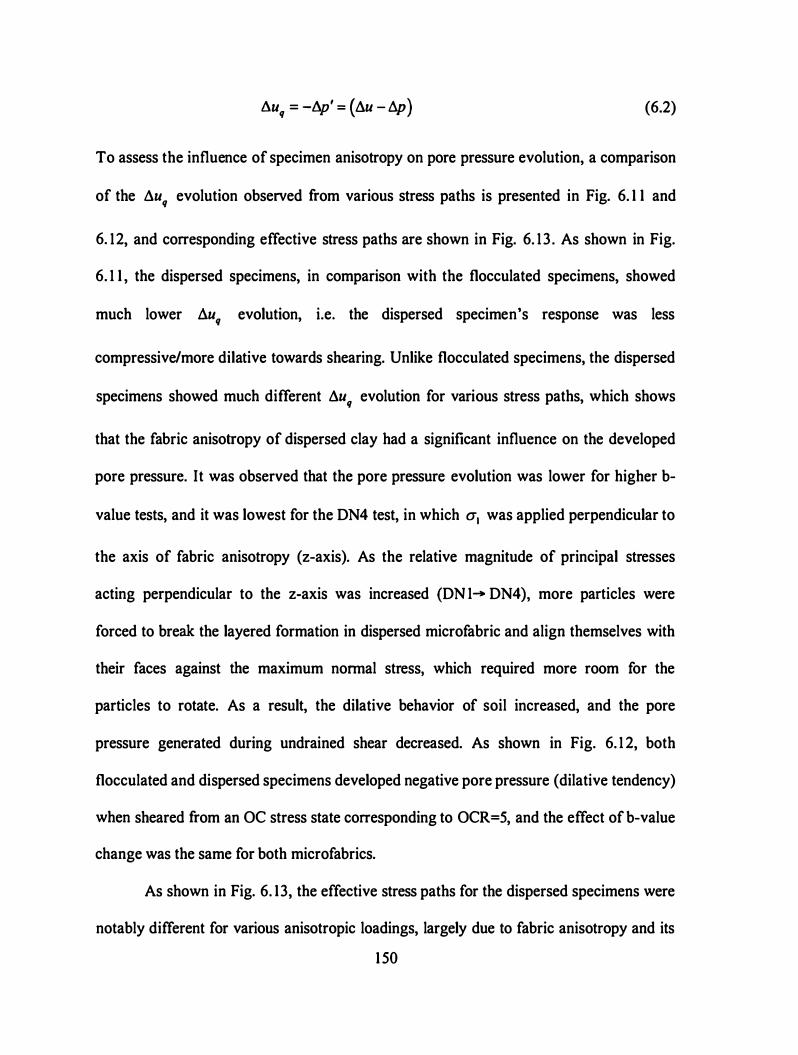
6u9 = -6p' = (Au -llp) (6.2)
To assess the influence of specimen anisotropy on pore pressure evolution, a comparison
of the Au9 evolution observed from various stress paths is presented in Fig. 6. 1 1 and
6. 12, and corresponding effective stress paths are shown in Fig. 6. 13 . As shown in Fig.
6. 1 1 , the dispersed specimens, in comparison with the flocculated specimens, showed
much lower flu9 evolution, i.e. the dispersed specimen's response was less
compressive/more dilative towards shearing. Unlike flocculated specimens, the dispersed
specimens showed much different Au9 evolution for various stress paths, which shows
that the fabric anisotropy of dispersed clay had a significant influence on the developed
pore pressure. It was observed that the pore pressure evolution was lower for higher b
value tests, and it was lowest for the DN4 test, in which a1 was applied perpendicular to
the axis of fabric anisotropy (z-axis). As the relative magnitude of principal stresses
acting perpendicular to the z-axis was increased (DN 1- DN4), more particles were
forced to break the layered formation in dispersed microfabric and align themselves with
their faces against the maximum normal stress, which required more room for the
particles to rotate. As a result, the dilative behavior of soil increased, and the pore
pressure generated during undrained shear decreased. As shown in Fig. 6. 1 2, both
flocculated and dispersed specimens developed negative pore pressure (dilative tendency)
when sheared from an OC stress state corresponding to OCR=5, and the effect of b-value
change was the same for both microfabrics.
As shown in Fig. 6. 13, the effective stress paths for the dispersed specimens were
notably different for various anisotropic loadings, largely due to fabric anisotropy and its
1 50
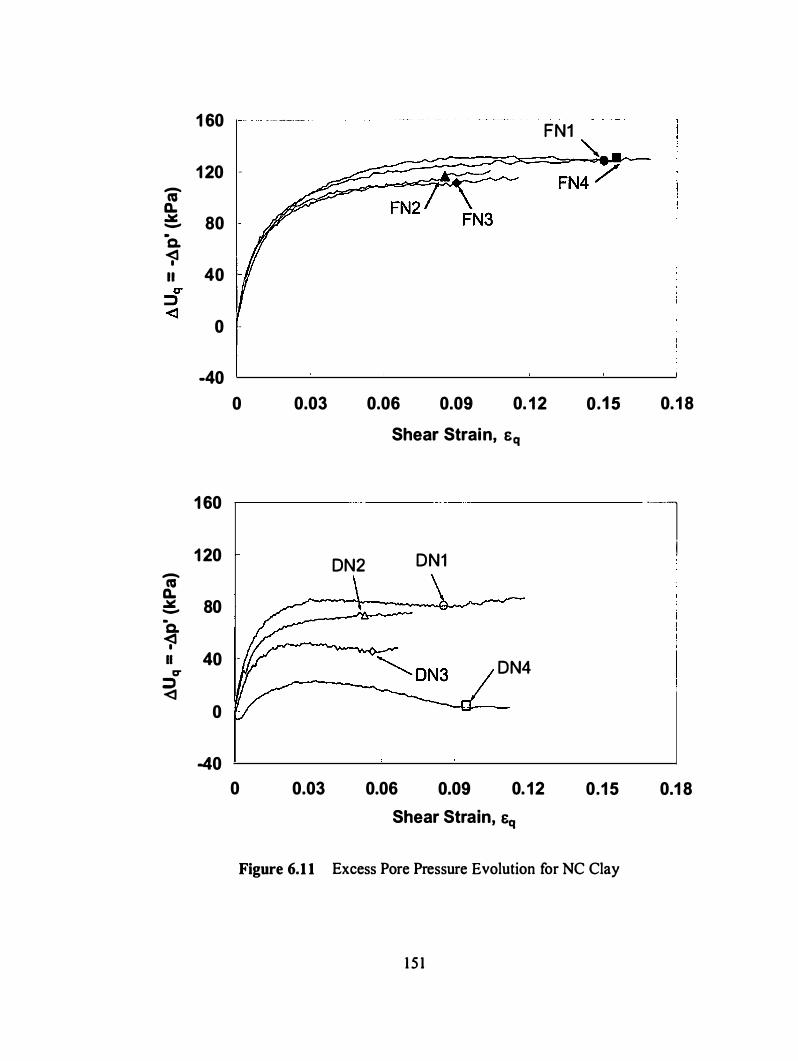
1 60 - ----- -
-ca a. .:.:'! -·a. �
1 20 -
80
II 40
0 -
-40
0
1 60
1 20 -ca a. .:.:'! 80 -·a. � II 40
c:r =» <:1
0
-40
0
0.03
0.03
FN1 '-...
FN4 /
0.06 0.09 0. 1 2 0.1 5
Shear Strain, Sq
DN2 DN1
DN4
0.06 0.09 0. 12 0.1 5
Shear Strain, sq
Figure 6.1 1 Excess Pore Pressure Evolution for NC Clay
1 5 1
0.1 8
·-l I
0.1 8
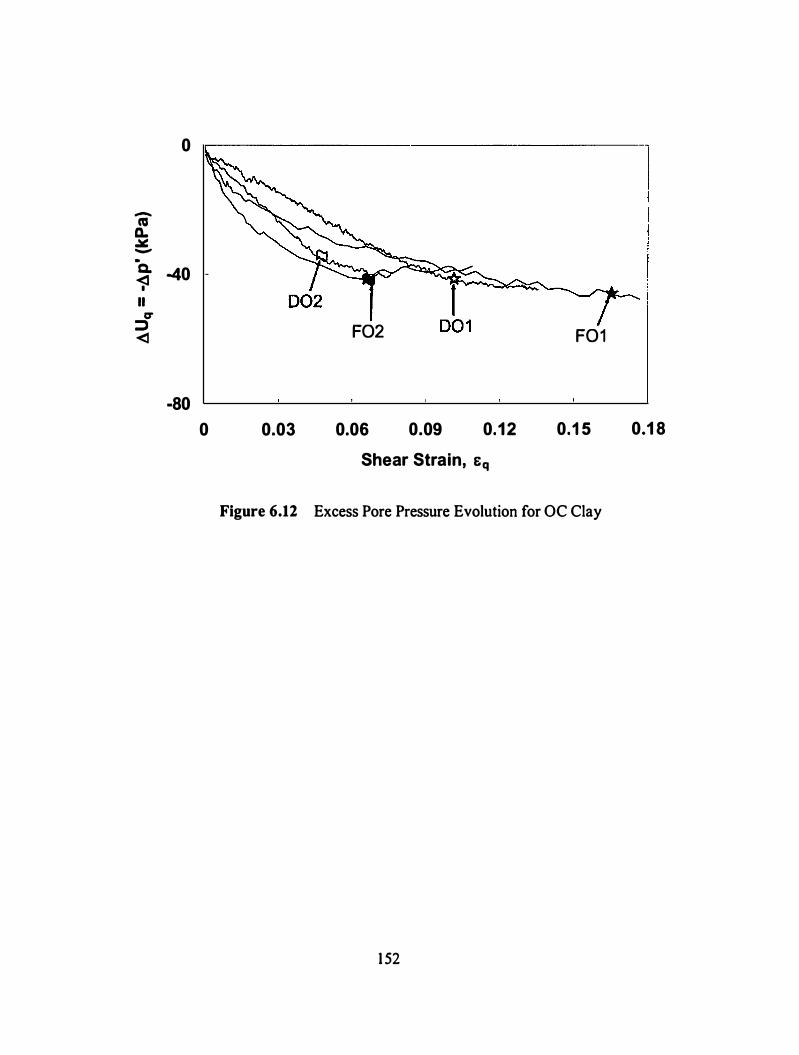
-ca D.. .llll: -
0
·c. -40 -� II
0" :::J <:1
-80
0
F02 F01
0.03 0.06 0.09 0.12 0.1 5
Shear Strain, E q
Figure 6.12 Excess Pore Pressure Evolution for OC Clay
1 52
0.1 8
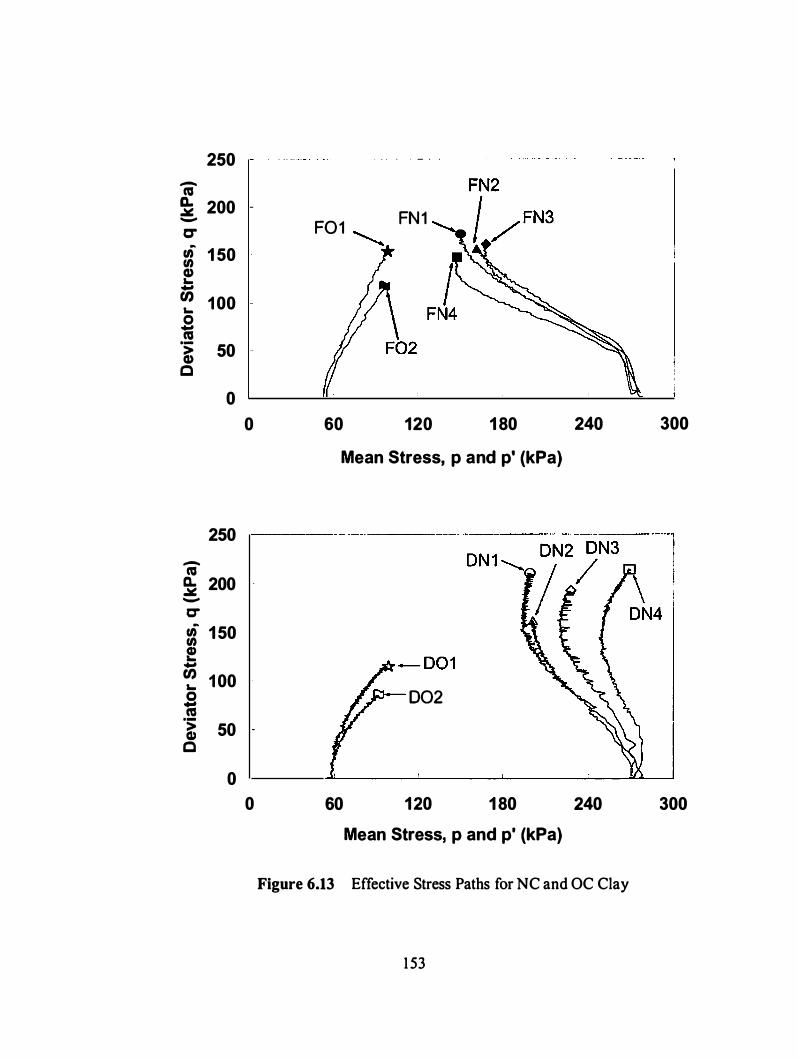
250 -ca D. 200 � -
C" ur 1 50 Cl) Cl) ...
-U) 1 00 ... 0 -ca ·:; 50 Cl) c
0
250
-ca D. 200 � -
C" ur 1 50 Cl) !
-� 1 00
�
-
-
0
·� 50 -c
0
0
F01 FN1
..............
60 120 1 80
Mean Stress, p and p' (kPa)
002
60 120 1 80
Mean Stress, p and p' (kPa)
240
240
Figure 6.13 Effective Stress Paths for NC and OC Clay
1 53
300
300
influence on the developed pore pressure. As the cr1 was rotated from 8 =0° (along z
axis) to 8 =90°, the flocculated specimen showed more of compressive behavior
(decrease in p' ), whereas, the dispersed specimen became more dilative (increase in p' ).
At OCR=5, no significant difference in the pattern of effective stress paths was observed
for the two microfabrics.
Strength and Pore Pressure Parameters
Figure 6. 1 4 shows the strength and Pore pressure parameters obtained from the
true triaxial tests performed on NC Kaolin clay with flocculated and dispersed
microfabric. In Fig. 6. 14a, the effective friction angle, ¢/ , defines the shear strength
considering the stresses in cr1 -cr3 plane, and the peak shear stress ratio, M, defines the
clay strength in 30 stress space, which is essentially the ratio of shear stress, q, and mean
effective stress, p' , at failure. The values of ¢' and M, observed for the dispersed
specimens ( ¢' =26.6° to 29.2°, M=0.80 to 1 .05), were generally lower than those for the
flocculated specimens ( ¢' =28.8° to 36.4 M=0.97o 1 . 1 5). Both the microfabrics shared a
common trend of decreasing M with the increase in b-value. For both the microfabrics,
the M values observed from the two b=l tests with different 8 angles were identical.
Figure 6. 14b shows the variation of Ar, and ar as a function of b-value, observed for the
two microfabrics. The ar parameter is defined as a generalized form of the skempton's
pore pressure parameter, Ar, in 30 stress space, as shown in equation 6 .3 and 6.4.
A1 = (flu -/lcr3 ) I/( llcr1 -/lCT3 ) I a1 = (flu - llp )1 /( .Ji.llq1 )
1 54
(6.3)
(6.4)
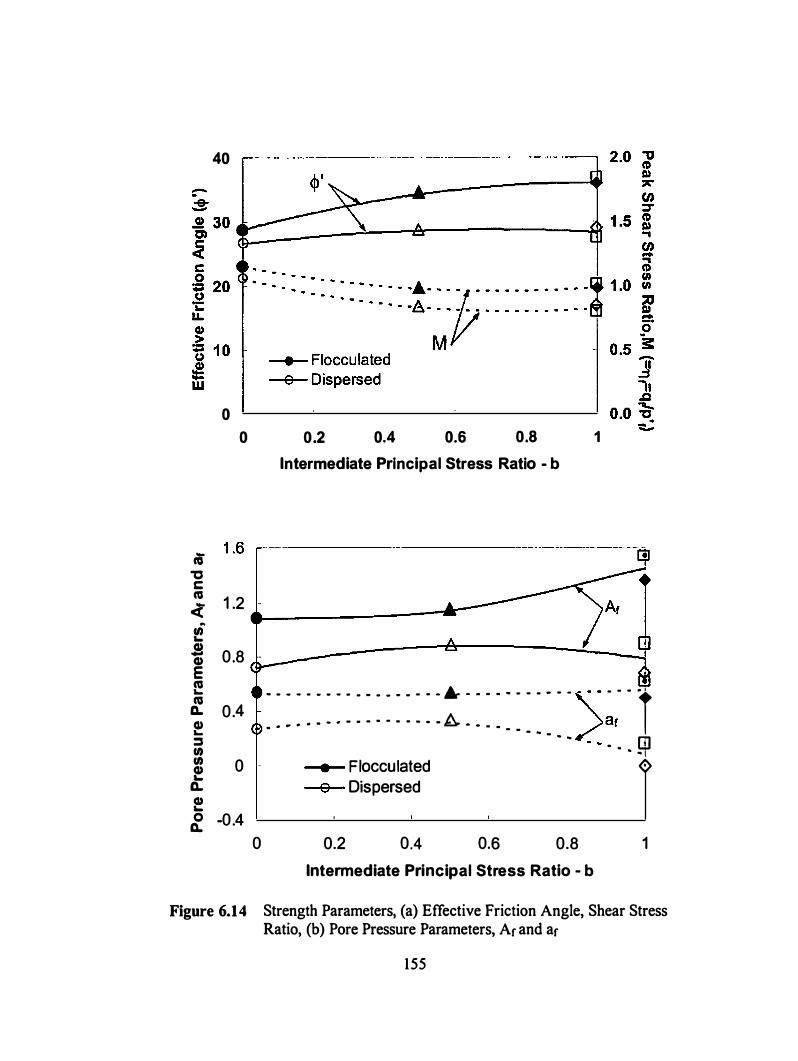
40
0
0
m
---- . . . . . -·--- - - ---- - · ·-- ----.
0.2 0.4 0.6 0.8 1
Intermediate Principal Stress Ratio - b
1 .6 ,-
"'C c ns
� 1 .2 .-_______ ____
I!! s G) 0.8 E ns � 0.4
- - - - - - - - - - - - - - - - - - .. - - - - - - - - - - -,. - - - ·r· a> •
• • • • • - • - • - • • • • - • · A - . . _ /at
:; · · - - - - - · - m � • � • � I e 0 - • Flocculated �
o. o Dispersed f 0 -0 .4 Q.
0 0.2 0.4 0.6 0.8
Intermediate Principal Stress Ratio - b 1
Figure 6.14 Strength Parameters, (a) Effective Friction Angle, Shear Stress Ratio, (b) Pore Pressure Parameters, Ar and ar
155
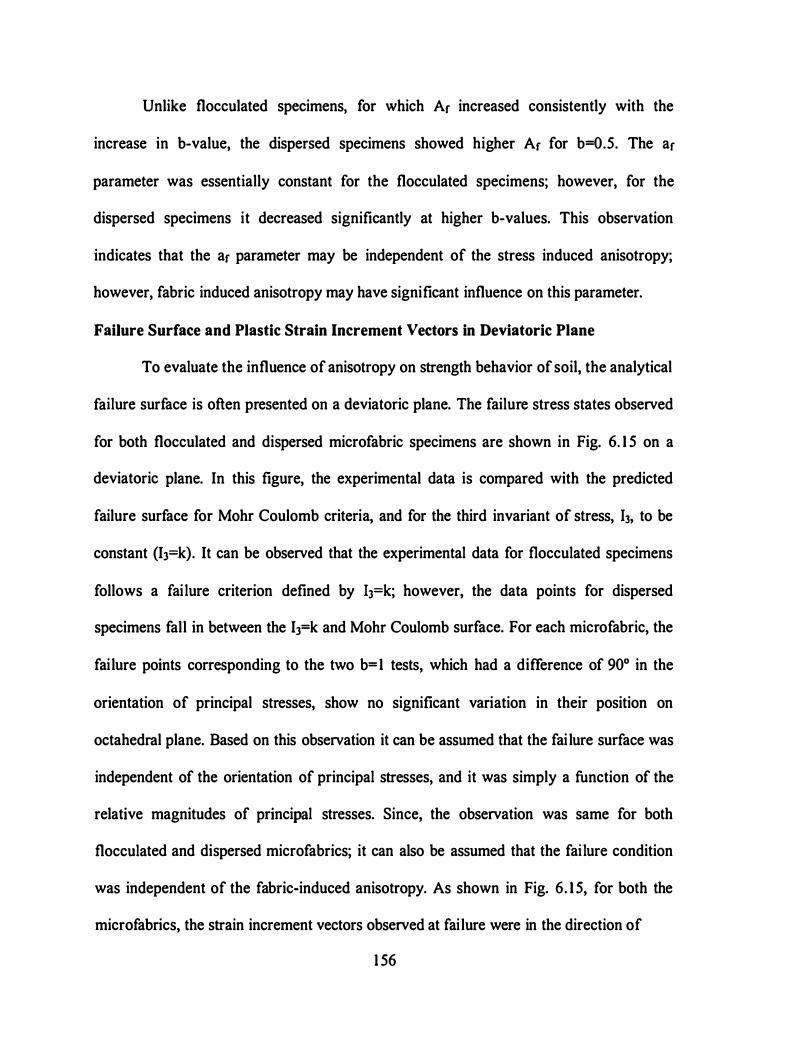
Unlike flocculated specimens, for which Ar increased consistently with the
increase in b-value, the dispersed specimens showed higher Ar for b=0.5. The ar
parameter was essentially constant for the flocculated specimens; however, for the
dispersed specimens it decreased significantly at higher b-values. This observation
indicates that the ar parameter may be independent of the stress induced anisotropy;
however, fabric induced anisotropy may have significant influence on this parameter.
Failure Surface and Plastic Strain Increment Vectors in Deviatoric Plane
To evaluate the influence of anisotropy on strength behavior of soil, the analytical
failure surface is often presented on a deviatoric plane. The failure stress states observed
for both flocculated and dispersed microfabric specimens are shown in Fig. 6. 1 5 on a
deviatoric plane. In this figure, the experimental data is compared with the predicted
failure surface for Mohr Coulomb criteria, and for the third invariant of stress, !), to be
constant (I3=k). It can be observed that the experimental data for flocculated specimens
follows a failure criterion defined by IJ=k; however, the data points for dispersed
specimens fall in between the I3=k and Mohr Coulomb surface. For each microfabric, the
failure points corresponding to the two b= 1 tests, which had a difference of 90° in the
orientation of principal stresses, show no significant variation in their position on
octahedral plane. Based on this observation it can be assumed that the fai lure surface was
independent of the orientation of principal stresses, and it was simply a function of the
relative magnitudes of principal stresses. Since, the observation was same for both
flocculated and dispersed microfabrics; it can also be assumed that the failure condition
was independent of the fabric-induced anisotropy. As shown in Fig. 6. 1 5, for both the
microfabrics, the strain increment vectors observed at failure were in the direction of
1 56
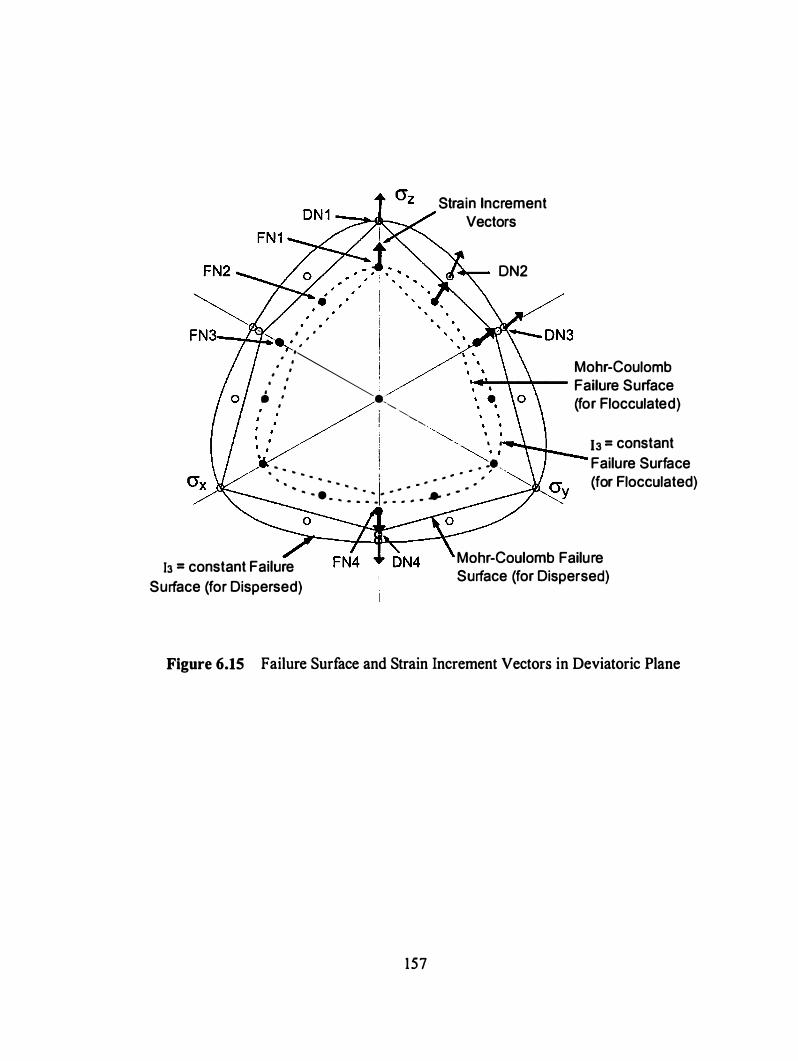
' ' . ·--o'o....J.....,;;;:'-e,_: �
,
Strain Increment Vectors
DN2
...
.. ·
�
. . ' . ' . . ·� Mohr-Coulomb
,...�r--�- Failure Surface . "
""' ··.,""-, "'- ' I "'-' I
'"" . ·· � ,. • -. .. I ,_ .. • , ,.............._
' .. .. .. ' . .. , ............ "' "" .. .. . · - - · .. 1- - - - - -.. - - · ·
. .. - . .. . . . . .. -
(for Flocculated)
13 = constant
Failure Surface (for Flocculated)
13 = constant Failure
Surface (for Dispersed)
Mohr-Coulomb Failure Surface (for Dispersed)
Figure 6.15 Failure Surface and Strain Increment Vectors in Deviatoric Plane
157
stress increments. Hence, the strain evolution at failure was observed to be independent
of the anisotropy of specimens with both flocculated and dispersed micro fabrics.
Conclusions
To investigate the influence of inherent microfabric (geometric arrangement of
clay particles) on the fundamental behavior of Kaolin clay, such as induced anisotropy,
consolidation behavior, stress-strain relationship, pore pressure evolution during
undrained shearing, and strength behavior; a series of flexible boundary true triaxial
undrained tests were performed on remolded cubical specimens with two different
microfabrics (flocculated and dispersed) of Kaolin clay. The flocculated and dispersed
specimens with two extreme particle arrangements (random and preferred orientation)
were obtained by Ko consolidation of slurry made in deionized and de-aired water, in
which 2% dispersant was used to obtain dispersed microfabric. Key observations from
this study are summarized as follows:
a) The permanent deformation during consolidation was much lower for the dispersed
specimens in comparison with the flocculated specimens; however, the recoverable
deformation observed after unloading was relatively higher for the dispersed
specimens. The fabric-induced anisotropy shows a significant influence on the mode
of anisotropic deformations of the specimens during hydrostatic consolidation.
b) The dispersed specimens, when sheared from an NC stress state, showed much stiffer
response in the stress-strain relationship, achieved higher strength, failed at lower
strain values, and showed much lower pore pressure evolution in comparison with the
flocculated specimens. However, the influence of microfabric was significantly
1 58
different when the specimens were sheared from an OC stress state corresponding to
OCR=5.
c) Both flocculated and dispersed specimens generally showed localized deformation
and brittle response at failure; particularly it was more significant for the dispersed
specimens.
d) The fabric-induced anisotropy (preferred orientation of particles) in the dispersed
specimens shows significant influence on excess pore pressure during shearing when
the specimens were subjected to different stress paths.
e) The strength parameters ( ¢/ and M) were significantly different for the two
microfabrics; however, they showed similar patterns of variation with different
anisotropic loadings for both flocculated and dispersed microfabrics. A similar
behavior was observed when the failure stress states were projected onto deviatoric
stress plane.
1 59
Chapter 7. Evaluation of Existing Constitutive Models for
Cohesive Soil: Review, Formulation, and Predictions
Introduction
Successful calculation of stresses and deformation in soil deposits under changing
loading conditions largely depend on constitutive models used for characterization of soil
behavior under general three dimensional stress conditions. Since the 1950's, an
increasing effort has been devoted to a description of the fundamental behavior of soil.
Laboratory tests in earlier studies often involved single axis loading conditions and
formed the basis for several existing theories that attempt to explain the mechanical
behavior of soil. The stress conditions corresponding to the in-situ state often involves
three unequal principal stresses i.e. the intermediate principal stress ( cr2) varies from the
major ( cr1 ) or minor principal stress ( cr3) (e.g., slope stability, excavations, and soil
foundation interactions). Advances in testing methods have added the capability of
studying various aspects of generalized stress-strain behavior in a controlled
environment. These techniques were used to study the soil behavior under complex stress
states; however, the constitutive models got increasingly complex when the attempts
were made to address general soil behavior based on these studies. In the chain of these
developments, theoretical ideas were implemented in the shape of constitutive models
with emphasis on various aspects of soil behavior and with a goal of reaching the
experimental observations to some extent. Constitutive theories presented by Drucker et
al. ( 1 957), Roscoe et al . ( 1 963), Roscoe and Burland ( 1968), DiMaggio and Sandler
( 197 1 ), Prevost ( 1978), Nakai and Matsuoka ( 1983), Desai and Faruque ( 1984),
160
Frantziskonis et al. ( 1 986), Lade ( I 990) gtve an idea of the modeling capabilities
achieved to date.
This chapter presents a brief review of the classical elasto-plasticity theory and
the constitutive models developed to explain soil behavior. In particular, the emphasis has
been given to the two leading constitutive theories:
1 . Modified Cam-Clay (MCC) model (Roscoe and Burland, 1 968), which was
developed based on a big resource of experimental data obtained from single axis
loading tests in laboratory. This model has been commonly used in practice to
analyze various field problems.
2. Single hardening model (Lade, 1 990), which was developed based on the
observations from a variety of three-dimensional loading tests. This model has
received attention from many researchers because it is commonly believed to have
better potential to represent the soil behavior under general stress conditions.
Elasto-Piasticity Theory
The total strain of an elasto-plastic material may be considered as the sum of
permanent (plastic) and recoverable (elastic) strains.
(7. 1 )
Here de is incremental strain. Incremental stress-strains relationship for the elastic part of
deformation can be defined using a fourth order elastic stiffness tensor Ke, which may
need up to 8 1 parameters to define fully anisotropic behavior. It is usually reasonable and
more convenient to assume the material to be elastically isotropic, which reduces
required parameters significantly.
161
(7.2)
A yield surface is defined as a surface in stress space such that it hounds stress
states which can be reached without initiating plastic strains. Mathematically, this surface
can be represented by a yield function:
(7.3)
where aiJ is the stress state and '' is a state variable that defines the size of yield surface
in stress space. '' depends on the loading history and its growth can be related to the
plastic strains developed in the material, as shown in equation 7 .4.
d' =a,, dEP (7.4) I aeP iJ
ij If the small variance in stress is such that df > 0 , then this process is called loading and
plastic strains are developed; if the variance induces df < 0 , then this process is called
unloading and it is assumed that there is no plastic strain during unloading. As a limiting
case, if the stress increment is along the yield surface i.e. df = 0 , then it is defined as
neutral loading and no plastic strain is produced.
A flow rule is defined to estimate the incremental plastic strains de; developed
under a loading condition, as shown in equation 7.5.
(7.5)
A stress function g (a !i, '8 ) is the plastic potential function and d)., is a non-negative
constant, which is related to the hardening rule H, as shown in equation 7.6. Equation 7.5
implies that the direction of incremental plastic strain increment vector is normal to a
1 62
surface defined by plastic potential function. This surface is referred to as plastic
potential surface. The flow rule is considered to be associative if g( aiJ,Sg ) coincides
with f (a iJ , S" 1 ) , otherwise it is called non-associative.
d). = _1 (
of da . . ) H ouiJ IJ
(7.6)
where ( ) are Macaulay brackets, which ensure that the function inside will have its
value only if it is positive, otherwise it will remain zero. The material hardening H is
determined from the consistency condition that defines the stress state to remain on
current yield surface throughout loading, as shown in equation 7. 7.
Consistency condition : (7.7)
From equation 7.4, 7.5, and 7.6, H can be determined as shown in equation 7.8.
(7.8)
Using equations 7.5, 7.6 and 7.8, the incremental plastic strains can be directly related to
the stress increments, as shown in equation 7.9.
(7.9)
From equation 7. 1 , 7.2, and 7.9, the incremental total strains can be obtained as a
function of stress increments as shown in equation 7. 1 0.
163
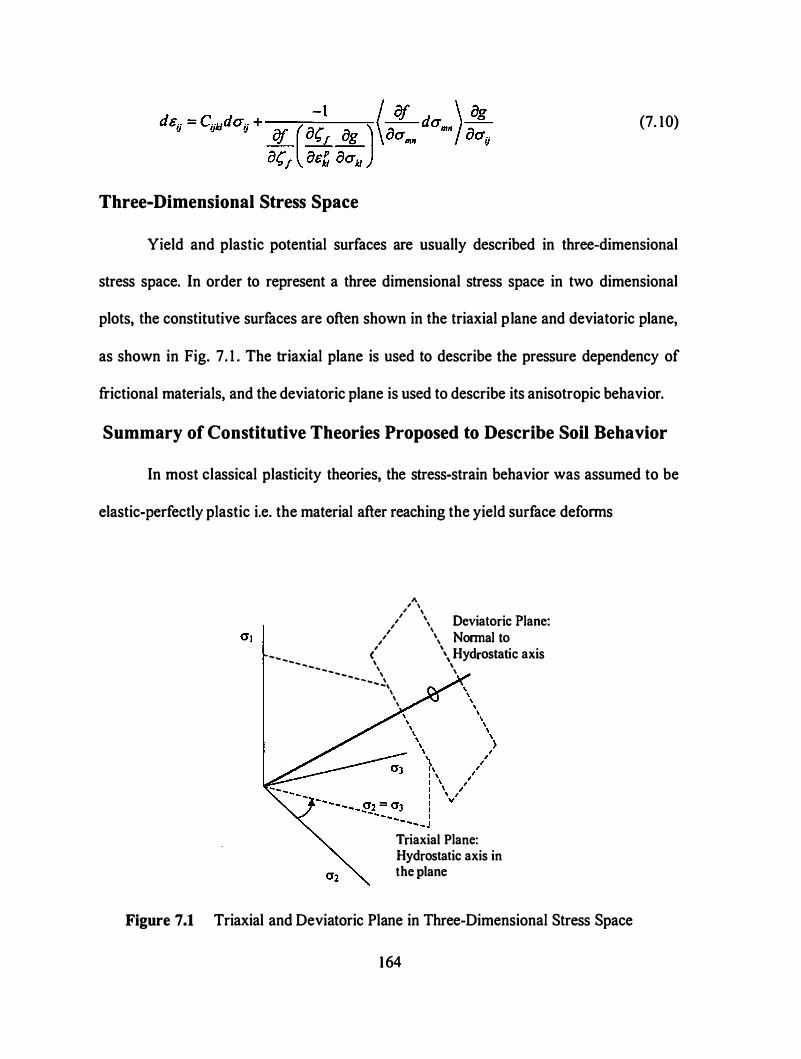
(7. 10)
Three-Dimensional Stress Space
Yield and plastic potential surfaces are usually described in three-dimensional
stress space. In order to represent a three dimensional stress space in two dimensional
plots, the constitutive surfaces are often shown in the triaxial plane and deviatoric plane,
as shown in Fig. 7 . 1 . The triaxial plane is used to describe the pressure dependency of
frictional materials, and the deviatoric plane is used to describe its anisotropic behavior.
Summary of Constitutive Theories Proposed to Describe Soil Behavior
In most classical plasticity theories, the stress-strain behavior was assumed to be
elastic-perfectly plastic i.e. the material after reaching the yield surface defonns
1\ , ' , ' / \ Deviatoric Plane: , ' /, \ Nonnal to
' ' , ,, _ <' \ Hydrostatic axis
�- � - , _
\ \ - -
- - ', - -, ' ' \
Triaxial Plane: Hydrostatic axis in the plane
Figure 7.1 Triaxial and Deviatoric Plane in Three-Dimensional Stress Space
164
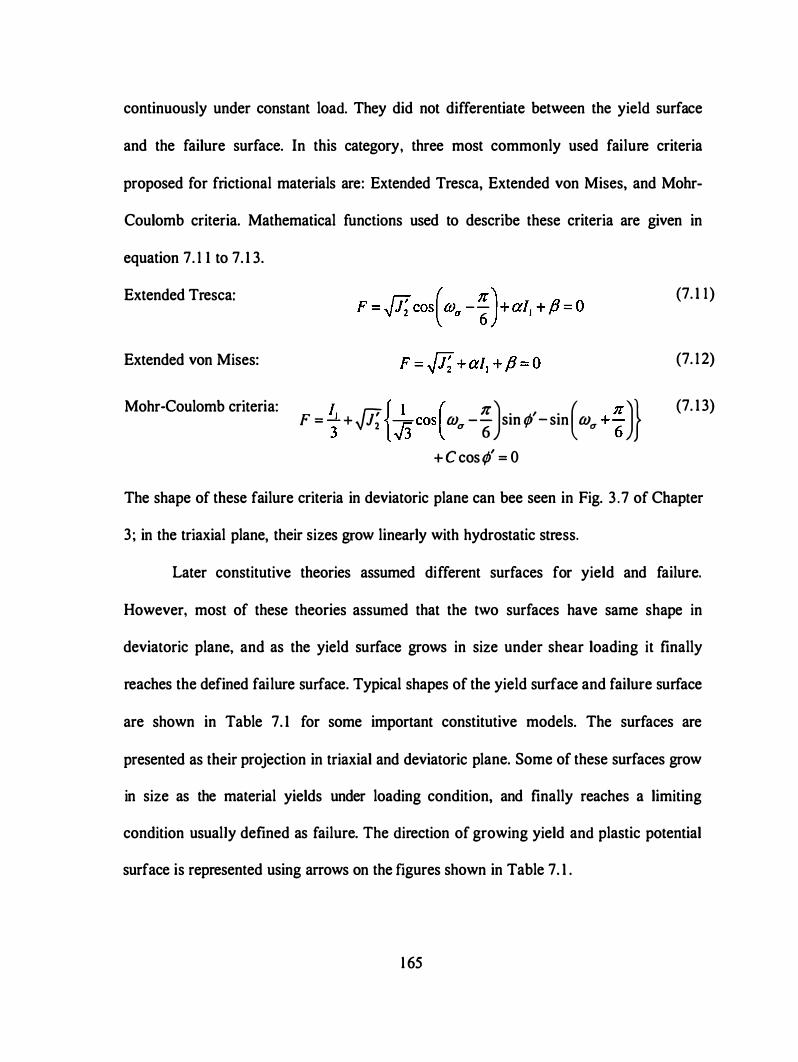
continuously under constant load. They did not differentiate between the yield surface
and the failure surface. In this category, three most commonly used failure criteria
proposed for frictional materials are: Extended Tresca, Extended von Mises, and Mohr-
Coulomb criteria. Mathematical functions used to describe these criteria are given in
equation 7. 1 1 to 7. 1 3.
Extended Tresca: (7. 1 1 )
Extended von Mises: (7. 1 2)
Mohr-Coulomb criteria: F = i + R {� cos
( m. -: )sin �' - sin
( m. +:
)}
(7. 1 3)
+Ccos¢' = 0
The shape of these failure criteria in deviatoric plane can bee seen in Fig. 3 .7 of Chapter
3; in the triaxial plane, their sizes grow linearly with hydrostatic stress.
Later constitutive theories assumed different surfaces for yield and failure.
However, most of these theories assumed that the two surfaces have same shape in
deviatoric plane, and as the yield surface grows in size under shear loading it finally
reaches the defined failure surface. Typical shapes of the yield surface and failure surface
are shown in Table 7. 1 for some important constitutive models. The surfaces are
presented as their projection in triaxial and deviatoric plane. Some of these surfaces grow
in size as the material yields under loading condition, and finally reaches a limiting
condition usualJy defined as failure. The direction of growing yield and plastic potential
surface is represented using arrows on the figures shown in Table 7. 1 .
1 65
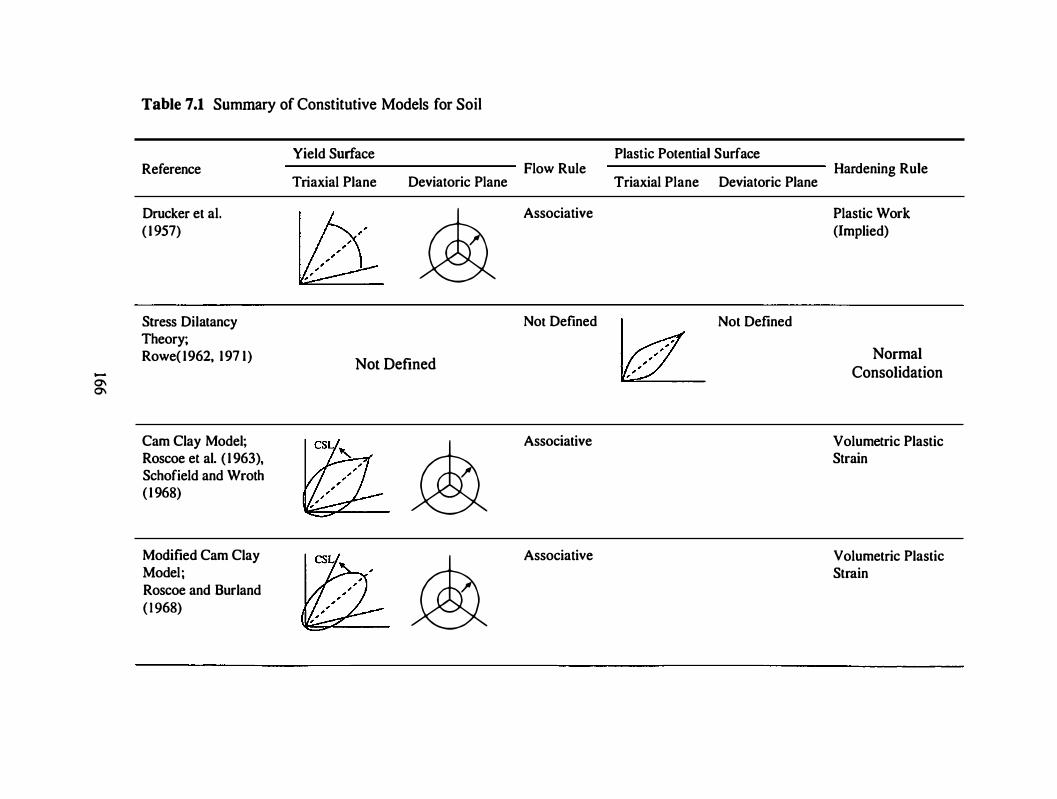
-0\ 0\
Table 7.1 Summary of Constitutive Models for Soil
Reference
Drucker et al. ( 1 957)
Stress Dilatancy Theory; Rowe( 1962, 197 1)
Cam Clay Model; Roscoe et al. ( 1 963 ), Schofield and Wroth ( 1 968)
Modified Cam Clay Model ; Roscoe and Burland ( 1 968)
Yield Surface ------------- Flow Rule
Triaxial Plane Deviatoric Plane
@ Associative
Not Defined
Not Defined
@ Associative
@ Associative
Plastic Potential Surface Hardening Rule
Triaxial Plane Deviatoric Plane
Not Defined
Plastic Work (Implied)
Normal Consolidation
Volumetric Plastic Strain
Volumetric Plastic Strain
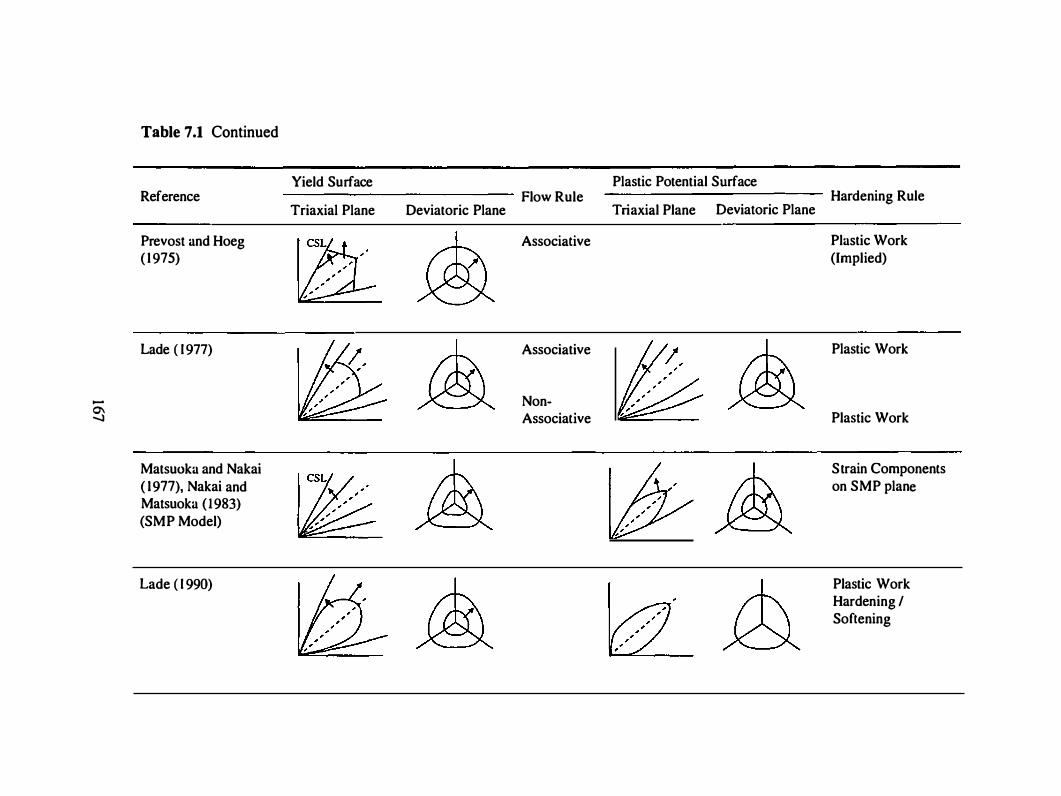
Table 7.1 Continued
Yield Surface Reference
Triaxial Plane Deviatoric Plane
Prevost and Hoeg j cs�,· ® ( 1 975)
Lade ( 1 977) I / / �
Q& ..... � 0\ -...J
Matsuoka and Nakai
� ~ ( 1977), Nakai and Matsuoka (1983) (SMP Model)
Lade ( 1 990)
Q&
Plastic Potential Surface Flow Rule
Triaxial Plane Deviatoric Plane
Associative
Associative
Q& Non-Associative
~
&
Hardening Rule
Plastic Work (Implied)
Plastic Work
Plastic Work
Strain Components on SMP plane
Plastic Work Hardening / Softening
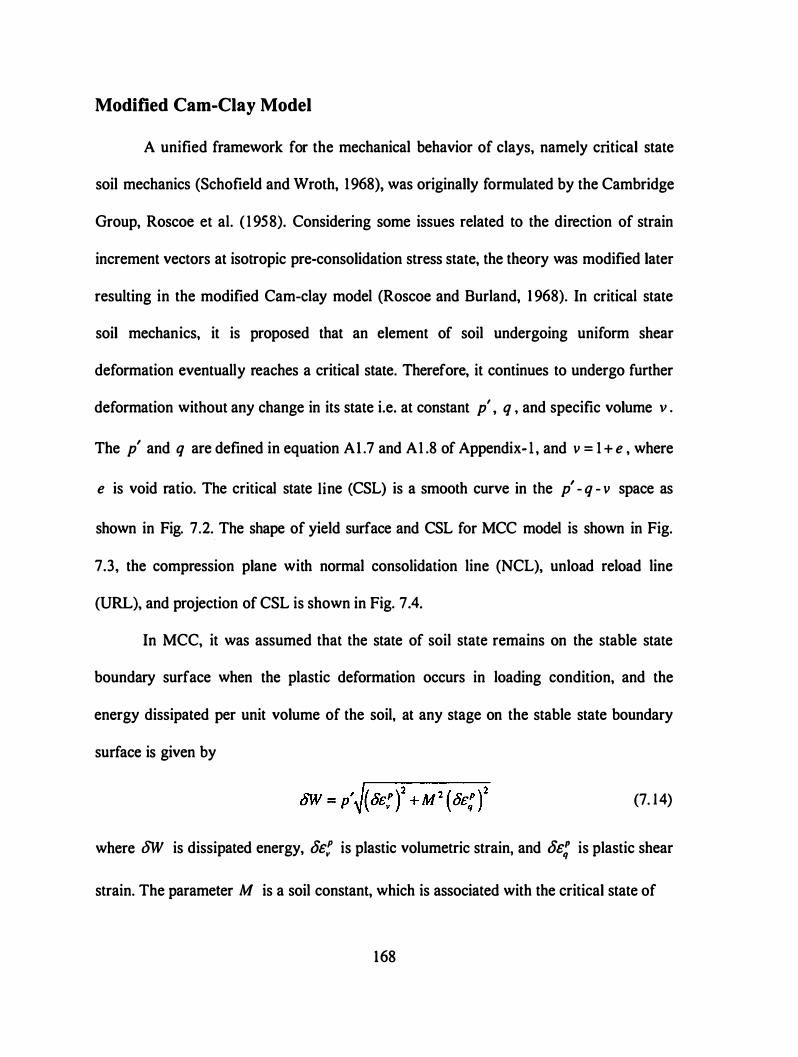
Modified Cam-Clay Model
A unified framework for the mechanical behavior of clays, namely critical state
soil mechanics (Schofield and Wroth, 1968), was originally formulated by the Cambridge
Group, Roscoe et al. ( 1 958). Considering some issues related to the direction of strain
increment vectors at isotropic pre-consolidation stress state, the theory was modified later
resulting in the modified Cam-clay model (Roscoe and Burland, 1 968). In critical state
soil mechanics, it is proposed that an element of soil undergoing uniform shear
deformation eventually reaches a critical state. Therefore, it continues to undergo further
deformation without any change in its state i.e. at constant p' , q , and specific volume v .
The p' and q are defined in equation A 1 . 7 and A 1 .8 of Appendix- ! , and v = 1 + e , where
e is void ratio. The critical state line (CSL) is a smooth curve in the p' - q - v space as
shown in Fig. 7 .2. The shape of yield surface and CSL for MCC model is shown in Fig.
7.3, the compression plane with normal consolidation line (NCL), unload reload line
(URL), and projection of CSL is shown in Fig. 7 .4.
In MCC, it was assumed that the state of soil state remains on the stable state
boundary surface when the plastic deformation occurs in loading condition, and the
energy dissipated per unit volume of the soil, at any stage on the stable state boundary
surface is given by
(7. 14)
where OW is dissipated energy, 8et is plastic volumetric strain, and 8e: is plastic shear
strain. The parameter M is a soil constant, which is associated with the critical state of
168
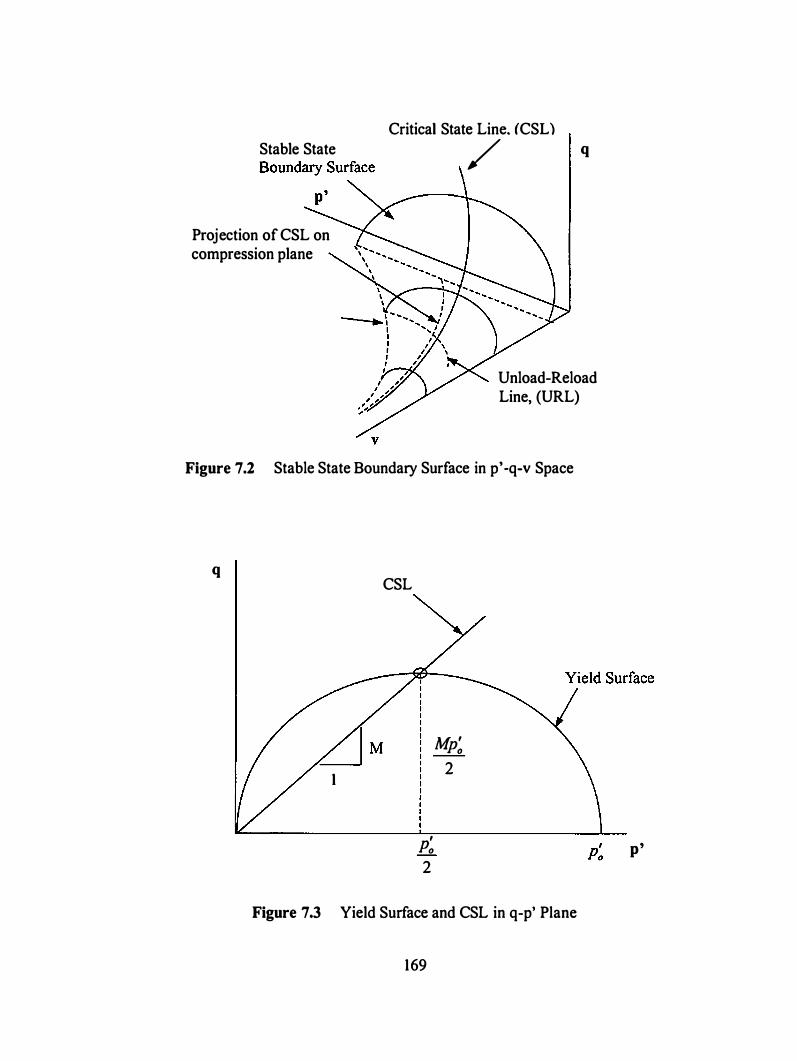
Stable State
Projection of CSL on compression plane
Critical State Line. (CSL)
/ q
Unload-Reload Line, (URL)
Figure 7.2 Stable State Boundary Surface in p'-q-v Space
q CSL
1
p; 2
Mp; 2
Figure 7.3 Yield Surface and CSL in q-p' Plane
169
p'
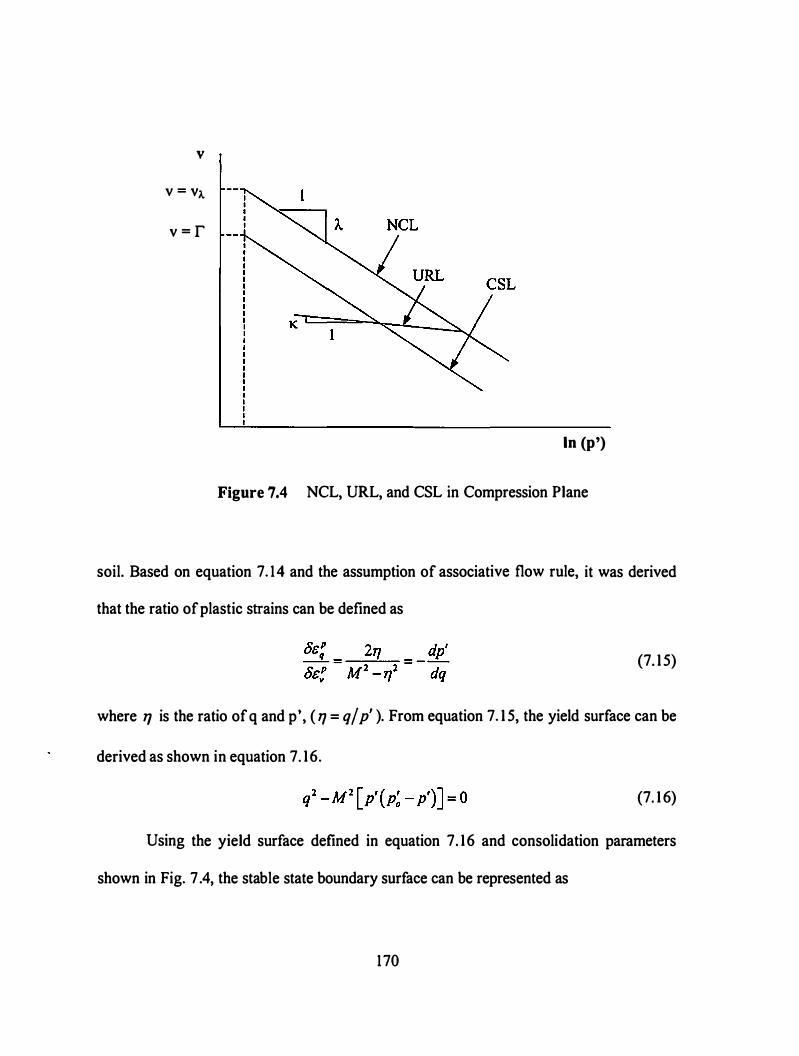
v
v = v;,.
v = r
In (p')
Figure 7.4 NCL, URL, and CSL in Compression Plane
soil. Based on equation 7. 14 and the assumption of associative flow rule, it was derived
that the ratio of plastic strains can be defined as
(7. 1 5)
where TJ is the ratio of q and p', ( TJ = q f p' ). From equation 7. 1 5, the yield surface can be
derived as shown in equation 7. 1 6.
(7. 1 6)
Using the yield surface defined in equation 7. 1 6 and consolidation parameters
shown in Fig. 7 .4, the stable state boundary surface can be represented as
170

ln [M2 + r/ ] = _
v:.:......t -_v -_A._In...:.(_
p...:..' ) M2 A-K (7. 1 7)
The CSL lies on the stable state boundary surface, thus substituting the equation of CSL
in compression plane, v = r - In (p ') , and 71 = M in equation 7. 1 7, the general equation
ofCSL is
(7. 1 8)
Modified Cam Clay Model Predictions for Kaolin Clay
The MCC model parameters A. =0. 16, K =0.02, and v ..t =2.8 were obtained from
the consolidation data shown in Fig. 5.2 of chapter 5. The stress path for true triaxial
compression test on NC clay was shown in Fig. 5.4, which gives the CSL parameter
M = 1 . 1 5. Lade ( 1979) found an empirical relationship between the plasticity index and
Poisson's ratio by comparing these values for various clays. From this relationship the
Poisson's ratio for kaolin clay (PI=0.32) was assumed to be v = 0.28 .
Using the formulation given in Appendix-2, a computer program was developed
to get the MCC model predictions for the true triaxial undrained tests performed in this
study. In this program, elastic and plastic strain increments are computed for a given
effective stress increment. An effective stress increment vector of small magnitude was
rotated along a constant b-value plane to satisfy the undrained condition within specified
limits; i.e. the total volumetric strain (sum of total elastic and plastic strain values) at any
stress state was within ±0.000 1% . Excess pore pressure generated was computed as the
difference between the total minor principal stress (constant during this test) and the
effective minor principal stress. Predictions are made for NC and OC clay using model
1 7 1
parameters appropriate for current Kaolin clay and compared with experimental data.
Results were numerically verified for triaxial compression tests by simulating the
problem in FLAC ( 1999) by the finite difference approach and in SAGE CRISP4.3a by
the finite element method.
The MCC model assumes isotropy and predicts the same shear stress-strain
relationship for all b-values; however, excess pore pressure predictions can vary for
different b-values due to change in total stress path, while the effective stress path
remains constant. Figure 7.5 shows a comparison between the MCC model predictions
(for b=O, 0.5, and 1 .0) and corresponding experimental data obtained from a series of
constant b-value true triaxial undrained tests performed on NC kaolin clay ( p; =275kPa).
A detailed analysis of the experimental data has been presented in chapter 2. In Fig. 7 .5,
it can be observed that in comparison with the experimental observations:
• MCC model predicts much stiffer response of the clay at small strain values (Eq<1 %);
consequently, it predicts much higher shear stress values at that strain level and shows
a poor approximation of the stress-strain relationship.
• MCC model predicts close values of shear strength for b=O test; however, it shows
much higher values of shear strength for b=0.5 and b= 1 .0 tests.
• MCC model exhibits much lower strain values at failure. In general, MCC model
shows higher excess pore pressure response (when compared to the experimental
data) during shearing. However, for b=O case, it gives a good prediction of excess
pore pressure at failure.
172
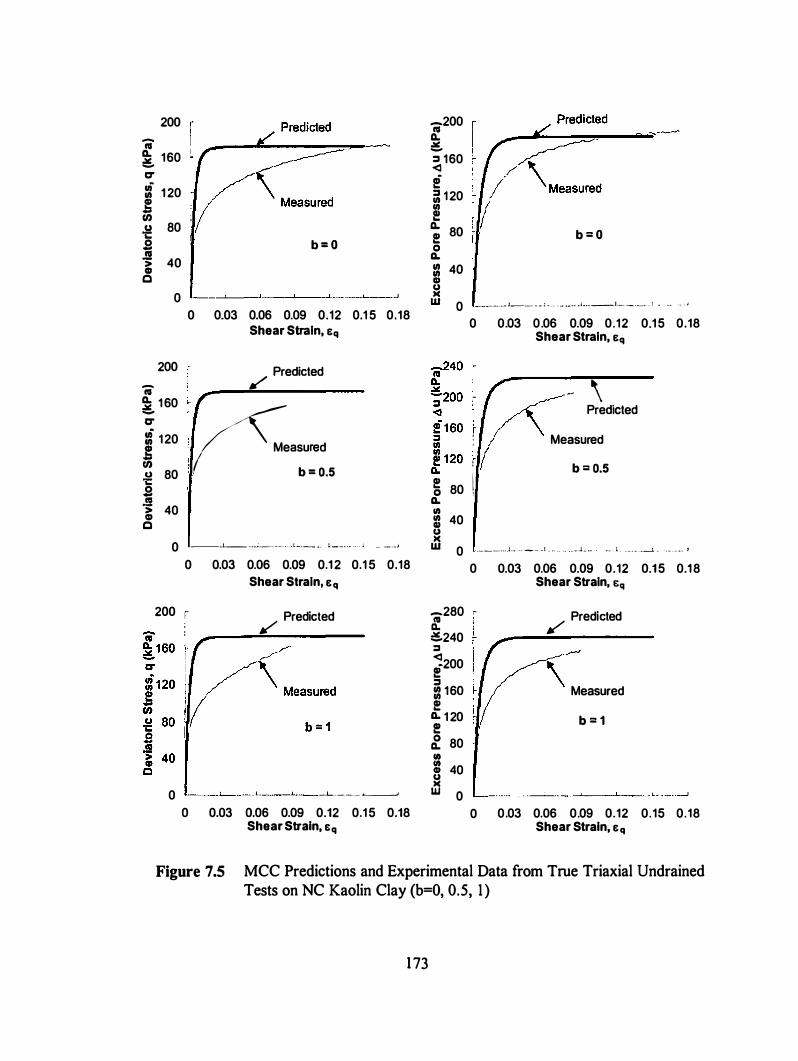
200 -IG � 1 60 -CT 0 Ill � U) � .2 IG > Cl) c
ii
1 20
80 :; b = O
40
0 .J
200
0 0.03 0.06 0.09 0.12 0.1 5 0.18 Shear Strain, &q
It("" Predicted
� 1 60
-; /(
= 1 20 ,g Measured
':! 80 ( "t: b = 0.5 .2 � 40 Cl) c
0 __ .J._ ···'·-- _ ___ , ____ __ 1----- .. l - ___ ;
0 0.03 0.06 0.09 0.1 2 0.1 5 0.18 Shear Strain, &q
200 r It("" Predicted
0 ---· ___ .__ __L_ __ ...______.
0 0.03 0.06 0.09 0.12 0.1 5 0.18 Shear Strain, &q
-200 IG D. .:tt. -:s 1 60 <3 e iil 1 20 � D. 80 ! b = O 0 D. :: 40 Cl) � w 0 ------ '-- - - ' · - -- ·-·· ·'·---'-- - -- - ' . ... __ _ ;
0 0.03 0.06 0.09 0.12 0.1 5 0.18 Shear Strain, &q
- - \ �r- Predicted
: Measured '
1: b = 0.5 ! 0 80 ' D. Ill = 40 u >< w 0 ··--� ··· L . . . , __ _ ! _ � · _ __ J__ - � . t . --·------1. - - - - - - · '
0 0.03 0.06 0.09 0.12 0.1 5 0.1 8 Shear Strain, &q
-280 -IG It("" Predicted D. �240 :s
�200 ! :s :: 1 60 !
D.. 1 20 e � 80 Ill = 40 � w 0
0
\ Measured
b = 1
0.03 0.06 0.09 0.12 0.15 0.18 Shear Strain, &q
Figure 7.5 MCC Predictions and Experimental Data from True Triaxial Undrained Tests on NC Kaolin Clay (b=O, 0.5, 1 )
1 73

In Fig. 7.6 and 7.7, the MCC model predictions are compared with the
corresponding experimental data obtained from a series of true triaxial undrained
compression tests (b=O) performed on OC kaolin clay at OCR= 1 .5, 2, 5, and 10. A
detailed analysis of experimental data has been presented in chapter 5. The shear stress
strain relationship and excess pore pressure behavior are shown in Fig. 7.6, and the stress
paths are presented in Fig. 7.7. It can be observed that in comparison with the
experimental observations:
• MCC model gives a good prediction of initial shear stiffness (elastic behavior) of clay
at each OCR value; however, it predicts much higher shear stresses at small strain
values.
• The range of linear elasticity in stress space (the size of initial yield surface) assumed
in MCC model appears to be much larger than the range, which can be acceptable for
the highly non-linear stress-strain relationship obtained from experimental data.
Experimental effective stress paths (in Fig. 7.7) show that the assumption of linear
elasticity, which requires p' to be constant according to cam clay elasticity, is
reasonable only for a small region in stress space. In chapter 5, a possible shape of
this elastic range was described to have a tear drop shape with its axis along the
hydrostatic line (See Fig. 5.4).
• MCC model gives a reasonable prediction of shear strength variation with OCR
values. However, it predicts much lower strain values corresponding to failure
condition.
1 74
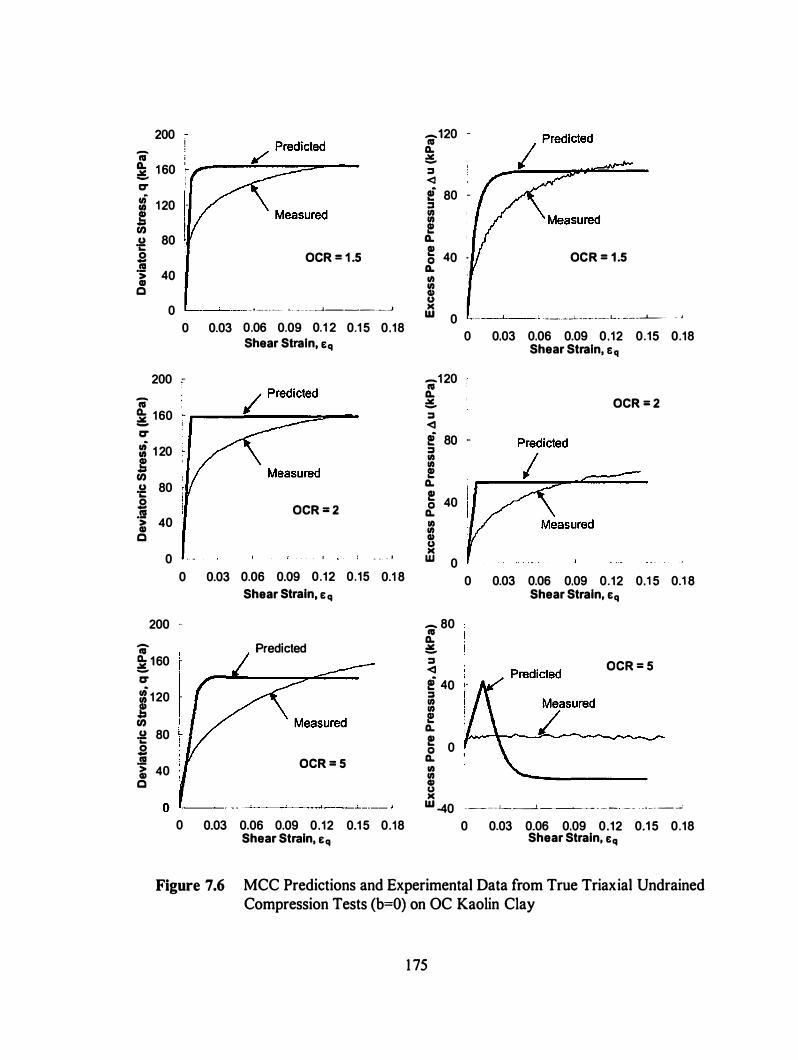
200 ii a. 1 60 � -CT uf 1 20 Cl)
� U) .g 80 .2 .!'! 40 > Gl c
0
200
ii � 1 60 CT :t 1 20 � U) .g 80 .2 .!! > 40 Ill c
0
200 -til Q. 160 � 0' :t 1 20 g U) .g 80 .2
0
;-
-
-
0
-
0.03
0.03
OCR = 1 .5
� · - - - ---- ..._ ______ __.J,_�-�-_J
0.06 0.09 0.1 2 Shear Strain, Bq
OCR = 2
l
0.06 0.09 0.12 Shear Strain, B q
Predicted
- �
0.1 5 0.18
l - - - - '
0.15 0.1 8
.!'! OCR = 5 ii 40 c
0 --· -'--' _ ___._ _ _.. _ __,
0 0.03 0.06 0.09 0.12 0.1 5 0.18 Shear Strain, Bq
-120 til a. � ::s <l PI 8o -::s Cl) Cl) ! a. � 40 · OCR = 1.5 a. Cl) 5 )( w 0 , --·---'-----�L., ___ ...i..--. J
ii1 20 a.
0 0.03 0.06 0.09 0.12 0.15 0.18 Shear Strain, Bq
� OCR = 2 ::s <I ! 80 -::s Ill Ill ! a. � 40 a. Ill = � 0
- 80 til a. � ::s <I ! 40 ::s Cl) Cl) ! a. � 0 a. Ill Cl) B )(
0 0.03 0.06 0.09 0.12 0.1 5 0.1 8 Shear Strain, Bq
OCR = 5
w -40 - - - -'- �---�- - - - - - . . · -- - ""
0 0.03 0.06 0.09 0.12 0.1 5 0.18 Shear Strain, Bq
Figure 7.6 MCC Predictions and Experimental Data from True Triaxial Undrained Compression Tests (b==O) on OC Kaolin Clay
1 75
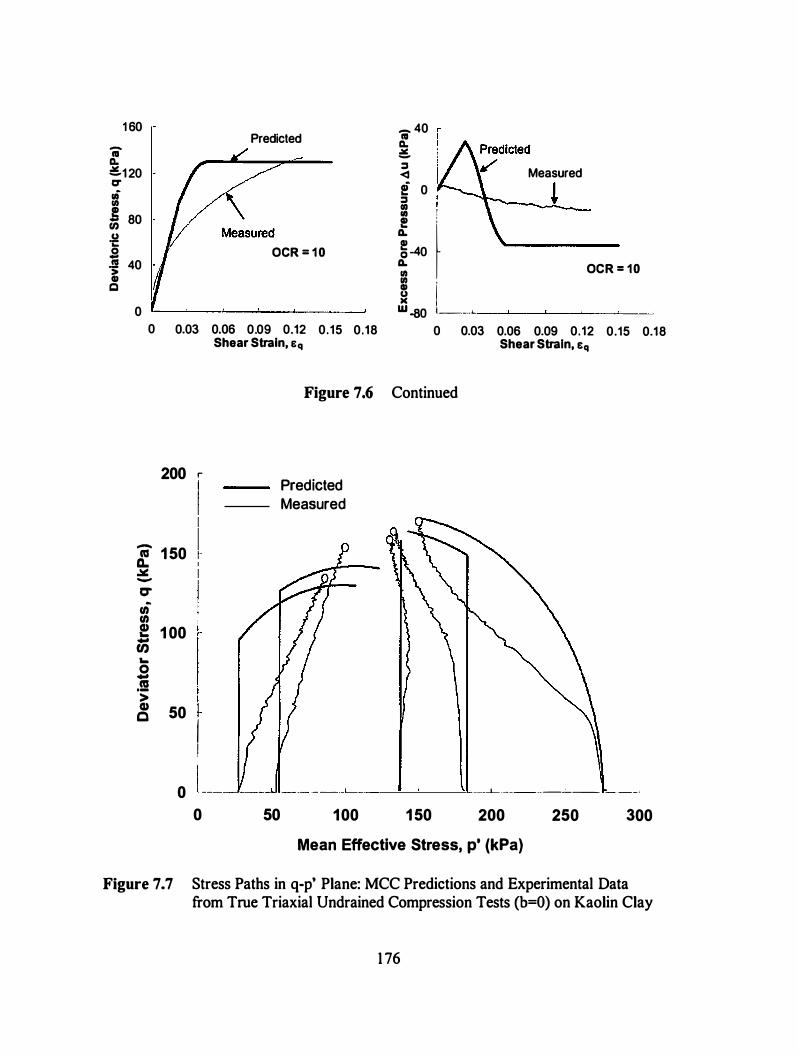
1 60 - 40 Predicted co
- a. co � a. :I �1 20 <I Measured CT i 0 � rA :I I II) II) ! 80 II) f U) e .g a.
.s OCR = 1 0 � -40 .!! 40 a. OCR = 10 > II) G) II) Q G) i u »<
0 w -ao [ ____ ....
0 0.03 0.06 0.09 0.12 0.15 0.18 0 0.03 0.06 0.09 0.12 0.15 0.18 Shear Strain, Eq Shear Strain, &q
Figure 7.6 Continued
200 r Predicted Measured
-1 50 ca -
Q. � -
0" .
U)
U) ! 1 00 I r -U) .... 0 -.!! � > Cl) 50 Q I I
0 -----'-----------'---- -·--!
0 50 100 1 50 200 250 300
Mean Effective Stress, p' (kPa)
Figure 7.7 Stress Paths in q-p' Plane: MCC Predictions and Experimental Data from True Triaxial Undrained Compression Tests (b=O) on Kaolin Clay
1 76
• In general, MCC model shows much higher excess pore pressure evolution during
shearing. However, for lightly overconsolidated clay (OCR= 1 .5 and 2), it gives a
good prediction of excess pore pressure at failure. For highly overconsolidated clay,
the model predicts much lower pore pressure response as the stress state reaches
failure condition.
• MCC model predicts elastic-perfectly plastic behavior for the test performed at
OCR=2; however, the experimental data shows initiation of plastic deformation at
much lower shear stress level.
Critical State Concept and Failure Criteria
Critical state concept is based on an assumption of unique critical state for a
particular type of soil, and this is not supposed to change with the stress state. The yield
surface in MCC model is a function of critical state parameter M and pre-consolidation
pressure p; . A constant M-value gives a circular yield surface in deviatoric plane, and
because of the associative flow rule, the plastic potential surface has the same shape as
yield surface. Based on experimental observations in the studies performed later by many
researchers, Kirby and Wroth (1 977) defined M-parameter to be dependent on the
intermediate principal stress, and reported that the M-value reaches its maximum for
triaxial compression (b=O) and minimum for extension (b= I ). In this case, the yield
surface remains circular in deviatoric plane but its size changes with the b-value. In that
discussion they proposed to determine the M-value based on a constant value of friction
177
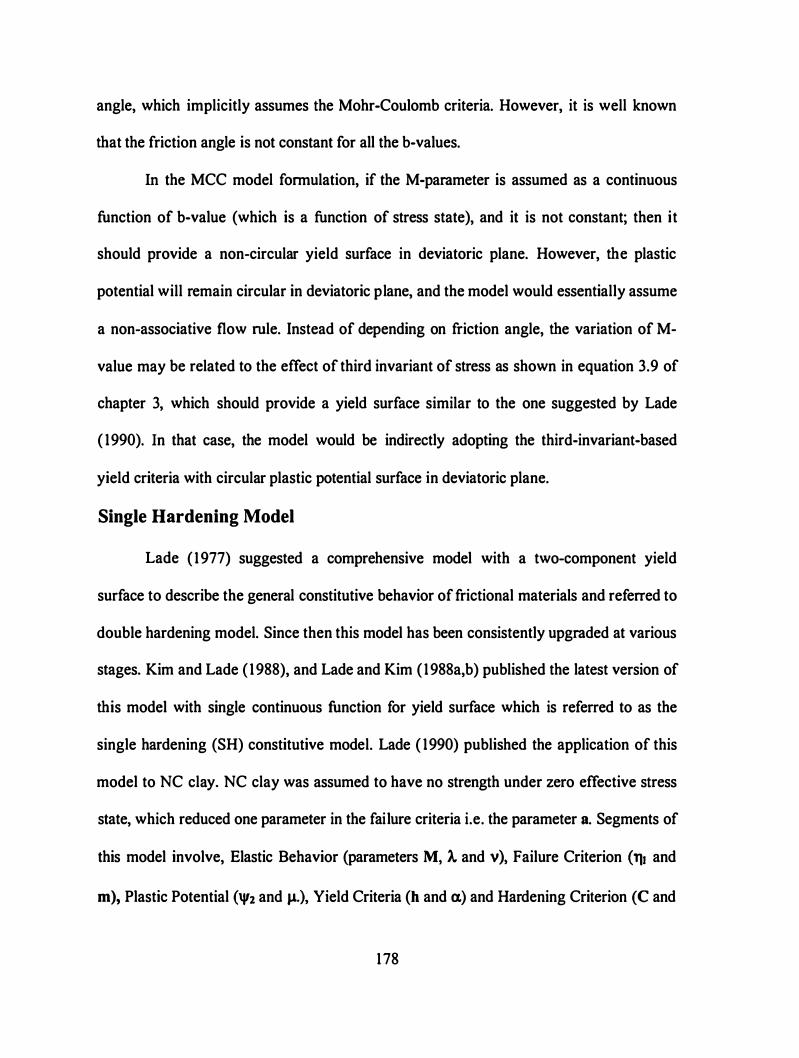
angle, which implicitly assumes the Mohr-Coulomb criteria. However, it is well known
that the friction angle is not constant for all the b-values.
In the MCC model formulation, if the M-parameter is assumed as a continuous
function of b-value (which is a function of stress state), and it is not constant; then it
should provide a non-circular yield surface in deviatoric plane. However, the plastic
potential will remain circular in deviatoric plane, and the model would essentially assume
a non-associative flow rule. Instead of depending on friction angle, the variation of M
value may be related to the effect of third invariant of stress as shown in equation 3.9 of
chapter 3, which should provide a yield surface similar to the one suggested by Lade
( 1990). In that case, the model would be indirectly adopting the third-invariant-based
yield criteria with circular plastic potential surface in deviatoric plane.
Single Hardening Model
Lade ( 1977) suggested a comprehensive model with a two-component yield
surface to describe the general constitutive behavior of frictional materials and referred to
double hardening model. Since then this model has been consistently upgraded at various
stages. Kim and Lade ( 1988), and Lade and Kim ( 1988a,b) published the latest version of
this model with single continuous function for yield surface which is referred to as the
single hardening (SH) constitutive model. Lade ( 1990) published the application of this
model to NC clay. NC clay was assumed to have no strength under zero effective stress
state, which reduced one parameter in the failure criteria i.e. the parameter a. Segments of
this model involve, Elastic Behavior (parameters M, ).. and v), Failure Criterion (111 and
m), Plastic Potential ('l':z and J.L.), Yield Criteria (h and a.) and Hardening Criterion (C and
178
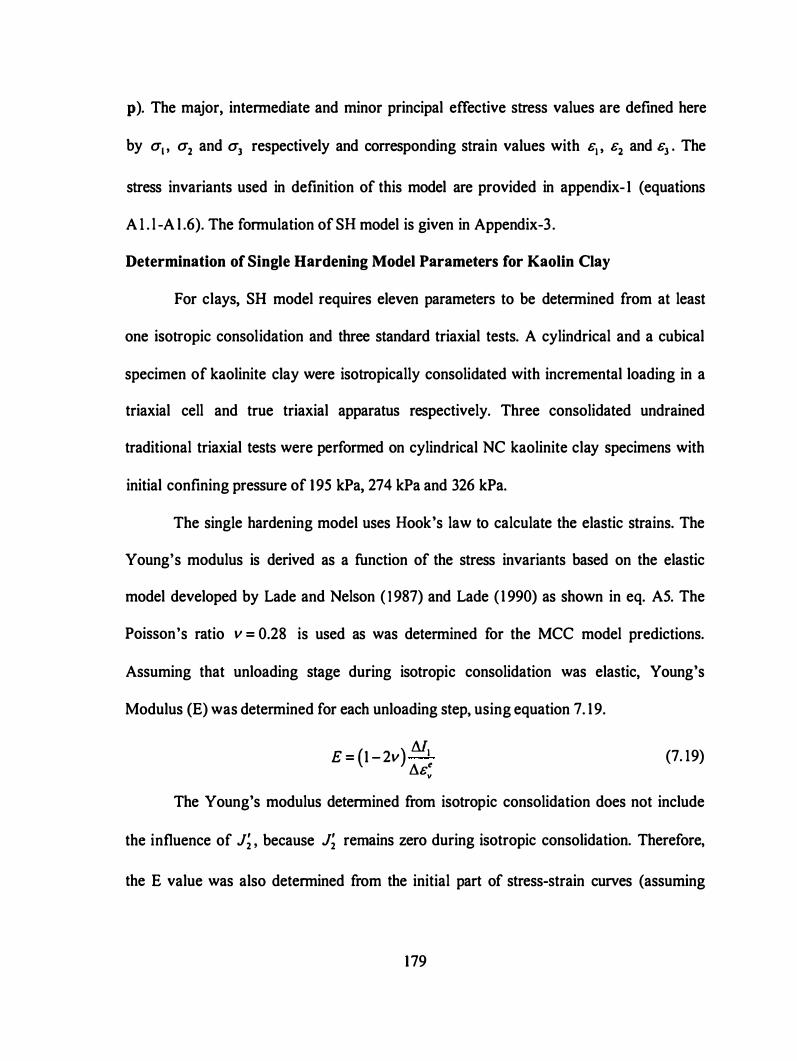
p ). The major, intermediate and minor principal effective stress values are defined here
by a1 , a2 and a3 respectively and corresponding strain values with &1 , &2 and &3 • The
stress invariants used in definition of this model are provided in appendix- I (equations
A l . l -A l .6). The formulation ofSH model is given in Appendix-3 .
Determination of Single Hardening Model Parameters for Kaolin Clay
For clays, SH model requires eleven parameters to be determined from at least
one isotropic consolidation and three standard triaxial tests. A cylindrical and a cubical
specimen of kaolinite clay were isotropically consolidated with incremental loading in a
triaxial cell and true triaxial apparatus respectively. Three consolidated undrained
traditional triaxial tests were performed on cylindrical NC kaolinite clay specimens with
initial confining pressure of 195 kPa, 274 kPa and 326 kPa.
The single hardening model uses Hook's law to calculate the elastic strains. The
Young's modulus is derived as a function of the stress invariants based on the elastic
model developed by Lade and Nelson ( 1 987) and Lade ( 1 990) as shown in eq. AS. The
Poisson's ratio v = 0.28 is used as was determined for the MCC model predictions.
Assuming that unloading stage during isotropic consolidation was elastic, Young's
Modulus (E) was determined for each unloading step, using equation 7. 1 9.
E = (1 - 2v) M1 ll.&e
v
(7. 19)
The Young's modulus determined from isotropic consolidation does not include
the influence of J� , because J� remains zero during isotropic consolidation. Therefore,
the E value was also determined from the initial part of stress-strain curves (assuming
179

elastic deformation within .6.e1 = 0.05 % , based on visual observation of linearity in the
stress-strain curve) obtained from three triaxial compression tests, using equation 7.20.
( b.cr1 - 2v . .6.cr3 ) £ = ...:....._-=----� .6.et (7.20)
Values of E/Pa are plotted against (11 /Pa )2 + R.J '2/p; m Fig. 7.8, proving the
parameter M = 26 and A. = 0.60 . Here, /1 and J '2 were computed as their average
values for the corresponding increments.
Failure locations in the three traditional triaxial tests were defined at peak
deviatoric stress. The values of two non-dimensional terms p) 11 and {I:/ /3 - 27) at
failure are plotted in Fig 7.9, which is supposed to give a linear relationship in log-log
space. However, from the test data they come out to be so scattered that it is difficult to
have confidence in a single regression line. Therefore, in this plot the failure points from
undrained as well as drained true triaxial tests (for various b-values) on cubical
specimens and hollow cylinder axial torsional tests are also included. The best judgment
for a linear relationship in this log-log plot provides the failure surface parameters,
7]1 = 50 , and m = 0.86 .
Lade's model is based on a non-associative flow rule. Therefore, in this model the
plastic potential function (gp, equation A3.3 in Appendix-3) is different from the yield
criterion (fp, equation A3.5). For triaxial compression test, the evolution of plastic strains
with the chosen plastic potential surface turns out to provide the relationship 7.2 1 , which
can be used to determine the parameters Ji and rp 2 •
(7.2 1 )
1 80
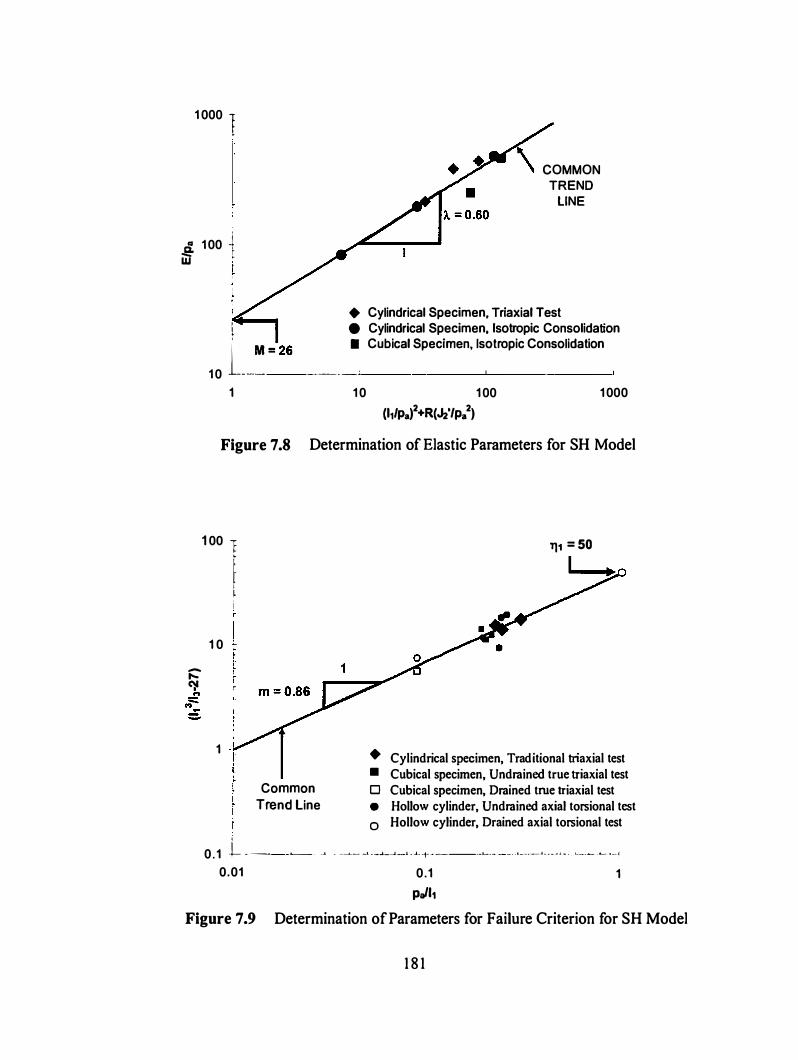
1 000 1 ..
COMMON TREND
LINE
& 1 00 -� - I w '
-..... � ...
�
+ Cylindrical Specimen, Triaxial Test
l e Cylindrical Specimen, Isotropic Consolidation
1 0 L_� = 26 ---�" Cubical Specimen, Isotropic Consolidation
1 1 0 1 00 1 000 (111Pa)2+R(�'/pa 2)
Figure 7.8 Determination of Elastic Parameters for SH Model
1 00 1
f I f i
1 0 1 � r
1
Common Trend Line
1'11 = 50 I
+ Cylindrical specimen, Traditional triaxial test • Cubical specimen, Undrained true triaxial test
0 Cubical specimen, Drained true triaxial test
• Hollow cylinder, Undrained axial torsional test
0 Hollow cylinder, Drained axial torsional test
0 _ 1 -� ----� - .-1 - __ __.___ _ _ , - -.L-_J_-l • ...l- -t- - ----L--- --- '---�.!- . . - .. � - - L._ _ _._ _ ._____.�·
0.01 0 .1 pJh
1
Figure 7.9 Determination of Parameters for Failure Criterion for SH Model
1 8 1
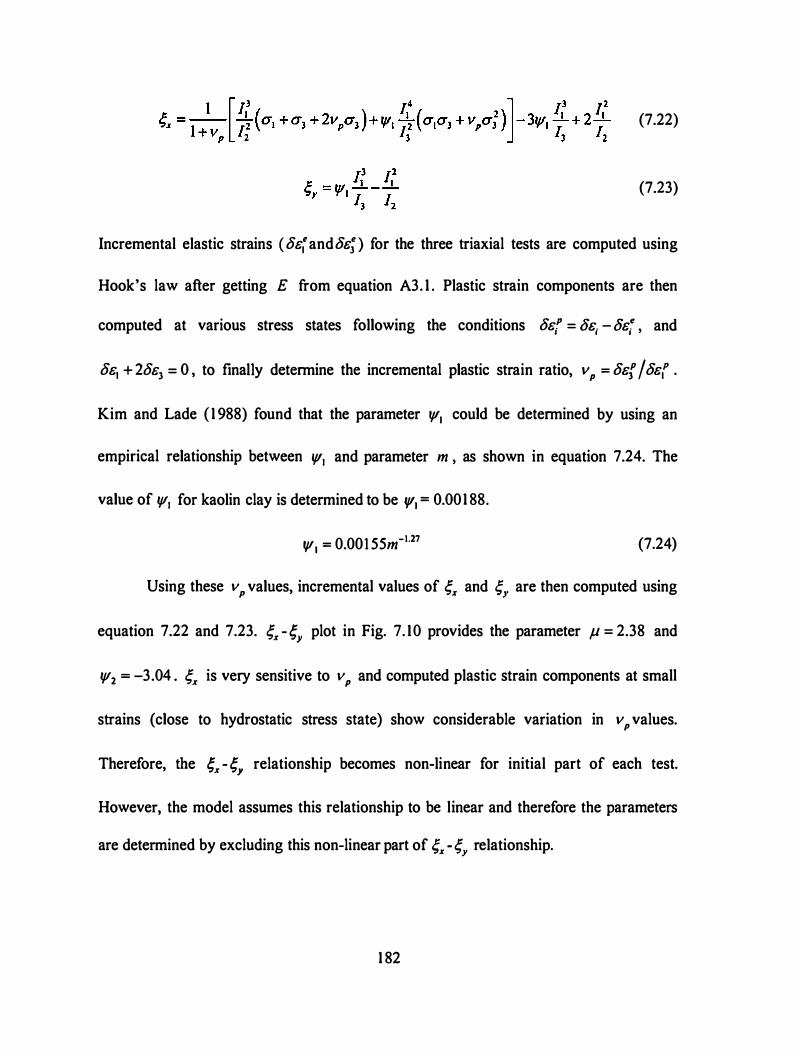
(7.22)
(7.23)
Incremental elastic strains ( oe� and oe; ) for the three triaxial tests are computed using
Hook's law after getting E from equation A3. 1 . Plastic strain components are then
computed at various stress states following the conditions oef' = OE; -oet ' and
oe, + 2oe3 = o , to finany determine the incremental plastic strain ratio, v, = oef 1 oer .
Kim and Lade ( 1 988) found that the parameter lf/1 could be determined by using an
empirical relationship between lf/1 and parameter m , as shown in equation 7.24. The
value of rp1 for kaolin clay is determined to be lf/1 = 0.001 88.
lf/1 = 0.001 55m-J.27 (7.24)
Using these v P values, incremental values of ,;x and ,;,. are then computed using
equation 7.22 and 7.23. ,;x -�y plot in Fig. 7. 10 provides the parameter ,u = 2.38 and
rp2 = -3.04 . ,;x is very sensitive to v, and computed plastic strain components at small
strains (close to hydrostatic stress state) show considerable variation in v, values.
Therefore, the �x -�Y relationship becomes non-linear for initial part of each test.
However, the model assumes this relationship to be linear and therefore the parameters
are determined by excluding this non-linear part of ,;x - ,;,. relationship.
1 82
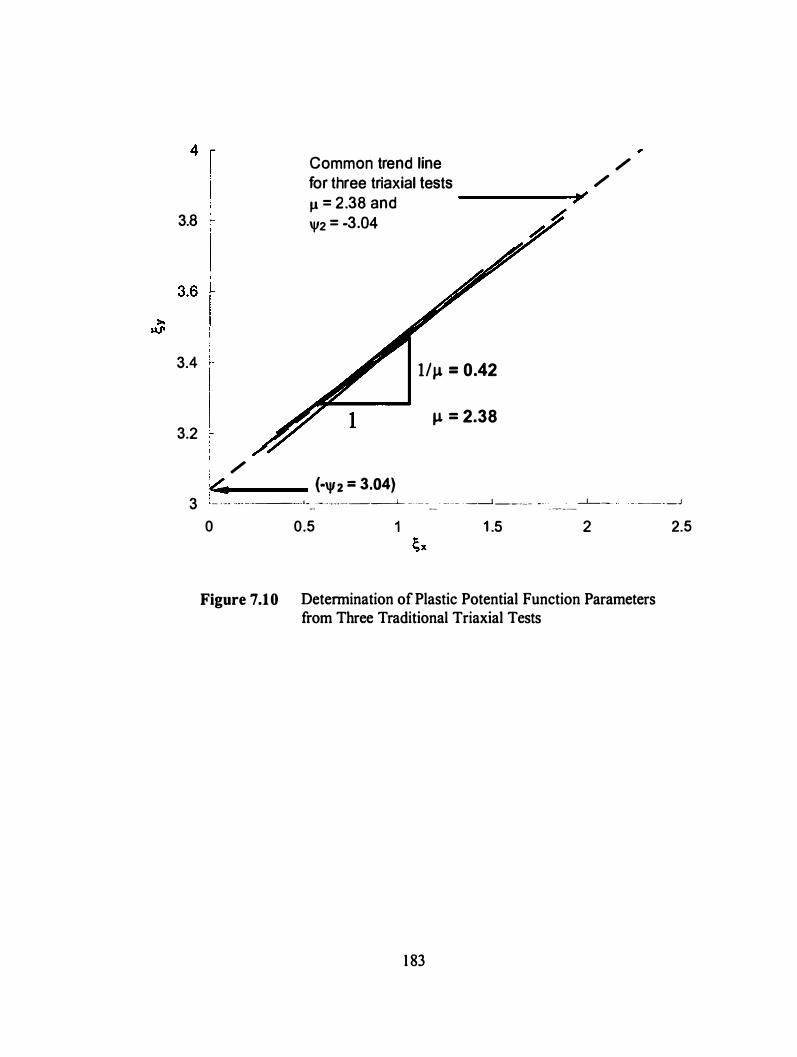
3.8 �
3.4
3.2 , /
Common trend line for three triaxial tests ll = 2.38 and ------Y \j/2 = -3.04
1/J.L = 0.42
JL = 2.38
/ /
.<�·---- (·\j/2 = 3.04) 3 [ _ _ __ ·-· - -- - •----- --------� -- - -- - - -- - -__J _____ - - -- --�_!_ __ -
_ _ _ _ _ .J
0 0.5 1 1 .5 2
Figure 7.10 Determination of Plastic Potential Function Parameters from Three Traditional Triaxial Tests
1 83
2.5
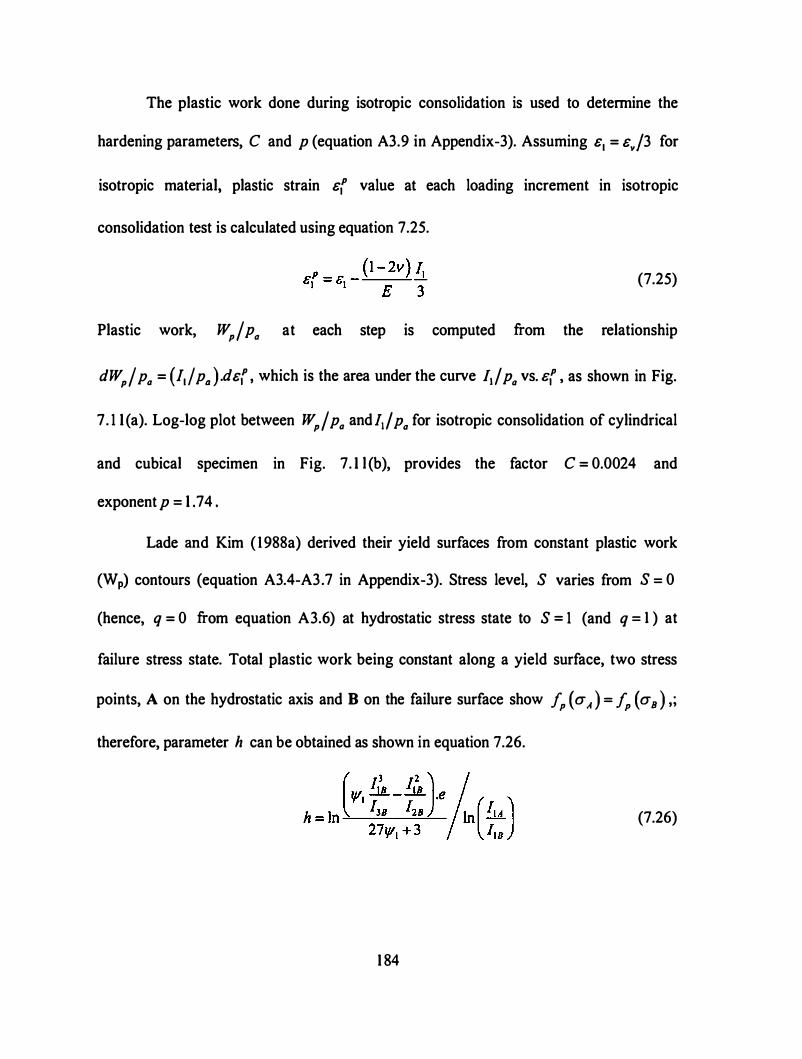
The plastic work done during isotropic consolidation is used to detennine the
hardening parameters, C and p (equation A3.9 in Appendix-3). Assuming &1 = &.,/3 for
isotropic material, plastic strain &t value at each loading increment in isotropic
consolidation test is calculated using equation 7.25.
(7.25)
Plastic work, W,/ Pa at each step is computed from the relationship
dW,/ Pa = (!1/ Pa ) .d&t , which is the area under the curve 11 / Pa vs. st , as shown in Fig.
7. 1 l (a). Log-log plot between W,/ Pa andl1/ Pa for isotropic consolidation of cylindrical
and cubical specimen in Fig. 7. l l (b), provides the factor C = 0.0024 and
exponent p = l . 74 .
Lade and Kim ( 1988a) derived their yield surfaces from constant plastic work
(Wp) contours (equation A3.4-A3.7 in Appendix-3). Stress level, S varies from S = 0
(hence, q = 0 from equation A3.6) at hydrostatic stress state to S = 1 (and q = 1 ) at
failure stress state. Total plastic work being constant along a yield surface, two stress
points, A on the hydrostatic axis and B on the failure surface show fP (a, ) = fP (a 8 ) ,; therefore, parameter h can be obtained as shown in equation 7 .26.
(7.26)
1 84
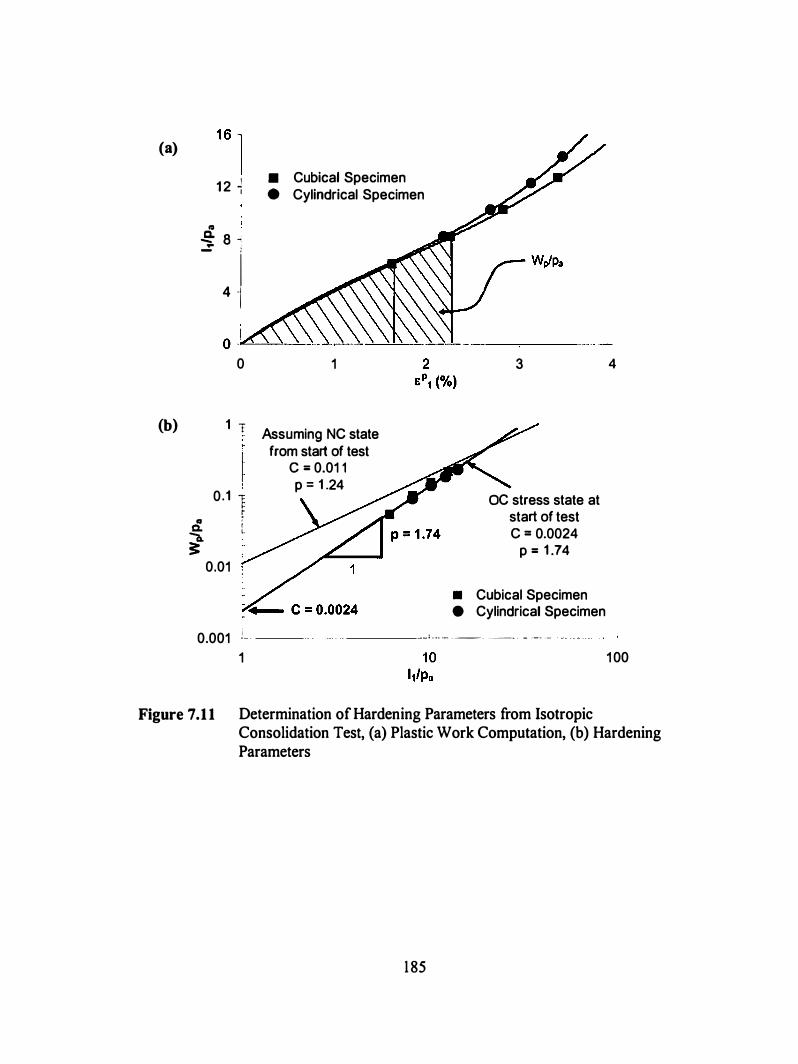
(a)
(b)
1 61 1 2 J I
Ia .e- 8 _;
� I 4 ·j
• Cubical Specimen e Cylindrical Specimen
0 -i"'-i.L.....>...��
� i
0
1 1 ..
f 0.1 1
0.01 � r L
0.001 i 1
1
Assuming NC state from start of test
c = 0.01 1 p = 1 .24
3
OC stress state at start of test c = 0.0024
p = 1 .74 • Cubical Specimen e Cylindrical Specimen
1 - -- - ----- · - ·-- --
4
1 00
Figure 7.1 1 Determination of Hardening Parameters from Isotropic Consolidation Test, (a) Plastic Work Computation, (b) Hardening Parameters
185
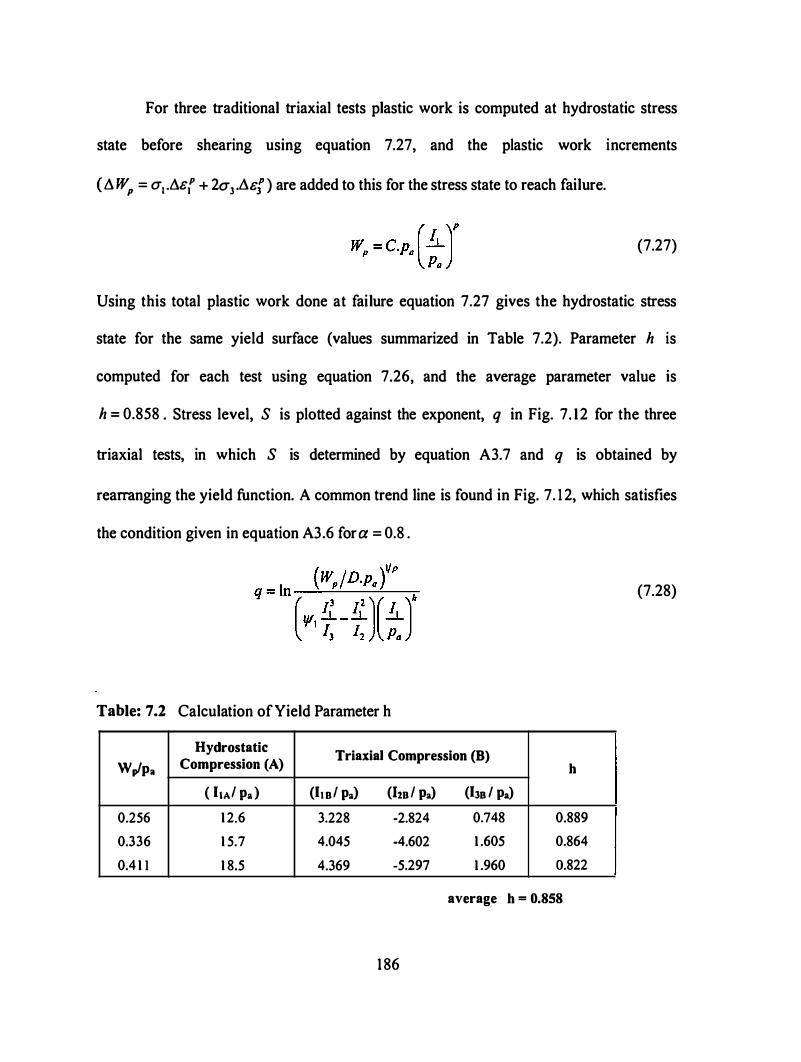
For three traditional triaxial tests plastic work is computed at hydrostatic stress
state before shearing using equation 7.27, and the plastic work increments
(.1WP = a1 • .1&{' + 2a3 • .1ef ) are added to this for the stress state to reach failure.
(7.27)
Using this total plastic work done at failure equation 7.27 gives the hydrostatic stress
state for the same yield surface (values summarized in Table 7.2). Parameter h is
computed for each test using equation 7.26, and the average parameter value ts
h = 0.858 . Stress level, S is plotted against the exponent, q in Fig. 7. 1 2 for the three
triaxial tests, in which S is determined by equation A3.7 and q is obtained by
rearranging the yield function. A common trend line is found in Fig. 7 . 1 2, which satisfies
the condition given in equation A3.6 fora = 0.8 .
Table: 7.2 Calculation ofYield Parameter h
Hydrostatic Triaxial Compression (B) Wp/pa Compression (A} h
( ItA/ Pa} (Ito/ Pa} (ho/ Pa) (IJo l Pa) 0.256 1 2.6 3.228 -2.824 0.748 0.889 0.336 1 5.7 4.045 -4.602 1 .605 0.864 0.4 1 1 1 8.5 4.369 -5.297 1 .960 0.822
average h = 0.858
1 86
(7.28)
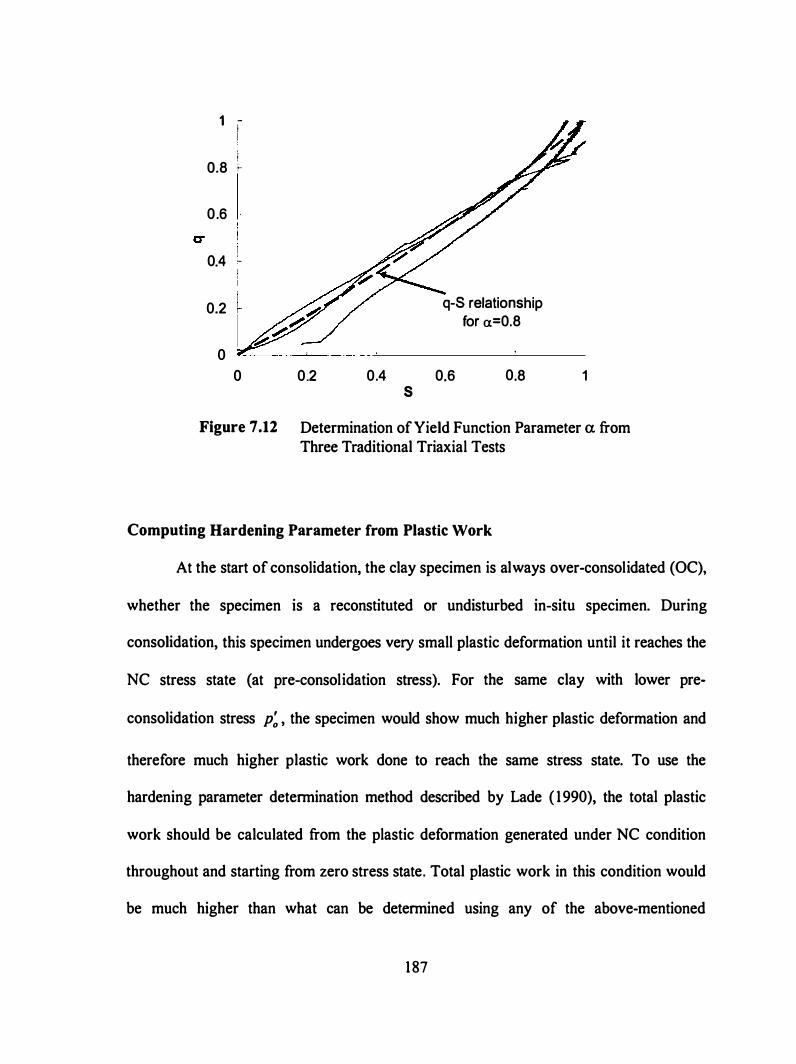
1 -I I i
0.8 t-
0.6
0.4 -
0.2
0 0 0.2 0.4
s
q-S relationship for a.=0.8
0.6 0.8 1
Figure 7.12 Determination of Yield Function Parameter a from Three Traditional Triaxial Tests
Computing Hardening Parameter from Plastic Work
At the start of consolidation, the clay specimen is always over-consolidated (OC),
whether the specimen is a reconstituted or undisturbed in-situ specimen. During
consolidation, this specimen undergoes very small plastic deformation until it reaches the
NC stress state (at pre-consolidation stress). For the same clay with lower pre-
consolidation stress p; , the specimen would show much higher plastic deformation and
therefore much higher plastic work done to reach the same stress state. To use the
hardening parameter determination method described by Lade ( 1990), the total plastic
work should be calculated from the plastic deformation generated under NC condition
throughout and starting from zero stress state. Total plastic work in this condition would
be much higher than what can be determined using any of the above-mentioned
1 87
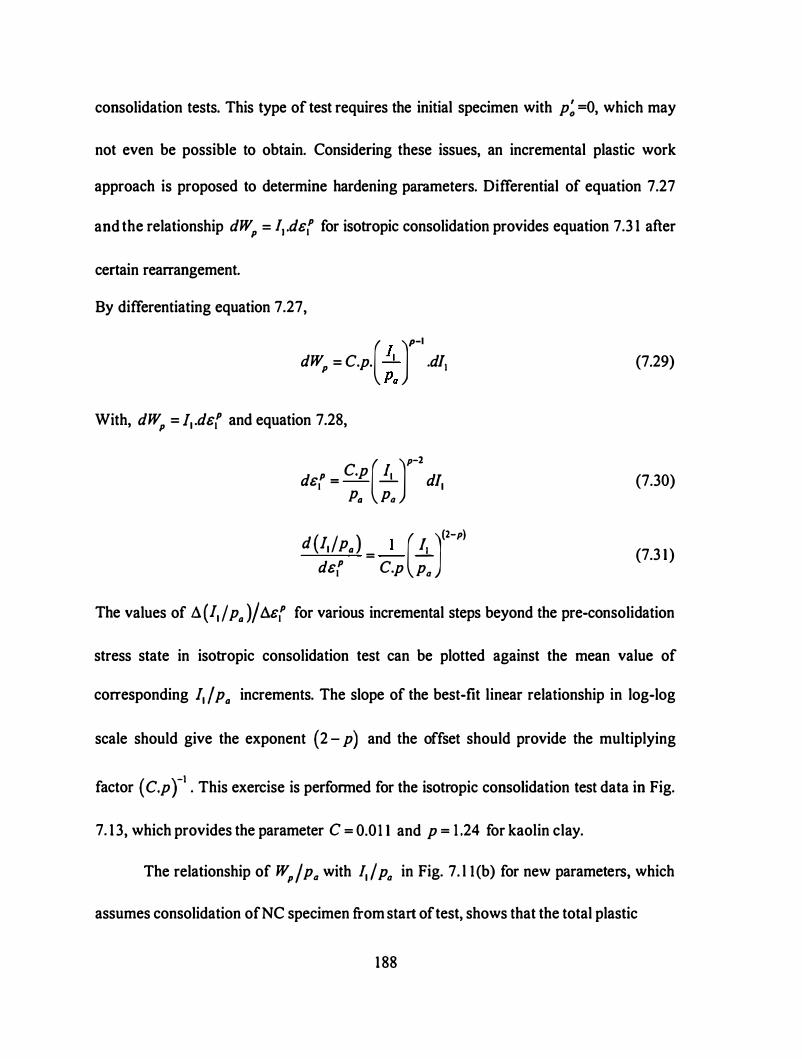
consolidation tests. This type of test requires the initial specimen with p; =0, which may
not even be possible to obtain. Considering these issues, an incremental plastic work
approach is proposed to determine hardening parameters. Differential of equation 7.27
and the relationship dW, = 11 .d&( for isotropic consolidation provides equation 7.3 1 after
certain rearrangement.
By differentiating equation 7.27,
(
)p-1 dW, = C.p. ;� .d/1
With, dW, = I1 .d&( and equation 7.28,
de( = C.p .!J.... d/1 (
)p-2
Pa Pa
( ) (
)(2-p) d I1 / Pa = _1_ .!J.... d&( C.p Pa
(7.29)
(7.30)
(7.3 1 )
The values of ll{I1 / Pa )/ !l&( for various incremental steps beyond the pre-consolidation
stress state in isotropic consolidation test can be plotted against the mean value of
corresponding I1 / Pa increments. The slope of the best-fit linear relationship in log-log
scale should give the exponent ( 2 - p) and the offset should provide the multiplying
factor ( C.p t . This exercise is performed for the isotropic consolidation test data in Fig.
7. 1 3, which provides the parameter C = 0.01 1 and p = 1 .24 for kaolin clay.
The relationship of W,/ Pa with 11 / Pa in Fig. 7. l l (b) for new parameters, which
assumes consolidation ofNC specimen from start of test, shows that the total plastic
1 88
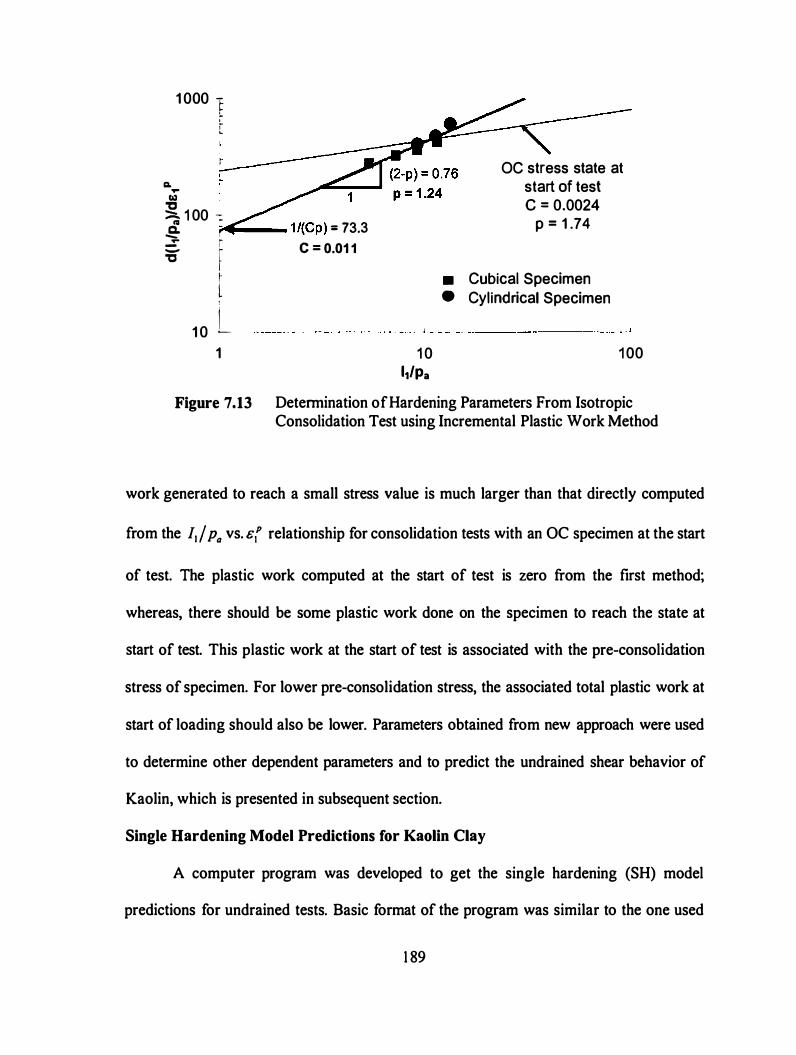
1 ooo E ' r � L
1:1. ....
OC stress state at start of test
CQ . � 1 00 � ,e. !1"11- .... -- 1/{Cp) = 73.3 .: r c = 0.01 1 :a �
c = 0.0024
p = 1 .74
t· • Cubical Specimen � • Cylindrical Specimen
1 o L ------ - - ---- -- -- ------1----- ----
1 1 0
I1/Pa 1 00
Figure 7.13 Determination of Hardening Parameters From Isotropic Consolidation Test using Incremental Plastic Work Method
work generated to reach a small stress value is much larger than that directly computed
from the /1 f Pa vs. &(' relationship for consolidation tests with an OC specimen at the start
of test. The plastic work computed at the start of test is zero from the first method;
whereas, there should be some plastic work done on the specimen to reach the state at
start of test. This plastic work at the start of test is associated with the pre-consolidation
stress of specimen. For lower pre-consolidation stress, the associated total plastic work at
start of loading should also be lower. Parameters obtained from new approach were used
to determine other dependent parameters and to predict the undrained shear behavior of
Kaolin, which is presented in subsequent section.
Single Hardening Model Predictions for Kaolin Clay
A computer program was developed to get the single hardening (SH) model
predictions for undrained tests. Basic format of the program was similar to the one used
1 89
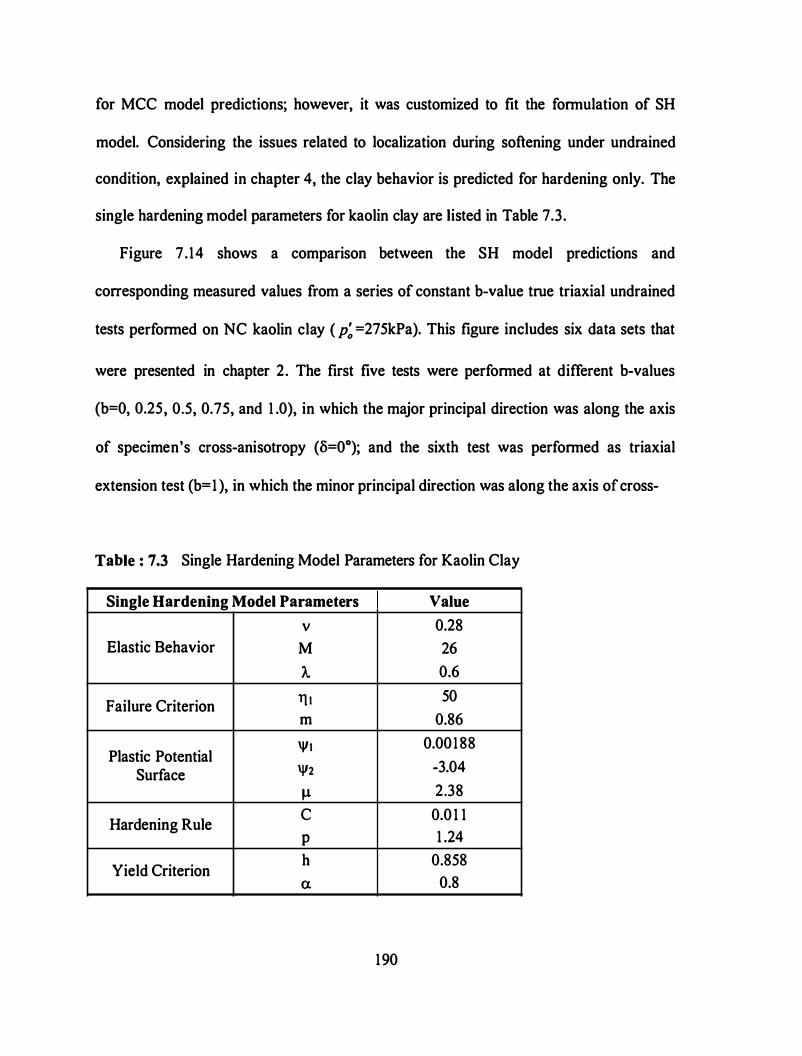
for MCC model predictions; however, it was customized to fit the formulation of SH
model. Considering the issues related to localization during softening under undrained
condition, explained in chapter 4, the clay behavior is predicted for hardening only. The
single hardening model parameters for kaolin clay are listed in Table 7.3.
Figure 7 . 14 shows a comparison between the SH model predictions and
corresponding measured values from a series of constant b-value true triaxial undrained
tests performed on NC kaolin clay ( p; =275kPa). This figure includes six data sets that
were presented in chapter 2. The first five tests were performed at different b-values
(b=O, 0.25, 0.5, 0. 75, and 1 .0), in which the major principal direction was along the axis
of specimen's cross-anisotropy (B=Oo); and the sixth test was performed as triaxial
extension test (b= 1 ), in which the minor principal direction was along the axis of cross-
Table : 7.3 Single Hardening Model Parameters for Kaolin Clay
Single Hardening Model Parameters Value
v 0.28 Elastic Behavior M 26
A. 0.6
Failure Criterion ll t 50 m 0.86 'Ill 0.00188
Plastic Potential -3.04 Surface '1'2
J..l 2.38
Hardening Rule c 0.0 1 1 p 1 .24
Yield Criterion h 0.858 a. 0.8
190
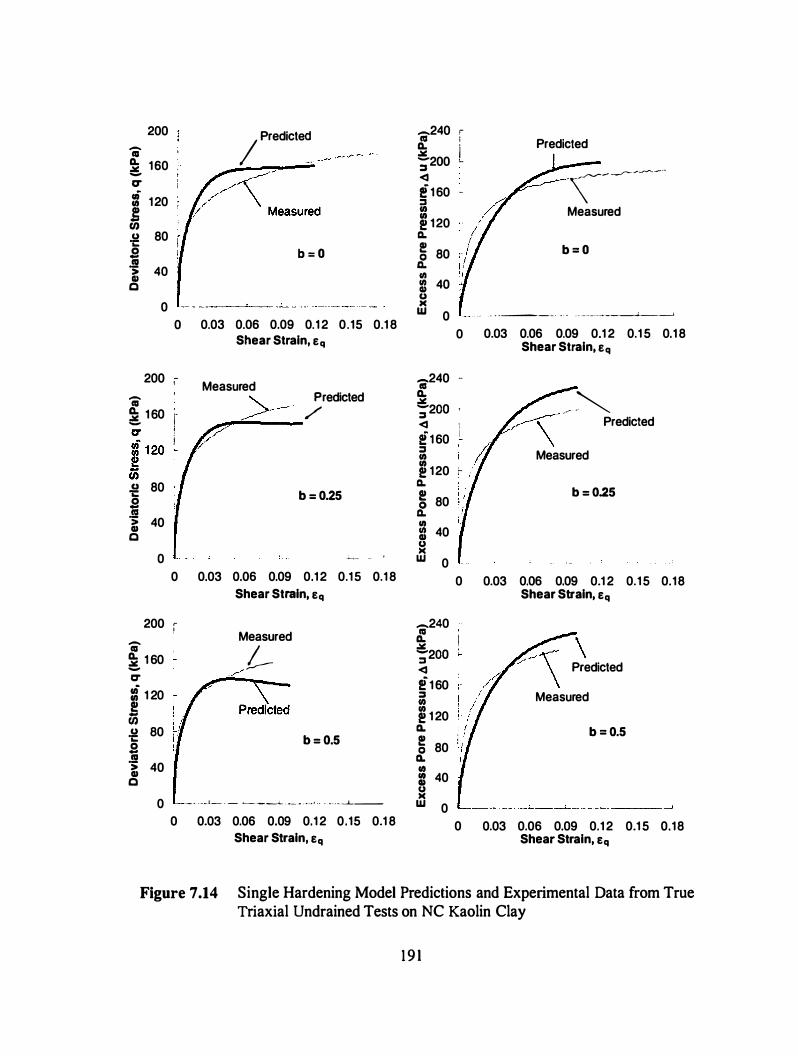
200 -ca � 1 60 -
0" fi 1 20 (/) g tJ) .g 80 s .m 40 > Ill 0
0 0
200 1 -ca
/ Predicte�.
b = O
0.03 0.06 0.09 0.1 2 0.15 0.1 8 Shear Strain, Eq
Measured
:t 1 6o 1 � ;redicted
-�----
.g 80 s as > 40 Ill 0
0
200 -ca � 1 60 -
0" = 1 20 !! .. tJ) .g 80 0 .. .m 40 > Ill 0
! j
0
r '
b : 0.25
-�- - !
0.03 0.06 0.09 0.1 2 0.1 5 0.1 8 Shear Strain, Eq
Measured
/ !--
b : 0.5
0 - · ···'- - � - �· · ·- · · · · · · .. . . . . ....1_ __
0 0.03 0.06 0.09 0.1 2 0.15 0.1 8 Shear Strain, Eq
-240 r as 1 � l ';200 <I ef 1 60 -:I (/) ! 1 20 11. � 80 11. (/) = 40 u )( w 0
0
-240 -ca 11. c2oo , :I <I 1 ! 1 60 :I (/) ! 1 20 ,_ 11. !! � 80
::: 40 Ill � 0
Predicted
-\-��-�-« Measured
b = O
. · ·---- -- . · � ------�-_._.)
0.03 0.06 0.09 0.1 2 0.1 5 0.1 8 Shear Strain, Eq
� -"'-�\ · Predicted yf
Measured
b : 0.25
0 0.03 0.06 0.09 0.1 2 0.1 5 0.1 8 Shear Strain, Eq
-240 ca a. I c2oo · :I Predicted <I f 1 60 d :I (/) ! 1 20 11. � 80 11. (/) : 40 � w 0
0
Measured
b = 0.5
0.03 0.06 0.09 0.1 2 0.1 5 0.1 8 Shear Strain, Eq
Figure 7.14 Single Hardening Model Predictions and Experimental Data from True Triaxial Undrained Tests on NC Kaolin Clay
1 9 1
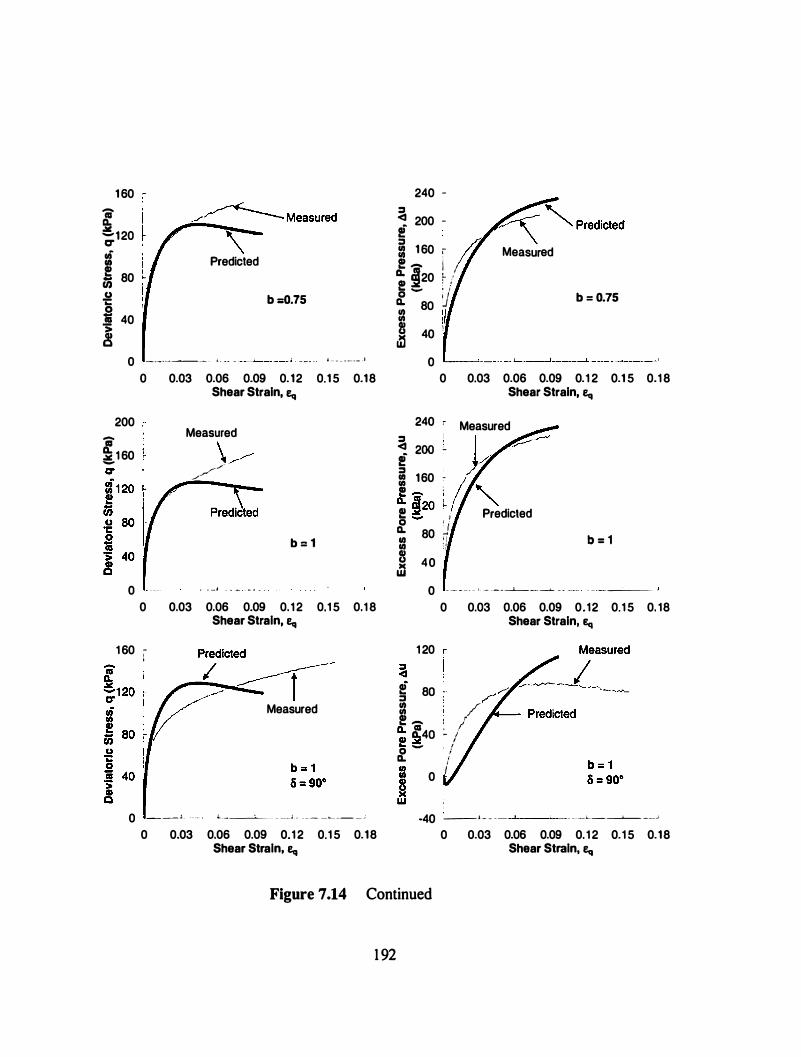
160 -ca 11. �120 c:r � IIi Ill e 80 -Cl)
Predicted
u 't: b :0.75 s 40 I
0 -------·· L .• • �'- --1 - - · · · ' -- - - · -�- -'
0 0.03 0.06 0.09 0. 12 0.15 0.18 Shear Strain, eq
200
'ii � 160
Measured
\___--
/"/ /
0 - . .. • - - - · - · - .
b = 1
0 0.03 0.06 0.09 0. 12 0.15 0.18
160 -i
Shear Strain, eq
Measured
0 --"· - ... . L------'----- -1. - - - - � -- - '
0 0.03 0.06 0.09 0.12 0.15 0.18 Shear Strain, eq
240 -
� 200 -PI . j3 160 !" ;J Measured e - 1 1 11. 120 r- / e _ ; ,-� � b = 0.75 ::
8o !I ! 40 !
0 0 0.03 0.06 0.09 0.1 2 0.1 5 0.18
Shear Strain, eq 240 r Measured
� 200 - ) PI A I 160 � I It :!20 L // " I! ! 1 Predicted
� ! I Ill 80 � Ill : 1
8 40 ' � b = 1
0 - - - -· - · - ---�-� - - -- - ---�--
120
PI 8o :I :: e .... r: cf4o
0 0.03 0.06 0.09 0.12 0.15 0. 18
r/ , I � I . ! I
Shear Strain, eq
//.
;::: � o Il. I 0 I
•40 --• - - - - ---L-� --�
0 0.03 0.06 0.09 0. 12 0.15 0.18 Shear Strain, eq
Figure 7.14 Continued
1 92
anisotropy (o=90°). In comparison with the experimental observations, the SH model
predictions exhibit following behavior of Kaolin clay.
• SH model gives a reasonable prediction of stress-strain relationship for most b
values; however, for triaxial compression (b=O) and extension (b= I , o=90°), it
predicts much higher shear stress values at strain levels ranging from Eq ::::i% to
Eq ::8%.
• In each case, the predicted stress-strain relationship shows a peak shear stress level,
after that the shear stress decreases as the stress state approaches its failure condition.
The peak becomes more prominent for higher b-values. However, the experimental
data shows brittle failure response of the clay (especially for b > 0.25), and the shear
stress values consistently increase until the stress state reaches its failure condition.
• SH model gives a reasonable prediction of shear strain values at failure; however, for
triaxial compression, and extension, it shows failure at much lower strain values.
• In all six cases, the predicted shear strength is lower than the experimentally
measured values, and the difference in strength values increases with increase in b
value.
• In all cases, predictions exhibit higher excess pore pressure response at failure. For
the extension test, the pore pressure response is not predicted well by this model.
• SH model does not account for the change in orientation of principal stress. It predicts
the same stress-strain behavior for the two b= I cases {o=0° and o=90°); however, the
experimental data shows significant influence of change in o-value.
193
The single hardening model for clays was described to be applicable only for
normally consolidated and lightly overconsolidated (OCR < 2.5) clays. Using SH model,
the shear strength of heavily overconsolidated clay is usually under-predicted, and most
of the stress-strain relationship is predicted to be purely elastic. In Fig. 7. 1 5 and 7. 1 6, the
SH model predictions are compared with the corresponding experimental data obtained
from a series of true triaxial undrained compression tests (b=O) performed on lightly OC
kaolin clay at OCR= l .S, 2. Shear stress-strain relationship and excess pore pressure
behavior are shown in Fig. 7 . 15, and the stress paths are presented in Fig. 7 . 1 6. In
comparison with the experimental observations, the SH model predictions exhibit
following behavior of Kaolin clay.
• The limit of linear elasticity is too high to be acceptable for the highly non-linear
stress-strain relationship obtained from experimental data. After the elastic zone, the
model predicts much softer response of clay, and finally at failure, the stress state
approximated the experimentally observed stress-strain relationship.
• For lightly OC clay, the predicted strength and strain values at failure are reasonable.
• SH model predicts much higher excess pore pressure response of lightly OC clay.
• Predicted effective stress-paths for undrained condition are significantly different at
each OCR value.
Conclusions
Soil is a particulate medium with a complex inelastic behavior. Accurate
theoretical solutions of boundary value problems in soil mechanics and soil structure
interaction problems, even in simple geometries, are extremely difficult or, in many
1 94

0
200
';-
0
OCR = 1 .5
0.03 0.06 0.09 0.12 0.1 5 0.18 Shear Strain, Eq
-120 r IV a. :s. :I <I e 8o .. :I ! :: I!! a.
a 40 a. u. u. CD � w 0 - � -
0
-1 20 -IV a.
OCR = 1 .5
-�---1-----' - - - j __ _ _ __;
0.03 0.06 0.09 0.12 0 .15 0.18 Shear Strain, Eq
� 160 :s. :I <I Predicted -
u "i: .s .!i > 411 c
80
40
0
OCR = 2
0 0.03 0.06 0.09 0.1 2 0.1 5 0.1 8 Shear Strain, Eq
e 8o :I :: I!! a.
a 40 a. Ul = u )( w 0
0
\
OCR = 2
- · ---· --- � - - ; -- - - - · - - - - - - - --·
0.03 0.06 0.09 0.1 2 0.1 5 0.1 8 Shear Strain, Eq
Figure 7.15 Single Hardening Model Predictions and Experimental Data from True Triaxial Undrained Compression Tests (b=O) on OC Kaolin Clay (OCR=l .5 and 2.0)
195
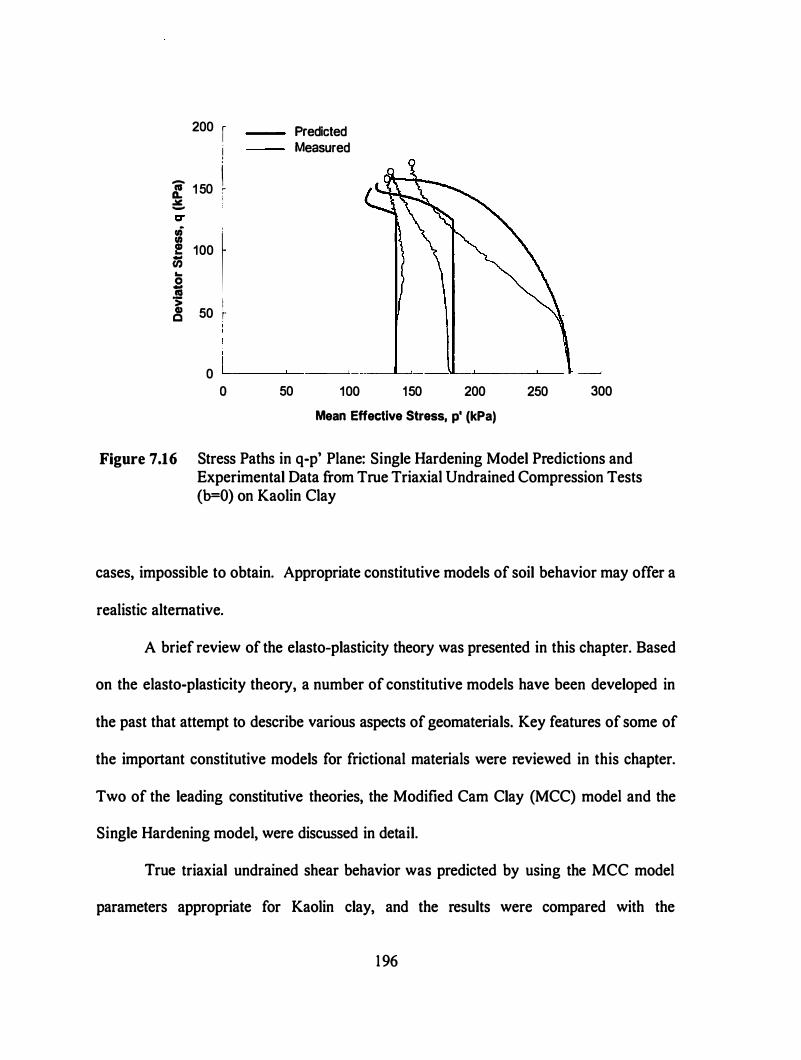
200 r !
'l 150 l � ' - '
f 100 � tiS ...
i 8 50 �
Predicted Measured
0 �----�----_J----��--��------L--
0 50 100 150 200 250
Mean Effective Stress, p' (kPa) 300
Figure 7.16 Stress Paths in q-p' Plane: Single Hardening Model Predictions and Experimental Data from True Triaxial Undrained Compression Tests (b=O) on Kaolin Clay
cases, impossible to obtain. Appropriate constitutive models of soil behavior may offer a
realistic alternative.
A brief review of the elasto-plasticity theory was presented in this chapter. Based
on the elasto-plasticity theory, a number of constitutive models have been developed in
the past that attempt to describe various aspects of geomaterials. Key features of some of
the important constitutive models for frictional materials were reviewed in this chapter.
Two of the leading constitutive theories, the Modified Cam Clay (MCC) model and the
Single Hardening model, were discussed in detail.
True triaxial undrained shear behavior was predicted by using the MCC model
parameters appropriate for Kaolin clay, and the results were compared with the
1 96
experimental data. It was shown that the basic assumptions taken during the development
of MCC model provide a fair estimate of normalized strength behavior; however, these
assumptions oversimplify the model, which leads to the inaccurate predictions of soil's
stress-strain relationship and pore pressure behavior.
The single hardening model was formulated in an effort to predict the generalized
soil behavior in three-dimensional stress space. This required a complex procedure for
the determination of its parameters. A detailed description of this procedure was
presented in this chapter while determining the parameters for kaolin clay. Using these
parameters, the undrained shear behavior of kaolin clay was predicted, and compared
with the experimental observations. In comparison with the MCC model, the single
hardening model was found to have a better potential to predict the normally consolidated
clay behavior. However, the strength behavior of clay was consistently under predicted
for all the anisotropic loading cases. Heavily overconsolidated clay behavior was not
considered during the development of single hardening model, and this study showed that
this model was unable to predict the experimental behavior of l ightly overconsolidated
clay behavior. In previous chapters, it was determined that the relative magnitudes of
principal stresses and their orientation with respect to the axis of cross anisotropy exhibit
their independent influence on the mechanical behavior of clay; however, in single
hardening model, the influence of anisotropy was considered only due to the change in
relative magnitude of principle stresses.
1 97
Chapter 8. A New Unified Elasto-Plastic Three-Dimensional
Constitutive Model for Cohesive Soil
Introduction
The principal purpose in attempting to model the constitutive behavior of soils is
to use the resulting model as a tool for solving engineering problems. It is desirable in
most engineering applications to have a model with reasonable simplicity, which is
described using minimum number of parameters, requires least number of experiments to
determine its parameters, and can be applied using simple procedures. It is tempting to
develop a single model that would describe all the aspects of soil behavior, and, by
adjusting certain parameters, would be applicable to all soil types. But in fact, such a
model would not fit the criteria of simplicity and would be so complex as to render it
virtually useless. A sensible approach is to have a set of models each designed to fulfill a
different purpose, and each containing the relevant features for a particular type of soil
behavior. This can also be achieved by having several variations of, or a set of
independent components in a single model. The critical state concept has been repeatedly
used to create variations of modified cam clay model (MCC model, Roscoe and Burland,
1 968) in an effort to explain various facets of the observed soil behavior. However, a
single model with several independent components, which could provide a convenient
framework in understanding the concept and determination of parameters, is needed.
Several experimental studies have shown that a wide range of soils have highly
non-linear stiffness at low strains; and in most cases soil specimen fail before reaching
the critical state, especially overconsolidated clays. The onset of localized deformations
198
within the specimens could be a possible reason for premature failure. The stress induced
anisotropy has also been observed to have a significant influence on the soil 's shear
behavior. For various soils, the dilative behavior under shear loading varies significantly,
which can also be influenced by the configuration of loading if the soil is anisotropic.
Using the well defined and widely accepted concept of elasto-plasticity theory, a
constitutive model for isotropically consolidated clays is proposed that entertains some of
the above mentioned issues. In the proposed model, an attempt has been made to have a
balance between the simplicity of formulation and accuracy of results. It is assumed that
the loading is monotonic and that large stress reversals including sudden directional
changes in the stress paths are not involved. Temperature and time effects are assumed to
be absent.
The basic concept of the proposed model is based on some of the assumptions
about clay behavior that were considered in the Cam clay elasto-plasticity (Roscoe and
Burland, 1 968). The volumetric behavior (elastic or plastic) of clay under shear loading
has been defined using the properties of clay that could be determined from its
consolidation behavior. The Cam clay plasticity uses volumetric hardening for growth of
its yield surface under loading condition, and this is used in the current model as a part of
the hardening rule. However, unlike the cam clay plasticity, a non-associative flow rule
(different yield and plastic potential functions) is used to describe the clay behavior as it
has been widely acknowledged to be most appropriate for geomaterials (Lade, 1 990).
The proposed model has two components. In first component, the behavior of
normally consolidated (NC) to highly overconsolidated (OC) clay is considered in triaxial
compression (b=O) plane. The issues related to brittle failure, dilative capacity, and
199
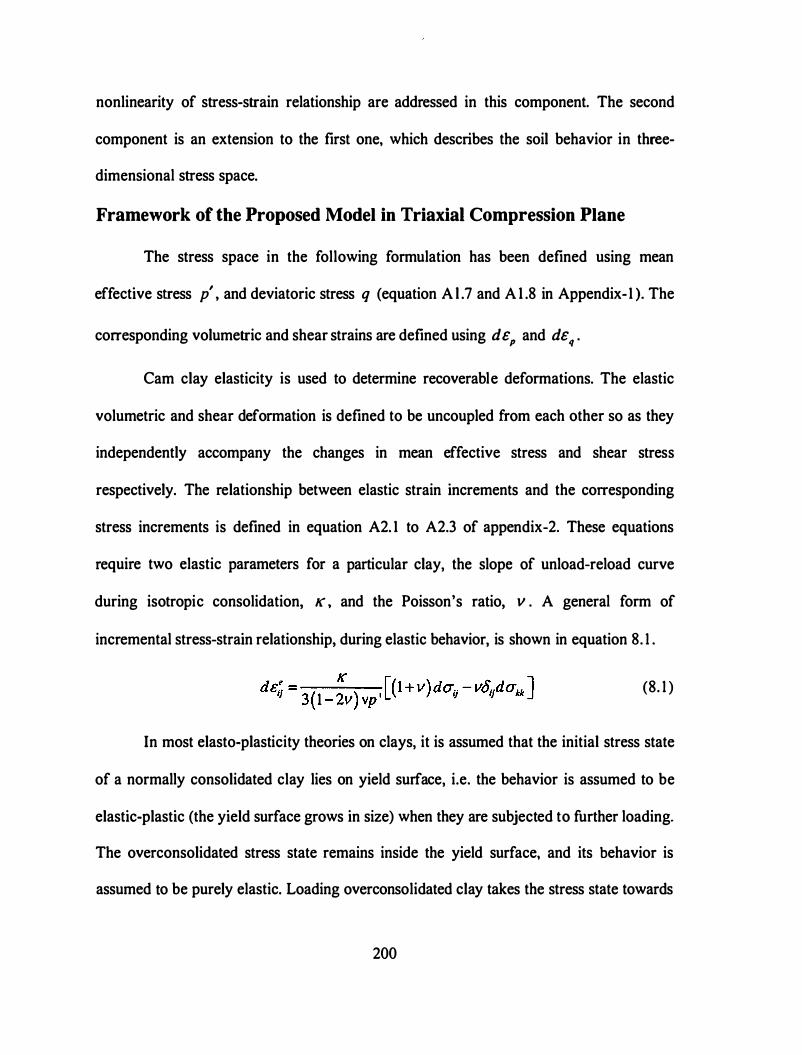
nonlinearity of stress-strain relationship are addressed in this component. The second
component is an extension to the first one, which describes the soil behavior in three-
dimensional stress space.
Framework of the Proposed Model in Triaxial Compression Plane
The stress space in the following formulation has been defined using mean
effective stress p' , and deviatoric stress q (equation A l .7 and A l .8 in Appendix- I ). The
corresponding volumetric and shear strains are defined using deP and deq .
Cam clay elasticity is used to determine recoverable deformations. The elastic
volumetric and shear deformation is defined to be uncoupled from each other so as they
independently accompany the changes in mean effective stress and shear stress
respectively. The relationship between elastic strain increments and the corresponding
stress increments is defined in equation A2. 1 to A2.3 of appendix-2. These equations
require two elastic parameters for a particular clay, the slope of unload-reload curve
during isotropic consolidation, K , and the Poisson's ratio, v . A general form of
incremental stress-strain relationship, during elastic behavior, is shown in equation 8. 1 .
(8. 1 )
In most elasto-plasticity theories on clays, it is assumed that the initial stress state
of a normally consolidated clay lies on yield surface, i.e. the behavior is assumed to be
elastic-plastic (the yield surface grows in size) when they are subjected to further loading.
The overconsolidated stress state remains inside the yield surface, and its behavior is
assumed to be purely elastic. Loading overconsolidated clay takes the stress state towards
200
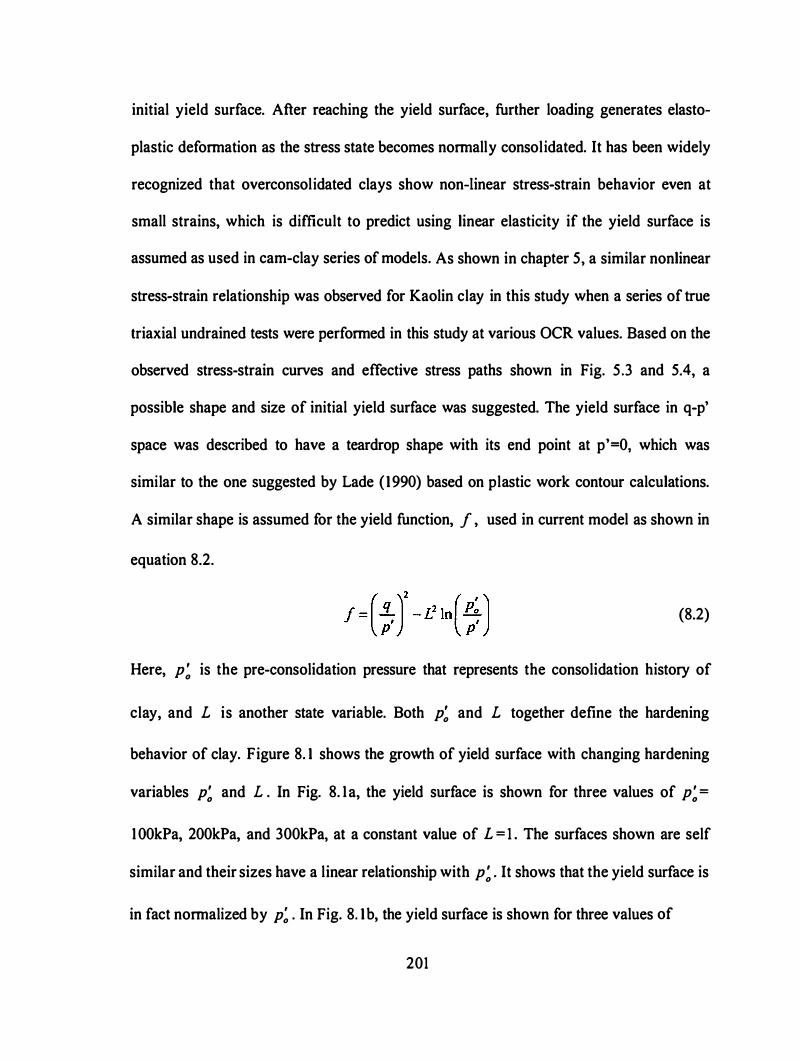
initial yield surface. After reaching the yield surface, further loading generates elasto
plastic defonnation as the stress state becomes nonnally consolidated. It has been widely
recognized that overconsolidated clays show non-linear stress-strain behavior even at
small strains, which is difficult to predict using linear elasticity if the yield surface is
assumed as used in cam-clay series of models. As shown in chapter 5, a similar nonlinear
stress-strain relationship was observed for Kaolin clay in this study when a series of true
triaxial undrained tests were perfonned in this study at various OCR values. Based on the
observed stress-strain curves and effective stress paths shown in Fig. 5 .3 and 5.4, a
possible shape and size of initial yield surface was suggested. The yield surface in q-p'
space was described to have a teardrop shape with its end point at p'=O, which was
similar to the one suggested by Lade ( 1 990) based on plastic work contour calculations.
A similar shape is assumed for the yield function, f , used in current model as shown in
equation 8.2.
! = (;. )'- !! In(�) (8.2)
Here, p; is the pre-consolidation pressure that represents the consolidation history of
clay, and L is another state variable. Both p; and L together define the hardening
behavior of clay. Figure 8. 1 shows the growth of yield surface with changing hardening
variables p; and L . In Fig. 8. 1 a, the yield surface is shown for three values of p; =
I OOkPa, 200kPa, and 300kPa, at a constant value of L = 1 . The surfaces shown are self
similar and their sizes have a linear relationship with p; . It shows that the yield surface is
in fact nonnalized by p; . In Fig. 8. 1 b, the yield surface is shown for three values of
201
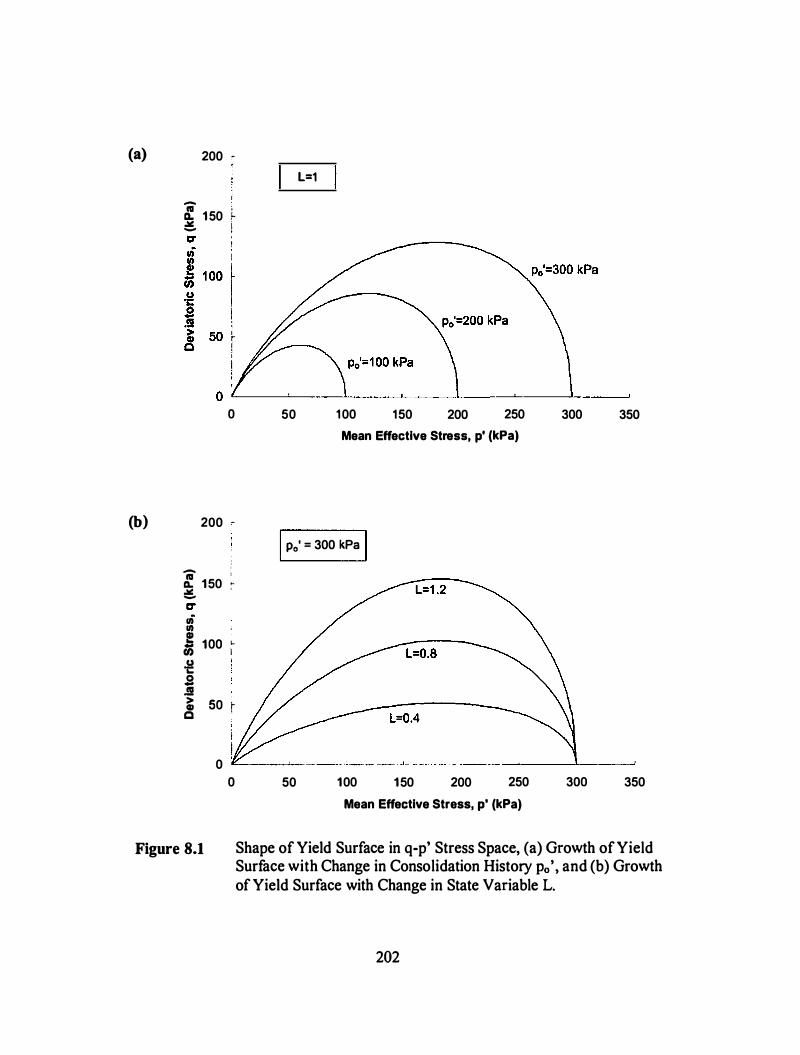
(a) 200 " '
l 1 50 L .a: ' -
0
(b) 200 �
I
ti : � 1 50 ; -
,n Ill . ! 1 oo 1 � .s .!2 � so r Q
L=1
50 1 00 1 50 200 250 300 350 Mean Effective Stress, p' (kPa)
I Po' = 300 kPa I
0 �---"----- - - - �· --- - -'----- - - --- - •-----'-----1------'
0
Figure 8.1
50 1 00 1 50 200 250 300 350 Mean Effective Stress, p' (kPa)
Shape of Yield Surface in q-p' Stress Space, (a) Growth of Yield Surface with Change in Consolidation History Po', and (b) Growth of Yield Surface with Change in State Variable L.
202

L = 0.4, 0.8, and 1 .2, at a constant value of p; =300kPa. It can be observed that the yield
surface grows only in the direction of shear stress with an increase in the state variable L.
Mayne ( 1979), and Mayne and Swanson ( 1 98 1 ) summarized the undrained
strength behavior of different clays reported throughout the geotechnical literature. They
showed that for most clays, the normalized strengths ( Su / u;'O ) are a function of OCR,
which was originally identified by Ladd and Foott ( 1 974). Based on these finding, a
failure surface was developed in chapter 5 (equations 5.3 to 5. 1 1 ) as a function of clay's
void ratio. The failure surface in current model is assumed to be the same as what was
derived in chapter 5, and it is shown in equation 8.3.
(8.3)
Two parameters C 1 and A0 are used to define the failure surface, and are assumed to be
soil constants. The failure surface is essentially a function of clay's pre-consolidation
pressure p; that grows in size with increasing p; value. Figure 8.2 shows shape and size
of a typical failure surface in comparison with that of a typical initial yield surface.
It was observed during the experimental study that the kaolin clay specimens
experienced sudden failure due to localized deformations within the specimens. A
detailed description of the observed brittle behavior of clay was presented in chapter 5.
To model this behavior in a mathematical framework, the surface defining the ultimate
growth of the yield surface has to be separated from the failure surface. This surface is
named as a reference surface. It should always be defined out side the failure surface;
however, for ductile behavior it would be the same as failure surface. For simplicity of
203
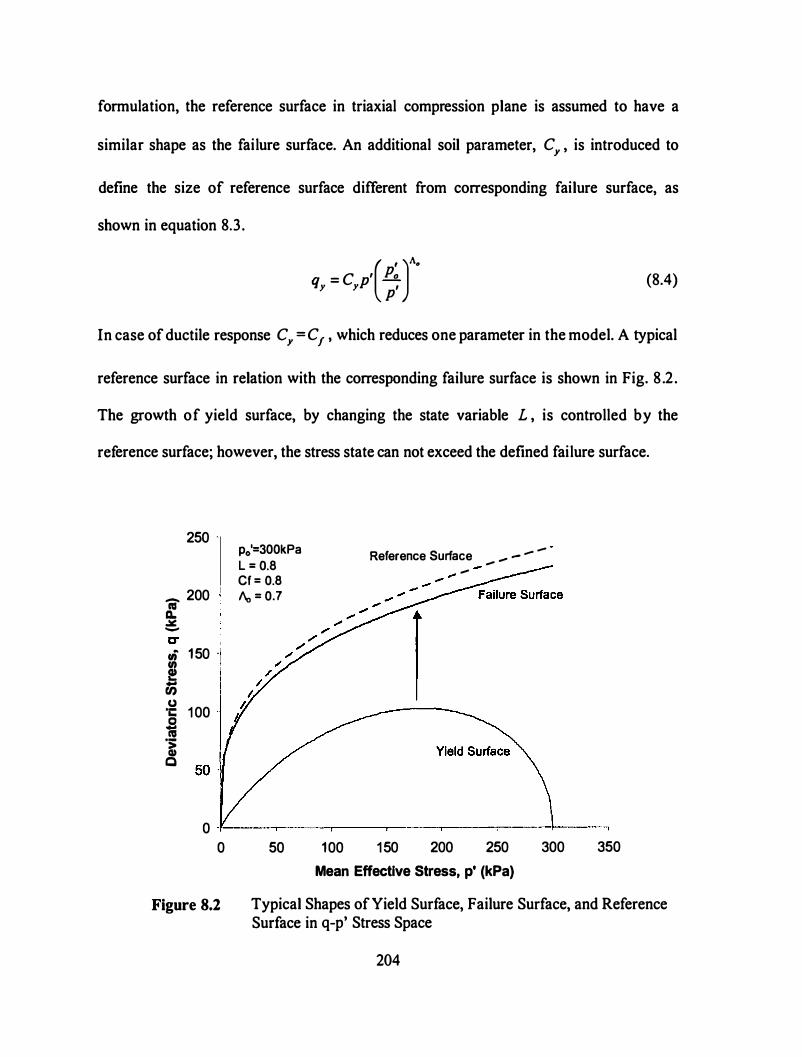
formulation, the reference surface in triaxial compression plane is assumed to have a
similar shape as the failure surface. An additional soil parameter, CY , is introduced to
define the size of reference surface different from corresponding failure surface, as
shown in equation 8.3 .
q = C p' Po (
,
)
/\
0
y y p' (8.4)
In case of ductile response C Y = C 1 , which reduces one parameter in the model. A typical
reference surface in relation with the corresponding failure surface is shown in Fig. 8 .2 .
The growth of yield surface, by changing the state variable L , is controlled by the
reference surface; however, the stress state can not exceed the defined failure surface.
250
- 200 nl
11. .:.::: -
0 1 50 0 I! u; u ·c: � ·� c
1 00
p0'=300kPa L = 0.8 Cf = 0.8 1\, = 0.7
Reference Surface - - - - - -
0 -�----.-----.-----.-----.------.----�-----
0
Figure 8.2
50 1 00 1 50 200 250
Mean Effective Stress, p' (kPa)
300 350
Typical Shapes of Yield Surface, Failure Surface, and Reference Surface in q-p' Stress Space
204
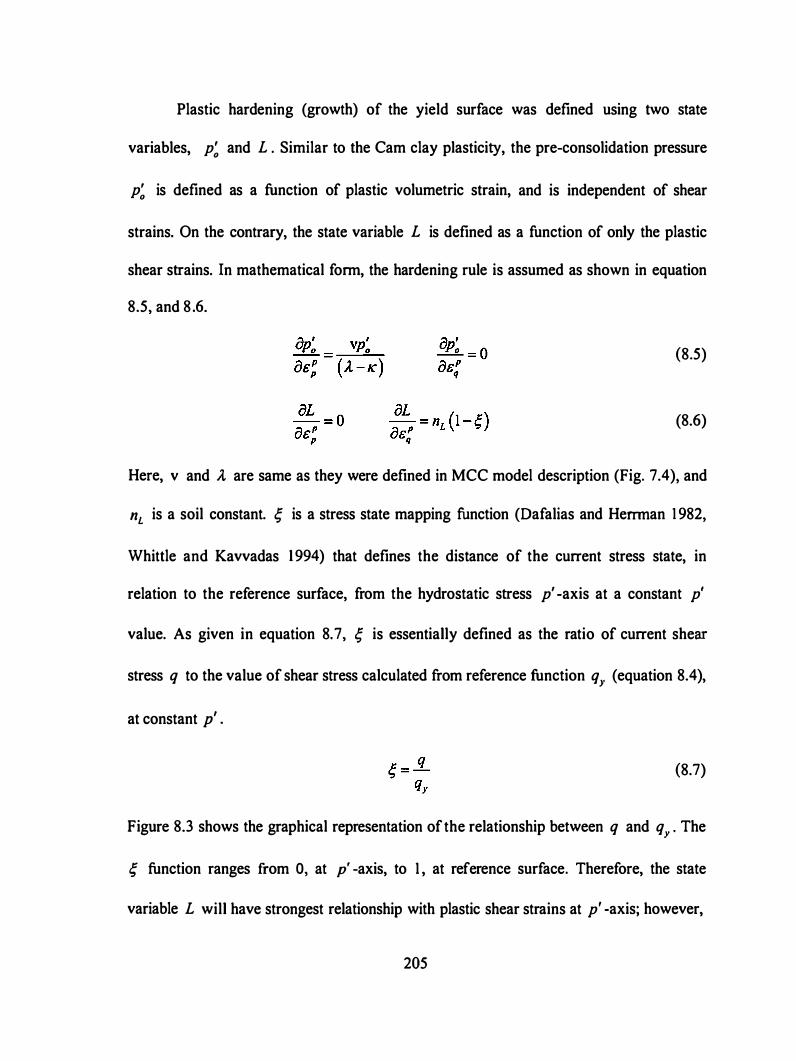
Plastic hardening (growth) of the yield surface was defined using two state
variables, p; and L . Similar to the Cam clay plasticity, the pre-consolidation pressure
p; is defined as a function of plastic volumetric strain, and is independent of shear
strains. On the contrary, the state variable L is defined as a function of only the plastic
shear strains. In mathematical form, the hardening rule is assumed as shown in equation
8.5, and 8 .6.
(8.5)
(8.6)
Here, v and ll are same as they were defined in MCC model description (Fig. 7.4), and
nL is a soil constant. � is a stress state mapping function (Dafalias and Herrman 1 982,
Whittle and Kavvadas 1 994) that defines the distance of the current stress state, in
relation to the reference surface, from the hydrostatic stress p' -axis at a constant p'
value. As given in equation 8. 7, � is essentially defined as the ratio of current shear
stress q to the value of shear stress calculated from reference function q r (equation 8.4 ),
at constant p' .
(8.7)
Figure 8.3 shows the graphical representation of the relationship between q and q Y • The
� function ranges from 0, at p' -axis, to I , at reference surface. Therefore, the state
variable L will have strongest relationship with plastic shear strains at p' -axis; however,
205
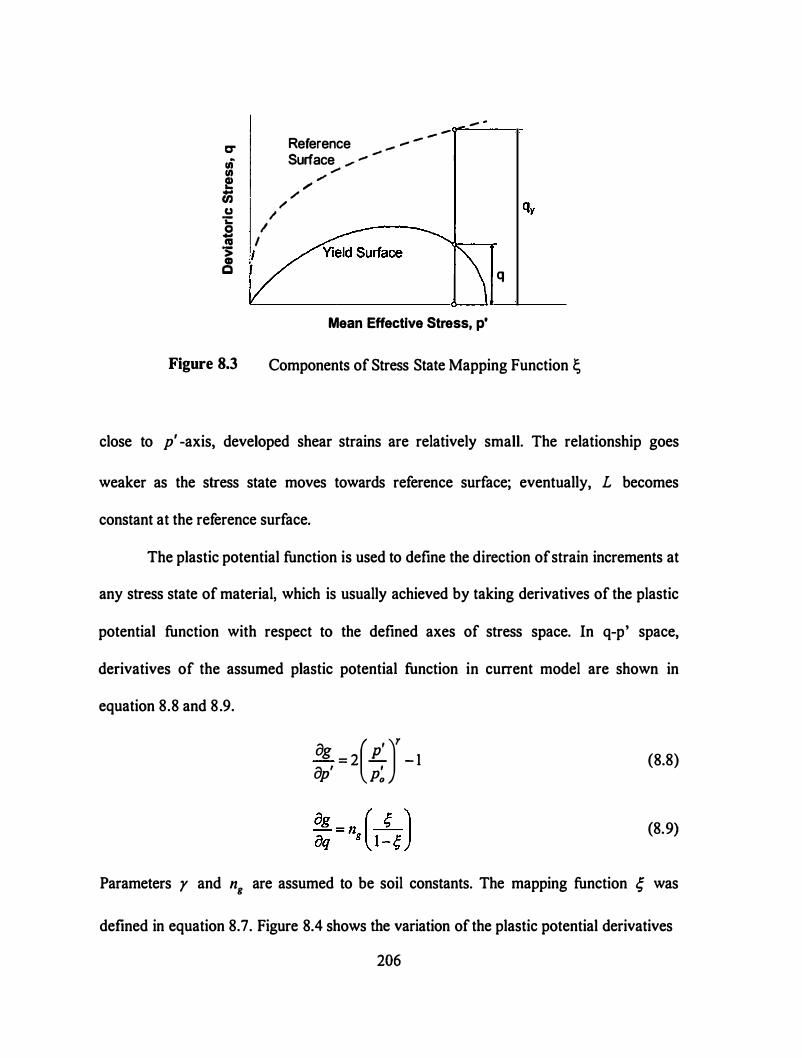
C" Reference _ , -
-
-
lA Surface .,. .,... " en ,.. e / ,.. Ui / u /
i: / .S I ca I
� (
-
-
Mean Effective Stress, p'
q
Figure 8.3 Components of Stress State Mapping Function �
close to p' -axis, developed shear strains are relatively small. The relationship goes
weaker as the stress state moves towards reference surface; eventually, L becomes
constant at the reference surface.
The plastic potential function is used to define the direction of strain increments at
any stress state of material, which is usually achieved by taking derivatives of the plastic
potential function with respect to the defined axes of stress space. In q-p' space,
derivatives of the assumed plastic potential function in current model are shown in
equation 8.8 and 8.9.
og = 2(l!..)r - 1 op' P:
(8.8)
(8.9)
Parameters r and ng are assumed to be soil constants. The mapping function � was
defined in equation 8.7. Figure 8.4 shows the variation of the plastic potential derivatives
206
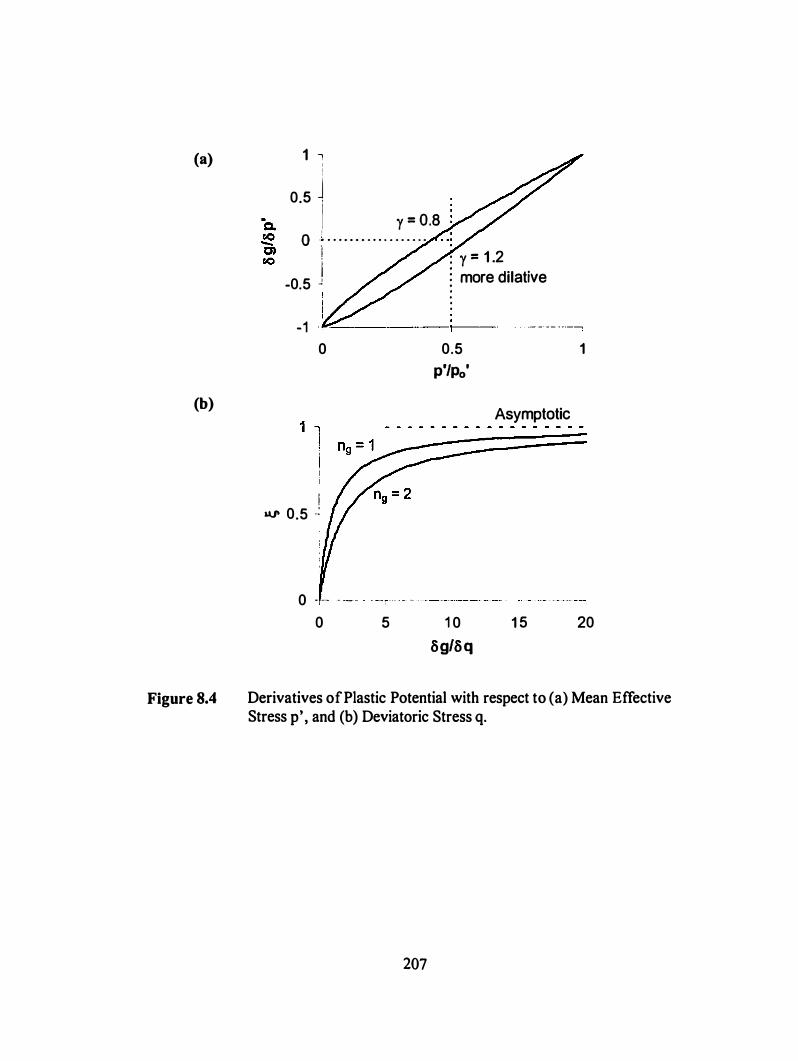
(a)
(b)
Figure 8.4
1 I I !
J 0.5 i I y = O.B 0 "� . . . . . . . . . . . . . . . . . .
I i : y = 1 .2
-0.5 J
-1 0
I ll.1' 0.5 _;
l more dilative . . . .
--------------- �
0.5
p"/po'
Asymptotic
1
0 - - - -- - - · - �··· • •" •" " --�-
0 5 1 0
8g/8 q 1 5 20
Derivatives of Plastic Potential with respect to (a) Mean Effective Stress p•, and (b) Deviatoric Stress q.
207
in stress space. Introducing y into plastic potential function provides the flexibility of
accounting for different volumetric response of different clays, which has been
commonly observed in various studies. However, the MCC model assumes r to be
constant, r = 1 . The value of parameter r is higher if the clay is more dilative clay.
Parameter n, accounts for the variation in evolution of volumetric response as the stress
state moves towards the reference surface during incremental shear loading. The shear-
strain increment vector remains zero when the stress state moves along hydrostatic axis;
it grows to large magnitudes as the stress state goes close to reference surface; eventually,
its hyperbolic variation becomes asymptotic to the reference surface. Therefore, if the
material is assumed to be ductile (reference surface lies on corresponding failure surface),
a limit of shear strain has to be specified as a failure condition.
During elasto plastic deformation, the yield surface grows in size, by following
the hardening rule, and the stress state always remains on the current yield surface. This
condition can be satisfied using the following consistency condition.
. ar ar ar ar f = -� dp' +-, dq+-,-dp' +-,-dL = O op' oq ap; 0 oM (8. 1 0)
In equation 8. 1 0, the incremental hardening variables can be obtained using equations 8.5
and 8.6, as shown in equation 8. 1 1 and 8. 12.
(8. 1 1 )
(8. 12)
Therefore, equation 8. 1 0 can be rewritten as
208
The flow rule can be defined as shown in equation 8. 14 and 8. 1 5.
d&P = d). ag p 8p'
Using equation 8. 1 3 to 8. 1 5, the loading function d). can be obtained as
-1 (
af a.r ) d). = - dp'+-dq n (l - �;) aj ag + vp: aj ag ap' aq
L aM aq (A. -K) ap: ap'
As defined in equation 7.6 (chapter 7), the material hardening H can be written as
(8. 1 3)
(8. 14)
(8. 15)
(8. 16)
(8. 17)
The derivatives of plastic potential were defined in equation 8.8 and 8.9. The derivatives
of yield function with respect to L and p; are as shown in equations 8. 1 8 to 8. 1 9.
()1' ,
-
� = -2Lp2 ln Po ar p'
Therefore, the hardening function H can be modified to as shown in equation 8.22.
209
(8. 1 8)
(8. 19)
(8.20)
A general form of incremental stress-strain relationship, during elasto-plastic behavior,
can be written as shown in equation 8.23 .
_ e P _ K[(l + v) da0 -v£5'0dau ] 1 ( of ) og de . . - de .. + deiJ - +- --da --" " 3(1 - 2v)vp ' H oa111, "'" oalf
Determination of Parameters for Kaolin Clay
(8.21 )
All the defmed parameters in the proposed model can be determined from an
isotropic consolidation test, and a triaxial compression test on normally consolidated
clay. In the experimental part of this study, data from a series of true triaxial undrained
compression tests and constant rate of strain Ko consolidation tests on Kaolin clay was
presented in chapter 5. This data is used to determine the model parameters for Kaolin
clay. Therefore, chapter 5 is referred to quite frequently in this section.
The basic concept behind the development of the failure surface and its
parameters was discussed in chapter 5. Using failure data from the undrained tests
performed at various OCR values, parameter A0 for Kaolin clay was determined to be
A0 = 0.9. From CRS test data, an average value of A was determined to be A =0. 16
assuming that the slope of virgin consolidation line during isotropic consolidation is
approximately same as that during Ko consolidation (Wood 1 990). Based on Mayne and
Swanson's ( 1 98 1 ) findings, it was discussed that the swelling index C5 can be
determined using the known values of A0 and compression index Cc (equation 5.2).
Parameters .l and K provide another form of Cc and C5 using natural log of mean
effective stress; therefore the relationship between Ao , .l , and K can be written as
(8.22)
Using equation 8.22, the value of K for kaolin clay defined as K =0.0 1 6. Equation 8.22
can also be used to detennination of Ao , if data from another triaxial test on
overconsolidated clay is not available. In such a case, K is detennined from
consolidation test data using e-ln p' relationship observed during unloading. Poisson's
ratio for kaolin clay is assumed to be v = 0.28 as was used in chapter 7 for MCC and
single hardening model predictions.
Henceforth, the data obtained from true triaxial compression tests on nonnally
consolidated ( p� = 275kPa) kaolin clay, shown in Fig. 5 .3 to Fig. 5.5 of chapter 5, is
referred to as NC data. Failure surface parameter C1 is detennined using equation 8.23,
which was derived in chapter 5 (equation 5.8) for triaxial compression test on NC clay.
(8.23)
In equation 8.23, p� is the initial pre-consolidation pressure and q1Nc is the shear
strength in tenns of deviatoric stress. From NC data in Fig. 5 .3, C1 is detennined to be
C1 = 0.63 . As shown in Fig. 5.3, the stress strain relationship from NC data can be used
to detennine the shear stress level at the reference surface, which is used to detennine
c, = 0.66 by extending equation 8.23 for the reference surface. Use of the method
described in chapter 5 for detennination of shear stress level at reference surface gives
just an approximate value of Cr . However, it will be demonstrated that the soil's
behavior can still be predicted within reasonable accuracy.
Hardening rule in equation 8.6 can be rewritten in incremental for as shown in
equation 8.24.
2 1 1
(8.24)
For NC data, Fig. 8.5 shows a relationship between L and cumulative sum M../nL , in
which L is calculated using yield function (equation 8.2) and M../ nL is calculated using
hardening rule (equation 8.24). During this calculation, incremental p; and � were
calculated using equations 8.5, 8.4 and 8.7. Components of Plastic strains were calculated
using equations 8.25 and 8.26.
Under undrained conditions: fleP = -!lee p p
(8.25)
(8.26)
Elastic strain components !le; and !le; were calculated using equation 8. 1 . The l inear
relationship shown in Fig. 8.5 provides initial value of L ( L0 =0.75), and hardening
parameter nL (= 22). The Lo , together with initial p; , defines the size of initial yield
surface.
At the reference surface, the relative magnitude of the plastic volumetric strain
increment vector goes to zero; therefore, agjap'=O (equation 8.8) at reference surface.
Applying this condition on NC data, plastic potential parameter y is determined to be
r =0.92 . Flow rule (equation 8. 14 and 8. 1 5) defines a relationship between shear and
volumetric components of plastic strains as shown in equation 8.27.
de: _ ag/ ag -- - - --
de; aq ap'
2 12
(8.27)

1 .60
6 1 .20 = u c :::s u. "C .! > E 0
0.80
I -= l :::; 0.40 I - i
1
L0 = 0.75
I 0.00 , _______ ._ ___ _ ___ ___L ___ _
0 0.01 0.02 0.03
(I A LlnL) from hardening rule 0.04
Figure 8.5 Determination of Hardening Parameter nL, and Initial L Value (Lo)
Using equations 8.8 and 8.9, the above defined relationship can be manipulated to show
equation 8.28.
where, Rg is defined as
{ I - �;) {2{p'/ p; )' - 1 } R = ----�------� g ,;
(8.28)
(8.29)
Figure 8.6 shows that the cumulative sums of Rgb.e: and lle; increments have a linear
relationship, which gives plastic potential parameter ng ==3.5.
A summary of all the model parameters determined for kaolin clay is provided in
Table 8. 1 . It is to be noted that Lo and p; are state variables. L0 remains constant when
2 13
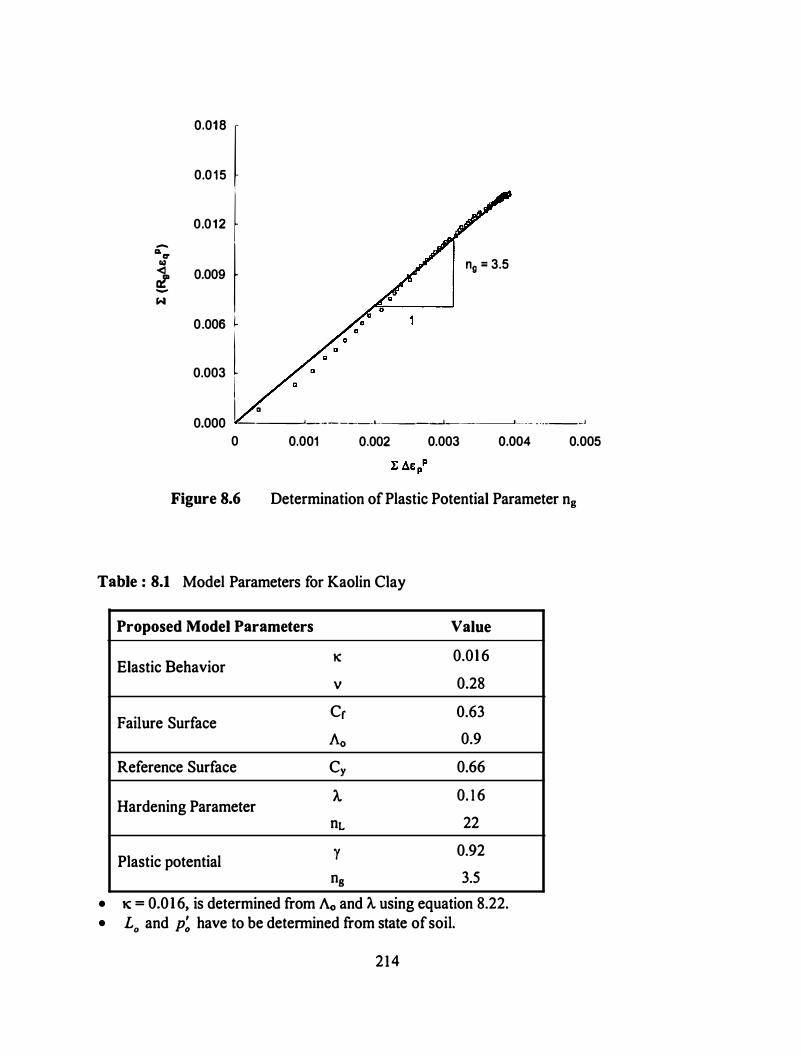
0.01 8 r 0.0 1 5
0.0 1 2 f -
0.000 l a. a' w <1 rr
-
H
n9 = 3.5
0.006 �
0.003 r 0.000
l_a ---"-------L-----'-------------'--- - -----1
0 0.001 0.002 0.003 0.004 0.005
Figure 8.6 Determination of Plastic Potential Parameter ng
Table : 8.1 Model Parameters for Kaolin Clay
Proposed Model Parameters
Elastic Behavior K
v
Failure Surface Cr Ao
Reference Surface Cy
Hardening Parameter A nL
Plastic potential y ng
Value
0.0 1 6
0.28
0.63
0.9
0.66
0. 1 6
22
0.92
3.5
• K = 0.01 6, is determined from Ao and A using equation 8.22. • Lo and p: have to be determined from state of soil.
214
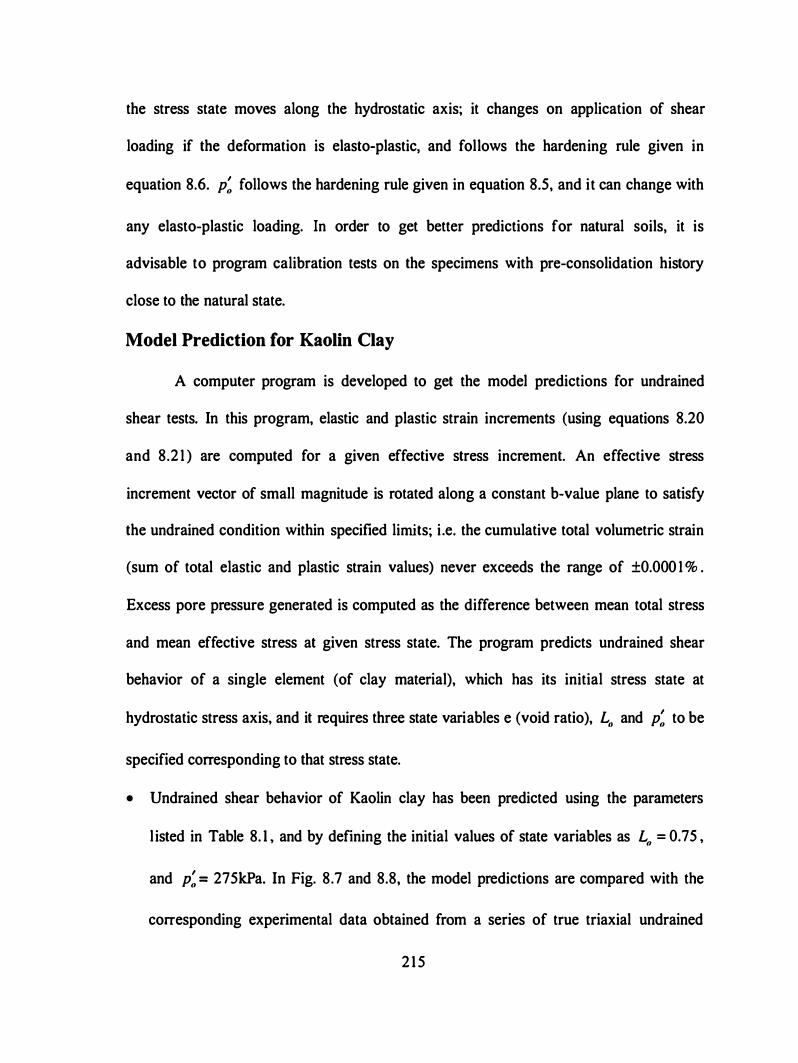
the stress state moves along the hydrostatic axis; it changes on application of shear
loading if the deformation is elasto-plastic, and follows the hardening rule given in
equation 8.6. p; follows the hardening rule given in equation 8.5, and it can change with
any elasto-plastic loading. In order to get better predictions for natural soils, it is
advisable to program calibration tests on the specimens with pre-consolidation history
close to the natural state.
Model Prediction for Kaolin Clay
A computer program is developed to get the model predictions for undrained
shear tests. In this program, elastic and plastic strain increments (using equations 8.20
and 8.2 1 ) are computed for a given effective stress increment. An effective stress
increment vector of small magnitude is rotated along a constant b-value plane to satisfy
the undrained condition within specified limits; i .e. the cumulative total volumetric strain
(sum of total elastic and plastic strain values) never exceeds the range of ±0.000 1 % .
Excess pore pressure generated is computed as the difference between mean total stress
and mean effective stress at given stress state. The program predicts undrained shear
behavior of a single element (of clay material), which has its initial stress state at
hydrostatic stress axis, and it requires three state variables e (void ratio), Ln and p; to be
specified corresponding to that stress state.
• Undrained shear behavior of Kaolin clay has been predicted using the parameters
l isted in Table 8. 1 , and by defining the initial values of state variables as L0 = 0.75 ,
and p; = 275kPa. In Fig. 8.7 and 8.8, the model predictions are compared with the
corresponding experimental data obtained from a series of true triaxial undrained
2 1 5
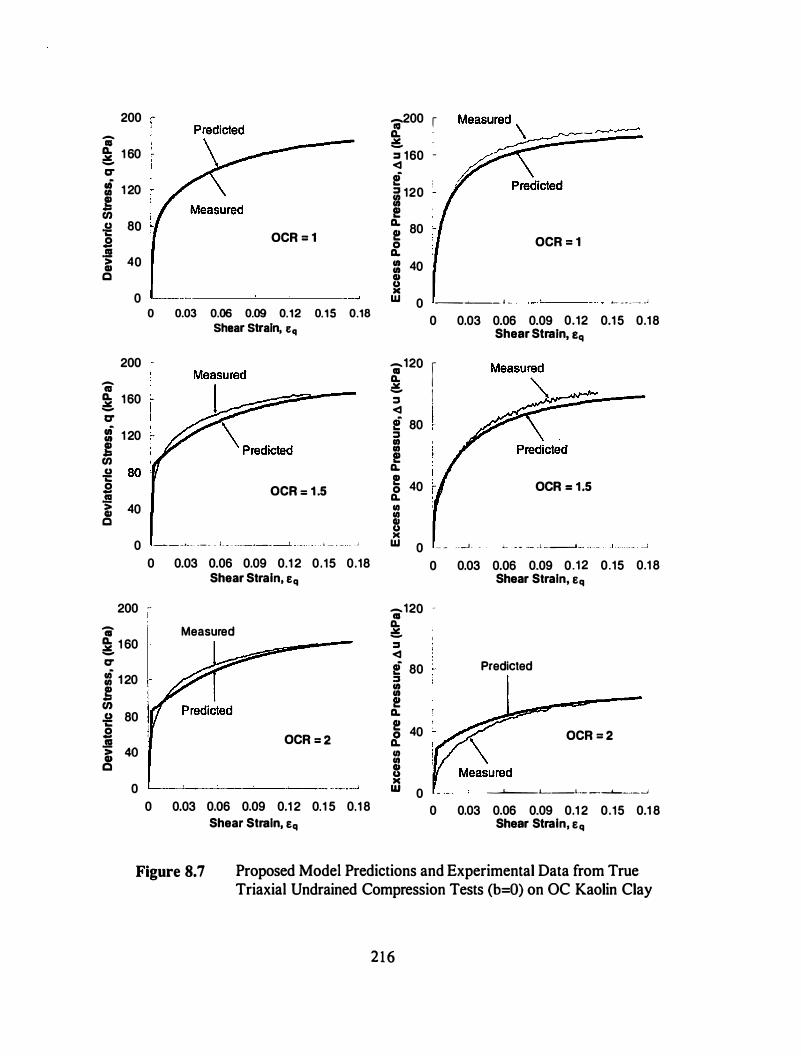
200 -Ill � 1 60 -c:r ,; 1 20 Ul l!! -tn .9 80 .. 0 -.!!! 40 ii c
0
200 -ftl � 1 60 -c:r = 1 20 l!! -tn .g s � 40 c
OCR = 1
0 0.03 0.06 0.09 0.12 0.15 0.18 Shear Strain, Eq
OCR = 1 .5
0 ---· --- -- � - 1- - -- ---·-------L - - - - · • - - _ _ j
0 0.03 0.06 0.09 0.1 2 0 .15 0.18 Shear Strain, Eq
200 --ftl � 1 60 -c:r = 1 20 g tn .g 80 s .!!!
� 40 0
Measured
OCR = 2
0 0.03 0.06 0.09 0.1 2 0.1 5 0.1 8 Shear Strain, Eq
1200 1 � = 160 -<I i � 120 en l!! Q. 80 l!! 0 Q. en en Cl) u )(
40
OCR = 1
w 0 __ _.�..__ __ , __ ..._ _ _ _ _ _ _ ;
-120 Ill Q. Jl: -::::11 <I i 80 ::::11 Ill Ill l!! Q. l!! 40 0 Q. Ill Ill Ill u )( w 0
-120 ftl Q. � :II <I i 80 ::::11 en en l!! Q. l!! g_ 40 en 8 � 0
0 0.03 0.06 0.09 0.12 0.1 5 0.18 Shear Strain, eq
I I �
OCR = 1 .5
·- - , . _J . " .L - - - ··- -l ----1-- -· -- I --- ·-- _ _J
0 0.03 0.06 0.09 0.12 0.15 0.1 8 Shear Strain, Eq
-
Predicted
OCR = 2
-'----"---1.-- ___ -L..._ ____ _j
0 0.03 0.06 0.09 0.1 2 0 .15 0.1 8 Shear Strain, Eq
Figure 8.7 Proposed Model Predictions and Experimental Data from True Triaxial Undrained Compression Tests (b=O) on OC Kaolin Clay
216
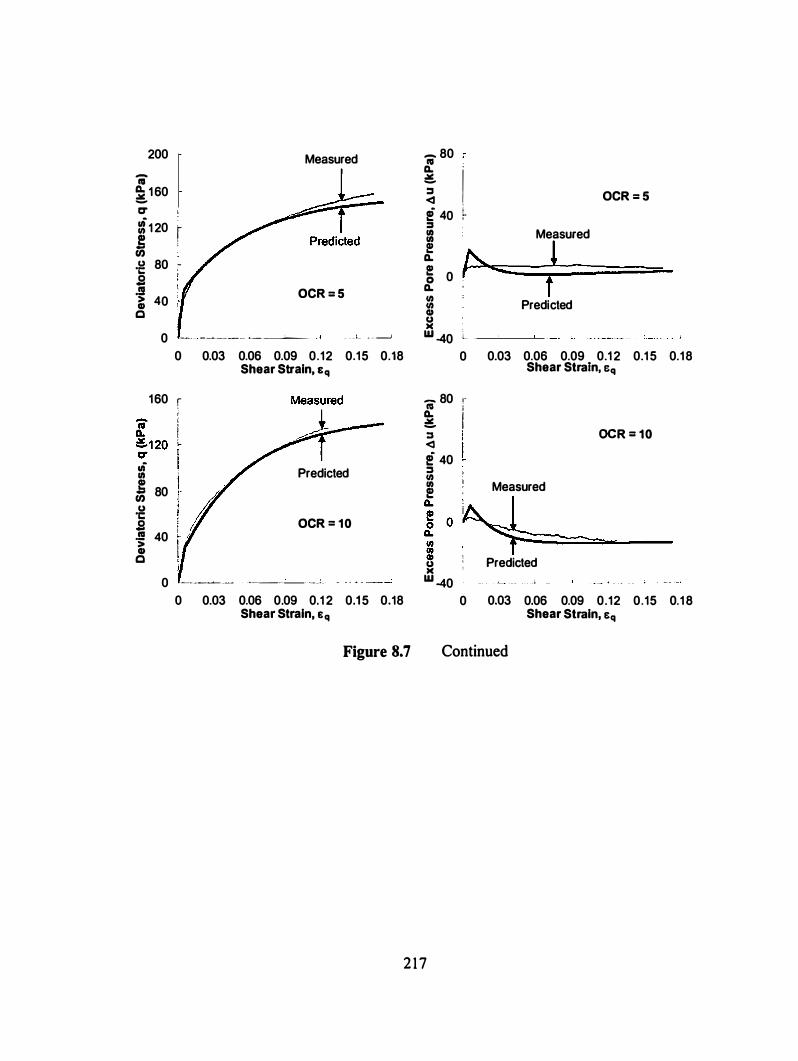
200
li A. 1 60 � c:T ::1 20 I g '
U) ·� 80 -
.s .!! � 40 c
Measured
OCR = 5
0 - · - -�--- ·- ---'--- - - -L _ __ ______j
.A II) � U) u
·c .s "' > CD c
0 0.03 0.06 0.09 0.12 0.15 0.18 Shear Strain, t:q
160 !
Predicted 80
OCR = 10
40
0 ----� -- -·---- --·-
0 0.03 0.06 0.09 0.1 2 0.1 5 0.18 Shear Strain, t:q
Figure 8.7
- 80 � "' ' Q. I � :::s <I OCR = 5
e 4o � :::s II) II) Measured ! h Q. ! 0 0
l t Q.
II) II) G) �
'
w 40 t_ 0
- 80 r
:. I
� I � l e 40 . :::s II)
Predicted
0.03 0.06 0.09 0.1 2 0.1 5 0.18 Shear Strain, t:q
OCR = 10
f , Measured
� 0 ��
= · � u : Predicted >C w -40
0 _J. -
0.03 0.06 0.09 0.12 0.15 0.1 8 Shear Strain, &q
Continued
2 17
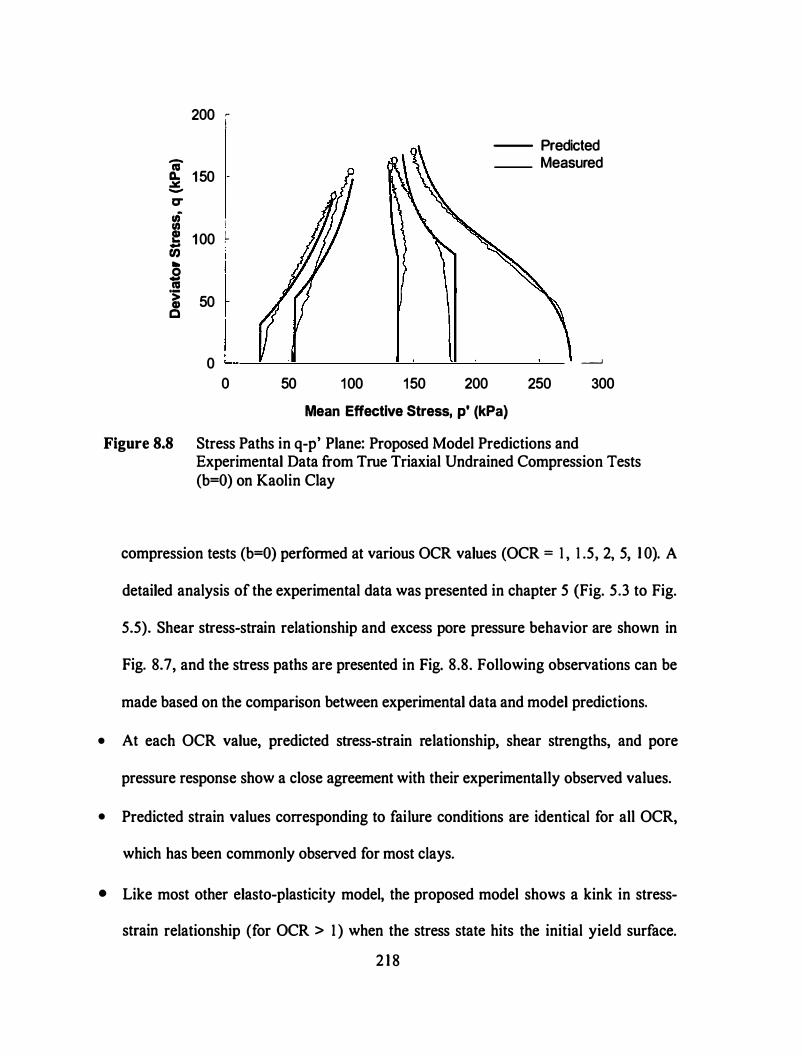
200 ,.. I -- Predicted
-__ Measured tU
D. 1 50 � -C"' IIi I II) ! 1 00 � ...
tn ... 0 ... tU ·s: 50 CD c
0 ____J
0 50 1 00 1 50 200 250 300
Mean Effective Stress, p' (kPa)
Figure 8.8 Stress Paths in q-p' Plane: Proposed Model Predictions and Experimental Data from True Triaxial Undrained Compression Tests (b=O) on Kaolin Clay
compression tests (b=O) performed at various OCR values (OCR = 1 , 1 .5, 2, 5, 1 0). A
detailed analysis of the experimental data was presented in chapter 5 (Fig. 5.3 to Fig.
5.5). Shear stress-strain relationship and excess pore pressure behavior are shown in
Fig. 8.7, and the stress paths are presented in Fig. 8.8. Following observations can be
made based on the comparison between experimental data and model predictions.
• At each OCR value, predicted stress-strain relationship, shear strengths, and pore
pressure response show a close agreement with their experimentally observed values.
• Predicted strain values corresponding to failure conditions are identical for all OCR,
which has been commonly observed for most clays.
• Like most other elasto-plasticity model, the proposed model shows a kink in stress-
strain relationship (for OCR > 1 ) when the stress state hits the initial yield surface. 2 1 8
The effective stress paths show a sudden change in their slope at the same stress level,
as can be observed in Fig. 8.8. Sometimes, transitional plasticity concepts (smooth
evolution of plasticity) are used to eliminate this response; however, this can
complicate the formulation significantly. Considering a balance between simplicity of
formulation and accuracy of results, it is found unnecessary to further modify the
proposed model.
• Similar to experimental observations, the predicted effective stress path for OCR=2
shows compressive nature of clay in elasto-plastic region (due to parameter y < 1 ).
Extension of the Proposed Model in Deviatoric Plane
In the proposed elasto-plasticity model for hydrostatically consolidated clays, it is
assumed that the elastic behavior of soil is isotropic. Plastic shear stiffness (yielding) of
the material is controlled by its reference surface, which is independent of material 's
failure surface. Since, the proposed model assumes non-associative flow rule; the yield
surface and its evolution during elasto-plastic deformation are independent of the failure
surface; therefore, the failure surface can be modified freely in the deviatoric plane to
improve the general response for stress anisotropy. However, it is preferred in elasto
plasticity theory that the failure surface is continuous and convex in stress space. The
reference surface merely defines the size of the yield surface and plastic potential surface
(in shear direction); however, the functions used for the yield surface and plastic potential
surface have their independent shape properties in stress space. Yield and plastic
potential functions are continuous and convex in working stress space; the yield function
has a discontinuity only at zero stress state.
2 19
Influence of Intermediate Principal Stress
In chapter 3, it was shown that the anisotropy of applied stresses could be defined
using two variables; intermediate principal stress ratio, b-value, and angle of major
principal direction from axis of cross-anisotropy, B-angle. Based on the experimental data
presented in chapter 3 to chapter 6, it can be concluded that the failure condition is
simply a function of applied anisotropic stress state, and it can be assumed to be
independent of the direction of applied loading. Based on this observation, a failure
surface was formulated in chapter 5 (equation 5. 1 3 and 5. 14), which assumes a similar
shape in deviatoric plane as was proposed by Lade ( 1 990). Using equation 5 . 1 3 and 5 . 14,
the stable state of material (stress state before failure condition) in three-dimensional
stress space can be defined using equation 8.30.
lL > I _3_(qf )3 _.!..(q' )2 + 1) p'3 \27 p' 3 p' (8.30)
where ( ) are Macaulay brackets. They constrain the failure surface to exist only in
positive quadrant of 3D stress space, by which it is considered that the frictional material
will fail if one of the acting principal stresses goes to zero. This condition is based on a
widely accepted assumption of no cohesion in frictional materials as was considered in
Lade's ( 1990) model. Figure 8.9 shows the constrained fai lure surface in triaxial
compression plane.
It was shown in chapter 5 that the yield behavior (in terms of shear stiffness) of
clay was not significantly influenced by the change in relative magnitude of principal
stresses when the tests were performed at constant orientation of principal stresses
220
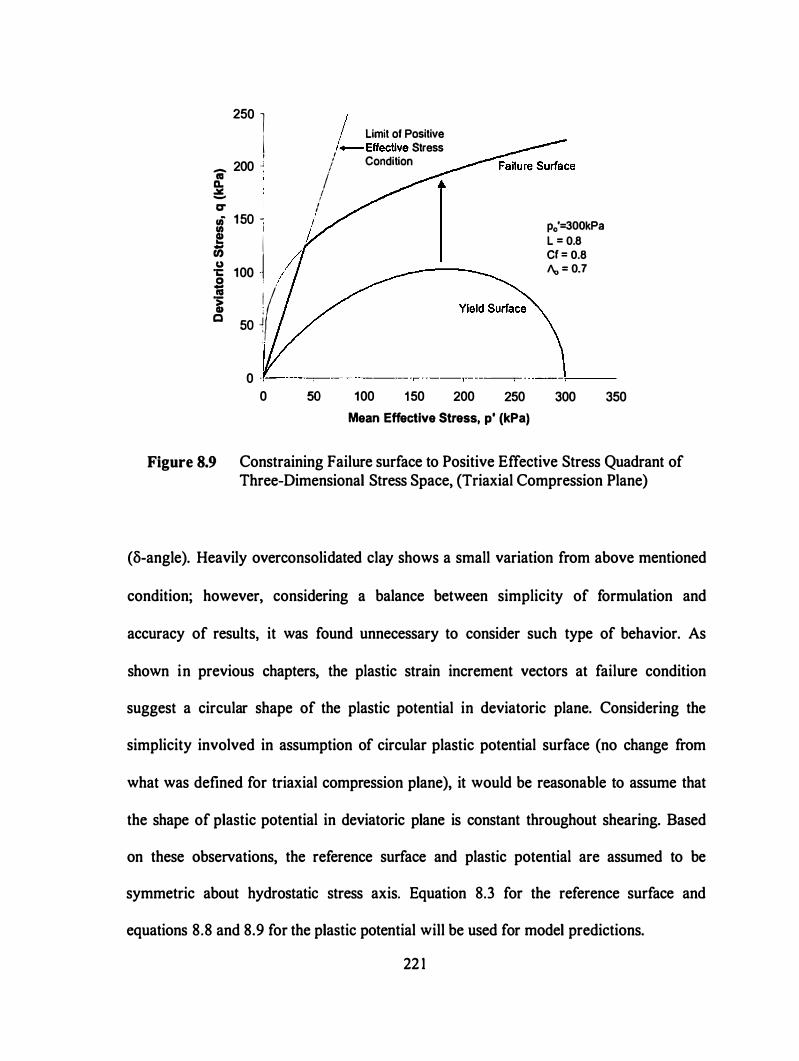
250 1 j Limit of Positive /- effective Stress _ 200 -! / Condition
i / c:r I :t 1 so
1 L' � I � 100 .j //) � . 1 ! / c so �I
I 0
0 50 100 1 50 200 250
Mean Effective Stress, p' (kPa)
p0'=300kPa L = 0.8 Cf = 0.8 flo = 0.7
300 350
Figure 8.9 Constraining Failure surface to Positive Effective Stress Quadrant of Three-Dimensional Stress Space, {Triaxial Compression Plane)
(B-angle). Heavily overconsolidated clay shows a small variation from above mentioned
condition; however, considering a balance between simplicity of formulation and
accuracy of results, it was found unnecessary to consider such type of behavior. As
shown in previous chapters, the plastic strain increment vectors at failure condition
suggest a circular shape of the plastic potential in deviatoric plane. Considering the
simplicity involved in assumption of circular plastic potential surface (no change from
what was defined for triaxial compression plane), it would be reasonable to assume that
the shape of plastic potential in deviatoric plane is constant throughout shearing. Based
on these observations, the reference surface and plastic potential are assumed to be
symmetric about hydrostatic stress axis. Equation 8.3 for the reference surface and
equations 8.8 and 8.9 for the plastic potential will be used for model predictions.
22 1

Model Predictions for Constant b-value True Triaxial Tests (8 = 0°)
A comparison between the model predictions (for b=0.25, 0.5, 0.75 and 1 .0) and
the corresponding experimental data is shown in Fig. 8. 1 0 for OCR=l , Fig. 8. 1 1 for
OCR=5, and Fig. 8. 1 2 for OCR=IO. Predicted stress-strain relationship, and pore
pressure response for OCR= 1 and OCR=5 shows a good agreement with the measured
values, which confirms that the assumption of constant reference surface for different b
values is valid. The shear strength of clay at different b-values is also predicted
reasonably in most cases. As discussed in chapter 5, the experimental data for OCR=IO
shows a strong influence of inherent anisotropy, because of which the model over
predicts the stress-strain relationship for b > 0. However, the pore pressure values are
predicted with reasonable accuracy.
Influence of Principal Stress Rotation
It has been observed that the yield behavior (elasto-plastic stiffuess) of soil
changes significantly with the change in orientation of principal stresses, which is usually
defined by the angle of major principal direction from axis of soil ' s cross-anisotropy, o
angle. Under undrained condition, volumetric response of soil is measured through
evolution of pore pressure, which is also influenced by the rotation of principal stresses.
In the proposed model, yield behavior is essentially controlled by its reference surface,
which is defined by using two parameters CY and A0 • The volumetric response of soil is
controlled by the hardening parameter r . The size of reference surface ( CY ) may change
with the rotation of principal stress; however, its variation along p' axis ( Ao ) can be
assumed constant. Since, the state variable L has a strong relationship with reference
222
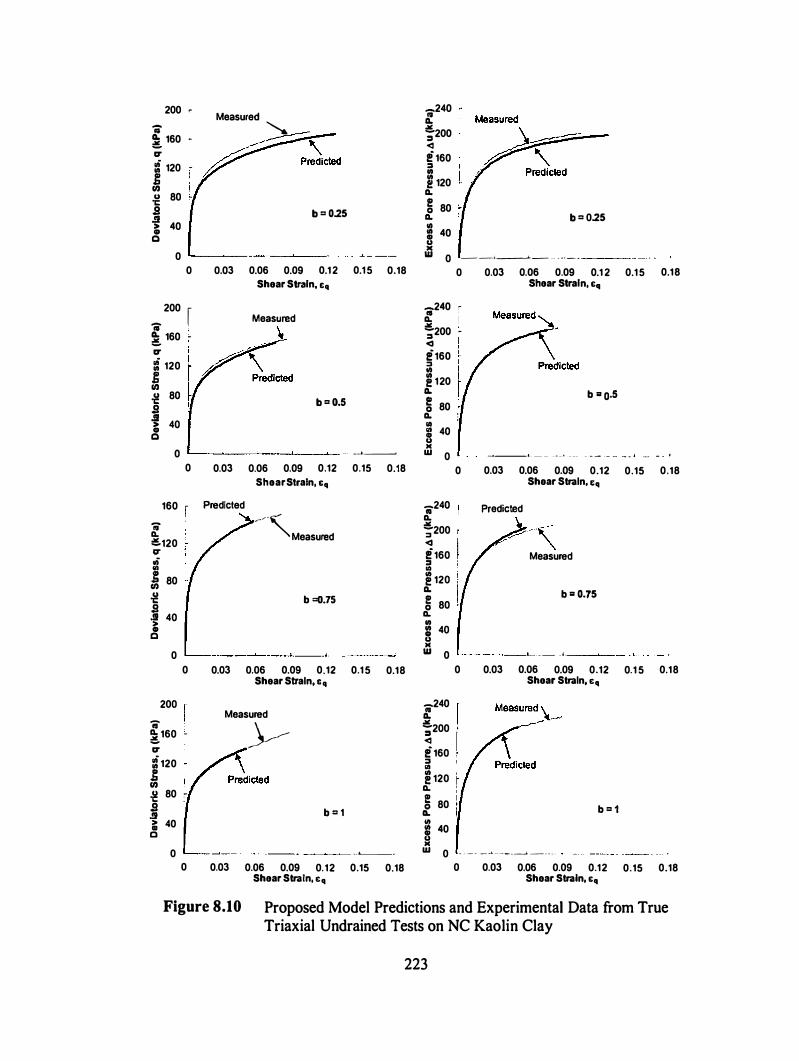
200 '
";' � 160 •
IT
= 120 -g en u 80 1: s .!! > 40 CD
Q
0 0
_ 200 1 � ' � 160 •
IT
= 120 g en
-8 80 s .!! > 40 CD
Q
0 0
160
";' Q.
�120 IT rA ., g 80 en
-8 s .!! 40 > 0
Q
0 0
200
";' � �160
IT
= 120 E en
� 80 c
s .!! ;; 40 c
0 0
Measured �
��-
b = 0.25
----0.03 0.06 0.09 0.12 0.15 0.18
Shear Strain, &q
Measured \
b = O.S
_.�
0.03 0.06 0.09 0.12 0.15 0.18 Shear Strain, &q
Predicted /."Measured
b =0.75
0.03 0.06 0.09 0.12 0.15 0.18 Shear Strain, s q
Measured )��
b = 1
·-'----0.03 0.06 0.09 0.12 0.15 0.18
Shear Strain, &q
-240 � Q. �200 :s <l ! 160 :s "' ! 120
Q.
e 80 0 Q. b = 0.25 Ill Ill 40 CD u )(
w 0 --·�- -· - -· - -
0 0.03 0.06 0.09 0.1 2 0.15 0.18 Shear Strain, &q
-240 c �
Q.
�200 • :s <I !160 :s Ill e 120
Q. b = O.S e 0 80
Q. Ill ., 40 CD u IC w 0 ___ , _ _ _ - - - · --- - - - -- - -� - ' � - - '
0 0.03 0.06 0.09 0.12 0.15 0.18 Shear Strain, t:q
-240 Predicted � Q.
�200 "'"v,_.-· ·\. :I <I !160 Measured :I "' e 120 Q. b = 0.75 e 0 80
Q. "' Ill 40 0 u IC
w 0 L - - - - ' -
0 0.03 0.06 0.09 0.12 0.1 5 0.18 Shear Strain, &q
-240 Ia Q. �200 :I <l ! 160 :I Ill e 120
Q.
� 80 b = 1 Q. = 40 Ql u IC w 0 - - - - _ ....1, ____ ---..J_ _ _ _ _ _
0 0.03 0.06 0.09 0.12 0.15 0.18 Shear Strain, &q
Figure 8.10 Proposed Model Predictions and Experimental Data from True Triaxial Undrained Tests on NC Kaolin Clay
223
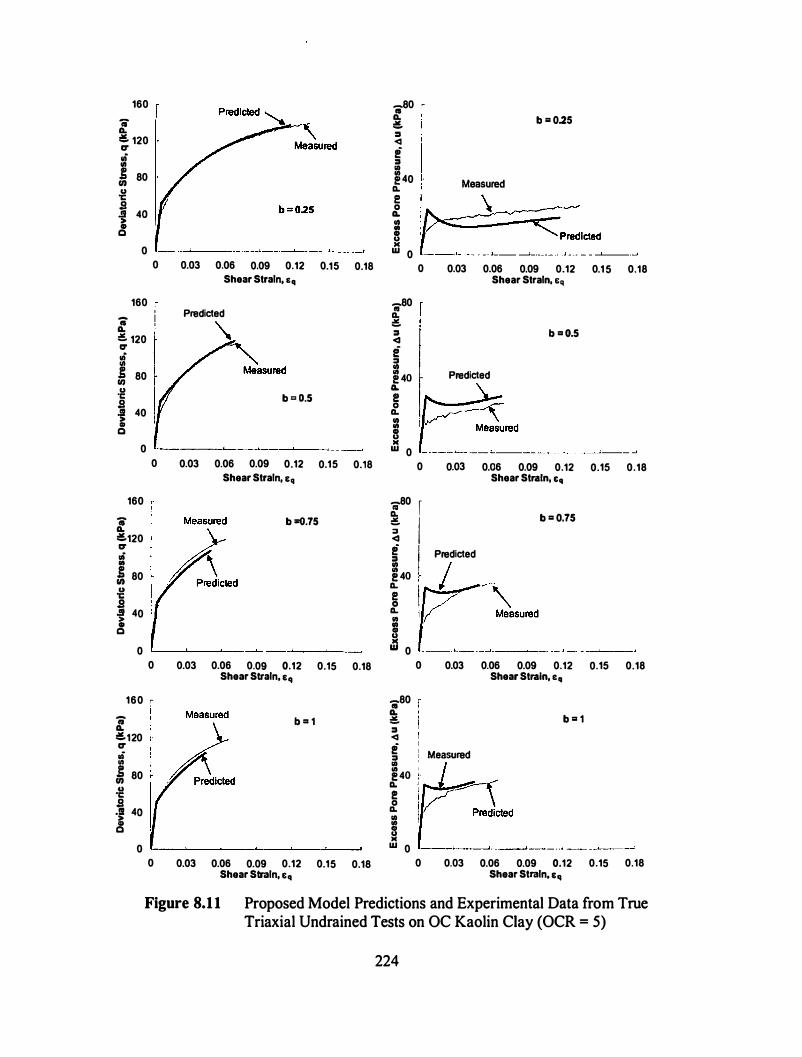
160 -80 -Cl
"ii' a.. b = 0.25 � a.. :I
� 120 <1 f1' ! .n :I "' Ill ' 80 �40 Measured rn u a..
'C ! \ s 0 .! 40 a.. > Ill 0 Ill
Q 0 u )(
0 w 0 0 0.03 0.06 0.09 0.12 0.15 0.18 0 0.03 0.06 0.09 0.12 0.1 5 0.18
Shear Strain, Eq Shear Strain, Gq
160 -80 Predicted Cl
"ii' a.. \. � a.. :I b = O.S � 120 <1 f1' e .n :I "' Ill ' 80 e4o Predicted rn
t�� u a.. ·c b = O.S ! s 0 .! 40 a.. > Ill CD .,
Q 0 u )(
0 w 0 0 0.03 0.06 0.09 0.12 0.15 0.18 0 0.03 0.06 0.09 0.12 0.15 0.18
Shear Strain, e11 Shear Strain, £q
160 -80 r Cl a.. b = 0.75 "ii' b =0.75 � I a.. :I
�120 <1 f1' ! ' Predicted .n :I ., ., ' 80 e4o
t-rn a.. .g !
��-��Md s 0
.! 40 a..
i; Ill Ill
Q CD u )(
0 w 0
0 0.03 0.06 0.09 0.12 0.15 0.18 0 0.03 0.06 0.09 0.12 0.15 0.18 Shear Strain, eq Shear Strain, £ 11
160 r -80 Cl
a.. b = 1 "ii' b = 1 �
a.. :I �120 <1 f1' ! .n :I Measured � Ill
80 e4o rn a.. .g I! s 0 .!! 40 a.. > Ill CD 5 Q
)( 0 w 0
0 0.03 0.06 0.09 0.12 0.15 0.18 0 0.03 0.06 0.09 0.12 0.15 0.18 Shear Strain, £q Shear Strain, e11
Figure 8.1 1 Proposed Model Predictions and Experimental Data from True Triaxial Undrained Tests on OC Kaolin Clay (OCR = 5)
224
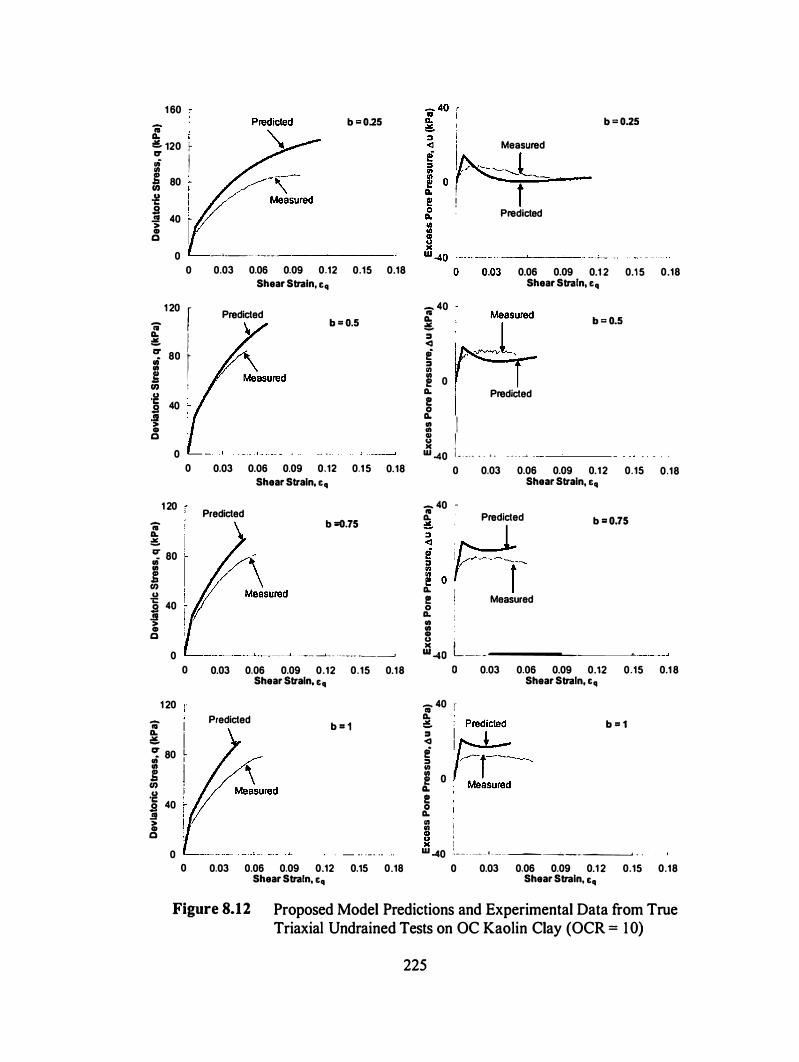
1 60
ii b = 0.25 a. i :!!.. t20 r-ICI' I ur Ill � 80 · �v�,� en
.g s ..!! 40 > Gl c
0
0
ii 1 20 f ! I i
80 r u 'C 40 s .!! > Gl c
0
0
1 20
ii a. :!!.. � 80 Ill Ill � rn u 'C
40 s .!! > Gl c
-•--� -·-----
0.03 0.06 0.09 0.12 0.15 Shear Strain, &q
Predicted b = 0.5
0.03 0.06 0.09 0.12 0.1 5 Shear Strain, &q
Predicted b =0.75
0.18
0.18
0 '----- --l---------'-- - --- ----L- � ------ -��
0 0.03 0.06 0.09 0.12 0.15 0.18 Shear Strain, &q
1 20
ii I Predicted b = 1 a. :!!.. � 80 L Ill
�r-� Ill � rn u 'C
40 s .!! > I Gl c
0 0 0.03 0.06 0.09 0.12 0.15 0.18
Shear Strain, &q
b = 0.25
- 40 "
I .1 Measured � i f I Predicted
0.06 0.09 0.1 2 Shear Strain, &q
! b = 0.5 ::J <I i ::J Ill � 0
a. Predicted � 5 II � w -40 L . . . . . , _ - - - - � _
0.1 5
0 0.03 0.06 0.09 0.1 2 0.15 Shear Strain, &q
- 40 -� Predicted b = 0.75 L�-i ! Measured a. Ill Ill Gl u '
�""o L--�----'---------<-
0.18
0.18
o 0.03 0.06 0.09 0.12 0.15 0.1 8 Shear Strain, &q
r I
� 40
::J <I i ::J Ill � 0 fF:-, Measured a.
� t'l I � I
b = 1
- ! w -40 ·--- --- ' - ----��-------'
0 0.03 0.06 0.09 0.1 2 0.15 0.18 Shear Strain, &q
Figure 8.12 Proposed Model Predictions and Experimental Data from True Triaxial Undrained Tests on OC Kaolin Clay (OCR = 1 0)
225
surface, and the size of reference surface is controlled by parameter CY , the initial value
of L can be defined in relation with CY as shown in equation 8.3 1 .
(8.3 1 )
where lo is an anisotropic state variable. As discussed in previous section, the failure
surface has a strong relationship with three-dimensional stress state; however, it is
assumed to be independent of B-angle. In order to predict the influence of principal stress
rotation using proposed model, it is essential to detennine a continuous relationship
between the angle of rotation and the two affected parameters, CY and r . However, the
true triaxial testing on cubical specimens can only be used for two extreme cases of
principal StreSS rotatiOn, 0=0° and 0=90°.
Model Predictions for extension tests (o = 90°)
Using the parameters listed in Table 1 , the anisotropic state variable /0 (equation
8.3 1 ) is detennined to be /0 = 1 . 136. Using NC data shown in Fig. 3.4 (chapter 3), the
values of two parameters cy and r for extension tests are detennined to be cy = 0.52,
and r =0. 75. Undrained shear behavior of true triaxial extension test on NC clay has been
predicted by using the above parameters, and its comparison with the corresponding
experimental data (Fig. 3.4 in chapter 3) is shown in Fig. 8. 1 3. Predicted stress-strain
relationship, and pore pressure response shows a good agreement with the measured
values. The shear strength and the strain value at failure condition are also predicted
reasonably using the proposed model. These observations show the strength of the
proposed model to predict the anisotropic behavior of clays. The proposed model can be
226
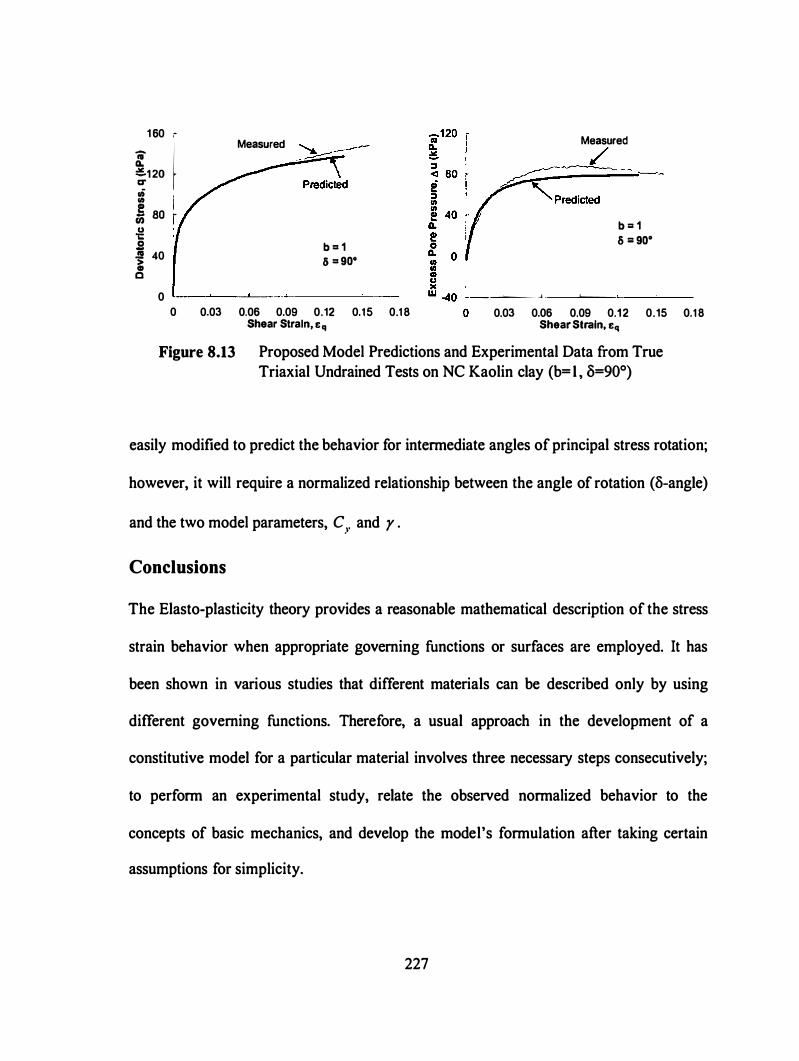
1 60 ..
i,. r
II) '
! I 0 so r .g s .!! 40 � a
Measured
b = 1 a = so•
0 .__..___....____
0 0.03 0.06 0.09 0.12 0.1 5 0.1 8 Shear Strain, £ q
Measured
�--�-/��-' Predicted
b = 1 s = so•
------- -' ·----'---
0.03 0.06 0.09 0.12 0.15 0.1 8 Shear Strain, £q
Figure 8.13 Proposed Model Predictions and Experimental Data from True Triaxial Undrained Tests on NC Kaolin clay (b= I , 5=90°)
easily modified to predict the behavior for intermediate angles of principal stress rotation;
however, it will require a normalized relationship between the angle of rotation (B-angle)
and the two model parameters, C,. and r .
Conclusions
The Elasto-plasticity theory provides a reasonable mathematical description of the stress
strain behavior when appropriate governing functions or surfaces are employed. It has
been shown in various studies that different materials can be described only by using
different governing functions. Therefore, a usual approach in the development of a
constitutive model for a particular material involves three necessary steps consecutively;
to perform an experimental study, relate the observed normalized behavior to the
concepts of basic mechanics, and develop the model's formulation after taking certain
assumptions for simplicity.
227
A new constitutive model was proposed in this research that can predict the
behavior of normally consolidated to overconsolidated clays. Basic formulation of the
model was expressed in the stress space using two stress invariants; mean effective stress
p' , and deviatoric stress q . The proposed rate independent model for hydrostatically
consolidated clays was formulated to follow a non-associative flow rule. The shape of
yield surface was defined on the basis of an acceptable range of elastic deformation that
was determined from the experimental observations. The failure condition was derived
from the widely recognized normalized undrained shear strength behavior of various
overconsolidated clays. Elasticity was assumed to be isotropic. The plastic behavior was
defined to be controlled by a reference surface, which was different from the failure
surface. An additional parameter was introduced in the model to consider that the
volumetric response of various clays under shear loading could be significantly different;
and even for the same clay, if it is anisotropic, various configurations of applied shear
loading could produce significantly different volumetric response.
The basic concept of proposed model was formulated in the triaxial compression
plane. It was then extended to the deviatoric plane on the basis of experimentally
observed normalized behavior of kaolin clay. The model parameters were either directly
measured in standard types of laboratory tests, or were obtained from well-defined
parametric studies. Through the use of these parameters, the model was validated by
comparing the predicted and measured stress strain relationship and pore pressure
behavior.
228
Chapter 9. Conclusions and Recommendations
This chapter summarizes the accomplishments from this study along with
conclusions and recommendations for the future research.
Summary and Conclusions
The current research included experimental and theoretical evaluation of the
three-dimensional mechanical behavior of cohesive soils. The main objective of this
study was to investigate the following; the effect of inherent and stress induced
anisotropy on the three-dimensional mechanical response of clay, the influence of clay's
microfabric on its consolidation and shear behavior, and the role of loading history in the
observed shear stiffiless and strength of an anisotropic clay. In order to achieve this goal,
a series of strain controlled true triaxial undrained tests were performed on remolded
cubical specimens of Kaolin clay. A comprehensive analysis of the experimental data
obtained was presented, and the observed normalized behavior was used to formulate a
theoretical framework. In order to compare the results obtained from various anisotropic
loading conditions, the stress and strain terms were calculated in three-dimensional
invariant form.
The three-dimensional undrained shear tests were performed using a flexible
boundary electro-pneumatic true triaxial system with independent control of the three
principal stresses. External loading on the specimen was applied using flexible
membranes in order to minimize the interference of loading boundaries. A Proportional
Integral-Differential (PID) based real-time feedback control system was employed to
achieve the desired test conditions. The PID algorithm was able to show a precise and
229
repeatable control over the test conditions if the PID coefficients were chosen carefully
with appropriate consideration to the effect of specimen stiffness. The PID coefficients
suitable for testing were found to be a function of shear stress level and the
overconsolidation ratio (OCR) because the specimen stiffness was observed to be varying
significantly with the increase in shear stress level or the OCR value. A procedure was
developed to obtain reproducible specimens of Kaolin clay with controlled microfabric.
The uniform and homogeneous specimens with two distinct microfabrics, flocculated and
dispersed, were obtained by consolidating the Kaolin clay slurry under Ko condition (at
207 kPa axial stress}, as a result they had a certain degree of cross-anisotropy. The
preferred orientation of particles forming the dispersed microfabric added to this
anisotropy in the dispersed specimens, which was termed as fabric induced anisotropy.
Identification of strain localization onset is an important aspect in defining the
point of shear failure precisely, because, beyond this point, the test data without exact
information about specimen deformation is not reliable. A method for the determination
of the onset of localization was proposed in this study based on true triaxial test data.
During all the undrained shear tests performed in this study, specimens were observed to
have localized deformation close to the peak deviatoric stress location, which was
therefore considered as the failure location.
The stress-strain behavior observed from the three types of laboratory tests:
combined axial-torsional tests on hollow cylinder, lubricated end triaxial tests on full
cylinder, and true triaxial tests on cubical specimens, was significantly different. The
specimen shapes and the influence of different boundary conditions played a significant
230
role in this observation. It was determined that various aspects of the soil behavior should
be analyzed using the data obtained from a single testing method.
The experimental data obtained from the constant b-value tests performed on
flocculated specimens indicated that the relative magnitude of principle stresses (b-value)
had no significant influence on the generalized shear stress-strain ( q -eq ) relationship.
However, the increased influence of inherent anisotropy at higher OCR values showed a
small variation in the stress strain relationship with the change in b-value. The fabric
induced anisotropy in dispersed specimens showed a significant influence on the stress
strain relationship even for the normally consolidated case. The specimen strength and
the strain at failure were observed to be decreasing with an increase in b-value. For all the
test conditions and varying microfabric, the strength data (stress at failure) could be
normalized in deviatoric plane using a failure surface based on third invariant of stress
tensor. The plastic strain increment vectors in deviatoric plane, close to failure, could be
described using a circular plastic potential surface. The shear strength of clay was
observed to be independent of the principal stress rotation (B-angle); whereas, the shear
stress-strain relationship showed notable change with a change in B-angle.
In comparison with the flocculated specimens, the dispersed specimens showed
higher plastic but lower elastic deformation during hydrostatic consolidation. The fabric
induced anisotropy showed its major influence on how the specimens deformed
(anisotropically) during hydrostatic consolidation, and it affected the evolution of pore
pressure significantly when the dispersed specimens were subjected to different stress
paths. The dispersed specimens exhibited much stiffer response in the stress-strain
23 1
relationship, achieved higher strength, failed at lower strain values, and showed much
lower pore pressure evolution in comparison with flocculated specimens.
A brief review of the two well-recognized constitutive theories developed for
isotropically consolidated soils, the Modified cam clay (MCC) model and the Single
hardening model, was presented. Both the models did not predict well the mechanical
behavior of kaolin clay observed in the current study. A new constitutive framework was
developed in this study to predict the observed true triaxial mechanical response of
cohesive soils. A teardrop shape for the initial yield surface in triaxial compression plane
(b=O) was proposed on the basis of a reasonable range of elastic deformation estimated
from the experimental data. Using the concept of normalized undrained strength behavior
of overconsolidated clays proposed by Ladd and Foott ( 1974), a dynamic failure surface
was derived as a function of stress state and the pre-consolidation history. The failure
surface was then extended in the deviatoric plane by introducing the third invariant of
stress tensor in its formulation. To capture the brittle response of clay that was observed
due to localized deformations, a reference surface was proposed to control the plastic
deformation during shearing, which was different from the fai lure surface. For simplicity,
the influence of b-value on the reference surface was neglected in the deviatoric plane.
The new model was able to predict the true triaxial response of Kaolin clay with
reasonable accuracy.
Recommendations for Future Research
• In this research, all the testing was performed using remolded specimens of identical
clay in an effort to study the influence of anisotropy, loading history and the change
232
in microfabric on its mechanical response. However, it is necessary to perform similar
studies on other cohesive soils to confirm the findings of this research for natural
soils.
• The isotropic pre-consolidation pressure before shearing was constant for all the true
triaxial tests performed on normally consolidated to overconsolidated clay specimens.
Most often, the soil behavior is linearly normalized for various pre-consolidation
stress levels; however, it is experimentally proven that the assumption of linearity
may not valid for big increments in pre-consolidation stress. Another issue is the type
of loading applied during consolidation. In this study, the specimens were
isotropically consolidated before shearing; however, the soil behavior may be
significantly different if the specimens were consolidated anisotropically (under Ko
condition or at a constant shear stress ratio). The consolidation process may
significantly change the anisotropy of soil.
• In this study, the specimens were sheared under undrained condition; however, both
undrained and drained conditions may exist in various field problems. The influence
of anisotropy under three-dimensional loading may be significantly affected by the
drainage conditions. It would be interesting to perform a series of tests under drained
conditions and correlate the results with the observations from undrained testing.
• The true triaxial device used for testing is capable of measuring pore pressure outside
as well as inside the specimen. To check the saturation level, the specimen was
isotropically loaded by an increment of 5kPa under undrained condition, and the pore
pressure values were recorded with time. The external and internal pore pressure
measurements showed difference in the time taken to reach equilibrium, which could
233
be expected for fine-grained soils due to its low penneability. Study of its cause and
effect may offer a better understanding of the undrained shear behavior dependency
on strain rate, specimen shape and size, and drainage path. It would be interesting to
see similar arrangements for internal pore pressure measurements in other testing
methods as the pore pressure equilibrium and its dissipation rate can significantly
effect the observed consolidation and shear behavior of clays.
• Using a true triaxial device, the principal stresses applied on the specimen can rotate
by 90° only. In order to study the influence of principal stress rotation, a cubical
specimen can be fanned by trimming off a larger specimen in such a way that its
faces have an angle with the direction of deposition.
• The specimen shapes and boundary conditions used m a testing method may
significantly influence the observed mechanical response of soil. In most cases, the
specimen is assumed to be a single element for analysis of data, which may not be
enough to interpret the soil behavior accurately. Simulation of these tests, using
various numerical methods (e.g. finite element or finite difference method) with
correct understanding of the test boundary conditions, may provide a better insight.
• Although, the non-unifonnity of defonnation associated with the use of flexible
boundary condition was small enough and therefore neglected in this study, it should
be further investigated to improve the test conditions.
• In order to study the non-unifonnity and localized defonnations within the specimens
during true triaxial testing, a method should be developed so that the defonnation
profile can be scanned accurately in three-dimensional space.
234
• In the current study, the shape of failure surface in deviatoric plane was reasonably
described using the third invariant of stress tensor, which was independent of the
principal stress rotation with the axis of cross anisotropy. The specimens were
observed to have developed localized deformations or shear bands (in most cases) at
failure location. McKyes and Y ong ( 1 97 1 ) reported that the clay particles in the
proximity of observed shear bands at failure aligned themselves along the failure
plane. If we can assume this to be true for other cohesive materials as well, then based
on the observations from current study, the failure condition at the macro level may
be derived using a correlation between the interparticle forces at micro level and the
void ratio of the soil at macro level. However, at present, the mechanical behavior of
clay at micro level, i.e. the mechanics of clay particles and the interparticle
interactions is largely unknown. For this matter, a comprehensive study could be
performed using the latest facilities available at present that are being used for
crystalline theory and nanotechnology. This study would also be able to answer the
questions related to the onset and propagation of localized deformations in soils.
• The results obtained for heavily overconsolidated Kaolin clay showed that the
influence of anisotropy in the stress-strain relationship could change significantly
with the confining pressure acting on the specimen. The anisotropy of soil was found
to be largely associated with the recoverable deformations. Based on this observation,
the proposed model can be modified to incorporate anisotropic elasticity of clay;
however, this will introduce more parameters and require more tests to determine
them.
235
• The reference surface proposed in the model can be defined as a function of both b
value and B-angle, which will capture the whole array of possibilities in the applied
anisotropic loading. However, a more comprehensive data set is needed to establish a
relationship for the nonnalized stress-strain response of clays in deviatoric plane. The
B-angle is commonly used to represent principal stress rotation, which is defined as
the angle of crt-direction with the axis of cross-anisotropy. For the b=l case, the crt
(=cr2) acts along two orthogonal directions, which creates confusion in defining a
single B-angle. A new way should be established to define the rotation of principal
stress, which will better represent experimental conditions and observations.
• The proposed model in the current study was mostly based on the mechanical
response of flocculated microfabric specimens. The influence of fabric induced
anisotropy and the effect of fabric in volumetric response of clay was not included in
the proposed model. The model could be modified to predict the response of
dispersed microfabric specimens; however, it will make more sense if the fabric of
clay is introduced in the fonn of a model parameter, which will require a continuous
relationship between the microfabric and the mechanical properties of clay. However,
it is difficult to obtain specimen with known intennediate microfabric, because a
method of quantifying intennediate microfabrics (maybe as a degree of dispersion)
itself has not been established yet.
236
List of References
237
List of References
Arthur, J. R. F. ( 1 988). "Cubical devices: versatility and constraints." Advanced Triaxial
Testing of Soil and Rock, ASTM STP 977, Robart T. Donaghe, Ronald C. Chaney,
Marshall L. Silver, Eds., American Society for Testing and Materials, Philadelphia, pp.
743-765
Barden, L. and Sides, G. ( 1 97 1 ). "Sample disturbance in investigation of clay structure."
Geotechnique, Vol. 2 1 , No. 3, pp. 2 1 1 -222.
Berre, T. ( 1982). "Triaxial testing at the Norwegian geotechnical institute." Geotechnical
Testing Journal, Vol. 5, No. 1 , pp. 3- 1 7.
Bishop, A. W. and Henkel, D. J. ( 1960). "The shear strength of saturated remolded
clays." Proceedings of ASCE Research Conference on Shear Strength of Cohesive Soils,
Boulder, Colorado, pp. 533-554.
Broms, B. B. and Casbarian, A. 0. ( 1965). "Effects of rotation of principal stress axes
and of the intermediate principal stress on the shear strength." Proceedings of the sixth
international conference on soil mechanics and foundation engineering, Montreal, Vol.
1 , pp. 1 79- 1 83 .
Burland, J. B. ( 1990). "On the compressibility and shear strength of natural clays.''
Geotechnique, Vol. 40, No. 3, pp. 329-378.
Callisto, L. and Calabresi, G. ( 1 998). "Mechanical Behaviour of a Natural Soft Clay."
Geotechnique, Vol. 48, No. 4, pp. 495-5 1 3.
Carty, W. M. ( 1999). "The Colloidal Nature of Kaolinite." American Ceramic Society
Bulletin, 77 (8), 72-76.
238
Casagrande, A. ( 1 932). "The structure of clay and its importance in foundation
engineering." Contributions of Soil Mechanics, 1 925- 1 940, Boston Society of Civil
Engineers, pp 72- 1 1 2.
Dafalias, Y. F. ( 1 986). "Bounding Surface Plasticity. 1: Mathematical Foundation and
Hypoplasticity." Journal of Engineering Mechanics, Vol. 1 12, No. 9, pp. 966-987.
Dafalias, Y. F. and Herrmann, L. R. ( 1986). "Bounding Surface Plasticity. II: Application
to Isotropic cohesive Soils." Journal of Engineering Mechanics, Vol. 1 1 2, No. 12, pp.
1 263- 1 29 1 .
Dafalias, Y. F . ( 1987). "An anisotropic critical state clay plasticity model." In
Constitutive laws for engineering materials (eds C. S. Desai, E. Krempl, P. D. Kiousis
and T. Kundu), vol. 1 , pp. 5 1 3-52 1 . Amsterdam: Elsevier.
Desai, C. S. and Faruque, M. 0. (1 984). "Constitutive Model for (Geological) Materials."
J. Eng. Mech. ASCE, vol. 1 1 0, no. 9, pp. 139 1 - 1408.
Dimaggio, F. L., and Sandler, I. S. ( 197 1). "Mathematical model for granular soil."
Journal of Engineering Mechanics Division, ASCE, Vol. 97, No. EM3, pp. 935-950.
Drucker, D. C., Gibson, R. E., and Henkel, D. J. ( 1 957). "Soil mechanics and work
hardening theories of plasticity." Transactions of ASME, Vol. 1 22, pp. 338-346.
Duncan, J. M. and Chang C. Y. ( 1 970). "Non Linear Analysis of Stress and Strain in
Soils." ASCE Journal of Soil Mechanics and Foundations Division, Vol. 96, No. SM5,
pp. 1 629- 1653.
Duncan, J. M. and Seed, H. B. ( 1 966). "Anisotropy and Stress Reorientation in Clay."
ASCE Journal of Soil Mechanics and Foundations Division, Vol. 92, No. SMS, pp. 2 1 -
50.
239
Egan, J. A. ( 1 977). "A Critical State Model for the Cyclic Loading Pore Pressure
Response of Soils.'' PhD Thesis, Cornell University, Ithaca, New York, USA.
FLAC ( 1999). "Fast Lagrangian Analysis of Continua: User Guide." Itasca Consulting
Group, Minneapolis, MN, Version 3.4.
Frantziskonis, G., Desai, C. S. and Somasundaram, S. ( 1 986). "Constitutive Model for
Nonassociative Behavior." J. Eng. Mech. ASCE, vol. 1 1 2, no. 9, pp. 923-946.
Germaine, J. T. ( 1 982). "Development of the directional shear cell for measuring cross
anisotropic clay properties," SeD thesis, Massachusetts lnst. of Tech., Cambridge, Mass.
Graham, J., Noonan, M. L., and Lew, K. V. ( 1983). "Yield States and Stress-Strain
Relationships in a Natural Plastic Clay." Canadian Geotechnical Journal, Vol. 20, pp.
502-5 1 6.
Graham, J., Pinkney, R. B., Lew, K. V., and Trainor, P. G. S. ( 1 982). "On Curve Fitting
and Laboratory Data," Canadian Geotechnical Journal, Vol. 1 9, pp. 201 -205.
Habib, M. P. ( 1 953). "Influence of the Variation of the Intermediate Principal Stress on
the Shearing Strength of Soil." Proceedings of third international conference on soil
mechanics and foundation engineering, Vol. 1 , pp. 1 3 1 .
Hambly, E. C. ( 1 972). "Plane Strain Behavior of Remoulded Normally Consolidated
Kaolin." Geotechnique, Vol. 22, pp. 30 1-3 17.
Han, C. and Vardoulakis, I. ( 1 99 1 ). "Plain Strain Compression Experiments on Water
saturated Fine-grained Sand." Geotechnique, Vol. 4 1 , pp. 29-44.
Haythomthwaite, R. M. ( 1960). "Stress and Strain in Soils." Plasticity, New York,
Pergamon press, Inc., pp. 1 958.
240

Hazen, 1., and Penumadu, D. ( 1 999). "Resonant column testing of clay specimens with
controlled microfabric." Report No. 99-02, Dept. of Civil & Env. Engg., Clarkson
University, Potsdam, NY.
Henkel, D. J. ( 1959). "The Relationship Between the Strength, Pore-water Pressure, and
Volume-change Characteristics of Saturated clay." Geotechnique, Vol. 9, pp. 1 1 9- 1 35.
Henkel, D. J. ( 1 960). "The Shear Strength of Saturated Remoulded Clay." Proceedings of
the ASCE Research conference on Shear Strength of Cohesive Soils, Boulder, Colo., pp.
533-554.
Hill, R. ( 1 962). "Acceleration Waves in Solids." J. Mech. and Physics of Solids, Vol. 10,
pp. 1 - 1 6.
Houston, W. N. and Mitchell, J. K. ( 1 968). "Property interrelationships in sensitive
clays." Journal of Soil Mechanics and foundation division, ASCE, Vol. 95, No. SM4, pp.
1 037- 1062.
Hvorslev, M. J. ( 1 937). "Uber die Festigkeitseigenschaften Gestorter Bindiger Boden."
("On the Physical Properties of Remoulded Cohesive Soils"). Ingeniorvidenskabelige
Skrifter. A. No. 45. 1 59 pp.
Hvorslev, M. J. ( 1960). "Physical Components of the Shear Strength of Saturated Clays."
ASCE Research Conf on Shear Strength of Cohesive Soils, University of Colorado,
Boulder, Colorado, June 1960, pp. 69-273.
Jamiolkowski, M., Ladd, C.C., Germaine, J.T., and Lancellotta, R. ( 1 985). "New
developments in field and laboratory testing of soils." Proceedings of the / / th
International Conference on Soil Mechanics and Foundation Engineering, Vol. 1 , pp. 57-
1 53 .
241
Kim, Moonkyum ( 1 988). "A Study of Constitutive Models for Frictional Materials."
PhD. Thesis, University of California, Los Angeles.
Kim, M. K. and Lade, P.V. ( 1 988). "Single Hardening Constitutive Model for Frictional
Materials 1: Plastic Potential Function." Computers and Geotechnics, Vol. 5, pp. 307-
324.
Kirby, R. C., and Wroth, C. P. ( 1 977). "Application of Critical State Soil Mechanics to
the Prediction of Axial Capacity for Driven Piles in Clay." 9h Offshore Technology
Conference, OTC paper No. 2942,
Kirkgard, M. M. ( 1988). "An experimental study of the. three-dimensional behavior of
normally consolidated anisotropic clay." PhD thesis, University of California, Los
Angeles.
Kirkgard, M. M. and Lade, Pout V. ( 1 993). "Anisotropic Three-Dimensional Behavior of
a normally consolidated clay." Canadian Geotechnical journal, 30, pp. 848-858.
Kjellman, W. ( 1 936). " Report on an apparatus for consummate investigation of the
mechanical properties." Proceedings of the First International Conference on Soil
Mechanics and Foundation Engineering, Cambridge, Mass. , Vol. 2, pp. 1 6-20.
Ko, H.Y., and Scott, R.F. ( 1 967). "A New Soil Testing Apparatus." Geotechnique, Vol.
1 7, No. 1 , pp. 40-57.
Krizek, R. J., Edil, T. B., and Ozaydin, I. K. ( 1 975). "Preparation and identification of
samples with controlled fabric." Engineering Geology, Vol. 9, No. 1 , pp. 1 3-38.
Kulhawy, F. H., Mayne, P. W. ( 1990). "Section 4- strength." Manual on Estimating soil
Properties for Foundation Design, Electric Power Research Institute, El-6800, Project:
1 493-6,
242
Ladd, C. C., and Foott, R. ( 1974). "New design procedure for stability of soft clays,"
ASCE Journal of the Geotechnical Engineering Division, Vol. 1 00, No. GT7, pp. 763-
786.
Lade, P. V. ( 1977). "Elasto-Plastic Stress-Strain Theory for Cohesionless Soil With
Curved Yield Surface." Int. J. Solids Structures, Vol. 13 , pp. 1 0 19- 1035.
Lade, P. V. ( 1 977). "Stress-Strain Theory for Normally Consolidated Clay." 3rd Int. Conf.
Numerical Methods Geomechanics, Aachen, pp. 1 325- 1 337.
Lade, P.V. ( 1 978). "Cubical Triaxial Apparatus for Soil Testing." Geotechnical Testing
Journal, Vol. I , No. 2, pp. 93 - 10 1 .
Lade, P . V . ( 1990). "Single Hardening Model with Application to NC Clay." Journal of
Geotechnical Engineering, Vol. 1 1 6, No. 3, pp. 394-415 .
Lade, P . V., Duncan, James M . ( 1973). "Cubical Triaxial tests on Cohesionless Soil."
Journal of the Soil Mechanics and Foundations Division, Vol. 99, No. SM I O, pp. 793-
8 12.
Lade, P.V. and Kim, M. K. ( 1988). "Single Hardening Constitutive Model for Frictional
Materials II: Yield Criterion and Plastic Work Contours." Computers and Geotechnics,
Vol. 6, pp. 1 3-29.
Lade, P.V. and Kim, M. K. ( 1988). "Single Hardening Constitutive Model for Frictional
Materials III: Comparision With Experimental Data." Computers and Geotechnics, Vol.
6, pp. 3 1-47.
Lade, P. V. and Musante, H. M. ( 1978). "Three-Dimensional Behavior of Remolded
Clay." ASCE Journal of Geotechnical Engineering Division, Vol. 1 04, No. GT2, pp .
1 93-209.
243
Lade, P. V., Nelson, R. B., and Ito, Y. M. ( 1 987). "Nonassociated Flow and Stability of
Granular Materials." ASCE Journal of Engineering Mechanics, Vol. 1 13 , No. 9, pp.
1 302- 1 3 1 8.
Lade, P. V., Nelson, R. B., and Ito, Y. M. ( 1988). "Instability of Granular Materials with
Nonassociated Flow." ASCE Journal of Engineering Mechanics, Vol. 1 14, No. 1 2, pp.
2 1 73-2 1 9 1 .
Lambe, T. W . ( 1 958). The structure of compacted clays. Proc. American Society of Civil
Engineers, Vol. 84, No. SM2, pp. 1 -34.
Lin, H. and Penumadu, D. (2002). "Interpretation of combined axial-torsional test for 3-D
constitutive behavior of geo-materials." Proceedings of the 15th ASCE Engineering
Mechanics Conference, Columbia University, NY, USA.
Mandeville, D. and Penumadu, D. (2000). "Testing procedures for obtaining fixed
inclination of major principal stress for 3-D testing of cohesive soil."
Proceedings, 14th Engineering Mechanics Conference (EM 2000), Texas,
Austin, USA.
Mandeville, D. and Penumadu, D. (2003). "True Triaxial Testing System for Clay with
Proportional-Integral-Differential Control." ASTM Geotechnical Testing Journal, 27, No.
2, GTJ I 1 756, pp. 1 - 1 2.
Martin, R. T. ( 1 965). "Quantitative fabric of consolidated Kaolinite." Massachusetts
Institute of Technology, Research Report R65-47, Soils Publication No. 1 79.
Mayne, P. W. ( 1 979). "Discussion of "Normalized Deformation parameters for Kaolin"
By H. G. Poulos." Geotechnical Testing Journal. Vol. 1 , No. 2, pp. 1 02- 1 06.
244
Mayne, P. W. and Holtz, R.D. ( 1 985). "Effect of Principal Stress Rotation on Clay
Strength." Proceedings of the eleventh international conference on soil mechanics and
foundation engineering. San Francisco, Vol. 2, pp. 579-582.
Mayne, P. W. and Swanson, P. G. ( 198 1 ). "The Critical-State Pore Pressure Parameter
from Consolidated-Undrained Shear Test." Laboratory Shear Strength of Soil, ASTM STP
740. ASTM, pp. 4 1 0-430.
McConnachie, I. ( 1 974). "Fabric Changes in Consolidated Kaolin." Geotechnique, Vol.
24, No. 2, pp. 207-222.
McKyes, E. and Yong, R. N. ( 197 1 ). "Three Techniques for Fabric Viewingas Applied to
Shear distortion of Clay." Clays and Clay Minerals, Vol. 1 9, pp. 289-293.
Mesri, G. and Godlewski, P. M. ( 1 977). "Time- and stress-compressibility
interrelationship." Journal of Geotechnical Engineering Division, ASCE, Vol. 1 03, No.
No. GT5, pp. 4 17-430.
Mitchell, R. J. ( 1 970). "On the Yielding and Mechanical Strength of Leda Clay."
Canadian Geotechnical Journal, Vol. 7, pp. 297-3 12.
Mitchell, J . K. ( 1 964). "Shearing Resistance of Soil as a Rate Process." Journal of Soil
Mechanics and foundation Division, ASCE, Vol. 90, No. SMI , pp. 29-6 1 .
Mitchel, J. K. ( 1993). "Fundamentals of soil Behavior." Second Edition, John Wiley and
Sons Inc.
Mitchell, J. K. and McConnell, J. R. ( 1965). "Some Characteristics of the elastic and
plastic deformation of clay on initial loading." Proceedings of the sixth international
conference on Soil Mechanics and Foundation Engineering, Vol. 1 , pp. 3 13-3 17.
245

Morgenstern, N. R. and Tchalenko, J. S. ( 1 967). "Microstructural observations on shear
zones and slips in natural clays." Proceedings of the Geotechnical Conference, Oslo, Vol.
1 , pp. 1 47- 1 53 .
Mroz, Z. ( 1 963). "Non-associated flow laws in plasticity." Journal de Mecanique. Vol. 2,
no. 1 , pp 2 1 -42.
Nakai, T. and Matsuoka, H. ( 1 983). "Shear behavior of sand and clay under three
dimensional stress conditions." Soils and Foundations, Vol. 23, No. 2, pp. 26-42.
Nakai, T. and Matsuoka, H. ( 1986). "A Generalized Elastoplastic Constitutive Model for
Clay in Three Dimensional Stresses." Soils and Foundations, Vol. 26, No. 3, pp. 8 1 -98.
Olson, R. E. and Mesri, G. ( 1970). "Mechanisms Controlling the Compressibility of
Clay." Journal of Soil Mechanics and Foundation division, ASCE, Vol. 96, No. SM6, pp.
1 863- 1 878.
Palmer, A. C. and Rice, J. R. ( 1 973). "The Growth of Slip Surfaces in the Progressive
Failure of Over-consolidated Clay." Proc. of the Royal Society of London series a
Mathematical Physical and Eng. Sciences, A332, pp. 527-548.
Parry, R. H. G. ( 1960). "Triaxial Compression and Extension Tests on Remoulded
Saturated Clay." Geotechnique, Vol. 1 0, 1960, pp. 166- 1 80.
Parry, R. H. G. and Nadarajah, V. ( 1973). "Observations on Laboratory Prepared, Lightly
Overconsolidated Specimens of Kaolin," Geotechnique, Vol. 24, No. 3, pp. 345-358.
Pearce, J. A. ( 1 97 1 ). "A New Triaxial Apparatus." Proceedings, Roscoe Memorial
Symposium, G. T. Foulis, Henley on Thames, pp. 330-339.
246
Penumadu, D. ( 1 996). "Evaluating Clay Microfabric Using scannmg Electron
Microscopy and Digital Information Processing." Transportation Research record 1526,
pp. 1 1 2- 1 20.
Penumadu, D., Skandarajah, A. and Chameau, J. L. ( 1998). "Strain-rate Effects in
Pressuremeter Testing Using a Cuboidal Shear Device: Experiments and Modeling,"
Canadian Geotechnical Journal, Vol. 35, pp. 27-42.
Perry, R. H., 1 973, Chemical Engineers Handbook, 5th edition.
Prashant A. and Penumadu D. (2004). "Effect of intermediate principal stress on
overconsolidated kaolin clay." ASCE, Journal of Geotechnical and Geoenvironmental
Engineering, Vol. 1 30, No. 3, pp. 284-292.
Prashant A. and Penumadu D. (2003). "A Laboratory Study of Normally Consolidated
Kaolin Clay." In Review, Canadian Geotechnical Journal.
Prevost, J. H. ( 1978a). "Anisotropic Undrained Stress-Strain Behavior of Clays." Journal
of Geotechnical Engineering Division. Vol. 1 04. No. GT8. pp. 1 075- 1090.
Prevost, J. H. ( 1 978b). "Plasticity Theory for Soil Stress-Strain Behavior." Journal of
Geotechnical Engineering Division. Vol. 104. No. EMS. pp. 1 1 77- 1 1 94.
Prevost, J. H. ( 1 98 1 ) . "Nonlinear Anisotropic Stress-Strain-Strength Behavior of Soils.''
Laboratory Shear Strength of Soil. ASTM STP 740. Eds. R. N. Yang and F. C. Townsend.
pp. 43 1-455.
Quigley, R. M. and Thompson, C. D. ( 1 966). 'The fabric of anisotropically consolidated
sensitive marine clay." Canadian Geotechnical Journal. Vol. 3, No. 2, pp. 6 1 -73.
Reddy, K.R., Saxena, S.K., and Budiman, J.S. ( 1992). "Development of a True Triaxial
Testing Apparatus." Geotechnical Testing Journal, Vol. 1 , No. 2, pp. 89- 105.
247
Rendulic, L. ( 1 936). "Relation Between Void Ratio and Effective Principal Stresses for a
Remoulded Silty Clay." Proceedings of First international conference on soil mechanics
andfoundation engineering, Vol. 3, pp. 48-5 1 .
Rice, J. R. ( 1 97 5). "On the Stability of Dilatant Hardening for Saturated Rock Mass." J.
of Geophysical Research, Vol. 80, No. 1 1 , pp. 153 1 - 1 536.
Roscoe, K. H. and Burland, J. B. ( 1 968). "On the generalized stress- strain behaviour of
'wet clay' ." Engineering plasticity (eds J. Heyman and F. A. Leckie), pp. 535-609.
Cambridge: Cambridge University Press.
Roscoe, K. H., Schofield, A. N. and Thurairajah, A. ( 1963). "Yielding of clays in state
wetter than critical." Geotechnique, Vol. 8, pp. 22-53.
Roscoe, K. H., Schofield, A. N. and Wroth, C. P. (1 958). "On Yielding of Soils."
Geotechnique, Vol. 13 , No. 2, pp. 2 1 1-240.
Rowe, P.W., and Barden, L. ( 1964). "Importance of free ends in triaxial testing." Journal
of Soil Mechanics and Foundation Division, Vol. 90, No. SM1 , pp. 1-27.
Saada, A.S. ( 1 988). "Hollow cylinder torsional devices: their advantages and
limitations." Advanced Triaxial Testing of Soil and Rock, ASTM STP 977, pp. 766-795.
Saada, A.S. and Bianchini, G.F. ( 1975). "The strength of one-dimensionally consolidated
clays." Journal of the Geotechnical Engineering Division-ASCE, Vol. 1 0 1 , No. 1 1 , pp.
1 15 1 - 1 1 64
Schofield, A. N. and Wroth, C. P. ( 1 968). "Critical State Soil Mechanics." Maidenhead,
McGraw-Hill.
Seah, T. H. ( 1990). "Anisotropy of normally consolidated Boston blue clay." SeD thesis,
Massachusetts Inst. of Tech., Cambridge, Mass.
248
Seed, H. B. and Chan, C. K. ( 1 959). "Structure and Strength Characteristics of
Compacted Clays." Journal of Soil Mechanics and Foundation Division, ASCE, Vol. 85,
No. SM5, pp. 87- 1 28.
Seed, H. B., Mitchell, J. K., and Chan, C. K. ( 1 962). "Swell and swell pressure
characteristics of compacted clays." Highway Research Board Bulletin, 3 13, pp. 12-39.
Sheeran, D. E. and Krizek, R. J. ( 197 1 ). "Preparation of Homogeneous Soil Samples by
Slurry Consolidation." Journal of Materials, Vol. 6, No.2, pp. 356-373.
Shibata, T. and Karube, D. ( 1965). "Influence of the Variation of the Intermediate
Principal Stress on the Mechanical Properties of Normally Consolidated Clays."
Proceedings of the sixth international conference on soil mechanics and foundation
engineering, Montreal, 2/48, pp. 359-363.
Sivakugan, N., Chameau, J. L., Holtz, R. D. and Altshaeffi, A. G. ( 1 988). "Servo
Controlled Cuboidal Shear Device." Geotechnical Testing Journal, Vol. I I , No. 2, pp.
1 1 9- 124.
Skempton, A.W. ( 1 954). "The pore pressure coefficients A and B." Geoteclmique, Vol. 4,
pp. 143- 147.
Soga, K. ( 1994). "Mechanical behavior and constitutive modeling of natural structured
soils." PhD. Thesis, Dept. of Civil & Env. Engg., University of California, Berkeley, CA.
Sture, S., and Desai, C. S. ( 1 979). "Fluid Cushion Truly Triaxial or Multiaxial Testing
Device." Geotech. testing J., Vol. 2, No. 1 , pp. 20-33.
Tavenas, F. , Rosiers, Des, J. P., Leroueil, S. , Rochelle, La, P., and Roy, M. ( 1979). "The
Use of Strain Energy as a Yield and Creep Criterion for Overconsolidated Clays."
Geotechnique, Vol. 29, No. 3, pp. 285-303.
249
Terzaghi, K. ( 1925). "Erdbaumechanik auf Bodenphysikalischer Grundlage." Deuticke,
Vienna, pp. 399.
P. A. Thiessen ( 1 942). "Wechselseitige Adsorption von Kolloiden," Ztachr. Elektrochem,
Vol. 48, No. 1 2, pp. 675-68 1 .
Vaid, Y. P. and Campanella, R. G. ( 1 974). "Triaxial and Plane Strain Behavior ofNatural
Clay." Journal of the Soil Mechanics and Foundations Division, Vol. 1 00, No. GT3, pp.
207-224.
Vardoulakis, I. ( 1 982). "Stability and Bifurcation of Soil Samples." In: Constitutive
Relations for Soils, (Editors G. Gudehus et al.), Balkema, Rotterdam, pp. 477-483 .
Vardoulakis, I. ( 1 985). "Stability and Bifurcation of Undrained, Plane Rectilinear
Deformations on Water-saturated Granular Soils." Int. J. for Numerical and Analytical
Methods in Geomechanics, Vol. 9, pp. 339-414.
Vardoulakis, I. and Sulem, J. ( 1 995). "Bifurcation Analysis in Geomechanics." Chapman
and Hall Publication, London.
Vardoulakis, I. ( 1 996). "Deformation of Water-saturated sand: I Uniform Undrained
Deformation and Shear Banding. II The effect of Pore-water Flow and Shear Banding."
Geotechnique, Vol. 46, No. 3, pp. 441 -472.
Wang, Q. and Lade, P. V. (2001 ). "Shear Banding in True Triaxial Tests and Its Effect on
Failure in Sand." Journal of Engineering Mechanics, Vol. 1 27, No. 8, pp. 754-761 .
Whittle, A. J. and Kavvadas, M. J. ( 1994). "Formulation of MIT-E3 Constitutive Model
for Overconsolidated Clays." Journal of Geotechnical Engineering. Vol. 120, No. 1 , pp.
1 73- 1 98.
250
Whittle, A. J., DeGroot, D. J., Ladd, C. C. and Seah, T. H. ( 1 994). "Model prediction of
anisotropic behavior of Boston blue clay." Journal of Geotechnical Engineering, ASCE,
1 20( 1 ), 1 99-224.
Wissa, A. E. Z., Christian, J. T., Davis, E. H., and Heiberg, S. ( 1 97 1 ). "Consolidation at
constant rate of strain." Journal of the Soil Mechanics and Foundations Division, Vol.
97, No. SMI O, pp. 1 393- 14 13 .
Wood, D. M. ( 1 990). "Soil behaviour and critical state soil mechanics." Cambridge:
Cambridge University Press.
Wu, T. H., Loh, A. K., and Malvern, L. E. ( 1 963). "Study of Failure Envelop of Soils."
Journal of the Soil Mechanics and Foundations Division, Vol. 89, No. SM1 , pp. 145- 1 8 1 .
Yong, R. N. and McKyes, E. ( 1 967). "Yielding of Clay in Complex Stress Field."
Proceedings of third panamerican conference on soil mechanics and foundation
engineering, Caracas, Venezuela, Vol. 1 , pp. 1 3 1 - 143 .
Yong, R. N. and McKyes, E. ( 1 97 1 ). "Yield and Failure of Clay Under Triaxial Stresses."
Journal of the Soil Mechanics and Foundations Division, Vol. 97, No. SM l , pp. 1 59- 176.
25 1
Appendices
252
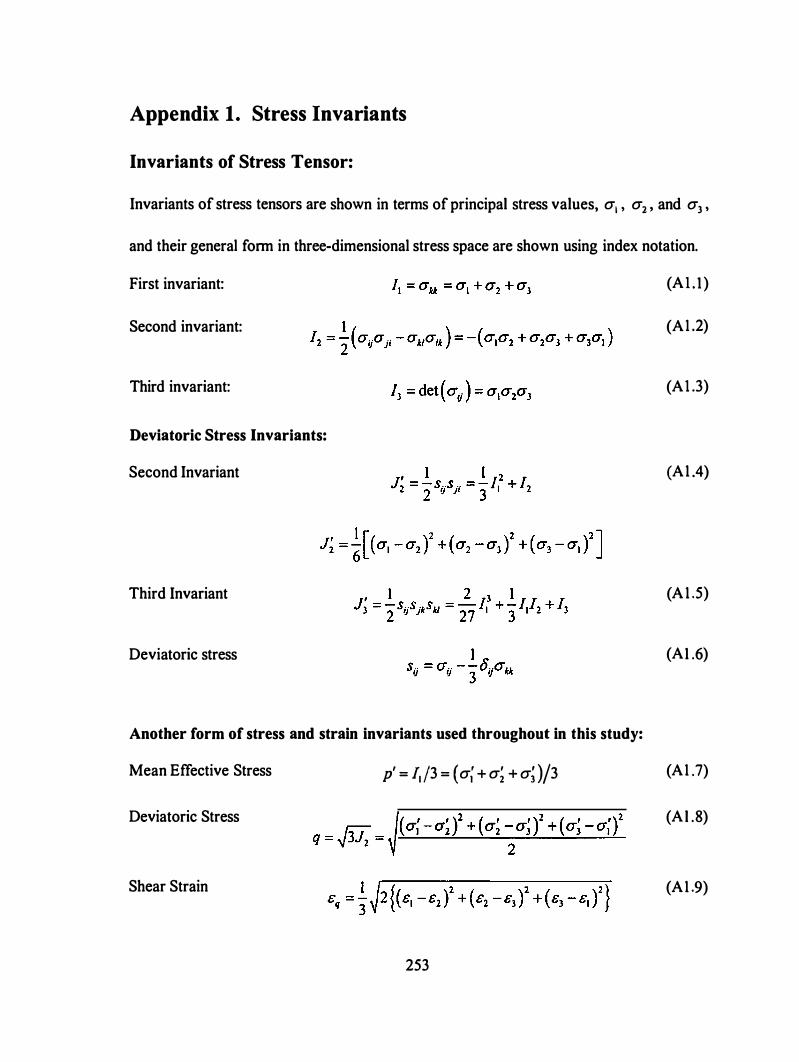
Appendix 1. Stress Invariants
Invariants of Stress Tensor:
Invariants of stress tensors are shown in terms of principal stress values, a1 , a 2 , and a3 ,
and their general fonn in three-dimensional stress space are shown using index notation.
First invariant: (ALI )
Second invariant: (A1 .2)
Third invariant: (Al .3)
Deviatoric Stress Invariants:
Second Invariant {Al .4)
Third Invariant (A l .5)
Deviatoric stress (A1 .6)
Another form of stress and strain invariants used throughout in this study:
Mean Effective Stress p' = 11 /3 = (a; + a� + a; )/3 (Al .7)
Deviatoric Stress (A l .8)
Shear Strain (Al .9)
253

Derivatives of Stress Tensor Invariants:
where, oij and eimn are defined as
[eu�: = 1 if, ijk = 123, 23 1,3 12 e0�: = -1 if, ijk = 321,132,2 1 3 e0k = 0 if, i = j, i = j, j = k, or i = j = k
254
(Al . IO)
(Al . l l)
(Al . l 2)
{Al . l3)
(Al . l4)

Appendix 2. Modified Cam-Clay Model: Formulation in
Principal Stress Space
Elastic Deformation:
Elastic Bulk modulus, K' = vp 1/K
where, v is specific volume, v = 1 + e , and e is void ratio.
Yong's Modulus E can be defined using elastic bulk modulus as
E = 3 ( l - 2v)vp 1jK
Using Hook's Law, the incremental elastic strains can be defined as
where, e1 = 1 for j = I , 2, and 3.
Plastic Deformation:
Yield Surface and Plastic Potential Surface:
Differentiate equation A2.4,
Hardening Rule:
of 3( I) M 2 ( I 2 I) au. = U; - p - -
3- Po - p
I
op I vp I _
o =
o O&P (A - K)
255
(A2. 1 )
(A2.2)
(A2.3)
(A2.4)
(A2.5)
(A2.6)
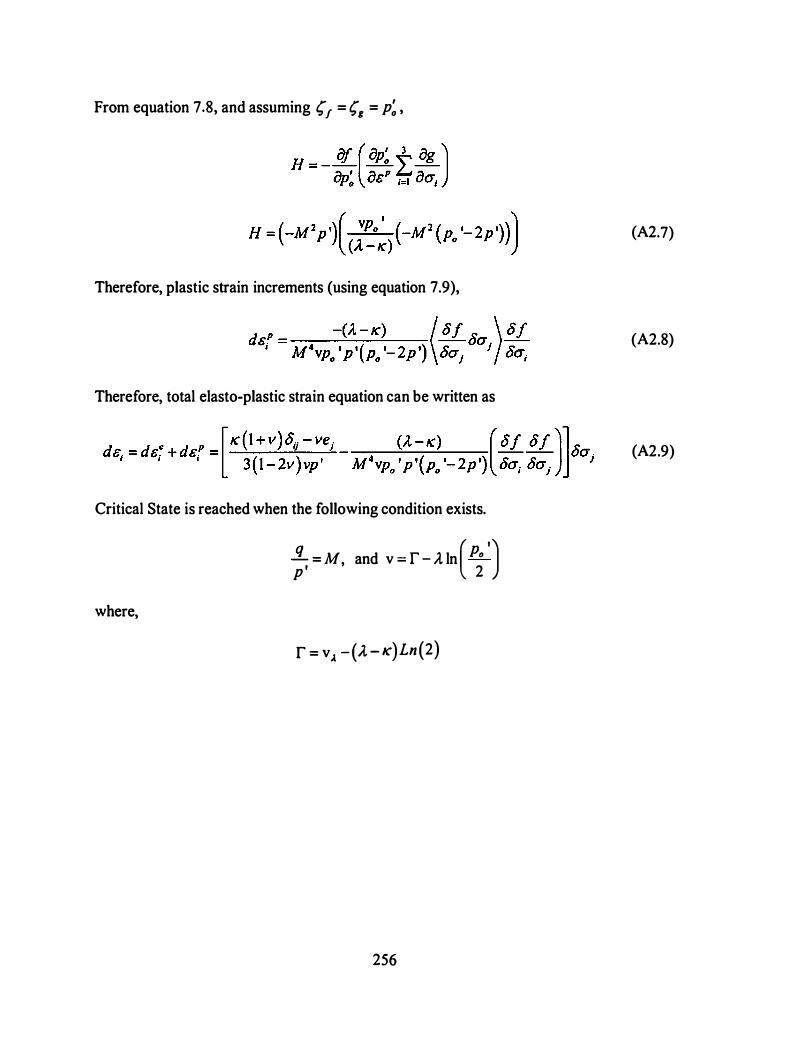
From equation 7.8, and assuming (1 = (1 = p; ,
Therefore, plastic strain increments (using equation 7.9),
Therefore, total elasto-plastic strain equation can be written as
Critical State is reached when the following condition exists.
where,
!!.._ = M and v = r - A. ln (P
o ') p ' ' 2
r = v A - (A. - K) Ln ( 2)
256
(A2.7)
(A2.8)
(A2.9)
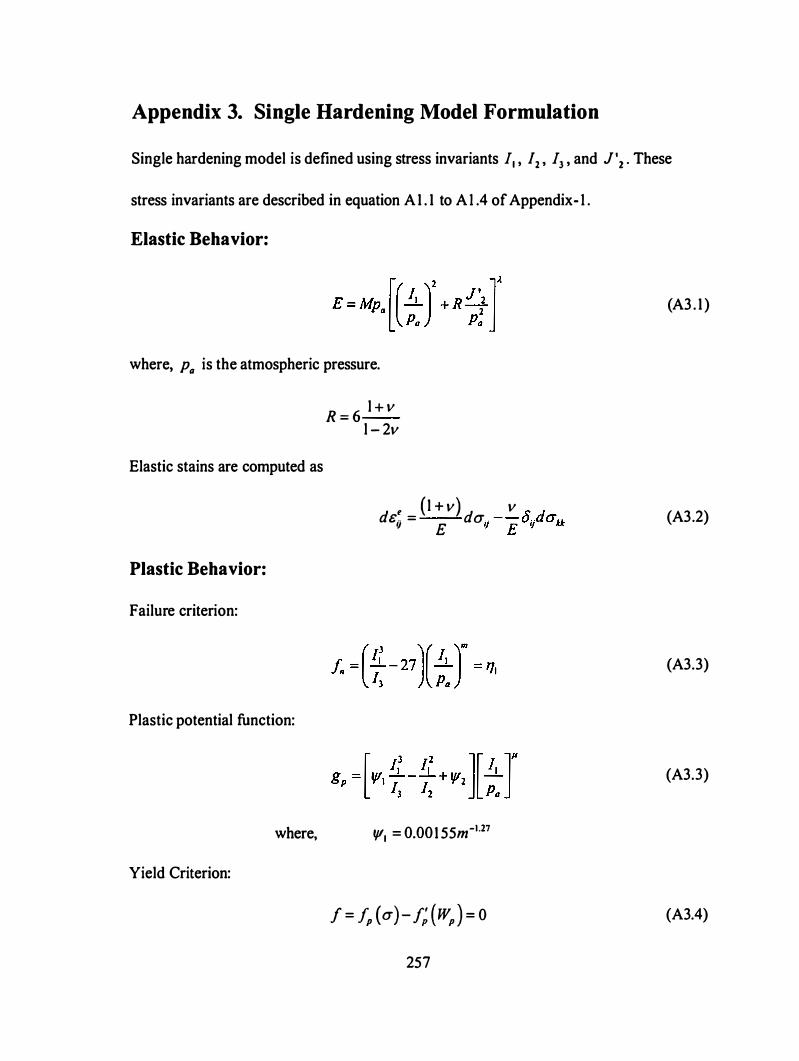
Appendix 3. Single Hardening Model Formulation
Single hardening model is defined using stress invariants /1 , I 2 , /3 , and J '2 • These
stress invariants are described in equation A 1 . 1 to A 1 .4 of Appendix- 1 .
Elastic Behavior:
where, p a is the atmospheric pressure.
Elastic stains are computed as
Plastic Behavior:
Failure criterion:
Plastic potential function:
where,
Yield Criterion:
R = 6 l + v
l - 2v
f! ( l + v) v de .. = da . --O,;;daLL " E " E ' ""
f//1 = 0.001 55m-1.27
f = [p (a)-r; ( wp ) = 0
257
(A3 . 1 )
(A3.2)
(A3.3)
(A3.3)
(A3.4)
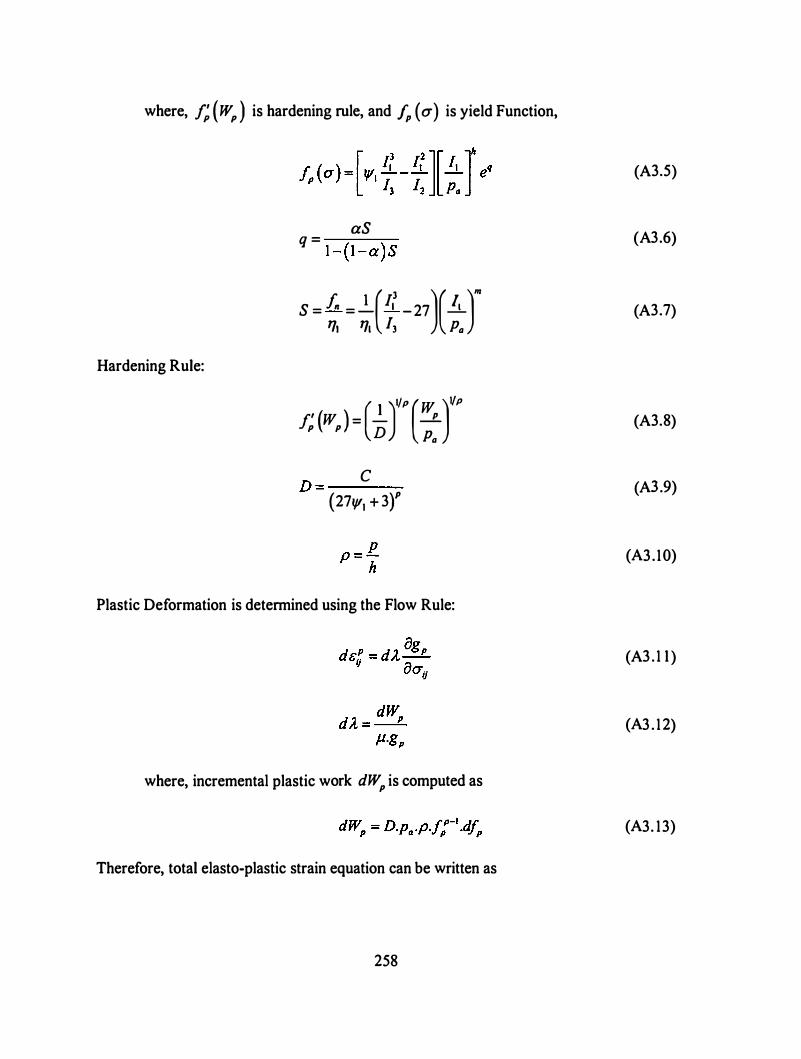
where, /; ( WP ) is hardening rule, and fp ( u) is yield Function,
Hardening Rule:
aS q = -�----:--
1 - (1 -a)S
S = /, = _!_( J( -27)(.!J_)
m 11J 1'1! /3 Pa
, _ (
1 )I/ p (
wp )
v P
f. (w ) - - -
P P D Pa
c D =----
(2711'1 + 3Y
Plastic Deformation is determined using the Flow Rule:
where, incremental plastic work dWP is computed as
Therefore, total elasto-plastic strain equation can be written as
258
(A3.5)
(A3.6)
(A3.7)
(A3.8)
(A3.9)
(A3 . 10)
(A3 . 1 1 )
(A3 . 1 2)
(A3. 13)
(A3 . 14)
Derivatives of yield and Plastic Potential Functions with respect to
Stress Components:
Yield Function:
Ofp _ ofp oi, ofp oi3 - - - - + - -oaij of, ouij of3 oaij
Plastic Potential Function:
ogp ogp of, ogp of2 ogp o/3 - = -- - + -- - + -- -oaij ol, ouij of2 ouij o/3 oaij
(A3. 1 5)
(A3 . 16)
In these equations, the derivatives of yield and plastic potential functions with respect to
stress invariants can be defined as shown in equations A3 . 1 7 to A3 .2 1 . The derivatives of
stress invariants with respect to stress components can be used from equation A 1 . 10 to
A l . l 2 of Appendix- I .
(A3. 1 7)
(A3. 1 8)
(A3. 1 9)
259
(A3.20)
(A3.21)
260
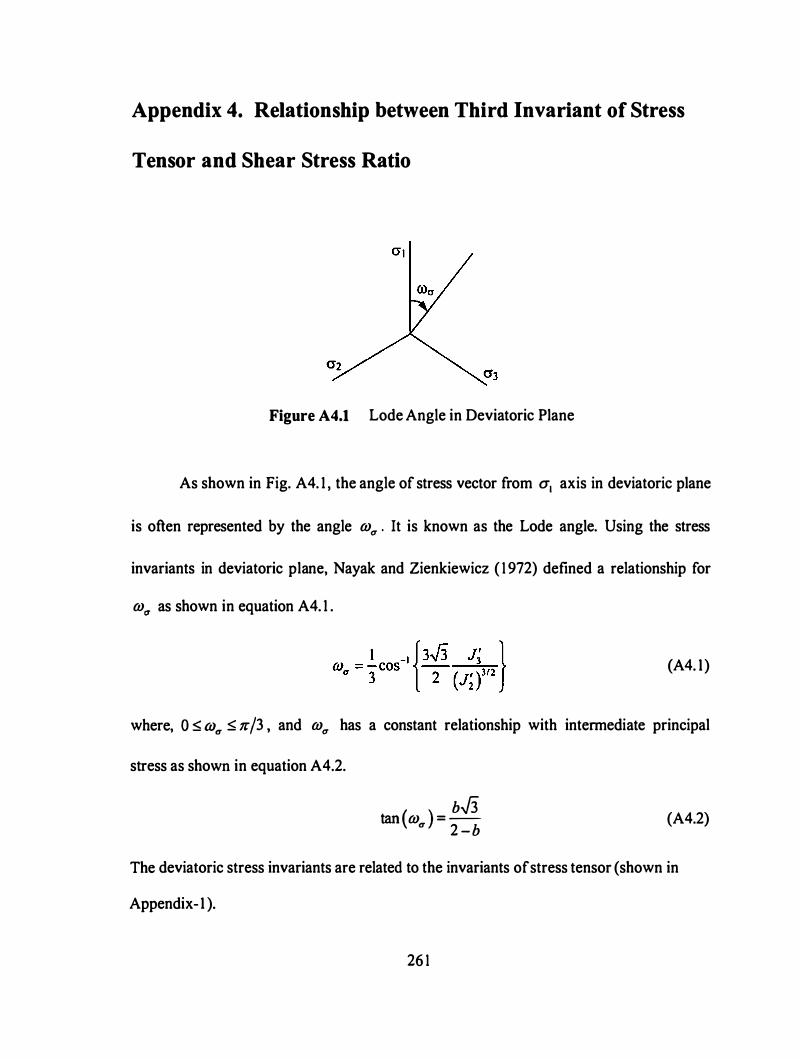
Appendix 4. Relationship between Third Invariant of Stress
Tensor and Shear Stress Ratio
Figure A4.1 Lode Angle in Deviatoric Plane
As shown in Fig. A4. 1 , the angle of stress vector from a1 axis in deviatoric plane
is often represented by the angle wu . It is known as the Lode angle. Using the stress
invariants in deviatoric plane, Nayak and Zienkiewicz ( 1 972) defined a relationship for
wu as shown in equation A4. 1 .
(A4. 1 )
where, 0 S wu S tr/3 , and wu has a constant relationship with intermediate principal
stress as shown in equation A4.2.
bJ3 tan (w ) = u 2 -b (A4.2)
The deviatoric stress invariants are related to the invariants of stress tensor (shown in
Appendix- 1 ).
26 1
J, l z I z = -I• + 2 3
(A4.3)
(A4.4)
In Appendix- 1 , the mean effective stress p' and deviatoric stress q were defined in
terms of the stress invariants:
From equations A4.3 to A4.6,
2
J' = !!_ 2 3
I = J' _!Iz = i_ -3p'z 2 2 3 I 3
Using the relationships defined above, equation A4. 1 can be defined as
2 P,!L_ _ p'3 + I
27 3 3 cos (3mu ) =
2 q3
(A4.5)
(A4.6)
(A4.7)
(A4.8)
(A4.9)
Using the definition of shear stress ratio, 17 = q I p' , equation A4.9 can be rearranged to
equation A4. 1 0.
I 2r/ 172
-3 = -cos (3m )-- + 1 p'3 27 (T 3
262
(A4. 10)
Variation of 77 for 13/ p'3 to be constant
If 77 = 11o at (J)u = 0 , then equation A4. 10 gives,
(A4. 1 1 )
For 13/ p'3 to be constant, equation A4. 1 1 gives the variation of 77 as
(A4. 1 2)
For :!3 to be positive, 0 ::; k ::; 27 .
A general solution for the cubic equation defined in equation A4. 12 is,
(A4. 1 2)
This relationship also defines the variation of 77 with b-value under the condition that
133 is constant because (J)u and b-value have a constant relationship as was shown in
p' equation A4.2.
263
Appendix 5. Procedure for Projecting Principal Stress State
onto an Octahedral/Deviatoric Plane
The specimens subjected to various proportional loading conditions do not fail at
the same value of mean effective stress or octahedral normal stress; however, the
difference is usually small enough to allow for linear interpolation of principal stresses so
that their mean value in all cases is a constant. This is under the assumption that the soil
has no cohesion and the failure surface is straight for a small increment. Modified
principal stress values can be computed using equation A5. 1 .
this gives,
From Fig. A5. 1 and Fig A5.2, the value of a:
Similarly, the value ofb and c:
a = {3 (a·
- a ) V2 I oct
b = {3 (a· - a ) V2 2 oct
c = {3 (a· - a ) V2 3 oct
264
(A5 . 1 )
(A5.2)
(A5.3)
(A5.4)
(A5.5)
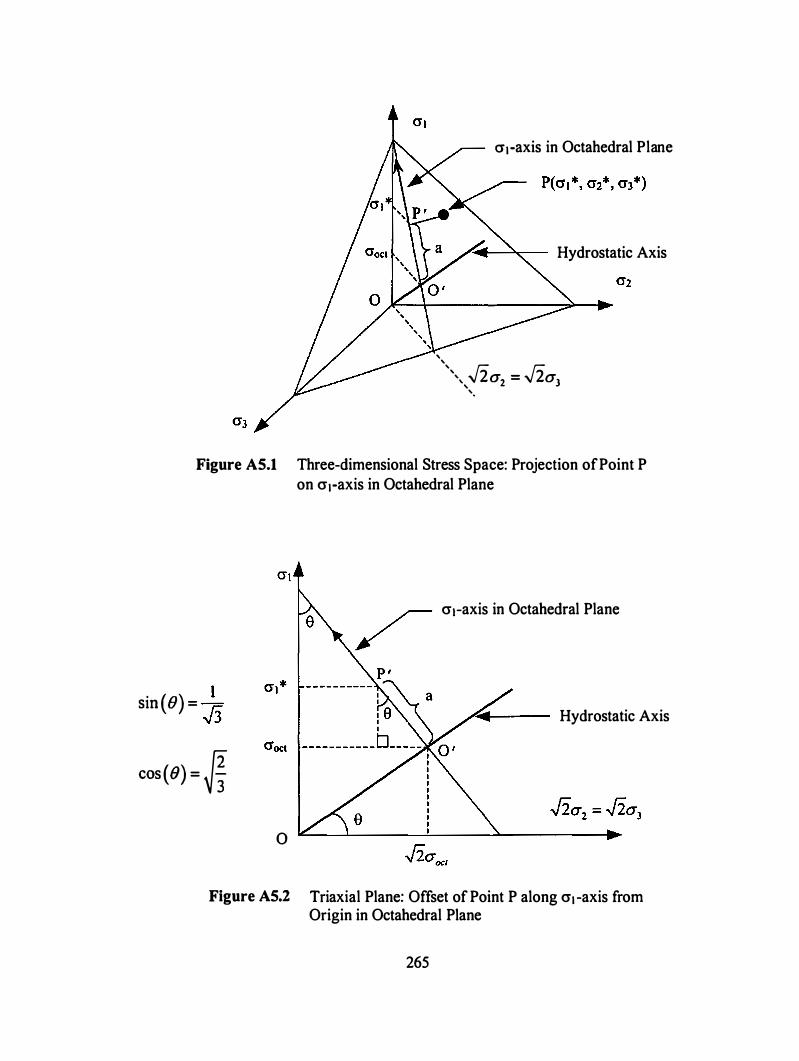
' '
<11-axis in Octahedral Plane
Hydrostatic Axis
'',,, .Jia 2 = .Jia3
'·
Figure A5.1 Three-dimensional Stress Space: Projection of Point P on cr1-axis in Octahedral Plane
sin (B) = )J cos (8) =�
0
Figure A5.2
cra-axis in Octahedral Plane
Hydrostatic Axis
Triaxial Plane: Offset of Point P along cr1 -axis from Origin in Octahedral Plane
265
Figure A5.3 shows the projections a, b, and c for a general stress point in 3-D stress
space. Figure A5.4 shows the same projections in the octahedral plane with orthogonal
basis along x, and y-axis. From Fig. A5.4, y-coordinate is equal to a:
From Fig. A5.4, x-coordinate:
.J3 x = -(-a -2c) 3
Substituting equation A5.4 and A5.5 into equation A5.7:
(A5.6)
(A5.7)
(A5.8)
The direction of principal strain increments can be considered to be in the
direction principal stress directions. The magnitude of strain increment is immaterial,
only the direction of strain increment vector is of interest, which depends on the relative
magnitudes of strain increments. The slope of strain increment in octahedral plane with
coordinate basis x and y is:
(A5.9)
(A5. 1 0)
266
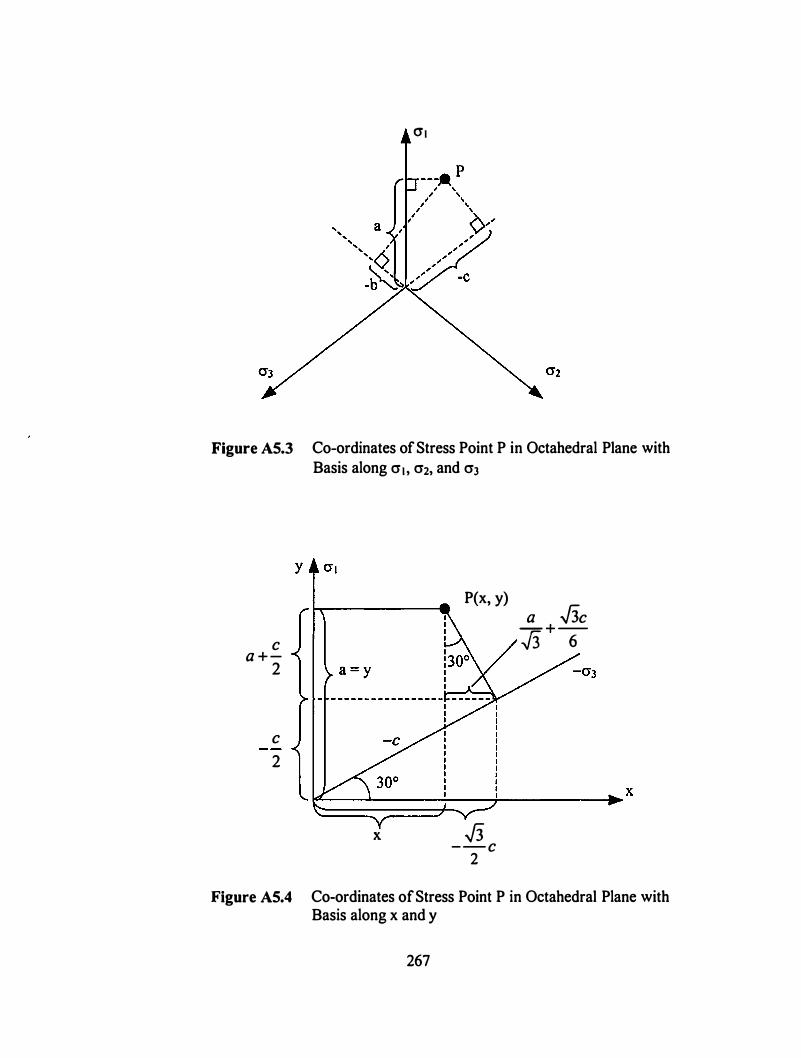
O't
Figure A5.3 Co-ordinates of Stress Point P in Octahedral Plane with Basis along cr 1 , cr2, and cr3
c a + -2
c 2
P(x, y)
X .J3 --c 2
a .J3c - + --..[3 6
Figure A5.4 Co-ordinates of Stress Point P in Octahedral Plane with Basis along x and y
267
Vita
Amit Prashant was born in Kanpur, U.P., India, on July 27, 1 976. He attended one
of the best high schools in state and graduated in 1 993 . Following high school, Amit
attended University of Roorkee, India, (currently known as Indian Institute of
Technology, Roorkee) and graduated in 1 997 with a bachelor of engineering degree in
civil engineering. During his stay in Roorkee, he participated in many student activities
and received uninterrupted merit scholarship for his academic performance. Upon
completion of college, he began his engineering career working with Consulting
Engineering Services (India) Ltd. in New Delhi, India, where he worked on a research
project by Indian Road Congress. Realizing his interest in research and development,
Amit decided to pursue for higher studies. In July 1999, Amit accepted a Graduate
Research Assistantship from Clarkson University at Potsdam, NY, and started to pursue a
master's degree in civil engineering under the supervision of Dr. D. Penumadu. Later, his
study was approved for direct Ph.D program. In August 200 1 , Dr. Penumadu joined The
University of Tennessee at Knoxville (UTK), and Amit followed him and transferred to
UTK. Amit's research during the Ph.D program focused mainly on the study of the
mechanical behavior of geomaterials using innovative experimental techniques and
advanced constitutive modeling theories. He graduated as a Doctor of Philosophy in Civil
Engineering in May 2004.
� 29!)1 4H E/23114 \�tR i
268
Copyright © 2022 FDOKUMEN