
Unexpected peaks in tandem mass spectra due to reaction of ...
Upload
independentCategory
view
0download
0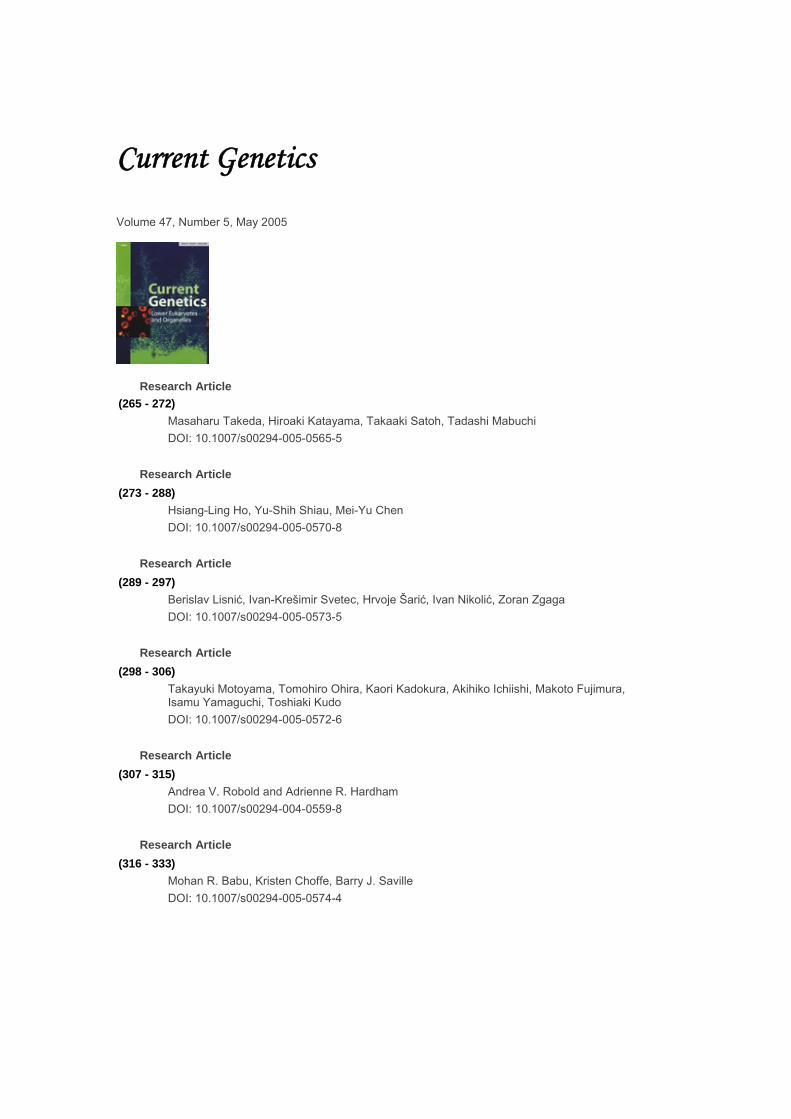
Current Genetics Volume 47, Number 5, May 2005
Research Article (265 - 272) Masaharu Takeda, Hiroaki Katayama, Takaaki Satoh, Tadashi Mabuchi DOI: 10.1007/s00294-005-0565-5 Research Article (273 - 288) Hsiang-Ling Ho, Yu-Shih Shiau, Mei-Yu Chen DOI: 10.1007/s00294-005-0570-8 Research Article (289 - 297) Berislav Lisnić, Ivan-Krešimir Svetec, Hrvoje Šarić, Ivan Nikolić, Zoran Zgaga DOI: 10.1007/s00294-005-0573-5 Research Article (298 - 306)
Takayuki Motoyama, Tomohiro Ohira, Kaori Kadokura, Akihiko Ichiishi, Makoto Fujimura, Isamu Yamaguchi, Toshiaki Kudo
DOI: 10.1007/s00294-005-0572-6 Research Article (307 - 315) Andrea V. Robold and Adrienne R. Hardham DOI: 10.1007/s00294-004-0559-8 Research Article (316 - 333) Mohan R. Babu, Kristen Choffe, Barry J. Saville DOI: 10.1007/s00294-005-0574-4
RESEARCH ARTICLE
Masaharu Takeda Æ Hiroaki Katayama Æ Takaaki SatohTadashi Mabuchi
Three copies of the ATP2 gene are arranged in tandem onchromosome X in the yeast Saccharomyces cerevisiae
Received: 13 October 2004 / Revised: 27 December 2004 / Accepted: 31 December 2004 / Published online: 18 March 2005� Springer-Verlag 2005
Abstract We previously reported that there were threecopies of ATP1 coding for F1-a and two copies of ATP3coding for F1-c on the left and right arm of chromosomeII, respectively. In this study, we present evidence thatthere are three closely linked copies of ATP2 encodingthe b subunit of the F1F0-ATPase complex on the rightarm of chromosome X in several laboratory strains,including Saccharomyces cerevisiae strain S288C, al-though it was reported by the yeast genome project thatATP2 is a single-copy gene. Chromosome X fragmen-tation, long-PCR, chromosome-walking and ATP2-dis-ruption analysis using haploid wild-type strains andprime clone 70645 showed that the three copies of ATP2are present on the right arm of chromosome X, likethose of ATP1 on chromosome II. Each was estimatedto be approximately 4 kb apart. We designated theATP2 proximal to the centromere as ATP2a, the middleone as ATP2b and the distal one as ATP2c. The regioncontaining the three ATP2s is composed of two repeatedunits of approximately 7 kb; that is, both ends (ATP2a,ATP2c) accompanying the ATP2-neighboring ORFs arethe same. A part of YJR119c, YJR120w, YJR122w(CAF17) and YJR123w (RP55), which were reported bythe yeast genome project, are contained in the ATP2
repeated units; and the middle ATP2 of the threeATP2s, ATP2b, is located between the two repeatedunits. Expression of all three copies of ATP2 (ATP2a,ATP2b, ATP2c) was confirmed because a single ordouble ATP2-disruptant could grow on glycerol, but atriple ATP2-disruptant could not. In addition, of thethree copies of ATP1 and ATP2, even if only one copyof the ATP1 and ATP2 genes remained, the cells grewon glycerol.
Keywords F1F0-ATPase Æ ATP2 Æ Repetitive genes ÆChromosome X Æ Saccharomyces cerevisiae
Introduction
The F1F0-ATPase complex (also known as H+ -depen-dent ATP synthase, EC3.6.1.34) is the enzyme that cat-alyzes the production of ATP from ADP and inorganicphosphate, using the transmembrane H+ gradient gen-erated by the action of an electron transport chain.Because of this property, it is essential for the enzyme toassociate with the membrane. The F1F0-ATPase com-plex plays a central role in oxidative phosphorylationand thus respiration in all aerobic organisms. It localizesin bacterial plasma membranes, mitochondrial innermembranes and chloroplast thylakoid membranes. It ishighly conserved in both amino acid sequence andsubunit structure (Futai and Kanazawa 1983; Falk et al.1985; Cox et al. 1992). In addition, the F1F0-ATPasecomplex functions as a molecular motor: the c subunit ofF1-ATPase rotates within the ab-hexamer, together withthe membrane-embedded proton-conducting unit F0
(Abrahams et al. 1994; Noji et al. 1997).In the case of Saccharomyces cerevisiae, the F1F0-
ATPase complex is localized on the mitochondrial innermembrane and the F1 subunits constituting F1 are allcoded by the nuclear DNA, whereas those constitutingF0 are partly coded by the nuclear and partly by themitochondrial DNA (Cox et al. 1992; Arnold et al.
Communicated by S. Hohmann
M. Takeda Æ H. Katayama Æ T. SatohDepartment of Applied Life Science,Sojo University, 4-22-1 Ikeda,Kumamoto 860-0082, Japan
T. MabuchiDepartment of Biochemistry,Interdisciplinary Graduate School of Medicine and Engineering,University of Yamanashi, Tamaho,Nakakoma, Yamanashi 409-3898, Japan
M. Takeda (&)Department of Material and Biological Engineering,Tsuruoka National College of Technology,Tsuruoka, Yamagata 997-8511, JapanE-mail: [email protected].: +81-235-25-9130Fax: +81-235-25-9130
Curr Genet (2005) 47: 265–272DOI 10.1007/s00294-005-0565-5

1998). Both F1 and F0 are necessary for ATP synthaseactivity, whereas F1 alone retains the ability to hydrolyzeATP (F1-ATPase; Noji et al. 1997). We focused ourattention on the assembly of the F1 subunits, the func-tions of each subunit in assembly and the catalysis andgene dosage for each subunit. F1 consists of five distinctsubunits, a, b, c, d and e, in a stoichiometry of 3:3:1:1:1.These subunits are coded by ATP1, ATP2, ATP3,ATP16 and ATP15, respectively (Cox et al. 1992).
Recently, we revealed that three copies of ATP1 arearranged in tandem on the left arm of chromosome II(Takeda et al. 1995, 1999), rather than one as reported bythe genome project (Mewes et al. 1997). The copy num-ber of ATP1 is coincident with the stoichiometry of the asubunit of F1-ATPase. However, two copies of the ATP3encoding the c subunits were also found on the right armof chromosome II, contrary to the subunit stoichiometryexpected (Ohnishi et al. 2003). Gene disruption experi-ments in ATP1 and ATP3 showed that all multiple genecopies of ATP1s and ATP3s express and function. Thismeans that the number of multiple gene copies might notonly be reflected in subunit stoichiometry but might alsohave other important biological significance.
Here, we show the copy number of the ATP2encoding the b subunit of the F1F0-ATPase complex, acatalytic subunit of the complex function, in the yeastS. cerevisiae. ATP2 was reported by the yeast genomeproject as a single-copy gene on the right arm of chro-mosome X (Galibert et al. 1996), as were ATP1 andATP3. We showed that three copies of ATP2 are ar-ranged in tandem on the right arm of chromosome Xand expressed as three identical copies of the ATP1encoding the a subunit of the complex on the left arm ofchromosome II in the yeast. The copy numbers of ATP1and ATP2 were coincident with the subunit stoichiom-etry of the respective subunits (a, b) in the F1F0-ATPasecomplex, but the copy number of ATP3 encoding the csubunit was not. These results suggested that the num-ber of multiple gene copies might play another role inliving cells, other than simply being a member of theF1F0-ATPase complex. The biological meaning of thethree ATP2 genes of the F1F0-ATPase complex in livingyeast cells is currently under study.
Materials and methods
Yeast strains
The yeast strains used in this study were: S. cerevisiaeYNN290 (MATa/a ade2-101/ade2-101 lys2-801/lys2-801ura3-52/ura3-52 trp1-D1/trp1-D1), SH964 [MATa ade2-101 lys2-801 ura3-52 his7 CFVII (RAD2, d)], DC5(MATa leu2-3 leu2-11 his3 can1-11), LL20 (MATa leu2his3), W301-1A (MATa leu2-3 leu2-112 his3-11 his3-15trp1-1 ura3-1 ade2-1 can1-100), W303-1B (MATa leu2-3leu2-112 his3-11 his3-15 trp1-1 ura3-1 ade2-1 can1-100),DBY746 (MATa his3-D1 leu2-3 leu2-112 ura3-52 trp1-289) and S288C (MATa SUC2 mal mel gal2 CUP1).
Escherichia coli strains
The Escherichia coli strains used in this study were: C600(F� thi-1 thr-1 leuB6 lacy tonA21 surE44 k� mcrA�
mcrB+), MC1066 (F�D(lacIPOZY) X74 galU galK rpsLhsdR trpC9830 leuB600 pyrF74:TN5) and JM109 (recA1endA1 gyrA96 thi-1 supE44 relA1 k�D(lacDproAB), [F�traD36 proAB lacIqZDM15] mcrA� mcrB+).
Plasmids
The ATP2 gene-disrupted plasmid pMBY8¢-2 was con-structed as follows. The ATP2 gene was digested withNcoI and BamHI; and the HindIII fragment of URA3(1.17 kb), the HpaI fragment of LEU2 (2.2 kb), or theBamHI fragment of the HIS3 gene (1.7 kb, filled-in ifnecessary) was inserted into the NcoI and BamHI site(filled-in if necessary) of ATP2.
Media
E. coli carrying plasmid was grown in LB (0.5% yeastextract, 1% bacto-tryptone, 1% NaCl) containing50 lg/ml ampicillin. Yeast strains were grown onYPDM [1% yeast extract, 0.5% bacto-peptone, 0.1%(NH4)2SO4, 0.2% KH2PO4, 0.1% MgSO4, 0.8% glu-cose], or SD (0.67% yeast nitrogen base without aminoacids, 2% glucose, with appropriate nutrients). Solidmedia contained 1.5% agar.
Polymerase chain reaction
PCR was performed according to the procedure for theTakara Pyrobest polymerase PCR kit (Takara Bio, Shi-ga, Japan). The primer pairs used were 5¢-CGCAA-GAACAGTAACAAAAT-3¢ (sense) and 5¢-GATTTTC-AGGTTATTGTTTG-3¢ (antisense). These primers werelocated just outside the ATP2-coding region (Takedaet al. 1985). DNA was amplified in PCR processors(TEMP control system PC-700; Astec, Fukuoka, Japan)using 30 cycles. Whole yeast DNAs from each strainused in this study were processed by the method reportedby Takeda et al. (1999). The PCR products from eachtemplate were cloned into a vector pBluescript (Strata-gene, La Jolla, Calif., USA) and Southern hybridizationwas performed with the ATP2 gene as a probe for therepetitive area.
Pulsed-field gel electrophoresis
Amplified DNAs were separated in a 1% agarose gel onan alternating contour-clamped homologous electricfield (CHEF) gel apparatus (Bio-Rad, Calif., USA).Electrophoresis was carried out for 16 h in 0.5· TBE
266
buffer at 200 V (14�C) with a 2.8–3.4 s linear gradient,as described by Takeda et al. (1995).
Preparation of mitochondria
Cells were grown in 50 ml of YPDM medium. Afterincubation in YPDM medium for 24 h at 30�C, the cells(ca. 2–4·106 cells/ml) were harvested and mitochondriawere prepared according to the published method(Daum et al. 1982).
F1-ATPase activity
ATPase activity was measured by the published proce-dure (Pullman et al. 1960).
Western blotting
Immuno-detection of proteins was performed accordingto the procedures described by Mabuchi et al. (2000).
Miscellaneous
Southern hybridization of digoxigenin (DIG)-labeledATP2 (2.6 kb EcoRI-HindIII fragment) and HIS3(1.7 kb BamHI fragment) and other probes neighboringthe ATP2 used in the experiments were performed asdescribed by Takeda et al. (1995).
Results
Gene disruption of ATP2 in various strains andchromosome Southern analysis
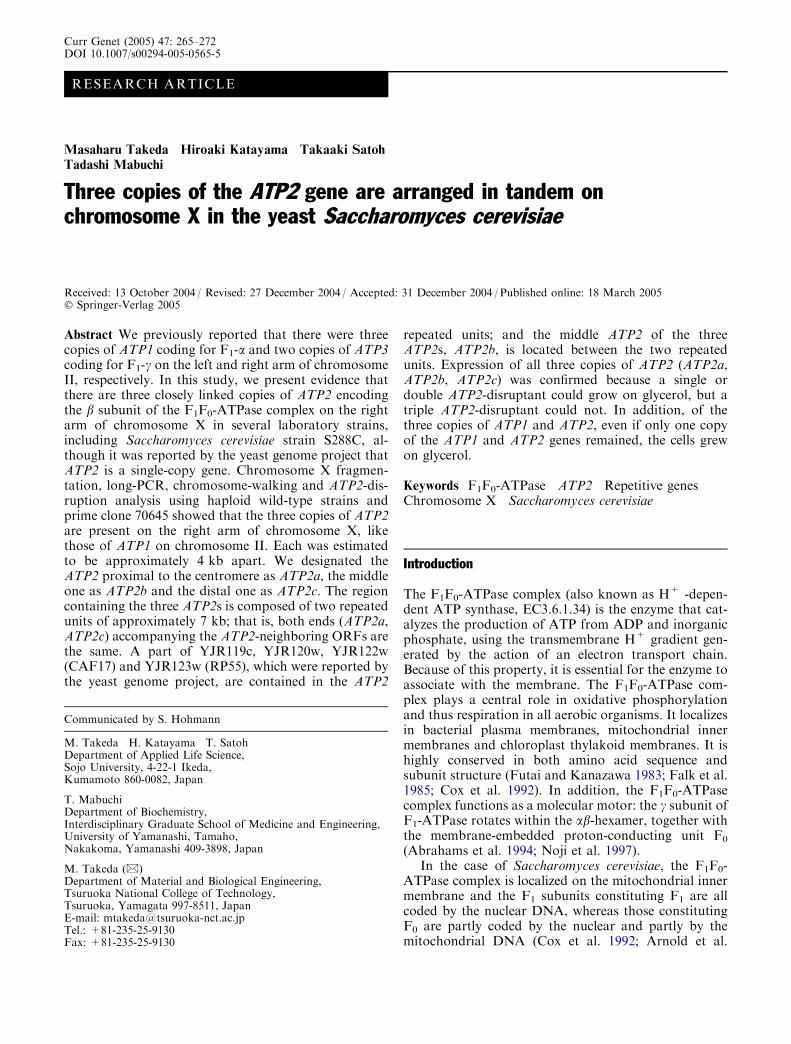
The strains used in these experiments were DC5, LL20,W303-1A, W303-1B, DBY746 and S288C. Total DNAs(genomic DNAs) from these strains carrying disruptedATP2 by plasmid pTS1 (URA3), pTS2 (LEU2) or pTS4(HIS3) were given two ATP2-hybridized bands con-taining the undisrupted ATP2 (2.6 kb EcoRI-HindIII)and the disrupted ATP2 (3.3 kb, 1.36 kb with 2.76 kb,or 1.12 kb with 2.49 kb EcoRI-HindIII.12I fragment foratp2::URA3, atp2::LEU2 or atp2::HIS3, respectively),according to the ATP2-disruption plasmids used (datanot shown). Total DNAs (genomic DNAs) from theATP2 disruptants were isolated and then digested withrestriction enzymes. The results are shown in Fig. 1. Toconfirm that the yeast genes were integrated with theATP2 on the right arm of chromosome X, the wholechromosomes isolated from each ATP2 disruptant withthe genes were electrophoresed on a CHEF apparatus asdescribed previously and underwent Southern analysis,using each gene as a probe (Fig. 2). The results showedthat both the undisrupted ATP2 and the disrupted
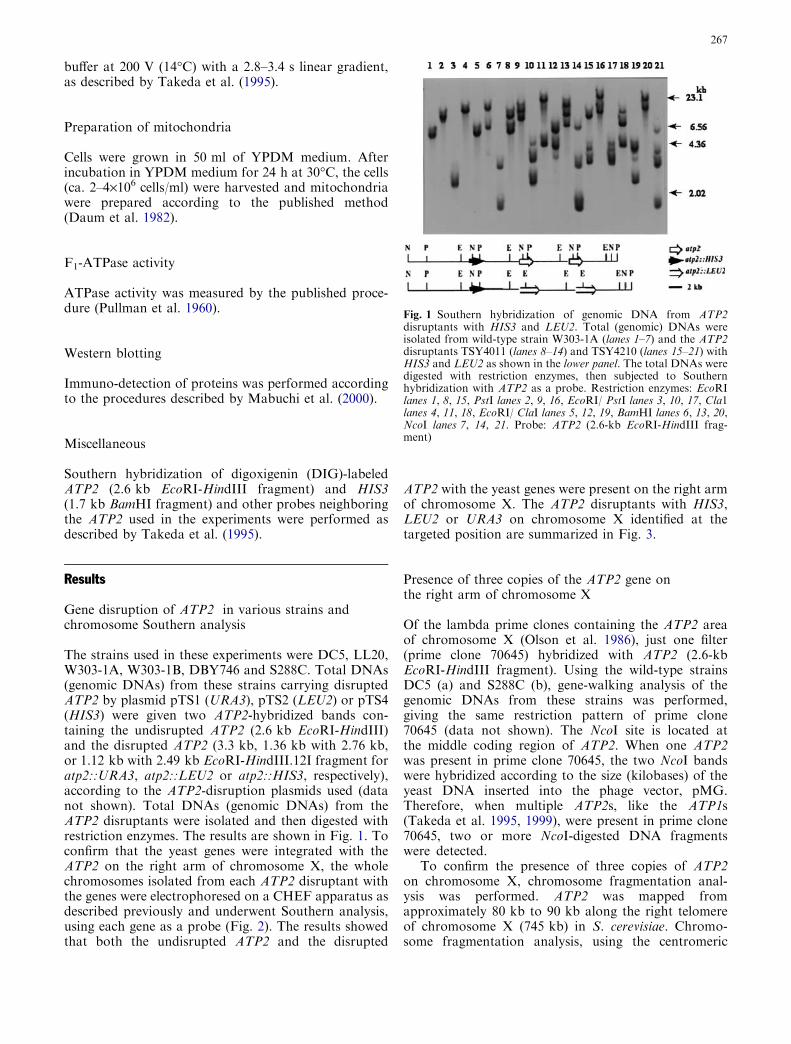
ATP2 with the yeast genes were present on the right armof chromosome X. The ATP2 disruptants with HIS3,LEU2 or URA3 on chromosome X identified at thetargeted position are summarized in Fig. 3.
Presence of three copies of the ATP2 gene onthe right arm of chromosome X
Of the lambda prime clones containing the ATP2 areaof chromosome X (Olson et al. 1986), just one filter(prime clone 70645) hybridized with ATP2 (2.6-kbEcoRI-HindIII fragment). Using the wild-type strainsDC5 (a) and S288C (b), gene-walking analysis of thegenomic DNAs from these strains was performed,giving the same restriction pattern of prime clone70645 (data not shown). The NcoI site is located atthe middle coding region of ATP2. When one ATP2was present in prime clone 70645, the two NcoI bandswere hybridized according to the size (kilobases) of theyeast DNA inserted into the phage vector, pMG.Therefore, when multiple ATP2s, like the ATP1s(Takeda et al. 1995, 1999), were present in prime clone70645, two or more NcoI-digested DNA fragmentswere detected.
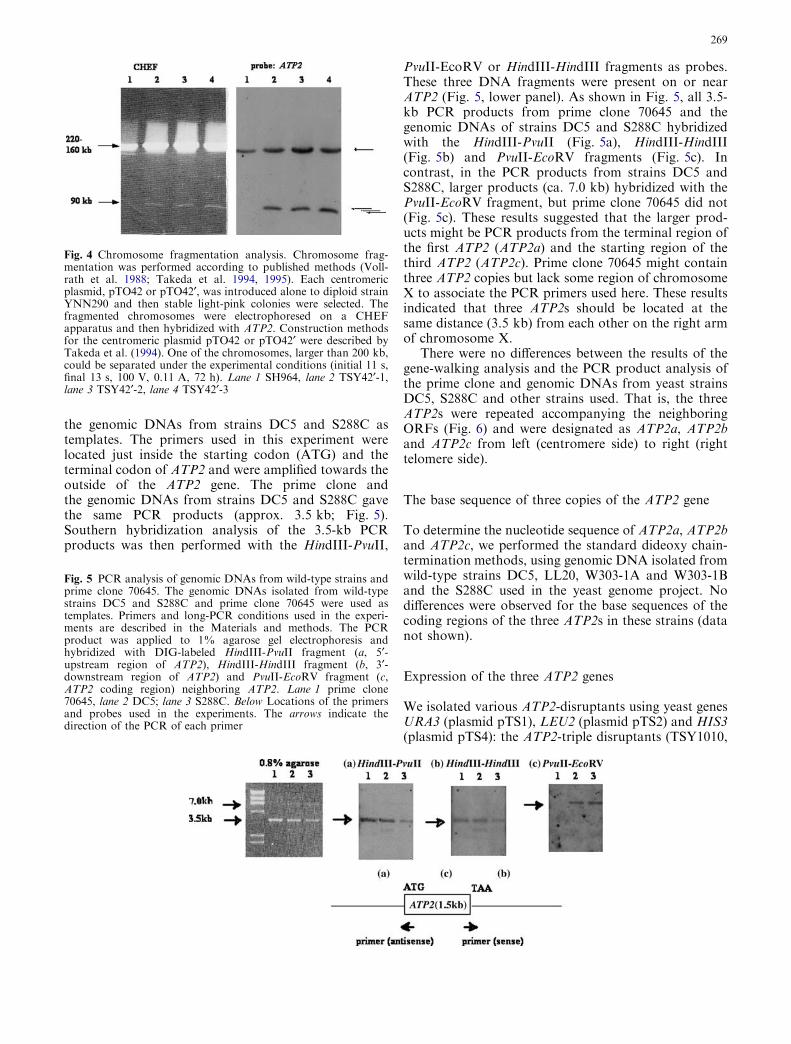
To confirm the presence of three copies of ATP2on chromosome X, chromosome fragmentation anal-ysis was performed. ATP2 was mapped fromapproximately 80 kb to 90 kb along the right telomereof chromosome X (745 kb) in S. cerevisiae. Chromo-some fragmentation analysis, using the centromeric
Fig. 1 Southern hybridization of genomic DNA from ATP2disruptants with HIS3 and LEU2. Total (genomic) DNAs wereisolated from wild-type strain W303-1A (lanes 1–7) and the ATP2disruptants TSY4011 (lanes 8–14) and TSY4210 (lanes 15–21) withHIS3 and LEU2 as shown in the lower panel. The total DNAs weredigested with restriction enzymes, then subjected to Southernhybridization with ATP2 as a probe. Restriction enzymes: EcoRIlanes 1, 8, 15, PstI lanes 2, 9, 16, EcoRI/ PstI lanes 3, 10, 17, Cla1lanes 4, 11, 18, EcoRI/ ClaI lanes 5, 12, 19, BamHI lanes 6, 13, 20,NcoI lanes 7, 14, 21. Probe: ATP2 (2.6-kb EcoRI-HindIII frag-ment)
267
vector pTOCF42¢, detected three different proximalfragments from strains TSY42¢-1, TSY42¢-2 andTSY42¢-3 (Fig. 4). These fragments hybridized withATP2. Therefore, these DNAs should be fragmentedfrom chromosome X with ATP2. Their sizes wereapproximately 90 kb (strain TSY42¢-1), 85 kb (strainTSY42¢-2) and 80 kb (strain TSY42¢-3). No chromo-some fragmentation occurred in the control,pTOCH42 (the opposite transcription direction ofATP2). The sizes of the chromosome X fragmentswere measured by considering the size (ca. 8 kb) of thevector that was used (YCF4; Vollrath et al. 1988) andby chromosome-walking analysis of genomic DNAs
from several wild-type strains and strain S288C (dis-cussed later). The results indicated that three identicalATP2 fragments might be derived from chromosomeX and that the ATP2(s) should be directed from thecentromere to the telomere.
Mapping of the region containing the repetitive ATP2and neighboring ORFs
To describe the repetitive region and copy number ofATP2 on chromosome X more precisely, we performedlong-PCR amplifications, using prime clone 70645 and
Fig. 2 Chromosomal Southernhybridization from the ATP2disruptants. Above, a Theglycerol phenotype of wild-typestrain W303-1A and ATP2disruptants. Chromosomeswere isolated from the wild-typestrain W303-1A (w.t.) and theATP2 disruptants andelectrophoresed on a CHEFapparatus. Electrophoresis wasperformed for 34 h withswitching intervals of 55 s for17 h and then 90 s for 17 h.After the gel electrophoresis,Southern hybridization wasperformed using the samemembrane and performedsequentially with DIG-labeledprobes: a LEU2, b HIS3, cATP2. Arrowheads indicatechromosomes III, XV and Xhybridized with LEU2 (a),HIS3 (b) and ATP2 (c),respectively. Lane 1 W303-1A,lane 2 TSY4010, lane 3TSY4011, lane 4 TSY4210.Strains TSY4010 and TSY4210contained disrupted ATP2swith LEU2, or LEU2 andHIS3, respectively. StrainTSY4011 contained bothundisrupted ATP2 anddisrupted ATP2 with HIS3
Fig. 3 Disrupted copies ofATP2 with URA3, LEU2 orHIS3 used in this study. Thedisrupted position of the ATP2gene on chromosome X wasidentified by gene-walkinganalysis as described in thecaption of Fig. 2. N NcoI, PPstI
268
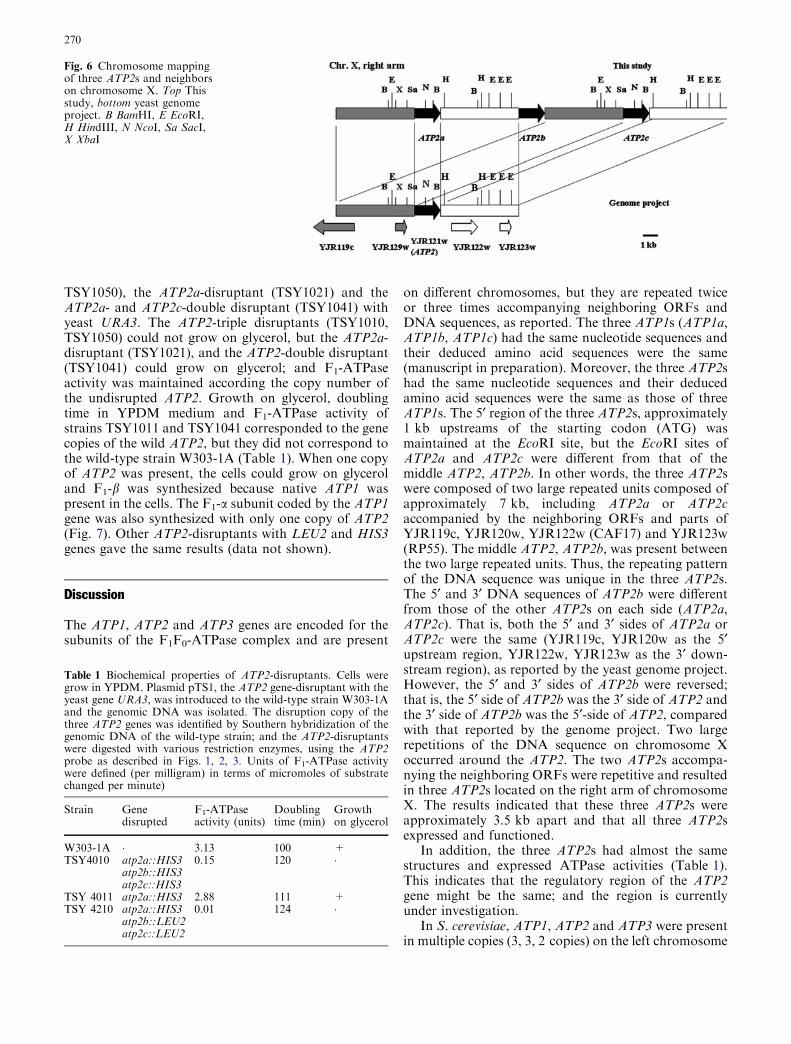
the genomic DNAs from strains DC5 and S288C astemplates. The primers used in this experiment werelocated just inside the starting codon (ATG) and theterminal codon of ATP2 and were amplified towards theoutside of the ATP2 gene. The prime clone andthe genomic DNAs from strains DC5 and S288C gavethe same PCR products (approx. 3.5 kb; Fig. 5).Southern hybridization analysis of the 3.5-kb PCRproducts was then performed with the HindIII-PvuII,
PvuII-EcoRV or HindIII-HindIII fragments as probes.These three DNA fragments were present on or nearATP2 (Fig. 5, lower panel). As shown in Fig. 5, all 3.5-kb PCR products from prime clone 70645 and thegenomic DNAs of strains DC5 and S288C hybridizedwith the HindIII-PvuII (Fig. 5a), HindIII-HindIII(Fig. 5b) and PvuII-EcoRV fragments (Fig. 5c). Incontrast, in the PCR products from strains DC5 andS288C, larger products (ca. 7.0 kb) hybridized with thePvuII-EcoRV fragment, but prime clone 70645 did not(Fig. 5c). These results suggested that the larger prod-ucts might be PCR products from the terminal region ofthe first ATP2 (ATP2a) and the starting region of thethird ATP2 (ATP2c). Prime clone 70645 might containthree ATP2 copies but lack some region of chromosomeX to associate the PCR primers used here. These resultsindicated that three ATP2s should be located at thesame distance (3.5 kb) from each other on the right armof chromosome X.
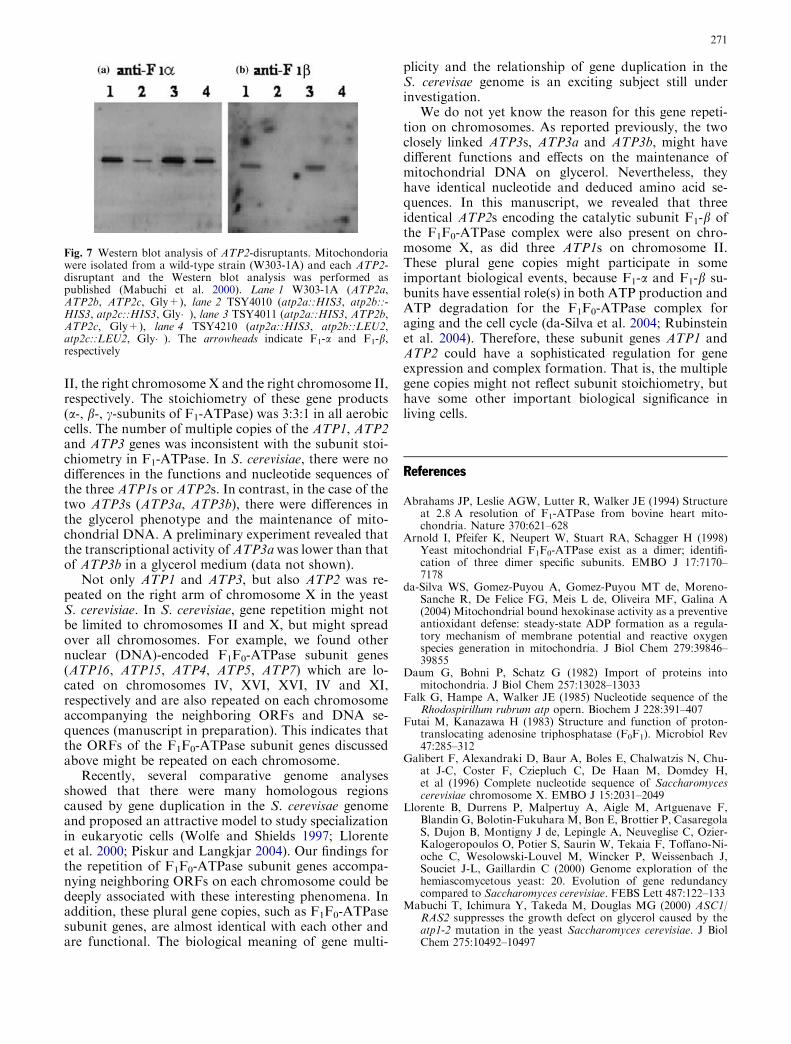
There were no differences between the results of thegene-walking analysis and the PCR product analysis ofthe prime clone and genomic DNAs from yeast strainsDC5, S288C and other strains used. That is, the threeATP2s were repeated accompanying the neighboringORFs (Fig. 6) and were designated as ATP2a, ATP2band ATP2c from left (centromere side) to right (righttelomere side).
The base sequence of three copies of the ATP2 gene
To determine the nucleotide sequence of ATP2a, ATP2band ATP2c, we performed the standard dideoxy chain-termination methods, using genomic DNA isolated fromwild-type strains DC5, LL20, W303-1A and W303-1Band the S288C used in the yeast genome project. Nodifferences were observed for the base sequences of thecoding regions of the three ATP2s in these strains (datanot shown).
Expression of the three ATP2 genes
We isolated various ATP2-disruptants using yeast genesURA3 (plasmid pTS1), LEU2 (plasmid pTS2) and HIS3(plasmid pTS4): the ATP2-triple disruptants (TSY1010,
Fig. 4 Chromosome fragmentation analysis. Chromosome frag-mentation was performed according to published methods (Voll-rath et al. 1988; Takeda et al. 1994, 1995). Each centromericplasmid, pTO42 or pTO42¢, was introduced alone to diploid strainYNN290 and then stable light-pink colonies were selected. Thefragmented chromosomes were electrophoresed on a CHEFapparatus and then hybridized with ATP2. Construction methodsfor the centromeric plasmid pTO42 or pTO42¢ were described byTakeda et al. (1994). One of the chromosomes, larger than 200 kb,could be separated under the experimental conditions (initial 11 s,final 13 s, 100 V, 0.11 A, 72 h). Lane 1 SH964, lane 2 TSY42¢-1,lane 3 TSY42¢-2, lane 4 TSY42¢-3
Fig. 5 PCR analysis of genomic DNAs from wild-type strains andprime clone 70645. The genomic DNAs isolated from wild-typestrains DC5 and S288C and prime clone 70645 were used astemplates. Primers and long-PCR conditions used in the experi-ments are described in the Materials and methods. The PCRproduct was applied to 1% agarose gel electrophoresis andhybridized with DIG-labeled HindIII-PvuII fragment (a, 5¢-upstream region of ATP2), HindIII-HindIII fragment (b, 3¢-downstream region of ATP2) and PvuII-EcoRV fragment (c,ATP2 coding region) neighboring ATP2. Lane 1 prime clone70645, lane 2 DC5; lane 3 S288C. Below Locations of the primersand probes used in the experiments. The arrows indicate thedirection of the PCR of each primer
269
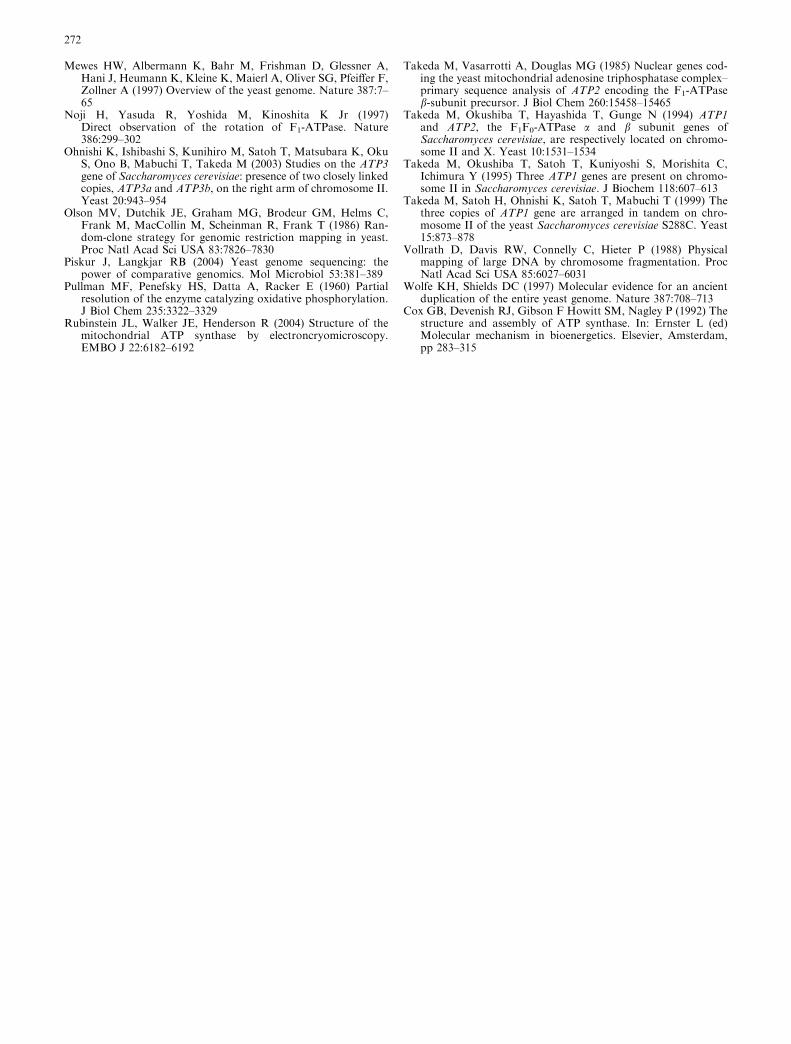
TSY1050), the ATP2a-disruptant (TSY1021) and theATP2a- and ATP2c-double disruptant (TSY1041) withyeast URA3. The ATP2-triple disruptants (TSY1010,TSY1050) could not grow on glycerol, but the ATP2a-disruptant (TSY1021), and the ATP2-double disruptant(TSY1041) could grow on glycerol; and F1-ATPaseactivity was maintained according the copy number ofthe undisrupted ATP2. Growth on glycerol, doublingtime in YPDM medium and F1-ATPase activity ofstrains TSY1011 and TSY1041 corresponded to the genecopies of the wild ATP2, but they did not correspond tothe wild-type strain W303-1A (Table 1). When one copyof ATP2 was present, the cells could grow on glyceroland F1-b was synthesized because native ATP1 waspresent in the cells. The F1-a subunit coded by the ATP1gene was also synthesized with only one copy of ATP2(Fig. 7). Other ATP2-disruptants with LEU2 and HIS3genes gave the same results (data not shown).
Discussion
The ATP1, ATP2 and ATP3 genes are encoded for thesubunits of the F1F0-ATPase complex and are present
on different chromosomes, but they are repeated twiceor three times accompanying neighboring ORFs andDNA sequences, as reported. The three ATP1s (ATP1a,ATP1b, ATP1c) had the same nucleotide sequences andtheir deduced amino acid sequences were the same(manuscript in preparation). Moreover, the three ATP2shad the same nucleotide sequences and their deducedamino acid sequences were the same as those of threeATP1s. The 5¢ region of the three ATP2s, approximately1 kb upstreams of the starting codon (ATG) wasmaintained at the EcoRI site, but the EcoRI sites ofATP2a and ATP2c were different from that of themiddle ATP2, ATP2b. In other words, the three ATP2swere composed of two large repeated units composed ofapproximately 7 kb, including ATP2a or ATP2caccompanied by the neighboring ORFs and parts ofYJR119c, YJR120w, YJR122w (CAF17) and YJR123w(RP55). The middle ATP2, ATP2b, was present betweenthe two large repeated units. Thus, the repeating patternof the DNA sequence was unique in the three ATP2s.The 5¢ and 3¢ DNA sequences of ATP2b were differentfrom those of the other ATP2s on each side (ATP2a,ATP2c). That is, both the 5¢ and 3¢ sides of ATP2a orATP2c were the same (YJR119c, YJR120w as the 5¢upstream region, YJR122w, YJR123w as the 3¢ down-stream region), as reported by the yeast genome project.However, the 5¢ and 3¢ sides of ATP2b were reversed;that is, the 5¢ side of ATP2b was the 3¢ side of ATP2 andthe 3¢ side of ATP2b was the 5¢-side of ATP2, comparedwith that reported by the genome project. Two largerepetitions of the DNA sequence on chromosome Xoccurred around the ATP2. The two ATP2s accompa-nying the neighboring ORFs were repetitive and resultedin three ATP2s located on the right arm of chromosomeX. The results indicated that these three ATP2s wereapproximately 3.5 kb apart and that all three ATP2sexpressed and functioned.
In addition, the three ATP2s had almost the samestructures and expressed ATPase activities (Table 1).This indicates that the regulatory region of the ATP2gene might be the same; and the region is currentlyunder investigation.
In S. cerevisiae, ATP1, ATP2 and ATP3 were presentin multiple copies (3, 3, 2 copies) on the left chromosome
Fig. 6 Chromosome mappingof three ATP2s and neighborson chromosome X. Top Thisstudy, bottom yeast genomeproject. B BamHI, E EcoRI,H HindIII, N NcoI, Sa SacI,X XbaI
Table 1 Biochemical properties of ATP2-disruptants. Cells weregrow in YPDM. Plasmid pTS1, the ATP2 gene-disruptant with theyeast gene URA3, was introduced to the wild-type strain W303-1Aand the genomic DNA was isolated. The disruption copy of thethree ATP2 genes was identified by Southern hybridization of thegenomic DNA of the wild-type strain; and the ATP2-disruptantswere digested with various restriction enzymes, using the ATP2probe as described in Figs. 1, 2, 3. Units of F1-ATPase activitywere defined (per milligram) in terms of micromoles of substratechanged per minute)
Strain Genedisrupted
F1-ATPaseactivity (units)
Doublingtime (min)
Growthon glycerol
W303-1A � 3.13 100 +TSY4010 atp2a::HIS3 0.15 120 �
atp2b::HIS3atp2c::HIS3
TSY 4011 atp2a::HIS3 2.88 111 +TSY 4210 atp2a::HIS3 0.01 124 �
atp2b::LEU2atp2c::LEU2
270
II, the right chromosome X and the right chromosome II,respectively. The stoichiometry of these gene products(a-, b-, c-subunits of F1-ATPase) was 3:3:1 in all aerobiccells. The number of multiple copies of the ATP1, ATP2and ATP3 genes was inconsistent with the subunit stoi-chiometry in F1-ATPase. In S. cerevisiae, there were nodifferences in the functions and nucleotide sequences ofthe three ATP1s or ATP2s. In contrast, in the case of thetwo ATP3s (ATP3a, ATP3b), there were differences inthe glycerol phenotype and the maintenance of mito-chondrial DNA. A preliminary experiment revealed thatthe transcriptional activity of ATP3awas lower than thatof ATP3b in a glycerol medium (data not shown).
Not only ATP1 and ATP3, but also ATP2 was re-peated on the right arm of chromosome X in the yeastS. cerevisiae. In S. cerevisiae, gene repetition might notbe limited to chromosomes II and X, but might spreadover all chromosomes. For example, we found othernuclear (DNA)-encoded F1F0-ATPase subunit genes(ATP16, ATP15, ATP4, ATP5, ATP7) which are lo-cated on chromosomes IV, XVI, XVI, IV and XI,respectively and are also repeated on each chromosomeaccompanying the neighboring ORFs and DNA se-quences (manuscript in preparation). This indicates thatthe ORFs of the F1F0-ATPase subunit genes discussedabove might be repeated on each chromosome.
Recently, several comparative genome analysesshowed that there were many homologous regionscaused by gene duplication in the S. cerevisae genomeand proposed an attractive model to study specializationin eukaryotic cells (Wolfe and Shields 1997; Llorenteet al. 2000; Piskur and Langkjar 2004). Our findings forthe repetition of F1F0-ATPase subunit genes accompa-nying neighboring ORFs on each chromosome could bedeeply associated with these interesting phenomena. Inaddition, these plural gene copies, such as F1F0-ATPasesubunit genes, are almost identical with each other andare functional. The biological meaning of gene multi-
plicity and the relationship of gene duplication in theS. cerevisae genome is an exciting subject still underinvestigation.
We do not yet know the reason for this gene repeti-tion on chromosomes. As reported previously, the twoclosely linked ATP3s, ATP3a and ATP3b, might havedifferent functions and effects on the maintenance ofmitochondrial DNA on glycerol. Nevertheless, theyhave identical nucleotide and deduced amino acid se-quences. In this manuscript, we revealed that threeidentical ATP2s encoding the catalytic subunit F1-b ofthe F1F0-ATPase complex were also present on chro-mosome X, as did three ATP1s on chromosome II.These plural gene copies might participate in someimportant biological events, because F1-a and F1-b su-bunits have essential role(s) in both ATP production andATP degradation for the F1F0-ATPase complex foraging and the cell cycle (da-Silva et al. 2004; Rubinsteinet al. 2004). Therefore, these subunit genes ATP1 andATP2 could have a sophisticated regulation for geneexpression and complex formation. That is, the multiplegene copies might not reflect subunit stoichiometry, buthave some other important biological significance inliving cells.
References
Abrahams JP, Leslie AGW, Lutter R, Walker JE (1994) Structureat 2.8 A resolution of F1-ATPase from bovine heart mito-chondria. Nature 370:621–628
Arnold I, Pfeifer K, Neupert W, Stuart RA, Schagger H (1998)Yeast mitochondrial F1F0-ATPase exist as a dimer; identifi-cation of three dimer specific subunits. EMBO J 17:7170–7178
da-Silva WS, Gomez-Puyou A, Gomez-Puyou MT de, Moreno-Sanche R, De Felice FG, Meis L de, Oliveira MF, Galina A(2004) Mitochondrial bound hexokinase activity as a preventiveantioxidant defense: steady-state ADP formation as a regula-tory mechanism of membrane potential and reactive oxygenspecies generation in mitochondria. J Biol Chem 279:39846–39855
Daum G, Bohni P, Schatz G (1982) Import of proteins intomitochondria. J Biol Chem 257:13028–13033
Falk G, Hampe A, Walker JE (1985) Nucleotide sequence of theRhodospirillum rubrum atp opern. Biochem J 228:391–407
Futai M, Kanazawa H (1983) Structure and function of proton-translocating adenosine triphosphatase (F0F1). Microbiol Rev47:285–312
Galibert F, Alexandraki D, Baur A, Boles E, Chalwatzis N, Chu-at J-C, Coster F, Cziepluch C, De Haan M, Domdey H,et al (1996) Complete nucleotide sequence of Saccharomycescerevisiae chromosome X. EMBO J 15:2031–2049
Llorente B, Durrens P, Malpertuy A, Aigle M, Artguenave F,Blandin G, Bolotin-Fukuhara M, Bon E, Brottier P, CasaregolaS, Dujon B, Montigny J de, Lepingle A, Neuveglise C, Ozier-Kalogeropoulos O, Potier S, Saurin W, Tekaia F, Toffano-Ni-oche C, Wesolowski-Louvel M, Wincker P, Weissenbach J,Souciet J-L, Gaillardin C (2000) Genome exploration of thehemiascomycetous yeast: 20. Evolution of gene redundancycompared to Saccharomyces cerevisiae. FEBS Lett 487:122–133
Mabuchi T, Ichimura Y, Takeda M, Douglas MG (2000) ASC1/RAS2 suppresses the growth defect on glycerol caused by theatp1-2 mutation in the yeast Saccharomyces cerevisiae. J BiolChem 275:10492–10497
Fig. 7 Western blot analysis of ATP2-disruptants. Mitochondoriawere isolated from a wild-type strain (W303-1A) and each ATP2-disruptant and the Western blot analysis was performed aspublished (Mabuchi et al. 2000). Lane 1 W303-1A (ATP2a,ATP2b, ATP2c, Gly+), lane 2 TSY4010 (atp2a::HIS3, atp2b::-HIS3, atp2c::HIS3, Gly�), lane 3 TSY4011 (atp2a::HIS3, ATP2b,ATP2c, Gly+), lane 4 TSY4210 (atp2a::HIS3, atp2b::LEU2,atp2c::LEU2, Gly�). The arrowheads indicate F1-a and F1-b,respectively
271
Mewes HW, Albermann K, Bahr M, Frishman D, Glessner A,Hani J, Heumann K, Kleine K, Maierl A, Oliver SG, Pfeiffer F,Zollner A (1997) Overview of the yeast genome. Nature 387:7–65
Noji H, Yasuda R, Yoshida M, Kinoshita K Jr (1997)Direct observation of the rotation of F1-ATPase. Nature386:299–302
Ohnishi K, Ishibashi S, Kunihiro M, Satoh T, Matsubara K, OkuS, Ono B, Mabuchi T, Takeda M (2003) Studies on the ATP3gene of Saccharomyces cerevisiae: presence of two closely linkedcopies, ATP3a and ATP3b, on the right arm of chromosome II.Yeast 20:943–954
Olson MV, Dutchik JE, Graham MG, Brodeur GM, Helms C,Frank M, MacCollin M, Scheinman R, Frank T (1986) Ran-dom-clone strategy for genomic restriction mapping in yeast.Proc Natl Acad Sci USA 83:7826–7830
Piskur J, Langkjar RB (2004) Yeast genome sequencing: thepower of comparative genomics. Mol Microbiol 53:381–389
Pullman MF, Penefsky HS, Datta A, Racker E (1960) Partialresolution of the enzyme catalyzing oxidative phosphorylation.J Biol Chem 235:3322–3329
Rubinstein JL, Walker JE, Henderson R (2004) Structure of themitochondrial ATP synthase by electroncryomicroscopy.EMBO J 22:6182–6192
Takeda M, Vasarrotti A, Douglas MG (1985) Nuclear genes cod-ing the yeast mitochondrial adenosine triphosphatase complex–primary sequence analysis of ATP2 encoding the F1-ATPaseb-subunit precursor. J Biol Chem 260:15458–15465
Takeda M, Okushiba T, Hayashida T, Gunge N (1994) ATP1and ATP2, the F1F0-ATPase a and b subunit genes ofSaccharomyces cerevisiae, are respectively located on chromo-some II and X. Yeast 10:1531–1534
Takeda M, Okushiba T, Satoh T, Kuniyoshi S, Morishita C,Ichimura Y (1995) Three ATP1 genes are present on chromo-some II in Saccharomyces cerevisiae. J Biochem 118:607–613
Takeda M, Satoh H, Ohnishi K, Satoh T, Mabuchi T (1999) Thethree copies of ATP1 gene are arranged in tandem on chro-mosome II of the yeast Saccharomyces cerevisiae S288C. Yeast15:873–878
Vollrath D, Davis RW, Connelly C, Hieter P (1988) Physicalmapping of large DNA by chromosome fragmentation. ProcNatl Acad Sci USA 85:6027–6031
Wolfe KH, Shields DC (1997) Molecular evidence for an ancientduplication of the entire yeast genome. Nature 387:708–713
Cox GB, Devenish RJ, Gibson F Howitt SM, Nagley P (1992) Thestructure and assembly of ATP synthase. In: Ernster L (ed)Molecular mechanism in bioenergetics. Elsevier, Amsterdam,pp 283–315
272
RESEARCH ARTICLE
Hsiang-Ling Ho Æ Yu-Shih Shiau Æ Mei-Yu Chen
Saccharomyces cerevisiaeTSC11/AVO3 participates in regulating cellintegrity and functionally interacts with components of the Tor2 complex
Received: 25 November 2004 / Revised: 10 February 2005 / Accepted: 20 February 2005 / Published online: 5 April 2005� Springer-Verlag 2005
Abstract Saccharomyces cerevisiae TSC11/AVO3 is anessential gene encoding one component of TORC2, amulti-protein complex of yeast Tor2p that also containsLst8p, Avo1p, and Avo2p. Despite the proven physicalassociation among TORC2 components, little is knownabout the functional linkage or cellular pathways theseproteins act in. Here, we present genetic data linking thefunction of TSC11 to the regulation of cell integrity.Mutants carrying temperature-sensitive (ts) alleles indifferent regions of TSC11 displayed cell wall defects,evidenced by characteristic osmotic stabilizer-remedia-ble cell lysis, susceptibility to trypan blue staining, andsensitivity to cell wall-digesting enzymes. Dosage sup-pression analysis identified different groups of genes inrescuing phenotypes of different tsc11ts mutants. AVO1suppressed one class of mutants, whereas active PKC1,AVO2, and SLM1 partially rescued another. Our find-ings demonstrate functional connections among TORC2components and we speculate that Tsc11p exerts itsfunction via a Pkc1p-independent mechanism mediatedthrough Avo1p, and a Pkc1p-dependent mechanismmediated through Avo2p and Slm1p.
Keywords Cell wall Æ Actin Æ Multicopy suppressor ÆTarget of rapamycin Æ Protein kinase C
Introduction
The target of rapamycin (TOR) protein, which is ahighly conserved Ser/Thr kinase existing widely inorganisms ranging from yeast to mammals, has emergedto play a central role in controlling cell growth andproliferation (Schmelzle and Hall 2000; Raught et al.2001; Fingar and Blenis 2004). TOR proteins are large(280–300 kDa) polypeptides with a common structurethat consists of a C-terminal phophatidylinositol 3-ki-nase-like catalytic domain, a FKBP12-rapamycin-bind-ing domain, and several protein–protein interactingmodules, including the N-terminal HEAT repeats andthe FAT/FATC domains. Consistent with the presenceof these domains, recent evidence has demonstrated thatTOR exists as a component of multi-protein complexes(Loewith et al. 2002; Wedaman et al. 2003; Jacinto et al.2004; Sarbassov et al. 2004).
In Saccharomyces cerevisiae, there exist two TORproteins, Tor1p and Tor2p, which control global anddiverse sets of cell growth in response to nutrientavailability (Heitman et al. 1991; Schmelzle and Hall2000). Both proteins function redundantly in a rapa-mycin-sensitive pathway that mediates protein synthesisand cell cycle progression (Helliwell et al. 1994; Zhenget al. 1995; Barbet et al. 1996). However, Tor2p has anadditional essential function that is not shared by Tor1p(Kunz et al. 1993; Helliwell et al. 1994; Zheng et al.1995). This Tor2p-specific function is not inhibited byrapamycin and is related to the cell cycle-dependentorganization of the actin cytoskeleton (Zheng et al.1995; Schmidt et al. 1996).
Previous reports suggested an interaction betweenthe TOR pathway and the signaling pathway thatregulates cell wall integrity (Schmidt et al. 1997;Helliwell et al. 1998a; Torres et al. 2002). The yeastcell wall is a dynamic structure whose synthesis istemporally and spatially controlled in response togrowth, stress, and mating signals (Firon et al. 2004).In S. cerevisiae, cell wall stress is sensed by Mid2p
Electronic Supplementary Material Supplementary material isavailable for this article at http://dx.doi.org/10.1007/s00294-005-0570-8
Communicated by S. Hohmann
H.-L. Ho Æ Y.-S. Shiau Æ M.-Y. Chen (&)Institute of Biochemistry, School of Life Sciencesand Department of Biochemistry, School of Medicine,National Yang-Ming University, 155, Sec. 2,Li-Nong St., Shih-Pai, Taipei, 112, TaiwanE-mail: [email protected].: + 886-2-28267269Fax: + 886-2-28264843
Curr Genet (2005) 47: 273–288DOI 10.1007/s00294-005-0570-8

(Ketela et al. 1999; Rajavel et al. 1999) or the Wscfamily of cell surface sensors (Verna et al. 1997). Thesensors transmit signals to the nucleotide exchangefactor Rom2p and subsequently the small GTPaseRho1p (Philip and Levin 2001). Rho1p acts in re-sponse to directly up-regulate the glucan synthase(Mazur and Baginsky 1996) and to stimulate Pkc1pkinase activity (Nonaka et al. 1995; Kamada et al.1996). Pkc1p in turn activates a MAPK activationcascade comprised of a MEKK (Bck1p), a redundantpair of MEKs (Mkk1p, Mkk2p) and a MAPK (Slt2p).Activated Slt2p then modulates the expression of en-zymes involved in cell wall biosynthesis (Igual et al.1996). It has been shown that rapamycin, which blocksthe TOR-shared function, up-regulates the PKCpathway and induces Slt2p activation (Torres et al.2002). In addition, Tor2p is required for the activationof Rom2p (Schmidt et al. 1997), suggesting that Tor2pmodulates the cell integrity pathway at the level of orupstream of the nucleotide exchange. Consistently,mutants lacking only the TOR2-unique functionexhibit a growth defect that can be suppressed byosmotic stabilizers, a phenotype reminiscent of thatshown by the PKC/MAPK pathway mutants; andoverexpression of genes including PKC1, ROM2, andRHO2 can suppress the growth defect of these tor2mutants (Helliwell et al. 1998a). Taken together, itseems that both the TOR-shared and the TOR2-uniquefunctions directly or indirectly affect the cell integritypathway. Molecular mechanisms by which TOR pro-teins modulate cell integrity remain elusive at present.
Corresponding to the two functions of the TORpathway, two distinct TOR complexes, TORC1 andTORC2, have been identified in the budding yeast(Loewith et al. 2002; Wedaman et al. 2003). EitherTor1p or Tor2p associates with Kog1p and Lst8p toform TORC1, which mediates rapamycin-sensitive,TOR-shared signaling that controls rapamycin-sensi-tive, growth-related processes in response to nutrients.Disruption of TORC1 components mimics rapamycintreatment in causing starvation-like phenotypes, evi-denced by altered cell morphology, reduced proteinsynthesis, specific changes in transcription, and glyco-gen accumulation. In contrast, TORC2 contains Tor2p(but not Tor1p) and other proteins, including Lst8p,Avo1p, Avo2p, and Tsc11p/Avo3p. TORC2 is rapa-mycin-insensitive and disruption of its components re-sults in actin organization defects that resemble TOR2depletion, indicating that TORC2 mediates the Tor2p-unique function. Remarkably, components of bothTOR complexes are conserved throughout evolution.By coimmunoprecipitation, the mammalian counter-parts mTORC1 and mTORC2 have been identified(Hara et al. 2002; Kim et al. 2002, 2003; Loewith et al.2002; Jacinto et al. 2004; Sarbassov et al. 2004). Simi-larly, mTORC1 signals to the cell growth machinery ina nutrient-sensitive manner (Kim et al. 2002, 2003),whereas mTORC2 controls the actin cytoskeleton(Jacinto et al. 2004; Sarbassov et al. 2004). Despite the
plethora of evidence for the physical interactionsamong components in each TOR complexes, little isknown about their functional linkages. What specificmolecular actions the TOR-interacting partners haveand what roles these proteins play in the diversity ofTOR-influenced cellular events still remain to beelucidated.
In this study, we focused on TSC11/AVO3/YER093C, a S. cerevisiae essential gene encoding oneTORC2 component. Besides the association of Tsc11pwith Tor2p (Loewith et al. 2002; Wedaman et al. 2003),little is known concerning the molecular function ofTsc11p. It has been shown that mutants with Ty1insertion in TSC11 are unable to grow on media con-taining 6 mM caffeine (Smith et al. 1996) and that atemperature-sensitive (ts) tsc 11 allele suppresses theCa2+-sensitive phenotype of the csg2D mutant (Beeleret al. 1998), yet the molecular bases underlying theseobservations have not been explored. Consistent withthe conservation of TOR in lower and higher eukary-otes, proteins sharing homology with Tsc11p are alsoencoded in the genomes of other species, includingDictyostelium discoideum (Chen et al. 1997), Schizo-saccharomyces pombe (Hilti et al. 1999), mouse (Jacintoet al. 2004), and human (Sarbassov et al. 2004). InDictyostelium, the homologue pianissimo is involved incAMP signaling as a cytosolic regulator of adenylylcyclase (Chen et al. 1997). In the fission yeast, thehomologue Ste20 has been shown to control starvation-mediated G1 arrest and the induction of genes impor-tant for sexual development (Hilti et al. 1999). Justrecently, the mammalian orthologue of Tsc11p, desig-nated mAVO3 or Rictor, was identified as a componentof the mammalian counterpart of TORC2 and dem-onstrated to act in mediating rapamycin-insensitiveregulation of the actin cytoskeleton (Jacinto et al. 2004;Sarbassov et al. 2004). However, none of these studieshas yet disclosed the molecular action of Tsc11phomologues.
We further characterized the cellular functions of theSaccharomyces cerevisiae TSC11 gene using geneticapproaches. Phenotypic analyses of tsc11ts mutantsshowed that, besides regulating actin cytoskeleton ascan be expected for a TORC2 component, the functionof Tsc11p is linked to the regulation of cell wallintegrity. Searches for suppressors found AVO1, AVO2,and SLM1 as multicopy suppressors for differenttsc11ts mutants. The identification of AVO1 and AVO2as suppressors demonstrates the functional linkageamong TORC2 components. More interestingly, theallelic specificity these suppressor genes displayed inrescuing phenotypes of different tsc11ts mutants sug-gests that Tsc11p participates in regulating cell wallintegrity through two distinct pathways, one mediatedby AVO1 and the other mediated by AVO2 and SLM1.Our results point to the intriguing possibility thatsignaling through the TOR kinase is channeled intoseparate pathways via different components of TORcomplexes.
274
Materials and methods
Yeast strains
The heterozygous diploid TSC11/tsc11D mutant strainMCY7 (MATa/a his3-D200/his3-D200 leu2-D1/leu2-D1lys2-D202/lys2-D202 trp1-D63/trp1-D63 ura3-52/ura3-52TSC11/tsc11D::HIS3) was generated using a PCR-med-iated, one-step, gene-disruption method (Lorenz et al.1995). Primers Scpia1 and Scpia2 were used in PCR toamplify the HIS3 gene from pRS403 (Sikorski andHieter 1989). The resulting PCR product, containing theHIS3 marker flanked by 40 bp of the sequence 5¢ to thestart codon and 40 bp of the sequence 3¢ to the stopcodon of TSC11, was transformed into MCY6 (MATa/a his3-D200/his3-D200 leu2-D1/leu2-D1 lys2-D202/lys2-D202 trp1-D63/trp1-D63 ura3-52/ura3-52). His+ colonieswere isolated and the deletion of one TSC11 locus wasverified by Southern analysis. MCY8 [MATa/a his3-D200/his3-D200 leu2-D1/leu2-D1 lys2-D202/lys2-D202trp1-D63/trp1-D63 ura3-52/ura3-52; pMYC79 (URA3CEN6/ARSH4 PGAL1 -TSC11)] was obtained by trans-forming pMYC79 (see below), which carries TSC11under the control of GAL1 promoter (Mumberg et al.1994), into MCY7. Haploid strains MCY12 (MATahis3-D200 leu2-D1 lys2-D202 trp1-D63 ura3-52tsc11D::HIS3; pMYC79) and MCY13 (MATa his3-D200leu2-D1 lys2-D202 trp1-D63 ura3-52 tsc11D::HIS3;pMYC79) were obtained from MCY8 by tetrad dissec-tion. All tsc11 mutants in this study were analyzed in theMCY13 background after removing pMYC79 by 5-flu-oroorotic acid (5-FOA) selection. Yeast transformationswere performed by the lithium acetate procedure (Geitzet al. 1992).
Plasmids
DNA manipulation and bacterial transformation weredone according to standard methods (Sambrook and
Russell 2001). Oligonucleotide primers used in this studyare summarized in Table 1.
The TSC11 gene was cloned by PCR amplifications,using genomic DNA from wild-type strains as the tem-plate. The entire 4,290-nucleotide coding sequence wasamplified as two PCR fragments. The 2.15-kb 5¢ frag-ment was amplified using primers Scpia7 and ScPia8;and the resulting PCR product was digested with SmaI(which was introduced 5¢ during PCR) and MfeI. The2.25-kb 3¢ fragment was amplified using primers Scpia 9and Scpia10; and the resulting PCR product wasdigested with MfeI and ClaI (which was introduced 3¢during PCR). The two digested fragments were ligatedsimultaneously into yeast expression vectorpRS416GAL1 (Mumberg et al. 1994) at the SmaI andClaI sites. The resulting plasmid, designated pMYC79,carried the CEN replication origin, the URA3 marker,and the full-length TSC11 gene under the control of theGAL1 promoter. We transformed pMYC79 into thediploid yeast strain MCY7 (in which one genomic copyof TSC11 was replaced by the HIS3 marker), sporulatedthe resulting diploid transformants, and performedspore analysis. All the His+ spores we could recoverwere also Ura+, indicating that the cloned DNA is afunctional TSC11 copy capable of complementing thehaploid spores that carried the tsc11D deletion.
Plasmids expressing deletion mutants of Tsc11p wereconstructed by inserting various TSC11 fragments intopTHA or pTHA-Nco (Lin and Zakian 1996) to generateN-terminal in-frame fusions with three copies of theinfluenza hemagglutinin epitope. All the TSC11 frag-ments in these constructs were obtained from pMC1,which was previously constructed by inserting the 4.3-kbSmaI-ClaI full-length TSC11 gene from pMYC79 intopAS2-1 (Clontech). pJW9 was generated by moving theentire TSC11 gene as a 4.3-kb NcoI-SalI fragment intothe NcoI and XhoI sites of pTHA-Nco. pTT35-1430 wasgenerated by inserting the 4.2-kb XhoI-SalI TSC11fragment from pMC1 into the XhoI site of pTHA-Nco.pTT363-1430 was generated by inserting the 1.9-kb
Table 1 Oligonucleotide primers used in this work
Primer Sequence
Scpia1 5¢-CTTCGTGCTGTACCGCTTCTATTAAGTTTTTGAAATTCACAGATTGTACTGAGAGTGCACa-3¢Scpia2 5¢-ATTGTGACTATATACATTTATACATGCGGCCCTTTTTTGCCTGTGCGGTATTTCACACCGb-3¢Scpia7 5¢-TCCCCCGGGc CACAATGAGCATACCTCACAGTGC-3¢Scpia8 5¢- AGCATAATCAATGCCCGACATGCC-3¢Scpia9 5¢- GAAACATTCCAGTTCAAGAAGATCGC-3¢Scpia10 5¢-CCATCGATd GCGGCCCTTTTTTGCTCTAACG-3¢Scpia13 5¢-ACGATAGTGAAGAATTGGGCGACC-3¢Scpia14 5¢-ACCACGAATCCCTTTCCTCC-3¢Scpia17 5¢-GAATGGGGTTCATATCCTAACG-3¢Scpia19 5¢-CCAAATTCCTATATGCGCCC-3¢Slm2-s2 5¢-CCGCAGTTGGTTAGTGGTTCCGC-3¢Slm2-a2 5¢-CGAAACTGGACTATGACTGCC-3¢a Homologous to the sense strand of the pRS sequence that flanksthe 5¢ end of the selectable markerb Homologous to the antisense strand of the pRS sequence thatflanks the 5¢ end of the selectable marker
c SmaI sited ClaI site
275
HindIII-HindIII fragment and the 1.3-kb HindIII-SalIfragment into HindIII and SalI sites of pTHA. pTT1-1077 was generated by first moving the 3.2-kb EcoRI-EcoRI fragment from pMC1 into the EcoRI site ofpAS2-1 and then moving the 3.2-kb NcoI-SalI TSC11fragment from the resulting plasmid into the NcoI andSalI sites of pTHA-Nco. To generate pTT1-978, pTT1-1077 was digested with PstI and SalI to remove the0.3-kb fragment, then the ends were blunted with theKlenow enzyme and ligated together.
Plasmids pHH1 and pHH2 were used in the gap-re-pair experiments. pHH1 (LEU2 CEN) harbored a 4.3-kbSacI-SacI fragment containing full-length TSC11 underthe PGK1 promoter cloned in the SacI site of pRS315(Sikorski and Hieter 1989). pHH2 was a derivative ofpHH1 in which the ApaI-SacI fragment in the multiple-cloning-site region was deleted.
Plasmids expressing the components of the PKC/MAPK pathway (Helliwell et al. 1998b), includingpSH24 (URA3 2l), YCp50::PKC1(R398P) (URA3CEN), pRS316::BCK1-20 (URA3 CEN), YEp352::MKK1 (URA3 2l), and YEp352::MPK1 (URA3 2l)were kindly provided by Dr. M.N. Hall. The vectorcontrol plasmid pHH3 was prepared by deleting the4.2-kb SphI-SphI PKC1 fragment from pSH24.
Suppressor plasmids pSupB1-1, pSupD1-1, andpSupD1-2 were obtained by searching for clones of apRS424-based genomic library that suppressed the tsphenotype of tsc11ts mutants (see below). pSupB1-1rescued the tsB1 mutant while pSupD1-1 and pSupD1-2rescued the tsD1 mutant. Sequence analysis revealedthat pSupB1-1 carried a 6.7-kb genomic insert contain-ing coordinates 179,333–186,048 of chromosome XV,pSupD1-1 carried a 6.2-kb genomic insert containingcoordinates 405,294–411,500 of chromosome XIII, andpSupD1-2 carried a 6.0-kb genomic insert containingcoordinates 166,282–172,282 of chromosome IX. Wealso obtained a plasmid, designated pTSS1, carrying agenomic fragment containing TSC11 during the sup-pressor hunt. To test the AVO1 gene in suppressing thets phenotype of tsc11ts mutants, a 4-kb SpeI-SalI geno-mic fragment containing the AVO1 gene under its ownpromoter was obtained from pSupB1-1 and ligated intopRS424 (Christianson et al. 1992), resulting in pHS2. Totest the AVO2 gene in suppressing the tsc11ts mutants,pSupD1-1 was digested with NdeI and the large frag-ment was self-ligated, resulting in pHS5, which con-tained only the AVO2 gene under its own promoter. Totest SLM1 in suppressing the tsc11ts mutants, a 3.7-kbNsiI-NsiI genomic fragment containing the entire openreading frame (ORF) under its own promoter wasobtained from pSupD1-2 and ligated into the PstI site ofpRS424 (Christianson et al. 1992), resulting in pHS6. Totest SLM2 in suppressing the tsc11ts mutants, a 2.7-kbgenomic fragment containing the entire ORF under itsown promoter was obtained by PCR amplification usingprimers Slm2-s2 and Slm2-a2; and the PCR product wassubcloned into pCRII-Topo (Invitrogen) and subse-
quently moved as a KpnI-XhoI fragment into pRS424,resulting in pHS8.
Screening for ts alleles of TSC11
We adopted the scheme of in vivo gapped-plasmid repair(Muhlrad et al. 1992) and plasmid shuffling (Sikorskiand Boeke 1991) to search for tsc11 alleles that renderedthe cells temperature-sensitive.
Libraries of tsc11 mutants were prepared by trans-forming a gapped plasmid and a PCR-generated frag-ment carrying mutations into the recipient strainMCY13; and the gap was repaired by recombination invivo, resulting in a plasmid carrying mutations withinthe gapped region. Since the entire TSC11 gene is morethan 4 kb, we arbitrarily divided TSC11 into regions ofapproximately 1 kb (A, B, C, D, from 5¢ to 3¢) for easierPCR amplifications. Selected restriction enzyme pairsthat gave gaps of about 1 kb after digestion (as shown inFig. 2a) were chosen to prepare the gapped plasmid. Allmutagenic PCR fragments covering regions of TSC11that correspond to gaps in the digested plasmid wereobtained under an error-prone PCR condition (Muhlradet al. 1992): 100–200 ng of pMYC79 DNA were used asthe template; and 0.3 lM primers, 1.5 mM MgCl2,0.2 mM dATP, 1 mM each dCTP, dGTP, and dTTP,0.5 mM MnCl2, and the non-proofreading enzyme Taqpolymerase were included in the reaction mix. Thecycling protocol was: one cycle of 3 min at 94�C, 25–30 cycles of 1 min at 94�C, 30 s at 50�C, and 90 s at72�C, followed by one cycle of 8 min at 72�C. Pairs ofpurified gapped plasmid and PCR product were co-transformed in a molar ratio of 1:5 into MCY13. Fig-ure 2a shows: (1) for gap-repair of region B, PCRproduct amplified by primers Scpia8 and Scpia13 andthe BglII-and BclI-digested pHH1 were used, (2) forgap-repair of region C, PCR product amplified byprimers Scpia14 and Scpia19 and the NheI- and PstI-digested pHH2 were used, and (3) for gap-repair ofregion D, PCR product amplified by primers Scpia10and Scpia17 and the PstI- and AatI-digested pHH2 wereused. Cells carrying the repaired plasmid were recoveredon synthetic complete medium without leucine (SC-L)plates as Leu+ colonies.
To screen for ts alleles of TSC11, the libraries ofLeu+ yeast transformants prepared as above were pla-ted onto plates containing 5-FOA to counterselect cellsthat still carried the wild-type copy of TSC11 on theURA3 plasmid. The 5-FOA-resistant colonies were nextreplica-plated onto SC-H-L plates (selecting for both thegap-repaired plasmid and the genomic knockout) andgrown at 30�C and 37�C, respectively. Colonies thatfailed to grow at 37�C were picked as candidates con-taining tsc11ts alleles. For each candidate mutant, theLEU2-tsc11ts-YCp plasmid was recovered, re-trans-formed into MCY13, plated onto 5-FOA, and retestedfor ts phenotype by replica-plating.
276
Isolation of multicopy suppressors of tsc11ts alleles
Temperature-sensitive mutants tsB1, tsC1, or tsD1 weretransformed with a yeast genomic DNA library (kindlyprovided by Dr. J.-J. Lin), constructed by insertingSau3A partially digested genomic DNA into the BamHIsite of the 2l plasmid pRS424 (Christianson et al. 1992).After transformation, cells were incubated on SC-L-Tplates at 27�C for 24 h to allow recovery and then shiftedto the non-permissive temperature of each tsc11ts mutant(37�C for tsB1, 38�C for tsC1, 36�C for tsD1) for 3–5 days until some colonies formed; and these colonieswere subsequently restreaked to verify their growth atnon-permissive temperatures. From transformants thatreproducibly grew at non-permissive temperatures, DNAwas extracted and transformed into Escherichia coli torecover the library plasmid. These plasmids were sub-jected to Southern analysis, using the full-length TSC11gene as the probe; and only those that did not hybridizeto TSC11 probe were picked and retransformed into thetsc11ts mutant to verify their suppression. Genes presentin the suppressor plasmids were identified by sequencingboth ends of the inserts and aligned to the genomic se-quence in the Saccharomyces genome database.
Trypan blue assay
A trypan blue exclusion assay (Karpova et al. 1993) wasadopted to assess the cell wall defect of tsc11ts mutants.Overnight cultures of cells grown in appropriate liquidmedia were diluted to an optical density at 600 nm(OD600) of 0.1–0.2, split into two aliquots, and incubatedat either 27�C or restrictive temperatures for 8 h. Cellswere then washed with distilled water and stained with0.01% trypan blue in water for a further 1 h. At least200 cells from each sample were examined under themicroscope to determine the proportion of stained cells.
Zymolyase sensitivity assay
Yeast cells were grown overnight at 27�C in appropriateliquid media, diluted to an OD600 of ca. 0.2, and thenincubated at 27�C or 37�C for 4 h. Cells were then col-lected, washed, and resuspended to an OD600 of ca. 0.4 in10 mM Tris-HCl (pH 7.5) containing 10 lg/ml Zymol-yase-T100 (Seikagaku). Cell suspensions were incubatedat room temperature and their OD600 values were mea-sured at 5-min intervals. Percent OD600 values were cal-culated by dividing the OD600 value at each time-pointwith that at time zero. Changes in percent OD600 withtime indicated sensitivity to Zymolyase-T100.
Detection of Slt2p phosphorylation
Yeast cells were grown overnight at 24�C in appropriatemedia. Cultures were then diluted to an OD600 of 0.3and further grown for 1 h at 24�C or 39�C. Cells were
collected on ice by adding the culture to an equal volumeof ice in the centrifuge tube and pelleting in a refriger-ated centrifuge. Cell extracts were prepared as describedby Martin et al. (2000). Samples of equal proteinamount (150 lg) were fractionated by SDS-polyacryl-amide gel electrophoresis using 8% polyacrylamide gelsand transferred to polyvinylidene difluoride (PVDF)membranes (Millipore). To detect phosphorylated Slt2p,membranes were incubated with an anti-phospho-p44/42 MAPK (Tyr202/Tyr204) antibody (New EnglandBiolabs) at 1:1,000 dilution in a Western analysis. Toexamine the amount of total endogenous Slt2p in ex-tracts, membranes were stripped and detected with apolyclonal anti-Slt2p Mpk1(yN-19) antibody (SantaCruz Biotechnology) at 1:1,000 dilution.
Actin staining
Overnight yeast cultures were diluted to OD600 of 0.1–0.2 and pre-grown at 27�C for 2 h. Cells were thenshifted to non-permissive temperatures for 6 h. Cellsfrom 10 ml of culture were harvested and fixed in 4%formaldehyde for 1 h at room temperature. After fixa-tion, cells were washed twice with 0.1 M sodium phos-phate buffer (pH 7.0) and resuspended in 500 ll of thesame buffer. A volume of 10 ll of 6.6 lM rhodamine-labeled phalloidin (Sigma) and 2 ll of 1% Triton X-100were added to the 100 ll of suspension and incubated at27�C for 1 h. Cells were washed five times with 0.1 Msodium phosphate buffer and resuspended in 50 ll ofmounting solution. A volume of 2 ll of each cell sus-pension was examined by fluorescence and differentialinterference contrast (DIC) microscopy, respectively, foractin distribution and cell morphology.
Results
A N-terminal region of Tsc11p is dispensable formaintaining cell viability but necessary for optimalgrowth in the presence of caffeine
Except for a RasGEFN domain at amino acids 990–1,046 found by NCBI conserved-domain search(Marchler-Bauer et al. 2004), the sequence of Tsc11pprovides little information concerning its function. Tofind regions likely important for Tsc11p function, wecompared its amino acid sequence with homologoussequences found in several complete or annotated fungalgenomes using T-Coffee (Notredame et al. 2000) andsearched for conserved blocks of sequence. As shown inthe schematic representation (Fig. 1a) and the completesequence alignment (Supplementary Material, Fig. S1),Tsc11p and these putative fungal orthologues share acommon domain architecture; and seven blocks withsequence conservation are distributed at similar relativelocations within each protein. Although the RasGEFNdomain of Tsc11p is located in a conserved block (box V
277
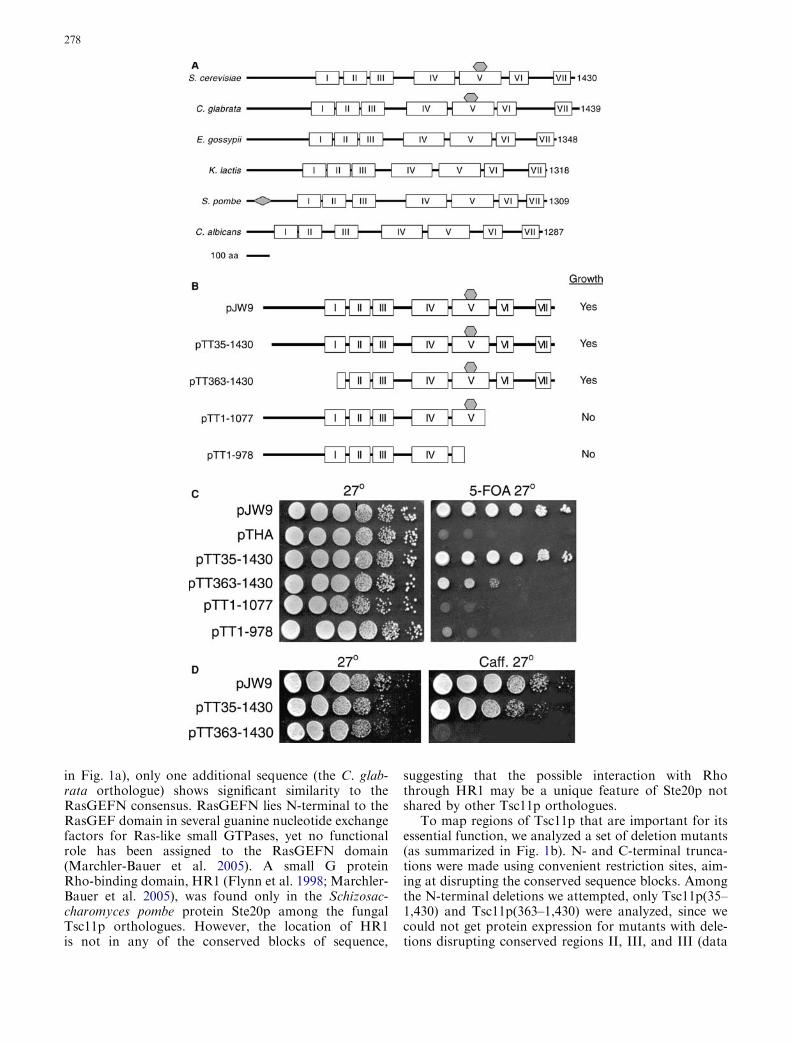
in Fig. 1a), only one additional sequence (the C. glab-rata orthologue) shows significant similarity to theRasGEFN consensus. RasGEFN lies N-terminal to theRasGEF domain in several guanine nucleotide exchangefactors for Ras-like small GTPases, yet no functionalrole has been assigned to the RasGEFN domain(Marchler-Bauer et al. 2005). A small G proteinRho-binding domain, HR1 (Flynn et al. 1998; Marchler-Bauer et al. 2005), was found only in the Schizosac-charomyces pombe protein Ste20p among the fungalTsc11p orthologues. However, the location of HR1is not in any of the conserved blocks of sequence,
suggesting that the possible interaction with Rhothrough HR1 may be a unique feature of Ste20p notshared by other Tsc11p orthologues.
To map regions of Tsc11p that are important for itsessential function, we analyzed a set of deletion mutants(as summarized in Fig. 1b). N- and C-terminal trunca-tions were made using convenient restriction sites, aim-ing at disrupting the conserved sequence blocks. Amongthe N-terminal deletions we attempted, only Tsc11p(35–1,430) and Tsc11p(363–1,430) were analyzed, since wecould not get protein expression for mutants with dele-tions disrupting conserved regions II, III, and III (data
278

not shown). Tsc11p(35–1,430) contains all the conservedregions, while Tsc11p(363–1,430) has region I disrupted.The C-terminal deletions we generated includeTsc11p(1–1,077), which has regions VI and VII removed,and Tsc11p(1–978), which lacks the RasGEFN domainalong with regions VI and VII. All deletion mutants weretested in a haploid yeast strain MCY13 for their abilityto support cell viability by using a plasmid shufflingprocedure (Sikorski and Boeke 1991). MCY13 had itschromosomal copy of TSC11 replaced by the HIS3marker, while the cell growth was supported by a wild-type copy of TSC11 carried on a URA3 plasmid. Aftertransforming each deletion mutant into MCY13respectively, we spotted individual transformants on5-FOA-containing plates to allow the growth of cellsthat had lost the URA3 plasmid and hence carried onlythe mutant copy of TSC11. If the mutant version ofTsc11p were able to support cell growth, colonies couldform on the 5-FOA plates. Among the deletion mutantstested, only Tsc11p(35–1,430) and Tsc11p(363–1,430)were able to grow to colonies on 5-FOA plates (Fig. 1c).Although Tsc11p(363-1,430) was ca. 1,000- to 10,000-fold less efficient in rescuing the tsc11 null mutant thanthe wild-type Tsc11p, our results indicated that aminoacids 363–1,430 of Tsc11p are sufficient for maintainingcell viability. None of the C-terminal deletion mutantsgrew to colonies, suggesting that the C-terminal regionof Tsc11p contains an essential element for Tsc11pfunction. The failure of the Tsc11p(1–1,077) mutant tosupport cell viability indicates that the presence ofRasGEFN domain is not sufficient for the essentialfunction of Tsc11p.
As previous studies showed that transposon insertionin the TSC11 gene can cause caffeine sensitivity in yeastcells (Smith et al. 1996), we tested the two viable deletionmutants for their sensitivity to caffeine. We found that,while cells expressing Tsc11p(35–1,430) grew almost aswell as the wild-type cells in 6 mM caffeine, cellsexpressing Tsc11p (363–1,430) exhibited caffeine sensi-tivity (Fig. 1d). Taken together, our results suggest thatamino acids 1–363 of Tsc11p are not required for cellgrowth under normal conditions while, in the presenceof 6 mM caffeine, amino acids 35–363 are necessary tomaintain cell viability.
ts mutations within the essential region of Tsc11presult in cell wall integrity defects
To further study the essential function of TSC11, weinitiated a genetic screen, combining in vivo gap-repair(Muhlrad et al. 1992) and plasmid shuffling (Sikorskiand Boeke 1991; see Materials and methods) for con-ditional tsc11 alleles. We arbitrarily divided the ratherlarge TSC11 coding region, which is more than 4 kb,into four regions (A, B, C, D, from 5¢ to 3¢; see Fig. 2a)when we planned the gap-repair experiment. Since re-gion A corresponds to the N-terminal portion of Tsc11p,which we have shown is dispensable for cell viability(Fig. 1b), we only mutagenized the B, C, and D regions,respectively. ts mutants from each of the three regionswere obtained (designated ts followed by the region ofmutation and a number). The growth of representativemutants from each region at different temperatures isshown in Fig. 2b (left, middle panels). Mutants tsB1,tsB2, and tsD1 were unable to form any colonies at37�C, even after longer incubation (data not shown).Growth of tsC1 was markedly inhibited at 37�C(Fig. 2b) and completely absent at 38�C (data notshown). It was noted that Tsc11p(363–1,430), a region Arepresentative mutant, seemed to grow less well than thewild type (Fig. 2b). However, unlike the tsc11ts mutants,Tsc11p(363–1,430) did not lose viability even at 37�Cbut rather grew more slowly; and colonies appeared inall dilutions of this mutant after longer incubation (datanot shown).
We sequenced these representative tsc11ts mutantsand confirmed that they carried mutations within therepaired gapped regions. It was noted that most muta-tion points reside in the conserved blocks of sequence(see Supplementary Material, Fig. S1). The tsB1 mutanthad three amino acid substitutions (Y370H, F419L,H500L): Y370H and F419L are in conserved region I,while H500L in region II. The tsB2 mutant had sixsubstitutions (L357P, Y422H, E466V, F568L, L577P,E638G); and these mutations are scattered within con-served regions I, II, and III, except for Y422H andE638G. The tsC1 mutant had four substitutions(K808T, F820S, K865E, F904V), all of which are inconserved region IV. The tsD1 mutant had 11 substi-tutions (I1008T, E1076G, K1079G, F1101S, N1142D,
Fig. 1 The N-terminal region of Tsc11p is dispensable formaintaining cell viability but required for growth in caffeine.a Alignment of Tsc11p and its putative fungal orthologues.Sequences with the following accession numbers were used in theT-coffee analysis to create the alignment: AAB60298 (Sac.cerevisiae), CAG60402 (C. glabrata), AAS50987 (E. gossypii),CAG99949 (Kluyveromyces lactis), CAA11758 (Sch. pombe),EAK93969 (Candida albicans). Regions I–VII are the mosthomologous regions across all species. RasGEFN domains (hexa-gons) are found within region V of Sac. cerevisiae and C. glabrataproteins. The Sch. pombe protein has a HR1 domain (diamond) atthe N-terminal region. b Schematic representation of the wild type(pJW9) and deletion mutants of TSC11 (pTTs; numbers indicate theamino acid positions corresponding to those of the wild-typeTsc11p contained in the mutant proteins). c Plasmid shuffling testfor the ability of deletion mutants to support cell growth. A set ofLEU2-containing 2l plasmids expressing the wild type or deletionmutants of TSC11 (as shown in b) were transformed into MCY13[tsc11D::HIS3; pMYC79 (URA3 CEN ARS TSC11)]. pTHA is thevector control. Ten-fold serial dilutions of cell suspensions preparedfrom different transformants were spotted onto yeast extract,peptone and dextrose (YPD) plates and SD-L plates containing1 mg/ml of 5-FOA and incubated at 27�C until colonies formed.d Caffeine (Caff.) sensitivity test on deletion mutants. MCY13 cellstransformed with pJW9, pTT35-1430, or pTT363-1430, respec-tively, were first plated onto 5-FOA plates to select for cells that lostthe URA3 plasmid. Ten-fold serial dilutions of the resulting clones,which only contained the LEU2 plasmids, were spotted onto YPDplates with or without 6 mM caffeine and incubated at 27�C untilcolonies formed
b
279
I1159V, I1267K, E1274G, D1276G, N1352D, N1367D).I1008T, E1076G, K1079G, and F1101S are in conservedregion V, with I1008T in the RasGEFN domain. I1159Vis in region VI, while N1352D and N1367D are in regionVII. N1142D, I1267K, E1274G, and D1276G are atpositions with less similarity across species.
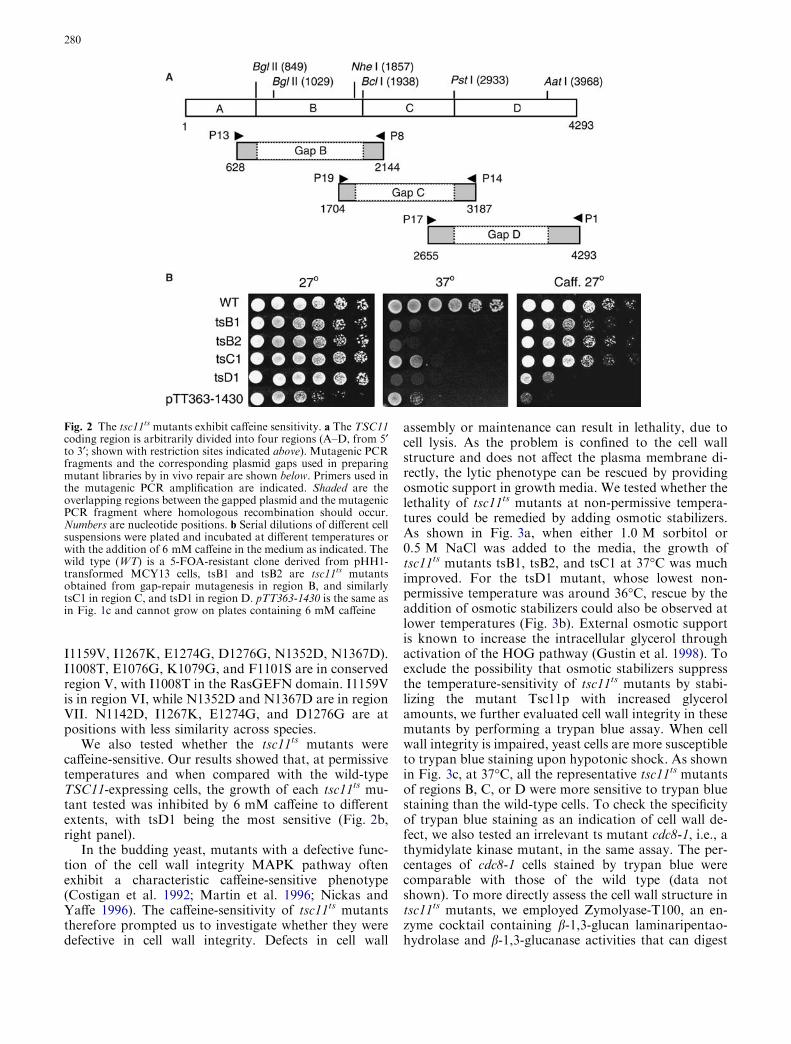
We also tested whether the tsc11ts mutants werecaffeine-sensitive. Our results showed that, at permissivetemperatures and when compared with the wild-typeTSC11-expressing cells, the growth of each tsc11ts mu-tant tested was inhibited by 6 mM caffeine to differentextents, with tsD1 being the most sensitive (Fig. 2b,right panel).
In the budding yeast, mutants with a defective func-tion of the cell wall integrity MAPK pathway oftenexhibit a characteristic caffeine-sensitive phenotype(Costigan et al. 1992; Martin et al. 1996; Nickas andYaffe 1996). The caffeine-sensitivity of tsc11ts mutantstherefore prompted us to investigate whether they weredefective in cell wall integrity. Defects in cell wall
assembly or maintenance can result in lethality, due tocell lysis. As the problem is confined to the cell wallstructure and does not affect the plasma membrane di-rectly, the lytic phenotype can be rescued by providingosmotic support in growth media. We tested whether thelethality of tsc11ts mutants at non-permissive tempera-tures could be remedied by adding osmotic stabilizers.As shown in Fig. 3a, when either 1.0 M sorbitol or0.5 M NaCl was added to the media, the growth oftsc11ts mutants tsB1, tsB2, and tsC1 at 37�C was muchimproved. For the tsD1 mutant, whose lowest non-permissive temperature was around 36�C, rescue by theaddition of osmotic stabilizers could also be observed atlower temperatures (Fig. 3b). External osmotic supportis known to increase the intracellular glycerol throughactivation of the HOG pathway (Gustin et al. 1998). Toexclude the possibility that osmotic stabilizers suppressthe temperature-sensitivity of tsc11ts mutants by stabi-lizing the mutant Tsc11p with increased glycerolamounts, we further evaluated cell wall integrity in thesemutants by performing a trypan blue assay. When cellwall integrity is impaired, yeast cells are more susceptibleto trypan blue staining upon hypotonic shock. As shownin Fig. 3c, at 37�C, all the representative tsc11ts mutantsof regions B, C, or D were more sensitive to trypan bluestaining than the wild-type cells. To check the specificityof trypan blue staining as an indication of cell wall de-fect, we also tested an irrelevant ts mutant cdc8-1, i.e., athymidylate kinase mutant, in the same assay. The per-centages of cdc8-1 cells stained by trypan blue werecomparable with those of the wild type (data notshown). To more directly assess the cell wall structure intsc11ts mutants, we employed Zymolyase-T100, an en-zyme cocktail containing b-1,3-glucan laminaripentao-hydrolase and b-1,3-glucanase activities that can digest
Fig. 2 The tsc11ts mutants exhibit caffeine sensitivity. a The TSC11coding region is arbitrarily divided into four regions (A–D, from 5¢to 3¢; shown with restriction sites indicated above). Mutagenic PCRfragments and the corresponding plasmid gaps used in preparingmutant libraries by in vivo repair are shown below. Primers used inthe mutagenic PCR amplification are indicated. Shaded are theoverlapping regions between the gapped plasmid and the mutagenicPCR fragment where homologous recombination should occur.Numbers are nucleotide positions. b Serial dilutions of different cellsuspensions were plated and incubated at different temperatures orwith the addition of 6 mM caffeine in the medium as indicated. Thewild type (WT) is a 5-FOA-resistant clone derived from pHH1-transformed MCY13 cells, tsB1 and tsB2 are tsc11ts mutantsobtained from gap-repair mutagenesis in region B, and similarlytsC1 in region C, and tsD1 in region D. pTT363-1430 is the same asin Fig. 1c and cannot grow on plates containing 6 mM caffeine
280
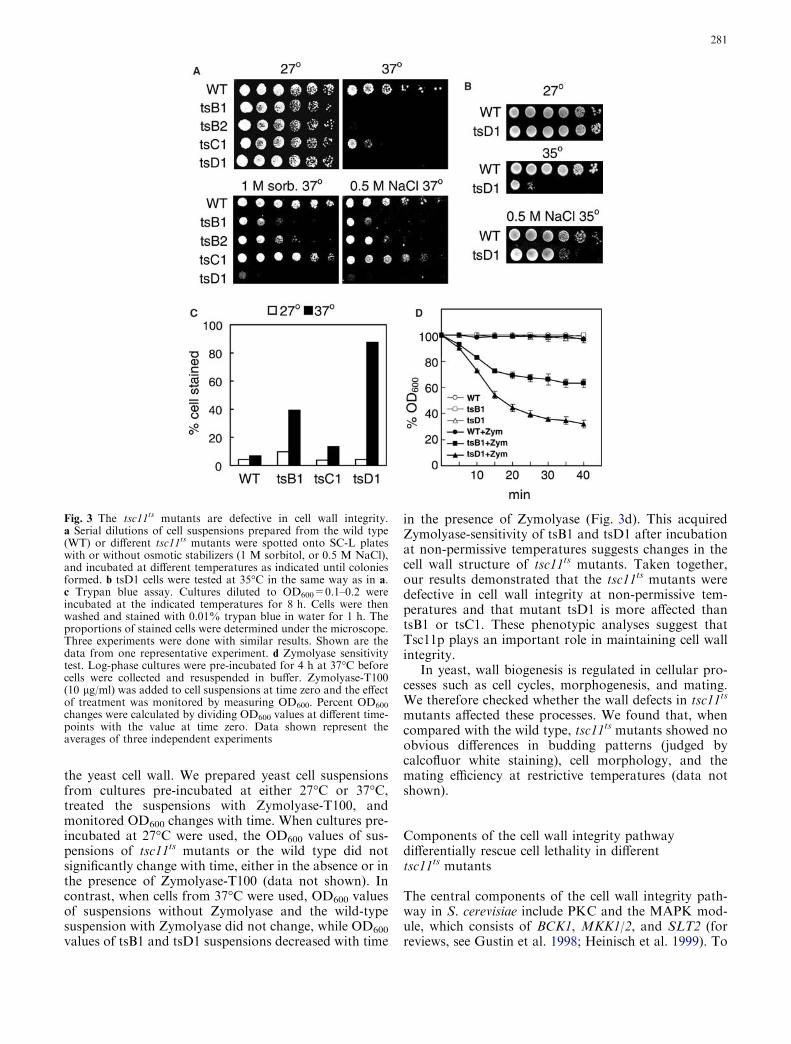
the yeast cell wall. We prepared yeast cell suspensionsfrom cultures pre-incubated at either 27�C or 37�C,treated the suspensions with Zymolyase-T100, andmonitored OD600 changes with time. When cultures pre-incubated at 27�C were used, the OD600 values of sus-pensions of tsc11ts mutants or the wild type did notsignificantly change with time, either in the absence or inthe presence of Zymolyase-T100 (data not shown). Incontrast, when cells from 37�C were used, OD600 valuesof suspensions without Zymolyase and the wild-typesuspension with Zymolyase did not change, while OD600
values of tsB1 and tsD1 suspensions decreased with time
in the presence of Zymolyase (Fig. 3d). This acquiredZymolyase-sensitivity of tsB1 and tsD1 after incubationat non-permissive temperatures suggests changes in thecell wall structure of tsc11ts mutants. Taken together,our results demonstrated that the tsc11ts mutants weredefective in cell wall integrity at non-permissive tem-peratures and that mutant tsD1 is more affected thantsB1 or tsC1. These phenotypic analyses suggest thatTsc11p plays an important role in maintaining cell wallintegrity.
In yeast, wall biogenesis is regulated in cellular pro-cesses such as cell cycles, morphogenesis, and mating.We therefore checked whether the wall defects in tsc11ts
mutants affected these processes. We found that, whencompared with the wild type, tsc11ts mutants showed noobvious differences in budding patterns (judged bycalcofluor white staining), cell morphology, and themating efficiency at restrictive temperatures (data notshown).
Components of the cell wall integrity pathwaydifferentially rescue cell lethality in differenttsc11ts mutants
The central components of the cell wall integrity path-way in S. cerevisiae include PKC and the MAPK mod-ule, which consists of BCK1, MKK1/2, and SLT2 (forreviews, see Gustin et al. 1998; Heinisch et al. 1999). To
Fig. 3 The tsc11ts mutants are defective in cell wall integrity.a Serial dilutions of cell suspensions prepared from the wild type(WT) or different tsc11ts mutants were spotted onto SC-L plateswith or without osmotic stabilizers (1 M sorbitol, or 0.5 M NaCl),and incubated at different temperatures as indicated until coloniesformed. b tsD1 cells were tested at 35�C in the same way as in a.c Trypan blue assay. Cultures diluted to OD600=0.1–0.2 wereincubated at the indicated temperatures for 8 h. Cells were thenwashed and stained with 0.01% trypan blue in water for 1 h. Theproportions of stained cells were determined under the microscope.Three experiments were done with similar results. Shown are thedata from one representative experiment. d Zymolyase sensitivitytest. Log-phase cultures were pre-incubated for 4 h at 37�C beforecells were collected and resuspended in buffer. Zymolyase-T100(10 lg/ml) was added to cell suspensions at time zero and the effectof treatment was monitored by measuring OD600. Percent OD600
changes were calculated by dividing OD600 values at different time-points with the value at time zero. Data shown represent theaverages of three independent experiments
281

test whether TSC11 interacts with this pathway, we ex-pressed PKC1 and components of its downstreamMAPK module to see whether these genes prevent thedeath of tsc11ts mutants at non-permissive temperatures.We found that, when compared with the vector control,none of the PKC/MAPK pathway components we tes-ted improved the growth of tsB1 mutant cells at the non-permissive temperature 37�C or even at semi-permissivetemperatures down to 34�C (data not shown). Similarresults were obtained for the tsC1 mutant (data notshown). However, when the tsD1 mutant was tested, theactive form of PKC1 clearly rescued the temperature-sensitivity; and the MAPK cascade components alsoslightly improved the cell growth at 35�C (Fig. 4a). Thedifference in the effect of PKC/MAPK expressionamong different tsc11ts mutants may suggest thatmutations in different regions of Tsc11p affected differ-ent functions of Tsc11p. It is possible that mutations inthe tsD1 mutant mainly affected a Tsc11p function thatcould be complemented by activation of the PKC/MAPK pathway, while mutations in tsB1 and tsC1had effects on additional PKC/MAPK-independentfunction(s) of Tsc11p.
Previous studies showed that cell wall damage trig-gers a ‘‘cell wall compensatory mechanism’’ which ispartly mediated by the PKC/MAPK pathway (Lahoreet al. 2003; Garcia et al. 2004); and this mechanism istherefore signified by hyper-phosphorylation of Slt2p.We examined the levels of Slt2p phosphorylation intsc11ts mutants at non-permissive temperatures. Con-sistent with its obvious defect in cell wall integrity, tsD1showed hyper-phosphorylation of Slt2p (Fig. 4b). Thelevel of Slt2p phosphorylation in tsB1, however, wassimilar to that in the wild type; and this observation mayreflect the minor cell wall phenotype of tsB1. Togetherwith the finding that components of the cell integritypathway failed to rescue the temperature-sensitivity oftsB1, we suspect that mutations in tsB1 affect an essen-tial function of Tsc11p other than modulating the cellintegrity.
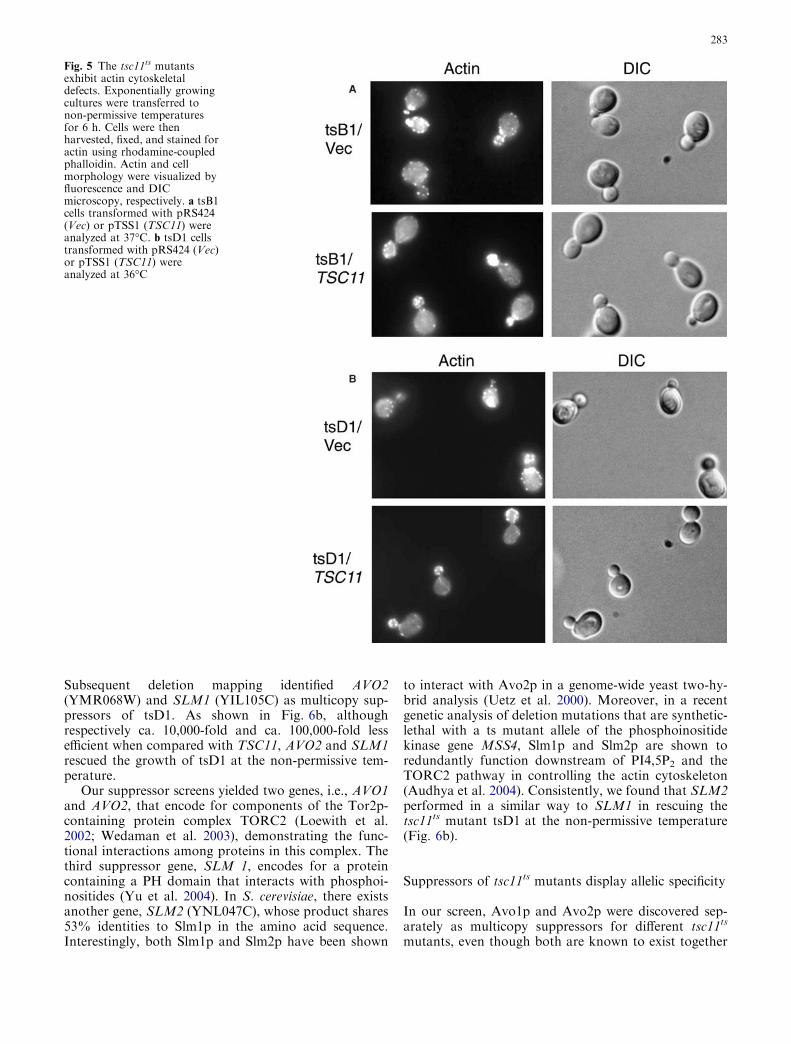
Actin distribution is affected in tsc11ts mutants
Since Tsc11p associates with Tor2p but not Tor1p(Loewith et al. 2002; Wedaman et al. 2003) and theTor2p-unique function is related to the organization ofthe actin cytoskeleton (Schmidt et al. 1996; Bickle et al.1998; Helliwell et al. 1998b), we examined the actindistribution patterns in tsc11ts mutants at non-permis-sive temperatures. In wild-type budded cells, actin cor-tical patches are concentrated in the small buds, whileactin cables are clearly visible in the mother cells. Boththe tsB1 and tsD1 mutants displayed abnormal patternsof actin distribution (Fig. 5). In tsB1, very few or noactin cables were seen and the polarization of actin waspoorer than that in the wild type, with considerablenumbers of actin patches present in the mother cells. ThetsD1 mutant showed even more obvious disorganization
of the actin cytoskeleton: actin cables were absent andpatches scattered throughout both mother and daughtercells. Expression of the wild-type TSC11 in these mu-tants completely restored the polarized actin distribu-tion, indicating that Tsc11p indeed participates in theTor2p-unique function.
Components of TORC2 and interacting proteins actas multicopy suppressors of tsc11ts mutants
To identify additional genes that functionally interactwith TSC11, we searched for multicopy suppressors bytransforming a 2l genomic library into representativetsc11ts mutants tsB1, tsC1, and tsD1. We failed toidentify any multicopy suppressor for tsC1, even thoughmore than 336,000 library transformants were screened.For the tsB1 mutant, other than clones containingTSC11, we discovered one multicopy suppressor cloneout of ca. 34,000 library transformants. By deletingdifferent parts of the genomic insert, we subsequentlyidentified AVO1 (YOL078W) as the suppressor gene. Asshown in Fig. 6a, AVO1 restored the cell growth oftsB1 at 37�C, although not to the same extent as TSC11did. For the tsD1 mutant, excluding plasmids containingTSC11, six different genomic clones out of ca. 600,000library transformants were found to suppress tempera-ture sensitivity, five of which carried DNA from chro-mosome XIII and one from chromosome IX.
Fig. 4 Over-expression of PKC/MAPK pathway componentsdifferentially affects different tsc11ts mutants. a Serial dilutions ofcell suspensions prepared from different tsD1 transformants werespotted onto SC-L-U plates and incubated at different tempera-tures as indicated until colonies formed. Plasmids used were: VecpHH3, TSC11 pMYC79, PKC1* YCp50::PKC1(R398P), which isan active form of PKC1, BCK1* pRS316::BCK1-20, which is anactive form of BCK1, MKK1 YEp352::MKK1, and SLT2YEp352::MPK1. b Phosphorylation of Slt2p in tsB1 and tsD1mutants. Log-phase cultures grown at 24�C were each split intotwo aliquots and either kept at 24�C or shifted to 39�C for 1 hbefore extracts were prepared. Equal amounts of protein wereseparated on 8% SDS-polyacrylamide gels and immunoblottedwith anti-phospho-p44/p42 MAPK antibodies. The same PVDFmembrane was stripped and re-blotted using anti-Slt2p antibodies
282
Subsequent deletion mapping identified AVO2(YMR068W) and SLM1 (YIL105C) as multicopy sup-pressors of tsD1. As shown in Fig. 6b, althoughrespectively ca. 10,000-fold and ca. 100,000-fold lessefficient when compared with TSC11, AVO2 and SLM1rescued the growth of tsD1 at the non-permissive tem-perature.
Our suppressor screens yielded two genes, i.e., AVO1and AVO2, that encode for components of the Tor2p-containing protein complex TORC2 (Loewith et al.2002; Wedaman et al. 2003), demonstrating the func-tional interactions among proteins in this complex. Thethird suppressor gene, SLM 1, encodes for a proteincontaining a PH domain that interacts with phosphoi-nositides (Yu et al. 2004). In S. cerevisiae, there existsanother gene, SLM2 (YNL047C), whose product shares53% identities to Slm1p in the amino acid sequence.Interestingly, both Slm1p and Slm2p have been shown
to interact with Avo2p in a genome-wide yeast two-hy-brid analysis (Uetz et al. 2000). Moreover, in a recentgenetic analysis of deletion mutations that are synthetic-lethal with a ts mutant allele of the phosphoinositidekinase gene MSS4, Slm1p and Slm2p are shown toredundantly function downstream of PI4,5P2 and theTORC2 pathway in controlling the actin cytoskeleton(Audhya et al. 2004). Consistently, we found that SLM2performed in a similar way to SLM1 in rescuing thetsc11ts mutant tsD1 at the non-permissive temperature(Fig. 6b).
Suppressors of tsc11ts mutants display allelic specificity
In our screen, Avo1p and Avo2p were discovered sep-arately as multicopy suppressors for different tsc11ts
mutants, even though both are known to exist together
Fig. 5 The tsc11ts mutantsexhibit actin cytoskeletaldefects. Exponentially growingcultures were transferred tonon-permissive temperaturesfor 6 h. Cells were thenharvested, fixed, and stained foractin using rhodamine-coupledphalloidin. Actin and cellmorphology were visualized byfluorescence and DICmicroscopy, respectively. a tsB1cells transformed with pRS424(Vec) or pTSS1 (TSC11) wereanalyzed at 37�C. b tsD1 cellstransformed with pRS424 (Vec)or pTSS1 (TSC11) wereanalyzed at 36�C
283
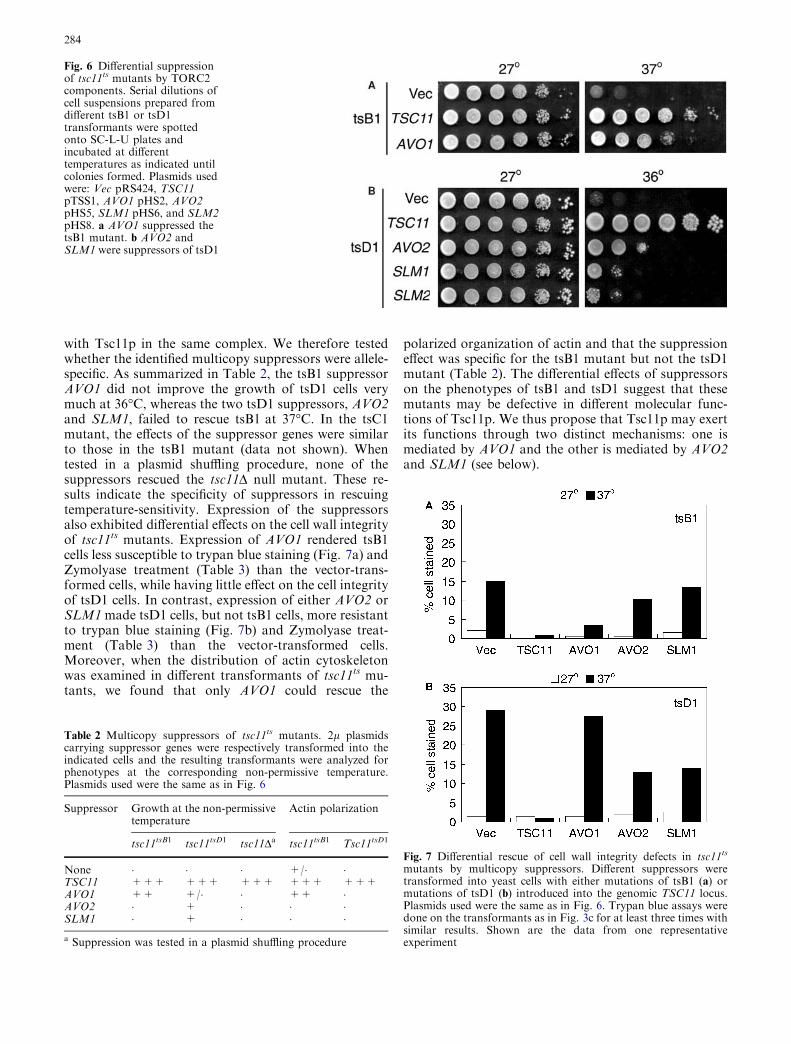
with Tsc11p in the same complex. We therefore testedwhether the identified multicopy suppressors were allele-specific. As summarized in Table 2, the tsB1 suppressorAVO1 did not improve the growth of tsD1 cells verymuch at 36�C, whereas the two tsD1 suppressors, AVO2and SLM1, failed to rescue tsB1 at 37�C. In the tsC1mutant, the effects of the suppressor genes were similarto those in the tsB1 mutant (data not shown). Whentested in a plasmid shuffling procedure, none of thesuppressors rescued the tsc11D null mutant. These re-sults indicate the specificity of suppressors in rescuingtemperature-sensitivity. Expression of the suppressorsalso exhibited differential effects on the cell wall integrityof tsc11ts mutants. Expression of AVO1 rendered tsB1cells less susceptible to trypan blue staining (Fig. 7a) andZymolyase treatment (Table 3) than the vector-trans-formed cells, while having little effect on the cell integrityof tsD1 cells. In contrast, expression of either AVO2 orSLM1made tsD1 cells, but not tsB1 cells, more resistantto trypan blue staining (Fig. 7b) and Zymolyase treat-ment (Table 3) than the vector-transformed cells.Moreover, when the distribution of actin cytoskeletonwas examined in different transformants of tsc11ts mu-tants, we found that only AVO1 could rescue the
polarized organization of actin and that the suppressioneffect was specific for the tsB1 mutant but not the tsD1mutant (Table 2). The differential effects of suppressorson the phenotypes of tsB1 and tsD1 suggest that thesemutants may be defective in different molecular func-tions of Tsc11p. We thus propose that Tsc11p may exertits functions through two distinct mechanisms: one ismediated by AVO1 and the other is mediated by AVO2and SLM1 (see below).
Fig. 6 Differential suppressionof tsc11ts mutants by TORC2components. Serial dilutions ofcell suspensions prepared fromdifferent tsB1 or tsD1transformants were spottedonto SC-L-U plates andincubated at differenttemperatures as indicated untilcolonies formed. Plasmids usedwere: Vec pRS424, TSC11pTSS1, AVO1 pHS2, AVO2pHS5, SLM1 pHS6, and SLM2pHS8. a AVO1 suppressed thetsB1 mutant. b AVO2 andSLM1 were suppressors of tsD1
Table 2 Multicopy suppressors of tsc11ts mutants. 2l plasmidscarrying suppressor genes were respectively transformed into theindicated cells and the resulting transformants were analyzed forphenotypes at the corresponding non-permissive temperature.Plasmids used were the same as in Fig. 6
Suppressor Growth at the non-permissivetemperature
Actin polarization
tsc11tsB1 tsc11tsD1 tsc11Da tsc11tsB1 Tsc11tsD1
None � � � +/� �TSC11 +++ +++ +++ +++ +++AVO1 ++ +/� � ++ �AVO2 � + � � �SLM1 � + � � �a Suppression was tested in a plasmid shuffling procedure
Fig. 7 Differential rescue of cell wall integrity defects in tsc11ts
mutants by multicopy suppressors. Different suppressors weretransformed into yeast cells with either mutations of tsB1 (a) ormutations of tsD1 (b) introduced into the genomic TSC11 locus.Plasmids used were the same as in Fig. 6. Trypan blue assays weredone on the transformants as in Fig. 3c for at least three times withsimilar results. Shown are the data from one representativeexperiment
284

Discussion
Extending beyond the physical interaction betweenTsc11p and Tor2p, our genetic data provide evidence forthe functional linkage among Tor2p-binding partners.Analysis of tsc11ts mutants revealed abnormal actinpolarization, indicating the participation of Tsc11p inthe Tor2p-unique function. Moreover, consistent withthe presence of two distinct TOR complexes, our sup-pressor analysis identified that only TORC2 componentsand not TORC1 components could rescue tsc11ts mu-tants. This leads to the prediction that tsc11ts cells, withpresumably only the function of TORC2 affected, arestill intact in their TORC1 function and are rapamycin-sensitive. Indeed, we found that growth of tsc11ts mu-tants was markedly inhibited on media containing10 ng/ml rapamycin (H.-L. Ho, M.-Y. Chen, unpub-lished data).
Phenotypic analysis of mutants indicated that TSC11is functionally linked to the regulation of cell wallintegrity. As mentioned in the Introduction, there is anemerging connection between the TOR2-unique func-tion and the cell wall integrity pathway (Schmidt et al.1997; Helliwell et al. 1998a). Despite the requirement ofTor2p for the activation of the nucleotide exchangefactor Rom2p (Schmidt et al. 1997), a direct physicalinteraction between Tor2p and Rom2p has not beendetected. Therefore, there very likely exist other molec-ular components to mediate the signaling between Tor2pand Rom2p. Our data raise the possibility that Tsc11pmay serve as a component acting between Tor2p andRom2p.
Although all the tsc11ts mutants we generatedexhibited actin and cell wall integrity defects, severalobservations distinguished them into two distinct clas-ses, one of which included the tsB1 and tsC1 mutantswhile the other was represented by tsD1. First, tsB1 andtsC1 were only slightly sensitive to 6 mM of caffeine,while tsD1 showed a marked caffeine-sensitivity. Sec-ond, components of the PKC/MAPK pathway did notrescue tsB1 or tsC1, yet the active form of PKC1
suppressed the temperature-sensitivity of tsD1. Third,AVO1 preferentially suppressed tsB1 and tsC1, whileAVO2 and SLM1/2 only suppressed tsD1. One plausi-ble, simple explanation for our data is that the twoclasses of mutants are defective in different molecularfunctions of Tsc11p. We thus propose that the twoclasses of mutants define two mechanisms for Tsc11pfunction (summarized in Fig. 8): one acts throughAvo1p, while the other is a Pkc1p-dependent mechanismmediated through Avo2p and Slm1p/Slm2p.
The proposed Avo1p branch of Tsc11p pathwayseems to mediate both cell integrity and actin polariza-tion, since AVO1 both rescued the wall defects andrestored the normal actin distribution in tsB1 at the non-permissive temperature. Consistently, avo1mutants wereshown to be defective in polarization of actin cytoskel-eton (Loewith et al. 2002). Previous studies defined threegenetic pathways that function in parallel to promote cellwall integrity: the Mpt5-containing pathway, the Ssd1p-containing pathway, and the Pkc1p-dependent pathway(Kaeberlein and Guarente 2002). As PKC1 did notsuppress the phenotype of tsB1, one intriguing possibil-ity is that Tsc11p-Avo1p signaling is linked to thePKC-independent cell wall integrity pathways.
Table 3 Zymolyase-T100 sensitivity of tsc11ts mutants. DifferenttsB1 or tsD1 transformants were tested for sensitivity to Zymoly-ase-T100. Plasmids used were as in Fig. 6. Cultures were pre-incubated for 4 h at the indicated temperatures. Zymolyase-T100(100 lg/ml) was then added to the culture medium. Cells weregrown for another 4 h and OD600 measured. Zymolyase sensitivityis expressed as fractions of cell growth, comparing OD600 values inmedium with and without Zymolyase. Values shown aremeans ±SD (n=4). * P<0.05, ** P<0.01
Suppressor Growth of tsB1at 37�C (%)
Growth of tsD1at 36�C (%)
Vector 68.9±2.4 37.8±2.5TSC11 87.5±2.0* 89.7±3.0 **AVO1 81.4±5.0 * 41.2±3.9AVO2 62.8±6.6 53.1±6.3 *SLM1 75.7±6.3 59.3±7.5 **
Fig. 8 A proposed model for Tsc11p signaling. Circled proteinswere found to interact genetically with Tsc11p in this study. TheTORC2 complex (shaded) integrates unknown upstream signalsand channels them through unique Tor2p-binding partners tospecific downstream effector pathways. In regulating cell integrity,Tsc11p signals through both an Avo1p-mediated pathway (withunknown downstream components) and an Avo2p-mediatedpathway that links to Pkc1p. The modulation of actin organizationby Tsc11p may involve both the Avo1p branch of the pathway anda mechanism that does not rely on either Avo1p or Avo2p. See theDiscussion for the role of Slm proteins and other details
285

In contrast, in the proposed Avo2p-mediated branchof Tsc11p pathway, Pkc1p likely acts as one downstreamcomponent, since its active form suppressed the pheno-type of tsD1. The involvement of the MAPK cascade isdoubtful, as the effect of expressing its components inrescuing tsD1 was marginal. We cannot rule out thepossibility that the better suppression by PKC1 is simplybecause it is a more potent activator of the MAPKsignaling than the downstream components when over-expressed. However, an alternative explanation is thatthe Avo2p-mediated Tsc11p function links to a Pkc1p-dependent but MAPK-independent effector pathway.This is not an unprecedented scenario, as other evidenceexists for a bifurcation of the signaling pathway down-stream of Pkc1p. For example, phenotypes of mid2D(Ketela et al. 1999), glc7-10 (a mutant allele of a type 1protein phosphatase; Andrews and Stark 2000), andsth1-3ts (a mutant allele of a RSC component; Chaiet al. 2002) can be suppressed only by over-expression ofPKC1 and its upstream activators, suggesting that thesefunctions signal through a MAPK cascade-independentalternative Pkc1p-mediated pathway. Besides Pkc1p,our data also suggest a role for Slm1p/Slm2p in theAvo2p-mediated Tsc11p-signaling pathway. We placeSlm proteins at the level of TORC2 in the model, sincethe association between Avo2p and Slm1 proteins hasbeen shown by two-hybrid screening (Uetz et al. 2000)and coimmunoprecipitation (Audhya et al. 2004). Slm1pand its closely related protein Slm2p function redun-dantly downstream of PI4,5P2 and TORC2 to regulateactin organization (Audhya et al. 2004). Interestingly,just like the temperature-sensitivity of the tsD1 mutantof TSC11, the lethality of slm1Dslm2D can be suppressedby an active form of PKC1, but not by active BCK1 orMKK1. These data position the action of Slm proteinsupstream of Pkc1p and suggest that Slm1p/Slm2p-mediated signaling may indeed link to an alternativePkc1p effector pathway that is MAPK-independent.
In addition, we propose in the model an Avo1/2p-independent signaling function of Tsc11p that modu-lates the actin cytoskeleton. This presumed Tsc11pfunction might have been affected in the tsD1 mutant,since neither expression of AVO1 nor AVO2 rescued theactin polarization defect in tsD1. Furthermore, despitethe fact that Slm1p and Slm2p are shown to be essentialfor normal actin organization (Audhya et al. 2004),overexpression of SLM1 failed to correct the actin dis-tribution patterns in tsD1, even though it did decreasethe susceptibility to trypan blue and sensitivity toZymolyase. Although possible explanations are thatoverexpression of AVO2 or SLM1 is not sufficient toactivate the actin pathway or that Tsc11p-Avo2p-Slm1psignaling mainly affects cell wall integrity, our datasuggest that Tsc11p can signal to regulate actin throughan Avo2p/Slm1p-independent mechanism.
Diverse cellular events are influenced by TOR and ithas been suggested that TOR acts as a ‘‘multichannelprocessor’’ to integrate various upstream signals andchannel them to specific downstream effector pathways
(Shamji et al. 2000). Given the existence of TOR-con-taining multi-protein complexes within cells, one plau-sible mechanism for TOR to differentially regulatedownstream signaling is through each unique TOR-binding partner that functions to specify target effectors.Consistent with this scenario, our genetic analyses re-vealed that TORC2 components Avo1p and Avo2pdefine two distinct signaling mechanisms of Tsc11p inmodulating actin cytoskeleton organization and cell wallintegrity. The challenge remains to elucidate how Tsc11pworks in these two mechanisms at the molecular level.As Tsc11p does not contain any known domains forcatalytic activities, one conceivable scenario is thatTsc11p exerts its functions through modulating protein–protein interactions. In this study, we provide genetic,but not physical evidence for an interaction betweenTsc11p and the multicopy suppressor proteins. Previousidentification of TORC2 components (Loewith et al.2002; Wedaman et al. 2003) or a demonstrationof association between Avo2p and the Slm proteins(Audhya et al. 2004) were done by copurification andcoimmunoprecipitation, but it was not determinedwhich proteins have direct physical contacts. It is pos-sible that Tsc11p directly binds to Tor2p and acts as anadaptor protein that links other components to form theTORC2 complex. Alternatively, Tsc11p might functionas a scaffold and associate with downstream effectors orsubstrates for Tor2p to enhance the efficiency andspecificity of TORC2 signaling. Slm proteins are cur-rently the only known substrates for the TORC2 kinase:although a weak association with Avo2p has beendemonstrated in coimmunoprecipitation (Audhya et al.2004), their physical interaction with Tsc11p has notbeen addressed. To evaluate this hypothesis, furtherexperiments are required to see whether Tsc11p functionis required for recruiting Slm proteins to TORC2 andwhether the recruitment affects the kinase activity ofTORC2 and the modulation of cell wall integrity andactin organization.
Acknowledgements We thank Dr. M.N. Hall for providing plas-mids expressing components of the PKC/MAPK pathway. We arevery grateful to Dr. J.-J. Lin for providing the S. cerevisiae genomiclibrary and critically reading the manuscript. This work was sup-ported by the Program for Promoting Academic Excellence ofUniversities (grant 89-B-FA22-2-4) from the Ministry of Educa-tion, Taiwan, by grants NSC87-2316-B-010-015, NSC88-2314-B-010-071, and NSC91-2320-B-010-082 from the National ScienceCouncil, Taiwan, and by grants NHRI-EX91-8916SC, NHRI-EX92-9230SI, and NHRI-EX93-9230SI from the National HealthResearch Institutes, Taiwan, to M.-Y.C.
References
Andrews PD, Stark MJ (2000) Type 1 protein phosphatase is re-quired for maintenance of cell wall integrity, morphogenesisand cell cycle progression in Saccharomyces cerevisiae. J Cell Sci113:507–520
Audhya A, et al (2004) Genome-wide lethality screen identifies newPI4,5P(2) effectors that regulate the actin cytoskeleton. EMBOJ 23:3747–3757
286
Barbet N, et al (1996) TOR controls translation initiation and earlyG1 progression in yeast. Mol Biol Cell 7:25–42
Beeler T, et al (1998) The Saccharomyces cerevisiaeTSC10/YBR265w gene encoding 3-ketosphinganine reductase is iden-tified in a screen for temperature-sensitive suppressors of theCa2+ sensitive csg2D mutant. J Biol Chem 273:30688–30694
Bickle M, Delley PA, Schmidt A, Hall MN (1998) Cell wallintegrity modulates RHO1 activity via the exchange factorROM2. EMBO J 17:2235–2245
Chai B, Hsu JM, Du J, Laurent BC (2002) Yeast RSC function isrequired for organization of the cellular cytoskeleton via analternative PKC1 pathway. Genetics 161:575–584
Chen M-Y, Long Y, Devreotes PN (1997) A novel cytosolic reg-ulator, Pianissimo, is required for chemoattractant receptor andG protein-mediated activation of the twelve transmembranedomain adenylyl cyclase in Dictyostelium. Genes Dev 11:3218–3231
Christianson TW, Skiorski RS, Dante M, Shero JH, Hieter P(1992) Multifunctional yeast high-copy-number shuttle vectors.Gene 110:119–122
Costigan C, Gehrung S, Snyder M (1992) A synthetic lethal screenidentifies SLK1, a novel protein kinase homolog implicated inyeast cell morphogenesis and cell growth. Mol Cell Biol12:1162–1178
Fingar DC, Blenis J (2004) Target of rapamycin (TOR): an inte-grator of nutrient and growth factor signals and coordinator ofcell growth and cell cycle progression. Oncogene 23:3151–3171
Firon A, Lesage G, Bussey H (2004) Integrative studies put cellwall synthesis on the yeast functional map. Curr Opin Micro-biol 7:617–623
Flynn P, Mellor H, Palmer R, Panayotou G, Parker PJ (1998)Multiple interactions of PRK1 with RhoA. Functional assign-ment of the Hr1 repeat motif. J Biol Chem 273:2698–2705
Garcia R, et al (2004) The global transcriptional response totransient cell wall damage in Saccharomyces cerevisiae and itsregulation by the cell integrity signaling pathway. J Biol Chem279:15183–15195
Geitz D, St Jean A, Woods RA, Schiestl RH (1992) Improvedmethod for high efficiency transformation of intact yeast cells.Nucleic Acids Res 20:1425
Gustin MC, Albertyn J, Alexander M, Davenport K (1998) MAPkinase pathways in the yeast Saccharomyces cerevisiae. Micro-biol Mol Biol Rev 62:1264–1300
Hara K, et al (2002) Raptor, a binding partner of target of rapa-mycin (TOR), mediates TOR action. Cell 110:177–189
Heinisch JJ, Lorberg A, Schmitz HP, Jacoby JJ (1999) The proteinkinase C-mediated MAP kinase pathway involved in themaintenance of cellular integrity in Saccharomyces cerevisiae.Mol Microbiol 32:671–680
Heitman J, Movva NR, Hall MN (1991) Targets for cell cyclearrest by the immunosuppressant rapamycin in yeast. Science253:905–909
Helliwell SB, et al (1994) TOR1 and TOR2 are structurally andfunctionally similar but not identical phosphatidylinositol ki-nase homologues in yeast. Mol Biol Cell 5:105–118
Helliwell SB, Howald I, Barbet N, Hall MN (1998a) TOR2 is partof two related signaling pathways coordinating cell growth inSaccharomyces cerevisiae. Genetics 148:99–112
Helliwell SB, Schmidt A, Ohya Y, Hall MN (1998b) The Rho1effector, Pkc1, but not Bni1, mediates signaling from Tor2 tothe actin cytoskeleton. Curr Biol 8:1211–1214
Hilti N, Baumann D, Schweingruber A-M, Bigler P, Schweingru-ber ME (1999) Gene ste20 controls amiloride sensitivityand fertility in Schizosaccharomyces pombe. Curr Genet 35:585–592
Igual JC, Johnson AL, Johnston LH (1996) Coordinated regula-tion of gene expression by the cell cycle transcription factorSwi4 and the protein kinase C MAP kinase pathway for yeastcell integrity. EMBO J 15:5001–5013
Jacinto E, et al (2004) Mammalian TOR complex 2 controls theactin cytoskeleton and is rapamycin insensitive. Nat Cell Biol6:1122–1128
Kaeberlein M, Guarente L (2002) Saccharomyces cerevisiaeMPT5and SSD1 function in parallel pathways to promote cell wallintegrity. Genetics 160:83–95
Kamada Y, et al (1996) Activation of yeast protein kinase C byRho1 GTPase. J Biol Chem 271:9193–9196
Karpova TS, Lepetit MM, Cooper JA (1993) Mutations that en-hance the cap2 null mutant phenotype in Saccharomyces cere-visiae affect the actin cytoskeleton, morphogenesis and patternof growth. Genetics 135:693–709
Ketela T, Green R, Bussey H (1999) Saccharomyces cerevisiaeMid2p is a potential cell wall stress sensor and upstream acti-vator of the PKC1-MPK1 cell integrity pathway. J Bacteriol181:3330–3340
Kim DH, et al (2002) mTOR interacts with raptor to form anutrient-sensitive complex that signals to the cell growthmachinery. Cell 110:163–175
Kim DH, et al (2003) GbetaL, a positive regulator of the rapa-mycin-sensitive pathway required for the nutrient-sensitiveinteraction between raptor and mTOR. Mol Cell 11:895–904
Kunz J, et al (1993) Target of rapamycin in yeast, TOR2, is anessential phosphatidylinositol kinase homolog required for G1progression. Cell 73:585–596
Lagorce A, et al (2003) Genome-wide analysis of the response tocell wall mutations in the yeast Saccharomyces cerevisiae. J BiolChem 278:20345–20357
Lin J-J, Zakian VA (1996) The Saccharomyces CDC13 protein is asingle-strand TG1-3 telomeric DNA-binding protein in vitrothat affects telomere behavior in vivo. Proc Natl Acad Sci USA93:13760–13765
Loewith R, et al (2002) Two TOR complexes, only one of which israpamycin sensitive, have distinct roles in cell growth control.Mol Cell 10:457–468
Lorenz MC, et al (1995) Gene disruption with PCR products inSaccharomyces cerevisiae. Gene 158:113–117
Marchler-Bauer A, et al (2005) CDD: a conserved domain databasefor protein classification. Nucleic Acids Res 33:D192–D196
Marchler-Bauer A, Bryant SH (2004) CD-Search: protein domainannotations on the fly. Nucleic Acids Res 32:W327–W331
Martin H, et al (1996) Molecular and functional characterization ofa mutant allele of the mitogen-activated protein-kinase geneSLT2 (MPK1) rescued from yeast autolytic mutants. CurrGenet 29:516–522
Martin H, Rodriguez-Pachon JM, Ruiz C, Nombela C, Molina M(2000) Regulatory mechanisms for modulation of signalingthrough the cell integrity Slt2-mediated pathway in Saccharo-myces cerevisiae. J Biol Chem 275:1511–1519
Mazur P, Baginsky W (1996) In vitro activity of 1,3-beta-d-glucansynthase requires the GTP-binding protein Rho1. J Biol Chem271:14604–14609
Muhlrad D, Hunter R, Parker R (1992) A rapid method forlocalized mutagenesis of yeast genes. Yeast 8:79–82
Mumberg D, Muller R, Funk M (1994) Regulatable promoters ofSaccharomyces cerevisiae: comparison of transcriptional activ-ity and their use for heterologous expression. Nucleic Acids Res22:5767–5768
Nickas ME, Yaffe MP (1996) BRO1, a novel gene that interactswith components of the Pkc1p-mitogen-activated protein kinasepathway in Saccharomyces cerevisiae. Mol Cell Biol 16:2585–2593
Nonaka H, et al (1995) A downstream target of RHO1 small GTP-binding protein is PKC1, a homolog of protein kinase C, whichleads to activation of the MAP kinase cascade in Saccharomy-ces cerevisiae . EMBO J 14:5931–5938
NotredameC,HigginsD,Heringa J (2000) T-Coffee: a novelmethodfor multiple sequence alignments. J Mol Biol 302:205–217
Philip B, Levin DE (2001) Wsc1 and Mid2 are cell surface sensorsfor cell wall integrity signaling that act through Rom2, aguanine nucleotide exchange factor for Rho1. Mol Cell Biol21:271–280
Rajavel M, Philip B, Buehrer BM, Errede B, Levin DE (1999) Mid2is a putative sensor for cell integrity signaling in Saccharomycescerevisiae. Mol Cell Biol 19:3969–3976
287

Raught B, Gingras A-C, Sonenberg N (2001) The target ofrapamycin (TOR) proteins. Proc Natl Acad Sci USA 98:7037–7044
Sambrook J, Russell DW (2001) Molecular cloning: a laboratorymanual, 3rd edn. Cold Spring Harbor Laboratory, Cold SpringHarbor, N.Y.
Sarbassov DD et al (2004) Rictor, a novel binding partner ofmTOR, defines a rapamycin-insensitive and raptor-independentpathway that regulates the cytoskeleton. Curr Biol 14:1296–1302
Schmelzle T, Hall MN (2000) TOR, a central controller of cellgrowth. Cell 103:253-262
Schmidt A, Kunz J, Hall MN (1996) TOR2 is required for orga-nization of the actin cytoskeleton in yeast. Proc Natl Acad SciUSA 93:13780–13785
Schmidt A, Bickle M, Beck T, Hall MN (1997) The yeast phos-phatidylinositol kinase homolog TOR2 activates RHO1 andRHO2 via the exchange factor ROM2. Cell 88:531–542
Shamji AF, Kuruvilla FG, Schreiber SL (2000) Partitioning thetranscriptional program induced by rapamycin among the ef-fectors of the Tor proteins. Curr Biol 10:1574–1581
Sikorski RS, Boeke JD (1991) In vitro mutagenesis and plasmidshuffling: from cloned genes to mutant yeast. Methods Enzymol194:302–318
Sikorski RS, Hieter P (1989) A system of shuttle vectors and yeasthost strains designed for efficient manipulation of DNA inSaccharomyces cerevisiae. Genetics 122:19–27
Smith V, Chou KN, Lashkare D, Botstein D, Brown PO (1996)Functional analysis of the genes of yeast chromosome V bygenetic footprinting. Science 274:2069–2074
Torres J, Di Como CJ, Herrero E, de la Torre-Ruiz MA (2002)Regulation of the cell integrity pathway by rapamycin-sensitiveTOR function in budding yeast. J Biol Chem 277:43495–43504
Uetz P, et al (2000) A comprehensive analysis of protein-proteininteractions in Saccharomyces cerevisiae. Nature 403:623–627
Verna J, Lodder A, Lee K, Vagts A, Ballester R (1997) A family ofgenes required for maintenance of cell wall integrity and for thestress response in Saccharomyces cerevisiae. Proc Natl Acad SciUSA 94:13804–13809
Wedaman KP, et al (2003) Tor kinases are in distinct membrane-associated protein complexes in Saccharomyces cerevisiae. MolBiol Cell 14:1204–1220
Yu JW, et al (2004)Genome-wide analysis ofmembrane targeting byS. cerevisiae pleckstrin homology domains. Mol Cell 13:677–688
Zheng XF, Florentino D, Chen J, Crabtree GR, Schreiber SL(1995) TOR kinase domains are required for two distinctfunctions, only one of which is inhibited by rapamycin. Cell82:121–130
288

RESEARCH ARTICLE
Berislav Lisnic Æ Ivan-Kresimir Svetec
Hrvoje Saric Æ Ivan Nikolic Æ Zoran Zgaga
Palindrome content of the yeast Saccharomyces cerevisiae genome
Received: 10 February 2005 / Accepted: 20 February 2005 / Published online: 18 March 2005� Springer-Verlag 2005
Abstract Palindromic sequences are important DNAmotifs involved in the regulation of different cellularprocesses, but are also a potential source of geneticinstability. In order to initiate a systematic study ofpalindromes at the whole genome level, we developed acomputer program that can identify, locate and countpalindromes in a given sequence in a strictly definedway. All palindromes, defined as identical inverted re-peats without spacer DNA, can be analyzed and sortedaccording to their size, frequency, GC content oralphabetically. This program was then used to prepare acatalog of all palindromes present in the chromosomalDNA of the yeast Saccharomyces cerevisiae. For eachpalindrome size, the observed palindrome counts weresignificantly different from those in the randomly gen-erated equivalents of the yeast genome. However, whilethe short palindromes (2–12 bp) were under-repre-sented, the palindromes longer than 12 bp were over-represented, AT-rich and preferentially located in theintergenic regions. The 44-bp palindrome found betweenthe genes CDC53 and LYS21 on chromosome IV wasthe longest palindrome identified and contained onlytwo C-G base pairs. Avoidance of coding regions wasalso observed for palindromes of 4–12 bp, but was lesspronounced. Dinucleotide analysis indicated a strongbias against palindromic dinucleotides that could ex-plain the observed short palindrome avoidance. Wediscuss some possible mechanisms that may influencethe evolutionary dynamics of palindromic sequences inthe yeast genome.
Keywords Palindrome Æ Inverted repeat ÆDinucleotide Æ Saccharomyces cerevisiae Æ Sequenceanalysis
Introduction
Closely spaced inverted repeats (IRs), palindromes andquasipalindromes can be found in the DNA of naturalplasmids, viral and bacterial genomes and eukaryoticchromosomes and organelles. In prokaryotes, they mayserve as binding sites for regulatory proteins, while shortperfect palindromes are known as recognition sites fortype II restriction-modification systems (RMSs) that playa significant role in bacterial ecology and evolution(Gelfand and Koonin 1997; Rocha et al. 2001). Anotherimportant property of such motifs is their potential toform intra-strand hydrogen bonds within DNA mole-cules or in corresponding RNA transcripts. Therefore,they are contained in genes encoding functional RNAmolecules, the structure of which depends on the for-mation of proper intra-strand bonding, and in differentcis-acting genetic elements, like terminators, attenuators,plasmid and viral origins of replication. Protein bindingand secondary structure formation are also modes ofaction for IRs and related motifs in eukaryotic cells. Forexample, palindromes with a spacer of one nucleotidewere identified in yeast sequences regulating cellular re-sponse to the accumulation of unfolded proteins in theendoplasmic reticulum (Mori et al. 1998) and a hetero-dimeric complex was isolated that binds two palindromicsequences in the promoter region of the human erbB-2gene (Chen and Gill 1996). In mouse B lymphoma cells,palindromic and potential stem-loop motifs were iden-tified as break-points during class switch recombination(Tashiro et al. 2001); and the formation of intra-strandsecondary structures is essential in the process of im-munoglobuline gene rearrangement known as V(D)J-joining (Cuomo et al. 1996).
However, in spite of their importance and functionalversatility, longer palindromes and IRs were shown to be
Communicated by S. Hohmann
B. Lisnic Æ I.-K. Svetec Æ Z. Zgaga (&)Faculty of Food Technology and Biotechnology,University of Zagreb, Pierottijeva 6,10000 Zagreb, CroatiaE-mail: [email protected].: +385-1-4836013Fax: +385-1-4836016
H. Saric Æ I. NikolicSail Company Croatia Ltd., Ilica 412, 10000 Zagreb, Croatia
Curr Genet (2005) 47: 289–297DOI 10.1007/s00294-005-0573-5
very unstable in different organisms, from bacteria tomammalian cells. The recombinogenicity of such motifsis attributed to their potential to form secondary struc-tures known as hairpins and cruciforms and the molec-ular models proposed to explain palindrome-inducedgenomic instability can be divided into two classes: first,based on template switching or slippage of the DNApolymerase during replication of DNA adopting sec-ondary structures and, second, requiring an enzymaticactivity that transforms cruciforms and hairpins to re-combinogenic lesions, like double-strand breaks (DSBs;Leach 1994). Both types of models are supported byexperimental data; and several human genetic disorderscan be explained either by errors occurring during thereplication of palindromic and quasipalindromic se-quences (Bissler 1998; Gordenin and Resnick 1998) or byIR-induced illegitimate end-joining (Repping et al. 2002).
Given the importance of palindromic sequences in theregulation of different cellular processes on the one sideand their influence on genetic stability on the other side,an analysis of the incidence of palindromes at the geno-mic level seems particularly interesting. LeBlanc et al.(2000) prepared a catalog of palindromes of 4–60 bppresent on chromosomes III and X of the nematodeCaenorhabditis elegans. Palindromes were classified asAT-rich, non-AT-rich or GC-rich and this analysisindicated that the long, AT-rich palindromes are muchmore frequent in the actual chromosomes than in therandomly generated sequences. The IRs separated by asingle base pair were also included in their study and such‘‘odd palindromes’’ were more frequent than perfect IRswithout a spacer. Avoidance of short palindromic se-quences was observed in the genomes of some bacterio-phages (Sharp 1986), but also in the genomes of theirbacterial hosts (Karlin et al. 1997; Gelfand and Koonin1997; Rocha et al. 2001). The highest bias was frequentlyobserved for the recognition sites of the type II restrictionenzymes, supporting the view that RMSs influence gen-ome evolution in prokaryotes. Consistent with thishypothesis, Fuglsang (2004) demonstrated that the suc-cession of codons disfavoring palindrome formation ismore pronounced for the bacterial species that haveRMSs. In order to initiate a systematic study of palin-dromes present in different genomes, we decided first todevelop a computer program that can score and count allpalindromes present in a given sequence in a strictly de-fined way. This program was then used to analyze thepalindrome content of the entire genome of the yeastSaccharomyces cerevisiae and the results of this analysisclearly indicate that the palindromic sequences conformto the specific rules of evolutionary dynamics.
Materials and methods
DNA sequences
The DNA sequence files for all yeast chromosomes(NC_001133.4, NC_001134.5, NC_001135.6, NC_
001136.5, NC_001137.2, NC_001138.4, NC_001139.4,NC_001140.3, NC_001141.1, NC_001142.5, NC_001143.4, NC_001144.3, NC_001145.2, NC_001146.2,NC_001147.4, NC_001148.2) were downloaded fromthe NCBI (ftp://ftp.ncbi.nih.gov/genomes/Saccharomy-ces_cerevisiae/) on 3 April, 2004. The total length ofdownloaded yeast genomic DNA sequences (excludingmitochondrial DNA) was 12,070,766 bp.
The file containing the coding regions of the entireyeast genome (that is, ORF coding sequences only,without 5¢UTR, 3¢UTR, intron sequences, or basesnot translated due to translational frameshifting)was downloaded on 12 July, 2004 from the SGD (ftp://genome-ftp.stanford. edu/pub/yeast/data_download/se-quence/genomic_sequence/orf_dna/orf_coding.fasta.gz).This file includes all ORFs except dubious ORFs, andprior to examination of the palindrome and dinucleotidecontent in the coding regions, the sequences of mito-chondrial DNA were removed from the file. The totallength of the coding DNA sequences in this shortenedfile was 8,755,368 bp.
Ten random genomes (12,070,766 bp each) weregenerated with respect to the frequency of the four basespresent in the yeast genome (A=30.90%, C=19.17%,G=19.13%, T=30.81%), so that the average propor-tions of the bases in the random genomes were:A=30.90±0.01%, C=19.18±0.01%, G=19.13±0.01% and T=30.81±0.01%.
Palindrome count
The Spinnaker program described in this workis available upon request.
Statistics
The numbers of dinucleotides and palindromes deter-mined in the chromosomal DNA were called the ob-served numbers, while the numbers of dinucleotides andpalindromes determined in the random genomes werecalled the expected numbers. To test whether the medi-ans of the expected numbers of palindromes and dinu-cleotides differed significantly from the observednumbers, we employed the Wilcoxon signed rank testwith a confidence interval of 99%, using MINITABver. 14.1.
Results
Palindrome scoring
Systematic study of palindromic sequences requiresconvenient software that will recognize and map allpalindromes in a predetermined size-range at the geno-mic level. This is not a trivial problem, since individual
290
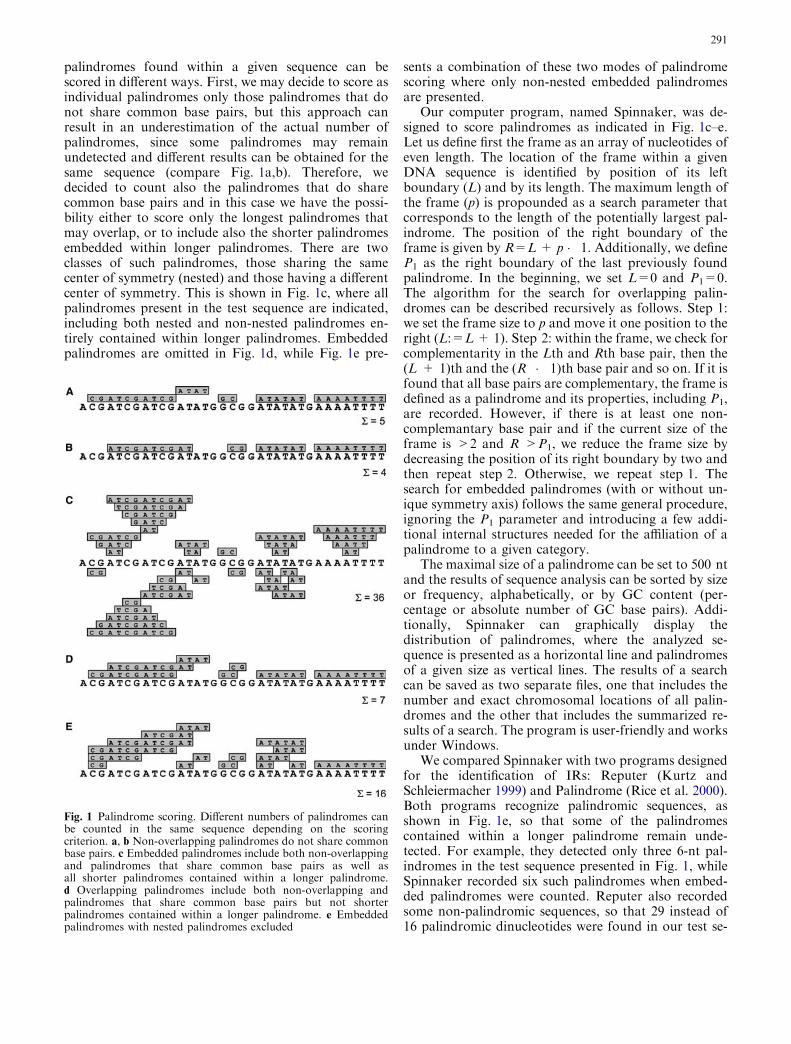
palindromes found within a given sequence can bescored in different ways. First, we may decide to score asindividual palindromes only those palindromes that donot share common base pairs, but this approach canresult in an underestimation of the actual number ofpalindromes, since some palindromes may remainundetected and different results can be obtained for thesame sequence (compare Fig. 1a,b). Therefore, wedecided to count also the palindromes that do sharecommon base pairs and in this case we have the possi-bility either to score only the longest palindromes thatmay overlap, or to include also the shorter palindromesembedded within longer palindromes. There are twoclasses of such palindromes, those sharing the samecenter of symmetry (nested) and those having a differentcenter of symmetry. This is shown in Fig. 1c, where allpalindromes present in the test sequence are indicated,including both nested and non-nested palindromes en-tirely contained within longer palindromes. Embeddedpalindromes are omitted in Fig. 1d, while Fig. 1e pre-
sents a combination of these two modes of palindromescoring where only non-nested embedded palindromesare presented.
Our computer program, named Spinnaker, was de-signed to score palindromes as indicated in Fig. 1c–e.Let us define first the frame as an array of nucleotides ofeven length. The location of the frame within a givenDNA sequence is identified by position of its leftboundary (L) and by its length. The maximum length ofthe frame (p) is propounded as a search parameter thatcorresponds to the length of the potentially largest pal-indrome. The position of the right boundary of theframe is given by R=L + p � 1. Additionally, we defineP1 as the right boundary of the last previously foundpalindrome. In the beginning, we set L=0 and P1=0.The algorithm for the search for overlapping palin-dromes can be described recursively as follows. Step 1:we set the frame size to p and move it one position to theright (L:=L+ 1). Step 2: within the frame, we check forcomplementarity in the Lth and Rth base pair, then the(L + 1)th and the (R � 1)th base pair and so on. If it isfound that all base pairs are complementary, the frame isdefined as a palindrome and its properties, including P1,are recorded. However, if there is at least one non-complemantary base pair and if the current size of theframe is >2 and R >P1, we reduce the frame size bydecreasing the position of its right boundary by two andthen repeat step 2. Otherwise, we repeat step 1. Thesearch for embedded palindromes (with or without un-ique symmetry axis) follows the same general procedure,ignoring the P1 parameter and introducing a few addi-tional internal structures needed for the affiliation of apalindrome to a given category.
The maximal size of a palindrome can be set to 500 ntand the results of sequence analysis can be sorted by sizeor frequency, alphabetically, or by GC content (per-centage or absolute number of GC base pairs). Addi-tionally, Spinnaker can graphically display thedistribution of palindromes, where the analyzed se-quence is presented as a horizontal line and palindromesof a given size as vertical lines. The results of a searchcan be saved as two separate files, one that includes thenumber and exact chromosomal locations of all palin-dromes and the other that includes the summarized re-sults of a search. The program is user-friendly and worksunder Windows.
We compared Spinnaker with two programs designedfor the identification of IRs: Reputer (Kurtz andSchleiermacher 1999) and Palindrome (Rice et al. 2000).Both programs recognize palindromic sequences, asshown in Fig. 1e, so that some of the palindromescontained within a longer palindrome remain unde-tected. For example, they detected only three 6-nt pal-indromes in the test sequence presented in Fig. 1, whileSpinnaker recorded six such palindromes when embed-ded palindromes were counted. Reputer also recordedsome non-palindromic sequences, so that 29 instead of16 palindromic dinucleotides were found in our test se-
Fig. 1 Palindrome scoring. Different numbers of palindromes canbe counted in the same sequence depending on the scoringcriterion. a, b Non-overlapping palindromes do not share commonbase pairs. c Embedded palindromes include both non-overlappingand palindromes that share common base pairs as well asall shorter palindromes contained within a longer palindrome.d Overlapping palindromes include both non-overlapping andpalindromes that share common base pairs but not shorterpalindromes contained within a longer palindrome. e Embeddedpalindromes with nested palindromes excluded
291
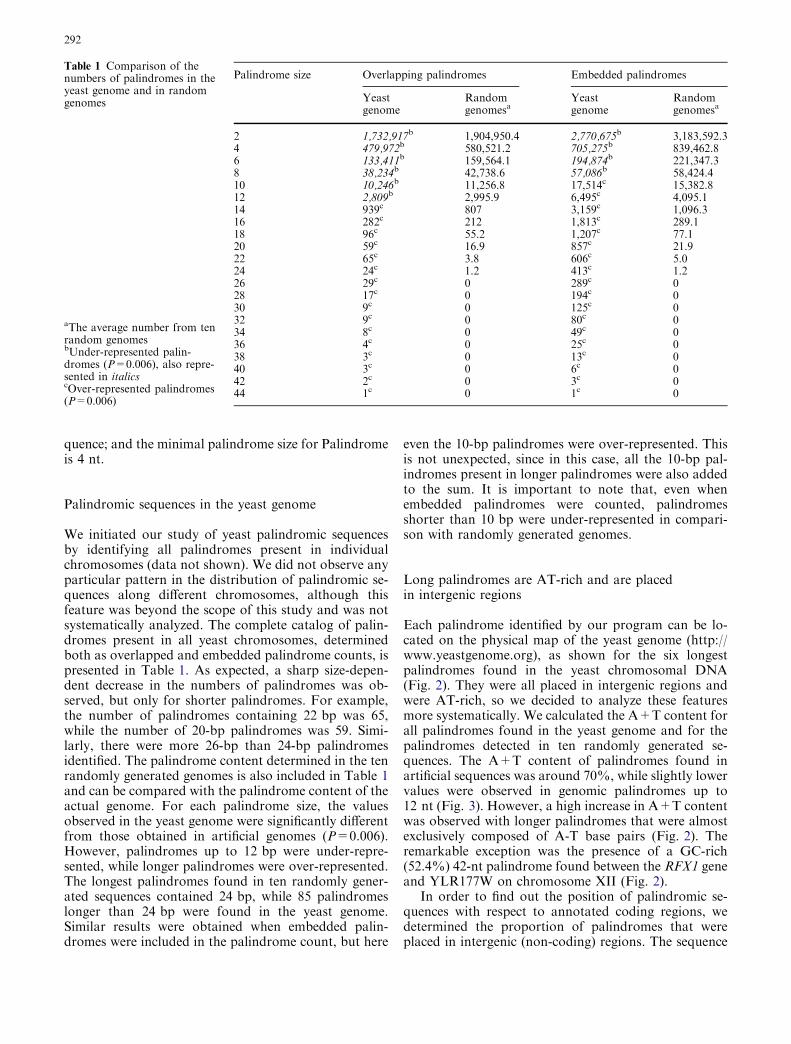
quence; and the minimal palindrome size for Palindromeis 4 nt.
Palindromic sequences in the yeast genome
We initiated our study of yeast palindromic sequencesby identifying all palindromes present in individualchromosomes (data not shown). We did not observe anyparticular pattern in the distribution of palindromic se-quences along different chromosomes, although thisfeature was beyond the scope of this study and was notsystematically analyzed. The complete catalog of palin-dromes present in all yeast chromosomes, determinedboth as overlapped and embedded palindrome counts, ispresented in Table 1. As expected, a sharp size-depen-dent decrease in the numbers of palindromes was ob-served, but only for shorter palindromes. For example,the number of palindromes containing 22 bp was 65,while the number of 20-bp palindromes was 59. Simi-larly, there were more 26-bp than 24-bp palindromesidentified. The palindrome content determined in the tenrandomly generated genomes is also included in Table 1and can be compared with the palindrome content of theactual genome. For each palindrome size, the valuesobserved in the yeast genome were significantly differentfrom those obtained in artificial genomes (P=0.006).However, palindromes up to 12 bp were under-repre-sented, while longer palindromes were over-represented.The longest palindromes found in ten randomly gener-ated sequences contained 24 bp, while 85 palindromeslonger than 24 bp were found in the yeast genome.Similar results were obtained when embedded palin-dromes were included in the palindrome count, but here
even the 10-bp palindromes were over-represented. Thisis not unexpected, since in this case, all the 10-bp pal-indromes present in longer palindromes were also addedto the sum. It is important to note that, even whenembedded palindromes were counted, palindromesshorter than 10 bp were under-represented in compari-son with randomly generated genomes.
Long palindromes are AT-rich and are placedin intergenic regions
Each palindrome identified by our program can be lo-cated on the physical map of the yeast genome (http://www.yeastgenome.org), as shown for the six longestpalindromes found in the yeast chromosomal DNA(Fig. 2). They were all placed in intergenic regions andwere AT-rich, so we decided to analyze these featuresmore systematically. We calculated the A+T content forall palindromes found in the yeast genome and for thepalindromes detected in ten randomly generated se-quences. The A+T content of palindromes found inartificial sequences was around 70%, while slightly lowervalues were observed in genomic palindromes up to12 nt (Fig. 3). However, a high increase in A+T contentwas observed with longer palindromes that were almostexclusively composed of A-T base pairs (Fig. 2). Theremarkable exception was the presence of a GC-rich(52.4%) 42-nt palindrome found between the RFX1 geneand YLR177W on chromosome XII (Fig. 2).
In order to find out the position of palindromic se-quences with respect to annotated coding regions, wedetermined the proportion of palindromes that wereplaced in intergenic (non-coding) regions. The sequence
Table 1 Comparison of thenumbers of palindromes in theyeast genome and in randomgenomes
aThe average number from tenrandom genomesbUnder-represented palin-dromes (P=0.006), also repre-sented in italicscOver-represented palindromes(P=0.006)
Palindrome size Overlapping palindromes Embedded palindromes
Yeastgenome
Randomgenomesa
Yeastgenome
Randomgenomesa
2 1,732,917b 1,904,950.4 2,770,675b 3,183,592.34 479,972b 580,521.2 705,275b 839,462.86 133,411b 159,564.1 194,874b 221,347.38 38,234b 42,738.6 57,086b 58,424.410 10,246b 11,256.8 17,514c 15,382.812 2,809b 2,995.9 6,495c 4,095.114 939c 807 3,159c 1,096.316 282c 212 1,813c 289.118 96c 55.2 1,207c 77.120 59c 16.9 857c 21.922 65c 3.8 606c 5.024 24c 1.2 413c 1.226 29c 0 289c 028 17c 0 194c 030 9c 0 125c 032 9c 0 80c 034 8c 0 49c 036 4c 0 25c 038 3c 0 13c 040 3c 0 6c 042 2c 0 3c 044 1c 0 1c 0
292
containing only the yeast coding regions represented72.73% of the total yeast genome (see Materials andmethods), but even the short palindromes were prefer-entially (30–35%) placed in intergenic regions. Only theproportion of palindromic dinucleotides found in theintergenic regions (27.65%) was very close to that
expected from random distribution between the codingand non-coding part of the genome. A preferentiallocation in intergenic regions was particularly pro-nounced for palindromes longer than 10 bp, so thatmore than 97% of palindromes longer than 18 bp wereidentified outside of the coding regions (Fig. 3).
Palindromic dinucleotides in the yeast genome
Four dinucleotides, AT, TA, GC and CG, may beconsidered as the shortest palindromic sequences, butthey are also found in the center of any longer palin-drome. Our analysis indicated that the short palin-dromes, including palindromic dinucleotides, were lessfrequent in the yeast genome than in the random ge-nomes (Table 1) and we decided to determine relativefrequencies for all 16 dinucleotides (Fig. 4). Indeed, thetwo most under-represented dinucleotides were palin-dromic dinucleotides containing purine on the 3¢ end,TA (0.77) and CG (0.80), while AT (0.94) was moder-ately under-represented and GC (1.02) was only slightlyover-represented. For non-palindromic dinucleotides,very close values were observed for complementary di-nucleotides and only the AC and GT couple was under-represented (0.89). The ratio between non-palindromicand palindromic dinucleotides composed either of A-Tor G-C base pairs illustrates well the avoidance of pal-indromic dinucleotides in the yeast genome. TT+AAdinucleotides are 1.33 times more frequent thanTA+AT dinucleotides, while CC+GG dinucleotidesare 1.17 times more frequent than CG+GC dinucleo-tides (Table 2). The same analysis was also done fordinucleotides present in all palindromes longer than
Fig. 2 Sequences and chromosomal locations of the six longestpalindromes found in the yeast genome. Numbers indicate the startand end locations for ORFs and palindromes
Fig. 3 Analysis of the A+Tcontent and location ofpalindromes with respect to thenon-coding regions in the yeastgenome. Palindromes werescored as presented in Fig. 1d(overlapping palindromes).Error bars indicate onestandard deviation
293
14 bp and the results obtained were quite different fromthose observed with the entire yeast genome, indicatingthat the long palindromes are specifically enriched inpalindromic dinucleotides. However, the bias was muchmore pronounced for the AT and TA dinucleotides,which were 5.6 times more frequent than the TT+AAdinucleotides (Table 2).
The data presented in Fig. 4 also indicated a strongbias in the frequency of palindromic dinucleotidescomposed of identical base pairs, so that the AT/TAratio was 1.22 and the GC/CG ratio was 1.28. Thisanalysis was also done for the coding complement of theyeast genome and for palindromes longer than 14 bp(Table 2). The AT/TA ratio rose to 1.31 in coding DNA,while in long palindromes it was 1.036, indicating thatthe two dinucleotides are almost equally frequent. Thiscan be explained by the presence of long runs of alter-nating A and T nucleotides frequently found in the longpalindromes (Fig. 2; data not shown). In contrast, theGC/CG ratio in the coding complement was very closeto that observed for the entire genome and in the longpalindromes it even increased to 1.33.
Discussion
Palindromes, quasipalindromes and closely spaced IRscan be found in the genomes of all organisms and are
involved in various cellular processes. In the presentwork, we focused on palindromes, defined as perfect IRswithout spacer DNA. In order to make possible a sys-tematic study of these important DNA motifs in differ-ent genomes, we first developed a computer programthat can identify, locate and count palindromes in a gi-ven nucleotide sequence in a strictly defined way. Thisprogram was then used to prepare a catalog of all pal-indromic sequences present in the S. cerevisiae genomeand in randomly generated equivalents of the yeastgenome. Comparison between actual and random ge-nomes revealed several important differences that arediscussed below.
Identification of palindromic sequences
As discussed before, palindrome scoring can be done indifferent ways and we decided to consider both sepa-rated (non-overlapping) and overlapping palindromes,together with all smaller palindromes contained withinlonger palindromes, as individual palindromes. Such anapproach ensures that no palindromic motif that may behidden within a longer palindrome can be omitted; andthis is very important for the detection of specific pal-indromic sites, like restriction enzyme sites or regulatoryunits. In addition to the embedded palindrome count,we also used a simplified way of palindrome scoringwhere partial overlapping of individual palindromes isallowed, but all smaller palindromes completely con-tained within longer palindromes are ignored. This wayof palindrome scoring (overlapped palindromes) indi-cates individual palindromic loci within a given sequenceand each palindrome is counted only once. In this way, amore realistic picture of the numbers and distribution ofpalindromic loci is obtained, especially when we con-sider the long runs of alternating complementary dinu-cleotides frequently present in a genome. For example,ten AT dinucleotides will be scored as a single 20 nt
Fig. 4 Occurrence ofdinucleotides in the yeastgenome. For each dinucleotide,the ratio between the numberdetermined in the yeast genome(observed) and the averagenumber obtained in ten randomgenomes (expected) is presented
Table 2 Relative frequencies of palindromic dinucleotides in thewhole genome, coding DNA and palindromes longer than 14 bp.ND Not determined
Ratio Wholegenome
CodingDNA
Palindromes>14 bp
(AA+TT)/(AT+TA) 1.328 ND 0.178(GG+CC)/(GC+CG) 1.166 ND 0.800AT/TA 1.220 1.308 1.036GC/CG 1.277 1.291 1.330
294
palindrome, while in the same sequence 100 embeddedpalindromes can be found. For these reasons, we deci-ded to use both embedded and overlapping palindromecounts in the analysis of palindrome content (Fig. 1c,d).As illustrated by our analysis of the yeast genome, thisdistinction is important. For example, both 10-nt and12-nt palindromes are under-represented when countedas overlapped palindromes, but are over-representedwhen scored as embedded palindromes (Table 1). Pal-indromic dinucleotides were also analyzed for two rea-sons. First, there is no clear reason to includetetranucleotides and to exclude dinucleotides from thepalindrome count and, second, each palindrome con-tains one of the four palindromic dinucleotides in thecenter and the analysis of their incidence could be usefulfor the general study of palindromic sequences. This wasdemonstrated by our analysis of the yeast genome,where the palindromic dinucleotides are particularlyunder-represented compared with non-palindromic di-nucleotides with the same base pair composition. In theC. elegans genome, the IRs separated by one nucleotideare more frequent than the repeats without a spacer(LeBlanc et al. 2000). One possible explanation for thisinteresting observation could be that the palindromicdinucleotides are also avoided in the C. elegans genome,but this type of analysis has not been performed.
Palindromes in the yeast genome
The palindrome content of the yeast genome was sortedby size and compared with the palindrome content of therandomly generated equivalents of the genome. Furtheranalysis indicated several interesting numerical trendsthat allowed us to make a clear distinction between‘‘short’’ and ‘‘long’’ palindromes, with the breakingpoint at 10–12 bp. While positive selection could ac-count for the relative abundance of long palindromes,under-representation of short palindromes seems moreintriguing. The avoidance of short palindromes was al-ready observed in viral and bacterial genomes and wasattributed either to the activity of the restriction enzymespresent in the cell, or introduced by horizontal genetransfer (Sharp 1986; Gelfand and Koonin 1997; Rochaet al. 2001). Obviously, such an interpretation could notexplain the paucity of short palindromes in the yeastgenome, where no restriction/modification system hasbeen detected. Since palindromic dinucleotides were alsounder-represented in the yeast genome, we decided toperform a systematic analysis of the dinucleotide contentof the yeast genome. This analysis indicated a differentbias for each palindromic dinucleotide in the followingorder: TA > CG > AT > GC; and only the GCdinucleotide was slightly over-represented. The strongbias observed for palindromic dinucleotides can alsoexplain the under-representation of other short palin-dromes, since each palindrome contains a palindromicdinucleotide as a center of symmetry. If, for some rea-son, such centers of symmetry are less frequently
formed, the occurrence of all palindromic sequences mayalso be expected to be less frequent. Palindromic dinu-cleotides composed of A-T base pairs were particularlydisfavored, consistent with our finding that the A+Tcontent of short palindromes present in the yeast gen-ome is decreased in comparison with the random se-quence.
The observed differences in the occurrence of dinu-cleotides are not specific for the yeast genome. Earlysequence analyses indicated strong biases in dinucleotidefrequencies in prokaryotes, eukaryotes, mitochondrialand viral genomes (Nussinov 1984). Karlin et al. (1997)also found that TA and CG are among the most under-represented dinucleotides in different microbial ge-nomes; and they extensively discussed the mechanismsthat could create a genomic signature. For example, onepossible explanation for the observed biases in thedinucleotide frequencies could reflect the yeast codonbias (Sharp and Cowe 1991), since a high proportion ofthe yeast genome consists of protein-coding sequences.However, our data indicated that 72.4% of all palin-dromic dinucleotides were located within coding regionsthat represent 72.7% of the entire genome. This resultsuggests that the high avoidance of palindromic dinu-cleotides in the yeast genome (Table 1) is not limitedonly to the coding DNA. We also observed that thedinucleotide GC-CG ratio was 1.28 for the entire gen-ome and 1.29 for the protein-coding part of the genome,while in palindromes longer than 14 bp it was even in-creased to 1.33. These results indicate that the observeddinucleotide bias is not a consequence of the bias incodon usage but could rather reflect the intrinsic bias inspontaneous mutagenesis or a bias in replication/repair,as proposed by Karlin et al. (1997). For example, thefact that the TT dinucleotide is 1.47 times more frequentthan the TA dinucleotide in the yeast genome could bedue to the biased incorporation of non-complementarynucleotides during DNA replication and/or repair syn-thesis, to the bias in the mismatch repair process, orbecause the probability for TA dinucleotides to mutateis slightly higher than that for TT dinucleotides. Suchbiases could be beyond the level of detection in anybiochemical assay, but could leave an imprint in thegenomic DNA sequences during evolutionary time, likethe genome-wide under-representation of short palin-dromes described here. Moreover, it is possible that asimilar mutagenic bias, rather than the activity ofrestriction enzymes, resulted in the short palindrome/restriction site avoidance observed in bacterial genomes.A systematic study of their palindrome contents, like theone described here, may contribute to a better under-standing of the role of these two processes in the evo-lution of bacterial genomes.
A high preference for non-coding regions was ob-served for long palindromes, but even the short (4–10 bp) palindromes showed size-dependent avoidance ofthe protein-coding regions. Therefore, although biaseddinucleotide composition could be the main reason forthe decreased frequency of short palindromes at the level
295

of the whole genome, there could be some other mech-anism(s) regulating their incidence in the coding regions.Avoidance of the 6-bp palindromes was also observed inthe genes of several bacterial species, including Buchnerasp. and Wigglesworthia sp., which apparently have noRMSs (Fuglsang 2004). It is tempting to speculate thatthe presence of palindromes in the genes is avoided be-cause they could affect in some way the metabolism ofmRNAs. It should be noted that, in addition to theformation of intramolecular hairpins, palindromic se-quences can also promote associations between twoidentical mRNA molecules in opposite orientations. TheRNA/RNA duplex created between two palindromicsequences may interfere with subsequent step(s) in pro-tein synthesis. For example, longer palindromes presentin mRNAs may produce an effect similar to that of theinterfering RNA molecules (Novina and Sharp 2004),stimulating mRNA degradation.
Our data clearly indicate that the number of largepalindromes present in the yeast genome is much higherthan expected from the analysis of random sequences.Starting from 10–12 bp, palindromes tend to be not onlymore frequent than expected, but also more AT-rich andpreferentially located in the non-coding regions. Palin-dromes longer than 18 bp are usually built mainly ofA-T base pairs and are almost exclusively located in theintergenic regions, comprising only 27.7% of the entiregenome. The longest palindrome detected in the yeastgenome (12.1 Mb) has 44 bp and contains only two C-Gbase pairs. An even more pronounced bias for long, AT-rich palindromes was observed in C. elegans chromo-somes III and X (LeBlanc et al. 2000). Four 60-bppalindromes were found on chromosome III (11 Mb)and 17 on chromosome X (16 Mb) and they were builtexclusively of A-T base pairs. Over-representation oflarge palindromes is consistent with their presumed rolein different cellular processes, like the regulation of geneexpression or initiation of chromosomal replication; andthe high A+T content may facilitate local DNA meltingand adoption of secondary structures. Systematic dele-tions of the longest palindromes detected in the yeastgenome, followed by phenotype analysis of the corre-sponding strains, could shed more light on their possiblebiological functions.
Different mechanisms may regulate palindromeincidence
The data presented here, together with the results ofother studies, may suggest an integrated view on theevolutionary dynamics of palindromic sequences inyeast (Fig. 5). The occurrence of short palindromes inthe entire genome could be disfavored due to a slightbias in mutagenic DNA replication and/or the increasedprobability for palindromic dinucleotides TA, CG andAT to mutate, while additional mechanism(s) couldcontribute to palindrome avoidance within coding re-gions. AT-rich palindromes that acquire the critical sizeof 10–12 nt may become unstable and increase their size,mainly due to the insertion of AT or TA dinucleotidesby slippage during DNA replication (Kruglyak et al.1988; Toth et al. 2000). Since insertions in the codingregions lead to gene inactivation, they are tolerated onlyin the intergenic regions. Long, AT-rich palindromescould acquire novel functions, but could also present astarting point for the generation of other palindromicsequences, imperfect palindromes and IRs, enlarging therepertoire of possible cis-acting genetic elements. Theupper size of a palindrome may be regulated by thepotential of palindromic sequences to form cruciformstructures in vivo. As mentioned before, such structurescan be processed to DSBs (Lobachev et al. 2002) and areknown to induce different types of recombination events(Gordenin et al. 1993; Leach 1994). The longest palin-drome found in the yeast genome contains 44 bp, butthe critical size of a palindrome that could act as aninitiator of recombination still needs to be experimen-tally determined.
Concluding remarks
The new research tool for palindrome analysis describedhere may contribute to a deeper insight into the evolu-tion and functions of these important DNA motifs. Ouranalysis of the first complete catalog of palindromicsequences present in the genome of a cellular organismrevealed several interesting findings. For example, weshow that the under-representation of short palindromesis not limited to the bacterial genomes but can also beobserved in yeast, while size-dependent palindromeavoidance in the coding regions seems particularlyintriguing. We also point out the relevance of dinucle-otide bias analysis for the study of palindromes and webelieve our computer program will also be useful formore specific tasks, like the identification of potentialrestriction sites or regulatory elements.
Fig. 5 Evolutionary dynamics of palindromic sequences in yeast.The solid vertical line indicates the size limit between short and longpalindromes as determined in this work. The critical size leading topalindrome loss/destruction (dashed vertical line) needs to beexperimentally determined
296
Acknowledgements We are grateful to Ana Vukelic for help instatistical analysis. This work was supported by grant 0058014from the Croatian Ministry of Science, Education and Sports.
References
Bissler JJ (1998) DNA inverted repeats and human disease. FrontBiosci 3:408–418
Chen Y, Gill GN (1996) A heteromeric nuclear protein complexbinds two palindromic sequences in the proximal enhancer ofthe human erbB-2 gene. J Biol Chem 271:5183–5188
Cuomo AC, Mundy CL, Oettinger MA (1996) DNA sequence andstructure requirements for cleavage of V(D)J recombinationsignal sequences. Mol Cell Biol 16:5683–5690
Fuglsang A (2004) The relationship between palindrome avoidanceand intergenic codon usage variations: a Monte Carlo study.Biochem Biophys Res Commun 316:755–762
Gelfand MS, Koonin EV (1997) Avoidance of palindromic wordsin bacterial and archaeal genomes: a close connection withrestriction enzymes. Nucleic Acids Res 25:2430–2439
Gordenin DA, Resnick MA (1998) Yeast ARMs (DNA at-riskmotifs) can reveal sources of genome instability. Mutat Res400:45–58
Gordenin DA, Lobachev KS, Degtyareva NP, Malkova AL, Per-kins E, Resnick MA (1993) Inverted DNA repeats: a source ofeukaryotic genomic instability. Mol Cell Biol 13:5315–5322
Karlin S, Mrazek J, Campbell AM (1997) Compositional biases ofbacterial genomes and evolutionary implications. J Bacteriol179:1363–1370
Kruglyak S, Durret RT, Schug MD, Aquadro CE (1998) Equilib-rium distribution of microsatellite repeat length resulting from abalance between slippage events and point mutations. Proc NatlAcad Sci USA 95:10774–10778
Kurtz S, Schleiermacher C (1999) REPuter: fast computation ofmaximal repeats in complete genomes. Bioinformatics 15:426–427
Leach DRF (1994) Long DNA palindromes, cruciform structures,genetic instability and secundary structure repair. Bioessays16:893–898
LeBlanc MD, Aspeslagh G, Buggia NP, Dyer BD (2000) Anannotated catalog of inverted repeats of Caenorhabditis eleganschromosomes III and X, with observations concerning odd/even biases and conserved motifs. Genome Res 10:1381–1392
Lobachev KS, Gordenin DA, Resnick MA (2002) The Mre11complex is required for repair of hairpin-capped double-strandbreaks and prevention of chromosome rearrangements. Cell103:83–193
Mori K, Ogawa N, Kawahara T, Yanagi H, Yura T (1998) Pal-indrome with spacer of one nucleotide is characteristic of thecis-acting unfolded protein response element in Saccharomycescerevisiae. J Biol Chem 273:9912–9929
Novina CD, Sharp PA (2004) The RNAi revolution. Nature430:161–164
Nussinov R (1984) Doublet frequencies in evolutionary distinctgroups. Nucleic Acids Res 12:1749–1763
Repping S, Skaletsky H, Lange J, Silber S, Veen F van der, OatesRD, Page DC, Rozen S (2002) Recombination between palin-dromes P5 and P1 on the human Y chromosome causes massivedeletions and spermatogenic failure. Am J Hum Genet 71:906–922
Rice P, Longden I, Bleasby A (2000) EMBOSS—the europeanmolecular biology open software suite. Trends Genet 15:276–278
Rocha EPC, Danchin A, Viari A (2001) Evolutionary role ofrestriction/modification systems as revealed by comparativegenome analysis. Genome Res 11:946–958
Sharp PM (1986) Molecular evolution of bacteriophages: evidenceof selection against the recognition sites of host restriction en-zymes. Mol Biol Evol 3:75–83
Sharp PM, Cowe E (1991) Synonymous codon usage in Saccha-romyces cerevisiae. Yeast 7:657–678
Tashiro J, Kinoshita K, Honjo T (2001) Palindromic but not G-rich sequences are targets of class switch recombination. IntImmunol 13:495–505
Toth G, Gaspari Z, Jurka J (2000) Microsatellites in differenteukaryotic genomes: survey and analysis. Genome Res 10:967–981
297
RESEARCH ARTICLE
Takayuki Motoyama Æ Tomohiro Ohira
Kaori Kadokura Æ Akihiko Ichiishi
Makoto Fujimura Æ Isamu Yamaguchi Æ Toshiaki Kudo
An Os-1 family histidine kinase from a filamentous fungus confersfungicide-sensitivity to yeast
Received: 17 December 2004 / Revised: 10 February 2005 / Accepted: 20 February 2005 / Published online: 18 March 2005� Springer-Verlag 2005
Abstract Three groups of fungicides (phenylpyrroles,dicarboximides, aromatic hydrocarbons) are effectiveagainst filamentous fungi. The target of these fungicidesis the osmotic stress signal transduction pathway, whichis dependent on the Os-1 family of two-component his-tidine kinases. These fungicides usually have no fungi-cidal effect on the yeast Saccharomyces cerevisiae. In thisreport, we found that expression of Hik1, an Os-1 or-thologue from rice blast fungus, can confer fungicide-sensitivity to yeast. This requires both the histidine kinaseand the response regulator domains of Hik1. Analysis ofyeast mutants indicated that this sensitivity is Hog1- andSsk1-dependent. In addition, our studies revealed aninteraction between Hik1 and Ypd1. These observationssuggest that Hik1 is a direct target of the fungicides or isa mediator of fungicide action and that the fungicidaleffect is transmitted to the Hog1 pathway via Ypd1.
Keywords Two-component histidine kinase ÆPhenylpyrrole fungicide Æ Dicarboximide fungicide ÆAromatic hydrocarbon fungicide Æ Rice blast fungus ÆHog1 MAP kinase
Introduction
Three groups of filamentous fungi-specific fungicides(phenylpyrroles, dicarboximides, aromatic hydrocar-
bons) have been shown to target the osmotic stress sig-nal transduction pathway, which is dependent on theOs-1 family of two-component histidine kinases (Pilloneland Meyer 1997; Fujimura et al. 2000; Ochiai et al. 2001,2002; Cui et al. 2002; Miller et al. 2002; Oshima et al.2002; Zhang et al. 2002; Dry et al. 2004; Yoshimi et al.2004). In bacteria, yeasts, filamentous fungi, slimemolds, and plants, the two-component histidine kinasescontrol a variety of cellular functions in response toenvironmental stimuli (West and Stock 2001; Catlettet al. 2003). Most of the eukaryotic histidine kinases arehybrid-type, wherein the same protein contains bothhistidine kinase and response regulator domains (Westand Stock 2001; Catlett et al. 2003).
The first Os-1 family two-component histidine kinasewas originally isolated from Neurospora crassa. Os-1,also known as Nik-1, is involved in the osmosensitive (os)signal transduction pathway and is required for adapta-tion to high osmolarity (Alex et al. 1996; Schumacheret al. 1997). This adaptation involves the accumulation ofglycerol as a compatible solute. Disturbance of the ossignal transduction pathway by the three groups of fila-mentous fungi-specific fungicides leads to growth defectsthat are associated with abnormal glycerol synthesis(Pillonel and Meyer 1997; Fujimura et al. 2000). Os-1family proteins share identical domain structures,including an N-terminal amino acid repeat domain(ARD), a histidine kinase domain, and a C-terminalresponse regulator domain. No transmembrane regionhas been identified in the Os-1 family histidine kinases,which suggests that they are cytoplasmic proteins. TheARD, which is specific to the Os-1 family histidine kin-ases, contains five to six 92-amino-acid repeats ofunknown function. All Os-1 family histidine kinasesidentified to date have been isolated from organisms thatexhibit filamentous growth (Alex et al. 1996, 1998;Schumacher et al. 1997; Nagahashi et al. 1998; Cui et al.2002; Oshima et al. 2002; Dry et al. 2004; Yoshimi et al.2004).
In the yeast Saccharomyces cerevisiae, there is onlyone histidine kinase (hybrid-type) gene (SLN1) that is
Communicated by S. Hohmann
T. Motoyama (&) Æ T. Ohira Æ K. KadokuraI. Yamaguchi Æ T. KudoRIKEN (Institute of Physical and Chemical Research),2-1 Hirosawa, Wako, Saitama 351-0198, JapanE-mail: [email protected].: +81-48-4679545Fax: +81-48-4624672
A. Ichiishi Æ M. FujimuraFaculty of Life Science, University of Toyo,Itakura, Oura-gun, Gunma 374-0193, Japan
Curr Genet (2005) 47: 298–306DOI 10.1007/s00294-005-0572-6
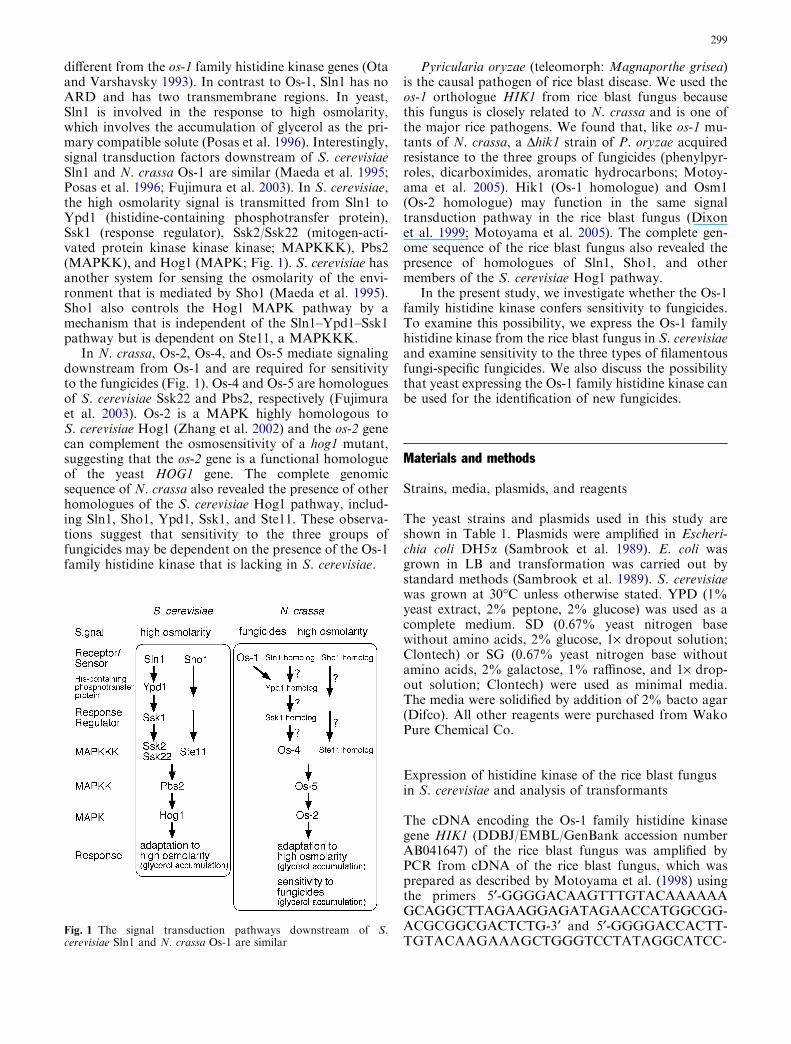
different from the os-1 family histidine kinase genes (Otaand Varshavsky 1993). In contrast to Os-1, Sln1 has noARD and has two transmembrane regions. In yeast,Sln1 is involved in the response to high osmolarity,which involves the accumulation of glycerol as the pri-mary compatible solute (Posas et al. 1996). Interestingly,signal transduction factors downstream of S. cerevisiaeSln1 and N. crassa Os-1 are similar (Maeda et al. 1995;Posas et al. 1996; Fujimura et al. 2003). In S. cerevisiae,the high osmolarity signal is transmitted from Sln1 toYpd1 (histidine-containing phosphotransfer protein),Ssk1 (response regulator), Ssk2/Ssk22 (mitogen-acti-vated protein kinase kinase kinase; MAPKKK), Pbs2(MAPKK), and Hog1 (MAPK; Fig. 1). S. cerevisiae hasanother system for sensing the osmolarity of the envi-ronment that is mediated by Sho1 (Maeda et al. 1995).Sho1 also controls the Hog1 MAPK pathway by amechanism that is independent of the Sln1–Ypd1–Ssk1pathway but is dependent on Ste11, a MAPKKK.
In N. crassa, Os-2, Os-4, and Os-5 mediate signalingdownstream from Os-1 and are required for sensitivityto the fungicides (Fig. 1). Os-4 and Os-5 are homologuesof S. cerevisiae Ssk22 and Pbs2, respectively (Fujimuraet al. 2003). Os-2 is a MAPK highly homologous toS. cerevisiae Hog1 (Zhang et al. 2002) and the os-2 genecan complement the osmosensitivity of a hog1 mutant,suggesting that the os-2 gene is a functional homologueof the yeast HOG1 gene. The complete genomicsequence of N. crassa also revealed the presence of otherhomologues of the S. cerevisiae Hog1 pathway, includ-ing Sln1, Sho1, Ypd1, Ssk1, and Ste11. These observa-tions suggest that sensitivity to the three groups offungicides may be dependent on the presence of the Os-1family histidine kinase that is lacking in S. cerevisiae.
Pyricularia oryzae (teleomorph: Magnaporthe grisea)is the causal pathogen of rice blast disease. We used theos-1 orthologue HIK1 from rice blast fungus becausethis fungus is closely related to N. crassa and is one ofthe major rice pathogens. We found that, like os-1 mu-tants of N. crassa, a Dhik1 strain of P. oryzae acquiredresistance to the three groups of fungicides (phenylpyr-roles, dicarboximides, aromatic hydrocarbons; Motoy-ama et al. 2005). Hik1 (Os-1 homologue) and Osm1(Os-2 homologue) may function in the same signaltransduction pathway in the rice blast fungus (Dixonet al. 1999; Motoyama et al. 2005). The complete gen-ome sequence of the rice blast fungus also revealed thepresence of homologues of Sln1, Sho1, and othermembers of the S. cerevisiae Hog1 pathway.
In the present study, we investigate whether the Os-1family histidine kinase confers sensitivity to fungicides.To examine this possibility, we express the Os-1 familyhistidine kinase from the rice blast fungus in S. cerevisiaeand examine sensitivity to the three types of filamentousfungi-specific fungicides. We also discuss the possibilitythat yeast expressing the Os-1 family histidine kinase canbe used for the identification of new fungicides.
Materials and methods
Strains, media, plasmids, and reagents
The yeast strains and plasmids used in this study areshown in Table 1. Plasmids were amplified in Escheri-chia coli DH5a (Sambrook et al. 1989). E. coli wasgrown in LB and transformation was carried out bystandard methods (Sambrook et al. 1989). S. cerevisiaewas grown at 30�C unless otherwise stated. YPD (1%yeast extract, 2% peptone, 2% glucose) was used as acomplete medium. SD (0.67% yeast nitrogen basewithout amino acids, 2% glucose, 1· dropout solution;Clontech) or SG (0.67% yeast nitrogen base withoutamino acids, 2% galactose, 1% raffinose, and 1· drop-out solution; Clontech) were used as minimal media.The media were solidified by addition of 2% bacto agar(Difco). All other reagents were purchased from WakoPure Chemical Co.
Expression of histidine kinase of the rice blast fungusin S. cerevisiae and analysis of transformants
The cDNA encoding the Os-1 family histidine kinasegene HIK1 (DDBJ/EMBL/GenBank accession numberAB041647) of the rice blast fungus was amplified byPCR from cDNA of the rice blast fungus, which wasprepared as described by Motoyama et al. (1998) usingthe primers 5¢-GGGGACAAGTTTGTACAAAAAAGCAGGCTTAGAAGGAGATAGAACCATGGCGG-ACGCGGCGACTCTG-3¢ and 5¢-GGGGACCACTT-TGTACAAGAAAGCTGGGTCCTATAGGCATCC-
Fig. 1 The signal transduction pathways downstream of S.cerevisiae Sln1 and N. crassa Os-1 are similar
299
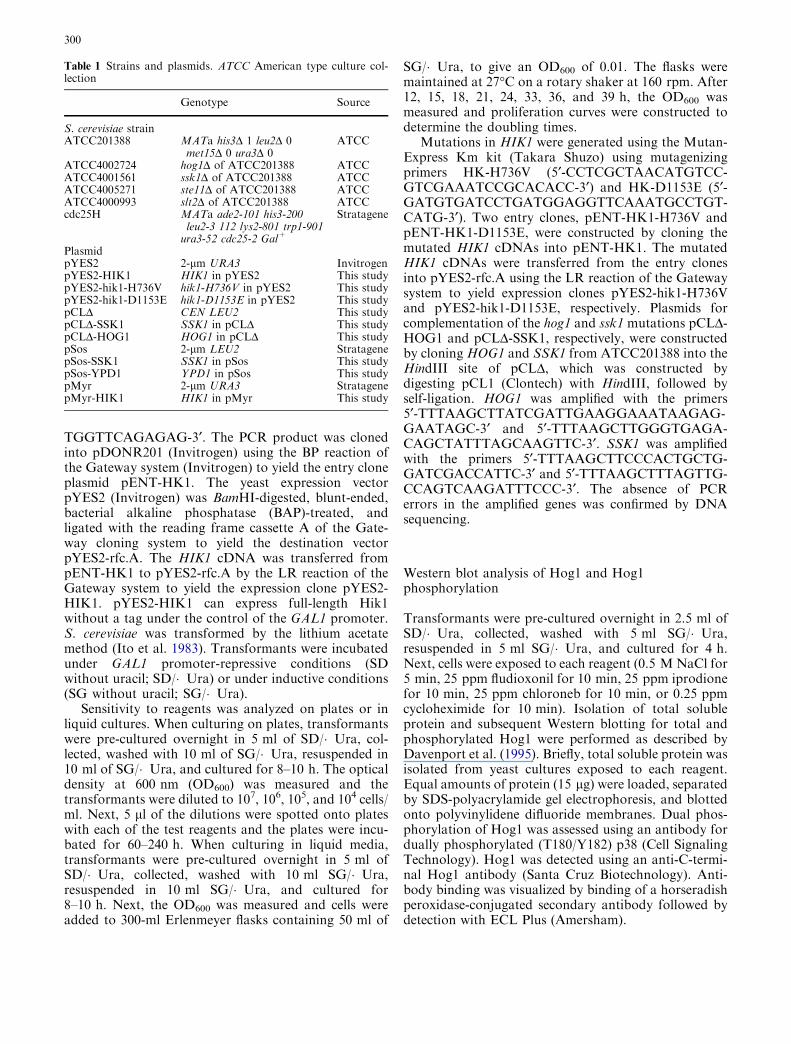
TGGTTCAGAGAG-3¢. The PCR product was clonedinto pDONR201 (Invitrogen) using the BP reaction ofthe Gateway system (Invitrogen) to yield the entry cloneplasmid pENT-HK1. The yeast expression vectorpYES2 (Invitrogen) was BamHI-digested, blunt-ended,bacterial alkaline phosphatase (BAP)-treated, andligated with the reading frame cassette A of the Gate-way cloning system to yield the destination vectorpYES2-rfc.A. The HIK1 cDNA was transferred frompENT-HK1 to pYES2-rfc.A by the LR reaction of theGateway system to yield the expression clone pYES2-HIK1. pYES2-HIK1 can express full-length Hik1without a tag under the control of the GAL1 promoter.S. cerevisiae was transformed by the lithium acetatemethod (Ito et al. 1983). Transformants were incubatedunder GAL1 promoter-repressive conditions (SDwithout uracil; SD/�Ura) or under inductive conditions(SG without uracil; SG/�Ura).
Sensitivity to reagents was analyzed on plates or inliquid cultures. When culturing on plates, transformantswere pre-cultured overnight in 5 ml of SD/�Ura, col-lected, washed with 10 ml of SG/�Ura, resuspended in10 ml of SG/�Ura, and cultured for 8–10 h. The opticaldensity at 600 nm (OD600) was measured and thetransformants were diluted to 107, 106, 105, and 104 cells/ml. Next, 5 ll of the dilutions were spotted onto plateswith each of the test reagents and the plates were incu-bated for 60–240 h. When culturing in liquid media,transformants were pre-cultured overnight in 5 ml ofSD/�Ura, collected, washed with 10 ml SG/�Ura,resuspended in 10 ml SG/�Ura, and cultured for8–10 h. Next, the OD600 was measured and cells wereadded to 300-ml Erlenmeyer flasks containing 50 ml of
SG/�Ura, to give an OD600 of 0.01. The flasks weremaintained at 27�C on a rotary shaker at 160 rpm. After12, 15, 18, 21, 24, 33, 36, and 39 h, the OD600 wasmeasured and proliferation curves were constructed todetermine the doubling times.
Mutations in HIK1 were generated using the Mutan-Express Km kit (Takara Shuzo) using mutagenizingprimers HK-H736V (5¢-CCTCGCTAACATGTCC-GTCGAAATCCGCACACC-3¢) and HK-D1153E (5¢-GATGTGATCCTGATGGAGGTTCAAATGCCTGT-CATG-3¢). Two entry clones, pENT-HK1-H736V andpENT-HK1-D1153E, were constructed by cloning themutated HIK1 cDNAs into pENT-HK1. The mutatedHIK1 cDNAs were transferred from the entry clonesinto pYES2-rfc.A using the LR reaction of the Gatewaysystem to yield expression clones pYES2-hik1-H736Vand pYES2-hik1-D1153E, respectively. Plasmids forcomplementation of the hog1 and ssk1 mutations pCLD-HOG1 and pCLD-SSK1, respectively, were constructedby cloning HOG1 and SSK1 from ATCC201388 into theHindIII site of pCLD, which was constructed bydigesting pCL1 (Clontech) with HindIII, followed byself-ligation. HOG1 was amplified with the primers5¢-TTTAAGCTTATCGATTGAAGGAAATAAGAG-GAATAGC-3¢ and 5¢-TTTAAGCTTGGGTGAGA-CAGCTATTTAGCAAGTTC-3¢. SSK1 was amplifiedwith the primers 5¢-TTTAAGCTTCCCACTGCTG-GATCGACCATTC-3¢ and 5¢-TTTAAGCTTTAGTTG-CCAGTCAAGATTTCCC-3¢. The absence of PCRerrors in the amplified genes was confirmed by DNAsequencing.
Western blot analysis of Hog1 and Hog1phosphorylation
Transformants were pre-cultured overnight in 2.5 ml ofSD/�Ura, collected, washed with 5 ml SG/�Ura,resuspended in 5 ml SG/�Ura, and cultured for 4 h.Next, cells were exposed to each reagent (0.5 MNaCl for5 min, 25 ppm fludioxonil for 10 min, 25 ppm iprodionefor 10 min, 25 ppm chloroneb for 10 min, or 0.25 ppmcycloheximide for 10 min). Isolation of total solubleprotein and subsequent Western blotting for total andphosphorylated Hog1 were performed as described byDavenport et al. (1995). Briefly, total soluble protein wasisolated from yeast cultures exposed to each reagent.Equal amounts of protein (15 lg) were loaded, separatedby SDS-polyacrylamide gel electrophoresis, and blottedonto polyvinylidene difluoride membranes. Dual phos-phorylation of Hog1 was assessed using an antibody fordually phosphorylated (T180/Y182) p38 (Cell SignalingTechnology). Hog1 was detected using an anti-C-termi-nal Hog1 antibody (Santa Cruz Biotechnology). Anti-body binding was visualized by binding of a horseradishperoxidase-conjugated secondary antibody followed bydetection with ECL Plus (Amersham).
Table 1 Strains and plasmids. ATCC American type culture col-lection
Genotype Source
S. cerevisiae strainATCC201388 MATa his3D 1 leu2D 0
met15D 0 ura3D 0ATCC
ATCC4002724 hog1D of ATCC201388 ATCCATCC4001561 ssk1D of ATCC201388 ATCCATCC4005271 ste11D of ATCC201388 ATCCATCC4000993 slt2D of ATCC201388 ATCCcdc25H MATa ade2-101 his3-200
leu2-3 112 lys2-801 trp1-901Stratagene
ura3-52 cdc25-2 Gal+
PlasmidpYES2 2-lm URA3 InvitrogenpYES2-HIK1 HIK1 in pYES2 This studypYES2-hik1-H736V hik1-H736V in pYES2 This studypYES2-hik1-D1153E hik1-D1153E in pYES2 This studypCLD CEN LEU2 This studypCLD-SSK1 SSK1 in pCLD This studypCLD-HOG1 HOG1 in pCLD This studypSos 2-lm LEU2 StratagenepSos-SSK1 SSK1 in pSos This studypSos-YPD1 YPD1 in pSos This studypMyr 2-lm URA3 StratagenepMyr-HIK1 HIK1 in pMyr This study
300
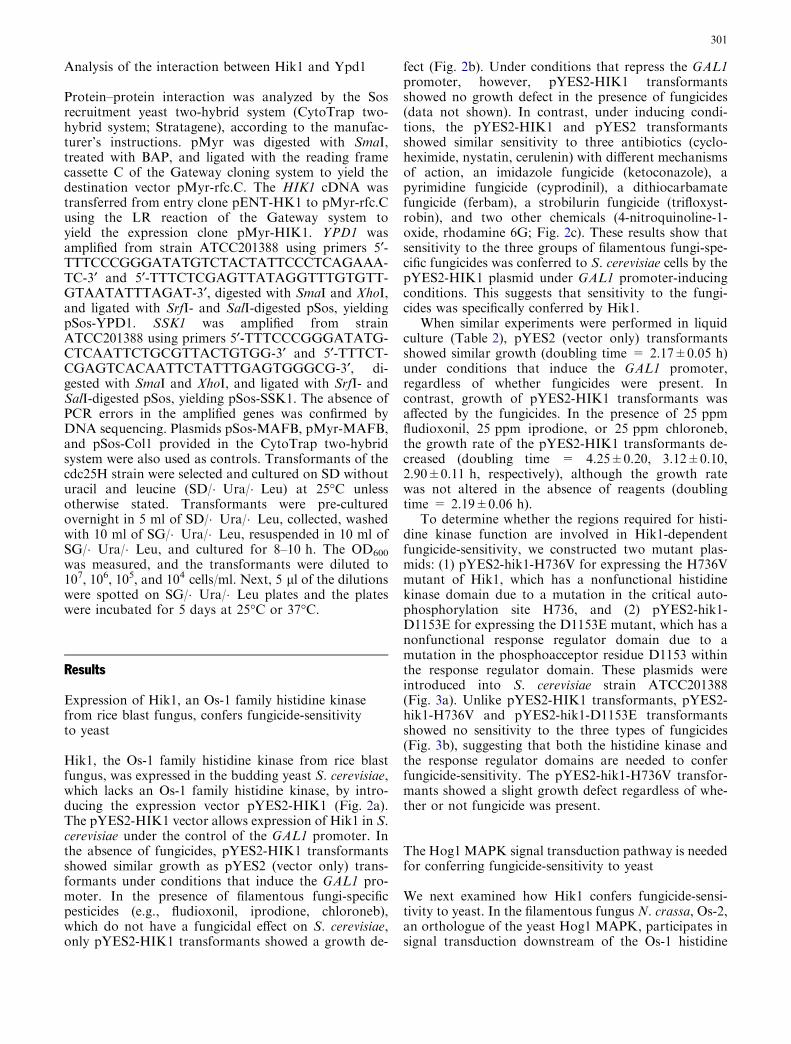
Analysis of the interaction between Hik1 and Ypd1
Protein–protein interaction was analyzed by the Sosrecruitment yeast two-hybrid system (CytoTrap two-hybrid system; Stratagene), according to the manufac-turer’s instructions. pMyr was digested with SmaI,treated with BAP, and ligated with the reading framecassette C of the Gateway cloning system to yield thedestination vector pMyr-rfc.C. The HIK1 cDNA wastransferred from entry clone pENT-HK1 to pMyr-rfc.Cusing the LR reaction of the Gateway system toyield the expression clone pMyr-HIK1. YPD1 wasamplified from strain ATCC201388 using primers 5¢-TTTCCCGGGATATGTCTACTATTCCCTCAGAAA-TC-3¢ and 5¢-TTTCTCGAGTTATAGGTTTGTGTT-GTAATATTTAGAT-3¢, digested with SmaI and XhoI,and ligated with SrfI- and SalI-digested pSos, yieldingpSos-YPD1. SSK1 was amplified from strainATCC201388 using primers 5¢-TTTCCCGGGATATG-CTCAATTCTGCGTTACTGTGG-3¢ and 5¢-TTTCT-CGAGTCACAATTCTATTTGAGTGGGCG-3¢, di-gested with SmaI and XhoI, and ligated with SrfI- andSalI-digested pSos, yielding pSos-SSK1. The absence ofPCR errors in the amplified genes was confirmed byDNA sequencing. Plasmids pSos-MAFB, pMyr-MAFB,and pSos-Col1 provided in the CytoTrap two-hybridsystem were also used as controls. Transformants of thecdc25H strain were selected and cultured on SD withouturacil and leucine (SD/�Ura/�Leu) at 25�C unlessotherwise stated. Transformants were pre-culturedovernight in 5 ml of SD/�Ura/�Leu, collected, washedwith 10 ml of SG/�Ura/�Leu, resuspended in 10 ml ofSG/�Ura/�Leu, and cultured for 8–10 h. The OD600
was measured, and the transformants were diluted to107, 106, 105, and 104 cells/ml. Next, 5 ll of the dilutionswere spotted on SG/�Ura/�Leu plates and the plateswere incubated for 5 days at 25�C or 37�C.
Results
Expression of Hik1, an Os-1 family histidine kinasefrom rice blast fungus, confers fungicide-sensitivityto yeast
Hik1, the Os-1 family histidine kinase from rice blastfungus, was expressed in the budding yeast S. cerevisiae,which lacks an Os-1 family histidine kinase, by intro-ducing the expression vector pYES2-HIK1 (Fig. 2a).The pYES2-HIK1 vector allows expression of Hik1 in S.cerevisiae under the control of the GAL1 promoter. Inthe absence of fungicides, pYES2-HIK1 transformantsshowed similar growth as pYES2 (vector only) trans-formants under conditions that induce the GAL1 pro-moter. In the presence of filamentous fungi-specificpesticides (e.g., fludioxonil, iprodione, chloroneb),which do not have a fungicidal effect on S. cerevisiae,only pYES2-HIK1 transformants showed a growth de-
fect (Fig. 2b). Under conditions that repress the GAL1promoter, however, pYES2-HIK1 transformantsshowed no growth defect in the presence of fungicides(data not shown). In contrast, under inducing condi-tions, the pYES2-HIK1 and pYES2 transformantsshowed similar sensitivity to three antibiotics (cyclo-heximide, nystatin, cerulenin) with different mechanismsof action, an imidazole fungicide (ketoconazole), apyrimidine fungicide (cyprodinil), a dithiocarbamatefungicide (ferbam), a strobilurin fungicide (trifloxyst-robin), and two other chemicals (4-nitroquinoline-1-oxide, rhodamine 6G; Fig. 2c). These results show thatsensitivity to the three groups of filamentous fungi-spe-cific fungicides was conferred to S. cerevisiae cells by thepYES2-HIK1 plasmid under GAL1 promoter-inducingconditions. This suggests that sensitivity to the fungi-cides was specifically conferred by Hik1.
When similar experiments were performed in liquidculture (Table 2), pYES2 (vector only) transformantsshowed similar growth (doubling time = 2.17±0.05 h)under conditions that induce the GAL1 promoter,regardless of whether fungicides were present. Incontrast, growth of pYES2-HIK1 transformants wasaffected by the fungicides. In the presence of 25 ppmfludioxonil, 25 ppm iprodione, or 25 ppm chloroneb,the growth rate of the pYES2-HIK1 transformants de-creased (doubling time = 4.25±0.20, 3.12±0.10,2.90±0.11 h, respectively), although the growth ratewas not altered in the absence of reagents (doublingtime = 2.19±0.06 h).
To determine whether the regions required for histi-dine kinase function are involved in Hik1-dependentfungicide-sensitivity, we constructed two mutant plas-mids: (1) pYES2-hik1-H736V for expressing the H736Vmutant of Hik1, which has a nonfunctional histidinekinase domain due to a mutation in the critical auto-phosphorylation site H736, and (2) pYES2-hik1-D1153E for expressing the D1153E mutant, which has anonfunctional response regulator domain due to amutation in the phosphoacceptor residue D1153 withinthe response regulator domain. These plasmids wereintroduced into S. cerevisiae strain ATCC201388(Fig. 3a). Unlike pYES2-HIK1 transformants, pYES2-hik1-H736V and pYES2-hik1-D1153E transformantsshowed no sensitivity to the three types of fungicides(Fig. 3b), suggesting that both the histidine kinase andthe response regulator domains are needed to conferfungicide-sensitivity. The pYES2-hik1-H736V transfor-mants showed a slight growth defect regardless of whe-ther or not fungicide was present.
The Hog1 MAPK signal transduction pathway is neededfor conferring fungicide-sensitivity to yeast
We next examined how Hik1 confers fungicide-sensi-tivity to yeast. In the filamentous fungus N. crassa, Os-2,an orthologue of the yeast Hog1 MAPK, participates insignal transduction downstream of the Os-1 histidine
301
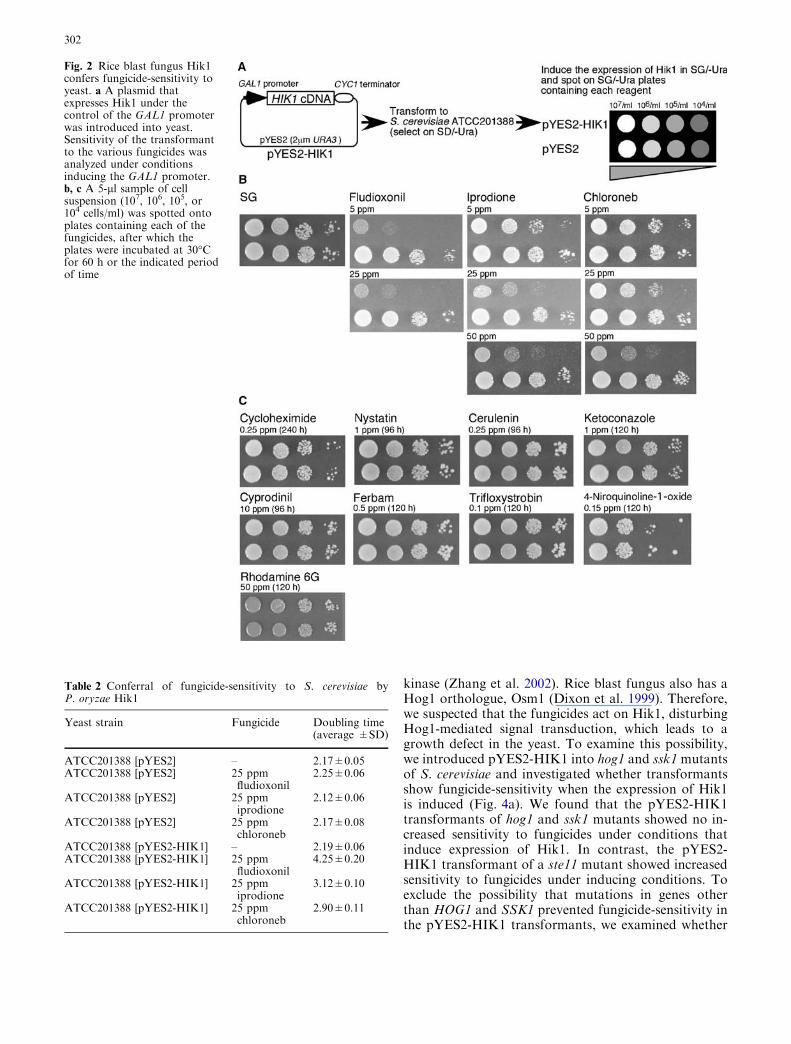
kinase (Zhang et al. 2002). Rice blast fungus also has aHog1 orthologue, Osm1 (Dixon et al. 1999). Therefore,we suspected that the fungicides act on Hik1, disturbingHog1-mediated signal transduction, which leads to agrowth defect in the yeast. To examine this possibility,we introduced pYES2-HIK1 into hog1 and ssk1 mutantsof S. cerevisiae and investigated whether transformantsshow fungicide-sensitivity when the expression of Hik1is induced (Fig. 4a). We found that the pYES2-HIK1transformants of hog1 and ssk1 mutants showed no in-creased sensitivity to fungicides under conditions thatinduce expression of Hik1. In contrast, the pYES2-HIK1 transformant of a ste11 mutant showed increasedsensitivity to fungicides under inducing conditions. Toexclude the possibility that mutations in genes otherthan HOG1 and SSK1 prevented fungicide-sensitivity inthe pYES2-HIK1 transformants, we examined whether
Table 2 Conferral of fungicide-sensitivity to S. cerevisiae byP. oryzae Hik1
Yeast strain Fungicide Doubling time(average ±SD)
ATCC201388 [pYES2] – 2.17±0.05ATCC201388 [pYES2] 25 ppm
fludioxonil2.25±0.06
ATCC201388 [pYES2] 25 ppmiprodione
2.12±0.06
ATCC201388 [pYES2] 25 ppmchloroneb
2.17±0.08
ATCC201388 [pYES2-HIK1] – 2.19±0.06ATCC201388 [pYES2-HIK1] 25 ppm
fludioxonil4.25±0.20
ATCC201388 [pYES2-HIK1] 25 ppmiprodione
3.12±0.10
ATCC201388 [pYES2-HIK1] 25 ppmchloroneb
2.90±0.11
Fig. 2 Rice blast fungus Hik1confers fungicide-sensitivity toyeast. a A plasmid thatexpresses Hik1 under thecontrol of the GAL1 promoterwas introduced into yeast.Sensitivity of the transformantto the various fungicides wasanalyzed under conditionsinducing the GAL1 promoter.b, c A 5-ll sample of cellsuspension (107, 106, 105, or104 cells/ml) was spotted ontoplates containing each of thefungicides, after which theplates were incubated at 30�Cfor 60 h or the indicated periodof time
302

intact HOG1 and SSK1 genes, respectively, can com-plement the fungicide-sensitivity of hog1 and ssk1 mu-tants (Fig. 4b). When pCLD -HOG1 was introducedinto a hog1 mutant with pYES2-HIK1, fungicide-sensi-tivity was recovered. In this case, pCLD-HOG1 alsocomplemented the high osmolarity-sensitive phenotype(sensitive to 0.5 M NaCl). Similarly, when pCLD-SSK1was introduced into an ssk1 mutant with pYES2-HIK1,fungicide-sensitivity was recovered. In contrast, whenvector (pCLD) alone was introduced into hog1 or ssk1mutants along with pYES2-HIK1, fungicide-sensitivitywas not recovered. These data suggest that, within the
Hik1 MAPK pathway, Ssk1 and Hog1, but not Ste11,are needed to confer fungicide-sensitivity.
The Hog1 MAPK signal transduction pathwayis activated by Hik1 in the presence of the threegroups of fungicides
Stimulation of the Hog1 pathway results in activation ofthe MAPK Hog1 via the dual phosphorylation of T174and Y176. Therefore, to determine whether exposure ofthe Hik1-expressing strain to the three groups of fungi-cides resulted in the activation of Hog1, we used anantibody that specifically detects the dually phosphory-lated form of Hog1 (Fig. 5). The total level of Hog1 wasassessed using an antibody against Hog1. As a positivecontrol, we also determined the degree of phosphoryla-tion of Hog1 after exposure to 0.5 M NaCl. In the Hik1-expressing strain, an elevated level of Hog1 phosphor-ylation was observed upon exposure to 0.5 M NaCl,
Fig. 4 SSK1 and HOG1 are required to confer fungicide-sensitivityby Hik1. a Hik1 was unable to confer fungicide-sensitivity to ssk1and hog1 mutants. b Hik1 conferred fungicide-sensitivity to ssk1and hog1 mutants transfected with SSK1 and HOG1, respectively.A 5-ll sample of cell suspension (107, 106, 105, or 104 cells/ml) wasspotted onto plates containing each of the fungicides, after whichthe plates were incubated for 60 h at 30�C. WT Wild type
Fig. 3 Both the histidine kinaseand the response regulatordomains of Hik1 are required toconfer fungicide-sensitivity.a Yeast strains expressing Hik1-H736V or Hik1-D1153E wereconstructed. Hik1-H736V has anonfunctional histidine kinasedomain and Hik1-D1153E hasa nonfunctional responseregulator domain. b A 5-llsample of cell suspension (107,106, 105, or 104 cells/ml) wasspotted onto plates containingeach of the fungicides, afterwhich the plates were incubatedfor 72 h at 30�C
303

25 ppm fludioxonil, 25 ppm iprodione, or 25 ppmchloroneb. The level of Hog1 phosphorylation in fludi-oxonil-treated cells was higher than in iprodione- orchloroneb-treated cells. In contrast, there was no in-crease in phosphorylation upon exposure to 0.25 ppmcycloheximide. In the Hik1-nonexpressing strain, anelevated level of Hog1 phosphorylation was observedupon exposure to 0.5 M NaCl, but elevated phosphor-ylation was not observed upon exposure to 25 ppmfludioxonil, 25 ppm iprodione, or 25 ppm chloroneb.These results indicate that Hog1 is specifically phos-phorylated by treatment with the three groups of fun-gicides when Hik1 is present.
Hik1 can interact with the yeast signal transductionfactor Ypd1, which functions upstream of Hog1
To determine which factor interacts with Hik1 in yeast,we used the Sos recruitment yeast two-hybrid system toinvestigate the interaction between Hik1 and candidatefactors Ypd1 and Ssk1. Specifically, we examined whe-ther the prey protein Hik1 expressed with a myristic acidmodification (pMyr-HIK1) can interact with the bait
proteins Ypd1 and Ssk expressed as Sos fusion proteins(pSos-YPD1, pSos-SSK1, respectively; Fig. 6). If thereis an interaction between the prey and the bait proteins,the host strain cdc25H can grow at the restrictive tem-perature (37�C). At the permissive temperature (25�C),all of the combinations showed significant growth. Thepositive control (pSos-MAFB + pMyr-MAFB) and thenegative control (pSos-Col1 + pMyr-MAFB) grewslower than the combination of empty vectors (pSos +pMyr) and all other transformants. At the restrictivetemperature (37�C), both the positive control and thetransformant with a combination of pSos-YPD1 andpMyr-HIK1 showed significant growth (Fig. 6). Thetransformant with a combination of pSos-SSK1 andpMyr-HIK1 did not show significant growth. Thetransformant with a combination of pSos-YPD1 andpMyr showed slight growth, probably because of inter-action of the Sos-YPD1 fusion protein with membrane-bound Sln1, which is an upstream factor in the yeastHog1 signal transduction pathway. These results suggestthat Hik1 of rice blast fungus can confer fungicide-sen-sitivity to yeast via Ypd1.
Discussion
Heterologous two-component histidine kinase geneshave been successfully expressed in S. cerevisiae. Forexample, an SLN1 homologue (tcsB) of Aspergillusnidulans has been shown to complement an sln1mutation in S. cerevisiae (Furukawa et al. 2002). Also,
Fig. 5 Activation of the Hog1 MAPK cascade by Hik1 in thepresence of the three groups of fungicides. Yeast cells carryingpYES2-HIK1 or pYES2 were treated with each reagent. Solubleprotein extracts were prepared and the dually phosphorylated formof Hog1 was detected by Western blotting, using an anti-phospho-p38 antibody. Hog1 was assessed on the same blot using an anti-C-terminal Hog1 antibody
Fig. 6 Detection of Hik1–Ypd1interaction by the Sosrecruitment yeast two-hybridsystem. The S. cerevisiae straincdc25H was transformed witheach combination of pSos andpMyr vectors. A 5-ll sample ofcell suspension (107, 106, 105,or 104 cells/ml) of eachtransformant was spotted ontoSG/�Ura/�Leu plates and theplates were incubated for 5 daysat 25�C or 37�C
304
a hybrid-type histidine kinase gene, ATHK1, fromArabidopsis thaliana can complement the sln1 mutation(Urao et al. 1999). Further, expression of A. thalianaCRE1 in S. cerevisiae confers cytokinin-dependentgrowth to an sln1 mutant via Ypd1, providing directevidence that Cre1 is a cytokinin receptor (Inoue et al.2001; Reiser et al. 2003). Finally, in the current report,we successfully expressed the Os-1 family histidinekinase, Hik1, from the rice blast fungus in S. cerevi-siae.
The target of the three groups of filamentous fungi-specific fungicides (phenylpyrroles, dicarboximides,aromatic hydrocarbons) has been shown to be the os-motic stress signal transduction pathway, which isdependent on the Os-1 family two-component histidinekinases. Cui et al. (2002) proposed that the target ofdicarboximide fungicides is the Os-1 family histidinekinase or another molecule that in turn interacts withthis molecule. In this report, we found that expression ofHik1, an Os-1 orthologue from rice blast fungus, canconfer fungicide-sensitivity to yeast. This required boththe histidine kinase and the response regulator domainsof Hik1. Analysis of yeast mutants indicated that thissensitivity was Hog1- and Ssk1-dependent. Also, treat-ment with the fungicides caused phosphorylation ofHog1 in the recombinant strain expressing Hik1; andinteraction between Hik1 and Ypd1 was observed inyeast two-hybrid studies. These observations stronglysuggest that Hik1 is a direct target of the fungicides andthat the signal from the fungicides is transmitted to theyeast Hog1 pathway via Ypd1. We also found that, inthe presence of 10 ppm fludioxonil, the mRNA level ofsome Hog1-dependent genes, including GRE2, GPD1,and CTT, is higher (14.0-, 6.6-, 3.1-fold, respectively) inthe Hik1-expressing strain than in strains that do notexpress Hik1 (data not shown). This further supportsour conclusion that Hik1 can activate the Hog1 pathwayin the presence of these fungicides. There stillremains the possibility that Hik1 mediates the actiondownstream from an unidentified fungicide receptor inS. cerevisiae. Direct binding experiments between Hik1and fungicides must be carried out to finally determinethe target of the fungicides.
The detailed mechanism by which Hik1 activates theHog1 MAPK cascade remains unclear. Because Sln1 is apotent negative regulator of the Hog1 MAPK cascadeunder normal osmolarity conditions (Ota and Varshav-sky 1993), this negative effect must be somehow dimin-ished so that the pathway is activated. The two-hybridexperiment demonstrated an interaction between Hik1and Ypd1, so in the presence of the fungicides, Hik1may disturb the Sln1–Ypd1–Ssk1 phosphorelay neededfor negative control of the Hog1 pathway, thus leadingto constitutive activation of the Hog1 MAPK cascade.Alternatively, Hik1 may modify the activity of phos-phorylated Ssk1 via the Hik1–Ypd1–Ssk1 interaction,leading to activation of the downstream pathway.
Yeast cells with Hik1 or other Os-1 homologues couldbe used for the discovery of new fungicides. Specifically,
Hik1 (Os-1 homologue)-specific fungicides could beidentified by searching for reagents that inhibit thegrowth of Hik1-expressing yeasts but do not inhibit thegrowth of yeasts lacking Hik1. This screening systemcould be used to search for new compounds that bind tosites different from the three groups of conventionalfungicides. Both rice blast fungus and S. cerevisiae areascomycete fungi. Therefore, we should be able to iden-tify compounds with high selectivity and minimalenvironmental effects by excluding those that functionin both rice blast fungus (filamentous fungi) andS. cerevisiae (yeast). Because there is a demand forspecific and environment-friendly fungicides, screeningsystems capable of identifying specific fungicides will beimportant and powerful tools.
Pillonel and Meyer (1997) showed that the proteinkinase PK-III, which may be involved in the regulationof glycerol synthesis, is inhibited by phenylpyrroles, butthat vinclozolin (dicarboximide) has no effect on thisprotein kinase. Disruption of the Aspergillus fumigatusFOS-1 gene, which encodes a putative two-componenthistidine kinase without an ARD, results in resistance todicarboximide fungicides (Pott et al. 2000). Ramesh et al.(2001) have further reported that the cAMP signaltransduction pathway is involved in the action of di-carboximide and aromatic hydrocarbon fungicides in thebasidiomycete fungus Ustilago maydis. The relationshipbetween these factors and the Os-1 family histidine kin-ases in the action of fungicides has not been clarified; andfurther research is needed to elucidate the detailedmechanism of fungicide action.
Acknowledgements This study was supported by grants for the Bio-architect and the Ecomolecular Science Research Program ofRIKEN. This work was also supported by MEXT.KAKENHI(15780063).
References
Alex LA, Borkovich KA, Simon MI (1996) Hyphal development inNeurospora crassa: involvement of a two-component histidinekinase. Proc Natl Acad Sci USA 93:3416–3421
Alex LA, Korch C, Selitrennikoff CP, Simon MI (1998) COS1, atwo-component histidine kinase that is involved in hyphaldevelopment in the opportunistic pathogen Candida albicans.Proc Natl Acad Sci USA 95:7069–7073
Catlett NL, Yoder OC, Turgeon BG (2003) Whole-genome anal-ysis of two-component signal transduction genes in fungalpathogens. Eukaryot Cell 2:1151–1161
Cui W, Beever RE, Parkes SL, Weeds PL, Templeton MD (2002)An osmosensing histidine kinase mediates dicarboximide fun-gicide resistance in Botryotinia fuckeliana (Botrytis cinerea).Fungal Genet Biol 36:187–198
Davenport KR, Sohaskey M, Kamada Y, Levin DE, Gustin MC(1995) A second osmosensing signal transduction pathwayin yeast. Hypotonic shock activates the PKC1 proteinkinase-regulated cell integrity pathway. J Biol Chem 270:30157–30161
Dixon KP, Xu JR, Smirnoff N, Talbot NJ (1999) Independentsignaling pathways regulate cellular turgor during hyperosmoticstress and appressorium-mediated plant infection by Magna-porthe grisea. Plant Cell 11:2045–2058
305

Dry IB, Yuan KH, Hutton DG (2004) Dicarboximide resistance infield isolates of Alternaria alternata is mediated by a mutation ina two-component histidine kinase gene. Fungal Genet Biol41:102–108
Fujimura M, Ochiai N, Ichiishi A, Usami R, Horikoshi K, Yam-aguchi I (2000) Sensitivity to phenylpyrrole fungicides andabnormal glycerol accumulation in os and cut mutant strains ofNeurospora crassa. J Pestic Sci 25:31–36
Fujimura M, Ochiai N, Oshima M, Motoyama T, Ichiishi A,Usami R, Horikoshi K, Yamaguchi I (2003) Putative homologsof SSK22 MAPKK kinase and PBS2 MAPK kinase of Sac-charomyces cerevisiae encoded by os-4 and os-5 genes for os-motic sensitivity and fungicide resistance in Neurospora crassa.Biosci Biotechnol Biochem 67:186–191
Furukawa K, Katsuno Y, Urao T, Yabe T, Yamada-Okabe T,Yamada-Okabe H, Yamagata Y, Abe K, Nakajima T (2002)Isolation and functional analysis of a gene, tcsB, encoding atransmembrane hybrid-type histidine kinase from Aspergillusnidulans. Appl Environ Microbiol 68:5304–5310
Inoue T, Higuchi M, Hashimoto Y, Seki M, Kobayashi M, KatoT, Tabata S, Shinozaki K, Kakimoto T (2001) Identification ofCRE1 as a cytokinin receptor from Arabidopsis. Nature409:1060–1063
Ito H, Fukuda Y, Murata K, Kimura K (1983) Transformation ofintact yeast cells with alkali cations. J Bacteriol 96:163–168
Maeda T, Takekawa M, Saito H (1995) Activation of yeast PBS2MAPKK by MAPKKKs or by binding of an SH3-containingosmosensor. Science 269:554–558
Miller TK, Renault S, Selitrennikoff CP (2002) Molecular dissec-tion of alleles of the osmotic-1 locus of Neurospora crassa.Fungal Genet Biol 35:147–155
Motoyama T, Imanishi K, Yamaguchi I (1998) cDNA cloning,expression, and mutagenesis of scytalone dehydratase neededfor pathogenicity of the rice blast fungus, Pyricularia oryzae.Biosci Biotechnol Biochem 62:564–566
Motoyama T, Kadokura K, Ohira T, Ichiishi A, Fujimura M,Yamaguchi I, Kudo T (2005) A two-component histidine kinaseof the rice blast fungus is involved in osmotic stress responseand fungicide action. Fungal Genet Biol 42:200–212
Nagahashi S, Mio T, Ono N, Yamada-Okabe T, Arisawa M,Bussey H, Yamada-Okabe H (1998) Isolation of CaSLN1 andCaNIK1, the genes for osmosensing histidine kinase homo-logues, from the pathogenic fungus Candida albicans. Micro-biology 144:425–432
Ochiai N, Fujimura M, Motoyama T, Ichiishi A, Usami R, Hori-koshi K, Yamaguchi I (2001) Characterization of mutations inthe two-component histidine kinase gene that confer fludioxonilresistance and osmotic sensitivity in the os-1 mutants of Neu-rospora crassa. Pestic Manage Sci 57:437–442
Ochiai N, Fujimura M, Oshima M, Motoyama T, Ichiishi A,Yamada-Okabe H, Yamaguchi I (2002) Effects of iprodioneand fludioxonil on glycerol synthesis and hyphal developmentin Candida albicans. Biosci Biotechnol Biochem 66:2209–2215
Oshima M, Fujimura M, Banno S, Hashimoto C, Motoyama T,Ichiishi A, Yamaguchi I (2002) A point mutation in the two-component histidine kinase BcOS-1 gene confers dicarboximideresistance in field isolates of Botrytis cinerea. Phytopathology92:75–80
Ota IM, Varshavsky A (1993) A yeast protein similar to bacterialtwo-component regulators. Science 262:566–569
Pillonel C, Meyer T (1997) Effect of phenylpyrroles on glycerolaccumulation and protein kinase activity of Neurospora crassa.Pestic Sci 49:229–236
Posas F, Wurgler-Murphy SM, Maeda T, Witten EA, Thai TC,Saito H (1996) Yeast HOG1 MAP kinase cascade is regulatedby a multistep phosphorelay mechanism in the SLN1–YPD1–SSK1 ‘‘two-component’’ osmosensor. Cell 86:865–875
Pott GB, Miller TK, Bartlett JA, Palas JS, Selitrennikoff CP (2000)The isolation of FOS-1, a gene encoding a putative two-com-ponent histidine kinase from Aspergillus fumigatus. FungalGenet Biol 31:55–67
Ramesh MA, Laidlaw RD, Durrenberger F, Orth AB, KronstadJW (2001) The cAMP signal transduction pathway mediatesresistance to dicarboximide and aromatic hydrocarbon fungi-cides in Ustilago maydis. Fungal Genet Biol 32:183–193
Reiser V, Raitt DC, Saito H (2003) Yeast osmosensor Sln1 andplant cytokinin receptor Cre1 respond to changes in turgorpressure. J Cell Biol 161:1035–1040
Sambrook J, Fritsch EF, Maniatis T (1989) Molecular cloning: alaboratory manual, 2nd edn. Cold Spring Harbor Laboratory,Cold Spring Harbor, N.Y.
Schumacher MM, Enderlin CS, Selitrennikoff CP (1997) Theosmotic-1 locus of Neurospora crassa encodes a putative histi-dine kinase similar to osmosensors of bacteria and yeast. CurrMicrobiol 34:340–347
Urao T, Yakubov B, Satoh R, Yamaguchi-Shinozaki K, Seki M,Hirayama T, Shinozaki K (1999) A transmembrane hybrid-typehistidine kinase in Arabidopsis functions as an osmosensor.Plant Cell 11:1743–1754
West AH, Stock AM (2001) Histidine kinases and response regu-lator proteins in two-component signaling systems. TrendsBiochem Sci 26:369–376
Yoshimi A, Tsuda M, Tanaka C (2004) Cloning and character-ization of the histidine kinase gene Dic1 from Cochliobolusheterostrophus that confers dicarboximide resistance andosmotic adaptation. Mol Genet Genomics 271:228–236
Zhang Y, Lamm R, Pillonel C, Lam S, Xu JR (2002) Osmoregu-lation and fungicide resistance: the Neurospora crassa os-2 geneencodes a HOG1 mitogen-activated protein kinase homologue.Appl Environ Microbiol 68:532–538
306
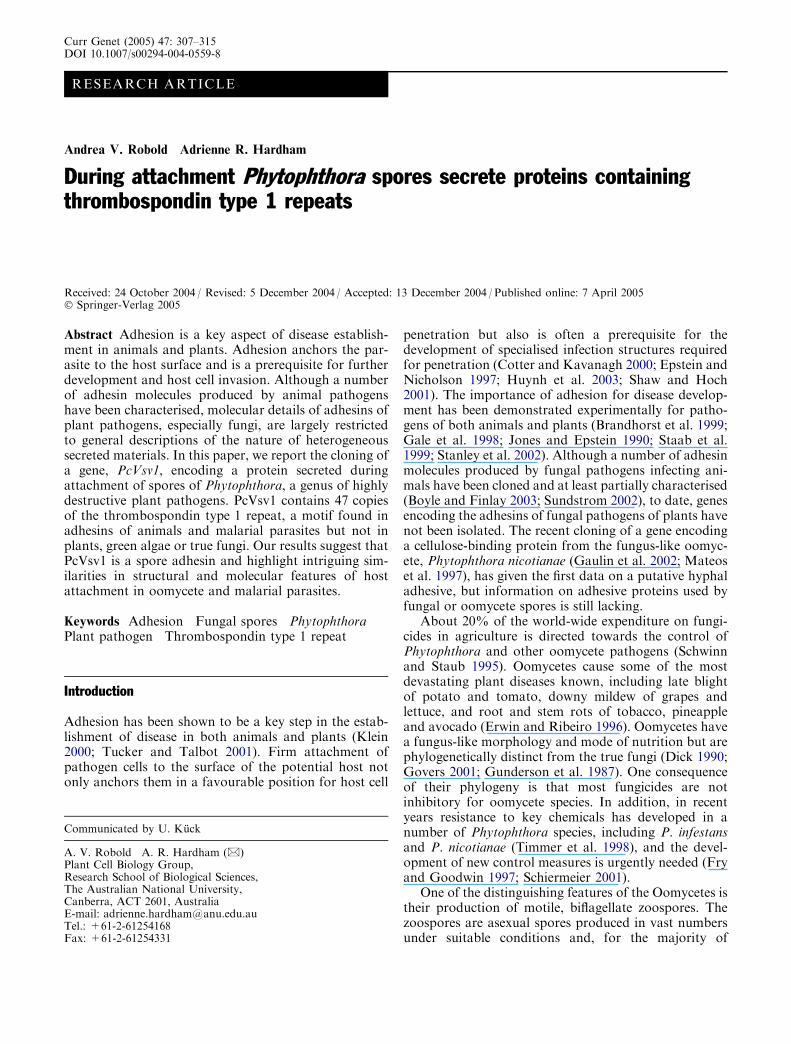
RESEARCH ARTICLE
Andrea V. Robold Æ Adrienne R. Hardham
During attachment Phytophthora spores secrete proteins containingthrombospondin type 1 repeats
Received: 24 October 2004 / Revised: 5 December 2004 / Accepted: 13 December 2004 / Published online: 7 April 2005� Springer-Verlag 2005
Abstract Adhesion is a key aspect of disease establish-ment in animals and plants. Adhesion anchors the par-asite to the host surface and is a prerequisite for furtherdevelopment and host cell invasion. Although a numberof adhesin molecules produced by animal pathogenshave been characterised, molecular details of adhesins ofplant pathogens, especially fungi, are largely restrictedto general descriptions of the nature of heterogeneoussecreted materials. In this paper, we report the cloning ofa gene, PcVsv1, encoding a protein secreted duringattachment of spores of Phytophthora, a genus of highlydestructive plant pathogens. PcVsv1 contains 47 copiesof the thrombospondin type 1 repeat, a motif found inadhesins of animals and malarial parasites but not inplants, green algae or true fungi. Our results suggest thatPcVsv1 is a spore adhesin and highlight intriguing sim-ilarities in structural and molecular features of hostattachment in oomycete and malarial parasites.
Keywords Adhesion Æ Fungal spores Æ Phytophthora ÆPlant pathogen Æ Thrombospondin type 1 repeat
Introduction
Adhesion has been shown to be a key step in the estab-lishment of disease in both animals and plants (Klein2000; Tucker and Talbot 2001). Firm attachment ofpathogen cells to the surface of the potential host notonly anchors them in a favourable position for host cell
penetration but also is often a prerequisite for thedevelopment of specialised infection structures requiredfor penetration (Cotter and Kavanagh 2000; Epstein andNicholson 1997; Huynh et al. 2003; Shaw and Hoch2001). The importance of adhesion for disease develop-ment has been demonstrated experimentally for patho-gens of both animals and plants (Brandhorst et al. 1999;Gale et al. 1998; Jones and Epstein 1990; Staab et al.1999; Stanley et al. 2002). Although a number of adhesinmolecules produced by fungal pathogens infecting ani-mals have been cloned and at least partially characterised(Boyle and Finlay 2003; Sundstrom 2002), to date, genesencoding the adhesins of fungal pathogens of plants havenot been isolated. The recent cloning of a gene encodinga cellulose-binding protein from the fungus-like oomyc-ete, Phytophthora nicotianae (Gaulin et al. 2002; Mateoset al. 1997), has given the first data on a putative hyphaladhesive, but information on adhesive proteins used byfungal or oomycete spores is still lacking.
About 20% of the world-wide expenditure on fungi-cides in agriculture is directed towards the control ofPhytophthora and other oomycete pathogens (Schwinnand Staub 1995). Oomycetes cause some of the mostdevastating plant diseases known, including late blightof potato and tomato, downy mildew of grapes andlettuce, and root and stem rots of tobacco, pineappleand avocado (Erwin and Ribeiro 1996). Oomycetes havea fungus-like morphology and mode of nutrition but arephylogenetically distinct from the true fungi (Dick 1990;Govers 2001; Gunderson et al. 1987). One consequenceof their phylogeny is that most fungicides are notinhibitory for oomycete species. In addition, in recentyears resistance to key chemicals has developed in anumber of Phytophthora species, including P. infestansand P. nicotianae (Timmer et al. 1998), and the devel-opment of new control measures is urgently needed (Fryand Goodwin 1997; Schiermeier 2001).
One of the distinguishing features of the Oomycetes istheir production of motile, biflagellate zoospores. Thezoospores are asexual spores produced in vast numbersunder suitable conditions and, for the majority of
Communicated by U. Kuck
A. V. Robold Æ A. R. Hardham (&)Plant Cell Biology Group,Research School of Biological Sciences,The Australian National University,Canberra, ACT 2601, AustraliaE-mail: [email protected].: +61-2-61254168Fax: +61-2-61254331
Curr Genet (2005) 47: 307–315DOI 10.1007/s00294-004-0559-8
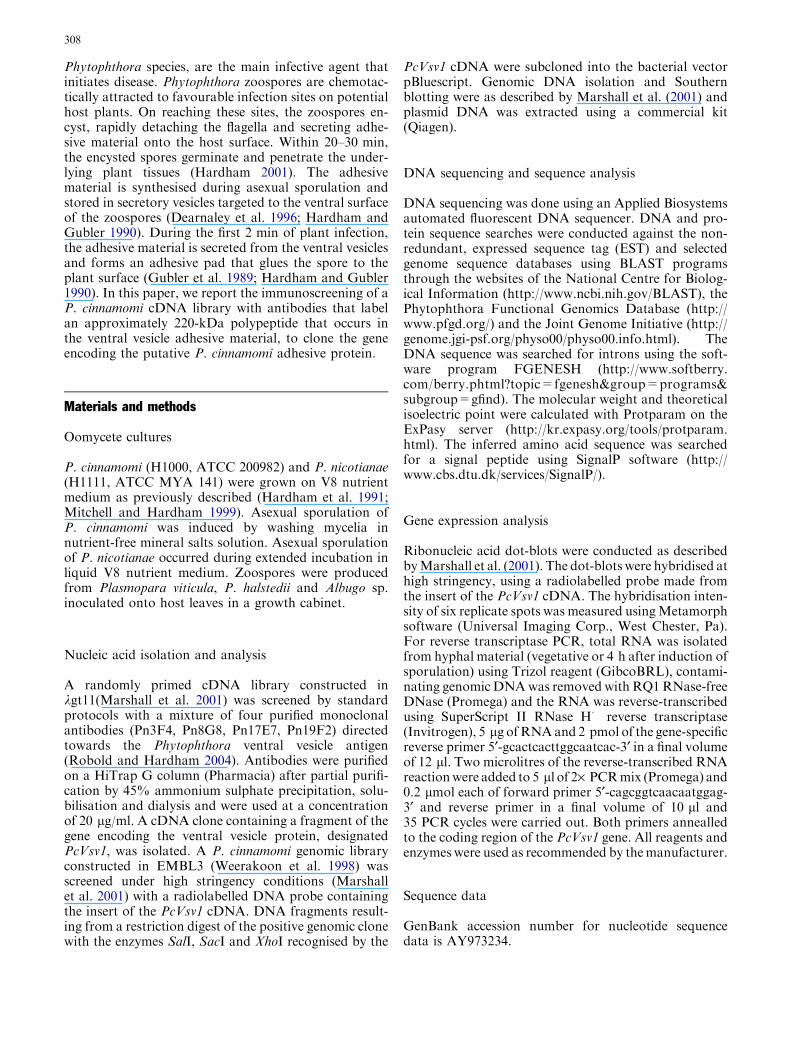
Phytophthora species, are the main infective agent thatinitiates disease. Phytophthora zoospores are chemotac-tically attracted to favourable infection sites on potentialhost plants. On reaching these sites, the zoospores en-cyst, rapidly detaching the flagella and secreting adhe-sive material onto the host surface. Within 20–30 min,the encysted spores germinate and penetrate the under-lying plant tissues (Hardham 2001). The adhesivematerial is synthesised during asexual sporulation andstored in secretory vesicles targeted to the ventral surfaceof the zoospores (Dearnaley et al. 1996; Hardham andGubler 1990). During the first 2 min of plant infection,the adhesive material is secreted from the ventral vesiclesand forms an adhesive pad that glues the spore to theplant surface (Gubler et al. 1989; Hardham and Gubler1990). In this paper, we report the immunoscreening of aP. cinnamomi cDNA library with antibodies that labelan approximately 220-kDa polypeptide that occurs inthe ventral vesicle adhesive material, to clone the geneencoding the putative P. cinnamomi adhesive protein.
Materials and methods
Oomycete cultures
P. cinnamomi (H1000, ATCC 200982) and P. nicotianae(H1111, ATCC MYA 141) were grown on V8 nutrientmedium as previously described (Hardham et al. 1991;Mitchell and Hardham 1999). Asexual sporulation ofP. cinnamomi was induced by washing mycelia innutrient-free mineral salts solution. Asexual sporulationof P. nicotianae occurred during extended incubation inliquid V8 nutrient medium. Zoospores were producedfrom Plasmopara viticula, P. halstedii and Albugo sp.inoculated onto host leaves in a growth cabinet.
Nucleic acid isolation and analysis
A randomly primed cDNA library constructed inkgt11(Marshall et al. 2001) was screened by standardprotocols with a mixture of four purified monoclonalantibodies (Pn3F4, Pn8G8, Pn17E7, Pn19F2) directedtowards the Phytophthora ventral vesicle antigen(Robold and Hardham 2004). Antibodies were purifiedon a HiTrap G column (Pharmacia) after partial purifi-cation by 45% ammonium sulphate precipitation, solu-bilisation and dialysis and were used at a concentrationof 20 lg/ml. A cDNA clone containing a fragment of thegene encoding the ventral vesicle protein, designatedPcVsv1, was isolated. A P. cinnamomi genomic libraryconstructed in EMBL3 (Weerakoon et al. 1998) wasscreened under high stringency conditions (Marshallet al. 2001) with a radiolabelled DNA probe containingthe insert of the PcVsv1 cDNA. DNA fragments result-ing from a restriction digest of the positive genomic clonewith the enzymes SalI, SacI and XhoI recognised by the
PcVsv1 cDNA were subcloned into the bacterial vectorpBluescript. Genomic DNA isolation and Southernblotting were as described by Marshall et al. (2001) andplasmid DNA was extracted using a commercial kit(Qiagen).
DNA sequencing and sequence analysis
DNA sequencing was done using an Applied Biosystemsautomated fluorescent DNA sequencer. DNA and pro-tein sequence searches were conducted against the non-redundant, expressed sequence tag (EST) and selectedgenome sequence databases using BLAST programsthrough the websites of the National Centre for Biolog-ical Information (http://www.ncbi.nih.gov/BLAST), thePhytophthora Functional Genomics Database (http://www.pfgd.org/) and the Joint Genome Initiative (http://genome.jgi-psf.org/physo00/physo00.info.html). TheDNA sequence was searched for introns using the soft-ware program FGENESH (http://www.softberry.com/berry.phtml?topic=fgenesh&group=programs&subgroup=gfind). The molecular weight and theoreticalisoelectric point were calculated with Protparam on theExPasy server (http://kr.expasy.org/tools/protparam.html). The inferred amino acid sequence was searchedfor a signal peptide using SignalP software (http://www.cbs.dtu.dk/services/SignalP/).
Gene expression analysis
Ribonucleic acid dot-blots were conducted as describedbyMarshall et al. (2001). The dot-blots were hybridised athigh stringency, using a radiolabelled probe made fromthe insert of the PcVsv1 cDNA. The hybridisation inten-sity of six replicate spots was measured usingMetamorphsoftware (Universal Imaging Corp., West Chester, Pa).For reverse transcriptase PCR, total RNA was isolatedfrom hyphal material (vegetative or 4 h after induction ofsporulation) using Trizol reagent (GibcoBRL), contami-nating genomicDNAwas removedwith RQ1RNase-freeDNase (Promega) and the RNA was reverse-transcribedusing SuperScript II RNase H� reverse transcriptase(Invitrogen), 5 lg ofRNAand 2 pmol of the gene-specificreverse primer 5¢-gcactcacttggcaatcac-3¢ in a final volumeof 12 ll. Two microlitres of the reverse-transcribed RNAreactionwere added to 5 ll of 2· PCRmix (Promega) and0.2 lmol each of forward primer 5¢-cagcggtcaacaatggag-3¢ and reverse primer in a final volume of 10 ll and35 PCR cycles were carried out. Both primers annealledto the coding region of the PcVsv1 gene. All reagents andenzymeswere used as recommended by themanufacturer.
Sequence data
GenBank accession number for nucleotide sequencedata is AY973234.
308
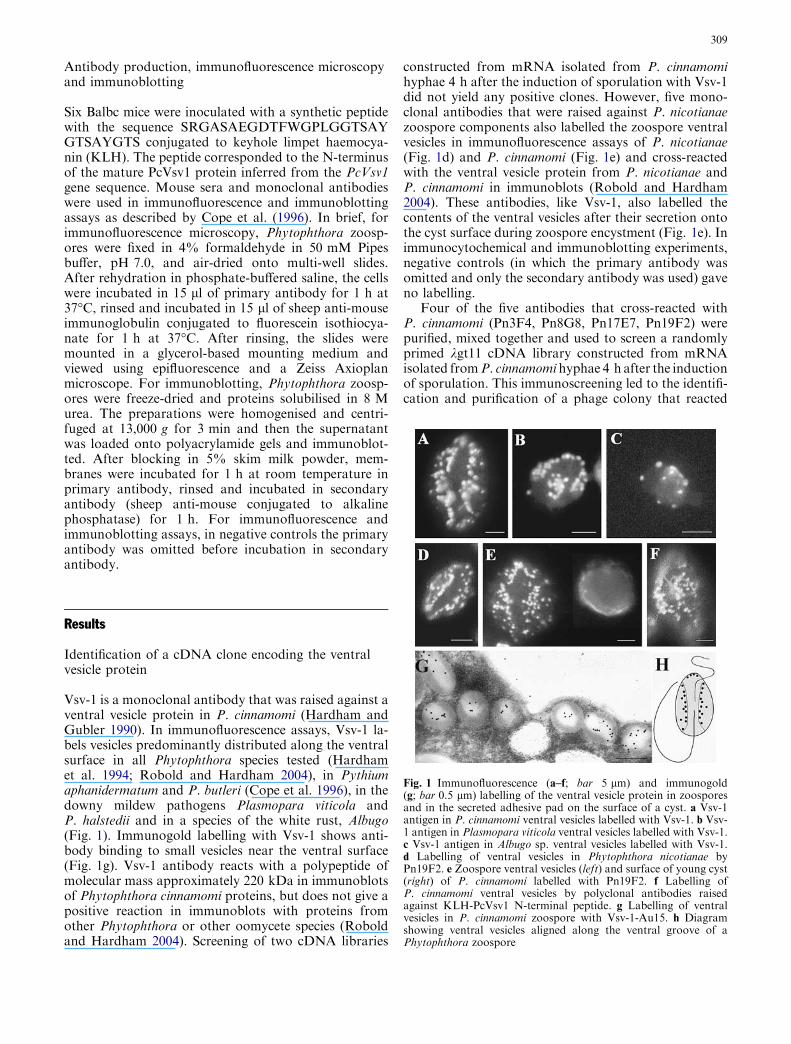
Antibody production, immunofluorescence microscopyand immunoblotting
Six Balbc mice were inoculated with a synthetic peptidewith the sequence SRGASAEGDTFWGPLGGTSAYGTSAYGTS conjugated to keyhole limpet haemocya-nin (KLH). The peptide corresponded to the N-terminusof the mature PcVsv1 protein inferred from the PcVsv1gene sequence. Mouse sera and monoclonal antibodieswere used in immunofluorescence and immunoblottingassays as described by Cope et al. (1996). In brief, forimmunofluorescence microscopy, Phytophthora zoosp-ores were fixed in 4% formaldehyde in 50 mM Pipesbuffer, pH 7.0, and air-dried onto multi-well slides.After rehydration in phosphate-buffered saline, the cellswere incubated in 15 ll of primary antibody for 1 h at37�C, rinsed and incubated in 15 ll of sheep anti-mouseimmunoglobulin conjugated to fluorescein isothiocya-nate for 1 h at 37�C. After rinsing, the slides weremounted in a glycerol-based mounting medium andviewed using epifluorescence and a Zeiss Axioplanmicroscope. For immunoblotting, Phytophthora zoosp-ores were freeze-dried and proteins solubilised in 8 Murea. The preparations were homogenised and centri-fuged at 13,000 g for 3 min and then the supernatantwas loaded onto polyacrylamide gels and immunoblot-ted. After blocking in 5% skim milk powder, mem-branes were incubated for 1 h at room temperature inprimary antibody, rinsed and incubated in secondaryantibody (sheep anti-mouse conjugated to alkalinephosphatase) for 1 h. For immunofluorescence andimmunoblotting assays, in negative controls the primaryantibody was omitted before incubation in secondaryantibody.
Results
Identification of a cDNA clone encoding the ventralvesicle protein
Vsv-1 is a monoclonal antibody that was raised against aventral vesicle protein in P. cinnamomi (Hardham andGubler 1990). In immunofluorescence assays, Vsv-1 la-bels vesicles predominantly distributed along the ventralsurface in all Phytophthora species tested (Hardhamet al. 1994; Robold and Hardham 2004), in Pythiumaphanidermatum and P. butleri (Cope et al. 1996), in thedowny mildew pathogens Plasmopara viticola andP. halstedii and in a species of the white rust, Albugo(Fig. 1). Immunogold labelling with Vsv-1 shows anti-body binding to small vesicles near the ventral surface(Fig. 1g). Vsv-1 antibody reacts with a polypeptide ofmolecular mass approximately 220 kDa in immunoblotsof Phytophthora cinnamomi proteins, but does not give apositive reaction in immunoblots with proteins fromother Phytophthora or other oomycete species (Roboldand Hardham 2004). Screening of two cDNA libraries
constructed from mRNA isolated from P. cinnamomihyphae 4 h after the induction of sporulation with Vsv-1did not yield any positive clones. However, five mono-clonal antibodies that were raised against P. nicotianaezoospore components also labelled the zoospore ventralvesicles in immunofluorescence assays of P. nicotianae(Fig. 1d) and P. cinnamomi (Fig. 1e) and cross-reactedwith the ventral vesicle protein from P. nicotianae andP. cinnamomi in immunoblots (Robold and Hardham2004). These antibodies, like Vsv-1, also labelled thecontents of the ventral vesicles after their secretion ontothe cyst surface during zoospore encystment (Fig. 1e). Inimmunocytochemical and immunoblotting experiments,negative controls (in which the primary antibody wasomitted and only the secondary antibody was used) gaveno labelling.
Four of the five antibodies that cross-reacted withP. cinnamomi (Pn3F4, Pn8G8, Pn17E7, Pn19F2) werepurified, mixed together and used to screen a randomlyprimed kgt11 cDNA library constructed from mRNAisolated fromP. cinnamomi hyphae 4 h after the inductionof sporulation. This immunoscreening led to the identifi-cation and purification of a phage colony that reacted
Fig. 1 Immunofluorescence (a–f; bar 5 lm) and immunogold(g; bar 0.5 lm) labelling of the ventral vesicle protein in zoosporesand in the secreted adhesive pad on the surface of a cyst. a Vsv-1antigen in P. cinnamomi ventral vesicles labelled with Vsv-1. b Vsv-1 antigen in Plasmopara viticola ventral vesicles labelled with Vsv-1.c Vsv-1 antigen in Albugo sp. ventral vesicles labelled with Vsv-1.d Labelling of ventral vesicles in Phytophthora nicotianae byPn19F2. e Zoospore ventral vesicles (left) and surface of young cyst(right) of P. cinnamomi labelled with Pn19F2. f Labelling ofP. cinnamomi ventral vesicles by polyclonal antibodies raisedagainst KLH-PcVsv1 N-terminal peptide. g Labelling of ventralvesicles in P. cinnamomi zoospore with Vsv-1-Au15. h Diagramshowing ventral vesicles aligned along the ventral groove of aPhytophthora zoospore
309
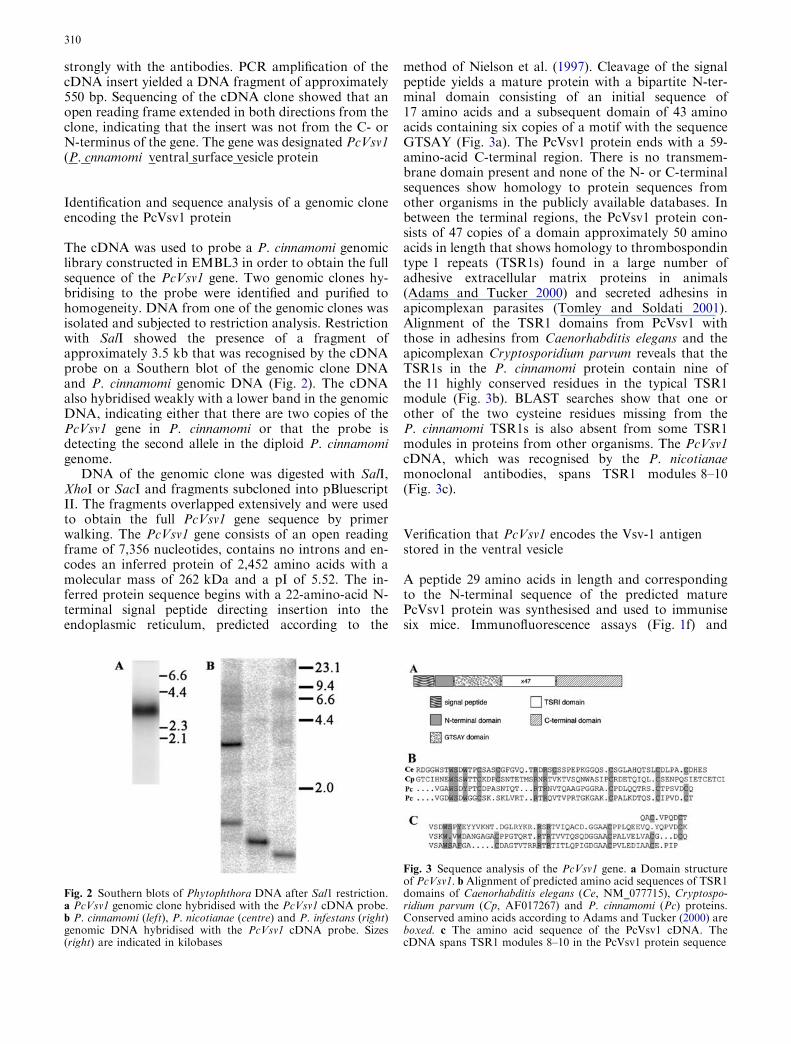
strongly with the antibodies. PCR amplification of thecDNA insert yielded a DNA fragment of approximately550 bp. Sequencing of the cDNA clone showed that anopen reading frame extended in both directions from theclone, indicating that the insert was not from the C- orN-terminus of the gene. The gene was designated PcVsv1(P. cnnamomi ventral surface vesicle protein
Identification and sequence analysis of a genomic cloneencoding the PcVsv1 protein
The cDNA was used to probe a P. cinnamomi genomiclibrary constructed in EMBL3 in order to obtain the fullsequence of the PcVsv1 gene. Two genomic clones hy-bridising to the probe were identified and purified tohomogeneity. DNA from one of the genomic clones wasisolated and subjected to restriction analysis. Restrictionwith SalI showed the presence of a fragment ofapproximately 3.5 kb that was recognised by the cDNAprobe on a Southern blot of the genomic clone DNAand P. cinnamomi genomic DNA (Fig. 2). The cDNAalso hybridised weakly with a lower band in the genomicDNA, indicating either that there are two copies of thePcVsv1 gene in P. cinnamomi or that the probe isdetecting the second allele in the diploid P. cinnamomigenome.
DNA of the genomic clone was digested with SalI,XhoI or SacI and fragments subcloned into pBluescriptII. The fragments overlapped extensively and were usedto obtain the full PcVsv1 gene sequence by primerwalking. The PcVsv1 gene consists of an open readingframe of 7,356 nucleotides, contains no introns and en-codes an inferred protein of 2,452 amino acids with amolecular mass of 262 kDa and a pI of 5.52. The in-ferred protein sequence begins with a 22-amino-acid N-terminal signal peptide directing insertion into theendoplasmic reticulum, predicted according to the
method of Nielson et al. (1997). Cleavage of the signalpeptide yields a mature protein with a bipartite N-ter-minal domain consisting of an initial sequence of17 amino acids and a subsequent domain of 43 aminoacids containing six copies of a motif with the sequenceGTSAY (Fig. 3a). The PcVsv1 protein ends with a 59-amino-acid C-terminal region. There is no transmem-brane domain present and none of the N- or C-terminalsequences show homology to protein sequences fromother organisms in the publicly available databases. Inbetween the terminal regions, the PcVsv1 protein con-sists of 47 copies of a domain approximately 50 aminoacids in length that shows homology to thrombospondintype 1 repeats (TSR1s) found in a large number ofadhesive extracellular matrix proteins in animals(Adams and Tucker 2000) and secreted adhesins inapicomplexan parasites (Tomley and Soldati 2001).Alignment of the TSR1 domains from PcVsv1 withthose in adhesins from Caenorhabditis elegans and theapicomplexan Cryptosporidium parvum reveals that theTSR1s in the P. cinnamomi protein contain nine ofthe 11 highly conserved residues in the typical TSR1module (Fig. 3b). BLAST searches show that one orother of the two cysteine residues missing from theP. cinnamomi TSR1s is also absent from some TSR1modules in proteins from other organisms. The PcVsv1cDNA, which was recognised by the P. nicotianaemonoclonal antibodies, spans TSR1 modules 8–10(Fig. 3c).
Verification that PcVsv1 encodes the Vsv-1 antigenstored in the ventral vesicle
A peptide 29 amino acids in length and correspondingto the N-terminal sequence of the predicted maturePcVsv1 protein was synthesised and used to immunisesix mice. Immunofluorescence assays (Fig. 1f) and
Fig. 2 Southern blots of Phytophthora DNA after Sal1 restriction.a PcVsv1 genomic clone hybridised with the PcVsv1 cDNA probe.b P. cinnamomi (left), P. nicotianae (centre) and P. infestans (right)genomic DNA hybridised with the PcVsv1 cDNA probe. Sizes(right) are indicated in kilobases
Fig. 3 Sequence analysis of the PcVsv1 gene. a Domain structureof PcVsv1. b Alignment of predicted amino acid sequences of TSR1domains of Caenorhabditis elegans (Ce, NM_077715), Cryptospo-ridium parvum (Cp, AF017267) and P. cinnamomi (Pc) proteins.Conserved amino acids according to Adams and Tucker (2000) areboxed. c The amino acid sequence of the PcVsv1 cDNA. ThecDNA spans TSR1 modules 8–10 in the PcVsv1 protein sequence
310
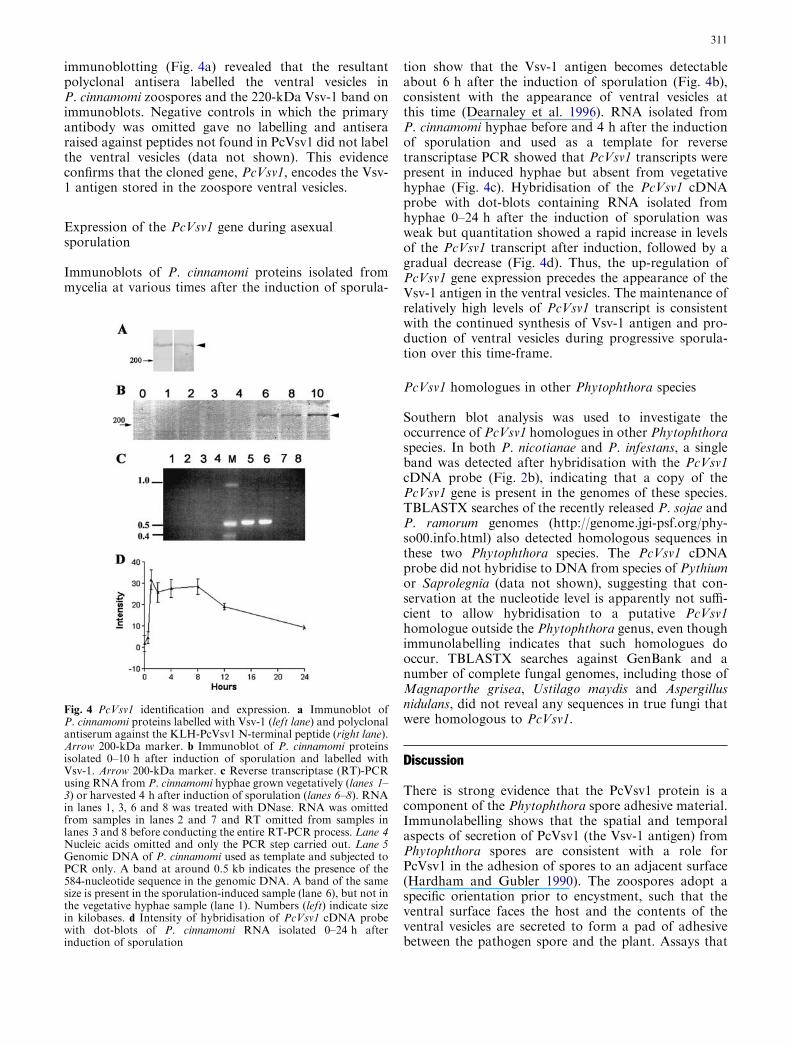
immunoblotting (Fig. 4a) revealed that the resultantpolyclonal antisera labelled the ventral vesicles inP. cinnamomi zoospores and the 220-kDa Vsv-1 band onimmunoblots. Negative controls in which the primaryantibody was omitted gave no labelling and antiseraraised against peptides not found in PcVsv1 did not labelthe ventral vesicles (data not shown). This evidenceconfirms that the cloned gene, PcVsv1, encodes the Vsv-1 antigen stored in the zoospore ventral vesicles.
Expression of the PcVsv1 gene during asexualsporulation
Immunoblots of P. cinnamomi proteins isolated frommycelia at various times after the induction of sporula-
tion show that the Vsv-1 antigen becomes detectableabout 6 h after the induction of sporulation (Fig. 4b),consistent with the appearance of ventral vesicles atthis time (Dearnaley et al. 1996). RNA isolated fromP. cinnamomi hyphae before and 4 h after the inductionof sporulation and used as a template for reversetranscriptase PCR showed that PcVsv1 transcripts werepresent in induced hyphae but absent from vegetativehyphae (Fig. 4c). Hybridisation of the PcVsv1 cDNAprobe with dot-blots containing RNA isolated fromhyphae 0–24 h after the induction of sporulation wasweak but quantitation showed a rapid increase in levelsof the PcVsv1 transcript after induction, followed by agradual decrease (Fig. 4d). Thus, the up-regulation ofPcVsv1 gene expression precedes the appearance of theVsv-1 antigen in the ventral vesicles. The maintenance ofrelatively high levels of PcVsv1 transcript is consistentwith the continued synthesis of Vsv-1 antigen and pro-duction of ventral vesicles during progressive sporula-tion over this time-frame.
PcVsv1 homologues in other Phytophthora species
Southern blot analysis was used to investigate theoccurrence of PcVsv1 homologues in other Phytophthoraspecies. In both P. nicotianae and P. infestans, a singleband was detected after hybridisation with the PcVsv1cDNA probe (Fig. 2b), indicating that a copy of thePcVsv1 gene is present in the genomes of these species.TBLASTX searches of the recently released P. sojae andP. ramorum genomes (http://genome.jgi-psf.org/phy-so00.info.html) also detected homologous sequences inthese two Phytophthora species. The PcVsv1 cDNAprobe did not hybridise to DNA from species of Pythiumor Saprolegnia (data not shown), suggesting that con-servation at the nucleotide level is apparently not suffi-cient to allow hybridisation to a putative PcVsv1homologue outside the Phytophthora genus, even thoughimmunolabelling indicates that such homologues dooccur. TBLASTX searches against GenBank and anumber of complete fungal genomes, including those ofMagnaporthe grisea, Ustilago maydis and Aspergillusnidulans, did not reveal any sequences in true fungi thatwere homologous to PcVsv1.
Discussion
There is strong evidence that the PcVsv1 protein is acomponent of the Phytophthora spore adhesive material.Immunolabelling shows that the spatial and temporalaspects of secretion of PcVsv1 (the Vsv-1 antigen) fromPhytophthora spores are consistent with a role forPcVsv1 in the adhesion of spores to an adjacent surface(Hardham and Gubler 1990). The zoospores adopt aspecific orientation prior to encystment, such that theventral surface faces the host and the contents of theventral vesicles are secreted to form a pad of adhesivebetween the pathogen spore and the plant. Assays that
Fig. 4 PcVsv1 identification and expression. a Immunoblot ofP. cinnamomi proteins labelled with Vsv-1 (left lane) and polyclonalantiserum against the KLH-PcVsv1 N-terminal peptide (right lane).Arrow 200-kDa marker. b Immunoblot of P. cinnamomi proteinsisolated 0–10 h after induction of sporulation and labelled withVsv-1. Arrow 200-kDa marker. c Reverse transcriptase (RT)-PCRusing RNA from P. cinnamomi hyphae grown vegetatively (lanes 1–3) or harvested 4 h after induction of sporulation (lanes 6–8). RNAin lanes 1, 3, 6 and 8 was treated with DNase. RNA was omittedfrom samples in lanes 2 and 7 and RT omitted from samples inlanes 3 and 8 before conducting the entire RT-PCR process. Lane 4Nucleic acids omitted and only the PCR step carried out. Lane 5Genomic DNA of P. cinnamomi used as template and subjected toPCR only. A band at around 0.5 kb indicates the presence of the584-nucleotide sequence in the genomic DNA. A band of the samesize is present in the sporulation-induced sample (lane 6), but not inthe vegetative hyphae sample (lane 1). Numbers (left) indicate sizein kilobases. d Intensity of hybridisation of PcVsv1 cDNA probewith dot-blots of P. cinnamomi RNA isolated 0–24 h afterinduction of sporulation
311
measure the adhesiveness of the spores show that thespores become sticky about 2 min after the induction ofencystment, concomitant with the timing of secretion ofthe ventral vesicle contents. Although the ventral vesi-cles may also contain other components involved inspore attachment, cloning and sequencing of the PcVsv1gene, as reported in the present study, reveals thatPcVsv1 contains multiple copies of a domain known toparticipate in cell attachment in animal cells and inmalarial parasites (Adams and Tucker 2000; Deng et al.2002; Tomley and Soldati 2001; Witcombe et al. 2003),namely the TSR1. Taken together, these data indicatethat the PcVsv1 protein is likely to be an adhesin thatplays an important role in the adhesion of Phytophthoraspores to the underlying surface.
The difference in the molecular masses of PcVsv1predicted from the inferred PcVsv1 sequence (260 kDa)and that measured in immunoblots (220 kDa) could bedue either to an undetected intron(s) in the PcVsv1genomic sequence or to inaccuracies in molecular massestimation from polyacrylamide gels, which occur espe-cially for large proteins. We consider the latter to be themore likely reason.
Comparison of PcVsv1 with TSR1-containing proteinsin animals and apicomplexans
In animals, proteins that contain TSR1 modules includethrombospondins, F-spondins, SCO-spondin andmembers of the semaphorin 5 family (Adams andTucker 2000; Tucker 2004). Many of the TSR1-con-taining proteins are components of the extracellularmatrix, are often expressed in the developing nervoussystem and have roles that include cell guidance,attachment and aggregation. In apicomplexan parasites,including species of Plasmodium, Cryptosporidium andEimeria, the TSR1-containing proteins are stored in andsecreted from apical microneme vesicles during the earlystages of host infection and mediate attachment to thehost cell (Naitza et al. 1998; Soldati et al. 2001; Tomleyand Soldati 2001). The TSR1 is just one of a number ofrepeated sequence modules in the animal and parasiticadhesive proteins; and it has been recognised as arisingbefore the evolutionary separation of nematodes andchordates (Adams and Tucker 2000). It contains anumber of highly conserved amino acid residues,including W8, S9, W11, C14, C18, R25, R27, C29, C41,C51 and C56 (Adams and Tucker 2000). These con-served amino acids are key components in three regionsof the TSR1 that have been shown to bind a variety ofglycoconjugates, including heparin and fibronectin (Guoet al. 1992; Sipes et al. 1993), and to function in celladhesion. These regions are the WSXW and CSVTCGmotifs (amino acids 14–19) and the basic residues thatlie downstream of the CSVTCG motif (including R25and R27). Comparison of the TSR1s in Phytophthoracinnamomi PcVsv1 reveals that PcVsv1 contains theWSXW motif (with variants) and the basic region
(including R25 and R27) in all 47 TSR1s, but only fourof the TSR1s contain the sequence CXXXCG, as aversion of the CSVTCG motif. All 47 PcVsv1 TSR1modules contain W8, while in ten modules W11 is re-placed by tyrosine and in five copies W11 is replaced byphenylalanine. Of the six conserved cysteine residues, allof the TSR1 modules in PcVsv1 lack C29 and all butfour lack C18. However, as illustrated in Fig. 3b, not allTSR1s in animal proteins contain all six cysteine resi-dues and C18 and C29 appear to be generally less highlyconserved than the other cysteines.
Phylogenetic distribution of PcVsv1 homologues
Southern blotting and BLAST searches demonstratethe presence of PcVsv1 homologues in P. nicotianae,P. infestans, P. sojae and P. ramorum. An EST withhomology to a thrombospondin-related adhesive hasalso been reported from P. sojae (Qutob et al. 2000).Immunolabelling with Vsv-1 monoclonal antibodyindicates that homologues of the PcVsv1 protein alsooccur in at least three other oomycete genera, namelyPythium (Cope et al. 1996), Plasmopara and Albugo,suggesting that the Vsv protein may be used in sporeattachment throughout the Oomycetes.
Outside the Oomycetes, the closest homologue ofPcVsv1 in GenBank is currently a TSR1-containing pro-tein from the apicomplexan malarial parasite, C. parvum(AA039046; Deng et al. 2002). This homology betweenPhytophthora and apicomplexan adhesives draws atten-tion to other similarities, both molecular and structural,between Phytophthora zoospores and apicomplexanzoites. Our understanding of protist phylogeny hasdeveloped extensively in recent years and the novelassemblages that have emerged through a redefinition ofthe boundaries between the major eukaryotic groups in-clude the stramenopiles (incorporating the Oomycetes)and the alveolates (incorporating the Apicomplexa).These groups are characterised by the possession of tri-partite tubular hairs and flattened membranous alveoli,respectively (Patterson and Sogin 1992; Van de Peer et al.1996). Connections between these two groups based ontraditional ultrastructural analyses have been limited (e.g.possession of tubular cristae in mitochondria; Pattersonand Sogin 1992). However, the recognition of phyloge-netic affinities has been strengthened by comparisons ofrRNA sequence data (Van de Peer et al. 1996; Van de Peerand De Wachter 1997). The new information on thePhytophthoraTSR1-containing putative adhesive proteinspotlights common features in infection strategies of thesetwo parasitic groups. In both, onset of infection ismarkedby rapid, regulated secretion of adhesive-containing ves-icles from a localised region of the pathogen aligned toface the host (Hardham and Gubler 1990; Joiner andRoos 2002). InPhytophthora, adhesive-containing ventralvesicles are confined to the ventral surface (Hardham andGubler 1990). In apicomplexans, adhesin-containing mi-cronemes are part of the apical complex that gives rise to
312

the name of the group (Tomley and Soldati 2001).Remarkably, the cortical region at which secretion occursis, in both cases, free of an underlying system of flattenedmembranes—the taxon-defining alveoli in the apicom-plexans (typically called the inner membrane complex)and the zoospore peripheral cisternae in Phytophthoraand related Oomycetes.
Microneme proteins characterised to date have 1–16 copies of the TSR1 domain and other motifs associ-ated with cell–cell or cell–matrix adhesion (Deng et al.2002; Tomley and Soldati 2001; Witcombe et al. 2003).PcVsv1 lacks other known adhesive motifs but, with47 copies, it has the largest number of TSR1 domainsreported to date. Recent studies of microneme contentsrevealed the presence of auxiliary proteins, includingchaperones (Brydges et al. 2000), escorters (Meissneret al. 2002; Reiss et al. 2001) and proteases (Opitz et al.2002). Future investigations of the protein complementof Phytophthora ventral vesicles may reveal the presenceof similar processing enzymes, characterisation of whichwill help elucidate the molecular mechanism underlyingPcVsv1 function. Analysis of these secreted proteins mayalso yield the first information on targeting motifs foroomycete proteins.
Fungal and oomycete adhesives
Fungal pathogens of animals and plants are likely to usea spectrum of adhesive molecules to attach to theirhosts. Some molecules (e.g. hydrophobins; Tucker andTalbot 2001) mediate non-specific binding to the adja-cent substratum, such as the hydrophobic interactionsdisplayed by a range of fungi and Oomycetes (Apogaet al. 2001; Doyle 2000; Gubler et al. 1989; Mercureet al. 1994; Wright et al. 2002b). Other adhesive mole-cules bind to specific ligands associated with the hostsurface. A number of the genes cloned from pathogenicyeasts, for example, recognise and bind to RGD-con-taining proteins on the animal cell surface (Hostetter2000). There is some evidence that RGD-binding adhe-sive molecules also exist in fungal phytopathogens(Correa et al. 1996), but as yet genes encoding these orany other fungal adhesive molecules have not beencloned. Indeed, our understanding of the adhesives ofphytopathogenic fungi remains limited largely toobservations of the site of storage of adhesive material inconidia, the timing of adhesive secretion and the glyco-protein nature of some adhesives (Hamer et al. 1988;Hughes et al. 1999; Kwon and Epstein 1993; Tucker andTalbot 2001; Wright et al. 2002a). It is clear that theextracellular matrix material secreted by fungal conidiacontains many different components, as exemplified bysurface iodination experiments in Bipolaris sorokinianawhich revealed about 40 labelled proteins (Apoga et al.2001) and by the demonstration of esterases that digestcutin and alter the properties of the host surface (Deisinget al. 1992; Gevens et al. 2001). This heterogeneityhampers the identification of fungal adhesins.
A gene encoding a 34-kDa glycoprotein, CBEL, thatis expressed in hyphae and binds to cellulose fibresand cellulose in plant cell walls, has been cloned fromP. nicotianae (Mateos et al. 1997) but silencing this genedoes not affect pathogenicity (Gaulin et al. 2002) and itsrole in pathogen attachment to host plants remains to bedetermined. PcVsv1 is one component of the adhesivematerial stored in and secreted from Phytophthora ven-tral vesicles during spore attachment and the presence ofmultiple copies of the TSR1 adhesive motif suggest thatPcVsv1 is a Phytophthora spore adhesin. As such,PcVsv1 would be the first gene encoding a spore adhe-sive to be cloned from a fungal or oomycete plantpathogen. In future studies, confirmation of the role ofPcVsv1 in spore attachment and its ligand specificitymay be achieved through biochemical studies thatdemonstrate the specific inhibition of adhesion byPcVsv1-directed antibodies, peptides or other ligands orthrough transformation and a gene-silencing approach.A better understanding of the molecular basis of adhe-sion in Phytophthora may provide a foundation for thedevelopment of much-needed novel controls of Phy-tophthora diseases.
Acknowledgements We thank V. Maclean and J. Elliott forexcellent technical assistance, L. Blackman for Fig. 4a, F. Gublerfor Fig. 1g and L. Lange for the production of Plasmoparazoospores.
References
Adams JC, Tucker RP (2000) The thrombospondin type 1 repeat(TSR) superfamily: diverse proteins with related roles in neu-ronal development. Dev Dyn 218:280–299
Apoga D, Jansson H-B, Tunlid A (2001) Adhesion of conidia andgermlings of the plant pathogenic fungus Bipolaris sorokinianato solid surfaces. Mycol Res 105:1251–1260
Boyle EC, Finlay BB (2003) Bacterial pathogenesis: exploitingcellular adherence. Curr Opin Cell Biol 15:633–639
Brandhorst TT, Wuthrich M, Warner T, Klein B (1999) Targetedgene disruption reveals an adhesin indispensable for pathoge-nicity of Blastomyces dermatitidis. J Exp Med 189:1207–1216
Brydges SD, Sherman GD, Nockemann S, Loyens A, Daubener W,Dubremetz J-F, Carruthers VB (2000) Molecular characteriza-tion of TgMIC5, a proteolytically processed antigen secretedfrom the micronemes of Toxoplasma gondii. Mol BiochemParasitol 111:51–66
Cope M, Webb MC, O’Gara ET, Philip BA, Hardham AR (1996)Immunocytochemical comparison of peripheral vesicles inzoospores of Phytophthora and Pythium species. Mycologia88:523–532
Correa A Jr, Staples RC, Hoch HC (1996) Inhibition of thigm-ostimulated cell differentiation with RGD-peptides in Uromycesgermlings. Protoplasma 194:91–102
Cotter G, Kavanagh K (2000) Adherence mechanisms of Candidaalbicans. Br J Biomed Sci 57:241–249
Dearnaley JDW, Maleszka J, Hardham AR (1996) Synthesis ofzoospore peripheral vesicles during sporulation of Phytophthoracinnamomi. Mycol Res 100:39–48
Deising H, Nicholson RL, Haug M, Howard RJ, Mendgen K(1992) Adhesion pad formation and the involvement of cutinaseand esterases in the attachment of uredospores to the hostcuticle. Plant Cell 4:1101–1111
313
Deng MQ, Templeton TJ, London NR, Bauer C, Schroeder AA,Abrahamsen MS (2002) Cryptosporidium parvum genes con-taining thrombospondin type 1 domains. Infect Immun70:6987–6995
Dick MW (1990) Phylum Oomycota. In: Margulis L, Corliss JO,Melkonian M, Chapman DJ (eds) Handbook of protoctista.Jones and Bartlett, Boston, pp 661–685
Doyle RJ (2000) Contribution of the hydrophobic effect tomicrobial infection. Microbes Infect 2:391–400
Epstein L, Nicholson RL (1997) Adhesion of spores and hyphae toplant surfaces. In: Carroll G, Tudzynski P (eds) The mycota Vpart A plant relationships. Springer, Berlin Heidelberg NewYork, pp 11–25
Erwin DC, Ribeiro OK (1996) Phytophthora diseases worldwide.APS, St. Paul, p. 562
Fry WE, Goodwin SB (1997) Re-emergence of potato and tomatolate blight in the United States. Plant Dis 81:1349–1357
Gale CA, Bendel CM, McClellan M, Hauser M, Becker JM, Ber-man J, Hostetter MK (1998) Linkage of adhesion, filamentousgrowth, and virulence in Candida albicans to a single gene,INT1. Science 279:1355–1358
Gaulin E, Jauneau A, Villalba F, Rickauer M, Esquerre-TugayeMT, Bottin A (2002) The CBEL glycoprotein of Phytophthoraparasitica var. nicotianae is involved in cell wall deposition andadhesion to cellulosic substrates. J Cell Sci 115:4565–4575
Gevens AJ, Carver TLW, Thomas BJ, Nicholson RL (2001)Visualization and partial characterization of the ECM ofPestalotia malicola on artificial and natural substrata. PhysiolMol Plant Pathol 58:277–285
Govers F (2001) Misclassification of pest as ’fungus’ puts vitalresearch on wrong track. Nature 411:633
Gubler F, Hardham AR, Duniec J (1989) Characterising adhe-siveness of Phytophthora cinnamomi zoospores during encyst-ment. Protoplasma 149:24–30
Gunderson JH, Elwood H, Ingold A, Kindle K, Sogin ML (1987)Phylogenetic relationships between chlorophytes, chrysophytes,and oomycetes. Proc Natl Acad Sci USA 84:5823–5827
Guo N-H, Krutzsch HC, Negre E, Zabrenetzky VS, Roberts DD(1992) Heparin-binding peptides from the type I repeats ofthrombospondin. Structural requirements for heparin bindingand promotion of melanoma cell adhesion and chemotaxis.J Biol Chem 267:19349–19355
Hamer JE, Howard RJ, Chumley FG, Valent B (1988) A mecha-nism for surface attachment in spores of a plant pathogenicfungus. Science 239:288–290
Hardham AR (2001) Cell biology of fungal infection of plants. In:Howard RJ, Gow NAR (eds) The Mycota: biology of thefungal cell, vol 7. Springer, Berlin Heidelberg New York, pp 91–123
Hardham AR, Gubler F (1990) Polarity of attachment of zoosp-ores of a root pathogen and pre-alignment of the emerging germtube. Cell Biol Int Rep 14:947–956
Hardham AR, Gubler F, Duniec J, Elliott J (1991) A review ofmethods for the production and use of monoclonal antibodiesto study zoosporic plant pathogens. J Microsc 162:305–318
Hardham AR, Cahill DM, Cope M, Gabor BK, Gubler F, HydeGJ (1994) Cell surface antigens of Phytophthora spores: bio-logical and taxonomic characterization. Protoplasma 181:213–232
Hostetter MK (2000) RGD-mediated adhesion in fungal pathogensof humans, plants and insects. Curr Opin Microbiol 3:344–348
Hughes HB, Carzaniga R, Rawlings SL, Green JR, O’Connell RJ(1999) Spore surface glycoproteins of Colletotrichum lindemu-thianum are recognized by a monoclonal antibody whichinhibits adhesion to polystyrene. Microbiology 145:1927–1936
Huynh M-H, Rabenau KE, Harper JM, Beatty WL, Sibley LD,Carruthers VB (2003) Rapid invasion of host cells by Toxo-plasma requires secretion of the MIC2-M2AP adhesive proteincomplex. EMBO J 22:2082–2090
Joiner KA, Roos DS (2002) Secretory traffic in the eukaryoticparasite Toxoplasma gondii: less is more. J Cell Biol 157:557–563
Jones MJ, Epstein L (1990) Adhesion of macroconidia to the plantsurface and virulence of Nectria haematococca. Appl EnvironMicrobiol 56:3772–3778
Klein BS (2000) Molecular basis of pathogenicity in Blastomycesdermatitidis: the importance of adhesion. Curr Opin Microbiol3:339–343
Kwon YH, Epstein L (1993) A 90-kDa glycoprotein associatedwith adhesion of Nectria haematococca macroconidia to sub-strata. Mol Plant Microbe Interact 6:481–487
Marshall JS, Wilkinson JM, Moore T, Hardham AR (2001)Structure and expression of the genes encoding proteins residentin large peripheral vesicles of Phytophthora cinnamomi zoosp-ores. Protoplasma 215:226–239
Mateos FV, Rickauer M, Esquerre-Tugaye MT (1997) Cloning andcharacterization of a cDNA encoding an elicitor ofPhytophthoraparasitica var. nicotianae that shows cellulose- binding and lectin-like activities. Mol Plant Microbe Interact 10:1045–1053
MeissnerM, ReissM, Viebig N, Carruthers VB, Toursel C, TomavoS, Ajioka JW, Soldati D (2002) A family of transmembrane mi-croneme proteins of Toxoplasma gondii contain EGF-like do-mains and function as escorters. J Cell Sci 115:563–574
Mercure EW, Leite B, Nicholson RL (1994) Adhesion of unger-minated conidia of Colletotrichum graminicola to artificialhydrophobic surfaces. Physiol Mol Plant Pathol 45:421–440
Mitchell HJ, Hardham AR (1999) Characterisation of the waterexpulsion vacuole in Phytophthora nicotianae zoospores. Pro-toplasma 206:118–130
Naitza S, Spano F, Robson KJH, Crisanti A (1998) The throm-bospondin-related protein family of apicomplexan parasites:the gears of the cell invasion machinery. Parasitol Today14:479–484
Nielsen H, Engelbrecht J, Brunak S, Heijne G von (1997) Identi-fication of prokaryotic and eukaryotic signal peptides andprediction of their cleavage sites. Protein Eng 10:1–6
Opitz C, Di Cristina M, Reiss M, Ruppert T, Crisanti A, Soldati D(2002) Intramembrane cleavage of microneme proteins at thesurface of the apicomplexan parasite Toxoplasma gondii.EMBO J 21:1577–1585
Patterson DJ, Sogin ML (1992) Eukaryote origins and protistandiversity. In: Hartman H, Matsuno K (eds) The origin andevolution of the cell. World Scientific, Singapore, pp 13–46
Qutob D, Hraber PT, Sobral BWS, Gijzen M (2000) Comparativeanalysis of expressed sequences in Phytophthora sojae. PlantPhysiol 123:243–253
Reiss M, Viebig N, Brecht S, Fourmaux M-N, Soete M, Di CristinaM, Dubremetz JF, Soldati D (2001) Identification and charac-terization of an escorter for two secretory adhesins in Toxo-plasma gondii. J Cell Biol 152:563–578
Robold AV, Hardham AR (2004) Production of monoclonalantibodies against peripheral vesicle proteins in zoospores ofPhytophthora nicotianae. Protoplasma 223:121–132
Schiermeier Q (2001) Russia needs help to fend off potato famine,researchers warn. Nature 410:1011
Schwinn F, Staub T (1995) Phenylamides and other fungicidesagainst Oomycetes. In: Lyr H (ed) Modern selective fungi-cides—properties, applications, mechanisms of action. Fischer,Jena, pp 323–346
Shaw BD, Hoch HC (2001) Ions as regulators of growth anddevelopment. In: Howard RJ, Gow NAR (eds) Mycota VIII:biology of the fungal cell. Springer, Berlin Heidelberg NewYork, pp 73–89
Sipes JM, Guo N-H, Negre E, Vogel T, Krutzsch HC, Roberts DD(1993) Inhibition of fibronectin binding and fibronectin-medi-ated cell adhesion to collagen by a peptide from the second type1 repeat of thrombospondin. J Cell Biol 121:469–477
Soldati D, Dubremetz JF, Lebrun M (2001) Microneme proteins:structural and functional requirements to promote adhesionand invasion by the apicomplexan parasite Toxoplasma gondii.Int J Parasitol 31:1293–1302
Staab JF, Bradway SD, Fidel PL, Sundstrom P (1999) Adhesiveand mammalian transglutaminase substrate properties of Can-dida albicans Hwp1. Science 283:1535–1538
314
Stanley MS, Callow ME, Perry R, Alberte RS, Smith R, Callow JA(2002) Inhibition of fungal spore adhesion by zosteric acid asthe basis for a novel, nontoxic crop protection technology.Phytopathology 92:378–383
Sundstrom P (2002) Adhesion in Candida spp. Cell Microbiol4:461–469
Timmer LW, Graham JH, Zitko SE (1998) Metalaxyl-resistantisolates of Phytophthora nicotianae: occurrence, sensitivity, andcompetitive parasitic ability on citrus. Plant Dis 82:254–261
Tomley FM, Soldati DS (2001) Mix and match modules: structureand function of microneme proteins in apicomplexan parasites.Trends Parasitol 17:81–88
Tucker RP (2004) Molecules in focus. The thrombospondin type 1repeat superfamily. Int J Biochem Cell Biol 36:969–974
Tucker SL, Talbot NJ (2001) Surface attachment and pre-pene-tration stage development by plant pathogenic fungi. Annu RevPhytopathol 39:385–417
Van de Peer Y, De Wachter R (1997) Evolutionary relationshipsamong the eukaryotic crown taxa taking into account site-to-site rate variation in 18S rRNA. J Mol Evol 45:619–630
Van de Peer Y, Van der Auwera G, De Wachter R (1996) Theevolution of stramenopiles and alveolates as derived by ‘‘sub-stitution rate calibration’’ of small ribosomal subunit RNA.J Mol Evol 42:201–210
Weerakoon ND, Roberts JK, Lehnen LP, Wilkinson JM, MarshallJS, Hardham AR (1998) Isolation and characterization of thesingle b-tubulin gene in Phytophthora cinnamomi. Mycologia90:85–95
Witcombe DA, Belli SI, Wallach MG, Smith NC (2003) Molecularcharacterisation of EmTFP250: a novel member of the TRAPprotein family in Eimeria maxima. Int J Parasitol 33:691–702
Wright AJ, Thomas BJ, Carver TLW (2002a) Early adhesion ofBlumeria graminis to plant and artificial surfaces demonstratedby centrifugation. Physiol Mol Plant Pathol 61:217–226
Wright AJ, Thomas BJ, Kunoh H, Nicholson RL, Carver TLW(2002b) Influences of substrata and interface geometry on therelease of extracellular material by Blumeria graminis conidia.Physiol Mol Plant Pathol 61:163–178
315
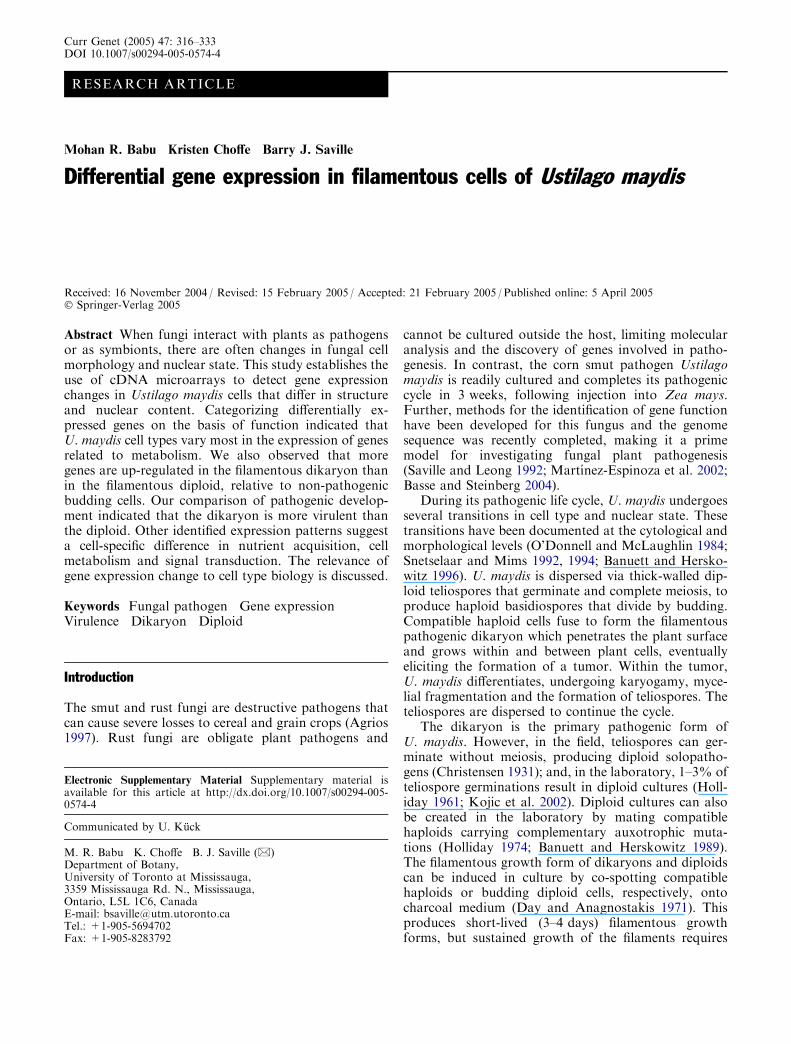
RESEARCH ARTICLE
Mohan R. Babu Æ Kristen Choffe Æ Barry J. Saville
Differential gene expression in filamentous cells of Ustilago maydis
Received: 16 November 2004 / Revised: 15 February 2005 / Accepted: 21 February 2005 / Published online: 5 April 2005� Springer-Verlag 2005
Abstract When fungi interact with plants as pathogensor as symbionts, there are often changes in fungal cellmorphology and nuclear state. This study establishes theuse of cDNA microarrays to detect gene expressionchanges in Ustilago maydis cells that differ in structureand nuclear content. Categorizing differentially ex-pressed genes on the basis of function indicated thatU. maydis cell types vary most in the expression of genesrelated to metabolism. We also observed that moregenes are up-regulated in the filamentous dikaryon thanin the filamentous diploid, relative to non-pathogenicbudding cells. Our comparison of pathogenic develop-ment indicated that the dikaryon is more virulent thanthe diploid. Other identified expression patterns suggesta cell-specific difference in nutrient acquisition, cellmetabolism and signal transduction. The relevance ofgene expression change to cell type biology is discussed.
Keywords Fungal pathogen Æ Gene expression ÆVirulence Æ Dikaryon Æ Diploid
Introduction
The smut and rust fungi are destructive pathogens thatcan cause severe losses to cereal and grain crops (Agrios1997). Rust fungi are obligate plant pathogens and
cannot be cultured outside the host, limiting molecularanalysis and the discovery of genes involved in patho-genesis. In contrast, the corn smut pathogen Ustilagomaydis is readily cultured and completes its pathogeniccycle in 3 weeks, following injection into Zea mays.Further, methods for the identification of gene functionhave been developed for this fungus and the genomesequence was recently completed, making it a primemodel for investigating fungal plant pathogenesis(Saville and Leong 1992; Martınez-Espinoza et al. 2002;Basse and Steinberg 2004).
During its pathogenic life cycle, U. maydis undergoesseveral transitions in cell type and nuclear state. Thesetransitions have been documented at the cytological andmorphological levels (O’Donnell and McLaughlin 1984;Snetselaar and Mims 1992, 1994; Banuett and Hersko-witz 1996). U. maydis is dispersed via thick-walled dip-loid teliospores that germinate and complete meiosis, toproduce haploid basidiospores that divide by budding.Compatible haploid cells fuse to form the filamentouspathogenic dikaryon which penetrates the plant surfaceand grows within and between plant cells, eventuallyeliciting the formation of a tumor. Within the tumor,U. maydis differentiates, undergoing karyogamy, myce-lial fragmentation and the formation of teliospores. Theteliospores are dispersed to continue the cycle.
The dikaryon is the primary pathogenic form ofU. maydis. However, in the field, teliospores can ger-minate without meiosis, producing diploid solopatho-gens (Christensen 1931); and, in the laboratory, 1–3% ofteliospore germinations result in diploid cultures (Holl-iday 1961; Kojic et al. 2002). Diploid cultures can alsobe created in the laboratory by mating compatiblehaploids carrying complementary auxotrophic muta-tions (Holliday 1974; Banuett and Herskowitz 1989).The filamentous growth form of dikaryons and diploidscan be induced in culture by co-spotting compatiblehaploids or budding diploid cells, respectively, ontocharcoal medium (Day and Anagnostakis 1971). Thisproduces short-lived (3–4 days) filamentous growthforms, but sustained growth of the filaments requires
Electronic Supplementary Material Supplementary material isavailable for this article at http://dx.doi.org/10.1007/s00294-005-0574-4
Communicated by U. Kuck
M. R. Babu Æ K. Choffe Æ B. J. Saville (&)Department of Botany,University of Toronto at Mississauga,3359 Mississauga Rd. N., Mississauga,Ontario, L5L 1C6, CanadaE-mail: [email protected].: +1-905-5694702Fax: +1-905-8283792
Curr Genet (2005) 47: 316–333DOI 10.1007/s00294-005-0574-4
growth in the host plant. The ability to stimulate fila-mentous growth of the dikaryon and diploid allows us toassess gene expression levels in axenic cultures of thesetwo pathogenic growth forms.
We are interested in identifying genes that are dif-ferentially expressed in cell types of the U. maydispathogenic cycle. cDNA microarrays allow expressionlevel determination of a large number of genes simul-taneously. They have been used to assess variation ingene expression resulting from filamentous growth,infection-related morphogenesis, an alteration in nutri-tional state or an alteration in glucose metabolism innon-smut fungi (Chambergo et al. 2002; Chigira et al.2002; Aign and Hoheisel 2003; Takano et al. 2003; Simset al. 2004). We created U. maydis cDNA libraries fromthe filamentous diploid and the germinating teliospore,sequenced them to create expressed sequence tag (EST)libraries (Sacadura and Saville 2003; Nugent et al. 2004)and combined them for comparative genomics analyses(Austin et al. 2004). A subset of the analyzed cDNAswas selected for the construction of microarrays andthese were used in hybridizations comparing geneexpression among cultured U. maydis cells with differentgrowth forms (filaments, budding cells) and/or nuclearstates (diploid, dikaryon, combined haploids). Detecteddifferences in gene expression may reflect differences innutrient acquisition, metabolism and signal transduc-tion. We also observed differences in gene expressionbetween filamentous diploids and dikaryons that corre-late with differences in virulence between these cell types.The data presented provides information for use inU. maydis genome annotation and identifies areas ofinvestigation that will increase knowledge of pathogenicdevelopment.
Materials and methods
Strains and media
U. maydis haploid strains FB1 (a1b1) and FB2 (a2b2)and diploid strain FBD12 (a1a2b1b2) were obtainedfrom F. Banuett (Banuett and Herskowitz 1989). Bud-ding cultures were grown on double complete medium(DCM) plates and on DCM plates with charcoal (Holl-iday 1974). Dikaryons of FB1·FB2 and filamentousdiploids (FBD12) were derived by co-spotting overnighthaploid cultures or spotting overnight diploid cultureson DCM plates with charcoal (Day and Anagnostakis1971; Holliday 1974; Banuett and Herskowitz 1989),followed by incubation at 28�C for 3 days.
Plant growth, fungal growth and inoculation
Golden Bantam corn plants (Ontario Seed Co., Water-loo, Ontario) were grown in Conviron CMP 4030 growthchambers (Conviron, Manitoba) at 70% relativehumidity with a day/night regime of 18 h light at 30�C
followed by 6 h dark at 25�C. For corn plant inocula-tions, FB1, FB2 and FBD12 were separately cultured in100 ml YEPS broth (1% yeast extract, 2% peptone, 2%sucrose) shaking at 250 rpm for 24 h at 28�C. Culturedcells were collected by centrifugation at 1,600 g, washedtwice with sterile distilled water (sdH20) and suspended in100 ml sdH20. Equal numbers of haploid cells were mixed(1:1, FB1:FB2) at a concentration of 106 cells/ml prior toinoculation; and approximately 0.5 ml mixture was in-jected at the base of 7-day-old seedlings, using a 1-mlsyringe with a 18 GI needle (Becton–Dickinson, FranklinLakes, N.J.). Diploid cells (FBD12) were also adjusted toa final concentration of 106 cells/ml and inoculated intothe stem base of each seedling. The inoculation andscoring of disease symptoms were carried out using themethod of Gold et al. (1997). Observations of diseasesymptoms were recorded at 7, 10, 14, 20 and 24 dayspost-inoculation (dpi) on a 0–5 scale. Experiments toanalyze pathogenicity were carried out three times.
Sequence analysis and selection of clones for spotting
Sequences from the filamentous diploid (FBD12;Nugent et al. 2004) and germinating teliospore (T11;Sacadura and Saville 2003) EST libraries were combinedand assembled into uniESTs, using the SeqManIImodule of Lasergene ver. 5.0 software (DNA STAR,Madison, Wis.). The consensus sequences from eachuniEST were used in BLASTX searches of the NCBInon-redundant database, using RunHtblast (http://www.ocgc.on.ca/runhtblast.htm) and an in-house batchBLAST script (R. Austin, Department of Botany, Uni-versity of Toronto). UniESTs with identical BLAST hitswere combined and the resulting 3,918 uniESTs wereused in the selection of 754 cDNA clones for spotting.These clones were selected to represent genes identifiedin each library: 244 specific to the teliospore library, 265specific to the filamentous diploid library and 245 genespresent in both libraries. Among the 754 clones were 255with sequences similar to uncharacterized genes orwithout BLAST similarity and 499 with sequences sim-ilar to previously characterized genes.
Bacterial growth conditions and plasmid miniprep
The bacterial cultures were grown in 96-well round-bottom polypropylene plates (model 1-63320; NalgeNunc International, Rochester, N.Y.) at 37�C, 250 rpmin a shaking incubator (Lab Line Instrument, Ill.) for aperiod of 16–18 h. Plasmid DNA from cDNA cloneswas extracted from the bacterial cultures by alkalinelysis and purified using 96-well glass-fiber GF/B filterplates (model 7700-3303; Whatmann, Ann Arbor,Mich.), following the manufacturer’s suggested proto-col. The plasmid DNAs were stored at �20�C in 96-wellplates, sealed with foil (model 538919; Beckman CoulterCanada, Mississauga, Ontario).
317
PCR amplification, purification and quantification
The primers for amplifying inserts in pSPORT1 (Invi-trogen; FBD12 library) were 5¢-CCCAGTCAC-GACGTTGTAAAACG-3¢ and 5¢-AGCGGATAACA-ATTTCACACAGG-3¢; and inserts in pDNR-LIB(Clontech; T11 library) were amplified with 5¢-GTAAA-ACGACGGCCAGT-3¢ and 5¢-AAACAGCTATGAC-CATGTTCA-3¢ (Qiagen Operon). Amplifications ofplasmid DNA were performed in 96-well plates (model0030 127.420; Eppendorf Scientific, Westbury, N.Y.) in aGeneAmp 9700 thermocycler (Applied Biosystems,Foster City, Calif.). The 100-ll reaction mixture con-tained 1· reaction buffer (10 mM Tris-HCl, pH 8.3,50 mM KCl), 3 mM MgCl2, 0.2 mmol dNTPs (Pro-mega), 0.25 lmol each primer, Taq polymerase and200 ng respective plasmid DNA as template. Thermalcycling parameters were optimized, based on the esti-mated average amplicon size of the cDNA clone in eachlibrary. The pSPORT1 clones were amplified usingtouch-down PCR, in which the annealing temperaturewas lowered by 2�C per cycle for the first five cycles.Cycling conditions for pSPORT1 were 94�C for 2.0 min,5 cycles of 94�C for 45 s, 70�C for 1.0 min and 72�C for3.5 min, then 35 cycles of 94�C for 45 s, 60�C for 1.0 minand 72�C for 3.5 min, followed by a 72�C hold for5.0 min. When amplifying the cDNA inserts frompDNR-LIB clones, the conditions were 95�C for 30 s,followed by 35 cycles of 94�C for 30 s and 68�C for3.0 min followed by 72�C hold for 5.0 min.
Prior to printing, all amplified products were purifiedusing 96-well glass-fiber GF/B filter plates (model 7700-3303; Whatmann), following the manufacturer’s sug-gested protocol. The purified PCR products wereresuspended in 140 ll TE buffer (100 mM Tris, 1 mMEDTA, pH 8.0) in 96-well polypropylene collectionplates (modle 267245A; Nunc). The plates were thensealed using foil (modle 538919; Beckman CoulterCanada) and stored at �20�C for future arrays.
The DNA concentration was determined by mea-suring the fluorescence signal at 460 nm, using a Flu-oromark microplate fluorimeter (Bio-Rad Laboratories,Mississauga, Ontario). For each clone, a 1-ll aliquot ofpurified DNA was mixed with 99 ll Hoechst-33342 dye(25 ng/ml) in 96-well black polystyrene plates (model655076; Greiner Bio-One, Longwood, Fla.) beforemeasurements were taken.
Microarray spotting
Purified DNA samples were lyophilized in 384-wellUniplates (model 7701-5101; Whatmann), using a Sa-vant UCS-200 SpeedVac (MPTR8-10 rotor; ThermoSavant, Holbrook, N.Y.). Samples were resuspended in3· SSC (450 mM sodium chloride, 45 mM sodium cit-rate) and spotted in duplicate at a concentration of200 ng/ll on aminosilane-coated CMT-GAP II slides(Corning Life Sciences, Acton, Mass.), using a Spot
Array 72 arrayer (Packard Biosciences, Boston, Mass.)equipped with 16 SMP3 microspotting stealth pins(TeleChem International, Sunnyvale, Calif.), producinga nominal spot diameter of 125 lm. The microarraycontained 16 subarrays, each with 24 columns and sixrows, for a total of 2,304 spots. cDNAs of housekeepinggenes were included as positive controls for normalizingthe microarray data. As negative controls, DrosophilaDNA (obtained from the Drosophilla Microarray Cen-tre, Mississauga, Ontario), k phage DNA (N3012S, NewEngland Biolabs, Beverly, Mass.) and spotting bufferwere included on the array. A microarray sample pool(MSP) titration series was also used as a positive controlon each array. The MSP titration series was generatedby transferring 10 ll from each of the 754 purified DNAsamples into a single tube and serially diluting thismixture, resulting in 200, 100, 50 or 25 ng/spot. Themicroarrays included cDNAs that represented 18 genespreviously characterized in U. maydis. Expression dataon four of these genes allowed some comparisonbetween our hybridization results and previous studies.
After spotting, the slides were dried at 80�C on ametal temperature block for 2 min (model 13259-058;VWR International, Mississauga, Ontario) and UV-crosslinked using a CL1000 ultraviolet crosslinker(UVP, Upland, Calif.) with a total intensity of 300 mJ.Slides were blocked with freshly prepared solution(M2P; Fisher Scientific Canada, Ottawa, Ontario) in astainless steel slide carrier (model 25461-032; WheatonScientific Products, Millville, N.J.), according to theprotocol of Neal et al. (2003) before being stored, pro-tected from light exposure, in a slide box with dry silicagel at room temperature.
RNA isolation
Independent isolation of total RNA was carried out witheachU.maydis cell type.We also isolated total RNA fromleaf and stem tumors (2 g each) from infected and mock-infected maize tissue at 7 dpi and 12 dpi. All isolationswere carried using the TRIzol reagent and the manufac-turer’s suggested protocol. The quality of eachRNA sample was confirmed by agarose gel electropho-resis, following glyoxal denaturation (Sambrook andRussell 2001). The concentration of the total RNAwas determined by spectrophotometer (model DU64;Beckman).
cDNA labeling and microarray hybridization
Each microarray hybridization experiment included fivebiological replicates, one of which was a dye-reversal. Thecell type comparisons are listed in Table 1. First-strandcDNA was synthesized from 40 lg total RNA in afinal volume of 40 ll containing 1· first-strand buffer(Invitrogen), 150 pmol Oligo dT20VN primer (SigmaGenosys), 500 lmol (each) dATP, dGTP and dTTP(Amersham Biosciences), 50 lM dCTP (Amersham Bio-
318

sciences), 10 mM dithiothreitol and 25 lMCy3- or Cy5-dCTP (AmershamBiosciences). The labelingmixture wasincubated at 65�C for 5 min, 42�C for 5 min and then400 units SuperScript II reverse transcriptase (Invitrogen)were added and incubationwas continued at 42�C for 3 h.The reactions were stopped by the addition of 5 ll EDTA(50 mM). The RNA was hydrolyzed by adding 4 llNaOH (5 N), followed by incubation at 65�C for 10 min.After neutralization with 4 ll acetic acid (5 M), the la-beled reference (control) cDNA and target (evaluated)cDNAwere pooled, precipitated with an equal volume ofice-cold isopropanol and incubated at�20�C for 30 min.The cDNA was then pelleted at 20,800 g (Eppendorfcentrifuge 5417C; Brinkmann Instrument, Mississauga,Ontario) for 30 min, washed twice with 200 ll ethanol(70%) and resuspended in 5 ll 18 MO water (7732-8-5;Sigma Aldrich).
The labeled cDNA was diluted in 75 ll hybridizationsolution [DIG EasyHyb (Hoffman–La Roche), yeasttRNA (10 mg/ml, Invitrogen), salmon sperm DNA(10 mg/ml, Invitrogen), at 20:1:1], denatured at 65�C for10 min, centrifuged at 20,800g for 5s, applied to micro-array slides and covered with a 24·60 mm coverslip(VWR). The microarray slides were then placed in aCMT-GAPS hybridization chamber (model 2551; Corn-ing) for hybridization in a 37�C waterbath for 12–18 h.After hybridization, slides were washed three times for15 min with 1· SSC, 0.1% SDS at 50�C, three times for15 min in 1· SSC at 50�C and three times in 0.1· SSC at50�C for 30s. The slides were removed from the final washsolution and blow-dried with compressed air beforescanning.
Scanning and data analysis
Slides were scanned in a Scan Array 4000 (GSILumonics/Perkin Elmer) at 10 lm resolution to ac-quire separate Cy3 and Cy5 fluorescence images. Theresulting 16-bit TIFF images were quantified withQuantArray ver. 3.0 (Perkin Elmer), using an adaptivealgorithm. Spots with dust, scratches, saturation orlocally high background were not used in furtheranalysis. The intensities of Cy3- and Cy5-labeledprobes were normalized (equalized) by comparing thesignal intensities of housekeeping genes (positive con-trols) for both dyes and using the determined ratio asa correction factor for differences in labeling efficiency.Spots with a lower signal intensity than the negativecontrols or with intensities less than twice the averagebackground for the channel were manually blocked(flagged) from further analysis. In each of thehybridizations, a set of normalized spot pairs thathad a valid signal in all five replicates was exportedto Gene Traffic ver. 3.2 (Iobion Informatics LLC,La Jolla, Calif.).
In Gene Traffic, spatial and intensity-dependent bia-ses within each array were corrected by sub-grid LOW-ESS normalization, using a 20% smoothing factor. An
additional round of filtering was applied to flag spotswith signal intensities less than twice the average back-ground or with absolute fluorescence intensities less than100. The signal intensities were calculated as a mean ofall five experiments with a cutoff value less than 100. Thegenes for which at least two-thirds of the spots (n‡6) metthese criteria were considered to represent a validhybridization signal. Hierarchical clustering, as imple-mented in the Gene Traffic software, was carried out toassess similarities in gene expression variation among thecell-type comparative hybridizations.
In a separate analysis of each hybridization experi-ment, a 2.0-fold increase or decrease in signal intensity(mean log2 ratio greater than 1.0 or less than �1.0) wasconsidered to indicate genes that are differentiallyexpressed (DeRisi et al. 1996). These genes were tabu-lated and used in the selection of clones for the con-firmation of expression level differences by Northernhybridization.
Northern analysis and reverse transcriptase–polymerasechain reaction
Total RNA from U. maydis cultures was denatured withglyoxal, electrophoretically separated on 1.5% agarosegels (20 lg/lane), transferred to Gene Screen Nylonmembranes (Perkin Elmer Life Sciences, Boston, Mass.)by capillary blotting and UV-crosslinked (1,200 lJ/cm2). Northern hybridizations for each of the clonesshown in Tables 3 and 4 were performed twice withindependent probe-labeling and hybridization to mem-branes from transfers of independently isolated RNAs.Probes were radiolabeled with [a�32P] dCTP by nicktranslation, following the manufacturer’s suggestedprotocol (Invitrogen Canada, Burlington, Ontario).Hybridization was performed as suggested by themembrane manufacturer. A PhosphorImager (Storm840; Molecular Dynamics, Amersham Biosciences) andImageQuant ver. 5.2 software (Molecular Dynamics)were used for the visualization and quantification ofradioactive signals. Transcript sizes were determined bycomparison with a RNA size marker (model 156200-16;Invitrogen). For rehybridization, probes were strippedfrom membranes, following the manufacturer’s sug-gested protocol. To account for variations in loadingbetween samples, each value was normalized against theexpression of S25 ribosomal protein.
To assess whether genes that are observed to be dif-ferentially regulated by microarray hybridization werealso expressed during U. maydis growth in planta, weperformed reverse transcriptase–polymerase chain reac-tion (RT-PCR) with primers directed against U. maydisgenes D61_H02 (UniEST 1289) and K19_H05 (UniEST3562). In each case, we used total RNA isolated frominfected and uninfected plants as a template. The primercombinations used were: 5¢-AAACGAGGCGCGA-CATGCTGGTAAA-3¢ and 5¢-ATCACGTTGAGGA-AACGAGTGCT-3¢for K19_H05, 5¢-GGAACATGCG-
319

TGCTTATTCCAAGG-3¢ and 5¢-GCGGTTATCTT-CCGTCTGAAACCA-3¢ for D61_H02. Reverse tran-scription was carried out using 5 lg DNase-treated totalRNA and Stratascript II reverse transcriptase (Strata-gene), following the manufacture’s suggested protocol.PCR amplifications were carried out in 50-ll reactionvolumes containing 1· reaction buffer (10 mM Tris-HCl, pH 8.3, 50 mM KCl), 3 mM MgCl2, 0.2 mmoldNTPs, 0.25 units Amplitaq Gold DNA polymerase(Applied Biosystems), 0.25 lmol of each primer and400 ng cDNA template. Amplifications were carried outin a 96-well GeneAmp 9700 thermal cycler (AppliedBiosystems) with incubation at 95�C for 10.0 min,35 cycles of 95�C for 30 s, 62�C for 30 s and 72�C for1.5 min and a 72�C hold for 7.0 min.
DNA sequencing
The cDNA clones selected for Northern hybridization(Tables 3, 4) were sequenced from the 5¢ and 3¢ ends ofthe insert, using ABI PRISM Big Dye terminatorchemistry ver. 3.1 (Applied Biosystems). Sequencing ofpSPORT1 cDNA clones was performed using M13universal forward primer (5¢-CCCAGTCACGACG-TTGTAAAACG-3¢) and T7 reverse primer (5¢-GAG-TAATACGACTCACTATAGGG-3¢; Sigma Genosys),while pDNR-LIB cDNA clones were sequenced usingM13 universal forward (5¢-GTAAAACGACGGC-CAGT-3¢) and reverse (5¢-CAGGAAACAGCTAT-GAC-3¢) primers. The extension products wereseparated and analyzed on an ABI PRISM 3100 geneticanalyzer (Applied Biosystems). All automated sequenc-ing outputs were examined for quality and runs with alow-quality peak shape were resequenced. The sequenceswere trimmed manually for vector and polylinkersequences using Gene Tool ver. 2.0 software (BioTools,Edmonton, Alberta). The resulting sequences of thecDNA clones from the 5¢ and 3¢ ends were aligned to theUstilago genome sequence (released by the Whitehead
Institute / MIT Center for Genome Research; http://www-genome.wi.mit.edu) using BLASTN (data notshown).
Results
Effect of RNA level on microarray hybridizationintensity
We investigated the reproducibility of cDNA labelingand hybridization to determine the lowest amount oftotal RNA required for high-quality hybridization. Aseries of self-against-self hybridizations were performedwith 10, 40 and 80 lg total RNA from dikaryotic fila-ments (data not shown). The amount of total RNArequired for cDNA microarray hybridization experi-ments was obtained by examining the usable spot pairsand mean fluorescence intensities generated. The usablespot pairs and mean signal intensity were 577 and 1,225,respectively, when using 10 lg total RNA, 780 and 1,641when using 40 lg total RNA, and 550 and 1,511 whenusing 80 lg total RNA. Approximately 51% of theDNA spots on the array gave a usable signal when 40 lgtotal RNA were used (data not shown). The hybridiza-tions with 10 lg total RNA produced low and variablespot intensities; and hybridizations with 80 lg totalRNA resulted in a higher background and saturation ofsignal, relative to the 40 lg total RNA. Consequently,40 lg total RNA was used in all experiments.
Differential gene expression in U. maydis cell types
A total of 754 spot pairs were assessed in each hybrid-ization experiment. The numbers of valid spot pairs ineach set of hybridizations are presented in Table 1.From each set of hybridizations, we identified genes thatwere more than 2.0-fold up-regulated or more than 2.0-fold down-regulated (mean log2 ratio greater than 1.0 or
Table 1 Assignment of classes to genes differentially regulated in cell-type comparative hybridizations
Hybridization Numberof validspot pairs
Classof up-regulatedgenes
Genes up/down-regulated >2.0-fold[number (%) / number (%)]
Dikaryon filament vs diploid filament 111 Class I, dikaryon up-regulated 5 (5.0) / 3 (3.0)Class II, diploid filament up-regulated 3 (3.0) / 5 (5.0)
Dikaryon filament vs combined haploidswith charcoal
279 Class III, dikaryon up-regulated 21 (8.0) / 13 (5.0)
Dikaryon filament vs combined haploidswithout (w/o) charcoal
262 Class IV, dikaryon up-regulated 42 (16.0) / 15 (6.0)
Dikaryon filament vs diploid budding cells 182 Class V, dikaryon up-regulated 23 (13.0) / 3 (1.6)Diploid filament vs diploid budding cells Class VI, diploid up-regulated 9 (4.9) / 13 (7.1)Diploid filament vs combined haploidswith charcoal
257 Class VII, diploid up-regulated 10 (3.9) / 7 (2.7)
Diploid filament vs combined haploids w/ocharcoal
222 Class VIII, diploid up-regulated 13 (5.9) / 18 (8.1)
Combined haploids grown with charcoal vscombined haploids grown w/o charcoal
574 See Supplementary Material:Tables A, B
310 (5.4) / 8 (1.4)
320
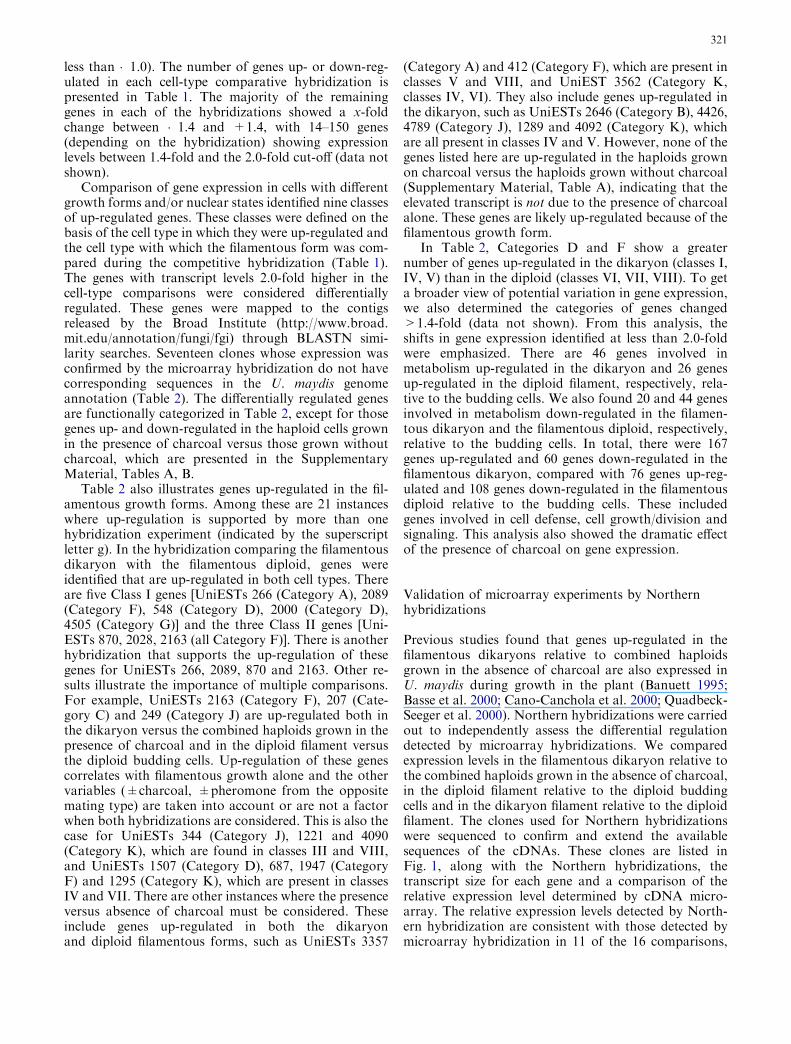
less than �1.0). The number of genes up- or down-reg-ulated in each cell-type comparative hybridization ispresented in Table 1. The majority of the remaininggenes in each of the hybridizations showed a x-foldchange between �1.4 and +1.4, with 14–150 genes(depending on the hybridization) showing expressionlevels between 1.4-fold and the 2.0-fold cut-off (data notshown).
Comparison of gene expression in cells with differentgrowth forms and/or nuclear states identified nine classesof up-regulated genes. These classes were defined on thebasis of the cell type in which they were up-regulated andthe cell type with which the filamentous form was com-pared during the competitive hybridization (Table 1).The genes with transcript levels 2.0-fold higher in thecell-type comparisons were considered differentiallyregulated. These genes were mapped to the contigsreleased by the Broad Institute (http://www.broad.mit.edu/annotation/fungi/fgi) through BLASTN simi-larity searches. Seventeen clones whose expression wasconfirmed by the microarray hybridization do not havecorresponding sequences in the U. maydis genomeannotation (Table 2). The differentially regulated genesare functionally categorized in Table 2, except for thosegenes up- and down-regulated in the haploid cells grownin the presence of charcoal versus those grown withoutcharcoal, which are presented in the SupplementaryMaterial, Tables A, B.
Table 2 also illustrates genes up-regulated in the fil-amentous growth forms. Among these are 21 instanceswhere up-regulation is supported by more than onehybridization experiment (indicated by the superscriptletter g). In the hybridization comparing the filamentousdikaryon with the filamentous diploid, genes wereidentified that are up-regulated in both cell types. Thereare five Class I genes [UniESTs 266 (Category A), 2089(Category F), 548 (Category D), 2000 (Category D),4505 (Category G)] and the three Class II genes [Uni-ESTs 870, 2028, 2163 (all Category F)]. There is anotherhybridization that supports the up-regulation of thesegenes for UniESTs 266, 2089, 870 and 2163. Other re-sults illustrate the importance of multiple comparisons.For example, UniESTs 2163 (Category F), 207 (Cate-gory C) and 249 (Category J) are up-regulated both inthe dikaryon versus the combined haploids grown in thepresence of charcoal and in the diploid filament versusthe diploid budding cells. Up-regulation of these genescorrelates with filamentous growth alone and the othervariables (±charcoal, ±pheromone from the oppositemating type) are taken into account or are not a factorwhen both hybridizations are considered. This is also thecase for UniESTs 344 (Category J), 1221 and 4090(Category K), which are found in classes III and VIII,and UniESTs 1507 (Category D), 687, 1947 (CategoryF) and 1295 (Category K), which are present in classesIV and VII. There are other instances where the presenceversus absence of charcoal must be considered. Theseinclude genes up-regulated in both the dikaryonand diploid filamentous forms, such as UniESTs 3357
(Category A) and 412 (Category F), which are present inclasses V and VIII, and UniEST 3562 (Category K,classes IV, VI). They also include genes up-regulated inthe dikaryon, such as UniESTs 2646 (Category B), 4426,4789 (Category J), 1289 and 4092 (Category K), whichare all present in classes IV and V. However, none of thegenes listed here are up-regulated in the haploids grownon charcoal versus the haploids grown without charcoal(Supplementary Material, Table A), indicating that theelevated transcript is not due to the presence of charcoalalone. These genes are likely up-regulated because of thefilamentous growth form.
In Table 2, Categories D and F show a greaternumber of genes up-regulated in the dikaryon (classes I,IV, V) than in the diploid (classes VI, VII, VIII). To geta broader view of potential variation in gene expression,we also determined the categories of genes changed>1.4-fold (data not shown). From this analysis, theshifts in gene expression identified at less than 2.0-foldwere emphasized. There are 46 genes involved inmetabolism up-regulated in the dikaryon and 26 genesup-regulated in the diploid filament, respectively, rela-tive to the budding cells. We also found 20 and 44 genesinvolved in metabolism down-regulated in the filamen-tous dikaryon and the filamentous diploid, respectively,relative to the budding cells. In total, there were 167genes up-regulated and 60 genes down-regulated in thefilamentous dikaryon, compared with 76 genes up-reg-ulated and 108 genes down-regulated in the filamentousdiploid relative to the budding cells. These includedgenes involved in cell defense, cell growth/division andsignaling. This analysis also showed the dramatic effectof the presence of charcoal on gene expression.
Validation of microarray experiments by Northernhybridizations
Previous studies found that genes up-regulated in thefilamentous dikaryons relative to combined haploidsgrown in the absence of charcoal are also expressed inU. maydis during growth in the plant (Banuett 1995;Basse et al. 2000; Cano-Canchola et al. 2000; Quadbeck-Seeger et al. 2000). Northern hybridizations were carriedout to independently assess the differential regulationdetected by microarray hybridizations. We comparedexpression levels in the filamentous dikaryon relative tothe combined haploids grown in the absence of charcoal,in the diploid filament relative to the diploid buddingcells and in the dikaryon filament relative to the diploidfilament. The clones used for Northern hybridizationswere sequenced to confirm and extend the availablesequences of the cDNAs. These clones are listed inFig. 1, along with the Northern hybridizations, thetranscript size for each gene and a comparison of therelative expression level determined by cDNA micro-array. The relative expression levels detected by North-ern hybridization are consistent with those detected bymicroarray hybridization in 11 of the 16 comparisons,
321
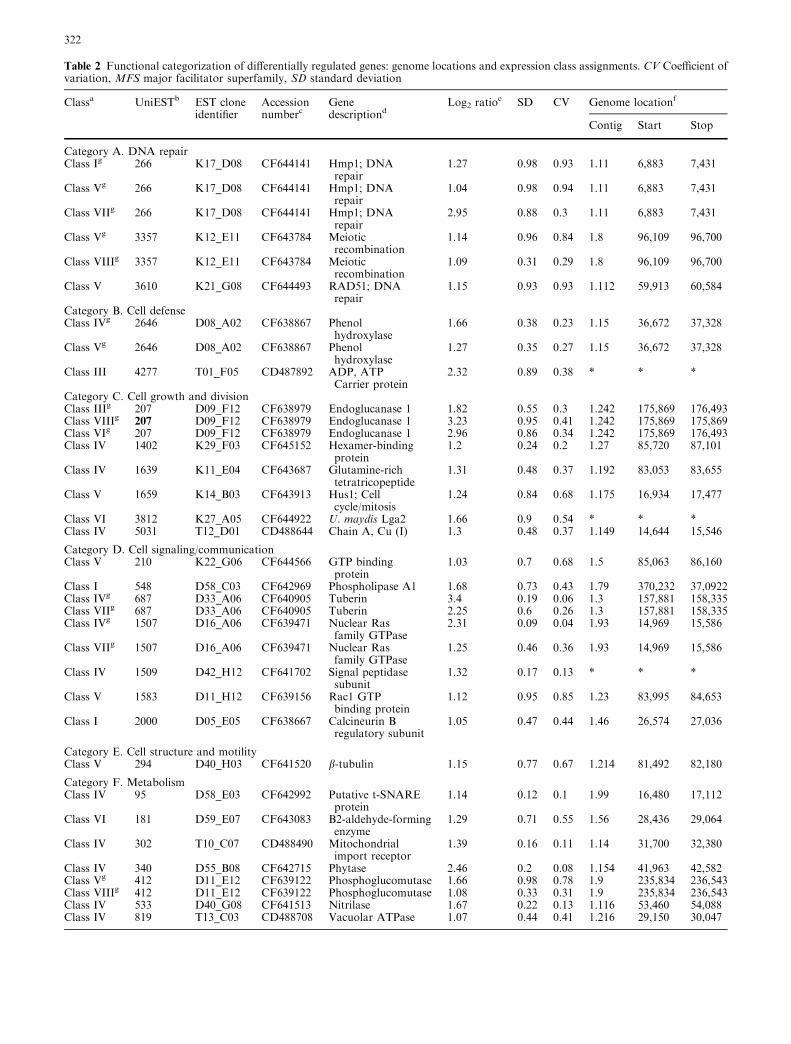
Table 2 Functional categorization of differentially regulated genes: genome locations and expression class assignments. CV Coefficient ofvariation, MFS major facilitator superfamily, SD standard deviation
Classa UniESTb EST cloneidentifier
Accessionnumberc
Genedescriptiond
Log2 ratioe SD CV Genome locationf
Contig Start Stop
Category A. DNA repairClass Ig 266 K17_D08 CF644141 Hmp1; DNA
repair1.27 0.98 0.93 1.11 6,883 7,431
Class Vg 266 K17_D08 CF644141 Hmp1; DNArepair
1.04 0.98 0.94 1.11 6,883 7,431
Class VIIg 266 K17_D08 CF644141 Hmp1; DNArepair
2.95 0.88 0.3 1.11 6,883 7,431
Class Vg 3357 K12_E11 CF643784 Meioticrecombination
1.14 0.96 0.84 1.8 96,109 96,700
Class VIIIg 3357 K12_E11 CF643784 Meioticrecombination
1.09 0.31 0.29 1.8 96,109 96,700
Class V 3610 K21_G08 CF644493 RAD51; DNArepair
1.15 0.93 0.93 1.112 59,913 60,584
Category B. Cell defenseClass IVg 2646 D08_A02 CF638867 Phenol
hydroxylase1.66 0.38 0.23 1.15 36,672 37,328
Class Vg 2646 D08_A02 CF638867 Phenolhydroxylase
1.27 0.35 0.27 1.15 36,672 37,328
Class III 4277 T01_F05 CD487892 ADP, ATPCarrier protein
2.32 0.89 0.38 * * *
Category C. Cell growth and divisionClass IIIg 207 D09_F12 CF638979 Endoglucanase 1 1.82 0.55 0.3 1.242 175,869 176,493Class VIIIg 207 D09_F12 CF638979 Endoglucanase 1 3.23 0.95 0.41 1.242 175,869 175,869Class VIg 207 D09_F12 CF638979 Endoglucanase 1 2.96 0.86 0.34 1.242 175,869 176,493Class IV 1402 K29_F03 CF645152 Hexamer-binding
protein1.2 0.24 0.2 1.27 85,720 87,101
Class IV 1639 K11_E04 CF643687 Glutamine-richtetratricopeptide
1.31 0.48 0.37 1.192 83,053 83,655
Class V 1659 K14_B03 CF643913 Hus1; Cellcycle/mitosis
1.24 0.84 0.68 1.175 16,934 17,477
Class VI 3812 K27_A05 CF644922 U. maydis Lga2 1.66 0.9 0.54 * * *Class IV 5031 T12_D01 CD488644 Chain A, Cu (I) 1.3 0.48 0.37 1.149 14,644 15,546
Category D. Cell signaling/communicationClass V 210 K22_G06 CF644566 GTP binding
protein1.03 0.7 0.68 1.5 85,063 86,160
Class I 548 D58_C03 CF642969 Phospholipase A1 1.68 0.73 0.43 1.79 370,232 37,0922Class IVg 687 D33_A06 CF640905 Tuberin 3.4 0.19 0.06 1.3 157,881 158,335Class VIIg 687 D33_A06 CF640905 Tuberin 2.25 0.6 0.26 1.3 157,881 158,335Class IVg 1507 D16_A06 CF639471 Nuclear Ras
family GTPase2.31 0.09 0.04 1.93 14,969 15,586
Class VIIg 1507 D16_A06 CF639471 Nuclear Rasfamily GTPase
1.25 0.46 0.36 1.93 14,969 15,586
Class IV 1509 D42_H12 CF641702 Signal peptidasesubunit
1.32 0.17 0.13 * * *
Class V 1583 D11_H12 CF639156 Rac1 GTPbinding protein
1.12 0.95 0.85 1.23 83,995 84,653
Class I 2000 D05_E05 CF638667 Calcineurin Bregulatory subunit
1.05 0.47 0.44 1.46 26,574 27,036
Category E. Cell structure and motilityClass V 294 D40_H03 CF641520 b-tubulin 1.15 0.77 0.67 1.214 81,492 82,180
Category F. MetabolismClass IV 95 D58_E03 CF642992 Putative t-SNARE
protein1.14 0.12 0.1 1.99 16,480 17,112
Class VI 181 D59_E07 CF643083 B2-aldehyde-formingenzyme
1.29 0.71 0.55 1.56 28,436 29,064
Class IV 302 T10_C07 CD488490 Mitochondrialimport receptor
1.39 0.16 0.11 1.14 31,700 32,380
Class IV 340 D55_B08 CF642715 Phytase 2.46 0.2 0.08 1.154 41,963 42,582Class Vg 412 D11_E12 CF639122 Phosphoglucomutase 1.66 0.98 0.78 1.9 235,834 236,543Class VIIIg 412 D11_E12 CF639122 Phosphoglucomutase 1.08 0.33 0.31 1.9 235,834 236,543Class IV 533 D40_G08 CF641513 Nitrilase 1.67 0.22 0.13 1.116 53,460 54,088Class IV 819 T13_C03 CD488708 Vacuolar ATPase 1.07 0.44 0.41 1.216 29,150 30,047
322

Table 2 (Contd.)
Classa UniESTb ESTclone identifier
Accessionnumberc
Genedescriptiond
Log2 ratioe SD CV Genome locationf
Contig Start Stop
Class IIg 870 D02_H07 CF638462 Glucan1,3-b-glycosidase
1.38 0.96 0.87 1.28 13,501 14,209
Class VIg 870 D02_H07 CF638462 Glucan1,3-b-glycosidase
2.03 0.4 0.2 1.28 13,501 14,209
Class VIIIg 870 D02_H07 CF638462 Glucan1,3-b-glycosidase
1.64 0.52 0.31 1.28 13,501 14,209
Class III 1296 D90_F03 CF643446 Cyto-b5reductase-like
2.02 0.47 0.23 1.126 74,579 75,237
Class IV 1440 D34_D10 CF641017 Ornithinecarbamoyltransferase
1.08 0.23 0.21 1.117 167,244 167,789
Class IVg 1947 D44_A05 CF641773 MFS allantoatepermease
2.3 0.03 0.01 1.56 142,862 143,727
Class Vg 1947 D44_A05 CF641773 MFS allantoatepermease
1.47 0.97 0.66 1.56 142,862 143,727
Class VIIg 1947 D44_A05 CF641773 MFS allantoatepermease
1.19 0.53 0.44 1.56 142,862 143,727
Class II 2028 D47_H07 CF642116 Yeastdihydro-ceramidase
1.77 0.99 0.56 1.157 108,517 108,992
Class Ig 2089 K20_C09 CF644375 Thymidylatesynthase
1.71 0.92 0.54 1.83 185,933 186,463
Class VIIg 2089 K20_C09 CF644375 Thymidylatesynthase
1.58 0.98 0.62 1.83 185,933 186,463
Class IIg 2163 K35_A01 CF645309 Fox2 protein;sterol binding
1.81 0.98 0.77 1.102 20,752 21,822
Class IIIg 2163 K35_A01 CF645309 Fox2 protein;sterol binding
3.26 0.54 0.17 1.102 20,752 21,822
Class VIg 2163 K35_A01 CF645309 Fox2 protein;sterol binding
4.34 0.48 0.11 1.102 20,752 21,822
Class VIIIg 2163 K35_A01 CF645309 Fox2 protein;sterol binding
2.99 0.88 0.35 1.102 20,752 21,822
Class IV 2454 D35_D01 CF641080 UMP-CMP kinase 2.4 0.25 0.1 1.149 38,331 38,492Class IV 3282 K10_H04 CF643629 Lipase B
precursor3.69 0.51 0.14 1.49 59,616 60,099
Class IV 3638 K22_E03 CF644547 Nuclease Le3 1.16 0.15 0.13 1.32 4,955 5,476Class IV 4009 K39_A07 CF645662 Cytochrome c
oxidase1.65 0.48 0.29 1.88 90,040 91,253
Class VIII 4301 D26_E05 CF640370 D-Amino acidoxidase
1.26 0.76 0.6 * * *
Class V 4736 D57_E09 CF642920 Amino AcidTransaminase
1.33 0.9 0.86 1.198 101,853 102,441
Class IV 4832 T21_F06 CD489314 Methylthioadenosinephosphorylase
1.45 0.43 0.3 * * *
Class IV 5140 T11_F04 CD488593 b-Hydroxybutyryl-CoAdehydrogenase
2.37 0.3 0.12 1.78 61,606 62,331
Class IVg 5200 D46_G10 CF642015 Putative methyltransferase
3.32 0.12 0.04 1.6 20,287 21,040
Class VIIg 5200 D46_G10 CF642015 Putativemethyltransferase
1.85 0.42 0.23 1.6 20,287 21,040
Category G. Protein synthesisClass VIII 594 D26_D11 CF640365 Tyrosyl-tRNA
synthetase1.45 0.93 0.64 1.99 27,237 27,976
Class IV 878 D08_A11 CF638874 Polyubiquitin 1.3 0.45 0.35 1.83 238,399 239,236Class III 1188 K14_G06 CF643972 ADP-ribosylation
factor1.35 1.02 0.75 1.7 32,632 33,968
Class I 4505 T24_B03 CD489494 Phenylalanyl-tRNAsynthetase
1.49 0.77 0.52 * * *
Class IVg 4743 T04_H04 CD488129 Integrin b-4binding protein
2.66 0.97 0.36 1.249 14,270 14,967
Class VIIg 4743 T04_H04 CD488129 Integrin b-4binding protein
1.32 0.76 0.58 1.249 14,270 14,967
Class V 4840 T17_D01 CD488999 50S ribosomalprotein
1.76 1.43 0.81 1.159 4,940 5,357
323

Table 2 (Contd.)
Classa UniESTb EST cloneidentifier
Accessionnumberc
Genedescriptiond
Log2 ratioe SD CV Genome locationf
Contig Start Stop
Category H. RNA synthesisClass VIII 373 D33_G01 CF640960 mRNA
export factor1.08 0.58 0.54 1.66 9,576 10,244
Category I. MiscellaneousClass VII 2155 K20_D10 CF644386 Gag-Pol
Polyprotein1.5 0.75 0.5 1.11 22,890 23,452
Class III 4883 T21_H03 CD489331 mRNA cleavagefactor
1.5 0.41 0.27 * * *
Category J. UnknownClass III 230 D62_G08 CF643264 Hypothetical
protein1.12 0.41 0.37 * * *
Class IIIg 249 D47_E06 CF642081 Hypotheticalprotein
2.22 0.42 0.19 1.245 3,414 4,178
Class VIg 249 D47_E06 CF642081 Hypotheticalprotein
3.17 0.45 0.14 1.245 3,414 4,178
Class VIIIg 249 D47_E06 CF642081 Hypotheticalprotein
3.18 0.53 0.17 1.245 3,414 4,178
Class IV 258 D59_G10 CF643106 agCP15147;Unknown 1.64 0.52 0.32 1.72 155,023 155,604Class IIIg 344 K21_F11 CF644485 Hypothetical
protein1.94 0.33 0.17 1.46 165,507 165,958
Class VIIIg 344 K21_F11 CF644485 Hypotheticalprotein
1.05 0.88 0.97 1.46 165,507 165,958
Class VIII 960 D04_F05 CF638602 Hypotheticalprotein
1.03 0.19 0.19 * * *
Class IV 1130 D15_F07 CF639438 ebiP1938;Unknown 1.31 0.5 0.39 1.66 99,456 99,932Class IV 1244 K35_B02 CF645322 RIKEN cDNA 1.22 0.26 0.21 1.215 130,615 131,078Class IV 1387 D90_A09 CF643409 Hypothetical
protein1.2 0.12 0.1 * * *
Class VII 3643 K22_F08 CF644561 Hypotheticalprotein
1.94 0.8 0.41 1.2 13,644 14,420
Class V 4268 T10_A07 CD488469 Hypotheticalprotein
1.29 0.77 0.59 * * *
Class III 4352 T02_C10 CD487937 Hypotheticalprotein
1.05 0.57 0.55 1.112 39,394 39,998
Class IVg 4426 T03_H03 CD488048 Hypotheticalprotein
1.07 0.13 0.12 1.13 119 568
Class Vg 4426 T03_H03 CD488048 Hypotheticalprotein
1.7 0.92 0.54 1.13 119 568
Class IV 4440 T17_C10 CD488997 CG2789 geneproduct
1.28 0.26 0.2 * * *
Class IV 4453 T25_E03 CD489594 ESTsD40621 1.37 0.13 0.09 1.1 17,039 17,608Class IV 4582 T14_C09 CD488777 Homologous
yeast-protein1.95 0.22 0.11 1.23 56,411 56,955
Class IVg 4789 T17_F07 CD489021 CG2245-PA;Unknown
1.93 0.7 0.36 * * *
Class Vg 4789 T17_F07 CD489021 CG2245-PA;Unknown
1.58 0.76 0.48 * * *
Class III 5198 T25_D09 CD489589 Hypotheticalprotein
1.39 0.11 0.08 1.247 62017 62640
Category K. No blast similarityClass IV 27 D56_G09 CF642861 No similarity by
BLASTX1.03 0.58 0.56 1.79 261,584 262,339
Class III 82 T25_D07 CD489587 No similarity byBLASTX
1.03 0.48 0.47 * * *
Class III 315 T22_F08 CD489389 No similarity byBLASTX
1.11 0.15 0.13 1.17 50,159 50,574
Class III 559 D53_E10 CF642601 No similarity byBLASTX
1.13 0.17 0.15 1.211 33,612 34,189
Class IV 613 K38_C02 CF645593 No similarity byBLASTX
1.09 0.21 0.19 1.238 8,093 8,411
Class III 712 D12_G08 CF639218 No similarity byBLASTX
1.26 0.57 0.45 1.188 43,135 43,655
324
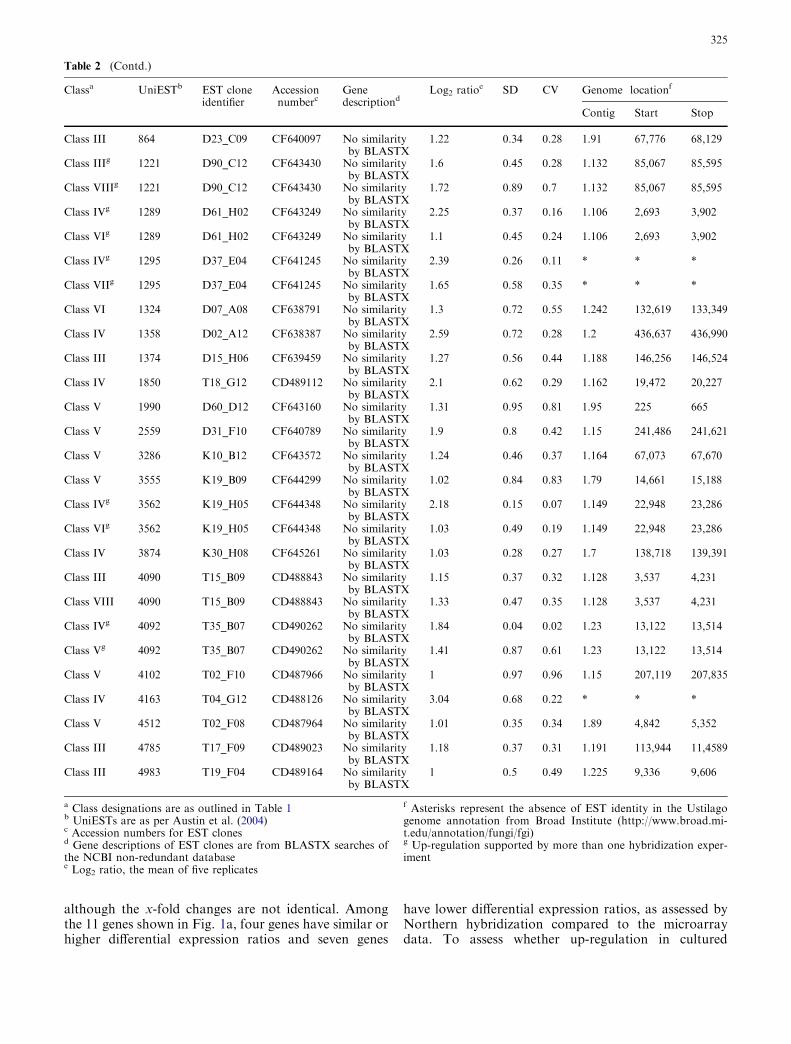
although the x-fold changes are not identical. Amongthe 11 genes shown in Fig. 1a, four genes have similar orhigher differential expression ratios and seven genes
have lower differential expression ratios, as assessed byNorthern hybridization compared to the microarraydata. To assess whether up-regulation in cultured
Table 2 (Contd.)
Classa UniESTb EST cloneidentifier
Accessionnumberc
Genedescriptiond
Log2 ratioe SD CV Genome locationf
Contig Start Stop
Class III 864 D23_C09 CF640097 No similarityby BLASTX
1.22 0.34 0.28 1.91 67,776 68,129
Class IIIg 1221 D90_C12 CF643430 No similarityby BLASTX
1.6 0.45 0.28 1.132 85,067 85,595
Class VIIIg 1221 D90_C12 CF643430 No similarityby BLASTX
1.72 0.89 0.7 1.132 85,067 85,595
Class IVg 1289 D61_H02 CF643249 No similarityby BLASTX
2.25 0.37 0.16 1.106 2,693 3,902
Class VIg 1289 D61_H02 CF643249 No similarityby BLASTX
1.1 0.45 0.24 1.106 2,693 3,902
Class IVg 1295 D37_E04 CF641245 No similarityby BLASTX
2.39 0.26 0.11 * * *
Class VIIg 1295 D37_E04 CF641245 No similarityby BLASTX
1.65 0.58 0.35 * * *
Class VI 1324 D07_A08 CF638791 No similarityby BLASTX
1.3 0.72 0.55 1.242 132,619 133,349
Class IV 1358 D02_A12 CF638387 No similarityby BLASTX
2.59 0.72 0.28 1.2 436,637 436,990
Class III 1374 D15_H06 CF639459 No similarityby BLASTX
1.27 0.56 0.44 1.188 146,256 146,524
Class IV 1850 T18_G12 CD489112 No similarityby BLASTX
2.1 0.62 0.29 1.162 19,472 20,227
Class V 1990 D60_D12 CF643160 No similarityby BLASTX
1.31 0.95 0.81 1.95 225 665
Class V 2559 D31_F10 CF640789 No similarityby BLASTX
1.9 0.8 0.42 1.15 241,486 241,621
Class V 3286 K10_B12 CF643572 No similarityby BLASTX
1.24 0.46 0.37 1.164 67,073 67,670
Class V 3555 K19_B09 CF644299 No similarityby BLASTX
1.02 0.84 0.83 1.79 14,661 15,188
Class IVg 3562 K19_H05 CF644348 No similarityby BLASTX
2.18 0.15 0.07 1.149 22,948 23,286
Class VIg 3562 K19_H05 CF644348 No similarityby BLASTX
1.03 0.49 0.19 1.149 22,948 23,286
Class IV 3874 K30_H08 CF645261 No similarityby BLASTX
1.03 0.28 0.27 1.7 138,718 139,391
Class III 4090 T15_B09 CD488843 No similarityby BLASTX
1.15 0.37 0.32 1.128 3,537 4,231
Class VIII 4090 T15_B09 CD488843 No similarityby BLASTX
1.33 0.47 0.35 1.128 3,537 4,231
Class IVg 4092 T35_B07 CD490262 No similarityby BLASTX
1.84 0.04 0.02 1.23 13,122 13,514
Class Vg 4092 T35_B07 CD490262 No similarityby BLASTX
1.41 0.87 0.61 1.23 13,122 13,514
Class V 4102 T02_F10 CD487966 No similarityby BLASTX
1 0.97 0.96 1.15 207,119 207,835
Class IV 4163 T04_G12 CD488126 No similarityby BLASTX
3.04 0.68 0.22 * * *
Class V 4512 T02_F08 CD487964 No similarityby BLASTX
1.01 0.35 0.34 1.89 4,842 5,352
Class III 4785 T17_F09 CD489023 No similarityby BLASTX
1.18 0.37 0.31 1.191 113,944 11,4589
Class III 4983 T19_F04 CD489164 No similarityby BLASTX
1 0.5 0.49 1.225 9,336 9,606
a Class designations are as outlined in Table 1b UniESTs are as per Austin et al. (2004)c Accession numbers for EST clonesd Gene descriptions of EST clones are from BLASTX searches ofthe NCBI non-redundant databasee Log2 ratio, the mean of five replicates
f Asterisks represent the absence of EST identity in the Ustilagogenome annotation from Broad Institute (http://www.broad.mi-t.edu/annotation/fungi/fgi)g Up-regulation supported by more than one hybridization exper-iment
325
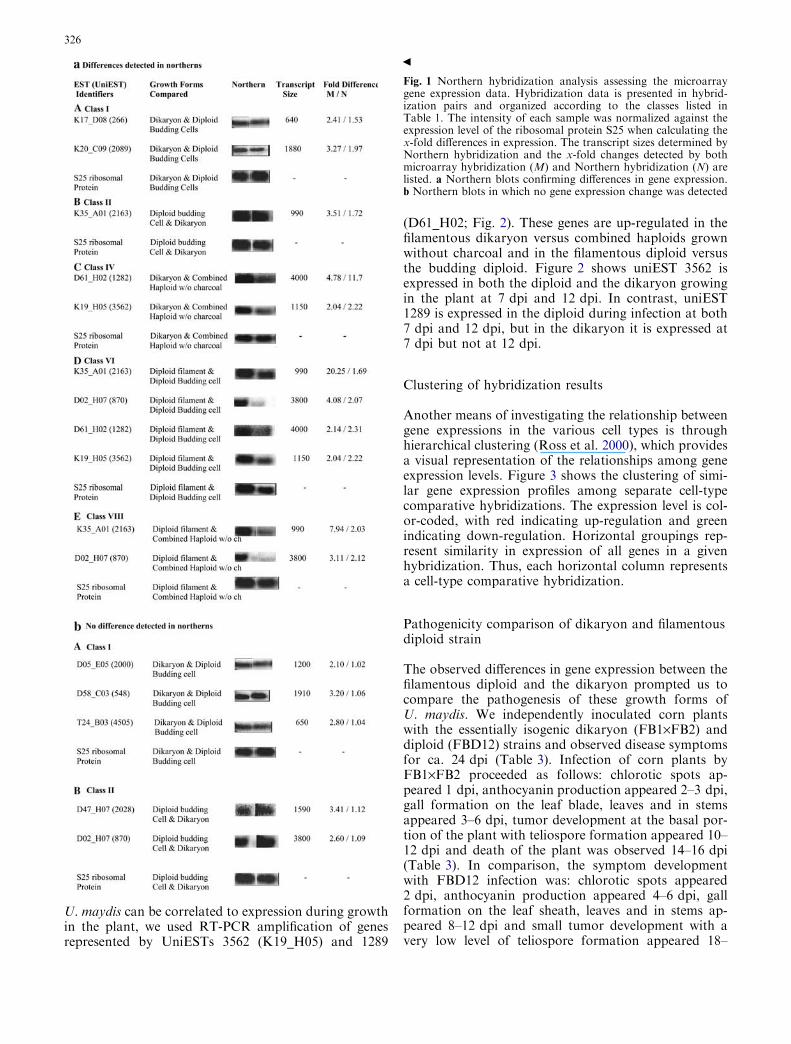
U. maydis can be correlated to expression during growthin the plant, we used RT-PCR amplification of genesrepresented by UniESTs 3562 (K19_H05) and 1289
(D61_H02; Fig. 2). These genes are up-regulated in thefilamentous dikaryon versus combined haploids grownwithout charcoal and in the filamentous diploid versusthe budding diploid. Figure 2 shows uniEST 3562 isexpressed in both the diploid and the dikaryon growingin the plant at 7 dpi and 12 dpi. In contrast, uniEST1289 is expressed in the diploid during infection at both7 dpi and 12 dpi, but in the dikaryon it is expressed at7 dpi but not at 12 dpi.
Clustering of hybridization results
Another means of investigating the relationship betweengene expressions in the various cell types is throughhierarchical clustering (Ross et al. 2000), which providesa visual representation of the relationships among geneexpression levels. Figure 3 shows the clustering of simi-lar gene expression profiles among separate cell-typecomparative hybridizations. The expression level is col-or-coded, with red indicating up-regulation and greenindicating down-regulation. Horizontal groupings rep-resent similarity in expression of all genes in a givenhybridization. Thus, each horizontal column representsa cell-type comparative hybridization.
Pathogenicity comparison of dikaryon and filamentousdiploid strain
The observed differences in gene expression between thefilamentous diploid and the dikaryon prompted us tocompare the pathogenesis of these growth forms ofU. maydis. We independently inoculated corn plantswith the essentially isogenic dikaryon (FB1·FB2) anddiploid (FBD12) strains and observed disease symptomsfor ca. 24 dpi (Table 3). Infection of corn plants byFB1·FB2 proceeded as follows: chlorotic spots ap-peared 1 dpi, anthocyanin production appeared 2–3 dpi,gall formation on the leaf blade, leaves and in stemsappeared 3–6 dpi, tumor development at the basal por-tion of the plant with teliospore formation appeared 10–12 dpi and death of the plant was observed 14–16 dpi(Table 3). In comparison, the symptom developmentwith FBD12 infection was: chlorotic spots appeared2 dpi, anthocyanin production appeared 4–6 dpi, gallformation on the leaf sheath, leaves and in stems ap-peared 8–12 dpi and small tumor development with avery low level of teliospore formation appeared 18–
Fig. 1 Northern hybridization analysis assessing the microarraygene expression data. Hybridization data is presented in hybrid-ization pairs and organized according to the classes listed inTable 1. The intensity of each sample was normalized against theexpression level of the ribosomal protein S25 when calculating thex-fold differences in expression. The transcript sizes determined byNorthern hybridization and the x-fold changes detected by bothmicroarray hybridization (M) and Northern hybridization (N) arelisted. a Northern blots confirming differences in gene expression.b Northern blots in which no gene expression change was detected
b
326
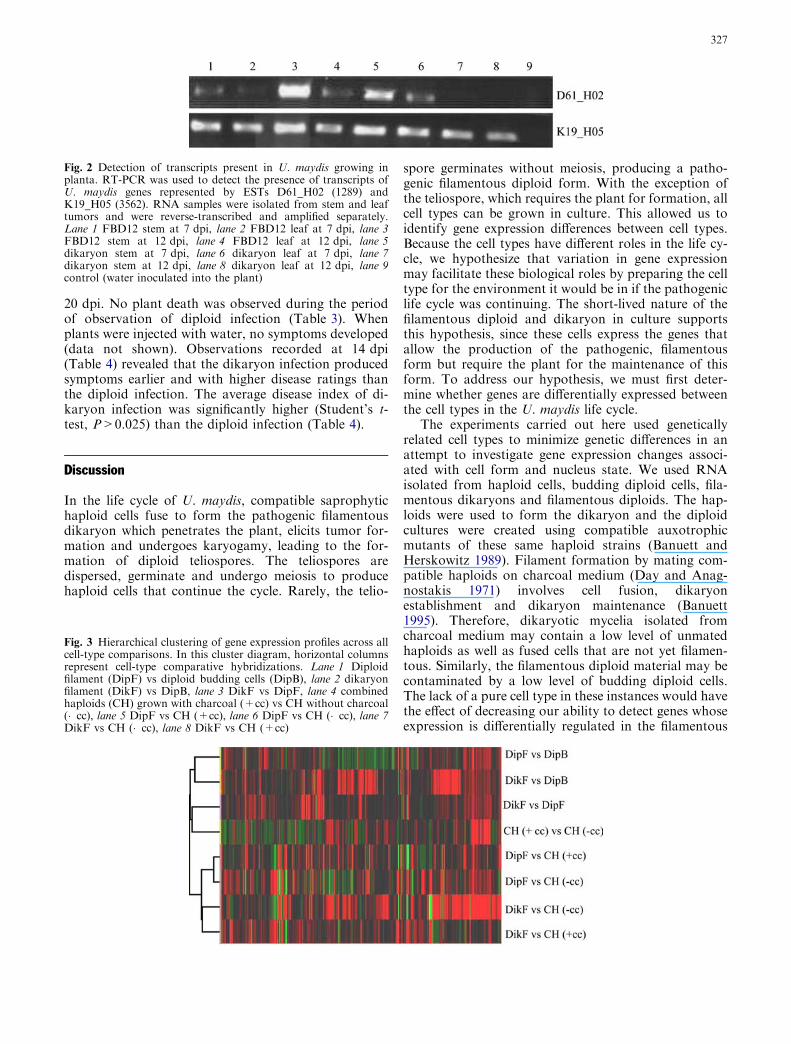
20 dpi. No plant death was observed during the periodof observation of diploid infection (Table 3). Whenplants were injected with water, no symptoms developed(data not shown). Observations recorded at 14 dpi(Table 4) revealed that the dikaryon infection producedsymptoms earlier and with higher disease ratings thanthe diploid infection. The average disease index of di-karyon infection was significantly higher (Student’s t-test, P>0.025) than the diploid infection (Table 4).
Discussion
In the life cycle of U. maydis, compatible saprophytichaploid cells fuse to form the pathogenic filamentousdikaryon which penetrates the plant, elicits tumor for-mation and undergoes karyogamy, leading to the for-mation of diploid teliospores. The teliospores aredispersed, germinate and undergo meiosis to producehaploid cells that continue the cycle. Rarely, the telio-
spore germinates without meiosis, producing a patho-genic filamentous diploid form. With the exception ofthe teliospore, which requires the plant for formation, allcell types can be grown in culture. This allowed us toidentify gene expression differences between cell types.Because the cell types have different roles in the life cy-cle, we hypothesize that variation in gene expressionmay facilitate these biological roles by preparing the celltype for the environment it would be in if the pathogeniclife cycle was continuing. The short-lived nature of thefilamentous diploid and dikaryon in culture supportsthis hypothesis, since these cells express the genes thatallow the production of the pathogenic, filamentousform but require the plant for the maintenance of thisform. To address our hypothesis, we must first deter-mine whether genes are differentially expressed betweenthe cell types in the U. maydis life cycle.
The experiments carried out here used geneticallyrelated cell types to minimize genetic differences in anattempt to investigate gene expression changes associ-ated with cell form and nucleus state. We used RNAisolated from haploid cells, budding diploid cells, fila-mentous dikaryons and filamentous diploids. The hap-loids were used to form the dikaryon and the diploidcultures were created using compatible auxotrophicmutants of these same haploid strains (Banuett andHerskowitz 1989). Filament formation by mating com-patible haploids on charcoal medium (Day and Anag-nostakis 1971) involves cell fusion, dikaryonestablishment and dikaryon maintenance (Banuett1995). Therefore, dikaryotic mycelia isolated fromcharcoal medium may contain a low level of unmatedhaploids as well as fused cells that are not yet filamen-tous. Similarly, the filamentous diploid material may becontaminated by a low level of budding diploid cells.The lack of a pure cell type in these instances would havethe effect of decreasing our ability to detect genes whoseexpression is differentially regulated in the filamentous
Fig. 2 Detection of transcripts present in U. maydis growing inplanta. RT-PCR was used to detect the presence of transcripts ofU. maydis genes represented by ESTs D61_H02 (1289) andK19_H05 (3562). RNA samples were isolated from stem and leaftumors and were reverse-transcribed and amplified separately.Lane 1 FBD12 stem at 7 dpi, lane 2 FBD12 leaf at 7 dpi, lane 3FBD12 stem at 12 dpi, lane 4 FBD12 leaf at 12 dpi, lane 5dikaryon stem at 7 dpi, lane 6 dikaryon leaf at 7 dpi, lane 7dikaryon stem at 12 dpi, lane 8 dikaryon leaf at 12 dpi, lane 9control (water inoculated into the plant)
Fig. 3 Hierarchical clustering of gene expression profiles across allcell-type comparisons. In this cluster diagram, horizontal columnsrepresent cell-type comparative hybridizations. Lane 1 Diploidfilament (DipF) vs diploid budding cells (DipB), lane 2 dikaryonfilament (DikF) vs DipB, lane 3 DikF vs DipF, lane 4 combinedhaploids (CH) grown with charcoal (+cc) vs CH without charcoal(�cc), lane 5 DipF vs CH (+cc), lane 6 DipF vs CH (�cc), lane 7DikF vs CH (�cc), lane 8 DikF vs CH (+cc)
327

growth forms relative to the budding cell types fromwhich they arise. Any alteration in the level of con-taminating budding cell forms would be expected toyield variation among the hybridization replicates. Afurther confounding factor is the presence or absence ofcharcoal. Haploid cells were grown in two conditions. Inthe first, the compatible haploids are co-spotted ontomedium without charcoal. This does not lead to theformation of the filamentous dikaryon but does allowthe haploids to be exposed to each other’s pheromone.The second involves the spotting of haploids separatelyonto charcoal-containing plates. This does not lead tofilament formation nor does it allow exposure to com-patible pheromones, but it does take into account therole of charcoal in altering gene expression. These twoconditions act as controls for gene expression changedue to the presence of charcoal alone. We assessedvariation in U. maydis gene expression through theconstruction and hybridization of cDNA microarrays.Even with the limitations of the experimental system,screening several genes simultaneously allowed us toidentify those that are differentially expressed. This, inturn, allowed us to address two questions: (1) are theredetectable differences in gene expression in the U. maydiscell types and (2) are there detectable differences in geneexpression that can be attributed to nucleus state?
To answer questions about gene expression differ-ences, it was necessary to first determine that the hun-dreds of different hybridizations occurring in themicroarray experiments provided valid signals. Thisvalidation was carried out by comparing the results ofreplicate hybridizations and, among other things,removing those hybridization results that were notabove background or not similar in all five replicates.After validation, we selected a 2.0-fold change in thelevel of signal as an indication of differential expression.
Under these criteria, differences in gene expression weredetected among different cell types. The differentiallyexpressed genes are presented in Table 2. To indepen-dently assess up-regulation of genes, we carried outNorthern hybridizations on a subset of genes (Fig. 1). Inthis assessment, the comparisons between filamentousdikaryons and filamentous diploids were confirmed forsome genes (Fig. 1a) but not for others (Fig. 1b). Apartfrom biological variation, this may reflect the method-ological variation between Northern and microarrayhybridization, for example, normalization to a specificgene in the Northerns and a more global normalizationin the microarray hybridizations. This is a reality thathas led to variation in other studies using microarraysand Northerns to investigate gene expression (Taniguchiet al. 2001; Akopyants et al. 2004; Yao et al. 2004). Sincewe used dikaryon and diploid cells that are essentiallyisogenic, the differences in gene expression detected andconfirmed between diploid and dikaryon filamentousgrowth forms can be attributed to differences in thenucleus state rather than nucleus content. A largernumber of genes showed differential expression in thehybridizations comparing the filamentous dikaryon withthe budding cells than in those hybridizations comparingthe filamentous diploid with the budding cells. Northernhybridizations confirmed this differential regulation forall genes investigated. Validation of the signal and sec-ondary confirmation by Northern hybridization indi-cated there are differences in gene expression betweencell types, including those between the dikaryotic anddiploid filamentous forms.
Another way to assess our expression data is tocompare it with previous data on the same genes. Thereare 18 cDNAs on the microarrays that represent previ-ously characterized U. maydis genes. There is expressiondata for four of these: egl1, ssp1, rum1 and frb136. Egl1
Table 4 Comparing the disease index of dikaryon and diploid infections
Strain inoculated Experimentalreplicates
Numberof plants
Disease rating scalea Diseaseindexb
Average disease indexc
0 1 2 3 4 5
Dikaryon (FB1·FB2) 1 20 1 4 1 2 2 10 3.50 3.28±0.11*2 20 0 6 2 2 2 8 3.203 20 0 5 2 4 3 6 3.15
Diploid (FBD12) 1 20 10 8 1 1 0 0 0.65 0.95±0.192 20 8 9 1 1 1 0 0.93 20 6 8 2 2 2 0 1.3
Table 3 Comparison ofdikaryon and diploidpathogenicity. – Absence ofplant death
Strain inoculated Time (dpi) when disease symptoms appeared
Chlorosis Anthocyanin Leafgalls
Stem gallsor tumors
Teliosporeformation
Plantdeath
Dikaryon (FB1·FB2) 1 2–3 3–4 5–6 10–12 14–16Diploid (FBD12) 2 4–6 8–10 10–12 18–20 –
a Observations recorded at 14 dpib The disease index is calculated as the sum of disease ratings di-vided by the number of plants
c The average disease index is the mean of three trials (±SE). Theasterisk (*) represents a significant difference (Student’s t-test,P>0.025) in the dikaryon infection relative to the diploid infection
328
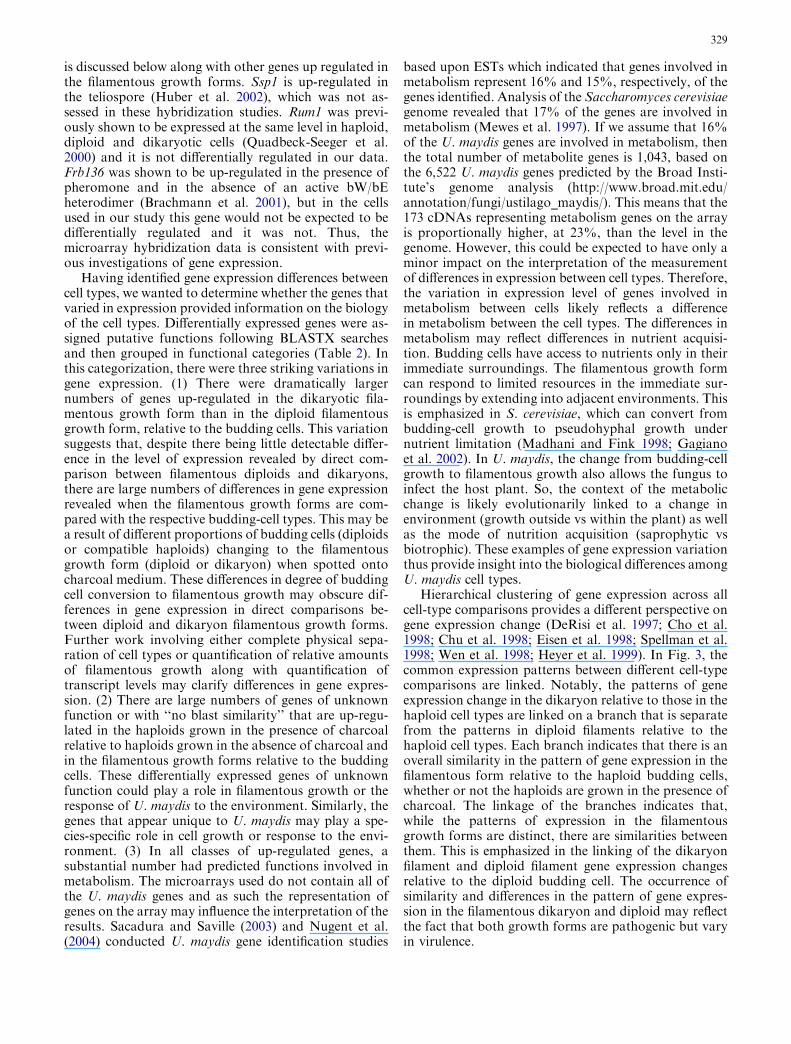
is discussed below along with other genes up regulated inthe filamentous growth forms. Ssp1 is up-regulated inthe teliospore (Huber et al. 2002), which was not as-sessed in these hybridization studies. Rum1 was previ-ously shown to be expressed at the same level in haploid,diploid and dikaryotic cells (Quadbeck-Seeger et al.2000) and it is not differentially regulated in our data.Frb136 was shown to be up-regulated in the presence ofpheromone and in the absence of an active bW/bEheterodimer (Brachmann et al. 2001), but in the cellsused in our study this gene would not be expected to bedifferentially regulated and it was not. Thus, themicroarray hybridization data is consistent with previ-ous investigations of gene expression.
Having identified gene expression differences betweencell types, we wanted to determine whether the genes thatvaried in expression provided information on the biologyof the cell types. Differentially expressed genes were as-signed putative functions following BLASTX searchesand then grouped in functional categories (Table 2). Inthis categorization, there were three striking variations ingene expression. (1) There were dramatically largernumbers of genes up-regulated in the dikaryotic fila-mentous growth form than in the diploid filamentousgrowth form, relative to the budding cells. This variationsuggests that, despite there being little detectable differ-ence in the level of expression revealed by direct com-parison between filamentous diploids and dikaryons,there are large numbers of differences in gene expressionrevealed when the filamentous growth forms are com-pared with the respective budding-cell types. This may bea result of different proportions of budding cells (diploidsor compatible haploids) changing to the filamentousgrowth form (diploid or dikaryon) when spotted ontocharcoal medium. These differences in degree of buddingcell conversion to filamentous growth may obscure dif-ferences in gene expression in direct comparisons be-tween diploid and dikaryon filamentous growth forms.Further work involving either complete physical sepa-ration of cell types or quantification of relative amountsof filamentous growth along with quantification oftranscript levels may clarify differences in gene expres-sion. (2) There are large numbers of genes of unknownfunction or with ‘‘no blast similarity’’ that are up-regu-lated in the haploids grown in the presence of charcoalrelative to haploids grown in the absence of charcoal andin the filamentous growth forms relative to the buddingcells. These differentially expressed genes of unknownfunction could play a role in filamentous growth or theresponse of U. maydis to the environment. Similarly, thegenes that appear unique to U. maydis may play a spe-cies-specific role in cell growth or response to the envi-ronment. (3) In all classes of up-regulated genes, asubstantial number had predicted functions involved inmetabolism. The microarrays used do not contain all ofthe U. maydis genes and as such the representation ofgenes on the array may influence the interpretation of theresults. Sacadura and Saville (2003) and Nugent et al.(2004) conducted U. maydis gene identification studies
based upon ESTs which indicated that genes involved inmetabolism represent 16% and 15%, respectively, of thegenes identified. Analysis of the Saccharomyces cerevisiaegenome revealed that 17% of the genes are involved inmetabolism (Mewes et al. 1997). If we assume that 16%of the U. maydis genes are involved in metabolism, thenthe total number of metabolite genes is 1,043, based onthe 6,522 U. maydis genes predicted by the Broad Insti-tute’s genome analysis (http://www.broad.mit.edu/annotation/fungi/ustilago_maydis/). This means that the173 cDNAs representing metabolism genes on the arrayis proportionally higher, at 23%, than the level in thegenome. However, this could be expected to have only aminor impact on the interpretation of the measurementof differences in expression between cell types. Therefore,the variation in expression level of genes involved inmetabolism between cells likely reflects a differencein metabolism between the cell types. The differences inmetabolism may reflect differences in nutrient acquisi-tion. Budding cells have access to nutrients only in theirimmediate surroundings. The filamentous growth formcan respond to limited resources in the immediate sur-roundings by extending into adjacent environments. Thisis emphasized in S. cerevisiae, which can convert frombudding-cell growth to pseudohyphal growth undernutrient limitation (Madhani and Fink 1998; Gagianoet al. 2002). In U. maydis, the change from budding-cellgrowth to filamentous growth also allows the fungus toinfect the host plant. So, the context of the metabolicchange is likely evolutionarily linked to a change inenvironment (growth outside vs within the plant) as wellas the mode of nutrition acquisition (saprophytic vsbiotrophic). These examples of gene expression variationthus provide insight into the biological differences amongU. maydis cell types.
Hierarchical clustering of gene expression across allcell-type comparisons provides a different perspective ongene expression change (DeRisi et al. 1997; Cho et al.1998; Chu et al. 1998; Eisen et al. 1998; Spellman et al.1998; Wen et al. 1998; Heyer et al. 1999). In Fig. 3, thecommon expression patterns between different cell-typecomparisons are linked. Notably, the patterns of geneexpression change in the dikaryon relative to those in thehaploid cell types are linked on a branch that is separatefrom the patterns in diploid filaments relative to thehaploid cell types. Each branch indicates that there is anoverall similarity in the pattern of gene expression in thefilamentous form relative to the haploid budding cells,whether or not the haploids are grown in the presence ofcharcoal. The linkage of the branches indicates that,while the patterns of expression in the filamentousgrowth forms are distinct, there are similarities betweenthem. This is emphasized in the linking of the dikaryonfilament and diploid filament gene expression changesrelative to the diploid budding cell. The occurrence ofsimilarity and differences in the pattern of gene expres-sion in the filamentous dikaryon and diploid may reflectthe fact that both growth forms are pathogenic but varyin virulence.
329

Our compilation of data in Table 2 reveals specificgenes that are differentially regulated and 21 instanceswhere the up-regulation of a gene in one cell-typehybridization class is supported by up-regulation in thesame cell type but in a separate hybridization class.Among the specific genes up-regulated are previouslydescribed U. maydis genes, including egl1 (UniEST 207),lga2 (UniEST 3812) and hmp1 (UniEST 266). Egl1 codesan endoglucanase that breaks down cellulose. This genewas shown by others to be strongly induced in the dik-aryotic filament relative to combined haploids grown inthe absence of charcoal (Schauwecker et al. 1995). Whilethis gene is not essential for filamentous growth orpathogenesis (Schauwecker et al. 1995), it may have a rolein pathogenic development. The gene expression changeobserved provides a completely independent confirma-tion of the gene expression differences we detectedthrough microarray hybridization. Lga2 is a gene codedin the a2 mating-type locus that is proposed to interferewith mitochondrial fusion. This action is controlled by aninteraction with Mrb1 and appears to have a link withpathogenesis (Bortfeld et al. 2004). Lga2 expression iscontrolled by the b mating-type locus (Romeis et al.2000). The b mating locus controls the transition fromsaprophytic to pathogenic growth and this transitionrequires the presence of proteins from different b alleles(for a review, see Banuett 1995). Upstream of lga2, thereis a recognition sequence for the binding of heterodimersof the b locus-encoded homeodomain proteins bE andbW. This is strong evidence that binding of the bE/Wheterodimers controls lga2 expression. Our data showsthat lga2 is up-regulated in the diploid filament versus thediploid budding cell (Table 2). These cell types are ex-pected to have the same potential for the formation ofheterodimeric bE and bW protein complexes, so the de-gree of lga2 gene expression change may either reflectfactors that alter the ability of the heterodimers to formor reflect a separate factor that controls lga2 geneexpression. Hmp1 is a protein that binds to DNA withcruciform structures, inducing or maintaining DNAstructural features (Dutta et al. 1997). Structural proteinsof this family are associated with alteration of geneexpression (Clark et al. 2004). Our data shows that hmp1is up-regulated in filamentous growth forms relative tobudding growth forms and that the transcript level maybe up-regulated in the dikaryon relative to the filamen-tous diploid. This suggests that hmp1 could be involvedin altering gene expression in the filamentous growthform through alteration of chromosome structure.Investigation of specific genes thus confirms geneexpression change, uncovers previously uncharacterizedinfluences on gene expression and identifies a possiblemechanism of influencing gene expression.
We also uncovered genes not previously characterizedin U. maydis that provide insight into the molecularevents of specific cell types. These include two genes in-volved in metabolism: uniEST 1947, a sugar phosphatepermease that is a member of the major facilitatorsuperfamily of proteins, and uniEST 5200, a phospho-
lipid methyl transferase. The differential expression ofthese genes (present in classes IV, V, VII, and in IV, VII,respectively) emphasizes the presence of metabolic dif-ferences between the filamentous growth forms andbudding cells. Two other genes, UniESTs 870 (a glucan1,3-b-glycosidase) and 2163 (a protein containing a steroltransfer family/sterol binding domain), are up-regulatedin the diploid filament versus the dikaryon filament, in thediploid filament versus the diploid budding cell and in thediploid filament versus the combined haploids grown inthe absence of charcoal. These genes may be generally up-regulated in the filamentous growth forms, supported by2163 also being up-regulated in the dikaryon versus thecombined haploid grown in the presence of charcoal, butseem to be further up-regulated in the diploid filamentousform. This suggests differences in metabolism betweenthe diploid and dikaryotic filamentous growth forms. Adifference in expression of glucan 1,3-b-glycosidase be-tween different filamentous growth form was observed inthe cultivated buttonmushroomAgaricus bisporus, whereit is expressed at a low level in vegetative mycelia and isup-regulated in the fruiting body (van de Rhee et al.1996). The genes represented by uniESTs 687 (a proteinwith a tuberin domain and a Rap-Gap domain) and 1507(a small nuclear GTPase of the Ras family) may be linkedin signal transduction. The tuberin domain is also foundin proteins that regulate cell cycle, cell growth, adhesionand vesicular trafficking, while the Rap-Gap domain isfound in GTPase activator proteins responsible for acti-vating nuclear RAS-related regulatory proteins, such asRap1, Rsp1 and Ran1. TheU. maydis nuclear Ras familymember is most similar to the essential S. cerevisiae geneGsp1/Cnr1, which is a Ran1 homologue that regulates theproper organization of the nucleus (Belhumeur et al.1993) as well as RNA processing and transport (Kado-waki et al. 1993). This suggests that the tuberin-con-taining protein and the GTPase may act together in U.maydis to link cell growth and/or vesicular trafficking tothe maintenance of nuclear organization and/or to RNAprocessing and transport. The coordinated up-regulationin the dikaryon and diploid filamentous growth formssuggests an increased requirement for this function inthese growth forms. The similar regulation of uniEST4743, an integrin b-4 binding protein and member of theeIF-6 family of translation initiation factors, providesanother link between the filamentous growth form andalterations in gene expression. Investigation of specificgenes thus identifies both the metabolite gene expressiondifferences between filamentous and budding cell typesand those between dikaryons and filamentous diploids. Italso uncovers co-regulated members of a potential signaltransduction cascade.
The gene expression variation we observed was incultures grown on plates. We were interested in whetherthese gene expression changes may reflect differences inbiology relating to U. maydis pathogenesis. We ad-dressed this in two ways. First, we used RT-PCR todetermine that two genes (represented by ESTsD61_H02, K19_H05) that are up-regulated in the
330

dikaryon versus the combined haploids without charcoaland in the diploid filament versus the diploid buddingcell were also expressed in U. maydis growing in planta(Fig. 2). This indicates that screening gene expressionchanges in U. maydis cultures growing on plates bycDNA microarray hybridization can identify genes ex-pressed during the biotrophic/pathogenic growth of thefungus. Second, since we observed gene expression dif-ferences between the filamentous dikaryon and diploid,we assessed whether there are differences in pathogenesisbetween these two cell forms. We determined that thediploid is less virulent than the dikaryon (Tables 3, 4Diploid infections produced smaller and fewer tumorsthan dikaryon infections, results consistent with those ofHolliday (1974); and the symptoms of diploid infectionsoccurred later than those of dikaryon infections. Thisresult is inconsistent with the same time-course ofinfection reported by Banuett and Herskowitz (1996).The inconsistency may be due to the use of a differentcorn line as host (Golden Bantam vs B164). If this is thecase, then there may be differences in how the U. maydisdiploids and dikaryons detect and respond to variationin host genotypes. This could lead to differences ingrowth within the plant, in signaling between U. maydisand the host or in the ability to elicit tumor formation(Holliday 1961; Kronstad and Leong 1989, 1990). Thegene expression change between dikaryons and fila-mentous diploids grown in culture may be related to avariation in virulence. This could be investigated withgenes that have large differences in expression betweenthese filamentous forms. A larger-scale comparison ofgene expression is required to identify such genes.
The discovery of a large number of genes that are up-regulated in the presence of carbon is interesting andseems very dramatic. Preliminary analysis of hybridiza-tions to microarrays with over five times the number ofcDNAs confirms the up-regulation of these genes butalso indicates that the number of genes up-regulated inthe presence of charcoal is not substantially greater thanthe number of genes up-regulated in other cell-typecomparisons. Thus, the apparently disproportionatenumber of up-regulated genes reported here may reflectthe selection of genes for printing on the microarray.Regardless of the proportion of genes, the number up-regulated is high and not readily explained. It should notbe unexpected that growing cells in a condition that al-lows mating and comparing this with a condition thatdoes not allow mating could result in differences in geneexpression. However, the number of genes whoseexpression changes is surprising. In a landmark discov-ery, Day and Anagnostakis (1971) first reported theuse of charcoal medium plates for mating assays inU. maydis. Yet, to our knowledge, there are no studiesthat reveal the exact nature of the change elicited bygrowth in the presence of charcoal. It may be that theadsorptive properties of activated charcoal remove aninhibitor produced by the cells and allow more efficientmating, or it could be that nutrient adsorption bythe charcoal sets up localized deficiencies or nutrient
gradients which change the cell’s environment enough tostimulate mating. Whatever the underlying factor, theend result is a substantial change in gene expression anda substantial increase in the ability of compatible hap-loids to mate. Further investigation of this induced geneexpression change may provide insight into uninvesti-gated environmental factors that affect mating. It mayalso provide an insight into the response of other fungito charcoal, such as the stimulation of bunt teliosporegermination (Boyd and Carris 1997) or the increasedcolonization of plants by mycorhizal fungi (Herrmannet al. 2004) in the presence of charcoal.
We have established a protocol for cDNA microarrayhybridization and identified genes that are differentiallyexpressed between U. maydis cell types. Categorizing thedifferentially expressed genes based upon functionrevealed variations in nutrient uptake, metabolism anda signal transduction pathway between filamentousand budding cells. Changes in nutrient acquisition andmetabolism may be evolutionarily linked to the devel-opment of an obligate biotrophic growth phase of theU. maydis life cycle. The signal transduction pathwayidentified could represent a manner in which signalsreceived from the plant could influence nucleus organi-zation, gene expression and the maintenance offilamentous growth. One of the U. maydis genes that ourmicroarray hybridizations show is differentially regu-lated confirmed similar results by others providing anadditional source of confidence about the data we ob-tained. The use of near-isogenic diploid and dikaryonfilamentous cultures also allowed us to identify geneswhose expression varies in relation to nuclear state. Theobservation that this variation correlates with a differ-ence in virulence provides a unique opportunity to fur-ther investigate gene expression changes that influencevirulence in a smut pathogen. This study thus provides abasis to initiate investigation in several unique areas ofbasidiomycete fungal pathogenesis.
Acknowledgements We thank Dr. F. Banuett for providing us withU. maydis strains. We acknowledge and thank Dr. Timothy J.Westwood, Director of the Canadian Drosophila MicroarrayCentre, and Dr. Jianming Pei and Scott J. Neal, Department ofBiology, University of Toronto at Mississauga, for their discussionand assistance on printing the cDNA microarray slides. We thankAli Zahiri, Eric Ho and Matthew Cahill for their comments on themanuscript. This work was supported by a Natural Sciences andEngineering Research Council grant to B.J.S.
References
Agrios GN (1997) Plant pathology, 4th edn. Academic, New YorkAign V, Hoheisel JD (2003) Analysis of nutrient-dependent tran-
script variations in Neurospora crassa. Fungal Genet Biol40:225–233
Akopyants NS, Matlib RS, Bukanova EN, Smeds MR, BrownsteinBH, Stormo GD, Beverley SM (2004) Expression profilingusing random genomic DNA microarrays identifies differen-tially expressed genes associated with three major develop-mental stages of the protozoan parasite Leishmania major. MolBiochem Parasitol 136:71–86
331
Austin R, Provart N, Sacadura NT, Nugent KG, Babu M, SavilleBJ (2004) A comparative genomic analysis of ESTs fromUstilago maydis. Funct Integr Genomics 4:207–218
Banuett F (1995) Genetics of Ustilago maydis, a fungal pathogenthat induces tumors in maize. Annu Rev Genet 29:179–208
Banuett F, Herskowitz I (1989) Different a alleles of Ustilagomaydis are necessary for maintenance of filamentousgrowth but not for meiosis. Proc Natl Acad Sci USA 86:5878–5882
Banuett F, Herskowitz I (1996) Discrete developmental stagesduring teliospore formation in the corn smut fungus, Ustilagomaydis. Development 122:2965–2976
Basse CW, Steinberg G (2004) Ustilago maydis, model system foranalysis of the molecular basis of fungal pathogenicity. MolPlant Pathol 5:83–92
Basse CW, Stumpferl S, Kahmann R (2000) Characterization of aUstilago maydis gene specifically induced during the biotrophicphase: evidence for negative as well as positive regulation. MolCell Biol 20:321–329
Belhumeur P, Lee A, Tam R, DiPaolo T, Fortin N, Clark MW(1993) GSP1 and GSP2, genetic suppressors of the prp20-1mutant in Saccharomyces cerevisiae: GTP-binding proteins in-volved in the maintenance of nuclear organization. Mol CellBiol 13:2152–2161
Bortfeld M, Auffarth K, Kahmann R, Basse CW (2004) TheUstilago maydis a2 mating-type locus genes iga2 and rga2compromise pathogenicity in the absence of the mitochondrialp32 family protein Mrb1. Plant Cell 16:2233–2248
Boyd ML, Carris LM (1997) Enhancement of teliospore germina-tion in wheat- and wild grass-infecting species of Tilletia onactivated charcoal medium. Phytopathology 88:260–264
Brachmann A, Weinzierl G, Kamper J, Kahmann R (2001) Iden-tification of genes in the bW/bE regulatory cascade in Ustilagomaydis. Mol Microbiol 42:1047–1063
Cano-Canchola C, Acevedo L, Ponce-Noyola P, Flores-MartinezA, Flores-Carreon A, Leal-Morales CA (2000) Induction oflytic enzymes by the interaction of Ustilago maydis with Zeamays tissues. Fungal Genet Biol 29:145–151
Chambergo FS, Bonaccorsi ED, Ferriera AJ, Ramos AS, FerrieraJJ Jr, Abrahao-Neto J, Farah JP, El-Dorry H (2002) Elucida-tion of the metabolic fate of glucose in filamentous fungusTrichoderma reesei using expressed sequence tag (EST) analysisand cDNA microarrays. J Biol Chem 277:13983–13988
Chigira Y, Abe K, Gomi K, Nakajima T (2002) ChsZ, a gene for anovel class of chitin synthase from Aspergillus oryzae. CurrGenet 41:261–267
Cho RJ, Campbell MJ, Winzeler EA, Steinmetz L, Conway A,Wodicka L, Wolfsberg TG, Gabriellan AE, Landsman D,Lockhart DJ, Davis RW (1998) A genomic-wide transcriptionalanalysis of the mitotic cell cycle. Mol Cell 2:65–73
Christensen JJ (1931) Studies on the genetics of Ustilago zeae.Phytopathology 4:124–188
Chu S, DeRisi J, Eisen M, Mulholland J, Botstein D, Brown PO,Herskowitz I (1998) The transcriptional program of sporulationin budding yeast. Science 282:699–705
Clark IA, Alleva LM, Mills AC, Cowden WB (2004) Pathogenesisof malaria and clinically similar conditions. Clin Microbiol Rev2004 17:509–539
Day PR, Anagnostakis SL (1971) Corn smut sikaryon in culture.Nat New Biol 231:19–20
DeRisi J, Penland L, Brown PO, Bittner ML, Meltzer PS, Ray M,Chen Y, Su YA, Trent JM (1996) Use of cDNA microarray toanalyse gene expression patterns in human cancer. Nat Genet14:457–460
DeRisi JL, Iyer VR, Brown PO (1997) Exploring the metabolic andgenetic control of gene expression on a genomic scale. Science278:680–686
Dutta S, Gerhold DL, Rice M, Germann M, Kmiec EB (1997)The cloning and overexpression of a cruciform bindingprotein from Ustilago maydis. Biochim Biophys Acta 1352:258–266
Eisen MB, Spellman PT, Brown PO, Botstein D (1998) Clusteranalysis and display of genome-wide expression patterns. ProcNatl Acad Sci USA 95:14863–14868
Gagiano M, Bauer FF, Pretorius IS (2002) The sensing of nutri-tional status and the relationship to filamentous growth inSaccharomyces cerevisiae. FEMS Yeast Res 2:433–470
Gold SE, Brogdon SM, Mayroga ME, Kronstad JW (1997) TheUstilago maydis regulatory subunit of a cAMP-dependentprotein kinase is required for gall formation in maize. Plant Cell9:1585–1594
Herrmann S, Oelmuller R, Buscot F (2004) Manipulation of theonset of ectomycorrhiza formation by indole-3-acetic acid,activated charcoal or relative humidity in the association be-tween oak microcuttings and Piloderma croceum: influence onplant development and photosynthesis. J Plant Physiol161:509–517
Heyer LJ, Kruglyak S, Yooseph S (1999) Exploring expressiondata: identification and analysis of co-expressed genes. GenomeRes 9:1106–1115
Holliday R (1961) Induced mitotic crossing-over in Ustilago may-dis. Genet Res 2:231–248
Holliday R (1974) Ustilago maydis. In: King RC (ed) Handbook ofgenetics, vol 1. Plenum, New York, pp 575–595
Huber SMFE, Lottspeich F, Kamper J (2002) A gene that encodesa product with similarity to dioxygenases is highly expressed inteliospores of Ustilago maydis. Mol Genet Genomics 267:757–771
Kadowaki T, Goldfarb D, Spitz LM, Tartakoff AM, Ohno M(1993) Regulation of RNA processing and transport by a nu-clear guanine nucleotide release protein and members of theRas superfamily. EMBO J 12:2929–2937
Kojic M, Kostrub CF, Buchman AR, Holloman WK (2002)BRCA2 homolog required for proficiency in DNA repair,recombination, and genome stability in Ustilago maydis. MolCell 10:683–691
Kronstad JW, Leong SA (1989) Isolation of two alleles of the blocus of Ustilago maydis. Proc Natl Acad Sci USA 86:978–982
Kronstad JW, Leong SA (1990) The b mating- type locus ofUstilago maydis contains variable and constant regions. GenesDev 4:1384–1395
Madhani HD, Fink GR (1998) The control of filamentousdifferentiation and virulence in fungi. Trends Cell Biol 8:348–353
Martınez-Espinoza AD, Garcia-Pedrajas MD, Gold SE (2002) Theustilaginales as plant pests and model systems. Fungal GenetBiol 35:1–20
Mews HW, Albermann K, Bahr M, Frishman D, Gleissner A,Hani J, Heumann K, Kliene K, Maierl A, Oliver SG, Pfeiffer F,Zollner A. (1997) Overview of the yeast genome. Nature 387[Suppl]:7–8
Neal SJ, Gibson M, Anthony KC, Westwood JT (2003) Con-struction of a cDNA-based microarray for Drosophila mela-nogaster: a comparison of gene transcription profiles from SL2and Kc167 cells. Genome 46:879–892
Nugent KG, Choffe K, Saville BJ (2004) Gene expression duringUstilago maydis diploid filamentous growth: EST library crea-tion and analyses. Fungal Genet Biol 41:349–360
O’Donnell KL, McLaughlin DJ (1984) Ultrastructure of meiosis inUstilago maydis. Mycologia 76:468–485
Quadbeck-Seeger C, Wanner G, Huber S, Kahmann R, Kamper J(2000) A protein with similarity to the human retinoblastomabinding protein 2 acts specifically as a repressor for genes reg-ulated by the b mating-type locus in Ustilago maydis. MolMicrobiol 38:154–166
van de Rhee MD, Mendes O, Werten MWT, Huizing HJ, Moo-ibroek H (1996) Highly efficient homologous integration viatandem exo-b-1,3,-glucanase genes in common mushroom,Agaricus bisporus. Curr Genet 30:166–173
Romeis T, Brachmann A, Kahmann R, Kamper J (2000) Identifi-cation of a target gene for bE-bW homeodomain proteincomplex in Ustilago maydis. Mol Microbiol 37:54–66
332

Ross DT, Scherf U, Eisen MB, Perou CM, Rees C, Spellman P,Iyer V, Jeffrey SS, Van de Rijn M, Waltham M, Pergamen-schikov A, Lee JCF, Lashkari D, Shalon D, Myers TG,Weinstein JN, Botstein D, Brown PO (2000) Systematic varia-tion in gene expression patterns in human cancer cell lines. NatGenet 24:227–235
Sacadura NT, Saville BJ (2003) Gene expression and EST analysesof Ustilago maydis germinating teliospores. Fungal Genet Biol40:47–64
Sambrook J, Russell DW (2001) Molecular cloning: a laboratorymanual, 3rd edn. Cold Spring Harbor Laboratory, Cold SpringHarbor, N.Y., pp 7.27–7.30
Saville BJ, Leong SA (1992) The molecular biology of pathogenesisin Ustilago maydis. In: Setlow JK (ed) Genetic engineering:principles and methods, vol 14. Plenum, New York
Schauwecker F, Wanner G, Kahmann R (1995) Filament-specificexpression of a cellulose gene in the dimorphic fungus Ustilagomaydis. Biol Chem Hoppe-Seyler 376:617–625
Sims AH, Robson GD, Hoyle DC, Oliver SG, Turner G, PradeRA, Russell HH, Dunn-Coleman NS, Gent ME (2004) Use ofexpressed sequence tag analysis and cDNA microarrays of thefilamentous fungus Aspergillus nidulans. Fungal Genet Biol41:199–212
Snetselaar KM, Mims CW (1992) Sporidial fusion and infection ofmaize seedlings by the smut fungus Ustilago maydis. Mycologia84:193–203
Snetselaar KM, Mims CW (1994) Light and electron microscopy ofUstilago maydis hyphae in maize. Mycol Res 98:347–355
Spellman PT, Sherlock G, Zhang MQ, Iyer VR, Anders K, EisenMB, Brown PO, Botstein D, Futcher B (1998) Comprehensiveidentification of cell cycle regulated genes of the yeast Saccha-romyces cerevisiae by microarray hybridization. Mol Biol Cell9:3273–3297
Takano Y, Choi W, Mitchell TK, Okuno T, Dean RA (2003) Largescale parallel analysis of gene expression during infection-re-lated morphogenesis of Magnaporthe grisea. Mol Plant Pathol4:337–346
Taniguchi M, Miura K, Iwao H, Yamanaka S (2001) Quantitativeassessment of DNA microarrays—comparison with northernblot analyses. Genomics 71:34–39
Wen X, Furham S, Michaels GS, Carr DB, Smith S, Barker JL,Somogyi R (1998) Large-scale temporal gene expression map-ping of central nervous system development. Proc Natl AcadSci USA 95:334–339
Yao B, Rakhade SN, Li Q, Ahmed S, Krauss R, Draghici S, LoebJA (2004) Accuracy of cDNA microarray methods to detectsmall gene expression changes induced by neuregulin on breastepithelial cells. BMC Bioinformatics 5:1–16
333
Copyright © 2022 FDOKUMEN