Thesis report_Nadia_Othman_Depot_Final_2
200
NNT : 2016SACLL003 L Sciences et tec S Fusion techn Thèse présentée et soutenu Composition du Jury: Mme Florence TUPIN , Profes M. Amine NAIT-ALI , Profes Mme Stephanie SCHUCKERS Mme Maria DE MARSICO , A M. Emine KRICHEN, Docteu Mme Bernadette DORIZZI , P THESE DE DOCTORAT DE L’UNIVERSITE PARIS-SACLAY PREPAREE A TELECOM SUDPARIS ÉCOLE DOCTORALE N°580 chnologies de l'information et de la com Spécialité de doctorat : Informatique Par Mme Nadia Othman niques for iris recognition in degraded s ue à Evry, le 11 mars 2016 : sseure, Télécom ParisTech, France - Présidente d sseur, Université Paris-Est Créteil, France - Rappo S , Full Professor, Clarkson University, Etats-Uni Associate Professor, Sapienza Università Di Rom ur, MORPHO GROUPE SAFRAN, France - Exam Professeure, Télécom SudParis, France - Directric mmunication sequences du Jury orteur is - Rapporteur ma, Italie - Examinatrice minateur ce de thèse
-
Upload
khangminh22 -
Category
Documents
-
view
2 -
download
0
Transcript of Thesis report_Nadia_Othman_Depot_Final_2

NNT : 2016SACLL003
L
Sciences et technologies de l'information et de la
Spécialité de doctorat
Fusion techniques for iris recognition in degraded sequences
Thèse présentée et soutenue à Evry, le 11 mars 2016
Composition du Jury: Mme Florence TUPIN , Professeure, M. Amine NAIT-ALI , Professeur, Université ParisMme Stephanie SCHUCKERS , Full Professor, Clarkson University, EtatsMme Maria DE MARSICO , Associate ProfessM. Emine KRICHEN, Docteur, MORPHO GROUPE SAFRAN, France Mme Bernadette DORIZZI , Professeure, Télécom SudParis, France
THESE DE DOCTORAT DE
L’UNIVERSITE PARIS-SACLAY PREPAREE A
TELECOM SUDPARIS
ÉCOLE DOCTORALE N°580 Sciences et technologies de l'information et de la communication
Spécialité de doctorat : Informatique
Par
Mme Nadia Othman
Fusion techniques for iris recognition in degraded sequences
Thèse présentée et soutenue à Evry, le 11 mars 2016 :
Mme Florence TUPIN , Professeure, Télécom ParisTech, France - Présidente du JuryALI , Professeur, Université Paris-Est Créteil, France - Rapporteur
Mme Stephanie SCHUCKERS , Full Professor, Clarkson University, Etats-Unis Mme Maria DE MARSICO , Associate Professor, Sapienza Università Di Roma, Italie M. Emine KRICHEN, Docteur, MORPHO GROUPE SAFRAN, France - ExaminateurMme Bernadette DORIZZI , Professeure, Télécom SudParis, France - Directrice de thèse
communication
Fusion techniques for iris recognition in degraded sequences
Présidente du Jury Rapporteur
Unis - Rapporteur or, Sapienza Università Di Roma, Italie - Examinatrice
Examinateur Directrice de thèse

Acknowledgments
Preparing a thesis is a challenging task, but I have been lucky to be professionally and
personally well-supported.
First and foremost, I would like to thank to my supervisor Prof. Bernadette Dorizzi for guiding
and supervising me throughout the thesis. I am especially grateful for her valuable advices,
comments, analyses and encouragements. Our discussions were very beneficial for me, which
has contributed to the success of this thesis. I have a great respect for her not only for teaching
me research skills but also for taking care personally.
I add a special thank to Dr. Nesma Houmani for her technical advices and remarks that have
been valuable to me.
I would like to thank Prof. Florence Tupin, Prof. Amine Nait-ali, Prof. Stephanie Schuckers,
Prof. Maria De Marsico, and Dr. Emine Krichen for being members of my PhD committee and
for their comments and suggestions for improving this doctoral work.
I would like also to thank Prof. Stephanie Schuckers for providing us QFIRE database which
was very useful to my research.
Special thanks go to all my colleagues of Télécom SudParis at Nano-INNOV for making
enjoyable and friendly my daily environment.
Finally, I acknowledge the support of my relatives during all my scholarship. In particular, I
dedicate this thesis to my parents.

0: Abstract
i
Abstract
Among the large number of biometric modalities, iris is considered as a very reliable biometrics
with a remarkably low error rate. The excellent performance of iris recognition systems are
obtained by controlling the quality of the captured images and by imposing certain constraints on
users, such as standing at a close fixed distance from the camera. However, in many real-world
applications such as control access and airport boarding these constraints are not suitable due to
the fact that the acquisition can be done at a large distance, with possible subject’s movement. In
such non ideal conditions, the resulting iris images suffer from diverse degradations such as a
lack of resolution, low contrasts and strong occlusions. All these disturbances have a negative
impact on the recognition rate.
One way to try to circumvent this bad situation is to use some redundancy arising from
the availability of several images of the same eye in the recorded sequence. Therefore, this thesis
focuses on how to fuse the information available in the sequence in order to improve the
performance. In the literature, diverse schemes of fusion have been proposed at different levels
(score, pixel, feature and bit). However, all these works agree on the fact that the quality of the
used images in the fusion process is an important factor for its success in increasing the
recognition rate. Therefore, researchers concentrated their efforts in the estimation of image
quality to weight each image in the fusion process according to its quality. There are various iris
quality factors to be considered and diverse methods have been proposed for quantifying these
criteria. These quality measures are generally combined to one unique value: a global quality.
However, there is no universal combination scheme to do so and some a priori knowledge has to
be inserted. Moreover, whatever the method used, the fusion process requires previously a
normalization step on the quality values, which is not a trivial task either.
To deal with these disadvantages, in this thesis we propose of a novel way of measuring
and integrating quality measures in the image fusion scheme aiming at improving the
performance. More precisely, we propose quality-based super-resolution approaches. This
strategy can handle two types of issues for iris recognition: the lack of resolution and the
presence of various artifacts in the captured iris images.
The first part of the doctoral work consists in elaborating a relevant quality metric able
to quantify locally the quality of the iris images. Our measure relies on a Gaussian Mixture

0: Abstract
ii
Model estimation of clean iris texture distribution. A global quality can be defined by using the
different local quality measures estimated on different sub-parts of the iris image. The interest of
our quality measure is 1) its simplicity, 2) its computation does not require identifying in
advance the type of degradations that can occur in the iris image, 3) its uniqueness, avoiding thus
the computation of several quality metrics and associated combination rule and 4) its ability to
measure the intrinsic quality and to specially detect segmentation errors.
In the second part of the thesis, we propose two novel quality-based fusion schemes.
Firstly, we suggest using our quality metric as a global measure in the fusion process in two
ways: as a selection tool for detecting the best images and as a weighting factor at the pixel-level
in the super-resolution scheme. In the last case, the contribution of each image of the sequence in
final fused image will only depend on its overall quality. Secondly, taking advantage of the
localness of our quality measure, we propose an original fusion scheme based on a local
weighting at the pixel-level, allowing us to take into account the fact that degradations can be
different in diverse parts of the iris image. This means that regions free from occlusions will
contribute more in the image reconstruction than regions with artefacts. Thus, the quality of the
fused image will be optimized in order to improve the performance.
The effectiveness of the proposed approaches is shown on several databases commonly
used: MBGC portal, Casia-Iris-Thousand and QFIRE at three different distances: 5, 7 and 11
feet. We separately investigate the improvement brought by the super-resolution, the global
quality and the local quality in the fusion process. In particular, the results show the important
improvement brought by the use of the global quality, improvement that is even increased using
the local quality.
Keywords : Iris recognition; Data fusion; Global and local quality; Texture pattern; Super-
resolution; Gaussian mixture model.
0: Résumé
iii
Résumé
Parmi les diverses modalités biométriques qui permettent l'identification des personnes, l'iris est
considéré comme très fiable, avec un taux d'erreur remarquablement faible. Toutefois, ce niveau
élevé de performances s'obtient en contrôlant la qualité des images acquises et en imposant de
fortes contraintes à la personne (être statique et à proximité de la caméra). Cependant, dans de
nombreuses applications de sécurité comme les contrôles d'accès, ces contraintes ne sont plus
adaptées car l'utilisateur peut se trouver loin de l'objectif ou en mouvement. Les images
résultantes souffrent alors de diverses dégradations : manque de résolution, faibles contrastes et
occlusions importantes. Toutes ces perturbations ont un impact négatif sur les taux de
reconnaissance.
Pour contourner ce problème, il est possible d’exploiter la redondance de l’information
découlant de la disponibilité de plusieurs images du même œil dans la séquence enregistrée.
Cette thèse se concentre sur la façon de fusionner ces informations, afin d'améliorer les
performances. Dans la littérature, diverses méthodes de fusion ont été proposées à différents
niveaux (score, pixel, descripteur et bits). Cependant, tous ces travaux s’accordent sur le fait que
la qualité des images utilisées dans la fusion est un facteur crucial pour sa réussite. Plusieurs
facteurs de qualité doivent être pris en considération et différentes méthodes ont été proposées
pour les quantifier. Ces mesures de qualité sont généralement combinées pour obtenir une valeur
unique et globale. Cependant, il n'existe pas de méthode de combinaison universelle et des
connaissances a priori doivent être utilisées ainsi qu'une étape de normalisation qui rendent le
problème non générique et non trivial.
Pour faire face à ces limites, nous proposons une nouvelle manière de mesurer et
d'intégrer des mesures de qualité dans le schéma de fusion d'images. Plus précisément, nous
proposons des approches de super-résolution complétées par des critères de qualité. Cette
stratégie permet de remédier à deux types de problèmes courants en reconnaissance par l'iris: le
manque de résolution et la présence d’artefacts dans les images d'iris.
La première partie de la thèse consiste en l’élaboration d’une mesure de qualité
pertinente pour quantifier la qualité d’image d’iris. Elle repose sur une mesure statistique locale
de la texture de l’iris grâce à un modèle de mélange de Gaussienne. Une qualité globale peut
aussi être définie à partir de ces différentes mesures locales, effectuées sur les sous-parties de
l'iris. L'intérêt de notre mesure est 1) sa simplicité, 2) son calcul ne nécessite pas d'identifier a

0:
iv
priori les types de dégradations, 3) son unicité, évitant ainsi l’estimation de plusieurs facteurs de
qualité et un schéma de combinaison associé et 4) sa capacité à prendre en compte la qualité
intrinsèque des images mais aussi, et surtout, les défauts liés à une mauvaise segmentation de la
zone d’iris.
Dans la deuxième partie de la thèse, nous proposons de nouvelles approches de fusion
basées sur des mesures de qualité. Tout d’abord, notre métrique est utilisée comme une mesure
de qualité globale de deux façons différentes: 1) comme outil de sélection pour détecter les
meilleures images de la séquence et 2) comme facteur de pondération au niveau pixel dans le
schéma de super-résolution. Dans le deuxième cas, la contribution de chaque image de la
séquence dans la reconstruction de l’image finale dépendra uniquement de sa qualité globale.
Puis, profitant du caractère local de notre mesure de qualité, nous proposons un schéma de
fusion original basé sur une pondération locale au niveau pixel, permettant ainsi de prendre en
compte le fait que les dégradations peuvent varier d’une sous partie à une autre. Ainsi, les zones
de bonne qualité contribueront davantage à la reconstruction de l'image fusionnée que les zones
présentant des artéfacts. Par conséquent, l'image résultante sera de meilleure qualité et pourra
donc permettre d'assurer de meilleures performances en reconnaissance.
L'efficacité des approches proposées est démontrée sur plusieurs bases de données
couramment utilisées: MBGC portal, Casia-Iris-Thousand et QFIRE à trois distances différentes.
Nous étudions séparément l'amélioration apportée par la super-résolution, la qualité globale et la
qualité locale dans le processus de fusion. En particulier, les résultats montrent une amélioration
importante apportée par l'utilisation de la qualité globale, amélioration qui est encore augmentée
en utilisant la qualité locale.
Mots-clés : Reconnaissance par l’iris; Fusion d’information; Qualité globale et locale; Motif
de texture; Super-resolution; Mélange de Gaussienne.

0: Contents
v
Contents
Abstract ...................................................................................................................................... i
Résumé .................................................................................................................................... iii
Contents .................................................................................................................................... v
List of Tables ........................................................................................................................... ix
List of Figures .......................................................................................................................... xi
Acronyms and abbreviations .................................................................................................... xv
Chapter 1. Introduction ...................................................................................................... 2
1.1. History of iris recognition ..................................................................................... 4
1.2. Deployments of iris recognition systems: Security applications ............................. 5
1.3. Iris acquisition ...................................................................................................... 7
1.3.1. Controlled mode: conventional acquisition ................................................... 8
1.3.2. Uncontrolled mode: less constrained acquisition ........................................... 9
1.4. Iris recognition ................................................................................................... 11
1.5. Objective and contributions of the thesis ............................................................. 12
1.6. Thesis organization ............................................................................................. 16
1.7. List of publications ............................................................................................. 17
Chapter 2. Evaluation of iris recognition systems ............................................................. 20
2.1. General evaluation of biometric systems ............................................................. 21
2.1.1. Score distributions ...................................................................................... 22
2.1.2. Accuracy rates ............................................................................................ 23
2.1.3. Performance curves .................................................................................... 25
2.1.4. Image specific evaluation ........................................................................... 26

0: Contents
vi
2.2. Evaluation of quality measurement algorithms .................................................... 28
2.2.1. Ranked DET .............................................................................................. 30
2.2.2. Error versus reject curves ........................................................................... 31
2.3. Reference iris databases ...................................................................................... 31
2.3.1. Multiple Biometrics Grand Challenge: Portal dataset .................................. 33
2.3.2. CASIA-IrisV4-Thousand ............................................................................ 34
2.3.3. QFIRE database ......................................................................................... 35
2.4. Benchmarks ........................................................................................................ 38
2.5. Conclusion ......................................................................................................... 43
Chapter 3. Fundamentals in iris acquisition and recognition systems ................................ 44
3.1. Iris recognition systems in the literature .............................................................. 46
3.1.1. Daugman's iris recognition system .............................................................. 46
3.1.2. Wildes' approach ........................................................................................ 50
3.1.3. Recent algorithms....................................................................................... 51
3.1.4. Open source systems for iris recognition ..................................................... 53
3.2. Reference systems developed by our research team ............................................. 54
3.2.1. Relevant versions: OSIRIS's evolution ....................................................... 55
3.2.1.1. OSIRISV2 .................................................................................................. 55
3.2.1.2. OSIRISV4 .................................................................................................. 56
3.2.1.3. OSIRISV4.1 ............................................................................................... 58
3.2.2. OSIRIS's impact in the research community and evaluation performance .... 62
3.3. Iris acquisition systems in less constrained environments .................................... 65
3.3.1. Literature review ........................................................................................ 65
3.3.2. Challenges in iris acquisition systems ......................................................... 68
3.4. Conclusion ......................................................................................................... 69

0: Contents
vii
Chapter 4. Design of a quality measurement algorithm for improving iris recognition ...... 72
4.1. Related works ..................................................................................................... 73
4.1.1. Iris image qualities ..................................................................................... 74
4.1.2. Synthesis and conclusion ............................................................................ 81
4.2. Definition of the proposed method for quality assessment ................................... 84
4.2.1. Choice of the model ................................................................................... 84
4.2.2. Description of the model ............................................................................ 85
4.2.3. Implementation of the model ...................................................................... 86
4.2.3.1. Model's input vector for characterizing good iris texture ............................. 86
4.2.3.2. Estimation of the model's parameters .......................................................... 91
4.2.4. Computation of our quality measurement ................................................... 92
4.3. Evaluation of our quality metric .......................................................................... 96
4.3.1. Validation of the improved GMM-based quality: GMM5obs ...................... 96
4.3.2. Assessment of the improved GMM-based quality: GMM5obs .................... 98
4.3.2.1. Relationship between the GMM-based quality and the quality of the texture
98
4.3.2.2. Relationship between the GMM-based quality and the usable iris area ........ 99
4.4. Conclusion ....................................................................................................... 102
Chapter 5. Fusion approaches for iris recognition in sequences ...................................... 104
5.1. Related works ................................................................................................... 105
5.1.1. Signal fusion of iris sequences .................................................................. 105
5.1.2. Synthesis and choice of the fusion approach ............................................. 109
5.2. Proposed approaches for fusing iris sequences .................................................. 111
5.2.1. Fusion process .......................................................................................... 111
5.2.1.1. Super-resolution implementation .............................................................. 111

0: Contents
viii
5.2.1.2. Integration of quality assessments ............................................................. 116
5.2.2. Overall architecture of the quality-based system ....................................... 117
5.3. Assessment of the proposed fusion processes .................................................... 119
5.3.1. Preliminary works .................................................................................... 120
5.3.1.1. Multiple biometric Grand Challenge: Portal dataset .................................. 120
5.3.1.2. CASIA-IrisV4-Thousand .......................................................................... 126
5.3.2. Final model tested on QFIRE databases .................................................... 130
5.3.2.1. No fusion vs. simple average fusion ......................................................... 132
5.3.2.2. Impact of the acquisition distance on the super-resolution improvement ... 133
5.3.2.3. Assessment of the global and local quality in the fusion scheme ............... 134
5.4. Conclusion ....................................................................................................... 138
Chapter 6. Quality assessment at the bit-level ................................................................ 140
6.1. Existence of consistent/inconsistent bits in the irisCodes ................................... 141
6.1.1. Related works .......................................................................................... 141
6.1.2. Synthesis and conclusion .......................................................................... 147
6.2. Integration of the local quality at the bit-level in the fusion process ................... 148
6.3. Comparative evaluations ................................................................................... 153
6.3.1. Experiments and results ............................................................................ 153
6.3.2. Discussion and conclusions ...................................................................... 156
6.4. Conclusion ....................................................................................................... 157
Chapter 7. Conclusions and perspectives ....................................................................... 158
Bibliography .............................................................................................................................. i
Appendix A: Personal publications ............................................................................................. i
Appendix B: QFIRE subset and protocols ................................................................................. iii

0: List of Tables
ix
List of Tables
Table 1-1: Summary of public deployment of iris biometric systems (data from [1]). ................. 7
Table 2-1: Characteristics of each of the 3 subsets of QFIRE database. .................................... 37
Table 2-2: Characteristic and noise factors in open iris databases. ............................................ 38
Table 2-3: Results of the MBGC portal workshop. ................................................................... 40
Table 3-1: OSIRIS citations for each version since 2009. ......................................................... 63
Table 3-2: Summary of works that have used OSIRISV2 and OSIRISV4.1. ............................. 64
Table 4-1: Overview on quality factors that have been studied in the literature. ........................ 77
Table 4-2: GLCM's statistic features. v is number of gray-levels in the image. ( , ) and
( , ) are respectively means and standards deviations of row x and column y. ................... 90
Table 4-3: Improvement of the FNMR@FMR=0.001 and the IFNMR at a 3% rejection of
comparisons based on UIA, GQ, AND GQM on QFIRE database. ......................................... 102
Table 5-1: Equal error rate on the portal challenge of MBGC for different score's fusion
schemes. ................................................................................................................................ 123
Table 5-2: Equal error rate on the portal challenge of MBGC for different image‘s fusion
methods without using quality. .............................................................................................. 123
Table 5-3: Equal error rate on the portal challenge of MBGC for different image‘s fusion
methods with and without quality measures. .......................................................................... 124
Table 5-4: Equal error rate on CASIA-IrisV4-Thousand for different score's fusion schemes. 128
Table 5-5: Equal error rate on the CASIA-IrisV4-Thousand for different image‘s fusion methods
.............................................................................................................................................. 128
Table 5-6: FRR@FAR=0.001 on QFIRE databases for 1 to 1, Best to best, and SA................ 133
Table 5-7: FRR@FAR=0.001 on QFIRE databases for the fusion schemes: SA, and SR-NoQ.
.............................................................................................................................................. 133
Table 5-8: FRR@FAR=0.001 on QFIRE databases for the fusion schemes SR-NoQ of scenario
BestIm and SR-GQ for scenario AllIm. .................................................................................. 136

0: List of Tables
x
Table 6-1: FRR@FAR=0.001 on QFIRE databases for the fusion schemes: SR-LQ and SR-
HDxLQ. ................................................................................................................................ 153
Table 6-2: FRR@FAR=0.001 on QFIRE databases for the fusion schemes: SR-HDxFB and SR-
OptimizedIC. ......................................................................................................................... 155

0: List of Figures
xi
List of Figures
Figure 1-1: Frontal view of a schematical human eye [3] ........................................................... 3
Figure 1-2: An example of IRIS gates used at an airport terminals for registered frequent
travelers in lieu of passport presentation [19]. ............................................................................ 6
Figure 1-3: Iris image acquired in near infrared band with LG2200 sensor. ................................ 8
Figure 1-4: An example of a correct iris acquisition, with some of its desirable properties marked
up [24]....................................................................................................................................... 9
Figure 1-5: Examples of iris acquisition devices: (a) IrisAccess2200 from LG/IrisID with an
acquisition range between 8 to 25 cm, and (b) IRISPASS-H from OKI with an acquisition
distance of approximately 3 cm. ................................................................................................ 9
Figure 1-6: Examples of degraded iris images: (a) Specular reflection, (b) Irregular illumination,
(c) Out of focus, (d) Low contrast, (e) Off-center and (f) Occlusions. ....................................... 10
Figure 1-7: Standard components in a classical iris recognition system: (a) Iris segmentation: the
red regions correspond to the artifacts, detected by the iris recognition system. The green circles
delimit the iris area. (b) Iris mask: The white pixels belong to the iris, the remaining black pixels
are considered as noisy regions, (c) Normalized iris image, and (d) IrisCode [33]. ................... 12
Figure 2-1: Genuine and impostor distributions for (a) an ideal system, and (b) a real system. .. 23
Figure 2-2: Performance of a biometric system: Relationship between FAR, FRR and EER. .... 24
Figure 2-3: Example of DET curves and some operating points for two distinct biometric
systems. ................................................................................................................................... 25
Figure 2-4: Illustration of ranked DET curves: (a) Relevant QMA: A proper behavior is observed
and (b) Irrelevant QMA: the ranked DET curves are incorrectly ordered. ................................. 31
Figure 2-5: Illustration of MBGC portal acquisition. ................................................................ 33
Figure 2-6: Examples of bad quality images taken from MBGC portal: (a) out of focus, (b)
eyelid and eyelashes occlusions, (c) closed eye, and (d) dark image (low contrast). .................. 34
Figure 2-7: Sequence of images for the subject S5025L from CASIA-IrisV4-Thousand. .......... 35

0: List of Figures
xii
Figure 2-8: Degradation of the iris texture since the distance of the acquisition increases. The
selected images correspond to best image in the sequence. ....................................................... 36
Figure 2-9: QFIRE acquisition [39].......................................................................................... 37
Figure 3-1: Illustration of the transformation procedure proposed by Daugman’s normalization
[33]. On the left, the original image. The iris is segmented by two circles. On the right, the
corresponding unwrapped texture according to Daugman's rubber sheet. .................................. 47
Figure 3-2: Illustration of the phase quantization. ..................................................................... 48
Figure 3-3: Segmentation results in OSIRISV2: (a) Initial contours, (b) accurate contours, and
(c) the associated mask [33]. .................................................................................................... 56
Figure 3-4: Application points uniformly distributed in a normalized iris image. ...................... 56
Figure 3-5: Examples of accurate (a) and coarse (b) iris borders for a given eye image extracted
from [104]. .............................................................................................................................. 57
Figure 3-6: Flowchart of: (a) OSIRISV2, (b) OSIRISV4, and (c) OSIRISV4.1 [33]. ................ 58
Figure 3-7: The difference between the two iris recognition systems: OSIRISV4 and
OSIRISV4.1 [33]. .................................................................................................................... 60
Figure 3-8: How to compute the new coordinates of points ( , ) [33]. ........................... 61
Figure 3-9: Illustration of segment S formed by ( , ) and ( , ). Note: Coarse
boundaries are modeled by circles to simplify the figure [33]. .................................................. 61
Figure 3-10: (a) Border points used for normalization in OSIRISV4.0, (b) Border points used for
normalization in OSIRISV4.1, (c) normalized image by OSIRISV4.0, (d) normalized image by
OSIRISV4.1 [33]. .................................................................................................................... 62
Figure 3-11: An illustration of the concept of IOM system [25]. The camera is visible at the far
right of the figure. .................................................................................................................... 66
Figure 3-12: Concept of Yoon's system [29]. ........................................................................... 66
Figure 3-13: Iris acquisition at a stand-off distance of 3 meters [28]. ....................................... 67
Figure 3-14: Iris acquisition by CyLab System. The subject is walking toward the system. His
speed is estimated between position A and B to set the focus of the camera to the position C to
acquired in-focus iris images while the subject approaches the system [30]. ............................. 68

0: List of Figures
xiii
Figure 4-1: How to compute GLCM features from the normalize iris image. ............................ 88
Figure 4-2: GLCM’s directions. ............................................................................................... 88
Figure 4-3: Energy features extracted from GLCMs at the eight possible orientations of for a
given normalized iris image. .................................................................................................... 89
Figure 4-4: Energy, contrast and correlation features extracted from GLCMs. Note that for the
values of the features we used cold color for high value, warm color for small value. ............... 90
Figure 4-5: Computation of the local qualities on sub-images of a normalized iris image. ........ 94
Figure 4-6: Normalized iris image of good quality with their corresponding local qualities given
by the 2 GMMs: GMM4obs and GMM5obs. ........................................................................... 95
Figure 4-7: Normalized iris image of poor quality with their corresponding local qualities given
by the 2 GMMs: GMM4obs and GMM5obs. ........................................................................... 95
Figure 4-8: Ranked-DETs based on the GQ given by the model: (a) GMM4obs, (b) GMM5obs.
................................................................................................................................................ 97
Figure 4-9: Relationship between GQM and QAoT. ................................................................. 99
Figure 4-10: Ranked-DETs based on (a) UIA, (b) GQ, and (c) GQM. .................................... 100
Figure 4-11: Error versus Reject curves based on UIA, GQ and GQM. .................................. 101
Figure 5-1: Fusion process of the proposed local quality-based method .................................. 117
Figure 5-2: Diagram of the quality-based super-resolution scheme for video-based iris
recognition. ........................................................................................................................... 119
Figure 5-3: Illustration of correct (in green) and aberrant (in red) segmentations and the
corresponding normalized images for a given iris. .................................................................. 121
Figure 5-4: DET-curves of the three image’s fusion approaches for MBGC portal videos....... 125
Figure 5-5: Examples of two different segmentations on the same eye: (a) Good segmentation
and corresponding normalization, (b) Wrong segmentation, and their corresponding normalized
iris image and local quality matrix. ........................................................................................ 127
Figure 5-6: DET-curves of the three image‘s fusion approaches for CASIA-IrisV4-Thousand 129

0: List of Figures
xiv
Figure 5-7: DET-curves (at low FAR) of the three image‘s fusion approaches for CASIA-IrisV4-
Thousand. .............................................................................................................................. 130
Figure 5-8: Example of extracted eye region from frames of QFIRE database at a distance of (a)
5 feet, (b) 7 feet and (c) 11 feet. ............................................................................................. 131
Figure 5-9: FRR@FAR=0.001 for various numbers of best frames for SA, SR-NoQ, and SR-LQ
fusion schemes for each QFIRE dataset. ................................................................................ 135
Figure 6-1: How to obtain the fused irisCode, mask and local quality matrix for performing
template matching. ................................................................................................................ 150
Figure 6-2: Creation of the weighted Hamming distance map................................................. 152
Figure 6-3: An illustration of a fragile bit map of a given irisCode. Fragile bits are represented
by black pixels....................................................................................................................... 155

0: Acronyms and abbreviations
xv
Acronyms and abbreviations
Organizations/Benchmarks IREX IRis EXchange MICHE Mobile Iris CHallenge Evaluation NIST National Institute of Standards and Technology NICE Noisy Iris Challenge Evaluation
Metrics DET Detection Error Trade-off EER Equal Error Rate FAR False Acceptance Rate FMR False Match Rate FNMR False Non Match Rate FRR False Rejection Rate FTA Failure To Acquire GAR Genuine Acceptance Rate iFMR image False Match Rate iFNMR image False Non Match Rate ROC Receiver Operating Characteristic
Models/Programs/Algorithms EM Expectation Maximization GMM Gaussian Mixture Model OSIRIS Open Source for IRIS SVM Support Vector Machine
Databases CASIA Chinese Academy of Sciences Institute of Automation ICE2005 Iris Challenge Evaluation 2005 ICE2006 Iris Challenge Evaluation 2006 MBGC Multiple Biometrics Grand Challenge QFIRE Quality Face and Iris Research Ensemble
Abbreviations Def Definition GLCM Gray Level Co-occurrence Matrix GMM4obs Gaussian Mixture Model with an observation vector of 4 elements GMM5obs Gaussian Mixture Model with an observation vector of 5 elements GQ Global Quality HR High-resolution

0:
xvi
IOM Iris-On-the-Move LBP Local Binary Pattern LR Low-Resolution LQ Local Quality MGMP Multi-Gallery Multi-Probe NIR Near InfraRed QAoT Quality Assurance of Texture QMA Quality Measurement Algorithm SR Super-resolution UIA Usable Iris Area uirLBP uniform invariant rotation Local Binary Pattern


Chapter 1. Introduction
1.1. History of iris recognition ............................................................................................... 4
1.2. Deployments of iris recognition systems: Security applications ....................................... 5
1.3. Iris acquisition ................................................................................................................ 7
1.3.1. Controlled mode: conventional acquisition ............................................................. 8
1.3.2. Uncontrolled mode: less constrained acquisition ..................................................... 9
1.4. Iris recognition ............................................................................................................. 11
1.5. Objective and contributions of the thesis ....................................................................... 12
1.6. Thesis organization ....................................................................................................... 16
1.7. List of publications ....................................................................................................... 17

Chapter 1: Introduction
3
eliable methods for automatic identification of individuals meet the increasing demand for
security in applications such as ID cards, border crossings, access control and forensics.
Traditional authentication methods based on knowledge (passwords, PIN number...) and
tokens (identification cards) suffer from several limitations. Indeed, cards are vulnerable to being
stolen, lost or even shared and passwords can be easily forgotten. In contrast, human identifications
based on physiological and behavioral characteristics are great alternatives to verify the identity of a
person. In fact, such methods called biometrics, do not require knowledge and tokens, and thus become
more convenient and friendly for users. Biometric traits such as face, iris, voice, fingerprint, and
palmprint have also proved to be unique to each person and constant throughout its lifetime [1]. For all
these reasons, a growing attention has been devoted to biometric methods.
This thesis exclusively addresses iris trait for human identification, namely iris recognition.
Among all biometric characteristics, iris pattern has been revealed as one of the most reliable biometric
trait to distinguish among different persons [2]. Large scale evaluations have demonstrated remarkable
performance in terms of recognition accuracy [3].
The iris is an "annular structure of elastic connective tissues forming a rich pattern of random
texture, visible in the eye" as defined in [3]. It is located between the pupil (dark region) and the sclera
(bright region). The border between the iris/pupil and the iris/sclera are respectively called pupillary
and limbic boundaries. The iris surface is characterized by diverse patterns e.g. radial and contraction
furrows, crypts... They represent the iris texture. A schematical anatomy of the human eye is provided
in Figure 1-1.
Figure 1-1: Frontal view of a schematical human eye [3]
R

Chapter 1: Introduction
4
Iris has several interesting properties. In contrast to other biometric traits such as fingerprint
and face, the iris is an internal organ, highly protected and thus cannot be easily altered [4]. It also
satisfies the requirements of uniqueness for biometric purpose. In fact, the iris texture is revealed to be
a random pattern of great complexity and randomness. More precisely, the texture is epigenetic (not
genetic determined, except for eye color), and developed from the third to eighth month of the
gestation [5]. Moreover, the iris assures stability throughout life [6]. For all these reasons, the iris
allows distinguishing between different people, even in the case of monozygotic twins. Moreover the
iris texture of the right and the left eyes belonging to the same person is different [7].
In Section 1.1, we relate the origin of recognizing people by their iris by citing the major key
dates in the iris recognition history. The major deployments of iris recognition systems in real
applications are reported in Section 1.2. After that, Section 1.3 explains how iris acquisition can be
achieved in operational systems. Classical iris recognition systems usually follow four main steps.
They are briefly described in Section 1.4. The objective and the contributions of the thesis are
presented in Section 1.5. Then, the structure of the report is described in Section 1.6. Finally, the
publications that have been published as part of this doctoral work are listed in Section 1.7.
1.1. History of iris recognition
Iris recognition is based on the analysis of iris patterns by mathematical pattern recognition techniques.
This modality is actually relatively recent, since the first automatic system able to identify people
based on iris texture was developed and patented by John Daugman in the last decade of twentieth
century.
However, the concept of recognizing people by their iris dates back to the nineteenth century.
In 1886, Alphonse Bertillon was the first to propose properties of the human eye (color) for arrestee
identification [8]. The idea of exploiting iris patterns was founded latter with the ophthalmologist
James H. Doggart in 1949 who had written [9]:
"Just as every human being has different fingerprints, so does the minute architecture of the
iris exhibit variations in every subject examined. [Its features] represent a series of variable factors
whose conceivable permutations and combinations are almost infinite."
In 1953, Francis H. Adler also referred to this fact in a clinical textbook [10]:

Chapter 1: Introduction
5
"In fact, the markings of the iris are so distinctive that it has been proposed to use photographs
as a means of identification, instead of fingerprints.".
Much later in 1987, the concept of using iris in automatic recognition system founded its origin
through two ophthalmologists: Leonard Flom and Aran Safir [11]. In fact, they patented the conjecture
of Adler and Doggart that iris texture could be used for identification but without proposing an
algorithm or an implementation to perform it. Less than ten years after, John Daugman developed and
patented the first automatic iris recognition system in 1994 [12] and details on the algorithm were
published in [13]. Most of the current iris recognition solutions are still based on Daugman' approach.
1.2. Deployments of iris recognition systems: Security
applications
Many real-world security applications, such as financial transactions, access control, crossing
international borders and so on, require reliable personal identification. Due to the impressive
uniqueness of the texture, iris biometric systems have been successfully adopted in several large-scale
applications, especially at airports for borders crossing in lieu of passport presentation for frequent
travelers.
For instance, the UK IRIS project (Iris Recognition Immigration System) has been deployed at
many airports, including Heathrow, Manchester, Birmingham and Gatwick, to identify frequent
travelers by their iris [14]. The system requires a priori registration (between five and ten minutes) in
order to store their irises in an enrolled database. After that, the enrolled travelers just have to look at
the front of the camera, crossing an IRIS gate (about twenty seconds) to perform the automatic
identification: the iris is compared to all that are present in the enrollment database. Consequently,
frequent passengers can travel without having to wait in a queue to have their passport stamped. Figure
1-2 illustrates an example of the IRIS gate in a United Kingdom airport terminal for enrolled frequent
travelers.
This technology is also employed in other countries for controlling border access such as
Schiphol airport in Netherlands [15], twenty-nine national airports in Canada [16], and also in the
United States [17] [16].
In the United Arab Emirates, iris-based border security systems are widely used to track
expellees and to perform access control [18]. The project is deployed at 32 air, land and sea ports. Over

Chapter 1: Introduction
6
one million of iris templates are saved in a "watch-list". Each day, about 12,000 irises are compared to
that list, leading to 14 billion of comparison. Since 2001, all expellees have been enrolled in order to
track illegal re-entry to UAE.
Figure 1-2: An example of IRIS gates used at an airport terminals for registered frequent travelers in
lieu of passport presentation [19].
The most largely deployed biometric system is set up in India. The project UIDIA (Unique
Identification Authority of India) [20] started in 2009 and is still in progress. For each Indian resident,
a unique number, called Aadhaar number, is attributed to provide a form of identity in order to
facilitate medical and financial aids, government use (national ID card, driver's license...)... Each
number is linked to biometric data (face, fingerprints and irises). More than 200 million citizens have
been enrolled since 2012, and the final goal of UIAID is to record about 1.2 billion persons.
The major projects based on iris recognition are listed in Table 1-1.
Due to the current success of iris recognition in many real-world applications, there is a clear
trend toward less controlled iris acquisitions. Scenarios such as portal-based, at-a-distance, and on-the-
move are more and more frequent in biometric system.

Chapter 1: Introduction
7
Table 1-1: Summary of public deployment of iris biometric systems (data from [1]).
Project Country Enrollments Purpose
UIDAI Aadhaar India >200 million
(2012)
National identity number for financial aids,
governance, etc. [20]
UNHCR Repatriation Afghanistan >2 million
(2008)
Refugee registration for aid (assistance
package, food, etc.) [21]
UAE Border control UAE >1.5 million
(2008)
Expellees tracking and border control in the
United Arab Emirates [18]
TSA CLEAR US >175 thousand
(2008)
Frequent traveler border crossing at major
US airports [17]
National Airport Sec. Canada >150 thousand
(2010)
Security solution at 29 Canadian airports
[16]
IRIS UK >100 thousand
(2009)
Heathrow, Manchester, Birmingham and
Gatwick airports border control [14]
NEXUS US, Canada >100 thousand
(2006) Frequent traveler border-crossing [22]
York County Prison US >35 thousand
(2012) Inmates registration [16]
Privium Netherlands >30 thousand
(2009)
Frequent traveler border control at Schiphol
airport using smartcard [15]
1.3. Iris acquisition
Acquiring iris images of high quality is not an evident task. The iris relatively represents a small part of
the face, with a diameter approximately equals to 11 mm. Moreover, iris is an internal organ, situated
behind the cornea, which is strongly reflective.
Most commercial iris acquisition systems work in near infrared (NIR) band. The illumination
source emits a light with a wavelength in the range of 700-900 nm. At those wavelengths, the structure
of iris patterns are visible, even for highly pigmented irises (dark eyes), and the reflection of the light is
widely reduced, in contrast to visible wavelength light. Figure 1-3 shows an example of an iris image
acquired in near infrared. The iris texture is well revealed under such wavelengths.

Figure 1-3: Iris image acquired in near infrared band with LG2200 sensor.
1.3.1. Controlled mode: conventional acquisition
The acquisition conditions of the iris images
quality of the captured images is
researches.
First conventional systems have been very restrictive
acquisition process. He is asked
it. The eye has to be wide open and located in the center of the image. The specular reflection
appear inside the region of the pupil and not on the pupillary boundary or inside the iris region.
A series of algorithmic measurements of the image quality
contrasts, illumination and iris resolution
Technical guidance for iris image collection were established in the IRis EXchange (IREX) program
[23], more precisely in the IREX V
Standards and Technology (NIST).
1-4.
All these recommendations were suggested in order to give guidance for avoiding the
collection of poor quality iris sa
a lack of user-friendliness during the acquisition.
There are principally two different types
• Access control: Wall
1-5-a.
• Handheld: Portable camera with small focal volume as depicted in
Chapter
8
Iris image acquired in near infrared band with LG2200 sensor.
Controlled mode: conventional acquisition
acquisition conditions of the iris images play a crucial role in the iris recognitio
d images is closely linked to recognition rate as pointed
First conventional systems have been very restrictive: the user is fully cooperativ
is asked to stand close to the camera at a fixed distance, and to look straight at
it. The eye has to be wide open and located in the center of the image. The specular reflection
pupil and not on the pupillary boundary or inside the iris region.
A series of algorithmic measurements of the image quality, such as focus,
s, illumination and iris resolution, are also used in such controlled acquisition
guidance for iris image collection were established in the IRis EXchange (IREX) program
, more precisely in the IREX V [24]. The project was organized by the National Institute of
tandards and Technology (NIST). An example of a "correct" iris acquisition is illustrated
All these recommendations were suggested in order to give guidance for avoiding the
collection of poor quality iris samples. Consequently, the resulting images are of good quality but with
dliness during the acquisition.
There are principally two different types of camera for iris acquisition in controlled mode:
: Wall-mounted camera with moderate focal volume as illustrated in
Portable camera with small focal volume as depicted in Figure
Chapter 1: Introduction
Iris image acquired in near infrared band with LG2200 sensor.
play a crucial role in the iris recognition. In fact, the
d out by many biometric
fully cooperative during the
to stand close to the camera at a fixed distance, and to look straight at
it. The eye has to be wide open and located in the center of the image. The specular reflections should
pupil and not on the pupillary boundary or inside the iris region.
focus, pupillary and limbic
ontrolled acquisition scenario.
guidance for iris image collection were established in the IRis EXchange (IREX) program
by the National Institute of
on is illustrated in Figure
All these recommendations were suggested in order to give guidance for avoiding the
mples. Consequently, the resulting images are of good quality but with
camera for iris acquisition in controlled mode:
moderate focal volume as illustrated in Figure
Figure 1-5-b.

Chapter 1: Introduction
9
Figure 1-4: An example of a correct iris acquisition, with some of its desirable properties marked up
[24].
(a) (b)
Figure 1-5: Examples of iris acquisition devices: (a) IrisAccess2200 from LG/IrisID with an
acquisition range between 8 to 25 cm, and (b) IRISPASS-H from OKI with an acquisition distance of
approximately 3 cm.
1.3.2. Uncontrolled mode: less constrained acquisition
However, in many real-world security applications as presented in Section 1.2, many of these
constraints become impossible to impose on the user, especially for iris recognition at a distance and

on-the-move. Relaxing acquisition conditions is an active field of resear
systems have been designed and developed, such as IOM system
moving subject passing through a portal at 3 meters
Stand-off system with iris acquisition at 1.5 meters
operating at 1.5 to 3 meters [29]
to 12 meters [30] and 30 meters
The scenarios addressed by such systems correspond to more realistic conditions. However, as the
degree of freedom of the subject's movement and position increase, the exp
images acquired by such systems increase
resolution, illumination and eye pose between different acquis
negative impact on the recognition
same eye considerably decreases when the environment acquisition differs
confusion regarding the biometric decision (iris from the same person or not). Moreover, the resulting
images often suffer from a lack of resolution and contrast between the pupillary and limbic boundaries.
Strong occlusions (e.g. eyelids, eyelashes, specular reflections) fr
acquisition mode. Examples of
recognition in such conditions becomes a very challenging task.
(a)
(d)
Figure 1-6: Examples of degraded iris images: (a) Specular reflection, (b) Irregular illumination, (c)
Out of focus, (d) Low contrast, (e) Off
Chapter
10
move. Relaxing acquisition conditions is an active field of research. Various iris recognition
systems have been designed and developed, such as IOM system (Iris On the Move)
moving subject passing through a portal at 3 meters [25], Eagle-Eyes operating at 3
off system with iris acquisition at 1.5 meters [27] and 3 meters [28], Pan tilt zoom camera
[29], and finally long range iris acquisition system (video surveillance) at 8
and 30 meters [31]. Such systems will be described in details in
The scenarios addressed by such systems correspond to more realistic conditions. However, as the
degree of freedom of the subject's movement and position increase, the exp
images acquired by such systems increases too. These changes lead to potential
resolution, illumination and eye pose between different acquisitions. As pointed in
recognition accuracy. In particular, the similarity between two irises of the
decreases when the environment acquisition differs
the biometric decision (iris from the same person or not). Moreover, the resulting
lack of resolution and contrast between the pupillary and limbic boundaries.
Strong occlusions (e.g. eyelids, eyelashes, specular reflections) frequently occur in such uncontrolled
Examples of degraded iris images are given in Figure 1-6. For all these reasons, iris
n in such conditions becomes a very challenging task.
(b)
(e)
: Examples of degraded iris images: (a) Specular reflection, (b) Irregular illumination, (c)
of focus, (d) Low contrast, (e) Off-center and (f) Occlusions.
Chapter 1: Introduction
ch. Various iris recognition
(Iris On the Move), working with
Eyes operating at 3-6 meters [26],
, Pan tilt zoom camera
, and finally long range iris acquisition system (video surveillance) at 8
. Such systems will be described in details in Chapter 3.
The scenarios addressed by such systems correspond to more realistic conditions. However, as the
degree of freedom of the subject's movement and position increase, the expected variation in the
nges lead to potentially strong differences in
s pointed in [32], this fact has a
accuracy. In particular, the similarity between two irises of the
decreases when the environment acquisition differs, leading to eventual
the biometric decision (iris from the same person or not). Moreover, the resulting
lack of resolution and contrast between the pupillary and limbic boundaries.
equently occur in such uncontrolled
For all these reasons, iris
(c)
(f)
: Examples of degraded iris images: (a) Specular reflection, (b) Irregular illumination, (c)
center and (f) Occlusions.

Chapter 1: Introduction
11
1.4. Iris recognition
In 1993, Daugman [13] was the first to propose a complete iris recognition system. Most of current
systems are inspired from it. They are usually divided into the four following steps:
1. Iris segmentation
The first task consists in isolating the iris texture from other elements of the image such as
eyelids, eyelashes, spotlights and/or shadows. These elements are considered as artifacts and have to be
handled at this stage. The pupillary and limbic boundaries are usually modeled by a parametric shape
such as circles or ellipses. In addition, the segmentation module generates a binary mask to indicate
which pixels of the image belong to iris texture in order to remove noisy information in the further
steps.
2. Normalization
The iris region is mapped into a size-invariant band called the normalized iris image. This
dimensionless coordinate system of the resulting image copes with the problem of pupil dilation. This
transformation is carried out by exploiting a parameterization of the iris boundaries obtained by the
segmentation module. The normalization process allows the alignment of any two iris images to be
compared.
3. Feature extraction
This stage aims at extracting the texture characteristics of a given iris. Discriminative features
of iris texture are the basis for the comparison (also called matching) of any two images. The resulting
template is usually represented by using a binary code composed of bits, called irisCode. These bits are
obtained by the quantization of the iris features.
4. Template matching
The final stage of iris recognition systems consists in deciding whether two templates belong to
the same iris or not. To this end, a similarity or dissimilarity score is computed between the two binary
codes to be compared. The decision of acceptance or rejection is taken by comparing the matching
score to a threshold. The key at this stage is to fix this threshold appropriately, in order to take the
correct decision.
We note that several levels are used for representing the iris during these four stages: (1) the
pixel-level (in the segmentation and normalization steps), (2) the feature-level (in the feature extraction

stage), and finally (3) the bit-
given by a classical iris recognition system.
(a)
Figure 1-7: Standard components in a classical iris recognition system: (a) Iris segmentation: the red
regions correspond to the artifacts, detected by the iris recognition system. The green
the iris area. (b) Iris mask: The
considered as noisy regions, (c) Normalized iris image, and (d)
1.5. Objective and contributions of the thesis
Ideally, an iris recognition system would operate with un
subjects possibly on the move and at a significant distance. However due to the difficulty in obtaining
images of good quality, environmental conditions
acquisition distances, frontal gaze and user collaboration. Nevertheless, dealing with r
becomes impossible to impose these constraints to the user
tend to suffer from imperfections as depicted in
decrease iris recognition performance. In fact, it is well known that
related to the quality of the biometric samples
Chapter
12
-level (in the matching step). Figure 1-7 shows the standard elements
given by a classical iris recognition system.
(b)
(c)
(d)
: Standard components in a classical iris recognition system: (a) Iris segmentation: the red
regions correspond to the artifacts, detected by the iris recognition system. The green
e iris area. (b) Iris mask: The white pixels belong to the iris, the remaining black pixels are
considered as noisy regions, (c) Normalized iris image, and (d) IrisCode
Objective and contributions of the thesis
iris recognition system would operate with un-cooperative users, and acquire images of
subjects possibly on the move and at a significant distance. However due to the difficulty in obtaining
images of good quality, environmental conditions must be constrained e.g. NIR illumination, close
acquisition distances, frontal gaze and user collaboration. Nevertheless, dealing with r
s impossible to impose these constraints to the users. Consequently, the resulting iris images
rom imperfections as depicted in Figure 1-6. All these degradations significantly
decrease iris recognition performance. In fact, it is well known that recognition performance is strongly
related to the quality of the biometric samples [34].
Chapter 1: Introduction
shows the standard elements
(b)
: Standard components in a classical iris recognition system: (a) Iris segmentation: the red
regions correspond to the artifacts, detected by the iris recognition system. The green circles delimit
e iris, the remaining black pixels are
risCode [33].
cooperative users, and acquire images of
subjects possibly on the move and at a significant distance. However due to the difficulty in obtaining
e.g. NIR illumination, close
acquisition distances, frontal gaze and user collaboration. Nevertheless, dealing with real scenarios, it
s. Consequently, the resulting iris images
. All these degradations significantly
recognition performance is strongly

Chapter 1: Introduction
13
In line with this problematic, in this doctoral work we have addressed NIR video based iris
recognition in such non-ideal condition, which corresponds to more realistic applications. Our
objective consists in proposing a solution to overcome the degradation of the performance that is
caused by the low quality of the resulting iris images. In such situations, two main aspect have to be
taken into account:
• Iris resolution: A minimal resolution has to be respected. The International Standards
Organization (ISO) Iris Image Standard released in 2005 [35] suggested a minimum of 100
pixels across the iris diameter. Under this value, the recognition performance is
dramatically degraded. Images that contain irises with 200 pixels in the diameter are
considered of high quality.
• Iris quality: Due to the relaxation of the constraints imposed on the users during the
acquisition, the quality of the captured irises may change from a frame to another. Blur
resulting from out-of-focus or/and motion blur, eyelids and eyelashes occlusions, specular
reflections, shadows, off angles, uneven illumination, low contrasts between the boundaries
are generally present in the images. All these factors affect the accuracy of the recognition.
Instead of keeping only one high quality iris image such as done in controlled mode, in
unconstrained scenarios, we consider the whole series of frames containing eventual degradations as
cited before. One way to try to circumvent this bad situation is to use some redundancy arising from
the availability of several images of the same eye in the recorded video sequence. Therefore, our
research activities focus on how to fuse the information available in the sequence in order to improve
as much as possible iris recognition.
In the state-of-the-art, different schemes of fusion have been proposed. These methods can be
achieved at different levels such as score and signal levels i.e. pixel, feature, or bit levels (see Section
1.4.). However, researchers agree that the quality of images used in the fusion process is a very
important factor for its success, and for obtaining an improvement in the recognition performance.
Therefore, they concentrated their efforts in the estimation of the image quality of each image in the
sequence in order to give it less or more weight in the fusion process according to its quality. The
principal iris quality components to be considered are: defocus/motion blur, occlusion/specular
reflection, lighting, resolution and iris/pupil-iris/sclera contrasts. Various methods have been proposed
for quantifying these criteria. These quality measures are generally combined in order to give one
unique value: a global quality. There is no universal combination scheme to do so and in general some

Chapter 1: Introduction
14
a priori knowledge is inserted. The combination method can be a simple multiplication or a more
sophisticated method such as the theory of Dempster–Shafer. Moreover, whatever the used method, the
fusion process requires previously a normalization step on the quality values, which is not a trivial task
either.
To deal with most of the disadvantages mentioned before, we propose a different approach for
computing the quality of an iris image. In the thesis, we concentrate our efforts on proposing of a novel
way of measuring and integrating quality measures in the image fusion scheme, aiming at improving
the poor performance resulting from the image degradations obtained from unconstrained acquisitions.
Therefore, we have first elaborated a relevant local quality metric to assess the amount of good
texture in the normalized iris images. This measure relies on a Gaussian Mixture Model (GMM)
estimation of a clean iris texture distribution. Our idea is to exploit this quality in the fusion process.
The GMM has been carefully designed in order to characterize the iris texture patterns in non-ideal
captured images. This local quality can be used to compute a global quality measure of the normalized
iris image. This new metric has been compared to most influential quality factors that are mentioned in
the state-of-the-art. We will also see that our quality measure is well correlated to the recognition
performance.
After that, we have proposed two novel schemes based on a super-resolution technique applied
at the pixel-level, on the different frames of a video, improved by taking into account our quality
measure in the fusion process. More precisely, our first contribution is the proposition of a global
quality measure of iris images, that we will use in two ways: as a selection tool and as a weighting
factor at the pixel-level in the super-resolution scheme. The interest of our quality measure compared
to what is done in the literature is (1): its simplicity, (2): the fact that its computation does not require
identifying in advance the type of degradations that can occur in the iris images, (3) its uniqueness (to
avoid combination method). The super-resolution was carried out in order to remedy the poor
resolution of iris images in videos acquired at a significant distance.
Taking benefit of this local measure, we explore as a second novel contribution a local
weighting strategy at the pixel-level, allowing us to handle local degradations of the iris images.
Indeed, we assume that the quality in a given iris image can be different in diverse sub-regions.
Therefore, by performing a local weighted scheme, regions free from occlusions will contribute more
in the reconstruction of the fused image than regions with artefacts. Thus, the quality of the

Chapter 1: Introduction
15
reconstructed image will be optimized in order to improve the performance. To our knowledge we
were the first to propose a local weighted scheme at the pixel-level in the literature.
The effectiveness of the proposed approaches has been demonstrated on several iris databases
that are collected under different unconstrained scenarios: iris-on-the-move (MBGC portal database
[36]), with intra-class variations (CASIA-Iris-Thousand [37]) and at different significant distances
(collections of QFIRE database [38] [39]). We have analyzed separately the iris recognition
improvement brought by the use of the super-resolution, the global quality and then the local quality
for determining the best strategy of fusion that leads to the best performance. This variability of the
acquisition protocols allows us to determine the robustness of the proposed approaches and
determining the best strategy of fusion regarding the specificity of the acquisition scenario.
To our knowledge, only a few works have been assessed on the QFIRE database for the iris
modality [40] [41] [42] and no protocols have been yet defined for this database. The database contains
a large number of acquisition scenarios. Therefore, we selected the scenarios and we defined some
protocols that seemed interesting for assessing our contribution in the fusion process. Note that we
would be happy to share them with the iris community so that they could be used for benchmarking
other iris recognition systems in video. Note that providing novel assessment protocols for the QFIRE
database is another contribution of the doctoral work.
Finally, we will demonstrate the advantage of performing a weighted fusion scheme at the
pixel-level in unconstrained iris acquisition compared to another level which is the bit-level as
proposed in recent works of the state-of-the-art. To this end, we have integrated our local quality in the
matching score computation stage. More precisely, the local quality measures the reliability of the bit-
pair comparisons. Then, we will also demonstrate the limitation of recent methods performing at the
bit-level.
Throughout the thesis, we have used two iris recognition systems developed by our research
group before my arrival: OSIRISV2 and the novel one OSIRISV4.1. These two systems are open
source and they are available on the website of Biosecure [43]. However, I have been involved into
recent works related to OSIRIS. We have published a paper which presents a comparison between the
different OSIRIS's versions [33]. Moreover, we have submitted the last version: OSIRISV4.1 to the
ICB Competition on Iris Recognition 2013 [44]. The obtained results show that OSIRISV4.1 can be
considered as an efficient iris recognition system.

Chapter 1: Introduction
16
1.6. Thesis organization
The thesis is organized as follows:
Chapter 2. Evaluation of iris recognition systems, presents the methods and tools we used in
the thesis to evaluate the performance of biometrics systems and quality measurement algorithms.
After that, the public iris databases that have been selected to assess our algorithms are described. The
major benchmarks in the field of iris recognition are then given to highlight the interest of the research
community in iris recognition in non-ideal situations.
Chapter 3. Fundamentals in iris acquisition and recognition systems, focuses on the state-
of-the-art of iris acquisition and recognition systems. First, the most important iris recognition systems
in the literature are described. Next, we present the designed open source recognition systems we used
in the thesis. Finally, a literature review on iris acquisition systems in less constrained environments is
reported.
Chapter 4. Design of a quality measurement algorithm for improving iris recognition, has
as center point our quality measurement algorithm. Related works to iris image qualities are first
presented. Iris quality components and their usage in recognition systems are explained. From this, we
will define what a relevant quality metric for iris recognition should be and design the proposed quality
measurement algorithm that will be used throughout the thesis. Details on the statistical model that we
have elaborated to quantify the amount of iris texture are then given. Besides, we present how we have
used it to measure locally the quality of the iris images. A global quality metric is also defined. We will
show that our global metric is well correlated to the performance of the system. Moreover, a
comparative study between our quality and most of the quality components that are shown in the
literature to influence significantly iris recognition is then given. From this study, we will deduce the
effectiveness of the proposed quality assessment algorithm in characterizing iris pattern of good
quality.
Chapter 5. Fusion approaches of iris sequences for improving the recognition, presents the
main contribution of the work. First, an overview of the methods used for the fusion of iris sequences
captured in less constrained acquisition is given. We will see that all these works agree on the fact that
the key of a successful fusion scheme lies in the good quality of the iris images. This will lead us to
propose quality-based fusion schemes in order to improve iris recognition. Our main novelty is the
introduction of a local quality measure (presented in Chapter 4) in the fusion scheme. It can also be

Chapter 1: Introduction
17
exploited for computing a global quality measure of the iris image which can be used either for the
selection of the best images or for weighting the images in the fusion scheme. Finally, extensive
experiments on challenging iris databases acquired under different real-world scenarios are reported.
Experimental studies on the impact of the sequence fusion, the super-resolution and the introduction of
the global and local quality are carried out. Depending on the specificity of each database, we will
underline which strategy of fusion can lead to best performance.
Chapter 6. Quality assessment at the bit-level, reports comparisons between introducing our
quality measure at two different levels in the fusion scheme: the pixel and bit levels. This comparison
allows us to determine which strategy can lead to best performance. We will also see the limitations of
some recent works that perform fusion at the bit-level.
Finally, Chapter 7 closes this thesis with conclusions and perspectives.
1.7. List of publications
The publications that have been published as part of this doctoral work are as follows:
International conferences:
• Nadia Othman, Nesma Houmani, Bernadette Dorizzi: Improving Video-based Iris Recognition
Via Local Quality Weighted Super Resolution, in International Conference on Pattern
Recognition Applications and Methods (ICPRAM), Barcelona, Spain, 2013.
• M. Zhang, J. Liu, Z. Sun, T. Tan, W. Su, F. Alonso-Fernandez, V. Nemesin, N. Othman, K.
Noda, P. Li, E. Hoyle, A. Josh: The First ICB Competition on Iris Recognition, in international
Joint Conference on Biometrics (IJCB), Florida, USA, 2014.
Book chapter:
• Nadia Othman, Nesma Houmani, and Bernadette Dorizzi: Quality-Based Super Resolution for
Degraded Iris Recognition, in Advances in Intelligent Systems and Computing, Series “Pattern
Recognition Applications and Methods”, vol. 318, Springer, Jan. 2015.
International journals:
• Nadia Othman, and Bernadette Dorizzi: Impact of Quality-Based Fusion Techniques for
Video-Based Iris Recognition at a Distance, in Information Forensics and Security, IEEE
Transactions on , vol.10, no.8, pp.1590-1602, Aug. 2015

Chapter 1: Introduction
18
• Nadia Othman, Bernadette Dorizzi, and Sonia Garcia-Salicetti: OSIRIS: An Open Source Iris
Recognition Software, in Pattern Recognition Letters (accepted in Sept 2015).

Chapter 1: Introduction
19

Chapter 2: Evaluation of iris recognition systems
20
Chapter 2. Evaluation of iris recognition systems
2.1. General evaluation of biometric systems ....................................................................... 21
2.1.1. Score distributions................................................................................................ 22
2.1.2. Accuracy rates ..................................................................................................... 23
2.1.3. Performance curves .............................................................................................. 25
2.1.4. Image specific evaluation ..................................................................................... 26
2.2. Evaluation of quality measurement algorithms .............................................................. 28
2.2.1. Ranked DET ........................................................................................................ 30
2.2.2. Error versus reject curves ..................................................................................... 31
2.3. Reference iris databases ................................................................................................ 31
2.3.1. Multiple Biometrics Grand Challenge: Portal dataset ............................................ 33
2.3.2. CASIA-IrisV4-Thousand ..................................................................................... 34
2.3.3. QFIRE database ................................................................................................... 35
2.4. Benchmarks.................................................................................................................. 38
2.5. Conclusion ................................................................................................................... 43

Chapter 2: Evaluation of iris recognition systems
21
iometric systems have been widely deployed in many real-world security applications as
described in Chapter 1. Different levels of security are required according to the
application's domain. Most systems should perform very high recognition performance to
guarantee security task. Failure of those systems can lead to severe consequences. Therefore, disposing
of an estimation of the expected accuracy of a given system on large databases is crucial. We explain in
Section 2.1 how performance of biometric recognition algorithms can be measured.
As explained in Chapter 1, in operational applications, the users are less cooperative during the
acquisition. Relaxing capture conditions introduces strong degradations in the biometric samples. As
the sample's quality is a fundamental factor in the accuracy of the recognition, disposing of relevant
quality measurement algorithms is very interesting. In Section 2.2, we explain how such algorithms
can be evaluated and used for improving the recognition performance.
All these evaluations can be performed only if the algorithms are benchmarked on given
databases, preferably public and with a large number of biometric samples of various quality levels.
Section 2.3 describes the databases we have used in this doctoral work for evaluating our approaches.
Details on the conditions of acquisition for each dataset are given to show the diversity of the scenarios
that we have studied in the thesis. The characteristics of the resulting images are also presented to insist
on the difficulty of recognizing people in such conditions.
Finally in Section 2.4, we will present the major campaigns of evaluation in the area of iris
recognition. We will see that the quality of the iris images is a recurring topic addressed by mostly
benchmarks.
2.1. General evaluation of biometric systems
Biometric systems follow three main steps:
• Enrollment: It consists in collecting the biometric samples of the system' users.
• Storage: The captured samples are then converted into digital representations named
templates and stored in the reference database (also called gallery).
• Comparison: Finally, the biometric authentication is performed. There are two possible
operation modes:
- Verification: In such mode, the individual claims to be a certain person which has
previously been recorded in the system during the enrollment. Its corresponding
B

Chapter 2: Evaluation of iris recognition systems
22
biometric sample is captured in order to generate its template which is then
compared to the stored ones belonging to the claimed person. Each comparison
results in a matching score which quantifies the dissimilarity between the templates
(or similarity). When several templates of the same person are registered, several
matching scores are computed and then combined by averaging them or by taking
the minimum value (or maximum) [45]. Then, a biometric decision is taken by
comparing this dissimilarly score to a threshold value τ as follows:
If the matching score is smaller than τ, then the two templates match;
If the matching score is greater than τ, then the two templates do not match.
This biometric decision is then taken for permitting or denying the access of the
person to the system.
- Identification: In this case, the identity of the individual is not known a priori. Its
biometric sample is first acquired. From it, a template is created and then compared
to every template in the reference database. Usually, a list of the k most probable
identities for the test individual is suggested by the biometric system [46].
In this doctoral work, we will perform only verification mode. We note also that the matching scores
reflect dissimilarity values.
When working with biometric systems, there are two elementary questions to be addressed:
How the accuracy of a given biometric system can be measured?
How different systems can be compared to each other?
In this sub-section we will answer to these questions.
2.1.1. Score distributions
Reference databases usually contain a large number of subjects. Several samples are acquired for each
person. Such databases are often used offline for evaluating biometric systems. Each template of each
person is compared to every other stored element in the database. Theses comparisons can be separated
into two categories:
• Genuine comparison when the two samples belong to the same person (also called intra-
class comparison);

Chapter 2: Evaluation of iris recognition systems
23
• Impostor comparison when the two samples belong to different persons (also named inter-
class comparison).
As explained above, a matching score is associated to each comparison. For evaluating the
accuracy of biometric systems, a large number of those scores should be generated for genuine and
impostor distributions. The reliability of the system relies on its ability for separating the two scores
distributions: a threshold should be properly defined to take the correct biometric decision.
When the two distributions do not overlap, the system can entirely differentiate between them
by easily setting a threshold as illustrated in Figure 2-1-a. However, this never occurs in real conditions
as no biometric system is completely truthful. Indeed, the two distributions overlap, and there is
consequently no possible threshold able to perfectly separate them as shown in Figure 2-1-b. By
varying the threshold, some of the genuine comparisons will be incorrectly classified as a non match
(producing false rejection error) and some impostor comparisons will be incorrectly taken as a match
(generating false acceptance error).
Therefore, this threshold plays a key role in the accuracy of a biometric system. If the threshold
is set very low, the system will be strict, rejecting many genuine users. Otherwise, if the threshold is
very high, the system will be more indulgent, letting many impostors pass as genuine. We note that
those two errors are linked to each other: if one increases, the other decreases and vice-versa.
(a) (b)
Figure 2-1: Genuine and impostor distributions for (a) an ideal system, and (b) a real system.
2.1.2. Accuracy rates
There are several metrics to measure the performance of a given biometric systems. Probably, the most
essential indicators are False Acceptance Rate (FAR), False Rejection Rate (FRR), and Equal Error
Rate (EER):

Chapter 2: Evaluation of iris recognition systems
24
• FAR defines “the portion of verification transactions with wrongful claims of identity that
are incorrectly confirmed” (ISO/IEC 19795-1 [47]). This error is also named Type I.
• FRR represents “the portion of verification transactions with truthful claims of identity that
are incorrectly denied” (ISO/IEC 19795-1 [47]). This error is also called Type II.
• When the distributions of the genuine and the impostor overlap, FRR and FAR intersect at
a specific point called the EER of the system. In other terms, the ERR is the point where
the proportion of the FRR and FAR are equals.
The Genuine Acceptance Rate (GAR) may also be used. It is defined as follows: = 1 −. According to genuine and impostor accumulation scores given by the recognition system, FRRs
and FARs are adjusted by varying thresholds as explained in the previous section. Figure 2-2 shows
the relationships between FRR, FAR and EER.
Figure 2-2: Performance of a biometric system: Relationship between FAR, FRR and EER.
We note that False Match Rate (FMR) and False Non Match Rate (FNMR) could be used as
error rates instead of FRR and FAR. The difference between them is that FMR and FNMR do not
include errors specific to biometric applications such as the proportion of Failure To Acquire (FTA)
due to the insufficient quality of the acquired sample. The relationships between FRR/FNMR and
FAR/FMR can be expressed as follow:
( ) ( )1.21 FTAFNMRFTAFRR −×+=
( ) ( )2.21 FTAFMRFAR −×=
In general, the results of a given biometric system are presented as FRR values at certain levels
of FAR. For example, a = 10 @ = 10 means that: one out of 10 impostor attempts is

Chapter 2: Evaluation of iris recognition systems
25
considered as a match, and one out 10 of the genuine attempts is considered as a non match. These
possible couples of values are called operating points.
2.1.3. Performance curves
For visualizing performance results, receiver operating characteristic (ROC) curves are often used.
ROC curve plots pairs of GAR (vertical axis) and FAR (horizontal axis) for varying thresholds
describing a biometric system. When the system is accurate, the curve is near the coordinate axes.
Therefore, it is useful to use logarithmic scale for one or both axis to highlight regions of interest on
the graph and operating points (EER, FRR at different FAR levels). For that reason, Detection Error
Trade-off (DET) curve is usually used instead of ROC curve. Each point of the graph exhibits the FAR
(vertical axis) and FRR (horizontal axis) associated with a certain threshold value, using logarithmic
scales (or at least for one axis). As ROC curve, DET curve covers the whole range of possible
threshold values which is the interval of the matching scores. (Remark: the FMR and FNMR could be
respectively used instead of FAR and FRR.)
Figure 2-3-a shows an example of DET curves for two different biometric systems. System 1
has a lower FRR than System 2 at a specified level of FAR (target 1). Consequently, System 1 is more
accurate than System 2. We can also note that in this case, System 1 is always more effective that
System 2 at every FAR. This does not always happen. For example in Figure 2-3-b, at target 1 System
2 is more accurate than System 1 while at target 2 the reverse occurs. This demonstrates the important
choice of the operating points according to the desired level of security/convenience of the application.
(a) (b)
Figure 2-3: Example of DET curves and some operating points for two distinct biometric systems.

Chapter 2: Evaluation of iris recognition systems
26
2.1.4. Image specific evaluation
The tools previously explained provide global evaluations about the overall performance of a given
biometric system. However, it is interesting to note that some persons (or images) are more difficult to
recognize than other ones. Many researches in biometrics have addressed performance variability
among different users, suggesting that some of them contribute disproportionately to the two error
rates: Type I (FAR) and Type II (FRR) of a biometric system. An analogy between these errors
heterogeneities and the existence of biometric menagerie was investigated in different modalities such
as speech, fingerprint, and face [48] [49] [50].
Doddington et al. [48] were the first authors who applied biometric zoo to the area of speaker
recognition by developing a framework able to identify four categories of speakers based on the
recognition errors for each individual:
• Sheep: Group of subjects that dominate the population and perform recognition easily;
• Goats: Group of subjects that are particularly difficult to recognize;
• Lambs: Group of subjects that are easy to imitate;
• Wolves: Group of subjects those are remarkably good at imitating others.
Goats cause the major portion of FRR but do not affect the FAR. They are especially
problematic for systems which the main interest is convenience issue (low FRR desirable at a fixed
FAR as illustrated in Figure 2-3-b). Paradoxically, lambs and wolves affect the security of the system
by generating high FAR.
In addition to performance variations among the users, different images belonging to the same
person can lead to significant difference in the matching scores. This intra-class variability is
frequently assigned to the acquisition device (different imaging systems, sensors...), the environment
(controlled/uncontrolled capture, illumination variation…) or the user itself (squinting, blinking…).
Disposing of assessment tools for measuring performance variations among the images is very
interesting for developing algorithms that are more robust to such variations, aiming at improving the
overall accuracy of the system.
In [50], novel tools were proposed to perform this type of evaluation. Two new metrics named
image False Match Rate (iFMR) and image False Non Match Rate (iFNMR) were introduced by
inheriting concepts from the biometric menagerie. To our knowledge, it is also the first work that

Chapter 2: Evaluation of iris recognition systems
27
investigated the existence of biometric zoo in the field of iris modality. These errors are defined as
follows:
• iFMR is defined as “the proportion of comparison for which an image produces false
matches”, i.e. impostor comparison scores are at or below the operating threshold (in the
case of dissimilarity scores).
• iFNMR is defined as “the proportion of comparison for which an image produces false non
matches”, i.e. genuine comparison scores are above the operating threshold (in the case of
dissimilarity scores).
Explicitly, let be the comparison score of the image of subject with image of
subject . The set of impostor scores of the image of subject for comparison against all images
of all persons in the database is:
( ) { } ( )3.21,1,,, j
ij
kl NlJjjiskiI KK ==≠=
The iFMR at a certain threshold is then expressed as follows:
( )( )
( )
( )
( )4.21
1,,
,
,
∑∑
∈
∈−−
=kiIs
kiIssH
kiiFMRτ
τ
where is the step function defined as:
( ) ( )5.201
00
>
≤=
xif
xifxH
In a similar way, the set of genuine scores of the image of subject is defined as follows:
( ) { } ( )6.2,1,, lkNlskiG i
ii
kl ≠== K
And, the iFNMR at a given threshold is:
( )( )
( )
( )
( )7.21
,,,
,
∑∑
∈
∈−
=kiGs
kiGssH
kiiFNMRτ
τ
Aggregating these two image-specific error rates, the author was able to classify the images
according to their level of recognition difficulties into four categories, like the Doddington’s concept
(combinations of low or high iFNMR and iFMR) [50].

Chapter 2: Evaluation of iris recognition systems
28
The threshold is set regarding a given value of achieved FMR (for example at = 10 as
proposed in [50]).
These image-specific error rates are not only able for partitioning a corpus into sub-sets but
they are also useful for:
• Quantifying the level of difficulty of an image, and so a overall dataset;
• Assessing the predictive power of iris image quality scores (correlation between the
iFMR/iFNMR and the estimated quality component);
• Detecting errors in the acquisition and the segmentation (images with high value of
iFNMR).
iFNMR and iFMR are interesting for us as one axe of the thesis's research is to develop
approaches for evaluating the quality of the images. Average of iFNMR and iFMR are relevant
indicators on the overall difficulty of the images in the database for recognizing the subjects.
2.2. Evaluation of quality measurement algorithms
Dealing with real-world deployment of biometric systems, the biometric samples often suffer from
various degradations, leading to acquired biometric data of different quality levels. When the capture is
done under strict conditions (controlled mode), the samples are usually of good quality. However in
uncontrolled mode, many factors such as user’s behavior, environmental conditions and sensor designs
can affect negatively the performance of the system [34].
The biometric community including academics, industrials and government, agrees on the fact
that the performance of biometric systems is dependent to the quality of the acquired signal. Therefore,
relevant quality measurement algorithms (QMAs) for assessing the quality of a sample are of crucial
importance. QMAs will be useful for improving the overall performance of a given iris recognition
system by detecting sample of "bad" quality in order to:
• Recapture of the biometric sample of insufficient quality or to select the best sample in live
during the enrollment phase;
• Identify the quality factors that influence iris recognition [51];
• Predict the performance of a given iris system via the quality of the images [52] [53];

Chapter 2: Evaluation of iris recognition systems
29
• Discard images of low quality in a video;
• Assign different weights to the images according to their quality in an image fusion
procedure [54]. By this way, images of best quality will contribute more than the other
ones in the reconstructed image.
But, the legitimate questions that may arise are "what means a sample of good quality?" and
"what is a relevant QMA?".
It is important to differentiate between the visual human quality of the biometric sample and its
quality for matching performance as outlined in [34]. For example for fingerprints modality, if an
observer notes that the image contains clear ridges, well contrasted, he may reasonably judge that the
sample is of good quality. However, if the recognition algorithm is based on minutia and the image
contains insufficient of them, the performance would be degraded. Another example, for face modality:
if the image presents sharp details, the observer may pretend that the image is of good quality too.
Nevertheless, if the recognition system benefits from a slight blurring, the human perception is not
appropriate in that case [34]. As the ultimate goal is to improve [33] the overall accuracy of the
recognition system, QMA should be developed with the respect to the target which is the matching
error rates, and not with the visual human's statement of the sample's quality.
Quantifying the association between the quality measure of the two images to be compared and
the resulting score comparison, is a good way for evaluating the effectiveness of a given QMA.
Biometric matching involves in general two samples and . The goal is then to relate their
corresponding qualities and to their matching score . To simplify the analysis, it is judicious to
combine the qualities into one unique value :
( ) ( )8.2, lkkl qqHq =
Thus, represents the pairwise quality of the two samples and being compared. Several
choices of are investigated in [34]:
• Minimum: ( , ) = ( , )
• Arithmetic function: ( , ) = ( + )/2
• Geometric function: ( , ) =
• Difference function: ( , ) = | − |

Chapter 2: Evaluation of iris recognition systems
30
The choice of is not limited to these propositions. But the authors considered them for their
relevance to real biometric scenarios and ease of implementation. The results show little difference
between them [34]. In the doctoral work, similar results were observed by performing these choices of
. We arbitrary decide to choose the minimum function. In this case, the worst sample drives the
matching score as only one of the two samples being of low quality is sufficient to degrade the
performance.
In the rest of the sub-section, we will present the proposed tools introduced in [34] to assess
QMAs, also used in the IREX II - IQCE (Iris Quality Calibration and Evaluation) benchmark [51]
organized by the NIST. These methods will be exploited for evaluating our proposed quality measure
in Chapter 4.
2.2.1. Ranked DET
As explained in Section 2.1.3, DET curve plots pairs of FMR and FNMR (or FAR and FRR) using
logarithmic scales at certain threshold values. A QMA is considered to be useful if it can at least
provide a ranking of the system's performance. Stated another way, for quality levels,
corresponding DETs curves are plotted and they should not cross each other.
As proposed in the IREX II - IQCE, to generate ranked DETs, the matching scores are divided
into three groups based on their pairwise quality . These three partitions represent samples of low,
medium and high quality. The set of lowest (resp. highest) quality contains a matching score with
pairwise qualities in the lowest (resp. highest) 15 percentile. The rest of the matching scores constitutes
the medium quality set (70%). Hence, three DET curves are generated, one per set. Illustrations of
ranked DET curves based on a good and a weak QMAs are given in Figure 2-4. The dependence of
FNMR and FMR on quality at a fixed threshold τ can be shown by plotting connections between the
ranked DETs (black lines of Figure 2-4). The connection points correspond to a FNMR and FMR that
are observed at the same threshold values.
A QMA is considered as effective if the ranked DETs are well separated. The generated DET
curve for the low quality set should appear above the other curves. In contrast, the DET curve of the
high quality set should be located below the others. In fact, the proper behavior consists in the
observation of expected lower FNMR and FMR as the pairwise quality of the samples increases. If the
ranked DETs overlap, then the QMA is not efficient. The more the separation of the ranked DETs is
high, the more the QMA is effective. If the DET curves are correctly ranked, the connected lines are

Chapter 2: Evaluation of iris recognition systems
31
expected to have a positive slope. In this case, the images of high quality generate low FMR, which is a
desired behavior.
(a) (b)
Figure 2-4: Illustration of ranked DET curves: (a) Relevant QMA: A proper behavior is observed and
(b) Irrelevant QMA: the ranked DET curves are incorrectly ordered.
2.2.2. Error versus reject curves
Error versus Reject curve is an alternative mean of assessing quality measurement algorithms. It
demonstrates how efficiently the rejection of lower quality samples can improve the accuracy of the
overall performance of a given recognition system. By detecting the samples of low quality, in an
operational scenario for example, the quality measure can drive the re-acquisition of a sample.
Moreover, the quality measure can be used to reject a sample in the post processing steps.
The curve plots error rate in function of the percentage of retrieved comparisons in the
database. If the QMA is effective, the error rate should decrease quickly as the rejection percentage
increase. A flat curve suggests that the QMA is not effective in predicting the performance of
recognition.
2.3. Reference iris databases
After describing how to evaluate the performance of biometric recognition systems and quality
measurement algorithms, we will present in this section the iris databases we used in this doctoral work
to validate our approaches.

Chapter 2: Evaluation of iris recognition systems
32
Databases are essential for evaluating recognition algorithms. There are two types of data:
public and proprietary. Obtaining excellent performance by a certain method on a proprietary database
is difficult to reproduce. In contrast, public databases facilitate the evaluation of a proposed system, by
comparing it with existing approaches, which make this type of dataset a valuable means for
benchmarking purposes and for the state-of-the-art’s progress in iris recognition field.
According to [55], biometric databases should satisfy the following criteria:
• Relevant: The dataset must contain a large number of biometric samples per subject, in
identification mode;
• Large: A large number of comparisons are required;
• Representative: The demographics properties (age, gender, race…) of the acquired subjects
should vary;
• Targeted by the sensor types, model, etc;
• Tagged: Meta information are provided with the data;
• Time variant: The dataset should be acquired over large period;
• Un-edited (without pre-processing).
There are several different iris databases available to iris recognition topic. Size samples and
target image characteristics (resolution and format, sensor, acquisition conditions) of the databases
represent a decisive element in the selection of the dataset, influencing recognition accuracy.
As explained in Chapter 1 in this doctoral work, we focus on improving iris recognition in
sequences acquired with low or even poor conditions. We have chosen the portal dataset of the
Multiple Biometrics Grand Challenge [36], CASIA-IrisV4-Thousand [37], and a collection of datasets
taken from QFIRE database [38] [39]. These databases are interesting for us because they contain
sequences (videos or multi images per subject) with various degradations as illumination in-
homogeneities, low resolution, occlusions, blur, specular reflections, etc. It is interesting to note that
those selected databases present different scenarios of acquisition and difficulties, allowing us to study
diverse problems and evaluating the robustness of the proposed approaches in function of these
problems. We also notice that different sensors were employed to acquire theses databases allowing the
validation of our results in these different conditions.

Chapter 2: Evaluation of iris recognition systems
33
In the rest of this sub-section, we present the selected databases in details. Some examples of
images are given to show the difficulties present in the databases.
2.3.1. Multiple Biometrics Grand Challenge: Portal dataset
Between 2007 and 2009, the National Institute of Standards and Technology (NIST) conducted the
Multiple Biometric Grand Challenge (MBGC) [56]. It consists in several sub-challenges to evaluate
face and iris recognition in realistic scenarios (less constraint imposed on the participants during the
acquisition).
Exploring more realistic low resolution and on the move, we chose to work with the portal
dataset of MBGC [36] that is composed of NIR faces videos. This MBGC portal dataset was collected
by capturing facial videos of 129 subjects walking through a confined portal located at 3 meters from a
NIR camera as depicted in Figure 2-5.
Figure 2-5: Illustration of MBGC portal acquisition.
Although the resolution of the frames in the video is 2048 2048, the number of pixels across
the iris is between 90 to 120, which is below the minimum of 140 pixels recommended by Daugman in
[32] as the minimum to ensure a good level of performance.
The images in this dataset contain a large variety of artifacts. They suffer not only from low
resolution but also from motion blur, occlusion, specular reflection and high variation of illumination
between the frames. Examples of bad quality images are shown in Figure 2-6.

Figure 2-6: Examples of bad quality images taken from MBGC
eyelashes occlusions, (c) closed eye, and (d) dark image (low contrast).
2.3.2. CASIA-IrisV4
CASIA-IrisV4-Thousand was collected by the Chinese Academy of Sciences Institute of Automation
(CASIA) [37]. The complete database includes 20000 iris images from 2000 eyes of 1000 persons,
mainly composed of Asian people. This population tends to have droopy eyelids and eyelashes o
downwards covering a significant ratio of the iris region, leading to challenging recognition task. The
images are captured using the dual
subject has 10 instances of both left and right ey
The main sources of variations in a given sequence are eyeglasses, specular reflections and
dilation, which make the iris segmentation particularly difficult.
sequence from CASIA-IrisV4-
sequence and in particular between images S5025L03.jpg and S5025L04.jpg. In some images in the
sequence the subject is asked to wear eyeglasses, which causes strong specular reflections.
Even if the database does not contain videos, we decide
intentional intra-variability in the images
by introducing iris segmentation errors. Therefore, by using this database for test, we will
proposed approaches are robust
Chapter 2: Evaluation of iris recognition systems
34
(a) (b)
(c) (d)
Examples of bad quality images taken from MBGC portal: (a) out of focus, (b) eyelid and
eyelashes occlusions, (c) closed eye, and (d) dark image (low contrast).
IrisV4-Thousand
Thousand was collected by the Chinese Academy of Sciences Institute of Automation
. The complete database includes 20000 iris images from 2000 eyes of 1000 persons,
mainly composed of Asian people. This population tends to have droopy eyelids and eyelashes o
downwards covering a significant ratio of the iris region, leading to challenging recognition task. The
images are captured using the dual-eye iris camera using IKEMB-100 produced by IrisKing. Each
subject has 10 instances of both left and right eye.
The main sources of variations in a given sequence are eyeglasses, specular reflections and
dilation, which make the iris segmentation particularly difficult. Figure 2-7 illustrates an example of a
-Thousand. We note the significant difference of the pupil's size in the
sequence and in particular between images S5025L03.jpg and S5025L04.jpg. In some images in the
to wear eyeglasses, which causes strong specular reflections.
the database does not contain videos, we decided to work with it. Indeed, the
variability in the images considerably degrades the recognition
by introducing iris segmentation errors. Therefore, by using this database for test, we will
proposed approaches are robust to segmentation errors.
Evaluation of iris recognition systems
: (a) out of focus, (b) eyelid and
eyelashes occlusions, (c) closed eye, and (d) dark image (low contrast).
Thousand was collected by the Chinese Academy of Sciences Institute of Automation
. The complete database includes 20000 iris images from 2000 eyes of 1000 persons,
mainly composed of Asian people. This population tends to have droopy eyelids and eyelashes oriented
downwards covering a significant ratio of the iris region, leading to challenging recognition task. The
100 produced by IrisKing. Each
The main sources of variations in a given sequence are eyeglasses, specular reflections and
illustrates an example of a
difference of the pupil's size in the
sequence and in particular between images S5025L03.jpg and S5025L04.jpg. In some images in the
to wear eyeglasses, which causes strong specular reflections.
to work with it. Indeed, the
degrades the recognition accuracy, essentially
by introducing iris segmentation errors. Therefore, by using this database for test, we will see how our

Chapter 2: Evaluation of iris recognition systems
35
Figure 2-7: Sequence of images for the subject S5025L from CASIA-IrisV4-Thousand.
2.3.3. QFIRE database
Quality Face and Iris Research Ensemble (QFIRE) [38] [39] was collected by Clarkson University. The
acquisition was funded by the Department of Homeland Security (DHS) Science and Technology
(S&T) Directorate in cooperation with the National Science Foundation. QFIRE is a multimodal
database composed of iris and face image sequences captured at varying distances and at different
quality levels totally controlled at the acquisition. The iris subsets were particularly used in the IREX II
- IQCE benchmark [51] to evaluate the impact of different factor quality on iris recognition.
Apart from this, to our knowledge, only a few works have been assessed on this database for
the iris modality [40] [41] [42] and no protocols have been yet defined for this database. The QFIRE
database contains a large number of various acquisition scenarios. To study the contribution of the
proposed fusion method we chose an acquisition context which differs from the one used in the
previous databases mentioned in Sections 2.3.1 and 2.3.2. We decided to work with iris acquisition of
stationary subject taken at different significant distances. This variation introduces different iris
resolutions between the sequences.
More precisely, we selected 3 subsets composed of NIR videos, captured with a Dalsa 4M30
infrared camera with a Tamron AF 70-300mm 1:4.5-5.6 LD DI lens, taken at a distance of 5, 7, and 11
feet. This variability in the distance was introduced to generate respectively high, medium and low-
resolution iris images as classified in [35]. The quality factor "resolution" is defined as the maximum
number of pixels across the horizontal diameter of the iris.

Chapter 2: Evaluation of iris recognition systems
36
Using different distances allows us to study the impact of the proposed fusion schemes for
different iris resolutions. Indeed, as the resolution decreases, the iris area in the image is getting less
textured and with less distinctive details, as illustrated in Figure 2-8.
(a) (b) (c)
Figure 2-8: Degradation of the iris texture since the distance of the acquisition increases. The selected
images correspond to best image in the sequence.
This lack of resolution leads to blurred images. Moreover, during the acquisition procedure of
QFIRE in order to generate some non-uniformity in each videos sequence, an intentional defocus blur
was added to each sequence by manually turning the focus ring of the iris camera.
The publicly released part of QFIRE consists of 90 subjects with two visits. In all, for each
person, two videos of 6 seconds in length were acquired at each distance at a certain illumination level
(low, medium and high). Varying levels of illumination are achieved through fixed illumination plus
varying levels of lights based on a LED-based portal positioned at 3 feet from the subject as presented
in Figure 2-9. This portal is composed of 8 LEDs, which can be turned off or on. For the medium level,
6 LEDs are switched on.
This level of illumination corresponds to the lower bound of contrast suggested by the current
ISO iris image standard requirements [35]. The contrast is defined as the difference in gray level
between the iris/pupil and the iris/sclera, which are respectively proposed to be at least 50 and 70 gray
levels. To make a compromise, we choose the medium illumination level for all the distances.

Chapter 2: Evaluation of iris recognition systems
37
Figure 2-9: QFIRE acquisition [39].
We expect an important decrease in the recognition performance with the decrease of
resolution and we want to assess and quantify to what extent the fusion schemes we propose can cope
with these degradations. Table 2-1 summarizes the characteristics of each subset. We respectively call
QFIRE05, QFIRE07 and QFIRE11 the datasets taken at 5, 7 and 11 feet.
Table 2-1: Characteristics of each of the 3 subsets of QFIRE database.
Subset notation QFIRE05 QFIRE07 QFIRE11
Distance 5 feet 7 feet 11 feet
Resolution metric range 280 to 300 200 to 220 100 to 120
Quality level High Medium Low
Subset comparable to Higher quality of
UBIRIS datasets
Medium quality of
CASIA and BioSecure
datasets
Low quality MBGC
dataset (NIR face
camera)
As the datasets are composed of face videos, we first have to detect and extract the eyes. In
particular, the sequences contain entire (at long distances) or partial faces (at close distance). To
localize the eyes, in the case of entire faces, we used the Matlab code developed in [57] based on an
enhanced pictorial structure model for precise eye localization. In order to track the eyes in partial
faces, we used a simple implementation based on a Hough transform. In this way, we obtain eye
images on which we can apply a standard processing: segmentation, normalization, feature extraction
and then template matching as explained in Section 1.4. False detections were manually discarded. In

Chapter 2: Evaluation of iris recognition systems
38
addition, due to the intentional defocus blur added at the beginning and the end during the sequence
acquisition in the QFIRE database, we have to discard unusable frames and for this, we used wavelet
transform.
In order to increase the number of intra-class comparisons, we divided the sequences with a
large number of usable frames into multiple sequences. After all these pre-processing processes, the
database we used in our experiments is composed of 676, 453 and 361 sequences for respectively
QFIRE05, QFIRE07 and QFIRE11. Each sequence has at least 10 frames. For more details on the used
dataset and protocols, see appendix B.
Table 2-2 summarizes the dataset's characteristics and lists subjectively the perceived noise
factors in the datasets we used in this doctoral work. We can note the variety of scenarios and
difficulties which allowed us an extensive evaluation of our fusion methods.
Table 2-2: Characteristic and noise factors in open iris databases.
Database MBGC CASIA-IrisV4-
Thousand QFIRE05 QFIRE07 QFIRE11
Acquisition
scenario
At a distance
and on the
move
Intra-class
variations,
static subject
At a distance,
static subject
At a distance,
static subject
At a distance,
static subject
Format NIR face videos NIR images
(jpg) NIR face videos NIR face videos NIR face videos
Sensor MBGC-Portal
(IOM system)
Irisking IKEMB-
100
Dalsa 4M30
infrared camera
Dalsa 4M30
infrared camera
Dalsa 4M30
infrared camera
Resolution low medium high medium Low
Reflections ** ** ** ** **
Occlusions ** * * * *
Blur * * * **
Illumination * **
*present, **problematic
2.4. Benchmarks
Taking into consideration all the various iris recognition algorithms available in the state-of-the-art, it
can be difficult to decide which one provides the best results. To compare the performance of two iris
recognition systems, the same protocol and the same data must be used. For these reasons, international

Chapter 2: Evaluation of iris recognition systems
39
campaigns of benchmarks are frequently organized. They are in general public and are coordinated by
an independent organism. In this sub-section, we will present several benchmarks that have taken place
in the area of iris recognition.
Most of the benchmark campaigns that have addressed iris recognition were conducted by the
National Institute of Standards and Technology (NIST). One of the first open challenges was the Iris
Challenge Evaluation 2005 (ICE2005) [58] initiated by NIST. The main goal of this benchmark was to
encourage the development of iris recognition systems and to defend this biometric modality in front of
the US government. The ICE2005 challenge provided the first largest public dataset, a common
experimental protocol for measuring the performance and a baseline iris recognition system (irisBEE).
The provided dataset contains 2953 iris images from 132 subjects, organized into two experiments: left
and right eyes. Twelve algorithms from nine submitters were benchmarked from August 2005 until
March 2006. At a FAR of 0.001 the verification rate on right irises is above 0.995 (for the 5 top
algorithms) and on the left irises between 0.990 and 0.995. The results of the evaluation showed
correlations between the right and left irises for match and non-match scores, and quality measures.
More details about the experimental results can be found in [59].
Soon after, NIST organized a second Iris Challenge Evaluation: ICE 2006 combined with Face
Recognition Vendor Test (FRVT) 2006 between June 2006 and March 2007. The objective of this
challenge was to alleviate comparison between the biometric modalities face and iris by defining a
common testing protocol. Contrary to ICE2005, ICE2006 proposed an independent evaluation with
sequestered data (not previously seen by the researchers). The dataset used for this benchmark is larger
than ICE2005 since it contained 59558 iris images. The experimental results are presented in [60].
The Multiple Biometric Grand Challenge (MBGC) conducted by NIST took place from 2007
to 2009 [56]. Three challenges were addressed: portal, still face and video. The main interest of this
project was to investigate, test and improve performance of face and iris recognition in both still
images and videos towards less restrictive acquisition environment. The challenge problems focused
on:
• Face recognition on still frontal images of high and low resolution;
• Iris recognition from off-angles images and videos;
• Face and iris fusion at score and image levels;
• Unconstrained face recognition from still image and video;

Chapter 2: Evaluation of iris recognition systems
40
• Recognition from NIR and HD video streams taken through portals.
Experimental results of the portal challenge are summarized in Table 2-3. GARs were nearly perfect
for the face modality and promising for the iris modality.
Table 2-3: Results of the MBGC portal workshop.
Portal challenge’s protocol GAR
Still iris vs. NIR video 20--95% at 1% FAR
Video iris vs. NIR video 20--95% at 1% FAR
Still face vs. HD video 15--100% at 1% FAR
Still iris and still face vs. NIR video and HD
video 80--100% at 0.1% FAR
In 2007 to 2009, the Noisy Iris Challenge Evaluation (NICE) was the first initiative towards
iris recognition with unconstrained data, using visible wavelength instead of NIR iris images.
Organized by University of Beira Interior's the SOCIA Lab in Portugal (Soft Computing and Image
Analysis Group), it was conducted in two separate parts: NICE I [61] and NICE II [62]. The first
challenge focused only on iris segmentation and noise detection by classifying the pixels of the image
into iris class or non-iris class. All participants were evaluated by comparing the classification error
rate (portion of pixels that disagree with respect to the ground truth manually determined on 500
images). The evaluation was reported on iris images similar to the ones of UBIRIS.v2 dataset [63].
Over than ninety contestants from 20 different countries participated to this challenge. The best
performance was achieved by the work of [64] with an error rate of 0.0131%. The global results
pointed out that most errors were caused by the failure of detecting accurate pupillary boundaries in
contrast to what occurs with NIR data.
The subsequent NICE II challenge conducted between 2009 and 2011 addressed the feature
extraction algorithms and comparison techniques of degraded iris images in visible wavelength,
already segmented accordingly to the best algorithm [64] of NICE I. The images used in the
benchmark are the same as those in NICE I. The challenge attracted 67 contestants. The evaluation was
based on the decidability index defined in [65]. Tan et al. [66] were the winner of the competition with
a decidability of 2.5748 (vs. 1.8213 for the second place). The approach considers multi-biometric
combination of iris and periocular data based on global color-based features and local ordinal
measures.

Chapter 2: Evaluation of iris recognition systems
41
Starting in 2007, NIST has conducted a program entitled The IRis EXchange (IREX) [23] in
several instances with specific objectives:
• IREX I addresses compression effects on the performance of commercial algorithms and
the interoperability of formats. It also summarizes the performance of iris recognition
algorithms submitted to NIST since 2009.
• IREX II - IQCE defines several iris quality factors and investigates their influence on iris
recognition accuracy.
• IREX III targets a large scale performance evaluation of iris recognition algorithms
published in the academic literature in order to prove the effectiveness of iris recognition
as a powerful biometric modality.
• IREX IV extends IREX III evaluations of iris identification algorithms for large scale
applications. It is composed of two parts. The first part explores the prospective of using
cost estimation model as a new performance metric in order to optimize the algorithm for a
specific application. The cost corresponds to a trade-off between security and convenience.
The second part establishes compression profiles for the compact representation of iris
images.
• IREX V outlines recommendations and simple procedures for the camera operator, the
subject behavior and the iris camera allowing a proper collection of iris images of good
quality.
• IREX VI investigates the temporal stability of iris recognition accuracy to determine
whether the performance decreases with the lapse of time between the enrollment and the
test stage. It intends to quantify natural ageing effect of the iris in a healthy population.
• IREX VII will intent to define a framework for communication and interaction between the
components in an iris recognition system. The goal is to facilitate the development of more
flexible, extensible and modifiable systems. The report is not yet published.
It is interesting to note that the quality of iris images has been studied in most benchmarks
projects cited in this sub-section. This shows the importance of the quality in the recognition accuracy.
Recent competitions have been organized in conjunction with international conferences on
diverse problems:

Chapter 2: Evaluation of iris recognition systems
42
• LivDet-Iris 2013 (Iris Liveness Detection Competition 2013 [67]) aimed at developing
approaches able to detect imitations of biometric characteristics to prevent from
presentation attacks. The competition was composed of two sub-competitions: Software-
based and System-based test. The competition provides public iris databases that contain
spoof and live images. The spoof images are obtained by using patterned contact lenses
and printed iris images. Only three contestants have participated to the competition. The
results were presented in the international conference on Biometrics: Theory, Applications
and Systems (2013) and are available online [67].
• ICIR 2013 (ICB Competition on Iris Recognition 2013 [44]) was organized by the Chinese
Academy of Sciences’ Institute of Automation (CASIA) in 2013. It was the ICB
Competition on Iris Recognition. The competition aimed at collecting recent state-of-the-
art algorithms of iris recognition. The submitted algorithms were evaluated on a
sequestered subset of CASIA-Iris-Thousand database [37]. The iris images suffer from
motion blur, non-linear deformation, eyeglasses and specular reflections. Eight teams
including our research group have participated. The experimental results were presented in
the International Joint Conference on Biometrics (2014) and are available in [44]. In
particular, our algorithm [33] have given an EER of 3.02% (second best rate) and a FNMR
of 31.41% at a FMR=0.01% (third best rate).
Today, a particular interest is devoted to iris recognition on mobile devices, some benchmarks
have already addressed this new issue:
• MobILive 2014 (Mobile Iris Liveness Detection Competition 2014 [68]) covers also anti-
spoofing attack. The goal is to classify the images into fake and real images acquired by
mobile devices. The fake images are printed images. The dataset is composed of a subset
of iris images taken from MobBIO database and its corresponding fake images.
• MICHE-I (Mobile Iris Challenge Evaluation, Part I [69]) was organized in 2014. Its goal
consists in tracking the most pertinent contributions in the field of iris recognition on
mobile devices (smartphone or tablet). It includes iris detection, segmentation and
recognition tasks. To this end, a database captured under uncontrolled settings using
mobile devices was provided (MICHE BIPLAB [70]). Nevertheless, participants were also
encouraged to provide new datasets with the characteristics of the devices used to capture
the images. The contestants were asked to provide their algorithms (executable codes). In

Chapter 2: Evaluation of iris recognition systems
43
fact, this special issue on iris recognition on mobile devices aimed also at promoting the
reproducibility of the research results. An overview of the participants and the datasets
they used for their experiments is given in [71].
2.5. Conclusion
In this chapter, several tools for evaluating biometric recognition and quality measurement algorithms
were described in details. These tools are commonly used in the biometric community to assess the
effectiveness of the developed algorithms. The evaluations are done on a large number of biometric
samples. We also presented the different iris databases we have used in the thesis, namely MBGC,
CASIA-IrisV4-Thousand and collections taken from QFIRE. For each database, we presented the
specific degradations present in the images in order to highlight in which aspect iris recognition is
challenging. We insisted on the fact that these databases cover different types of scenarios, leading to
various difficulties, in order to show the effectiveness of our results. Finally, we cited the major public
evaluation campaigns on iris recognition. We note that iris recognition in less constrained environment
and quality assessment are two topics often addressed in the literature. This shows that the research
community is concerned about these two issues.
In the next chapter, we will explain how iris recognition works. We describe in particular the
pioneer algorithm which has inspired most of the current iris recognition systems. Several recent iris
recognition algorithms and open source systems will also be presented. Then, we will describe the
reference iris recognition systems developed in our team, and more precisely those used in the thesis. A
literature review on iris acquisition systems in less constrained environments will close the next
chapter.

Chapter 3. Fundamentals in iris acquisition and
recognition systems
3.1. Iris recognition systems in the literature ........................................................................ 46
3.1.1. Daugman's iris recognition system ....................................................................... 46
3.1.2. Wildes' approach .................................................................................................. 50
3.1.3. Recent algorithms ................................................................................................ 51
3.1.4. Open source systems for iris recognition .............................................................. 53
3.2. Reference systems developed by our research team....................................................... 54
3.2.1. Relevant versions: OSIRIS's evolution ................................................................. 55
3.2.1.1. OSIRISV2............................................................................................................ 55
3.2.1.2. OSIRISV4............................................................................................................ 56
3.2.1.3. OSIRISV4.1 ......................................................................................................... 58
3.2.2. OSIRIS's impact in the research community and evaluation performance ............. 62
3.3. Iris acquisition systems in less constrained environments .............................................. 65
3.3.1. Literature review .................................................................................................. 65
3.3.2. Challenges in iris acquisition systems ................................................................... 68
3.4. Conclusion ................................................................................................................... 69

Chapter 3: Fundamentals in iris acquisition and recognition systems
45
his chapter provides basic considerations about iris recognition. Questions like "How does
iris recognition work?", «What are the iris recognition systems available in the literature?" ,
and "What are today's challenges in iris acquisition and recognition?" will be discussed in
this chapter.
As explained in Chapter 1, authentication by biometric verification is becoming increasingly
common in security applications such as banking, border and access control, forensics and so on.
Today, a particular attention is given to iris biometrics, due to its high reliability for personal
identification. This modality is relatively recent since the first automatic system able to identify people
based on iris texture was proposed by John Daugman in 1993. Later on, alternative solutions have been
proposed in the literature aimed at improving the performance of the recognition. To our knowledge,
there are only few open source algorithms for iris recognition. Such systems are extremely useful for
the research community. Indeed, they provide an accessible tool for comparative evaluation (baseline)
of other algorithms. They also encourage development through the modification of some of their
components, contrary to commercial products which are in general “black-box” systems.
Details on pioneer algorithms for iris recognition, as well as recent methods and existing open
source systems are given in Section 3.1.
Moving forward in this direction, the BioSecure Association, maintained by our research team
[43], has proposed an Open Source IRIS recognition system (OSIRIS), in 2007, aiming at providing a
reference for the scientific community. OSIRIS is designed as a modular software system, adequate to
study modifications of its components and their effects on performance. Several versions of OSIRIS
have been implemented, aiming at improving recognition accuracy. In Section 3.2, we detail the
evolution of the open source iris recognition system OSIRIS through its more relevant versions, as well
as the latest versions we have employed for performing iris recognition in this thesis.
To satisfy recent applications requirements, iris acquisition conditions have been gradually
relaxed. Indeed, less intrusive and more fluid acquisition systems would be appreciated in many iris
recognition applications. A literature review on iris acquisition systems in less constrained
environment: at a distance, with eventually mobile subjects is related in Section 3.3. We insist on the
challenging task of designing iris recognition and acquisition systems. The relaxation of the constraints
on the subject leads to images of low quality, affecting negatively the performance obtained by usual
iris recognition systems. This will lead us to underline what contributions this doctoral work makes in
T

Chapter 3: Fundamentals in iris acquisition and recognition systems
46
the management of the issue of iris recognition improvement in less restrictive acquisition
environment.
3.1. Iris recognition systems in the literature
3.1.1. Daugman's iris recognition system
The first operational iris recognition system was proposed in 1993 by John Daugman [13] who later
patented it in 1994 [12]. As mentioned in Section 1.4, he divides the problem into four parts:
segmentation, normalization, feature extraction and template matching [13].
Initial method:
To segment the iris region, Daugman assumes that it can be modeled by two non-concentric
circles. The pupillary and the limbic boundaries are approximated by theses circles thanks to an
integro-differential operator according to the following formula:
( ) ( ) ( )1.32
,max
0000 ,,,, ∫∂
∂∗
yxryxrds
r
yxI
rrG
πσ
where * denotes convolution, I represents the original iris image and ( ) symbolizes a Gaussian
filter used for smoothing, σ being the standard deviation.
This operator searches over the whole image for the maximum in the blurred partial derivative, with
respect to increasing radius , of the normalized contour integral of ( , ) along a circular arc of
radius and center ( , ).
In order to overcome the fact that the size of the iris can change from an image acquisition to
another the iris region should be normalized. Indeed, iris dilation/contraction are caused by
illumination variations during the acquisition. To handle this issue, the iris area is transformed into a
rectangle image of a pre-determined dimension so that it can be used in the template matching module.
Such transformation can be seen as an unwrapping of the iris texture delimited by the two pupillary and
the limbic boundaries, obtained in the segmentation module as illustrated in Figure 3-1.
More precisely, the normalization technique transforms the iris image from cartesian
coordinates ( , ) to the dimensionless polar coordinates ( , ). This mapping can be expressed as
follows:

Chapter 3: Fundamentals in iris acquisition and recognition systems
47
( ) ( )( ) ( ) ( )2.3,,,, θθθ rIryrxI →
where is in the range of 0, 1 ; is an angle in the range of 0, 2 ; ( , ) and ( , ) consist in
linear combination of the set of pupillary boundary points ( ), ( ) and the set of limbic
boundary points ( ), ( ) , such that:
( ) ( ) ( ) ( ) ( )3.31, θθθ ip rxxrrx +−=
( ) ( ) ( ) ( ) ( )4.31, θθθ ip ryyrry +−=
This normalization is often referred to, as the rubber-sheet model of the iris. Such mapping has
many benefits. The normalized iris image is invariant to iris size and/or dilation/contraction and eye
image translation. Moreover, it transforms eye image rotation into normalized iris translation
(horizontal axis). In addition, in the template matching module, the normalized irises can be easily
compared thanks to the common fixed size.
Figure 3-1: Illustration of the transformation procedure proposed by Daugman’s normalization [33].
On the left, the original image. The iris is segmented by two circles. On the right, the corresponding
unwrapped texture according to Daugman's rubber sheet.
Then, the feature extraction module's purpose consists in generating a compact representation
of the characteristics of the iris texture aiming at facilitate the comparison. In Daugman's approach,
these characteristics results in a binary code called irisCode, representing frequency information. More
precisely, the irisCode is built by applying a set of Gabor filter at different scales and orientations at
predetermined points of the normalized image. Then, only the phase of the resulting coefficients is
used to represent the iris. For compression information purpose, the phases are quantized: a pair of bits
is assigned to each coefficient depending on the sign of its real part and imaginary part as depicted in
Figure 3-2. By keeping only the phase information, illumination/contrast, camera gain and other noise

Chapter 3: Fundamentals in iris acquisition and recognition systems
48
factors, which typically influence magnitude information, are avoided [13]. The irisCode's length
depends on the number of Gabor filters applied. Daugman used a binary code of 2048 bits.
Figure 3-2: Illustration of the phase quantization.
Finally, template comparison is achieved by a bitwise comparison between two binary codes
associated to two irises. The Hamming distance is used to evaluate the dissimilarity between the two
irisCodes (A and B), resulting in a matching score according to the following formula:
)5.3(IrisCodeBIrisCodeAHD ⊗=
where ⨂ denotes the XOR operator.
This score represents the ratio of the number of bits that disagree on the length of the
irisCodes. The score is 0 if the two irisCodes are identical, and 1 if all the bits disagree. Since each bit
has equal a priori odds of being a 1 or a 0, the probability that any pair of bits from different irisCodes
disagrees is 0.5. If all the 2048 bits were completely independent, the expected impostor distribution of
observed Hamming distances would be a binomial distribution with = 0.5 and = 2048. However,
the set of Gabor filters used in the feature extraction introduces intrinsic correlation between the bits. In
addition, there is some spatial correlation between the pixels of the iris image [13]. Due to these two
factors, Daugman shows that there are only 173 independent binary degrees of freedom in the irisCode.
Consequently, the impostor matching scores can be modeled by a binomial distribution with = 0.5
and = 173 and the likelihood that two irisCodes obtained from two different irises fully agrees is
approximately one in 2 ≈ 10 [13].

Chapter 3: Fundamentals in iris acquisition and recognition systems
49
In practice, the iris texture can be affected by non ideal acquisition conditions such as head
rotation. A rotation of the iris texture in the original image introduces a horizontal shift of the texture in
the normalized image. In that case, binary codes are not aligned and the comparison is biased. To
overcome this issue, Daugman proposes to perform different shifts to one of the irisCode of the
pairwise to be compared, before evaluating the Hamming distance between the irisCodes. The
minimum score corresponds to the correct alignment of the two images.
Performance's improvement:
Since 1993, Daugman has proposed several techniques that can improve the performance given
by his first iris recognition algorithm. For example in [72], Daugman proposed to improve the
segmentation stage by adding the localization of the upper and lower eyelids by curvilinear edges
detection. By this way, he created a binary mask which is then unwrapped according to the rubber
sheet. This normalized mask is associated to the corresponding irisCode, aiming at eliminating the bits
generated from noisy regions in the iris from the comparison. The Hamming distance between iris A
and iris B is then computed as follows:
( ))6.3(
maskBmaskA
maskBmaskAIrisCodeBIrisCodeAHD
∩
∩∩⊗=
where ⨂ denotes the XOR operator and ⋂ the intersection operator (to insure that the distance is only
performed on non noisy region of irisCodes A and B).
The latest improvements of his iris recognition system were presented in [73]. Daugman
proposed four supplementary enhancements:
• A segmentation based on active contours aiming at modeling the pupillary and limbic
borders more faithfully;
• A Fourier-based method for detecting off-angles in the iris images in order to handle them
by rotating the eye into orthographic perspective;
• A statistical inference technique for identifying and eliminating eyelashes;
• A score normalization method based on the amount of iris texture that is available in the
images and the required scale of database search.
The new Hamming distance is obtained according to Formula 3.7, in which HD represents the
hamming distance previously calculated in Formula 3.6, is the number of available bits that are
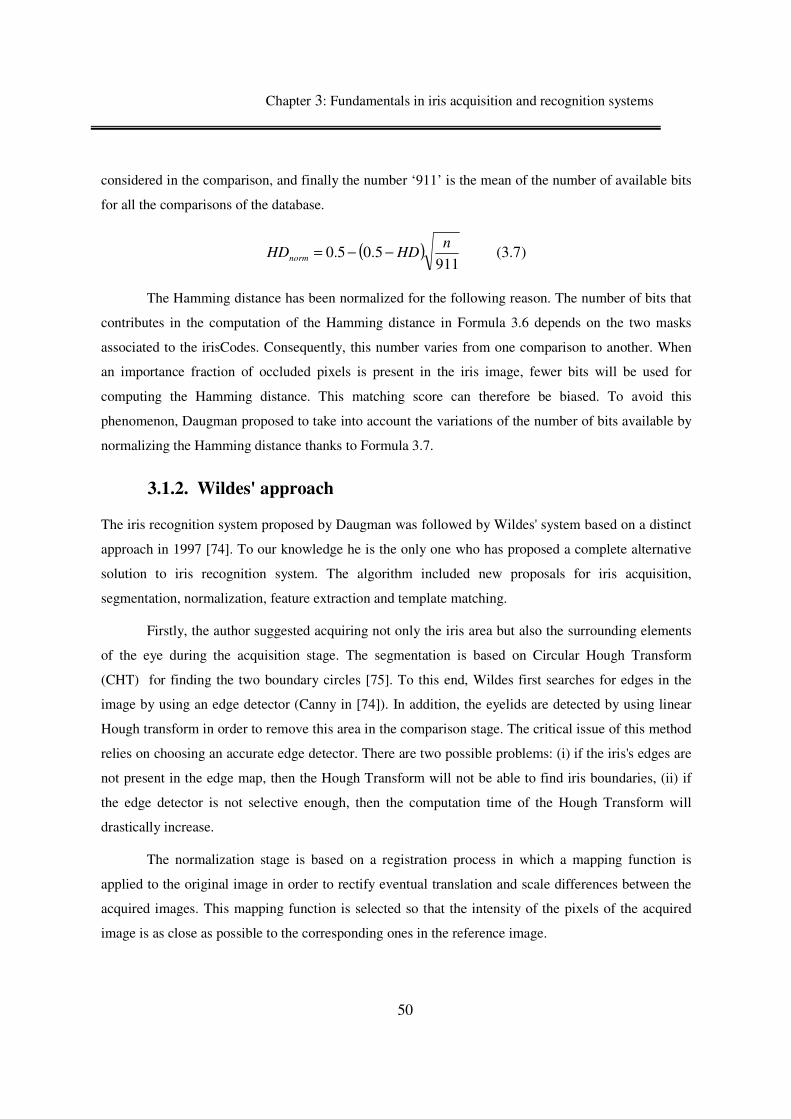
Chapter 3: Fundamentals in iris acquisition and recognition systems
50
considered in the comparison, and finally the number ‘911’ is the mean of the number of available bits
for all the comparisons of the database.
( ) )7.3(911
5.05.0n
HDHDnorm −−=
The Hamming distance has been normalized for the following reason. The number of bits that
contributes in the computation of the Hamming distance in Formula 3.6 depends on the two masks
associated to the irisCodes. Consequently, this number varies from one comparison to another. When
an importance fraction of occluded pixels is present in the iris image, fewer bits will be used for
computing the Hamming distance. This matching score can therefore be biased. To avoid this
phenomenon, Daugman proposed to take into account the variations of the number of bits available by
normalizing the Hamming distance thanks to Formula 3.7.
3.1.2. Wildes' approach
The iris recognition system proposed by Daugman was followed by Wildes' system based on a distinct
approach in 1997 [74]. To our knowledge he is the only one who has proposed a complete alternative
solution to iris recognition system. The algorithm included new proposals for iris acquisition,
segmentation, normalization, feature extraction and template matching.
Firstly, the author suggested acquiring not only the iris area but also the surrounding elements
of the eye during the acquisition stage. The segmentation is based on Circular Hough Transform
(CHT) for finding the two boundary circles [75]. To this end, Wildes first searches for edges in the
image by using an edge detector (Canny in [74]). In addition, the eyelids are detected by using linear
Hough transform in order to remove this area in the comparison stage. The critical issue of this method
relies on choosing an accurate edge detector. There are two possible problems: (i) if the iris's edges are
not present in the edge map, then the Hough Transform will not be able to find iris boundaries, (ii) if
the edge detector is not selective enough, then the computation time of the Hough Transform will
drastically increase.
The normalization stage is based on a registration process in which a mapping function is
applied to the original image in order to rectify eventual translation and scale differences between the
acquired images. This mapping function is selected so that the intensity of the pixels of the acquired
image is as close as possible to the corresponding ones in the reference image.

Chapter 3: Fundamentals in iris acquisition and recognition systems
51
The feature extraction step is based on real-valued feature vectors instead of binary codes such
as proposed by Daugman. A multi-spectral analysis is carried out on the registered iris images by using
Laplacian of Gaussian (LoG) filters at four resolutions. The filtered images represent the feature
vector. A similarity score based on normalized correlation between the vectors of the reference and the
test images is computed in the template matching stage.
Compared to the initial Daugman's system [13], Wildes' approach leads to higher EER as
pointed in [76]. In addition, the system is more complex than [13]: a less compact representation of
iris features is used and a correlation step is performed to obtain a matching score instead of a simple
Hamming distance. Nevertheless, Wildes' segmentation is considered to be more stable to noise
perturbations (thanks to CHT method) than [13] and is also able to obtain finer distinctions between the
irises (no quantization step).
3.1.3. Recent algorithms
Several researches have proposed alternative solutions especially to segmentation and feature
extraction stages, aiming at improving the performance of the recognition. However, in general the
majority of the existing works on iris recognition used Daugman’s rubber-sheet [13] to perform
normalization.
Segmentation:
In the literature, there is a large variety of segmentation methods. The pupillary and limbic
boundaries can be detected by circles or ellipses fitting techniques. For instance, CHT was widely used
with some variations in several works [76] [77] [78] [79] [80] in order to perform iris segmentation. In
[81], Zuo and Schimd proposed to segment the iris by fitting rotated ellipse on pre-processed iris
images: the noise was considerably reduced thanks to inpainting, and contrast enhancement algorithms.
Uhl and Wild presented in [82] a four steps iris segmentation framework: (i) inpainting process for
reflection removal, (ii) initial center detection by using feedback on edge magnitude and orientation
given by Weighted Adaptive Hough Transform, and (iii) detection of potential boundaries in the polar
and ellipsopolar domains and (iv) selection of the best candidate.
Since the iris is neither circular nor elliptical, several authors proposed methods based on
active contours aiming at approximating real iris boundaries by curve fitting techniques by using:
pulling and pushing elastic model (He et al. [83]), active contours (Vatsa et al. [84]), and geodesic
active contours (Shah et al. [85] and Roy et al. [86]).

Chapter 3: Fundamentals in iris acquisition and recognition systems
52
Other techniques use texture analysis to perform iris segmentation. For example, in [87]
Benboudjema et al. exploited a Triplet Markov Field (TMF) for unsupervised segmentation of the eyes
in non ideal acquisition condition. A Hidden Markov Field (HMF) and a graph cut based energy
minimization algorithm were also proposed by Pundlik et al. in [88] to perform eye segmentation.
Recently, Hidden Markov Chain (HMC) and Pairwise Markov Chain (PMC) were also investigated to
segment irises in challenging iris images.
A wide literature exists on iris segmentation approaches. See [89] for a more extensive selection of
algorithms.
Feature extraction and template matching:
Several researchers have kept the representation of the iris template in binary codes, thus
allowing low memory (compact representations) and fast template matching (simple distance).
However, alternative ways to extract the iris texture features were proposed. For example, Sun et al.
[90] proposed to exploit ordinal measures i.e. relative comparison, between sub-parts of the normalized
iris image. To this end, multi-lobe differential filters (MLDF) are employed to extract ordinal iris
features. Several parameters such as scale, inter-lobe distance, orientation and number of lobes are set
for defining the MLDF allowing flexible filter construction. Consequently, MLDF may be more
adaptive to specific texture patterns. The response of the filter is then quantized into a binary code as
done in Daugman’s approach. Others filters have also been tested for extracting iris features: Discrete
Cosine Transform (DCT) as proposed by Monro et al. [91], and dyadic wavelet transforms as
suggested by Ma et al. [92]. A comparison study between several filters has been investigated by
Thornton et al. [93] in order to determine which filter leads to best recognition performance. The tested
filters are: Daubechie’s wavelet, bi-orthogonal wavelet, Coiflet wavelet, Symlet wavelet, Haar wavelet,
circular symmetric filters and Gabor wavelet, and the best results were obtained by using Gabor
wavelets. In all these approaches, filters’ responses are quantized into a series of bits from which a
similarity/dissimilarity score can be easily computed between the two iris templates to be compared.
As in Wildes’ approach [74], several authors exploited real-valued features instead of binary
ones. For example, a phase correlation technique in Fourier domain was proposed by Miyazawa et al.
[94]. Kumar et al. [95] proposed to generate specific correlation filters for each iris class. Several intra-
class images are required at the learning phase for designing the filter. In the test phase, the filter is
applied to the test iris image to determine if the two iris images come from the same person. If the
resulting correlation contains a narrow peak, then a good match exists between the test and the

Chapter 3: Fundamentals in iris acquisition and recognition systems
53
reference iris images. Otherwise, there is no match. To build the correlation filter, the authors used
Optimal Trade-off Synthetic Discriminant Function (OTSDF) [96] which aims at minimizing the
Average Correlation Energy (ACE) and the Output Noise Variance (ONV). In [77], Krichen et al.
exploited real-valued features obtained by Gabor-filtered phase. Then, local normalized cross-
correlations are performed between sub-parts of the two templates to be compared. The values of the
different peaks and their position are used to evaluate a similarity matching score.
The previous listed works are not exclusive. More feature extraction techniques can be found in [89].
3.1.4. Open source systems for iris recognition
It is interesting for the research biometric community to have access to free iris recognition systems in
which each module can be studied and examined independently. Moreover, the code can be extracted
or/and re-used for other issues. However, to our knowledge only few open source reference systems for
iris recognition are available.
Probably, the most widespread open source iris recognition system was supplied by Masek and
Kovesi [79] in 2003. The approach is inspired from the first system proposed by Daugman [13]. It was
developed as a part of Masek Master’s thesis [97]. The source code, written in MATLAB®, has been
largely employed by the research community for comparative evaluations and testing purpose. The
code is designed as a modular software system. It includes functions for segmentation, normalization,
feature extraction, and template matching. The segmentation is based on the Circular Hough Transform
to detect the iris region, restricted to an interval of interest, which is manually set, depending on the
database used. Eyelids are isolated by performing line Hough Transforms and Canny edge detection.
The eyelashes and eventual reflections are removed by a threshold. The extracted iris area is then
normalized into a rectangular image following Daugman's rubber sheet model [13]. The features are
obtained by convolving each row of the normalized image with 1D Log-Gabor filters. The phase
coefficients are then quantized to four levels, resulting in a binary template as proposed by Daugman.
Finally, a bitwise template containing a certain number of bit information (iris features), and a
corresponding noise mask (non iris regions) are produced. To classify the iris templates, the Hamming
distance is used to evaluate dissimilarity scores. Another implementation of the Masek's system is
available in C language. The code was rewritten by Liu et al. [98]. This iris recognition system has
been largely used by the research community for comparative evaluations. However, its performance
has become obsolete relatively to recent state-of-the-art results, obtained by more robust and accurate
algorithms.

Chapter 3: Fundamentals in iris acquisition and recognition systems
54
Recently, for iris recognition in less constrained acquisition environment, NIST provided an
open source iris recognition system namely VASIR (Video-based Automated System for Iris
Recognition) [99]. VASIR is the first public open source system for video-based iris recognition taken
at a distance using an IOM system (Iris On the Move). The still image scenario is also supported. The
software was used as a baseline reference for MBGC challenge. The software is composed of 5
modules: acquisition loading (video or still image), eyes regions detection based on Haar-like features
[100] and left/right iris images extraction, image quality assessment for best image selection (based on
an edge density method for face image quality [101]), segmentation, normalization, feature extraction,
and template comparison. The segmentation is based on Circular Hough Transform for detecting the
iris, and line Hough Transform for eyelids detection. The rest of the modules are largely similar to
Masek's algorithm.
Our research team has also proposed an open source iris recognition system based on
Daugman's approach, called OSIRIS (Open Source for IRIS) [102]. OSIRISV1.0 was the first version
[102]. The segmentation module used the Circular Hough Transform for retrieving the iris contours.
The remaining modules are similar to Daugman's system [13]. No masks were created. OSIRISV1.0 is
now obsolete and not yet available online. Since then, other versions were developed and they are
explained in the next sub-section.
3.2. Reference systems developed by our research team
In 2007, our research team has proposed the first version of an open source iris recognition system
namely “OSIRIS” which is now distributed via the BioSecure Association [43]. The system is free and
licensed under the GNU General Public License. The software is mainly composed of four key
modules, namely segmentation, normalization, feature extraction and template matching, as classical
iris recognition systems.
Several versions of OSIRIS have been developed. From a version to another, some modules
have been modified in order to decrease the error rate of the overall recognition system. OSIRISV2 is
the first relevant version available online since 2009. Its implementation is basic and simple. The
segmentation module is based on a Hough transform. OSIRISV2 was largely used in the past due to its
competitive results relatively to the state-of-the-art and in particular relatively to Masek reference
system. However, with the progress of research, it became obsolete due to its weakness at the
segmentation step, which led to high error rates at the recognition step.

Chapter 3: Fundamentals in iris acquisition and recognition systems
55
For this reason, this module has been completely modified in the more recent version
OSIRISV4 and replaced by a more sophisticated approach. Consequently, the performance has been
greatly enhanced and for further improvement, OSIRISV4 has been upgraded by modifying the
normalization module. Indeed, to unwrap the iris texture, a novel contour description, relaxing the
geometric (circles or ellipses) parameterization constraints is proposed instead of circles as done in
OSIRISV2 and OSIRISV4. This parameterization provides more accurate iris boundaries (closer to the
real contours) allowing a more efficient matching. This version, namely OSIRISV4.1, is the latest open
source software for automated iris recognition and is available online since 2013.
The different versions were developed by other members of our team before my arrival.
However, I made some modifications and adaptations of the last version in order to make the system
open source (+ documentation) and available online and participate to the ICB competition.
In this doctoral work, we have used both versions i.e. OSIRISV2 and OSIRISV4.1. Details on
their implementations are given in this sub-section.
3.2.1. Relevant versions: OSIRIS's evolution
3.2.1.1. OSIRISV2
OSIRISV21 has been developed in 2009. The segmentation is done in 2 steps: (i) a rough localization
of iris contours is performed by using circular Hough transform; (ii) these two circles are then used to
initialize an active contour following the method proposed by Xu and Prince in [103], in order to refine
the iris contours as displayed in Figure 3-3. The refined contours are then exploited for generating a
mask that indicates those regions containing only iris texture. These two non-concentric circles are
used to model the iris borders. According to Daugman's rubber sheet, the iris texture is unwrapped with
respect to these two circles as previously explained in Section 3.1.1.
1 http://svnext.it-sudparis.eu/svnview2-eph/ref_syst/Iris_Osiris/.

Chapter
The next module consists in the extraction of iris features
with a bank of 2D Gabor filters of different resolutions and orientations, applied at specific points of
the normalized iris image. These points of interest were used
(a)
Figure 3-3: Segmentation results in OSIRISV2: (a) Initial contours, (b) accurate contours, and (c) the
Figure 3-4: Application points uniformly distributed in a normalized iris image.
The phase of each resulting Gabor coefficient is then encoded on two bits, depending on the
sign of its real and imaginary parts, resulting in a binary template, the irisCode. In the
module, the comparison is based on the
between the two irisCodes (low (resp. high) when they come from the same (resp. different) iris).
These two modules are inspired by Daugman’s approach.
In practice, the evaluation of OSIRISV2 has shown the weakness of the segmentation phase.
For instance, on the ICE2005
17.46%. This weakness motivated the foll
accuracy of the segmentation process.
3.2.1.2. OSIRISV4
This version uses the same normalization, feature extraction and matching modules as OSIRISV2.
However, the segmentation part has been greatly improved. Indeed, the contours of the iris in this
version correspond to an optimal path retrieved by the Viterbi
Chapter 3: Fundamentals in iris acquisition and recognition systems
56
next module consists in the extraction of iris features by filtering the nor
Gabor filters of different resolutions and orientations, applied at specific points of
the normalized iris image. These points of interest were used in OSIRISV2 are illustrated in
(b)
: Segmentation results in OSIRISV2: (a) Initial contours, (b) accurate contours, and (c) the
associated mask [33].
: Application points uniformly distributed in a normalized iris image.
The phase of each resulting Gabor coefficient is then encoded on two bits, depending on the
sign of its real and imaginary parts, resulting in a binary template, the irisCode. In the
the comparison is based on the Hamming distance. This score measures the dissimilarity
low (resp. high) when they come from the same (resp. different) iris).
These two modules are inspired by Daugman’s approach.
In practice, the evaluation of OSIRISV2 has shown the weakness of the segmentation phase.
database [58] the EER was 5.41% and the FRR at FAR of 0.001, was
17.46%. This weakness motivated the following new version of OSIRIS which presents an
accuracy of the segmentation process.
OSIRISV4
This version uses the same normalization, feature extraction and matching modules as OSIRISV2.
However, the segmentation part has been greatly improved. Indeed, the contours of the iris in this
version correspond to an optimal path retrieved by the Viterbi algorithm for joining in an optimal way,
Fundamentals in iris acquisition and recognition systems
by filtering the normalized image
Gabor filters of different resolutions and orientations, applied at specific points of
in OSIRISV2 are illustrated in Figure 3-4.
(c)
: Segmentation results in OSIRISV2: (a) Initial contours, (b) accurate contours, and (c) the
: Application points uniformly distributed in a normalized iris image.
The phase of each resulting Gabor coefficient is then encoded on two bits, depending on the
sign of its real and imaginary parts, resulting in a binary template, the irisCode. In the matching
This score measures the dissimilarity
low (resp. high) when they come from the same (resp. different) iris).
In practice, the evaluation of OSIRISV2 has shown the weakness of the segmentation phase.
the EER was 5.41% and the FRR at FAR of 0.001, was
owing new version of OSIRIS which presents an improved
This version uses the same normalization, feature extraction and matching modules as OSIRISV2.
However, the segmentation part has been greatly improved. Indeed, the contours of the iris in this
algorithm for joining in an optimal way,

Chapter 3: Fundamentals in iris acquisition and recognition systems
57
the points of high gradients under the constraint that the resulting curve has to be closed [104]. The
Viterbi algorithm is then exploited at two resolutions: at a high resolution, accurate contours are
recovered, while at a low resolution the optimal path corresponds to coarse contours. More precisely, at
a high resolution, the contour is searched by exploiting all the pixels in the image. In the low resolution
case, fewer points on noisy regions (close to the eyelids and the eyelashes) are used to retrieve the
contour. Consequently, the coarse contour is non-regularly sampled, contrary to the accurate contour,
as represented in Figure 3-5.
(a) (b)
Figure 3-5: Examples of accurate (a) and coarse (b) iris borders for a given eye image extracted from
[104].
The normalization that follows is based on a modelization of the borders by circles, as in
OSIRISV2. Such circles are computed from the coarse contours detected by the Viterbi algorithm at
low resolution, using a least-square based method for circle fitting. Note that such circles do not need
to match exactly with the maximum of pupil and iris gradient points, contrary to the circles obtained
through the Circular Hough Transform in OSIRISV2. Moreover, due to the sensitivity of least-square
fitting methods to outliers, coarse contours, which contain less noisy points in regions showing
occlusions (eyelids and eyelashes zones), are used instead of accurate contours. The two non-
concentric resulting circles are then used to unwrap the texture.
For recognition purpose, non-iris regions have to be masked. To this end, this version of
OSIRIS exploits the accurate contours found by the Viterbi algorithm to mask the eyelashes. However,
this mask is not efficient to detect all the occlusions in the image. Therefore, another mask based on an
adaptive filter is generated in order to remove the remaining eyelashes and other occlusions such as
shadows and specular reflections. This mask results from a simple classification of pixels (iris or non-
iris), and corresponds to the Full Width at Half Maximum (FWHM) of the Gaussian density function,
modeling the histogram of iris pixel intensities. This mask is then combined to the segmentation mask
given by the accurate contours in order to build a final mask. As shown by Sutra et al. [104],

Chapter
performance of iris recognition improves when using the refined final mask instead of the mask based
only on accurate contours. The difference between OSIRISV2 and OSIRISV4 is illustrated in
3-6-a and Figure 3-6-b.
Figure 3-6: Flowchart of: (a) OSIRISV2, (b) OSIRISV4, and (c) OSIRISV4.1
3.2.1.3. OSIRISV4.1
OSIRISV4.12 version is an upgrade of OSIRISV4. The difference between both versions lies in the
normalization step. In the previous version V4,
borders by circular contours in order to unwrap the texture following the pioneer normalization
algorithm in the literature proposed by Daugman
furthermore modeled by two non
parameterization of contours is not optimal to recover the iris zone. Indeed, as contour borders are not
an exact circle, any circular model will induce e
shown that small errors in the estimation of circles’ parameters change the
and this can dramatically impact the performance of the over
2 http://svnext.it-sudparis.eu/svnview2
Chapter 3: Fundamentals in iris acquisition and recognition systems
58
performance of iris recognition improves when using the refined final mask instead of the mask based
curate contours. The difference between OSIRISV2 and OSIRISV4 is illustrated in
(a)
(b)
(c)
: Flowchart of: (a) OSIRISV2, (b) OSIRISV4, and (c) OSIRISV4.1
OSIRISV4.1
version is an upgrade of OSIRISV4. The difference between both versions lies in the
normalization step. In the previous version V4, the normalization is based on a modelization of
borders by circular contours in order to unwrap the texture following the pioneer normalization
algorithm in the literature proposed by Daugman [13]. Even in recent works [85]
non-concentric circles. Nevertheless, it is clear that using such a simple
parameterization of contours is not optimal to recover the iris zone. Indeed, as contour borders are not
an exact circle, any circular model will induce errors. Moreover, Proença and
shown that small errors in the estimation of circles’ parameters change the resulting normalized image
dramatically impact the performance of the overall system.
sudparis.eu/svnview2-eph/ref_syst/Iris_Osiris_v4.1/.
Fundamentals in iris acquisition and recognition systems
performance of iris recognition improves when using the refined final mask instead of the mask based
curate contours. The difference between OSIRISV2 and OSIRISV4 is illustrated in Figure
: Flowchart of: (a) OSIRISV2, (b) OSIRISV4, and (c) OSIRISV4.1 [33].
version is an upgrade of OSIRISV4. The difference between both versions lies in the
a modelization of the iris
borders by circular contours in order to unwrap the texture following the pioneer normalization
[85] [86] [105], the iris is
concentric circles. Nevertheless, it is clear that using such a simple
parameterization of contours is not optimal to recover the iris zone. Indeed, as contour borders are not
Proença and Alexandre [106] have
resulting normalized image

Chapter 3: Fundamentals in iris acquisition and recognition systems
59
Two normalized iris images resulting from different acquisitions of the same person may
present a high discrepancy and consequently lead to wrong authentication. Therefore, having an
accurate description of the iris boundaries is an essential task to avoid significant degradations of
performance.
Beyond circles, other types of parametric contours are proposed in the literature to model the
shape of the iris such as ellipses [81] [82] [84] and polynomial curves [83]. In another way, parametric
contours given by Fourier series are also used to describe the border of the iris in the works of
Daugman [73] and Proença [107]. Such parameterization, which does not make an assumption of the
contour as a known geometric curve, allows obtaining more flexible and generalized iris contour
description. OSIRISV4.1's modelization fits in this category. Actually, the iris boundaries used in the
normalization are the coarse contours resulting from the Viterbi optimization of a cumulative gradient
function around the center of the pupil. Contrary to [73] and [107], fewer points are used in the noisy
areas which correspond to usual locations of the occlusions (close to the eyelids and the eyelashes)
than in the clean ones. Therefore, the obtained contour corresponds to a sequence of non-regularly
sampled points, as shown in Figure 3-5-b. By this way, the number of possible erroneous contour
points is reduced. These coarse contours are finally used in Daugman’s rubber-sheet in order to unwrap
the iris texture.
We note that outer coarse contours look like a circle even in the superior part where the
occlusion occurs (upper eyelids). This is due to the Viterbi algorithm that imposes regularity in the
search of the contour points. More precisely, the obtained contour is a series of radii ( ) in polar
coordinates, where index n stands for the angle (varying from 1° to 360°). A non-regular sampling of
the angles is considered as follows: in “difficult” areas (where occlusions might occur), one contour
point is selected every eight pixels, while in other regions, one contour point is selected every two
pixels. The Viterbi algorithm is used to find an optimal path through the gradient map. It imposes the
search of the radius ( + 1) in the restrained interval ( ) − 1 ; ( ) + 1 .
In Figure 3-5-b, the upper part of the iris boundary corresponds to the “difficult” area (possible
occlusions), where contour points are sparse. Therefore, the radius does not change roughly and the
final contour looks like a circle. In this way, the area considered as iris after the normalization step,
will be similar for a given person, independently of the presence of occlusions or not in the original
image (case of upper eyelid).

Chapter 3: Fundamentals in iris acquisition and recognition systems
60
Figure 3-7 shows the difference between the components used in the two iris recognition
systems OSIRISV4 and OSIRISV4.1.
Figure 3-7: The difference between the two iris recognition systems: OSIRISV4 and OSIRISV4.1 [33].
The new normalization follows the following steps. First, let and be respectively the
width and height of the desired normalized image. Regarding Daugman's approach, we compute a
regular sampling of angles where ranges from 0 to , so that = 0 and = 2 :
[ ] ( )8.30,2 WkW
kk ∈= πθ
Let ( , , ) and ( , , ) be the coordinates of a point of pupil coarse and iris coarse
contours respectively where ( , ) are the x-coordinate and y-coordinate of the radius relatively to the
estimated center of each coarse contour and the angle of the non-regular sampling. follows the
non-uniform sampling of the coarse contour as explained above. The next step consists in estimating
the new point ( , ) with a sampling as close as possible to from the coarse pupil contour. To
this end, we interpolate the two nearest points of the coarse contour and + 1 to as follows:
( ) ( )9.31 1+⋅+⋅−= jp
jp
pk xxX αα
( ) ( )10.31 1+⋅+⋅−= jp
jp
pk yyY αα

Chapter 3: Fundamentals in iris acquisition and recognition systems
61
with jp
jp
jpk
ϕϕ
ϕθα
−
−=
+1
This process is illustrated in Figure 3-8. In a similar way, the new points ( , ) of the iris
contour are computed.
Figure 3-8: How to compute the new coordinates of points ( , ) [33].
The pupil and the iris centers are not necessarily the same. Often the pupil center has a nasal
and inferior position relative to the iris center [10]. To cope with this problem, we define a segment
formed by ( , ) and ( , ) as shown in Figure 3-9.
Figure 3-9: Illustration of segment S formed by ( , ) and ( , ). Note: Coarse boundaries are
modeled by circles to simplify the figure [33].
is then rescaled so that it fits with the height of the normalized image. On the normalized
image, the pixel on ℎ row and column will take the same value as the pixel located at ( , , , )
on the original image as follows:

Chapter 3: Fundamentals in iris acquisition and recognition systems
62
( )11.31,ik
pkhk X
H
hX
H
hx ⋅
+⋅
−=
( )12.31,i
kp
khk YH
hY
H
hy ⋅
+⋅
−=
with ℎ ∈ 0 .
Compared to OSIRISV4, in OSIRISV4.1 the borders used for normalization are closer to the
real ones in the sclera area and in the lower eyelid part, as illustrated in Figure 3-10. Therefore, the
matching points considered in the comparison of two irises are better aligned resulting in increased
performance. For instance, on CASIA-IrisV4-Thousand, an improvement of 25.36% is observed at the
FRR@FAR=0.001 operating point. More results are reported in [33]. The flowchart of OSIRISV4.1 is
resumed in Figure 3-6-c.
Figure 3-10: (a) Border points used for normalization in OSIRISV4.0, (b) Border points used for
normalization in OSIRISV4.1, (c) normalized image by OSIRISV4.0, (d) normalized image by
OSIRISV4.1 [33].
3.2.2. OSIRIS's impact in the research community and evaluation
performance
OSIRIS reference system has been cited in several papers since 2009, in different topics such as iris
segmentation [3] [108] [109] [110] [111] [112], iris aging [113], cryptography [114] [115] [116] and
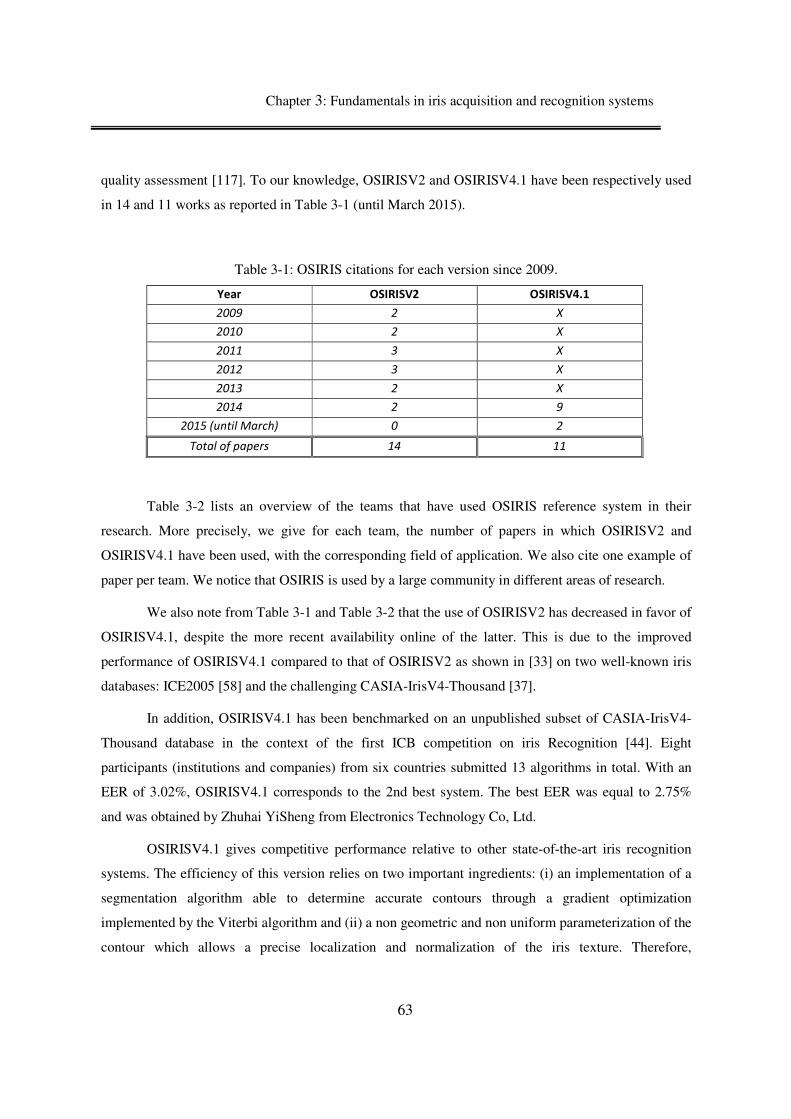
Chapter 3: Fundamentals in iris acquisition and recognition systems
63
quality assessment [117]. To our knowledge, OSIRISV2 and OSIRISV4.1 have been respectively used
in 14 and 11 works as reported in Table 3-1 (until March 2015).
Table 3-1: OSIRIS citations for each version since 2009.
Year OSIRISV2 OSIRISV4.1
2009 2 X
2010 2 X
2011 3 X
2012 3 X
2013 2 X
2014 2 9
2015 (until March) 0 2
Total of papers 14 11
Table 3-2 lists an overview of the teams that have used OSIRIS reference system in their
research. More precisely, we give for each team, the number of papers in which OSIRISV2 and
OSIRISV4.1 have been used, with the corresponding field of application. We also cite one example of
paper per team. We notice that OSIRIS is used by a large community in different areas of research.
We also note from Table 3-1 and Table 3-2 that the use of OSIRISV2 has decreased in favor of
OSIRISV4.1, despite the more recent availability online of the latter. This is due to the improved
performance of OSIRISV4.1 compared to that of OSIRISV2 as shown in [33] on two well-known iris
databases: ICE2005 [58] and the challenging CASIA-IrisV4-Thousand [37].
In addition, OSIRISV4.1 has been benchmarked on an unpublished subset of CASIA-IrisV4-
Thousand database in the context of the first ICB competition on iris Recognition [44]. Eight
participants (institutions and companies) from six countries submitted 13 algorithms in total. With an
EER of 3.02%, OSIRISV4.1 corresponds to the 2nd best system. The best EER was equal to 2.75%
and was obtained by Zhuhai YiSheng from Electronics Technology Co, Ltd.
OSIRISV4.1 gives competitive performance relative to other state-of-the-art iris recognition
systems. The efficiency of this version relies on two important ingredients: (i) an implementation of a
segmentation algorithm able to determine accurate contours through a gradient optimization
implemented by the Viterbi algorithm and (ii) a non geometric and non uniform parameterization of the
contour which allows a precise localization and normalization of the iris texture. Therefore,

Chapter 3: Fundamentals in iris acquisition and recognition systems
64
OSIRISV4.1 can be used with high benefit as an up to date, relevant tool for benchmarking novel iris
recognition algorithms, which is publicly available online.
Table 3-2: Summary of works that have used OSIRISV2 and OSIRISV4.1.
OSIRISV2 OSIRISV4.1
Team Topic Number
of papers Team Topic
Number
of papers
Carlos III University
of Madrid
Quality
assessment,
(Tomeo-Reyes et
al., 2011) [117]
2
Electrical
Engineering
Department - DEE
Federal University
of Campina Grande,
Brazil
Cryptography,
(Rodrigues et al.,
2014) [115]
1
Department of
Computer Sciences,
University of
Salzburg, Austria
Iris segmentation,
(Rathgeb et al.,
2013) [3]
5
The University of
Electro-
Communications,
Tokyo, Japan
Iris segmentation,
(Oishi et al., 2015)
[110]
1
Department of
Computer Science
and
Engineering,
University of Notre
Dame, USA
Iris recognition
system, Bit
reliability in an
irisCode,
(Hollingsworth,
2009) [108]
4
Norwegian
Biometric
Laboratory, Gjøvik
University College,,
Norway
Iris segmentation
for Smartphone
applications, light
field camera...
(Raja et al., 2014)
[111]
7
Department of
Electronics and
Systems
Federal University of
Pernambuco, Brazil
Cryptography,
(Camara and
Rocha, 2010)
[114]
1
Advanced
Technologies
Application Center,
Havana, Cuba
Iris segmentation,
(Sanchez-
Gonzalez et al.,
2014) [112]
1
Institute of Control
and Computation
Engineering, Warsaw
University of
Technology, Poland.
Iris aging, (Czajka,
2014) [113] 1
Faculty of IT,
Monash University,
Melbourne,
Australia
Cryptography,
(Torres et al.,
2014) [116]
1 Oak Ridge National
Laboratory, USA, and
The University of
Tennessee Health
Science Center:
Hamilton Eye
Institute.
Iris segmentation,
(Santos-Villalobos
et al., 2012) [109]
1

Chapter 3: Fundamentals in iris acquisition and recognition systems
65
3.3. Iris acquisition systems in less constrained
environments
Conventional iris systems require restrictive acquisition conditions on the subjects, which can cause
inconvenience to the participants. The major limitations for such systems are:
• The proximity of the subject to the camera: Iris caption is actually carried out at close
distances (under 50 cm) in comparison with other modality such as face.
• Static participants during the acquisition.
• Slow acquisition time: Such systems require an active cooperation of the participants.
Quality checks including feedback to the user are used in order to assist him/her in
providing biometric samples free from noise, resulting in slow acquisition time.
To overcome those drawbacks and make iris recognition feasible in more realistic conditions,
new imaging systems were proposed rather than conventional cameras. In this section, details on iris
recognition systems that function on the move and at a distance will be discussed.
3.3.1. Literature review
Several researchers have concentrated their efforts on designing iris recognition systems in more
realistic conditions with acceptable recognition accuracy. To our knowledge, this ambitious objective
has been addressed for the first time by Fancourt et al. in 2005 [118]. They proposed two iris
recognition systems at 5 and 10 meters. Each one is based on a custom-built telescope connected to a
NIR camera. During the acquisition, the participant was seated and his head was fixed by a chin rest
with a forehead stabilizer. The experimental results show the successful feasibility of iris recognition at
larger distances. Nevertheless, the iris acquisition conditions are still constrained (fixed location of the
head, staring at a spot light). Therefore, further research was developed in order to design iris
recognition systems under less restrictive conditions imposed on position and movement of the
participants.
The Iris-On-the-Move System (IOM) later proposed by Matey et al. [25] in 2006, was the first
system able to capture iris images at a distance and on the move with a sufficient quality for
recognition. The subject is moderately cooperative: he is asking to walk at a normal speed through a
confining portal, looking forward. The camera is positioned at a fixed distance of 3 meters in front of

Chapter 3: Fundamentals in iris acquisition and recognition systems
66
the participant. The system is designed to produce images with a resolution of approximately 100
pixels across the iris diameter. An illustration of an acquisition by the IOM system is given in Figure
3-11. One limitation of this system consists in the inability of capturing irises for people with different
heights (children, tall person) due to the small capture field of view. Another drawback of IOM system
lies in the low-resolution of the resulting iris images. Despite the relaxation of the acquisition
constraint, the user is still cooperative: he looks forward without any intended behavior to prevent iris
acquisition.
Figure 3-11: An illustration of the concept of IOM system [25]. The camera is visible at the far
right of the figure.
In 2007, Yoon et al. [29] proposed to use a pan-tilt-zoom camera to acquire iris images at a
distance. For user convenience, the system was designed for providing large operating range which can
cover the natural movements of a standing user. The wide height and width of operating range is
obtained by the pan-tilt unit and the large depth is achieved by zoom lens. The capture is done in two
steps. Firstly the face is detected and secondly it is zoomed to fit the entire image in order to produce a
high-resolution iris image (diameter > 150 pixels). Figure 3-12 shows the concept of this system.
Figure 3-12: Concept of Yoon's system [29].

Chapter 3: Fundamentals in iris acquisition and recognition systems
67
In the same way as [29], Wheeler et al. [27] proposed a stand-off iris recognition system for
access control application at a distance of 1.5 meters but with heavier imposed cooperation from
participants. The system is designed for cooperative users of any height who stops, stares, and looks
towards the iris camera, with no possibility of natural movement. The difference between [27] and [29]
is in the localization of the face. The system is configured in order to acquire iris images at a resolution
of approximately 200 pixels across the iris diameter.
Bashir et al. [26] [119] proposed a novel prototype of system called Eagle-Eyes which uses
video surveillance techniques to acquire multiple biometrics (face and iris modalities). It is able to
recognize a person by their irises at a large stand-off distance of 3 to 6 meters. The system combines
multiple cameras with hierarchically ordered field of views, a high pan tilt unit, and a long focal length
zoom. The used cameras in the system are: (i) fixed scene camera for human tracking, (ii) face camera
for face detection and (iii) NIR iris camera in order to capture iris images. The iris resolution meets the
specifications pointed in ISO/IEC 19794-6 [35] (between 100 to 200 pixels across the iris). Similar to
Eagle-Eyes system, Dong et al. [28] proposed a stand-off iris recognition system at 3 meters based on
a hierarchy of cameras for successive detection of human, face and then eyes. An illustration of iris
acquisition is given in Figure 3-13.
Figure 3-13: Iris acquisition at a stand-off distance of 3 meters [28].
Long range iris acquisition and recognition systems have been also developed by Villar et al. in
[31] and Venugopalan et al. in [30]. In [31], the system is able to recognize people at a distance of 30
meters. It uses a wide field of view camera to locate the subject via face and eye, and then a narrow
field of view camera attached to a telescope is pointed to the detected eye. Iris images of approximately
190 pixels across the diameter are acquired by the system. The subject is stationary, standing in a

Chapter 3: Fundamentals in iris acquisition and recognition systems
68
corridor. In [30], the iris acquisition system operates at 8 and 12 meters. The system captures both the
face and the iris using a single camera of high-resolution. The subject can be stationary or mobile
(walking toward the camera). For moving subject, during the course between two check points (for
example position A and B in Figure 3-14), the user's speed is estimated in order to finely tune the focus
of the system to the subject motion and then a set of high-resolution images are acquired at a desired
check point (position C in Figure 3-14). Based on the estimated speed, the focus is continuously
adjusted while the subject is approaching the system. The location of this check point depends on the
required iris resolution.
Figure 3-14: Iris acquisition by CyLab System. The subject is walking toward the system. His speed is
estimated between position A and B to set the focus of the camera to the position C to acquired in-
focus iris images while the subject approaches the system [30].
Recent commercial solutions for iris recognition at a distance are also available. For instance,
AOptix Technologies proposed a system, named InSight® [120], able to acquire both irises and face
images at a standoff distance range of 1.5 and 2.5 meters. Four seconds are required for dual-iris and
face capture, including quality assessments and encoding functionality. More recently, MORPHO
(SAFRAN) has developed a stand-off iris recognition system named MORPHO IAD™ [121]. The
acquisition of both irises and face is performed under less than 1 second, at a distance range of 0.8 to
1.2 meters. Both systems can be used for enrollment and authentication and they are suitable in border
control, aviation security and for securing sensitive sites.
3.3.2. Challenges in iris acquisition systems
Image acquisition plays a crucial role in successful recognition. Dealing with mobile subjects, and
acquisition at a distance, the main concern is the quality of the resulted images for recognition purpose.
Poor imaging conditions have been shown to affect the genuine score distribution. In fact, the
similarity between iris templates belonging to the same subject considerably decreases under less
constrained acquisition conditions [122]. However, impostor scores are largely less dependent on

Chapter 3: Fundamentals in iris acquisition and recognition systems
69
image quality. The quality of the images is basically related to two major factors: the imaging system
itself and the environmental conditions during the capture.
Imaging systems must be carefully designed in order to achieve acceptable recognition
accuracy. The challenges associated with iris recognition design arise principally from two necessities:
(i) enough resolution (number of pixel across the iris diameter) and (ii) enough NIR illumination
intensity.
• Resolution: According to the iris image data interchange standard released [35] in 2005, an
image with 200 pixels across the iris diameter is considered as a high quality iris image.
The lower limit of the number of pixel is set to 100. Below this limit, the recognition
performance is dramatically degraded.
• NIR illumination: The light is emitted from a NIR illumination source, with a wavelength
range that emphasizes the iris texture while providing sufficient contrast between the
pupillary and limbic boundaries, and covering uniformly the iris surface. The intensity
must be sufficient to maximize the signal/noise ratio that is collected by the camera sensor.
As high illumination can cause permanent eye damage, the level of illumination must be
set carefully. Indeed when working with NIR wavelengths, the human eye does not
respond to its natural light protective mechanism such as aversion, blinking and pupil
contraction.
Even if these two issues are addressed properly by the hardware design, relaxing the imposed
constraints on the participant during the acquisition causes significantly quality variations in the iris
images. In fact, the captured images may suffer from blur due to motion and/or out of focus, distortion,
strong occlusions, poor resolution, low contrast and so on. These factors have to be handled by
software algorithms in order to improve the accuracy of the recognition system.
3.4. Conclusion
In this chapter, we explained basic considerations on iris recognition. In particular, a literature review
on pioneer and recent iris recognition algorithms was presented. Existing open source systems for iris
recognition were also described. After that, the reference system: OSIRIS that we used throughout this
thesis was presented. Several versions have been implemented aiming at improving the accuracy of the
recognition. Finally, we related a literature review on iris acquisition systems in less constrained
environment. As explained in this chapter, in such condition, the resulting iris images suffer from

Chapter 3: Fundamentals in iris acquisition and recognition systems
70
diverse degradations. These perturbations dramatically decrease the performance of the overall iris
recognition system.
As explained in Chapter 2, quality measurement algorithms (QMAs) are very useful for
improving performance of a given iris recognition system. Therefore, disposing of a pertinent quality
metric will be especially beneficial for us since in this thesis we address iris recognition in uncontrolled
acquisition. Indeed, we want to integrate quality measures in the fusion process in order to remedy to
eventual degradations. By this way, we expect to enhance the accuracy of the recognition. Therefore,
we will first elaborate a relevant quality metric able to measure locally and globally the quality of the
iris images. This new quality measure is presented in the next chapter.

Chapter 3: Fundamentals in iris acquisition and recognition systems
71

Chapter 4: Design of a quality measurement algorithm for improving iris recognition
72
Chapter 4. Design of a quality measurement algorithm
for improving iris recognition
4.1. Related works ............................................................................................................... 73
4.1.1. Iris image qualities ............................................................................................... 74
4.1.2. Synthesis and conclusion ...................................................................................... 81
4.2. Definition of the proposed method for quality assessment ............................................. 84
4.2.1. Choice of the model ............................................................................................. 84
4.2.2. Description of the model ...................................................................................... 85
4.2.3. Implementation of the model ................................................................................ 86
4.2.3.1. Model's input vector for characterizing good iris texture ....................................... 86
4.2.3.2. Estimation of the model's parameters .................................................................... 91
4.2.4. Computation of our quality measurement ............................................................. 92
4.3. Evaluation of our quality metric .................................................................................... 96
4.3.1. Validation of the improved GMM-based quality: GMM5obs ................................ 96
4.3.2. Assessment of the improved GMM-based quality: GMM5obs .............................. 98
4.3.2.1. Relationship between the GMM-based quality and the quality of the texture ......... 98
4.3.2.2. Relationship between the GMM-based quality and the usable iris area .................. 99
4.4. Conclusion ................................................................................................................. 102

Chapter 4: Design of a quality measurement algorithm for improving iris recognition
73
s mentioned in Chapter 1, many real-world security applications require less cooperative
recognition systems. However, less restrictive conditions during the iris acquisition cause a
loss in the quality of the resulting images. In fact, the images suffer from lack of resolution,
out-of-focus and motion blur, strong occlusions, low eye contrasts, etc. All these degradations
significantly decrease iris recognition performance [34]. Biometric system designers are therefore
challenged for the conception of such systems for providing iris images of sufficient quality as
explained in Section 3.3. Nevertheless, the recognition performance obtained by such systems is still
not satisfactory regarding the high demand of security required by the applications. This fact suggests
that the resulting images are of insufficient quality for iris recognition purpose.
The ultimate goal of this thesis is to deal with the degradation of the images quality in order to
improve the overall recognition accuracy. Our research activities focus on how to fuse the information
available in the sequence in order to improve as much as possible iris recognition. Since the
performance of the recognition is strongly related to the quality of the images, we propose to integrate
a local quality measure in the proposed fusion scheme for retrieving the most relevant data from the
sequence. This local quality and its pertinence will be presented in this chapter independently of the
fusion scheme which will be detailed in the next chapter.
In Section 4.1, we first relate a literature review on iris quality measures that have been
proposed in the state-of-the-art. From this overview, the quality components that influence mostly
recognition will be identified. Moreover, a synthesis is provided to determine all the requirements of a
relevant quality measure for iris recognition. This will guide us in defining our quality measurement
algorithm (QMA) that can respond to all the identified needs. Section 4.2 presents the proposed local
quality measure, as well as the details of its implementation. Finally, extensive experiments are
conducted in Section 4.3 in order to prove the effectiveness of the approach. We will also show the
possibility of defining a global quality from the proposed local quality and demonstrate that it is well
correlated to the performance of the recognition.
4.1. Related works
As shown in the literature [34], iris recognition performance decreases dramatically when the iris
image quality drops. Therefore, identifying the quality factors and quantifying their effects on the
recognition allows us to design a relevant QMA that can considerably improve the performance of the
entire system.
A

Chapter 4: Design of a quality measurement algorithm for improving iris recognition
74
Quality assessment can be used in different ways. It can be useful not only to re-acquire an iris
image of poor quality but also to select the best image across multiple enrollments. In the case of video
acquisitions in less constrained environment, different weights can be allocated to the images regarding
their quality in order to give less importance to poor quality images in order to relevantly fuse the
images in an iris sequence as done in [54]. It can also be useful to predict the performance of a given
iris system via the quality of the couple of images to be compared. In [52], Li et al. explored the
relationship between the matching score and the quality of the pairwise iris images by formulating the
mapping as a statistical regression problem. They define the uncertainty interval of matching scores.
They demonstrated that by discarding the uncertain match pairs the recognition performance is thus
improved. In [53], a nonlinear mapping based on a Feed Forward Neural Network (FFNN) is
developed for establishing predictions on quality measures and corresponding matching scores.
As iris recognition is increasingly performed in less constrained environment, the interest of
designing effective QMA can only increase too. However, image quality measurements allow
improving the accuracy of the performance only if the quality metric is well correlated to the
recognition accuracy.
4.1.1. Iris image qualities
In the state-of-the-art, various publications have addressed the problem of iris image quality since
several years now. In the first proposed iris recognition system [13], the focus level of the images was
already pointed out as being a critical factor in the degradation of the performance. Therefore,
Daugman introduced new metrics to measure the energy of the high frequency components in an image
in order to assess the level of blur in [13] and [72]. This metric was further improved by Kang and Park
[123].
Ma et al. presented in [124] a new scheme to assess image quality. They evaluated three
quality factors: defocus, motion and occlusion, by analyzing the distribution of Fourier spectra in two
local iris regions. These three quality metrics were also addressed by Wei et al. in [125]. They
exploited power-based metrics and statistical features to quantify the quality of the images. Both
quality assessment algorithms of [124] and [125] are used for selecting clean images in recorded iris
sequences for subsequent recognition. Based on the estimated three quality factors, a Support Vector
Machine (SVM) is used to classify the images into clean or noisy images. By discarding the identified
noisy images, the overall FRR error is reduced.

Chapter 4: Design of a quality measurement algorithm for improving iris recognition
75
In [126], Lu et al. suggested a sequential scheme for image quality assessment by designing
different situations of bad quality caused by blur (defocus and motion) and occlusions. By comparing
each quality component to a fixed threshold, only the images that have higher qualities are kept for
further processing. In another way, a dynamic method was proposed by Dong et al. [127] to adjust the
threshold of an iris matching module based on the quality of the input iris image. This way, the poor
images are not discarded by a quality threshold fixed globally such as in [126]. This method gives a
chance to poor images to be matched under a fixed FAR (false accept rate) based on a look-up table,
which establishes the relationship between the quality of the images and the matching score. The
studied quality factors are defocus, motion, occlusion, and dilation.
Pupil dilation [80] [128] and contact lenses [80] also represent two quality factors that have
negative impacts on the performance. Czajka and Bowyer [129] considered three iris quality factors
that can be influenced by the behavior of the subject: un-occluded iris area, motion blur and margin.
They analyzed the overall quality of consecutive attempts (three times) in a biometric system to
complete a transaction. Each of the estimated quality factors is compared to a threshold that has been
fixed a priori regarding the exploited database. Only images with enough qualities are accepted for
further processing. Gaze angle also disturbs the performance of the iris recognition as demonstrated in
several works. It occurs when the subject does not look straight at the camera. Gaze direction can be
estimated and then corrected in order to transform the off-angle iris image into a frontal one as done for
example in [130] by Yang et al.
The impact of image compression on iris recognition was also investigated in several works
[131] [132] [133]. And in [134], Bergmueller et al. conducted a study on the impact of using pre-
compressed data for iris segmentation.
The majority of the above works considered less than three quality components. A broader
number of quality metrics and a new fusion scheme were proposed by Kalka et al. [135]. The authors
proposed an analysis of various quality factors that influence iris recognition such as defocus blur,
motion blur, off-angle, occlusion/specular reflection, lighting and iris resolution. All these quality
factors are estimated and then combined using a Dempster–Shafer theory approach to obtain one
unique value. The authors showed the negative effect of all these discrete factors on the performance,
with mainly degradations in the genuine matching scores. Moreover, by using the fused quality, they
were able to classify the images into 3 classes: high, medium and low quality. Thus, they demonstrated
that this combined quality is a suitable indicator of their ability to predict iris image quality.

Chapter 4: Design of a quality measurement algorithm for improving iris recognition
76
In addition to the quality factors that have been addressed in [135], Zuo and Schmid proposed
to assess other elements: segmentation scores, interlacing, eye contrasts, and dilation [136]. All these
quality factors are then fused by a simple sum rule to avoid high computational cost.
In [137], Mahadeo et al. proposed a quality assessment scheme for detecting the best frames in
iris videos. First, the frames with blinks and off-angles are discarded from the sequence by using
averaging and correlation methods. Then, the remaining blurred images are dismissed using the
Laplacian operator. Finally, frames with poor illumination are removed by analyzing the distribution of
the pixels’ intensities.
A brief summary of the quality components that have been studied in the literature and their
eventual scheme of combination to obtain one single value are reported in Table 4-1.
From the above academic publications, we note that several iris image properties have been
investigated. They differ from a work to another. Results show that they all play a role in the
degradation of the performance. However, a legitimate question can arise: What are the iris image
properties that most influence the iris recognition performance? In this context, the National Institute of
Standards and Technology (NIST) organized in 2011 the first public challenge in iris image quality:
Iris Quality Calibration and Evaluation (IQCE) [51], already mentioned in Section 2.4. It aimed at
defining and quantifying iris image quality components that have the highest influence on iris
recognition accuracy. The proposed quality components, their corresponding definition and the
motivation of their investigation are the following:
• Gray scale spread: Def. Distribution spread of intensity pixels value.
An image of good quality has a wide and well distributed spread of intensity: Better
performance is achieved with high contrast and large dynamic range. In contrast, saturation or poor
illumination causes a lack of well-spread distribution.
• Iris size: Def. Number of pixels across the iris radius, when the iris boundary is modeled
by a circle.
The iris size is determined by the iris acquisition condition and environment which include the
spatial sampling rate of the image sensor and the distance between the subject and the camera. Too big
or small irises cause recognition failures.

Table 4-1: Overview on quality factors that have been studied in the literature.
Publications Defocus Motion Off-angle Occlusion
Lighting
variation Resolution Interlacing
Pixels
count Dilation Margin
Compress-
ion Fusion rule
Daugman [13][72] X ---
Kang and Park [123] X ---
Ma et al. 2003 [124] X X X
SVM
(classification into
clear/noisy images)
Wei et al. [125] X X X
SVM
(classification into
clear/noisy images)
Lu et al. [126] X X X No
(3 sequential thresholds)
Dong et al. [127] X X X X Multiplication
Bowyer et al.[80] X ---
Kalka et al. [135] X X X
X
Specular
reflection
X X X Dempster-Shafer
Zuo and Schmid [136] X X X X X X X X Sum
Mahadeo et al. [137] X X X X
(blinking) X
No
(sequential thresholds
removing)
Czajka and Bowyer
[129] X X X
No sequential thresholds
removing
Daugman and
Downing [131] X ---
Ives et al.[132] X ---
Bergmueller et al.
[134] X ---
Rakshit, S., & Monro
[133] X ---

• Dilation: Def. Ratio of pupil diameter to iris diameter.
High dilation induces low usable iris area, hence a lack of information. However, low dilation
indicates constricted pupil which generates error in the localization of the iris.
Usable iris area: Def. Percentage of iris that is not occluded by artifacts such as eyelash,
eyelid, or specular reflections possibly caused by sunlight or eye-wear.
Eyelid or eyelash occlusions can stem from subject behavior (blinking or squinting) or/and
subject character that are induced by genetic factors (droopy eyelids) and eyes diseases. Such
occlusions considerably reduce the amount of usable iris area, leading to lack of information in the
description of the iris texture, and consequently poor performance. In particular, occlusions that occur
at the pupillary or limbic boundaries are considered as the most severe artifacts for iris recognition.
They not only diminish usable iris area, but also lead to complicated iris segmentation task (wrong
localization of the true borders).
• Iris-pupil and iris-sclera contrasts: Def. Difference in intensity between the pupillary and
limbic boundaries.
Different contrasts can be caused by intrinsic properties relative to each person (shadow of
eyelash on iris, contact lens), medical conditions (cataract, albinism, etc) or extrinsic factors such as
NIR illuminator and other imaging system characteristics. These two quality components mostly affect
segmentation accuracy, and hence influence iris recognition performance. In general, the contrast
between the iris and the pupil is lower than the one between the iris and the sclera, which makes the
localization of the pupillary boundary more difficult than the limbic one.
• Iris and pupil shapes: Def. Measure of regularity in the pupillary and limbic boundaries.
The boundaries of an iris are rarely circular or even elliptic. This phenomenon is caused by
natural anatomical variation, non frontal gaze or medical condition, rather than by the acquisition
device. The detection of accurate pupil-iris border is important as the iris region just around the pupil
contains a lot of information. Irregular shape leads to difficult iris segmentation.
• Sharpness: Def. Absence of defocus blur.
When the object of interest is outside the depth of field of the camera, the acquired image
suffers from blur. This artifact can be solved by a better optical design and user guidance.
• Gaze angle: Def. The optical axes of the subject and the camera are not aligned.

Chapter 4: Design of a quality measurement algorithm for improving iris recognition
79
Off-angle occurs when the user does not look straight to the camera or when his head is rotated
or inclined. It leads to iris deformation thereby complicating the recognition.
• Interlace: Def. Artifact between odd and even lines.
This type of artifact reduces twice the vertical resolution of the images. (Note that modern iris
capture devices use progressive scan instead of interlacing.)
Other quality components such as motion blur and signal to noise ratio have been proposed in
IQCE, however their effects on the performance were non-conclusive.
Overall, nine iris recognition vendors participated to IQCE by submitting their own quality
measurement algorithms (QMAs) for those quality components. The effectiveness of these QMAs in
predicting iris recognition performance was examined. The investigation of the results of the report
leads to the following conclusions. They showed that the usable iris area (UIA) has the highest effect
on recognition performance followed by iris-pupil contrast, pupil shape, iris-sclera contrast, gaze angle
and finally sharpness. In particular, UIA affects significantly the genuine and impostor distributions.
The effect on the impostor distribution is smaller than on the genuine distribution but still significant.
Therefore the shift in both impostor and genuine distributions denotes that FNMR and FMR are
affected by high occlusions. The same behavior is observed for eye contrasts. However, the
experimental results show that the UIA is by far the most influential factor on iris recognition.
Sharpness has a large effect on the FNMR and on genuine and imposter scores. But, a difference
between the qualities of the pairwise images leads to lower FNMR than UIA and eye contrasts.
Another result presented in the report is the improvement of the FNMR after rejecting 3% of
the comparisons on ICE2006 database. The value of the decision threshold (explained in Section 2.1) is
set to give an overall FNMR of 0.1. It corresponds to the baseline (no rejection). The highest
improvement is achieved when the rejection is based on the UIA quality metric. In that case the FNMR
is equals to 0.09011, followed by the iris-pupil contrast metric that enables to achieve a FNMR of
0.09085. Other quality metrics such as iris-sclera contrast and sharpness respectively allow decreasing
the FNMR to 0.0940 and 0.0980.
Finally, the participants were asked to propose a unique quality namely scalar quality metric
for measuring the overall quality of the image. This metric can combine all the quality components that
have been cited above or only some of them. When discarding 3% of the comparison on ICE2006
database, the FNMR is reduced from 0.1 to 0.0892. Higher improvement is thus observed by using this

Chapter 4: Design of a quality measurement algorithm for improving iris recognition
80
scalar quality component than exclusively the UIA. From these experimental results, we can conclude
that the combination of multiple quality components is more pertinent in order to quantify the quality
of a given iris image than the use of one quality metric.
The quality assessment algorithms submitted to IQCE were designed as “black-boxes”. No
information on their estimations as given. In [138], Alonso-Fernandez and Bigun proposed quality
metric solutions to estimate mostly quality factors that have been addressed in IREX-IQCE. They also
analyzed their impact on the performance of iris segmentation and recognition. The results show that
the recognition and the iris segmentation are not necessarily affected by the same quality components.
It is interesting to note that the quality metric can be measured on the entire image or only on
the iris region after the localization of the boundaries (segmented image) as done in the previous
literature review. However in other works (but more sparse), the quality of the iris image has been
defined in a more local way. Indeed, in a given iris image, some regions can contain local artifacts and
other parts can present high quality texture. Consequently, some researchers have concentrated their
effort on proposing more local quality metrics to quantify the quality of the different regions in an iris
image.
To our knowledge, Chen et al. proposed in [139] the first work in which a local approach was
used to evaluate the quality of an iris image. They measured the energy of concentric iris bands
obtained from 2D wavelets. These local qualities are then weighted regarding the bands location (high
weights are assigned to inner band as they provide more texture and are often less occluded by
artifacts) in order to obtain one quality index. The experimental results show that this overall quality is
reliable to predict the performance of an iris recognition system.
Further local metrics have been proposed by assigning to each pixel of the segmented image a
quality measure. Krichen et al. proposed in [77] a probabilistic local quality measure relying on a
Gaussian Mixture Model (GMM) that can quantify levels of defocus blur or occlusion. An extension of
this model was developed by Cremer et al. in [140]. The new approach is able to distinguish highly
textured regions from poorly textured ones. In [141], Li and Savvides exploited two GMMs to model
iris and occlusion distributions separately in order to detect locally occlusions in iris images. The
approach presents several differences regarding Krichen’s work. In fact, in [77], the model is trained
on good quality texture so as the GMM gives a continuous value which can be used to characterize not
only occlusions but many other artifacts that can occur in iris images. However in [141] the two

Chapter 4: Design of a quality measurement algorithm for improving iris recognition
81
GMMs are trained respectively on good and low quality images in order to achieve a binary
classification at the pixel-level into two classes: iris or occlusion.
Moreover, in [141] different experiments are performed to choose the input features for
optimizing the resulting classifiers. The best feature set is the combination of image intensity and the
response of Gabor filters. All works [77] [140] [141] show that a relevant choice of the input features is
an essential task in the design of a GMM to ensure the efficiency of the related system.
4.1.2. Synthesis and conclusion
From the above literature review, we infer that to design an effective quality assessment algorithm,
some questions should be concerned with:
1. What are the quality components that should be taken into consideration for iris
recognition? And which approach has to be followed to compute them?
2. How to use QMA to improve the performance of the iris recognition?
3. How to efficiently combine several quality measures?
In this sub-section, we will answer these questions.
(1): What are the quality components that should be taken into consideration for iris recognition? And
which approach has to be followed to compute them?
Image quality assessment for biometric purpose can be divided into two categories: image-
specific qualities (generic, used for many image based applications such as sharpness, contrast,
compression artifact) and domain-specific qualities (related to the modality). These quality metrics
differ from a biometric modality to another. For example, face geometry, pose eye detect-ability,
expression and illumination angles are standard quality components for face recognition (determined
by the ISO/IEC 19794-5 [142]). Moreover, as explained in Section 2.2, the visual human quality of a
biometric sample (visual inspection) may differ from its quality for matching performance. In
particular, for iris recognition purpose, a human can judge a well focused image, without problem of
illumination of good quality. However, if the spotlights of the LEDs occur exactly at the pupillary
boundaries, the iris segmentation will probably fail. Therefore, QMA should be designed regarding the
ultimate goal which is the matching performance and not according to human's statements about
sample's quality.

Chapter 4: Design of a quality measurement algorithm for improving iris recognition
82
Various iris quality factors have been investigated as summarized in Table 4-1. Different
protocols of evaluation and different use of quality assessment algorithms have been proposed, making
thus the identification of the most influential quality component on the recognition impossible.
However the IREX II - IQCE report has answered this question. The experimental results pointed out
that the quality component with the highest impact on recognition performance is the UIA, then iris-
pupil contrast, pupil shape, iris-sclera contrast, gaze angle and sharpness. For further improvement in
the performance, several quality components should be combined in order to take into consideration
various artifacts.
The quality components can be measured on the entire image, or more locally, on the
segmented iris image. In the literature, most of the quality metrics are calculated from the segmented
image. Moreover, it is shown in [138] that local estimations are better than global ones for evaluating
quality metrics but at an additional cost of computation as local measures requires prior segmentation
of the iris.
From these observations, we conclude that a QMA has to combine essentially three criteria to
be considered as a relevant quality metric:
• The global quality of the entire image: without blur and enough iris resolution;
• The intrinsic iris quality: well textured in NIR and enough non-occluded iris pixels;
• Segmentation quality: Errors in iris localization lead to wrongly normalized iris images. In
that case, two normalized iris images resulting from the same eye may present a high
discrepancy and consequently are prone to failure in the recognition step. Low eye
contrasts and occlusions at the pupillary and limbic boundaries contribute to severe
segmentation errors. As these errors affect significantly the overall performance of the
system, it is crucial to assess the segmentation quality of the iris images.
(2): How to use QMA to improve the performance of the iris recognition?
Quality assessment may be used in many applications for:
• Predicting matching performance;
• Giving feedback on the quality during the enrollment;
• Providing a weighted scheme for multimodal biometric systems;
• Selecting the best images in a sequence;

Chapter 4: Design of a quality measurement algorithm for improving iris recognition
83
• Providing a weighted scheme for fusing a sequence.
As shown before, many quality factors that affect the performance have been identified, with
different degrees of influence. Therefore, considering a set of quality metrics for quantifying the level
of quality is better than using one single factor. However, this set of qualities, usually expressed as a
vector, is not immediately exploitable in many applications as cited previously. Most usage of QMA
requires a single quality value which indicates the match-ability of the image (if the iris will be
correctly recognized). Therefore, a step of qualities' combination is often required. From this summary
quality value, the performance of an overall recognition system can be improved by for example
discarding images of low quality for further processing, or quantifying the quality of the images by a
continuous value in order to perform a weighted scheme in multimodal systems or even by fusing a
sequence by giving less importance to low quality images in the fused image.
(3): How to efficiently combine several quality measures?
In the literature, different ways of using multiple quality components have been proposed. For
example in [126] and [137], the decision of discarding low quality images for further processing
follows a flowchart scheme. The image has to fulfill all the investigated quality criteria. Each quality
measure is compared to a threshold which corresponds to the minimal required quality. In [125] and
[124], SVMs are used to classify the images into clear or noisy. The output of these approaches is a
binary decision which consists in rejecting or keeping the images regarding one or multiple fixed
thresholds. They are set arbitrarily with some a priori on the used database.
In other works, a unique quality measure of the image is obtained by fusing all the individual
qualities. The fusing method can be a simple multiplication like in [127], a sum [136] or a more
sophisticated method by using the theory of Dempster–Shafer [135]. However, the combination of the
quality metrics has to be performed carefully, without losing information. There is not universal fusion
scheme to do so and in general some a priori is inserted in the fusion protocol. Moreover, whatever the
followed method, the fusion process previously requires a normalization step on the quality values,
which is not a trivial task either.
In this doctoral work, we propose a different approach to compute the quality of an iris image
which is able to deal with most of the disadvantages mentioned before. The quality measure deals with
several quality factors that have been identified in IREX II - IQCE to have a negative impact on the
recognition. The method does not require individual estimations of the iris properties and hence no

Chapter 4: Design of a quality measurement algorithm for improving iris recognition
84
scheme of combination is needed. Our quality measure is based on local quality estimations and gives
an indication on the quality of the segmentation. The approach is explained in detail in the next section.
4.2. Definition of the proposed method for quality
assessment
4.2.1. Choice of the model
As mentioned before, the aim of the thesis is to improve the iris recognition accuracy in non ideal
situations. One way to try to circumvent this bad situation is to fuse iris images of the same eye in the
recorded video sequence. We concentrated our effort in proposing a fusion scheme at the pixel-level.
As the degradation of the performance is related to the quality of the images, we improved the
approach by integrating QMA in the fusion scheme. We decided to perform QMA on the normalized
iris image for two reasons (i) to avoid the alignment problem in the fusion scheme (thanks to the
normalization) and (ii) to follow the recommendation of most works in the literature: QMAs are more
precise when they are calculated on the segmented image [138].
Moreover, to achieve more precise measurements, we decided to estimate the quality on
several local regions of the normalized image. Our intuition is that the quality of the iris image is not
similar in different parts of the image. Therefore we would like to assess the amount of quality texture
in each sub-region of the normalized iris image. Our objective’s statement can be modeled by a
classification problem. In fact, we wish to classify different regions of the normalized image according
to their corresponding quality. For performing this, we have chosen a model based on supervised
classification. Such approaches require labeled samples in order to train the model. There are two
categories of learning algorithms for performing such classification: discriminative and generative.
Discriminative learning algorithms try to learn directly the conditional distribution of the class
y given the observation x (posteriori probability ( / )). The learning phase consists in learning the
borders between all the classes. Such approach requires labeled samples for each class. Linear
regression, SVM and neural networks are examples of such methods. In our context, if we use such
type of algorithm to classify iris regions according to their quality, we would need labeled iris regions
containing all possible type of artifacts (eyelash and eyelid occlusions, specular reflection, blur,
segmentation errors...) and also high quality regions (well-textured). In contrast, generative learning
algorithms try to model ( / ) (and ( )) instead of ( / ). This approach allows learning each

Chapter 4: Design of a quality measurement algorithm for improving iris recognition
85
class individually by using only labeled samples of this class. Gaussian Mixture Model, Naive Bayes
and Hidden Markov models belong to this type of models.
As our goal is not to classify iris region according to the nature of the artifacts but only to
identify highly textured iris regions, we have chosen a generative model. Indeed, our ultimate aim is to
give more importance to such high quality regions in the fusion process and less to the other noisy
regions, in order to reconstruct a fused image of better quality. Details on the proposed fusion schemes
are provided in the next chapter. By using a learning generative algorithm, we only need to label high
textured iris regions to model the probability distribution of one single class, which corresponds to high
quality regions. By this way, we avoid explicitly defining all the other possible classes. Indeed, these
classes correspond to all the possible types of artifacts that can occur in the iris regions. They are
various and diverse as explained in Section 4.1.1. Therefore, learning the separations between all the
classes would be a complex task. Moreover by using such algorithm, we define only one single quality
measure instead of computing individually each quality factors and then combining them by fusion rule
as done in the literature. Consequently, the task of measuring iris image quality becomes simpler.
We have chosen a Gaussian Mixture Model (GMM) for characterizing iris textures of high
quality. The use of this model for performing this task is motivated by the capability of Gaussian
mixtures to model the probability distribution associated to a class of sub-images as previously shown
in [77].
4.2.2. Description of the model
To our knowledge, the first GMM was introduced by Reynolds et al. [143] for speech recognition tasks
as a simplified model of classical Hidden Markov Models [144]: GMM provides a probabilistic model
without imposing Markovian constraints between the classes.
A Gaussian mixture density of a given class consists in a weighted sum of Gaussian
component densities. It can be defined by the following equation:
( ) )1.4()/(1∑
=
⋅=M
m
mm xgwxp λ
where is a -dimensional observation vector, ( ) , = 1, … , are the component densities and
, = 1, … , are the mixture weights.

Chapter 4: Design of a quality measurement algorithm for improving iris recognition
86
Each component density is a D-variate Gaussian function of the form:
( ) ( ) ( ) )2.4(2
1exp
2
1 12/12/
−Σ−−Σ
= −Τmmm
mD
m xxxg µµπ
with mean vector and covariance matrix Σ . The mixture weights satisfy the constraint that
∑=
=M
m
mw1
1 .
The model is entirely parameterized by the mean vectors, covariance matrices and mixture weights
from all component densities. These parameters are collectively defined by:
{ } )3.4(,...,1,, Mmw mmm =Σ= µλ
The learning phase of the GMM aims at determining these sets of elements from the training
dataset. This is achieved by an iterative process in three steps: initialization of the model , successive
re-estimation of from model and verification of the halt criterion at each iteration. These
steps are explained in the next sub-section.
4.2.3. Implementation of the model
4.2.3.1. Model's input vector for characterizing good iris texture
The GMM is trained on sub-images of high quality as done in [77] and [140]. These sub-images are
extracted from the normalized iris images. They contain only high quality textures free from any
artifact such as eyelids, eyelashes, shadow, specular spot, etc. For each pixel of the extracted sub-
images, an input vector is associated. This vector is called the observation vector. In the work of
Cremer et al. [140] is composed of four local observations, measured in a 5 5 neighborhood of a
given pixel . The vector contains the intensity of the pixel, the local mean, the local variance and the
local contrast. The contrast is defined as the difference between the maximum and minimum of the
intensities in the fixed neighborhood.
All these statistical observations correspond to first order descriptors of textures. To improve
the model, we enriched the input vector by adding a second order texture measure because of its
benefits in characterizing texture patterns. More precisely, it considers the spatial relationship of the
pixels. A standard tool for performing this is the Gray Level Co-occurrence Matrix (GLCM) proposed
by Haralick in the 1970s [145]. Due to its potential and effectiveness, GLCM is still popular until now

Chapter 4: Design of a quality measurement algorithm for improving iris recognition
87
in many fields. In the area of iris recognition, many studies [146] [147] [148] and [149] have aimed at
extracting iris features by using these matrices instead of the traditional iris features extracted from 2D
Gabor filters as proposed by Daugman. The results of these works show the successful capacity of
GLCM for characterizing iris texture. Therefore, we expect a better representation of the iris texture by
using this second order descriptor. In particular, we would like to generate a GMM model which is
more discriminative against the different level of the texture quality.
GLCM is a square matrix of size , where is the number of gray levels in the image .
Each element of the matrix represents the joint-probability of a couple of pixels intensities ( , ) in
fixed relative positions ( , ) and ( + , + ). and are fixed at various scales and
orientations . This can be expressed as:
( ) ( )4.4
),()1,(
),1()1,1(
,
=
VVpVp
Vpp
dGLCM
L
MOM
L
α
Each element of the matrix ( , ) represents the probability that a pixel with value at
coordinate ( , ) is adjacent to a pixel of value at ( + , + ). Several statistical features have
been derived from GLCMs for characterizing the co-occurrence matrix contents such as energy,
correlation, contrast, entropy... [150].
For each pixel of image I, one or more GLCM can be calculated on a neighbourhood, defined
by a window. Then, several statistical features can be applied on the resulting matrix for describing
image properties. These results are associated to the pixel, localized in the center of the window, as
depicted in Figure 4-1. Then the window is shifted by one pixel and the procedure is repeated for the
entire image.
Due to the possible values of the parameters and α, a large set of GLCMs is often computed.
There are eight possible values for the orientation: 0°, 45°, 90°, 135°, 180°, 225°, 270°, and 315°.
The arrows of Figure 4-2 represent the direction from the reference pixel to its neighbor pixel, for each
orientation. These eight matrices are thus sensitive to the direction. Therefore, they are usually
averaged to obtain a unique rotation invariant matrix as done in [147] and [149]. In [146], the GLCMs
are not applied on the images but on pre-processed ones in order to make them invariant to rotation. In
practice is limited to a narrow range of small values for computation time reasons.

Chapter 4: Design of a quality measurement algorithm for improving iris recognition
88
Figure 4-1: How to compute GLCM features from the normalize iris image.
Figure 4-2: GLCM’s directions.
In our context, the GLCMs are computed on the iris image with a range of at least 256 gray
levels for iris recognition (as recommended in [35]) and thus = 256. The dimension of each matrix
is thereby 256 256. This wide size leads to a large number of computations for an iris image of size
64 512. In addition, a large size of the GLCM induce sparse matrix [151]. In practice, most of the
matrix entries are zeros. Applying feature statistical measurements on them is thus an inefficient
procedure. Therefore, it is recommended to reduce this range in order to decrease the complexity and
also to be less sensitive to noise. In [150] [151] and [152], the number of gray level is reduced by using
simple gray-level quantization techniques. However, the matrices are still sensitive to rotations.
To avoid all these disadvantages, we do not calculate the GLCM on the iris image but on the
Local Binary Pattern (LBP) iris image. LBP was introduced in [153] and has been widely used in
texture classification because of its efficiency and simplicity. We decided to apply the uniform
invariant rotation Local Binary Pattern (uirLBP), detailed in [154] to the normalized iris image. It
quantifies the frequency of the individual rotation invariant patterns corresponding to a specific micro-

Chapter 4: Design of a quality measurement algorithm for improving iris recognition
89
feature in the image. By considering a neighborhood of size 8 and a radius of 1, the number of gray
levels in the iris image is reduced to 10 ( = 10). This operation has two benefits for our application.
Firstly, it considerably reduces the number of gray level in the image, and thus the size of the GLCM.
Secondly, due to its rotation invariant characteristic uirLBP decreases the number of possible
orientations. For a given normalized iris image, Figure 4-3 shows energy features (defined in Table
4-2) extracted from the GLCMs in all the directions, with a window of dimension 5 5 pixels. We note
that there is a high similarity between the GLCMs of the first column. The same behavior is observed
for the second column. Therefore, the number of possible orientations can be reduced to 2.
(1, 0°) and (1, 45°) are arbitrary selected for further investigation. We note that the same
observation is obtained by using other feature descriptors. To simplify, we only give the results
obtained by the energy descriptor.
Figure 4-3: Energy features extracted from GLCMs at the eight possible orientations of for a given
normalized iris image.
As mentioned before, there are several statistical features that can be applied on the GLCM.
According to [150], three fundamental properties can be extracted from the matrices. First, the main
diagonal points out the degree of smoothness of the texture. This property can be obtained thanks to
several features such as the contrast, the dissimilarity and the inverse difference. Second, the
uniformity of the entries of the GLCM can be also studied by using features e.g. energy, the entropy
and the maximum probability. Finally, the description of the correlation between the pairwise gray-
levels in the image is given by correlation features. For our analysis, we selected one feature per each
category: energy, contrast and correlation features. They are defined in Table 4-2.
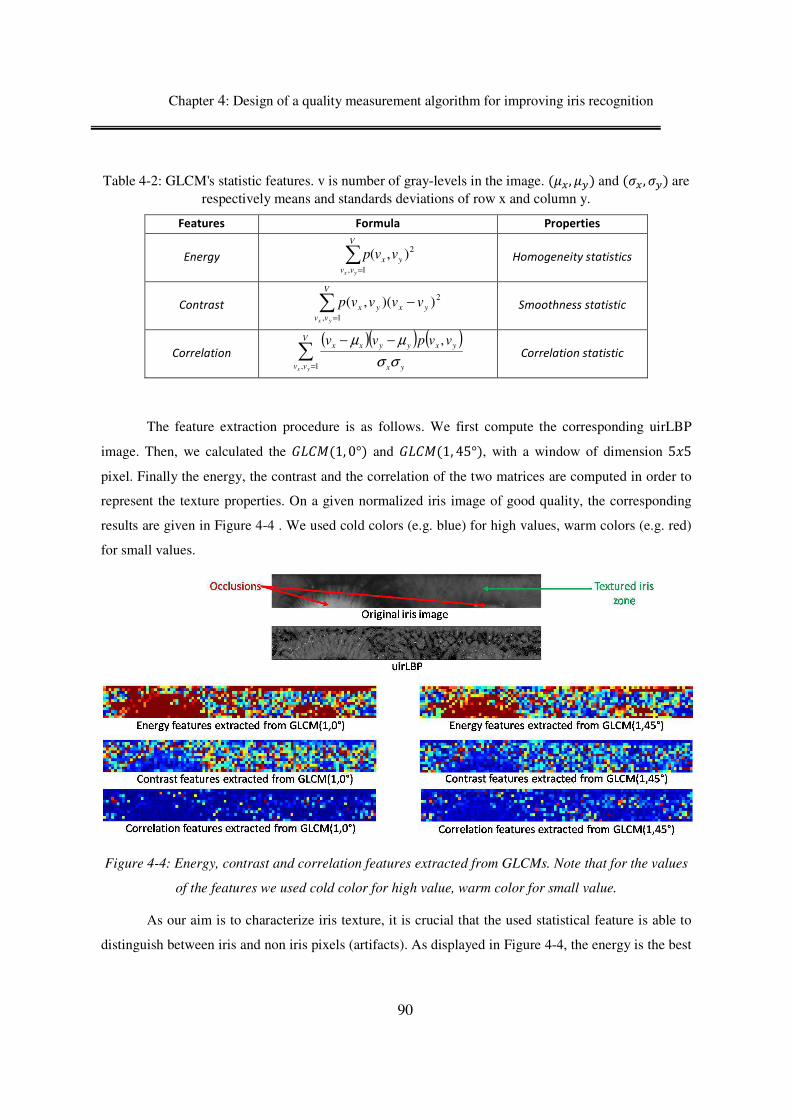
Chapter 4: Design of a quality measurement algorithm for improving iris recognition
90
Table 4-2: GLCM's statistic features. v is number of gray-levels in the image. ( , ) and ( , ) are respectively means and standards deviations of row x and column y.
Features Formula Properties
Energy ∑=
V
vv
yx
yx
vvp1,
2),( Homogeneity statistics
Contrast ∑=
−V
vv
yxyx
yx
vvvvp1,
2))(,(
Smoothness statistic
Correlation ( )( ) ( )
∑=
−−V
vv yx
yxyyxx
yx
vvpvv
1,
,
σσ
µµ
Correlation statistic
The feature extraction procedure is as follows. We first compute the corresponding uirLBP
image. Then, we calculated the (1, 0°) and (1, 45°), with a window of dimension 5 5
pixel. Finally the energy, the contrast and the correlation of the two matrices are computed in order to
represent the texture properties. On a given normalized iris image of good quality, the corresponding
results are given in Figure 4-4 . We used cold colors (e.g. blue) for high values, warm colors (e.g. red)
for small values.
Figure 4-4: Energy, contrast and correlation features extracted from GLCMs. Note that for the values
of the features we used cold color for high value, warm color for small value.
As our aim is to characterize iris texture, it is crucial that the used statistical feature is able to
distinguish between iris and non iris pixels (artifacts). As displayed in Figure 4-4, the energy is the best

Chapter 4: Design of a quality measurement algorithm for improving iris recognition
91
discriminative feature for performing this task. It highly distinguishes well-textured zones (cold colors)
from less textured ones (warm colors) which correspond to occlusions such as eyelids, shadows etc.
Energy feature is a measure of the image homogeneity since it measures textural uniformity. In other
words, it detects pairwise gray repetitions in the image. As the iris image is highly textured, the GLCM
will have a large number of small entries and the energy will be small. However, GLCMs that are
extracted from less textured zones (homogenous regions) would have fewer entries of large value as
few pairs represent the texture. This leads to high energy values. This statistical feature is thus selected.
Due to the similarity of (1, 0°) and (1, 45°) and to reduce the complexity, we
arbitrarily decide to use only the second one, on which the energy is extracted. This value is added to
the input vector of the GMM as the fifth observation.
So, the final dimension of our observation vector is = 5. It contains the intensity of pixel ,
the mean, the variance, the contrast and the GLCM's energy, computed on its neighborhood of size 5 5
pixels.
4.2.3.2. Estimation of the model's parameters
The GMM is learned on small images selected from QFIRE datasets at different distances [38] [39].
We trained the model with 6 Gaussians on 122 sub-images free from occlusions, well focused and
highly textured as in [140]. These sub-images are manually extracted from 47 normalized iris images
of size 64 512, taken from different collections of data, namely QFIRE05, QFIRE07 and QFIRE11
(see Section 2.3.3). These normalized iris images constitute the training set and are not subsequently
used. The sub-images have different dimensions (an average of 4171 pixels per sub-image).
Several tests have been conducted in order to set these values. By analyzing their influence on
the GMM's training, the final values have been determined empirically. They correspond to a trade-off
between the accuracy of the model and the computational cost.
Let and be respectively the number of sub-images of the training set and the number of
pixels in the sub-image. is the number of Gaussians. The estimation of the GMM's parameters,
= , , , = 1, … , , follows these steps:
• Initialization
The GMM's parameters are initialized by k-mean algorithm [155]. First the means of the
Gaussian components are randomly initialized. Then, each observation vector ,where =

Chapter 4: Design of a quality measurement algorithm for improving iris recognition
92
1, … , , = 1, … , , is assigned to a particular Gaussian for which the Euclidean distance between its
mean and this observation vector is minimal. Then, the mean vectors and the covariance
matrices are computed for each of the equal groups. For each Gaussian , the associated weight
is obtained by computing the portion of the observation vectors in the group.
• Re-estimation of the GMM
The GMM's parameters are iteratively re-estimated by using the Expectation Maximization
(EM) algorithm [156]. EM is used to estimate GMM parameters λ that maximize the log-likelihood
given the training data defined as:
( )( ) )5.4(log11
1 1∑ ∑
= =
=K
k
T
t
k
t
k
train
k
OPTK
LL λ
The principle of the EM algorithm consists in beginning with an initial model λ, in order to
estimate a new model ̅ , such that ( ) ( )λλ // OPOP ≥ , where is the set of the observation vectors.
After that, the new model becomes the initial model for the next iteration. The process is repeated and
stopped when the following halt criteria is verified:
( ) ( )( ) )6.4(
exp
expexpε<
−before
train
after
train
before
train
LL
LLLL
where < 10 . The value is set empirically.
4.2.4. Computation of our quality measurement
In this part, we explain how the GMM is exploited to define a local quality measure. As described in
the previous sub-section, GMM has been trained on sub-images that are well textured and free from
artifacts for characterizing textures of high quality. In the test phase, a likelihood can be assigned by
the GMM to each observation vector associated to a given pixel in the image. This likelihood takes its
value between 0 and 1. Highest values correspond to the closest tested observation vectors to those
used for training the model.
The GMM can be used for categorical or probabilistic classification. In the first case, a
threshold should be set on the likelihood to classify the pixels into two classes: high quality or non-
high quality pixel. This implies the binarization of the real-value of the likelihood, leading to a loss of

Chapter 4: Design of a quality measurement algorithm for improving iris recognition
93
information. Consequently, we have chosen to rather exploit the model for probabilistic classification.
In the test, for each sub-image a likelihood that it is of high quality will be assigned. This way, the
GMM will characterize good quality iris texture and will therefore give a low probability on the noisy
regions, which result from blur or artifacts. The interest of this approach is that there is no need to
identify in advance the type of noise present in the images.
In practice, the model is applied to local observations grouped in the input vector for each
pixel of in the sub-image. The local quality measure (LQ) associated to a sub-image ω is given by the
formula:
)7.4())/(log(1
exp)(1
−−= ∑
=
d
i
traini LLxpd
LQ λω
where is the size of the sub-image ω, is the observation vector of the GMM, ( / ) is the
likelihood given by the GMM to the input vector , and is the mean log-likelihood on the
training set as defined in formula 4.5. We recall that is composed of five elements: the intensity of
pixel , the mean, the variance, the contrast and the GLCM's energy, computed on its neighborhood of
size 5x5 pixels.
To normalize the log-likelihood with respect to the training set, we take the absolute value of
the difference between the log-likelihood given by the GMM to the test vector x and the log-likelihood
of the training set. This result can be seen as a distance: the lower the value is, the closest the test
vector x is to the training dataset. The mean of these distances are computed for all the d pixels
belonging to the sub-image ω. A negative exponential is then used to obtain a value between 0 and 1.
The closer the LQ value is to 1, the higher is the quality of the sub-image ω, namely being free from
occlusion and highly textured.
Note that even if this quality measure was trained on specific collections of databases, it can be
used for characterizing any iris images, with the same illumination, coming from other sources. In fact,
the model is only sensitive to the global variation of the pixels' intensities. To overcome this eventual
issue, a simple preprocessing can be done on the sub-images on the training set as well as the test
images on which the GMM will be applied. For example in [140], all the images are pre-processed
such that their mean gray-level would be close to a constant value.

Chapter 4: Design of a quality measurement algorithm for improving iris recognition
94
Each normalized iris image of dimension 64 512 is divided in sub-images of size 4 8 without
overlap as displayed in Figure 4-5. On each sub-region ω, the local quality measure is computed as
follows:
For each pixel of the sub-image ω:
On its neighborhood of size 5 5, we :
Compute:
- m: the mean of the pixels intensities,
- v: the variance of the pixels intensities,
- c: the contrast: Difference between the maximum and minimum of the intensities,
- e: the energy of the GLCM applied to the uirLBP iris image
Assign its corresponding input vector x which contains the gray level of pixel i and the values:
m, v, c and e
Compute ( / ): the likelihood given by the GMM to the input vector
Finally, the local quality of the sub-image ω given the GMM model is computed as defined in Formula
4.7.
At the end, we obtain a matrix of local qualities of 1024 values.
Figure 4-5: Computation of the local qualities on sub-images of a normalized iris image.
Examples of matrices of local qualities:
As mentioned in Section 4.2.3.1, we enriched the proposed model of Cremer et al. [140] by
adding a descriptor of texture of second order to the observation vector. This element takes into
account the spatial relationship between the pixels. Figure 4-6 and Figure 4-7 show the difference
between the GMM used in [140] (namely GMM4obs) and the new one (namely GMM5obs) on two
examples of iris images: one of good quality and the other of low quality. Dark colors (resp. light)
correspond to pixels of low (resp. high) quality.

Chapter 4: Design of a quality measurement algorithm for improving iris recognition
We notice that the GMM5obs detects occlusion zones better than the GMM4obs, es
eyelashes of the iris image in Figure
are not distinguished by the GMM4obs contrary to what occurs with GMM5obs which is more
sensitive to the blur.
Figure 4-6: Normalized iris image of good quality
Figure 4-7: Normalized iris image of poor quality with their corresponding local qualities given by the
Global quality measure:
The local measure presented in
the quality of the entire image by averaging the probabilities given by the GMM of each sub
follows:
where is the number of sub-
sub-image.
Design of a quality measurement algorithm for improving iris recognition
95
We notice that the GMM5obs detects occlusion zones better than the GMM4obs, es
Figure 4-6. Moreover, iris blurred zones of the iris image in
are not distinguished by the GMM4obs contrary to what occurs with GMM5obs which is more
Normalized iris image of good quality with their corresponding local qualities given by the
2 GMMs: GMM4obs and GMM5obs.
Normalized iris image of poor quality with their corresponding local qualities given by the
2 GMMs: GMM4obs and GMM5obs.
The local measure presented in formula 4.7 can also be employed to define a global measure of
the quality of the entire image by averaging the probabilities given by the GMM of each sub
( ) )8.4(1∑=
n
nLQN
GQ ω
-images and ( ) is the local quality given by the GMM on
Design of a quality measurement algorithm for improving iris recognition
We notice that the GMM5obs detects occlusion zones better than the GMM4obs, especially the
. Moreover, iris blurred zones of the iris image in Figure 4-7
are not distinguished by the GMM4obs contrary to what occurs with GMM5obs which is more
with their corresponding local qualities given by the
Normalized iris image of poor quality with their corresponding local qualities given by the
can also be employed to define a global measure of
the quality of the entire image by averaging the probabilities given by the GMM of each sub-image as
given by the GMM on the

Chapter 4: Design of a quality measurement algorithm for improving iris recognition
96
4.3. Evaluation of our quality metric
The objective of this section is to show the effectiveness of the proposed QMA. To this end, we have
exploited our local quality measure to compute a global quality such as defined in Formula 4.8. We
wish to demonstrate that this global quality is well correlated to the performance of the recognition. As
explained in Section 2.2, a pertinent QMA should be linked to the recognition rate.
First, we will show the improvement brought by the enriched model. Therefore, we will
compare the two models GMM4obs and GMM5obs for classifying iris images according to their
quality. We believe that the added fifth element to the observation vector of the GMM is promising to
improve the effectiveness of our quality measure.
As explained in the literature, the quality of the iris texture and the usable iris area (area free
from occlusions) represent the two quality factors with the greatest impact on the iris recognition [51].
Therefore, we would like to assess how our GMM-based quality measure defined in Section 4.2 is
related to those two criteria.
Throughout this section, the reference system OSIRISV4.1 that is described in Section 3.2.1 is
used to perform the recognition. The experiments are carried out on 5400 images randomly taken from
the QFIRE07 dataset (see Section 2.3.3). We have chosen this distance as a compromise between small
(QFIRE05) and long (QFIRE11) distances.
4.3.1. Validation of the improved GMM-based quality: GMM5obs
In this part, we would like to prove that our GMM-based quality obtained by the GMM5obs achieves
better characterization of the iris texture than the GMM4obs, developed in [140]. To establish a
comparative evaluation between these two QMAs, we used ranked-DETs tool as done in the IREX II -
IQCE report [51] of NIST. The more the distance between the DETs is high, the more the QMA is
effective.
To compute the performance, we have considered all the images as independent ones and we
have followed a 1 to 1 matching scheme. For each QMA, a global quality (GQ) is computed for each
normalized iris image as defined in Formula 4.8. The number of genuine and impostor comparisons are
respectively 41,650 and 7,315,114.
The pairwise quality of the two images to be compared can be obtained by several manners
from the quality of the two images as explained in Section 2.2. However, the difference in the achieved

Chapter 4: Design of a quality measurement algorithm for improving iris recognition
97
results is not significant as shown in [34]. In our case, we decided to take the minimum between the
qualities of the two images. We selected the minimum as only one of the two images of the couple
having a low quality is sufficient to degrade the performance. According to this pairwise quality, we
partition the comparison scores into three groups: low, medium, and high. The set of lowest (resp.
highest) quality contains a matching score with pairwise qualities in the lowest (resp. highest) 15
percentile. The rest of the matching scores constitutes the medium quality set. For each QMA, we
generate three ranked-DETs, one for each set above as shown in Figure 4-8.
We notice that the ranked DETs of Figure 4-8-b are better separated that those of Figure 4-8-a.
In fact, the distances between the ranked DETs (connection lines) are higher when the images are
classified according to the GQ given by the GMM5obs model. Consequently, we deduce that our QMA
based on GMM5obs achieves better performance ranking than the QMA based on GMM4obs. In
particular, when we observe the achieved performance of the highest quality sets, we note that lower
FNMR and FMR are obtained for higher quality images, based on the GMM5obs than the GMM4obs.
Therefore, our intuition which consists in claiming that the GMM5obs model characterizes the high
quality texture better than GMM4obs is confirmed.
The remaining experiences are carried out with the best model: GMM5obs.
Figure 4-8: Ranked-DETs based on the GQ given by the model: (a) GMM4obs, (b) GMM5obs.

Chapter 4: Design of a quality measurement algorithm for improving iris recognition
98
4.3.2. Assessment of the improved GMM-based quality: GMM5obs
4.3.2.1. Relationship between the GMM-based quality and the
quality of the texture
In this part, we analyzed how the GMM-based quality is related to the amount of texture present in the
normalized iris image. The poor texture can be caused by iris pigmentation characteristics (for
instance, heavily pigmented irises are less textured even in NIR) and/or by blur introduced by the out
of focus of the camera or the subject moving.
As shown in [157], there is a strong correlation between the quality of the texture and the
accuracy of the recognition and as outlined in [51], low sharpness significantly affects the performance
of the iris system by increasing both FNMR and FMR. Therefore, we expect to show a strong
correlation between the GMM-based quality and the texture quality, and thus the recognition
performance.
To better assess the quality of the iris texture, we have to mask all the occlusions of the
normalized iris image before computing GQ, as done in [157]. To this end, we used the mask given by
OSIRISV4.1. We call GQM (Global Quality of the Masked normalized image) the global quality
computed only on regions free from occlusions and we compared it to the approach of [157] based on a
classical iris texture-quality measure. Indeed in [157], Gong et al used a 5 5 convolution matrix
method proposed by Kang et al. [158] which is an improved version of the Daugman filter to extract
the amount of texture. Convolution matrix methods are based on optical defocus models. This quality
measure is called “Quality Assurance of Texture” (QAoT).
We use scatter plots in order to investigate the relationship between GQM and QAoT. To avoid
the over-plotting of data points in the large dataset, we grouped the data into 13 equal count bins by
abscissa (GQM) and then we plotted the average and the standard deviation for each bin. Figure 4-9
shows the link between the amount of texture QAoT and GQM.

Chapter 4: Design of a quality measurement algorithm for improving iris recognition
99
Figure 4-9: Relationship between GQM and QAoT.
As expected, our quality measure increases with the amount of texture. These results show that
GQM is able to quantify the quality of iris texture and therefore to discriminate highly textured regions
from poorly textured ones.
4.3.2.2. Relationship between the GMM-based quality and the
usable iris area
As underlined in [51], among all quality components, the usable iris area has the greatest influence on
performance. This quality measures the proportion of iris pixels non-occluded in the normalized image.
For each image, we compute the following measures:
• UIA: It measures the usable iris area which corresponds to the number of pixels non-
occluded according to the mask of OSIRISV4.1.
• GQ: It represents the average of the local qualities given by the GMM5obs on the sub-
parts of the entire normalized image without any detection of occlusion.
• GQM: It is the average of the local qualities given by the GMM5obs only on the sub-
parts of the normalized image free from occlusions. The occlusions are detected by the
mask of OSIRISV4.1 such as in UIA measure.
To achieve a comparative evaluation between the quality metrics cited above, we calculate the
recognition performance according to the quality of the images. Indeed, relevant quality metrics should
be strongly linked to the recognition performance: the higher the quality according to this metric, the

Chapter 4: Design of a quality measurement algorithm for improving iris recognition
100
higher the performance should be. We use ranked-DETs curves to evaluate the efficiency of these
quality measures. To this end, we have followed the same scheme as in Section 4.3.1. We have used
7,315,114 inter-class and 41,650 intra-class comparisons and for each comparison, the minimum the
between the qualities of the two images represents the quality of the pairwise. The partition of the
comparison scores is also performed in a similar way: we have considered 3 categories of quality: low,
medium, and high. The lowest (resp. highest) quality set is composed of comparisons with pairwise
quality in the lowest (resp. highest) 15 percentile. The remaining comparisons which represent 70% of
the entire matching scores are assigned to the middle quality set. For each quality metric, three ranked-
DETs are generated, one for each set above as displayed in Figure 4-10.
We observe that the ranked-DET curves are well separated for all the measures. Consequently,
these qualities are effective criteria for predicting the performance. An appropriate behavior is
observed: lower FNMR and FMR are observed as the quality increases. As expected, the highest
performance is noticed for the images with the fewest occlusions and the lowest performance for the
images with a high degree of occlusion.
In addition, we observe that the GQ and the GQM allow the higher separation among the three
curves. The difference is higher than one order of magnitude. This fact indicates that GQ and GQM are
more pertinent quality measures than UIA for sorting the images according to their quality. In
particular at the EER, the improvement between the high and the low ranked-DETs by the GQM is
higher than UIA (from 19.64% to 1.13%, vs from 15.57% to 3.21%). Therefore, we conclude that our
quality measures are relevant for classifying the image into low, medium, and high quality.
Figure 4-10: Ranked-DETs based on (a) UIA, (b) GQ, and (c) GQM.

Chapter 4: Design of a quality measurement algorithm for improving iris recognition
101
One other metric for the comparative evaluation of quality measures is the error versus reject
curves. These curves are used to demonstrate how efficiently the rejection of low quality images results
in improving the performance as introduced in the IREX II - IQCE report. To this end, we compute the
average of the image False Non Match Rate (iFNMR) and the FNMR at FMR equals to 0.001
(FNMR@FMR=0.001) at diverse fractions of comparisons rejected. The iFNMR is calculated at a
FMR equals to 0.001 corresponding to a threshold where false match errors actually occur as suggested
by Tabassi in [50]. Figure 4-11 shows error versus reject curves for each quality measure.
We notice that all the quality measures are effective. The iFNMR and FNMR@FMR=0.001
improve as more as low-quality pairwises are discarded. The curves decrease quickly with the fraction
of comparison rejected but not with the same slope, which allows the metrics to be compared as the
higher the slope, the higher the pertinence of the quality metric.
Figure 4-11: Error versus Reject curves based on UIA, GQ and GQM.
We also observe that GQM generally outperforms the two other quality metrics mostly at a 3%
rejection threshold. In fact, GQM quality reduces the FNMR@FMR=0.001 by almost 11.85% and the
iFNMR by 12.96%. Table 4-3 sums up the improvement of the performances at 3% rejection threshold
for all the quality measures. As shown in Table 4-3, GQM outperforms UIA. In fact, UIA calculates
only the number of non-occluded pixels without taking in account their quality. However, the GQM
gives a weight to each pixel according to the local quality of the region given by the GMM5obs.
Therefore, GQM contains more information than UIA. It represents the quality of the usable iris area
and not only the percentage of occlusions.

Chapter 4: Design of a quality measurement algorithm for improving iris recognition
102
Table 4-3: Improvement of the FNMR@FMR=0.001 and the IFNMR at a 3% rejection of comparisons based on UIA, GQ, AND GQM on QFIRE database.
Metrics UIA GQ GQM
FNMR@FMR=0.001's improvement 6.27% 9.22% 11.85%
iFNMR's improvement 5.96% 10.72% 12.96%
On the other hand, by observing Figure 4-11 and Table 4-3, we can see that GQ is slightly
worse than GQM. In fact, GQ is computed by using all the sub-regions of the images. We expected that
GQ would be able to give a very small weight to the occluded pixels and therefore that it would play
the role of a mask. Nevertheless regarding the error versus reject curves, GQ seems to be less
discriminative than the mask of OSIRISV4.1 which is used by UIA and GQM. In fact, the mask allows
us not to take into account the occlusion in the quality measure, while GQ considers them even if the
associated value is low. For this reason, we decide to use both the mask of OSIRISV4.1 and our quality
in the fusion schemes in the next chapter.
In IREX II - IQCE report, the improvements of the FNMR regarding several quality criteria
estimated by the best contestant's QMA were also given. For example, on ICE2006 database, a
rejection of 3% according to UIA criteria brought an improvement of 9.89%. In the case of the scalar
quality component (which includes all the quality factors such as our global quality measure), the
FNMR is improved by 10.8%. Due to the fact that the evaluation was done on two different databases
(for IREX II - IQCE on ICE2006 and for us on QFIRE07), it is difficult to perform an exact
comparison between these improvements and ours (UIA: 6.27% and GQM: 11.85%). However, the
two used datasets present some quality similarities as the images of ICE2006 approximately have the
same resolution as QFIRE07 (> 200 pixels). They also contain occlusions and blur as in QFIRE07.
4.4. Conclusion
In this chapter, we presented a relevant approach to quantify the quality iris images. The measure is
based on a GMM, trained on samples of high quality. We showed the capability of the quality measure
in detecting regions of good quality as well as regions with artifacts such as eyelids, eyelashes,
shadows, specular spot... Moreover, our quality measure is able to distinguish highly iris texture from
lower ones.
The strong point of the approach consists in identifying locally several quality factors that have
an impact of the performance, i.e. usable iris area and sharpness as reported in the evaluation of IREX

Chapter 4: Design of a quality measurement algorithm for improving iris recognition
103
II - IQCE. Moreover the quality is a unique measure, estimated on the segmented image, without need
of identifying a priori the type of the degradation(s). Therefore, no individual estimation of each
quality factors is required and no step of qualities combination is hence needed.
We have conducted comparative evaluations between two GMMs, based on different input
features. The difference in the results shows that the choice of these input vectors is a crucial task in
the design of a GMM to ensure the efficiency of the related system.
Through several experiments, we assessed the correlation between the proposed quality
measure and the amount of texture and the usable iris area. The results show a strong link between
them. Consequently, the developed QMA can be considered as a relevant tool for estimating iris
quality.
In the next chapter, we will present the proposed schemes of fusion for improving iris
recognition in degraded sequences, as well as the integration of the quality in the fusion process.

Chapter 5: Fusion approaches for iris recognition in sequences
104
Chapter 5. Fusion approaches for iris recognition in
sequences
5.1. Related works ............................................................................................................. 105
5.1.1. Signal fusion of iris sequences ............................................................................ 105
5.1.2. Synthesis and choice of the fusion approach ....................................................... 109
5.2. Proposed approaches for fusing iris sequences ............................................................ 111
5.2.1. Fusion process ................................................................................................... 111
5.2.1.1. Super-resolution implementation ........................................................................ 111
5.2.1.2. Integration of quality assessments ...................................................................... 116
5.2.2. Overall architecture of the quality-based system ................................................. 117
5.3. Assessment of the proposed fusion processes .............................................................. 119
5.3.1. Preliminary works .............................................................................................. 120
5.3.1.1. Multiple biometric Grand Challenge: Portal dataset ............................................ 120
5.3.1.2. CASIA-IrisV4-Thousand ................................................................................... 126
5.3.2. Final model tested on QFIRE databases .............................................................. 130
5.3.2.1. No fusion vs. simple average fusion ................................................................... 132
5.3.2.2. Impact of the acquisition distance on the super-resolution improvement ............. 133
5.3.2.3. Assessment of the global and local quality in the fusion scheme ......................... 134
5.4. Conclusion ................................................................................................................. 138
Chapter 5: Fusion approaches for iris recognition in sequences
105
s explained before, the excellent performance of iris recognition systems are obtained by
controlling the quality of the captured images, by both imposing certain constraints on
users, such as standing at a close fixed distance from the camera, and using algorithmic
measurements of image quality, such as contrast, illumination and textural richness controls. However,
in many recent security applications, many of these constraints become impossible to impose
especially for scenarios of iris recognition at long distance and/or on the move. The usual NIR sensors
are not optimized for such acquisition and therefore the resulting images present a lack of resolution,
leading to blur and low contrast between the different boundaries of the iris. All these degradations
significantly decrease iris recognition performance.
One way to try to circumvent this bad situation is to use some redundancy arising from the
availability of several images of the same eye in the recorded sequence. In the literature, researchers
have concentrated their efforts on proposing several approaches based on fusion schemes to exploit the
entire sequence rather than using one single image, selected as the best image in term of quality. State-
of-the-art on fusion approaches for iris recognition in sequences under less constrained acquisition is
related in Section 5.1.
We will see that the literature agrees on the fact that the quality of the iris images that are used
in the fusion scheme plays a crucial role in its success. Therefore, we will introduce our quality
measure presented in the previous Chapter 4 in the fusion process. Details on the proposed fusion
processes and how we have integrated our quality measure in these approaches are given in Section
5.2.
Finally, the proposed fusion processes are benchmarked on several public iris databases. The
experimental results are given in Section 5.3. Different acquisition scenarios are investigated: iris
recognition on the move, multiple images shot with intra-variability, and recognition at a distance.
5.1. Related works
5.1.1. Signal fusion of iris sequences
The idea of exploiting multiple still images or video sequences has been previously proposed
for face recognition. For instance, one challenge of the Face Recognition Grand Challenge [159],
organized by NIST, has addressed this issue. It is reported that exploiting multiple still images can
significantly improve the accuracy of face recognition. Promptly researchers assumed that employing
A

Chapter 5: Fusion approaches for iris recognition in sequences
106
same approaches in the field of iris recognition would also lead to enhancement in the recognition
performance.
Taking benefit of having at disposal multiple still images in iris databases, researches have
started to propose approaches based on the combination of matching scores across multiple
comparisons. In [92], Ma et al. proposed to use three templates of a given iris in the enrollment
database and took the average of three Hamming distances as the final matching score. Krichen et al.
[160] performed a similar approach. The authors used the minimum matching score instead of the
average. In [161], Schmid et al. presented two methods for fusing Hamming distance scores: they
demonstrated that fusing the scores using log likelihood ratio gave superior performance when
compared to average Hamming distance. All these approaches use multiple images available in the
gallery dataset (also called reference dataset).
Two main drawbacks stem from using still iris image instead of iris video (or sequence) as
input of the recognizer:
• Artifacts such as occlusions, specular spots and blur reduce the amount of high quality texture
contained in a still image. However in the case of a sequence video, due to several factors, this
quantity of iris texture can vary between the frames, (e.g. eyelash occlusions not constant,
absence/presence of spots, image well focused or out of focus...). Therefore, it is possible to
reconstruct a better template by using various frames than one single image.
• Illumination variation between two still images to be compared causes degradation in the
matching score. However, this difference can be reduced by fusing several frames of a video
sequence in order to built one final template, used in the comparison instead of a single still
image.
Recent works shifted toward proposing new approaches based on signal-fusion rather than
score-fusion frameworks, aiming at improving the performance of iris recognition in less restrictive
acquisition. Taken advantage of temporal continuity in videos, a possible direction is to fuse the frames
of the videos at the pixel-level, exploiting this way the redundancy of the iris texture at an early stage.
The feature extraction and matching steps are then performed on the resulting fused images, reducing
drastically the complexity. At this level of study, the question arising is how to perform this fusion
stage so that the performance can be improved compared to 1 to 1 matching (baseline) or score-fusion
schemes. In [162], Hollingsworth et al. proposed performing a simple averaging of the normalized iris
images extracted from the video in order to match NIR iris videos against NIR iris videos from MBGC

Chapter 5: Fusion approaches for iris recognition in sequences
107
database. Ten images with the highest qualities are selected from the video for averaging the signal.
The experimental results showed that a registration of the images is not necessarily for this dataset. The
signal fusion scheme reduces the FRR@FAR=0.001 from 3.32% to 1.1% (compared to the baseline: no
fusion). The proposed method is also compared to score-fusion approaches: it outperforms [92]
(Hamming distances' average) and [160] (the minimum of the Hamming distances) methods and
achieves comparable performance to [161] (log likelihood method). The authors proposed also a new
approach based on a score-fusion, namely Multi-Gallery Multi-Probe (MGMP). It considers
independently the N frames in the reference video and the M ones of the test video, and hence
computes matching scores. Then, these scores are fused by the min operator in order to get a
unique score per video. When compared to signal-fusion methods, the results are slightly better but
with a very higher computational cost.
Jillela et al. in [163] explored the fusion in the feature domain using Principal Components
Transform (PCT). Their approach uses the availability of multiple images of the same iris to extract
discriminatory information. NIR iris videos of MBGC database are used to benchmark the method.
Only six images of good quality are manually selected for the assessment stage. The authors performed
the following scheme: low-resolution probes images (also called test images) are compared to high-
resolution images gallery. The probe images are generated by artificially degrading high-resolution
images (down-sampled). The authors claim that the proposed method avoid registration requirement.
The approach leads to an EER of 1.48%.
Another way is to use super-resolution (SR) approaches to build a high-resolution template
from successive iris images of low-resolution. Indeed, SR techniques are a well-known solution for
fusing and exploiting the information arising in a sequence of poor quality. In general, SR approaches
can be achieved in the pixel or feature domain. To our knowledge, the first paper that considered the
problem of fusing images of low quality in iris videos for improving recognition performance via SR is
from Fahmy [164]. He proposed a super-resolution technique based on an auto-regressive signature
model in the pixel domain for obtaining high-resolution images from successive low-resolution ones,
captured at a long distance. However, his approach uses the whole eye image for registration (based on
cross correlation model), which potentially prone to errors, especially in less constrained recognition
applications. He shows that the resulting images are valuable only if the initial low-resolution images
are free of blur and focused, stressing already the bad influence of low quality images in the fusion.

Chapter 5: Fusion approaches for iris recognition in sequences
108
In the same way, Nguyen et al. proposed fusing different irises coming from NIR face videos
at a pixel-level after an interpolation step [54] [165]. The authors use a quality factor in their fusion
scheme, which allows them to give less importance to images of bad quality in the fusion. The
interpolation procedure as well as the quality weighting is shown very efficient for improving
recognition performance. The experiences are conducted on the challenging dataset: MBGC portal.
NIR face videos are compared against NIR high-quality still iris images. An EER of 2.1% is achieved
by their approach in [54] . In particular, the proposed method outperforms classical scheme based on
best quality frame selection [32] and other existing approaches: MPMG score-fusion (10,1%) and
signal-fusion methods (2.6%) [162].
In a more recent work [166], Nguyen et al. explored feature-domain SR for iris recognition
using eigeniris as the features. A different protocol is adopted in this work: two images are selected
from the NIR high-quality iris still images of MBGC database. One is devoted to the gallery, while the
other is artificially degraded to create a series of low-quality images. The proposed method leads to
better performance than their previous work [54] with this new protocol. The EER is approximately
reduced from 10% to 5%. However, it is shown that 2D Gabor wavelets are more discriminate features
for iris recognition than eigeniris features. Therefore, in [167] feature-level SR approach is directly
conducted on the Gabor filtered images.
A super-resolution scheme based on an improved iterated back projection algorithm is also
proposed by Ren et al. in [168]. A high-resolution image is reconstructed from multiple still iris
images, taken from CASIA-Iris-Lamp. The images are also artificially down-sampled. Lower EER is
obtained by the SR method.
In another direction, Liu et al. [41] proposed a fusion scheme based on a modified Markov
network at the bit-level to obtain a high-resolution irisCode from a sequence of low-resolution ones.
Heterogeneous comparisons are performed between high and low resolution videos, coming from
QFIRE05 and QFIRE11 respectively. Only images free from noise and successfully segmented are
used. They also proposed measuring the reliability of each bit in the enhanced irisCode in order to
improve iris recognition performance.
Mahadeo et al. [169] proposed a method that reconstructs an optimized irisCode from several
frames of an iris video. The method selects the best rows and columns in different irisCodes coming
from the sequence. The best row (resp. column) corresponds to the raw (resp. column) that achieves the
lowest mean of the Hamming distances with the corresponding rows (resp. column) in the remaining

Chapter 5: Fusion approaches for iris recognition in sequences
109
irisCodes of the sequence. The optimal irisCode is obtained by performing an AND operator between
the best rows and columns. A mask is also generated: it corresponds to the bits that disagree between
these two best entities. NIR iris videos of MBGC are used to assess the approach. Only frames with
high quality are used. The proposed bit-fusion scheme is compared to other score-fusion ones: it
outperforms [92] (the average of the Hamming distances) and [160] (the minimum value of the
Hamming distances). More precisely, the obtained EER by the proposed method, [92] and [160] are
respectively 0.018%, 0.1022% and 0.1041%.
5.1.2. Synthesis and choice of the fusion approach
All the related works of the above literature review agree on the fact that the quality of the used images
in the fusion process is a very important factor for its success, and hence for obtaining an improvement
in the recognition performance.
Except [54] [165], in all the works only images of high quality are used to perform the fusion.
They are selected either manually [163] [164] [166] [168] or according to quality assessment
algorithms [162] [167] [169]. The images are well focused, with a reasonable percentage of visible iris
area in the frame. After that, the quality of the segmentation is also examined. Images poorly
segmented are discarded [41] or corrected [162] for assessing their proposed approaches. Moreover, in
[163] the images are fully segmented manually. The selected database for benchmarking most of these
related works is the NIR iris video dataset of MBGC which is from relatively high quality. This is due
to the controlled acquisition mode (close acquisition distance, static subject...).
Other works proposed to estimate the image quality in the sequence to give to this image less
or more weight in the fusion process according to its quality [54] [165]. Super-resolution technique is
performed to improve the resolution of the images. The assessment of the proposed approaches is
conducted on the MBGC portal challenge dataset. Compared to the NIR iris video dataset, less
constrained conditions during the acquisition are imposed in the portal scenario which corresponds to
more realistic applications (long distance, iris on the move). The resulting images are thereby of lower
quality.
As explained before, the context addressed in this doctoral work is iris recognition in videos
under less constrained acquisition. As in [165] we propose to fuse the different frames of the sequence
at the pixel-level. This fusion is based on a basic super-resolution approach, allowing image resolution
enhancement. When dealing with videos, contrary to [165], we consider a video vs. video scenario,

Chapter 5: Fusion approaches for iris recognition in sequences
110
more adapted to the re-identification context, meaning that we will use several frames in both low
quality videos to address the person recognition task.
We note that the above state-of-the-art review dealing with super-resolution in particular [165]
[54] [164] [168] has stressed the importance of choosing adequately the images involved in the fusion
process. Integration of low quality images leads to a decrease in performance producing a rather
counterproductive effect. Indeed, in general iris videos taken at a distance or on the move suffer from
blur and low contrast between the pupillary and limbic boundaries. Moreover strong occlusions can
occur on iris regions. These degradations may lead to wrong iris localization, which particularly
influences the precision of the iris segmentation and consequently the quality of the normalized iris
texture. In this case, two normalized iris images resulting from different acquisitions of the same
person, present a high discrepancy and consequently one must be very careful in fusing such images.
Therefore, it is important to consider accurately the quality of the images in the fusion process in order
to increase the recognition performance.
Following these considerations, we therefore concentrate our efforts on proposing a novel and
relevant way of measuring and integrating quality measures in the image fusion scheme. More
precisely, our first contribution is the proposition of a global quality measure of normalized iris images
that we will use in two ways: as a selection tool and as a weighting factor in the same way as proposed
in [165]. More precisely, we propose to use our quality assessment algorithm previously described in
Chapter 4. We recall that our measure exploits a local Gaussian Mixture Model based characterization
of the iris texture. The interest of our quality measure compared to [165] is its simplicity and the fact
that its computation does not require identifying in advance the type of degradations that can occur in
the iris images. Bad quality normalized iris images are therefore images containing a large part of non-
highly textured zones, resulting from blur or occlusions.
Taking advantage of this local measure, we propose as a second novel contribution to perform
a local weighting in the image fusion scheme, allowing us to take into account the fact that
degradations can be different in diverse parts of the iris image. This means that regions free from
occlusions will contribute more in the reconstruction of the fused image than regions with artefacts.
Thus, we believe that the quality of the reconstructed image will be optimized and we expect this
scheme to lead to a significant improvement in the recognition performance. To our knowledge, this is
the first work in which a local quality is proposed for fusing iris sequences instead of a global one as
done in the literature.

Chapter 5: Fusion approaches for iris recognition in sequences
111
We have chosen to fuse the images of the sequences at the pixel-level. Our motivation lies in
the fact that our local quality is estimated on the normalized images for each pixel. However, we will
see in the next chapter that it is also possible to exploit this local quality at the bit-level.
5.2. Proposed approaches for fusing iris sequences
The aim of this section is to present our strategy for fusing iris images, aiming at improving iris
recognition in less constrained environment. We first describe the implemented super-resolution
process allowing interpolation and fusion of images of a given iris video. After that, we will explain
how we have integrated our quality measures presented in Chapter 4 in the fusion process. Finally, we
summarize the overall architecture of the system that we propose for person recognition from a
sequence of iris images, using frames fusion with local and global quality measures.
5.2.1. Fusion process
5.2.1.1. Super-resolution implementation
Super-resolution (SR) is a set of image processing techniques that generate a higher-resolution image
from multiple lower-resolution images of the same scene. SR aims at building details finer than the
sampling grid of a given imaging device by increasing the number of pixels per region in an image
[105]. Indeed, the high-resolution image contains a high pixels density and hence more details on the
original scene. As we are working with sequences acquired by biometric systems in less constrained
environment, e.g. at a distance or/and on the move, the resulting images may suffer from poor
resolution. In the current state-of-the-art, it is shown that a lack of resolution leads to significant
degradation in iris recognition performance. SR technique can remedy to this lack of resolution by
producing an enhanced restored image from multiples images.
SR techniques in general:
SR techniques involve the three following principles: image observation model, registration
and reconstruction.
i. Image observation model:
SR problem is usually modeled as an inverse problem where "the source (High-resolution (HR)
image) has to be estimated from the observed data (Low-resolution (LR) images)" [170]. In order to

Chapter 5: Fusion approaches for iris recognition in sequences
112
solve this inverse problem, an observation model is first defined. In our context, the observation model
which consists in relating the HR image h to the observed LR images l, and can be expressed as [171]:
( )1.51 FifornhMDBl iiii ≤≤+=
where D, B and M respectively denote the sub-sampling, blur and warp matrix. n represents the
additive Gaussian noise and F is the number of frames in the video.
ii. Image registration:
This process ensures the correct alignment of the multiple images coming from the same scene
at distinct times. Image registration is a fundamental image processing problem. This task becomes
more difficult especially when the observations are degraded: low-resolution images with strong
artifacts in our case.
As well known, image registration accuracy decreases when the resolution of the observations
diminishes [172]. Indeed, the boundaries are more blurred in the images of low-resolution. This fact
can introduce severe registration errors. Therefore, the quality of the reconstructed high-resolution
image depends on the performance of the registration.
Registering images can be expressed as a mapping or a transformation of the pixels from the
observation to the reference image (rotation, translation...). This stage can be global i.e. performing the
same transformation on the whole image, or local i.e. addressing differently the sub-regions of the
image [126]. Global transformations are generally used when the observed scene is rigid. Adversely,
when the scene is not rigid, local transformations are more suitable.
iii. Image reconstruction:
SR techniques can be categorized into three main classes: interpolation, frequency and
regularized based algorithms. Major principles of those methods and some of the most popular
methods are given below. More details can be found in the technical review [171].
• Interpolation-based algorithms:
It consists in recovering the HR image by projecting all the LR images to a reference image.
After that, all the LR images are fused. This is justified by the fact that, each one of them can bring an
additional amount of information about the scene. A deblurring procedure is then applied to the
obtained fused image in order to obtain the final HR image. Non-uniform interpolation can be
Chapter 5: Fusion approaches for iris recognition in sequences
113
performed as in [173] [174]. The interpolation can also be iteratively conducted by e.g. back-projection
algorithm [175], or projection onto convex sets algorithm [176].
• Frequency-based algorithms:
Such approaches exploit the aliasing effect that exits in each LR image to restore the HR
image. Indeed, this effect is easily modeled in the frequency-domain. The first algorithm was proposed
by Huang and Tsai [177] and followed these principles: (i) shifting properties of Fourier Transform,
(ii) the aliasing relationship between Discrete Fourier Transform coefficients (DFT) of the LR images
and the continuous Fourier Transform of the original HR image, and (iii) the original HR image is
band-limited. In [178], Discrete Cosine Transform (DCT) has been proposed instead of DFT. An
iterative EM algorithm [179] was also used for performing registration, de-convolution and
interpolations processes. The use of wavelets has been also investigated for recovering the high-
frequency information in many works [180] [181] [182].
The major limitation of these techniques lies in the fact that the registration can only be
performed globally. However, such approaches have a low complexity cost.
• Regularized-based algorithms:
Due to insufficient number of LR images or ill-conditioned blur operators, various regularized-
based approaches have been implemented to "stabilize" the inverse problem, by decreasing the number
of possible solutions. Some prior knowledge of the source HR image is incorporated to solve the
problem. Such methods can be classified into deterministic or stochastic approaches.
In deterministic SR reconstruction methods, the observation model given in Formula 5.1 can
be entirely specified: prior information about the solution is exploited to make the problem well posed.
A typical method can be used for performing this: the constrained least squares. Stochastic approaches
rely on the possibility that the posteriori probability density function of the original HR image can be
established, by using information on both observed LR images and prior knowledge on the HR image.
Bayesian-based SR approaches belong to this type of category. One of the most popular Bayesian-
based SR approaches is the Maximum a Posteriori (MAP) estimation approach [183].
SR in the field of iris recognition:
In the literature, SR techniques have been used for fusing iris sequences of low quality in order
to reconstruct a highest resolution iris image as related in Section 5.1.1 in several works [54] [164]
[165] [168]. We give below more details on the SR approaches.

Chapter 5: Fusion approaches for iris recognition in sequences
114
In [164], Fahmy presented an SR approach based on an auto-regressive signature to construct a
higher resolution iris image from a video sequence. First a set of 9 un-blurred frames are selected from
the video, and registered with the first frame by using cross correlation model. No criterion of selection
is mentioned in the paper. Then, auto-regressive signatures are calculated between the reference frame
and the remaining frames in 3 directions: vertical, horizontal and diagonal. For each direction, the
frame that gives the highest value is selected. These three images and the reference image are then
interleaved to create a 4 times higher resolution image. This process can be repeated to build a 16 times
higher resolution frame to the original iris frame. Experimental results show recognition enhancement
for the HR images compared to original ones (LR).
A reconstruction-based SR approach that incorporates quality criteria was proposed by Nguyen
et al. in [54] [165] to improve iris recognition accuracy. The approach is based on a bilinear
interpolation. In [54] the registration is as follows: for each interpolated iris image, the corresponding
irisCode is calculated and then shifted to compute several Hamming distances with the reference
image. The shift that produces the smallest value is used to register the interpolated image. In [165] a
phase correlation patch-based registration is used for registering the images. In both works, the
interpolated and registered images are then averaged by using quality criteria. The HR image is then
restored by applying a deblurring Wiener filter.
Ren et al. [168] proposed a robust SR algorithm to construct a HR image from several distinct
and proper LR images (well-focused and without strong occlusions). The images are first segmented
and normalized. Then, the normalized iris images are registered to the reference image by using
translation and rotation transforms. In the Fourier domain, the slope of the phase difference is
calculated to provide the translation shift in the pixel domain while the rotation angle corresponds to
the value that provides maximum correlation between the Fourier transform of the reference image and
the normalized iris image to be registered. Finally, the reconstruction phase relies on two stages: (i) the
nearest interpolation of the reference image (first image of the sequence) to get a HR image and (ii) the
total square error between the reference and the remaining registered images is iteratively calculated.
Iterations are done with the sum of the images and the gradient of the total square error. The process is
stopped when the error reaches a fixed threshold value. The method is compared to other SR
algorithms such as robust mean averaging algorithm [184]. The proposed method gives lower EER.
SR approaches have also been performed to build a HR iris image from a single LR image
instead of various LR images, aiming at improving the recognition. For example, in [185] Kwang et al.

Chapter 5: Fusion approaches for iris recognition in sequences
115
explored a learning-based SR algorithm based on multiple Multi-Layer Perceptrons (MLPs) to enhance
the resolution of the images. By using bilinear interpolation based on the output pixels of the trained
multiple MLPs, a HR iris image is produced. To this end, the MLP is trained with back propagation
algorithm only on clean pixels (free from occlusions). The LR image is divided into small blocks and
each of them is classified into one of the 3 following classes: vertical, horizontal and non-edge
depending on the edge direction of the iris patterns. These 3 types of blocks are fed into 3
corresponding MLP neural networks to estimate the new pixels. The resulting blocks contain the old
and the new pixels. These blocks are then combined in order to get a HR iris image. Pixels without
values are restored by using bilinear interpolation. Experimental results of the proposed approach on
Casia-IrisV3-Interval database show lower EER than conventional bilinear interpolation.
Another learning-based approach based on Circular Symmetric Filter (CDF) [186] was
proposed by Huang et al. in [187]. Prior probability relations between the information of different
frequency bands of iris features extracted by CDFs and used for the recognition are learned and then
incorporated in the SR to enhance the visual effect. Local spatial relationships between LR and HR
patches are modeled by using a Markov Network [188]. Better recognition accuracy are obtained by
performing this feature-domain approach compared to the traditional interpolation SR algorithm of
Freeman [189] operating in the pixel domain.
Adopted super-resolution in the doctoral work:
Among the various ways used to reconstruct the HR image, we chose a simple interpolation-
based SR technique in the pixel-domain, similar to that exploited in [165] resulting in a double
resolution image. We will show on several iris databases that this simple SR technique is sufficient to
improve the performance of the recognition. We presume that more sophisticated algorithms could lead
to further improvement as learning-based approaches but with a higher complexity cost. However, the
choice of the SR algorithm should be done carefully, as it is reported in the literature [165] [187] that
learning-based methods fully learned on pixel intensity to model the relationship between HR and LR
images introduce some fake high frequencies in the reconstructed HR image in order to produce good
visual effect. These biased data can lead to possible performance degradations.
As highlighted before, a process of registration has to be performed on the images before the
pixel-fusion to ensure that the pixels are correctly aligned with each other in the sequence. Therefore,
each iris image of the sequence is first segmented and then normalized. Indeed, the process of
normalization performs a scaling of the iris zone dealing with pupil dilation, and thus allowing an
Chapter 5: Fusion approaches for iris recognition in sequences
116
alignment of the pixels. This method is sufficient for the registration due to the fact that the images of
the selected databases for benchmarking are frontal images. However, a different method of alignment
would be necessary for iris videos with head rotation or eye movement (off-angle).
After that, each normalized image of the sequence is bi-linearly interpolated and then averaged
to obtain one high-resolution image. Bilinear interpolation consists in assigning to each unknown pixel
a value which corresponds to the weighted average of the pixels’ intensities in the nearest 2-by-2
neighborhood. Finally, the Wiener deconvolution filter [190] is then applied on this fused image for
enhancing its quality (deblurring stage). However, the obtained performances on the selected databases
show similar recognition accuracy results with or without this filter. Therefore, we decided to remove
the filter to reduce the complexity of the method.
5.2.1.2. Integration of quality assessments
We explored specifically two possible fusion schemes, depending on how the quality has been
exploited:
i. Global quality-based fusion process
As done in [165], we weight the value of each pixel of each normalized iris image by the same
factor but for this we use our empirical global quality measure (GQ) as defined in Formula 4.8 in the
previous chapter. GQ allows us to estimate one unique quality measure per image avoiding a fusion
phase of various quality measures, which requires identifying a priori the type of each degradation. We
recall that the GQ is the mean of the local qualities, estimated on sub-regions of the normalized iris
image as illustrated in Figure 4-5 of Section 4.2.4 of the previous chapter. More precisely, the
normalized iris image of size 64 512 is divided in 4 8 non overlapping regions, leading in 1024
quality measures. These values are then averaged to obtain a single value: the global quality GQ.
ii. Local quality-based fusion process
We also propose a novel scheme using the local quality measure (LQ) defined in Formula 4.7.
Our aim is therefore to take into account the fact that degradations can be different in diverse parts of
the iris image. This means that regions free from occlusions will contribute more in the reconstruction
of the fused image than regions with artifacts. In this case, we compute the quality measures of all the
sub-images as in the global quality-based fusion process but they are differently exploited. Instead of
averaging the qualities, we let them in the matrix form. This matrix is then bi-linearly interpolated in
the same way as the normalized iris image to create two entities of equal size. Finally, we weight the
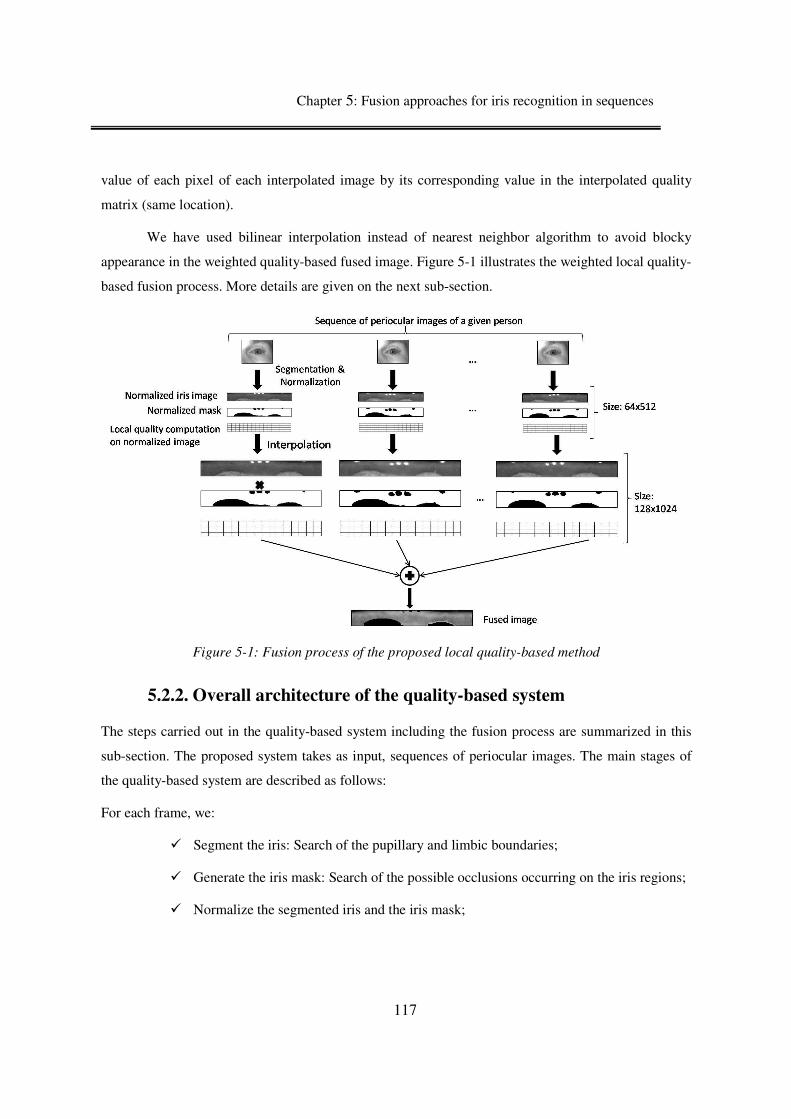
Chapter 5: Fusion approaches for iris recognition in sequences
117
value of each pixel of each interpolated image by its corresponding value in the interpolated quality
matrix (same location).
We have used bilinear interpolation instead of nearest neighbor algorithm to avoid blocky
appearance in the weighted quality-based fused image. Figure 5-1 illustrates the weighted local quality-
based fusion process. More details are given on the next sub-section.
Figure 5-1: Fusion process of the proposed local quality-based method
5.2.2. Overall architecture of the quality-based system
The steps carried out in the quality-based system including the fusion process are summarized in this
sub-section. The proposed system takes as input, sequences of periocular images. The main stages of
the quality-based system are described as follows:
For each frame, we:
Segment the iris: Search of the pupillary and limbic boundaries;
Generate the iris mask: Search of the possible occlusions occurring on the iris regions;
Normalize the segmented iris and the iris mask;

Chapter 5: Fusion approaches for iris recognition in sequences
118
Measure the local quality on the normalized image using the GMM already learned
given in formula 4.7,
Interpolate the normalized iris image and its local quality matrix to a double resolution
using the bilinear interpolation. The normalized mask is also interpolated by
performing nearest neighborhood algorithm instead of bilinear interpolation to avoid
real values in the mask.
Then, for all the frames, we generate the fused image as follows:
i. In the case of the global quality-based fusion process, the reconstructed HR image is
obtained as follows:
( )( ) ( )
( ))3.5(
,
,,
,
1
1
∑
∑
=
=
⋅
⋅⋅
=F
i
ii
F
i
iii
fused
QyxM
QyxMyxI
yxI
where is the total number of frames, ( , ) and ( , ) are the values of the pixel in position
( , ) of, respectively, the interpolated normalized image and mask. is a scalar which represents
the global quality of the image. corresponds to the weighted average of non-occluded pixels.
Each weight corresponds to the global quality of the iris image.
ii. In the case of the local quality-based fusion process, the reconstructed HR image is
obtained by the following formula:
( )( ) ( ) ( )
( ) ( ))2.5(
,,
,,,
,
1
1
∑
∑
=
=
⋅
⋅⋅
=F
i
ii
F
i
iii
fused
yxQyxM
yxQyxMyxI
yxI
where is the total number of frames, ( , ) and ( , ) are the values of the pixel in position
( , ) of, respectively, the interpolated normalized image and mask. ( , ) is the value in the
location ( , ) of the interpolated local quality matrix. corresponds to the weighted average
of non-occluded pixels. Each weight corresponds to the local quality of the pixel.
The last steps of the recognition process, namely feature extraction and matching, are
performed on the fused image. Note that from one video of frames, we get only one image
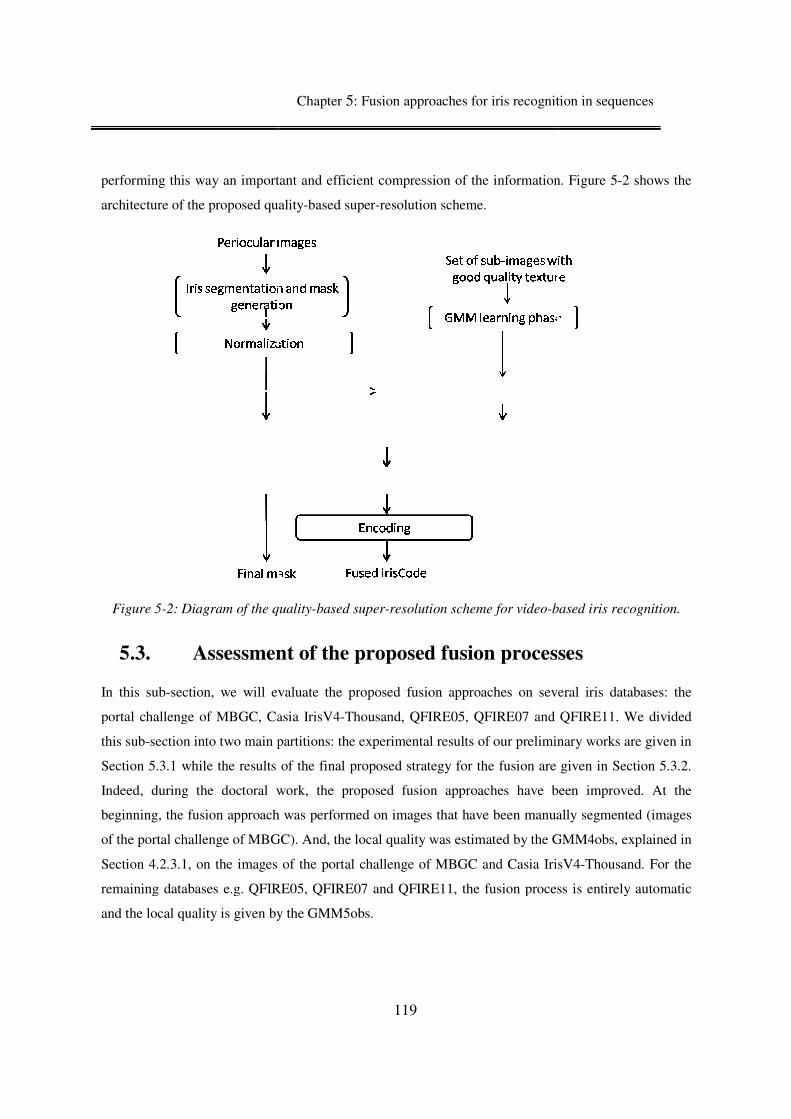
performing this way an important and efficient compression of the information.
architecture of the proposed quality
Figure 5-2: Diagram of the q
5.3. Assessment of the prop
In this sub-section, we will evaluate the proposed fusion approaches on several iris databases: the
portal challenge of MBGC, Casia IrisV4
this sub-section into two main partitions: the experimental results of our prel
Section 5.3.1 while the results of the final proposed strategy for the fusion are given in Section
Indeed, during the doctoral work, the proposed fusion approaches have been improved. At the
beginning, the fusion approach was performed on images that have been manually segmented (images
of the portal challenge of MBGC). And, the local quality was estimated by the GMM4obs, explained in
Section 4.2.3.1, on the images of the portal challenge of MBGC and Ca
remaining databases e.g. QFIRE05, QFIRE07 and QFIRE11, the fusion process is entirely automatic
and the local quality is given by the GMM5obs.
Chapter 5: Fusion approaches for iris recognition in sequences
119
an important and efficient compression of the information.
architecture of the proposed quality-based super-resolution scheme.
quality-based super-resolution scheme for video-based iris recognition.
Assessment of the proposed fusion processes
ection, we will evaluate the proposed fusion approaches on several iris databases: the
portal challenge of MBGC, Casia IrisV4-Thousand, QFIRE05, QFIRE07 and QFIRE11. We divided
section into two main partitions: the experimental results of our preliminary works are given in
while the results of the final proposed strategy for the fusion are given in Section
Indeed, during the doctoral work, the proposed fusion approaches have been improved. At the
beginning, the fusion approach was performed on images that have been manually segmented (images
e portal challenge of MBGC). And, the local quality was estimated by the GMM4obs, explained in
, on the images of the portal challenge of MBGC and Casia IrisV4
remaining databases e.g. QFIRE05, QFIRE07 and QFIRE11, the fusion process is entirely automatic
and the local quality is given by the GMM5obs.
Fusion approaches for iris recognition in sequences
an important and efficient compression of the information. Figure 5-2 shows the
based iris recognition.
osed fusion processes
ection, we will evaluate the proposed fusion approaches on several iris databases: the
Thousand, QFIRE05, QFIRE07 and QFIRE11. We divided
iminary works are given in
while the results of the final proposed strategy for the fusion are given in Section 5.3.2.
Indeed, during the doctoral work, the proposed fusion approaches have been improved. At the
beginning, the fusion approach was performed on images that have been manually segmented (images
e portal challenge of MBGC). And, the local quality was estimated by the GMM4obs, explained in
sia IrisV4-Thousand. For the
remaining databases e.g. QFIRE05, QFIRE07 and QFIRE11, the fusion process is entirely automatic

Chapter 5: Fusion approaches for iris recognition in sequences
120
For all the databases, our test protocol rely on the comparison of a sequence against a
sequence, like in the first popular work on signal-fusion in iris recognition [162].
5.3.1. Preliminary works
In the first experiments performed during this thesis, the proposed fusion schemes have been evaluated
on two challenging databases: the portal challenge of MBGC and Casia IrisV4-Thousand. The images
of the first one suffer from poor resolution and blur. The images of the second database are better in
terms of quality but they are considered as difficult to segment due to the spots on the boundaries of the
pupil and the iris and the presence of eyeglasses. In this way, we can show the interest of our fusion
scheme for two distinct problems for iris recognition, which are the very low quality of the images
resulting from an acquisition at a distance and on the move, and the wrong segmentation of the iris.
5.3.1.1. Multiple biometric Grand Challenge: Portal dataset
At the beginning of our doctoral research, we have addressed the problem of iris recognition at a
distance and on the move. To benchmark the proposed fusion schemes, we have chosen the portal
challenge of MBGC database. As presented in Chapter 2, the database contains NIR face videos of
subjects, walking towards a portal. However, as described in the previous sub-section, our quality-
based system has as input a sequence of periocular images. Therefore, we first have to detect and track
the eyes in the video sequence. In general, the tracking is guided by the presence of spots that are
located around the eyes.
After that, highly blurred frames from the sequence were removed by using wavelet’s
transformation. Once this stage has been completed, the fusion process requires the usual iris
segmentation and normalization of the images as seen in Section 5.2.2.
Iris segmentation on this database is considered to be a challenging task for many reasons.
One of the difficulties present in the images lies in the fact that light spots often occlude the pupillary
boundary. Consequently, the shape of the iris becomes irregular which disturbs segmentations based on
a detection of a specific parametric shape such as circles or ellipses. The other difficulty consists in the
change of illumination between the different frames in the same sequence, resulting in dark and bright
iris images. Consequently, the images suffer from low contrast, and thus the segmentation becomes
very tricky.

Chapter 5: Fusion approaches for iris recognition in sequences
121
All these factors appear during the acquisition in non ideal conditions. However, the iris
recognition systems that have been presented in Chapter 3 namely OSIRISV2 and OSIRISV4.1 have
been developed in the context of still images, taken from static subjects in restrictive conditions of
acquisition. More precisely, their parameters have been defined and set up according to ICE2005
database in order to work well on it. Consequently, their performance cannot be optimal on other
databases, acquired in a different scenario (sensor, environment...).
As pointed in Chapter 1, our goal is to propose a fusion scheme, aiming at reducing the high
error rate of the overall performance system in less constrained acquisition, caused by the degradations
of the images, whether the segmentation is accurate or not. However, the quality of MBGC images is
so poor that no version of OSIRIS was able to perform at least one acceptable segmentation per video.
The fact that several aberrant segmentations occur in a sequence is critical for the further processing
steps, making those images of the sequence not exploitable whatever the fusion process used. Indeed
the segmentation task aims at providing a model of the iris boundaries, used to achieve the
normalization step. The normalized images of the sequence are then used as input to perform the fusion
procedure. If that input is completely aberrant, there is no chance to improve the performance. Figure
5-3 illustrates an example of correct and aberrant segmentations and the corresponding normalized
images for a given iris.
Figure 5-3: Illustration of correct (in green) and aberrant (in red) segmentations and the
corresponding normalized images for a given iris.
Since none of the segmentation modules of the different OSIRIS versions satisfies this
requirement on the portal challenge of MBGC database, we performed a manual segmentation of the
iris boundaries. Those borders are modeled by two circles, which fit at best the pupillary and limbic
boundaries, manually determined. According to these circles, the normalized image is obtained with
the Daugman rubber sheet, coded in the normalization module of OSIRISV4.1. The possible

Chapter 5: Fusion approaches for iris recognition in sequences
122
occlusions are detected through an adaptive filter applied on the normalized images [104]. The further
steps namely feature extraction and template matching are also performed by OSIRISV4.1.
After all these pre-processings, the database was composed of 108 subjects and each one
possesses 2 sequences with at least 4 frames per sequence. For each person, we used the first sequence
as a target and the second one as a query.
Experimental results and discussions:
The proposed approach is first compared to other fusion score methods such as Multi-Gallery
Simple-Probe (MGSP), Multi-Gallery Multi-Probe (MGMP) and then to fusion signal methods as
simple averaging of images [162] and finally weighted super-resolution as done in [54].
i. Fusion at the score level:
As a first step, we performed different score-fusion methods:
• Matching 1 to 1: All the frames in the video of a person are considered as independent
images and used for performing inter-class and intra-class comparisons. This system
was used as a baseline system to compare the other methods.
• Matching N to 1: Multi-Gallery, Simple-Probe (MGSP): In this case, the different
images in the video are considered dependent as they represent the same person. If the
number of samples in the gallery and the probe are respectively N and 1 per person, we
get N Hamming distance scores which can be combined by making a simple average
[92] or the minimum of all the scores [160].
• Matching N to M, Multi-Gallery, Multi-Probe (MGMP): In this case, we consider M
images in the probe and N images in the gallery. We thus get scores per person
and combine them by taking the average or the minimum.
The performances of these score-fusion schemes on the portal of MBGC are reported in Table 5-1.
The best score’s fusion scheme reduces the Equal Error Rate (EER) from 14.32% to 4.66%.
This indicates that recognition performance can be further improved by the redundancy brought by the
video. However, the corresponding matching time considerably increases when the recognition score is
calculated for comparisons.

Chapter 5: Fusion approaches for iris recognition in sequences
123
Table 5-1: Equal error rate on the portal challenge of MBGC for different score's fusion schemes.
Methods EER (in %)
Baseline: 1 to 1 14.32
Minimum Average
MGSP 9.30 10.27
MGMP 4.66 5.65
ii. Fusion at the signal level:
• Without a quality measure:
At first, the fusion of images is done without using the quality measure. For each sequence, we
create a single image by averaging the pixels intensities of the different frames of such a sequence. We
experimented two cases: without and with interpolated images (SR). In the first case, we wish to
demonstrate the eventual improvement brought by a simple fusion scheme. This scheme of fusion is
called "SA". The second one allows us to quantify the impact of the super-resolution on the results. We
named this fusion scheme "SR-NoQ". The EERs of these two methods are reported in Table 5-2.
The results shows that the fusion method based on the interpolation of images before averaging
the pixel intensities, outperforms the simple average method with a relative improvement of 25.30% at
the EER functioning point. This result is coherent with Nguyen’s results which states that super-
resolution greatly improves recognition performance [54].
Table 5-2: Equal error rate on the portal challenge of MBGC for different image‘s fusion methods
without using quality.
Strategy of signal fusion EER (in %)
SA 4.90
SR-NoQ 3.66
By observing Table 5-1 and Table 5-2, we see that the MGMP-min method is slightly better
than the simple average (4.66% vs 4.9%). These results are coherent with those obtained by
Hollingsworth et al in [162]. However, as explained in their work, the required processing time is much
lower for image’s fusion than score’s fusion (17.09 seconds vs. 1008.9 seconds).

Chapter 5: Fusion approaches for iris recognition in sequences
124
• With a quality measure: Global or local
Given the considerable improvement brought by the interpolation, we decided to perform our
further experiments only on SR images. We introduce in the fusion, the global quality (GQ) and local
quality (LQ) fusion schemes, as described in Section 5.2.1.2. These two signal fusion methods are
respectively called "SR-GQ" and "SR-LQ". The Equal Error Rate of all methods is shown in Table 5-3
and the DET-curves of these methods are shown in Figure 5-4.
As reported in Table 5-3, introducing our global quality criterion in the fusion gives a high
relative recognition improvement (25.95% at the EER) compared to when no quality is considered. Our
method is in agreement with Nguyen’s result [165] who obtains an improvement of 11.5% by
introducing his quality measure (but with another evaluation protocol). Compared to his method, our
quality is simpler to implement. Indeed, the metric employed by Nguyen for estimating the quality of a
given frame includes four independent factors: focus, off-angle, illumination variation and motion blur.
After calculating individually each of these quality scores, a single score is obtained with the
Dempster-Shafer theory [165]. Our quality measure has the advantage of not requiring an extra strategy
of combinations neither knowing in advance the possible nature of the degradation.
Table 5-3: Equal error rate on the portal challenge of MBGC for different image‘s fusion methods
with and without quality measures.
Strategy of signal fusion EER (in %)
SR-NoQ 3.66
SR-GQ 2.71
SR-LQ 2.58
By incorporating our GQ measure in the fusion process, the contribution of each frame in the
fused image will be correlated to its quality, this way more weight is given to the high quality images.
Table 5-3 also shows that LQ-based fusion method outperforms the GQ-based fusion method
with a relative improvement of 4.79% at the EER. This is due to the fact that the quality in an iris
image is not globally identical as we expected. Indeed, due for example to motion blur, a region in an
iris image can be more textured than another one. Moreover, our LQ measure can detect eventual
errors of masks and assign them a low value. The LQ-based fusion scheme allows therefore a more
accurate weighting of the pixels in the fusion scheme than the GQ-based method.

Chapter 5: Fusion approaches for iris recognition in sequences
125
Figure 5-4: DET-curves of the three image’s fusion approaches for MBGC portal videos.
Conclusions
We have proposed two novel contributions for implementing image fusion of frames extracted
from videos of moving persons with the aim of improving the performance in iris recognition. Our
main novelty compared to the literature is the introduction in the fusion scheme, at the pixel-level, of a
local quality (LQ) measure relying on a GMM estimation of the distribution of a clean iris texture. This
LQ measure can also be used for giving a global quality (GQ) measure of the normalized iris image.
We have shown on the MBGC database that the LQ-based fusion allows a high improvement in
performance compared to other fusion schemes (at the score or image level) and to our GQ-based
fusion. We therefore conclude that the quality in an iris image is not globally identical: indeed, due for
example to motion blur, a region in an iris image can be more textured than another one. Our intuition
is that LQ measure can detect eventual errors of masks and assign them a low value. The SR-LQ based
fusion scheme allows therefore a more accurate weighting of the pixels in the fusion scheme than the
SR-GQ method.
As the segmentation was done manually, the segmented images do not contain errors of
segmentation. However, if this procedure is replaced by an automatic one, we expect a large number of
errors of segmentation, caused by less constrained acquisition. Our intuition is that our local quality
measure should be able to detect those errors and that our system will therefore be able to discard those
bad-segmented pixels from the fusion procedure. If this is the case our fusion procedure should not
suffer too much from segmentation errors. Our future works will tend to validate this hypothesis by
using a bigger iris database: Casia IrisV4-Thousand on which segmentation errors will be present.

Chapter 5: Fusion approaches for iris recognition in sequences
126
After this preliminary work, we note that we did not re-benchmark the approaches on MBGC
portal with an improved automatic segmentation algorithm as the interest for this database by research
community has considerably decreased over the time. Therefore, we preferred to use more recent iris
datasets.
5.3.1.2. CASIA-IrisV4-Thousand
In complement to the work developed on MBGC, we have studied the impact of possible inaccurate
segmentations in the proposed fusion process. This aspect cannot be previously studied due to the
manual segmentation. Casia IrisV4-Thousand includes 20000 iris images from 2000 eyes of 1000
persons. Thus, each subject has 10 instances of both left and right eye. We have selected randomly 600
subjects. The resolution of the images is higher than in MBGC portal. The main sources of variations
in this database are eyeglasses, specular reflections and dilation (see Chapter 2), which make the iris
segmentation particularly difficult. For each person, several images are taken under different
conditions, but there are at least some images of "good quality". This way, the automatic segmentation
is not aberrant for all the images in a given sequence. Even if errors may occur, possible improvement
can be obtained by the fusion approaches.
To perform the segmentation step, we used the OSIRISV2 reference system described in
Section 3.2.1. As mentioned, the segmentation is based on Hough transform and active contour. This
version has been improved in the latest version but, as our purpose is to show the impact of using a
local quality measure in the fusion process when the segmentation of the iris fails, we decided to use
the second version, which leads to more cases of wrong segmentation. For instance, Figure 5-5
illustrates two examples of segmentation: a good (Figure 5-5-a) and a wrong (Figure 5-5-b) and their
corresponding normalized image and local quality matrix.
On Figure 5-5-b, we can see a part of the sclera on the normalized iris image. This is due to the
wrong localization of the boundary between the iris and the sclera. When fusing the iris images, this
zone which does not correspond to iris texture will degrade the results. Therefore, we should give to
this zone less importance in the process of fusion. To do this, we will fuse the normalized iris images
using their local quality matrices. This way, dark areas of this matrix, which correspond to low quality
zones (zones not belonging to the iris region), will therefore contribute less in the fusion than bright
ones. Therefore, the local quality can be considered as a real valued mask.

Chapter 5: Fusion approaches for iris recognition in sequences
127
Normalized iris image
Local quality matrix
(a)
Normalized iris image
Local quality matrix
(b)
Figure 5-5: Examples of two different segmentations on the same eye: (a) Good segmentation and
corresponding normalization, (b) Wrong segmentation, and their corresponding normalized iris image
and local quality matrix.
Apart from this undesirable effect, a bad localization of the borders of the irises also introduces
some disparities in the normalized iris images and therefore two images from the same eye can lead to
two normalized images in which two points with the same coordinates do not correspond to the same
texture. This effect is illustrated in Figure 5-5. The two points A and B correspond to the same part of
the observed iris. However, due to the wrong segmentation, they are not well aligned (Point A is below
Point B). Our proposed quality-based fusion process does not take this effect into account.
For each subject, we divided arbitrary the ten instances into two equal parts: we used five
images as a target sequence (references) and the rest as a query sequence (test).
Experimental results and discussions:
As done on MBGC portal, several experiments have been conducted on Casia IrisV4-Thousand
database. We performed both score-fusion and signal-fusion methods.
Sclera
Point A
Point B

Chapter 5: Fusion approaches for iris recognition in sequences
128
i. Fusion at the score level:
We first analyzed the impact of score-fusion methods on recognition performance following
the three previously defined protocols: Matching 1 to 1 (baseline: 1 to 1), Matching N to 1 (MGSP),
and Matching M to N (MGMP). In this case, N and M are equal to 5. The recognition performance at
the EER is given in Table 5-4.
Table 5-4: Equal error rate on CASIA-IrisV4-Thousand for different score's fusion schemes.
Methods EER (in %)
Baseline: 1 to 1 23.82
MGSP 9.98
MGMP 6.29
ii. Fusion at the signal level:
We also analyzed the impact of image fusion methods considering only the case of interpolated
images (SR-NoQ). Recognition performance is computed by comparing the obtained fused test image
to the obtained fused reference image. This protocol is close to the MGMP one: in both scenarios, we
assume dependency between the reference images and the test images. Recognition performance
results are reported in Table 5-5 and the DETs are given in Figure 5-6.
We first observe, as expected, that the results are highly improved thanks to the fusion of the
scores. A relative improvement of 56.16% is observed considering the scenario 5-1 (MGSP) and of
73.56% considering the scenario 5-5 (MGMP), compared to the scenario 1-1.
Table 5-5: Equal error rate on the CASIA-IrisV4-Thousand for different image‘s fusion methods
Strategy of signal fusion EER (in %)
SR-NoQ 5.48
SR-GQ 4.86
SR-LQ 5.54
When comparing the results reported in Table 5-4 and Table 5-5, we notice that all the images
fusion methods outperform the best obtained score-fusion (EER= 6.29%). This interesting result points

Chapter 5: Fusion approaches for iris recognition in sequences
129
out the contribution of the fusion at the image level compared to the fusion at the score level that is
high time consuming.
Figure 5-6: DET-curves of the three image‘s fusion approaches for CASIA-IrisV4-Thousand
We also notice in Table 5-5 that the best performance is obtained when the global quality is
considered in the images fusion (SR-GQ, EER=4.86%), while the result at the EER functioning point
with the local quality (SR-LQ) is the worst one. To refine this analysis, we plotted in Figure 5-7 the
DET curves of the different image fusion methods at low FAR. We observe that at FAR values lower
than 1%, the local quality-based system leads to a significant improvement in terms of recognition
performance compared to the global quality-based system and to the case when no quality is
considered. Indeed at FAR= 0.1%, FRR=33.3% with the local quality measure while FRR=39.5% with
the global quality measure and FRR=41.2% when no quality is considered. This is an interesting result,
as low FAR values are often considered in the iris recognition framework, when high security is
demanded.

Chapter 5: Fusion approaches for iris recognition in sequences
130
Figure 5-7: DET-curves (at low FAR) of the three image‘s fusion approaches for CASIA-IrisV4-
Thousand.
Conclusions:
As was the case with MBGC portal, the experimental results on Casia IrisV4-Thousand
database also show a big improvement thanks to the use of image fusion for the references and test
sets. While the LQ-based image fusion does not bring any improvement at the EER functioning point
compared to the global quality schemes, it is very efficient at low FAR values. Despite the wrong
segmentations (obtained by OSIRISV2), the local quality was able to improve the recognition
accuracy. These results confirm our intuition that the LQ is able to detect segmentation errors in the
normalized images. By assigning small values to those regions (pixel badly segmented), the
reconstructed HR image is of better quality.
The good results that we obtained by performing the local quality-based fusion of sequences of
multiple still images from Casia IrisV4-Thousand (which present intra-variability and therefore
segmentation defaults) and videos of very low quality from MBGC portal (manually segmented, hence
no segmentation errors) make us optimistic in the overall performance of an automatic system in the
context iris recognition in less constrained environment.
5.3.2. Final model tested on QFIRE databases
Subsequently during the thesis, we wanted to investigate the behaviour of our fusion approaches in the
context of a scenario where the acquisition is performed at different distances. Meanwhile, a new
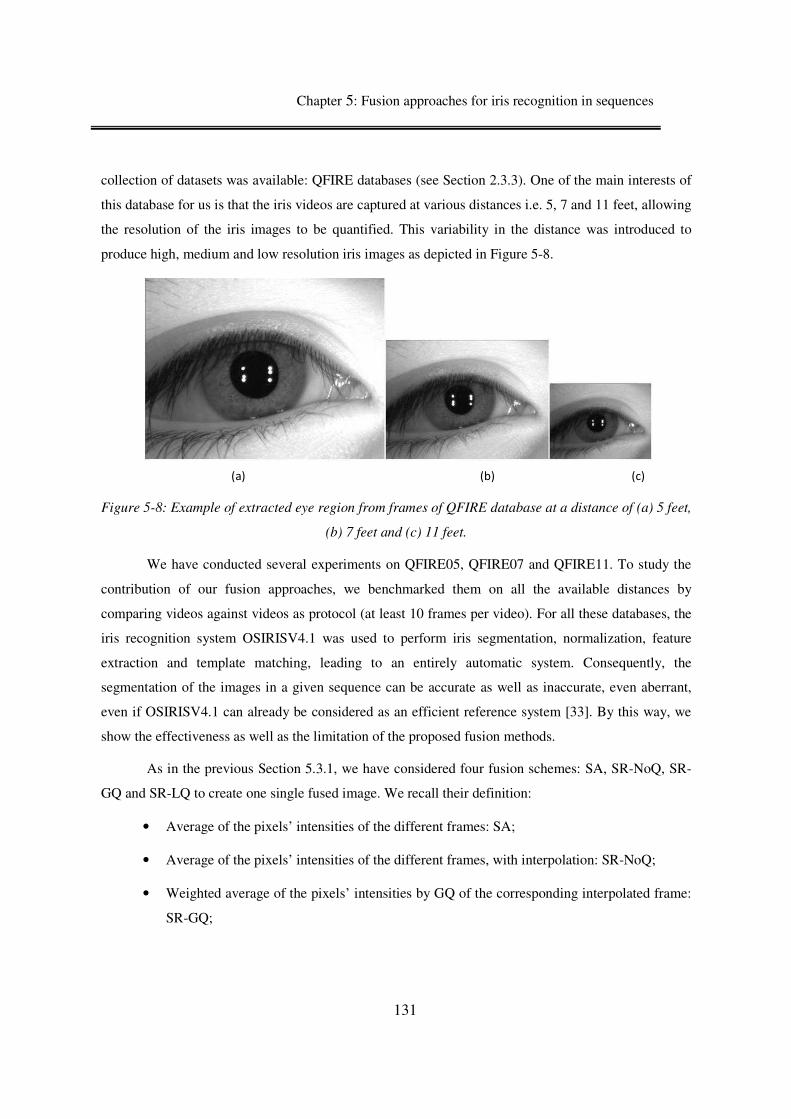
Chapter 5: Fusion approaches for iris recognition in sequences
131
collection of datasets was available: QFIRE databases (see Section 2.3.3). One of the main interests of
this database for us is that the iris videos are captured at various distances i.e. 5, 7 and 11 feet, allowing
the resolution of the iris images to be quantified. This variability in the distance was introduced to
produce high, medium and low resolution iris images as depicted in Figure 5-8.
(a) (b) (c)
Figure 5-8: Example of extracted eye region from frames of QFIRE database at a distance of (a) 5 feet,
(b) 7 feet and (c) 11 feet.
We have conducted several experiments on QFIRE05, QFIRE07 and QFIRE11. To study the
contribution of our fusion approaches, we benchmarked them on all the available distances by
comparing videos against videos as protocol (at least 10 frames per video). For all these databases, the
iris recognition system OSIRISV4.1 was used to perform iris segmentation, normalization, feature
extraction and template matching, leading to an entirely automatic system. Consequently, the
segmentation of the images in a given sequence can be accurate as well as inaccurate, even aberrant,
even if OSIRISV4.1 can already be considered as an efficient reference system [33]. By this way, we
show the effectiveness as well as the limitation of the proposed fusion methods.
As in the previous Section 5.3.1, we have considered four fusion schemes: SA, SR-NoQ, SR-
GQ and SR-LQ to create one single fused image. We recall their definition:
• Average of the pixels’ intensities of the different frames: SA;
• Average of the pixels’ intensities of the different frames, with interpolation: SR-NoQ;
• Weighted average of the pixels’ intensities by GQ of the corresponding interpolated frame:
SR-GQ;

Chapter 5: Fusion approaches for iris recognition in sequences
132
• Weighted average of the pixels’ intensities by their corresponding values in the interpolated
quality matrix LQ of the corresponding interpolated frame: SR-LQ.
For each fusion scheme, instead of presenting only the estimated FRR@FAR=0.001, we also
give the 90% confidence interval. This allows better assessment and comparisons between the fusion
methods. The confidence interval is based on a bootstrap methodology, which consists in sampling
randomly the individual of the database with replacement such as explaining in [191].
The experiences are organized as follows. First, we propose to show the contribution of the
fusion (SA) compared to other schemes, which do not apply fusion (Section 5.3.2.1). Second, we
propose to study the contribution of the super-resolution without introducing any quality in the fusion
process (Section 5.3.2.2). Finally, we evaluate the impact of quality by implementing SR-GQ and SR-
LQ fusion processes. GQ quality can also be used to select the best images of a sequence. A
comparison between these two cases (selection and fusion) was also conducted to determine the best
strategy of fusion (Section 5.3.2.3) according to the resolution of the images.
5.3.2.1. No fusion vs. simple average fusion
In this section, we first want to give an estimation of the improvement that can be brought by fusion as
compared to 1 to 1 matching schemes. Contrary to what we did in our preliminary works (Section
5.3.1), we did not implement any score-fusion algorithms, as they are computationally costly. We will
compare the simple fusion scheme SA to the following basic schemes, which consider only the
matching of two images of the video at a time:
• Matching 1 to 1: All the frames in the video of a person are considered as independent
images and used for performing inter-class and intra-class comparisons. This system
was used as a baseline system to compare the other methods.
• Matching Best to Best: For each video, only the image with the highest quality is
considered for performing inter-class and intra-class comparisons. The quality is
computed by the global quality given by GMM5obs previously explained in Chapter 4.
There is no fusion in this case.
We compare these methods to the simplest fusion scheme without introducing image quality:
SA. We note that all the frames of the sequence are used in the fusion scheme (ten frames). The
performance results of these methods are reported in Table 5-6.

Chapter 5: Fusion approaches for iris recognition in sequences
133
Table 5-6: FRR@FAR=0.001 on QFIRE databases for 1 to 1, Best to best, and SA.
Methods QFIRE05 QFIRE07 QFIRE11
Baseline: 1 to 1 24.3% 34.12% 52.65%
Best to Best 8.0% 15.0% 16.38%
SA 4.18% [4.04-4.20] 10.0% [9.71-10.06] 12.62% [11.03-12.75]
As shown in Table 5-6, the SA fusion scheme reduces the FRR@FAR=0.001 for all the
databases. This indicates that recognition performance can be further improved by the redundancy
brought by the videos. Moreover, SA scheme outperforms the Best to Best scheme: SA reduces the
FRR@FAR=0.001 by 47.72%, 33.33% and 22.92% respectively for the datasets QFIRE05, QFIRE07,
and QFIRE11.
5.3.2.2. Impact of the acquisition distance on the super-resolution
improvement
In this part, we would like to analyze the contribution of the super-resolution without
introducing any quality measures (SR-NoQ). For each sub-set QFIRE05, QFIRE07 and QFIRE11, we
perform the SA and SR-NoQ schemes on the same datasets of the previous section. We report in Table
5-7 the recognition performance at FRR@FAR=0.001.
Table 5-7: FRR@FAR=0.001 on QFIRE databases for the fusion schemes: SA, and SR-NoQ.
Signal fusions QFIRE05 QFIRE07 QFIRE11
SA 4.18% [4.04-4.20] 10.0% [9.71-10.06] 12.62% [11.03-12.75]
SR-NoQ 2.24% [2.24-2.25] 5.93% [5.91-5.97] 10.23% [9.62-10.34]
Table 5-7 shows that the fusion method based on the interpolation of images before averaging
the pixel intensities outperforms the simple average method with a relative improvement of 46.42%,
40.62%, and 18.91% at the FRR@FAR=0.001 point for resp. QFIRE05, QFIRE07, and QFIRE11. As
expected, the improvement due to the super-resolution decreases when the distance between the
camera and the subject increases. We note that for the dataset QFIRE11, the improvement significantly
drops. This may be explained by the fact that the iris videos are taken at a very long distance, therefore

Chapter 5: Fusion approaches for iris recognition in sequences
134
the images suffer more from blur at this distance as shown in Figure 5-8 and it is well known that the
super-resolution performs less well with blurred iris images [164].
Moreover, we notice that this sub-set QFIRE11 contains more segmentation errors than
QFIRE05 and QFIRE07. These segmentation errors are dramatic for the super-resolution for the reason
that they induce registration problems. Better performances could be expected for this dataset by
performing more accurate registration methods as usually employed in SR methods (i.e. phase
correlation).
5.3.2.3. Assessment of the global and local quality in the fusion
scheme
In this part, we investigate the contribution of the quality in the fusion process. The GQ can be used in
2 ways for:
Selecting the best images of the sequence. We call this scenario: "BestIm";
Weighting the different frames of the sequence. This scenario is called "AllIm".
In the following, below we compare the performance of a scheme where we first select the
optimal number of good quality images, which are afterwards averaged, to a scheme where all the
frames in the sequence (ten frames) are fused according to the global quality. Secondly, we also assess
the interest of a local fusion in both scenarios.
• BestIm scenario:
In "BestIm", we compare the SR-NoQ, and SR-LQ fusion schemes for various numbers of
frames ranked by their global quality GQ. Figure 5-9 shows the recognition performance at
FRR@FAR=0.001 of these fusion methods for each dataset QFIRE05, QFIRE07 and QFIRE11. We
have also plotted the SA scheme as the baseline fusion system.
We note that for QFIRE05, the FRR@FAR=0.001 tends to stabilize at 6 frames, without
degradation by adding frames of lower quality. However this is not the case of QFIRE07 and
QFIRE11: the FRR@FAR=0.001 decreases respectively until 4 and 6 frames and then increases
drastically by adding frames of lower quality. This fact confirms the well-known paradigm that fusing
images of bad quality degrades the performance in SR (SR-NoQ scheme). Moreover, these results

indicate that there are more images of good quality in QFIRE05 than in QFIRE07 and than in
QFIRE11. From Figure 5-9, we notice that despite the ranking of the images according to their glob
quality GQ, using the local quality LQ in the fusion allows an improvement in the performance,
especially when the number of frames exceeds the value 6 and this
Figure 5-9: FRR@FAR=0.001 for various numbers of best frames for SA, SR
• AllIm scenario:
In AllIm scenario, we perform two weighted fusion schemes of all the frames by the GQ and
the LQ which correspond respectiv
To compare this scenario with BestIm one, we report in
SR-NoQ of “BestIm” and the SR
corresponding SR-LQ schemes is given in
Chapter 5: Fusion approaches for iris recognition in sequences
135
e more images of good quality in QFIRE05 than in QFIRE07 and than in
, we notice that despite the ranking of the images according to their glob
quality GQ, using the local quality LQ in the fusion allows an improvement in the performance,
especially when the number of frames exceeds the value 6 and this is true for all the databases.
FRR@FAR=0.001 for various numbers of best frames for SA, SR-NoQ, and SR
schemes for each QFIRE dataset.
AllIm scenario:
In AllIm scenario, we perform two weighted fusion schemes of all the frames by the GQ and
the LQ which correspond respectively to the SR-GQ and SR-LQ schemes.
To compare this scenario with BestIm one, we report in Table 5-8 the best performances of the
NoQ of “BestIm” and the SR-GQ of “AllIm”. In addition, the FRR@FAR=0.001 of the
LQ schemes is given in Table 5-8 for both scenarios.
Fusion approaches for iris recognition in sequences
e more images of good quality in QFIRE05 than in QFIRE07 and than in
, we notice that despite the ranking of the images according to their global
quality GQ, using the local quality LQ in the fusion allows an improvement in the performance,
is true for all the databases.
NoQ, and SR-LQ fusion
In AllIm scenario, we perform two weighted fusion schemes of all the frames by the GQ and
the best performances of the
“AllIm”. In addition, the FRR@FAR=0.001 of the

Chapter 5: Fusion approaches for iris recognition in sequences
136
Table 5-8: FRR@FAR=0.001 on QFIRE databases for the fusion schemes SR-NoQ of scenario
BestIm and SR-GQ for scenario AllIm.
QFIRE05 QFIRE07 QFIRE11
Scenario BestIm AllIm BestIm AllIm BestIm AllIm
Number of frames 6 10 4 10 6 10
Use of the global
quality
2.54%
[2.39-2.55]
2.09%
[2.09-2.25]
4.37%
[4.09-4.40]
4.68%
[4.57-4.71]
3.07%
[2.73-3.10]
7.5%
[6.55-7.58]
Use of the local quality 2.24%
[2.24-2.25]
2.09%
[2.08-2.10]
4.37%
[4.08-4.40]
4.48%
[4.19-4.51]
2.04%
[2.05-2.06]
3.07%
[2.73-3.10]
By comparing Table 5-7 and Table 5-8, we can see that introducing the global quality GQ
criterion in the fusion gives a relative recognition improvement of 6.7%, 21.08%, and 26.69% at the
FRR@FAR=0.001 point for resp. QFIRE05, QFIRE07, and QFIRE11, in the scenario AllIm. The
improvement due to GQ is higher for QFIRE07 and QFIRE11 than for QFIRE05. This is due to the
fact that these two datasets contain images of poorer quality. By incorporating our GQ measure into the
fusion process, the contribution of each frame in the fused image will be correlated to its quality and in
this way more weight is given to the high quality images. This result is in agreement with the outcomes
of Table 5-3 and Table 5-5. Indeed, we obtained a significant improvement by introducing the GQ
quality in the fusion for MBGC portal and Casia IrisV4-Thousand databases.
From Table 5-8, we notice that for QFIRE05, the use of the GQ in the fusion method (SR-GQ
scheme of scenario AllIm) slightly outperforms the SR-NoQ of scenario BestIm. We conclude that
when dealing with good images of equal quality in the sequence, there is no important difference in the
performances between using the global quality inside the scheme for weighting all the images or
selecting only the best images for performing the fusion process. However, for QFIRE11, the
performances are better with a selection of the best images for the fusion than with a weighted fusion
scheme of all the images (3.07% with BestIm compared to 7.5% with AllIm at the FRR@FAR=0.001).
We deduce that low quality images, even if weighted by a low value, degrade the performance.
Concerning the use of the local quality as shown in Table 5-8,we observe that LQ does not
allow us to increase significantly the performance for QFIRE05 and QFIRE07 neither for BestIm nor
for AllIm. However, considering QFIRE11, we note an improvement with BestIm of 33.55% and an
even larger one of 59.07% for AllIm. This is due to the fact that the iris images are more difficult to
segment at this distance. Indeed, we assume that the LQ measure detects eventual errors of masks and

Chapter 5: Fusion approaches for iris recognition in sequences
137
segmentation and assigns them a low value. The LQ-based fusion scheme allows therefore a more
accurate weighting of the pixels in the fusion scheme than the GQ method.
In all cases, it is therefore interesting to use LQ in the fusion process, particularly since its use
doesn’t introduce extra complexity cost. In fact, we have to calculate the LQ to obtain the GQ (mean of
the LQ values) and GQ must be computed on the 10 frames in both BestIm and AllIm scenarios.
Moreover, the only difference between all the fusion schemes is in the weighting of the frames by
either 1, LQ or GQ values. Therefore all the schemes have a similar complexity.
Conclusion:
We have shown the efficiency of the proposed system through extensive experiments
performed on the challenging database QFIRE, which possesses videos acquired at various distances
(5, 7 and 11 feet). Our approach is based on simple SR techniques applied on the different frames of a
video, improved by taking into account some quality criteria.
We have tested two ways to use the GQ measure in the fusion process, one for weighting the
fusion schemes such as done in Section 5.3.1 and one for selecting the best images.
Firstly, we have shown that super-resolution improves significantly the performance of iris
recognition only when the images are of good quality. This is the case, when the fusion involves: (i)
images taken from short distances or (ii) only best images coming from long distances. We assume
that, thanks to the good quality of the images, there are fewer segmentation errors, and hence our
image registration scheme in the SR is appropriate.
Secondly, we have noticed that the proposed method based on the introduction of a local
quality in the super-resolution (SR-LQ approach) enhances the performance mostly when the quality of
the images decreases. For the short distances, we assume that, as the images are well segmented and
present no artifact on the iris area, introducing a local quality measure is not really necessary. For the
long distances, on the contrary, the SR-LQ fusion allows a high improvement in the performance. Our
explanation is that, at such distances, where many bad segmentations occur, the local quality measure
is able to detect the bad-segmented pixels and to discard them from the fusion procedure. This way, the
LQ weighted fusion procedure does not suffer too much from segmentation errors.

Chapter 5: Fusion approaches for iris recognition in sequences
138
5.4. Conclusion
In this chapter, we have proposed several novel contributions to the problem of iris
performance decrease due to degradations of the iris image, occurring when the acquisition is less
restrictive. Our approach is based on simple SR techniques applied on the different frames of a
sequence, improved by taking into account some quality criteria. Our main novelty is the introduction
in the fusion scheme, at the pixel-level, of a local quality LQ measure relying on a GMM estimation of
the distribution of a clean iris texture. This LQ measure can also be used to compute a global quality
GQ measure of the normalized iris image.
We have tackled two different situations, namely video sequences of low-resolution resulting
from an acquisition on the move (MBGC portal database) and sequences of multi-shot still images,
presenting variability and therefore segmentation defaults (Casia IrisV4-Thousand database). We have
also addressed the problem of video-based iris recognition at a distance (QFIRE databases).
To remedy to the degradation of the performance in such situations, we have proposed two
quality-based super-resolution fusion approaches. Extensive experiments on all the databases show that
the SR considerably reduces error rates. In addition, big improvement is obtained by the use of the
global quality. Moreover, the local quality-based fusion scheme further increases the performance due
to its ability to locally consider the different parts of the image and therefore to discard occluded
and/or poorly segmented pixels in the fusion process.
In the next chapter, we will test other fusion schemes at the bit-level (quantized feature) and
study the interest of quality criteria in this context.

Chapter 5: Fusion approaches for iris recognition in sequences
139

Chapter 6: Quality assessment at the bit-level
140
Chapter 6. Quality assessment at the bit-level
6.1. Existence of consistent/inconsistent bits in the irisCodes ............................................. 141
6.1.1. Related works .................................................................................................... 141
6.1.2. Synthesis and conclusion .................................................................................... 147
6.2. Integration of the local quality at the bit-level in the fusion process ............................. 148
6.3. Comparative evaluations............................................................................................. 153
6.3.1. Experiments and results ...................................................................................... 153
6.3.2. Discussion and conclusions ................................................................................ 156
6.4. Conclusion ................................................................................................................. 157

Chapter 6: Quality assessment at the bit-level
141
s seen in the literature review of the previous chapter, fusion schemes can be performed at
different levels. Recent approaches tend towards proposing approaches based on irisCodes
[41] [169]. A particular attention has been devoted to the reliability of the bits in the
irisCodes. Indeed, since several years, state-of-the-art has shown that sub-parts in these binary codes
are more stable than others. This phenomenon is called consistent/inconsistent bits, also known under
the name of fragile bits. A bit is fragile if its values changes across different acquisitions of the same
iris. Therefore, integrating quality measures at this level in order to individually consider the reliability
of each bit can be useful in the fusion scheme to enhance the performance of the recognition.
In Chapter 5, we have demonstrated the effectiveness of our local quality-based fusion scheme
at the pixel-level on several challenging databases. However, at this point, a legitimate question can
arise: Is it the best level to incorporate quality measures in a given fusion process? Moreover, can we
perform a fusion scheme at the bit-level like recent works tend to, and obtain the same level of
performance as what we obtained at the pixel-level? In this chapter, we will try to investigate these
issues by conducting a simple comparative study between diverse fusion schemes. We will see the
advantages and limitation of these approaches.
To understand the existence of fragile bits that appears in sub-parts of the irisCode, a literature
review is related in Section 6.1. We will see several manners to exploit the consistence of the bits for
improving recognition rate. Section 6.2 describes the proposed method that integrates a local quality
measure, relying on a GMM model as presented in Chapter 4, at the bit-level. Finally, this proposed
method and other fusion schemes implemented in the state-of-the-art are benchmarked on the
challenging collections of QFIRE database, in order to answer these two questions:
• At which level quality assessment should be inserted?
• At which level the fusion should be performed in order to achieve best performance?
The results are given in Section 6.3.
6.1. Existence of consistent/inconsistent bits in the irisCodes
6.1.1. Related works
The existence of "fragile" bits was first formalized by Bolle et al. [192]. The authors noted that the
empirical FRR was notably better than predicted by their theoretical model. They deduced that bits in a
A

Chapter 6: Quality assessment at the bit-level
142
given irisCode are not equally predisposed to flip (0 to 1 or 1 to 0) across different acquisitions of the
same iris.
This was further investigated by Hollingsworth et al. in the well-know work [108] in 2009.
Indeed, a bit in an irisCode is considered as fragile (or inconsistent) if there is significant probability of
it ending up to 0 for some images of the iris and 1 for other images of the same iris. The existence of
fragile bits was empirically shown on a subset of ICE database. A careful procedure has been followed
to select the images of this subset: they are mostly un-occluded by eyelids and eyelashes. Moreover,
only images with correct segmentation are kept. This process was done according to visual inspection.
Several images for a given iris are selected: they represent the intra-class images. For each class, the
corresponding irisCodes are created by using both 1D log-Gabor and multiple sizes of 2D Gabor
filters. Then, the irisCodes are correctly aligned to an arbitrary one. All these considerations are carried
out in order to conduct a study on irisCodes with less imperfection as possible. We recall that irisCodes
are obtained by a coarse quantization of the complex number’s phase in one of the four quadrants (see
Figure 3-2). Several conclusions were derived from the experimental results:
The middle bands of the iris contain more consistent bits that inner bands contrary to
previous investigations that had been conducted in the literature [76] [193].
The existence of fragile bits appears for both genders and with different type of filters
for encoding the irisCode. Fragile bits come from the filter responses near quantization
boundaries. Indeed, small changes in the complex number near the axes can induce
quadrant switch. The authors noticed that larger filters lead to fewer fragile bits than
smaller ones. Therefore, the fragility of a bit totally depends on the encoding
algorithm.
Fragile bits are invariant to blur noise in the iris images. This result is coherent with
Bolle's work [192].
Outlier values of complex numbers correspond to specular reflections in the original
iris image.
Masking fragile bits can reduce the FRR in a given iris recognition system.
Extended experiments have been carried out in [194] on their intern iris database. A new
metric called Fragile Bit Distance (FBD) has been defined to improve the accuracy of the matching. It
measures how well two fragile bit patterns are aligned. To identify the fragile bits, the real parts of the

Chapter 6: Quality assessment at the bit-level
143
complex number are first sorted. Then, according to Daugman's suggestion3, the lowest quartile of
values is considered as inconsistent bits (25%). The same procedure is done for the smallest imaginary
values. Only un-occluded bits are taken into consideration. In fact, this method is not sufficient to
detect bits coming from occlusions regions. Therefore, the mask given by the segmentation is still
used. Given two irisCodes A and B, the FBD is computed as follows:
( )1.6)(
BA
BABA
mm
ffNOTmmFBD
∩
∩∩∩=
where ∩ is the AND operators. ∩ represents a matrix containing the masked bits for fragility,
while ∩ is a matrix that is composed of occluded bits. The result of the formula is a scalar
value and represents the ratio of un-occluded bits masked for fragility in the comparison.
The results show that when this FBD measure is combined to the standard Hamming distance
by multiplication, better performance are achieved than using solely Hamming distance. The EER is
significantly reduced from 0.87 % to 0.79%.
In another way, the concept of reliable bits was used to reduce the number of bits needed for
iris recognition. In [195], Dozier and al. proposed to reduce the number of irisCodes’ bits by a factor of
30% without degrading the accuracy of the recognition (without increasing the FRR). The proposed
method is jointly based on a genetic search and bits inconsistency in order to only select the most
reliable bits of the irisCode. Ten intra-class irisCodes are used in the training stage for generating their
corresponding fragile bit masks. The method was tested on a subset of ICE2006 database. Iris
boundaries are automatically detected by two circles, while the eyelids and eyelashes were manually
segmented in order to obtain good segmentations at the end.
In [196], Rathgeb et al. suggested a selective bits method for iris recognition. The approach is
able to extract the most discriminative bits coming from two irisCodes that have been created by two
different algorithms. The resulting irisCode is smaller than both individual templates. The selection is
based on a reliability mask that provides the stability of each bit with respect to genuine and impostor
comparisons for a given algorithm. The reliability at each bit position is defined as:
3 Personal communication between the authors and John Daugman. No reference is provided in the paper.

Chapter 6: Quality assessment at the bit-level
144
( ) ( ) ( )( ) ( )2.62/1 iPiPiR impostorgenuine −+=
where is is the probability of a bit-pair of being 0-0 or 1-1.
According to this mask, an ideal permutation of bit positions is extracted for each encoding
algorithm and applied to sort the bits of the irisCodes: first bits are considered as more reliable than last
ones. Based on this information, for each algorithm the last half bits of each irisCode is removed. The
new template is thereby the result of the concatenation of the two best half parts of bits of the two
algorithms. The experimental results show an improvement of 0.37% at the EER operating point
compared to the concatenation of the two initial irisCodes. The proposed method provides a trade-off
between accuracy and processing time for recognition purpose. The approach was learned and tested
on a subset of good quality taken from CASIA-V3-Interval dataset.
Based on this reliability mask, in [197] Rathged et al. proposed this time an incremental
method to iris recognition (identification mode) by rejecting in an early stage unlikely matches. More
precisely, partial bit comparisons of the probe with each gallery are performed for a given window
size. Most reliable bits are first compared thanks to the reliability mask. All the partial Hamming
distances are combined with the corresponding obtained Hamming distances from the previous
windows. For each iteration, templates of the gallery set with high combined Hamming distances are
rejected (dissimilarity score). The other ones are kept: they have better chance for belonging to the
correct claimed identity. The approach is benchmarked on the same good quality images as in [196].
For a same portion of bits compared between the probe and gallery, the proposed incremental approach
achieves a better identification rate than just comparing sorted irisCodes.
Gentile et al. [198] also suggested reducing the length of irisCodes by extracting highly
discriminatory regions. To this end, two analyses have been investigated on a training subset:
An analysis based on the Kolmogorov-Smirnov criterion is carried out to identify the
rows of the irisCodes that contain most discriminative information. It consists in
determining the capacity of each row in separating the genuine and impostor score
distributions. The middle band of the iris was found to contain higher information than
the inner and outer bands as shown in [108].
By estimating the correlation between the rows, high local correlations between nearby
irisCode rows have been pointed out. This phenomenon confirms Daugman's

Chapter 6: Quality assessment at the bit-level
145
observation in [13]: “Iris patterns such as furrow or ciliary tend to spread across a
significant radial distance in the iris, leading to radial correlations”.
These two facts were taken into consideration in order to reduce the size of the irisCode
compared to the initial one, without significant degradation in the performance. The approach was
validated on images of MMU dataset [199] that have been well segmented (visual verification). The
results show slight performance degradation between full length irisCodes (FLICs) and short length
irisCodes (SLICs). But, the overall recognition system operates faster with less required memory.
SLICs have been also used in [200] to accelerate the iris recognition process. First, based on
bits comparison between SLICs of the whole gallery and the probe, a short list of the top 10 candidates
from the gallery is proposed. Then, Hamming distances are calculated between FLICs of the probe and
of the short list instead of the entire gallery. Compared to Rathged's work [197], the inconvenient of
this approach arises when the correct identity to claim is not included in the short list and this cannot be
fixed in the later stage. This limits the true positive rate to approximately 93%.
Dong et al. [201] suggested a personalized iris-matching approach using a class-specific weight
map learned from the training images of the same iris class. The personalized weight map of class
denoted contains different weights. These values reflect the reliability of each bit in the iris
matching step. The stability of a bit is computed as follows:
( )( )3.6,12 012
01
20
21 nmmwith
mm
mmwi =+−
+
+⋅=
where, is the number of templates in the same class, and are respectively the number of time
that the bit is equal to 1 and 0.
The robustness of the personalized weight map depends on the number of intra-class training
samples. To obtain an effective map, a large number of training images per class is required, which
increases the computational cost.
For each class, a weight map is associated to the corresponding template in the gallery. It has
the following properties:
High values indicate more stable iris matching results than low values.
The weight map cannot replace the binary mask given by the segmentation. The
weights are not equal to zero in occluded regions.

Chapter 6: Quality assessment at the bit-level
146
A general weight map can be derived by averaging all personalized weight map. It
reflects the reliability of the matching results on different regions, statistically learned
by all iris classes of the database.
The proposed matching score strategy improves the traditional Hamming distance by
introducing the weighted map in the matching procedure. For instance, the matching score between a
probe B and a gallery A is obtained as follows:
( )( )4.6
A
ABAA
W
WIrisCodeIrisCodeHD
⋅⊕=
where ⨁ is the XOR operator, is the personalized weight map of the iris class .
This concept is similar to the "fragile bits" work of Hollingsworth [108]. Extensive
experiments on several databases have shown the improvement brought by the proposed matching
scheme compared to the traditional Hamming distance, especially in the case of poor-quality iris
images.
In [139], Chen et al. proposed a wavelet-based local quality metric that estimates the energy in
a given concentric band of the iris. Then, this local quality measure was incorporated in the Hamming
distance as follows:
( ) ( ) ( )
( ) ( )
( )5.61
1
1
∑
∑
=
=
×
⊕⋅×
⋅=L
i
Big
Aig
L
i
BAB
igA
ig
Weighted
EE
IrisCodeIrisCodeEE
LHD
ii
where and represent the bit in the irisCode A and irisCode B respectively,
of length L. ( ) is the index of the band that contains the bit of the irisCodes. ( ) and ( ) are
the associated local quality measures of the ( ) band in iris images A and B respectively.
According to formula 6.5, regions with high quality in both irisCodes contribute more in the
computation of the Hamming distance than regions of poorer quality. This weighted scheme is very
similar to Dong et al. and Hollingsworth et al. approaches.
The notion of fragile bits has been also observed in irisCodes computed from iris taken in
visible wavelength as shown in a more recent work [202].

Chapter 6: Quality assessment at the bit-level
147
6.1.2. Synthesis and conclusion
The concept of consistent/inconsistent bits has been addressed in several works of the literature as cited
before and the phenomenon was observed on several iris databases. In most works, the authors ensure
that the selected images are of good quality [108] [196] [197]. Moreover, the segmentation is verified
by visual inspection in order to keep only good segmented irises for benchmarking the proposed
method [108] [195] [198] [200]. In most of the works, a training phase is carried out to identify the
fragile bits by using intra-class variability [192] [198] [201] [200] or by considering both intra and
inter class data [196] [197] [202]. Several images per iris class are required to assess the reliability of
the bits. Extensive experiments in [108] and [201] have shown that the stability of the bits depends on
the encoding algorithm.
Those approaches can be categorized into 3 classes according to the strategy that was
employed to handle the inconsistent bits:
Creation of a binary quality mask [194].
Creation of a weighted quality mask [139] [201].
Reduction of the number of bits in the irisCodes by keeping the most discriminative ones
[195] [196] [197] [198] [200].
Only in the work of Dong et al. [201], the weighted Hamming strategy was tested on an iris
database that has been captured under less constrained conditions. However, the estimation of the
personalized weighted map requires a large number of images (20 images) for every iris class in the
gallery.
We note that all the cited works in the previous sub-section are evaluated by performing a
matching between two still iris images (matching: 1 to 1). Major approaches are tested on images on
good quality. These two facts are in disagreement with the video based recognition context that has
been addressed in this thesis.
However, this existence of consistent/inconsistent bits has inspired some researchers in
developing fusion approaches that integrate the reliability of the bits. Indeed, in recent works, some
authors proposed to fuse iris sequences at the bit-level (irisCode) [41] [169]. The reliability of each bit
in the irisCodes is taken into consideration in the fusion procedure in order to extract the most relevant
information. This idea is motivated by the concept that not all the bits are equally consistent as proven
in previous related works. For instance in [169], the proposed iris fusion is based on the reconstruction

Chapter 6: Quality assessment at the bit-level
148
of an optimized irisCode with a high number of reliable bits and a low number of inconsistent bits. In
another way, in [41], a weight mask which can measure the reliability of each bit in the reconstructed
irisCode, is used to compute weighted Hamming distances in the matching stage. Both works are
benchmarked only on high quality images, carefully selected by a quality assessment algorithm [169]
or manually checked [41].
In this chapter, we propose to introduce our previous local quality at the bit-level. We believe
that our measure is able to identify consistent bits in the irisCodes and hence able to enhance
recognition performance. Contrary to [41] and [169], we propose to use all the frames of the sequence
and not only high quality images. Indeed, as our main interest is to improve iris recognition in less
restrictive environment of acquisition, we decided to keep all the frames, including this way possible
low-quality images with eventual segmentation errors, corresponding to more realistic situations.
6.2. Integration of the local quality at the bit-level in the
fusion process
One way of integrating our local quality metric in the fusion process is to create a quality mask that
measures the reliability of each bit in an irisCode. There are two ways for exploiting this quality mask.
The first one consists in defining empirically a threshold for binarizing the real values of the
quality measures in order to generate a binary mask. Regions with lower qualities than the fixed
threshold would be masked. This mask is then combined to the mask that is obtained in the
segmentation stage. This final binary mask is incorporated in the computation of the Hamming distance
as was done by Hollingsworth et al. [194] as well as in Krichen's thesis [203].
The second case consists in introducing a weighted quality mask in the estimation of the
Hamming distance as performed in Krichen's thesis [203], as well as Chen et al. in [139] and Dong et
al. in [201]. Compared to a binary strategy, the weighted scheme has the advantage of taking into
consideration real values of local quality measures. In that way, the higher the quality of the region is,
the higher the contribution in the computation of the Hamming distance will be. There is no loss of
information compared to the binary strategy. Therefore, we decided to use this weighted scheme since
our goal is not to classify regions into iris and non-iris but to quantify the reliability of the bits.
If we consider a matching scenario based on a comparison between two single iris images A
and B, the weighted Hamming distance is computed as follows:

Chapter 6: Quality assessment at the bit-level
149
( ) ( )
( )( )6.6
1,
1,
∑
∑
=
=
×∩
×∩∩⊕
=L
i
BABA
L
i
BABABA
iiii
iiiiii
LQMM
LQMMIrisCodeIrisCode
HD
( )
=
∩=
strategyweightedifLQLQLQ
strategybinaryifLQBinLQBinLQwith
iiii
iiii
BABA
BABA
,,min
,
,
,
where and are the binary codes resulting from the feature extraction of the
normalized iris images A and B, and are the binary masks given by the segmentation stage of
iris A and B, and , is the local quality associated to the couple ( , ). L is the length of each
irisCode.
However as we deal with iris sequences and not single images, the Hamming distance given in
Formula 6.6 is not directly exploitable. Some modifications should be introduced to carry out a
matching based on a comparison between two iris sequences instead of two still images.
Proposed technique:
One way to perform a fusion scheme at the bit-level is to perform a weighted average by
multiplying the bits of each irisCode by their corresponding value from the local quality matrix. To this
end, we first have to segment and normalize each frame of the sequence. The iris features are then
extracted from each normalized iris image. Thereby, we obtain a series of different irisCodes. Then, a
weighted average is computed by multiplying each irisCode by its corresponding value from the local
quality matrix that is computed from the normalized iris image. A "fuzzy" irisCode with real values is
thus obtained. To establish a dissimilarly score based on the Hamming distance, we have to binarize
the values of this fused irisCode. To this end, a threshold should be fixed.
After several tested thresholds, the results of this fusion scheme were not promising. In
addition to that, this method has several drawbacks. The binarization of the fused irisCode requires a
certain threshold as explained before. This value is empirically fixed after several tests in order to
optimize the recognition rate. The threshold depends on the database. Moreover, this scheme demands
several additional operations compared to the fusion schemes we developed in the previous chapter at
the pixel-level: each normalized images coming from the sequence has to be encoded instead of only
encoding the fused normalized image.

Chapter 6: Quality assessment at the bit-level
150
As the biometric decision is based on the comparison scores given by the Hamming distance in
our case, we believe that it is more judicious to directly exploit the local quality in the computation of
this value as an indicator on the reliability of the result of the comparison instead of performing this
scheme. Therefore we have proposed an alternative solution which is quite similar to the local quality-
based fusion (namely SR-LQ) that has been illustrated in Figure 5-2. To better understand the
differences between these two schemes, we give the architecture of the proposed fusion scheme at the
bit-level in Figure 6-1.
Figure 6-1: How to obtain the fused irisCode, mask and local quality matrix for performing template
matching.
For each frame of the sequence, the iris is first segmented. Then, the iris texture is unwrapped
to obtain a normalized iris image which is then bi-linearly interpolated. The resulting images are then
averaged to get one unique HR image which is encoded using 2D Gabor filters. Three filters of
different sizes are used. To generate the irisCode, the real and imaginary parts of the phase response
are quantized in a pair of bits according to their position in the quadrant. OSIRISV4.1 is used to
perform all these steps. For more details, see Section 3.2.1. In parallel, the normalized masks are also
interpolated in the same way as the normalized iris images. We specify that the fused irisCode and the
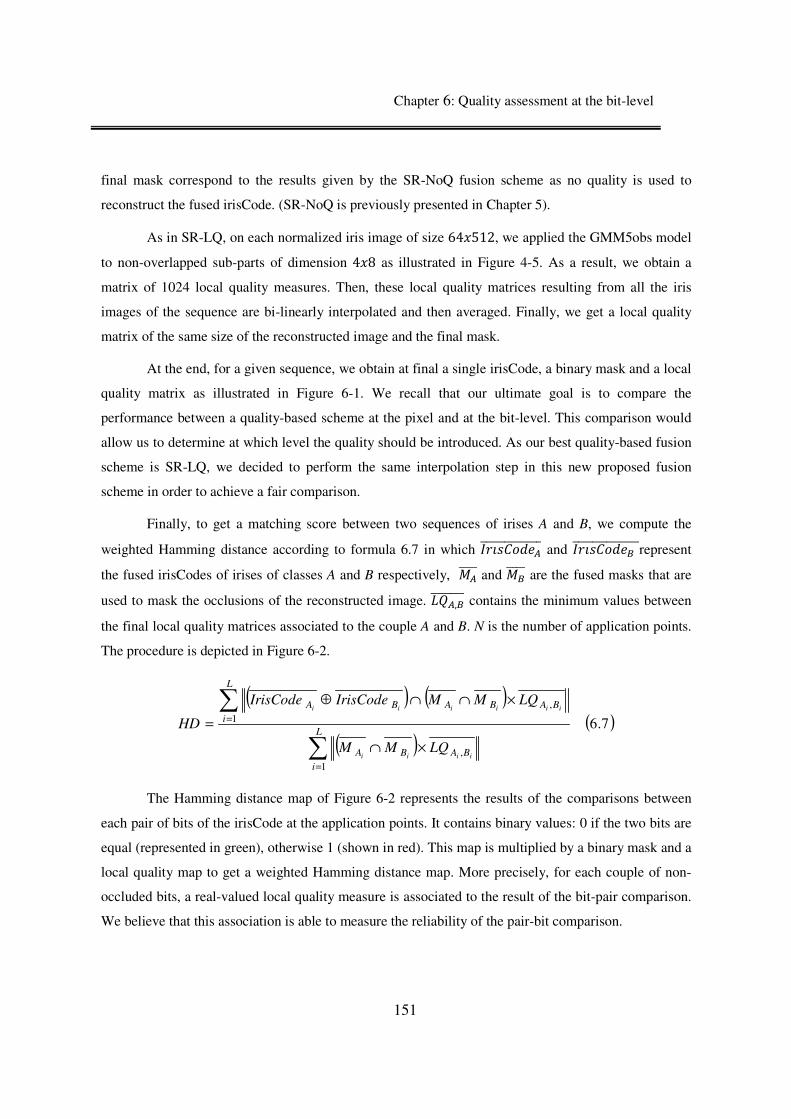
Chapter 6: Quality assessment at the bit-level
151
final mask correspond to the results given by the SR-NoQ fusion scheme as no quality is used to
reconstruct the fused irisCode. (SR-NoQ is previously presented in Chapter 5).
As in SR-LQ, on each normalized iris image of size 64 512, we applied the GMM5obs model
to non-overlapped sub-parts of dimension 4 8 as illustrated in Figure 4-5. As a result, we obtain a
matrix of 1024 local quality measures. Then, these local quality matrices resulting from all the iris
images of the sequence are bi-linearly interpolated and then averaged. Finally, we get a local quality
matrix of the same size of the reconstructed image and the final mask.
At the end, for a given sequence, we obtain at final a single irisCode, a binary mask and a local
quality matrix as illustrated in Figure 6-1. We recall that our ultimate goal is to compare the
performance between a quality-based scheme at the pixel and at the bit-level. This comparison would
allow us to determine at which level the quality should be introduced. As our best quality-based fusion
scheme is SR-LQ, we decided to perform the same interpolation step in this new proposed fusion
scheme in order to achieve a fair comparison.
Finally, to get a matching score between two sequences of irises A and B, we compute the
weighted Hamming distance according to formula 6.7 in which and represent
the fused irisCodes of irises of classes A and B respectively, and are the fused masks that are
used to mask the occlusions of the reconstructed image. , contains the minimum values between
the final local quality matrices associated to the couple A and B. N is the number of application points.
The procedure is depicted in Figure 6-2.
( ) ( )
( )( )7.6
1,
1,
∑
∑
=
=
×∩
×∩∩⊕
=L
i
BABA
L
i
BABABA
iiii
iiiiii
LQMM
LQMMIrisCodeIrisCode
HD
The Hamming distance map of Figure 6-2 represents the results of the comparisons between
each pair of bits of the irisCode at the application points. It contains binary values: 0 if the two bits are
equal (represented in green), otherwise 1 (shown in red). This map is multiplied by a binary mask and a
local quality map to get a weighted Hamming distance map. More precisely, for each couple of non-
occluded bits, a real-valued local quality measure is associated to the result of the bit-pair comparison.
We believe that this association is able to measure the reliability of the pair-bit comparison.

Chapter 6: Quality assessment at the bit-level
152
Figure 6-2: Creation of the weighted Hamming distance map.
To generate the local quality map, we have chosen to take the minimum value between the two
local quality matrices associated to A and B. As shown in Chapter 4, these resulting values are well
correlated to the performance of the recognition. As explained before, there is no consensus on how to
combine two quality measures. Multiplication or simple average could also be performed.
We note that the procedure of weighted Hamming distance computation that is illustrated in
Figure 6-2 is repeated several times, with different values of shift that are applied on the fused
irisCodes, masks and local quality matrices. Only the minimum value of all comparisons is retained to
represent the matching score. We called this quality-based fusion scheme at the bit-level: "SR-
HDxLQ".

Chapter 6: Quality assessment at the bit-level
153
6.3. Comparative evaluations
6.3.1. Experiments and results
In this sub-section, we will first conduct a comparative evaluation between the best fusion scheme at
the pixel-level validated in the previous chapter namely the local quality-based scheme (SR-LQ) and
the proposed method at the bit-level described above (SR-HDxLQ). This comparison will allow us to
determine which weighted local quality strategy leads to best performance. We note that in both
schemes, the same reference system OSIRISV4.1 is used for the segmentation, the normalization and
the feature extraction stages. Besides, the same quality assessment algorithm (GMM5obs model) is
used to measure the local qualities, leading to the same local quality matrices.
The evaluation is conducted on QFIRE05, QFIRE07 and QFIRE11 as in Section 5.3.2. All the
frames of the sequences are used in the fusion schemes. Note that no global quality is used to sort the
images. This protocol corresponds to the AllIm scenario described in Section 5.3.2.3. We performed
the same genuine and impostor comparisons. To assess the performance of each method, we report the
FRR at FAR=0.001 in Table 6-1.
Table 6-1: FRR@FAR=0.001 on QFIRE databases for the fusion schemes: SR-LQ and SR-HDxLQ.
QFIRE05 QFIRE07 QFIRE11
SR-LQ 2.09% 4.48% 3.07%
SR-HDxLQ 2.84% 5.62% 4.77%
For all the QFIRE databases, we can see that the quality weighted scheme at the pixel-level
achieves better performance than the bit-level. More precisely, we note that performance degradation
increases as the quality of the images of the database become worse. A significant increase of 0.75%,
1.14%, and 1.70% is respectively observed at the FRR@FAR=0.001 for QFIRE05, QFIRE07, and
QFIRE11. Consequently, we can conclude that the best method, out of the two tested quality-based
fusion schemes, is SR-LQ whatever the database.
This is not the results we expected. Indeed, as explained in Section 6.1.1, several works have
demonstrated the effectiveness of combining a reliability map to the standard Hamming distance in
order to estimate a matching score between two still iris images such as proposed by Hollingsworth et

Chapter 6: Quality assessment at the bit-level
154
al. in their popular work [194], which inspired latter various works in the literature. The reliability map
has also proven its effectiveness in enhancing the performance in the case of matching iris sequences
instead of single images as done in a more recent work [41]. Moreover in [169], Mahadeo et al. have
shown that irisCodes' fusion achieves better performance that images' fusion with masking fragile bits.
However as pointed out in Section 6.1.2, these proposed methods [41] [169] [194] are benchmarked
only on images of good quality contrary to our tested iris database.
To better understand our results, we decided to implement the two following approaches:
• Signal fusion + masking fragile bits: SR-HDxFB
This fusion scheme is done at the signal level as proposed by Hollingsworth in [162]. This
scheme corresponds to the SA approach described in Chapter 5. It consists in averaging the frames of
the sequence to create a single image. After that, as suggested in [108] [194] by the same authors, the
fragile bits are identified in order to create a binary mask. These bits are coming from complex
coefficients which lie near to the real and imaginary axes. Indeed, these bits might end up as a 0 or a 1
across different irisCodes of the same iris image. The un-occluded bits corresponding to the 25%
imaginary and real lowest values are considered as fragile and hence masked. We call this mask:
fragile bit map. Fewer bits will contribute in the computation of the Hamming distance but each of
them is more consistent. To establish a fair comparison with our proposed method, we performed an
interpolation step before averaging the images. This method will allow us to evaluate our local quality
map in the detection of the inconsistent bits compared to this fragile bit approach. In other words, the
Hamming distance is computed according to formula 6.7, but this time the , is as follows:
( )8.6, iiii BABA FBFBLQ ∩=
where and are respectively the fragile bit maps of iris A and B.
Figure 6-3 depicts an example of fragile bits map for a given irisCode resulting from the
feature extraction module of OSIRISV4.1. The locations of the fragile bits are coherent with those in
[108]: smaller Gabor filters have fewer consistent bits than larger ones.
• IrisCodes’ fusion approach: SR-OptimizedIC
We have also implemented the approach of Mahadeo et al. in [169], already explained in
Section 5.1.1. Only one modification was done in order to achieve fair comparison with our approach.
Indeed, instead of computing the irisCodes from the normalized iris images of the sequence, we have

Chapter 6: Quality assessment at the bit-level
155
performed a prior step of interpolation on the images as in our scheme. Therefore the resulting
optimized irisCode is of double size compared to [169]. We call this approach: SR-OptimizedIC.
Figure 6-3: An illustration of a fragile bit map of a given irisCode. Fragile bits are represented by
black pixels.
The same protocol is used to benchmark these two methods on the three QFIRE databases. To
conduct a comparative study between all the algorithms, the FRR at FAR=0.001 on the QFIRE
databases are tabulated in Table 6-2.
Table 6-2: FRR@FAR=0.001 on QFIRE databases for the fusion schemes: SR-HDxFB and SR-OptimizedIC.
QFIRE05 QFIRE07 QFIRE11
SR-HDxFB 2.82% 8.75% 12.28%
SR-OptimizedIC 5.53% 10.01% 9.55%
i. Validation of the reliability map:
From Table 6-1 and Table 6-2, we observe that SR-HDxLQ and SR-HDxFB methods give
similar performance on QFIRE05: 2.84% vs 2.82%. This is not the case on QFIRE07 and QFIRE11,
for which the SR-HDxLQ scheme outperforms the SR-HDxFB approach. Moreover, performance
degradation increases as the acquisition distance increases too. More precisely, the FRR@FAR=0.001
respectively increases by a value of 3.13% and 7.51% on QFIRE07 and QFIRE11.

Chapter 6: Quality assessment at the bit-level
156
The well-known method SR-HDxFB had proven its effectiveness in detecting the fragile bits in
[108] [194]. However, the method was benchmarked only on images of good quality. The fact that
QFIRE05 contains images with better quality than the other database, can explain the comparable
performance of our SR-HDxLQ scheme and the SR-HDxFB method on this database. We deduced that
our method is also relevant to identify the fragile bits. In the case of lower quality images (QFIRE07
and QIRE11) our method gives better results.
ii. Comparison with an IrisCodes fusion approach:
We note from Table 6-2 that the approach based on the fusion of irisCodes (SR-OptimizedIC)
leads to higher errors at the FRR@FAR=0.001 than SR-HDxFB whatever the tested iris database. This
is in contradiction to the results in [169]. We believe that the fact that they only select the best frames
of the sequence is the reason of this disagreement. Indeed in [169], an automatic quality assessment
algorithm is performed in order to identify high quality frames in a sequence. After that, only best
frames are used to perform the fusion.
The bad performance may be also caused by the number of irisCodes used in order to generate
the optimized irisCode. Indeed, the authors have tested several cases in order to retain the number that
maximizes the recognition rate on a specific database. These two reasons can explain the
ineffectiveness of detecting consistent/inconsistent bits on our tested databases.
iii. Comparison with our local quality-based fusion:
We can see from Table 6-1 and Table 6-2 that the algorithm which achieves the best
performance is the SR-LQ whatever the tested database.
6.3.2. Discussion and conclusions
The comparative study between the different implementations shows the following statements:
Better performance is obtained by the local quality-based scheme at the pixel-level (SR-
LQ) than the bit-level (SR-HDxLQ).
The standard fragile bits method proposed by Hollingsworth et al. [194] is not suitable for
images of low quality resulting from less restrictive condition during the acquisition.
Approach based on irisCodes' fusion [169] is not appropriate when the images are not of
high quality.

Chapter 6: Quality assessment at the bit-level
157
The results show that the SR-LQ scheme outperforms the SR-HDxLQ method for all the
databases. It is better to perform a local quality weighted scheme at an early stage in the fusion process.
This fact points out that it is better to try to reconstruct a normalized iris image of the best
quality as possible that will be used for the further steps i.e. encoding and template matching, than
reconstructing a normalized iris image with latent artifacts, then performing encoding stage and only
after that, using a quality measure at the last stage i.e. in template matching. Therefore, we believe that
artifacts should be handled before quantizing the features into pairs of bits i.e. before degrading the
signal. In fact, quantization of the features leads to a loss of information that our local quality is not
able to compensate.
The key of successful schemes of fusion relies on the quality of the images that are used in the
fusion process. Indeed, in both works [169] [194], the fusion at the bit-level is compared to an
approach at the pixel-level on images that have been carefully selected according to their quality. Their
results show best performance for the bit-level approach. However, we have shown that such fusion
schemes are relevant only thanks to the high quality of the images. These related results combined with
those obtained in this chapter, make us saying that approaches based on bits are more sensitive to the
quality of the initial iris images. However, they lead to best performance only when one deals with
images of high quality.
6.4. Conclusion
We have demonstrated in this chapter that the local quality developed in Chapter 4, also used in
Chapter 5 as a local weighted tool in the fusion process, is relevant to assess the reliability of a bit-pair
comparisons. However, on the challenging QFIRE databases, our local quality-based fusion scheme at
the pixel-level achieves better performance than the proposed bit-level fusion scheme. In less
restrictive acquisition, our investigations have shown that quality assessment should be incorporated in
early stage throughout the fusion scheme, i.e. before degrading the signal in the quantization phase.
Literature results and our ones showed that approaches based on bit-level gives better
performance than those at pixel-level in ideal conditions i.e. images with no imperfection such as
segmentation errors, strong occlusions. However, this is not the case with images of low quality.
Therefore, in scenario with non cooperative subject, we do not think that such approaches could be
appropriate to enhance the performance of the recognition.

Chapter 7: Conclusions and perspectives
158
Chapter 7. Conclusions and perspectives
his PhD dissertation has addressed the problem of video-based iris recognition under less
constrained environment. The authentication was performed in three challenging scenarios:
at a distance and on the move, (ii) with intra-class variation (dilation, eyeglasses...) and (iii)
at large distances in still positions. In such conditions, the captured images suffer from
diverse degradations e.g. blur resulting from out-of-focus or/and motion blur, eyelids and eyelashes
occlusions, specular reflections, shadows, off angles, uneven illumination, low contrasts between the
boundaries and lack of resolution. All these perturbations dramatically affect the overall performance
of the recognition system.
Taking advantage of disposing of several iris images in uncontrolled acquisition mode, we
proposed to fuse the information available in each iris image of the sequence, in order to obtain a final
optimized template, on which the recognition will be performed. More precisely, quality-based super-
resolution methods in the pixel domain were elaborated in order to synthesize a clear high-quality iris
image from multiple low-quality normalized iris images aiming at improving the recognition accuracy.
Therefore, the main research focus of this thesis is two-fold: (i) designing a relevant quality measure
and (ii) developing a fusion scheme based on super-resolution improved by taking into account this
quality measure.
We have first elaborated a quality measurement algorithm able to locally measure the quality
of the iris texture. This measure was later exploited in the proposed fusion scheme. Our quality
measure is based on a Gaussian Mixture Model. The GMM was trained on highly textured sub-images
free from any degradation. The choice of the input vectors to the model was guided by different
experiments aiming at characterizing at best iris texture patterns. The quality measure is a value
between 0 and 1. High values indicate regions well textured without artifacts. In contrast, low values
are associated to regions containing perturbations such as artifacts, poorly textured region and pixels
wrongly segmented. Consequently, we are able to distinguish between the high-quality and low-quality
regions in normalized iris images. A global quality can be defined by using the different local quality
measures estimated on different sub-parts of the normalized iris image.
To evaluate our quality measure, we followed the protocol defined in IREX II - IQCE report of
NIST. A global pairwise quality is associated to each matching couple by taking the minimum between
T

Chapter 7: Conclusions and perspectives
159
the local qualities of the two normalized iris images. We have demonstrated the pertinence of our
quality measure by showing its correlation to the recognition rate. Moreover, we have shown the strong
relationship between our quality measure and (i) the amount of texture in non-occluded regions of the
iris: we have proven the capacity of our quality measure to measure the amount of texture by
discriminating highly textured regions from poorly textured ones and (ii) the usable iris area: we have
shown that our quality metric supplies more pertinent information for classifying the images into low,
medium, and high quality, than the usable iris area which is as far the most influential factor on the
recognition rate as pointed in the IREX II - IQCE report. Moreover, by combining the information
brought by the normalized iris mask and our quality measure further recognition improvements are
observed by rejecting the couples of lowest quality.
These two factors considerably influence the accuracy of the recognition. Consequently, the
developed quality measure can be considered as a relevant tool for estimating iris quality in the
perspective of biometric verification.
As a second achievement, we have proposed quality-based super-resolution approaches for
fusing iris sequences in order to improve the performance. This strategy can handle two types of issues
for iris recognition which are the lack of resolution and the presence of various artifacts in the iris
images. The fusion was carried out on the normalized iris images at the pixel-level. The super-
resolution is based on a simple bilinear interpolation. As well known, SR techniques can remedy to
poor resolution in the images. Despite the simplicity of the SR model implemented, the experimental
results shown the effectiveness of this approach in improving the accuracy of the performance on
several challenging iris databases. In order to further improve the previous results, we have proposed to
exploit our quality measure in the fusion scheme. This quality measure can be considered globally or
locally in order to decrease the effect of low quality images in the SR, which leads to a decrease in
performance producing a rather counterproductive effect.
The global quality can be used in two ways: (i) as a selection tool: it allows performing the
fusion using only the best images of the iris sequence and (ii) as a weighting factor in the same way as
proposed in the literature. In this case, it permits to give less contribution to the low quality images of a
given sequence in the reconstruction of the fused template. Compared to the state-of-the-art, the
interest of our quality measure consists in the estimation of one unique quality measure avoiding a
combination phase of various quality measures, which requires identifying a priori the nature of each
degradation.

Chapter 7: Conclusions and perspectives
160
Our main novelty is the introduction of a local quality measure in the fusion scheme.
Performing a local weighting in the image fusion scheme allows us to take into account the fact that
degradations can be different in diverse parts of the iris image. This means that regions free from
occlusions will contribute more in the reconstruction of the fused image than regions with artefacts.
Using a local measure instead of a global one as done in the literature was motivated by our intuition
that the quality in an iris image is not globally identical. In fact, eventual errors of the segmentation
masks can occur in the normalized iris images especially in uncontrolled acquisition mode which is our
case. Indeed, in general iris images that are captured at a distance or/and on-the-move suffer from blur
and low contrast between the pupillary and limbic boundaries and from strong occlusions on the iris
area. These degradations induce errors on iris localization, which particularly influence the precision of
the iris segmentation and consequently the quality of the normalized iris texture. In this case, two
normalized iris images resulting from different acquisitions of the same person, present a high
discrepancy and consequently one must be very careful in fusing such images. Therefore, it is
important to accurately consider the quality of the images in the fusion process in order to increase the
recognition performance.
Extensive experiments were performed on several commonly used iris databases: MBGC
portal and Casia-Iris-Thousand. We separately investigated the improvement brought by the super-
resolution, the global quality and the local quality in the fusion process. In particular, the experimental
results show the important improvement brought by the use of the global quality in the fusion process,
improvement that is even increased using the local quality. These results confirm our intuition: the
local quality is able to detect local noisy regions in the normalized iris images. By assigning small
values to those regions, the reconstructed HR image is of better quality.
Moreover, the approaches were also evaluated on the new challenging database QFIRE, at
three different distances: 5, 7 and 11 feet. Firstly, we have shown that SR enhances significantly the
recognition rate when the images are of good quality. This is the case, when the fusion is applied on
iris images taken from short distances or only on the best iris images coming from long distances. We
believe that, thanks to the good quality of the images, there are fewer segmentation errors, and hence
our image registration scheme in the SR is appropriate. Secondly, we have observed that the proposed
method based on the incorporation of a local quality in the SR improves the performance mostly when
the quality of the images decreases. For the short distances, we assume that, as the images are well
segmented and present no artifact on the iris area, introducing a local quality measure is not really
necessary. For the long distances, on the contrary, the local quality-based fusion scheme allows a high

Chapter 7: Conclusions and perspectives
161
improvement in the performance. Our explanation is that, at such distances, where many bad
segmentations occur, the local quality measure is able to detect the bad-segmented pixels and to
discard them from the fusion procedure. This way, the fusion procedure does not suffer too much from
segmentation errors, thanks to the local quality weighting.
Finally, we have conducted a simple study to determine on which representation of the iris
(pixel, feature or bit) our quality measure should be incorporated in the fusion scheme in order to
obtain the best performance. The experimental results showed that the local quality led to better
recognition rates when the measure is introduced at the pixel-level than at the bit-level. This fact
pointed out that the degradations that can occur on the normalized iris images in the fusion should be
handled at an early stage. In fact, the quantization of the features into binary codes leads to a loss of
information that our local quality is not able to compensate.
This thesis opens up some perspectives and directions for future works:
A first point would be to improve the registration step in the super-resolution. Indeed, image
alignment is an essential task in the fusion process as SR is very sensitive to registration errors. In this
thesis, the normalization process was used to register the iris images. Indeed, this process performs a
scaling of the iris zone dealing with pupil dilation, and thus allowing an alignment of the pixels.
However, the blur can reduce the ability to accurately align the iris images. Indeed, the segmentation of
blurred images can lead to small errors in the localization of the iris boundaries. As the normalization
is based on these boundaries, the normalized iris images can present some distortions and disparities
between them. In this case, using iris normalization may not be sufficient as the registration basis for
SR. This can explain the fact that SR does not improve as much the recognition rate at long distances
due to the blur. Better performances could be expected by performing more accurate registration as
usually employed in SR methods such as cross correlation techniques.
Secondly, it would be interesting to investigate the possibility of performing a quality-based
fusion scheme at the feature-level i.e. before the features quantization. We could combine our local
quality to the response of the Gabor filters before the quantization into a binary code. In a weighted
scheme, the phase numbers obtained from noisy regions detected by our local quality will have values
near to zeros and occur close to the axes. Lowest weights will be assigned to those regions in the
reconstruction of the fused feature template, on which the quantization will be done. Another
possibility would be to directly estimate the quality of the iris features by a new quality metric at the

Chapter 7: Conclusions and perspectives
162
feature level. Then, this measure could be introduced in the fusion scheme at this level in order to give
more importance to the features of good quality.
A final point to explore would be to perform a fusion scheme at the bit-level improved by a
training phase aiming at optimizing the recognition rate. Each iris images of the sequence is
segmented, normalized and then encoded. For fusing the resulting irisCodes, genetic algorithms could
be used for finding the best bit-fusion strategy, which optimizes the verification performance. By this
way, most relevant bits in the irisCodes of the sequence will be used to reconstruct an optimized fused
irisCode.

Chapter 7: Conclusions and perspectives
163

Bibliography
[1] A. Ross, K. Nandakumar, and A. K. Jain, “Introduction to multibiometrics,” in Handbook of
Biometrics, Springer, 2008, pp. 271–292.
[2] K. W. Bowyer, K. Hollingsworth, and P. J. Flynn, “Image understanding for iris biometrics: A survey,” Comput. Vis. image Underst., vol. 110, no. 2, pp. 281–307, 2008.
[3] C. Rathgeb, A. Uhl, and P. Wild, “Iris Segmentation Methodologies,” in Iris Biometrics, Springer, 2012, pp. 49–73.
[4] A. Ross, “Iris recognition: The path forward,” Computer (Long. Beach. Calif)., no. 2, pp. 30–35, 2010.
[5] P. Kronfeld and G. Anatomy, “Embryology of the Eye,” Eye, Acad. Press. London, 1962.
[6] M. Fairhurst and M. Erbilek, “Analysis of physical ageing effects in iris biometrics,” IET
Comput. Vis., vol. 5, no. 6, pp. 358–366, 2011.
[7] J. Daugman and C. Downing, “Epigenetic randomness, complexity and singularity of human iris patterns,” Proc. R. Soc. London B Biol. Sci., vol. 268, no. 1477, pp. 1737–1740, 2001.
[8] A. Bertillon, La couleur de l’iris. Masson, 1886.
[9] J. H. Doggart, Ocular signs in slit-lamp microscopy. H. Kimpton, 1949.
[10] F. H. Adler, Physiology of the eye: clinical application. Mosby, 1959.
[11] L. Flom and A. U. S. Safir, “Patent No. 4641 349,” US Gov. Print. Off. Washington, DC, 1987.
[12] J. G. Daugman, “Biometric personal identification system based on iris analysis.” 1994.
[13] J. G. Daugman, “High confidence visual recognition of persons by a test of statistical independence,” Pattern Anal. Mach. Intell. IEEE Trans., vol. 15, no. 11, pp. 1148–1161, 1993.
[14] “UK Border Agency iris recognition immigration system.” [Online]. Available: http://www.bbc.com/news/uk-england-17058448. [Accessed: 02-Dec-2015].
[15] “Iris scans at Amsterdam Airport Schiphol.” [Online]. Available: http://www.schiphol.nl/Travellers/AtSchiphol/Privium.htm. [Accessed: 02-Dec-2015].
[16] “IRIS ID: Iris access in Action.” [Online]. Available: http://www.irisid.com/productssolutions/irisaccessinaction/. [Accessed: 02-Dec-2015].
[17] “Alclear: Clear.” [Online]. Available: https://www.clearme.com/. [Accessed: 02-Dec-2015].
[18] J. Daugman, “Iris recognition border-crossing system in the UAE,” Int. Airpt. Rev., vol. 8, no. 2, 2004.
[19] J. Daugman, “Iris recognition at 20 years: from zero to 150 trillion iris comparisons per day,” in Keynote Lecture, Biometrics (ICB), 2012 5th IAPR International Conference on, 2012.
[20] “Unique Identification Authority of India.” [Online]. Available: https://uidai.gov.in/. [Accessed: 02-Dec-2015].
[21] “UNHCR - Iris testing of returning Afghans passes 200,000 mark.” [Online]. Available: http://www.unhcr.org/3f86b4784.html. [Accessed: 02-Dec-2015].
[22] “Canada Border Services Agency: NEXUS.” [Online]. Available: http://www.cbsa-

ii
asfc.gc.ca/prog/nexus/menu-eng.html. [Accessed: 02-Dec-2015].
[23] “Iris Exchange Program.” [Online]. Available: http://www.nist.gov/itl/iad/ig/irex.cfm. [Accessed: 09-Dec-2015].
[24] G. W. Quinn, J. Matey, E. Tabassi, and P. Grother, “IREX V report,” 2014.
[25] J. R. Matey, O. Naroditsky, K. Hanna, R. Kolczynski, D. J. LoIacono, S. Mangru, M. Tinker, T. M. Zappia, and W. Y. Zhao, “Iris on the move: Acquisition of images for iris recognition in less constrained environments,” Proc. IEEE, vol. 94, no. 11, pp. 1936–1947, 2006.
[26] F. Bashir, P. Casaverde, D. Usher, and M. Friedman, “Eagle-eyes: a system for iris recognition at a distance,” in Technologies for Homeland Security, 2008 IEEE Conference on, 2008, pp. 426–431.
[27] F. W. Wheeler, G. Abramovich, B. Yu, P. H. Tu, and others, “Stand-off iris recognition system,” in Biometrics: Theory, Applications and Systems, 2008. BTAS 2008. 2nd IEEE
International Conference on, 2008, pp. 1–7.
[28] W. Dong, Z. Sun, and T. Tan, “A design of iris recognition system at a distance,” in Pattern
Recognition, 2009. CCPR 2009. Chinese Conference on, 2009, pp. 1–5.
[29] S. Yoon, K. Bae, K. R. Park, and J. Kim, “Pan-tilt-zoom based iris image capturing system for unconstrained user environments at a distance,” in Advances in Biometrics, Springer, 2007, pp. 653–662.
[30] S. Venugopalan, U. Prasad, K. Harun, K. Neblett, D. Toomey, J. Heyman, and M. Savvides, “Long range iris acquisition system for stationary and mobile subjects,” in Biometrics (IJCB),
2011 International Joint Conference on, 2011, pp. 1–8.
[31] J. De Villar, R. W. Ives, J. R. Matey, and others, “Design and implementation of a long range iris recognition system,” in Signals, Systems and Computers (ASILOMAR), 2010 Conference
Record of the Forty Fourth Asilomar Conference on, 2010, pp. 1770–1773.
[32] J. Daugman, “How iris recognition works,” Circuits Syst. Video Technol. IEEE Trans., vol. 14, no. 1, pp. 21–30, 2004.
[33] N. Othman, B. Dorizzi, and S. Garcia-Salicetti, “OSIRIS: An open source iris recognition software,” Pattern Recognit. Lett., 2015.
[34] P. Grother and E. Tabassi, “Performance of biometric quality measures,” Pattern Anal. Mach.
Intell. IEEE Trans., vol. 29, no. 4, pp. 531–543, 2007.
[35] “‘Information Technology’, Biometric Data Interchange Format. Part 6: Iris Image Data, ISO/IEC 19794-6.,” 2005.
[36] “MBGC Portal Challenge Version 2 Preliminary Results. National Institute of Standards and Technology – MGBC 3rd Workshop.” [Online]. Available: http://www.nist.gov/itl/iad/ig/mbgc-presentations.cfm. [Accessed: 02-Dec-2015].
[37] “Chinese Academy of Sciences’ Institute of Automation, CASIA-Iris-Thousand,” 2012. [Online]. Available: http://biometrics.idealtest.org/findTotalDbByMode.do?mode=Iris. [Accessed: 02-Dec-2015].
[38] S. Schuckers, P. Meyer Lopez, P. Johnson, N. Sazonova, F. Hua, R. Lazarick, C. Miles, E. Tabassi, E. Sazonov, A. Ross, and L. Hornak, “Quality--Face / Iris Research Ensemble (Q-FIRE) Data Collection Steps,” 2010.
[39] S. Schuckers, P. Meyer Lopez, P. Johnson, N. Sazonova, F. Hua, R. Lazarick, C. Miles, E.

iii
Tabassi, E. Sazonov, A. Ross, and L. Hornak, “Quality--Face / Iris Research Ensemble (Q-FIRE) Dataset Overview,” 2010.
[40] P. A. Johnson, P. Lopez-Meyer, N. Sazonova, F. Hua, and S. Schuckers, “Quality in face and iris research ensemble (Q-FIRE),” in Biometrics: Theory Applications and Systems (BTAS),
2010 Fourth IEEE International Conference on, 2010, pp. 1–6.
[41] J. Liu, Z. Sun, and T. Tan, “Code-level information fusion of low-resolution iris image sequences for personal identification at a distance,” in Biometrics: Theory, Applications and
Systems (BTAS), 2013 IEEE Sixth International Conference on, 2013, pp. 1–6.
[42] P. A. Johnson, F. Hua, and S. Schuckers, “Comparison of quality-based fusion of face and iris biometrics,” in Biometrics (IJCB), 2011 International Joint Conference on, 2011, pp. 1–5.
[43] “Biosecure Project.” [Online]. Available: http://biosecure.it-sudparis.eu/AB/. [Accessed: 02-Dec-2015].
[44] M. Zhang, J. Liu, Z. Sun, T. Tan, W. Su, F. Alonso-Fernandez, V. Nemesin, N. Othman, K. Noda, P. Li, and others, “The first ICB* competition on iris recognition,” in Biometrics (IJCB),
2014 IEEE International Joint Conference on, 2014, pp. 1–6.
[45] K. Revett, Behavioral biometrics: a remote access approach. John Wiley & Sons, 2008.
[46] H. Proenca, “Towards non-cooperative biometric iris recognition,” Univ. Beira Inter. Dep.
Comput. Sci., 2006.
[47] “‘Information Technology’, Biometric performance testing and reporting -- Part 1: Principles and framework, ISO/IEC 19795-1.,” 2006.
[48] G. Doddington, W. Liggett, A. Martin, M. Przybocki, and D. Reynolds, “Sheep, goats, lambs and wolves: A statistical analysis of speaker performance in the NIST 1998 speaker recognition evaluation,” 1998.
[49] A. Hicklin, B. Ulery, and C. I. Watson, The myth of goats: How many people have fingerprints
that are hard to match? US Department of Commerce, National Institute of Standards and Technology, 2005.
[50] E. Tabassi, “Image specific error rate: A biometric performance metric,” in Pattern Recognition
(ICPR), 2010 20th International Conference on, 2010, pp. 1124–1127.
[51] E. Tabassi, P. Grother, and W. Salamon, “IREX II-IQCE (Iris Quality Calibration and Evaluation: Performance of Iris Image Quality Assessment Algorithms) report,” 2011.
[52] X. Li, Z. Sun, and T. Tan, “Predict and improve iris recognition performance based on pairwise image quality assessment,” in Biometrics (ICB), 2013 International Conference on, 2013, pp. 1–6.
[53] J. Zuo, F. Nicolo, N. Schmid, H. Wechsler, and others, “Adaptive biometric authentication using nonlinear mappings on quality measures and verification scores,” in Image Processing
(ICIP), 2010 17th IEEE International Conference on, 2010, pp. 4077–4080.
[54] K. Nguyen, C. Fookes, S. Sridharan, and S. Denman, “Focus-score weighted super-resolution for uncooperative iris recognition at a distance and on the move,” in Image and Vision
Computing New Zealand (IVCNZ), 2010 25th International Conference of, 2010, pp. 1–8.
[55] P. J. Flynn, “Biometrics databases,” in Handbook of Biometrics, Springer, 2008, pp. 529–548.
[56] P. J. Phillips, P. J. Flynn, J. R. Beveridge, W. T. Scruggs, A. J. O’toole, D. Bolme, K. W. Bowyer, B. A. Draper, G. H. Givens, Y. M. Lui, and others, “Overview of the multiple

iv
biometrics grand challenge,” in Advances in Biometrics, Springer, 2009, pp. 705–714.
[57] X. Tan, F. Song, Z.-H. Zhou, and S. Chen, “Enhanced pictorial structures for precise eye localization under incontrolled conditions,” in Computer Vision and Pattern Recognition, 2009.
CVPR 2009. IEEE Conference on, 2009, pp. 1621–1628.
[58] “Iris Challenge Evaluation.” [Online]. Available: http://www.nist.gov/itl/iad/ig/ice.cfm. [Accessed: 02-Dec-2015].
[59] P. J. Phillips, K. W. Bowyer, P. J. Flynn, X. Liu, and W. T. Scruggs, “The iris challenge evaluation 2005,” in Biometrics: Theory, Applications and Systems, 2008. BTAS 2008. 2nd
IEEE International Conference on, 2008, pp. 1–8.
[60] P. J. Phillips, A. Martin, C. L. Wilson, and M. Przybocki, “An introduction evaluating biometric systems,” Computer (Long. Beach. Calif)., vol. 33, no. 2, pp. 56–63, 2000.
[61] “SOCIA Lab, University of Beira Interior: Noisy Iris Challenge Evaluation Part I.” [Online]. Available: http://nice1.di.ubi.pt/. [Accessed: 02-Dec-2015].
[62] “SOCIA Lab, University of Beira Interior: Noisy Iris Challenge Evaluation Part II.” [Online]. Available: http://nice2.di.ubi.pt/. [Accessed: 02-Dec-2015].
[63] “UBIRIS: Noisy Visible Wavelength Iris Image Databases.” [Online]. Available: URL: http://iris.di.ubi.pt/. [Accessed: 02-Dec-2015].
[64] T. Tan, Z. He, and Z. Sun, “Efficient and robust segmentation of noisy iris images for non-cooperative iris recognition,” Image Vis. Comput., vol. 28, no. 2, pp. 223–230, 2010.
[65] J. Daugman, Biometric decision landscapes, no. 482. University of Cambridge, Computer Laboratory, 2000.
[66] T. Tan, X. Zhang, Z. Sun, and H. Zhang, “Noisy iris image matching by using multiple cues,” Pattern Recognit. Lett., vol. 33, no. 8, pp. 970–977, 2012.
[67] “LivDet-Iris 2013: Iris Liveness Detection Competition 2013,” 2013. [Online]. Available: http://iris2013.livdet.org/results.php. [Accessed: 03-Dec-2015].
[68] “MobILive 2014: Mobile Iris Liveness Detection Competition 2014.,” 2014. [Online]. Available: http://mobilive2014.inescporto.pt/final-results. [Accessed: 03-Dec-2015].
[69] “MICHE-I: Mobile Iris Challenge Evaluation, Part I,” 2014. [Online]. Available: http://biplab.unisa.it/MICHE/index_miche.htm. [Accessed: 03-Dec-2015].
[70] M. De Marsico, M. Nappi, D. Riccio, and H. Wechsler, “Mobile Iris Challenge Evaluation (MICHE)-I, biometric iris dataset and protocols,” Pattern Recognit. Lett., vol. 57, pp. 17–23, 2015.
[71] M. De Marsico, M. Nappi, H. Proença, and others, “Guest editorial introduction to the special executable issue on‘ Mobile Iris CHallenge Evaluation part I (MICHE I),’” Pattern Recognit.
Lett., no. 57, pp. 1–3, 2015.
[72] J. Daugman, “The importance of being random: statistical principles of iris recognition,” Pattern Recognit., vol. 36, no. 2, pp. 279–291, 2003.
[73] J. Daugman, “New methods in iris recognition,” Syst. Man, Cybern. Part B Cybern. IEEE
Trans., vol. 37, no. 5, pp. 1167–1175, 2007.
[74] R. P. Wildes, “Iris recognition: an emerging biometric technology,” Proc. IEEE, vol. 85, no. 9, pp. 1348–1363, 1997.

v
[75] S. J. K. Pedersen, “Circular hough transform,” Aalborg Univ. Vision, Graph. Interact. Syst., 2007.
[76] L. Ma, T. Tan, Y. Wang, and D. Zhang, “Local intensity variation analysis for iris recognition,” Pattern Recognit., vol. 37, no. 6, pp. 1287–1298, 2004.
[77] E. Krichen, S. Garcia-Salicetti, and B. Dorizzi, “A new probabilistic iris quality measure for comprehensive noise detection,” in Biometrics: Theory, Applications, and Systems, 2007. BTAS
2007. First IEEE International Conference on, 2007, pp. 1–6.
[78] E. Krichen, S. Garcia-Salicetti, and B. Dorizzi, “A new phase-correlation-based iris matching for degraded images,” Syst. Man, Cybern. Part B Cybern. IEEE Trans., vol. 39, no. 4, pp. 924–934, 2009.
[79] L. Masek and P. Kovesi, “Matlab source code for a biometric identification system based on iris patterns, Master’s thesis,” Sch. Comput. Sci. Softw. Eng. Univ. West. Aust., vol. 26, 2003.
[80] K. W. Bowyer, S. E. Baker, A. Hentz, K. Hollingsworth, T. Peters, and P. J. Flynn, “Factors that degrade the match distribution in iris biometrics,” Identity Inf. Soc., vol. 2, no. 3, pp. 327–343, 2009.
[81] J. Zuo, N. Schmid, and others, “On a methodology for robust segmentation of nonideal iris images,” Syst. Man, Cybern. Part B Cybern. IEEE Trans., vol. 40, no. 3, pp. 703–718, 2010.
[82] A. Uhl and P. Wild, “Weighted adaptive hough and ellipsopolar transforms for real-time iris segmentation,” in Biometrics (ICB), 2012 5th IAPR International Conference on, 2012, pp. 283–290.
[83] Z. He, T. Tan, Z. Sun, and X. Qiu, “Toward accurate and fast iris segmentation for iris biometrics,” Pattern Anal. Mach. Intell. IEEE Trans., vol. 31, no. 9, pp. 1670–1684, 2009.
[84] M. Vatsa, R. Singh, and A. Noore, “Improving iris recognition performance using segmentation, quality enhancement, match score fusion, and indexing,” Syst. Man, Cybern. Part
B Cybern. IEEE Trans., vol. 38, no. 4, pp. 1021–1035, 2008.
[85] S. Shah and A. Ross, “Iris segmentation using geodesic active contours,” Inf. Forensics Secur.
IEEE Trans., vol. 4, no. 4, pp. 824–836, 2009.
[86] K. Roy, P. Bhattacharya, and C. Y. Suen, “Towards nonideal iris recognition based on level set method, genetic algorithms and adaptive asymmetrical SVMs,” Eng. Appl. Artif. Intell., vol. 24, no. 3, pp. 458–475, 2011.
[87] D. Benboudjema, N. Othman, B. Dorizzi, and W. Pieczynski, “Challenging eye segmentation using triplet Markov spatial models,” in Acoustics, Speech and Signal Processing (ICASSP),
2013 IEEE International Conference on, 2013, pp. 1927–1931.
[88] S. J. Pundlik, D. L. Woodard, and S. T. Birchfield, “Non-ideal iris segmentation using graph cuts,” in Computer Vision and Pattern Recognition Workshops, 2008. CVPRW’08. IEEE
Computer Society Conference on, 2008, pp. 1–6.
[89] C. Rathgeb, A. Uhl, and P. Wild, Iris biometrics: from segmentation to template security, vol. 59. Springer Science & Business Media, 2012.
[90] Z. Sun and T. Tan, “Ordinal measures for iris recognition,” Pattern Anal. Mach. Intell. IEEE
Trans., vol. 31, no. 12, pp. 2211–2226, 2009.
[91] D. M. Monro, S. Rakshit, and D. Zhang, “DCT-based iris recognition,” Pattern Anal. Mach.
Intell. IEEE Trans., vol. 29, no. 4, pp. 586–595, 2007.

vi
[92] L. Ma, T. Tan, Y. Wang, and D. Zhang, “Efficient iris recognition by characterizing key local variations,” Image Process. IEEE Trans., vol. 13, no. 6, pp. 739–750, 2004.
[93] J. Thornton, M. Savvides, and B. Kumar, “An evaluation of iris pattern representations,” in Biometrics: Theory, Applications, and Systems, 2007. BTAS 2007. First IEEE International
Conference on, 2007, pp. 1–6.
[94] K. Miyazawa, K. Ito, T. Aoki, K. Kobayashi, and H. Nakajima, “A phase-based iris recognition algorithm,” in Advances in biometrics, Springer, 2005, pp. 356–365.
[95] J. Thornton, M. Savvides, and V. Kumar, “A Bayesian approach to deformed pattern matching of iris images,” Pattern Anal. Mach. Intell. IEEE Trans., vol. 29, no. 4, pp. 596–606, 2007.
[96] B. V. K. Kumar, A. Mahalanobis, and D. W. Carlson, “Optimal trade-off synthetic discriminant function filters for arbitrary devices,” Opt. Lett., vol. 19, no. 19, pp. 1556–1558, 1994.
[97] L. Masek, “Recognition of human iris patterns for biometric identification,” University of Western Australia, 2003.
[98] X. Liu, “Optimizations in iris recognition, Doctoral dissertation,” University of Notre Dame, 2006.
[99] Y. Lee, R. J. Micheals, and J. Phillips, “Improvements in video-based automated system for iris recognition (VASIR),” in Motion and Video Computing, 2009. WMVC’09. Workshop on, 2009, pp. 1–8.
[100] R. Lienhart and J. Maydt, “An extended set of haar-like features for rapid object detection,” in Image Processing. 2002. Proceedings. 2002 International Conference on, 2002, vol. 1, pp. I–900.
[101] J. R. Beveridge, G. H. Givens, P. J. Phillips, B. Draper, Y. M. Lui, and others, “Focus on quality, predicting FRVT 2006 performance,” in Automatic Face & Gesture Recognition, 2008.
FG’08. 8th IEEE International Conference on, 2008, pp. 1–8.
[102] E. Krichen, B. Dorizzi, Z. Sun, and S. Garcia-Salicetti, “Iris recognition,” in Guide to Biometric
Reference Systems and Performance Evaluation, Springer, 2009, pp. 25–49.
[103] C. Xu and J. L. Prince, “Snakes, shapes, and gradient vector flow,” Image Process. IEEE
Trans., vol. 7, no. 3, pp. 359–369, 1998.
[104] G. Sutra, S. Garcia-Salicetti, and B. Dorizzi, “The viterbi algorithm at different resolutions for enhanced iris segmentation,” in Biometrics (ICB), 2012 5th IAPR International Conference on, 2012, pp. 310–316.
[105] C.-T. Chou, S.-W. Shih, W.-S. Chen, V. W. Cheng, and D.-Y. Chen, “Non-orthogonal view iris recognition system,” Circuits Syst. Video Technol. IEEE Trans., vol. 20, no. 3, pp. 417–430, 2010.
[106] H. Proença and L. A. Alexandre, “Iris recognition: Analysis of the error rates regarding the accuracy of the segmentation stage,” Image Vis. Comput., vol. 28, no. 1, pp. 202–206, 2010.
[107] H. Proença, “Quality assessment of degraded iris images acquired in the visible wavelength,” Inf. Forensics Secur. IEEE Trans., vol. 6, no. 1, pp. 82–95, 2011.
[108] K. P. Hollingsworth, K. W. Bowyer, and P. J. Flynn, “The best bits in an iris code,” Pattern
Anal. Mach. Intell. IEEE Trans., vol. 31, no. 6, pp. 964–973, 2009.
[109] H. J. Santos-Villalobos, D. R. Barstow, M. Karakaya, C. B. Boehnen, and E. Chaum, “Ornl biometric eye model for iris recognition,” in Biometrics: Theory, Applications and Systems

vii
(BTAS), 2012 IEEE Fifth International Conference on, 2012, pp. 176–182.
[110] S. Oishi, M. Ichino, and H. Yoshiura, “Fusion of iris and periocular user authentication by AdaBoost for mobile devices,” in Consumer Electronics (ICCE), 2015 IEEE International
Conference on, 2015, pp. 428–429.
[111] K. B. Raja, R. Raghavendra, V. K. Vemuri, and C. Busch, “Smartphone based visible iris recognition using deep sparse filtering,” Pattern Recognit. Lett., vol. 57, pp. 33–42, 2015.
[112] Y. Sanchez-Gonzalez, Y. Chacon-Cabrera, and E. Garea-Llano, “A Comparison of Fused Segmentation Algorithms for Iris Verification,” in Progress in Pattern Recognition, Image
Analysis, Computer Vision, and Applications, Springer, 2014, pp. 112–119.
[113] A. Czajka, “Influence of Iris Template Aging on Recognition Reliability,” in Biomedical
Engineering Systems and Technologies, Springer, 2014, pp. 284–299.
[114] D. Camara and V. C. da Rocha Jr, “Providing Higher Entropy Cryptographic Keys by the Use of Biometrics,” 2010.
[115] M. V. C. Rodrigues, F. M. Masculo, F. M. de Assis, and B. B. Albert, “Biometrics-Based Secret Key Agreement by Public Discussion with RFID System.”
[116] W. A. A. Torres, N. Bhattacharjee, and B. Srinivasan, “Effectiveness of Fully Homomorphic Encryption to Preserve the Privacy of Biometric Data,” in Proceedings of the 16th International
Conference on Information Integration and Web-based Applications & Services, 2014, pp. 152–158.
[117] I. Tomeo-Reyes, J. Liu-Jimenez, I. Rubio-Polo, and B. Fernandez-Saavedra, “Quality metrics influence on iris recognition systems performance,” in Security Technology (ICCST), 2011
IEEE International Carnahan Conference on, 2011, pp. 1–7.
[118] C. Fancourt, L. Bogoni, K. Hanna, Y. Guo, R. Wildes, N. Takahashi, and U. Jain, “Iris recognition at a distance,” in Audio-and Video-Based Biometric Person Authentication, 2005, pp. 187–200.
[119] F. Bashir, D. Usher, P. Casaverde, and M. Friedman, “Video surveillance for biometrics: long-range multi-biometric system,” in Advanced Video and Signal Based Surveillance, 2008.
AVSS’08. IEEE Fifth International Conference on, 2008, pp. 175–182.
[120] “Aoptix technologies, Insight-duo: Iris recognition and face capture system.” [Online]. Available: http://www.airportsinternational.com/wp-content/directory/pdf/1343040479.pdf. [Accessed: 03-Dec-2015].
[121] “Morpho IAD: Iris at a distance solution.” [Online]. Available: http://www.morpho.com/en/aviation-border-security/secure-and-manage-borders/check-traveler-id/control-stations/morpho-iad. [Accessed: 03-Dec-2015].
[122] J. Daugman, “Probing the uniqueness and randomness of IrisCodes: Results from 200 billion iris pair comparisons,” Proc. IEEE, vol. 94, no. 11, pp. 1927–1935, 2006.
[123] B. J. Kang and K. R. Park, “A study on iris image restoration,” in Audio-and Video-Based
Biometric Person Authentication, 2005, pp. 31–40.
[124] L. Ma, T. Tan, Y. Wang, and D. Zhang, “Personal identification based on iris texture analysis,” Pattern Anal. Mach. Intell. IEEE Trans., vol. 25, no. 12, pp. 1519–1533, 2003.
[125] Z. Wei, T. Tan, Z. Sun, and J. Cui, “Robust and fast assessment of iris image quality,” in Advances in Biometrics, Springer, 2005, pp. 464–471.

viii
[126] G. Lu, J. Qi, and Q. Liao, “A new scheme of iris image quality assessment,” in Intelligent
Information Hiding and Multimedia Signal Processing, 2007. IIHMSP 2007. Third
International Conference on, 2007, vol. 1, pp. 147–150.
[127] W. Dong, Z. Sun, T. Tan, and Z. Wei, “Quality-based dynamic threshold for iris matching,” in Image Processing (ICIP), 2009 16th IEEE International Conference on, 2009, pp. 1949–1952.
[128] K. P. Hollingsworth, K. W. Bowyer, and P. J. Flynn, “The importance of small pupils: a study of how pupil dilation affects iris biometrics,” in Biometrics: Theory, Applications and Systems,
2008. BTAS 2008. 2nd IEEE International Conference on, 2008, pp. 1–6.
[129] A. Czajka and K. W. Bowyer, “Statistical analysis of multiple presentation attempts in iris recognition,” in Cybernetics (CYBCONF), 2015 IEEE 2nd International Conference on, 2015, pp. 483–488.
[130] T. Yang, J. Stahl, S. Schuckers, F. Hua, C. B. Boehnen, and M. Karakaya, “Gaze angle estimate and correction in iris recognition,” in Computational Intelligence in Biometrics and Identity
Management (CIBIM), 2014 IEEE Symposium on, 2014, pp. 132–138.
[131] J. Daugman and C. Downing, “Effect of severe image compression on iris recognition performance,” Inf. Forensics Secur. IEEE Trans., vol. 3, no. 1, pp. 52–61, 2008.
[132] R. W. Ives, D. A. D. Bishop, Y. Du, and C. Belcher, “Effects of image compression on iris recognition performance and image quality,” in Computational Intelligence in Biometrics:
Theory, Algorithms, and Applications, 2009. CIB 2009. IEEE Workshop on, 2009, pp. 16–21.
[133] S. Rakshit and D. M. Monro, “An evaluation of image sampling and compression for human iris recognition,” Inf. Forensics Secur. IEEE Trans., vol. 2, no. 3, pp. 605–612, 2007.
[134] T. Bergmueller, E. Christopoulos, M. Schnoell, and A. Uhl, “Recompression effects in iris segmentation,” in Biometrics (ICB), 2015 International Conference on, 2015, pp. 1–8.
[135] N. D. Kalka, J. Zuo, N. Schmid, B. Cukic, and others, “Estimating and fusing quality factors for iris biometric images,” Syst. Man Cybern. Part A Syst. Humans, IEEE Trans., vol. 40, no. 3, pp. 509–524, 2010.
[136] J. Zuo, N. Schmid, and others, “Global and local quality measures for NIR iris video,” in Computer Vision and Pattern Recognition Workshops, 2009. CVPR Workshops 2009. IEEE
Computer Society Conference on, 2009, pp. 120–125.
[137] N. K. Mahadeo, A. P. Paplinski, and S. Ray, “Automated selection of optimal frames in nir iris videos,” in Digital Image Computing: Techniques and Applications (DICTA), 2013
International Conference on, 2013, pp. 1–8.
[138] F. Alonso-Fernandez and J. Bigun, “Quality factors affecting iris segmentation and matching,” in Biometrics (ICB), 2013 International Conference on, 2013, pp. 1–6.
[139] Y. Chen, S. C. Dass, and A. K. Jain, “Localized iris image quality using 2-d wavelets,” in Advances in Biometrics, Springer, 2005, pp. 373–381.
[140] S. Cremer, B. Dorizzi, S. Garcia-Salicetti, and N. Lempérière, “How a local quality measure can help improving iris recognition,” in Biometrics Special Interest Group (BIOSIG), 2012
BIOSIG-Proceedings of the International Conference of the, 2012, pp. 1–6.
[141] Y.-H. Li and M. Savvides, “An automatic iris occlusion estimation method based on high-dimensional density estimation,” Pattern Anal. Mach. Intell. IEEE Trans., vol. 35, no. 4, pp. 784–796, 2013.

ix
[142] “‘Information Technology’, Biometric Data Interchange Format. Part 5: Face Image Data, ISO/IEC 19794.,” 2004.
[143] D. Reynolds, R. C. Rose, and others, “Robust text-independent speaker identification using Gaussian mixture speaker models,” Speech Audio Process. IEEE Trans., vol. 3, no. 1, pp. 72–83, 1995.
[144] L. R. Rabiner, “A tutorial on hidden Markov models and selected applications in speech recognition,” Proc. IEEE, vol. 77, no. 2, pp. 257–286, 1989.
[145] R. M. Haralick, K. Shanmugam, and I. H. Dinstein, “Textural features for image classification,” Syst. Man Cybern. IEEE Trans., no. 6, pp. 610–621, 1973.
[146] B. Mazaheri and H. Pourghassem, “Iris image classification based on texture and Fourier Mellin Transform features,” in Communication Software and Networks (ICCSN), 2011 IEEE 3rd
International Conference on, 2011, pp. 118–122.
[147] V. V. S. Tallapragada and E. G. Rajan, “Iris recognition based on combined feature of GLCM and Wavelet transform,” in Integrated Intelligent Computing (ICIIC), 2010 First International
Conference on, 2010, pp. 205–210.
[148] R. M. Sundaram and B. C. Dhara, “Neural network based Iris recognition system using Haralick features,” in Electronics Computer Technology (ICECT), 2011 3rd International
Conference on, 2011, vol. 3, pp. 19–23.
[149] A. Zaim, A. Sawalha, M. Quweider, J. Iglesias, and R. Tang, “A New Method for Iris Recognition using Gray-Level Coccurence Matrix,” in Electro/information Technology, 2006
IEEE International Conference on, 2006, pp. 350–353.
[150] D. A. Clausi, M. E. Jernigan, and others, “A fast method to determine co-occurrence texture features,” IEEE Trans. Geosci. Remote Sens., vol. 36, no. 1, pp. 298–300, 1998.
[151] J. R. Ferguson, Using the grey-level co-occurrence matrix to segment and classify radar
imagery. ProQuest, 2007.
[152] M. Hall-Beyer, “GLCM texture: a tutorial,” Natl. Counc. Geogr. Inf. Anal. Remote Sens. Core
Curric., 2000.
[153] T. Ojala, M. Pietikainen, and D. Harwood, “Performance evaluation of texture measures with classification based on Kullback discrimination of distributions,” in Pattern Recognition, 1994.
Vol. 1-Conference A: Computer Vision & Image Processing., Proceedings of the 12th IAPR
International Conference on, 1994, no. 1, pp. 582–585.
[154] T. Ojala, M. Pietikäinen, and T. Mäenpää, “Multiresolution gray-scale and rotation invariant texture classification with local binary patterns,” Pattern Anal. Mach. Intell. IEEE Trans., vol. 24, no. 7, pp. 971–987, 2002.
[155] J. MacQueen and others, “Some methods for classification and analysis of multivariate observations,” in Proceedings of the fifth Berkeley symposium on mathematical statistics and
probability, 1967, vol. 1, no. 14, pp. 281–297.
[156] A. P. Dempster, N. M. Laird, and D. B. Rubin, “Maximum likelihood from incomplete data via the EM algorithm,” J. R. Stat. Soc. Ser. B, pp. 1–38, 1977.
[157] Y. Gong, D. Zhang, P. Shi, and J. Yan, “An optimized wavelength band selection for heavily pigmented iris recognition,” Inf. Forensics Secur. IEEE Trans., vol. 8, no. 1, pp. 64–75, 2013.
[158] B. J. Kang and K. R. Park, “Real-time image restoration for iris recognition systems,” Syst.

x
Man, Cybern. Part B Cybern. IEEE Trans., vol. 37, no. 6, pp. 1555–1566, 2007.
[159] “Face Recognition Grand Challenge.,” 2004. [Online]. Available: http://www.nist.gov/itl/iad/ig/frgc.cfm. [Accessed: 07-Dec-2015].
[160] E. Krichen, L. Allano, S. Garcia-Salicetti, and B. Dorizzi, “Specific texture analysis for iris recognition,” in Audio-and Video-Based Biometric Person Authentication, 2005, pp. 23–30.
[161] N. Schmid, M. V Ketkar, H. Singh, B. Cukic, and others, “Performance analysis of iris-based identification system at the matching score level,” Inf. Forensics Secur. IEEE Trans., vol. 1, no. 2, pp. 154–168, 2006.
[162] K. Hollingsworth, T. Peters, K. W. Bowyer, and P. J. Flynn, “Iris recognition using signal-level fusion of frames from video,” Inf. Forensics Secur. IEEE Trans., vol. 4, no. 4, pp. 837–848, 2009.
[163] R. Jillela, A. Ross, and P. J. Flynn, “Information fusion in low-resolution iris videos using principal components transform,” in Applications of Computer Vision (WACV), 2011 IEEE
Workshop on, 2011, pp. 262–269.
[164] G. Fahmy, “Super-resolution construction of iris images from a visual low resolution face video,” in Signal Processing and Its Applications, 2007. ISSPA 2007. 9th International
Symposium on, 2007, pp. 1–4.
[165] K. Nguyen, C. Fookes, S. Sridharan, and S. Denman, “Quality-driven super-resolution for less constrained iris recognition at a distance and on the move,” Inf. Forensics Secur. IEEE Trans., vol. 6, no. 4, pp. 1248–1258, 2011.
[166] K. Nguyen, C. Fookes, S. Sridharan, and S. Denman, “Feature-domain super-resolution for iris recognition,” Comput. Vis. Image Underst., vol. 117, no. 10, pp. 1526–1535, 2013.
[167] K. Nguyen, S. Sridharan, S. Denman, and C. Fookes, “Feature-domain super-resolution framework for Gabor-based face and iris recognition,” in Computer Vision and Pattern
Recognition (CVPR), 2012 IEEE Conference on, 2012, pp. 2642–2649.
[168] H. Ren, Y. He, J. Pan, and L. Li, “Super resolution reconstruction and recognition for iris image sequence,” in Biometric Recognition, Springer, 2012, pp. 193–201.
[169] N. Mahadeo, A. Paplinski, and S. Ray, “Optimization of Iris Codes for Improved Recognition,” in Computer Vision and Pattern Recognition Workshops (CVPRW), 2014 IEEE Conference on, 2014, pp. 48–55.
[170] M. Bevilacqua, “Algorithms for super-resolution of images and videos based on learning methods,” Rennes 1, 2014.
[171] S. C. Park, M. K. Park, and M. G. Kang, “Super-resolution image reconstruction: a technical overview,” Signal Process. Mag. IEEE, vol. 20, no. 3, pp. 21–36, 2003.
[172] J. Yang and T. Huang, “Image super-resolution: Historical overview and future challenges,” Super-resolution imaging, pp. 20–34, 2010.
[173] H. Ur and D. Gross, “Improved resolution from subpixel shifted pictures,” CVGIP Graph.
Model. Image Process., vol. 54, no. 2, pp. 181–186, 1992.
[174] N. K. Bose, N. Ahuja, and others, “Superresolution and noise filtering using moving least squares,” Image Process. IEEE Trans., vol. 15, no. 8, pp. 2239–2248, 2006.
[175] M. Irani and S. Peleg, “Super resolution from image sequences,” in Pattern Recognition, 1990.
Proceedings., 10th International Conference on, 1990, vol. 2, pp. 115–120.

xi
[176] A. J. Patti, M. I. Sezan, and others, “Superresolution video reconstruction with arbitrary sampling lattices and nonzero aperture time,” Image Process. IEEE Trans., vol. 6, no. 8, pp. 1064–1076, 1997.
[177] R. Y. Tsai and T. S. Huang, “Multiframe image restoration and registration,” Adv. Comput. Vis.
Image Process., vol. 1, no. 2, pp. 317–339, 1984.
[178] S. Rhee and M. G. Kang, “DCT-based regularized algorithm for high-resolution image reconstruction,” in Image Processing, 1999. ICIP 99. Proceedings. 1999 International
Conference on, 1999, vol. 3, pp. 184–187.
[179] N. Woods, N. P. Galatsanos, A. K. Katsaggelos, and others, “Stochastic methods for joint registration, restoration, and interpolation of multiple undersampled images,” Image Process.
IEEE Trans., vol. 15, no. 1, pp. 201–213, 2006.
[180] N. Nguyen and P. Milanfar, “An efficient wavelet-based algorithm for image superresolution,” in Image Processing, 2000. Proceedings. 2000 International Conference on, 2000, vol. 2, pp. 351–354.
[181] S. E. El-Khamy, M. M. Hadhoud, M. I. Dessouky, B. M. Salam, and F. E. A. El-Samie, “Wavelet fusion: A tool to break the limits on LMMSE image super-resolution,” Int. J.
Wavelets, Multiresolution Inf. Process., vol. 4, no. 01, pp. 105–118, 2006.
[182] H. Ji and C. Fermüller, “Wavelet-based super-resolution reconstruction: theory and algorithm,” in Computer Vision--ECCV 2006, Springer, 2006, pp. 295–307.
[183] J. Tian and K.-K. Ma, “Stochastic super-resolution image reconstruction,” J. Vis. Commun.
Image Represent., vol. 21, no. 3, pp. 232–244, 2010.
[184] K. Nguyen, C. Fookes, and S. Sridharan, “Robust mean super-resolution for less cooperative NIR iris recognition at a distance and on the move,” in Proceedings of the 2010 Symposium on
Information and Communication Technology, 2010, pp. 122–127.
[185] K. Y. Shin, K. R. Park, B. J. Kang, and S. J. Park, “Super-resolution method based on multiple multi-layer perceptrons for iris recognition,” in Ubiquitous Information Technologies &
Applications, 2009. ICUT’09. Proceedings of the 4th International Conference on, 2009, pp. 1–5.
[186] L. Ma, Y. Wang, and T. Tan, “Iris recognition using circular symmetric filters,” in Pattern
Recognition, 2002. Proceedings. 16th International Conference on, 2002, vol. 2, pp. 414–417.
[187] J. Huang, L. Ma, T. Tan, and Y. Wang, “Learning Based Resolution Enhancement of Iris Images.,” in BMVC, 2003, pp. 1–10.
[188] S. Geman and D. Geman, “Stochastic relaxation, Gibbs distributions, and the Bayesian restoration of images,” Pattern Anal. Mach. Intell. IEEE Trans., no. 6, pp. 721–741, 1984.
[189] W. T. Freeman, T. R. Jones, and E. C. Pasztor, “Example-based super-resolution,” Comput.
Graph. Appl. IEEE, vol. 22, no. 2, pp. 56–65, 2002.
[190] N. Wiener, Extrapolation, interpolation, and smoothing of stationary time series, vol. 2. MIT press Cambridge, MA, 1949.
[191] M. E. Schuckers, Computational Methods in Biometric Authentication: Statistical Methods for
Performance Evaluation. Springer Science & Business Media, 2010.
[192] R. M. Bolle, S. Pankanti, J. H. Connell, and N. K. Ratha, “Iris individuality: A partial iris model,” in Pattern Recognition, 2004. ICPR 2004. Proceedings of the 17th International

xii
Conference on, 2004, vol. 2, pp. 927–930.
[193] Y. Du, B. Bonney, R. Ives, D. Etter, and R. Schultz, “Analysis of partial iris recognition using a 1D approach,” in Acoustics, Speech, and Signal Processing, 2005. Proceedings.(ICASSP’05).
IEEE International Conference on, 2005, vol. 2, pp. ii–961.
[194] K. P. Hollingsworth, K. W. Bowyer, and P. J. Flynn, “Improved iris recognition through fusion of hamming distance and fragile bit distance,” Pattern Anal. Mach. Intell. IEEE Trans., vol. 33, no. 12, pp. 2465–2476, 2011.
[195] G. Dozier, K. Frederiksen, R. Meeks, M. Savvides, K. Bryant, D. Hopes, and T. Munemoto, “Minimizing the number of bits needed for iris recognition via bit inconsistency and grit,” in Computational Intelligence in Biometrics: Theory, Algorithms, and Applications, 2009. CIB
2009. IEEE Workshop on, 2009, pp. 30–37.
[196] C. Rathgeb, A. Uhl, and P. Wild, “On combining selective best bits of iris-codes,” in Biometrics
and ID Management, Springer, 2011, pp. 227–237.
[197] C. Rathgeb, A. Uhl, and P. Wild, “Incremental iris recognition: A single-algorithm serial fusion strategy to optimize time complexity,” in Biometrics: Theory Applications and Systems (BTAS),
2010 Fourth IEEE International Conference on, 2010, pp. 1–6.
[198] J. E. Gentile, N. Ratha, and J. Connell, “SLIC: Short-length iris codes,” in Biometrics: Theory,
Applications, and Systems, 2009. BTAS ’09. IEEE 3rd International Conference on, 2009, pp. 1–5.
[199] “Multimedia University, MMU iris image database,” 2004.
[200] J. E. Gentile, N. Ratha, and J. Connell, “An efficient, two-stage iris recognition system,” in Biometrics: Theory, Applications, and Systems, 2009. BTAS’09. IEEE 3rd International
Conference on, 2009, pp. 1–5.
[201] W. Dong, Z. Sun, and T. Tan, “Iris matching based on personalized weight map,” Pattern Anal.
Mach. Intell. IEEE Trans., vol. 33, no. 9, pp. 1744–1757, 2011.
[202] H. Proenca, “Iris Recognition: What Is Beyond Bit Fragility?,” Inf. Forensics Secur. IEEE
Trans., vol. 10, no. 2, pp. 321–332, 2015.
[203] E. Krichen, “Reconnaissance des personnes par l’iris en mode dégradé,” Evry, Institut national des télécommunications, 2007.

i
Appendix A: Personal publications
International conferences:
• Nadia Othman, Nesma Houmani, Bernadette Dorizzi: Improving Video-based Iris Recognition
Via Local Quality Weighted Super Resolution, in International Conference on Pattern
Recognition Applications and Methods (ICPRAM), Barcelona, Spain, 2013.
• Dalila Benboudjema, Nadia Othman, Bernadette Dorizzi, Wojciech Pieczynski: Challenging
eye segmentation using Triplet Markov spatial models, in International Conference on
Acoustics, Speech and Signal Processing (ICASSP), Vancouver, Canada, 2013.
• M. Zhang, J. Liu, Z. Sun, T. Tan, W. Su, F. Alonso-Fernandez, V. Nemesin, N. Othman, K.
Noda, P. Li, E. Hoyle, A. Josh: The First ICB Competition on Iris Recognition, in international
Joint Conference on Biometrics (IJCB), Florida, USA, 2014.
National conference:
• Dalila Benboudjema, Nadia Othman, Bernadette Dorizzi, Wojciech Pieczynski: Segmentation
d’images des yeux par champs de markov triplets: Application à la biométrie, in proceedings
to Colloque GRETSI, 2013.
Book chapter:
• Nadia Othman, Nesma Houmani, and Bernadette Dorizzi: Quality-Based Super Resolution for
Degraded Iris Recognition, in Advances in Intelligent Systems and Computing, Series “Pattern
Recognition Applications and Methods”, vol. 318, Springer, Jan. 2015.
International journals:
• Nadia Othman, and Bernadette Dorizzi: Impact of Quality-Based Fusion Techniques for
Video-Based Iris Recognition at a Distance, in Information Forensics and Security, IEEE
Transactions on , vol.10, no.8, pp.1590-1602, Aug. 2015.
• Nadia Othman, Bernadette Dorizzi, and Sonia Garcia-Salicetti: OSIRIS: An Open Source Iris
Recognition Software, in Pattern Recognition Letters (accepted in Sept 2015).

ii

iii
Appendix B: QFIRE subset and protocols
The subset is available upon request. See CITER website:
http://clarkson.edu/citer/research/collections/face_iris_research.html
The protocols are available online:
http://svnext.it-sudparis.eu/svnview2-eph/ref_syst/QFIRE_protocols/
Quality Face and Iris Research Ensemble (QFIRE) [1] [2] is a multimodal database composed of iris
and face videos, recorded at Clarkson University. The acquisition was funded by the Department of
Homeland Security (DHS) Science and Technology (S&T) Directorate in cooperation with the
National Science Foundation. QFIRE contains a large number of various acquisition scenarios. The
sequences are collected at varying distances and different quality levels, entirely controlled during the
acquisition.
As we address the problem of iris recognition at a distance, we have selected 3 subsets from
the QFIRE database which seem to us interesting for our context. More precisely, we have proposed in
[3] several systems aiming at improving the poor performance resulting from image degradations (low
resolution, blur, and lack of texture) obtained from such distant acquisitions. Our approaches are based
on simple super-resolution techniques applied at the pixel level on the different frames of a video,
improved by taking into account some quality criteria.
The 3 selected subsets correspond to the scenario “illumination” at the medium quality level,
and at different distances: 5, 7 and 11 feet of QFIRE database. This variability in the distance was
introduced to produce high, medium and low resolution iris images. The quality factor "resolution" is
defined as the number of pixels across the horizontal diameter of the iris. In addition, during the
acquisition procedure of QFIRE, an intentional defocus blur was added to each sequence by manually
turning the focus ring of the iris camera in order to generate some non-uniformity in each video
sequence. Note that the subjects are static.
To study the contribution of our fusion approaches, we benchmarked them on these 3 distances
by comparing videos against videos as protocol.
Dataset overview:
To build the dataset, we first tracked right and left eyes in the NIR videos. In particular, the sequences
contain entire (at long distances) or partial faces (at close distance). To localize the eyes, in the case of

iv
entire faces, we used the MATLAB code developed in [4] based on an enhanced pictorial structure
model for precise eye localization. In order to track the eyes in partial faces, we used a simple
implementation based on a Hough transform. Due to the intentional defocus blur added at the
beginning and the end during the sequence acquisition, we have discarded unusable frames and for this,
we used wavelet transform. To increase the number of videos, long sequences were divided into
sequences of 10 frames. In order to increase the number of intra-class comparisons, we divided the
sequences with a large number of usable frames into multiple sequences of 10 frames. We give in
TABLE 1 a summary of the dataset we obtained after all these pre-processing processes.
Those interested in these datasets can request a copy from Clarkson University at the following email
address: [email protected]. Any questions related to requesting the dataset can also be directed to:
TABLE 1: CHARACTERISTICS OF EACH OF THE 3 SUBSETS OF QFIRE DATABASE USED IN [3].
Acquisition distance 5 feet 7 feet 11 feet
Database nomination QFIRE05 QFIRE07 QFIRE11
Number of sequences 662 453 361
Number of frames per
sequence 10 10 10
Number of class 166 160 113
Number of sequence per
class 2 to 6 2 to 6 2 to 6
Image size 680 x520 (mostly) 640x480 (mostly) 280x440
Format bmp bmp bmp
Iris Resolution 280 to 300 200 to 220 100 to 120
Quality level (resolution) High Medium Low
Subset comparable to Higher quality of UBIRIS
datasets
Medium quality of CASIA
and BioSecure datasets
Low quality MBGC
dataset (NIR face
camera)
Illumination level Medium Medium Medium
Number of session 2 2 2
Sensor Dalsa 4M30 infrared
camera
Dalsa 4M30 infrared
camera
Dalsa 4M30 infrared
camera
Other information Possible presence of blur,
spot light and occlusion
Possible presence of blur,
spot light and occlusion
Possible presence of blur,
spot light and occlusion
The convention name of the images is as follows:
(Subject Number)_illumination_(Distance)_ft_M(Sequence Number)-F(Frame Number)-(Iris).bmp

v
where:
Distance: [05, 07, 11]
Iris: [LEFT, RIGHT]
Protocols:
The protocols are available online:
http://svnext.it-sudparis.eu/svnview2-eph/ref_syst/QFIRE_protocols/
List of images:
The lists of the images are available in the folder: “./List of images/”. For example, the file:
“ImList_05ft_session1.txt” lists the images of QFIRE05 subset, acquired during the first session. Each
line represents the ten used images for each sequence.
List of matching:
The matching protocol is based on a comparison of N fused frames (session1) vs. N fused frames
(session2). TABLE 2 reports the number of comparisons for each subset.
TABLE 2: NUMBER OF COMPARISONS FOR EACH SUBSET OF QFIRE DATABASE USED IN [3].
Database nomination QFIRE05 QFIRE07 QFIRE11
Intra-class comparisons 670 320 293
Inter-class comparisons 108722 50676 32231
The matching lists are available in the folder: “./List of matching/”. For example the text file
“InterMatchingList_05ft.txt” gives the inter-class comparisons of QFIRE05. The first and second
column respectively represents the name of the fused template obtained from the sequence acquired in
the first and second session. The convention name of the fused template is as follows:
(Subject Number)_illumination_(Distance)_ft_M(Sequence Number)-(Iris)_(Session).bmp
where:
Distance: [05, 07, 11]
Iris: [LEFT, RIGHT]
Session: [1, 2]

vi
References
Please cite the following references on any work made public based directly or indirectly on the data
we have presented in this document:
“N. Othman, and B. Dorizzi: Impact of Quality-Based Fusion Techniques for Video-Based Iris
Recognition at a Distance, in Information Forensics and Security, IEEE Transactions on , vol.10, no.8,
pp.1590-1602, Aug. 2015.”
Please, do not forget also to cite the references of the original QFIRE database, as indicated by its
owners.
Contact:
Questions regarding these datasets and protocols can be directed toward:
Nadia Othman: [email protected]
Bernadette Dorizzi: [email protected]
Bibliography:
[1] S. Schuckers, P. Meyer Lopez, P. Johnson, N. Sazonova, F. Hua, R. Lazarick, C. Miles, E. Tabassi,
E. Sazonov, A. Ross, and L. Hornak, “Quality--Face / Iris Research Ensemble (Q-FIRE) Data
Collection Steps,” 2010.
[2] S. Schuckers, P. Meyer Lopez, P. Johnson, N. Sazonova, F. Hua, R. Lazarick, C. Miles, E. Tabassi,
E. Sazonov, A. Ross, and L. Hornak, “Quality--Face / Iris Research Ensemble (Q-FIRE) Dataset
Overview,” 2010.
[3] N. Othman, and B. Dorizzi: Impact of Quality-Based Fusion Techniques for Video-Based Iris
Recognition at a Distance, in Information Forensics and Security, IEEE Transactions on , vol.10, no.8,
pp.1590-1602, Aug. 2015.
[4] X. Tan, F. Song, Z.-H. Zhou, and S. Chen, “Enhanced pictorial structures for precise eye
localization under incontrolled conditions,” in Computer Vision and Pattern Recognition, 2009. CVPR
2009. IEEE Conference on, 2009, pp. 1621–1628.