Thesis-Olivia-Gugger-Volltext.pdf - edoc.unibas.ch
147
Mechanisms and Consequences of Reduced Dendritic Growth of Cerebellar Purkinje Cells Inauguraldissertation Zur Erlangung der Würde eines Doktors der Philosophie vorgelegt der Philosophisch-Naturwissenschaftlichen Fakultät der Universität Basel von Olivia Sarah Gugger aus Frauenfeld (TG) Basel, 2012 Originaldokument gespeichert auf dem Dokumentenserver der Universität Basel edoc.unibas.ch Dieses Werk ist unter dem Vertrag „Creative Commons Namensnennung-Keine kommerzielle Nutzung-Keine Bearbeitung 2.5 Schweiz“ lizenziert. Die vollständige Lizenz kann unter creativecommons.org/licences/by-nc-nd/2.5/ch eingesehen werden.
-
Upload
khangminh22 -
Category
Documents
-
view
2 -
download
0
Transcript of Thesis-Olivia-Gugger-Volltext.pdf - edoc.unibas.ch

Mechanisms and Consequences of Reduced Dendritic Growth of Cerebellar Purkinje Cells
Inauguraldissertation
Zur
Erlangung der Würde eines Doktors der Philosophie
vorgelegt der
Philosophisch-Naturwissenschaftlichen Fakultät
der Universität Basel
von
Olivia Sarah Gugger
aus Frauenfeld (TG)
Basel, 2012
Originaldokument gespeichert auf dem Dokumentenserver der Universität Basel edoc.unibas.ch
Dieses Werk ist unter dem Vertrag „Creative Commons Namensnennung-Keine kommerzielle Nutzung-Keine Bearbeitung 2.5 Schweiz“ lizenziert. Die vollständige Lizenz kann unter creativecommons.org/licences/by-nc-nd/2.5/ch eingesehen werden.

2
Genehmigt von der Philosophisch-Naturwissenschaftlichen Fakultät
auf Antrag von
Prof. Josef Kapfhammer Prof. Markus Rüegg Prof. Peter Scheiffele Basel, den 13. Dezember 2011
Dekan Prof. Martin Spiess

Namensnennung-Keine kommerzielle Nutzung-Keine Bearbeitung 2.5 Schweiz
Sie dürfen:
das Werk vervielfältigen, verbreiten und öffentlich zugänglich machen
Zu den folgenden Bedingungen:
Namensnennung. Sie müssen den Namen des Autors/Rechteinhabers in der von ihm festgelegten Weise nennen (wodurch aber nicht der Eindruck entstehen darf, Sie oder die Nutzung des Werkes durch Sie würden entlohnt).
Keine kommerzielle Nutzung. Dieses Werk darf nicht für kommerzielle Zwecke verwendet werden.
Keine Bearbeitung. Dieses Werk darf nicht bearbeitet oder in anderer Weise verändert werden.
• Im Falle einer Verbreitung müssen Sie anderen die Lizenzbedingungen, unter welche dieses Werk fällt, mitteilen. Am Einfachsten ist es, einen Link auf diese Seite einzubinden.
• Jede der vorgenannten Bedingungen kann aufgehoben werden, sofern Sie die Einwilligung des Rechteinhabers dazu erhalten.
• Diese Lizenz lässt die Urheberpersönlichkeitsrechte unberührt.
Quelle: http://creativecommons.org/licenses/by-nc-nd/2.5/ch/ Datum: 3.4.2009
Die gesetzlichen Schranken des Urheberrechts bleiben hiervon unberührt.
Die Commons Deed ist eine Zusammenfassung des Lizenzvertrags in allgemeinverständlicher Sprache: http://creativecommons.org/licenses/by-nc-nd/2.5/ch/legalcode.de
Haftungsausschluss:Die Commons Deed ist kein Lizenzvertrag. Sie ist lediglich ein Referenztext, der den zugrundeliegenden Lizenzvertrag übersichtlich und in allgemeinverständlicher Sprache wiedergibt. Die Deed selbst entfaltet keine juristische Wirkung und erscheint im eigentlichen Lizenzvertrag nicht. Creative Commons ist keine Rechtsanwaltsgesellschaft und leistet keine Rechtsberatung. Die Weitergabe und Verlinkung des Commons Deeds führt zu keinem Mandatsverhältnis.

3
Table of Contents
List of Abbreviations ................................................................................................ 8
Summary ................................................................................................................. 10
1. INTRODUCTION ............................................................................................. 12
1.1. General Dendritic Development ....................................................................... 12
1.1.1. Overview ............................................................................................... 12
1.1.2. Dendritic growth regulation by extracellular molecules ......................... 15
1.1.3. Internal pathways to integrate external signals ..................................... 18
1.1.4. Dendritic growth regulation by transcriptional programs ....................... 20
1.2. Cerebellum ....................................................................................................... 22
1.2.1. Cerebellar Cytology .............................................................................. 24
1.2.2. Functional aspects ................................................................................ 27
1.2.3. Basics of cerebellar development ......................................................... 28
1.3. Purkinje cell development ................................................................................. 30
1.3.1. Overview ............................................................................................... 30
1.3.2. External aspects influencing Purkinje cell dendritic development ......... 34
1.3.3. The role of PKC in Purkinje cell dendritic development ........................ 37
1.3.4. The role of mGluR1 in Purkinje cell dendritic development ................... 38
1.4. The cerebellar slice culture model .................................................................... 40
2. SPECIFIC AIMS OF THE THESIS ........................................................................ 42
2.1. The role of Purkinje cell dendritic tree size in excitotoxicity .............................. 42
2.2. Analysis of the signaling pathways mediating dendritic growth inhibition after chronic mGluR1 or PKC activation ............................................................................. 43

4
3. DENDRITIC TREE SIZE IN EXCITOTOXICITY ......................................................... 45
Reduced size of the dendritic tree does not protect Purkinje cells from excitotoxic death .................................................................................................... 45
3.1. Abstract ............................................................................................................ 46
3.2. Introduction ....................................................................................................... 46
3.3. Materials and Methods ..................................................................................... 48
3.3.1. Organotypic slice cultures ..................................................................... 48
3.3.2. Immunohistochemistry .......................................................................... 49
3.3.3. Quantitative analysis of Purkinje cell survival and dendritic tree size .... 50
3.4. Results ............................................................................................................. 53
3.4.1. AMPA kills Purkinje cells in a dose dependent manner ........................ 53
3.4.2. Pre-treatment with DHPG or PMA reduces dendritic tree size without a strong impact on cell survival ............................................................................. 54
3.4.3. Normal sensitivity to AMPA induced neurotoxic death of Purkinje cells with small dendritic trees after PMA-treatment or DHPG-treatment ................... 57
3.4.4. Glutamatergic synapses are abundantly available even on severely reduced dendritic trees ....................................................................................... 58
3.4.5. Cerebellar granule cells survive high doses of AMPA and start to express Calbindin D-28K immunoreactivity ........................................................ 60
3.5. Discussion ........................................................................................................ 61
3.5.1. Purkinje cell excitotoxic death ............................................................... 61
3.5.2. The role of the dendritic compartment for excitotoxic neuronal damage 62
3.5.3. Resistance of granule cells to AMPA treatment .................................... 63
3.6. Conclusion ........................................................................................................ 64

5
4. MECHANISMS OF DENDRITIC GROWTH INHIBITION MEDIATED BY CHRONIC MGLUR1
OR PKC ACTIVATION ........................................................................................... 65
P/Q-type and T-type calcium channels, but not TRPC3 channels, are involved in inhibition of dendritic growth after chronic mGluR1 and PKC activation in cerebellar Purkinje cells......................................................................................... 65
4.1. Abstract ............................................................................................................ 66
4.2. Introduction ....................................................................................................... 67
4.3. Materials and Methods ..................................................................................... 68
4.3.1. Organotypic slice cultures ..................................................................... 68
4.3.2. Immunocytochemistry ........................................................................... 69
4.4. Results ............................................................................................................. 71
4.4.1. Inhibition of T-, N- and P/Q-type Ca2+ channels in cerebellar slice cultures does not affect dendritic tree size in Purkinje cells ............................... 71
4.4.2. Inhibition of either T- or P/Q-type calcium channels alone could not rescue dendritic growth after mGluR1 stimulation .............................................. 73
4.4.3. Combined inhibition of T- and P/Q-type calcium channels rescued Purkinje cell dendritic growth after mGluR1 stimulation ..................................... 73
4.4.4. T- and P/Q-type calcium channels mediate inhibition of Purkinje cell dendritic growth after PKC activation ................................................................. 76
4.4.5. TRPC3-/- and wild-type cultures were equally sensitive to dendritic growth inhibition mediated by DHPG or PMA .................................................... 79
4.4.6. Rescue of dendritic growth by the combined inhibition of P/Q- and T-type Ca2+ channels is not altered in the absence of TRPC3 ...................................... 81
4.4.7. Selective pharmacological inhibition of TRPC3 channels did not alter DHPG- or PMA-mediated dendritic growth inhibition or the rescue effects obtained by combined blockade of P/Q- and T-type Ca2+ channels ................... 85
4.4.8. Inhibition of Phospholipase C, GluRδ2 - or R-type Ca2+ channels did not increase the rescue effects obtained by combined inhibition of P/Q- and T-type Ca2+ channels .................................................................................................... 87
4.5. Discussion ........................................................................................................ 91
4.5.1. TRPC3 channels are not required for inhibition of dendritic growth of Purkinje cells ...................................................................................................... 91

6
4.5.2. Inhibition of Purkinje cell dendritic growth involves Ca2+ entry through voltage gated channels ...................................................................................... 92
4.5.3. Pharmacological compounds blocking T-type Ca2+ channels are toxic to Purkinje cell axons ............................................................................................. 94
4.5.4. The role of Ca2+ homeostasis for Purkinje cell dendritic growth ............ 94
4.6. Supporting information ..................................................................................... 96
5. ADDITIONAL DATA ......................................................................................... 98
5.1. The common TRPC inhibitor SK&F 96365 was in high concentrations toxic to Purkinje cell axons independent of TRPC3 ................................................................ 98
5.2. Compounds which had no effect on dendritic growth after mGluR1 or PKC stimulation .................................................................................................................. 99
5.2.1. Nimodipine: inhibitor of L-type calcium channels .................................. 99
5.2.2. BAPTA-AM: intracellular calcium chelation ......................................... 100
5.3. Morphological analysis of Purkinje cell spines using confocal microscopy ..... 103
6. GENERAL DISCUSSION ................................................................................ 106
6.1. What might be the cause of Purkinje cell vulnerability to excitotoxic death? .. 106
6.2. What are the differences between the similar effects induced by chronic mGluR1 and PKC activation? ................................................................................... 108
6.3. Inhibition of Purkinje cell dendritic growth involves Ca2+ entry through voltage gated channels of the T- and the P/Q-type ............................................................... 109
7. CONCLUSION AND OUTLOOK ........................................................................ 111
7.1. Physiological relevance of limiting dendritic size after chronic activation of mGluR1 or PKC ........................................................................................................ 111
7.2. Further studies on dendritic growth inhibition induced by chronic mGluR1 or PKC activation .......................................................................................................... 111

7
7.3. Blockade of T-type and P/Q-type Ca2+ channels partially rescues dendritic trees from mGluR1 and PKC induced dendritic growth inhibition ............................. 112
8. MATERIALS AND METHODS .......................................................................... 113
8.1. Cerebellar slice cultures ................................................................................. 113
8.1.1. Media and prearrangements for cerebellar slice cultures ................... 113
8.1.2. Procedure ........................................................................................... 114
8.2. Experiments and maintenance of the cultures ................................................ 115
8.2.1. Pharmacological agents ...................................................................... 115
8.2.2. The role of dendritic tree size in excitotoxicity: .................................... 116
8.2.3. Pathway analysis of mGluR1- and PKC-induced dendritic growth inhibition ........................................................................................................... 117
8.3. Immunocytochemistry ..................................................................................... 117
8.4. Genotyping of TRPC3-/- mice .......................................................................... 118
8.4.1. Protocol for isolation of DNA ............................................................... 118
8.4.3. Gel electrophoresis ............................................................................. 119
8.5. Quantitative analysis of cultured Purkinje cells ............................................... 120
References ............................................................................................................ 122
Acknowledgements .............................................................................................. 143
Curriculum Vitae ................................................................................................... 144

8
List of Abbreviations
AMPA (RS)-a-Amino-3-hydroxy-5-methyl-4-isoxazolepropionic acid (AMPA)
BDNF brain-derived neurotrophic factor
bHLH basic helix-loop-helix
Ca calcium
CB6 B6CF1, mouse strain
CF climbing fiber
CGN cerebellar granule cell
CNS central nervous system
DCN deep cerebellar neuron
DHPG (RS)-3,5-Dihydroxyphenylglycine
DIV days in vitro
E embryonic day
EAAT excitatory ammino acid transporter
EGL external granule layer
ES cell external sensory cells
EtD a 1:1 mixture of ethanol and dimethyl sulfoxide
FBP fructose 1,6-bisphosphate
GluRδ2 glutamate receptor δ2
GNP granule neuron precursor
IGL internal granule layer
LTD long term depression
MD cell multidendritic cell
mGluR1 metabotropic glutamate receptor, type 1
ML molecular layer
MW molecular weight
mwk moonwalker
Nasp naphtyl-acetyl spermine
NGF nerve growth factor
NT neurotrophin
P postnatal day
P/Q-block combination of 100 nM ω-agatoxin IVA and 1 μM ω-conotoxin MVIIC
PTN pleiotrophin

9
PTPζ protein tyrosine phosphatase zeta
PB phosphate buffer
PC Purkinje cell
PCL Purkinje cell layer
PCR polymerase chain reaction
PF parallel fiber
PKC protein kinase C
PLC phospholipase C
PM preparation medium
PMA phorbol-12-myristate-13-acetate
PNS peripheral nervous system
RGC retinal ganglion cell
RL rhombic lip
ROR α retinoid-related orphan receptor α
SCA spinocerebellar ataxia
sEPSP slow excitatory postsynaptic potential
SGC soluble guanylate cyclase
Shh sonic hedgehog
SKF SKF&F 96365
SS stock solution
TBI traumatic brain injury
TF transcription factor
TRPC3 transient receptor potential cation channel, type 3
UBN unipolar brush neuron
VDCC voltage dependent calcium channel
vGluT vesicular glutamate transporter
VZ ventricular zone

10
Summary The cerebellum is a brain region crucial for coordination and motor learning. Being
the principal output cell of the cerebellar cortex, Purkinje cell loss and degeneration
play an important role in many cerebellar diseases. The most striking feature of
cerebellar Purkinje cells is their large and extensively branched dendritic tree, which
is almost flat and strictly arranged in the sagittal plane. The factors and molecules
which control the growth and patterning of neuronal dendrites are still poorly
understood. Previous research in our lab has shown that chronic activation of
metabotropic glutamate receptor 1 (mGluR1) (Sirzen-Zelenskaya et al., 2006) or
Protein Kinase C (PKC) (Metzger & Kapfhammer, 2000; Schrenk et al., 2002) in
organotypic cerebellar slice cultures of postnatal mice severely inhibits the growth
and development of the Purkinje cell dendritic tree.
Although we found that the similar effect induced by mGluR1 or PKC is mediated by
independent mechanisms (Sirzen-Zelenskaya et al., 2006), the signaling events
leading to inhibition of dendritic growth after both mGluR1 and PKC activation remain
largely unknown. Another intriguing question is that of the physiological relevance of
limiting dendritic size after chronic activation of a metabotropic glutamate receptor.
We addressed both aspects using organotypic cerebellar slice cultures. In this culture
model, a 300 µm thick slice of cerebellar tissue is kept in culture, where the natural
microenvironment of a cell with neighboring cell-cell interactions and local neuronal
networks are preserved. In order to study Purkinje cell dendritic development,
cerebella from mice were cultured shortly before Purkinje cells enter the
developmental stage of rapid dendritic growth and expansion, and were maintained
for 10-12 days.
Purkinje cells are especially affected in various diseases involving excitotoxicity. We
have tested the hypothesis that it is the size of the dendritic tree which determines
Purkinje cell sensitivity to excitatory overload. Therefore, we have grown Purkinje
cells under conditions which result in a strong reduction of dendritic tree size. Then
we have exposed the cultures to (RS)-a-Amino-3-hydroxy-5-methyl-4-
isoxazolepropionic acid (AMPA), which is an appropriate model system to study
excitotoxic neurodegeneration in the cerebellum as it selectively kills Purkinje cells
but leaves cerebellar granule cells unharmed. Our results indicate that a reduction of
the size of the dendritic tree in Purkinje cells does not offer any protection from
glutamate-induced excitotoxicity. Staining for the vesicular glutamate transporter

11
vGluT1 revealed a high density of glutamatergic synapses on the stunted dendritic
trees of pre-treated Purkinje cells. This suggests that receptor density rather than
total receptor load is important for determining the sensitivity of Purkinje cells to
AMPA-mediated neurotoxicity.
In a second study we have searched for potential mechanisms limiting Purkinje cell
dendritic growth and have concentrated on channels allowing the entry of Ca2+ ions,
especially the TRPC3, P/Q-type and T-type Ca2+ channels.
To analyze the roles of these channels in mediating dendritic reduction induced by
mGluR1 or PKC we have treated Purkinje cells in cerebellar slice cultures with the
mGluR1 activator DHPG or the PKC activator PMA and simultaneously with different
combinations of Ca2+ channel inhibitors. After the culture period, the size of the
dendritic trees was evaluated.
Co-treatment with a combination of P/Q- and T-type inhibitors partially rescued the
dendrite-reducing effects induced by DHPG or PMA treatment. In contrast, no
improvement of dendritic growth was found in mice lacking TRPC3 function or using
an acute pharmacological TRPC3 inhibitor. Furthermore, the partial rescue obtained
by P/Q- and T-type inhibition was not further increased by additional co-treatments
with inhibitors of GluRδ2 - or R-type Ca2+ channels, or of Ca2+ release from internal
stores.
In conclusion, our results suggest that T-type and P/Q-type Ca2+ channels are part of
the signaling pathways induced after chronic mGluR1 and PKC stimulation resulting
in the inhibition of dendritic growth, while no involvement of TPRC3-, GluRδ2-, R-type
Ca2+ channels or Ca2+ release from intracellular stores was found.

12
1. Introduction
1.1. General Dendritic Development
1.1.1. Overview
There are a large number of different neurons in the nervous system, and each type
develops a specific set of dendrites which is precisely adapted to a specific neuron’s
function and role in neuronal circuits. Demonstrating the essential significance of
dendrites in cognition, aberrant dendritic morphologies have been found in several
conditions of mental retardation (reviewed in (Kaufmann & Moser, 2000)) as well as
in diseases such as schizophrenia (Broadbelt et al., 2002).
Dendritic structures vary in size and complexity and, as a consequence, in the
number of synapses they bear (Purves & Hume, 1981). Dendrites carry some
characteristic features that are responsible for the way a neuron integrates various
synaptic inputs and reacts to them with action potentials and/or synaptic plasticity
(Hausser et al., 2000). Given this highly specialized structure of individual dendrites it
is not surprising that dendritic development is a complicated process that involves
genetic programs running in concert with reactions to environmental extracellular
signals.
In general, dendritic development starts after the axon has emerged from the cell
body (Gao et al., 1999; Wu et al., 1999). It can be subdivided into three major stages
(Wu et al., 1999) (see Fig. 1):
1. (See Fig. 1 A). During the outgrowth of the primary dendrites overall dendritic
growth is dynamic but slow and few branches with growth cones are present
(Dailey & Smith, 1996; Wu et al., 1999).
2. (See Fig. 1 B). Concurrent with the beginning of synaptogenesis, filopodia
emerge from the dendritic shafts (Dailey & Smith, 1996). Synapses can be
found on filopodia as well as on dendritic shafts. The dendritic trees gain
complexity in a highly dynamic manner with branches and filopodia rapidly
rearranging by addition, retraction, resorption or elongation and stabilization to
become dendritic branches or spines (Papa et al., 1995; Dailey & Smith, 1996;
Saito et al., 1997; Fiala et al., 1998; Cline, 2001). In fact, turnover of filopodia

13
occurs within less than a minute (Dailey & Smith, 1996; Williams & Truman,
2004).
Besides interstitial branching, where a filopidium emerges from the dendritic
trunk, an alternative mechanism for branching is the splitting of growth cones,
which happens under some circumstances in cultured neurons (Bray, 1973).
The rapid dynamic motility of dendrites has been proposed to be intrinsically
regulated (Dunaevsky et al., 1999), while other studies have found dendritic
motility to be responsive to external stimulation (Maletic-Savatic et al., 1999)
as well as to application of glutamate and NMDA (Segal, 1995; Korkotian &
Segal, 1999). The differences between findings in different studies are to be
expected because the effects of activity on dendrites depend on the age of the
dendrites as well as on the exact way, intensity and even location of the
applied activity (Bravin et al., 1999).
3. (See Fig. 1 C). In the end-phase of synaptogenesis, filopodia are more and
more stabilized to become spines and overall motility of terminal branches is
slowing down as the dendritic tree takes its terminal shape (Dailey & Smith,
1996; Dunaevsky et al., 1999). Limitation of dendritic growth plays an
important role at this stage of development. A striking example is a
phenomenon called tiling, which has been described in the vertebrate retina,
where it has first been observed (Wassle et al., 1981), as well as in several
types of neurons in Drosophila (Grueber et al., 2002; Millard et al., 2007; Soba
et al., 2007; Ting et al., 2007). One speaks of tiling when dendrites of the
same type of neurons completely cover a receptive area, but their dendritic
fields do not overlap. They do overlap, however, with dendrites of other
classes of neurons. To establish this situation, there must be a repulsive signal
upon interaction with neighboring dendrites of the same type. Dscam2, a
transmembrane adhesion molecule of the immunoglobulin superfamily,
mediates tiling behavior in L1 lamina neurons in Drosophila by homophilic
binding and repulsion (Millard et al., 2007). Also a very important role in tiling
and branching in Drosophila sensory neurons play the products of the genes
tricornered (trc) and furry (fry) (Emoto et al., 2004). The serine/threonine
kinase Trc (Tamaskovic et al., 2003) is activated by the large protein Fry to
mediate a repulsive response after contact with like dendrites (Emoto et al.,
2004). Appropriately, mammalian Fry has been shown to bind to microtubules

14
(Tamaskovic et al., 2003), thus having a possibility to influence dendritic
growth patterns.
A related phenomenon to tiling is self-avoidance, which is crucial for
segregation of dendritic branches of the same cell (Kramer & Stent, 1985).
The molecular basis of self-avoidance was identified in Drosophila as Dscam1,
another protein of the immunoglobulin superfamily, which can be spliced in
over 38’000 of different ways (Schmucker et al., 2000). Each neuron
expresses on its surface a specific set of Dscam1 splice variants (Neves et al.,
2004). If Dscam1 molecules of the same splice variant bind to each other, as it
statistically only happens when dendritic branches of the same cell meet, they
generate a repulsive signal that causes the branches to turn and grow in a
different direction (Wojtowicz et al., 2004; Hattori et al., 2007a; Matthews et
al., 2007).
Vertebrate Dscam was recently shown to carry out a similar function in the
mouse retina. Mutant mice lacking functional Dscam had severe defects in
arborization and mosaic-like distribution of cell bodies in only those retinal
amacrine cell types which naturally express Dscam (Fuerst et al., 2008).
Unlike Dscam1 in Drosophila, vertebrate Dscam appeared to be responsible
for both self-avoidance (arborization) and tiling. In about 60 % of retinal
ganglion cells and retinal interneurons, either Dscam or a closely related
adhesion molecule of the immunoglobulin superfamily (DscamL, Sidekick-1 or
Sidekick-2) has been found to be expressed and play a role in arborization of
the neurons in a specific sublamina of the inner plexiform layer (Yamagata &
Sanes, 2008).

15
Figure 1: Stages of dendritic development. A) Outgrowth of primary dendrites, slow overall dendritic growth. B) Fast and highly dynamic dendritic growth and synaptogenesis C) Slow dendritic growth, refinement of dendritic tree, stabilization of synapses and spines, tiling. Picture adapted from (Wong & Wong, 2000).
Regarding dendritic development in a larger context than motility of single branches,
directed neuronal activity has been shown to be highly influential in various cell types
and species. For example, mice which were raised in a so-called enriched
environment, promoting learning and social interaction, developed larger dendritic
trees selectively in the Hippocampus, a brain region essential for learning and
memory (Faherty et al., 2003). Similarly, in Xenopus laevis tadpoles, 4 hours of light
stimulation proved sufficient to enhance dendritic growth in optical tectal neurons
even during a following 4 hour’s period in the dark (Sin et al., 2002). Similarly,
pharmacological inhibition of synaptic activity in the CA1 region of early postnatal
mice resulted in decreased branching of pyramidal cells (Groc et al., 2002).
1.1.2. Dendritic growth regulation by extracellular molecules
Apart from neurotransmitter-conveyed signals there are other extrinsic cues that have
been found to be influential on dendritic development and mediate interneuronal
communication. I would like to introduce a few interesting examples.
Several hormones have been found to have specific effects on dendritic growth in
certain brain regions. For example, Pyramidal cells in the CA3 region of the
Hippocampus reacted to hyperthyroidism with increased dendritic growth and
branching (Gould et al., 1990b) and, consistently, to hypothyroidism with reduced

16
dendritic trees (Rami et al., 1986). Pyramidal cells in the CA1 region, on the other
hand, responded to thyroid treatment with a decrease in spine density, but no
changes in dendritic growth and branching were observed (Gould et al., 1990a;
Gould et al., 1990b).
The neurotrophins comprise at least four proteins: nerve growth factor (NGF), which
was first discovered in the 1950’s (Cohen et al., 1954), neurotrophin-3 (NT-3),
neurotrophin-4 (NT-4) and brain-derived neurotrophic factor (BDNF). Their receptors
are the low-affinity receptor p75 and the high-affinity receptor-kinases TrkA, TrkB and
TrkC. Trks are tyrosine kinases and differentially expressed in the developing CNS
(Martin-Zanca et al., 1986; Ringstedt et al., 1993; Segal, 2003).
In one of the first studies to investigate the role of a neurotrophins in dendritic
development, neonatal rats were treated with NGF for 1 or 2 weeks, which resulted in
highly significant increase of dendritic length, branching and number of primary
dendrites in sympathetic ganglion neurons (Snider, 1988).
The effect of neurotrophins on cortical pyramidal neurons in the CNS has been
addressed in several studies. For example, in organotypic slice cultures of the
developing visual cortex of ferrets, treatment with NGF, BDNF, NT-3 or NT-4 over 3
days showed that basal dendrites of pyramidal neurons in each cortical layer
responded predominantly to a single neurotrophin, while the apical dendrites
responded to a wider range of neurotrophins (McAllister et al., 1995). Interestingly,
the effects of neurotrophins on different cells, and even on different dendrites on the
same cell, varied widely. BDNF, for example, enhanced dendritic growth of basal
dendrites in layers 4 and 5, but decreased it in layer 6. Since the neurons in one
specific layer of the mammalian cortex build a functionally and morphologically
related community, neurotrophins do not generally promote dendritic growth but act
specifically in the development of typical growth patterns (McAllister et al., 1995;
McAllister et al., 1997). Additionally, responsiveness of pyramidal cells to
neurotrophins has been shown to require synaptic activity (McAllister et al., 1996),
thus providing a possible mechanism of how bioelectrical activity may influence
dendritic growth.
Expression of the small membrane-bound protein CPG15 is induced by neuronal
activity (injection of kainate or light-exposure) in adult rats, and it is also expressed
during development (Nedivi et al., 1996). When CPG15 was transfected into the optic
tectum of Xenopus tadpoles, the dendritic complexity and branch length of projection

17
neurons, but not of interneurons, was increased (Nedivi et al., 1998). Similar results
were obtained in cats (Corriveau et al., 1999).
CPG15 protein is concentrated in axons of retinal ganglion cells during the period
when the dendritic development of their target cells was sensitive to CPG15 (Nedivi
et al., 1998). This may provide another mechanism through which neuronal activity is
transduced into dendritic growth. Recently, a paralogue of CPG15, CPG15-2, was
discovered, which has a different expression pattern but has many functional
similarities with CPG15 (Fujino et al., 2008).
Semaphorins are a large family of guidance molecules for axons and dendrites.
Semaphorin3A (Sema3A) is produced and secreted by the cortical plate during
development from late embryonic stages (Giger et al., 1996; Skaliora et al., 1998)
and has been shown to act as a chemorepellent on growing axons of cortical
pyramidal cells (Polleux et al., 1998). Conversely, it acts as a chemoattractant on
apical dendrites of the same cells (Polleux et al., 2000), as well as a regulator of
spine maturation (Morita et al., 2006). At least one part of the Sema3A receptor,
Neuropilin-1, is apparently involved in both repelling axons and attracting dendrites,
as it is expressed in pyramidal neurons in axons as well as in dendrites (He &
Tessier-Lavigne, 1997; Kolodkin et al., 1997; Polleux et al., 2000). Whether Sema3A
acts as a repellent or an attractant has been shown to be dependent on the presence
of cyclic GMP (Song et al., 1998). Indeed, in cortical pyramidal neurons, the
distribution of soluble guanylate cyclase (SGC) has been found to be asymmetric
with a high concentration of SGC in the apical pole already before the outgrowth of
the apical dendrite, and SGC was shown to specifically mediate dendritic orientation
via regulation of cGMP-dependent protein kinase (PKG) (Polleux et al., 2000).
Besides several effector-molecules which have been supposed to be involved, the
two kinases Fyn and CDK5 have been shown to take part in mediation of the
Sema3A effect on apical dendrites (Sasaki et al., 2002; Morita et al., 2006).
Glial cells promote dendritic growth even after they are fully matured (Le Roux &
Reh, 1995), in contrast, they lose their ability to promote axon growth after the intial
phase of development (Smith et al., 1990). It has been found that rat embryonic
RGCs require direct contact to neighboring astrocytes to become able to form
dendritic synapses (Barker et al., 2008). Direct contact with astrocytes caused
dislocation of the protein Neurexin out of the dendrites, and overexpression of
Neurexin in dendrites abolished the astrocytic effect on synaptogenesis, thus

18
proposing a possible mechanism (Barker et al., 2008). In postnatal RGCs, on the
other hand, astrocytes promote synaptogenesis without requiring direct cell-cell
interaction; instead astrocytes secrete signals that promote synaptogenesis (Nagler
et al., 2001). Two proteins of the thrombospondin family (TSPs), TSP-1 and TSP-2,
have been identified to be a necessary part of this astrocyte-secreted signal to
induce synaptogenesis in cultured RGCs and in vivo (Christopherson et al., 2005).
Another mechanism for how neuron-glia-interaction may be mediated has been
suggested for pyramidal cells in the CA1 region of the Hippocampus in mice, where
contact with astrocytes regulates spine morphology. Adult hippocampal spines
express the EphA4 receptor on their surface, and its ligand, Ephrin-A3, is expressed
on the surface of astrocytes (Murai et al., 2003). EphA4-activation causes spines to
retract, which is important for proper spine organization and regulation of spine
morphology (Murai et al., 2003).
1.1.3. Internal pathways to integrate external signals
In Chick retinal ganglion cells it has been found that neurotransmitter-mediated input
leading to Ca2+ induced Ca2+ release from internal stores and subsequently to local
increases of internal Ca2+ concentration is required for maintaining dendritic
structures, while global increases of Ca2+ concentration (concerning the whole
neuron) were not required (Lohmann et al., 2002).
In other studies, Ca2+ entry through L-type VDCCs has been found to play an
important role in activity-induced dendritic changes (Wu et al., 2001; Redmond et al.,
2002).
All movement of cellular processes eventually involves changes in the cytoskeleton.
While the cytoskeleton in filopodia and spines fundamentally consists of actin,
dendritic branches are filled with microtubules (Fischer et al., 1998; Harada et al.,
2002). How are external signals transferred to affect actin and microtubules?
In cultured rat sympathetic neurons, neuronal activity also caused dendrite formation,
and this effect was enhanced by addition of NGF. Activation of a key regulator of
dendritic stability (Harada et al., 2002), the microtubule-associated protein MAP2 by
phosporylation through two types of kinases, CamKII and Erks was necessary to
stabilize microtubules and thus mediate the effect of activity (Vaillant et al., 2002).

19
The necessity of CamKs and the MEK-ERK-pathway to work together in activating
MAPK2 after stimulation was also found in a study in cultured hippocampal neurons
(Wu et al., 2001). Interestingly, the pattern of activation had a profound effect: only
spaced, repetitive impulses resulted in a prolonged phosphorylation of dendritic
MAPK, which correlated with stable morphological changes in spines. Activity of
CaMKs was only required for short-term activation of MAPK.
In another study in hippocampal neurons, the effect of neuronal activity on actin has
been found to require β-catenin (Yu & Malenka, 2003). β-catenin is an important part
of the Wnt signaling pathway, which regulates gene transcription in cancer and
embryonic development (Cadigan & Nusse, 1997; Bienz & Clevers, 2000; Polakis,
2007). Additionally, it functions in the cadherin/catenin complex to mediate cell
adhesion and ties the actin-cytoskeleton to cadherins in the cell membrane
(Gumbiner, 1996). In rat hippocampal neurons β-catenin is present during
development (Benson & Tanaka, 1998) and high levels of β-catenin (and other
components of the cadherin/catenin complex) have been shown to enhance dendritic
branching (Yu & Malenka, 2003). Furthermore, membrane depolarization (thus
mimicking electrical activity) also increased dendritic branching and this effect
required β-catenin to be mediated. β-catenin influenced dendritic branching
independently of its role in gene transcription, instead it has been shown that the
extracellular domain of N-cadherin as well as actin-binding was necessary (Yu &
Malenka, 2003).
Similarly, Rho, Rac and CdC42, the best-studied subfamilies of the Rho family of
small GTPases, which are of major importance for regulating the actin cytoskeleton
(Hall, 1998; Hall & Nobes, 2000), have been shown to enhance dendritic elaboration
in cultured cortical neurons of E18 rats (Threadgill et al., 1997).
Concerning the dynamics of dendritic remodeling during synaptogenesis in chick
retinal ganglion cells at E12-13, Rho and Rac have been found to have a reciprocal
influence (Wong et al., 2000). While Rac activation increased glutamatergic
transmission-dependent motility and number of fine terminal processes, Rho
decreased it.
Rho, Rac and CdC42 have also been shown to mediate the effects of activity on
dendritic growth in the optic tectum of Xenopus laevis tadpoles (Li et al., 2002; Sin et
al., 2002). Consistent with the results obtained by Wong et al (Wong et al., 2000),

20
Rho activity was found to inhibit activity-induced dendritic growth, while Rac and
Cdc42 enhanced it (Sin et al., 2002).
On the other hand, in cortical cultures from embryonic rats, electrical stimulation and
following Ca2+ entry via L-VSCCs exerted their growth-promoting effect on dendrites
through induction of protein synthesis (Redmond et al., 2002). CaMKIV activated the
transcription factor CREB and its co-activator CBP which resulted in changes of gene
transcription.
1.1.4. Dendritic growth regulation by transcriptional programs
Although synaptic input and environmental interactions are undoubtedly necessary
for dendritic development, a study by Verhage and colleagues provided evidence that
intrinsic programs make up a substantial part of brain development (Verhage et al.,
2000). Deletion of the munc-18-1 gene in mice abolished all neurotransmitter release
and resulted in completely paralyzed mice. Although neurons eventually underwent
apoptosis, all brain regions initially developed in an apparently normal way including
circuit assembly and synaptogenesis (Verhage et al., 2000).
The importance of a complicated transcriptional control for morphological
development is undeniable. Transcription factors are the core components of every
cell-intrinsic growth pattern.
The transcription factor hamlet, for example, is expressed only in the neuronal
precursor cell IIIB in the Drosophila PNS and is inherited by both daughter cells, an
external sensory (ES) neuron and a glial cell (Moore et al., 2002). Hamlet expression
persists in ES neurons throughout morphogenesis of their single dendrite, which
does not develop branches. Without hamlet expression, however, ES cells become
multidendritic (MD) neurons, which have highly branched dendritic trees and are
derived from the IIB precursor cell, which gives also rise to the IIIB precursor. Hamlet
has been found to determine both cell fate specification and dendritic morphology
(Moore et al., 2002). Similarly in mammals, the characteristic unipolar dendritic
morphology of pyramidal neurons in the neocortex and hippocampus has been found
to be determined by expression of the transcription factor Neurogenin2 (Ngn2) in
their progenitors (Hand et al., 2005).
Interesting examples for how specific expression of transcription factors endows
neurons with their characteristic dendritic arbors are the Drosophila dendritic

21
arborization (da) neurons, a subgroup of the md neurons and an extensively studied
model. According to their dendritic arbor complexity, they have been categorized into
four sub-classes (Grueber et al., 2002) (see Fig. 2). Each sub-class expresses
distinct levels of the three transcription factors Cut, Abrupt and Knot (Grueber et al.,
2003; Sugimura et al., 2004; Jinushi-Nakao et al., 2007). In classes I-III, increasing
expression of Cut correlates with increased dendritic branching (Grueber et al.,
2003). Class I da neurons have the least complex branching pattern and are the only
da subclass with no detectable Cut expression (Grueber et al., 2003), instead they
express Abrupt (Sugimura et al., 2004). Abrupt has been shown to be responsible
for the class-I-specific dendritic comb-like morphology (Sugimura et al., 2004).
Although Cut and Abrupt are expressed complementary, they do not influence each
other at the level of gene expression (Sugimura et al., 2004). When they are both
overexpressed, however, they functionally antagonize each other with Abrupt limiting
dendritic growth and branching (Sugimura et al., 2004).
Class III neurons have on their long primary and secondary dendrites many so-called
spikes, which contain actin but no microtubules, whereas class IV neurons have
microtubule-filled higher-order branches (Grueber et al., 2002). Class IV da neurons
express lower levels of Cut than class III neurons (Grueber et al., 2003). Additionally,
they express Knot which causes branching and represses Cut-driven spike-formation
(Hattori et al., 2007b; Jinushi-Nakao et al., 2007; Crozatier & Vincent, 2008). The
Knot-induced effect on branching has been shown to be essentially mediated by
upregulation of spastin, a protein influencing microtubule organization. Both Cut and
Knot are required for class IV-specific dendritic morphology, since they regulate
different features of the dendritic arbor, by targeting different aspects of the
cytoskeleton (Jinushi-Nakao et al., 2007). While Knot has no influence on Cut
expression, Cut influences the amount of Knot that is expressed, although not its
initial expression (Jinushi-Nakao et al., 2007; Crozatier & Vincent, 2008).
Furthermore, all four classes of neurons, like all sensory neurons in the Drosophila
embryonic PNS, express the transcription factor Spineless independently of Cut and
Abrupt (Kim et al., 2006). In classes I and II, Spineless limits dendritic branching,
while in classes III and IV, Spineless promotes branching (Kim et al., 2006).
To underline that these explanations are only a rough simplification of the
complicated interplay between transcription factors in dendritic morphogenesis, I
would like to mention a study by Parrish and colleagues (Parrish et al., 2006), where

22
RNA interference was used to identify over 70 transcription factors involved in
dendritic development of class I da neurons alone.
Figure 2: Dendritic branching pattern of the four subclasses of Drosophila dendritic arborization neurons according to (Grueber et al., 2002). Picture from (Jinushi-Nakao et al., 2007)
1.2. Cerebellum
Anatomically, the cerebellum fundamentally consists of the cerebellar cortex, the
deep cerebellar nuclei and the cerebellar peduncles.
The cerebellar cortex is furled into parallel folds running transversely. While there are
numerous anatomical subdivisions of the cerebellum which have little or no functional
meaning, its hemispheres can be functionally divided into three main sections (see
Fig. 3):
I. The cerebrocerebellum is the largest part in humans. It is concerned with
intricate movements such as speech or playing a musical instrument, as well
as with visual guidance of ongoing movements. Damage to the
cerebrocerebellum consequently results in impairment of such learned skills
which depend on fine coordination (Dale Purves, 2008).
II. The spinocerebellum occupies the median parts of the hemispheres,
including the midline, which is called vermis. It is primarily concerned with
movements of the limbs, as well as with some eye movements (e.g.

23
saccades). The somatic sensory input from the whole body surface is
represented as somatotopic maps in the spinocerebellum. The lower limbs, for
example, are mapped in the anterior part of the spinocerebellum. Chronic
alcohol abuse damages specifically the anterior portion of the cerebellum and
consequently, patients suffer from a staggering, shuffling gait but can still
fluently move their arms and hands. Damage in larger parts of the
spinocerebellum, however, result in intention tremor and general impairment of
well-coordinated movements (Dale Purves, 2008). The vermis region has
been found to be involved in fear-related involuntary movements such as
freezing in rats (Supple et al., 1987), while the more lateral parts of the
spinocerebellum are crucial for learning conditioned eyeblink reflexes (Bracha
et al., 1997).
III. The vestibulocerebellum projects to Lower motor neurons in the spinal cord
and brainstem and is responsible for posture and balance, as well as for the
vestibulo-ocular reflex. Difficulties with a balanced stance or following a
moving object with one’s eyes as well as loss of muscle tone are typically
related with lesions of the vestibulocerebellum (Dale Purves, 2008).
This classification is mainly based on the source of the afferents and the destination
of efferents connecting these functional divisions with the rest of the brain. These
three divisions receive input from different regions of the CNS and project through
different deep cerebellar nuclei and peduncles, and finally, to distinct parts in the
CNS (Dale Purves, 2008).

24
Figure 3: Flat projection of the cerebellar surface showing the three main areas. Adapted from (Dale Purves, 2008).
1.2.1. Cerebellar Cytology
The density of neurons in the cerebellum is very high compared to other parts of the
brain, and the cerebellar cortex is highly organized. It consists of three layers (see
Fig. 4):
1. The molecular layer (ML) is the outermost layer of the cerebellar cortex, and it
principally consists of the Purkinje cell dendritic trees, which are strictly
arranged in the sagittal plane, and the T-shaped axons of the cerebellar
granule neurons (CGN) called parallel fibers (PF). They run perpendicular to
the Purkinje cell dendritic arbors and one PF builds synapses on the dendritic

25
spines of tens of thousands of Purkinje cells, while, on the other hand, one
Purkinje cell gets contacted by up to 200 000 PFs (Napper & Harvey, 1988;
Dale Purves, 2008). The relatively few cell bodies present in the molecular
layer belong to two types of inhibitory interneurons, which are modulating the
excitatory input from PFs on PCs:
o The basket cells synapse on Purkinje cell bodies
o The stellate cells synapse on Purkinje cell dendrites
The second excitatory input Purkinje cells receive is the one from the climbing
fibers (CF), which are axons from neurons in the inferior olive. One single CF
makes numerous synapses on the dendritic shaft of one single PC.
2. Below the ML, the Purkinje cell bodies are aligned in a monolayer, which is
called Purkinje cell layer (PCL). Purkinje cells are GABAergic neurons and
provide the principal output of the cerebellar cortex.
3. Below the PCL and right above the white matter lies the granular layer (GL). It
contains the most numerous cell type in the whole brain, the cerebellar
granule neurons (CGNs), as well as the Golgi interneurons, which synapse on
CGN dendrites and whose dendrites get input from the PFs in the ML, thus
providing a negative feedback loop to the CGNs. The CGNs receive excitatory
input from the mossy fibers which are the major afferents of the cerebellum
coming from various brain regions (see above). A remarkable type of
excitatory interneuron, the unipolar brush neurons (UBN), intensify this
afferent input of mossy fibers on CGNs, especially in the vestibulocerebellum
(Kalinichenko & Okhotin, 2005). Another cell type in the GL, situated just
below the PCL, are the Lugaro cells, an inhibitory interneuron which contacts
Basket and stellate cells in the ML, and Golgi cells in the GL, while Lugaro
cells themselves receive input from Purkinje cell collaterals (reviewed in
(Geurts et al., 2003))
Through the white matter underneath the cortex, the Purkinje cell axons project to
neurons in the deep cerebellar nuclei (DCN). Their axons leave the cerebellum
through the cerebellar peduncles.
All input to the cerebrocerebellum is relayed onto neurons in the pontine nuclei
and the inferior olive. From the pontine nuclei, the mossy fibers enter the
cerebellum through the cerebellar peduncles, split off collaterals to neurons in the
deep cerebellar nuclei and ascend further to excite the CGNs. The CGNs convey

26
the excitatory signal to the Purkinje cells, where the integration of information is
controlled by stellate and basket cells, as well as by CF input. The CFs from the
inferior olive also project collaterals to DCNs before they contact Purkinje cells.
CF input on Purkinje cells reduces their excitability and thus the effectiveness of
the PF-PC synapses. Immediate motor error corrections as well as long-term
adaptations like motor learning have been shown to depend on CF activity (Dale
Purves, 2008).
Figure 4: Schematic enlargement from a sagittal section through the cerebellum. Composition of the cerebellar cortex with the most important cell types is illustrated. Adapted from (Kobielak & Fuchs, 2004).

27
1.2.2. Functional aspects
The cerebellum is a brain region crucial for coordination and motor learning, and is
involved in planning and execution of movements as well as in ocular reflexes and
maintaining balance and posture. According to more recent findings, the cerebellum
also plays a role in spatial orientation and modulating cognitive programs.
Cerebellar diseases and lesions are characterized by difficulties with fluid and precise
movements rather than paralysis. In cerebellar ataxia the coordination of muscle
groups is disturbed, which leads to clumsiness. Typical signs are intention tremor,
applying a wrong amount of muscle force to a task, reaching too high or too low
(dysmetria), problems with keeping an upright and balanced stance, unsteady muscle
tone or carrying out movements at the wrong speed. These symptoms can affect all
skeletal muscle groups, involving speech, eye movements, movements of limbs and
trunk. There are a group of congenital diseases called spinocerebellar ataxias (SCA),
which are all caused by different genetic disorders concerning the cerebellum. SCAs
are usually slowly progressing disorders caused by mutation in a single gene and
include autosomal-dominant as well as recessive patterns of inheritance (reviewed in
(Perlman, 2011)). Dominant SCAs are generally caused by a “gain-of-function” gene
mutation, which most often includes an expansion of CAG triplet repeats. These
polyglutamine gene products become toxic and often lead to degeneration of
cerebellar structures (reviewed in (Perlman, 2011)). The detailed proceedings and
extent of a cerebellar ataxia strongly depend on the exact location of the lesion or
damage in the cerebellum (see above).
Altogether, the cerebellum receives input from various areas of the cerebral cortex,
spinal cord and brainstem, and it mainly projects back to the Premotor and Motor
cortices, Thalamus, spinal cord and brainstem. This constitutes a feedback-loop
which allows the cerebellum to carry out one of its most important functions, which is
the correction of motor errors. During the execution of a movement, the cerebellum
receives constant sensory information on position and motion of the body, which
allows detection of differences in the originally planned movement and the actual
situation. The cerebellum then sends a corrective signal to motor neurons, in order to
adapt the movement immediately, while the correction can also be stored for motor
learning (Dale Purves, 2008).

28
1.2.3. Basics of cerebellar development
Early in development, the neural tube is subdivided along the rostral-caudal axis into
four areas. The prosencephalon at the front of the neural tube will later bring about
the forebrain, the mesencephalon will develop mainly into the midbrain, and the
rhombencephalon, after dividing into the metencephalon and the myelencephalon,
will form the hindbrain. The cerebellum principally evolves from the metencephalon,
with parts of the mesencephalon contributing (Wang & Zoghbi, 2001; Dale Purves,
2008). By embryonic day 9.5 (E9.5) in the mouse, the neural tube is virtually closed,
but at the border between the mesencephalon and the metencephalon, there is a gap
which forms a specialized region of the dorsal neuroepithelium, the rhombic lip (RL)
(see Fig. 5) (Morales & Hatten, 2006). In the developing cerebellum, there are
basically two different germinal matrices where neurons are produced: the RL and
the ventricular zone (VZ) (Wingate, 2001; Hoshino et al., 2005; Butts et al., 2011).
All GABAergic neuron populations derive from the VZ from progenitors expressing
the basic helix-loop-helix (bHLH) transcription factor Ptf1a (Hoshino et al., 2005).
Between E10 and E17, the GABAergic fraction of DCNs is born, Purkinje cells are
produced from E11-E13, and GABAergic interneurons subsequently (Miale &
Sidman, 1961; Wang & Zoghbi, 2001).
In the RL, TGFβ-signaling from the neighboring roof plate induces the expression of
a different bHLH transcription factor, Math1 (often also referred to as Atoh1). All
glutamatergic neuron populations in the cerebellum arise from the RL, and they are
born during a particular time frame (Gilthorpe et al., 2002; Hoshino et al., 2005; Butts
et al., 2011):
At E10.5 in the mouse, the glutamatergic fraction of deep cerebellar neurons is born.
They switch off expression of Math1 after migrating away from the RL towards the
cerebellar nuclei.
2 days later, the RL starts to produce unipolar brush neurons and progenitors of
cerebellar granule neurons (GNP). GNPs migrate first along the surface of the neural
tube and form the external granule Layer (EGL) (see Fig. 6). This process lasts until
after birth. In the EGL, GNP transit amplification is induced by sonic hedgehog (Shh)
signaling from underlying Purkinje cells and is dependent of maintained Math1
expression (Flora et al., 2009). The extent and duration of Shh signaling (and thus
GNP proliferation in the EGL) is an essential determinant for the development of

29
cerebellar lobules and complexity of foliation (Corrales et al., 2006). From 3 days until
3 weeks after birth, postmitotic GNPs switch off Math1 expression and start to
migrate radially away from the surface past the PCs along glial extensions to finish
differentiation in the internal granule layer (IGL) (Hatten, 1999; Machold & Fishell,
2005; Butts et al., 2011).
Figure 5: The rhombic lip at E9. Blue and orange regions highlight the rostral and caudal parts of the RL, respectively. The cerebellar granule neurons derive from the rostral area (blue region). Adapted from (Wang & Zoghbi, 2001)

30
Figure 6: Schematic enlargement from a sagittal section through the cerebellum. Composition of the cerebellar cortex around 1 day before birth is illustrated. Postmitotic granule neuron precursors migrate from the EGL into the IGL. Adapted from (Wang & Zoghbi, 2001).
1.3. Purkinje cell development
1.3.1. Overview
The following studies have been carried out either on rats or mice. To compare the
data acquired from both species, it can be assumed that the development of the
mouse is generally one day ahead of the development of the rat
(http://embryology.med.unsw.edu.au/OtherEmb/Rat.htm).
As mentioned above, Purkinje cells are produced in the mouse from E11-E13 in the
ventricular zone (Miale & Sidman, 1961; Wang & Zoghbi, 2001). From E16 in the rat,
the Purkinje cell marker calbindin is expressed (Armengol & Sotelo, 1991), and from
E19 in the mouse, climbing fibers build synapses on Purkinje cells (Morara et al.,
2001). Purkinje cell axons have been found to project to cerebellar nuclei at E18
(Eisenman et al., 1991). The Purkinje cell monolayer in the cortex is established

31
within the first week after birth (Armengol & Sotelo, 1991; Kapfhammer, 2004).
Dendritic development starts around birth and is closely paralleled by development of
electrophyiological properties (Woodward et al., 1969; Gruol et al., 1992; McKay &
Turner, 2005).
P0-P9 (see Fig. 7):
At birth, Purkinje cells are polarized and have one smooth dendrite (Armengol &
Sotelo, 1991). During the first 6 days after birth, this simple appearance becomes
transiently more complex before dendrites retract and then rapidly regrow again from
the soma in an unpolarized manner, a stage termed “stellate cell with disoriented
dendrites” (Armengol & Sotelo, 1991). Since Purkinje cells pass the stages at an
individual rate, all different stages are present at all times in these first 6 days
(Armengol & Sotelo, 1991). Dendritic development at this early stage of dendritic
remodeling has been found to be controlled by expression of the transcription factor
retinoid-related orphan receptor α (RORα) (Boukhtouche et al., 2006). Staggerer
mutant mice are lacking RORα function in Purkinje cells and suffer from cerebellar
atrophy after cell death of Purkinje- and, subsequently, granule cells (Hamilton et al.,
1996; Steinmayr et al., 1998). The remaining Purkinje cells fail to proceed in their
development beyond this early stage (Shirley & Messer, 2004).
Despite the rapid dendritic rearrangements in the first postnatal week, there is little
total dendritic expansion (McKay & Turner, 2005). Cell bodies, on the other hand,
grow considerably to reach their adult size by P9 in the rat (McKay & Turner, 2005).
Electrophysiologically, Purkinje cells reacted to current injections with an immature
pattern of Na+ spikes of low amplitude (McKay & Turner, 2005). The big majority of
synaptic input comes from climbing fibers, which synapse still perisomatically on
Purkinje cells and are not yet confined to a one CF-PC relation with only one CF
innervating one Purkinje cell ((Mason et al., 1990), abstract). Activation of mGluR1,
and subsequently PLCβ and PKCγ, has been shown to be crucial for this process of
multiple CF elimination, which starts around P5 in rodents and is finished by 3-4
weeks postnatally (Kano et al., 1995; Kano et al., 1997; Kano et al., 1998).
P9- week 4 after birth (see Fig. 7):
Until P12, Purkinje cell dendrites rearrange again to develop a single primary
dendrite (McKay & Turner, 2005). Purkinje cells then enter the phase of rapid

32
dendritic expansion, with the dendritic trees increasing dramatically in length and
complexity. Dendritic growth at this stage is now restricted to the sagittal plane of the
cerebellum (Ramon y Cajal, 1911). As granule neurons migrate past the Purkine cells
into the IGL during this time, Parallel Fibers extend and form synapses on Purkinje
cells dendrites. Also synapses between Purkinje cells and inhibitory interneurons are
formed. Synapses of CFs dislocate from the somata to the proximal dendrites and
are restricted to one CF per Purkinje cell ((Mason et al., 1990), abstract). The phase
of rapid dendritic growth lasts until 3 weeks after birth in mice and until 4 weeks in
rats ((Berry & Bradley, 1976; Weiss & Pysh, 1978), abstracts).
Electrophysiological input resistance decreased remarkably concurrent with the
appearance of the prominent stem dendrite (McKay & Turner, 2005), and while the
dendritic trees grow, the cells first become able to produce so-called Ca2+-Na+-bursts
(a burst of Na+ spikes terminated by a Ca2+ spike) and later develop a trimodal
pattern of intrinsic activity (Womack & Khodakhah, 2004; McKay & Turner, 2005).
This trimodal pattern is independent of synaptic input and consists of three modes of
spontaneous activity; Purkinje cells fire tonically, then accelerate to burst (Ca2+-Na+-
bursts) and then go silent, before they restart the pattern with firing tonically again
(Womack & Khodakhah, 2002). The duration of one cycle has been found to vary
widely between Purkinje cells of the same age (20 seconds to 20 minutes), but did
not change within the same cell (Womack & Khodakhah, 2002). After P18 in rats,
only minor changes in electrophysiological output, as well as in dendritic growth were
detected (McKay & Turner, 2005).

33
Figure 7: morphological stages of Purkinje cell dendritic development from P0-P39 in rats. Adapted from (McKay & Turner, 2005).
Given these dynamic morphological and electrophysiological processes, it is not
surprising that also the expression of ion channels in Purkinje cells is differentially
regulated during the first 3 weeks of development. For example, the voltage-
independent, small conductance Ca2+-activated K+ channel type 2 (SK2) is already
expressed at P1 in Purkinje cells and is continuously downregulated within 3 weeks
(Cingolani et al., 2002). Exclusively in young Purkinje cells, SK2 channels have been
found to be very important for the regularity and patterning of spontaneous activity
(Cingolani et al., 2002). The expression of large conductance voltage- and Ca2+-
activated K+ (BK) channels, on the other hand, increases during the first 2 weeks
postnatally and is high in adult Purkinje cells (Muller et al., 1998).
While in Purkinje cells of 2 weeks and older animals P/Q-type Ca2+ channels have
been shown to mediate the main Ca2+ influx (Regan, 1991; Mintz et al., 1992a), in
P4-P7 rats L-type Ca2+ channels have been found to be required for spontaneous
intracellular Ca2+ oscillations, a striking feature of developing Purkinje cells which
may play a role in regulation of gene expression (Liljelund et al., 2000). Intriguingly,
immunostaining of P/Q-type Ca2+ channels on P5 was equally intense as of L-type
channels, thus P/Q type channels were also expressed in Purkinje cells, but had a

34
very small influence on Ca2+ oscillations (Liljelund et al., 2000). In a later study by this
group, they found that both P/Q- and L-type channels contributed to the Ca2+ signal
observed after K+-induced membrane depolarization, but only L-type channels were
found to lead to activation of the transcription factor CREB and subsequent gene
transcription (Gruol et al., 2005).
1.3.2. External aspects influencing Purkinje cell dendritic development
Synaptic input
How much of this late dendritic development in Purkinje cells is dependent on parallel
fiber input has been the content of several studies. In dissociated Purkinje cell
cultures, dendritic development without neuronal activity such as glutamate
treatment, co-culture with granule cells or under TTX treatment was rather poor
(Schilling et al., 1991; Baptista et al., 1994; Tanaka et al., 2006). In cerebellar
organotypic slice cultures, on the other hand, only slightly smaller dendritic trees
were found after inhibition of all glutamate receptors (Adcock et al., 2004).
Additionally, extinction of granule cells by X-irradiation (Altman & Anderson, 1972) or
absence of granule cell contacts in the cerebellum of weaver mutant mice (Rakic &
Sidman, 1973) revealed that although Purkinje cells lacked third and higher order
branches and spiny branchlets, an overall normal looking dendritic tree, including
spines, developed.
Hormones
Purkinje cells of neonatal rats have been found to produce the sex hormones
progesterone and estrogen in especially high levels during the phase of dendritic
development, at the same time when they also have been found to express
progesterone- and estrogen receptors (Ukena et al., 1999; Jakab et al., 2001;
Sakamoto et al., 2003a; Sakamoto et al., 2003b), and both hormones have been
shown to increase dendritic growth and spine formation (Sakamoto et al., 2002;
Sakamoto et al., 2003a). In addition, Purkinje cells have also been found to respond
to the environmental chemicals octylphenol (OP) and bisphenol A (BPA), which act
on estrogen receptors (Khurana et al., 2000; Paris et al., 2002). When one week old
rats were injected with OP or BPA for 4 days into the cerebrospinal fluid around the
cerebellum, the outgrowth of dendrites was promoted (Shikimi et al., 2004).

35
While treatment with thyroid hormones has been shown to enhance dendritic growth
of Purkinje cells (Lindholm et al., 1993), their absence in hypothyroid rats resulted in
a significant reduction and delay of dendritic development ((Vincent et al., 1982),
abstract). Interestingly, this effect has been found to be caused by adverse actions of
thyroid receptors that do not have thyroid hormones bound rather than by the
absence of thyroid receptor signal transduction itself (Gothe et al., 1999; Hashimoto
et al., 2001).
Neurotrophins
The roles of neurotrophins have been extensively studied in dissociated cultures of
Purkinje cells. While NT-3 and NT-4/5 have been shown to increase Purkinje cell
survival when applied to the cultures ((Mount et al., 1994b),abstract) (Larkfors et al.,
1996), NGF has been found to require direct or indirect activation of mGluRs to
mediate cell survival, cell size and neurite development in a p75 neurotrophin
receptor mediated manner (Cohen-Cory et al., 1991; Mount et al., 1994a; Mount et
al., 1998).
For BDNF, however, results have been controversial, even among studies using
dissociated Purkinje cell cultures. BDNF did not influence Purkinje cell survival in a
study by Mount and colleagues ((Mount et al., 1994b), abstract), while it did so in
another study (Larkfors et al., 1996). In Purkinje-granule cell co-cultures, Shimada
and colleagues found an influence of BDNF on Purkinje cell spine development, but
not on dendritic complexity (Shimada et al., 1998), whereas Hirai and Launey found
that inhibition of the BDNF receptor Trk-B reduced Purkinje cell dendritic growth,
most likely an indirect effect mediated by less promoted granule cell survival (Hirai &
Launey, 2000). It was suggested that the culture medium used might have an impact
on the expression of Trk receptors in the culture, thus influencing the need for BDNF
(Hirai & Launey, 2000).
In BDNF-/- mice, Purkinje cell dendrites have been shown to be severely reduced
during the first three weeks after birth (Schwartz et al., 1997), but at P24 they did not
look very different from wt mice (Carter et al., 2002). However, BDNF-/- mice were
reported to have general growth retardation and reduced weight (Ernfors et al., 1994;
Korte et al., 1995). In cerebellar slice cultures from BDNF-deficient mice, no
differences in several Purkinje cell dendritic growth parameters were found compared
to wt mice (Adcock et al., 2004). Furthermore, Purkinje cell dendrites had a normal

36
appearance in mice lacking a functional BDNF receptor, TrkB (Rico et al., 2002). In
summary, these results certainly reflect the in vivo situation closer than the
dissociated culture system and thus support the concept that BDNF does not play a
significant role in Purkinje cell dendritic development. Instead, TrkB signaling, and
thus BDNF and NT-4, have been found to be essential to the development and
activity-dependent synaptogenesis of inhibitory interneurons in the cerebellum (Rico
et al., 2002; Seil, 2003; Spatkowski & Schilling, 2003) .
Bergmann glia
Purkinje cell dendritic processes have been shown to grow preferentially in the
vertical direction (up towards the pia) when they are in close contact with fibers of the
cerebellar astrocytes called Bergmann glia (Lordkipanidze & Dunaevsky, 2005).
Thus, the radial processes of the Bergmann glia supposedly build a substrate which
helps shape the Purkinje cell dendritic tree, although the dendritic growth rate was
unchanged by these interactions (Lordkipanidze & Dunaevsky, 2005).
Interactions with Bergmann glia have also been found to be important in proceeding
Purkinje cell morphology from multiple disoriented dendrites to a single primary
dendrite with directed growth in cerebellar slice cultures (Tanaka et al., 2003). Signal
transduction of the receptor protein tyrosine phosphatase zeta (PTPζ) after binding of
one of its ligands, the heparin-binding growth factor Pleiotrophin (PTN), has been
shown to be required for this process, as well as activity of the glutamate transporter
GLAST (Tanaka et al., 2003). PTPζ is a chondroitin sulfate proteoglycan, which is
expressed by Bergmann glia until adulthood and by Purkinje cells during the time of
dendritic development (Maeda et al., 1992; Canoll et al., 1993; Tanaka et al., 2003).
GLAST is expressed on the Bergmann glia lamellate processes which have been
found to closely surround differentiating Purkinje cell dendritic trees (Yamada et al.,
2000). Double immunostaining for PTPζ and GLAST revealed an overlap of the two
proteins and treatments affecting PTN-PTPζ signaling reduced GLAST
immunoreactivity, suggesting that GLAST activity or expression is regulated
downstream of PTN-PTPζ signaling (Tanaka et al., 2003). Interestingly, comparable
morphological defects have been observed in Purkinje cells of the mutant mouse
ducky, where a defect in the α2δ-2 protein, a subunit of voltage-gated Ca2+ channels
strongly expressed in Purkinje cells, leads to absence epilepsy and ataxia (Barclay et

37
al., 2001; Brodbeck et al., 2002). Thus, there might be a connection between PTN-
PTPζ signalling, GLAST and voltage-gated Ca2+ channels.
Moreover, mice lacking GLAST function had defects in motor coordination, persistent
Purkinje cell multiple climbing fiber innervation, and were more susceptible to brain
injury (Watase et al., 1998), thus underlining the importance of Bergmann glia for
correct synaptogenesis as well as limiting excitotoxicity after cerebellar damage.
1.3.3. The role of PKC in Purkinje cell dendritic development
PKCγ is the PKC isoform which is in the cerebellum specifically expressed in Purkinje
cells, where it is also the most abundant isoform (Kose et al., 1988; Barmack et al.,
2000). Like PKCα and β, it belongs to the “classical” subgroup of PKC molecules,
which are characterized by being activated in the presence of phosphatidylserine by
diacylglycerol (DAG) and Ca2+ (for review see (Saito & Shirai, 2002)). Besides PKCγ,
PKCα is also expressed in Purkinje cells, as well as in all cells in the cerebellum
(Huang et al., 1988). Expression of PKCγ is developmentally regulated, with low
levels around birth and subsequent upregulation until 2-3 weeks postnatally
(Hashimoto et al., 1988; Yoshida et al., 1988). PKCγ plays a major role in cerebellar
Long term depression (for review see (Ito, 2001)). Missense mutations in PKCγ have
been found in patients suffering from spinocerebellar ataxia type 14 (SCA14), an
autosomal dominant disease which comes along with degenerated Purkinje cells
(Chen et al., 2003). Moreover, PKCγ is an important regulator of Purkinje cell
dendritic growth under natural conditions; chronic pharmacological inhibition of PKC
in rat cerebellar slice cultures during the time of rapid dendritic expansion lead to
excessive growth and branching (Metzger & Kapfhammer, 2000). These findings
were confirmed in PKCγ deficient mice, although a decreased PKCγ activity in mice
resulted in increased branching rather than in larger dendritic trees of Purkinje cells
(Schrenk et al., 2002). Chronic pharmacological activation of PKC, on the other hand,
limited dendritic growth in slice clultures from wild type rats and mice, probably by
retraction of dendrites (Metzger & Kapfhammer, 2000; Schrenk et al., 2002). It was
excluded that the negative effect of PKC activation on dendritic growth was due to
downregulation of the enzyme (Metzger & Kapfhammer, 2000). Interestingly, PKCγ
deficient mice still reacted to pharmacological PKC activation with limited dendritic
growth, while mice lacking the PKCα isoform were protected (Gundlfinger et al.,

38
2003). In conclusion, PKCγ naturally regulates dendritic growth in Purkinje cells,
while a reserve pool of PKCα is activated or upregulated upon stronger stimulation
(Schrenk et al., 2002; Gundlfinger et al., 2003).
1.3.4. The role of mGluR1 in Purkinje cell dendritic development
The 8 genes of metabotropic glutamate receptors (mGluR1-8) identified so far have
been put into 3 groups according to their signal transduction pathways, sequence
similarities and pharmacological features. mGluR1 and mGluR5 both couple to
phospholipase C, thus inducing phosphoinositide hydrolysis upon activation and
constitute group I of the mGluRs (for reviews see (Nakanishi, 1992; Conn & Pin,
1997; Knopfel & Grandes, 2002)). The most abundant mGluR subtype in Purkinje
cells is mGluR1 (Lein et al., 2007), with lower levels of mGluR7 found (Kinzie et al.,
1995). mGluR1 is expressed in Purkinje cells already before birth (Masu et al., 1991;
Lopez-Bendito et al., 2001) and during the period of rapid dendritic expansion it
spreads into the dendrites to take its final localization in spines, perisynaptically of
excitatory synapses (Nusser et al., 1994; Lopez-Bendito et al., 2001). mGluR1a is the
mGluR1 splice variant with the strongest expression in the cerebellum, with
increasing expression levels during development until adulthood (Casabona et al.,
1997; Lopez-Bendito et al., 2001). mGluR1 activation occurs after repeated
discharges by either climbing fibers or parallel fibers, the two excitatory synaptic
inputs to Purkinje cells (Batchelor & Garthwaite, 1993; Batchelor et al., 1994; Dzubay
& Otis, 2002). Two responses have been found to be initiated:
An increase in IP3 due to PLC activation leads to Ca2+ release from the
endoplasmic reticulum (ER) in dendrites and spines (Finch & Augustine, 1998;
Takechi et al., 1998; Okubo et al., 2004), followed by activation of PKC. This
pathway has been shown to be crucial for elimination of multiple climbing fiber
innervation and establishment of LTD (Kano et al., 1995; Kano et al., 1997;
Offermanns et al., 1997; De Zeeuw et al., 1998; Kano et al., 1998; Ichise et al.,
2000; Ito, 2001).
A slow excitatory postsynaptic potential (sEPSP) is induced (Batchelor &
Garthwaite, 1993; Batchelor et al., 1994), which consists of a considerable Na+
- and, to a lesser extent, Ca2+ influx (Knopfel et al., 2000; Tempia et al., 2001).

39
The nonselective, Ca2+ permeable TRPC3 channel has been shown to
mediate the sEPSC (Hartmann et al., 2008) and its activation depends on
tyrosine phosphatase activity (Canepari & Ogden, 2003).
Both mGluR1-induced responses are mediated by the G-protein Gq (Hartmann2004),
but diverge upstream of PLC, since PLC activity is not required for sEPSC induction
(Hirono et al., 1998; Canepari et al., 2001; Canepari & Ogden, 2003).
Mutant mice lacking mGluR1 function suffer from an ataxic gait, intention tremor,
impaired LTD and associative learning (Aiba et al., 1994). In addition, elimination of
multiple climbing fiber innervation is incomplete (Kano et al., 1997). All cerebellar
phenotypic symptoms were rescued by transgenic induction of the mGluR1a splice
variant in Purkinje cells of mGluR1 k.o. mice (Ichise et al., 2000; Kishimoto et al.,
2002). No significant aberrations in cerebellar anatomy, including Purkinje cell
morphology, have been observed in mGluR1 k.o. mice, however (Aiba et al., 1994;
Ichise et al., 2000). Inhibition of mGluR1 in mixed rat Purkinje cell/CGN cultures and
in vivo as early as P3-9, on the other hand, has been shown to adversely affect
Purkinje cell morphology and survival (Catania et al., 2001). Pharmacological
mGluR1 inhibition over 12 days in cerebellar slice cultures at a later time in
development (starting at P8 in mice) had very little effect on Purkinje cell morphology
(Adcock et al., 2004). On the contrary, treatment of cerebellar slice cultures during
the time of rapid dendritic expansion with the class I mGluR activator DHPG resulted
in severely reduced Purkinje cell dendritic tree sizes and numbers of branch points in
a concentration dependent manner (Sirzen-Zelenskaya et al., 2006). DHPG co-
treatments with inhibitors of either PKC, PLC, mGluR5 or glutamatergic synaptic
transmission (TTX combined with inhibitors of AMPA and NMDA receptors) were
ineffective in modulating the inhibitory effect of DHPG, thus indicating that a direct
mGluR1 receptor activation is responsible and that the inhibitory effect is mediated
independent of bioelectrical activity and the classical pathway involving PKC and
PLC.

40
1.4. The cerebellar slice culture model
In dissociated cell cultures, cells of one type - or a small selection of co-cultured cell
types - are studied in isolation. In contrast, in organotypic slice cultures, a thick slice
of the whole tissue is kept in culture, where the natural microenvironment of a cell
with neighboring cell-cell interactions and, as in the case of nervous tissue, local
neuronal networks are preserved ((Dupont et al., 2006), abstract). This provides the
possibility for various kinds of studies, like cell development, synaptogenesis,
regeneration or electrophysiology.
Slice cultures from nervous tissue, however, can only be obtained from immature
tissue, as survival of neurons critically depends on their stage of development.
Purkinje cells, for example, are extremely sensitive to axotomy at P1-P5 in rats (P4-
P6 in mice) and do not survive in slice cultures prepared during this period (Dusart et
al., 1997). In general, slice cultures can be taken from developing nervous tissue as
long as there is no myelination (Kapfhammer, 2010).
Some special measures have to be taken to ensure a thorough supply with nutrients
and oxygen to all cells in the typically 0.3 – 0.5 mm thick cultures. In the technically
simplest method, the static slice culture, which allows cerebellar slices to be cultured
for several weeks, the slices are placed on top of a membrane which is permeable to
all ingredients of the culture medium (Yamamoto et al., 1989; Stoppini et al., 1991).
The membrane is held by a culture insert and placed over the medium, which is
drawn through the membrane into the slice culture by capillary forces. Thus, the top
of the culture is at the interface between culture medium and air, which allows both
nutrients and oxygen to reach the whole culture (see Fig. 8).

41
Figure 8: Illustration of the experimental device for static slice culture. The bottom of the culture insert is a porous membrane which is permeable to the culture medium below. The slice culture is lying on this membrane at the interface between culture medium and air. By capillary forces, the medium is drawn through the membrane into the tissue slice. Picture from (Kapfhammer, 2010).
Obtaining slice cultures from mouse cerebella is possible until 2 weeks postnatal.
They are usually cut in the sagittal plane, since this is the natural orientation of the
Purkinje cell dendritic tree, therefore allowing morphological analyses of Purkinje
cells. Besides Purkinje cells, granule neurons, Golgi cells, basket cells, stellate cells,
unipolar brush cells, astrocytes and Bergmann glia, as well as an extracellular matrix
have been found in slice cultures (Jaeger et al., 1988; Nunzi & Mugnaini, 2000;
Bruckner & Grosche, 2001). Since the axons of granule cells run at a right angle to
the Purkinje cell dendritic trees, they are being cut during the culturing process. Due
to their immaturity in the early days after birth, they regenerate and reorganize to
form synapses on Purkinje cells (Tanaka et al., 1994). In the median zone of the
cerebellum Purkinje cell axons are cut as well, and although the cells survive the
axotomy well after P6 in the mice, they do not regrow (Dusart et al., 1997). In more
lateral areas of the cerebellum, the deep cerebellar nuclei are part of the slice culture,
and Purkinje cells project to their original target, the deep cerebellar neurons
(Mouginot & Gahwiler, 1995). Climbing and Mossy fibers, which originate from
outside of the cerebellum, are absent. During the culture period, the slices become
thinner and although the cytological architecture of the cerebellar cortex is generally
preserved, Purkinje cells are not strictly arranged in a monolayer anymore. The slice
culture model is also well suitable for electrophysiological studies, as electrical

42
activity develops spontaneously in the cultures (Leiman & Seil, 1973; Kapoor et al.,
1988; Mouginot & Gahwiler, 1995; Dupont et al., 2006).
After the culture period, the slices can be fixed and immunostained for various
targets. To study Purkinje cells, an antibody against calbindin D-28K, which stains no
other cells in the cerebellum (Celio, 1990), is conveniently used to visualize whole
Purkinje cells including dendrites and axons. Granule cell survival can be
simultaneously shown with NeuN-staining as a control (Weyer & Schilling, 2003).
Slices taken from P7-P9 mice and kept in culture for approximately 10 days provide
good survival of Purkinje and granule cells and cover the period of rapid Purkinje cell
dendritic growth. All things considered, the cerebellar slice culture model is a very
suitable system to study Purkinje cell morphological development.
2. Specific Aims of the thesis
2.1. The role of Purkinje cell dendritic tree size in excitotoxicity
The aim of this project was to test the hypothesis that it is the extraordinary size of
their dendritic tree, with an accordingly large amount of AMPA receptors, which
makes Purkinje cells especially susceptible to excitotoxic death.
Chronic activation of either mGluR1 or PKC in organotypic slice cultures strongly
inhibits Purkinje cell dendritic growth (Metzger & Kapfhammer, 2000; Schrenk et al.,
2002; Sirzen-Zelenskaya et al., 2006). The question arises what the physiological
relevance of this effect might be. One possibility is that growth of the Purkinje cell
dendritic tree is inhibited as soon as a certain amount of excitatory input reaches the
cell, thus creating a feedback mechanism which protects the cell from excitatory
overload. In fact, Purkinje cells appear to be highly sensitive to excitotoxic death
(Garthwaite & Garthwaite, 1984). In several models of traumatic brain injury (TBI),
delayed Purkinje cell loss has been found even if the injury was inflicted to other
parts of the brain than the cerebellum (Mautes et al., 1996; Park et al., 2006).
Evidently, this Purkinje cell loss does not occur by mechanical damage or
haemorrhage, but involves excitotoxic mechanisms (Ai & Baker, 2002; Park et al.,
2006; Igarashi et al., 2007).

43
Treatment with (RS)-a-Amino-3-hydroxy-5-methyl-4-isoxazolepropionic acid (AMPA)
was used to induce excitotoxic neurodegeneration in cerebellar slice cultures. AMPA-
exposure does not affect cerebellar granule cells, but kills Purkinje cells already in
low doses by a mechanism called dark-cell degeneration, which includes aspects of
both, apoptosis and necrosis (Garthwaite & Garthwaite, 1990; Meldrum & Garthwaite,
1990; Garthwaite & Garthwaite, 1991b; Leist & Jaattela, 2001; Strahlendorf et al.,
2003). All things considered, AMPA-treatment is a suitable model to study sensitivity
of Purkinje cells to excitotoxicity.
Purkinje cells with either normal or reduced dendritic tree sizes after chronic
activation of mGluR1 or PKC were exposed to AMPA, and cell survival was
compared.
Purkinje cells with a reduced dendritic tree were equally sensitive to AMPA treatment
as were control cells with a norm-sized dendritic tree. Thus, our results indicate that
the expansion of the dendritic tree is no major determinant for Purkinje cell
susceptibility to excitatory overload.
2.2. Analysis of the signaling pathways mediating dendritic growth inhibition after chronic mGluR1 or PKC activation
The aim of this project was to identify components of the signaling pathways which
lead to dendritic growth inhibition in Purkinje cells after chronic mGluR1 or PKC
activation.
Activation of either mGluR1 or PKC result in a severely reduced Purkinje cell
dendritic tree, but intriguingly, the pathways mediating this effect appear to be
independent of each other (Metzger & Kapfhammer, 2000; Schrenk et al., 2002;
Sirzen-Zelenskaya et al., 2006) and remain, in both cases, largely unknown.
A similar reduction of Purkinje cell dendritic trees has been found in two independent
mouse models, the moonwalker (mwk) and the lurcher mouse (Becker et al., 2009;
Zanjani et al., 2009). In both mouse models, abnormal activity of a nonselective, Ca2+
permeable cation channel has been found. In lurcher mice, a mutation of the δ2
glutamate receptor (GluRδ2) results in a constitutively open cation channel and leads
to death of Purkinje cells and stunted dendrites in surviving ones (Zuo et al., 1997;
Zanjani et al., 2009). In mwk mice, a gain-of-function mutation in the Trpc3 gene

44
results in facilitated TRPC3 channel opening and leads to reduced Purkinje cell
dendritic trees and an ataxic phenotype (Becker et al., 2009).
Based on these findings, we focused our research on Ca2+ permeable cation
channels in the Purkinje cell membrane, especially on TRPC3, P/Q-type and T-type
Ca2+ channels, as they are all strongly expressed in Purkinje cells and can be
associated with mGluR1. TRPC3 channels have been shown to mediate the sEPSC
occurring after mGluR1 stimulation (Hartmann et al., 2008). P/Q-type and T-type
Ca2+ channels account for up to 95% of all Ca2+ currents in Purkinje cells (Usowicz et
al., 1992; Watanabe et al., 1998; Swensen & Bean, 2003; Isope & Murphy, 2005;
Isope et al., 2010). P/Q-type channels have been found to directly interact with
mGluR1 in Purkinje cell spines (Kitano et al., 2003), and T-type channels of the
Cav3.1 isoform have been shown to co-localize with mGluR1 in Purkinje cell spines
and to be potentiated upon mGluR1 activation (Hildebrand et al., 2009).
We have treated cerebellar slice cultures of P8 mice with several pharmacological
inhibitors of Ca2+ channels simultaneously with activators of mGluR1 or PKC.
Treatment with inhibitors of R-type Ca2+ channels, GluRδ or TRPC3 channels did not
reveal an involvement of these channels. Concerning the TRPC3 channels, the
results were in line with experiments using mice lacking TRPC3 function. Inhibitors of
T- type or P/Q-type Ca2+ channels partially rescued the dendrite reducing effect seen
after chronic PKC activation. The combination of T- type and P/Q-type Ca2+ channel
inhibitors conferred a partial rescue from the dendrite reducing effect seen after
chronic mGluR1 activation.
Our results strongly suggest an involvement of T-type and P/Q-type Ca2+ channels in
mediating dendritic growth inhibition after both, mGluR1 and PKC activation.

45
3. Dendritic tree size in excitotoxicity
Reduced size of the dendritic tree does not protect Purkinje cells from excitotoxic death
Olivia S. Gugger and Josef P. Kapfhammer
Anatomical Institute, Department of Biomedicine Basel, University of Basel, Pestalozzistr. 20, CH - 4056 Basel, Switzerland.
The following section is based on the work published in the Journal of Neuroscience
Research, 2010, Volume 88, Issue 4, Pages 774-783. Some text, figures, figure legend
numbering and title numbering were modified to fit this thesis

46
3.1. Abstract
Purkinje cell loss by excitotoxic damage is a typical finding in many cerebellar
diseases. One important aspect of this high sensitivity of Purkinje cells to excitotoxic
death might be the enormous size of their dendritic tree with a high load of excitatory
glutamate receptors. We have studied whether the reduction of the size of the
dendritic tree might confer resistance against excitotoxic death to Purkinje cells.
We have grown Purkinje cells in organotypic cerebellar slice cultures under chronic
activation of metabotropic glutamate receptors or of Protein kinase C. Both
treatments strongly reduced dendritic tree size. After this treatment, cells were
exposed to the glutamate receptor agonist AMPA which has a strong excitotoxic
effect on Purkinje cells. We found that Purkinje cells with small dendritic trees were
equally sensitive to AMPA exposure as untreated control cells with large dendritic
trees. Immunostaining against vesicular glutamate transporter 1 revealed that the
small dendritic trees were densely covered by glutamatergic terminals.
Our results indicate that the expansion of the dendritic tree and the total number of
AMPA receptors per neuron do not play a major role in determining the susceptibility
of Purkinje cells to excitotoxic death.
3.2. Introduction
The loss of Purkinje cells (PCs) is a hallmark of many cerebellar diseases causing
functional impairment of motor performance. An important factor for the involvement
of Purkinje cells in cerebellar disease is their high sensitivity to excitotoxic death
(Garthwaite & Garthwaite, 1984). In addition, Purkinje cells are often affected in
traumatic brain injuries (TBI). Loss of motor control and coordination, symptoms
typically associated with cerebellar dysfunction, play an important role within the
pathophysiology of TBI. It has been shown that Purkinje cell loss is a common finding
in TBI in experimental animals, even if the cerebellum is remote from the site of
impact, e.g. a focal injury in the forebrain (Mautes et al., 1996; Park et al., 2006).
Delayed neurodegeneration in the cerebellum is a generalized response to TBI and
the specific local pattern of cell loss (with a special vulnerability of the vermis region

47
of the cerebellum) suggests involvement of mechanisms other than mechanical
damage and haemorrhage (Park et al., 2006; Igarashi et al., 2007). There is
evidence that the PC loss in TBI does occur by excitotoxic mechanisms (Ai & Baker,
2002; Park et al., 2006). In experimental animals as well as in the cerebrospinal fluid
of patients with TBI, glutamate levels were significantly elevated after injury (Baker et
al., 1993; Palmer et al., 1993). Purkinje cell degeneration induced by (RS)-a-Amino-
3-hydroxy-5-methyl-4-isoxazolepropionic acid (AMPA) is an appropriate model
system to study excitotoxic neurodegeneration. The cytological features of Purkinje
cell degeneration after AMPA exposure are characterized by a process called dark-
cell degeneration (Meldrum & Garthwaite, 1990; Garthwaite & Garthwaite, 1991a).
This is a form of programmed cell death with features from both, apoptosis and
necrosis (Leist & Jaattela, 2001; Strahlendorf et al., 2003). Degenerating Purkinje
cells become positive for TUNEL staining and caspase 3 immunoreactivity
(Strahlendorf et al., 1999; Strahlendorf et al., 2003). Since AMPA-exposure kills
Purkinje cells but leaves cerebellar granule cells unharmed (Garthwaite &
Garthwaite, 1990; Garthwaite & Garthwaite, 1991a), it is well suited to investigate
susceptibility of Purkinje cells to excitotoxic death.
We have previously shown that chronic activation of metabotropic glutamate receptor
1 (mGluR1) (Sirzen-Zelenskaya et al., 2006) or Protein kinase C (PKC) (Metzger &
Kapfhammer, 2000; Schrenk et al., 2002) in organotypic cerebellar slice cultures of
postnatal mice severely inhibits the growth and development of the Purkinje cell
dendritic tree. A potential physiological function of growth inhibition by mGluR
activation might be to limit the size of the Purkinje cell dendritic tree in a kind of
feedback mechanism which would limit the number of excitatory inputs and the total
AMPA receptor load to make the cell less sensitive to excitotoxic death (depicted in
Fig. 9 A). In this study, we have tested this hypothesis and have grown Purkinje cells
in organotypic slice cultures under conditions which result in a severe reduction of
dendritic tree size. We have then analyzed the effects of AMPA exposure on Purkinje
cells with different dendritic tree sizes. Our results indicate that a reduction of the size
of the dendritic tree in Purkinje cells does not offer any protection from glutamate-
induced excitotoxicity.

48
3.3. Materials and Methods
3.3.1. Organotypic slice cultures
Animal experiments were carried out in accordance with the European Communities
Council Directive of 24 November 1986 (86/609/EEC) and were reviewed and
permitted by Swiss authorities. Cultures were prepared from B6CF1 mice as
described previously (Adcock et al., 2004; Kapfhammer, 2005). Briefly, mice were
decapitated at postnatal day 8 (P8), their brains were aseptically removed and the
cerebellum was dissected in ice-cold preparation medium (minimal essential medium
(MEM), 1% glutamax (Gibco, Invitrogen), pH 7.3). Sagittal sections 350 µm thick
were cut on a McIllwain tissue chopper under aseptic conditions. Slices were
separated, transferred onto permeable membranes (Millicell-CM, Millipore) and
incubated on a layer of incubation medium (50% MEM, 25% Basal Medium Eagle,
25% horse serum, 1% glutamax, 0.65% glucose) in a humidified atmosphere with 5%
CO2 at 37°C. The medium was changed every 2-3 days for a total of 13-14 days.
Pharmacological compounds were added to the medium at each change, according
to the treatment schedule (see Fig. 1 B): (RS)-3,5-Dihydroxyphenylglycine (DHPG,
Tocris) or Phorbol 12-myristate 13-acetate (PMA, Tocris) were added starting at 3-4
days in vitro (DIV) and washed out at DIV 10-11 (after 7 days of treatment), (RS)-a-
Amino-3-hydroxy-5-methyl-4-isoxazolepropionic acid (AMPA, Tocris) was added 24
hours after end of the pre-treatment (at DIV 11-12) for 4 hours. The following
concentrations were used: 15 µM DHPG, 100 nM PMA, 30 µM AMPA. Slices were
kept in culture for two additional days before fixation and immunohistochemical
staining.

49
Figure 9: Schematic drawings of starting hypothesis and treatment schedule. A) Starting hypothesis of this study: On an extensive dendritic tree, a greater number of glutamatergic synapses provide more entry points for excitatory input. This could make a large Purkinje cell more susceptible to excitatory overload through AMPA compared to a cell with a reduced dendritic tree. B) Treatment schedule for cerebellar slice cultures. At postnatal day 8 (P8), slice cultures were prepared. The pharmacological treatments with either DHPG or PMA were started at day in vitro 3 (DIV 3) and stopped at DIV10. After 24 hours of recovery time, the cultures were challenged with AMPA for 4 hours and kept in culture for two more days without treatment.
3.3.2. Immunohistochemistry
At DIV 13-14 cultures were fixed in 4% paraformaldehyde overnight at 4°C. All
reagents were diluted in 100 mM phosphate buffer (PB), pH 7.3. Slices were
incubated in blocking solution (0.5% Triton X-100, 3% normal goat serum) for a
minimum of 30 minutes in order to permeabilize the tissue and block non-specific
antigen binding. Two different primary antibodies were simultaneously added to the
slices in fresh blocking solution and incubated overnight at 4°C. After washing in PB,
secondary antibodies were added to the slices in PB containing 0.1% Triton X-100 in
order to prevent non-specific antigen binding for at least 1 hour at room temperature.

50
For the analysis of Purkinje and granule cell survival and Purkinje cell dendritic size,
rabbit anti-Calbindin D-28K (Swant, 1:1000) and monoclonal anti-NeuN (Chemicon,
Millipore, 1:500) were used as primary antibodies and goat anti-rabbit Alexa 546
(Molecular Probes, Invitrogen, 1:500) and goat anti-mouse Alexa 488 (Molecular
Probes, Invitrogen, 1:500) were used as secondary antibodies to visualize Purkinje
cells and cerebellar granule cells, respectively. For the synaptic analysis, mouse anti-
Calbindin D-28K (Swant, 1:1000) and rabbit anti-vGluT1 (Synaptic Systems, 1:3000)
were used as primary antibodies and goat anti-mouse Alexa 546 (1:500) and goat
anti-rabbit Alexa 488 (1:500) were used as secondary antibodies to visualize Purkinje
cells and glutamatergic synapses, respectively. Stained slices were mounted on
cover slips with Mowiol. Cultures were viewed on an Olympus AX-70 microscope
equipped with a Spot digital camera. Recorded images were adjusted for brightness
and contrast with Photoshop image processing software. For Fig. 2, multiple images
of cerebellar slice cultures photographed with the 10x lens were stitched together to
show the entire slice using the Photoshop panorama function.
3.3.3. Quantitative analysis of Purkinje cell survival and dendritic tree size
The quantification of the effects of the pharmacological treatments on Purkinje cell
dendritic tree size was done as previously described (Adcock et al., 2004; Sirzen-
Zelenskaya et al., 2006). Purkinje cells which had an axon and dendritic tree which
could be isolated from its surroundings were selected for analysis. As described
earlier (Adcock et al., 2004), the measurement of dendritic tree size was only
possible in Purkinje cells in which the dendritic field did not overlap with the one of
neighbouring cells. Cells were viewed on a with a 20x lens and photographed with a
digital camera (Coolsnap-Pro, Photometrics, Canada). An image analysis program
(Image Pro Plus) was used to trace the outline of the Purkinje cell dendritic trees
yielding the area covered by the dendritic tree. Cells were acquired from four
independent experiments with a minimum number of 20 cells per experiment. The
total number of analyzed individual cells ranged from 101 for control to 134 for DHPG
treatment. The data were analyzed using GraphPad Prism software. The mean value
of the dendritic tree area of untreated control cells was set to 100% and the results

51
were expressed as percentage of controls +/- standard deviation with 95%
confidence intervals. The statistical significance of differences in parameters was
assessed by non-parametric analysis of variance (Kruskal-Wallis test) followed by
Dunn’s post test. For comparisons of single data columns, Mann-Whitney’s non-
parametric test was used.
For the evaluation of Purkinje cell survival, we used a semi-quantitative rating similar
to a one described earlier (Dusart et al., 1997; Schrenk et al., 2002). Briefly, five
classes of slices were defined according to the number and arrangement of Calbindin
D-28K stained Purkinje cells. Class I included slices with very few dispersed cells, i.e.
with no compact group containing more than 20 cells and a total Purkinje cell number
< 50. Class II included slices with at least one cluster with more than 20 cells or a
total Purkinje cell number >50. In the third class (III), slices with 4 or more clusters of
over 20 cells or with one intact folium were included. In class IV, slices with 2 or more
intact folia but at least two missing or incomplete folia were included. Class V
contained all slices with not more than one missing or incomplete folium. The total
number of analyzed slices ranged from 45 for DHPG treatment to 72 for PMA
treatment and slices for each treatment came from at least 4 independent
experiments. In order to compare results from different treatment groups, the
arithmetic mean of the survival class values for all slices from one group was
calculated and named the “survival score” for this treatment group. A possible
protective effect on Purkinje cell survival would be detected with high sensitivity
because additional survival of only few Purkinje cells in a slice with no Purkinje cell
survival (as typically seen with AMPA treatment) would lead to classification in class
II instead of class I.

52
Figure 10: Representative slices for survival classes V (A), IV (B), III (C) and II (D). Calbindin D-28K staining shows Purkinje cells. A) Class V, virtually complete survival of Purkinje cells. B) Class IV, Purkinje cell growth is thinned out in 3 folia (arrows). C) Class III, moderate Purkinje cell survival, more than 4 clusters with compact growth (arrows). D) Class II, few dispersed surviving Purkinje cells, only one cluster with more than 20 Purkinje cells (arrow). Scale bar 500 µm.

53
3.4. Results
3.4.1. AMPA kills Purkinje cells in a dose dependent manner
In order to evaluate cell survival, we used a semi-quantitative rating of Purkinje cell
survival in the slice cultures similar to the one described in (Dusart et al., 1997). Five
groups of slices were defined according to the number and arrangement of Calbindin
D-28K stained Purkinje cells. Class V would represent slices with virtually complete
survival of Purkinje cells throughout the slice and class I would represent almost
complete death of Purkinje cells (details in Methods). Figure 10 shows representative
examples of three of the five groups. For the different treatment conditions, a mean
survival score was calculated which represents the mean of the survival scores of a
particular treatment group. A mean survival score of 5 would mean that 100% of the
slices were in class V and a score of 1 that all slices were in class I.
In order to assess the neurotoxic potential of AMPA treatment for Purkinje cells,
slices grown under control conditions for 11 days (see treatment schedule in
Methods, Fig. 9 B) were treated with different concentrations of AMPA for 4 hrs. After
the treatment, the slices were kept in culture for 2 additional days. Figure 11 A shows
the survival scores of Purkinje cells exposed to different AMPA concentrations.
Without AMPA treatment the mean survival score was 4.69, i.e. most slices belonged
to class V, demonstrating good survival of Purkinje cells under control conditions.
Survival of Purkinje cells in slices treated with 2 µM AMPA for 4 h was similar to
control slices with a mean survival score of 4.66. After treatment with 5 µM AMPA,
the slice cultures displayed several regions with remarkable cell loss and the mean
survival score dropped to 3.88. After 10 µM AMPA there was a considerable cell loss
throughout the slices with the mean survival score dropping to 2.25. After 20 µM
AMPA 89% of slices was in class I and the mean survival score was down to 1.13.
After treatment with 30 µM AMPA virtually all Purkinje cells were lost with 98% of the
slices belonging to class I and a mean survival score of 1.02. AMPA toxicity affected
Purkinje cells in an all-or-nothing kind of reaction: within one slice some Purkinje cells
were seen disintegrating, while neighbouring cells looked healthy without any signs
of impairment. Figure 11 B shows a dying Purkinje cell after AMPA treatment. Note
that the remnants of the former dendritic tree are still visible.

54
Figure 11: AMPA kills Purkinje cells in a dose dependent manner. A) Mean survival score of the slice cultures treated with increasing AMPA concentrations. Each slice was given a value according to the survival class it was categorized into and the arithmetic mean was calculated. A value of 5 would mean complete Purkinje cell survival, a value of 1 complete Purkinje cell death. The slices in the control group remained untreated. With increasing AMPA concentrations a dose-dependent loss of Purkinje cells is evident which became virtually complete at 20 µM and 30 µM AMPA. B) Calbindin D-28K staining of a Purkinje cell after treatment with 10 µM AMPA. The dendritic tree and the cell body are disintegrating. Scale bar 50 µm.
3.4.2. Pre-treatment with DHPG or PMA reduces dendritic tree size without a strong impact on cell survival
A strong reduction of the dendritic tree size in cerebellar Purkinje cells in slice
cultures can be achieved by chronic activation of either mGluR1 (Sirzen-Zelenskaya
et al., 2006) or PKC (Metzger & Kapfhammer, 2000; Schrenk et al., 2002). We have
treated organotypic slice cultures according to these studies for 7 days with either
the PKC activator PMA or the group I mGluR activator DHPG, starting at DIV 3-4.
After completion of these treatments, slices were kept in culture for 4 more days in
parallel with the cultures from the experimental groups which were exposed to AMPA
(see below). Measurement of the dendritic tree area showed that the PMA treatment
reduced the size of the dendritic tree to 43% of that of control cells, and the DHPG
treatment to 49%, meaning that dendritic tree area was reduced to less than half of
its original size (see Fig. 12 A and B). This reduction was clearly evident in the cell
morphology (Fig. 12 C-E). It should be noted that the size reduction probably was

55
even more pronounced at the beginning of the AMPA treatment (1 day after the 7
day treatment period) because the dendritic trees had 4 days for recovery in control
medium after ending the DHPG or PMA treatment. Recovery of the dendritic tree size
has been shown to occur after washout of PMA (Metzger & Kapfhammer, 2000).
In order to verify that none of the pharmacological agents used severely affected
Purkinje cell survival by itself, we measured cell survival at DIV 13-14 in DHPG-
treated, PMA-treated and control cultures. PMA-treatment had no adverse effect on
cell survival, and DHPG treatment resulted in a mild reduction of Purkinje cell survival
with more slices falling into classes 4 and 3. The mean survival scores were 4.52 for
control cultures, 4.56 for PMA-treated cultures and 3.8 for DHPG-treated cultures.
The distribution of the slices in the different classes is shown in Figure 13.

56
Figure 12: Size of the area covered by a Purkinje cell dendritic tree. Standard size of control cells was rated 100%. A) Cells were treated with DHPG (15 μM) without AMPA exposure. The average dendritic tree size was reduced to 43% of that of control cells (100%). B) After treatment with PMA (100 nM) without AMPA exposure the mean size of the dendritic tree was reduced to 49% of that of control cells (100%). Differences were significant with p< 0.01, Mann-Whitney test. Error bars represent the mean +/- standard deviation; standard deviation was 39% for PMA-treated cells (A), 40% for DHPG-treated cells (B) and 39% for control cells. C) – E) Examples of the morphology of dendritic trees of Purkinje cells grown under control conditions (C) or treated with DHPG (D) or PMA (E) for 7 days, without the AMPA exposure. Dendritic trees were visualized by immunostaining for Calbindin D-28K. The strong reduction of dendritic tree size after the treatments is evident. Scale bar 50 µm.

57
Figure 13: Distribution of the survival classes in PMA- and DHPG-treated slice cultures. The total number of classified slices of each treatment was set as 100%. The slices in the control group remained untreated. A) Survival of slices receiving PMA 100 nM for 7 days was identical to control slices. B) Survival of slices treated with DHPG 15 µM for 7 days was moderately reduced compared to control slices with more slices falling into classes III and IV.
3.4.3. Normal sensitivity to AMPA induced neurotoxic death of Purkinje cells with small dendritic trees after PMA-treatment or DHPG-treatment
To test Purkinje cell susceptibility to AMPA treatment, we chose an AMPA
concentration of 30 µM, the lowest concentration which caused an explicit, almost
complete Purkinje cell loss in control cultures (Fig. 11 A). At this point of the AMPA
dose-response curve, a higher resistance to AMPA would result in a clearly
detectable improvement of Purkinje cell survival.
When we exposed Purkinje cells from either DHPG-treated or PMA-treated cultures
with small dendritic trees to 30 µM AMPA for 4 hours we found no difference in
survival compared to Purkinje cells in control cultures with normal sized dendritic
trees. After the AMPA treatment, the mean survival score of control cultures was
down to 1.15, with 85% of the slices grown under control conditions were in class I
and 15% in class II. In slices pretreated with DHPG, the survival score after AMPA
exposure was 1.16 with 84% falling into class I and to 16% into class II. With PMA
pretreatment, the AMPA-mediated Purkinje cell loss was similar with a mean survival

58
score of 1.19. Of these slices, 85% were in class I, 10.5% in class II and 4.5%
reached class III. These results indicate that the reduction of the dendritic tree size by
pretreatment with either DHPG or PMA had no beneficial effect on AMPA mediated
toxicity, i.e. the Purkinje cells retained the full sensitivity to AMPA neurotoxicity
despite the strong reduction of dendritic tree size. The distribution of the slices in the
different classes is shown in Figure 14.
Figure 14: Survival of Purkinje cells with size-reduced dendritic trees after AMPA exposure. A) Slice cultures were pre-treated with 100 nM PMA for 7 days and then exposed to 30 µM AMPA for four hours (at DIV 11). There was no improved survival of the Purkinje cells in the pre-treated cultures; survival classes were similar to control cultures. B) Slice cultures were pre-treated with 15 µM DHPG for 7 days and then exposed to 30 µM AMPA for four hours (DIV 11). There was no improved survival of the Purkinje cells in the pre-treated cultures; survival classes were similar to control cultures.
3.4.4. Glutamatergic synapses are abundantly available even on severely reduced dendritic trees
Since Purkinje cells with reduced dendritic trees were equally sensitive to excitatory
overload by AMPA as those in control cultures, we have studied the presence of
glutamatergic synapses on these Purkinje cells by immunohistochemistry. In order to
visualize the presynaptic parts of the parallel fiber/Purkinje cell synapses, we stained
for the vesicular glutamate transporter (vGluT) 1 which is expressed on the terminals
of parallel fibers (Fremeau et al., 2001; Takamori, 2006). Immunostaining with
vGluT2 which specifically labels mossy fibers and climbing fibers (Hioki et al., 2003)

59
was negative throughout the culture confirming the absence of these extrinsic fiber
populations (data not shown). As shown in Figure 15, vGluT1 immunoreactivity
appeared to be equally intense on the normal dendritic tree of control neurons and on
the size-reduced Purkinje cell dendritic trees from PMA- or DHPG-treated cultures,
revealing the presence of tightly clustered glutamatergic terminals. Interestingly,
many of the somata of Purkinje cells in PMA-treated, but not in DHPG- treated or
control cultures, were also covered by vGluT1-positive terminals. Despite the
absence of inferior olive-derived climbing fibers in the cultures the PC soma was not
covered by vGluT1-positive terminals under control conditions indicating a specific
affinity of parallel fiber terminals for the more distal parts of the PC dendritic tree even
in the absence of climbing fibers. This specificity appears to be lost after PKC
activation, but not after mGluR activation.
Figure 15: vGluT1 staining on Purkinje cells to visualize glutamatergic terminals. Double staining with Calbindin D-28K showing Purkinje cells in red and vGluT1 showing glutamatergic afferent terminals in green clustered around dendrites of Purkinje cells. A) A Purkinje cell grown under control conditions shows dense clusters of vGluT1-positive afferent terminals along the dendrites. The cell soma and the proximal part of the dendritic tree are devoid of vGluT1-positive afferent terminals. B) Two Purkinje cells after treatment with 100 nM PMA. The small dendrites are completely and densely covered by vGluT1-positive afferent terminals. In the lower cell vGluT1- positive afferent terminals are also present on the cell soma and the proximal dendrites. C) A Purkinje cell after treatment with 15 µM DHPG. The small dendrites are completely and densely covered by vGluT1-positive afferent terminals. The cell soma and the proximal part of the dendrite are devoid of vGlut1-positive afferent terminals. Scale bar 50 µm.

60
3.4.5. Cerebellar granule cells survive high doses of AMPA and start to express Calbindin D-28K immunoreactivity
While we observed an almost complete loss of Purkinje cells after 4 hrs of AMPA
exposure, we did not observe any noticeable loss of granule cells in these
experiments. Granule cell survival was assessed by staining with NeuN which in the
cerebellum selectively labels granule cells (Weyer & Schilling, 2003). Neither DHPG
nor PMA treatment changed the overall appearance of granule cells (data not
shown). After exposure to AMPA, granule cells survived with apparently normal cell
density. In some experiments we used concentrations of up to 1 mM AMPA for
several days without observing a considerable loss of granule cells (data not shown)
demonstrating the remarkable resistance of these cells to AMPA exposure.
Interestingly, after AMPA treatment, granule cells started to express Calbindin D-28K
at the end of the culture period (see Fig. 16). Calbindin D-28K immunoreactivity on
granule cells could be detected as early as 24h after AMPA exposure (data not
shown).
Figure 16: Double staining of Calbindin D-28K (red) and NeuN (green) reveals induction of Calbindin D-28K expression in AMPA challenged granule cells. A) - C) In control cultures granule cells are positive for NeuN (A) and are negative for Calbindin D-28K, which labels specifically Purkinje cells (B). Merged image in (C). D) – F) After AMPA exposure many NeuN-positive granule cells (D) became positive for Calbindin D-28K immunoreactivity (E). Most Purkinje have been lost due to the neurotoxic action of AMPA (E). Merged image in (F). Scale bar 50 µm.

61
3.5. Discussion
Neurons display a large variety in their sensitivity to excitotoxic activation. In the
cerebellum, Purkinje cells are highly susceptible to AMPA-mediated neurotoxic injury
and death. In contrast, cerebellar granule cells, despite the presence of AMPA
receptors, are almost insensitive to AMPA neurotoxic effects. While many of the
differences in sensitivity of different neurons to neurotoxic damage probably result
from different intracellular defence and compensatory mechanisms, one possible
determinant for this sensitivity also might be the total receptor load of the neuron and,
related to this, the size of the dendritic tree. We have tested whether a reduction of
the dendritic tree size of Purkinje cells, induced by two different independent
pharmacological treatments, may confer a certain protection from AMPA mediated
neurotoxicity. Our results show that the reduction of the dendritic tree size offers no
protection from AMPA-mediated neurotoxicity. Immunohistochemical staining for the
vesicular glutamate transporter vGluT1 revealed that glutamatergic synapses were
present in high density on the small dendritic trees of pre-treated Purkinje cells
suggesting that receptor density rather than total receptor load is important for
determining the sensitivity of Purkinje cells to AMPA-mediated neurotoxic death.
3.5.1. Purkinje cell excitotoxic death
Purkinje cells are very sensitive to AMPA-mediated excitotoxic death. A brief 30 min
long exposure of Purkinje cells to 30 µM AMPA is sufficient to cause death of most
Purkinje cells by dark degeneration (Garthwaite & Garthwaite, 1991a). Neurotoxic
death is mediated by a rise in intracellular calcium (Garthwaite & Garthwaite, 1991b;
Strahlendorf et al., 1998). Our finding that a 4 hour exposure to 20-30 µM AMPA
essentially wipes out the Purkinje cell population in cerebellar slice cultures is in good
agreement with these findings. Furthermore, we show that even lower concentrations
of AMPA beginning with 5 µM AMPA for 4 hours lead to a considerable loss of
Purkinje cells. This is in agreement with our earlier finding that chronic exposure of
cerebellar slice cultures to 5 µM AMPA resulted in an almost complete loss of
Purkinje cells in cerebellar slice cultures (Sirzen-Zelenskaya et al., 2006). The high
sensitivity of Purkinje cells to AMPA-mediated excitotoxic death is also reflected by
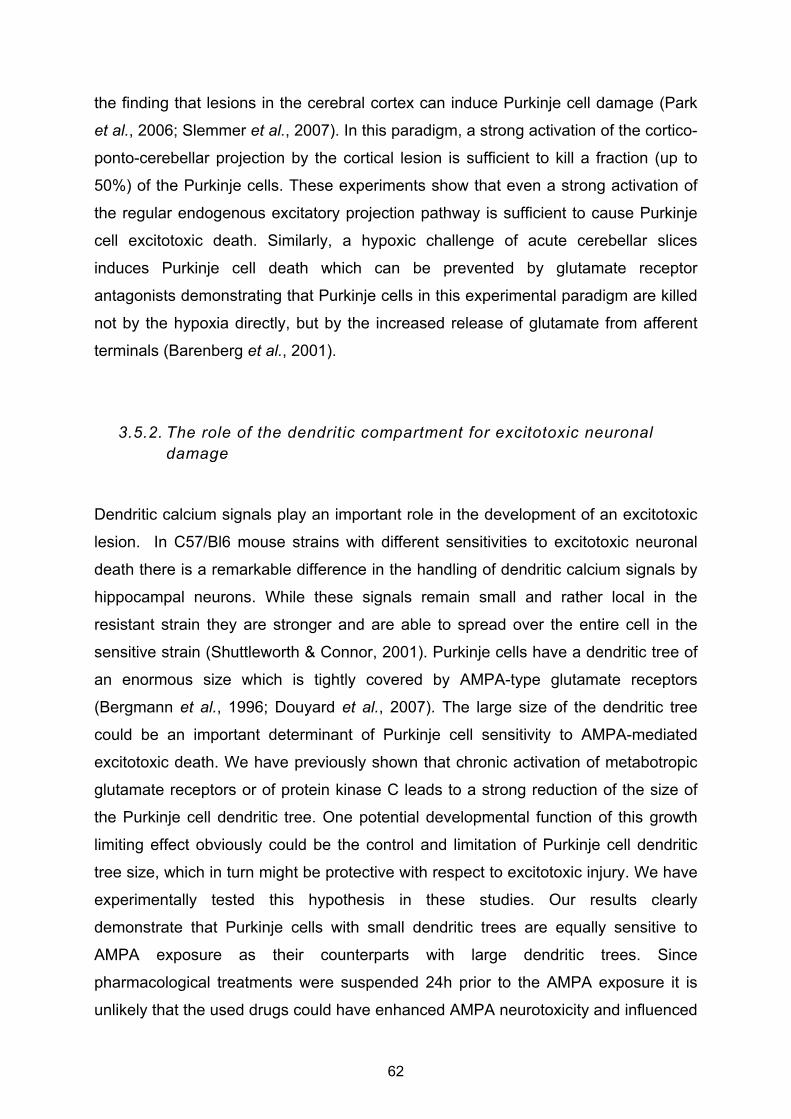
62
the finding that lesions in the cerebral cortex can induce Purkinje cell damage (Park
et al., 2006; Slemmer et al., 2007). In this paradigm, a strong activation of the cortico-
ponto-cerebellar projection by the cortical lesion is sufficient to kill a fraction (up to
50%) of the Purkinje cells. These experiments show that even a strong activation of
the regular endogenous excitatory projection pathway is sufficient to cause Purkinje
cell excitotoxic death. Similarly, a hypoxic challenge of acute cerebellar slices
induces Purkinje cell death which can be prevented by glutamate receptor
antagonists demonstrating that Purkinje cells in this experimental paradigm are killed
not by the hypoxia directly, but by the increased release of glutamate from afferent
terminals (Barenberg et al., 2001).
3.5.2. The role of the dendritic compartment for excitotoxic neuronal damage
Dendritic calcium signals play an important role in the development of an excitotoxic
lesion. In C57/Bl6 mouse strains with different sensitivities to excitotoxic neuronal
death there is a remarkable difference in the handling of dendritic calcium signals by
hippocampal neurons. While these signals remain small and rather local in the
resistant strain they are stronger and are able to spread over the entire cell in the
sensitive strain (Shuttleworth & Connor, 2001). Purkinje cells have a dendritic tree of
an enormous size which is tightly covered by AMPA-type glutamate receptors
(Bergmann et al., 1996; Douyard et al., 2007). The large size of the dendritic tree
could be an important determinant of Purkinje cell sensitivity to AMPA-mediated
excitotoxic death. We have previously shown that chronic activation of metabotropic
glutamate receptors or of protein kinase C leads to a strong reduction of the size of
the Purkinje cell dendritic tree. One potential developmental function of this growth
limiting effect obviously could be the control and limitation of Purkinje cell dendritic
tree size, which in turn might be protective with respect to excitotoxic injury. We have
experimentally tested this hypothesis in these studies. Our results clearly
demonstrate that Purkinje cells with small dendritic trees are equally sensitive to
AMPA exposure as their counterparts with large dendritic trees. Since
pharmacological treatments were suspended 24h prior to the AMPA exposure it is
unlikely that the used drugs could have enhanced AMPA neurotoxicity and influenced

63
Purkinje cell survival. Furthermore, pharmacological treatments alone had no or only
a minor effect on Purkinje cell survival. These findings clearly indicate that the high
sensitivity of Purkinje cells to AMPA-mediated excitotoxic death is unrelated to the
large size of the Purkinje cell dendritic tree and to total AMPA receptor load. They
rather suggest that important factors for the sensitivity to neurotoxic death are
glutamate receptor density and the handling of calcium signals by the neuron. This
interpretation is supported by studies showing that Purkinje cell neurotoxic death is
influenced by the presence and activity of neuronal and glial glutamate transporters
(Yamashita et al., 2006; Slemmer et al., 2007) or by the activation of calpain
(Mansouri et al., 2007). It should be noted that the experiments in this study were
done in the organotypic slice culture model system, where the afferent innervation of
Purkinje cells is severely altered compared to the in vivo situation. The climbing fiber
innervation is missing in these cultures, and innervation by parallel fibers is not by
parallel fiber beams running orthogonal to the Purkinje cell dendrite, but rather by
fibers originating from local granule cells. Nevertherless, expression of glutamate
receptors in Purkinje cells is very similar to the in vivo situation, and most
electrophysiological characteristics of Purkinje cells are nicely preserved in the slice
cultures (Dupont et al., 2006). We are therefore convinced that our findings are not
specific to the culture situation, but also apply to Purkinje cells in vivo.
3.5.3. Resistance of granule cells to AMPA treatment
In our experimental paradigm granule cells in the cerebellar slice cultures proved to
be remarkably resistant to AMPA treatment. Even after chronic exposure to 1mM
AMPA granule cells survived without any apparent cell loss in our cultures. This is in
agreement with earlier studies showing that granule cells are insensitive to AMPA
mediated excitotoxicity (Garthwaite & Garthwaite, 1991a; Resink et al., 1994) despite
the presence of Calcium-permeable GluR2 receptor subunits and AMPA-mediated
Calcium influx (Hack et al., 1995). Apparently granule cells are able to handle a
certain Calcium load evoked by AMPA treatment, but AMPA induces granule cell loss
when receptor desensitization is blocked (Hack et al., 1995) or energy metabolism is
compromised (Cebers et al., 1998). In this study we observed that granule cells
exposed to AMPA became distinctly immunoreactive for Calbindin D-28K. Typically,
64
granule cells do not express Calbindin D-28K immunoreactivity, which in the
cerebellum is a specific marker for Purkinje cells (Bastianelli, 2003). Our finding that
AMPA-challenged cerebellar granule cells rapidly become immunoreactive for
Calbindin D-28K shows that the specificity of Calbindin D-28K immunoreactivity for
Purkinje cells in the cerebellum is not absolute, and that also granule cells can
express this protein. This finding suggests that the upregulation of Calcium-buffering
proteins may be an important mechanism by which granule cells protect themselves
from AMPA-mediated neurotoxic death.
3.6. Conclusion
Our results show that the reduction of the dendritic tree size offers no protection from
AMPA-mediated neurotoxicity. Vesicular glutamate transporter vGluT1 staining
revealed that glutamatergic synapses were present in high density on the small
dendritic trees of pre-treated Purkinje cells suggesting that receptor density rather
than total receptor load is important for determining the sensitivity of Purkinje cells to
AMPA-mediated neurotoxic death. Our finding that AMPA-challenged cerebellar
granule cells rapidly become immunoreactive for Calbindin D-28K shows that the
specificity of Calbindin D-28K immunoreactivity for Purkinje cells in the cerebellum is
not absolute, and that also granule cells can express this protein. This finding
suggests that the upregulation of Calcium-buffering proteins may be an important
mechanism by which granule cells protect themselves from AMPA-mediated
neurotoxic death.
Acknowledgements
We thank Markus Saxer for technical assistance. This work was supported by the
University of Basel and the Swiss National Science Foundation (31003A-116624).

65
4. Mechanisms of dendritic growth inhibition mediated by chronic mGluR1 or PKC activation
P/Q-type and T-type calcium channels, but not TRPC3 channels, are involved in inhibition of dendritic growth after chronic mGluR1 and PKC activation in cerebellar Purkinje cells
Olivia S. Gugger1, Jana Hartmann2, Lutz Birnbaumer3 and Josef P. Kapfhammer1
1 Anatomical Institute, Department of Biomedicine Basel, University of Basel, Pestalozzistr. 20, CH - 4056 Basel, Switzerland
2 Institute for Neuroscience, TU Munich, Biedersteiner Str. 29, D - 80802 Munich, Germany
3 National Institute of Environmental Health Sciences, Research Triangle Park, NC27709, USA
The following section is based on the work accepted for publication in the European Journal of Neuroscience. Some text, figures, figure legend numbering and title numbering were modified to fit this thesis

66
4.1. Abstract
The development of a neuronal dendritic tree is modulated by signals from afferent
fibers as well as by an intrinsic program. We have previously shown that chronic
activation of either class I metabotropic glutamate receptors or Protein Kinase C in
organotypic cerebellar slice cultures of mice and rats severely inhibits the growth and
development of the Purkinje cell dendritic tree. The signaling events linking receptor
activation to the regulation of dendritic growth remain largely unknown. We have
studied whether channels allowing the entry of Ca2+ ions into Purkinje cells, in
particular the TRPC3 channels, P/Q-type and T-type Ca2+ channels, might be
involved in the signaling after mGluR1 or PKC stimulation. We show that the
inhibition of dendritic growth seen after mGluR1 or PKC stimulation is partially
rescued by pharmacological blockade of P/Q-type and T-type Ca2+ channels
indicating that activation of these channels mediating Ca2+ influx contributes to the
inhibition of dendritic growth. In contrast, absence of Ca2+-permeable TRPC3
channels in TRPC3-deficient mice or pharmacological blockade had no effect on
mGluR1- and PKC-mediated inhibition of Purkinje cell dendritic growth. Similarly,
blockade of Ca2+ influx through GluRdelta2 or R-type Ca2+ channels or inhibition of
release from intracellular stores did not influence mGluR1- and PKC-mediated
inhibition of Purkinje cell dendritic growth. These findings suggest that both T- and
P/Q-type Ca2+ channels, but not TRPC3 or other Ca2+-permeable channels, are
involved in mGluR1 and PKC signaling leading to the inhibition of dendritic growth in
cerebellar Purkinje cells.

67
4.2. Introduction
A large and highly elaborate dendritic tree is a characteristic feature of cerebellar
Purkinje cells. The factors and molecules controlling the growth and patterning of
neuronal dendrites are not yet well understood. We have previously shown that
chronic activation of metabotropic glutamate receptor 1 (mGluR1) (Sirzen-
Zelenskaya et al., 2006) or Protein Kinase C (PKC) (Metzger & Kapfhammer, 2000;
Schrenk et al., 2002) in organotypic cerebellar slice cultures of postnatal mice
severely inhibits the growth and development of the Purkinje cell dendritic tree.
The signaling events leading to inhibition of dendritic growth after both mGluR1 and
PKC activation remain largely unknown, but PKC activation is not required for the
inhibitory effect of mGluR1 suggesting that both use independent signaling pathways
(Sirzen-Zelenskaya et al., 2006). In this study we have searched for potential
mechanisms limiting Purkinje cell dendritic growth and have concentrated on
channels allowing the entry of Ca2+ ions. Increased influx of Ca2+ into Purkinje cells
occurs in two independent mouse models which are characterized by Purkinje cells
with greatly reduced dendritic arbors similar to the ones seen after mGluR or PKC
stimulation: the lurcher (Zanjani et al., 2009) and the moonwalker (mwk) mice
(Becker et al., 2009). In the mwk mouse model, a gain-of-function mutation in the
Trpc3 gene leads to altered TRPC3 channel gating resulting in an ataxic phenotype
with impaired growth and development of Purkinje cells with a drastically reduced
dendritic tree reminiscent of that seen after mGluR or PKC activation (Becker et al.,
2009). The TRPC3 channel is a nonselective cation channel which mediates the slow
excitatory postsynaptic potential (sEPSP) seen after stimulation of mGluR1
(Hartmann et al., 2008). Trpc3 is strongly expressed in Purkinje cells during
dendritogenesis (Huang et al., 2007).
Purkinje cell dendrites have a high density of voltage dependent Ca2+ channels
(VDCC), which consist mostly of the high-threshold P/Q-type (Usowicz et al., 1992).
P/Q-type Ca2+ channels in dendrites have been shown to be essential for the trimodal
pattern of Purkinje cell spontaneous activity (Womack & Khodakhah, 2002; Womack
& Khodakhah, 2004). Contributing to the low-threshold fraction of Ca2+ currents and
to dendritic burst firing of Purkinje cells are the T-type Ca2+ channels (Pouille et al.,
2000; Swensen & Bean, 2003; Womack & Khodakhah, 2004). The Cav3.1 and
Cav3.3 T-type channel isoforms are expressed in Purkinje cells and the Cav3.1

68
isoform has been shown to co-localize with mGluR1 in spines and to be potentiated
upon mGluR1 activation (Hildebrand et al., 2009).
In this study we have analyzed the role of P/Q-type, T- type and TRPC3 channels in
mGluR1- and PKC-mediated dendritic growth inhibition. Pharmacological inhibition of
the channels in cerebellar slice cultures revealed that both T- and P/Q-type Ca2+
channels are involved in mediating growth inhibition after chronic mGluR1 and PKC
activation. In contrast, using TRPC3 deficient mice (Hartmann et al., 2008) or
pharmacological blockade of TRPC3, release from intracellular stores, GluRdelta2 or
R-type Ca2+ channels, no involvement of TRPC3 or other sites of Ca2+ entry in the
mGluR1 and PKC-mediated inhibition of dendritic growth was found.
4.3. Materials and Methods
4.3.1. Organotypic slice cultures
Animal experiments were carried out in accordance with the European Communities
Council Directive of 24 November 1986 (86/609/EEC) and were reviewed and
permitted by Swiss authorities. Cultures were prepared from B6CF1 mice (CB6) and
TRPC3-/- mice (Hartmann et al., 2008) as described previously (Adcock et al., 2004;
Kapfhammer, 2005). Briefly, mice were decapitated at postnatal day 8 (P8), their
brains were aseptically removed and the cerebellum was dissected in ice-cold
preparation medium (minimal essential medium (MEM), 1% glutamax (Gibco,
Invitrogen), pH 7.3). Sagittal sections 350 µm thick were cut on a McIllwain tissue
chopper under aseptic conditions. Slices were separated, transferred onto permeable
membranes (Millicell-CM, Millipore) and incubated on a layer of incubation medium
(50% MEM, 25% Basal Medium Eagle, 25% horse serum, 1% glutamax, 0.65%
glucose) in a humidified atmosphere with 5% CO2 at 37°C. The medium was
changed every 2-3 days. Pharmacological compounds were added to the medium at
each change for a total of 7 days, starting at 2-4 days in vitro (DIV). Slices were kept
in culture for a total of 9-11 days before fixation and immunohistochemical staining.
The following compounds were used: (RS)-3,5-Dihydroxyphenylglycine (DHPG,
Tocris, Bristol, UK), Phorbol 12-myristate 13-acetate (PMA, Tocris), ω-Agatoxin IVA
(Bachem, Bubendorf, Switzerland), ω-Conotoxin MVIIC (Bachem), mibefradil
dihydrochloride (Tocris), NNC 55-0396 dihydrochloride (Tocris), SNX-482 (Biotrend,

69
Köln, Germany), 1-naphthyl acetyl spermine (Nasp, Sigma), U73122 (Tocris), Ethyl-
1-(4-(2,3,3-trichloroacrylamide)phenyl)-5-(trifluoromethyl)-1H-pyrazole-4-carboxylate
(Pyr3, Tocris). The following concentrations were used: 10 µM DHPG (Sirzen-
Zelenskaya et al., 2006), 50 nM PMA (Metzger & Kapfhammer, 2000; Schrenk et al.,
2002), 100 nM ω-Agatoxin IVA (shown to be effective and selective in (Mintz et al.,
1992a; Mintz et al., 1992b)), 1 μM ω-Conotoxin MVIIC (McDonough et al., 1996),
500nM SNX-482 (Newcomb et al., 1998), 100 μM Nasp (as used in (Zanjani et al.,
2009), 3μM Pyr3 (Kiyonaka et al., 2009), 10 μM U73122 (as used in (Canepari &
Ogden, 2006)), 2 µM mibefradil, 1 µM NNC 55-0396. When organotypic slice cultures
were treated for 7 days with the specific T-type Ca2+ channel inhibitor NNC 55-0396,
we found that the compound was toxic to Purkinje cell axons in concentrations above
1 µM. Purkinje cell survival and dendritic development, however, was not affected up
to concentrations of 6 µM (Fig. 17). The same observation was made with the T-type
Ca2+ channel inhibitor mibefradil in higher concentrations (Gugger and Kapfhammer,
unpublished observations). Since mibefradil has been reported to inhibit T-type
currents on Purkinje cells at 2 µM (McDonough & Bean, 1998) and to have an IC50
value about 1.5 times higher than NNC 55-0396 (Huang et al., 2004), we decided to
apply 1 µM NNC 55-0396 to study dendritic development.
4.3.2. Immunocytochemistry
At DIV 9-11 cultures were fixed in 4% paraformaldehyde overnight at 4°C. All
reagents were diluted in 100 mM phosphate buffer (PB), pH 7.3. Slices were
incubated in blocking solution (0.3% Triton X-100, 3% normal goat serum) for a
minimum of 30 minutes in order to permeabilize the tissue and block non-specific
antigen binding. The primary antibody was added to the slices in fresh blocking
solution and incubated overnight at 4°C. After washing in PB, the secondary antibody
was added to the slices in PB containing 0.1% Triton X-100 in order to prevent non-
specific antigen binding for at least 1 hour at room temperature. For the analysis of
Purkinje cell survival and Purkinje cell dendritic size, rabbit anti-Calbindin D-28K
(Swant, Marly, Switzerland, 1:1000) was used as a primary antibodiy to visualize
Purkinje cells. Stained slices were mounted on glass slides and coverslipped with
Mowiol. Cultures and sections were viewed on an Olympus AX-70 microscope

70
equipped with a Spot digital camera. Recorded images were adjusted for brightness
and contrast with Photoshop image processing software.
Figure 17: Toxicity of the T-type channel inhibitor NNC 55-0396 on Purkinje cell axons. Staining of Calbindin D-28K shows Purkinje cells. Cells were treated with NNC 55-0396 for 7 days. Scale bar: 100 μm A) In untreated control cultures the Purkinje cell axons are clearly visible (asterisk in A). B) Treatment with NNC 1 μM does not harm Purkinje cell axons (asterisk in B) C) Treatment with NNC 3 µM causes damage of Purkinje cell axons (asterisk in C) D) After treatment with NNC 6 µM most Purkinje cell axons are missing (asterisk in D)
4.3.3. Quantitative analysis of cultured Purkinje cells
The quantification of the effects of the pharmacological treatments on Purkinje cell
dendritic tree size was done as previously described (Adcock et al., 2004; Sirzen-
Zelenskaya et al., 2006). Purkinje cells which had a dendritic tree which could be
isolated from its surroundings were selected for analysis. Cells were viewed with a

71
25x lens and photographed with a digital camera (Coolsnap-Pro, Photometrics,
Canada). Dendritic branch points were counted and an image analysis program
(Image Pro Plus) was used to trace the outline of the Purkinje cell dendritic trees
yielding the area covered by the dendritic tree. Cells were acquired from three
independent experiments with an average number of 20 cells per experiment and per
growth condition. For detailed information on the number of cells measured for each
diagram see supporting Table 1. The data were analyzed using GraphPad Prism
software. The mean value of the dendritic tree area and number of branch points of
untreated control cells were set to 100 % and the results were expressed as
percentage of controls. Error bars represent the standard error of the mean (SEM).
The statistical significance of differences in parameters was assessed by non-
parametric analysis of variance (Kruskal-Wallis test) followed by Dunn’s post test. For
comparisons of single data columns, Mann-Whitney’s non-parametric test was used.
Confidence intervals were 95 %, statistical significance when p<0.05. The number of
measured cells is indicated as n value in the figure legends.
4.4. Results
4.4.1. Inhibition of T-, N- and P/Q-type Ca2+ channels in cerebellar
slice cultures does not affect dendritic tree size in Purkinje cells
T- and P/Q-type Ca2+ channels are abundantly expressed in Purkinje cell dendrites
(Usowicz et al., 1992; Hildebrand et al., 2009) and are one of the major sources of
Ca2+ influx into Purkinje cells (Usowicz et al., 1992; Watanabe et al., 1998; Isope &
Murphy, 2005; Isope et al., 2010). Furthermore, Ca2+ influx through these channels
has been shown to be potentiated by mGluR1 activation (Kitano et al., 2003;
Hildebrand et al., 2009; Johnston & Delaney, 2010). In order to exclude the
possibility that inhibition of P/Q- and T-type Ca2+ channels by itself has a specific
effect on Purkinje cell dendritic trees independent of mGluR1 or PKC stimulation we
tested the effect of channel antagonists on Purkinje cell dendritic trees. For P/Q-type
Ca2+ channel inhibition, a combination of ω-Agatoxin IVA and ω-Conotoxin MVIIC
was used (further referred to as P/Q-block) (Mintz et al., 1992a; McDonough et al.,
2002). ω-Conotoxin MVIIC is also a strong inhibitor of N-type Ca2+ channels

72
(McDonough et al., 1996), which contribute about 5 % to the total high-threshold Ca2+
currents in Purkinje cells (Regan, 1991; Mintz et al., 1992a; Watanabe et al., 1998;
McKay & Turner, 2005). We further refer to the combination of ω-Agatoxin IVA and
ω-Conotoxin MVIIC merely as P/Q-block although it is in fact a P/Q/N block.
T-type Ca2+ channels were blocked with the inhibitors mibefradil or NNC 55-0396
(McDonough & Bean, 1998; Huang et al., 2004).
Organotypic slice cultures were treated for 7 days with one of the T-type Ca2+
channel inhibitors mibefradil or NNC 55-0396 and the P/Q-block starting at DIV 2-4.
The average size of dendritic tree areas in cultures treated with either combination of
a T-type Ca2+ channel inhibitor and the P/Q block was minimally reduced compared
to untreated control cultures. Average dendritic branch point number in cultures
treated with NNC 55-0396 and the P/Q-block was slightly increased. With both
combinations, the effects on dendritic tree size and branch points were not
statistically significant and no changes in Purkinje cell morphology were visible.
Inhibition of T- and P/Q-type Ca2+ channels alone thus had no effect on Purkinje cell
dendritic development (Fig. 18, A and B).
Figure 18. Dendritic tree size after treatment with P/Q-type and T-type channel blockers. A) and B): Size of the area covered by a single dendritic tree (A) and number of branch points (B). Cells were treated with the P/Q-block and one of the T-type Ca2+ channel inhibitors mibefradil or NNC 55-0396 combined. Standard growth of control cells was rated 100%. No statistical significance. Number of cells analyzed is given as n-value. Error bars represent the SEM. A) Treatment with mibefradil and the P/Q-block reduced average area to 98% (n=60). Treatment with NNC 55-0396 and the P/Q-block reduced average area to 95% (n=86). No statistical significant difference to control (n=58). B) Treatment with Mibefradil and the P/Q-block left average branch point number at 100% (n=50). Treatment with NNC 55-0396 and the P/Q-block increased average branch point number to 105% (n=66). No statistical significant difference to control (n=50).

73
4.4.2. Inhibition of either T- or P/Q-type calcium channels alone could not rescue dendritic growth after mGluR1 stimulation
In order to find out whether T- and P/Q type Ca2+ channels are involved in mGluR1
mediated dendritic growth inhibition, we treated the cultures with the group I mGluR
activator DHPG and simultaneously with inhibitors of T- or P/Q-type Ca2+ channels.
Organotypic slice cultures were treated for 7 days with DHPG (10 μM), starting at
DIV 2-4. Alternatively, cultures were treated in the same way with DHPG and the
P/Q-block or one of the T-type Ca2+ channel inhibitors mibefradil or NNC 55-0396
(Fig. 19, A and B).
The treatment with DHPG resulted in reduced dendritic areas of 48% and dendritic
branch point numbers of 37% of untreated control cultures. Co-treatment with
mibefradil resulted in an average dendritic area of 53% and an average branch point
number of 40%, co-treatment with NNC 55-0396 resulted in an average dendritic
area of 53% and an average branch point number of 37% of control cultures. Co-
treatment with the P/Q-block resulted in an average dendritic area of 51% and an
average branch point number of 43% of control cultures. Thus, all co-treatments
showed a trend towards an improvement of dendritic growth which did not reach
statistical significance. No difference in effectiveness between the two T-type Ca2+
channel inhibitors mibefradil and NNC 55-0396 was found.
4.4.3. Combined inhibition of T- and P/Q-type calcium channels rescued Purkinje cell dendritic growth after mGluR1 stimulation
Because both types of channels mediate Ca2+ entry into Purkinje cells, the inhibition
of one type of channel might have been compensated by the other. Therefore, we did
experiments with simultaneous inhibition of T- and P/Q-type Ca2+ channels along with
DHPG treatment. Organotypic slice cultures were treated for 7 days with DHPG (10
μM), starting at DIV 2-4. Alternatively, cultures were treated in the same way with
DHPG, the P/Q-block and one of the T-type Ca2+ channel inhibitors mibefradil or
NNC 55-0396.
The treatment with DHPG resulted in reduced dendritic areas of 48% and dendritic
branch point numbers of 35% of untreated control cultures. Both combinations
(including mibefradil or NNC 55-0396) were able to increase the average area and

74
branch point number of the dendritic trees significantly compared to cultures treated
with DHPG alone. The P/Q/T inhibition including mibefradil increased the dendritic
areas to 64% and the number of branch points to 50%, and the P/Q/T inhibition
including NNC 55-0396 increased the dendritic areas to 65% and the number of
branch points to 48% of control cultures (Fig. 19, C and D). Thus, the T-type Ca2+
channel inhibitors mibefradil and NNC 55-0396 were equally effective. The beneficial
effect of P/Q/T inhibition on DHPG-treated cells was also evident qualitatively in cell
morphology, with dendritic trees of a clearly higher degree of elaboration in rescued
cultures (Fig. 19, E-G).

75
Figure 19: Dendritic trees after DHPG treatment and co-treatment with T- and/or P/Q-type channel blockers. Size of the area covered by a single dendritic tree (A, C) and number of branch points (B, D). Cells were treated with DHPG (10 µM) for 7 days either alone or in the presence of the P/Q-block or one of the T-type Ca2+ channel inhibitors Mibefradil or NNC 55-0396 (A, B), or in the presence of the P/Q-block and one of the T-type Ca2+ channel inhibitors Mibefradil or NNC 55-0396 combined (C, D). Standard growth of control cells was rated 100%. Number of cells analyzed is given as n-value. Error bars represent the SEM. All pharmacologically treated growth conditions were significantly smaller than control (P<0.001).

76
A) Treatment with DHPG reduced average area to 48% (n=98). Treatment with DHPG and NNC 55-0396 resulted in average areas of 53% (n=110, not significant), with DHPG and mibefradil of 53% (n=75, not significant) and with DHPG and the P/Q-block of 51% (n=91, not significant) of controls (n=85). B) Treatment with DHPG reduced average branch point number to 37% (n=92). Treatment with DHPG and NNC 55-0396 resulted in average branch point numbers of 37% (n=92, not significant), with DHPG and mibefradil of 40% (n=62, not significant) and with DHPG and the P/Q-block of 43% (n=79, not significant) of controls (n=74). C) Treatment with DHPG for 7 days (n=70) reduced average dendritic area to 48% of untreated controls (n=64). Treatment with P/Q-block and mibefradil simultaneously with DHPG increased the average area to 64% (n=77, significant *** P<0.001). Treatment with P/Q-block and NNC 55-0396 simultaneously with DHPG increased average area to 65% (n=86, significant *** P<0.001). D) Treatment with DHPG for 7 days (n=67) reduced average branch point number to 35% of untreated controls (n=58). Treatment with P/Q-block and mibefradil simultaneously with DHPG increased average branch point number to 50% (n=69, significant P<0.05). Treatment with P/Q-block and NNC 55-0396 simultaneously with DHPG increased average branch point number to 48% (n=78, significant P<0.05). E)-G) Examples of the morphology of Purkinje cell dendritic trees. Staining of Calbindin D-28K shows Purkinje cells. DHPG-treatment (F, 10 µM for 7 days) caused stunted dendrites compared to the control cell (E). Inhibition of P/Q- and T-type Ca2+ channels (NNC 55-0396 1 µM) along with DHPG treatment (G) resulted in visibly more dendritic branches and a general morphology close to the control cell. Scale bar 40 μm.
4.4.4. T- and P/Q-type calcium channels mediate inhibition of Purkinje cell dendritic growth after PKC activation
A strong dendritic growth inhibition of cerebellar Purkinje cells in slice cultures can be
achieved by chronic activation of either mGluR1 (Sirzen-Zelenskaya et al., 2006) or
PKC (Metzger & Kapfhammer, 2000; Schrenk et al., 2002). In order to find out
whether T- and P/Q-type Ca2+ channels are also involved in mediating this effect
after chronic PKC activation the same rescue experiment was carried out using the
PKC stimulator PMA instead of DHPG. Organotypic slice cultures were treated for 7
days with PMA (50 nM), starting at DIV 2-4. Alternatively, cultures were treated in the
same way with PMA and the P/Q-block, PMA and one of the T-type Ca2+ channel
inhibitors mibefradil or NNC 55-0396, or PMA, P/Q-block and a T-type Ca2+ channel
inhibitor combined.
Application of the P/Q-block or one of the T-type Ca2+ channel inhibitors as well as
their combinations along with the PMA treatment was sufficient to increase the area
and branch point number of the dendritic trees significantly (Fig. 20, A and B). The

77
rescue effect obtained by the combination of T- and P/Q-type Ca2+ channel inhibition
was stronger than inhibition of either T- or P/Q-type Ca2+ channels. The size of the
dendritic areas after PMA treatment was reduced to 42%, the average branch point
number to 31% of untreated control cultures. Together with mibefradil, the dendritic
areas reached 55% and the average branch point number 39%. PMA and NNC 55-
0396 resulted in dendritic areas of 51% and a branch point number of 42%. Together
with the P/Q-block the area was 56%, branch point number 44%. The combination of
the P/Q-block and mibefradil resulted in an average dendritic area of 61% and a
branch point number of 49%. In the combination with P/Q-block and NNC 55-0396
the areas were 64% and branch point numbers were 53%. In rescued cultures, the
morphology of the dendritic trees was also visibly improved compared to cells treated
with PMA only (Fig. 20, C-E).

78
Figure 20: Dendritic trees after PMA treatment and co-treatment with T- and/or P/Q-type channel blockers Size of the area covered by a single dendritic tree (A) and number of branch points (B). Cells were treated with PMA (50 nM) for 7 days either alone or in the presence of the P/Q-block and/or one of the T-type Ca2+ channel inhibitors mibefradil or NNC 55-0396. Standard growth of control cells was rated 100%. Number of cells analyzed is given as n-value. Stars indicate statistical significance compared to PMA-only-treated cultures. All pharmacologically treated growth conditions were significantly smaller than control (P<0.001). Error bars represent the SEM. A) PMA treatment (n=137) reduced average dendritic area to 42% of untreated controls (n=139). After co-treatment with NNC-55-0396, average area was 51% (n=119, significant P<0.05), after co-treatment with mibefradil 55% (n=80, significant P<0.001) and after co-treatment with the P/Q-block 56% (n=131, significant P<0.001). Treatment with P/Q-block and mibefradil simultaneously with PMA increased average size to 61% (n=65, significant P<0.001). Treatment with P/Q-block and NNC 55-0396 simultaneously with PMA increased average size to 64% (n=100, significant P<0.001).

79
B) PMA treatment (n=143) reduced average dendritic branch point number to 31% of untreated controls (n=113). After co-treatment with NNC-55-0396, average branch point number was 42% (n=114, significant P<0.001), after co-treatment with mibefradil 39% (n=69, significant P<0.05) and after co-treatment with the P/Q-block 44% (n=117, significant P<0.001).
Treatment with P/Q-block and mibefradil simultaneously with PMA increased average size to 49% (n=58, significant P<0.001). Treatment with P/Q-block and NNC 55-0396 simultaneously with PMA increased average size to 53% (n=88, significant P<0.001). C-E) Examples of the morphology of Purkinje cell dendritic trees. Purkinje cells were visualized by immunostaining for Calbindin D-28K. PMA-treatment (C, 50 nM for 7 days) caused stunted dendrites compared to the control cell (C). Inhibition of P/Q- and T-type Ca2+ channels along with PMA treatment (E) resulted in visibly more dendritic branches and a general morphology close to the control cell. Scale bar 50 μm.
4.4.5. TRPC3-/- and wild-type cultures were equally sensitive to dendritic growth inhibition mediated by DHPG or PMA
In order to study TRPC3 involvement in mediating dendritic growth inhibition after
chronic activation of mGluR1 or PKC, we used mice lacking TRPC3 function (TRPC3-
/- mice). CB6 mice which were born within two days before or after the TRPC3-/- mice
were used as a wild type control because TRPC3-/- mice were bred in a C57Bl6
background (Hartmann et al., 2008). Organotypic slice cultures were treated for 7
days with either the PKC activator PMA or the group I mGluR activator DHPG,
starting at DIV 2-4.
No difference in Purkinje cell morphology could be detected between CB6 and
TRPC3-/- mice in control cultures as well as in cultures treated with DHPG or PMA
(Fig. 21, A-F). The average size of the dendritic tree areas in TRPC3-/- cultures did
not vary significantly from CB6 cultures. The DHPG treatment reduced the size of the
dendritic tree areas to 46% in CB6 as well as in TRPC3-/- cells compared to CB6
controls. The PMA treatment reduced the size of the dendritic tree areas to 30% in
CB6, and to 28% in TRPC3-/-, compared to CB6 control cells (Fig. 21, G and H). No
difference was found in branch point counts and in experiments with increasing
concentrations of either DHPG or PMA the minimal dose resulting in a dendritic
growth inhibition was identical in wildtype and in TRPC3-/- mice (Gugger and
Kapfhammer, unpublished observations).

80
Figure 21: Dendritic trees after DHPG or PMA treatment in CB6 and TRPC3-/- mice. A) – F) Staining of Calbindin D-28K shows Purkinje cells A) - C) In cultures from CB6 mice, treatment with 10 µM DHPG (B) or 50 nM PMA (C) limits dendritic growth compared to untreated cells (A). D) – F) Cultures from TRPC3-/- mice. No morphological difference to Purkinje cells from CB6 mice can be found. Untreated control culture (D). Treatment with 10 µM DHPG (E) or 50 nM PMA (F) limits dendritic growth. Scale bar 50 µm. G) –H) Size of the area covered by a single dendritic tree. Standard size of CB6 control cells was rated 100%. Number of cells analyzed is given as n-value. All pharmacologically treated growth conditions were significantly smaller than control (P<0.001). Error bars represent the SEM. G) Cells were treated with DHPG (10 µM) for 7 days. Average of dendritic tree size of TRPC3-/- control Purkinje cells (n=57) reached 97% of CB6 controls (n=77, not significant). In cultures from CB6 mice, DHPG treatment reduced dendritic tree size to 46 % (n=91, significant P<0.001) compared to CB6 control cells. In cultures from TRPC3-/- mice, DHPG

81
treatment reduced dendritic tree size to 46 % (n=92, significant P<0.001) compared to CB6 control cells. H) Cells were treated with PMA (50 nM) for 7 days. Average of dendritic tree size of TRPC3-/- control Purkinje cells (n=68) reached 89% of CB6 controls (n=62, not significant). In cultures from CB6 mice, PMA treatment reduced dendritic tree size to 30% (n=87, significant P<0.001) compared to CB6 control cells. In cultures from TRPC3-/- mice, PMA treatment reduced dendritic tree size to 28% (n=76, significant P<0.001) compared to CB6 control cells.
4.4.6. Rescue of dendritic growth by the combined inhibition of P/Q- and T-type Ca2+ channels is not altered in the absence of TRPC3
Because TRPC3 forms Ca2+-permeable channels (Zitt et al., 1997; Kamouchi et al.,
1999) an even increased rescue effect of T- and P/Q-type Ca2+ channel inhibition in
cultures from TRPC3-/- mice after mGluR1 or PKC activation was conceivable if
TRPC3 channels were involved in the mGluR or PKC mediated signaling pathway.
The same rescue experiments were carried out in cultures from TRPC3-/- mice. Each
single experiment was paralleled with cultures from CB6 mice which were born within
2 days. Organotypic slice cultures were treated for 7 days with DHPG (10 μM),
starting at DIV 2-4. Alternatively, cultures were treated in the same way with DHPG
and the P/Q-block, DHPG and the T-type Ca2+ channel inhibitor NNC 55-0396, or
DHPG, P/Q-block and NNC 55-0396 combined.
As in cultures from CB6 mice, only the combination of P/Q- and T-type inhibition was
able to increase the areas and branch point numbers of the dendritic trees
significantly compared to cultures treated with DHPG alone. In TRPC3-/- mice, the
P/Q/T inhibition simultaneously with DHPG increased the dendritic areas to 65% of
control cultures, compared to 47% in cultures which were treated only with DHPG.
This constitutes a net increase of areas by 18% (Fig. 22 A). The number of branch
points after DHPG treatment was 43% and after co-treatment with P/Q/T inhibitors
58%, which is an increase of 15% (Fig. 22 B). The results from the parallel
experiments in CB6 mice were: DHPG only treated cultures reached dendritic areas
of 50% of control, in combination with the P/Q/T-block they were increased to 66%.
This constitutes a net increase of areas by 16% (Fig. 22 C). The number of branch
points after DHPG treatment was 39% and after co-treatment with P/Q/T inhibitors
59%, which is an increase of 20% (Fig. 22 D). The dendritic areas of cells which were
treated with either the P/Q-block or the T-type Ca2+ channel inhibitor NNC 55-0396

82
along with DHPG showed in both mouse strains only a slight trend of a rescue (Fig.
22, A-D). Taken together, there was no additional rescue effect by the absence of
TRPC3 channels compared to treatment with the Ca2+ channel inhibitors alone.
Organotypic slice cultures were treated for 7 days with PMA (50 nM), starting at DIV
2-4. Alternatively, cultures were treated in the same way with PMA and the P/Q-
block, PMA and the T-type Ca2+ channel inhibitor NNC 55-0396, or PMA, P/Q-block
and NNC 55-0396 combined.
As in cultures from CB6 mice, all co-treatments were able to increase the areas and
branch point numbers of the dendritic trees significantly compared to cultures treated
with PMA alone, while the rescue effect in cultures co-treated with P/Q- and T-type-
inhibitors combined was slightly stronger. In TRPC3-/- mice, the PMA treatment
resulted in reduced dendritic areas of 38% of controls. After co-treatment with NNC
55-0396 the areas were increased to 50%, after co-treatment with the P/Q-block to
47% and after co-treatment with P/Q- and T-type inhibition combined to 51% (Fig. 22
E). The number of branch points after PMA treatment was 25%, after co-treatment
with NNC 55-0396 40%, after co-treatment with the P/Q-block 44% and after co-
treatment with P/Q/T inhibitors combined 47% (Fig. 22 F). The results from the
parallel experiments in CB6 mice were: PMA only treated cultures reached dendritic
areas of 41% of control, after co-treatment with NNC 55-0396 49%, after co-
treatment with the P/Q-block 52% and after co-treatment with P/Q/T inhibitors
combined 62% (Fig. 22 G). The number of branch points after PMA treatment was
27%, after co-treatment with NNC 55-0396 39%, after co-treatment with the P/Q-
block 43% and after co-treatment with P/Q/T inhibitors combined 50% (Fig. 22 H).
Taken together, there was no additional rescue effect by the absence of TRPC3
channels compared to treatment with the Ca2+ channel inhibitors alone indicating that
TRPC3 channels are not involved in the dendritic growth inhibition seen after
mGluR1 or PMA stimulation.

83
Figure 22: Dendritic trees after DHPG or PMA treatment and co-treatment with T-type and/or P/Q-type channel blockers in CB6 and TRPC3-/- mice. Size of the area covered by a single dendritic tree (A, C, E, G) and number of branch points (B, D, F, H). Cells were treated with DHPG (10 µM) (A-D) or PMA (50 nM) (E-H) for 7 days either alone or in the presence of the P/Q-block and/or the T-type Ca2+ channel inhibitor NNC 55-0396. Standard growth of control cells was rated 100%. Star indicates statistical significance compared to DHPG- or PMA-only-treated cultures. Number of cells analyzed is given as n-value. All pharmacologically treated growth conditions were significantly smaller than control (P<0.001). Error bars represent the SEM.

84
A) TRPC3-/- cultures. DHPG treatment (n=99) reduced average dendritic area to 47%of untreated controls (n=77). After co-treatment with NNC-55-0396, average area was 54% (n=84, not significant) and after co-treatment with the P/Q-block 53% (n=96, not significant). Treatment with P/Q-block and NNC 55-0396 simultaneously with DHPG increased average size to 65% (n=93, significant P<0.001). B) TRPC3-/- cultures. DHPG treatment (n=93) reduced average dendritic branch point number to 43% of untreated controls (n=61). After co-treatment with NNC-55-0396, average branch point number was 45% (n=79, not significant) and after co-treatment with the P/Q-block 48% (n=88, not significant). Treatment with P/Q-block and NNC 55-0396 simultaneously with DHPG increased average branch point number to 58% (n=88, significant P<0.01). C) CB6 cultures. DHPG treatment (n=99) reduced average dendritic area to 50% of untreated controls (n=76). After co-treatment with NNC-55-0396, average area was 54% (n=93, not significant) and after co-treatment with the P/Q-block 53% (n=103, not significant). Treatment with P/Q-block and NNC 55-0396 simultaneously with DHPG increased average size to 66% (n=103, significant P<0.001). D) CB6 cultures. DHPG treatment (n=91) reduced average dendritic branch point number to 39% of untreated controls (n=63). After co-treatment with NNC-55-0396, average branch point number was 44% (n=87, not significant) and after co-treatment with the P/Q-block 43% (n=87, not significant). Treatment with P/Q-block and NNC 55-0396 simultaneously with DHPG increased average branch point number to 59% (n=89, significant P<0.001). E) TRPC3-/- cultures. PMA treatment (n=85) reduced average dendritic area to 38% of untreated controls (n=78). After co-treatment with NNC-55-0396, average area was 50% (n=70, significant P<0.01) and after co-treatment with the P/Q-block 47% (n=97, significant P<0.05). Treatment with P/Q-block and NNC 55-0396 simultaneously with PMA increased average size to 51% (n=92, significant P<0.001). F) TRPC3-/- cultures. PMA treatment (n=86) reduced average dendritic branch point number to 25% of untreated controls (n=68). After co-treatment with NNC-55-0396, average branch point number was 40% (n=92, significant P<0.01) and after co-treatment with the P/Q-block 44% (n=97, significant P<0.001). Treatment with P/Q-block and NNC 55-0396 simultaneously with PMA increased average branch point number to 47% (n=89, significant P<0.001). G) CB6 cultures. PMA treatment (n=89) reduced average dendritic area to 41% of untreated controls (n=80). After co-treatment with NNC-55-0396, average area was 49% (n=93, significant P<0.05) and after co-treatment with the P/Q-block 52% (n=68, significant P<0.01). Treatment with P/Q-block and NNC 55-0396 simultaneously with PMA increased average size to 62% (n=78, significant P<0.001). H) CB6 cultures. PMA treatment (n=87) reduced average dendritic branch point number to 27% of untreated controls (n=75). After co-treatment with NNC-55-0396, average branch point number was 39% (n=93, significant P<0.01) and after co-treatment with the P/Q-block 43% (n=66, significant P<0.001). Treatment with P/Q-block and NNC 55-0396 simultaneously with PMA increased average branch point number to 50% (n=74, significant P<0.001).

85
4.4.7. Selective pharmacological inhibition of TRPC3 channels did not alter DHPG- or PMA-mediated dendritic growth inhibition or the rescue effects obtained by combined blockade of P/Q- and T-type Ca2+ channels
Chronic loss of TRPC3 function in TRPC3-/- mice may be compensated by
overexpression of other TRPC channel types. Therefore, we carried out the same
rescue experiments in CB6 mice with an acute TRPC3 blockade by application of
Pyr3, a selective pharmacological inhibitor of TRPC3 channels (Kiyonaka et al.,
2009).
Organotypic slice cultures were treated for 7 days with DHPG (10 μM) or PMA (50
nM), starting at DIV 2-4. Alternatively, cultures were treated in the same way with
DHPG or PMA and the TRPC3 inhibitor Pyr3 (3 μM), DHPG or PMA and the
combination of P/Q-block and T-type inhibitor NNC 55-0396 (1 µM), or DHPG or
PMA, the P/Q- and T-type inhibitory block and Pyr3 combined.
Application of Pyr3 alone slightly reduced dendritic areas to 97 % of untreated control
cultures and raised dendritic branch points to 101 %, which was statistically not
significant (Fig. 23 A, B). Thus, TRPC3 inhibition had no major influence on dendritic
tree size.
DHPG treatment resulted in reduced dendritic areas of 48 % and average branch
point numbers of 42 %. Co-treatment with Pyr3 further reduced dendritic areas to 44
% and branch point number to 39 %. Co-treatment with the rescue-combination of
P/Q-block and T-type inhibitor increased dendritic areas to 63 % and branch point
number to 58 %. Additional co-treatment with Pyr3 to the P/Q- and T-type inhibitory
block resulted in dendritic areas of 54% and dendritic branch points of 55% of control,
which was somewhat less than with P/Q- and T-type inhibitory block alone (Fig. 23).
PMA treatment resulted in reduced dendritic areas of 36 % and average branch point
numbers of 25 %. Co-treatment with Pyr3 further reduced dendritic areas to 29 %
and branch point number to 17 %. Co-treatment with the rescue-combination of P/Q-
block and T-type inhibitor increased dendritic areas to 49 % and branch point number
to 43 %. Additional co-treatment with Pyr3 to the P/Q- and T-type inhibitory block
resulted in dendritic areas and branch points of 38 %, again a reduced rescuing
effect compared to P/Q- and T-type inhibitory block alone (Fig. 23).
Taken together, selective pharmacological inhibition or TRPC3 channels in CB6 mice
had no significant influence on the effects of DHPG or PMA treatment and did not

86
convey an additional rescue effect to the combination of P/Q- and T-type inhibitors.
This is in line with our results obtained with TRPC3-/- mice.
Figure 23: Dendritic trees after DHPG or PMA treatment and co-treatment with T/P/Q-type channel blockers and/or TRPC3 inhibitor pyr3. Size of the area covered by a single dendritic tree (A) and number of branch points (B). Cells were treated with the TRPC3 inhibitor Pyr3 (3 µM) alone or with DHPG (10 µM) or PMA (50 nM) for 7 days alone or in the presence of Pyr3 and/or the P/Q/T-block (including the T-type Ca2+ channel inhibitor NNC 55-0396). Standard growth of control cells was rated 100%. Star indicates statistical significance compared to DHPG- or PMA-only-treated cultures. Number of cells analyzed is given as n-value. All pharmacologically treated growth conditions were significantly smaller than control (P<0.001), except for the condition Pyr3 alone, which was not significantly different from control. Error bars represent the SEM. A) Treatment with Pyr3 (n=58) slightly reduced dendritic areas to 97% of untreated controls (n=107). DHPG treatment reduced average dendritic area to 48% (n=91). After co-treatment with Pyr3 average area was 44% (n=70, not significant to DHPG), after co-treatment with the P/Q/T-block 63% (n=74, significant to DHPG P<0.05) and after co-treatment with the P/Q/T-block and Pyr3 combined 54% (n=72, not significant to DHPG). PMA treatment reduced average dendritic area to 36% (n=91). After co-treatment with Pyr3 average area was 29% (n=73, not significant to PMA), after co-treatment with the P/Q/T-block 49% (n=73, significant to PMA P<0.01) and after co-treatment with the P/Q/T-block and Pyr3 combined 38% (n=70, not significant to PMA). B) Treatment with Pyr3 (n=55) slightly increased dendritic branch point number to 101% of untreated controls (n=103).

87
DHPG treatment reduced average branch point number to 42% (n=91). After co-treatment with Pyr3 average branch point number was 39% (n=69, not significant to DHPG), after co-treatment with the P/Q/T-block 58% (n=74, significant to DHPG P<0.05) and after co-treatment with the P/Q/T-block and Pyr3 combined 55% (n=71, not significant to DHPG). PMA treatment reduced average branch point number to 25% (n=92). After co-treatment with Pyr3 average branch point number was 17% (n=74, not significant to PMA), after co-treatment with the P/Q/T-block 43% (n=73, significant to PMA P<0.001) and after co-treatment with the P/Q/T-block and Pyr3 combined 38% (n=70, not significant to PMA).
4.4.8. Inhibition of Phospholipase C, GluRδ2 - or R-type Ca2+ channels did not increase the rescue effects obtained by combined inhibition of P/Q- and T-type Ca2+ channels
Co-treatment with a combination of P/Q- and T-type inhibitors partially rescued the
dendrite-limiting effects of both, chronic mGluR1 or PKC stimulation. Yet, the rescued
Purkinje cell dendritic trees did not reach the average size of untreated control cells.
After mGluR1- or PKC stimulation with DHPG or PMA, respectively, calcium can
enter the cytoplasm through GluRδ2 - or R-type Ca2+ channels (Meacham et al.,
2003; Cavelier et al., 2008; Zanjani et al., 2009) or could be released from internal
stores (Canepari & Ogden, 2006) in addition to influx through P/Q-, T-, and N-type
channels, which are effectively blocked by our combination of ω-Agatoxin IVA, ω-
Conotoxin MVIIC and NNC 55-0396 (Mintz et al., 1992a; McDonough et al., 2002;
Huang et al., 2004). We investigated whether additional inhibition of these other
sources of calcium entry into the cytoplasm would increase the rescue effect.
Organotypic slice cultures were treated for 7 days with DHPG (10 μM) or PMA (50
nM), either with co-treatment of the P/Q/T-inhibitory combination or without, starting
at DIV 2-4. Alternatively, cultures were co-treated with the R-type Ca2+ channel
inhibitor SNX-482 (500 nM) (Newcomb et al., 1998), the open channel blocker 1-
naphthyl-acetyl spermine (Nasp) which blocks influx through GluRδ2 channels
(Zanjani et al., 2009) or the phospholipase C (PLC) inhibitor U73122 (Cruzblanca et
al., 1998). PLC activation leads to release of Ca2+ from internal stores (Canepari &
Ogden, 2006) and sole PLC inhibition by U73122 has been shown to be ineffective in
rescuing the dendrite limiting effect mediated by DHPG (Sirzen-Zelenskaya et al.,
2006). A contribution of Ca2+ from internal stores, however, might increase the
rescue effect obtained by combined P/Q- and T-type inhibition.

88
Treatment of slice cultures for 7 days with SNX-482, Nasp or U73122 alone did not
significantly influence dendritic size of Purkinje cells. SNX-482 (500 nM) increased
dendritic areas to 101 % and reduced average branch point number to 98%
compared to untreated controls. Nasp (100 µM) reduced dendritic areas to 98% and
average branch point number to 90 % and U73122 reduced dendritic areas to 98%
and average branch point number to 88 % (Fig. 24 A, B).
DHPG treatment resulted in reduced dendritic areas of 52 % and an average branch
point number of 43 % of controls. Co-treatment with SNX-482 further reduced
average areas to 43 % and branch point number to 36 %. Co-treatment with Nasp
resulted with an average area of 60 % and an average branch point number of 43 %
in slightly increased dendritic trees, but the effect was not significant. The
combination of P/Q-and T-type inhibitors significantly increased average dendritic
areas to 74 % and branch point number to 62 %. Co-treatment with the P/Q/T-block
and SNX-482 resulted in average dendritic areas of 64 % and branch point number
of 63 %. Co-treatment with the P/Q/T-block and Nasp yielded dendritic areas of 68 %
and a branch point number of 57 %. Co-treatment with the P/Q/T-block and U73122
resulted in dendritic areas of 62 % and branch point number of 53 % (Fig. 24 A, B).
Thus, DHPG-mediated dendritic growth inhibition was not rescued by co-treatments
with SNX-482 or Nasp, and the partial rescue obtained by P/Q- and T-type inhibition
was not further increased by co-treatments with SNX-482, Nasp or U73122.
PMA treatment resulted in dendritic areas of 35 % and average branch point number
of 25 % of controls. Co-treatment with SNX-482 reduced average areas to 36 % and
branch point number to 23 %. Co-treatment with Nasp reduced average areas to 36
% and branch point number to 22 %. The combination of P/Q-and T-type inhibitors
significantly increased average dendritic areas to 48 % and branch point number to
42 %. Co-treatment with the P/Q/T-block and Nasp significantly increased average
dendritic areas to 45 % and branch point number to 37 %. Co-treatment with the
P/Q/T-block and U73122 gave dendritic areas of 37 % and branch point number of
36 %. Dendritic areas were significantly smaller than in the co-treatment with the
P/Q/T-block only. Co-treatment with the P/Q/T-block and SNX-482 yielded dendritic
areas of 42 %, and branch point number of 37 % (Fig. 24 C, D). Thus, PMA-mediated
dendritic growth inhibition was not rescued by co-treatments with SNX-482 or Nasp,
and the partial rescue obtained by P/Q- and T-type inhibition was not further
increased by co-treatments with SNX-482, Nasp or U73122.

89
Figure 24: Dendritic trees after DHPG or PMA treatment and co-treatment with T/P/Q-type channel blockers and/or inhibitors of R-type channels, GluRδ2 or PLC. Size of the average area covered by a single dendritic tree (A, C) and average number of branch points (B, D). Cells were treated for 7 days with SNX-482 (500 nM), Nasp (100 µM), U73122 (10

90
µM) or DHPG (10 µM) alone, or with DHPG in the presence of SNX-482, Nasp or the P/Q/T-block (including the T-type Ca2+ channel inhibitor NNC 55-0396), or alternatively with DHPG, the P/Q/T-block and SNX-482, Nasp or U73122 combined (A, B). Cells were treated for 7 days PMA (50 nM) alone, or with PMA in the presence of SNX-482, Nasp or the P/Q/T-block, or alternatively with PMA, the P/Q/T-block and SNX-482, Nasp or U73122 combined (C, D) Standard growth of control cells was rated 100%. Star indicates statistical significance compared to DHPG- or PMA-only-treated cultures. Number of cells analyzed is given as n-value. All pharmacologically treated growth conditions were significantly smaller than control (P<0.001), except for the conditions SNX-482, Nasp and U73122 alone, which were not significantly different from control. Error bars represent the SEM. A) Treatment with SNX-482 (n=66) slightly increased dendritic areas to 101% of untreated controls (n=219), Nasp (n=65) and U73122 (n=61) both reduced areas to 98%. DHPG treatment reduced area to 52% (n=225). After co-treatment with SNX-482 area was 43% (n=67, not significant to DHPG), after co-treatment with Nasp 60% (n=75, not significant to DHPG), after co-treatment with the P/Q/T-block 74% (n=177, significant to DHPG P<0.001), after co-treatment with the P/Q/T-block and SNX-482 combined 64% (n=73, significant to DHPG P<0.05), after co-treatment with the P/Q/T-block and Nasp combined 68% (n=67, significant to DHPG P<0.01) and after co-treatment with the P/Q/T-block and U73122 combined 62% (n=75, not significant to DHPG). B) Treatment with SNX-482 (n=63) slightly reduced dendritic branch point number to 98% of untreated controls (n=208), Nasp (n=64) to 90% and U73122 (n=59) to 88%. DHPG treatment reduced branch points to 43% (n=216). After co-treatment with SNX-482 branch point number was 36% (n=67, not significant to DHPG), after co-treatment with Nasp 43% (n=71, not significant to DHPG), after co-treatment with the P/Q/T-block 61% (n=176, significant to DHPG P<0.001), after co-treatment with the P/Q/T-block and SNX-482 combined 63% (n=71, significant to DHPG P<0.001, not significant to DHPG with P/Q/T-inhibition alone), after co-treatment with the P/Q/T-block and Nasp combined 57% (n=66, not significant to DHPG) and after co-treatment with the P/Q/T-block and U73122 combined 53% (n=74, not significant to DHPG). C) PMA treatment reduced area to 36% (n=91). After co-treatment with SNX-482 (n=71) or Nasp (n=65) area was unchanged 36%, after co-treatment with the P/Q/T-block 48% (n=73, significant to PMA P<0.001), after co-treatment with the P/Q/T-block and Nasp combined 45% (n=66, significant to PMA P<0.01), after co-treatment with the P/Q/T-block and U73122 combined 37% (n=66, not significant to PMA) and after co-treatment with the P/Q/T-block and SNX-482 combined 42% (n=64, not significant to PMA). D) PMA treatment reduced branch points to 25% (n=92). After co-treatment with SNX-482 (n=71) branch point number was 23% and after co-treatment with Nasp (n=65) 22%. After co-treatment with the P/Q/T-block branch point number was 42% (n=73, significant to PMA P<0.001), after co-treatment with the P/Q/T-block and Nasp combined 37% (n=65, significant to PMA P<0.01), after co-treatment with the P/Q/T-block and U73122 combined 36% (n=66, significant to PMA P<0.05) and after co-treatment with the P/Q/T-block and SNX-482 combined 37% (n=63, significant to PMA P<0.01).

91
4.5. Discussion
In this study, we have analyzed the contribution of Ca2+ permeable channels for the
inhibition of Purkinje cell dendritic growth after mGluR1 and after PKC stimulation.
We have found that both, P/Q-type and T-type Ca2+ channels are involved in the
inhibition of dendritic growth, because blockade of P/Q-type and T-type Ca2+
channels simultaneous with mGluR1 stimulation resulted in a partial rescue of the
dendritic morphology. For PKC-stimulation, blockade of either P/Q-type or T-type
Ca2+ channels was sufficient to achieve a rescue effect which was maximal after
blockade of both types of channels. These findings imply that Ca2+ entry through
voltage-gated Ca2+ channels is required for the inhibitory effects on dendritic growth.
In contrast, absence or acute blockade of TRPC3 channels had no rescue effect
indicating that Ca2+ entry through TRPC3 channels is not involved in the inhibition of
Purkinje cell dendritic growth. Similarly, blockade of Ca2+ influx through GluRdelta2
channels or inhibition of release from intracellular stores did not influence mGluR1-
and PKC-mediated inhibition of Purkinje cell dendritic growth. Thus, both P/Q-type
and T-type Ca2+ channels, but not TRPC3 or other Ca2+-permeable channels
channels, are involved in the regulation Purkinje cell dendritic growth after chronic
mGluR1 or PKC activation.
4.5.1. TRPC3 channels are not required for inhibition of dendritic growth of Purkinje cells
TRPC3 channels have an important role in mGluR1 signaling in Purkinje cells by
mediating the so-called slow EPSP (Batchelor & Garthwaite, 1993; Canepari et al.,
2001). In mice which are deficient for the TRPC3 channels in Purkinje cells, the slow
EPSC is completely absent after mGluR1 stimulation, whereas the mGluR1-mediated
Ca2+ release from internal stores is not affected (Hartmann et al., 2008). Because in
previous experiments we have shown that the mGluR1-mediated inhibition of
Purkinje cell dendritic growth is unlikely to be caused by Ca2+ release from internal
stores (Sirzen-Zelenskaya et al., 2006) the TRPC3 channel would be an attractive
candidate for mediating this growth inhibitory effect. It is highly expressed on Purkinje
cell dendrites during dendritic growth and it remains strongly expressed into
adulthood (Huang et al., 2007). Furthermore, in a recent publication it was shown that
in the moonwalker (mwk) mouse mutant a facilitated opening of the TRPC3 channel

92
after sub-threshold mGluR1 stimulation results in a robust cerebellar phenotype with
some loss of Purkinje cells and a pronounced reduction of the Purkinje cell dendritic
tree (Becker et al., 2009). Interestingly, TRPC3 channels are inhibited by
phosphorylation by Protein Kinase C, creating a possible link to the effects of PKCγ
activation of Purkinje cell dendritic growth (Metzger & Kapfhammer, 2000; Schrenk et
al., 2002). We have tested for an involvement of TRPC3 in mGluR1- and PKC-
mediated dendritic growth inhibition by experiments with mice lacking TRPC3
channels (TRPC3-/-) (Hartmann et al., 2008). Purkinje cells in cultures derived from
TRPC3-/--mice reacted to mGluR1 or PKC-stimulation in exactly the same way as
Purkinje cells in control cultures. Furthermore, experiments with an acute
pharmacological blockade of TRPC3 channels yielded very similar results making
functional compensation by other types of TRPC channels rather unlikely. Further
evidence against compensation by other TRPC receptors comes from experiments
with the unspecific TRPC inhibitor SKF 96365 which did not alter the dendritic growth
inhibition by mGluR1 or PKCγ activation (see suppporting information, Fig. 25).
These experiments exclude that activation of the TRPC3 channels is required for the
inhibitory effect on dendritic growth of Purkinje cells.
4.5.2. Inhibition of Purkinje cell dendritic growth involves Ca2+ entry through voltage gated channels
It is well known that Ca2+ signals play an important role in neuronal development by
modulating dendritic growth and branching (Konur & Ghosh, 2005). There is also
evidence that suggests the mGluR and PKC mediated inhibition of dendritic growth
could be mediated by changes of the intracellular Ca2+ signaling. In two independent
mouse models with increased Ca2+ entry into Purkinje cells also strongly reduced
dendritic trees are found, similar to the dendritic trees seen after chronic mGluR1- or
PKC-activation. In the lurcher mouse, a constitutively open Ca2+ permeable cation
channel, the glutamate receptor δ2 (GluRδ2) channel, leads to disrupted Purkinje cell
development followed by cell death (Zuo et al., 1997). Purkinje cells in organotypic
cultures derived from lurcher mice have a much reduced dendritic tree. The growth of
the dendritic tree can be rescued by blocking of cation channels with Naphtyl-acetyl
spermine (Nasp, (Zanjani et al., 2009). Interestingly, Nasp was ineffective in
mediating the growth inhibitory effects of mGluR1 or PKC-stimulation excluding that
93
they are mediated by the GluRδ2 channel. Taken together with the similar phenotype
of the mwk mice (Becker et al., 2009), see above) with a leaky TRPC3 channel it is
very likely that a chronic Ca2+ overload of Purkinje cells during the period of dendritic
development will result in inhibition of dendritic growth.
While we have excluded that Ca2+ influx either through TRPC3 channels or GluRδ2
channels are involved in mGluR1 or PKC mediated dendritic growth inhibition of
Purkinje cells we here provide evidence for an involvement of voltage dependent
Ca2+ channels (VDCC) of the P/Q-type and T-type, but not of the R-type. The P/Q-
type and T-type channels are responsible for up to 95% of the total Ca2+ currents in
Purkinje cells (Usowicz et al., 1992; Watanabe et al., 1998; Swensen & Bean, 2003;
Isope & Murphy, 2005; Isope et al., 2010). A direct interaction and functional coupling
between mGluR1 and P/Q-type Ca2+ channels in Purkinje cell dendritic spines has
been shown to result in a potentiation of Ca2+ influx (Kitano et al., 2003).
The T-type Ca2+ channels of the Cav3.1 isoform have been shown to be highly
enriched in Purkinje cell spines where they co-localize with mGluR1 (Hildebrand et
al., 2009). Furthermore, they are potentiated upon mGluR1 activation (Hildebrand et
al., 2009), an effect which is mediated by a phospholipase C-independent, tyrosine-
phosphatase-dependent pathway (Hirono et al., 1998; Canepari et al., 2004;
Hildebrand et al., 2009). We have shown here that pharmacological blockade of
these channels results in a rescue of the Purkinje cell dendritic tree after mGluR1 or
PKC stimulation indicating that Ca2+ influx through these channels is critical for the
inhibitory effect on dendritic growth. The observed rescue effect did not restore the
full dendritic tree size. This may indicate that additional pathways are involved, but
could also simply reflect an incomplete blocking activity of the channel blockers. In
our experience the chronic activation of either mGluR1 receptors by DHPG or PKC
activity by PMA over several days is an extremely powerful stimulant and will be very
difficult to block by any drug directed at the downstream signaling pathways.
Interestingly, there are subtle differences between mGluR1 and PKC-mediated
inhibition of dendritic growth. For PKC activation, blockade of either P/Q-type
channels or T-type channels was effective in providing a rescue of Purkinje cell
dendrites, though combined blockade was the most effective. For mGluR1-activation
the combined blockade of both channels was necessary to obtain a significant rescue
effect. This indicates that, although in both cases P/Q-type and T-type channels are

94
involved, there are also differences in the signaling pathways following mGluR1 and
PKC activation.
4.5.3. Pharmacological compounds blocking T-type Ca2+ channels are toxic to Purkinje cell axons
Unexpectedly, we found a consistent toxic effect on Purkinje cell axons with the use
of the T-type channel blockers mibefradil and NNC 55-0396 when applied in
concentrations higher than used in this study (Fig. 18). An even stronger toxic effect
on Purkinje cell axons was found with the compound SK&F 96365 (SKF, see chapter
5, section 5.1., Fig. 26). Recently, SKF has been shown to be a potent blocker of low-
voltage-activated (LVA) and high-voltage-activated (HVA) Ca2+ channels, with an
especially high affinity for LVA T-type Ca2+ channels (Singh et al., 2010).
Interestingly, there is evidence that T-type Ca2+ channels might indeed be present in
the axon initial segment of Purkinje cells (Bender & Trussell, 2009). In cultured
hippocampal neurons, activation of T-type Ca2+ channels induced relocation of the
axon initial segment (Grubb & Burrone, 2010). It is not clear at the moment whether
the axonotoxic activity of high concentrations of mibefradil and NNC55-0396 or SKF
is due to blockade of T-type channels or rather due to an unknown side effect of
these drugs. Further investigations on the role of voltage-gated Ca2+ channels in
axons will be required to clarify this point.
4.5.4. The role of Ca2+ homeostasis for Purkinje cell dendritic growth
The observation that Purkinje cell dendritic growth is severely compromised after
chronic activation of mGluR1 or PKC links electrical activity to the regulation of
dendritic growth and might constitute a stop mechanism for the expansion of the
Purkinje cell dendritic tree (Sirzen-Zelenskaya et al., 2006). The signaling pathways
involved in this effect are of interest because they provide a link between the
functional status of the cell and dendritic growth processes. Furthermore,
pharmacological manipulation of several classical pathways (IP3/DAG pathway,
PI3K/AKT/mTOR pathway, MAPK/ERK pathway) was not effective to rescue Purkinje
cell dendritic morphology after either mGluR1 or PKC activation (Sirzen-Zelenskaya
et al., 2006). While the initial steps of the signaling chain after mGluR or PKC

95
activation are still not clear, the findings presented in this study demonstrate that they
will eventually result in an increased influx of Ca2+ ions into Purkinje cell dendrites
through voltage-dependent Ca2+ channels. Whether there is also a contribution from
intracellular Ca2+ stores is not known, but pharmacological blockade of IP3-R
sensitive stores showed no rescue effect. The inhibition of Purkinje cell dendritic
growth seen after chronic stimulation of mGluR1 or PKC shares many similarities
with that observed in lurcher (Zanjani et al., 2009) or in mwk mutant mice (Becker et
al., 2009). The lurcher mutation in the GluR δ2 channel, the mwk mutation in the
TRPC3 channel and the activation of mGluR1 or PKC clearly have in common a
chronic long-lasting overload of Purkinje cells with Ca2+ ions entering through
channels in the dendritic plasma membrane eventually compromising dendritic
expansion. This mechanism is likely to be an important regulatory component of
dendritic growth of cerebellar Purkinje cells.
Acknowledgements:
We thank Markus Saxer for technical assistance. This work was supported by the
University of Basel and the Swiss National Science Foundation (31003A-116624).

96
4.6. Supporting information
To exclude the possibility that overexpression of other TRPC channel types might
compensate for the chronic loss of TRPC3 function in TRPC3-/- mice, we treated
TRPC3-/- mice with the unspecific TRPC channel inhibitor SKF 96365 (Kress et al.,
2008) in the presence of either DHPG or PMA. As visible in the diagrams in Figure
25, SKF treatment (25µM) had no significant influence on Purkinje cell dendritic
growth and co-treatment with SKF (25µM) of cultures challenged with DHPG or PMA
did not provide a rescue effect in cutures from both, CB6 and TRPC3-/- mice. These
results corroborate our findings with Pyr3, a selective pharmacological inhibitor of
TRPC3 channels (Kiyonaka et al., 2009).
Figure 25: Dendritic trees after DHPG or PMA treatment and co-treatment with the TRPC inhibitor SKF 96365. Size of the area covered by a single dendritic tree. Cells were treated with the TRPC channel inhibitor SKF 96365 (25 µM) for 7 days either alone (A, B), in the presence of DHPG (10 µM) (C, D) or in the presence of PMA (100 nM) (E, F). The experiments performed in cultures from TRPC3-/- mice (A, C, E) were paralleled with cultures from CB6 mice(B, D, F) born within two days before or after the TRPC3-/- mice, as

97
a wild-type control. Standard growth of control cells was rated 100%. Error bars represent the SEM. Confidence intervals were 95%. Mann-Whitney’s non-parametric test (A, B), Kruskal-Wallis test followed by Dunn’s post test (C - F). Statistical significance when p<0.05. A) TRPC3-/- mice. Treatment with SKF (n=56) increased average area to 110% of untreated controls (n=84). B) CB6 mice. Treatment with SKF (n=65) reduced average area to 99% of controls (n=76, no significant difference). C) TRPC3-/- mice. Treatment with DHPG reduced average area to 53% (n=66, significant p<0.001) of controls (n=83). Treatment with DHPG and SKF resulted in average areas of 56% (n=58, not significant to DHPG). D) CB6 mice. Treatment with DHPG reduced average area to 53% (n=68, significant p<0.001) of controls (n=74). Treatment with DHPG and SKF resulted in average areas of 52% (n=67, not significant to DHPG). E) TRPC3-/- mice. Treatment with PMA reduced average area to 35% (n=70, significant p<0.001) of controls (n=64). Treatment with PMA and SKF resulted in average areas of 30 % (n=62, not significant to PMA). F) CB6 mice. Treatment with PMA reduced average area to 36% (n=74, significant p<0.001) compared to controls (n=87). Treatment with PMA and SKF resulted in average areas of 30% (n=66, not significant to PMA).

98
5. Additional data The following section contains unpublished results.
5.1. The common TRPC inhibitor SK&F 96365 was in high concentrations toxic to Purkinje cell axons independent of TRPC3
The widely used TRPC3-inhibitor SK&F 96365 (SKF) (Kress et al., 2008) caused
toxic effects on Purkinje cells from CB6 mice in a concentration dependent manner
(Fig. 26). At SKF 10 µM, after a survival of 10 days the cultures displayed a moderate
axonal damage (see Fig. 26 B) with the rest of the culture remaining unharmed. SKF
25 µM caused strong axonal damage to the point of complete loss of axons (see Fig.
26 C). Survival of Purkinje cells was still equal to control cultures, but their dendritic
trees showed clear signs of degeneration. After treatment with SKF 50 μM, Purkinje
cell density was remarkably reduced with the remaining cells displaying stunted
dendrites and no axons (Fig. 26 D). In order to find out whether these effects were
due to TRPC3 inhibition, we treated TRPC3-/- cultures in the same way over 10 days.
No difference between the two mouse strains could be found (Fig. 26 E-H).
Figure 26: Toxicity of the TRPC inhibitor SKF 96365 on Purkinje cell axons. Staining of Calbindin D-28K shows Purkinje cells.

99
A) - D) Cultures from CB6 mice. In untreated control cultures the Purkinje cell axons are clearly visible (asterisk in A). Treatment with SKF 10 µM (B) and 25 µM (C) causes damage of Purkinje cell axons (asterisks in B, C). Treatment with SKF 50 μM additionally causes Purkinje cell death (D). E) – H) Cultures from TRPC3-/- mice. Untreated control cultures with clearly visible axons (asterisk in E). The toxic effects of treatment with SKF 10 µM (F), 25 µM (G) and 50 μM (D) on Purkinje cells are comparable to those in CB6 cultures.
5.2. Compounds which had no effect on dendritic growth after mGluR1 or PKC stimulation
5.2.1. Nimodipine: inhibitor of L-type calcium channels
P/Q-type and T-type Ca2+ are responsible for up to 95% of the total Ca2+ currents in
Purkinje cells (Usowicz et al., 1992; Watanabe et al., 1998; Swensen & Bean, 2003;
Isope & Murphy, 2005; Isope et al., 2010). L-type Ca2+ channels are also expressed
in Purkinje cells, making a small contribution to Ca2+ currents, however (Regan,
1991; Mintz et al., 1992a; Watanabe et al., 1998; McKay & Turner, 2005). We
inhibited L-type channels additionally to T-type and P/Q-type Ca2+ channels
simultaneous with mGluR1 activation to find out if the rescue effect on dendritic
growth can be increased.
Treatment with the L-type channel inhibitor nimodipine had even a negative effect on
the rescue achieved with T/P/Q-type inhibition in two experiments (see Fig. 27).
Due to these results, no further research or analysis was done with L-type channel
inhibitors.

100
Figure 27: Dendritic tree areas after treatment with DHPG, T/P/Q-inhibitors and co-treatment with the L-type channel blocker nimodipine. Size of the area covered by a single dendritic tree. Cells were treated with DHPG (10 µM) for 7 days either alone or in the presence of the P/Q-block, the P/Q-block and the T-type Ca2+ channel inhibitor NNC 55-0396, or both combinations together with Nimodipine (2 µM). Standard growth of control cells was rated 100 %, error bars represent the SEM. A minimum number of 23 cells per condition were measured. DHPG treatment reduced average dendritic area to 44 % of untreated controls. Treatment with P/Q-block and NNC 55-0396 simultaneously with DHPG increased the average area to 68 %. After addition of Nimodipine to T/PQ-inhibition, dendritic area was 53 %. After treatment with P/Q-block simultaneously with DHPG, the average area was 50 %. After addition of Nimodipine to P/Q-inhibition, dendritic area was 52 %. Star indicates statistical significance compared to DHPG-only-treated cultures.
5.2.2. BAPTA-AM: intracellular calcium chelation
BAPTA-AM is the membrane permeable form of the calcium chelator BAPTA .Since
calcium entry through T-type and P/Q-type channels appears to mediate dendritic
growth inhibition in Purkinje cells after mGluR1 and PKC activation, binding of
intracellular calcium by a chelator can be expected to have similar effects as T-type
and P/Q-type channel inhibition.

101
Organotypic slice cultures treated with 50 or 100µM BAPTA-AM simultaneous with
DHPG or PMA for 7 days showed no substantial increase of dendritic areas or
morphology in one experiment (see Fig. 28). In further experiments, BAPTA-AM was
used in combination with P/Q-type and T-type inhibitors (see Fig. 29).
After dendritic growth inhibition with DHPG and inhibition of P/Q-type channels, the
addition of BAPTA-AM 50µM slightly increased dendritic branch point number. In all
other combinations, BAPTA-AM had no influence on dendritic areas or branch point
numbers (see Fig. 29, A and B).
After dendritic growth inhibition with PMA and inhibition of T-type channels, the
addition of BAPTA-AM 50µM caused a trend towards increased dendritic areas and
branch point numbers (see Fig. 29, C and D). Inhibition of only T-type or P/Q-type
channels simultaneous with PMA treatment caused a trend towards improved areas
and branch point numbers compared to PMA alone, but only two experiments were
done under these conditions and the number of cells measured (<75 cells) was too
low to reach statistical significance. Due to the moderate effect of BAPTA-AM on
dendritic development found in these pilot experiments, no further research or
analysis was done.
Figure 28: Dendritic tree areas after treatment with DHPG or PMA and co-treatment with the intracellular calcium chelator BAPTA-AM. Size of the area covered by a single dendritic tree. Cells were treated with DHPG (10 µM) (A) or with PMA (50 nM) (B)for 7 days either alone or in the presence of BAPTA-AM (50 or 100 µM). Standard growth of control cells was rated 100 %, error bars represent the SEM. A minimum number of 25 cells per condition were measured. A) DHPG treatment reduced average dendritic area to 47 % of untreated controls. After co-treatment with BAPTA-AM 50 µM, average area was 45 %, and after co-treatment with BAPTA-AM 100 µM 44 %. B) PMA treatment reduced average dendritic area to 44 % of untreated controls. After co-treatment with BAPTA-AM 50 µM, average area was 34 %, and after co-treatment with BAPTA-AM 100 µM 49 %.

102
Figure 29: Dendritic tree areas after treatment with DHPG or PMA, T/P/Q-inhibitors and co-treatment with the intracellular calcium chelator BAPTA-AM. Size of the area covered by a single dendritic tree (A, C) and number of branch points (B, D). Cells were treated with DHPG (10 µM) (A, B) or with PMA (50 nM) (C, D)for 7 days either alone or in the presence of the P/Q-block and/or the T-type Ca2+ channel inhibitor NNC 55-0396 (1 µM) and/or BAPTA-AM (50 µM). Standard growth of control cells was rated 100 %, error bars represent the SEM. A minimum number of 42 cells per condition were measured. A) DHPG treatment reduced average dendritic area to 45 % of untreated controls. After co-treatment with NNC-55-0396, average area was 52 %, after co-treatment with NNC-55-0396 and BAPTA-AM 47 %, after co-treatment with the P/Q-block 45 % and after co-treatment with the P/Q-block and BAPTA-AM 46 %. Treatment with P/Q-block and NNC 55-0396 simultaneously with DHPG increased average size to 60 %. B) DHPG treatment reduced average dendritic branch point number to 39 % of untreated controls. After co-treatment with NNC-55-0396, average branch point number was 43 %, after co-treatment with NNC-55-0396 and BAPTA-AM 42 %, after co-treatment with the P/Q-block 46 % and after co-treatment with the P/Q-block and BAPTA-AM 50 %. Treatment with P/Q-block and NNC 55-0396 simultaneously with PMA increased average branch point number to 54 %. C) PMA treatment reduced average dendritic area to 38 % of untreated controls. After co-treatment with NNC-55-0396, average area was 42 %, after co-treatment with NNC-55-0396 and BAPTA-AM 46 %, after co-treatment with the P/Q-block 44 % and after co-treatment with the P/Q-block and BAPTA-AM 44 %.

103
Treatment with P/Q-block and NNC 55-0396 simultaneously with PMA increased average size to 49 %. D) PMA treatment reduced average dendritic branch point number to 30 % of untreated controls. After co-treatment with NNC-55-0396, average branch point number was 38 %, after co-treatment with NNC-55-0396 and BAPTA-AM 43 %, after co-treatment with the P/Q-block 50 % and after co-treatment with the P/Q-block and BAPTA-AM 48 %. Treatment with P/Q-block and NNC 55-0396 simultaneously with PMA increased average size to 56 %. Star indicates statistical significance compared to DHPG- or PMA-only-treated cultures, respectively.
5.3. Morphological analysis of Purkinje cell spines using confocal microscopy
To characterize the differences between the effects on Purkinje cell dendrites
mediated by mGluR1 and PKC, we used confocal microscopy in a piloting
experiment. Cultures grown in the presence of PMA (50nM) or DHPG (10 µM) for 7
days were compared to untreated control cultures. Qualitative picture analysis
revealed profound differences in spine morphology (see Fig. 30 A-C). Another
observation was that in untreated control cultures, spines were only found on
dendrites (see Fig. 31 A), while in PMA treated cultures, spines were also found on
Purkinje cell somata (see Fig. 31 B) No definition of parameters describing spine
morphology or quantification has been done.

104
Figure 30: Examples for Purkinje cell dendrites viewed with confocal microscopy. Pictures were taken with a 100 x lens and all digitally magnified by the same factor. A) Untreated control culture, spines clearly visible (arrow in A points to a spine). B) Culture treated with PMA (50nM) for 7 days, spines look different from control (arrow in B points to a spine). C) Culture treated with DHPG (10µM) for 7 days, spines are virtually gone.

105
Figure 31: Examples for Purkinje cell dendrites viewed with confocal microscopy. Pictures were taken with a 100 x lens and all digitally magnified by the same factor. A) Untreated control culture, spines clearly visible on dendrites, no spines visible on soma (arrow in A points to a spine). B) Culture treated with PMA (50nM) for 7 days, spines present on soma (arrow in B points to a spine).

106
6. General Discussion 6.1. What might be the cause of Purkinje cell vulnerability to
excitotoxic death?
Cerebellar Purkinje cells have been found to be especially affected in various
diseases with an excitotoxic aspect, such as ischemia, trauma or neurodegenerative
disorders (reviewed in (Sarna & Hawkes, 2003)). When we treated cerebellar slice
cultures with 30 µM AMPA for 4 hours, virtually all Purkinje cells were killed
independent of the size of their dendritic trees, which had been reduced by pre-
treatment with either PMA or DHPG for 7 days. Staining for vGluT1 revealed that
Purkinje cell dendrites were densely covered by glutamatergic terminals. This
suggests that it is not the size, or total number of glutamatergic synapses on the
dendritic tree that confers susceptibility to excitotoxic overload. In Purkinje cells,
AMPA induces a process called dark cell degeneration, which resembles the cellular
pathology seen after conditions such as hypoglycemia, stroke or trauma (Garthwaite
& Garthwaite, 1991a). Excitotoxicity is mediated by an increase in intracellular
calcium concentration (Garthwaite & Garthwaite, 1991b; Strahlendorf et al., 1998).
Although they do express functional AMPA receptors (Hack et al., 1995), cerebellar
granule cells in the same cultures did not show any impairment of survival after the
AMPA treatment, instead they started to express calbindin D-28K, which normally is
Purkinje cell specific in the cerebellum (Bastianelli, 2003). In several studies, the
expression of calbindin has been found to be an important determinant for a cell’s
susceptibility to excitotoxic conditions. For example, in hippocampal granule cells of
epileptic patients, loss of calbindin resulted in a faster Ca2+-dependent inactivation of
calcium entry through voltage-dependent calcium channels (VDCC) during seizure-
like frequent neuronal discharges (Nagerl et al., 2000). Probably by either direct
interaction with VDCCs or accumulation around the Ca2+ entry points to buffer
incoming Ca2+, calbindin is thought to prevent an important negative feedback
mechanism in controlling Ca2+ influx into neurons. Similarly, hippocampal CA1
pyramidal neurons of calbindin D-28k-/- mice were remarkably less susceptible to
experimental ischemia in vivo and in vitro than wild types (Klapstein et al., 1998). It is
conceivable that CGNs under excitotoxic stress benefit from faster Ca2+ dependent

107
Ca2+ inactivation due to absence of calbindin, while additional upregulation of
calbindin buffers excess calcium ions.
The ability to cope with metabolic stress apparently also plays a role in excitotoxicity,
as cerebellar granule cells have been shown to be more sensitive to AMPA when
their energy metabolism was impaired ((Cebers et al., 1998), abstract). The
metabolic enzyme aldolase C has indeed been found to be a determinant for Purkinje
cell excitotoxic susceptibility (Slemmer et al., 2007). Aldolase C is an important
enzyme in glycolysis, as it converts fructose 1,6-bisphosphate (FBP) to
gyceraldehyde 3-phosphate and dihydroxyacetone phosphate, or reversibly
catalyzes the reaction in the other direction. FBP has been found to protect neurons
from excitotoxicity (Rogido et al., 2003; Park et al., 2004). Aldolase C is expressed in
a subset of cerebellar Purkinje cells in a pattern of parasagittal stripes (Slemmer et
al., 2007) (see Fig. 32). Interestingly, Aldolase C expressing Purkinje cells were
resistant to experimental TBI compared to Purkinje cells without the enzyme, within
the same animal. Moreover, in dissociated cultures, Aldolase C-positive Purkinje cells
survived a treatment with AMPA (30µM, 20 min), while Aldolase C-negative PCs did
not. By transfecting the cells with aldolase C siRNA, which strongly exacerbated
vulnerability to AMPA, an involvement of the enzyme was confirmed (Slemmer et al.,
2007). A small contribution of the glutamate transporter EAAT4, which co-localizes
with Aldolase C expression in Purkinje cells, is possible, however. In fact, mice
lacking the function of the glial glutamate transporter GLAST have been found to lose
considerably more Purkinje cells after induced ischemia, with a special vulnerability
of those Purkinje cells with low expression of EAAT4 (Yamashita et al., 2006).
Glutamate transporters remove glutamate from the extracellular space, which is a
very important function when glutamate levels in the cerebrospinal fluid are elevated
after injury (Baker et al., 1993; Palmer et al., 1993).

108
Figure 32: Schematic drawing of the pattern of aldolase C expression in the mouse cerebellum, dorsal view, according to (Sillitoe & Hawkes, 2002). Purkinje cells in the gray shaded areas express aldolase C (=zebrin II). Roman numbers I-X refer to the lobules of the cerebellar vermis region. In the anterior and posterior zones (AZ, PZ), aldolase C is expressed in a pattern resembling zebra stripes, while in the central zone (CZ), all Purkinje cells express aldolase C. picture adapted from (Sillitoe & Hawkes, 2002).
6.2. What are the differences between the similar effects induced by chronic mGluR1 and PKC activation?
Chronic activation of either mGluR1 or PKC results in a strong dendritic growth
inhibition of the Purkinje cell dendritic tree in cerebellar slice cultures (sirzen,
metzger&kapf, schrenk). Because PKC is a downstream effector in mGluR1
signalling mediating long term depression (Daniel et al., 1998; Ito, 2001), it is
interesting that PKC and mGluR1 appear to mediate dendritic growth inhibition via
independent pathways (Sirzen-Zelenskaya et al., 2006). The dendritic effects
conveyed by chronic mGluR1 or PKC activation are similar, but they do differ in some
aspects, however.
When we stained cerebellar slice cultures for vGluT1, glutamatergic terminals were
revealed to be located at the more distal parts of the Purkinje cell dendritic trees (see
Fig. 15 A). This was still the case after 7 days of treatment with DHPG (Fig. 15 C).
After 7 days of treatment with PMA, on the other hand, vGluT1-positive terminals
were also located on many Purkinje cell somata (Fig. 15 B). Somehow, the Purkinje

109
cell somata must have retained the characteristics of the dendritic compartments to
build glutamatergic synapses. Preliminary results using confocal microscopy to
visualize Purkinje cell spines revealed striking morphological differences between
mGluR1- and PKC-induced dendritic growth inhibition (see Fig. 30). After chronic
DHPG treatment, Purkinje cell dendrites were virtually devoid of spines, while after
chronic PMA treatment, Purkinje cell dendrites, and often also somata, were densely
covered by spines, which were clearly different in shape than the spines found in
untreated controls. Moreover, after PMA treatment spines were found on Purkinje cell
dendrites and somata, while in controls the somata were devoid of spines (see Fig.
31). This is in line with our findings on vGluT1-positive terminals on Purkinje cell
somata after PMA treatment.
Combined inhibition of T-type and P/Q-type calcium channels provided a partial
rescue from the dendritic growth inhibition mediated by PKC or mGluR1 activation. In
PMA treated cultures, however, either inhibition of T-type or of P/Q-type channels
was sufficient to increase dendritic growth parameters significantly, while in DHPG
treated cultures, simultaneous inhibition of both channel types was required. This
points toward additional, compensatory mechanisms being involved in mediating
dendritic growth inhibition particularly after chronic mGluR1 activation.
6.3. Inhibition of Purkinje cell dendritic growth involves Ca2+ entry through voltage gated channels of the T- and the P/Q-type
We have shown here that pharmacological blockade of T-type and P/Q-type Ca2+
channels results in a rescue of the Purkinje cell dendritic tree after mGluR1 or PKC
stimulation indicating that Ca2+ influx through these channels is important in
mediating dendritic growth inhibition. In many aspects of neuronal development, Ca2+
signals play a critical role (Konur & Ghosh, 2005). Increased Ca2+ entry into Purkinje
cells severely reduced dendritic trees in two independent mouse models. A
constitutively open GluRδ2 channel impairs Purkinje cell development and survival in
the lurcher mouse (Zuo et al., 1997), while in the mwk mouse a leaky TRPC3
channel causes dendritic growth inhibition in Purkinje cells. Pharmacological
inhibition of the GluRδ2 channel with Nasp, which is able to rescue the effects in
lurcher mice (Zanjani et al., 2009), did not convey any protection from dendritic
growth inhibition after mGluR1 or PKC activation. Similarly, pharmacological

110
inhibition as well as experiments with mice lacking TRPC3 function strongly suggest
that TRPC3 does not play a role in mediating mGluR1 or PKC induced dendritic
growth inhibition. This was surprising, because a gain-of-function in the trpc3 gene
has a similar effect on Purkinje cell dendrites as DHPG- or PKC treatment, and,
moreover, TRPC3 has been shown to be involved in both, mGluR1- and PKC
signaling. TRPC3 mediates the sEPSC after mGluR1 activation (Hartman) and
TRPC3 activity is modulated by PKC (Becker et al., 2009).
Furthermore, no involvement or contribution of Ca2+ release from internal stores, from
R-type and, in piloting experiments, L-type channels have been found, while the role
of N-type Ca2+ channels cannot be fully excluded, as they were inhibited together
with T- and P/Q- type channels with ω-conotoxin MVIIC (McDonough et al., 1996).
Since T- and P/Q-type channels together mediate up to 95% of the total Ca2+
currents in Purkinje cells (Usowicz et al., 1992; Watanabe et al., 1998; Swensen &
Bean, 2003; Isope & Murphy, 2005; Isope et al., 2010), and both have been shown to
be involved in mGluR1 signaling (Kitano et al., 2003; Hildebrand et al., 2009), it is
conceivable that they are also responsible for the major part of Ca2+ entry after
mGluR1 or PKC activation.
In an attempt to corroborate our findings by supporting the theory that increased Ca2+
influx mediates the growth inhibiting effects after chronic DHPG or PKC treatment,
we used BAPTA-AM as a chelator of intracellular calcium. In concentrations up to
100µM, BAPTA-AM did not rescue Purkinje cell dendrites which were simultaneously
treated with DHPG or PMA (see Fig. 28), and BAPTA-AM at 50 µM did not increase
the rescue effect obtained by T/P/Q-inhibition (see Fig. 29). A possible explanation
for this lack of effect could be that BAPTA-AM is required to traverse the cell
membrane in order to perform its action. This can be problematic in organotypic slice
cultures.

111
7. Conclusion and Outlook 7.1. Physiological relevance of limiting dendritic size after chronic
activation of mGluR1 or PKC
Our results show that a reduced size of the dendritic tree does not protect Purkinje
cells from AMPA-mediated neurotoxicity. Staining for the vesicular glutamate
transporter vGluT1 revealed a high density of glutamatergic synapses on the stunted
dendritic trees of pre-treated Purkinje cells. This suggests that receptor density rather
than total receptor load is important for determining the sensitivity of Purkinje cells to
AMPA-mediated neurotoxicity. Our finding that AMPA-challenged cerebellar granule
cells rapidly become immunoreactive for Calbindin D-28K shows that the specificity
of Calbindin D-28K immunoreactivity for Purkinje cells in the cerebellum is not
absolute, and that also granule cells can express this protein. Intrinsic features like
calbindin expression under normal conditions, coping with metabolic stress and the
presence of glutamate transporters are possible reasons for Purkinje cell
susceptibility to excitotoxic overload. Carrying out our experiments with calbindin-/-
mice (Klapstein et al., 1998) might reveal interesting results.
It remains unclear what the physiological relevance of limiting dendritic size after
chronic activation of a metabotropic glutamate receptor or PKC might be. The
generation of transgenic mice expressing a constitutively active PKCγ, which is
currently a project in our group, may not only clarify this point, but may also serve as
a useful animal model to study spinocerebellar ataxia type 14 (Chen et al., 2003).
Similarly, experiments with a constitutively active mGluR1 receptor (Yamashita et al.,
2004), either in vivo or in vitro using a hand-held gene gun for transfection of
cerebellar slice cultures, can be interesting projects for the future.
7.2. Further studies on dendritic growth inhibition induced by chronic mGluR1 or PKC activation
Chronic activation over several days of either mGluR1 or PKC results in a strong
dendritic growth inhibition of the Purkinje cell dendritic tree in cerebellar slice culture
(Metzger & Kapfhammer, 2000; Schrenk et al., 2002; Sirzen-Zelenskaya et al., 2006).
Interestingly, PKC and mGluR1 appear to mediate dendritic growth inhibition via

112
independent pathways (Sirzen-Zelenskaya et al., 2006). The effects on dendritic
morphology and characteristics conveyed by chronic mGluR1 or PKC activation are
similar, but differ in some aspects when they come under scrutiny. Qualitative piloting
experiments with confocal microscopy revealed interesting differences in spine
morphology. Further experiments and establishment of a method for quantification of
spine density and definition of morphological parameters will be necessary to gain
further insights.
7.3. Blockade of T-type and P/Q-type Ca2+ channels partially rescues dendritic trees from mGluR1 and PKC induced dendritic growth inhibition
Our results show that T-type and P/Q-type Ca2+ channels are involved in mediating
dendritic growth inhibition after chronic mGluR1 and PKC activation. The rescued
dendritic trees did not reach the size of untreated control cells. Although it is possible
that additional pathways are involved, the reason for this partial rescue could also be
an incomplete blocking of the channel blockers. We have experienced the permanent
presence of DHPG or PMA in the culture medium over 7 days as a very potent
activator of mGluR1 or PKC, respectively. Therefore, it might be problematic to
thoroughly block any downstream target by pharmacological means. An alternative
method which could help us clarify this point may be the introduction of siRNA
against the calcium channels using a hand-held gene gun.

113
8. Materials and Methods 8.1. Cerebellar slice cultures
8.1.1. Media and prearrangements for cerebellar slice cultures
All ingredients were sterile and mixed in a laminar flow workbench. Ingredients for 200 ml preparation medium (PM):
100 ml minimal essential medium (MEM) (Gibco 11012), in twofold
concentration
98 ml Aqua bidest
1 ml Glutamax (Gibco 35050)
1N NaOH or 1N HCl to adjust pH to 7.2-7.4
Ingredients for 100 ml incubation medium:
25 ml MEM (Gibco 11012), in twofold concentration
23,5 ml Aqua bidest
25 ml Basal Medium Eagle, with Earl’s salt, without glutamine (Gibco 21400)
25 ml horse serum, heat-inactivated (Gibco 26050)
1 ml Glutamax (Gibco 35050)
700 µl of a 10% glucose solution
1N NaOH or 1N HCl to adjust pH to 7.2-7.4
Pre-arrangements:
A sterilized razorblade was installed on a tissue chopper (McIllwain).
Petri dishes (greiner bio-one 627102, 35mm) were half-filled with ice-cold
preparation medium and stored at 4°C until used. 2-3 dishes per mouse were
required.
750μl of incubation medium was pipeted in each well of a tissue culture plate
(6 wells, Falcon 353046). The plate was placed in an incubator providing a
humidified atmosphere with 5% CO2 at 37°C. One plate holds cultures from 3
mice.
Surgical instruments were sterilized and placed ready.

114
8.1.2. Procedure
Animal experiments were carried out in accordance with the European Communities
Council Directive of 24 November 1986 (86/609/EEC) and were reviewed and
permitted by Swiss authorities. Cultures were prepared from B6CF1 mice at postnatal
day 8 (P8) as described previously (Adcock et al., 2004; Kapfhammer, 2005; 2010)
and incubated according to the static method (Stoppini et al., 1991). All steps were
carried out in the aseptic environment of a horizontal laminar flow workbench (BDK,
Germany).
A P8 mouse pup was decapitated and the head was sprayed with 70%
ethanol
The skull was carefully opened in the sterile workbench.
The cerebellum was removed together with surrounding brain structures
(colliculi inferiores, pons, medulla oblongata) and placed immediately in a dish
filled with ice-cold preparation medium. All further steps were carried out under
a stereomicroscope (Zeiss, stemi2000).
The cerebellum was isolated by cutting the cerebellar peduncles and removing
most of the meninges from the surface.
The cerebellum was placed on the tissue chopper and sagittal slices (350 μm)
were cut.
The sliced cerebellum was placed in a fresh dish with cold preparation
medium and the slices were separated from each other. One cerebellum
usually yielded 15-18 slices.
The bottom membranes of two tissue culture inserts (Millicell CM, Millipore
PICM 03050) were moistened with preparation medium.
The slices were carefully laid on the membrane. Both culture inserts should
contain about the same amount of slices from different regions of the
cerebellum.
The culture inserts were placed in the pre-arranged tissue culture plate and
incubated immediately.

115
8.2. Experiments and maintenance of the cultures
The incubation medium was changed every 2-3 days. Fresh incubation
medium was pre-warmed to 37°C and the pH was adjusted to 7.2-7.4, if
necessary.
Drugs were added to the culture medium after every medium change.
8.2.1. Pharmacological agents
Solvents for stock solutions (SS, sterile):
Preparation medium (PM)
Aqua bidest (H2O)
1:1 mixture of ethanol and dimetyl sulfoxide (EtD)
All Stock solutions 1 (see Table 1) were kept at -20°C. Stock solutions 2 were kept at
-20°C if the solvent was EtD, and at -4°C for the duration of the experiment if the
solvent was PM or H2O. Concentrations of stock solutions 2 were chosen according
to the desired end-concentration for the experiment, as to make sure that the
concentration of solvent in the culture medium would not exceed 1 % (Kapfhammer,
2010).
Table 1: Substances and stock solutions.
Substance MW [g/mol]
Stock solution 1
Stock solution 2
Supplier
ω-Agatoxin IVA 5202.3 0.1mM (0.1mg in 192µl PM)
50µM (dilute SS1 1:1 in EtD)
Bachem H-1544.0100
AMPA (RS)-a-Amino-3-hydroxy-5-methyl-4-isoxazolepropionic acid
186.2 10mM (1.86mg/ml in H2O)
5mM (dilute SS1 1:1 in EtD)
Tocris 169
BAPTA-AM (light sensitive)
764.7 10mM (7.65mg/ml in EtD )
Calbiochem 196419
ω-Conotoxin MVIIC
2639.1 1mM (0.5mg in 182µl PM)
500µM (dilute SS1 1:1 in EtD)
Bachem H-8835.0500
DHPG (RS)-3,5-Dihydroxyphenylglycine
183.05 30mM (10mg in 1763µl PM)
7.5mM (dilute SS1 1:3 in EtD)
Tocris 0342

116
Substance MW [g/mol]
Stock solution 1
Stock solution 2
Supplier
Mibefradil
568.55 30mM (10mg in 568 µl H2O)
1mM (dilute SS1 1:29 in H2O)
Tocris 2198
Naspm 1-Naphthylacetyl spermine
479.9 50mM (5mg in 208µl PM),
25 mM (dilute SS1 1:3 in EtD)
Sigma N193
NNC 50-0396
564.6 25mM (10mg in 676µl H2O)
0.5mM (dilute SS1 1:49 in H2O)
Tocris 2268
Nimodipin (light sensitive)
418.4 50mM (23.9mg in 1.14 ml EtD)
1mM (dilute SS1 1:49 in EtD)
Tocris 600
PMA Phorbol 12-myristate 13-acetate
616.8 1.5 mM (0.925 mg/ml in EtD)
50µM (dilute SS1 1:29 in EtD)
Tocris 1201
Pyr3 456.6 20mM (10mg in 1094µl EtD)
1mM (dilute SS1 1:19 in EtD)
Tocris 3751
SKF 96365
402.9 25 mM (10 mg/ml in EtD)
5 mM (dilute SS1 1:4 in EtD)
Tocris 1147
SNX-482 4495.0 100µM (10µg in 22.25µl H2O
Biotrend BP0376
U73 122
469.15 4mM (1.88mg/ml in EtD)
1mM (dilute SS1 1:3 in EtD)
Tocris 1268
8.2.2. The role of dendritic tree size in excitotoxicity:
Pharmacological treatments inhibiting dendritic growth of Purkinje cells were
started after 3 days in vitro (DIV3) and washed out at DIV10.
The cultures were incubated for 24 hours without treatment.
At DIV12 the cultures were challenged with AMPA for 4 hours and kept in
culture for two more days without treatment.

117
8.2.3. Pathway analysis of mGluR1- and PKC-induced dendritic growth inhibition
All pharmacological treatments were started at DIV2-3 and maintained for 7
days, until the end of the culture period.
To ensure a thorough blockade of Ca2+ channels, the substances DHPG and
PMA were added 4 hours after the channel inhibitors. This would make sure
that the channel inhibitors reach their binding sites and establish a channel
inhibition before DHPG or PMA could trigger a cellular reaction limiting
dendritic growth.
The P/Q- and N-type Ca2+ channel inhibitor ω-conotoxin MVIIC was an
exception to this rule as it was added 4 hours after the other channel inhibitors
at the same time with DHPG or PMA, because ω-conotoxin MVIIC only
supports P/Q-type inhibition achieved by ω-agatoxin IVA if ω-agatoxin IVA
reaches the binding site first (McDonough et al., 2002).
8.3. Immunocytochemistry
At the end of the culture period cultures were fixed in 4% paraformaldehyde in
100 mM phosphate buffer (PB) overnight at 4°C.
The slices were washed with PB 3 times for 10 min.
The plastic feet at the culture inserts were cut off to limit the required amount
of antibody solution to 800μl.
The 1. antibody solution was prepared in PB as follows:
o 0.5 % Triton X-100, in order to permeabilize the tissue and prevent
non-specific antigen binding
o 3 % normal goat serum, in order to block non-specific antigen binding
o rabbit anti-Calbindin D-28K (Swant) 1:1000, to visualize Purkinje cells
o monoclonal anti-NeuN (Chemicon, Millipore) 1:500, to visualize CGNs
The slices were incubated in 1. antibody solution at 4°C overnight
The slices were washed with PB 3 times for 10 min.
The 2. Antibody solution was prepared in PB as follows:
o 0.1 % Triton X-100, in order to prevent non-specific antigen binding

118
o goat anti-rabbit Alexa 546 or 568 (Molecular Probes, Invitrogen) 1:500
o goat anti-mouse Alexa 488 (Molecular Probes, Invitrogen) 1:500
The slices were incubated in 2. antibody solution at room temperature for 1-4
hours.
The slices were washed with PB 3 times for 10 min.
Stained slices were mounted on glass slides (Thermo Scientific Menzel-Gläser
Superfrost Plus, Art. No. J1800AMNZ) and coverslipped with Mowiol.
Cultures were viewed on an Olympus AX-70 microscope equipped with a Spot
digital camera.
Recorded images were adjusted for brightness and contrast with Photoshop
image processing software
8.4. Genotyping of TRPC3-/- mice
TRPC3-/- mice were a kind gift from the Arthur Konnerth group. To confirm that those
mice indeed contained the dysfunctional Trpc3 gene which lacks exon 7 (Hartmann
et al., 2008), we performed a PCR.
8.4.1. Protocol for isolation of DNA
Cut 1 mm mouse tail tip after decapitation of the mouse pup for cerebellar
slice culture, store at -20°C immediately in an Eppendorf tube (1.5 mm).
Add to each tail tip:
o 40 μl Proteinase K (Merck, Stock solution of 10 mg/ml)
o 700 μl ‘Tail Buffer’ (10 mM Tris. Cl, pH8.0, 50 mm EDTA, 100 mM
NaCl, 0.5 % SDS)
Shake at 55°C over night
Add 175 μl NaCl (6M), shake at 55°C for 15 min
Centrifuge at 13’000 for 20 min (Heraeus Biofuge pico)
Transfer 660 μl supernatant into fresh Eppendorf tube (1.5 mm)
Add 660 μl Isopropanol, shake shortly by hand
Centrifuge at 4°C at 20 000 g, 22 min (Heraeus Biofuge stratus)
Discard supernatant, keep pellet

119
Add to pellet 660 μl ethanol (75 %, stored at 4°C), shake shortly by hand
Centrifuge at 4°C at 20 000 g, 22 min (Heraeus Biofuge stratus)
Discard supernatant, put open Eppendorf tube at 55°C for 15 min to let the
pellet dry
Dissolve pellet in 200 μl sterile water
8.4.2. PCR
The primer sequences for the murine Trpc3 gene (chosen to flank missing exon 7)
were chosen according to (Hartmann et al., 2008) and produced by Microsynth.
5’-AGA ATC CAC CTG CTT ACA ACC ATG TG-3’
5’-GGT GGA GGT AAC ACA CAG CTA AGC C-3’
The primers were resolved in sterile water to a concentration of 50 µM.
PCR Master Mix (for 1 sample), prepare on ice
19.5 μl water
1.5 μl PCR Buffer 10x (invitrogen)
1.5 μl MgCl2 50 mM (invitrogen)
1.5 μl Primer mix (containing both primers at 0.5 μM in water)
1.5 μl ddNTP (invitrogen)
0.5 μl Taq Polymerase (5 units/μl, invitrogen)
For 1 sample pipet 28 μl Master Mix + 2 μl DNA solution.
PCR (36 cycles):
94°C 2 min 30 s
94°C 40 s
58°C 50 s (annealing)
72°C 50 s (elongation)
8.4.3. Gel electrophoresis
Mix samples with sample loading buffer (Laemmli 2x concentrate, Sigma) and
load 15 μl per lane, one lane contains 1kb DNA Ladder (BioLabs)

120
Run 1 % agarose gel (0.3 % ethidium bromide) at 100 V for 80 min,
photograph under UV light (see Fig. 33)
Figure 33: photograph of an agarose gel after electrophoresis, showing analysis of PCR results. Top lane shows DNA ladder with the 2 fastest bands at 1000 and 500 bp. The lanes marked TPRC3-/- contain DNA from TRPC3-/- mice, with bands below 500 bp. The lanes marked CB6 contain DNA from CB6 mice, with bands between 1000 and 500 bp. According to Hartmann et al., the band for TRPC3-/- mice is supposed to be at 300 bp, and the band for wild type mice at 700 bp (Hartmann et al., 2008). This is in line with our results.
8.5. Quantitative analysis of cultured Purkinje cells
Purkinje cells which had a dendritic tree which could be isolated from its
surroundings were selected for analysis.
Cells were viewed with a 25x lens of a POLYVAR microscope and
photographed with a digital camera (Coolsnap-Pro, Photometrics, Canada).
Dendritic branch points were counted manually.
The image analysis program Image Pro Plus was used to trace the outline of
the Purkinje cell dendritic trees (see Fig. 34) by selecting the area using the
magic wand tool. This yielded the area covered by the dendritic tree.
Cells were acquired from three independent experiments with an average
number of 20 cells per experiment.
The data were analyzed using GraphPad Prism software.
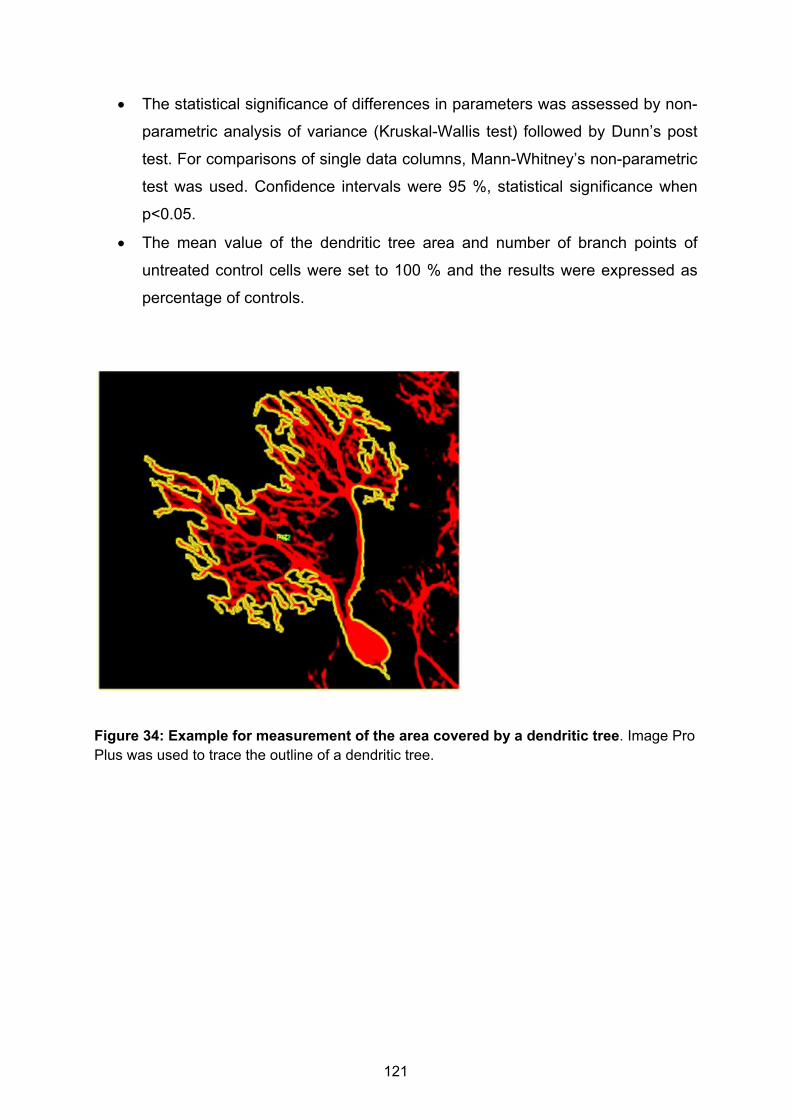
121
The statistical significance of differences in parameters was assessed by non-
parametric analysis of variance (Kruskal-Wallis test) followed by Dunn’s post
test. For comparisons of single data columns, Mann-Whitney’s non-parametric
test was used. Confidence intervals were 95 %, statistical significance when
p<0.05.
The mean value of the dendritic tree area and number of branch points of
untreated control cells were set to 100 % and the results were expressed as
percentage of controls.
Figure 34: Example for measurement of the area covered by a dendritic tree. Image Pro Plus was used to trace the outline of a dendritic tree.

122
References
Adcock, K.H., Metzger, F. & Kapfhammer, J.P. (2004) Purkinje cell dendritic tree development in the absence of excitatory neurotransmission and of brain-derived neurotrophic factor in organotypic slice cultures. Neuroscience, 127, 137-145.
Ai, J. & Baker, A. (2002) Presynaptic hyperexcitability at cerebellar synapses in traumatic
injury rat. Neuroscience letters, 332, 155-158. Aiba, A., Kano, M., Chen, C., Stanton, M.E., Fox, G.D., Herrup, K., Zwingman, T.A. &
Tonegawa, S. (1994) Deficient cerebellar long-term depression and impaired motor learning in mGluR1 mutant mice. Cell, 79, 377-388.
Altman, J. & Anderson, W.J. (1972) Experimental reorganization of the cerebellar cortex. I.
Morphological effects of elimination of all microneurons with prolonged x-irradiation started at birth. J Comp Neurol, 146, 355-406.
Armengol, J.A. & Sotelo, C. (1991) Early dendritic development of Purkinje cells in the rat
cerebellum. A light and electron microscopic study using axonal tracing in 'in vitro' slices. Brain Res Dev Brain Res, 64, 95-114.
Baker, A.J., Moulton, R.J., MacMillan, V.H. & Shedden, P.M. (1993) Excitatory amino acids
in cerebrospinal fluid following traumatic brain injury in humans. Journal of neurosurgery, 79, 369-372.
Baptista, C.A., Hatten, M.E., Blazeski, R. & Mason, C.A. (1994) Cell-cell interactions
influence survival and differentiation of purified Purkinje cells in vitro. Neuron, 12, 243-260.
Barclay, J., Balaguero, N., Mione, M., Ackerman, S.L., Letts, V.A., Brodbeck, J., Canti, C.,
Meir, A., Page, K.M., Kusumi, K., Perez-Reyes, E., Lander, E.S., Frankel, W.N., Gardiner, R.M., Dolphin, A.C. & Rees, M. (2001) Ducky mouse phenotype of epilepsy and ataxia is associated with mutations in the Cacna2d2 gene and decreased calcium channel current in cerebellar Purkinje cells. J Neurosci, 21, 6095-6104.
Barenberg, P., Strahlendorf, H. & Strahlendorf, J. (2001) Hypoxia induces an excitotoxic-type
of dark cell degeneration in cerebellar Purkinje neurons. Neuroscience research, 40, 245-254.
Barker, A.J., Koch, S.M., Reed, J., Barres, B.A. & Ullian, E.M. (2008) Developmental control
of synaptic receptivity. J Neurosci, 28, 8150-8160. Barmack, N.H., Qian, Z. & Yoshimura, J. (2000) Regional and cellular distribution of protein
kinase C in rat cerebellar Purkinje cells. J Comp Neurol, 427, 235-254. Bastianelli, E. (2003) Distribution of calcium-binding proteins in the cerebellum. Cerebellum,
2, 242-262. Batchelor, A.M. & Garthwaite, J. (1993) Novel synaptic potentials in cerebellar Purkinje cells:
probable mediation by metabotropic glutamate receptors. Neuropharmacology, 32, 11-20.

123
Batchelor, A.M., Madge, D.J. & Garthwaite, J. (1994) Synaptic activation of metabotropic glutamate receptors in the parallel fibre-Purkinje cell pathway in rat cerebellar slices. Neuroscience, 63, 911-915.
Becker, E.B., Oliver, P.L., Glitsch, M.D., Banks, G.T., Achilli, F., Hardy, A., Nolan, P.M.,
Fisher, E.M. & Davies, K.E. (2009) A point mutation in TRPC3 causes abnormal Purkinje cell development and cerebellar ataxia in moonwalker mice. Proc Natl Acad Sci U S A, 106, 6706-6711.
Bender, K.J. & Trussell, L.O. (2009) Axon initial segment Ca2+ channels influence action
potential generation and timing. Neuron, 61, 259-271. Benson, D.L. & Tanaka, H. (1998) N-cadherin redistribution during synaptogenesis in
hippocampal neurons. J Neurosci, 18, 6892-6904. Bergmann, M., Fox, P.A., Grabs, D., Post, A. & Schilling, K. (1996) Expression and
subcellular distribution of glutamate receptor subunits 2/3 in the developing cerebellar cortex. J Neurosci Res, 43, 78-86.
Berry, M. & Bradley, P. (1976) The growth of the dendritic trees of Purkinje cells in the
cerebellum of the rat. Brain research, 112, 1-35. Bienz, M. & Clevers, H. (2000) Linking colorectal cancer to Wnt signaling. Cell, 103, 311-320. Boukhtouche, F., Janmaat, S., Vodjdani, G., Gautheron, V., Mallet, J., Dusart, I. & Mariani, J.
(2006) Retinoid-related orphan receptor alpha controls the early steps of Purkinje cell dendritic differentiation. J Neurosci, 26, 1531-1538.
Bracha, V., Zhao, L., Wunderlich, D.A., Morrissy, S.J. & Bloedel, J.R. (1997) Patients with
cerebellar lesions cannot acquire but are able to retain conditioned eyeblink reflexes. Brain, 120 ( Pt 8), 1401-1413.
Bravin, M., Morando, L., Vercelli, A., Rossi, F. & Strata, P. (1999) Control of spine formation
by electrical activity in the adult rat cerebellum. Proc Natl Acad Sci U S A, 96, 1704-1709.
Bray, D. (1973) Branching patterns of individual sympathetic neurons in culture. J Cell Biol,
56, 702-712. Broadbelt, K., Byne, W. & Jones, L.B. (2002) Evidence for a decrease in basilar dendrites of
pyramidal cells in schizophrenic medial prefrontal cortex. Schizophr Res, 58, 75-81. Brodbeck, J., Davies, A., Courtney, J.M., Meir, A., Balaguero, N., Canti, C., Moss, F.J., Page,
K.M., Pratt, W.S., Hunt, S.P., Barclay, J., Rees, M. & Dolphin, A.C. (2002) The ducky mutation in Cacna2d2 results in altered Purkinje cell morphology and is associated with the expression of a truncated alpha 2 delta-2 protein with abnormal function. J Biol Chem, 277, 7684-7693.
Bruckner, G. & Grosche, J. (2001) Perineuronal nets show intrinsic patterns of extracellular
matrix differentiation in organotypic slice cultures. Exp Brain Res, 137, 83-93. Butts, T., Chaplin, N. & Wingate, R.J. (2011) Can clues from evolution unlock the molecular
development of the cerebellum? Mol Neurobiol, 43, 67-76. Cadigan, K.M. & Nusse, R. (1997) Wnt signaling: a common theme in animal development.
Genes Dev, 11, 3286-3305.

124
Canepari, M., Auger, C. & Ogden, D. (2004) Ca2+ ion permeability and single-channel
properties of the metabotropic slow EPSC of rat Purkinje neurons. J Neurosci, 24, 3563-3573.
Canepari, M. & Ogden, D. (2003) Evidence for protein tyrosine phosphatase, tyrosine kinase,
and G-protein regulation of the parallel fiber metabotropic slow EPSC of rat cerebellar Purkinje neurons. J Neurosci, 23, 4066-4071.
Canepari, M. & Ogden, D. (2006) Kinetic, pharmacological and activity-dependent separation
of two Ca2+ signalling pathways mediated by type 1 metabotropic glutamate receptors in rat Purkinje neurones. J Physiol, 573, 65-82.
Canepari, M., Papageorgiou, G., Corrie, J.E., Watkins, C. & Ogden, D. (2001) The
conductance underlying the parallel fibre slow EPSP in rat cerebellar Purkinje neurones studied with photolytic release of L-glutamate. J Physiol, 533, 765-772.
Canoll, P.D., Barnea, G., Levy, J.B., Sap, J., Ehrlich, M., Silvennoinen, O., Schlessinger, J. &
Musacchio, J.M. (1993) The expression of a novel receptor-type tyrosine phosphatase suggests a role in morphogenesis and plasticity of the nervous system. Brain Res Dev Brain Res, 75, 293-298.
Carter, A.R., Chen, C., Schwartz, P.M. & Segal, R.A. (2002) Brain-derived neurotrophic
factor modulates cerebellar plasticity and synaptic ultrastructure. J Neurosci, 22, 1316-1327.
Casabona, G., Knopfel, T., Kuhn, R., Gasparini, F., Baumann, P., Sortino, M.A., Copani, A. &
Nicoletti, F. (1997) Expression and coupling to polyphosphoinositide hydrolysis of group I metabotropic glutamate receptors in early postnatal and adult rat brain. The European journal of neuroscience, 9, 12-17.
Catania, M.V., Bellomo, M., Di Giorgi-Gerevini, V., Seminara, G., Giuffrida, R., Romeo, R.,
De Blasi, A. & Nicoletti, F. (2001) Endogenous activation of group-I metabotropic glutamate receptors is required for differentiation and survival of cerebellar Purkinje cells. J Neurosci, 21, 7664-7673.
Cavelier, P., Lohof, A.M., Lonchamp, E., Beekenkamp, H., Mariani, J. & Bossu, J.L. (2008)
Participation of low-threshold Ca2+ spike in the Purkinje cells complex spike. Neuroreport, 19, 299-303.
Cebers, G., Cebere, A. & Liljequist, S. (1998) Metabolic inhibition potentiates AMPA-induced
Ca2+ fluxes and neurotoxicity in rat cerebellar granule cells. Brain research, 779, 194-204.
Celio, M.R. (1990) Calbindin D-28k and parvalbumin in the rat nervous system.
Neuroscience, 35, 375-475. Chen, D.H., Brkanac, Z., Verlinde, C.L., Tan, X.J., Bylenok, L., Nochlin, D., Matsushita, M.,
Lipe, H., Wolff, J., Fernandez, M., Cimino, P.J., Bird, T.D. & Raskind, W.H. (2003) Missense mutations in the regulatory domain of PKC gamma: a new mechanism for dominant nonepisodic cerebellar ataxia. Am J Hum Genet, 72, 839-849.
Christopherson, K.S., Ullian, E.M., Stokes, C.C., Mullowney, C.E., Hell, J.W., Agah, A.,
Lawler, J., Mosher, D.F., Bornstein, P. & Barres, B.A. (2005) Thrombospondins are astrocyte-secreted proteins that promote CNS synaptogenesis. Cell, 120, 421-433.

125
Cingolani, L.A., Gymnopoulos, M., Boccaccio, A., Stocker, M. & Pedarzani, P. (2002) Developmental regulation of small-conductance Ca2+-activated K+ channel expression and function in rat Purkinje neurons. J Neurosci, 22, 4456-4467.
Cohen-Cory, S., Dreyfus, C.F. & Black, I.B. (1991) NGF and excitatory neurotransmitters
regulate survival and morphogenesis of cultured cerebellar Purkinje cells. J Neurosci, 11, 462-471.
Cohen, S., Levi-Montalcini, R. & Hamburger, V. (1954) A Nerve Growth-Stimulating Factor
Isolated from Sarcom as 37 and 180. Proc Natl Acad Sci U S A, 40, 1014-1018. Conn, P.J. & Pin, J.P. (1997) Pharmacology and functions of metabotropic glutamate
receptors. Annu Rev Pharmacol Toxicol, 37, 205-237. Corrales, J.D., Blaess, S., Mahoney, E.M. & Joyner, A.L. (2006) The level of sonic hedgehog
signaling regulates the complexity of cerebellar foliation. Development, 133, 1811-1821.
Corriveau, R.A., Shatz, C.J. & Nedivi, E. (1999) Dynamic regulation of cpg15 during activity-
dependent synaptic development in the mammalian visual system. J Neurosci, 19, 7999-8008.
Crozatier, M. & Vincent, A. (2008) Control of multidendritic neuron differentiation in
Drosophila: the role of Collier. Dev Biol, 315, 232-242. Cruzblanca, H., Koh, D.S. & Hille, B. (1998) Bradykinin inhibits M current via phospholipase
C and Ca2+ release from IP3-sensitive Ca2+ stores in rat sympathetic neurons. Proc Natl Acad Sci U S A, 95, 7151-7156.
Dailey, M.E. & Smith, S.J. (1996) The dynamics of dendritic structure in developing
hippocampal slices. J Neurosci, 16, 2983-2994. Dale Purves, G.J.A., David Fitzpatrick, William C. Hall, Anthony-Samuel LaMantia, James O.
McNamara, Leonard E. White (2008) Neuroscience, 4th edition Neuroscience, 4th edition. Sinauer Associates, Inc., Sunderland, Massachusetts USA, pp. 475-494.
Daniel, H., Levenes, C. & Crepel, F. (1998) Cellular mechanisms of cerebellar LTD. Trends
Neurosci, 21, 401-407. De Zeeuw, C.I., Hansel, C., Bian, F., Koekkoek, S.K., van Alphen, A.M., Linden, D.J. &
Oberdick, J. (1998) Expression of a protein kinase C inhibitor in Purkinje cells blocks cerebellar LTD and adaptation of the vestibulo-ocular reflex. Neuron, 20, 495-508.
Douyard, J., Shen, L., Huganir, R.L. & Rubio, M.E. (2007) Differential neuronal and glial
expression of GluR1 AMPA receptor subunit and the scaffolding proteins SAP97 and 4.1N during rat cerebellar development. J Comp Neurol, 502, 141-156.
Dunaevsky, A., Tashiro, A., Majewska, A., Mason, C. & Yuste, R. (1999) Developmental
regulation of spine motility in the mammalian central nervous system. Proc Natl Acad Sci U S A, 96, 13438-13443.
Dupont, J.L., Fourcaudot, E., Beekenkamp, H., Poulain, B. & Bossu, J.L. (2006) Synaptic
organization of the mouse cerebellar cortex in organotypic slice cultures. Cerebellum, 5, 243-256.
126
Dusart, I., Airaksinen, M.S. & Sotelo, C. (1997) Purkinje cell survival and axonal regeneration are age dependent: an in vitro study. J Neurosci, 17, 3710-3726.
Dzubay, J.A. & Otis, T.S. (2002) Climbing fiber activation of metabotropic glutamate
receptors on cerebellar purkinje neurons. Neuron, 36, 1159-1167. Eisenman, L.M., Schalekamp, M.P. & Voogd, J. (1991) Development of the cerebellar
cortical efferent projection: an in-vitro anterograde tracing study in rat brain slices. Brain Res Dev Brain Res, 60, 261-266.
Emoto, K., He, Y., Ye, B., Grueber, W.B., Adler, P.N., Jan, L.Y. & Jan, Y.N. (2004) Control of
dendritic branching and tiling by the Tricornered-kinase/Furry signaling pathway in Drosophila sensory neurons. Cell, 119, 245-256.
Ernfors, P., Lee, K.F. & Jaenisch, R. (1994) Mice lacking brain-derived neurotrophic factor
develop with sensory deficits. Nature, 368, 147-150. Faherty, C.J., Kerley, D. & Smeyne, R.J. (2003) A Golgi-Cox morphological analysis of
neuronal changes induced by environmental enrichment. Brain Res Dev Brain Res, 141, 55-61.
Finch, E.A. & Augustine, G.J. (1998) Local calcium signalling by inositol-1,4,5-trisphosphate
in Purkinje cell dendrites. Nature, 396, 753-756. Fischer, M., Kaech, S., Knutti, D. & Matus, A. (1998) Rapid actin-based plasticity in dendritic
spines. Neuron, 20, 847-854. Flora, A., Klisch, T.J., Schuster, G. & Zoghbi, H.Y. (2009) Deletion of Atoh1 disrupts Sonic
Hedgehog signaling in the developing cerebellum and prevents medulloblastoma. Science, 326, 1424-1427.
Fremeau, R.T., Jr., Troyer, M.D., Pahner, I., Nygaard, G.O., Tran, C.H., Reimer, R.J.,
Bellocchio, E.E., Fortin, D., Storm-Mathisen, J. & Edwards, R.H. (2001) The expression of vesicular glutamate transporters defines two classes of excitatory synapse. Neuron, 31, 247-260.
Fuerst, P.G., Koizumi, A., Masland, R.H. & Burgess, R.W. (2008) Neurite arborization and
mosaic spacing in the mouse retina require DSCAM. Nature, 451, 470-474. Fujino, T., Wu, Z., Lin, W.C., Phillips, M.A. & Nedivi, E. (2008) cpg15 and cpg15-2 constitute
a family of activity-regulated ligands expressed differentially in the nervous system to promote neurite growth and neuronal survival. J Comp Neurol, 507, 1831-1845.
Garthwaite, G. & Garthwaite, J. (1984) Differential sensitivity of rat cerebellar cells in vitro to
the neurotoxic effects of excitatory amino acid analogues. Neuroscience letters, 48, 361-367.
Garthwaite, G. & Garthwaite, J. (1991a) AMPA Neurotoxicity in Rat Cerebellar and
Hippocampal Slices: Histological Evidence for Three Mechanisms. The European journal of neuroscience, 3, 715-728.
Garthwaite, G. & Garthwaite, J. (1991b) Mechanisms of AMPA Neurotoxicity in Rat Brain
Slices. The European journal of neuroscience, 3, 729-736. Garthwaite, J. & Garthwaite, G. (1990) Mechanisms of excitatory amino acid neurotoxicity in
rat brain slices. Advances in experimental medicine and biology, 268, 505-518.

127
Geurts, F.J., De Schutter, E. & Dieudonne, S. (2003) Unraveling the cerebellar cortex:
cytology and cellular physiology of large-sized interneurons in the granular layer. Cerebellum, 2, 290-299.
Giger, R.J., Wolfer, D.P., De Wit, G.M. & Verhaagen, J. (1996) Anatomy of rat semaphorin
III/collapsin-1 mRNA expression and relationship to developing nerve tracts during neuroembryogenesis. J Comp Neurol, 375, 378-392.
Gilthorpe, J.D., Papantoniou, E.K., Chedotal, A., Lumsden, A. & Wingate, R.J. (2002) The
migration of cerebellar rhombic lip derivatives. Development, 129, 4719-4728. Gothe, S., Wang, Z., Ng, L., Kindblom, J.M., Barros, A.C., Ohlsson, C., Vennstrom, B. &
Forrest, D. (1999) Mice devoid of all known thyroid hormone receptors are viable but exhibit disorders of the pituitary-thyroid axis, growth, and bone maturation. Genes Dev, 13, 1329-1341.
Gould, E., Allan, M.D. & McEwen, B.S. (1990a) Dendritic spine density of adult hippocampal
pyramidal cells is sensitive to thyroid hormone. Brain research, 525, 327-329. Gould, E., Westlind-Danielsson, A., Frankfurt, M. & McEwen, B.S. (1990b) Sex differences
and thyroid hormone sensitivity of hippocampal pyramidal cells. J Neurosci, 10, 996-1003.
Groc, L., Petanjek, Z., Gustafsson, B., Ben-Ari, Y., Hanse, E. & Khazipov, R. (2002) In vivo
blockade of neural activity alters dendritic development of neonatal CA1 pyramidal cells. The European journal of neuroscience, 16, 1931-1938.
Grubb, M.S. & Burrone, J. (2010) Activity-dependent relocation of the axon initial segment
fine-tunes neuronal excitability. Nature, 465, 1070-1074. Grueber, W.B., Jan, L.Y. & Jan, Y.N. (2002) Tiling of the Drosophila epidermis by
multidendritic sensory neurons. Development, 129, 2867-2878. Grueber, W.B., Jan, L.Y. & Jan, Y.N. (2003) Different levels of the homeodomain protein cut
regulate distinct dendrite branching patterns of Drosophila multidendritic neurons. Cell, 112, 805-818.
Gruol, D.L., Deal, C.R. & Yool, A.J. (1992) Developmental changes in calcium conductances
contribute to the physiological maturation of cerebellar Purkinje neurons in culture. J Neurosci, 12, 2838-2848.
Gruol, D.L., Netzeband, J.G., Quina, L.A. & Blakely-Gonzalez, P.K. (2005) Contribution of L-
type channels to Ca2+ regulation of neuronal properties in early developing purkinje neurons. Cerebellum, 4, 128-139.
Gumbiner, B.M. (1996) Cell adhesion: the molecular basis of tissue architecture and
morphogenesis. Cell, 84, 345-357. Gundlfinger, A., Kapfhammer, J.P., Kruse, F., Leitges, M. & Metzger, F. (2003) Different
regulation of Purkinje cell dendritic development in cerebellar slice cultures by protein kinase Calpha and -beta. J Neurobiol, 57, 95-109.
Hack, N.J., Sluiter, A.A. & Balazs, R. (1995) AMPA receptors in cerebellar granule cells
during development in culture. Brain Res Dev Brain Res, 87, 55-61.

128
Hall, A. (1998) Rho GTPases and the actin cytoskeleton. Science, 279, 509-514. Hall, A. & Nobes, C.D. (2000) Rho GTPases: molecular switches that control the
organization and dynamics of the actin cytoskeleton. Philos Trans R Soc Lond B Biol Sci, 355, 965-970.
Hamilton, B.A., Frankel, W.N., Kerrebrock, A.W., Hawkins, T.L., FitzHugh, W., Kusumi, K.,
Russell, L.B., Mueller, K.L., van Berkel, V., Birren, B.W., Kruglyak, L. & Lander, E.S. (1996) Disruption of the nuclear hormone receptor RORalpha in staggerer mice. Nature, 379, 736-739.
Hand, R., Bortone, D., Mattar, P., Nguyen, L., Heng, J.I., Guerrier, S., Boutt, E., Peters, E.,
Barnes, A.P., Parras, C., Schuurmans, C., Guillemot, F. & Polleux, F. (2005) Phosphorylation of Neurogenin2 specifies the migration properties and the dendritic morphology of pyramidal neurons in the neocortex. Neuron, 48, 45-62.
Harada, A., Teng, J., Takei, Y., Oguchi, K. & Hirokawa, N. (2002) MAP2 is required for
dendrite elongation, PKA anchoring in dendrites, and proper PKA signal transduction. J Cell Biol, 158, 541-549.
Hartmann, J., Dragicevic, E., Adelsberger, H., Henning, H.A., Sumser, M., Abramowitz, J.,
Blum, R., Dietrich, A., Freichel, M., Flockerzi, V., Birnbaumer, L. & Konnerth, A. (2008) TRPC3 channels are required for synaptic transmission and motor coordination. Neuron, 59, 392-398.
Hashimoto, K., Curty, F.H., Borges, P.P., Lee, C.E., Abel, E.D., Elmquist, J.K., Cohen, R.N.
& Wondisford, F.E. (2001) An unliganded thyroid hormone receptor causes severe neurological dysfunction. Proc Natl Acad Sci U S A, 98, 3998-4003.
Hashimoto, T., Ase, K., Sawamura, S., Kikkawa, U., Saito, N., Tanaka, C. & Nishizuka, Y.
(1988) Postnatal development of a brain-specific subspecies of protein kinase C in rat. J Neurosci, 8, 1678-1683.
Hatten, M.E. (1999) Central nervous system neuronal migration. Annu Rev Neurosci, 22,
511-539. Hattori, D., Demir, E., Kim, H.W., Viragh, E., Zipursky, S.L. & Dickson, B.J. (2007a) Dscam
diversity is essential for neuronal wiring and self-recognition. Nature, 449, 223-227. Hattori, Y., Sugimura, K. & Uemura, T. (2007b) Selective expression of Knot/Collier, a
transcriptional regulator of the EBF/Olf-1 family, endows the Drosophila sensory system with neuronal class-specific elaborated dendritic patterns. Genes Cells, 12, 1011-1022.
Hausser, M., Spruston, N. & Stuart, G.J. (2000) Diversity and dynamics of dendritic signaling.
Science, 290, 739-744. He, Z. & Tessier-Lavigne, M. (1997) Neuropilin is a receptor for the axonal chemorepellent
Semaphorin III. Cell, 90, 739-751. Hildebrand, M.E., Isope, P., Miyazaki, T., Nakaya, T., Garcia, E., Feltz, A., Schneider, T.,
Hescheler, J., Kano, M., Sakimura, K., Watanabe, M., Dieudonne, S. & Snutch, T.P. (2009) Functional coupling between mGluR1 and Cav3.1 T-type calcium channels contributes to parallel fiber-induced fast calcium signaling within Purkinje cell dendritic spines. J Neurosci, 29, 9668-9682.

129
Hioki, H., Fujiyama, F., Taki, K., Tomioka, R., Furuta, T., Tamamaki, N. & Kaneko, T. (2003) Differential distribution of vesicular glutamate transporters in the rat cerebellar cortex. Neuroscience, 117, 1-6.
Hirai, H. & Launey, T. (2000) The regulatory connection between the activity of granule cell
NMDA receptors and dendritic differentiation of cerebellar Purkinje cells. J Neurosci, 20, 5217-5224.
Hirono, M., Konishi, S. & Yoshioka, T. (1998) Phospholipase C-independent group I
metabotropic glutamate receptor-mediated inward current in mouse purkinje cells. Biochem Biophys Res Commun, 251, 753-758.
Hoshino, M., Nakamura, S., Mori, K., Kawauchi, T., Terao, M., Nishimura, Y.V., Fukuda, A.,
Fuse, T., Matsuo, N., Sone, M., Watanabe, M., Bito, H., Terashima, T., Wright, C.V., Kawaguchi, Y., Nakao, K. & Nabeshima, Y. (2005) Ptf1a, a bHLH transcriptional gene, defines GABAergic neuronal fates in cerebellum. Neuron, 47, 201-213.
Huang, F.L., Yoshida, Y., Nakabayashi, H., Young, W.S., 3rd & Huang, K.P. (1988)
Immunocytochemical localization of protein kinase C isozymes in rat brain. J Neurosci, 8, 4734-4744.
Huang, L., Keyser, B.M., Tagmose, T.M., Hansen, J.B., Taylor, J.T., Zhuang, H., Zhang, M.,
Ragsdale, D.S. & Li, M. (2004) NNC 55-0396 [(1S,2S)-2-(2-(N-[(3-benzimidazol-2-yl)propyl]-N-methylamino)ethyl)-6-fluoro-1,2,3,4-tetrahydro-1-isopropyl-2-naphtyl cyclopropanecarboxylate dihydrochloride]: a new selective inhibitor of T-type calcium channels. J Pharmacol Exp Ther, 309, 193-199.
Huang, W.C., Young, J.S. & Glitsch, M.D. (2007) Changes in TRPC channel expression
during postnatal development of cerebellar neurons. Cell Calcium, 42, 1-10. Ichise, T., Kano, M., Hashimoto, K., Yanagihara, D., Nakao, K., Shigemoto, R., Katsuki, M. &
Aiba, A. (2000) mGluR1 in cerebellar Purkinje cells essential for long-term depression, synapse elimination, and motor coordination. Science, 288, 1832-1835.
Igarashi, T., Potts, M.B. & Noble-Haeusslein, L.J. (2007) Injury severity determines Purkinje
cell loss and microglial activation in the cerebellum after cortical contusion injury. Experimental neurology, 203, 258-268.
Isope, P., Hildebrand, M.E. & Snutch, T.P. (2010) Contributions of T-Type Voltage-Gated
Calcium Channels to Postsynaptic Calcium Signaling within Purkinje Neurons. Cerebellum.
Isope, P. & Murphy, T.H. (2005) Low threshold calcium currents in rat cerebellar Purkinje cell
dendritic spines are mediated by T-type calcium channels. J Physiol, 562, 257-269. Ito, M. (2001) Cerebellar long-term depression: characterization, signal transduction, and
functional roles. Physiol Rev, 81, 1143-1195. Jaeger, C.B., Kapoor, R. & Llinas, R. (1988) Cytology and organization of rat cerebellar
organ cultures. Neuroscience, 26, 509-538. Jakab, R.L., Wong, J.K. & Belcher, S.M. (2001) Estrogen receptor beta immunoreactivity in
differentiating cells of the developing rat cerebellum. J Comp Neurol, 430, 396-409.

130
Jinushi-Nakao, S., Arvind, R., Amikura, R., Kinameri, E., Liu, A.W. & Moore, A.W. (2007) Knot/Collier and cut control different aspects of dendrite cytoskeleton and synergize to define final arbor shape. Neuron, 56, 963-978.
Johnston, J. & Delaney, K.R. (2010) Synaptic activation of T-type Ca2+ channels via mGluR
activation in the primary dendrite of mitral cells. J Neurophysiol, 103, 2557-2569. Kalinichenko, S.G. & Okhotin, V.E. (2005) Unipolar brush cells--a new type of excitatory
interneuron in the cerebellar cortex and cochlear nuclei of the brainstem. Neurosci Behav Physiol, 35, 21-36.
Kamouchi, M., Philipp, S., Flockerzi, V., Wissenbach, U., Mamin, A., Raeymaekers, L.,
Eggermont, J., Droogmans, G. & Nilius, B. (1999) Properties of heterologously expressed hTRP3 channels in bovine pulmonary artery endothelial cells. J Physiol, 518 Pt 2, 345-358.
Kano, M., Hashimoto, K., Chen, C., Abeliovich, A., Aiba, A., Kurihara, H., Watanabe, M.,
Inoue, Y. & Tonegawa, S. (1995) Impaired synapse elimination during cerebellar development in PKC gamma mutant mice. Cell, 83, 1223-1231.
Kano, M., Hashimoto, K., Kurihara, H., Watanabe, M., Inoue, Y., Aiba, A. & Tonegawa, S.
(1997) Persistent multiple climbing fiber innervation of cerebellar Purkinje cells in mice lacking mGluR1. Neuron, 18, 71-79.
Kano, M., Hashimoto, K., Watanabe, M., Kurihara, H., Offermanns, S., Jiang, H., Wu, Y.,
Jun, K., Shin, H.S., Inoue, Y., Simon, M.I. & Wu, D. (1998) Phospholipase cbeta4 is specifically involved in climbing fiber synapse elimination in the developing cerebellum. Proc Natl Acad Sci U S A, 95, 15724-15729.
Kapfhammer, J.P. (2004) Cellular and molecular control of dendritic growth and development
of cerebellar Purkinje cells. Progress in histochemistry and cytochemistry, 39, 131-182.
Kapfhammer, J.P. (2005) Cerebellar slice cultures. In Poindron, P., Piguet, P., Förster, E.
(eds) New Methods for Culturing Cells from Nervous Tissues. Karger, Basel, pp. 74-81.
Kapfhammer, J.P. (2010) Cerebellar Slice Cultures. In Doering, L.C. (ed) Protocols for
Neural Cell Culture. Humana Press, pp. 285-298. Kapoor, R., Jaeger, C.B. & Llinas, R. (1988) Electrophysiology of the mammalian cerebellar
cortex in organ culture. Neuroscience, 26, 493-507. Kaufmann, W.E. & Moser, H.W. (2000) Dendritic anomalies in disorders associated with
mental retardation. Cereb Cortex, 10, 981-991. Khurana, S., Ranmal, S. & Ben-Jonathan, N. (2000) Exposure of newborn male and female
rats to environmental estrogens: delayed and sustained hyperprolactinemia and alterations in estrogen receptor expression. Endocrinology, 141, 4512-4517.
Kim, M.D., Jan, L.Y. & Jan, Y.N. (2006) The bHLH-PAS protein Spineless is necessary for
the diversification of dendrite morphology of Drosophila dendritic arborization neurons. Genes Dev, 20, 2806-2819.

131
Kinzie, J.M., Saugstad, J.A., Westbrook, G.L. & Segerson, T.P. (1995) Distribution of metabotropic glutamate receptor 7 messenger RNA in the developing and adult rat brain. Neuroscience, 69, 167-176.
Kishimoto, Y., Fujimichi, R., Araishi, K., Kawahara, S., Kano, M., Aiba, A. & Kirino, Y. (2002)
mGluR1 in cerebellar Purkinje cells is required for normal association of temporally contiguous stimuli in classical conditioning. The European journal of neuroscience, 16, 2416-2424.
Kitano, J., Nishida, M., Itsukaichi, Y., Minami, I., Ogawa, M., Hirano, T., Mori, Y. & Nakanishi,
S. (2003) Direct interaction and functional coupling between metabotropic glutamate receptor subtype 1 and voltage-sensitive Cav2.1 Ca2+ channel. J Biol Chem, 278, 25101-25108.
Kiyonaka, S., Kato, K., Nishida, M., Mio, K., Numaga, T., Sawaguchi, Y., Yoshida, T.,
Wakamori, M., Mori, E., Numata, T., Ishii, M., Takemoto, H., Ojida, A., Watanabe, K., Uemura, A., Kurose, H., Morii, T., Kobayashi, T., Sato, Y., Sato, C., Hamachi, I. & Mori, Y. (2009) Selective and direct inhibition of TRPC3 channels underlies biological activities of a pyrazole compound. Proc Natl Acad Sci U S A, 106, 5400-5405.
Klapstein, G.J., Vietla, S., Lieberman, D.N., Gray, P.A., Airaksinen, M.S., Thoenen, H.,
Meyer, M. & Mody, I. (1998) Calbindin-D28k fails to protect hippocampal neurons against ischemia in spite of its cytoplasmic calcium buffering properties: evidence from calbindin-D28k knockout mice. Neuroscience, 85, 361-373.
Knopfel, T., Anchisi, D., Alojado, M.E., Tempia, F. & Strata, P. (2000) Elevation of
intradendritic sodium concentration mediated by synaptic activation of metabotropic glutamate receptors in cerebellar Purkinje cells. The European journal of neuroscience, 12, 2199-2204.
Knopfel, T. & Grandes, P. (2002) Metabotropic glutamate receptors in the cerebellum with a
focus on their function in Purkinje cells. Cerebellum, 1, 19-26. Kobielak, A. & Fuchs, E. (2004) Alpha-catenin: at the junction of intercellular adhesion and
actin dynamics. Nature reviews, 5, 614-625. Kolodkin, A.L., Levengood, D.V., Rowe, E.G., Tai, Y.T., Giger, R.J. & Ginty, D.D. (1997)
Neuropilin is a semaphorin III receptor. Cell, 90, 753-762. Konur, S. & Ghosh, A. (2005) Calcium signaling and the control of dendritic development.
Neuron, 46, 401-405. Korkotian, E. & Segal, M. (1999) Bidirectional regulation of dendritic spine dimensions by
glutamate receptors. Neuroreport, 10, 2875-2877. Korte, M., Carroll, P., Wolf, E., Brem, G., Thoenen, H. & Bonhoeffer, T. (1995) Hippocampal
long-term potentiation is impaired in mice lacking brain-derived neurotrophic factor. Proc Natl Acad Sci U S A, 92, 8856-8860.
Kose, A., Saito, N., Ito, H., Kikkawa, U., Nishizuka, Y. & Tanaka, C. (1988) Electron
microscopic localization of type I protein kinase C in rat Purkinje cells. J Neurosci, 8, 4262-4268.
Kramer, A.P. & Stent, G.S. (1985) Developmental arborization of sensory neurons in the
leech Haementeria ghilianii. II. Experimentally induced variations in the branching pattern. J Neurosci, 5, 768-775.

132
Kress, M., Karasek, J., Ferrer-Montiel, A.V., Scherbakov, N. & Haberberger, R.V. (2008)
TRPC channels and diacylglycerol dependent calcium signaling in rat sensory neurons. Histochem Cell Biol, 130, 655-667.
Larkfors, L., Lindsay, R.M. & Alderson, R.F. (1996) Characterization of the responses of
Purkinje cells to neurotrophin treatment. Journal of neurochemistry, 66, 1362-1373. Le Roux, P.D. & Reh, T.A. (1995) Independent regulation of primary dendritic and axonal
growth by maturing astrocytes in vitro. Neuroscience letters, 198, 5-8. Leiman, A.L. & Seil, F.J. (1973) Spontaneous and evoked bioelectric activity in organized
cerebellar tissue cultures. Experimental neurology, 40, 748-758. Lein, E.S. & Hawrylycz, M.J. & Ao, N. & Ayres, M. & Bensinger, A. & Bernard, A. & Boe, A.F.
& Boguski, M.S. & Brockway, K.S. & Byrnes, E.J. & Chen, L. & Chen, T.M. & Chin, M.C. & Chong, J. & Crook, B.E. & Czaplinska, A. & Dang, C.N. & Datta, S. & Dee, N.R. & Desaki, A.L. & Desta, T. & Diep, E. & Dolbeare, T.A. & Donelan, M.J. & Dong, H.W. & Dougherty, J.G. & Duncan, B.J. & Ebbert, A.J. & Eichele, G. & Estin, L.K. & Faber, C. & Facer, B.A. & Fields, R. & Fischer, S.R. & Fliss, T.P. & Frensley, C. & Gates, S.N. & Glattfelder, K.J. & Halverson, K.R. & Hart, M.R. & Hohmann, J.G. & Howell, M.P. & Jeung, D.P. & Johnson, R.A. & Karr, P.T. & Kawal, R. & Kidney, J.M. & Knapik, R.H. & Kuan, C.L. & Lake, J.H. & Laramee, A.R. & Larsen, K.D. & Lau, C. & Lemon, T.A. & Liang, A.J. & Liu, Y. & Luong, L.T. & Michaels, J. & Morgan, J.J. & Morgan, R.J. & Mortrud, M.T. & Mosqueda, N.F. & Ng, L.L. & Ng, R. & Orta, G.J. & Overly, C.C. & Pak, T.H. & Parry, S.E. & Pathak, S.D. & Pearson, O.C. & Puchalski, R.B. & Riley, Z.L. & Rockett, H.R. & Rowland, S.A. & Royall, J.J. & Ruiz, M.J. & Sarno, N.R. & Schaffnit, K. & Shapovalova, N.V. & Sivisay, T. & Slaughterbeck, C.R. & Smith, S.C. & Smith, K.A. & Smith, B.I. & Sodt, A.J. & Stewart, N.N. & Stumpf, K.R. & Sunkin, S.M. & Sutram, M. & Tam, A. & Teemer, C.D. & Thaller, C. & Thompson, C.L. & Varnam, L.R. & Visel, A. & Whitlock, R.M. & Wohnoutka, P.E. & Wolkey, C.K. & Wong, V.Y. & Wood, M. & Yaylaoglu, M.B. & Young, R.C. & Youngstrom, B.L. & Yuan, X.F. & Zhang, B. & Zwingman, T.A. & Jones, A.R. (2007) Genome-wide atlas of gene expression in the adult mouse brain. Nature, 445, 168-176.
Leist, M. & Jaattela, M. (2001) Four deaths and a funeral: from caspases to alternative
mechanisms. Nature reviews, 2, 589-598. Li, Z., Aizenman, C.D. & Cline, H.T. (2002) Regulation of rho GTPases by crosstalk and
neuronal activity in vivo. Neuron, 33, 741-750. Liljelund, P., Netzeband, J.G. & Gruol, D.L. (2000) L-Type calcium channels mediate calcium
oscillations in early postnatal Purkinje neurons. J Neurosci, 20, 7394-7403. Lindholm, D., Castren, E., Tsoulfas, P., Kolbeck, R., Berzaghi Mda, P., Leingartner, A.,
Heisenberg, C.P., Tessarollo, L., Parada, L.F. & Thoenen, H. (1993) Neurotrophin-3 induced by tri-iodothyronine in cerebellar granule cells promotes Purkinje cell differentiation. J Cell Biol, 122, 443-450.
Lohmann, C., Myhr, K.L. & Wong, R.O. (2002) Transmitter-evoked local calcium release
stabilizes developing dendrites. Nature, 418, 177-181. Lopez-Bendito, G., Shigemoto, R., Lujan, R. & Juiz, J.M. (2001) Developmental changes in
the localisation of the mGluR1alpha subtype of metabotropic glutamate receptors in Purkinje cells. Neuroscience, 105, 413-429.

133
Lordkipanidze, T. & Dunaevsky, A. (2005) Purkinje cell dendrites grow in alignment with Bergmann glia. Glia, 51, 229-234.
Machold, R. & Fishell, G. (2005) Math1 is expressed in temporally discrete pools of
cerebellar rhombic-lip neural progenitors. Neuron, 48, 17-24. Maeda, N., Matsui, F. & Oohira, A. (1992) A chondroitin sulfate proteoglycan that is
developmentally regulated in the cerebellar mossy fiber system. Dev Biol, 151, 564-574.
Maletic-Savatic, M., Malinow, R. & Svoboda, K. (1999) Rapid dendritic morphogenesis in
CA1 hippocampal dendrites induced by synaptic activity. Science, 283, 1923-1927. Mansouri, B., Henne, W.M., Oomman, S.K., Bliss, R., Attridge, J., Finckbone, V., Zeitouni, T.,
Hoffman, T., Bahr, B.A., Strahlendorf, H.K. & Strahlendorf, J.C. (2007) Involvement of calpain in AMPA-induced toxicity to rat cerebellar Purkinje neurons. Eur J Pharmacol, 557, 106-114.
Martin-Zanca, D., Hughes, S.H. & Barbacid, M. (1986) A human oncogene formed by the
fusion of truncated tropomyosin and protein tyrosine kinase sequences. Nature, 319, 743-748.
Mason, C.A., Christakos, S. & Catalano, S.M. (1990) Early climbing fiber interactions with
Purkinje cells in the postnatal mouse cerebellum. J Comp Neurol, 297, 77-90. Masu, M., Tanabe, Y., Tsuchida, K., Shigemoto, R. & Nakanishi, S. (1991) Sequence and
expression of a metabotropic glutamate receptor. Nature, 349, 760-765. Matthews, B.J., Kim, M.E., Flanagan, J.J., Hattori, D., Clemens, J.C., Zipursky, S.L. &
Grueber, W.B. (2007) Dendrite self-avoidance is controlled by Dscam. Cell, 129, 593-604.
Mautes, A.E., Fukuda, K. & Noble, L.J. (1996) Cellular response in the cerebellum after
midline traumatic brain injury in the rat. Neuroscience letters, 214, 95-98. McAllister, A.K., Katz, L.C. & Lo, D.C. (1996) Neurotrophin regulation of cortical dendritic
growth requires activity. Neuron, 17, 1057-1064. McAllister, A.K., Katz, L.C. & Lo, D.C. (1997) Opposing roles for endogenous BDNF and NT-
3 in regulating cortical dendritic growth. Neuron, 18, 767-778. McAllister, A.K., Lo, D.C. & Katz, L.C. (1995) Neurotrophins regulate dendritic growth in
developing visual cortex. Neuron, 15, 791-803. McDonough, S.I. & Bean, B.P. (1998) Mibefradil inhibition of T-type calcium channels in
cerebellar purkinje neurons. Mol Pharmacol, 54, 1080-1087. McDonough, S.I., Boland, L.M., Mintz, I.M. & Bean, B.P. (2002) Interactions among toxins
that inhibit N-type and P-type calcium channels. J Gen Physiol, 119, 313-328. McDonough, S.I., Swartz, K.J., Mintz, I.M., Boland, L.M. & Bean, B.P. (1996) Inhibition of
calcium channels in rat central and peripheral neurons by omega-conotoxin MVIIC. J Neurosci, 16, 2612-2623.
McKay, B.E. & Turner, R.W. (2005) Physiological and morphological development of the rat
cerebellar Purkinje cell. J Physiol, 567, 829-850.

134
Meacham, C.A., White, L.D., Barone, S., Jr. & Shafer, T.J. (2003) Ontogeny of voltage-
sensitive calcium channel alpha(1A) and alpha(1E) subunit expression and synaptic function in rat central nervous system. Brain Res Dev Brain Res, 142, 47-65.
Meldrum, B. & Garthwaite, J. (1990) Excitatory amino acid neurotoxicity and
neurodegenerative disease. Trends in pharmacological sciences, 11, 379-387. Metzger, F. & Kapfhammer, J.P. (2000) Protein kinase C activity modulates dendritic
differentiation of rat Purkinje cells in cerebellar slice cultures. The European journal of neuroscience, 12, 1993-2005.
Miale, I.L. & Sidman, R.L. (1961) An autoradiographic analysis of histogenesis in the mouse
cerebellum. Experimental neurology, 4, 277-296. Millard, S.S., Flanagan, J.J., Pappu, K.S., Wu, W. & Zipursky, S.L. (2007) Dscam2 mediates
axonal tiling in the Drosophila visual system. Nature, 447, 720-724. Mintz, I.M., Adams, M.E. & Bean, B.P. (1992a) P-type calcium channels in rat central and
peripheral neurons. Neuron, 9, 85-95. Mintz, I.M., Venema, V.J., Swiderek, K.M., Lee, T.D., Bean, B.P. & Adams, M.E. (1992b) P-
type calcium channels blocked by the spider toxin omega-Aga-IVA. Nature, 355, 827-829.
Moore, A.W., Jan, L.Y. & Jan, Y.N. (2002) hamlet, a binary genetic switch between single-
and multiple- dendrite neuron morphology. Science, 297, 1355-1358. Morales, D. & Hatten, M.E. (2006) Molecular markers of neuronal progenitors in the
embryonic cerebellar anlage. J Neurosci, 26, 12226-12236. Morara, S., van der Want, J.J., de Weerd, H., Provini, L. & Rosina, A. (2001) Ultrastructural
analysis of climbing fiber-Purkinje cell synaptogenesis in the rat cerebellum. Neuroscience, 108, 655-671.
Morita, A., Yamashita, N., Sasaki, Y., Uchida, Y., Nakajima, O., Nakamura, F., Yagi, T.,
Taniguchi, M., Usui, H., Katoh-Semba, R., Takei, K. & Goshima, Y. (2006) Regulation of dendritic branching and spine maturation by semaphorin3A-Fyn signaling. J Neurosci, 26, 2971-2980.
Mouginot, D. & Gahwiler, B.H. (1995) Characterization of synaptic connections between
cortex and deep nuclei of the rat cerebellum in vitro. Neuroscience, 64, 699-712. Mount, H.T., Dreyfus, C.F. & Black, I.B. (1994a) Muscarinic stimulation promotes cultured
Purkinje cell survival: a role for acetylcholine in cerebellar development? Journal of neurochemistry, 63, 2065-2073.
Mount, H.T., Dreyfus, C.F. & Black, I.B. (1994b) Neurotrophin-3 selectively increases
cultured Purkinje cell survival. Neuroreport, 5, 2497-2500. Mount, H.T., Elkabes, S., Dreyfus, C.F. & Black, I.B. (1998) Differential involvement of
metabotropic and p75 neurotrophin receptors in effects of nerve growth factor and neurotrophin-3 on cultured Purkinje cell survival. Journal of neurochemistry, 70, 1045-1053.

135
Muller, Y.L., Reitstetter, R. & Yool, A.J. (1998) Regulation of Ca2+-dependent K+ channel expression in rat cerebellum during postnatal development. J Neurosci, 18, 16-25.
Murai, K.K., Nguyen, L.N., Irie, F., Yamaguchi, Y. & Pasquale, E.B. (2003) Control of
hippocampal dendritic spine morphology through ephrin-A3/EphA4 signaling. Nat Neurosci, 6, 153-160.
Nagerl, U.V., Mody, I., Jeub, M., Lie, A.A., Elger, C.E. & Beck, H. (2000) Surviving granule
cells of the sclerotic human hippocampus have reduced Ca(2+) influx because of a loss of calbindin-D(28k) in temporal lobe epilepsy. J Neurosci, 20, 1831-1836.
Nagler, K., Mauch, D.H. & Pfrieger, F.W. (2001) Glia-derived signals induce synapse
formation in neurones of the rat central nervous system. J Physiol, 533, 665-679. Nakanishi, S. (1992) Molecular diversity of glutamate receptors and implications for brain
function. Science, 258, 597-603. Napper, R.M. & Harvey, R.J. (1988) Number of parallel fiber synapses on an individual
Purkinje cell in the cerebellum of the rat. J Comp Neurol, 274, 168-177. Nedivi, E., Fieldust, S., Theill, L.E. & Hevron, D. (1996) A set of genes expressed in
response to light in the adult cerebral cortex and regulated during development. Proc Natl Acad Sci U S A, 93, 2048-2053.
Nedivi, E., Wu, G.Y. & Cline, H.T. (1998) Promotion of dendritic growth by CPG15, an
activity-induced signaling molecule. Science, 281, 1863-1866. Neves, G., Zucker, J., Daly, M. & Chess, A. (2004) Stochastic yet biased expression of
multiple Dscam splice variants by individual cells. Nat Genet, 36, 240-246. Newcomb, R., Szoke, B., Palma, A., Wang, G., Chen, X., Hopkins, W., Cong, R., Miller, J.,
Urge, L., Tarczy-Hornoch, K., Loo, J.A., Dooley, D.J., Nadasdi, L., Tsien, R.W., Lemos, J. & Miljanich, G. (1998) Selective peptide antagonist of the class E calcium channel from the venom of the tarantula Hysterocrates gigas. Biochemistry, 37, 15353-15362.
Nunzi, M.G. & Mugnaini, E. (2000) Unipolar brush cell axons form a large system of intrinsic
mossy fibers in the postnatal vestibulocerebellum. J Comp Neurol, 422, 55-65. Nusser, Z., Mulvihill, E., Streit, P. & Somogyi, P. (1994) Subsynaptic segregation of
metabotropic and ionotropic glutamate receptors as revealed by immunogold localization. Neuroscience, 61, 421-427.
Offermanns, S., Hashimoto, K., Watanabe, M., Sun, W., Kurihara, H., Thompson, R.F.,
Inoue, Y., Kano, M. & Simon, M.I. (1997) Impaired motor coordination and persistent multiple climbing fiber innervation of cerebellar Purkinje cells in mice lacking Galphaq. Proc Natl Acad Sci U S A, 94, 14089-14094.
Okubo, Y., Kakizawa, S., Hirose, K. & Iino, M. (2004) Cross talk between metabotropic and
ionotropic glutamate receptor-mediated signaling in parallel fiber-induced inositol 1,4,5-trisphosphate production in cerebellar Purkinje cells. J Neurosci, 24, 9513-9520.
Palmer, A.M., Marion, D.W., Botscheller, M.L., Swedlow, P.E., Styren, S.D. & DeKosky, S.T.
(1993) Traumatic brain injury-induced excitotoxicity assessed in a controlled cortical impact model. Journal of neurochemistry, 61, 2015-2024.

136
Paris, F., Balaguer, P., Terouanne, B., Servant, N., Lacoste, C., Cravedi, J.P., Nicolas, J.C.
& Sultan, C. (2002) Phenylphenols, biphenols, bisphenol-A and 4-tert-octylphenol exhibit alpha and beta estrogen activities and antiandrogen activity in reporter cell lines. Mol Cell Endocrinol, 193, 43-49.
Park, E., McKnight, S., Ai, J. & Baker, A.J. (2006) Purkinje cell vulnerability to mild and
severe forebrain head trauma. Journal of neuropathology and experimental neurology, 65, 226-234.
Park, J.Y., Kim, E.J., Kwon, K.J., Jung, Y.S., Moon, C.H., Lee, S.H. & Baik, E.J. (2004)
Neuroprotection by fructose-1,6-bisphosphate involves ROS alterations via p38 MAPK/ERK. Brain research, 1026, 295-301.
Parrish, J.Z., Kim, M.D., Jan, L.Y. & Jan, Y.N. (2006) Genome-wide analyses identify
transcription factors required for proper morphogenesis of Drosophila sensory neuron dendrites. Genes Dev, 20, 820-835.
Perlman, S.L. (2011) Spinocerebellar degenerations. Handb Clin Neurol, 100, 113-140. Polakis, P. (2007) The many ways of Wnt in cancer. Curr Opin Genet Dev, 17, 45-51. Polleux, F., Giger, R.J., Ginty, D.D., Kolodkin, A.L. & Ghosh, A. (1998) Patterning of cortical
efferent projections by semaphorin-neuropilin interactions. Science, 282, 1904-1906. Polleux, F., Morrow, T. & Ghosh, A. (2000) Semaphorin 3A is a chemoattractant for cortical
apical dendrites. Nature, 404, 567-573. Pouille, F., Cavelier, P., Desplantez, T., Beekenkamp, H., Craig, P.J., Beattie, R.E., Volsen,
S.G. & Bossu, J.L. (2000) Dendro-somatic distribution of calcium-mediated electrogenesis in purkinje cells from rat cerebellar slice cultures. J Physiol, 527 Pt 2, 265-282.
Purves, D. & Hume, R.I. (1981) The relation of postsynaptic geometry to the number of
presynaptic axons that innervate autonomic ganglion cells. J Neurosci, 1, 441-452. Rakic, P. & Sidman, R.L. (1973) Weaver mutant mouse cerebellum: defective neuronal
migration secondary to abnormality of Bergmann glia. Proc Natl Acad Sci U S A, 70, 240-244.
Rami, A., Patel, A.J. & Rabie, A. (1986) Thyroid hormone and development of the rat
hippocampus: morphological alterations in granule and pyramidal cells. Neuroscience, 19, 1217-1226.
Ramon y Cajal, S. (1911) Hisologie du Système nerveux de l'homme et des vertebrés, vol. 2.
Paris: Maloine. Redmond, L., Kashani, A.H. & Ghosh, A. (2002) Calcium regulation of dendritic growth via
CaM kinase IV and CREB-mediated transcription. Neuron, 34, 999-1010. Regan, L.J. (1991) Voltage-dependent calcium currents in Purkinje cells from rat cerebellar
vermis. J Neurosci, 11, 2259-2269. Resink, A., Hack, N., Boer, G.J. & Balazs, R. (1994) Growth conditions differentially
modulate the vulnerability of developing cerebellar granule cells to excitatory amino acids. Brain research, 655, 222-232.

137
Rico, B., Xu, B. & Reichardt, L.F. (2002) TrkB receptor signaling is required for establishment
of GABAergic synapses in the cerebellum. Nat Neurosci, 5, 225-233. Ringstedt, T., Lagercrantz, H. & Persson, H. (1993) Expression of members of the trk family
in the developing postnatal rat brain. Brain Res Dev Brain Res, 72, 119-131. Rogido, M., Husson, I., Bonnier, C., Lallemand, M.C., Merienne, C., Gregory, G.A., Sola, A.
& Gressens, P. (2003) Fructose-1,6-biphosphate prevents excitotoxic neuronal cell death in the neonatal mouse brain. Brain Res Dev Brain Res, 140, 287-297.
Saito, N. & Shirai, Y. (2002) Protein kinase C gamma (PKC gamma): function of neuron
specific isotype. J Biochem, 132, 683-687. Sakamoto, H., Mezaki, Y., Shikimi, H., Ukena, K. & Tsutsui, K. (2003a) Dendritic growth and
spine formation in response to estrogen in the developing Purkinje cell. Endocrinology, 144, 4466-4477.
Sakamoto, H., Shikimi, H., Ukena, K. & Tsutsui, K. (2003b) Neonatal expression of
progesterone receptor isoforms in the cerebellar Purkinje cell in rats. Neuroscience letters, 343, 163-166.
Sakamoto, H., Ukena, K. & Tsutsui, K. (2002) Dendritic spine formation in response to
progesterone synthesized de novo in the developing Purkinje cell in rats. Neuroscience letters, 322, 111-115.
Sarna, J.R. & Hawkes, R. (2003) Patterned Purkinje cell death in the cerebellum. Prog
Neurobiol, 70, 473-507. Sasaki, Y., Cheng, C., Uchida, Y., Nakajima, O., Ohshima, T., Yagi, T., Taniguchi, M.,
Nakayama, T., Kishida, R., Kudo, Y., Ohno, S., Nakamura, F. & Goshima, Y. (2002) Fyn and Cdk5 mediate semaphorin-3A signaling, which is involved in regulation of dendrite orientation in cerebral cortex. Neuron, 35, 907-920.
Schilling, K., Dickinson, M.H., Connor, J.A. & Morgan, J.I. (1991) Electrical activity in
cerebellar cultures determines Purkinje cell dendritic growth patterns. Neuron, 7, 891-902.
Schmucker, D., Clemens, J.C., Shu, H., Worby, C.A., Xiao, J., Muda, M., Dixon, J.E. &
Zipursky, S.L. (2000) Drosophila Dscam is an axon guidance receptor exhibiting extraordinary molecular diversity. Cell, 101, 671-684.
Schrenk, K., Kapfhammer, J.P. & Metzger, F. (2002) Altered dendritic development of
cerebellar Purkinje cells in slice cultures from protein kinase Cgamma-deficient mice. Neuroscience, 110, 675-689.
Schwartz, P.M., Borghesani, P.R., Levy, R.L., Pomeroy, S.L. & Segal, R.A. (1997) Abnormal
cerebellar development and foliation in BDNF-/- mice reveals a role for neurotrophins in CNS patterning. Neuron, 19, 269-281.
Segal, M. (1995) Morphological alterations in dendritic spines of rat hippocampal neurons
exposed to N-methyl-D-aspartate. Neuroscience letters, 193, 73-76. Segal, R.A. (2003) Selectivity in neurotrophin signaling: theme and variations. Annu Rev
Neurosci, 26, 299-330.

138
Seil, F.J. (2003) TrkB receptor signaling and activity-dependent inhibitory synaptogenesis. Histol Histopathol, 18, 635-646.
Shikimi, H., Sakamoto, H., Mezaki, Y., Ukena, K. & Tsutsui, K. (2004) Dendritic growth in
response to environmental estrogens in the developing Purkinje cell in rats. Neuroscience letters, 364, 114-118.
Shimada, A., Mason, C.A. & Morrison, M.E. (1998) TrkB signaling modulates spine density
and morphology independent of dendrite structure in cultured neonatal Purkinje cells. J Neurosci, 18, 8559-8570.
Shirley, L.T. & Messer, A. (2004) Early postnatal Purkinje cells from staggerer mice undergo
aberrant development in vitro with characteristic morphologic and gene expression abnormalities. Brain Res Dev Brain Res, 152, 153-157.
Shuttleworth, C.W. & Connor, J.A. (2001) Strain-dependent differences in calcium signaling
predict excitotoxicity in murine hippocampal neurons. J Neurosci, 21, 4225-4236. Sillitoe, R.V. & Hawkes, R. (2002) Whole-mount immunohistochemistry: a high-throughput
screen for patterning defects in the mouse cerebellum. J Histochem Cytochem, 50, 235-244.
Sin, W.C., Haas, K., Ruthazer, E.S. & Cline, H.T. (2002) Dendrite growth increased by visual
activity requires NMDA receptor and Rho GTPases. Nature, 419, 475-480. Singh, A., Hildebrand, M.E., Garcia, E. & Snutch, T.P. (2010) The transient receptor potential
channel antagonist SKF96365 is a potent blocker of low-voltage-activated T-type calcium channels. Br J Pharmacol, 160, 1464-1475.
Sirzen-Zelenskaya, A., Zeyse, J. & Kapfhammer, J.P. (2006) Activation of class I
metabotropic glutamate receptors limits dendritic growth of Purkinje cells in organotypic slice cultures. The European journal of neuroscience, 24, 2978-2986.
Skaliora, I., Singer, W., Betz, H. & Puschel, A.W. (1998) Differential patterns of semaphorin
expression in the developing rat brain. The European journal of neuroscience, 10, 1215-1229.
Slemmer, J.E., Haasdijk, E.D., Engel, D.C., Plesnila, N. & Weber, J.T. (2007) Aldolase C-
positive cerebellar Purkinje cells are resistant to delayed death after cerebral trauma and AMPA-mediated excitotoxicity. The European journal of neuroscience, 26, 649-656.
Smith, G.M., Rutishauser, U., Silver, J. & Miller, R.H. (1990) Maturation of astrocytes in vitro
alters the extent and molecular basis of neurite outgrowth. Dev Biol, 138, 377-390. Snider, W.D. (1988) Nerve growth factor enhances dendritic arborization of sympathetic
ganglion cells in developing mammals. J Neurosci, 8, 2628-2634. Soba, P., Zhu, S., Emoto, K., Younger, S., Yang, S.J., Yu, H.H., Lee, T., Jan, L.Y. & Jan,
Y.N. (2007) Drosophila sensory neurons require Dscam for dendritic self-avoidance and proper dendritic field organization. Neuron, 54, 403-416.
Song, H., Ming, G., He, Z., Lehmann, M., McKerracher, L., Tessier-Lavigne, M. & Poo, M.
(1998) Conversion of neuronal growth cone responses from repulsion to attraction by cyclic nucleotides. Science, 281, 1515-1518.

139
Spatkowski, G. & Schilling, K. (2003) Postnatal dendritic morphogenesis of cerebellar basket and stellate cells in vitro. J Neurosci Res, 72, 317-326.
Steinmayr, M., Andre, E., Conquet, F., Rondi-Reig, L., Delhaye-Bouchaud, N., Auclair, N.,
Daniel, H., Crepel, F., Mariani, J., Sotelo, C. & Becker-Andre, M. (1998) staggerer phenotype in retinoid-related orphan receptor alpha-deficient mice. Proc Natl Acad Sci U S A, 95, 3960-3965.
Stoppini, L., Buchs, P.A. & Muller, D. (1991) A simple method for organotypic cultures of
nervous tissue. J Neurosci Methods, 37, 173-182. Strahlendorf, J., Box, C., Attridge, J., Diertien, J., Finckbone, V., Henne, W.M., Medina, M.S.,
Miles, R., Oomman, S., Schneider, M., Singh, H., Veliyaparambil, M. & Strahlendorf, H. (2003) AMPA-induced dark cell degeneration of cerebellar Purkinje neurons involves activation of caspases and apparent mitochondrial dysfunction. Brain research, 994, 146-159.
Strahlendorf, J., McMahon, K., Border, B., Barenberg, P., Miles, R. & Strahlendorf, H. (1999)
AMPA-elicited dark cell degeneration of cerebellar Purkinje neurons has characteristics of apoptosis. Neuroscience Research Communications, 25, 149-161.
Strahlendorf, J.C., Brandon, T., Miles, R. & Strahlendorf, H.K. (1998) AMPA receptor-
mediated alterations of intracellular calcium homeostasis in rat cerebellar Purkinje cells in vitro: correlates to dark cell degeneration. Neurochem Res, 23, 1355-1362.
Sugimura, K., Satoh, D., Estes, P., Crews, S. & Uemura, T. (2004) Development of
morphological diversity of dendrites in Drosophila by the BTB-zinc finger protein abrupt. Neuron, 43, 809-822.
Supple, W.F., Jr., Leaton, R.N. & Fanselow, M.S. (1987) Effects of cerebellar vermal lesions
on species-specific fear responses, neophobia, and taste-aversion learning in rats. Physiol Behav, 39, 579-586.
Swensen, A.M. & Bean, B.P. (2003) Ionic mechanisms of burst firing in dissociated Purkinje
neurons. J Neurosci, 23, 9650-9663. Takamori, S. (2006) VGLUTs: 'exciting' times for glutamatergic research? Neuroscience
research, 55, 343-351. Takechi, H., Eilers, J. & Konnerth, A. (1998) A new class of synaptic response involving
calcium release in dendritic spines. Nature, 396, 757-760. Tamaskovic, R., Bichsel, S.J. & Hemmings, B.A. (2003) NDR family of AGC kinases--
essential regulators of the cell cycle and morphogenesis. FEBS Lett, 546, 73-80. Tanaka, M., Maeda, N., Noda, M. & Marunouchi, T. (2003) A chondroitin sulfate proteoglycan
PTPzeta /RPTPbeta regulates the morphogenesis of Purkinje cell dendrites in the developing cerebellum. J Neurosci, 23, 2804-2814.
Tanaka, M., Tomita, A., Yoshida, S., Yano, M. & Shimizu, H. (1994) Observation of the highly
organized development of granule cells in rat cerebellar organotypic cultures. Brain research, 641, 319-327.
Tanaka, M., Yanagawa, Y., Obata, K. & Marunouchi, T. (2006) Dendritic morphogenesis of
cerebellar Purkinje cells through extension and retraction revealed by long-term tracking of living cells in vitro. Neuroscience, 141, 663-674.

140
Tempia, F., Alojado, M.E., Strata, P. & Knopfel, T. (2001) Characterization of the mGluR(1)-
mediated electrical and calcium signaling in Purkinje cells of mouse cerebellar slices. J Neurophysiol, 86, 1389-1397.
Threadgill, R., Bobb, K. & Ghosh, A. (1997) Regulation of dendritic growth and remodeling by
Rho, Rac, and Cdc42. Neuron, 19, 625-634. Ting, C.Y., Herman, T., Yonekura, S., Gao, S., Wang, J., Serpe, M., O'Connor, M.B.,
Zipursky, S.L. & Lee, C.H. (2007) Tiling of r7 axons in the Drosophila visual system is mediated both by transduction of an activin signal to the nucleus and by mutual repulsion. Neuron, 56, 793-806.
Ukena, K., Kohchi, C. & Tsutsui, K. (1999) Expression and activity of 3beta-hydroxysteroid
dehydrogenase/delta5-delta4-isomerase in the rat Purkinje neuron during neonatal life. Endocrinology, 140, 805-813.
Usowicz, M.M., Sugimori, M., Cherksey, B. & Llinas, R. (1992) P-type calcium channels in
the somata and dendrites of adult cerebellar Purkinje cells. Neuron, 9, 1185-1199. Vaillant, A.R., Zanassi, P., Walsh, G.S., Aumont, A., Alonso, A. & Miller, F.D. (2002)
Signaling mechanisms underlying reversible, activity-dependent dendrite formation. Neuron, 34, 985-998.
Verhage, M., Maia, A.S., Plomp, J.J., Brussaard, A.B., Heeroma, J.H., Vermeer, H., Toonen,
R.F., Hammer, R.E., van den Berg, T.K., Missler, M., Geuze, H.J. & Sudhof, T.C. (2000) Synaptic assembly of the brain in the absence of neurotransmitter secretion. Science, 287, 864-869.
Vincent, J., Legrand, C., Rabie, A. & Legrand, J. (1982) Effects of thyroid hormone on
synaptogenesis in the molecular layer of the developing rat cerebellum. J Physiol (Paris), 78, 729-738.
Wang, V.Y. & Zoghbi, H.Y. (2001) Genetic regulation of cerebellar development. Nat Rev
Neurosci, 2, 484-491. Wassle, H., Peichl, L. & Boycott, B.B. (1981) Dendritic territories of cat retinal ganglion cells.
Nature, 292, 344-345. Watanabe, S., Takagi, H., Miyasho, T., Inoue, M., Kirino, Y., Kudo, Y. & Miyakawa, H. (1998)
Differential roles of two types of voltage-gated Ca2+ channels in the dendrites of rat cerebellar Purkinje neurons. Brain research, 791, 43-55.
Watase, K., Hashimoto, K., Kano, M., Yamada, K., Watanabe, M., Inoue, Y., Okuyama, S.,
Sakagawa, T., Ogawa, S., Kawashima, N., Hori, S., Takimoto, M., Wada, K. & Tanaka, K. (1998) Motor discoordination and increased susceptibility to cerebellar injury in GLAST mutant mice. The European journal of neuroscience, 10, 976-988.
Weiss, G.M. & Pysh, J.J. (1978) Evidence for loss of Purkinje cell dendrites during late
development: a morphometric Golgi analysis in the mouse. Brain research, 154, 219-230.
Weyer, A. & Schilling, K. (2003) Developmental and cell type-specific expression of the
neuronal marker NeuN in the murine cerebellum. J Neurosci Res, 73, 400-409.

141
Wingate, R.J. (2001) The rhombic lip and early cerebellar development. Curr Opin Neurobiol, 11, 82-88.
Wojtowicz, W.M., Flanagan, J.J., Millard, S.S., Zipursky, S.L. & Clemens, J.C. (2004)
Alternative splicing of Drosophila Dscam generates axon guidance receptors that exhibit isoform-specific homophilic binding. Cell, 118, 619-633.
Womack, M. & Khodakhah, K. (2002) Active contribution of dendrites to the tonic and
trimodal patterns of activity in cerebellar Purkinje neurons. J Neurosci, 22, 10603-10612.
Womack, M.D. & Khodakhah, K. (2004) Dendritic control of spontaneous bursting in
cerebellar Purkinje cells. J Neurosci, 24, 3511-3521. Wong, W.T., Faulkner-Jones, B.E., Sanes, J.R. & Wong, R.O. (2000) Rapid dendritic
remodeling in the developing retina: dependence on neurotransmission and reciprocal regulation by Rac and Rho. J Neurosci, 20, 5024-5036.
Wong, W.T. & Wong, R.O. (2000) Rapid dendritic movements during synapse formation and
rearrangement. Curr Opin Neurobiol, 10, 118-124. Woodward, D.J., Hoffer, B.J. & Lapham, L.W. (1969) Postnatal development of electrical and
enzyme histochemical activity in Purkinje cells. Experimental neurology, 23, 120-139. Wu, G.Y., Deisseroth, K. & Tsien, R.W. (2001) Spaced stimuli stabilize MAPK pathway
activation and its effects on dendritic morphology. Nat Neurosci, 4, 151-158. Wu, G.Y., Zou, D.J., Rajan, I. & Cline, H. (1999) Dendritic dynamics in vivo change during
neuronal maturation. J Neurosci, 19, 4472-4483. Yamada, K., Fukaya, M., Shibata, T., Kurihara, H., Tanaka, K., Inoue, Y. & Watanabe, M.
(2000) Dynamic transformation of Bergmann glial fibers proceeds in correlation with dendritic outgrowth and synapse formation of cerebellar Purkinje cells. J Comp Neurol, 418, 106-120.
Yamagata, M. & Sanes, J.R. (2008) Dscam and Sidekick proteins direct lamina-specific
synaptic connections in vertebrate retina. Nature, 451, 465-469. Yamamoto, N., Kurotani, T. & Toyama, K. (1989) Neural connections between the lateral
geniculate nucleus and visual cortex in vitro. Science, 245, 192-194. Yamashita, A., Makita, K., Kuroiwa, T. & Tanaka, K. (2006) Glutamate transporters GLAST
and EAAT4 regulate postischemic Purkinje cell death: an in vivo study using a cardiac arrest model in mice lacking GLAST or EAAT4. Neuroscience research, 55, 264-270.
Yamashita, T., Kai, T., Terakita, A. & Shichida, Y. (2004) A novel constitutively active
mutation in the second cytoplasmic loop of metabotropic glutamate receptor. Journal of neurochemistry, 91, 484-492.
Yoshida, Y., Huang, F.L., Nakabayashi, H. & Huang, K.P. (1988) Tissue distribution and
developmental expression of protein kinase C isozymes. J Biol Chem, 263, 9868-9873.
Yu, X. & Malenka, R.C. (2003) Beta-catenin is critical for dendritic morphogenesis. Nat
Neurosci, 6, 1169-1177.

142
Zanjani, H.S., McFarland, R., Cavelier, P., Blokhin, A., Gautheron, V., Levenes, C.,
Bambrick, L.L., Mariani, J. & Vogel, M.W. (2009) Death and survival of heterozygous Lurcher Purkinje cells in vitro. Dev Neurobiol, 69, 505-517.
Zitt, C., Obukhov, A.G., Strubing, C., Zobel, A., Kalkbrenner, F., Luckhoff, A. & Schultz, G.
(1997) Expression of TRPC3 in Chinese hamster ovary cells results in calcium-activated cation currents not related to store depletion. J Cell Biol, 138, 1333-1341.
Zuo, J., De Jager, P.L., Takahashi, K.A., Jiang, W., Linden, D.J. & Heintz, N. (1997)
Neurodegeneration in Lurcher mice caused by mutation in delta2 glutamate receptor gene. Nature, 388, 769-773.

143
Acknowledgements
This work was performed at the Department of Biomedicine, Institute of Anatomy in
the Lab of Developmental Neurobiology under the supervision of Prof. Josef
Kapfhammer.
I would like to thank:
Prof. Josef Kapfhammer for giving me the opportunity to do my PhD thesis in this lab,
introducing me to the field of my project, teaching me the necessary methods and
skills, and for his great support and advice.
Prof. Markus Rüegg for being my official supervisor for the Faculty of Natural
Sciences at the University of Basel.
Markus Saxer for his extraordinarily helpful technical assistance.
Mark Ji for his help and advice, especially in PCR genotyping.
My colleagues for the interesting discussions, scientific contributions and relaxing
lunch breaks, especially I would like to thank Sophorn, Lionel, Brenda and Fritzi.
And last but most importantly thanks to my family; my fiancé Philip, my parents,
Madeleine and Cyrill, and my brother Joël, for being always there for me and giving
me unconditional support in all situations. A special thank goes to Christian F. Furrer
for sharing his enthusiasm for the life sciences with me.
This work is dedicated to Dahli F. von Reding - Meichtry (13.12.1955 - 28.7.2011).
Vaya con Dios.

144
Curriculum Vitae
Personal Details
Name Olivia Sarah Gugger Address Niederamtstrasse 3, CH-4656 Starrkirch-Will Telephone +41 78 745 40 61 E-mail [email protected] Date of Birth 6th October, 1981 Nationality Swiss
Education & Training
Since Nov. 2007 Ph.D. Studies in Developmental Neurobiology, Department of Biomedicine, University of Basel
Thesis subject: Mechanisms and Consequences of Reduced dendritic growth of
cerebellar Purkinje cells Supervisor: Prof. Josef Kapfhammer 2001- 2006 Studies of Pharmaceutical Sciences at the Swiss Federal
Institute of Technology (ETH) in Zurich Master of Science ETH in Pharmaceutical Sciences Swiss federal Pharmacists’ license
2005-2006
Practical training as a pharmacist, “Passage Apotheke” in Frauenfeld (TG) Customer services, Execution and checking of
prescriptions Establishment of standard operational procedures (SOPs)
for the incoming components inspection according to up-to-date guidelines
Adaptation of the existing hygiene directives to up-to-date guidelines; including employee training in hygiene-awareness
Development of an SOP for triage in cases of cystitis (handling and evaluation of a urine test, decision diagrams for pharmacists, actions in case of emergency and general advice for customers)
Supervisor: Susanne Hagebeucker

145
March – September 2005 Diploma Thesis: “Phenotype screen with mutants of RNA-binding proteins in
yeast”; 21 knock out mutant yeast strains were grown under several
different stress conditions in order to find a specific phenotype.
One of the found effects was chosen for further studies using DNA microarrays and immunopurification to analyze changes in gene expression of RNAs usually binding to the protein which is absent in the mutant.
Performed at the Institute of Pharmaceutical Sciences, Pharmacogenomics, ETH
Supervisor: Dr. André Gerber
2001 Matura, Kantonsschule Rychenberg, Winterthur (ZH)
Further activities and training: WIN09 (Women into Industry) mentee: mentoring program between
University of Basel and Novartis (2009-2010). Mentor: Kirsten Watson (Pharma Development HR)
Lab Animal Experiments Licence (CH): LTK Module 1 (University of Zürich, 2008)
Work Experience:
March – Sept. 2007 Pharmacist at “Coop Vitality Apotheke” in Winterthur and Volketswil (ZH); Customer services, Execution and checking of
prescriptions, Incoming components inspection
March-July 2001 Employee at IP Multimedia (Schweiz) AG, in Küsnacht (ZH); Receipt and forwarding of telephone calls, Informing customers in German, English and French, general administrative office assistance

146
Languages
German: Mother tongue English: Fluent in speaking and writing; Cambridge Certificate of
Proficiency (March 2011) French: Basic skills
Publications
Gugger, O.S., Kapfhammer, J.P. (2010) Reduced size of the dendritic tree does not protect Purkinje cells from excitotoxic death. J Neurosci Res, 88, 774-783.
Publication in Progress: Gugger, O.S., Hartmann, J., Birnbaumer, L., Kapfhammer, J.P. P/Q-type and T-type calcium channels, but not TRPC3 channels, are involved in inhibition of dendritic growth after chronic mGluR1 and PKC activation in cerebellar Purkinje cells. Article accepted for Publication in the Eur J Neurosci. October 2011.
Conference presentations
June 2011 “The Plastic Brain” meeting, joint Neurex and ENSN workshop, Basel, Switzerland, poster and short plenary presentation
March 2011 SSN Annual Meeting (Swiss Society for Neuroscience), Basel, Switzerland, poster presentation A5
February 2011 USGEB Zürich, Switzerland. Poster No. 58 and short presentation in symposium “Brain Imaging”.
July 2010 FENS forum Amsterdam, Netherlands, poster presentation A17 (supported by a travel grant from SSAHE – Swiss Society of Anatomy, Histology and Embryology)
February 2010 USGEB Lugano, Switzerland, poster presentation T02-20 July 2008 FENS forum Geneva, Switzerland, poster presentation 142.10