Thermodynamic evaluation and optimization of the (LiF + NaF + KF + MgF 2 + CaF 2 + SrF 2) system
12
Thermodynamic evaluation and optimization of the (Na + X) binary systems (X = Ag, Ca, In, Sn, Zn) using combined Calphad and first-principles methods of calculation Jian Wang a , Naihua Miao b , Patrice Chartrand a,⇑ , In-Ho Jung c a Center for Research in Computational Thermochemistry (CRCT), Dept. of Chemical Engineering, Ecole Polytechnique, Montréal, Québec, Canada H3C 3A7 b Physique Théorique des Matériaux, Institut de Physique, Université de Liège, Bât. B5a 3/5, Allée du 6 août, 17, B-4000, Sart Tilman, Belgium c Department of Mining and Materials Engineering, McGill University, H.W. Wong Building, 3610 University Street, Montréal, Québec, Canada H3A 2B2 article info Article history: Received 24 April 2013 Received in revised form 3 June 2013 Accepted 10 June 2013 Available online 25 June 2013 Keywords: CALPHAD Na–X systems First-principles calculations Phase equilibria abstract Critical evaluations and optimizations of the (Na + X) binary systems (X: Ag, Ca, In, Sn, Zn) are presented. The enthalpies of formation of Ag 2 NaðcF24 Fd " 3mÞ, InNaðcF16 Fd " 3mÞ, NaZn 13 ðcF112 Fd " 3mÞ and InNa 2 ðoC48 C222 1 Þ were estimated from First-Principles calculations. The Modified Quasichemical Model in the Pair Approximation (MQMPA) was used for the liquid solution which exhibits a high degree of short-range order. The solid phases are modeled with the Compound Energy Formalism (CEF). All avail- able and reliable experimental data are reproduced within experimental error limits. The integration of finite temperature First-Principles calculations provides a useful and effective assistance to the Calphad modelling approach. Finally, the short-range ordering behaviour of (Na + In) and (Na + Sn) in the liquid solution is studied. Ó 2013 Elsevier Ltd. All rights reserved. 1. Introduction The low density of magnesium alloys is a strong driving force for their applications in the automotive and aeronautical indus- tries. Compared to other structural materials, such as aluminium alloys and steels, the use of magnesium alloys can potentially re- duce the weight of vehicles and their fuel consumption. A major alloying element in Mg alloys is aluminium, but most of the Mg– Al based alloys, except the AE series, have poor mechanical proper- ties at high temperature, which restricts their applications. The current trend is to improve Mg-based alloys for high temperature applications. Mg–Sn based alloys have stable microstructures and good mechanical properties at high temperature due to the high solubility of Sn in hcp(Mg) and to the potential precipitation of a cubic second phase (Mg 2 Sn) in the magnesium-rich matrix [1,2]. Previous investigations [1–3] indicate that (Mg + Sn) alloys with additional alloying elements have comparable or even better creep properties than AE42 alloys. In addition, it is known that Sn can im- prove the corrosion resistance [4,5]. Unfortunately, the behaviour of (Mg + Sn) alloys during ageing after quenching requires quite long aeging times to reach the peak hardness, which is not practi- cal for industrial applications [6]. Hence, it is necessary to improve the age hardening response and creep resistant behaviour of (Mg + Sn) alloys. Adding microalloying elements can potentially achieve this goal, with many alloying elements such as Ag, Ca, Li, Na, Zn, Sr, In and rare-earth elements being considered [7–9]. For precipitation hardenable alloys, Mendis et al. [7,8] proposed a qual- itative thermo-kinetic criteria for choosing microalloying additions (In, Li, Na, and Zn). In the case of (In + Li) additions, the increase in number density is closer to one order of magnitude and the hard- ening increment is about 150% (270% with Na) [8]. A similar result has also been reported by Sasaki et al. [9] with (Na + Zn) additions. Gibson et al. [1] reported that (Mg + Sn + Zn + Na) alloys show sec- ondary creep rates five orders of magnitudes lower than binary (Mg + Sn) alloys and approximately three orders of magnitudes lower than ternary (Mg + Sn + Zn) alloys. Park et al. [10] reported that the addition of Ag to (Mg + Zn) alloys can increase the tensile strength in a double ageing condition. Mendis et al. [11] studied the effects of additives of Ag and Ca on the (Mg + Zn) alloys, and pointed out that the hardness was enhanced due to the refinement of precipitates. The (Na + X) (X = Sn, In ...) binary compounds have strong negative enthalpy of formation resulting in a high tendency for short-range ordering behaviour in the liquid solution. A strong tendency to form (Na + X) binary compounds and heterogeneous structure in the (Mg + Na + X) ternary or (Mg + Na + X + Y) multi- component from the liquid solutions which may benefit the nucle- ation of strengthening precipitates in the Mg (hcp) matrix. Although several interesting research results about the effect of additives such as Na, In, Ag et al. in Mg-based alloys were reported 0021-9614/$ - see front matter Ó 2013 Elsevier Ltd. All rights reserved. http://dx.doi.org/10.1016/j.jct.2013.06.005 ⇑ Corresponding author. Tel.: +1 514 340 4711x4089; fax: +1 514 340 5840. E-mail address: [email protected] (P. Chartrand). J. Chem. Thermodynamics 66 (2013) 22–33 Contents lists available at SciVerse ScienceDirect J. Chem. Thermodynamics journal homepage: www.elsevier.com/locate/jct
-
Upload
independent -
Category
Documents
-
view
3 -
download
0
Transcript of Thermodynamic evaluation and optimization of the (LiF + NaF + KF + MgF 2 + CaF 2 + SrF 2) system

J. Chem. Thermodynamics 66 (2013) 22–33
Contents lists available at SciVerse ScienceDirect
J. Chem. Thermodynamics
journal homepage: www.elsevier .com/locate / jc t
Thermodynamic evaluation and optimization of the (Na + X) binarysystems (X = Ag, Ca, In, Sn, Zn) using combined Calphad andfirst-principles methods of calculation
0021-9614/$ - see front matter � 2013 Elsevier Ltd. All rights reserved.http://dx.doi.org/10.1016/j.jct.2013.06.005
⇑ Corresponding author. Tel.: +1 514 340 4711x4089; fax: +1 514 340 5840.E-mail address: [email protected] (P. Chartrand).
Jian Wang a, Naihua Miao b, Patrice Chartrand a,⇑, In-Ho Jung c
a Center for Research in Computational Thermochemistry (CRCT), Dept. of Chemical Engineering, Ecole Polytechnique, Montréal, Québec, Canada H3C 3A7b Physique Théorique des Matériaux, Institut de Physique, Université de Liège, Bât. B5a 3/5, Allée du 6 août, 17, B-4000, Sart Tilman, Belgiumc Department of Mining and Materials Engineering, McGill University, H.W. Wong Building, 3610 University Street, Montréal, Québec, Canada H3A 2B2
a r t i c l e i n f o
Article history:Received 24 April 2013Received in revised form 3 June 2013Accepted 10 June 2013Available online 25 June 2013
Keywords:CALPHADNa–X systemsFirst-principles calculationsPhase equilibria
a b s t r a c t
Critical evaluations and optimizations of the (Na + X) binary systems (X: Ag, Ca, In, Sn, Zn) are presented.The enthalpies of formation of Ag2NaðcF24 Fd�3mÞ, InNaðcF16 Fd�3mÞ, NaZn13ðcF112 Fd�3mÞ andInNa2ðoC48 C2221Þwere estimated from First-Principles calculations. The Modified Quasichemical Modelin the Pair Approximation (MQMPA) was used for the liquid solution which exhibits a high degree ofshort-range order. The solid phases are modeled with the Compound Energy Formalism (CEF). All avail-able and reliable experimental data are reproduced within experimental error limits. The integration offinite temperature First-Principles calculations provides a useful and effective assistance to the Calphadmodelling approach. Finally, the short-range ordering behaviour of (Na + In) and (Na + Sn) in the liquidsolution is studied.
� 2013 Elsevier Ltd. All rights reserved.
1. Introduction
The low density of magnesium alloys is a strong driving forcefor their applications in the automotive and aeronautical indus-tries. Compared to other structural materials, such as aluminiumalloys and steels, the use of magnesium alloys can potentially re-duce the weight of vehicles and their fuel consumption. A majoralloying element in Mg alloys is aluminium, but most of the Mg–Al based alloys, except the AE series, have poor mechanical proper-ties at high temperature, which restricts their applications. Thecurrent trend is to improve Mg-based alloys for high temperatureapplications. Mg–Sn based alloys have stable microstructures andgood mechanical properties at high temperature due to the highsolubility of Sn in hcp(Mg) and to the potential precipitation of acubic second phase (Mg2Sn) in the magnesium-rich matrix [1,2].Previous investigations [1–3] indicate that (Mg + Sn) alloys withadditional alloying elements have comparable or even better creepproperties than AE42 alloys. In addition, it is known that Sn can im-prove the corrosion resistance [4,5]. Unfortunately, the behaviourof (Mg + Sn) alloys during ageing after quenching requires quitelong aeging times to reach the peak hardness, which is not practi-cal for industrial applications [6]. Hence, it is necessary to improvethe age hardening response and creep resistant behaviour of
(Mg + Sn) alloys. Adding microalloying elements can potentiallyachieve this goal, with many alloying elements such as Ag, Ca, Li,Na, Zn, Sr, In and rare-earth elements being considered [7–9]. Forprecipitation hardenable alloys, Mendis et al. [7,8] proposed a qual-itative thermo-kinetic criteria for choosing microalloying additions(In, Li, Na, and Zn). In the case of (In + Li) additions, the increase innumber density is closer to one order of magnitude and the hard-ening increment is about 150% (270% with Na) [8]. A similar resulthas also been reported by Sasaki et al. [9] with (Na + Zn) additions.Gibson et al. [1] reported that (Mg + Sn + Zn + Na) alloys show sec-ondary creep rates five orders of magnitudes lower than binary(Mg + Sn) alloys and approximately three orders of magnitudeslower than ternary (Mg + Sn + Zn) alloys. Park et al. [10] reportedthat the addition of Ag to (Mg + Zn) alloys can increase the tensilestrength in a double ageing condition. Mendis et al. [11] studied theeffects of additives of Ag and Ca on the (Mg + Zn) alloys, andpointed out that the hardness was enhanced due to the refinementof precipitates. The (Na + X) (X = Sn, In . . .) binary compounds havestrong negative enthalpy of formation resulting in a high tendencyfor short-range ordering behaviour in the liquid solution. A strongtendency to form (Na + X) binary compounds and heterogeneousstructure in the (Mg + Na + X) ternary or (Mg + Na + X + Y) multi-component from the liquid solutions which may benefit the nucle-ation of strengthening precipitates in the Mg (hcp) matrix.Although several interesting research results about the effect ofadditives such as Na, In, Ag et al. in Mg-based alloys were reported

J. Wang et al. / J. Chem. Thermodynamics 66 (2013) 22–33 23
recently, the mechanism resulting in improvement of mechanicalproperties from such additives is still confused. Thus a systematicalstudy on the role of additives Ag, Na, In, Ca and Zn for the mechan-ical properties improvement of (Mg + Sn) based alloys is necessary.
In order to design new (Mg + Sn)-based alloys and to under-stand the relationship between their microstructures and mechan-ical properties, a better knowledge of the phase relationships in(Mg + Sn)-based alloys is imperative, starting with phase equilib-ria. Obtaining such information by the sole mean of experimentaltechniques is cumbersome and costly. Fortunately, thermody-namic modelling of multi-component systems by the CALPHAD(Calculation of Phase Diagrams) [12] approach has been shownto be a very efficient way to investigate phase equilibria [13]. Cou-pled phase-field calculations, ab initio calculations, and physicalproperties modelling permit one to estimate material properties[14]. In the present work, the (Na + X) binary systems (X = Ag, Ca,In, Sn, and Zn) were studied, as part of a wider thermodynamicdatabase development project for (Mg + Sn + X) multi-componentsystems (X: Ag, Ca, In, Li, Na, Sr, and Zn).
The available experimental data on phase equilibria and on thethermodynamic properties of the condensed phases has been crit-ically reviewed. Due to the lack of thermodynamic data for severalcompounds in the (Na + X) binary systems (X = Ag, Ca, In, Sn, andZn), and due to the experimental difficulties (high vapour pres-sures) of measuring this type of data in such chemical systems,first-principles calculations were used to obtain the enthalpy offormation for several solid phases in the present study. Using theCALPHAD technique, a consistent set of model parameters hasbeen obtained for all condensed phases in the (Na + X) binary sys-tems (X = Ag, Ca, In, Sn, and Zn). The parameters will be added to athermodynamic database for Mg alloys.
2. Thermodynamic models
In the present work, all the thermodynamic optimizations ofthe (Na + X) binary systems (X = Ag, Ca, In, Sn, and Zn) have beencarried out by means of the FactSage thermodynamic software[15]. The phases considered are listed in table 1, along with themodel used to describe their thermodynamic properties. The ther-modynamic parameters of the pure elements are the recom-mended SGTE values [16].
TABLE 1Binary phases considered in the present work in the (Na + X) binary systems (X = Ag, Ca, I
Phase Strukturbericht Prototype
Liquidfcc A1 Cubcc A2 Whcp A3 Mgbct A5 Sntet A6 InAg2Na C15 Cu2MgIn9Na5
InNa B32 NaTlInNa2
In5Na3
Na15Sn4 D86 Cu15Si4
NaSn3
Na9Sn4 Na9Sn4
Na4Sn3
bNaSnaNaSn NaPbNaSn2
NaSn3
NaSn4
NaSn6
NaZn13 D23 NaZn13
a MQM: Modified Quasichemical Model with Pair approximation [18]; CEF: Compound
2.1. Liquid phase
The thermodynamic properties of the liquid phase were mod-eled using the Modified Quasichemical Model in the Pair Approxi-mation (MQMPA) developed by Pelton et al. [17,18]. A detaileddescription of the MQMPA and its associated notation is given inRefs. [17,18]. The same notation is used in the present work, anda brief description of MQMPA is given as follows:
For the binary (A + B) system, the quasichemical pair exchangereaction can be considered:
ðA� AÞpair þ ðB� BÞpair ¼ 2ðA� BÞpair;DgAB; ð1Þ
where i� j pair represents a first-nearest-neighbour pair of atoms.The Gibbs energy change for the formation of one mole of ðA� BÞpairs according to Reaction (1) is DgAB=2. Let nA and nB be the num-ber of moles of A and B, nAA, nBB, and nAB be the number of moles ofA� A, B� B, and A� B pairs. ZA and ZB are the coordination numbersof A and B. Then the Gibbs energy of the solution is given by:
G ¼ ðnAG�A þ nBG�BÞ � TDSconfig þ ðnAB=2ÞDgAB; ð2Þ
where G�A and G�B are the molar Gibbs energies of the pure compo-nent A and B, and DSconfig is the configurational entropy of mixinggiven by randomly distributing the A� A, B� B and A� B pairs inthe one-dimensional Ising approximation. The expression forDSconfig is:
DSconfig ¼ �RðnA ln XA þ nB ln XBÞ
� R nAA lnXAA
Y2A
þ nBB lnXBB
Y2B
þ nAB lnXAB
2YAYB
!; ð3Þ
where XAA, XBB and XAB are the mole fractions of the A� A, B� B andA� B pairs respectively; YA and YB are the coordination-equivalentfractions of A and B:
Xij ¼nij
nAA þ nBB þ nABði; j ¼ A or BÞ; ð4Þ
Yi ¼Zini
ZAnA þ ZBnBði ¼ A or BÞ: ð5Þ
Moreover, the following elemental balance equations can bewritten:
n, Sn, and Zn).
Pearson symbol Space group Modela
MQMcF4 Fm�3m CEFcI2 Im�3m CEFhP2 P63=mmc CEFtI4 I41=amd CEFtI2 I4=mmm CEFcF24 Fd�3m CEF
STcF16 Fd�3m ST
STST
cI76 I4�3d STST
oC52 Cmcm STSTST
tI64 I41=acd STSTSTSTST
cF112 Fd�3m ST
Energy Formalism; ST: Stoichiometric compound.

24 J. Wang et al. / J. Chem. Thermodynamics 66 (2013) 22–33
ZAnA ¼ 2nAA þ nAB; ð6Þ
ZBnB ¼ 2nBB þ nAB: ð7Þ
It may be noted that there is no exact expression for the config-urational entropy in three dimensions. Although equation (3) isonly an approximate expression in three dimensions, it is exactone-dimensionally (when Z = 2) [18]. As explained in [18], one isforced by the approximate nature of equation (3) to use non-exactvalues for the coordination numbers in order to yield good fits be-tween the experimental data and calculated ones. The mathemat-ical approximation of the one-dimensional Ising model of equation(3) can be partially compensated by selecting values of ZA and ZB
which are smaller than the experimental values [19]. As is known,the MQMPA model is sensitive to the ratio of coordination num-bers, but less sensitive to their absolute values. From a practicalstandpoint for the development of large thermodynamic dat-abases, values of ZA and ZB of the order of 6 have been found nec-essary for the solutions with a small or medium degree of ordering(i.e., alloy solutions).
The DgAB is the model parameter to reproduce the Gibbs energyof the liquid phase of the A� B binary system, which is expandedas a polynomial in terms of the pair fractions, as follows:
DgAB ¼ Dg�AB þXiP1
gioABðXAAÞi þ
XjP1
gojABðXBBÞj; ð8Þ
where Dg�AA, gioAB and goj
AB are the adjustable model parameters whichcan be function of the temperature. The equilibrium state of the sys-tem is obtained by minimizing the total Gibbs energy at constantelemental composition, temperature and pressure. The equilibriumpair distribution is calculated by setting:
@G@nAB
� �nA ;nB
¼ 0: ð9Þ
This gives the ‘‘equilibrium constant’’ for the ‘‘quasichemicalpair reaction’’ of equation (1):
X2AB
XAAXBB¼ 4� exp �DgAB
RT
� �: ð10Þ
Moreover, the model permits ZA and ZB to vary with composi-tion as follows [18]:
1ZA¼ 1
ZAAA
2nAA
2nAA þ nAB
� �þ 1
ZAAB
nAB
2nAA þ nAB
� �; ð11Þ
1ZB¼ 1
ZBBB
2nBB
2nBB þ nAB
� �þ 1
ZBAB
nAB
2nBB þ nAB
� �; ð12Þ
where ZAAA and ZA
AB are the values of ZA when all nearest neighboursof an atom A are As, and when all nearest neighbours of an atom Aare Bs respectively; ZB
BB and ZBAB are defined similarly. The
TABLE 2Optimized model parameters of the MQM for the liquid phase on Na–X (X: Ag, Ca, In, Sn,
Coordination numbersa
i j Ziij Zj
ij
Ag Na 6 6
Ca Na 6 6
In Na 6 7.5
Sn Na 5.6 4.4
Zn Na 6 6
a For all pure elements (Na, Ag, Ca, In, Sn, and Zn), Zjij ¼ 6.
composition of maximum short-range ordering (SRO) is determinedby the ratio of the coordination numbers ZA
AB=ZBAB. The values of the
coordination numbers chosen in the present study are listed intable 2.
2.2. Solid solutions
The Compound Energy Formalism (CEF) was introduced by Hill-ert to describe the Gibbs energy of solid phases with sub-lattices,and ideal mixing on each sub-lattice is assumed [20]. In the presentwork, all solid solutions (hcp, bct, bcc and fcc) and the orderedintermetallic solutions in the (Na + X) binary systems (X = Ag, Ca,In, Sn, and Zn) were modeled with the CEF with their sublatticestoichiometry based on the reported crystal structures. Takingthe Ag2NaðcF24 Fd�3mÞ solution for example, its Gibbs energyexpression, based on the CEF, is obtained by mixing Ag and Na ontwo sublattices with a stoichiometry ratio of 2:1, as inðAg;NaÞ2ðAg;NaÞ. The Gibbs energy of the laves_C15 solution canbe expressed as:
GAg2Na ¼ yIAgyII
Na0GAg2Na
Ag:Na þ yIAgyII
Ag0GAg2Na
Ag:Ag þ yINayII
Na0GAg2Na
Na:Na
þ yINayII
Ag0GAg2Na
Na:Ag þ 2RTðyIAg ln yI
Ag þ yINa ln yI
NaÞ
þ RTðyIIAg ln yII
Ag þ yIINa ln yII
NaÞ þ yIAgyI
NayIIAg
nLAg;Na:Ag
þ yIAgyI
NayIINa
nLAg;Na:Na þ yIAgyII
AgyIINa
nLAg:Na;Na
þ yINayII
AgyIINa
nLNa:Ag;Na; ð13Þ
where yI� and yII
� are the site fractions of elements Ag or Na on thefirst and second sublattices, respectively. The values of 0GAg2Na
�:� rep-resent the Gibbs energies of the end-members of the Ag2Na solutionwhen the first and second sublattices are completely occupied byone of the four permutations of Ag and Na, in the laves_C15 struc-ture. LAg;Na:� and L�:Ag;Na are the second-nearest neighbour interactionparameters between Ag and Na when the other sublattice is fullyoccupied by either Na or Ag, and they can be expressed as linearfunctions of temperature:nLAg;Na:� ¼ an þ bnT; ð14Þ
and
nL�:Ag;Na ¼ a0n þ b0nT: ð15Þ
The parameters an, bn, a0n and b0n are in general evaluated byoptimisation of the assessed thermodynamic and phase equilib-rium data, but for the specific laves_C15 Ag2Na they were set as‘‘0’’ in the present work.
2.3. Stoichiometric phases
The molar Gibbs energies of pure elements and stoichiometricphases can be described by:
Zn) systems.
Gibbs energies of pair exchange reactions
DgAg;Na=ðJ �mol�1Þ ¼ �974:9� 1427:2XAgAg þ 7740:4XNaNa
DgCa;Na=ðJ �mol�1Þ ¼ 8075:1þ 2050:2XCaCa � 3138XNaNa
DgIn;Na=ðJ �mol�1Þ ¼ �9706:9þ 4:60ðT=KÞ þ ð2301:2� 0:628ðT=KÞÞXInInþð3556:4þ 3:347ðT=KÞÞXNaNa
DgNa;Sn=ðJ �mol�1Þ ¼ �21924:2þ 8:703ðT=KÞ þ ð1631:8� 0:460ðT=KÞÞXNaNaþð2175:7� 1:172ðT=KÞÞXSnSn
DgNa;Zn=ðJ �mol�1Þ ¼ 11338:6� 3:35ðT=KÞ þ ð4184� 5:02ðT=KÞÞXNaNaþð2092þ 1:26ðT=KÞÞXZnZn

TABLE 3Crystallographic data and calculated standard enthalpy of formation, DHf of solid phases occurring in the Na–X (X: Ag, Ca, In, Sn, Zn) systems.
Phase Pearson symbol Space group Lattice parameters/nm Reference DfH�/(kJ �mol-atom�1)
a b c FPC Calphad
Ag2Na cF24 Fd�3m 0.7923 0.7923 0.7923 [29] �10.55a �10.36a
0.8027 0.8027 0.8027 Present workInNa cF16 Fd�3m 0.7332 0.7332 0.7332 [29] �14.56a/�23.8b �15.44a
0.7460 0.7460 0.7460 Present workInNa2 oC48 C2221 1.3855 0.8836 1.1762 [29] �11.04a �10.52a
1.3944 0.8851 1.1741 Present workIn5Na3 [29] �17.03a
In9Na5 [29] �16.24a
NaZn13 cF112 Fd�3m 1.2836 1.2836 1.2836 [29] �3.25a �3.15a
1.2292 1.2292 1.2292 Present work
a Values of DfHo were calculated in this work using FPC (T = 0 K) and Calphad (T = 298.15 K) methods separately.
b Values of DfHo were calculated by Ozisik et al. [59] using FPC (T = 0 K) occurring in the (Na + X) binary systems (X = Ag, Ca, In, Sn, and Zn).
J. Wang et al. / J. Chem. Thermodynamics 66 (2013) 22–33 25
G�T ¼ H�T � TS�T ; ð16Þ
H�T ¼ DH�298:15K þZ T
298:15KCpdT; ð17Þ
S�T ¼ S�298:15K þZ T
298:15KðCp=TÞdT; ð18Þ
where DfHo
298.15K is the molar enthalpy of formation of a given spe-cies from pure elements (DH�298:15K of the stable element at 298.15 Kand 1 atm is assumed as 0 J mol�1; reference state), S�298:15K is themolar entropy at 298.15 K and Cp is the molar heat capacity. Asthere are no heat capacity experimentals of intermetallics, the heatcapacities were evaluated using Neumann–Kopp rule [21]. Bothheat capacities of solid In, Na and Sn from SGTE database showsmaximum just above their melting temperatures (that is in the li-quid stable region). Several intermetallic phases in the studied sys-tem have their melting temperature substantially higher that thepure elements they are formed from. The resultant heat capacitiesof intermetallic phases, from the Neumann–Kopp rule, had alsomaximum at about T = 506 K, which is not likely in reality. In orderto resolve this, we modified the heat capacities of solid In, Na and Snabove their melting temperature to make sure that the heat capac-ities of intermetallics can increase with temperatures until theirmelting temperatures (table 5). This is solely applied in the Neu-mann–Kopp rule, not for the pure elements. Hence, this proposedmodification does no influence the pure In, Na and Sn elements.
3. First-principles method of the calculations
First-principles total energy calculations were performed basedon density functional theory (DFT), in order to estimate the ther-modynamic properties of pure intermetallic phases. The projectoraugmented-wave (PAW) method [22–25] was used to solve theKohn–Sham equations. We employed the PAW pseudopotentialswith the following electronic configurations: Na 3s1, Ag 4d105s1,In 5s25p1 and Zn 3d104s2. The generalized gradient approximation(GGA) [26] and Perdew Burke Ernzerhof functional (PBE) [27] wereused for exchange correlation functions. The cutoff energy forplane wave basis set was 700 eV. The following k-points andMonkhorst–Pack (MP) scheme [28] were adopted as Brillouin Zonesampling: 12 � 12 � 12 for Na and Ag, 15 � 15 � 10 for In, 11 � 11 � 6for Zn, 6 � 6 � 6 for Ag2Na, 8 � 8 � 8 for InNa, 4 � 6 � 4 for InNa2, and2 � 2 � 2 for NaZn13. The relaxation convergences for ions and elec-trons were 1 � 10�5 eV and 1 � 10�6 eV, respectively. The initialcrystal structures have been built on the basis of the experimentalcrystallographic data and the optimized lattice parameters alongwith the compiled data from Pearson’s handbook [29] are summa-
rized in table 3. All the lattice parameters obtained in present workare in good agreement with the reported experimental data.
The total energy was calculated for the optimized crystal struc-tures. The formation energy Eform for a given crystal AxBy was ob-tained according to Eform = Etotal
(AxBy) � xEtotal(A) � yEtotal
(B), whereEtotal
(AxBy), Etotal(A) and Etotal
(B) were the total energy of AxBy, A andB crystals, respectively. The calculated heat of formation of thephases of Ag2NaðcF24 Fd�3mÞ, InNaðcF16 Fd�3mÞ,NaZn13ðcF112 Fd�3mÞ and InNa2ðoC48 C2221Þ at 0 K also are sum-marized in table 3.
4. Critical evaluation and thermodynamic optimization ofbinary systems
4.1. The (Na + Ag) system
Pelton [30] critically reviewed the reported experimental phaseequilibrium and thermodynamic data in the (Na + Ag) binary sys-tem. Only one intermetallic compound Ag2Na is reported [31].The Ag-liquidus curve was studied by Quercigh [32], Kienast andVerma [31], and Mathewson [33] with thermal analysis methods.There is a good agreement between the different data sets, exceptin the Ag-rich portion (> 75 at.% Ag) reported by Kienast and Verma[31], which are about (30–50) K higher than that of the two Refs.[32,33]. Pelton calculated that the experimental liquidus points ofKienast and Verma do not respect the theoretical limiting slopeof the liquidus in this region of composition [30]. At lower temper-atures (273 K to 550 K) the liquidus was determined by solubilitymeasurements by Lamprecht and Crowther [34] and for 373 K to823 K by Weeks [35]. Both reported dataset are in good agreement.The solubility of Na in fcc (Ag) was reported as 1 at.% by Mathew-son [33] using chemical analysis. But the author also reported thatthis value is most probably much too high, because of the presenceof mechanically entrained Na in the samples. The ratio of atomicradii of Ag and Na indicates that solid solubility should be very lim-ited. The X-ray study by Kienast and Verma [31] shows the exis-tence of a Ag2Na phase with the laves_C15 crystal structurewhich is similar to the Au2Na phase reported in the (Au + Na) bin-ary system [36]. The temperature of the peritectic reactionliquidþ fcc$ Ag2Na was reported as 595.15 K by Kienast and Ver-ma [31] using thermal arrest observations. There is no experimen-tal data reported on the thermodynamic properties of the liquidphase or of the Ag2Na compound.
All the experimental data discussed above were taken into ac-count in the present thermodynamic optimization. The enthalpyof formation of Ag2Na phase at T = 0 K was calculated by first-prin-ciples calculations and is used in present work (table 3).

T /
K
Ag 0.2 0.4 0.6 0.8 Na
Liquid
Ag
Na
T=595K
T=371K
2
T=1013K
400
500
600
700
800
900
1000
1100
1200
1300
x(Na)
FIGURE 1. Calculated (Ag + Na) phase diagram system. Experimental data are fromKienast and Verma [31] (s), Quercigh [32] (h), and Mathewson [33] (4).
1
3
5
7ideal mixingpresent calculation
x(Na)
Ent
ropy
of
mix
ing
/ J·m
ol ·
K
Ag 0.2 0.4 0.6 0.8 Na
2
4
6
8
-1-1
FIGURE 2. Calculated entropy of mixing of the (Na + Ag) binary liquid at T = 1273 K.
x(Na)Ca Na
716K
371K
983Kbcc
fcc
Liquid#1+Liquid#2
Liquid
1434K
bcc
0.2 0.4 0.6 0.8300
500
700
900
1100
1300
1500
T /
K
FIGURE 3. Calculated (Na + Ca) phase diagram. Experimental data are from Rincket al. [42] (s).
x(Na)Ca 0.2 0.4 0.6 0.8 Na
ideal mixingpresent calculation
2
4
6
8
1
3
5
7Zhang et al. [45]
Ent
ropy
of
mix
ing
/ J ·K
·mol
-1
-1
FIGURE 4. Calculated entropy of mixing of the (Ca + Na) binary liquid at T = 1473 K.
Liquid
tet(In)
434K
717K
620K
369K
In5N
a3
InN
a
InN
a2
523K
686K
In9N
a5
T /
K
400
500
600
700
800
26 J. Wang et al. / J. Chem. Thermodynamics 66 (2013) 22–33
The calculated phase diagram of the (Na + Ag) system is shownin figure 1, compared with the reported experimental data [31–33].As discussed above, it was considered not necessary to use com-plex thermodynamic functions to fit the disputable experimentaldata of Kienast and Verma [31] in the range of Na contents below25 at.%. The metastable misciblility gap of the liquid phase at lowtemperature was also calculated by using present optimized ther-modynamic parameters as shown in figure 1. The calculated conso-lute temperature of the metastable miscibility gap of the liquid isat T = 1013 K and 41.73 at.% Ag (the consolute point of the(Na + Cu) liquid miscibility gap is above 1273 K [37] – note thatthe (Na + Au) binary system has 3 stable compounds [36]). Thestoichiometric compound Ag2Na was modelled using a two-sublat-tice model (Ag,Na)2(Ag,Na) based on its reported crystal structure(laves_C15) [38]. The temperature of the peritectic reactionliquidþ fcc$ Ag2Na is calculated at T = 595.15 K as reported byKienast and Verma [31]. The calculated entropy of mixing of the li-quid phase at 1273 K along with the ideal entropy mixing curves isshown in figure 2. The optimized thermodynamic parameters ofthe present study are summarized in tables 2 and 4.
x(Na)0.2 0.4 0.6 0.8 NaIn
bcc(Na)
FIGURE 5. Calculated (In + Na) phase diagram. Experimental data are from Heber-lein [45] (e), Davies [46] (5), Lamprecht and Crowther [47] (4 thermal analysisand N solubility measurement), Thummel and Klemm [48] (h), Neething [49] (ssolubility measurement and d thermal analysis).
4.2. The (Na + Ca) system
The (Na + Ca) system was first studied by Muthmann et al. [39],and Lorenz and Winzer [40,41]. Later Rinck et al. [42] determinedthe limits of the miscibility gap of the liquid phase via the reaction
Ca + 2NaCl = CaCl2 + 2Na at various temperatures. The liquiduscurves and the temperature of the monotectic reaction were alsomeasured using thermal analysis techniques. The reported valueof the melting temperature of Ca as 1082.15 K (instead of1115.15 K) by Lorenz and Winzer [40,41] suggests that there wassome contamination in their samples, therefore the liquidus datareported by Rinck et al. [42] are considered more reliable. Thus,

x(Na)In 0.2 0.4 0.6 0.8 Na
T=773 K
T=723K
Ent
halp
y of
mix
ing
/ kJ·
mol
-1
-9
-8
-7
-6
-5
-4
-3
-2
-1
0
FIGURE 7. Calculated entropy mixing of (In + Na) binary liquid at temperatures723 K and 773 K. Experimental data are from Iwasw et al. [52] (h T = 728 K),Kleinsteuber [53] ( T = 773 K), Rais et al. [54] (N T = 773 K) and (4 T = 723 K),Bartleett et al. [55] (+ T = 713 K), Morachevskii et al. [56] (e T = 850 K), Maiorovaand Morachevskii [57] (5 T = 800 K), Bushmanov and Yatsenko [58] (� T = 773 K).
J. Wang et al. / J. Chem. Thermodynamics 66 (2013) 22–33 27
Pelton [43] evaluated the (Na + Ca) phase diagram mainly based onthe experimental data of Rinck et al. [42]. There is no reportedexperimental thermodynamic properties data on the (Na + Ca) bin-ary system. The (Na + Ca) binary system was thermodynamic opti-mized by Zhang et al. [44] with Bragg–Williams random mixingapproximation model for the liquid phase.
The optimized phase diagram of the (Na + Ca) system of thepresent work, compared with reported experimental data, isshown in figure 3. The calculated monotectic reaction temperatureis 983.15 K with the compostions of the two liquids in equilibriumbeing 22.5 and 96.5 at.% Na, which is in a good agreement with theexperimental data of 22.1 and 95.9 at.% Na at 983.15 K as reportedby Rinck et al. [42]. The calculated maximum solubility of Na in bccCa is 8.0 at.% in comparison with the value of 7.5 at.% reported byPelton [43] by analysis of the limiting slopes of the calcium liqui-dus. In the present work, the calculated maximum temperatureof the liquid miscibility gap is 1433 K at 69 at.% Na. The calculatedentropy of mixing of the liquid phase at T = 1473 K is shown in fig-ure 4 along with the calculated entropy of mixing calculated withan ideal solution model and the model proposed by Zhang et al.[44]. The entropy of mixing proposed by Zhang et al. [44] is sub-stantially larger than the ideal solution entropy, which is dubiousfor this relatively simple system (see in figure 4). All the optimizedthermodynamic parameters of the present study are summarizedin tables 2 and 4.
4.3. The (Na + In) system
Phase equilibria of (Na + In) binary system in the composition of0–51 at.% Na region was investigated by Heberlein [45] using ther-mal analysis and metallographic techniques. The temperature ofthe peritectic reaction Liquidþ In8Na5 $ tetðInÞ was reported at433.15 K. The solubility of In in liquid Na was measured by Davies[46] by using thermal analysis. The same author also reportedthat the temperature of the the eutectic reactionLiquid$ bccðNaÞ þ InNa is 368.15 K. Phase equilibria over the com-plete composition range was investigated by Lamprecht and Crow-ther [47], Thummel and Klemm [48], and Neething [49] usingthermal analysis and X-ray methods. The shape of the liquiduscurve in the Na-rich region (up to 90 at.% Na) reported by Lampr-echt and Crowther [47] is very close a straight line, and similar re-sults were also reported by Davies [46]. Davies [46] and Neething[49] reported that the temperature of the peritectic reactionLiquidþ In8Na5 $ tetðInÞ is 428.15 K, while the eutectic reaction
x(Na)In 0.2 0.4 0.6 0.8 Na
T=773 K
T=723 K
-2.0
-1.0
0
1.0
2.0
3.0
4.0
5.0
6.0
ideal mixingpresent calculation
Ent
ropy
of
mix
ing
/ J ·K
·mol
-1
-1
FIGURE 6. Calculated entropy mixing of (In + Na) binary liquid at temperatures723 K and 773 K. Experimental data are from Iwasw et al. [52] (h T = 728 K), Raiset al. [54] (N T = 773 K and 4 T = 723 K), Bartleett et al. [55] (+ T = 713 K),Morachevskii et al. [56] (e T = 850 K), Maiorova and Morachevskii [57] (5T = 800 K).
Liquid$ tetðInÞ þ In8Na5 was rather reported by Lamprecht andCrowther [47]. A stoichiometric compound with a congrunentmelting point at 713.15 K was reported by Lamprecht and Crow-ther [47] with the formula of In3Na2. But later Thummel andKlemm [48] proved that the formula of this compound is ratherIn8Na5 using a X-ray method. The compound InNa was studiedby Thummel and Klemm [48] using a X-ray method. The tempera-ture of the peritectic reaction Liquidþ In8Na5 $ NaIn was reportedto be about (618 ± 5) K by Lamprecht and Crowther [47], and byThummel and Klemm [48]. A third compound was reported byLamprecht and Crowther [47] with the formula InNa3, and byThummel and Klemm [48] with the formula of InNa2, based onthe thermal measurenent and crystal analysis results in the Na-richportion. Because of the controversy among the reported results[45–49], especially for the existence of the compound InNa2, Sevovand Corbett [50] reinvestigated the (Na + In) system experimen-tally by using X-ray and electrical resistivity techniques: four com-pounds with the compositions In27.4Na15, InNa, and In11.8Na7 werereported. The assessed phase diagram of the (In + Na) system wasmodified by Sevov and Corbett [50] based on the compilation ofLarose and Pelton [51] the compound In3Na2 (or In8Na5) was re-placed by two different compounds with the following stoichiom-etry In27.4Na15 and In11.8Na7. In the present work the chemicalformula In9Na5 and In5Na3 were used for the thermodynamic
-6
-4
-2
In 0.2 0.4 0.6 0.8 Na
ln (
), (
liqui
d st
anda
rd s
tate
s)
-8
0
(Na) (T=723 K)
(Na) (T=850 K)
x(Na)
і
FIGURE 8. Calculated activities of In and Na (liquid standard states) in (In + Na)binary liquid at temperatures 723 K and 850 K. Experimental are from Iwasw et al.[52] (h T = 728 K), Rais et al. [54] (N T = 773 K) and (4 T = 723 K), Bartleett et al. [55](+ T = 713 K), Morachevskii et al. [56] (e T = 850 K), Maiorova and Morachevskii [57](5 T = 800 K).

TABLE 4Optimized parameters of solid solutions Na–X (X: Ag, Ca, In, Sn, Zn) systems.
Ag2Na phase, ðAg;NaÞ2ðAg;NaÞ:
GAg:Ag=ðJ �mol�1Þ ¼ 3� 0GfccAg þ 45000:0; GNa:Na=ðJ �mol�1Þ ¼ 3� 0Gbcc
Na þ 45000:0
GNa:Ag=ðJ �mol�1Þ ¼ 2� 0GbccNa þ 0Gfcc
Ag þ 45000:0; GAg:Na=ðJ �mol�1Þ ¼ 2� 0GfccAg þ 0Gbcc
Na � 31380:0þ 50:21ðT=KÞ
fcc A1 phase, ðAg;Ca; In;Na; Sn; ZnÞðVaÞ3:
GAg:Va=ðJ �mol�1Þ ¼ 0GfccAg ; GCa:Va=ðJ �mol�1Þ ¼ 0Gfcc
Ca ; GNa:Va=ðJ �mol�1Þ ¼ 0GbccNa � 50:0þ 1:30ðT=KÞ
GIn:Va=ðJ �mol�1Þ ¼ 0GtetIn þ 123:0� 0:30ðT=KÞ; GSn:Va=ðJ �mol�1Þ ¼ 0Gbct
Sn þ 4150:0� 5:20ðT=KÞGZn:Va=ðJ �mol�1Þ ¼ 0Ghcp Zn
Zn þ 2969:8þ 1:57ðT=KÞ;LAg;Na:Va=ðJ �mol�1Þ ¼ 46024:0; LCa;Na:Va=ðJ �mol�1Þ ¼ 20920:0; LZn;Na:Va=ðJ �mol�1Þ ¼ 20920:0
bcc A2 phase, ðAg;Ca; In;Na; Sn; ZnÞðVaÞ3:
GAg:Va=ðJ �mol�1Þ ¼ 0GfccAg þ 3400:0þ 1:05ðT=KÞ; GCa:Va=ðJ �mol�1Þ ¼ 0Gfcc
Ca þ 1405:0þ 2:25ðT=KÞ
GNa:Va=ðJ �mol�1Þ ¼ 0GbccNa ; GIn:Va=ðJ �mol�1Þ ¼ 0Gtet
In þ 800:0� 0:80ðT=KÞ;GSn:Va=ðJ �mol�1Þ ¼ 0Gbct
Sn þ 4400:0� 6:00ðT=KÞ; GZn:Va=ðJ �mol�1Þ ¼ 0Ghcp ZnZn þ 2886:0� 2:50ðT=KÞ
LAg;Na:Va=ðJ �mol�1Þ ¼ 20920:0; LCa;Na:Va=ðJ �mol�1Þ ¼ 29330:0� 10:50ðT=KÞ; LZn;Na:Va=ðJ �mol�1Þ ¼ 20920:0
tet A6 phase, ðAg;Ca; In;Na; Sn; ZnÞðVaÞ3:
GAg:Va=ðJ �mol�1Þ ¼ 0GfccAg þ 15000:0; GCa:Va=ðJ �mol�1Þ ¼ 0Gfcc
Ca þ 15000:0
GNa:Va=ðJ �mol�1Þ ¼ 0GbccNa þ 50208:0; GIn:Va=ðJ �mol�1Þ ¼ 0Gtet
In
GSn:Va=ðJ �mol�1Þ ¼ 0GbctSn þ 5388:0� 8:25ðT=KÞ; GZn:Va=ðJ �mol�1Þ ¼ 0Ghcp Zn
Zn þ 17505:00LIn;Na:Va=ðJ �mol�1Þ¼ �103428:0; 1LIn;Na:Va=ðJ �mol�1Þ ¼ �29706:0
LZn;Na:Va=ðJ �mol�1Þ ¼ 20920:0
hcp A3ðZnÞ phase, ðAg;Ca; In;Na; Sn; ZnÞðVaÞ3:
GAg:Va=ðJ �mol�1Þ ¼ 0GfccAg þ 2000:0; GCa:Va=ðJ �mol�1Þ ¼ 0Gfcc
Ca þ 2000:0
GNa:Va=ðJ �mol�1Þ ¼ 0GbccNa þ 2000:0; GIn:Va=ðJ �mol�1Þ ¼ 0Gtet
In þ 2000:0
GSn:Va=ðJ �mol�1Þ ¼ 0GbctSn þ 2000:0; GZn:Va=ðJ �mol�1Þ ¼ 0Ghcp Zn
Zn
LZn;Na:Va=ðJ �mol�1Þ ¼ 10000:0
28 J. Wang et al. / J. Chem. Thermodynamics 66 (2013) 22–33
modelling of the ‘‘In27.4Na15’’ and ‘‘In11.8Na7’’ phases reported bySevov and Corbett [50].
The activity of Na in liquid (In + Na) alloys has been measuredby many investigators [52–57] using EMF techniques: all the re-ported data are in good agreement. The enthalpies and entropiesof mixing, obtained from the temperature dependence of the elec-tromotive force (EMF), are also in good agreement. The enthalpy ofmixing of the liquid phase was also measured by Kleinsteuber [53]and by Bushmanov and Yatsenko [58] using differential scanningmicrocalorimeters at T = 773 K. Their reported data are also in goodagreement with the results derived from electromotive forces(EMF). The isothermal enthalpy of mixing curve shows a ‘‘V’’-shapewith a minima near (40 to 50) at.% Na. The isothermal entropy ofmixing curve exhibits a ‘‘m’’-shape with a minimum near theame composition, all of which indicate a tendency to ordering inthe liquid phase around this compostion range. Accordingly, inthe present work the coordination numbers of In and Na in themelt were set to ZIn
InNa ¼ 6 and ZNaInNa ¼ 7:5 (table 2) in order to fix
the maximum ordering composition near 44 at.% Na. No
experimental thermodynamic data were reported for the solidphases. The enthalpy formation of InNa was calculated by Ozisiket al. [59] by using First-Principles calculations.
The calculated phase diagram of the (Na + In) system is shownin figure 5 along with the reported experimental data [45–49].According to the results of Ozisika et al. [59], InNa2 is stable fromroom temperature to about 513 K. The compound InNa2 is calcu-lated to decompose peritectically at 523.15 K in the present work.The calculated curves for the entropies of mixing of liquid (Na + In)alloys at 723.15 K and 773.15 K are presented in figure 6 with thereported experimental points derived from the temperaturedependance of emf measurements. The curves show the classic‘‘m’’-shape associated to short-range order with a minimum entro-py value near 45 at.% Na. At the same composition, a clear mini-mum appears in the enthalpy of mixing curve, as shown in figure7. The calculated curves for the activity of Na and In (reference: li-quid (Na) and liquid (In)) in liquid (In + Na) alloys at different tem-peratures are shown in figure 8 along with the reportedmeasurements using EMF techniques. The calculated enthalpies

TABLE 5Optimized parameters of stoichiometric compounds of Na–X (X: Ag, Ca, In, Sn, Zn) systems.
Compound DH�
298K /(kJ �mol�1) S�
298K /(J � K�1 �mol�1) Cp /(J � K�1 �mol�1)
In9Na5 � 227.104 660.742 CIn9 Na5p ¼ 9� �CpðInÞ þ 5� �CpðNaÞ
In5Na3 �136.957 369.028 CIn5 Na3p ¼ 5� �CpðInÞ þ 3� �CpðNaÞ
InNa �30.958 91.703 CInNap ¼ �CpðInÞ þ �CpðNaÞ
InNa2 �31.638 144.250 CInNa2p ¼ �CpðInÞ þ 2� �CpðNaÞ
Na15Sn4 �298.210 903.198 CNa15 Sn4p ¼ 4� �CpðSnÞ þ 15� �CpðNaÞ
Na3Sn �71.804 187.185 CNa3 Snp ¼ �CpðSnÞ þ 3� �CpðNaÞ
Na9Sn4 �276.211 594.299 CNa4 Sn9p ¼ 4� �CpðSnÞ þ 9� �CpðNaÞ
Na4Sn3 �156.992 331.224 CNa4 Sn3p ¼ 3� �CpðSnÞ þ 4� �CpðNaÞ
bNaSn �52.080 92.545 CbNaSnp ¼ �CpðSnÞ þ �CpðNaÞ
aNaSn �48.080 92.545 CaNaSnp ¼ �CpðSnÞ þ �CpðNaÞ
NaSn2 �52.970 141.249 CNaSn2p ¼ 2� �CpðSnÞ þ �CpðNaÞ
NaSn3 �51.900 197.574 CNaSn3p ¼ 3� �CpðSnÞ þ �CpðNaÞ
NaSn4 �51.960 249.059 CNaSn4p ¼ 4� �CpðSnÞ þ �CpðNaÞ
NaSn6 �51.753 352.308 CNaSn6p ¼ 6� �CpðSnÞ þ �CpðNaÞ
NaZn13 �44.108 571.090 CNaZn13p ¼ 13� CpðZn;hcpÞ þ �CpðNaÞ
�CpðNaÞ= J � K�1 �mol�1� �
¼ 51:0393608� 0:144613266 T=Kð Þ � 264308 T=Kð Þ�2 þ 0:000261829698 T=Kð Þ2; 200 K < T < 370:87 K¼ 36:02� 0:0003196 T=Kð Þ � 647000� T=Kð Þ�2 þ 3:908� 10�8ðT=KÞ2; 370:88 K < T < 2300 K:
�CpðInÞ= J � K�1 �mol�1� �
¼ 21:8386þ 0:01145132 T=Kð Þ þ 45812 T=Kð Þ�2 þ 1:2721926� 10�5 T=Kð Þ2; 298 K < T < 429:78 K¼ 31:05� 0:0001919 T=Kð Þ � 312000 T=Kð Þ�2 þ 3:374� 10�8 T=Kð Þ2 429:79 K < T < 38000 K.
�Cp SnÞ=ðJ � K�1 �mol�1� �
¼ 25:858� 0:0010237 T=Kð Þ � 36880 T=Kð Þ�2 þ 1:9156602� 10�5 T=Kð Þ2; 249 K < T < 250 K¼ 15:961þ 0:0377404 T=Kð Þ þ 123920 T=Kð Þ�2 � 1:8727002� 10�5 T=Kð Þ2; 251 K < T < 1000 K¼ 35:098; 1000 K < T < 3000 K.
J. Wang et al. / J. Chem. Thermodynamics 66 (2013) 22–33 29
of formation for the solid phases at 298.15 K are shown in figure 9and table 3 compared the estimations from first-principlescalculations. All the optimized thermodynamic parameters of thepresent study are summarized in tables 2, 4 and 5.
4.4. The (Na + Sn) system
Mathewson [60] studied phase equilibria in the (Na + Sn) binarysystem over the entire composition range using thermal analysisand microscopic methods. Five compounds were reported: Na4Sn,Na2Sn, Na4Sn3, NaSn, and NaSn2. Hume-Rothery [61] re-investi-gated the phase equilibria in the (Na + Sn) system for the wholecomposition range using thermal and optical microscope methods:four more compounds were identified, namely Na3Sn, NaSn3,NaSn4, and NaSn6. The melting temperature of Na2Sn and NaSnwas reported [61] at 751.15 K and 851.15 K respectively, in goodagreement with Mathewson’s results [60] (750.15 K and849.15 K). According to the thermal analysis results by Hume-Rothery [61], the compound Na4Sn3 is melting incongruently at751.15 K and decomposes at 630.15 K. However, this compoundswas reported to be stable from 751.15 K down to room tempera-ture by Mathewson [60]. The solubility of Sn in liquid Na has beendetermined by Lamprecht et al. [62] over the temperature range(373 to 533) K by radiochemical analysis, and by Hubberstey [63]and Hubbberstey and Pulham [64] using EMF, thermal analysisand resistance measurement methods. Their results [62–64] arein good agreement. The reported maximum solubility of Sn inbcc (Na) and of Na in bct (Sn) are less than 0.01 atomic percent[65]. The compounds Na4Sn and Na2Sn reported in the work ofMathewson [60] and Hume-Rothery [61] were characterized asNa15Sn4 [66–68] and Na9Sn4 [67,68] by using single-crystal andX-ray methods.
The thermodynamic properties of (Na + Sn) molten alloys weredetermined by EMF measurements by several authors. Hauffe andVierk [69] measured the activity of Na in liquid (Na + Sn) alloys atT = 753 K. Delimars and Konomuu [70] reported the activities at773 K. The activity of Na in liquid phase at 873 K were studiedby Morachevskii and Lantratov [71], who derived from their EMF
measurements the enthalpy mixing of the liquid at 873 K. Thetemperature dependence of the EMF related to the activity of Nain the liquid was determined between 623 K and 773 K by Yuanand Kroger [72], who also reported the enthalpy of formation ofthe compound NaSn as –(25 ± 1.6) kJ �mol-atom�1. Hubberstey[63] measured and calculated the thermodynamic properties of di-lute liquid (Na + Sn) alloys between 573 K and 773 K. Maiorova andMorachevskii [57] reported the thermodynamic properties ofdilute sodium solutions in molten Sn at 800 K. Rivier and Pelton[73] measured the activity of Na using a EMF tenchnique in liquid(Na + Sn) alloys in the compostition range (0 to 30) at.% Na from523 K to 723 K. The derived enthalpy mixing, Gibbs energy and en-tropy mixing of liquid (Na + Sn) alloys were reported by Rais et al.[54] at 773 K and 856 K, by Tamaki et al. [74] at 673 K and 873 K,and by Alqasmi and Egan [75] at 1073 K based on their EMF mea-surements. The thermodynamic properties of liquid (Na + Sn) al-loys were studied by Saboungi and Corbin [76], Itho and Kozuka[77], and Fang and Wendt [78], using EMF techniques with thebeta-alumuina cell. The enthalpy of mixing of liquid (Na + Sn) al-loys were measured by direct calorimetry at 773 K [53] and at883 K [79]. The reported enthalpy of mixing data for liquid(Na + Sn) alloys, obtained either by EMF methods or by calorimet-ric methods, are in relatively good agreement considering theexperimental errors (figure 11). The enthalpy of formation of thesolid compounds were determined by direct calorimetry atT = 298.15 K [80] and by solution calorimetry at the same temper-ature by Biltz [81], and Biltz and Holverscheit [82]. Later Mckissonand Bromley [79] measured the heat of formation of the binarycompounds using a high-temperature calorimeter. A complete re-view of the (Na + Sn) phase diagram data was published by Sang-ster and Bale [83].
The local structure of liquid (Na + Sn) alloys has been studied byseveral investigators both theoretically and experimentally[54,72,74,78,84]. All the reported results show that there is a highdegree of short-range ordering near the composition (42 to 45) at.%Na. This behaviour is also evidence by the composition of the min-imum in the entropy of mixing and the enthalpy of mixing curvesfor the liquid phase.

x(Na)
Ent
halp
y of
for
mat
ion
/ kJ·
mol
-ato
m
0.2 0.4 0.6 0.8
-8
-4
0
In Na
-16
-12
InNa2
InNa
In5Na3In9Na5
-1
FIGURE 9. Calculated enthalpy of formation of (In + Na) binary alloys atT = 298.15 K. First-principles calculations from this work (d) and Ozisik et al. [59](s).
-20
-15
-10
-5
0
Na 0.2 0.4 0.6 0.8x(Sn)
T=773 K
T=856 KEnt
halp
y of
mix
ing
/ kJ·
mol
-1
Sn
FIGURE 11. Calculated mixing of enthalpy of (Na + Sn) binary liquid at tempera-tures 773 K and 856 K. Experimental data are from Kleinsteuber [53] (d T = 773 K),and Rais et al. [54] (s T = 856 K and � T = 773 K).
Na 0.2 0.4 0.6 0.8x(Sn)
-4
-2
2
4
6
0
ideal mixingpresent calculation
T=773K
T=856K
Sn
Ent
ropy
of
mix
ing
/ J ·K
·mol
-1
-1
FIGURE 10. Calculated mixing of entropy of (Na + Sn) binary liquid at temperatures773 K and 856 K. Experimental data are from Rais et al. [54] (h T = 856 K and s
T = 773 K).
-20
-15
-10
-5
Na 0.2 0.4 0.6 0.8x(Sn)
Gib
bs e
nerg
y of
mix
ing
/ kJ·
mol
-ato
m
T=856 K T=773 K
-1
0
Sn
FIGURE 12. Calculated Gibbs energy of mixing of (Na + Sn) binary liquid attemperatures 773 K and 856 K. Experimental data are from Rais et al. [54] (s
T = 856 K and � T = 773 K).
T /
K851K
756 K
750 K
628 K
707 K
753 K
680 K
650 K
370 K
582 K
562 K
501 K
491 K
αN
aSn
βNaS
n
Na4
Sn3
NaS
n2
NaS
n3
NaS
n4
NaS
n 6
Na9
Sn4
Na3
Sn
Na 1
5Sn 4
bcc
Liquid
bct
400
500
600
700
800
900
Na 0.2 0.4 0.6 0.8x(Sn)
Sn
FIGURE 13. Calculated (Sn + Na) phase diagram. Experimental data are fromMathewson [60] (thermal analysis s), Hume-Rothery [61] (thermal analysis 5),Lamprecht et al. [62] (thermal analysis 4), Hubberstey [63] (resistance measure-ment j), Hubberstey and Pulham [64] (radiochemical analysis h).
x(Na)=0.75x(Na)=0.80x(Na)=0.85x(Na)=0.90
T/K500 600 700 800 900 1000
-10
-8
-6
-4
-2
0
2
x(Na)=0.10
x(Na)=0.05
x(Na)=0.17x(Na)=0.26x(Na)=0.35x(Na)=0.44
x(Na)=0.50
x(Na)=0.57
x(Na)=0.65
ln (�
),
(liq
uid
stan
dard
sta
te)
Na
FIGURE 14. Calculated activity of Na (liquid standard state) in the (Na + Sn) binaryliquid versus (T/K). Experimental data are from Tamaki et al. [74] (s x = 0.05 Na, h
x = 0.10 Na, 4 x = 0.17 Na, 5 x = 0.26 Na, e x = 0.35 Na, + x = 0.44 Na, x = 0.50 Na,� x = 0.57 Na, d x = 0.65 Na, j x = 0.75 Na, N x = 0.80 Na, 5 x = 0.85 Na, � x = 0.90Na).
30 J. Wang et al. / J. Chem. Thermodynamics 66 (2013) 22–33
In the present work, the coordination numbers of Na and Sn inthe liquid solution were set based on the the maximumshort-range ordering (SRO) composition of 43 at.% Na: ZSn
SnNa ¼ 5:7and ZNa
SnNa ¼ 4:3 (table 2). The calculated enthalpy and entropy ofmixing curves for the liquid solution at 773 K and 856 K with the
Na 0.2 0.4 0.6 0.8 Sn x(Sn)
-12
-10
-8
-6
-4
-2
0
T=773 K
T=728 K
T=673 K
T=873 K
T=1123 KT=1073 K
T=1026 K
T=633 K
T=573 K
ln (
),
(liq
uid
stan
dard
sta
te)
Na
FIGURE 15. Calculated activity of Na (liquid standard state) in the (Na + Sn) binaryliquid for the temperature range from 573 K to 1123 K. Experimental data are fromRais et al. [54] ( f T = 773 K and j T = 856 K), Maiorova and Morachevskii [57] (gT = 800 K), Hauffe and Vierk [69] (� T = 753 K), Delimarskii and Konomuu [70] (sT = 773 K), Morachevskii and Lantratov [71] (h T = 873 K), Yuan and Kroger [72] ( gT = 773 K), Rivier and Pelton [73] ( T = 633 K), Alqasmi and Egan [75] (.T = 1123 K, N T = 1073 K, and 4 T = 1026 K), Saboungi and Corbin [76] (dT = 673 K, + T = 573 K), Itoh and Kozuka [77] (e T = 628 K).
Liquid#1 + Liquid#2
Liquid
x(Zn)Na 0.2 0.4 0.6 0.8 Zn
Zn1
3Na
830 K
693 K
Calculated metastable miscibility gap
T /
K
400
500
600
700
800
900
1000
1100
1200
371 K
1107 K
FIGURE 17. Calculated (Na + Zn) phase diagram. Experimental data are fromMathewson [85] (s thermal analysis and optical micorgraphy), Morachevskiiet al. [87] (4 EMF), Cetin and Ross [88] (5 thermal analysis), Hausler [89] (hthermal analysis).
J. Wang et al. / J. Chem. Thermodynamics 66 (2013) 22–33 31
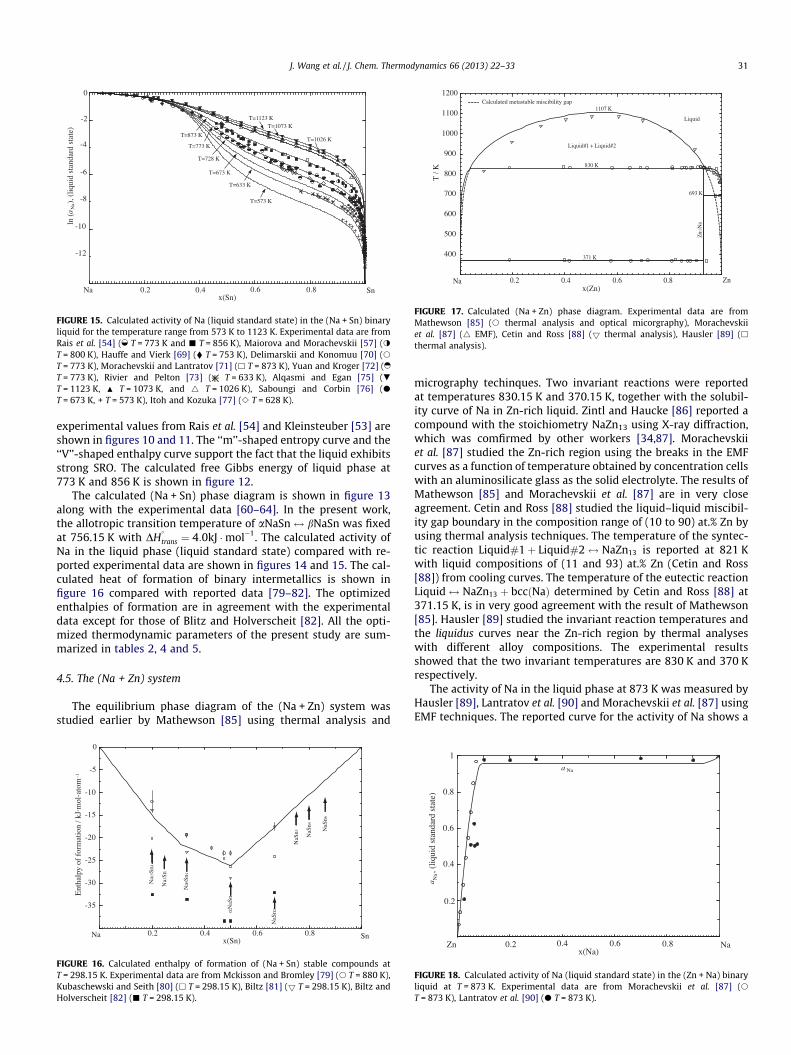
experimental values from Rais et al. [54] and Kleinsteuber [53] areshown in figures 10 and 11. The ‘‘m’’-shaped entropy curve and the‘‘V’’-shaped enthalpy curve support the fact that the liquid exhibitsstrong SRO. The calculated free Gibbs energy of liquid phase at773 K and 856 K is shown in figure 12.
The calculated (Na + Sn) phase diagram is shown in figure 13along with the experimental data [60–64]. In the present work,the allotropic transition temperature of aNaSn$ bNaSn was fixedat 756.15 K with DH
�
trans ¼ 4:0kJ �mol�1. The calculated activity ofNa in the liquid phase (liquid standard state) compared with re-ported experimental data are shown in figures 14 and 15. The cal-culated heat of formation of binary intermetallics is shown infigure 16 compared with reported data [79–82]. The optimizedenthalpies of formation are in agreement with the experimentaldata except for those of Blitz and Holverscheit [82]. All the opti-mized thermodynamic parameters of the present study are sum-marized in tables 2, 4 and 5.
4.5. The (Na + Zn) system
The equilibrium phase diagram of the (Na + Zn) system wasstudied earlier by Mathewson [85] using thermal analysis and
-35
-30
-25
-20
-15
-10
-5
0
Na 0.2 0.4 0.6 0.8x(Sn)
αN
aSn
NaS
n2
NaS
n3 NaS
n4
NaS
n 6
Na9
Sn4
Na3
Sn
Na 1
5Sn4
Sn
Ent
halp
y of
for
mat
ion
/ kJ·
mol
-ato
m-1
FIGURE 16. Calculated enthalpy of formation of (Na + Sn) stable compounds atT = 298.15 K. Experimental data are from Mckisson and Bromley [79] (s T = 880 K),Kubaschewski and Seith [80] (h T = 298.15 K), Biltz [81] (5 T = 298.15 K), Biltz andHolverscheit [82] (j T = 298.15 K).
micrography techinques. Two invariant reactions were reportedat temperatures 830.15 K and 370.15 K, together with the solubil-ity curve of Na in Zn-rich liquid. Zintl and Haucke [86] reported acompound with the stoichiometry NaZn13 using X-ray diffraction,which was comfirmed by other workers [34,87]. Morachevskiiet al. [87] studied the Zn-rich region using the breaks in the EMFcurves as a function of temperature obtained by concentration cellswith an aluminosilicate glass as the solid electrolyte. The results ofMathewson [85] and Morachevskii et al. [87] are in very closeagreement. Cetin and Ross [88] studied the liquid–liquid miscibil-ity gap boundary in the composition range of (10 to 90) at.% Zn byusing thermal analysis techniques. The temperature of the syntec-tic reaction Liquid#1þ Liquid#2$ NaZn13 is reported at 821 Kwith liquid compositions of (11 and 93) at.% Zn (Cetin and Ross[88]) from cooling curves. The temperature of the eutectic reactionLiquid$ NaZn13 þ bccðNaÞ determined by Cetin and Ross [88] at371.15 K, is in very good agreement with the result of Mathewson[85]. Hausler [89] studied the invariant reaction temperatures andthe liquidus curves near the Zn-rich region by thermal analyseswith different alloy compositions. The experimental resultsshowed that the two invariant temperatures are 830 K and 370 Krespectively.
The activity of Na in the liquid phase at 873 K was measured byHausler [89], Lantratov et al. [90] and Morachevskii et al. [87] usingEMF techniques. The reported curve for the activity of Na shows a
Zn 0.2 0.4 0.6 0.8 Na
0.2
0.4
0.6
0.8
1
x(Na)
,
(liq
uid
stan
dard
sta
te)
Na
Na
FIGURE 18. Calculated activity of Na (liquid standard state) in the (Zn + Na) binaryliquid at T = 873 K. Experimental data are from Morachevskii et al. [87] (s
T = 873 K), Lantratov et al. [90] (d T = 873 K).

X 0.2 0.4 0.6 0.8 Na
0.2
0.4
0.6
0.8
FNN
bon
d fr
actio
ns o
f liq
uid
solu
tions
Na-InNa-Sn
Na-Na pair
Sn-Sn pair Na-Sn pair
Na-In pair
In-In pair
x(Na)
1.0
FIGURE 19. Calculated first nearest-neighbour bond fractions in (Na + In) and(Na + Sn) binary liquid solutions at T = 1073 K.
x(Na)
Hea
t cap
acity
of
mix
ing
/ J·K
·m
ol
X 0.2 0.4 0.6 0.8 Na
2
6
10
14
4
8
12
Na-In
Na-Sn
-1-1
FIGURE 21. Calculated heat capacity of mixing of (Na + In) and (Na + Sn) binaryliquid solutions at T = 773 K.
32 J. Wang et al. / J. Chem. Thermodynamics 66 (2013) 22–33
strong positive deviation from the ideal solution behaviour, indi-cating the presence of the miscibility gap in the liquid phase.
The optimized phase diagram is shown in figure 17 along withthe reported experimental data [85,87–89]. In the present optimi-zation, the calculated temperature of the syntectic reactionLiquid#1þ Liquid#2$ NaZn13 is 821 K with the compositions of2 liquidus at 11 at.% and 93 at.% Zn respectively, in a good agree-ment with the reported data [34,85,88]. The consolute temperatureof the miscibility gap in the liquid phase is calculated at 1090 K and57 at.% Zn. The calculated enthalpy of formation of NaZn13 is givenin table 3. The calculated activity of Na in the liquid phase (refer-ences: liquid (Na) and liquid (Zn)) is shown in figure 18. Thethermodynamic parameters obtained for the (Na + Zn) binary sys-tem are listed in tables 2, 4 and 5.
5. Short-range ordering in (Na + In) and (Na + Sn) liquid alloys
The structure of molten (Na + Sn) alloys was investigated byAlblas et al. [91] and Akinlade [92] who reoprted strong order-ing behaviour in the liquid at the Na4Sn3 composition from neu-tron diffraction measurements. A similar ordering behaviour inthe liquid alloy appeared for the (Na + In) system at the compo-sition of Na2In3 [93]. These ordering behaviours can be expectedfrom the strong negative Gibbs energy and enthalpy of liquidphase in (Na + In) and (Na + Sn) systems, as described above.The modified Quasichemical Model (MQM) used for liquid phaseof (Na + In) and (Na + Sn) binary system in the present study can
X 0.2 0.4 0.6 0.8 Na
-60
-20
20
60
100
140
Na-In
Na-Sn
Exc
ess
stab
ility
fun
ctio
n / k
J·m
ol
x (Na)
-1
FIGURE 20. Calculated excess stability functions (Na + In) and (Na + Sn) binaryliquid solutions at T = 1073 K.
be allowed to calculate the bonding structure of the liquid sol-utionas pair fractions. According to the present calculate resultsshown in figure 19, the maximum amount of (Na + Sn) pairs inmolten Na–Sn alloys is 0.68 at xNa � 57% and T = 1073 K, andthe maximum amount of (Na + In) pairs is 0.57 at xNa ¼ 45%
and T = 1073 K.One of the best indicators of a tendency toward ordering is the
excess stability function (ES) defined by Darken [94] as:
ES ¼ @2GE
@X2i
!T;P
: ð19Þ
The calculated excess stability functions for the liquid phase in(Na + In) and in (Na + Sn) alloys are shown in figure 20. Quitestrong peaks in the excess stability functions can be observed atxNa � 59% for (Na + Sn) system, and at xNa � 41% for (Na + In) sys-tem. Another indication of short range ordering in liquid solution isthe variation of DCp function with temperature and compositionfrom the thermodynamic relationship,
DCp ¼ T@
@TðDSmÞ; ð20Þ
the calculated Cp function for the liquid solution of (Na + Sn) and(Na + In) system at T = 773 K is shown in figure 21. These calculatedordering behaviours are in good agreement with the experimentalobservation [92,93].
6. Conclusions
Finite temperature first-principles calculations can produce rea-sonable and useful thermodynamic data for intermetallic com-pounds. The enthalpies of formation of the Ag2Na, InNa, InNa2,and NaZn13 compounds at T = 0 K were calculated by first-princi-ples calculations in the present work and intergrated in the presentthermodynamic optimization by using Calphad method.
A critical evaluation and optimization of the (Na + X) binary sys-tems (X = Ag, Ca, In, Sn, and Zn) has been presented combined withthe assistance of the method of first-principles calculations. Thethermodynamic parameters of the Gibbs energies functions forall phases permits the reproduction within good accuracy theexperimental data retained from the critical analysis.
The (Na + In) and (Na + Sn) binary liquid alloys exhibit a sub-stantially large degree of short-range ordering (SRO) in the liquidphase. It has shown that the Modified Quasichemical Model(MQM) for the liquid phase, which takes the SRO into account witha first-nearest-neighbour pair equilibrium, is able to reproduce the

J. Wang et al. / J. Chem. Thermodynamics 66 (2013) 22–33 33
experimental data very well with the resultant typical ‘‘V’’-shapedintegral enthalpy of mixing curves (and the associated inflectionsin the partial enthalpy of mixing curves), as well as the typical‘‘m’’-shaped integral entropy of mixing curves more realisitic.
Acknowledgements
Financial supports from General Motors of Canada Ltd. and theNatural Sciences and Engineering Research Council of Canada(NSERC) through the CRD grant program are gratefullyacknowledged.
References
[1] M.A. Gibson, X. Fang, C.J. Bettles, C.R. Hutchinson, Scripta Mater. 63 (2010)899–902.
[2] D.H. Kang, S.S. Park, Y.S. Oh, N.J. Kim, Mater. Sci. Eng. A 449–451 (2007) 318–321.
[3] T.A. Leil, Y.D. Huang, H. Dieringa, N. Hort, K.U. Kainer, J. Buršík, Y. Jirásková, K.P.Rao, Mater. Sci. Forum (2007) 69–72.
[4] N. Hort, Y. Huang, T.A. Leil, P. Maier, K.U. Kainer, Adv. Eng. Mater. 8 (2006)359–364.
[5] T.A. Leil, N. Hort, W. Dietzel, C. Blawert, Y. Huang, K.U. Kainer, K.P. Rao, Trans.Nonferr. Metal. Soc. China 19 (2009) 40–44.
[6] K. Van der Planken, J. Mater. Sci. Lett. 4 (1969) 927.[7] C.L. Mendis, C.J. Bettles, M.A. Gibson, C.R. Hutchinson, Mater. Sci. Eng. A 435–
436 (2006) 163–717.[8] C.L. Mendis, C.J. Bettles, M.A. Gibson, S. Gorsse, R. Hutchinson, Philos. Mag. Lett.
86 (2006) 443–456.[9] T.T. Sasaki, K. Oh-ishi, T. Ohkubo, K. Hono, Scripta Mater. 55 (2006) 251–254.
[10] S.C. Park, J.D. Lim, D. Eliezer, K.S. Shin, Mater. Sci. Forum 419–422 (2003) 159–164.
[11] C.L. Mendis, K. Oh-ishi, K. Hono, Scripta Mater. 57 (2007) 485–488.[12] N. Saunders, A.P. Miodownik, CALPHAD (Calculation of Phase Diagrams): A
Comprehensive Guide, Pergamon, 1998.[13] H. Ohtani, K. Ishida, Thermochim. Acta 314 (1998) 69–77.[14] J.C. Zhao, B.P. Bewlay, M.R. Jackson, L.A. Peluso, Structural Intermetallics 2001,
TMS, Warrendale, PA, 2001. pp. 483–491.[15] C.W. Bale, P. Chartrand, S.A. Degterov, G. Eriksson, K. Hack, R. Ben Mahfoud, J.
Melancon, A.D. Pelton, S. Petersen, CALPHAD 26 (2002) 189–228.[16] A.T. Dinsdale, CALPHAD 15 (1991) 317–425.[17] A.D. Pelton, P. Chartrand, Metall. Mater. Trans. A 32 (2001) 1355–1360.[18] A.D. Pelton, S.A. Degterov, G. Eriksson, C. Robelin, Y. Dessureault, Metall. Mater.
Trans. B: Process Metallurgy and Materials Processing Science, 31 (2000) 651–659.
[19] Y.-B. Kang, A.D. Pelton, P. Chartrand, C.D. Fuerst, CALPHAD 32 (2008) 413–422.[20] M. Hillert, J. Alloys Compounds 320 (2001) 161–176.[21] H. Kopp, Phil. Trans. Roy. Soc. A 155 (1865) 71–202.[22] P.E. Blöchl, Phys. Rev. B 50 (1994) 17953–17979.[23] G. Kresse, J. Furthmüller, Computational, Mater. Sci. 6 (1996) 15–50.[24] G. Kresse, D. Joubert, Phys. Rev. B 59 (1999) 1758–1775.[25] G. Kresse, J. Furthmüller, Phys. Rev. B 54 (1996) 11169–11186.[26] J.P. Perdew, Y. Wang, Phys. Rev. B 45 (1992) 13244–13249.[27] J.P. Perdew, K. Burke, M. Ernzerhof, Phys. Rev. Lett. 77 (1996) 3865–3868.[28] H.J. Monkhorst, J.D. Pack, Phys. Rev. B 13 (1976) 5488.[29] P. Villars, K. Cenzual, Pearson’s Crystal Data- Crystal structure Database for
Inorganic Compounds, Materials Park, ASM International, OH, 2007.[30] A.D. Pelton, Bulletin of Alloy Phase Diagram, New York, 1986, pp. 133–136.[31] G. Kienast, J. Verma, Z. Anorg. allg. Chem. 310 (1961) 143–169.[32] E. Quercigh, Z. Anorg. Allg. Chem. 68 (1910) 301–306.[33] C.H. Mathewson, Int. Z. Metallogr. 1 (1911) 51–63.[34] G.J. Lamprecht, P. Crowther, Trans. AIME 242 (1968) 2169–2171.[35] J.R. Weeks, Trans. ASM 62 (1969) 304.[36] A.D. Pelton, Bulletin of Alloy Phase diagram, New York, 1986, pp. 136–139.[37] A.D. Pleton, Bulletin of Alloy Phase diagram, New York, 1986, pp. 25–27.[38] P. Willars, Pearson’s Handbook Desk Edition, ASM International, Materials
Park, OH, 1997.
[39] W. Muthmann, L. Weiss, J. Metzger, Justus Liebigs Annalen der Chemie 355(1907) 137–143.
[40] R. Lorenz, R. Winzer, Z. Anorg. Allg. Chem. 179 (1929) 281–286.[41] R. Lorenz, R. Winzer, Z. Anorg. Allg. Chem. 181 (1929) 193–202.[42] A. Rinck, E. Kaempf, A. Steinmann, Z. Anal. Chem. 83 (1931) 67–70.[43] A.D. Pelton, J. Phase Equilib. Diff. 6 (1985) 35–37.[44] S.J. Zhang, D.W. Shin, Z.K. Liu, CALPHAD 27 (2003) 235–241.[45] M.F.W. Heberlein, Trans. ASM 44 (1952) 545–548.[46] H.A. Davies, Trans. Metall. Soc. AIME 239 (1967) 928–929.[47] G.J. Lamprecht, P. Crowther, J. Inorg. Nucl. Chem. 31 (1969) 925–931.[48] R. Thummel, W. Klemm, Z. Anorg, Allg. Chem. 376 (1970) 44–63.[49] A.J. Neething, S.a.a.e.b. Report (Ed.), PEL230, Pretoria, Pelindaba, 1974, p. 21.[50] S.C. Sevov, J.D. Corbett, J. Solid State Chem. 103 (1993) 114–130.[51] S. Larose, A.D. Pelton, J. Phase Equilib. Diff. 12 (1991) 371–376.[52] M. Iwase, S. Sugino, E. Ichise, J. Chem. Thermodyn. 17 (1985) 601–609.[53] T. Kleinsteuber, The mixing enthalpy of Na and K with B-metals, Ludwig-
Maximilian University, Munich, 1961.[54] A. Rais, N.E. Cusack, F.E. Neale, J. Phys. F: Met. Phys. 12 (1982) 1091–1100.[55] H.E. Bartlett, A.J. Neethling, P. Crowther, J. Chem. Thermodyn. 2 (1970) 523–
534.[56] A.G. Morachevskii, M.A. Bykova, E.A. Maiorova, Z. Prikl Khim. 44 (1971) 2317–
2319.[57] E. Maiorova, A.G. Morachevskii, Z. Prikl Khim. 49 (1976) 2537–2539.[58] V.D. Bushmanov, S.P. Yatsenko, Z. Prikl Khim. 55 (1981) 2951–2952.[59] H.B. Ozisik, K. Colakoglu, E. Deligoz, H. Ozisik, Comput. Mater. Sci. 50 (2011)
1070–1076.[60] C.H. Mathewson, Z. Anorg. Chem. 46 (1905) 94–112.[61] W. Hume-Rothery, J. Chem. Soc. Faraday Trans. 1 (1928) 947–963.[62] G.J. Lamprecht, P. Crowther, D.M. Kemp, J. Phys. Chem. 71 (1967) 4209–4212.[63] P. Hubberstey, J. Electrochem. Soc. 110 (1972) 967–970.[64] P. Hubberstey, R.J. Pulham, J. Chem. Soc. Dalton Trans. 14 (1974) 1541–1544.[65] N.L. Pokrovskii, T.G. Smirnova, Phys. Met. Metallog. USSR 12 (1961) 751–780.[66] W. Muller, K. Volk, Z. Naturforsch. B 30 (1975) 494–496.[67] W. Muller, K. Volk, Z. Naturforsch. B 33 (1978) 709–710.[68] O.Y. Gukov, Y.Y. Gukova, Deposited document SPSTL 777 Khp-D80, 1980.[69] K. Hauffe, A.L. Vierk, Z. Elektrochem. angewandte Phys. Chem. 53 (1948) 151–
191.[70] Y.K. Delimarskii, A.A. Konomuu, Z. Fiz Khim. 28 (1954) 1169–1173.[71] A.G. Morachevskii, M.F. Lantratov, Z. Obsh Khim. 29 (1959) 2109–2113.[72] D. Yuan, F.A. Kroger, J. Phys. Chem. 73 (1969) 2390–2492.[73] M. Rivier, A.D. Pelton, J. Electrochem. Soc. 125 (1978) 1377–1382.[74] S. Tamaki, T. Ishiguro, S. Takeda, J. Phys. F: Met. Phys. 12 (1982) 1613–1624.[75] R. Alqasmi, J.J. Egan, Berichte der Bunsen-gesellschaft fur Physikalische Chemie
87 (1983) 815–817.[76] M.L. Saboungi, T.P. Corbin, J. Phys. F: Met. Phys. 14 (1984) 13–21.[77] M. Itoh, Z. Kozuka, J. Mater. Sci. 26 (1991) 5221–5228.[78] Q. Fang, H. Wendt, J. Appl. Electrochem. 26 (1996) 343–352.[79] R.L. Mckisson, L.A. Bromley, Trans. Am. Inst. Min. Metall. Petrol. Eng. 4 (1952)
33–38.[80] O. Kubaschewski, W. Seith, Z. Metallk. 30 (1938) 7–9.[81] V.W. Biltz, Z. Metallk. 29 (1937) 72–79.[82] V.W. Biltz, W. Holverscheit, Z. Anorg. Allg. Chem. 140 (1924) 261–267.[83] J. Sangster, C.W. Bale, J. Phase Equilib. Diff. 19 (1998) 76–80.[84] D. Adhikari, B.P. Singh, I.S. Jha, J. Mol. Liquid 167 (2012) 52–56.[85] C.H. Mathewson, Z. Anorg. Chem. 48 (1906) 195–200.[86] E. Zintl, W. Haucke, Acta Crystallogr. 5 (1937) 637–644.[87] A.G. Morachevskii, E.A. Maiorova, O.I. Vorobeva, Elektrokhimiya 18 (1982)
148–150.[88] H. Cetin, R.G. Ross, J. Phase Equilib. Diff. 12 (1991) 6–9.[89] W. Hausler, Z. Metallk. 51 (1960) 95.[90] M.F. Lantratov, A.G. Morachevskii, M.I. Antonova, Z. Prikl Khim. 36 (1963)
1278–1283.[91] B.P. Alblas, W. Van der Lugt, J. Dijkstra, W. Geertsma, C. Van Dijk, J. Phys. F:
Met. Phys. 13 (1983) 2465–2470.[92] O. Akinlade, Phys. Chem. Liquid: Int. J. 29 (2006) 9–21.[93] O. Akinlade, Z. Metallk. 85 (1996) 487–491.[94] L. Darken, Met. Soc. Trans. AIME 239 (1967) 80–89.
JCT 13/243