
OCT 2 2 2003 - CORE
167
SOURCES AND CHARACTERISTICS OF OIL CONSUMPTION IN A SPARK-IGNITION ENGINE by Ertan Yilmaz Diplom - Ingenieur Rheinisch-Westfalische Technische Hochschule Aachen, Germany (1997) Submitted to the Department of Mechanical Engineering in Partial Fulfillment of the Requirements for the Degree of Doctor of Philosophy at the MASSACHUSETTS INSTITUTE OF TECHNOLOGY September 2003 © 2003 Massachusetts Institute of Technology All Rights Reserved MASSACHUSETTS INSTITUTE OF TECHNOLOGY OCT 2 2 2003 LIBRARIES Signature of Author_ If ' Department of Mechanical Engineering September, 2003 Certified by John B. Heywood Certified by Sun Jae Professor of Mechanical Engineering Thesis Supervisor Victor W Wong Lecturer, Department of Mechanical Engineering Thesis Supervisor Ain A Sonin Chairman, Department of Graduate Committee Accepted by BARKER
-
Upload
khangminh22 -
Category
Documents
-
view
3 -
download
0
Transcript of OCT 2 2 2003 - CORE
SOURCES AND CHARACTERISTICS OF OIL CONSUMPTIONIN A SPARK-IGNITION ENGINE
by
Ertan Yilmaz
Diplom - IngenieurRheinisch-Westfalische Technische Hochschule Aachen, Germany
(1997)
Submitted to the Department of Mechanical Engineeringin Partial Fulfillment of the Requirements for
the Degree of Doctor of Philosophy
at the
MASSACHUSETTS INSTITUTE OF TECHNOLOGY
September 2003
© 2003 Massachusetts Institute of TechnologyAll Rights Reserved
MASSACHUSETTS INSTITUTEOF TECHNOLOGY
OCT 2 2 2003
LIBRARIES
Signature of Author_
If
' Department of Mechanical EngineeringSeptember, 2003
Certified byJohn B. Heywood
Certified by
Sun Jae Professor of Mechanical EngineeringThesis Supervisor
Victor W WongLecturer, Department of Mechanical Engineering
Thesis Supervisor
Ain A SoninChairman, Department of Graduate Committee
Accepted by
BARKER
(This page was intentionally left blank)
2
SOURCES AND CHARACTERISTICS OF OIL CONSUMPTION IN ASPARK-IGNITION ENGINE
by
Ertan Yilmaz
Submitted to the Department of Mechanical Engineeringon August 14, 2003 in Partial Fulfillment of the Requirements for
the Degree of Doctor of Philosophy
ABSTRACT
Engine oil consumption is an important source of hydrocarbon and particulate emissions inautomotive engines. In addition, chemical compounds present in oil additives poison catalyticconverters and reduce their conversion efficiency. As a part of the effort to comply withincreasingly stringent emission standards, engine manufacturers strive to minimize engine oilconsumption. This requires the advancement of the understanding of the characteristics, sources,and driving mechanisms of oil consumption. There is a general lack of oil consumption studiesthat connect comprehensive experiments and theoretical analysis.
In this work, a combined theoretical and experimental approach was used to separate andquantify different oil consumption sources in a production spark ignition engine at differentengine operating conditions. An extensive diagnostic system was successfully implemented onthe test engine to measure real time oil consumption and in-cylinder parameters that affect majorconsumption sources such as inter-ring pressures, oil film thickness in the piston-ring-pack, andliner temperatures.
A multi-species liner evaporation model was developed and verified by testing two oils withdifferent volatility at varying cylinder liner temperatures and engine speed and load conditions.The experimental and modeling results were used to separate and quantify the contributions of oilevaporation, oil entrained in the blowby gas flow, and oil flow into the combustion chamberpassing by the piston system to total engine oil consumption. The results show that thecontribution of each consumption source varies with engine operating conditions. At low load,oil flowing past by the piston was found to be the major consumption source, while thecontributions of oil evaporation and of blowby entrainment became more significant withincreasing engine load.
Furthermore, an extensive study was conducted to measure and analyze the oil consumptionbehavior during engine load transients to simulate real driving conditions.
This work is an important step in advancing the understanding of oil consumption sources inspark ignition engines.
Thesis Supervisors:
John B. HeywoodProfessor, Department of Mechanical Engineering
Victor W. WongLecturer, Department of Mechanical Engineering
3

(This page was intentionally left blank)
4
ACKNOWLEDGEMENTS
I would like to thank the members of my doctoral thesis committee who have given me theirguidance, and through feedback and suggestions have improved my research. In particular, Iwould like to thank my thesis supervisors Professor John B. Heywood and Dr. Victor W. Wongfor their support and insightful advice throughout the project, and for their focus on the importantthat kept me in the right track. I would like to express my gratitude to Dr. Tian Tian for thecontinuous help and the numerous helpful discussions over the years. Tian took part in my thesiscommittee and has been a constant source of advice for my work. His broad scientificknowledge, insight, and expertise in the field of engine lubrication have contributed significantlyto this thesis. My sincere thanks to Professor Mikid for accepting being part of the committee andfor his careful criticism and suggestions. I would also like to thank Professor Wai Cheng for hissupport and advice. Furthermore, I would like to thank Professors John B. Heywood and SimoneHochgreb for giving me the opportunity to conduct my doctoral research at MIT.
I would like to thank PSA Peugeot Citroen and the members of the Consortium onLubrication in Internal Combustion Engines at MIT (current members include Dana Corporation,Mahle GmBh, Renault SA, PSA Peugeot Citro6n, and Volvo AB) for sponsoring this research. Iwould like to thank Dr. Bernard Cousyn, Nicholas Lee, and Dr. Sebastien Mess6 at PSA PeugeotCitro6n for their support and help in this project. I would like to thank R6mi Rabut6 at Dana forhis support and valuable technical inputs over the years. I would also like to thank FredrikStromstedt, Bengt Olson, Dr. Adam Blomburg, and Jonas Rick at Volvo, Dr. Rolf-GerhardFiedler and Dr. Eberhard Kopf at Mahle, Randy Lunsford and Kim Karrip at Dana, and Dr.Mokhtar Maamouri at Renault for their interest and support. I would like to express specialthanks to Lubrizol Corporation for formulating and providing the special lubricants for thisproject.
I gratefully acknowledge the support of the Sloan Automotive Laboratory staff. BrianCorkum, Peter Menard, and Thane Dewitt deserve special credit for their technical assistance. Iwould also like to thank Alexis Rozantes, Nancy Cook, Susan Lutin, and Karla Stryker for theirhelp and pleasant attitude. Special thanks also to Leslie Reagan for her support and help.
Bertrand Lecointe, Gerald Chamarre, Yonggy Shin, Daisuke Suzuki, and Oscar Lopezdeserve special credit for their contributions to the test facility set-up and measurements.
I would like to thank Benoist Thirouard, Conor McNally and Liang Liu for the helpfuldiscussions and most importantly for having made my stay at MIT both rich and enjoyableexperience. Particularly, I would like to thank Benoist for providing valuable 2D-LIF images. Iwould also like to thank the following list of graduate students and visiting engineers in the SloanAutomotive Laboratory for their help and for making my research in the laboratory enjoyable:Morgan Andreae, Jinchul Hong, Grant Smedley, Jeff Matthews, Yong Li, Jim Cowart, RobertMeyer, Matt Rublewski, Adam Vokac, Fiona McClure, Mohammad Rassuli, Franck Gambin,Michael Bourgeois, Brian Hallgren, Ioannis Kitsopanidis, Joseph Acar, Jeremy Llaniguez,Yuetao Zhang, Kevin Lang, Gerardo Jose Cordova Lao, Halim Santoso, and Yeunwoo Cho.
Outside the Sloan Automotive Laboratory, I would like to thank Cornelius O'Sullivan,Dimitrios Rovas, Michaela Wiegel, A. Burak Guner, Cagri Savran, Dr. Wolf-Dietrich Bauer, andEfstratios Mylidakis for their friendship, help, and support. I would especially like to thankCynthia Galvan for her support, care, and understanding. She has been a constant source ofencouragement to me.
I would like to express my special thanks to all members of my family. This thesis would nothave been completed without their unconditional support. In particular, I am very grateful to mymother, father, and sister Eda for their continuous encouragement and support.
Cambridge, October 2003
5

(This page was intentionally left blank)
6
Table of Content
Abstract 3
Acknowledgements 5
Table of Content 7
Chapter 1 Introduction 16
1.1 Engine Lubrication and Oil Consumption 16
1.2 Research on Oil Consumption 17
1.3 Oil Consumption Sources and Transport Mechanisms in SI Engines 18
1.4 Project Scope 22
Chapter 2 Experimental Setup 25
2.1 Experimental Objectives 25
2.2 Test engine: Production Spark Ignition Engine 26
2.3 Measurement Techniques 27
2.3.1 Total Output Measurements 27
2.3.1.1 Oil Consumption 27
2.3.1.1.1 High Sulfur Oil 28
2.3.1.1.2 Low Sulfur Fuel 30
2.3.1.1.3 Oil Consumption Measurement Setup 30
2.3.1.1.4 Oil Consumption Formula 32
2.3.1.2 Blowby 34
2.3.1.3 SMPS 36
2.3.2 In-cylinder Measurements 37
2.3.2.1 Laser-Induced-Fluorescence (LIF) System 39
2.3.2.2 Cylinder and Land Pressures 47
2.3.2.3 Liner Temperatures 50
2.4 Experimental Conditions 50
2.4.1 Engine Operating Conditions 50
7
2.4.1.1 Steady State Engine Operation 50
2.4.1.2 Engine Transients 52
2.4.2 Ring-pack Design 53
Chapter 3 Oil Consumption Characteristics during Steady State and
Transient Operation 55
3.1 Factors Influencing Oil Consumption at Different Speed and Load 55
3.2 Simulation of Piston-Ring-Pack Performance 56
3.3 Speed and Load Effects on Oil Consumption and In-Cylinder Parameters 58
3.3.1 Oil Consumption Measurements 59
3.3.2 Blowby 60
3.3.2.1 Blowby Flow Structure 60
3.3.2.2 Blowby Gas Flow Oil Dragging 62
3.3.2.3 Blowby Measurements 64
3.3.3 Oil Distribution along Piston 66
3.4 Analysis of Oil Consumption Behavior during Transients in Load 72
3.4.1 Introduction 72
3.4.2 Oil Consumption Measurements 74
3.4.3 Blowby, Land Pressures and Oil Film Thickness 78
3.4.4 Gas Flow and Ring Dynamics 83
3.4.5 2-D LIF Observations 90
3.4.6 Summary for Analysis of Oil Consumption during Transients in Load 91
Chapter 4 Oil Consumption Sources 93
4.1 Blowby 93
4.1.1 Blowby Contribution to Oil Consumption at Different Speed and Load 94
4.1.2 Particle Size Distribution in the Blowby 101
4.1.3 Summary of the Oil Consumption due to Blowby 105
4.2 Oil Evaporation 106
4.2.1 Introduction 106
4.2.2 Experimental Methodology and Conditions 107
8
4.2.2.1 Oil Specifications 107
4.2.2.2 Experimental Conditions 112
4.2.3 Effect of Cylinder Liner Temperature on Oil Consumption 115
4.2.4 Effect of Oil Volatility on Oil Consumption 118
4.2.5 Estimation of Liner Evaporation 120
4.2.5.1 Analytical Liner Evaporation Model 123
4.2.6 Analysis of Model Results and Comparison with Experiments 131
4.2.7 Summary of the Oil Evaporation Study 139
4.3 Contribution of Different Sources to Total Oil Consumption 140
4.3.1 Separation of Three Different Oil Consumption Sources 141
4.3.2 Variation of the Oil Consumption Sources with Engine Load 144
4.3.3 Variation of the Oil Consumption Sources with Engine Speed 150
4.3.4 Summary of the Contribution of Different Sources to Oil Consumption 153
Chapter 5 Conclusions 155
Appendices 165
9
List of Figures
Figure 1-1 O il consum ption sources .............................................................................. 19
Figure 1-2 Schematic of oil transport through the piston-ring-liner system clearances ... 21
Figure 2-1 Baseline oil sulfur content with distillation................................................. 29
Figure 2-2 Schematic of oil consumption measurement setup ..................................... 30
Figure 2-3 A ntek® sulfur detector ................................................................................. 32
Figure 2-4 Variation of the crankcase volume during one engine cycle....................... 36
Figure 2-5 Schematic of the classification of particles in the SMPS ............................. 37
Figure 2-6 Measurement locations of in-cylinder variables........................................... 38
Figure 2-7 Schematic of LIF system setup.................................................................... 40
Figure 2-8 Axial position of LIF probes and of different piston regions with crank
an g le ........................................................................................................ . . 4 1
Figure 2-9 Modified engine block for optical access................................................... 42
Figure 2-10 LIF window dim ensions............................................................................. 42
Figure 2-11 Surface profile along liner and bottom window at the anti-thrust side ......... 43
Figure 2-12 Arrangement of LIF housing sleeve and probe assembly ......................... 44
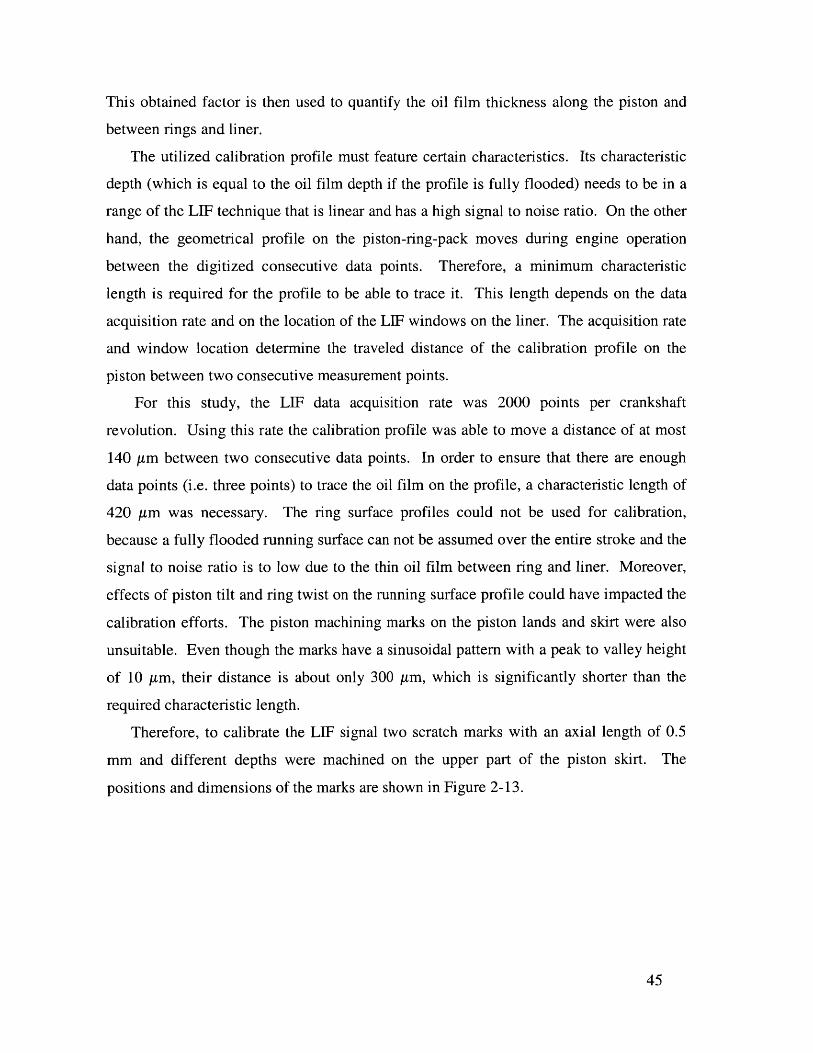
Figure 2-13 Piston scratch mark dimensions ................................................................. 46
Figure 2-14 Surface profile of piston skirt and scratch marks at anti-thrust side ...... 46
Figure 2-15 Sam ple LIF traces...................................................................................... 47
Figure 2-16 Axial positions along liner of different piston region as a function of CA ... 48
Figure 2-17 Side view schematic of engine with mounted pressure transducer adapter .. 49
Figure 2-18 Sample second and third land pressure measurements with the liner
pressure transducers at 75% load, 2500 rpm............................................. 49
Figure 2-19 Torque at full load (100%) as a function of speed ................................... 51
Figure 2-20 Investigated steady state engine operating conditions............................... 51
Figure 2-21 Investigated operating conditions of blowby contribution to total oil
consum ption ............................................................................................ . 52
Figure 2-22 Description of the ramp transient experiments in load............................... 53
Figure 2-23 Piston and baseline ring-pack geometry.................................................... 54
Figure 2-24 Details of the ring-pack geometry used for ramp transient experiments....... 54
10
Figure 3-1 Schematic of the believed U-flex OCR flank shape after installation.......... 57
Figure 3-2 Predicted and measured land pressures and blowby at 75% load, 2500 rpm.. 58
Figure 3-3 Oil consumption at different engine speed and load .................................... 60
Figure 3-4 Pressures in different regions and gas flows through ring gap at 25% load,
3500 rpm ................................................................................................. . . 6 1
Figure 3-5 Schematic of the main blowby flow path through the piston-ring-pack with
a U -flex oil control ring............................................................................. 62
Figure 3-6 Schematic of the transport mechanism of gas flow oil dragging on surfaces . 62
Figure 3-7 Blowby flow rate (liter/minute) at different engine speed and load............ 65
Figure 3-8 Blowby (cm 3/cycle) dependency on engine speed and load ....................... 65
Figure 3-9 Sample LIF trace with control volumes of piston land for averaging......... 67
Figure 3-10 Effect of engine speed and load on the oil accumulation on top and 2 "d
lan d ........................................................................................................ . . 6 8
Figure 3-11 Circumferential volumetric gas flow on the second land.......................... 69
Figure 3-12 Sam ple 2-D LIF im age ............................................................................... 74
Figure 3-13 Oil consumption and blowby during transient in load (0% to 100%) at
different speeds ........................................................................................ 75
Figure 3-14 Oil consumption during transient in load and the importance of the initial
load at 4000 rpm ..................................................................................... 76
Figure 3-15 Effect of blowby on oil consumption during ramp transient in load......... 77
Figure 3-16 Predicted and measured land pressures and blowby at no load (0%), 3500
rp m .......................................................................................................... . . 7 9
Figure 3-17 Blowby dependency on speed and load with ring-pack used for transient
experim ents .............................................................................................. . 79
Figure 3-18 Oil accumulation on top land with varying load and speed ...................... 80
Figure 3-19 Oil film thickness evolution during ramp transient in load from no load
(0% ) to full load (100%) at 3500 rpm ...................................................... 81
Figure 3-20 Change in oil film thickness after transient in load from no load (0%) to
full load (100% ) at different speed........................................................... 82
Figure 3-21 Comparison of measured and predicted land pressures at 4200rpm......... 84
Figure 3-22 Top ring dynamics at 4200 rpm ................................................................. 85
11

Figure 3-23 Schematic of top ring reverse flutter .......................................................... 86
Figure 3-24 Illustration of the sequence of events during top ring reverse flutter........87
Figure 3-25 Gas flows through top ring groove and gap during reverse flutter at full
load (100% ), 4200 rpm ............................................................................ 88
Figure 3-26 Oil flow during transient at 2500 rpm ........................................................ 91
Figure 4-1 Illustration of the inertial separator ............................................................ 96
Figure 4-2 Typical efficiency curve of an inertial separator ........................................ 97
Figure 4-3 Oil consumption due to oil entrainment in the blowby gas flow at different
speed and load .......................................................................................... 98
Figure 4-4 Contribution of the oil in the recycled blowby gases to total oil
consumption at different speed and load.................................................. 99
Figure 4-5 Oil loading in the blowby gas flow into the intake manifold system............ 100
Figure 4-6 Particle mass distribution in the blowby flow of different engines............... 101
Figure 4-7 Load effect on particle size distribution in the blowby flow at 2500 rpm .... 102
Figure 4-8 Particle size distribution in the exhaust of a spark ignition engine ............... 103
Figure 4-9 Load effect on droplet volume concentration at 2500 rpm ........................... 104
Figure 4-10 Liquid oil particle proportion of total oil in the blowby gases .................... 105
Figure 4-11 Typical operating temperatures on the piston surface at full load .............. 110
Figure 4-12 Comparison of the viscosity of both test oils .............................................. 111
Figure 4-13 Synthetic oil sulfur content with distillation ............................................... 112
Figure 4-14 Relation between coolant and liner temperatures at 75% load, 3500 rpm.. 113
Figure 4-15 Effect of coolant outlet temperature on liner temperature at the TDC
location of the scraper ring at different load, 3500 rpm............................. 114
Figure 4-16 Investigated operating conditions (evaporation study)................................ 115
Figure 4-17 Oil consumption dependence on liner temperature at different load, 3500
rp m ............................................................................................................. 1 16
Figure 4-18 Oil consumption dependence on liner temperature at different speed, full
lo ad (10 0 % )................................................................................................ 1 17
Figure 4-19 Difference in oil consumption due to oil volatility at different speed and
lo ad ............................................................................................................. 1 19
12
Figure 4-20 Decrease of oil consumption (as percent of the baseline oil consumption)
due to reduction of volatility at different speed and load........................... 120
Figure 4-21 Schematic of the oil consumption mechanisms from the top land.............. 121
Figure 4-22 Oil film thickness distribution at different coolant outlet temperature at
75% load, 3500 rpm ................................................................................... 122
Figure 4-23 Schematic of the liner oil evaporation process............................................ 123
Figure 4-24 Mass transfer Biot number distribution on the liner for the first two
species of the baseline oil at 100% load, 3500 rpm, and 93'C coolant
outlet tem perature....................................................................................... 126
Figure 4-25 Typical cylinder pressure measurement with computed bulk gas
tem p erature ................................................................................................. 12 8
Figure 4-26 Variation of the liner temperature distribution for different load
conditions at 3500 rpm, standard coolant outlet temperature (a); and for
different coolant outlet temperatures at 100% load, 3500 rpm (b)............ 129
Figure 4-27 Distillation curves of baseline and synthetic oil.......................................... 130
Figure 4-28 Typical trace of the oil film thickness left on the liner after the intake and
expansion stroke......................................................................................... 13 1
Figure 4-29 Oil evaporation dependence on liner temperatures at 75% load, 3500 rpm 131
Figure 4-30 Total oil consumption and predicted liner evaporation dependence on
liner temperature at different load, 3500 rpm ............................................ 133
Figure 4-31 Oil volume held by the top ring and liner oil film thickness after
downstrokes at the minor thrust side for 100% load, 3500rpm ................. 134
Figure 4-32 Cumulative total oil evaporation and proportions of the lightest four
species during one engine cycle at 100% load, 3500 rpm, and 93'C
coolant outlet tem perature.......................................................................... 135
Figure 4-33 Effect of the liner oil composition variation (baseline oil) on the
evaporation at 100% load, 3500 rpm ......................................................... 137
Figure 4-34 Measured total oil consumption and predicted liner evaporation
dependence on liner temperature at different load (50%, 75%, and
100%), 3500 rpm. Exponential curve fit to each data set and
corresponding R2 correlation coefficient shown........................................ 138
13
Figure 4-35
Figure
Figure
Figure
Figure
Figure
4-36
4-37
4-38
4-39
4-40
Figure 4-41
Figure 4-42
Figure 4-43
Measured total oil consumption and predicted liner evaporation
dependence on liner temperature for synthetic oil at different load (50,
75, and 100%), 2500 rpm. Exponential curve fit to each data set and
corresponding R2 correlation coefficient shown........................................ 139
Illustration of the separated oil consumption sources ................................. 142
Schematic illustrating the separation of the three oil consumption sources 144
Effect of engine load on different oil consumption sources and on total
oil consumption at 3500 rpm for the baseline oil....................................... 144
Reverse gas flow through top ring gap at different engine load.................. 146
Computed oil flow with reverse gas flow through top ring gap and
separated oil transport rate at different engine load ................................... 147
Effect of engine load on the relative importance of different oil
consumption sources to total oil consumption at 3500 rpm for the
b aselin e o il ................................................................................................. 14 9
Effect of engine speed on different oil consumption sources and on total
oil consumption at 100% load for the baseline oil..................................... 150
Effect of engine speed on the relative importance of different oil
consumption sources to total oil consumption at 100% load for the
b aselin e o il ................................................................................................. 15 2
14
List of Tables
Table 2-1 Test engine characteristics ............................................................................. 26
Table 2-2 Relevant baseline oil specifications ............................................................... 29
Table 2-3 Relevant fuel specifications .......................................................................... 30
Table 2-4 Blowby meter specifications........................................................................ 35
T able 2-5 LIEF specifications .......................................................................................... 40
Table 2-6 Investigated load transients at constant speed ............................................... 53
Table 3-1 Average reverse gas flows and oil transport (assuming 1 percent oil loading
in the gas) into the combustion chamber at 4200 rpm. ............................ 89
Table 4-1 Relevant oil specifications of the test oils ...................................................... 109
15
Chapter 1 Introduction
1.1 Engine Lubrication and Oil Consumption
The piston assembly creates the boundary between the combustion chamber and the
crankcase, therefore it is essential as it provides and maintains the only seal for the high
pressure combustion gases. Sealing is accomplished by the piston rings, moving in the
ring grooves within the piston and sliding along the liner. The interaction among liner,
piston, and rings during engine operation requires sufficient lubrication of the surfaces in
relative motion to minimize friction and wear, thereby enhancing the lifetime of the
engine. Another task performed by the piston-ring-pack is the supply of oil to all
surfaces of relative motion, i.e. to all ring grooves and the liner. This supply of oil,
however, must be controlled, because excess oil in regions adjacent to the combustion
chamber results in unfavorable oil consumption.
Oil consumption from the piston-ring-liner system significantly contributes to total
engine oil consumption [1]. Engine oil consumption is recognized to be a significant
source of pollutant emissions in automotive engines. Unburned or partially burned oil in
the exhaust gases contributes directly to hydrocarbon and particulate emissions [2][3][4].
Moreover, chemical compounds in oil additives can poison exhaust gas treatment devices
and can severely reduce their conversion efficiency [5][6]. Oil consumption is also an
important indicator for engine performance and, consequently, customer satisfaction.
The trade-off between the objectives of adequate oil supply for lubrication and
minimizing oil consumption has always been a difficult task due to the lack of physical
understanding of the oil flow in the piston ring assembly. This inadequate physical
understanding of oil transport and consumption has resulted in the empirical development
of most piston and piston ring designs. As a part of the effort to comply with
increasingly stringent emission standards, engine manufacturers strive to optimize the
piston-ring-pack performance in terms of oil consumption and friction. Moreover, to
reduce development lead-time and costs, there exists increasing demand for analytical
16
tools to predict oil consumption and friction. However, the prediction of oil consumption
requires an understanding of oil transport and of the contributing oil consumption sources.
1.2 Research on Oil Consumption
Oil consumption from the piston-ring-liner system and from the crankcase ventilation
systems are considered to be the major contributors to total engine oil consumption in
modem automotive engines.
Studies on crankcase ventilation systems focused on the contribution of the crankcase
blowby gases to oil consumption and the performance of oil separators [7][8][9][10][11].
Numerous studies have been carried out to analyze the impact of different parameters
of the piston-ring-liner system on oil consumption. Oil consumption was found to be
affected by the geometrical details of the piston and the rings [12][13][14][15][16], liner
surface finish[ 17] [18] [19], cylinder bore distortion[20] [21], component temperatures[22],
oil properties[23][24], and engine operation conditions such as speed, load, and whether
the engine operates in a steady state.
To gain more insight regarding oil consumption sources from the piston-ring-pack,
measurements were conducted on the inter-ring pressures and the relative ring positions
in the groove [25][26]. In addition, studies of the oil film thickness on the piston and
between the rings and liner using the Laser Induced Fluorescence (LIF) technique,
determined the oil accumulation characteristics in various engines at different engine
operating conditions, showing consistently partial flooding of the piston top, second, and
third lands [28][29][30][31][32][33][34][35]. In most of these studies oil consumption
mechanism hypothesis were formulated and oil consumption sources were postulated.
However, a complete oil consumption model is still out of reach. Among other
invariably non-quantitative mechanisms, gas flows have been found to transport oil into
the combustion chamber via two paths. First, oil may be dragged or entrained by the
reverse gas flow from the second land through the top ring gap and groove, as the second
land pressures become greater than the cylinder pressure at the end of expansion and
early exhaust stroke. Oil flow through the top ring gap was observed on a one-cylinder
research engine at low load conditions when the top ring was pinned [36][37]. Second,
17
oil mist present in the blowby gases is recycled into the intake manifold. Other
hypotheses supported by experimental data relate oil consumption to the mechanical
transport of liquid oil into the combustion chamber due to inertia forces caused by
acceleration and deceleration of the piston. Oil throw off from the top land was also
visualized in one-cylinder research engines at low load conditions [38][39]. Other,
experimental studies show that evaporation from the liner and piston may be a substantial
contributor to oil consumption [22][23][24]. A number of theoretical approaches studied
the oil evaporation from the liner and found the evaporation process sensitive to oil
composition and liner temperatures [40] [42].
However, oil from the crankcase has to traverse many paths before being transported
into the combustion chamber via these routes. Recently, extensive and reliable ring-pack
models have been developed at the MIT (Sloan Automotive Laboratory) that predict ring
dynamics, gas flows, and ring-liner lubrication to estimate oil transport along the piston,
along the liner, and from liner to piston [43][44][45]. Moreover, physical models for the
oil transport mechanisms along the piston have been suggested utilizing 2-D LIF
observations on a one-cylinder research engine derived from the production engine used
for this study [46]. Despite these efforts, further experimental and modeling work are
still needed in order to connect these predicted driving forces and oil transport with oil
consumption. In summary, so far little work has been done combining oil consumption
measurements, in-cylinder measurements and advanced modeling. Consequently, due to
the complex character of oil consumption and lack of comprehensive experimental data, a
complete picture that describes the contribution of different sources to total oil
consumption has not been obtained for any engines.
1.3 Oil Consumption Sources and Transport Mechanisms in SI Engines
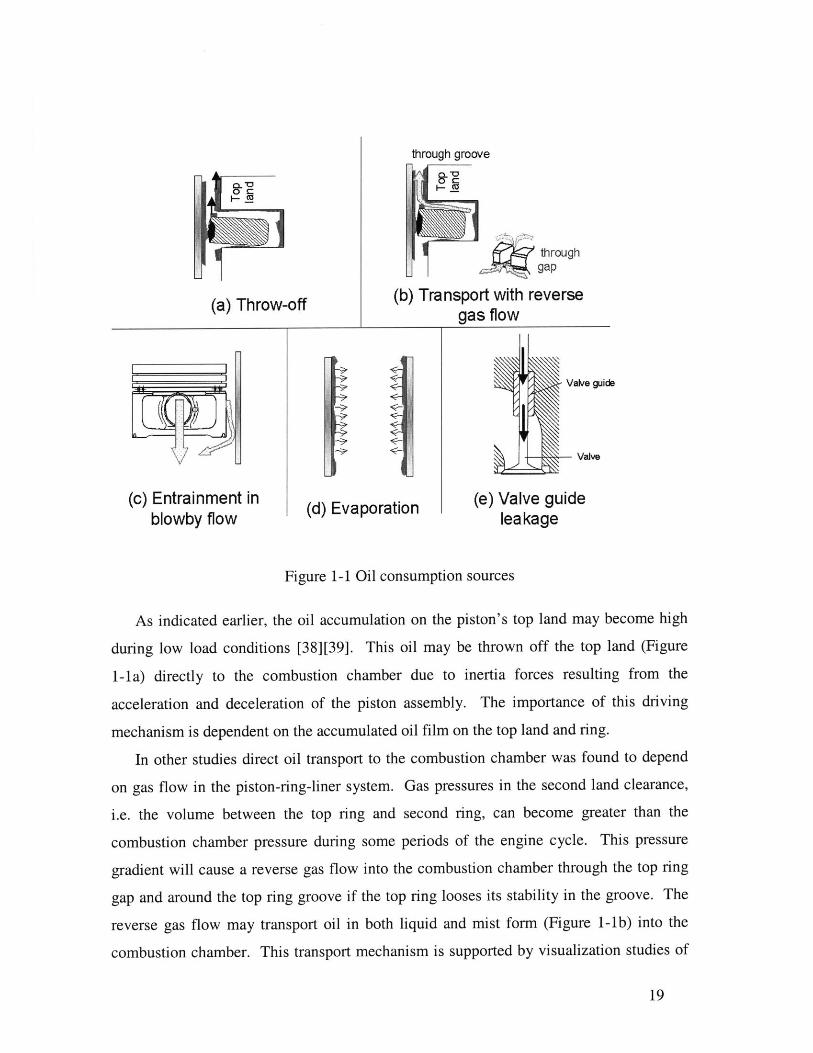
Five possible oil consumption sources have been suggested to contribute to total oil
consumption of spark ignition engines during engine operation. These sources are
illustrated in Figure 1-1.
18
(a) Throw-off
through groove
throughgap
(b) Transport with reversegas flow
T T
(c) Entrainment inblowby flow
(d) Evaporation
Valve guide
Valve
(e) Valve guideleakage
Figure 1-1 Oil consumption sources
As indicated earlier, the oil accumulation on the piston's top land may become high
during low load conditions [38][39]. This oil may be thrown off the top land (Figure
1-1a) directly to the combustion chamber due to inertia forces resulting from the
acceleration and deceleration of the piston assembly. The importance of this driving
mechanism is dependent on the accumulated oil film on the top land and ring.
In other studies direct oil transport to the combustion chamber was found to depend
on gas flow in the piston-ring-liner system. Gas pressures in the second land clearance,
i.e. the volume between the top ring and second ring, can become greater than the
combustion chamber pressure during some periods of the engine cycle. This pressure
gradient will cause a reverse gas flow into the combustion chamber through the top ring
gap and around the top ring groove if the top ring looses its stability in the groove. The
reverse gas flow may transport oil in both liquid and mist form (Figure 1-1b) into the
combustion chamber. This transport mechanism is supported by visualization studies of
19

the oil distribution in the piston-ring-pack, when the top ring was pinned. In these studies,
oil flow through the top ring gap towards the combustion chamber was observed during
low load conditions [36][37].
Oil mist, also present in the recycled blowby gas flow (Figure 1-1c), has been found
to enter the combustion chamber via the intake manifold system. Experimental studies
on different engines quantified the contribution of oil in the crankcase ventilation gases to
total oil consumption [1][7]. It was found that this oil consumption source could
contribute significantly, depending on the specific engine, to total oil consumption.
Oil evaporation (Figure 1-1d) from the piston-ring-liner system is also believed to
contribute significantly to total oil consumption, especially during severe operation
conditions when the thermal loading of engine components is high. Several experimental
results indicated that oil evaporation from the liner and piston might contribute
substantially to oil consumption [23][24][22]. In addition, a number of purely theoretical
approaches studied oil evaporation from the liner and found sensitivities in the
evaporation process to oil composition and to component temperatures [40][41][42].
However, uncertainties in predictions of the oil evaporation rate remain in the order of oil
consumption.
In earlier spark ignition engine designs, oil transport from the cylinder head through
the valve guide into the intake port (Figure 1-le) contributed to oil consumption during
part load conditions, when the intake manifold pressure is significantly below
atmospheric. However, this oil leak path is effectively sealed in modem engines by
employing positive valve stem seals [1]. Therefore, this oil consumption source is
considered to contribute little to the total oil consumption in today's spark ignition
engines.
All of these consumption sources contribute to total oil consumption during engine
operation. All mechanisms, except oil transport through the valve guide, are related to
the performance of the piston assembly. Whether one or the other mechanism dominates
depends mostly on the engine design specific oil transport rates, engine operating
parameters, and lubricant properties. The oil must traverse a complex course before
being transported into the combustion chamber, as indicated in Figure 1-2.
20
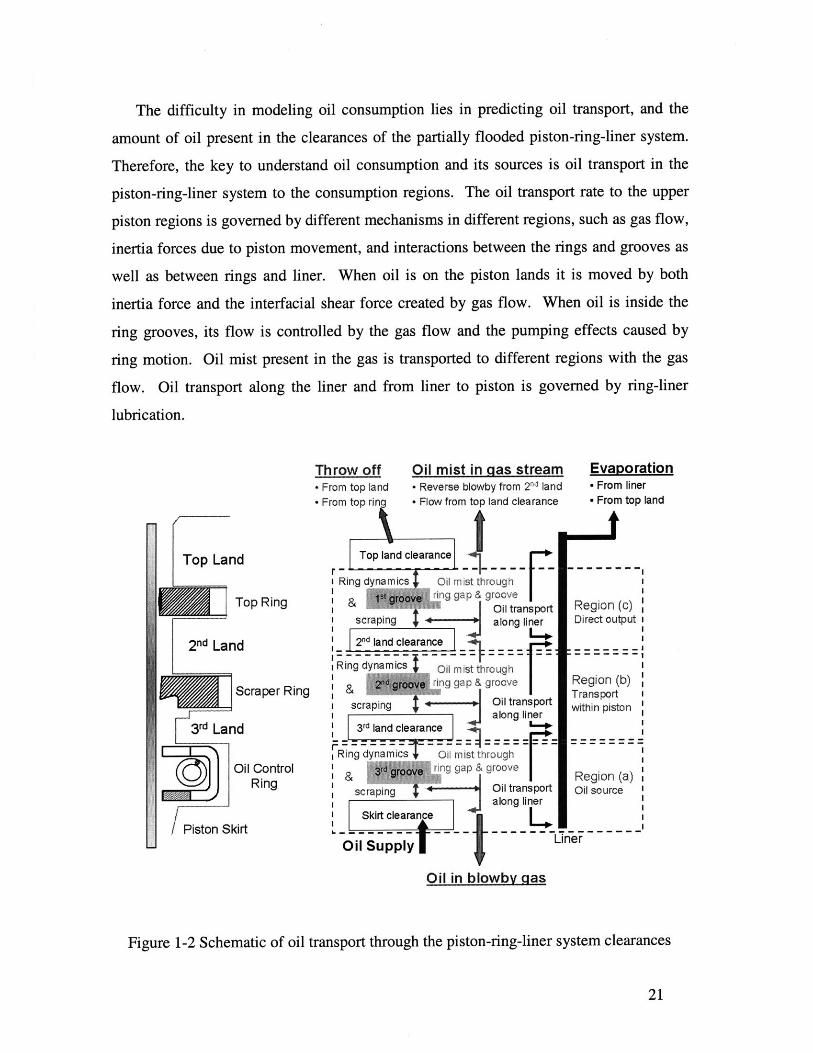
The difficulty in modeling oil consumption lies in predicting oil transport, and the
amount of oil present in the clearances of the partially flooded piston-ring-liner system.
Therefore, the key to understand oil consumption and its sources is oil transport in the
piston-ring-liner system to the consumption regions. The oil transport rate to the upper
piston regions is governed by different mechanisms in different regions, such as gas flow,
inertia forces due to piston movement, and interactions between the rings and grooves as
well as between rings and liner. When oil is on the piston lands it is moved by both
inertia force and the interfacial shear force created by gas flow. When oil is inside the
ring grooves, its flow is controlled by the gas flow and the pumping effects caused by
ring motion. Oil mist present in the gas is transported to different regions with the gas
flow. Oil transport along the liner and from liner to piston is governed by ring-liner
lubrication.
Top Land
Top Ring
2 nd Land
Scraper Ring
3 rd Land
Oil ControlRing
/ Piston Skirt
Throw off Oil mist in gas stream Evaporation- From top land - Reverse blowby from 2nd land - From liner- From top ring * Flow from top land clearance * From top land
Top land clearancer- ----- - --- -a '& groove-- -- -I Ring dynamics Oil mistthrough I
& g itransport Region (c) |scraping 4 - along liner Direct output i
nd land clearance
Ring dynamics Oil mist through
& 2e $ ring gap groove Region (b)&4 n Transportscraping -Oil transport within piston
along liner3 rd land clearance
Ring dynamics Oi mist through
& r ring gap & groove Region (a)
scra g Oil transport Oil sourcealong liner I
Skirt clearance- --. -- ..- - ..- - ....- -- - - .- - - .
Oil Supp l Liner
Oil in blowby -gas
Figure 1-2 Schematic of oil transport through the piston-ring-liner system clearances
21
M
All these driving forces for oil transport are sensitive to engine speed and load.
Therefore, to understand and model oil consumption sources it is critical to isolate
different driving forces for oil transport by changing engine operating conditions, and
then to connect them with oil consumption. To investigate the effects of engine operating
conditions on the flow and accumulation of oil, the piston-ring-pack region is subdivided
into three regions (see Figure 1-2):
Region (a): This region includes the clearances in the upper piston skirt and the oil
control ring groove. The oil supplied from the piston skirt must pass region (a) to reach
the upper piston ring-pack. Therefore, region (a) controls the gross oil on the liner and
determines the supply of oil to the upper piston regions.
Region (b): This region includes the clearances in the third land and the second ring
groove. This region also controls the oil on the liner and determines the oil supply to the
second land and top ring groove.
Region (c): This region includes the clearances on the second land and top ring
groove. The contribution of the direct oil consumption sources is mainly determined in
this region. Oil removal from region (c) to the crown land both with the reverse gas flow
or from the groove is theorized to be irreversible, and thus considered as oil consumption.
This region determines the oil left on the liner during down strokes and therefore affects
oil evaporation and ring scraping. High gas flows through the rings gaps affect the oil
entrainment in the blowby gases.
1.4 Project Scope
A major difficulty in the development of analytical tools to predict oil consumption is
the lack of understanding of the contribution of major oil consumption sources to total
engine oil consumption. This thesis work is intended to quantify important oil
consumption sources and to advance the overall understanding of the contribution of
different oil transport mechanisms to oil consumption in a spark ignition engine. It
22
characterizes oil transport, oil consumption, and the contribution of different oil
consumption sources at different engine operating conditions, by combining
comprehensive measurements and physics-based modeling work. Emphasis was placed
on the investigation and quantification of major oil consumption sources during different
steady state operating conditions and on the analysis of the oil consumption behavior
during ramp transients in load.
On a modem, four-cylinder production spark ignition engine an extensive diagnostic
system was developed and implemented to measure and identify key oil consumption
sources and their contribution to total engine oil consumption. This diagnostic system
has the capability to simultaneously measure oil consumption, blowby, and in-cylinder
variables such as oil film distribution in the piston-ring-pack, inter ring pressures,
cylinder pressure, and liner temperatures. The experimental setup is presented in Chapter
2.
In Chapter 3 the influence of different steady state engine speed and load conditions
on oil consumption, blowby, and in-cylinder parameters is analyzed. The simulation
codes developed at MIT were applied in order to evaluate driving forces for oil transport
and oil consumption such as gas flow in different regions, ring dynamics, and ring liner
lubrication. Furthermore, an extensive study was conducted to measure and analyze the
oil consumption behavior during engine load transients at constant speed. Emphasis was
placed on the analysis of the oil consumption behavior during transients from low load to
full load by combining oil consumption measurements, in-cylinder measurements, and
theoretical modeling.
In Chapter 4 the contribution of different oil consumption sources to total engine oil
consumption is characterized and quantified at different steady state speed and load
conditions. First, the contribution of oil entrained in the blowby gas to total oil
consumption is analyzed. Then the impact of oil evaporation to oil consumption is
characterized. A physics-based liner evaporation model is proposed and verified
experimentally by varying oil volatility, liner temperature, and engine operating
conditions. Finally, the contributions of oil evaporation, oil entrained in the blowby gas
flow, and oil flow through various pathways into the combustion chamber to total oil
consumption are assessed by combining the experimental and modeling results.
23

(This page was intentionally left blank)
24
Chapter 2 Experimental Setup
2.1 Experimental Objectives
A critical issue in experimental investigations is the choice, development, and
implementation of suitable experimental techniques. In this section, the experimental
objectives and the technical approach to meet these objectives are discussed.
As described in Section 1.3, oil transport in the piston-ring-liner system is governed
by ring-liner lubrication, piston and ring dynamics, and gas flow. All these driving forces
vary with engine operating conditions, but can be predicted using computer models that
were developed at MIT (see Section 3.2). However, these models require in-cylinder
parameters such as cylinder pressure traces, component geometries during engine
operation, oil volumes accumulated on different regions of the piston, and component
thermal conditions. All parameters, but in particular the thermal expansion of component
geometries, change with operating conditions and need to be estimated for each condition.
These unknown parameters can, however, be adjusted within a reasonable range, until the
model predictions match with measurements of land pressures and blowby. In addition,
thermal conditions on the cylinder liner are believed to directly affect the oil evaporation
process. Moreover, oil consumption has been found to vary for identical engine designs
at same operating conditions. This is most likely caused by the variations in oil transport
inside the piston-ring-pack, and thus in oil consumption sources. Therefore, to
thoroughly study oil consumption and its sources it is essential to obtain simultaneous
measurements of oil consumption and in-cylinder variables affecting oil transport to the
main consumption sources.
Consequently, for this study a comprehensive experimental setup was needed with the
capability to measure not only oil consumption, but also blowby and in-cylinder variables
that govern the oil transport and consumption mechanisms. The experimental objectives
can be summarized as follows:
25

1 - Provide relatively fast and accurate measurements of total engine oil consumption
and oil consumption sources.
2 - Provide blowby measurements.
3 - Provide measurements of in-cylinder parameters that affect oil transport in the
piston-ring-liner system and thus oil consumption.
* Measurements of the oil film behavior in the piston-ring-pack
" Measurements of inter-ring and cylinder pressures
" Measurements of thermal conditions on the cylinder liner
2.2 Test engine: Production Spark Ignition Engine
A typical, modern, four-cylinder production spark ignition engine was used as the test
engine. The engine characteristics are shown in Table 2-1.
Engine Type Port injected spark ignition engine
Number of cylinders 4
Displacement 2.01 liter
Bore 86.25 mm
Stroke 86.00 mm
Maximum power 97.4 kW at 5500 rpm
Maximum torque 180 Nm at 4200 rpm
Compression ratio 10.4:1
Table 2-1 Test engine characteristics
The test engine was modified to allow the implementation of several experimental
techniques and to control different engine operating conditions. The cylinder head was
modified to fit pressure transducers on the third and fourth cylinder for cylinder pressure
measurements. In addition, the engine block and the liner of the third cylinder were
machined to allow the installation of liner pressure transducers, thermocouples, and silica
windows for optical access to the piston-liner interface for oil film thickness
26
measurements. The implementation of these in-cylinder measurement techniques caused
the penetration of the water jacket that surrounds the liner. The problems arising from
the penetration of the water jacket, and the precautions taken to address this problem, will
be described in Section 2.3.2.
To control the coolant temperature, and thereby the engine thermal conditions, the
engine thermostat was removed. The engine coolant from an external coolant tank
(capacity of approximately 30 liters) was circulated unrestricted through the engine block.
Before entering the engine block, the coolant was cooled in a heat exchanger by city
water. Controlling the flow rate of the city water through the heat exchanger regulated
the coolant temperature. The city water flow rate was controlled by a regulating valve
that could be adjusted to the desired temperature. The heat capacity of the additional
coolant slowed the engine's thermal response to changes in the operating conditions.
2.3 Measurement Techniques
An extensive diagnostic system was implemented on the test engine to measure oil
consumption, blowby, and the in-cylinder variables oil distribution in the piston-ring-
pack, cylinder pressure, land pressures, and liner temperatures. In this section, the
applied experimental techniques are described and discussed.
2.3.1 Total Output Measurements
2.3.1.1 Oil Consumption
Typical oil consumption rates of modem passenger car engines are on the order of 10
g/hour. Due to the small amount of oil consumption, its measurement has been always a
challenging task for researchers in the automotive industry. However, several oil
consumption measurement methods have been developed. Traditional methods such as
weight and drain, and continuous weight method require several hours of engine
operation. The length of the time required for each measurement introduces also
potential interferences with other mechanisms and produces erratic results. For example,
27
it is well known that the oil consumption rate measurements can be negative due to the
dilution of fuel in the engine oil.
Other methods, such as the radioactive tracer methods, have been developed to
determine oil consumption by adding radioactive tracers into the oil and measuring the
concentration of the tracer in the exhaust gases. The measurement times of these
methods are on the order of several minutes, but the handling of the radioactive material
requires special equipment and procedures.
One alternative tracer method to measure oil consumption is the sulfur tracer
technique. This technique requires high sulfur oil and low sulfur fuel, and monitors the
sulfur content in the exhaust gases to determine the engine oil consumption rate.
Researchers in the automotive industry have successfully demonstrated the capability of
the sulfur tracer technique to measure oil consumption during steady state and transient
operating conditions [47][48][49][50][51]. Moreover, this method has the capability to
measure the contribution of oil entrained in the blowby gases to total oil consumption.
The contribution of the blowby gas to oil consumption can be obtained by determining
the difference in oil consumption with and without blowby gas return to the intake system.
For this study, the sulfur tracer technique was implemented on the test engine to measure
engine oil consumption. The specific requirements of the oil and fuel properties
necessary to apply the sulfur tracer technique are described next.
2.3.1.1.1 High Sulfur Oil
By considering typical oil consumption rates for this engine, and the accuracy of the
sulfur detector, it was found that the sulfur concentration in the oil needed to be around
1.5% [wt.] in order to have reliable measurements throughout the engine operating range.
Oil transport into the combustion chamber is in liquid and vapor form (evaporated oil).
As discussed in Section 4.2 the oil evaporation process is in general selective. The major
contribution to the total evaporation is from species at the light end. Therefore, a
consistent sulfur concentration in the oil is required throughout the oil distillation curve
in order to assume that the consumed oil (in liquid and vapor form) in the exhaust has the
same concentration of sulfur as in the original oil. Only then, can the sulfur
concentration in the exhaust gas be used as indicator for the consumed oil. Lubrizol Corp.
28
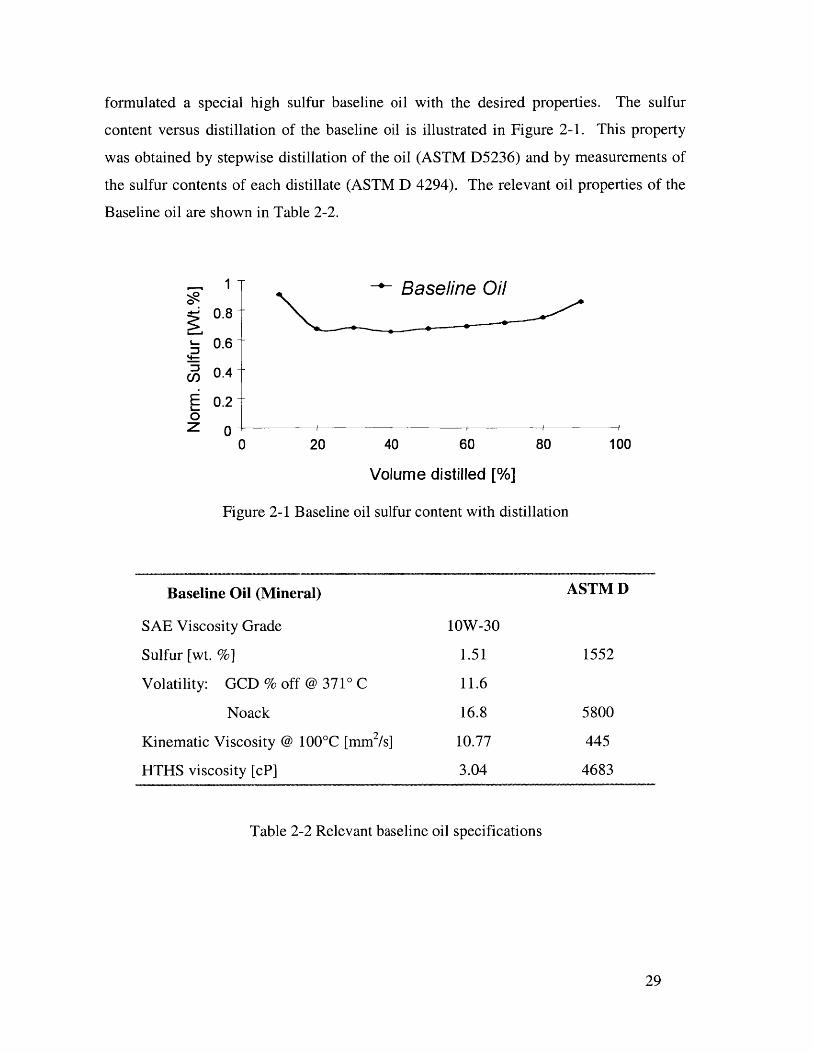
formulated a special high sulfur baseline oil with the desired properties. The sulfur
content versus distillation of the baseline oil is illustrated in Figure 2-1. This property
was obtained by stepwise distillation of the oil (ASTM D5236) and by measurements of
the sulfur contents of each distillate (ASTM D 4294). The relevant oil properties of the
Baseline oil are shown in Table 2-2.
.1Baseline Oil0.8--
0.6
0.4-
E 0.20Z 0 1
0 20 40 60 80 100
Volume distilled [%]
Figure 2-1 Baseline oil sulfur content with distillation
Baseline Oil (Mineral) ASTM D
SAE Viscosity Grade 1OW-30
Sulfur [wt. %] 1.51 1552
Volatility: GCD % off @ 371P C 11.6
Noack 16.8 5800
Kinematic Viscosity @ 1000C [mm 2 /s] 10.77 445
HTHS viscosity [cP] 3.04 4683
Table 2-2 Relevant baseline oil specifications
29

2.3.1.1.2 Low Sulfur Fuel
In order to utilize the sulfur in the engine oil as the tracer for oil consumption
measurements, it is necessary to minimize other sulfur sources. Sulfur in the gasoline can
contribute to the sulfur in the exhaust gases, and could mask the actual sulfur-level in the
withdrawn sample. To minimize this source of sulfur, a low sulfur research fuel was
used with a sulfur level below 2 ppm [wt.]. Table 2-3 summarizes the relevant fuel
specifications.
Low Sulfur Fuel
Sulfur [wt. ppm] < 2
Table 2-3 Relevant fuel specifications
2.3.1.1.3 Oil Consumption Measurement Setup
The oil consumption measurement setup, as shown in Figure 2-2, consists of four
elements. These are the exhaust sampling and analysis section, the air flow meter, the
lambda (k) sensor, and the data acquisition system.
Tm t r oni t Exhaust Sampling
Exhaust -Sulfur Analyzer
Engting Aapeqandsnsuatio
Intak ~ (Air Flow MeterFSo sak
FiuEn2-inemai ofocnupinmAusremnt e
30
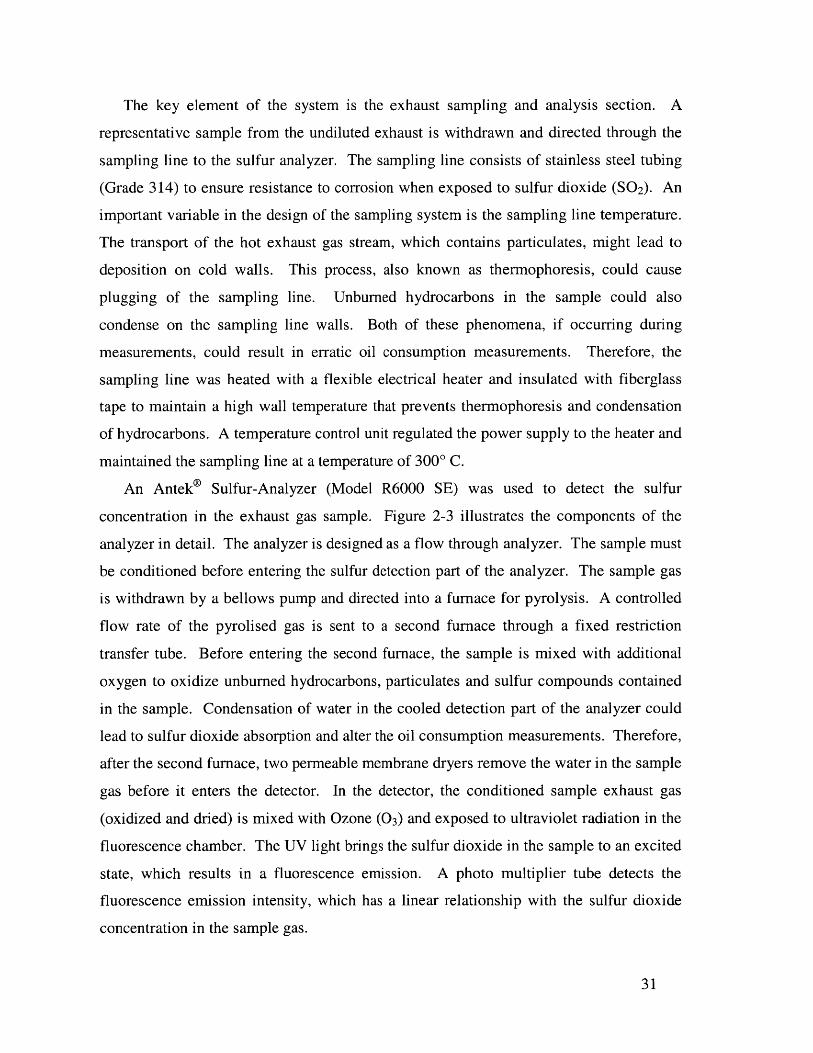
The key element of the system is the exhaust sampling and analysis section. A
representative sample from the undiluted exhaust is withdrawn and directed through the
sampling line to the sulfur analyzer. The sampling line consists of stainless steel tubing
(Grade 314) to ensure resistance to corrosion when exposed to sulfur dioxide (SO 2). An
important variable in the design of the sampling system is the sampling line temperature.
The transport of the hot exhaust gas stream, which contains particulates, might lead to
deposition on cold walls. This process, also known as thermophoresis, could cause
plugging of the sampling line. Unburned hydrocarbons in the sample could also
condense on the sampling line walls. Both of these phenomena, if occurring during
measurements, could result in erratic oil consumption measurements. Therefore, the
sampling line was heated with a flexible electrical heater and insulated with fiberglass
tape to maintain a high wall temperature that prevents thermophoresis and condensation
of hydrocarbons. A temperature control unit regulated the power supply to the heater and
maintained the sampling line at a temperature of 300' C.
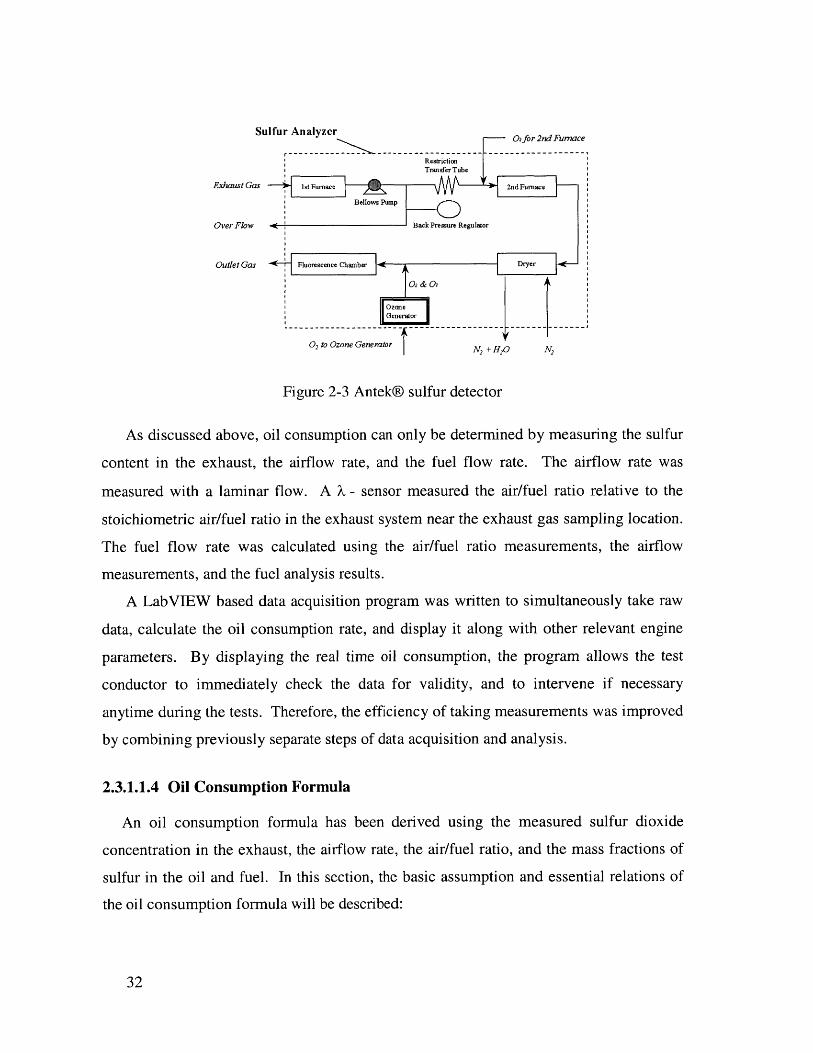
An Antek® Sulfur-Analyzer (Model R6000 SE) was used to detect the sulfur
concentration in the exhaust gas sample. Figure 2-3 illustrates the components of the
analyzer in detail. The analyzer is designed as a flow through analyzer. The sample must
be conditioned before entering the sulfur detection part of the analyzer. The sample gas
is withdrawn by a bellows pump and directed into a furnace for pyrolysis. A controlled
flow rate of the pyrolised gas is sent to a second furnace through a fixed restriction
transfer tube. Before entering the second furnace, the sample is mixed with additional
oxygen to oxidize unburned hydrocarbons, particulates and sulfur compounds contained
in the sample. Condensation of water in the cooled detection part of the analyzer could
lead to sulfur dioxide absorption and alter the oil consumption measurements. Therefore,
after the second furnace, two permeable membrane dryers remove the water in the sample
gas before it enters the detector. In the detector, the conditioned sample exhaust gas
(oxidized and dried) is mixed with Ozone (03) and exposed to ultraviolet radiation in the
fluorescence chamber. The UV light brings the sulfur dioxide in the sample to an excited
state, which results in a fluorescence emission. A photo multiplier tube detects the
fluorescence emission intensity, which has a linear relationship with the sulfur dioxide
concentration in the sample gas.
31
Sulfur Analyzer 02for2ndFurnace
Taser ubeExhaust Gas 1st Furnace 2ndFurnace
Bellow Pump
Over Flow Back Pressure Regulator
Outlet Gas s Dryer
02 & Os
i OzoneGenerator
02 to Ozone Generator N + H2w N
Figure 2-3 Antek@ sulfur detector
As discussed above, oil consumption can only be determined by measuring the sulfur
content in the exhaust, the airflow rate, and the fuel flow rate. The airflow rate was
measured with a laminar flow. A X - sensor measured the air/fuel ratio relative to the
stoichiometric air/fuel ratio in the exhaust system near the exhaust gas sampling location.
The fuel flow rate was calculated using the air/fuel ratio measurements, the airflow
measurements, and the fuel analysis results.
A LabVIEW based data acquisition program was written to simultaneously take raw
data, calculate the oil consumption rate, and display it along with other relevant engine
parameters. By displaying the real time oil consumption, the program allows the test
conductor to immediately check the data for validity, and to intervene if necessary
anytime during the tests. Therefore, the efficiency of taking measurements was improved
by combining previously separate steps of data acquisition and analysis.
2.3.1.1.4 Oil Consumption Formula
An oil consumption formula has been derived using the measured sulfur dioxide
concentration in the exhaust, the airflow rate, the air/fuel ratio, and the mass fractions of
sulfur in the oil and fuel. In this section, the basic assumption and essential relations of
the oil consumption formula will be described:
32
The consumed sulfur mass from the oil can be calculated from mass conservation,
filSoil = hS,Wet Exhaust - S,Fuel - S,Air (2.1)
where rnS'oi I rnS,Fuel 9S,Wet Exhaust S,Air are mass flow rates of the sulfur in oil, fuel, wet
exhaust gas, and air respectively. The sulfur content of air is negligible (in the order of
10 ppb), therefore
S,Air = 0 (2.2)
rhls Oil = rn0oi1 * SOs1'
rS,Fuel = mFuel * S,Fuel
S,Wet Exhaust =ImWet Exhaust * S,Wet Exhaust
(2.3)
(2.4)
(2.5)
where S,OilI S,Fuel 9S,Wet Exhaust are the mass fractions of sulfur in oil, fuel, and exhaust
respectively. Substituting equations (2.2), (2.3), (2.4), (2.5) into (2.1):
M lirWet Exhaust * JS,Wet Exhaust - rnFuel * JS,Fuel].
From mass conversation and
mAir L *Lst,rnFuel
(2.6)
(2.7)
where L is the air/fuel ratio, and LSt is the stoichiometric air/fuel ratio, it follows that
(2.8)rnWet Exhaust = ImAir + mFuel + tOil = I jAir ( Ls*
The mass fraction of sulfur in the exhaust can be written as
S,Wet Exhaust - WS,Wet Exhaust
M
M Wet Exhaust
With
(2.9)
33
Where MWet Exhaust is the molecular weight of wet exhaust, Ms is the molecular weight of
sulfur (32g/mol), and VS,Wet Exhaust is the molar fraction of sulfur in wet exhaust. With
V SO, Wet Exhaust = f S,Wet Exhaust (2.10)
where V'SO2,Wet Exhaust is the molar fraction of sulfur dioxide in wet exhaust. The molar
fraction of sulfur dioxide in the wet exhaust may be written as
OWe2Exhaust 2 Dry Exhaust (2.11)S sWet Exhaust
where P SO2 Dry Exhaust is the molar fraction of sulfur dioxide in dry exhaust, and fiH,0 and
n Wet Exhaust are the moles of water and wet exhaust respectively. Substituting (2.8), (2.9),
(2.10), (2.11) into (2.6) results in the final form of the oil consumption formula:
~ * SDyL M s n H20 _ s,Fuel (2.12)i l , - O1 SO,Dry Wet Exhaust SWet Exhaust
2.3.1.2 Blowby
Blowby is the leakage of combustion gases through the piston-ring-liner system into
the crankcase. It constitutes combustion gases, unburned mixture, and lubricating oil.
Some portion of the entrained oil is present as liquid particles. The blowby gases are in
general fed into the intake manifold by a positive crankcase ventilation system to prevent
the emission of pollutants in the blowby into the atmosphere. However, as for reasons
explained in Section 2.1 it was essential for this study to measure the blowby flow rate
into the crankcase. To do so, an accurate flow meter was installed that was based on the
Von Kirmin-vortex shedding principle. Details of the blowby flow meter are
summarized in Table 2-4.
34
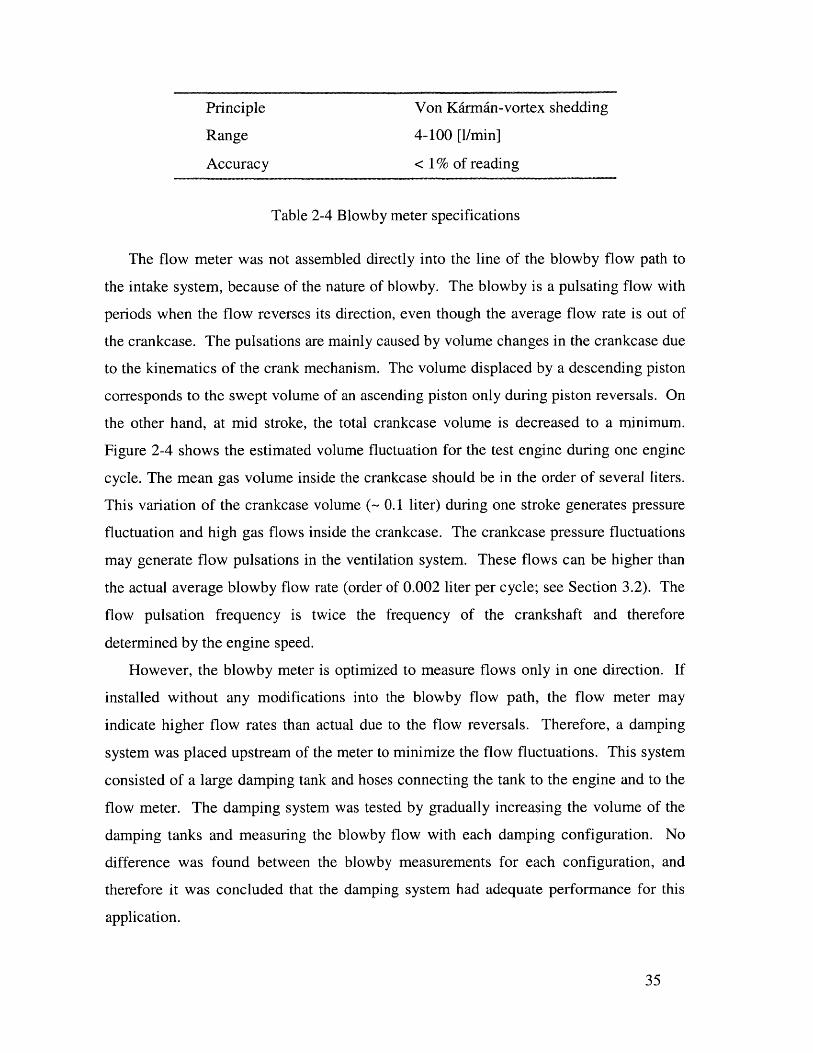
Principle Von Kirmain-vortex shedding
Range 4-100 [1/min]
Accuracy < 1% of reading
Table 2-4 Blowby meter specifications
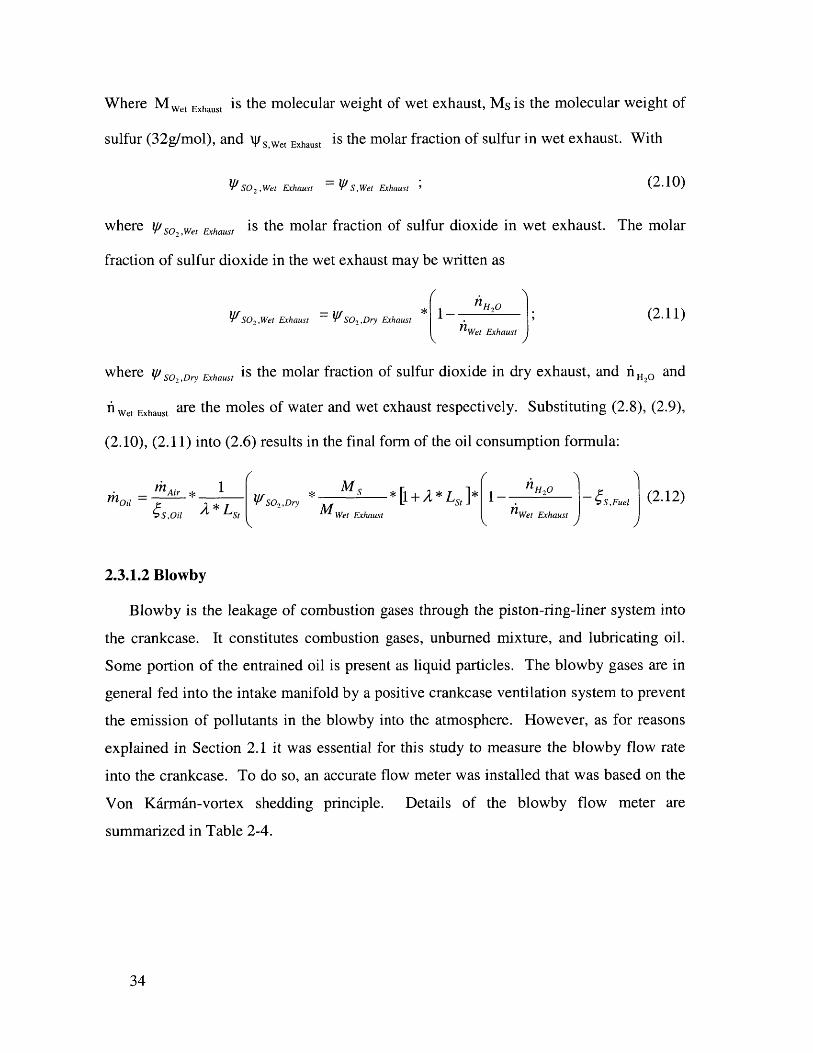
The flow meter was not assembled directly into the line of the blowby flow path to
the intake system, because of the nature of blowby. The blowby is a pulsating flow with
periods when the flow reverses its direction, even though the average flow rate is out of
the crankcase. The pulsations are mainly caused by volume changes in the crankcase due
to the kinematics of the crank mechanism. The volume displaced by a descending piston
corresponds to the swept volume of an ascending piston only during piston reversals. On
the other hand, at mid stroke, the total crankcase volume is decreased to a minimum.
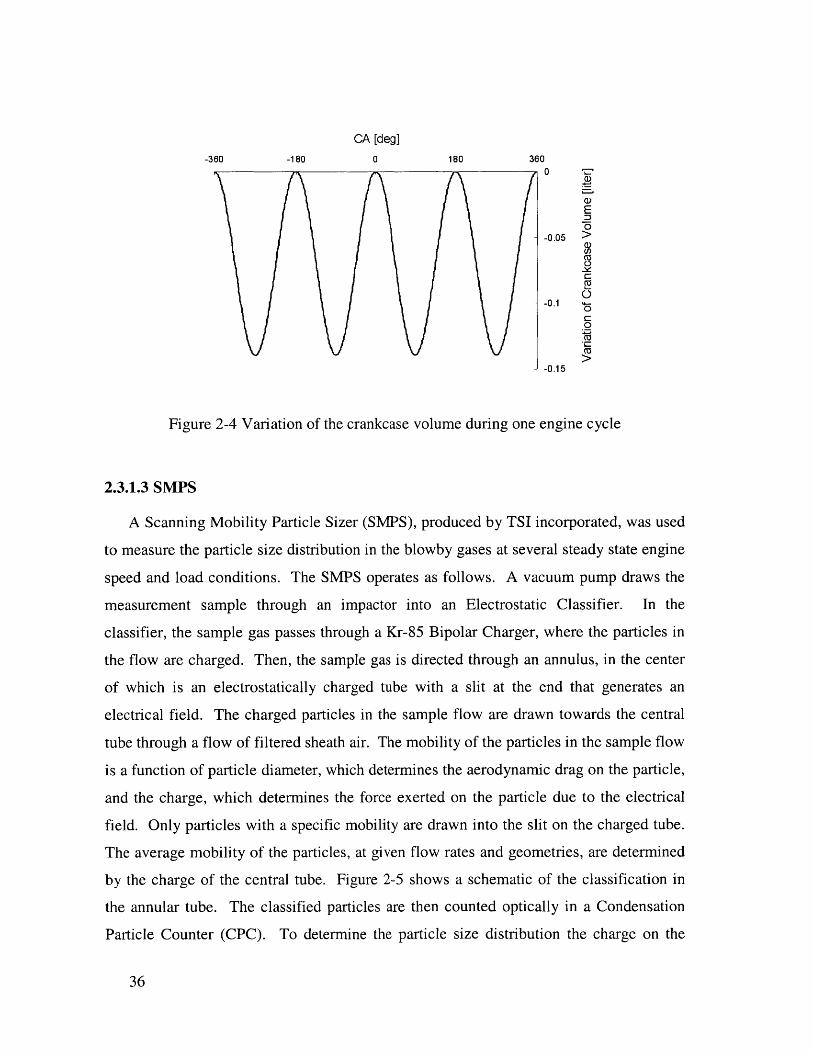
Figure 2-4 shows the estimated volume fluctuation for the test engine during one engine
cycle. The mean gas volume inside the crankcase should be in the order of several liters.
This variation of the crankcase volume (- 0.1 liter) during one stroke generates pressure
fluctuation and high gas flows inside the crankcase. The crankcase pressure fluctuations
may generate flow pulsations in the ventilation system. These flows can be higher than
the actual average blowby flow rate (order of 0.002 liter per cycle; see Section 3.2). The
flow pulsation frequency is twice the frequency of the crankshaft and therefore
determined by the engine speed.
However, the blowby meter is optimized to measure flows only in one direction. If
installed without any modifications into the blowby flow path, the flow meter may
indicate higher flow rates than actual due to the flow reversals. Therefore, a damping
system was placed upstream of the meter to minimize the flow fluctuations. This system
consisted of a large damping tank and hoses connecting the tank to the engine and to the
flow meter. The damping system was tested by gradually increasing the volume of the
damping tanks and measuring the blowby flow with each damping configuration. No
difference was found between the blowby measurements for each configuration, and
therefore it was concluded that the damping system had adequate performance for this
application.
35
CA [deg]
-360 -180 0 180 3600
-0.05
C)
- -0.1 L.
0
C)0
-0.15
Figure 2-4 Variation of the crankcase volume during one engine cycle
2.3.1.3 SMPS
A Scanning Mobility Particle Sizer (SMPS), produced by TSI incorporated, was used
to measure the particle size distribution in the blowby gases at several steady state engine
speed and load conditions. The SMPS operates as follows. A vacuum pump draws the
measurement sample through an impactor into an Electrostatic Classifier. In the
classifier, the sample gas passes through a Kr-85 Bipolar Charger, where the particles in
the flow are charged. Then, the sample gas is directed through an annulus, in the center
of which is an electrostatically charged tube with a slit at the end that generates an
electrical field. The charged particles in the sample flow are drawn towards the central
tube through a flow of filtered sheath air. The mobility of the particles in the sample flow
is a function of particle diameter, which determines the aerodynamic drag on the particle,
and the charge, which determines the force exerted on the particle due to the electrical
field. Only particles with a specific mobility are drawn into the slit on the charged tube.
The average mobility of the particles, at given flow rates and geometries, are determined
by the charge of the central tube. Figure 2-5 shows a schematic of the classification in
the annular tube. The classified particles are then counted optically in a Condensation
Particle Counter (CPC). To determine the particle size distribution the charge on the
36
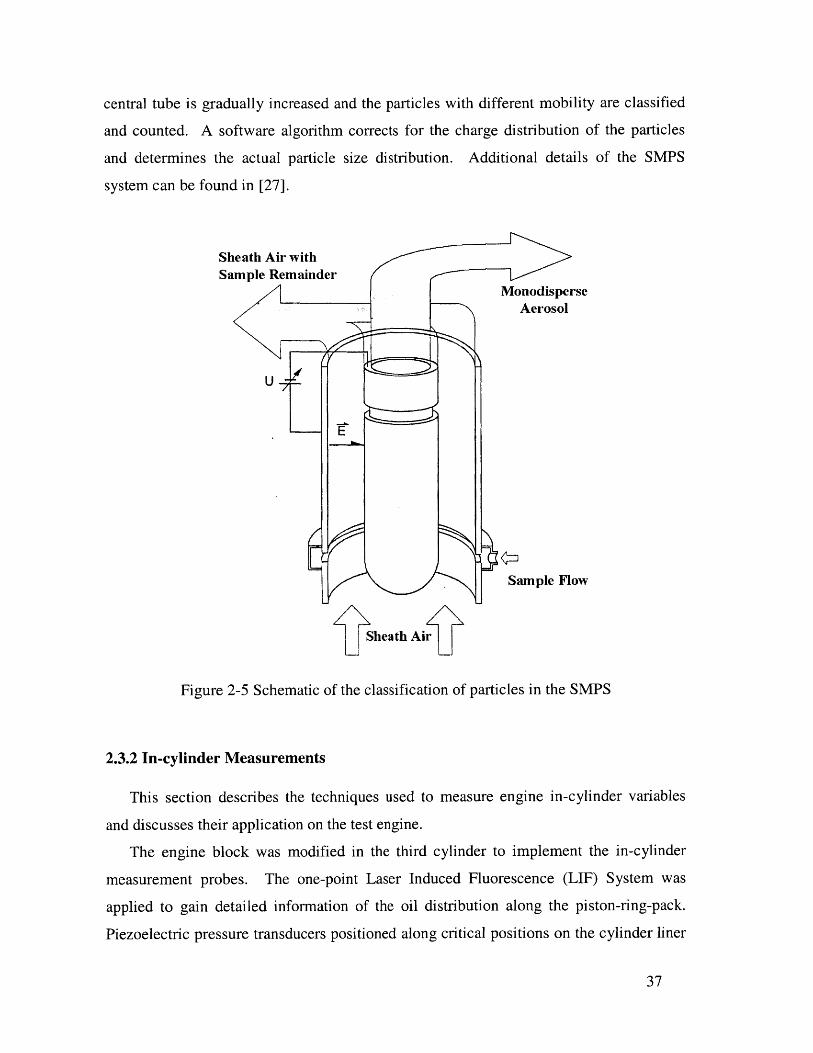
central tube is gradually increased and the particles with different mobility are classified
and counted. A software algorithm corrects for the charge distribution of the particles
and determines the actual particle size distribution. Additional details of the SMPS
system can be found in [27].
Sheath Air withSample Remainder
MonodisperseAerosol
-E
Sample Flow
Sheath Air
Figure 2-5 Schematic of the classification of particles in the SMPS
2.3.2 In-cylinder Measurements
This section describes the techniques used to measure engine in-cylinder variables
and discusses their application on the test engine.
The engine block was modified in the third cylinder to implement the in-cylinder
measurement probes. The one-point Laser Induced Fluorescence (LIF) System was
applied to gain detailed information of the oil distribution along the piston-ring-pack.
Piezoelectric pressure transducers positioned along critical positions on the cylinder liner
37
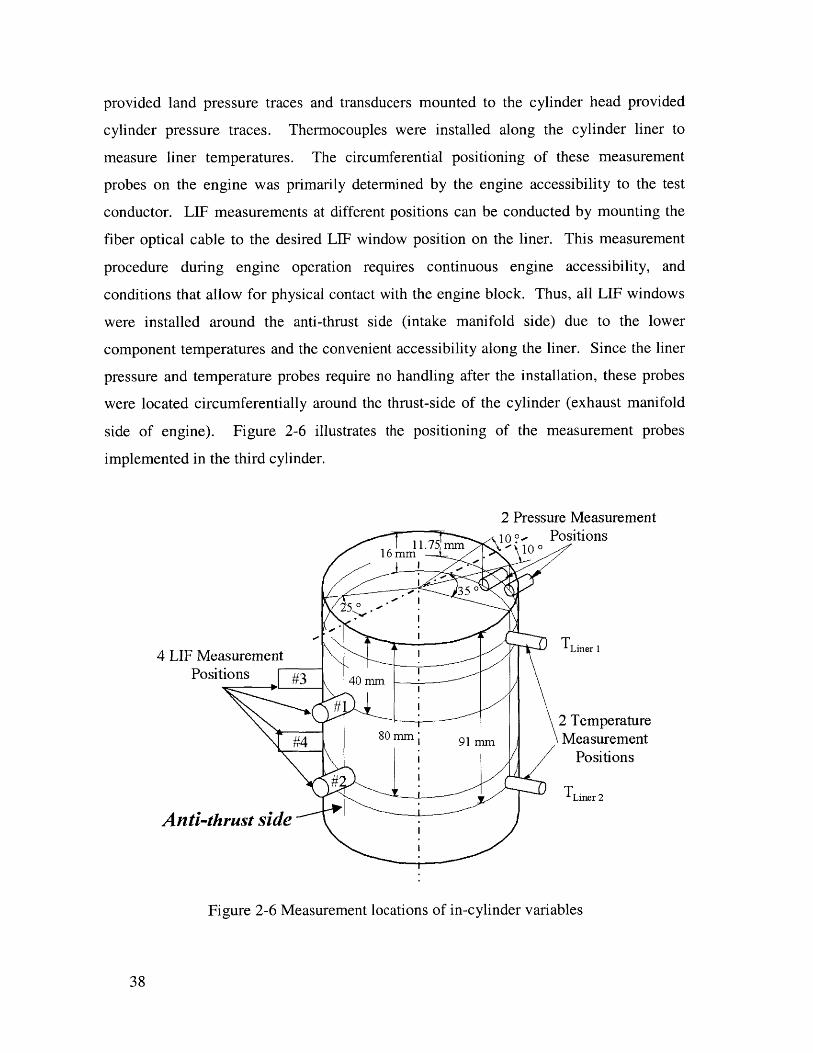
provided land pressure traces and transducers mounted to the cylinder head provided
cylinder pressure traces. Thermocouples were installed along the cylinder liner to
measure liner temperatures. The circumferential positioning of these measurement
probes on the engine was primarily determined by the engine accessibility to the test
conductor. LIF measurements at different positions can be conducted by mounting the
fiber optical cable to the desired LIF window position on the liner. This measurement
procedure during engine operation requires continuous engine accessibility, and
conditions that allow for physical contact with the engine block. Thus, all LIF windows
were installed around the anti-thrust side (intake manifold side) due to the lower
component temperatures and the convenient accessibility along the liner. Since the liner
pressure and temperature probes require no handling after the installation, these probes
were located circumferentially around the thrust-side of the cylinder (exhaust manifold
side of engine). Figure 2-6 illustrates the positioning of the measurement probes
implemented in the third cylinder.
2 Pressure Measurement
11.75 mm 10 Positions16 mm "-1
350
0T
4 LIF MeasurementPositions 40 mm
#2 Temperature
#4 1 91 mm MeasurementPositions
Anti-thrust side
Figure 2-6 Measurement locations of in-cylinder variables
38
2.3.2.1 Laser-Induced-Fluorescence (LIF) System
Fluorescence can be defined in a simplified description as a three-stage electronic
transition process. Certain organic molecules absorb electromagnetic radiation and are
excited from the ground electronic state E0 to an excited electronic state E1. After
excitation, the molecules undergo collisional deactivation with their environment. This
results in partial dissipation of their excitation energy to an intermediate electronic state
E1 *. Then the excited molecules return to a lower electronic state and radiation emission
occurs. The emitted radiation is known as fluorescence if the return from the excited to
the ground electronic state occurs without a significant time delay (longer than1 second).
A fluorescence molecule remains in the excited state usually for 10-8 to 10-9 seconds
before returning to the ground state. Due to the partial dissipation of energy in the
excited state, the emitted radiation energy is lower than the corresponding absorbed
radiation and thus has a longer wavelength.
In this study, the Laser Induced Fluorescence (LIF) System was used to quantify the
oil film thickness (OFT) between the piston rings and liner, and to quantify the oil
accumulation on the piston lands during engine operation. The LIF System was
developed at the Sloan Automotive Laboratory (MIT) and its capabilities were
demonstrated in previous studies [28][29][30][32][33]. In these studies, oil was doped
with fluorescing dye to increase the natural fluorescence activity of the engine oil to
enable the measurements of oil film thickness in the piston-ring-liner system. It was
theoretically demonstrated that for low dye concentration and thin lubricant films, the
relationship between the film thickness and intensity of the light emitted from the dye
was linear. To increase this linear range to thicker films, such as in the piston-ring-pack
region, the concentration of the fluorescing dye was minimized. However, the dye
concentration was high enough to maximize the fluorescence signal to noise ratio [28].
For this application, the selected fluorescent dye was Coumarin 523 with a
concentration of 1.0 * 10-4 mol/liter in the lubricant, as suggested in [28]. The LIF
System can be described as follows: The laser beam, produced by a Helium-Cadmium
laser (441.6 nm), is directed through a bifurcated fiber optics cable into the LIF focusing
probe. In the probe, a conventional lens system focuses the laser light onto the
lubricating oil film on the piston and ring surface. The dye molecules solved in the oil
39
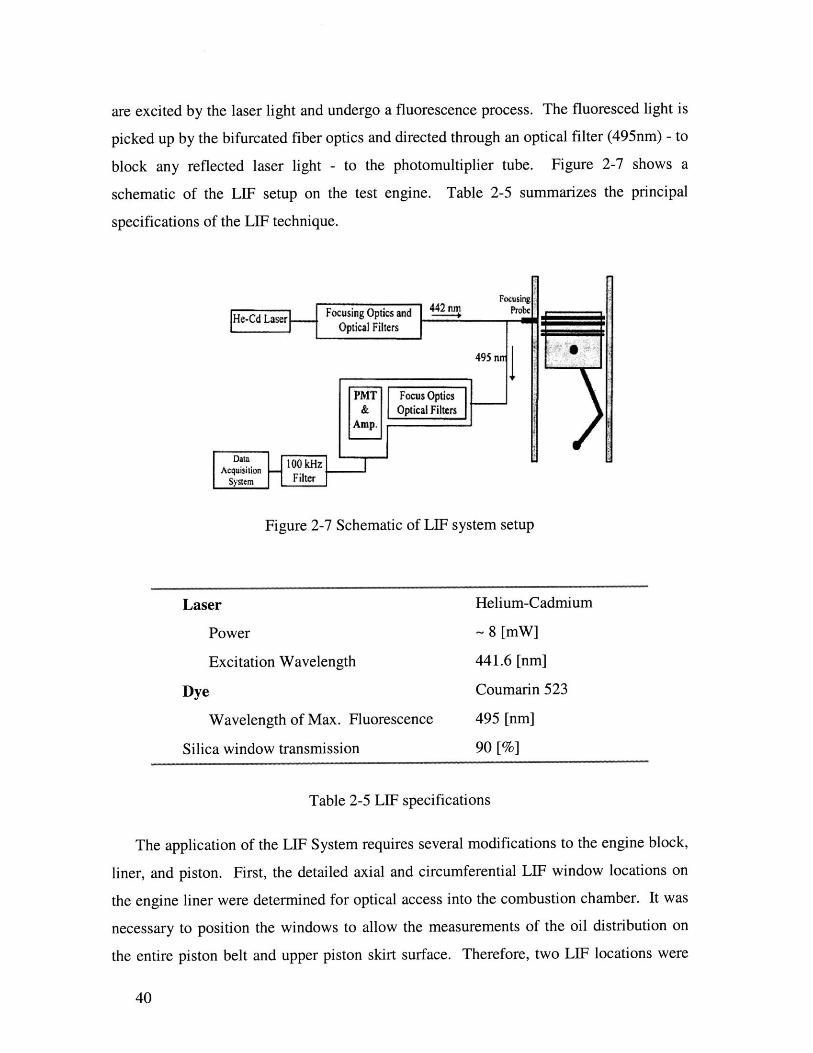
are excited by the laser light and undergo a fluorescence process. The fluoresced light is
picked up by the bifurcated fiber optics and directed through an optical filter (495nm) - to
block any reflected laser light - to the photomultiplier tube. Figure 2-7 shows a
schematic of the LIF setup on the test engine. Table 2-5 summarizes the principal
specifications of the LIF technique.
Focusing
re-Cd Laser an
495 nff
PMT Focus Optics& Optical Fitters
SYS= Filter
Figure 2-7 Schematic of LIF system setup
Laser Helium-Cadmium
Power - 8 [mW]
Excitation Wavelength 441.6 [nm]
Dye Coumarin 523
Wavelength of Max. Fluorescence 495 [nm]
Silica window transmission 90 [%]
Table 2-5 LIF specifications
The application of the LIF System requires several modifications to the engine block,
liner, and piston. First, the detailed axial and circumferential LIF window locations on
the engine liner were determined for optical access into the combustion chamber. It was
necessary to position the windows to allow the measurements of the oil distribution on
the entire piston belt and upper piston skirt surface. Therefore, two LIF locations were
40
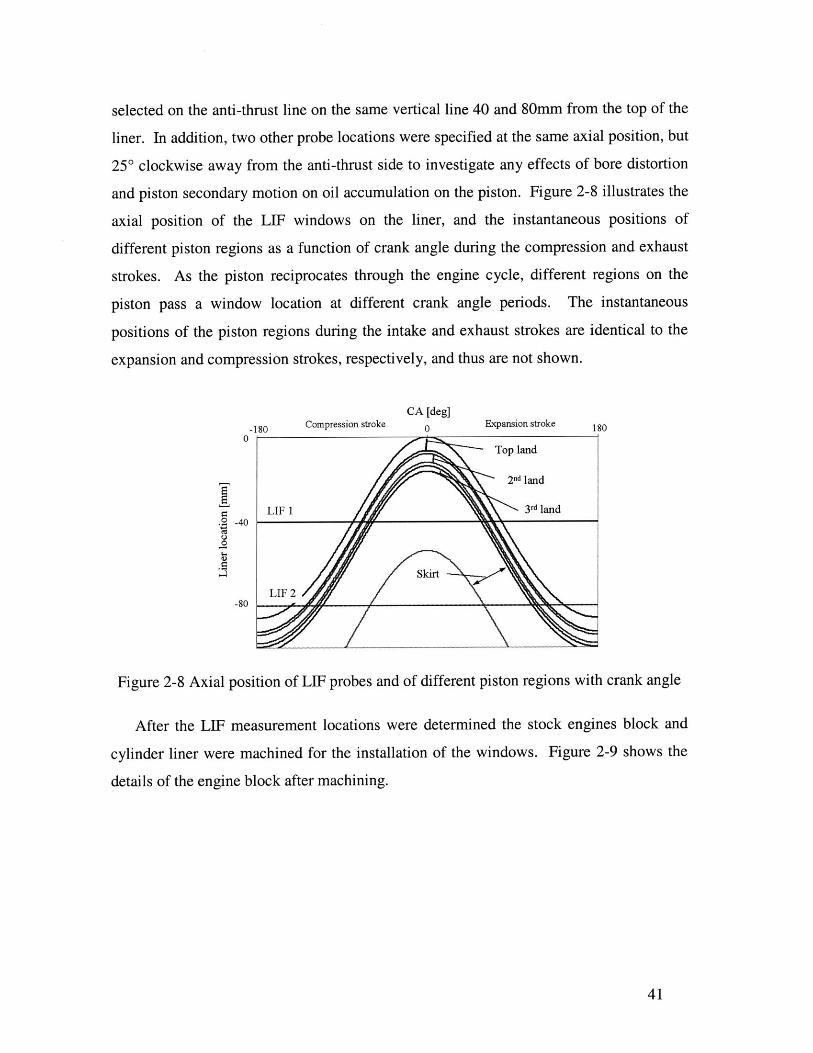
selected on the anti-thrust line on the same vertical line 40 and 80mm from the top of the
liner. In addition, two other probe locations were specified at the same axial position, but
250 clockwise away from the anti-thrust side to investigate any effects of bore distortion
and piston secondary motion on oil accumulation on the piston. Figure 2-8 illustrates the
axial position of the LIF windows on the liner, and the instantaneous positions of
different piston regions as a function of crank angle during the compression and exhaust
strokes. As the piston reciprocates through the engine cycle, different regions on the
piston pass a window location at different crank angle periods. The instantaneous
positions of the piston regions during the intake and exhaust strokes are identical to the
expansion and compression strokes, respectively, and thus are not shown.
CA [deg]
-180 Compression stroke 0 Expansion stroke 1800
Top land
2nd land
0 LIF 1 3 rd land.2 -40
LIF 2-80
Figure 2-8 Axial position of LIF probes and of different piston regions with crank angle
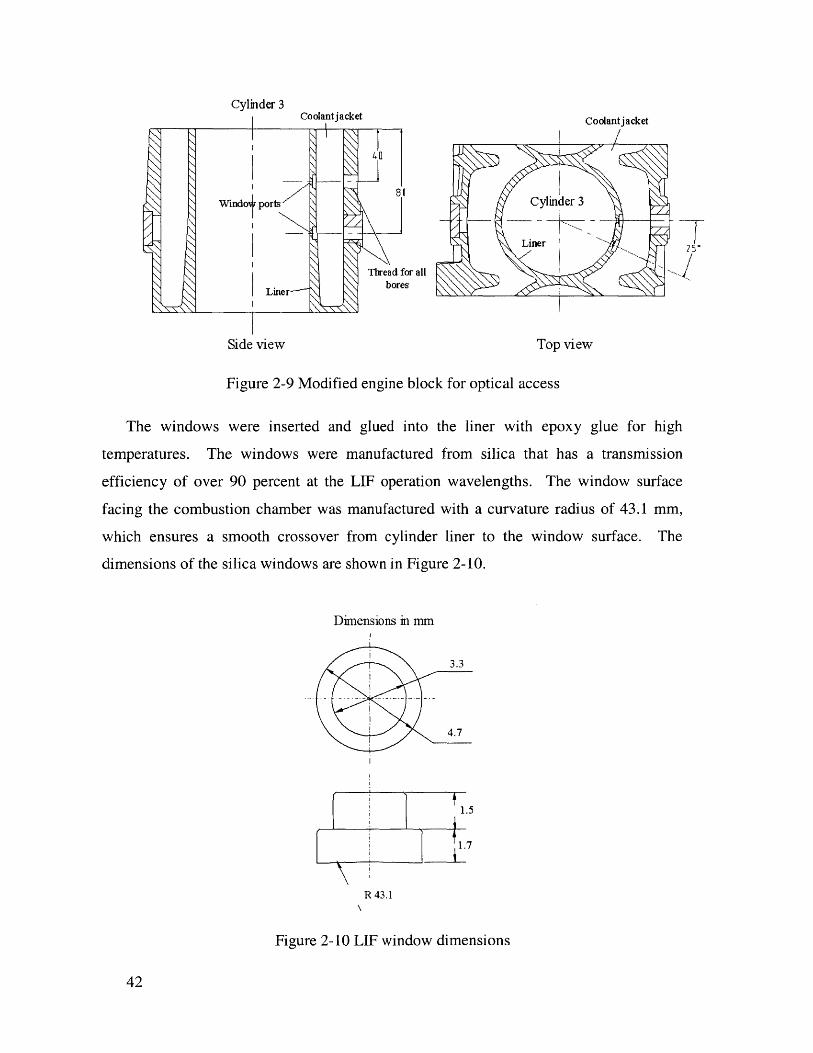
After the LIF measurement locations were determined the stock engines block and
cylinder liner were machined for the installation of the windows. Figure 2-9 shows the
details of the engine block after machining.
41
Cylinder 3Coolantjacket
Cylinder 3
Liner 25S
Top view
Figure 2-9 Modified engine block for optical access
The windows were inserted and glued into the liner with epoxy glue for high
temperatures. The windows were manufactured from silica that has a transmission
efficiency of over 90 percent at the LIF operation wavelengths. The window surface
facing the combustion chamber was manufactured with a curvature radius of 43.1 mm,
which ensures a smooth crossover from cylinder liner to the window surface. The
dimensions of the silica windows are shown in Figure 2-10.
Dimensions in mm
a
3.3
1~4.7
1.5
1.7
R 43.1
Figure 2-10 LIF window dimensions
42
Coolant jacket
Thread for allbores
Windo ports
Lin
Side view
er-
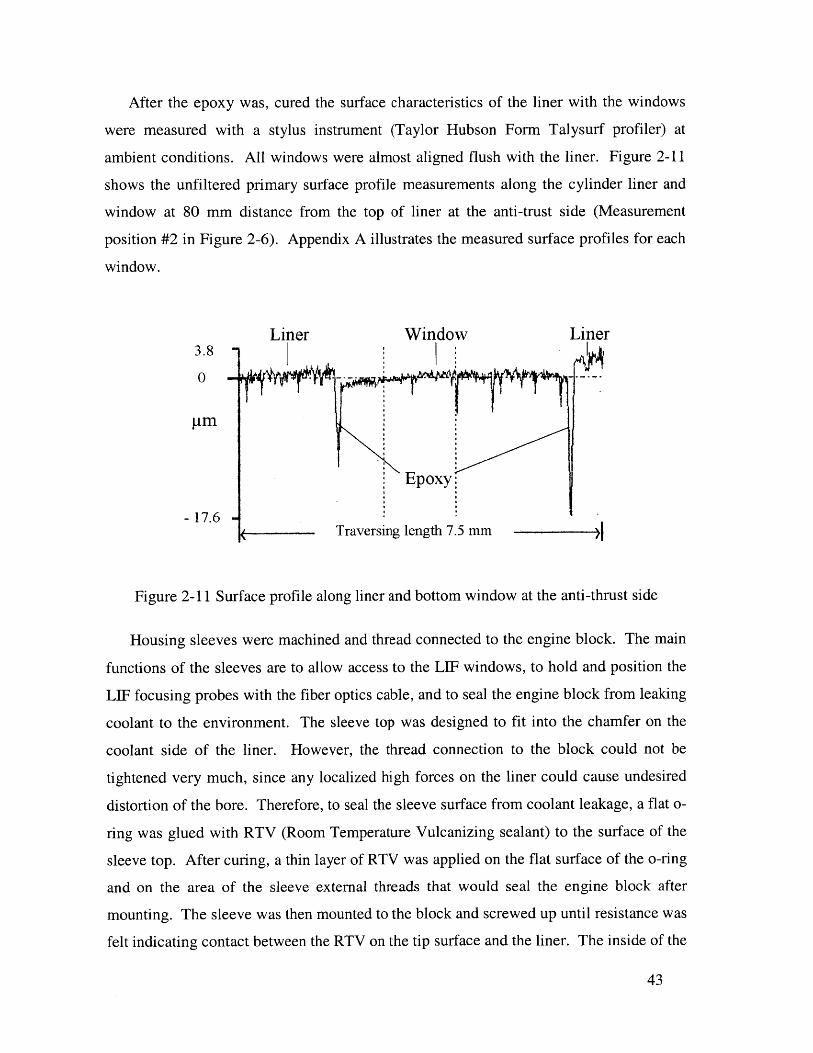
After the epoxy was, cured the surface characteristics of the liner with the windows
were measured with a stylus instrument (Taylor Hubson Form Talysurf profiler) at
ambient conditions. All windows were almost aligned flush with the liner. Figure 2-11
shows the unfiltered primary surface profile measurements along the cylinder liner and
window at 80 mm distance from the top of liner at the anti-trust side (Measurement
position #2 in Figure 2-6). Appendix A illustrates the measured surface profiles for each
window.
Liner Window Liner3.8
0-
pm
Epoxy:
-17.6Traversing length 7.5 mm
Figure 2-11 Surface profile along liner and bottom window at the anti-thrust side
Housing sleeves were machined and thread connected to the engine block. The main
functions of the sleeves are to allow access to the LIF windows, to hold and position the
LIF focusing probes with the fiber optics cable, and to seal the engine block from leaking
coolant to the environment. The sleeve top was designed to fit into the chamfer on the
coolant side of the liner. However, the thread connection to the block could not be
tightened very much, since any localized high forces on the liner could cause undesired
distortion of the bore. Therefore, to seal the sleeve surface from coolant leakage, a flat o-
ring was glued with RTV (Room Temperature Vulcanizing sealant) to the surface of the
sleeve top. After curing, a thin layer of RTV was applied on the flat surface of the o-ring
and on the area of the sleeve external threads that would seal the engine block after
mounting. The sleeve was then mounted to the block and screwed up until resistance was
felt indicating contact between the RTV on the tip surface and the liner. The inside of the
43
sleeve was inspected and any RTV smearing onto the window was removed with cotton
tabs.
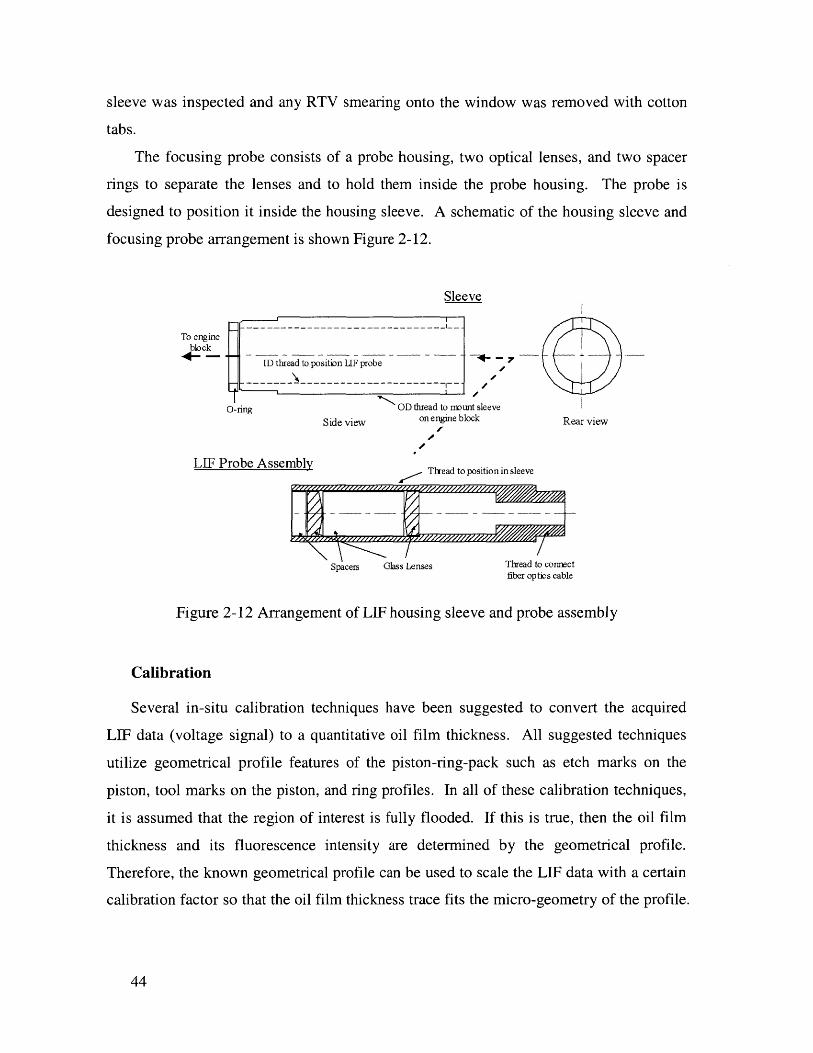
The focusing probe consists of a probe housing, two optical lenses, and two spacer
rings to separate the lenses and to hold them inside the probe housing. The probe is
designed to position it inside the housing sleeve. A schematic of the housing sleeve and
focusing probe arrangement is shown Figure 2-12.
Sleeve
To engineblock____ _
ID thread to position LIF probe
o-ring OD thread to mount sleeve
Side view on engine block Rear view
LIF Probe Assembly Tfread to positionin sleeve
Spacers Glass Lenses Thread to connectfiber optics cable
Figure 2-12 Arrangement of LIF housing sleeve and probe assembly
Calibration
Several in-situ calibration techniques have been suggested to convert the acquired
LIF data (voltage signal) to a quantitative oil film thickness. All suggested techniques
utilize geometrical profile features of the piston-ring-pack such as etch marks on the
piston, tool marks on the piston, and ring profiles. In all of these calibration techniques,
it is assumed that the region of interest is fully flooded. If this is true, then the oil film
thickness and its fluorescence intensity are determined by the geometrical profile.
Therefore, the known geometrical profile can be used to scale the LIEF data with a certain
calibration factor so that the oil film thickness trace fits the micro-geometry of the profile.
44
This obtained factor is then used to quantify the oil film thickness along the piston and
between rings and liner.
The utilized calibration profile must feature certain characteristics. Its characteristic
depth (which is equal to the oil film depth if the profile is fully flooded) needs to be in a
range of the LIF technique that is linear and has a high signal to noise ratio. On the other
hand, the geometrical profile on the piston-ring-pack moves during engine operation
between the digitized consecutive data points. Therefore, a minimum characteristic
length is required for the profile to be able to trace it. This length depends on the data
acquisition rate and on the location of the LIF windows on the liner. The acquisition rate
and window location determine the traveled distance of the calibration profile on the
piston between two consecutive measurement points.
For this study, the LIF data acquisition rate was 2000 points per crankshaft
revolution. Using this rate the calibration profile was able to move a distance of at most
140 Am between two consecutive data points. In order to ensure that there are enough
data points (i.e. three points) to trace the oil film on the profile, a characteristic length of
420 pm was necessary. The ring surface profiles could not be used for calibration,
because a fully flooded running surface can not be assumed over the entire stroke and the
signal to noise ratio is to low due to the thin oil film between ring and liner. Moreover,
effects of piston tilt and ring twist on the running surface profile could have impacted the
calibration efforts. The piston machining marks on the piston lands and skirt were also
unsuitable. Even though the marks have a sinusoidal pattern with a peak to valley height
of 10 Am, their distance is about only 300 Am, which is significantly shorter than the
required characteristic length.
Therefore, to calibrate the LIF signal two scratch marks with an axial length of 0.5
mm and different depths were machined on the upper part of the piston skirt. The
positions and dimensions of the marks are shown in Figure 2-13.
45
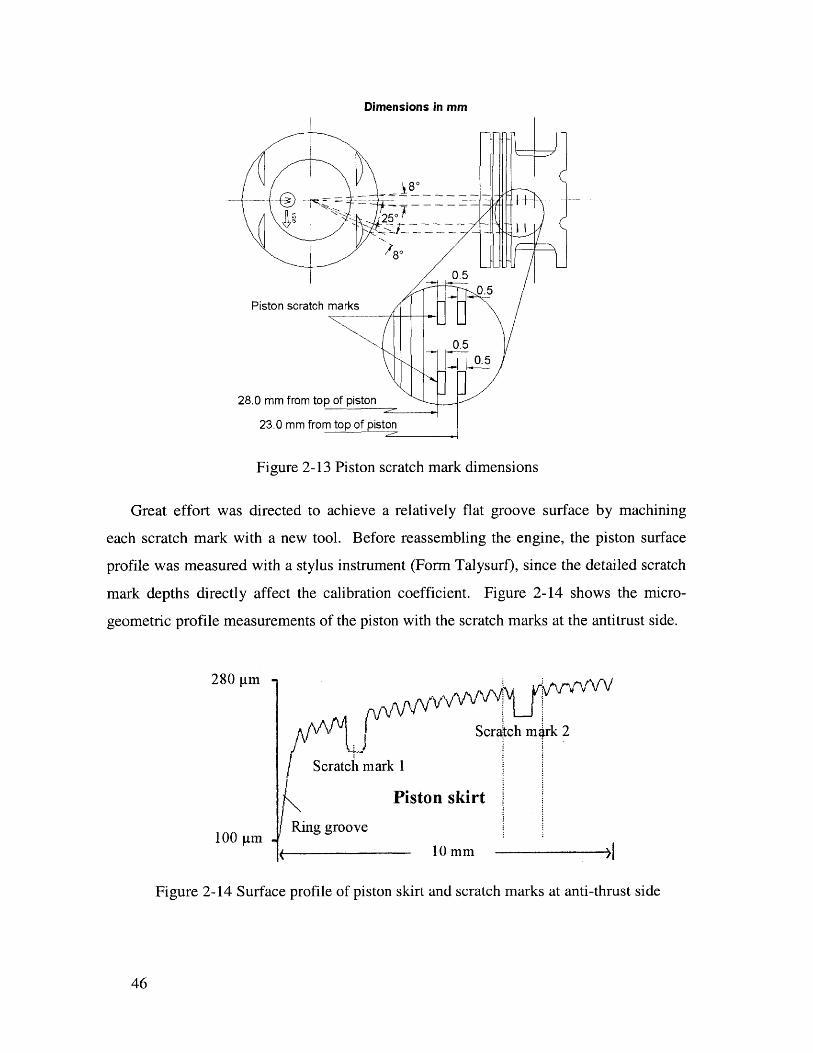
Dimensions in mm
25'5
0.5
Piston scratch marks0.
28.0 mm from top of piston
23.0 mm from top of piston
Figure 2-13 Piston scratch mark dimensions
Great effort was directed to achieve a relatively flat groove surface by machining
each scratch mark with a new tool. Before reassembling the engine, the piston surface
profile was measured with a stylus instrument (Form Talysurf), since the detailed scratch
mark depths directly affect the calibration coefficient. Figure 2-14 shows the micro-
geometric profile measurements of the piston with the scratch marks at the antitrust side.
280 pm -V-J
Scratch mark 2
Scratch mark 1
Piston skirt
Ring groove100 pm
10 mm
Figure 2-14 Surface profile of piston skirt and scratch marks at anti-thrust side
46
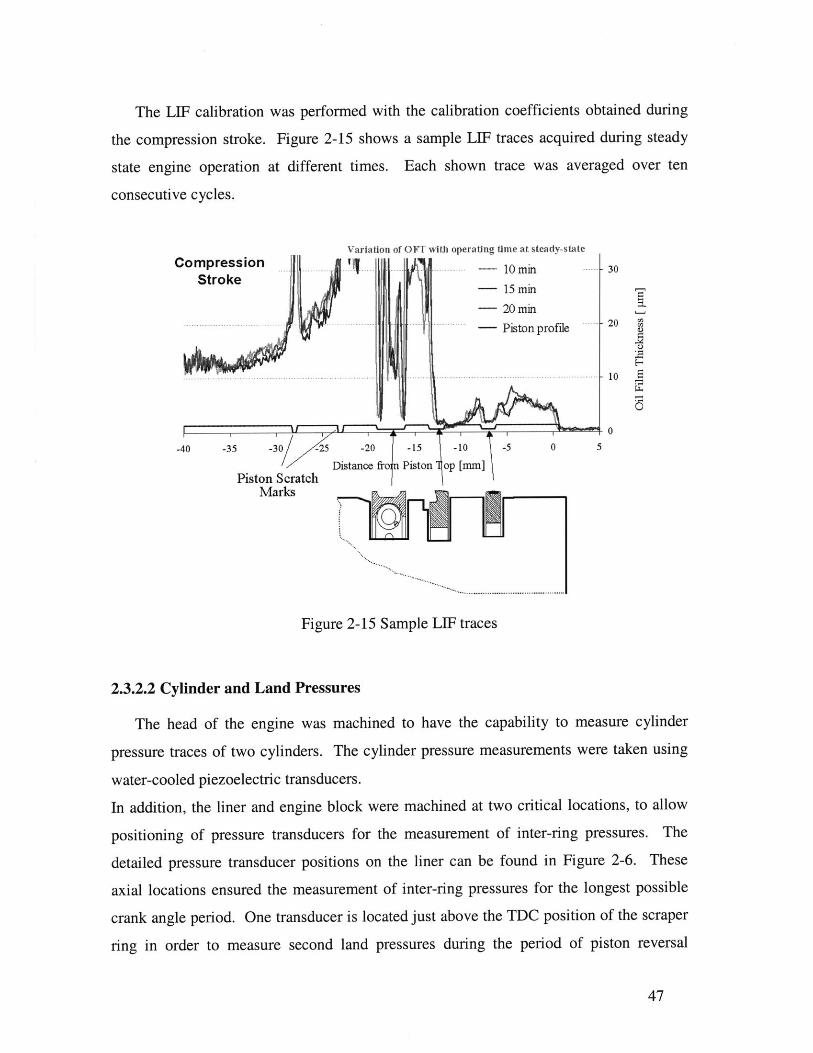
The LIF calibration was performed with the calibration coefficients obtained during
the compression stroke. Figure 2-15 shows a sample LIF traces acquired during steady
state engine operation at different times. Each shown trace was averaged over ten
consecutive cycles.
CVartation of OFT with operating time at steady-state
Stro ke 20) mirnompression
-0n
......... ...... .. Piston profle
- 30
-20
10
0
-40 -35 -30 25
Piston ScratchMarks
-20 -15 -10 -5 0
Distance frojn Piston op [mm]
7...r
Figure 2-15 Sample LIF traces
2.3.2.2 Cylinder and Land Pressures
The head of the engine was machined to have the capability to measure cylinder
pressure traces of two cylinders. The cylinder pressure measurements were taken using
water-cooled piezoelectric transducers.
In addition, the liner and engine block were machined at two critical locations, to allow
positioning of pressure transducers for the measurement of inter-ring pressures. The
detailed pressure transducer positions on the liner can be found in Figure 2-6. These
axial locations ensured the measurement of inter-ring pressures for the longest possible
crank angle period. One transducer is located just above the TDC position of the scraper
ring in order to measure second land pressures during the period of piston reversal
47
5
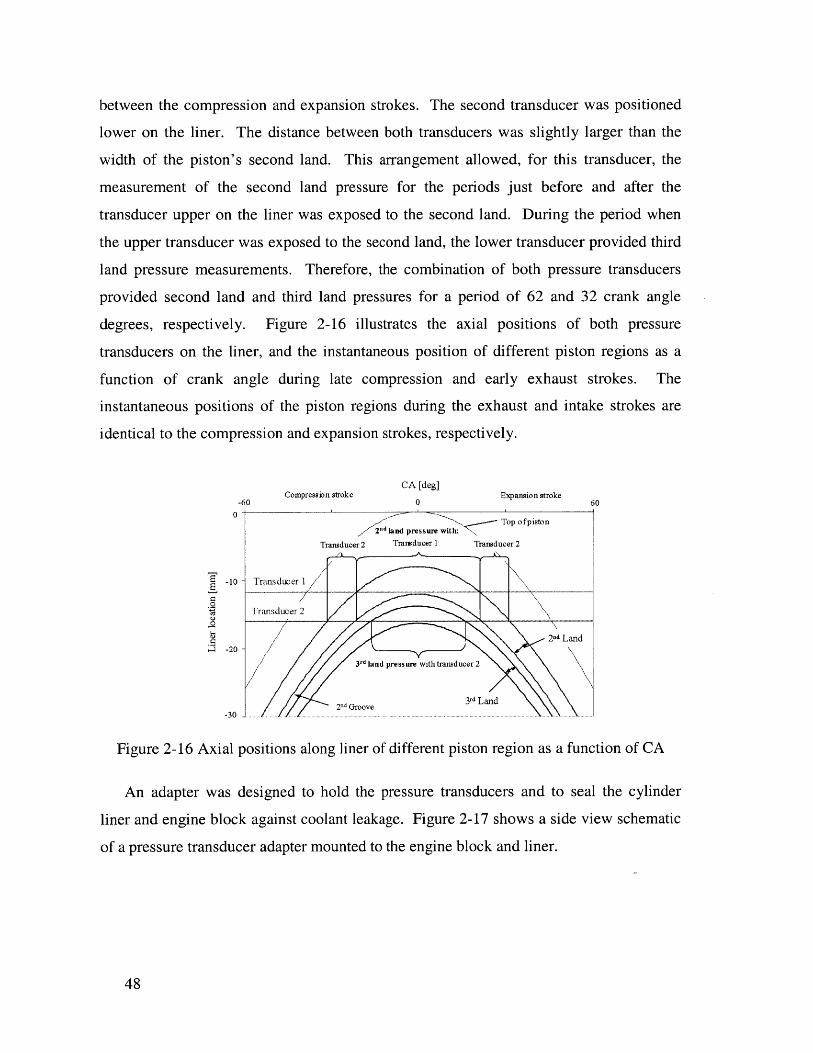
between the compression and expansion strokes. The second transducer was positioned
lower on the liner. The distance between both transducers was slightly larger than the
width of the piston's second land. This arrangement allowed, for this transducer, the
measurement of the second land pressure for the periods just before and after the
transducer upper on the liner was exposed to the second land. During the period when
the upper transducer was exposed to the second land, the lower transducer provided third
land pressure measurements. Therefore, the combination of both pressure transducers
provided second land and third land pressures for a period of 62 and 32 crank angle
degrees, respectively. Figure 2-16 illustrates the axial positions of both pressure
transducers on the liner, and the instantaneous position of different piston regions as a
function of crank angle during late compression and early exhaust strokes. The
instantaneous positions of the piston regions during the exhaust and intake strokes are
identical to the compression and expansion strokes, respectively.
CA [deg]
-60 Compression stroke 0 Expansion stroke 60
0nd.srTop ofpiston
Z'd land pressurne with:;
Transducer 2 Transducer 1 Transducer 2
-10 Transducer I \
Transducer 2
2-d Land4 -20-
3rd land pressure with transducer 2
2 nd Groove
Figure 2-16 Axial positions along liner of different piston region as a function of CA
An adapter was designed to hold the pressure transducers and to seal the cylinder
liner and engine block against coolant leakage. Figure 2-17 shows a side view schematic
of a pressure transducer adapter mounted to the engine block and liner.
48
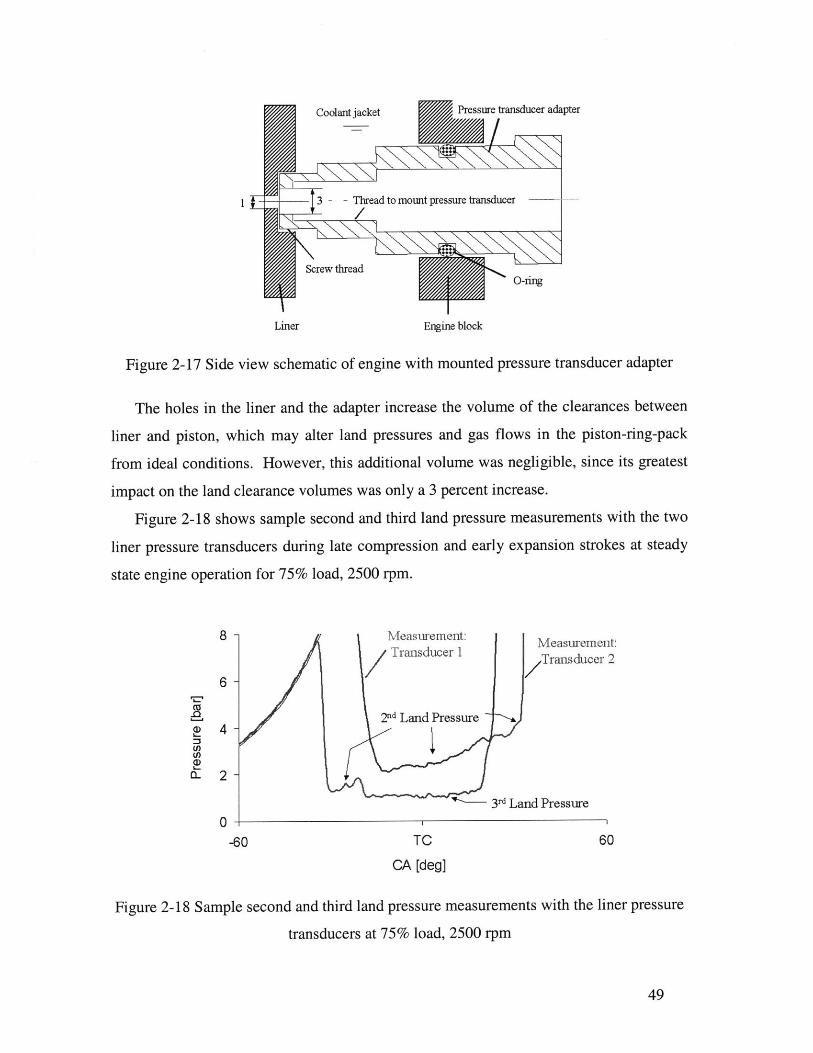
Coolant jacket Psre transducer adapter
3 - Thread to mount pressure transducer
Screw threadO-ring
Liner Engine block
Figure 2-17 Side view schematic of engine with mounted pressure transducer adapter
The holes in the liner and the adapter increase the volume of the clearances between
liner and piston, which may alter land pressures and gas flows in the piston-ring-pack
from ideal conditions. However, this additional volume was negligible, since its greatest
impact on the land clearance volumes was only a 3 percent increase.
Figure 2-18 shows sample second and third land pressure measurements with the two
liner pressure transducers during late compression and early expansion strokes at steady
state engine operation for 75% load, 2500 rpm.
8 - Measuremenit: Measurement:/ Transducer 1 Transducer 2
6-
2nd Land PressureS 4-
0 2
3rd Land Pressure
0
-60 TC 60
CA [deg]
Figure 2-18 Sample second and third land pressure measurements with the liner pressure
transducers at 75% load, 2500 rpm
49
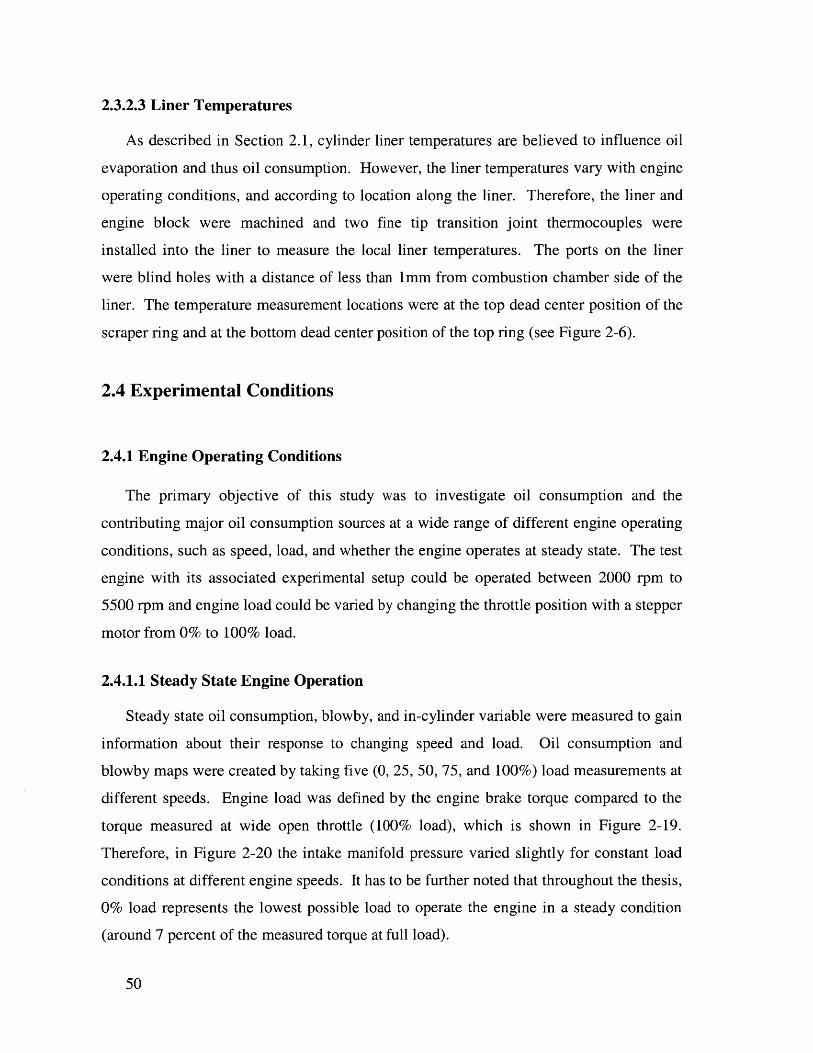
2.3.2.3 Liner Temperatures
As described in Section 2.1, cylinder liner temperatures are believed to influence oil
evaporation and thus oil consumption. However, the liner temperatures vary with engine
operating conditions, and according to location along the liner. Therefore, the liner and
engine block were machined and two fine tip transition joint thermocouples were
installed into the liner to measure the local liner temperatures. The ports on the liner
were blind holes with a distance of less than 1mm from combustion chamber side of the
liner. The temperature measurement locations were at the top dead center position of the
scraper ring and at the bottom dead center position of the top ring (see Figure 2-6).
2.4 Experimental Conditions
2.4.1 Engine Operating Conditions
The primary objective of this study was to investigate oil consumption and the
contributing major oil consumption sources at a wide range of different engine operating
conditions, such as speed, load, and whether the engine operates at steady state. The test
engine with its associated experimental setup could be operated between 2000 rpm to
5500 rpm and engine load could be varied by changing the throttle position with a stepper
motor from 0% to 100% load.
2.4.1.1 Steady State Engine Operation
Steady state oil consumption, blowby, and in-cylinder variable were measured to gain
information about their response to changing speed and load. Oil consumption and
blowby maps were created by taking five (0, 25, 50, 75, and 100%) load measurements at
different speeds. Engine load was defined by the engine brake torque compared to the
torque measured at wide open throttle (100% load), which is shown in Figure 2-19.
Therefore, in Figure 2-20 the intake manifold pressure varied slightly for constant load
conditions at different engine speeds. It has to be further noted that throughout the thesis,
0% load represents the lowest possible load to operate the engine in a steady condition
(around 7 percent of the measured torque at full load).
50
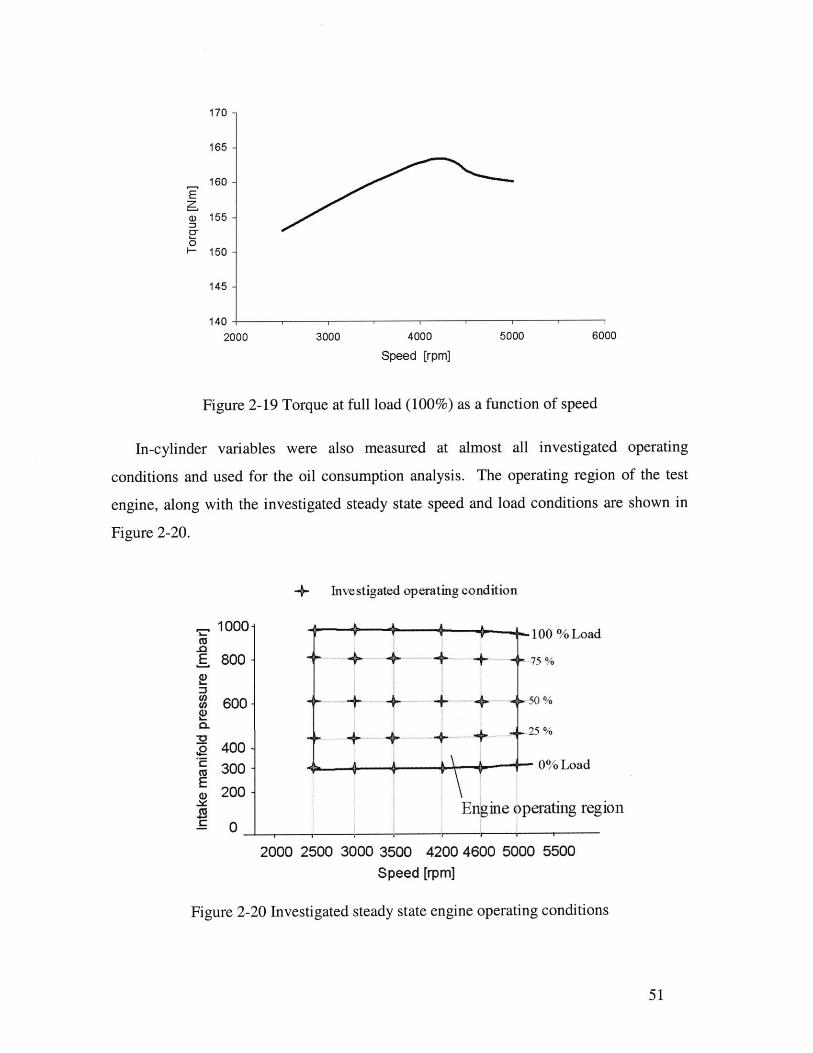
z
0
170 -
165 -
160 -
155 -
150 -
145 -
140
2000 3000 4000
Speed [rpm]
50006
6000
Figure 2-19 Torque at full load (100%) as a function of speed
In-cylinder variables were also measured at almost all investigated operating
conditions and used for the oil consumption analysis. The operating region of the test
engine, along with the investigated steady state speed and load conditions are shown in
Figure 2-20.
+ Investigated operating condition
++ 7-
. + .. .... +. .....
+. +.. +.... .....
+ .
100 %Load
50%
5%
-0% Load
Engine operating region
2000 2500 3000 3500 4200 4600 5000 5500Speed [rpm]
Figure 2-20 Investigated steady state engine operating conditions
51
"C
E
I...
CL
a-o
1000-
800 -
600 -
400-
300-200 -
0
I
-- ---
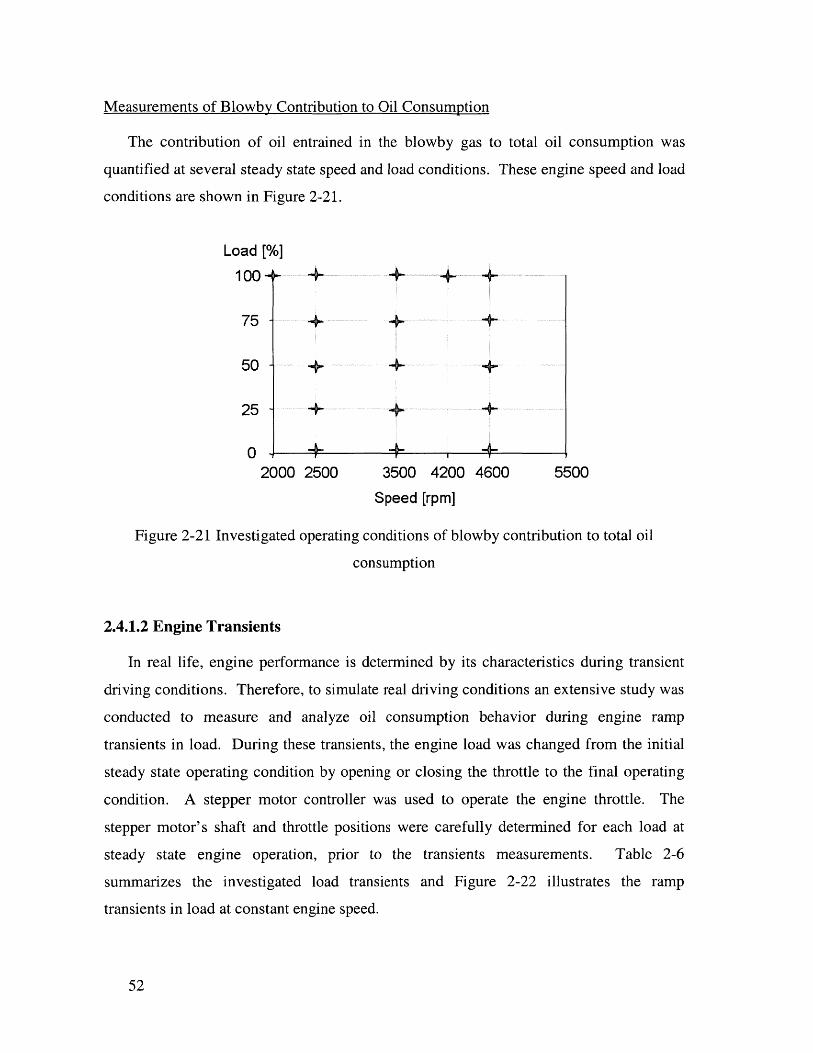
Measurements of Blowbv Contribution to Oil ConsumDtion
The contribution of oil entrained in the blowby gas to total oil consumption was
quantified at several steady state speed and load conditions. These engine speed and load
conditions are shown in Figure 2-21.
Load [%]
100-
75
50
251
02000
+
+
+
+
±--++
+
±
+
2500 3500
Speed
4200
[rpm]
±
+
+
4600 5500
Figure 2-21 Investigated operating conditions of blowby contribution to total oil
onsumption
2.4.1.2 Engine Transients
In real life, engine performance is determined by its characteristics during transient
driving conditions. Therefore, to simulate real driving conditions an extensive study was
conducted to measure and analyze oil consumption behavior during engine ramp
transients in load. During these transients, the engine load was changed from the initial
steady state operating condition by opening or closing the throttle to the final operating
condition. A stepper motor controller was used to operate the engine throttle. The
stepper motor's shaft and throttle positions were carefully determined for each load at
steady state engine operation, prior to the transients measurements. Table 2-6
summarizes the investigated load transients and Figure 2-22 illustrates the ramp
transients in load at constant engine speed.
52
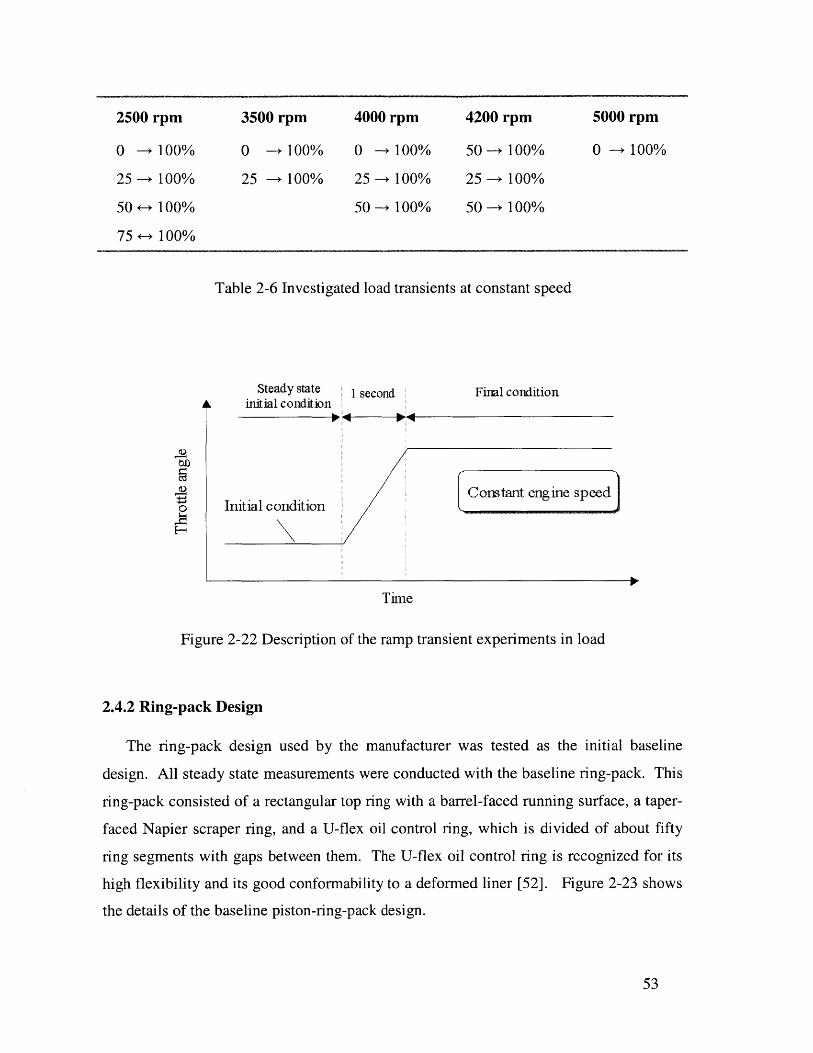
2500 rpm 3500 rpm 4000 rpm 4200 rpm 5000 rpm
0 -+100% 0 -+ 100% 0 -*100% 50-+100% 0 -*+100%
25 -- 100% 25 -+ 100% 25 --+ 100% 25 -+ 100%
50 <-* 100% 50--+100% 50 -100%
75 <-+ 100%
Table 2-6 Investigated load transients at constant speed
Steady state 1 seinitial condition
104
cond Final condition
Constant engine speedInitial condition
Time
Figure 2-22 Description of the ramp transient experiments in load
2.4.2 Ring-pack Design
The ring-pack design used by the manufacturer was tested as the initial baseline
design. All steady state measurements were conducted with the baseline ring-pack. This
ring-pack consisted of a rectangular top ring with a barrel-faced running surface, a taper-
faced Napier scraper ring, and a U-flex oil control ring, which is divided of about fifty
ring segments with gaps between them. The U-flex oil control ring is recognized for its
high flexibility and its good conformability to a deformed liner [52]. Figure 2-23 shows
the details of the baseline piston-ring-pack design.
53
o
0
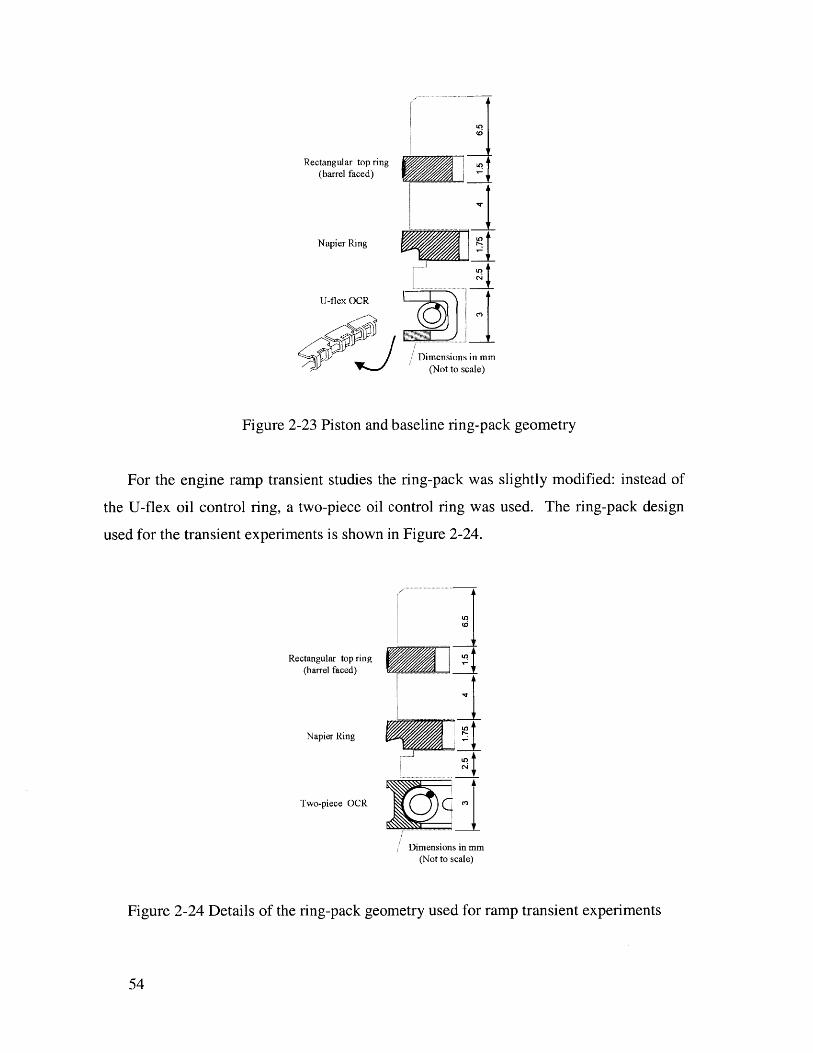
Rectangular top ring(barrel faced)
Napier Ring
U-flex OCR
/ Dimensions in mm(Not to scale)
Figure 2-23 Piston and baseline ring-pack geometry
For the engine ramp transient studies the ring-pack was slightly modified: instead of
the U-flex oil control ring, a two-piece oil control ring was used. The ring-pack design
used for the transient experiments is shown in Figure 2-24.
Rectangular top ring(barrel faced)
Napier Ring
Two-piece OCR
Dimensions in mm(Not to scale)
Figure 2-24 Details of the ring-pack geometry used for ramp transient experiments
54
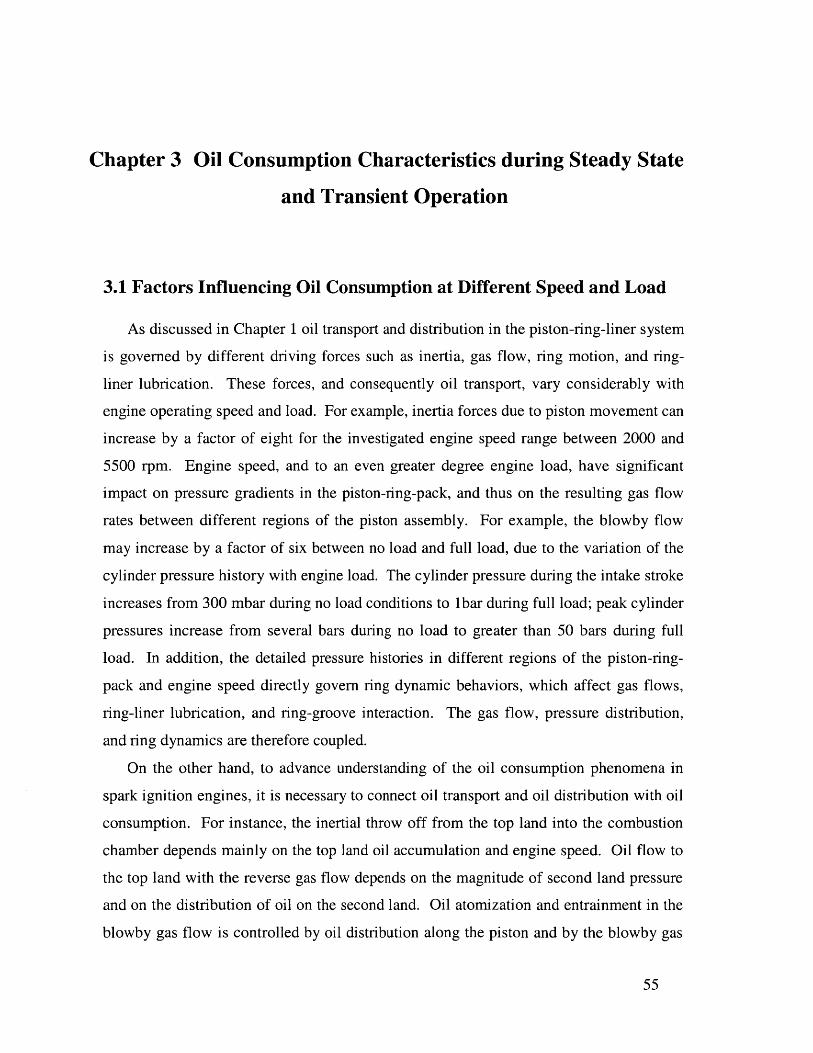
Chapter 3 Oil Consumption Characteristics during Steady State
and Transient Operation
3.1 Factors Influencing Oil Consumption at Different Speed and Load
As discussed in Chapter 1 oil transport and distribution in the piston-ring-liner system
is governed by different driving forces such as inertia, gas flow, ring motion, and ring-
liner lubrication. These forces, and consequently oil transport, vary considerably with
engine operating speed and load. For example, inertia forces due to piston movement can
increase by a factor of eight for the investigated engine speed range between 2000 and
5500 rpm. Engine speed, and to an even greater degree engine load, have significant
impact on pressure gradients in the piston-ring-pack, and thus on the resulting gas flow
rates between different regions of the piston assembly. For example, the blowby flow
may increase by a factor of six between no load and full load, due to the variation of the
cylinder pressure history with engine load. The cylinder pressure during the intake stroke
increases from 300 mbar during no load conditions to ibar during full load; peak cylinder
pressures increase from several bars during no load to greater than 50 bars during full
load. In addition, the detailed pressure histories in different regions of the piston-ring-
pack and engine speed directly govern ring dynamic behaviors, which affect gas flows,
ring-liner lubrication, and ring-groove interaction. The gas flow, pressure distribution,
and ring dynamics are therefore coupled.
On the other hand, to advance understanding of the oil consumption phenomena in
spark ignition engines, it is necessary to connect oil transport and oil distribution with oil
consumption. For instance, the inertial throw off from the top land into the combustion
chamber depends mainly on the top land oil accumulation and engine speed. Oil flow to
the top land with the reverse gas flow depends on the magnitude of second land pressure
and on the distribution of oil on the second land. Oil atomization and entrainment in the
blowby gas flow is controlled by oil distribution along the piston and by the blowby gas
55
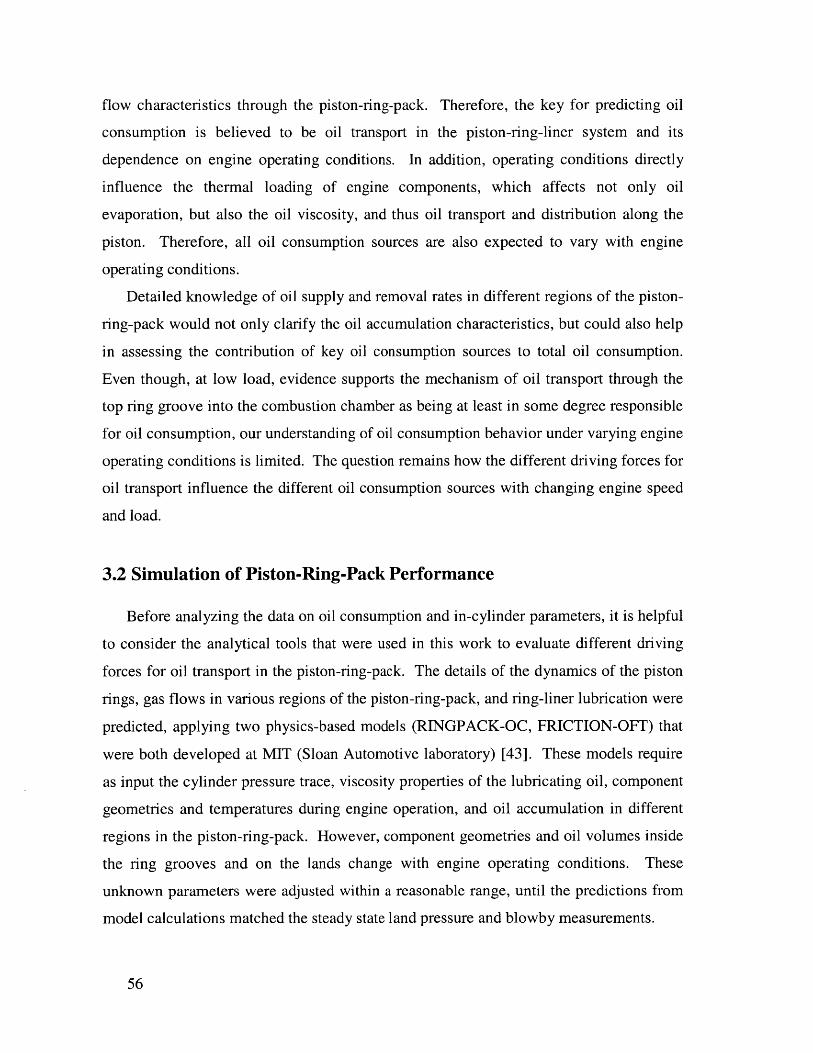
flow characteristics through the piston-ring-pack. Therefore, the key for predicting oil
consumption is believed to be oil transport in the piston-ring-liner system and its
dependence on engine operating conditions. In addition, operating conditions directly
influence the thermal loading of engine components, which affects not only oil
evaporation, but also the oil viscosity, and thus oil transport and distribution along the
piston. Therefore, all oil consumption sources are also expected to vary with engine
operating conditions.
Detailed knowledge of oil supply and removal rates in different regions of the piston-
ring-pack would not only clarify the oil accumulation characteristics, but could also help
in assessing the contribution of key oil consumption sources to total oil consumption.
Even though, at low load, evidence supports the mechanism of oil transport through the
top ring groove into the combustion chamber as being at least in some degree responsible
for oil consumption, our understanding of oil consumption behavior under varying engine
operating conditions is limited. The question remains how the different driving forces for
oil transport influence the different oil consumption sources with changing engine speed
and load.
3.2 Simulation of Piston-Ring-Pack Performance
Before analyzing the data on oil consumption and in-cylinder parameters, it is helpful
to consider the analytical tools that were used in this work to evaluate different driving
forces for oil transport in the piston-ring-pack. The details of the dynamics of the piston
rings, gas flows in various regions of the piston-ring-pack, and ring-liner lubrication were
predicted, applying two physics-based models (RINGPACK-OC, FRICTION-OFF) that
were both developed at MIT (Sloan Automotive laboratory) [43]. These models require
as input the cylinder pressure trace, viscosity properties of the lubricating oil, component
geometries and temperatures during engine operation, and oil accumulation in different
regions in the piston-ring-pack. However, component geometries and oil volumes inside
the ring grooves and on the lands change with engine operating conditions. These
unknown parameters were adjusted within a reasonable range, until the predictions from
model calculations matched the steady state land pressure and blowby measurements.
56
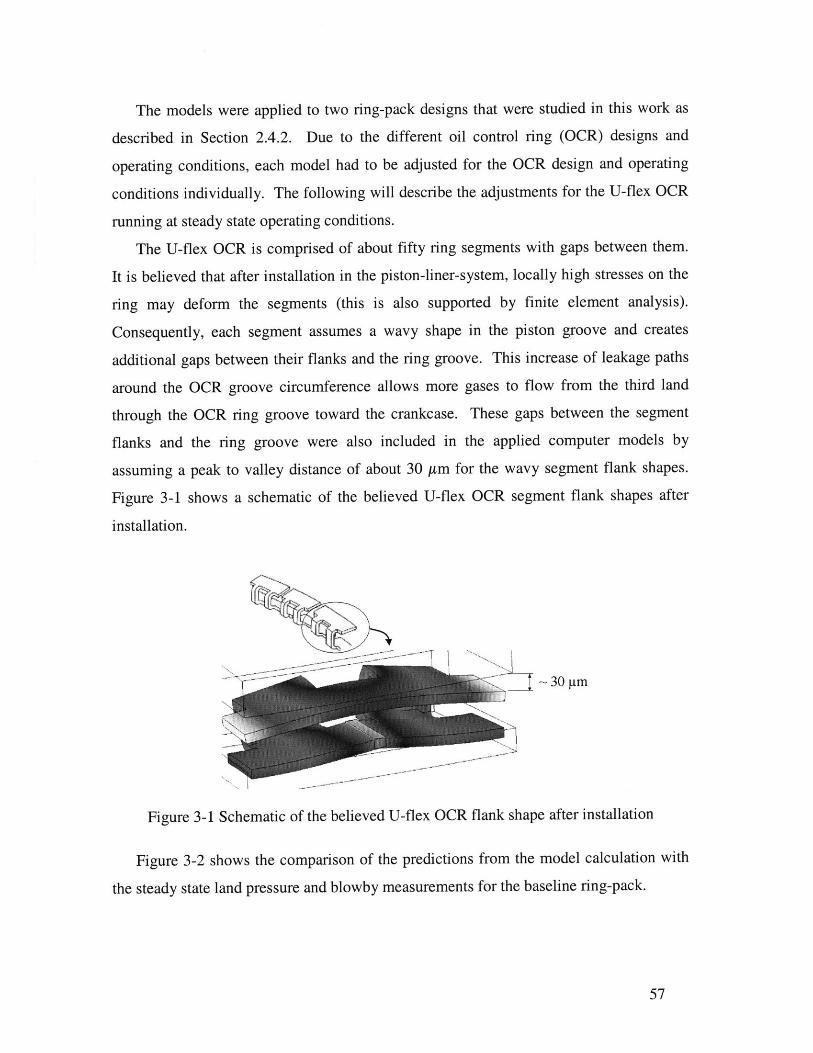
The models were applied to two ring-pack designs that were studied in this work as
described in Section 2.4.2. Due to the different oil control ring (OCR) designs and
operating conditions, each model had to be adjusted for the OCR design and operating
conditions individually. The following will describe the adjustments for the U-flex OCR
running at steady state operating conditions.
The U-flex OCR is comprised of about fifty ring segments with gaps between them.
It is believed that after installation in the piston-liner-system, locally high stresses on the
ring may deform the segments (this is also supported by finite element analysis).
Consequently, each segment assumes a wavy shape in the piston groove and creates
additional gaps between their flanks and the ring groove. This increase of leakage paths
around the OCR groove circumference allows more gases to flow from the third land
through the OCR ring groove toward the crankcase. These gaps between the segment
flanks and the ring groove were also included in the applied computer models by
assuming a peak to valley distance of about 30 ptm for the wavy segment flank shapes.
Figure 3-1 shows a schematic of the believed U-flex OCR segment flank shapes after
installation.
Figure 3-1 Schematic of the believed U-flex OCR flank shape after installation
Figure 3-2 shows the comparison of the predictions from the model calculation with
the steady state land pressure and blowby measurements for the baseline ring-pack.
57
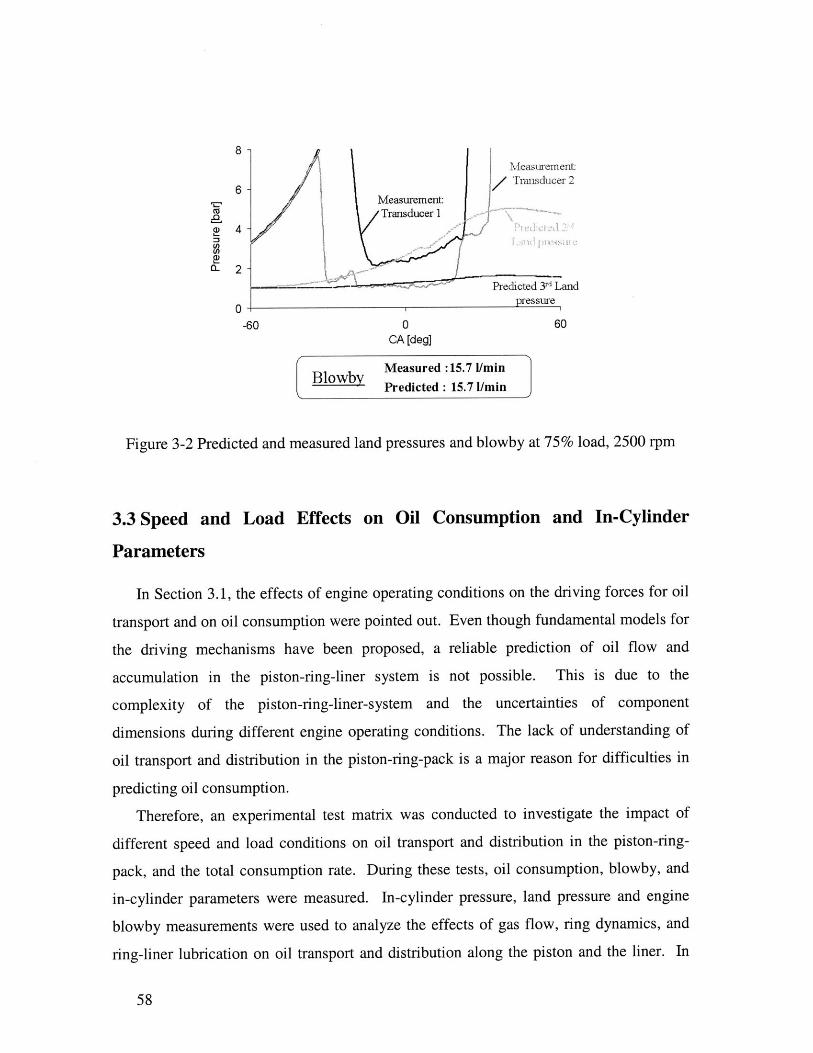
Measurement
6 1 Trnsducer 2
Measurement:Transducer 1
02- Land
0 pressure
-60 0 60CA [deg]
Measured :15.7 1/minBlowby
Predicted :15.7 1/min
Figure 3-2 Predicted and measured land pressures and blowby at 75% load, 2500 rpm
3.3 Speed and Load Effects on Oil Consumption and In-Cylinder
Parameters
In Section 3.1, the effects of engine operating conditions on the driving forces for oil
transport and on oil consumption were pointed out. Even though fundamental models for
the driving mechanisms have been proposed, a reliable prediction of oil flow and
accumulation in the piston-ring-liner system is not possible. This is due to the
complexity of the piston-ring-liner-system and the uncertainties of component
dimensions during different engine operating conditions. The lack of understanding of
oil transport and distribution in the piston-ring-pack is a major reason for difficulties in
predicting oil consumption.
Therefore, an experimental test matrix was conducted to investigate the impact of
different speed and load conditions on oil transport and distribution in the piston-ring-
pack, and the total consumption rate. During these tests, oil consumption, blowby, and
in-cylinder parameters were measured. In-cylinder pressure, land pressure and engine
blowby measurements were used to analyze the effects of gas flow, ring dynamics, and
ring-liner lubrication on oil transport and distribution along the piston and the liner. In
58
W
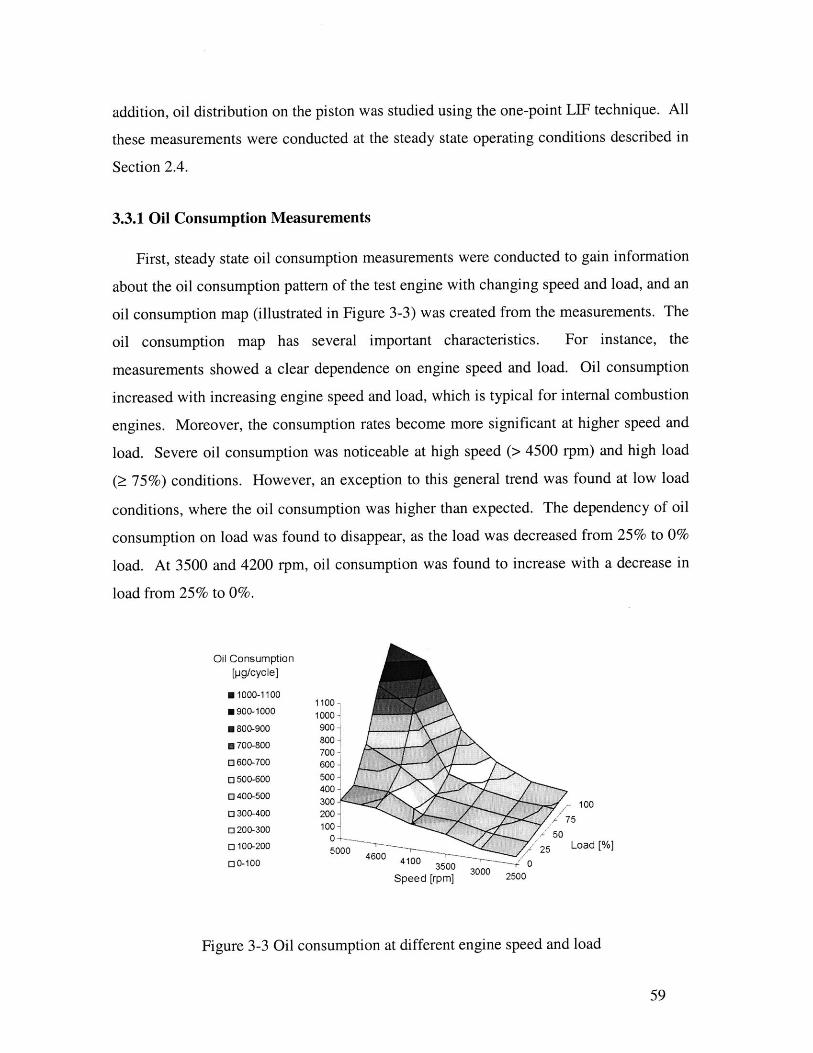
addition, oil distribution on the piston was studied using the one-point LIF technique. All
these measurements were conducted at the steady state operating conditions described in
Section 2.4.
3.3.1 Oil Consumption Measurements
First, steady state oil consumption measurements were conducted to gain information
about the oil consumption pattern of the test engine with changing speed and load, and an
oil consumption map (illustrated in Figure 3-3) was created from the measurements. The
oil consumption map has several important characteristics. For instance, the
measurements showed a clear dependence on engine speed and load. Oil consumption
increased with increasing engine speed and load, which is typical for internal combustion
engines. Moreover, the consumption rates become more significant at higher speed and
load. Severe oil consumption was noticeable at high speed (> 4500 rpm) and high load
(> 75%) conditions. However, an exception to this general trend was found at low load
conditions, where the oil consumption was higher than expected. The dependency of oil
consumption on load was found to disappear, as the load was decreased from 25% to 0%
load. At 3500 and 4200 rpm, oil consumption was found to increase with a decrease in
load from 25% to 0%.
Oil Consumption[pg/cycle]
E 1000-11001100-
*900-1000 1000
0 800-900 900J
m 700-800
0 600-700 600o 500-600 500
0 400-500 400 300000300-400 200-7
o 200-300 100
o100-200 50 0 25 Load [%]
o 0-100 4600 4100 3
Speed [rpm] 3000 2500
Figure 3-3 Oil consumption at different engine speed and load
59

3.3.2 Blowby
Having determined the oil consumption pattern, the next step was to investigate the
effects of blowby and in-cylinder parameters on oil transport and distribution at different
steady state engine speed and load.
3.3.2.1 Blowby Flow Structure
Before analyzing the blowby and LIF oil film thickness measurements, it is helpful to
consider the blowby flow features through the piston-ring-pack, since the flow effects oil
transport. Blowby gas flow is strongly dependent on leakage paths. If instabilities of the
rings are prevented, then the main structure of the blowby flow is believed to be as
follows. As the cylinder pressure rises during compression and combustion, the gases in
the combustion chamber leak through the top ring gap to the second land. On the second
land, these gases flow mainly in the circumferential direction from the top ring gap to the
second ring gap. This can be explained using the simulation code RINPACK-OC that
computes the land pressure history and gas flow in different regions of the piston-ring-
pack. Figure 3-4 shows the measured cylinder and the computed land pressures as well
as gas flow rates through the top and second ring gaps during the engine cycle at 25%
load, 3500 rpm. During the compression and early expansion strokes, gases flow from
the combustion chamber through the top ring gap into the second land due to the pressure
gradient across the top ring. As a result, the pressure in the second land clearance
increases because of its finite volume, and a pressure gradient evolves between the
second and third land regions. This pressure gradient induces a gas flow from the second
land through the second ring gap into the third land. During the intake stroke and the late
expansion and early exhaust strokes blowby gases may flow back from the second land
through the top ring gap to the top land. However, the average of the flows through the
top and second ring gaps and the integration of this average through the engine cycle
results in a net gas flow from the top to the second ring gap. This gas flows most likely
along the circumferential direction of the piston's second land.
60
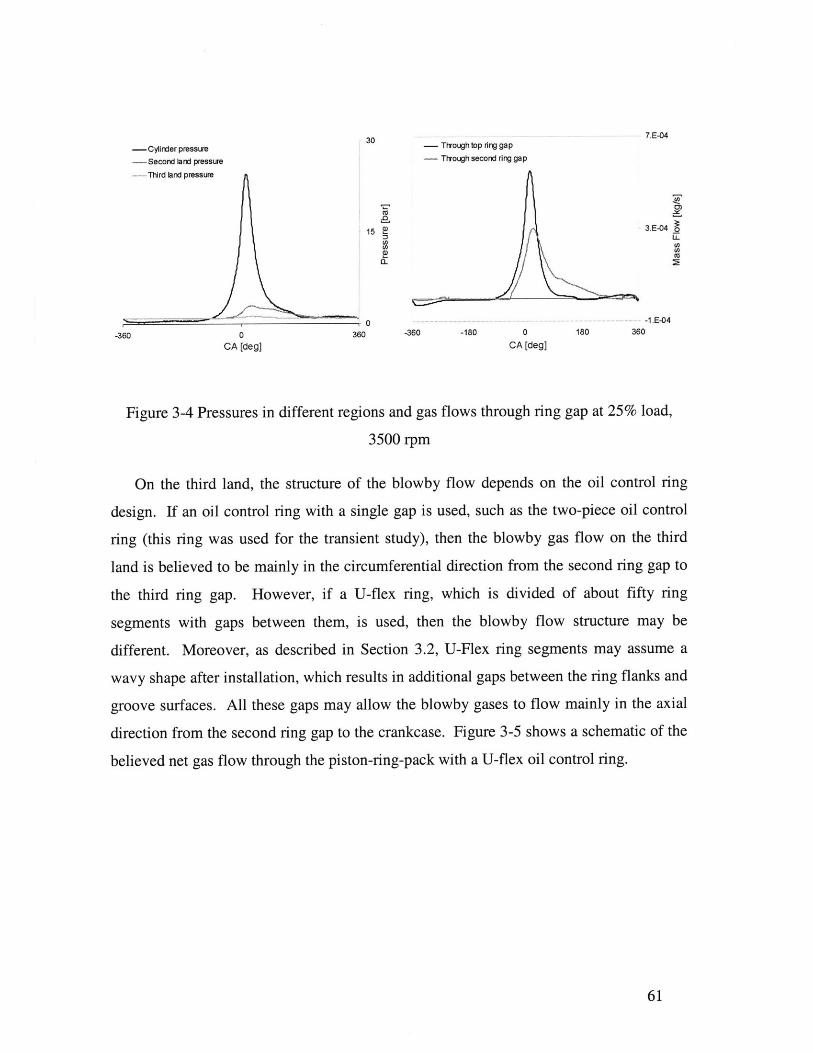
- Cylinder pressure- Second lard pressure
-- Third land pressure
- Through top ring gap- Through second ring gap
CU
n
15 ~CoCoa)0~
360 -360 -180 0CA [deg]
- -1.E-04180 360
Figure 3-4 Pressures in different regions and gas flows through ring gap at 25% load,
3500 rpm
On the third land, the structure of the blowby flow depends on the oil control ring
design. If an oil control ring with a single gap is used, such as the two-piece oil control
ring (this ring was used for the transient study), then the blowby gas flow on the third
land is believed to be mainly in the circumferential direction from the second ring gap to
the third ring gap. However, if a U-flex ring, which is divided of about fifty ring
segments with gaps between them, is used, then the blowby flow structure may be
different. Moreover, as described in Section 3.2, U-Flex ring segments may assume a
wavy shape after installation, which results in additional gaps between the ring flanks and
groove surfaces. All these gaps may allow the blowby gases to flow mainly in the axial
direction from the second ring gap to the crankcase. Figure 3-5 shows a schematic of the
believed net gas flow through the piston-ring-pack with a U-flex oil control ring.
61
-360CA [deg]
Co0)
3.E-04
CeCi,CU
7.E-0430
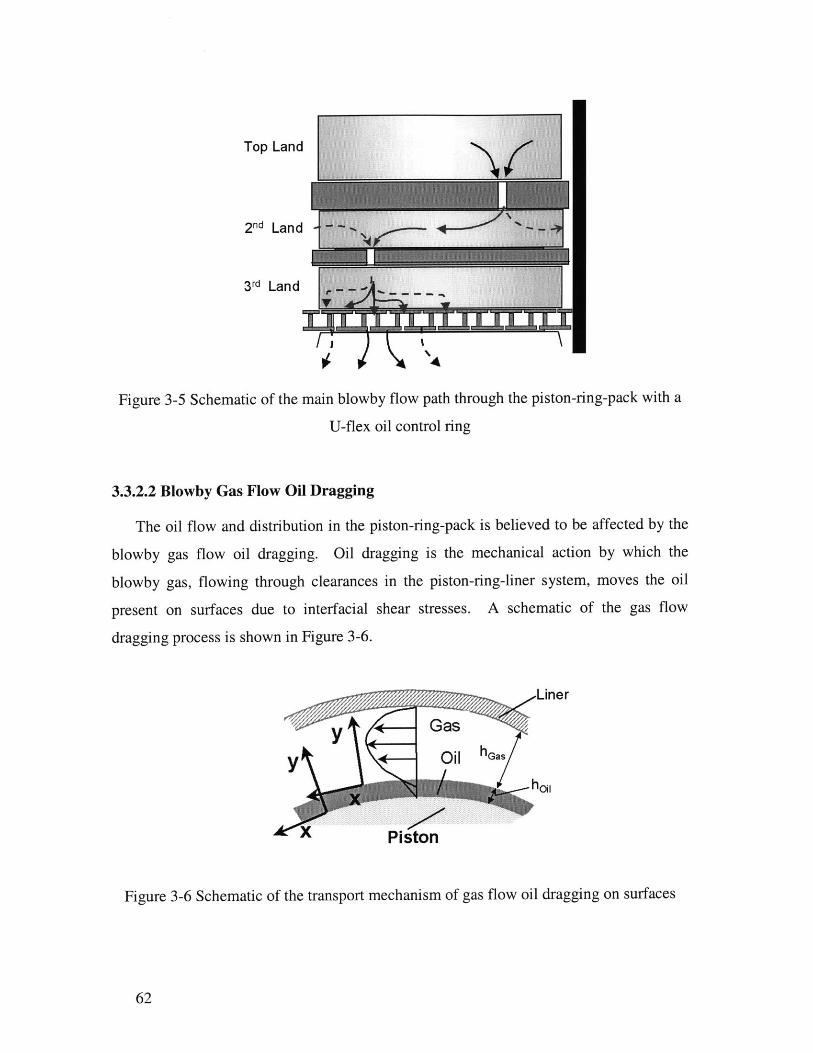
Top Land
2nd Land
3rd Land
Figure 3-5 Schematic of the main blowby flow path through the piston-ring-pack with a
U-flex oil control ring
3.3.2.2 Blowby Gas Flow Oil Dragging
The oil flow and distribution in the piston-ring-pack is believed to be affected by the
blowby gas flow oil dragging. Oil dragging is the mechanical action by which the
blowby gas, flowing through clearances in the piston-ring-liner system, moves the oil
present on surfaces due to interfacial shear stresses. A schematic of the gas flow
dragging process is shown in Figure 3-6.
Liner
-- Gas
y -- Oil hGas
hos,
x Piston
Figure 3-6 Schematic of the transport mechanism of gas flow oil dragging on surfaces
62
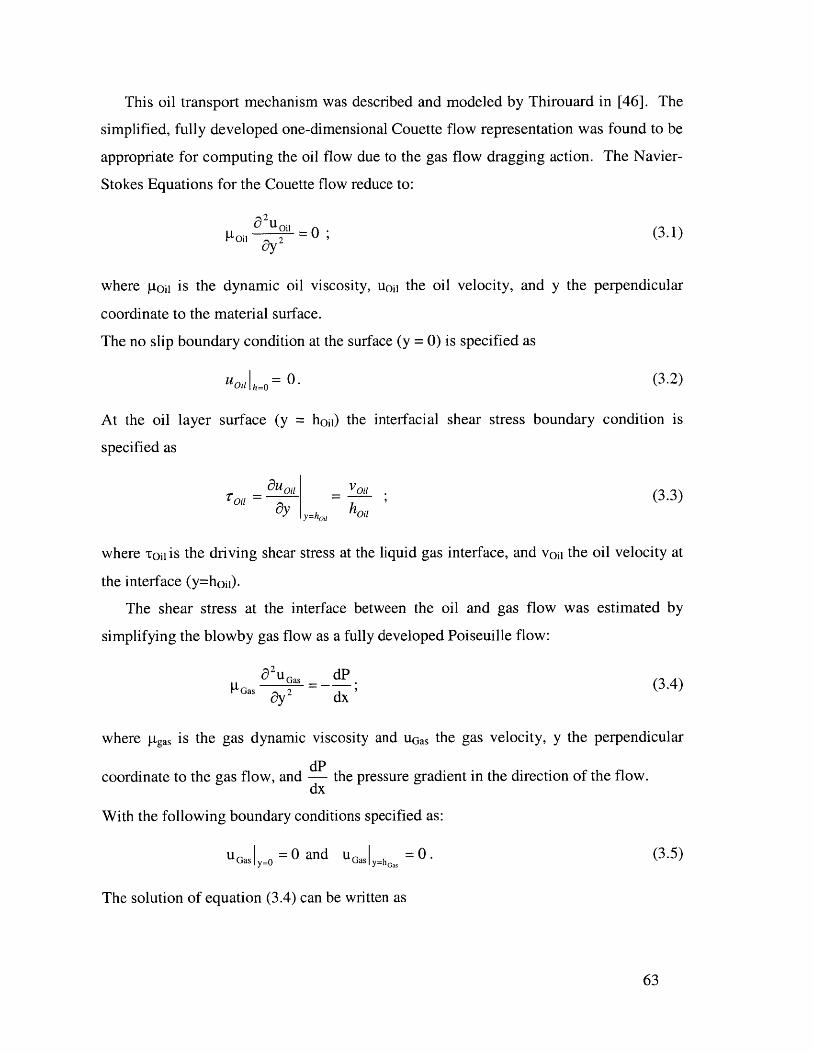
This oil transport mechanism was described and modeled by Thirouard in [46]. The
simplified, fully developed one-dimensional Couette flow representation was found to be
appropriate for computing the oil flow due to the gas flow dragging action. The Navier-
Stokes Equations for the Couette flow reduce to:
a2u0 ,-O 2 =i 0 ; (3.1)
ay2
where ptoil is the dynamic oil viscosity, uoil the oil velocity, and y the perpendicular
coordinate to the material surface.
The no slip boundary condition at the surface (y = 0) is specified as
U 0 OhO = 0. (3.2)
At the oil layer surface (y = hoi]) the interfacial shear stress boundary condition is
specified as
~u , vo" (3.3)Oi ay ,= ,, h oil
where toi is the driving shear stress at the liquid gas interface, and voi1 the oil velocity at
the interface (y=hoii).
The shear stress at the interface between the oil and gas flow was estimated by
simplifying the blowby gas flow as a fully developed Poiseuille flow:
__2_ _dP
as Gas (34)ItG y 2 dx
where tgas is the gas dynamic viscosity and uGas the gas velocity, y the perpendicular
dPcoordinate to the gas flow, and the pressure gradient in the direction of the flow.
dx
With the following boundary conditions specified as:
uGas y=0 0 and UGas y=hGas =0. (3.5)
The solution of equation (3.4) can be written as
63
dP qGas2* Gas(3.6)
dx L*hGas
where qgas is the instantaneous volumetric gas flow rate and L the depth of the oil covered
surface. The interfacial shear stress is then given as
dP h (7tGas _ * hGas
dx 2
With equations (3.3), (3.6), and (3.7) the instantaneous oil flow rate due to blowby gas
flow dragging can be estimated. In [46], it was found that the average oil flow rate due to
gas flow dragging was estimated reasonably well by the following expression:
3 * * 2
QOil = QGas * Gas 2 Oil (3.8)1Oi * hGas
where Qoji is the cumulative oil flow over one cycle [m3/cycle], Qas the cumulative gas
flow over one cycle flowing through the clearance of interest [m 3/cycle], and Oil the
average oil layer covering the piston surface of interest.
3.3.2.3 Blowby Measurements
Engine operating conditions drastically change the blowby flow magnitude and
possibly the flow paths. Such a change of the gas flow features may have a significant
influence on oil transport and oil consumption. Therefore, blowby measurements were
taken at different steady state engine speed and load conditions to investigate its
operating condition dependence. A common representation of blowby by researchers in
the automotive industry is the volumetric blowby gas flow rate per unit time. Figure 3-7
illustrates the variation of the blowby flow rate (liters per minute) with engine speed and
load. It is evident that blowby increased with increasing engine load at all investigated
speed conditions. The increase of the cylinder pressures history with engine load causes
a greater pressure gradient between the combustion chamber and crankcase, which
enhances the blowby gas flow through the piston-ring-pack. Moreover, the
measurements show that the variation of engine speed at constant load has little effect on
the blowby flow rate.
64
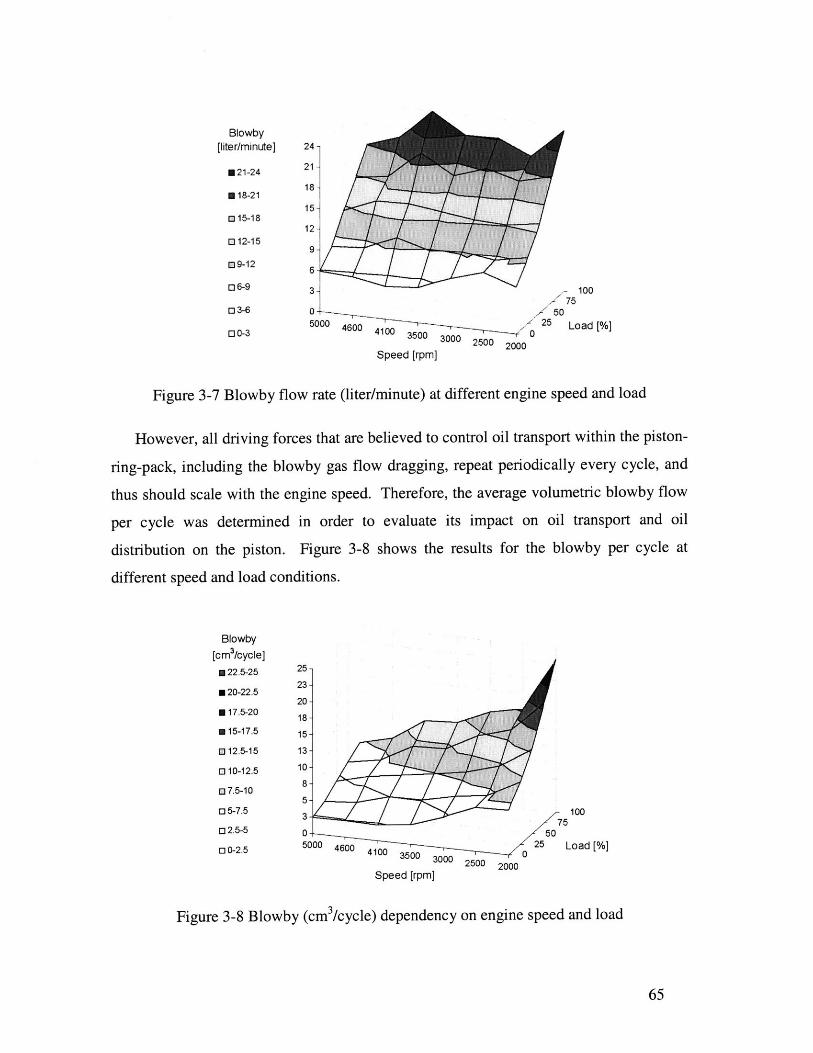
Blowby[liter/minute] 24-
0 21-24 21-
18.R 18-21
15-0 15-18
12-012-15
0 9-12 6
06-9 3 100
0 3-6 0 50 755000 4625 Load [%]
00-3 4100500 460 4003500 3000 2500 2000
Speed [rpm]
Figure 3-7 Blowby flow rate (liter/minute) at different engine speed and load
However, all driving forces that are believed to control oil transport within the piston-
ring-pack, including the blowby gas flow dragging, repeat periodically every cycle, and
thus should scale with the engine speed. Therefore, the average volumetric blowby flow
per cycle was determined in order to evaluate its impact on oil transport and oil
distribution on the piston. Figure 3-8 shows the results for the blowby per cycle at
different speed and load conditions.
Blowby
[cm3/cycle]
m 22.5-25 25-
m 20-22.5
0 17.5-20 18m 15-17.5 15 -
012.5-15 13 -
0 10-12.5 10 -
3 7.5-10 8-
035-7.5 3100
5002 4600 410 25 Load [%]
00 2500 2000Speed [rpm]
Figure 3-8 Blowby (cm 3/cycle) dependency on engine speed and load
65
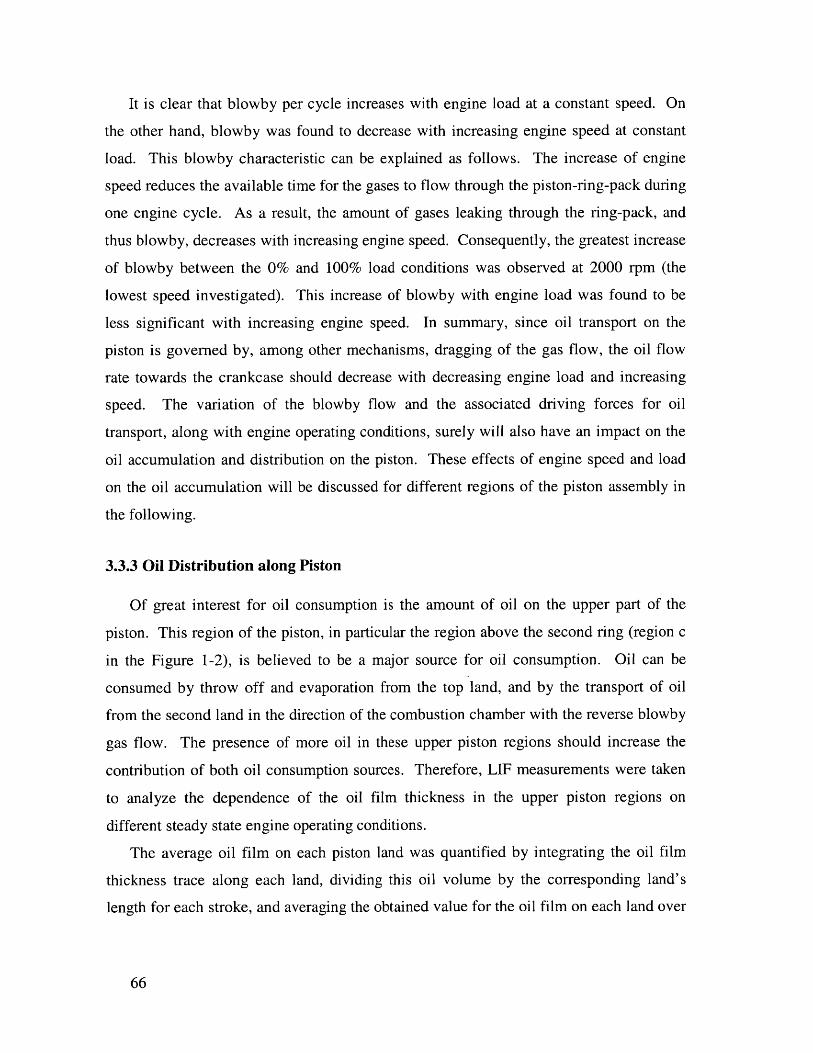
It is clear that blowby per cycle increases with engine load at a constant speed. On
the other hand, blowby was found to decrease with increasing engine speed at constant
load. This blowby characteristic can be explained as follows. The increase of engine
speed reduces the available time for the gases to flow through the piston-ring-pack during
one engine cycle. As a result, the amount of gases leaking through the ring-pack, and
thus blowby, decreases with increasing engine speed. Consequently, the greatest increase
of blowby between the 0% and 100% load conditions was observed at 2000 rpm (the
lowest speed investigated). This increase of blowby with engine load was found to be
less significant with increasing engine speed. In summary, since oil transport on the
piston is governed by, among other mechanisms, dragging of the gas flow, the oil flow
rate towards the crankcase should decrease with decreasing engine load and increasing
speed. The variation of the blowby flow and the associated driving forces for oil
transport, along with engine operating conditions, surely will also have an impact on the
oil accumulation and distribution on the piston. These effects of engine speed and load
on the oil accumulation will be discussed for different regions of the piston assembly in
the following.
3.3.3 Oil Distribution along Piston
Of great interest for oil consumption is the amount of oil on the upper part of the
piston. This region of the piston, in particular the region above the second ring (region c
in the Figure 1-2), is believed to be a major source for oil consumption. Oil can be
consumed by throw off and evaporation from the top land, and by the transport of oil
from the second land in the direction of the combustion chamber with the reverse blowby
gas flow. The presence of more oil in these upper piston regions should increase the
contribution of both oil consumption sources. Therefore, LIF measurements were taken
to analyze the dependence of the oil film thickness in the upper piston regions on
different steady state engine operating conditions.
The average oil film on each piston land was quantified by integrating the oil film
thickness trace along each land, dividing this oil volume by the corresponding land's
length for each stroke, and averaging the obtained value for the oil film on each land over
66
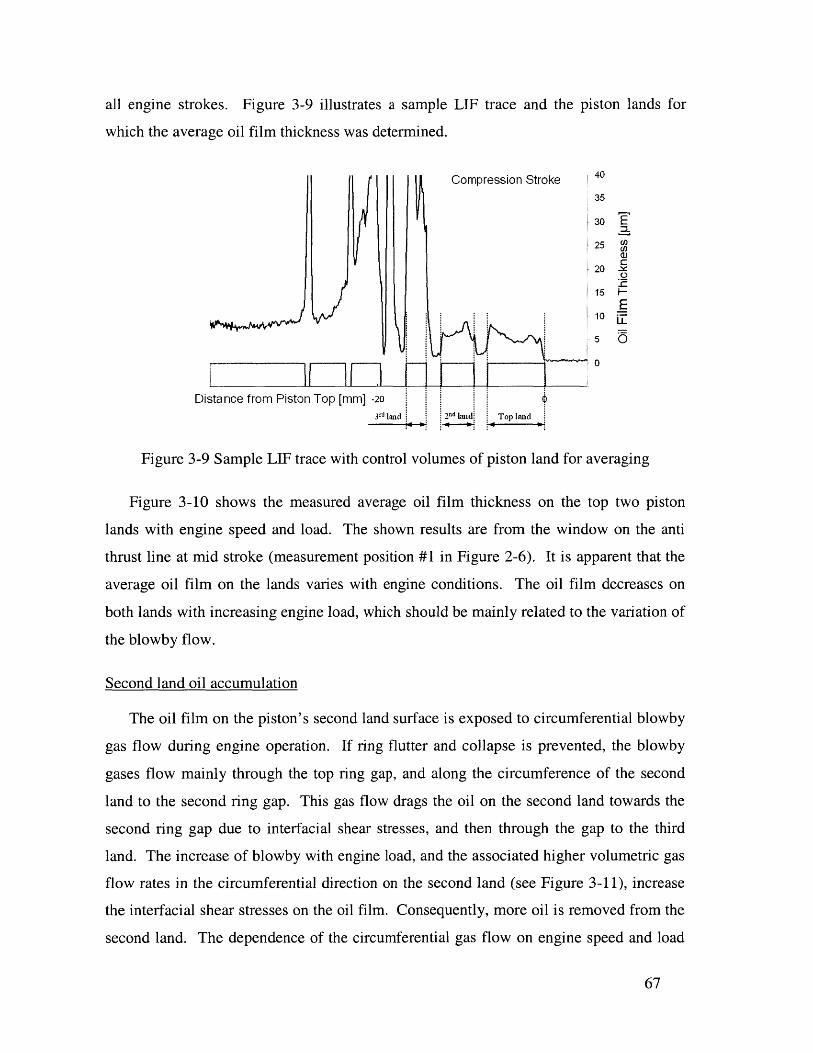
all engine strokes. Figure 3-9 illustrates a sample LIF trace and the
which the average oil film thickness was determined.
piston lands for
V7F-Compression Stroke
yDistance from Piston Top [mm] -20
rd lnd2nd Ihid
Figure 3-9 Sample LIF trace with control volumes of piston land for averaging
Figure 3-10 shows the measured average oil film thickness on the top two piston
lands with engine speed and load. The shown results are from the window on the anti
thrust line at mid stroke (measurement position #1 in Figure 2-6). It is apparent that the
average oil film on the lands varies with engine conditions. The oil film decreases on
both lands with increasing engine load, which should be mainly related to the variation of
the blowby flow.
Second land oil accumulation
The oil film on the piston's second land surface is exposed to circumferential blowby
gas flow during engine operation. If ring flutter and collapse is prevented, the blowby
gases flow mainly through the top ring gap, and along the circumference of the second
land to the second ring gap. This gas flow drags the oil on the second land towards the
second ring gap due to interfacial shear stresses, and then through the gap to the third
land. The increase of blowby with engine load, and the associated higher volumetric gas
flow rates in the circumferential direction on the second land (see Figure 3-11), increase
the interfacial shear stresses on the oil film. Consequently, more oil is removed from the
second land. The dependence of the circumferential gas flow on engine speed and load
67
40
35
30
25
20
15
0
EM)
0)
E
0-
Top laid
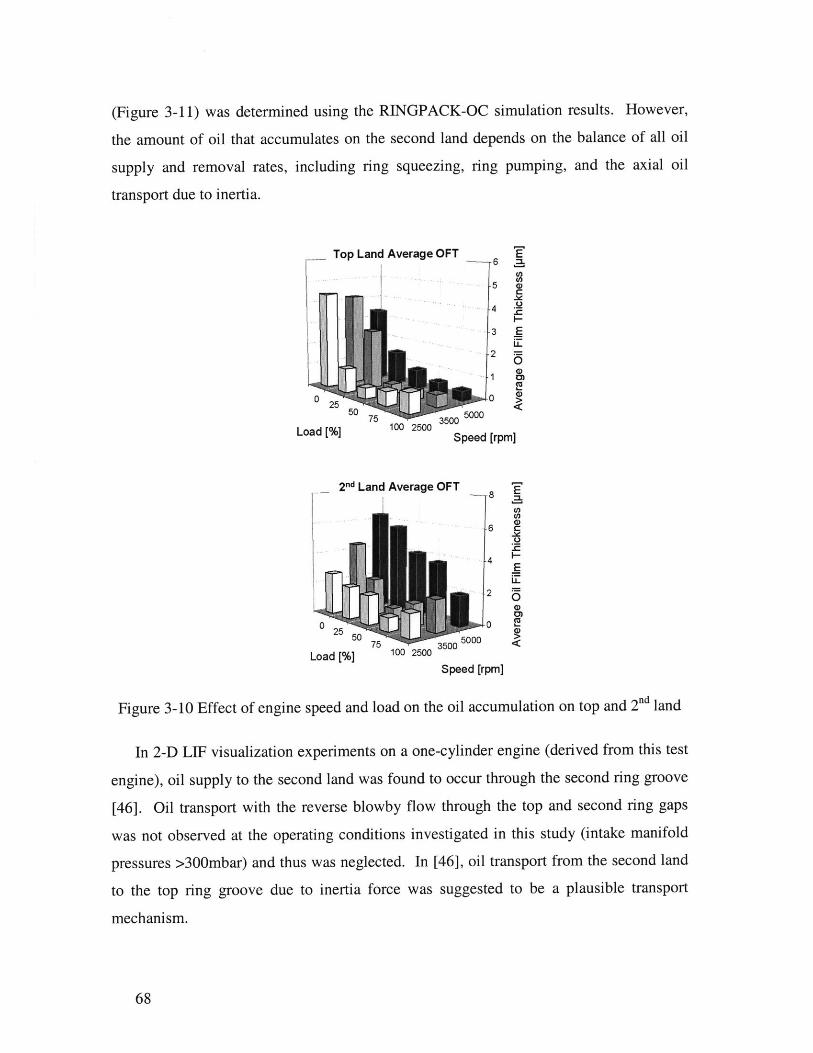
(Figure 3-11) was determined using the RINGPACK-OC simulation results. However,
the amount of oil that accumulates on the second land depends on the balance of all oil
supply and removal rates, including ring squeezing, ring pumping, and the axial oil
transport due to inertia.
Top Land Average OFT E_- 6 M-
0
4-
3 E
S25 500 <L [ 15 350000050
Load [%] 100 2500 Speed [rpm]
2 "d Land Average OFT-8 M
6 C
4 E
025 050 73505000
Load [%] 100 2500
Speed [rpm]
Figure 3-10 Effect of engine speed and load on the oil accumulation on top and 2"d land
In 2-D LIEF visualization experiments on a one-cylinder engine (derived from this test
engine), oil supply to the second land was found to occur through the second ring groove
[46]. Oil transport with the reverse blowby flow through the top and second ring gaps
was not observed at the operating conditions investigated in this study (intake manifold
pressures >300mbar) and thus was neglected. In [46], oil transport from the second land
to the top ring groove due to inertia force was suggested to be a plausible transport
mechanism.
68
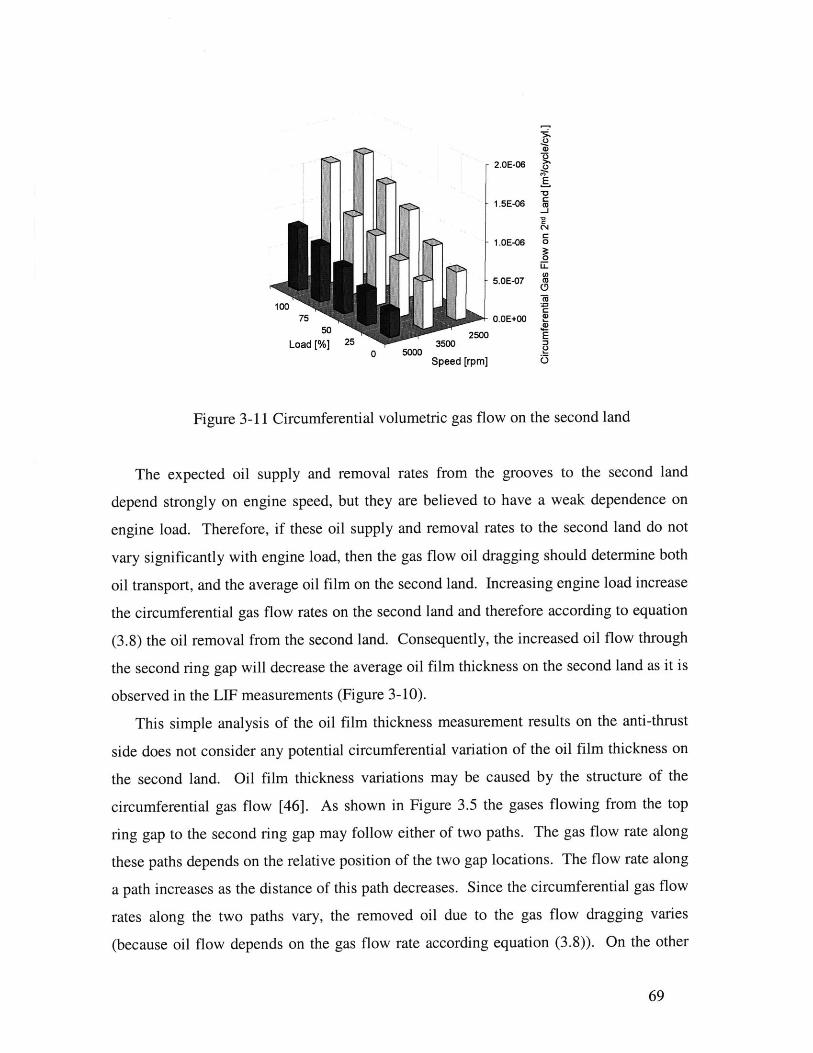
<U
2.OE-06
E
1.5E-06-j
04
1.OE-06 0
(I)5.OE-07 (0
10075 O.OE+00 2
Load [%] 25 35000 50000
Speed [rpm] )
Figure 3-11 Circumferential volumetric gas flow on the second land
The expected oil supply and removal rates from the grooves to the second land
depend strongly on engine speed, but they are believed to have a weak dependence on
engine load. Therefore, if these oil supply and removal rates to the second land do not
vary significantly with engine load, then the gas flow oil dragging should determine both
oil transport, and the average oil film on the second land. Increasing engine load increase
the circumferential gas flow rates on the second land and therefore according to equation
(3.8) the oil removal from the second land. Consequently, the increased oil flow through
the second ring gap will decrease the average oil film thickness on the second land as it is
observed in the LIF measurements (Figure 3-10).
This simple analysis of the oil film thickness measurement results on the anti-thrust
side does not consider any potential circumferential variation of the oil film thickness on
the second land. Oil film thickness variations may be caused by the structure of the
circumferential gas flow [46]. As shown in Figure 3.5 the gases flowing from the top
ring gap to the second ring gap may follow either of two paths. The gas flow rate along
these paths depends on the relative position of the two gap locations. The flow rate along
a path increases as the distance of this path decreases. Since the circumferential gas flow
rates along the two paths vary, the removed oil due to the gas flow dragging varies
(because oil flow depends on the gas flow rate according equation (3.8)). On the other
69
hand, the axial oil supply and removal rates to the second land are believed to occur
essentially on the entire piston circumference. Yet, the gas flow along a flow path drags
the oil circumferentially to the second ring gap location. According to equation (3.8), the
circumferential oil flow also depends on the oil film thickness, which causes an
additional variation of the oil film thickness along the flow paths itself. Even if in reality
the circumferential second land oil film thickness varies, the main conclusion obtained
from the above analysis should not be affected.
Figure 3-10 shows further that the average oil film thickness on the second land
increased with increasing engine speed at constant load. However, as shown in Figure
3-11 the circumferential gas flow on the second land also decreases with increasing
engine speed at constant load. This gas flow behavior with speed decreases the oil
removal rate per cycle from the second land due to gas flow dragging. On the other hand,
it is believed that increasing engine speed increases the axial oil transport to higher piston
regions, due to the higher inertia forces acting on the oil volume, which may result in
higher oil supply rates to the second land [46]. These two effects of increasing speed on
the oil flow on the second land result in higher second land oil film thickness.
Top land oil film thickness
The average oil film thickness on the top land was found to decrease with engine load
(see Figure 3-10). This behavior can be explained as follows:
Oil accumulation on the top land depends on the balance of the oil supply and
removal rates to it. Two mechanisms may supply oil to the top land. First, oil can be
supplied through the top ring groove due to oil squeezing caused by the ring's relative
motion in its groove. The squeezing of oil to the top land depends, among other factors,
on the oil supply to top ring groove, which is governed by the second land oil film
thickness, and the oil flow due to inertia forces. Second, oil may be scraped from the
liner and supplied to the top land, when the bore is significantly distorted and the ring
conformability is dependent on the pressure behind the ring. As mentioned above, in
visualization experiments, oil supply through the top ring gap with the reverse blowby
flow was not observed at the investigated operating conditions in this study [46].
70
The supplied oil on the top land is transported either into the combustion chamber, or
returned to the second land with the blowby gas flow through the top ring gap. The oil is
transported from the top land to the combustion chamber either by the throw off due to
inertial forces, or by evaporation into the top land crevice gas flow due to the high top
land temperatures. The blowby gas flow moves the oil on the top land through the ring
gap to the second land due to interfacial shear stresses. Unlike the blowby flow through
the second land, the gases flow only over a small region on the top land near the ring gap
due to absence of circumferential gas flow and the higher cylinder pressures.
Consequently, oil can be removed only from a small region of the top land. The impact
of this mechanism on the top land oil balance depends on the top land oil supply and
removal rates, and on the average speed at which the top ring rotates in its groove.
Decreasing engine load increases the oil film thickness on the second land. The
higher oil film on the second land with decreasing engine load should also increase the
oil transport to the top ring groove, and therefore the oil supply to the top land. On the
other hand, decreasing engine load should decrease the oil removal from the top land.
The oil return to the second land through the top ring gap decreases due to the lower gas
flows and oil evaporation reduces due to the lower top land and crevice gas temperatures.
Therefore, this increase in oil supply and decreased removal of oil with decreasing load
are the believed reasons for the increase in oil film thickness on the top land.
The increased oil presence on the upper part of the piston during low load conditions
is more susceptible to being transported into the combustion chamber by direct oil
consumption sources. This may explain the resulting increase of total oil consumption as
the engine load was decreased from 25% to 0%. However, for a thorough analysis of the
oil consumption pattern other issues that may affect the oil consumption need to be
considered, such as variations blowby in gas flow, blowby entrainment, ring dynamics,
ring-liner lubrication, and component temperatures. The impact of some of these
parameters on the oil consumption sources and the oil consumption pattern of the test
engine will be discussed in Section 4.3.
71
3.4 Analysis of Oil Consumption Behavior during Transients in Load
3.4.1 Introduction
Most prior oil consumption studies have focused on determining and understanding
the steady state oil consumption pattern. However, in practice, automotive engines
typically operate at non-steady conditions. During transient engine operation, oil
consumption can differ significantly from steady state. It is important therefore to
understand the oil consumption characteristics during non-steady engine operation. The
research work on transient oil consumption was greatly advanced by applying fast-
response oil consumption measuring techniques such as the sulfur-tracer technique that
was used in this study.
Studies focused on oil consumption behavior during transient engine operation have
reported an increase in oil consumption during specific transient conditions. In particular,
increased oil consumption values were observed during load transients from low load to
high load conditions. Two reasons were suggested as responsible for this oil
consumption phenomenon:
(i) More oil accumulated on the liner and top of the piston during low load
conditions and
(ii) the subsequent combustion of the accumulated oil [49][50].
Similar higher oil consumption during transients was observed in a heavy duty diesel
engine [51]. In [51], the engine oil consumption was measured simultaneously with in-
cylinder variables, and the oil consumption phenomenon during the transients was found
to be related to the oil transport through the oil control ring.
Oil transport and consumption are affected by in-cylinder variables such as oil
accumulation on the piston, ring dynamics, and gas flows. The behavior of these
variables during engine transients has not yet been fully analyzed. In this work, a study
72
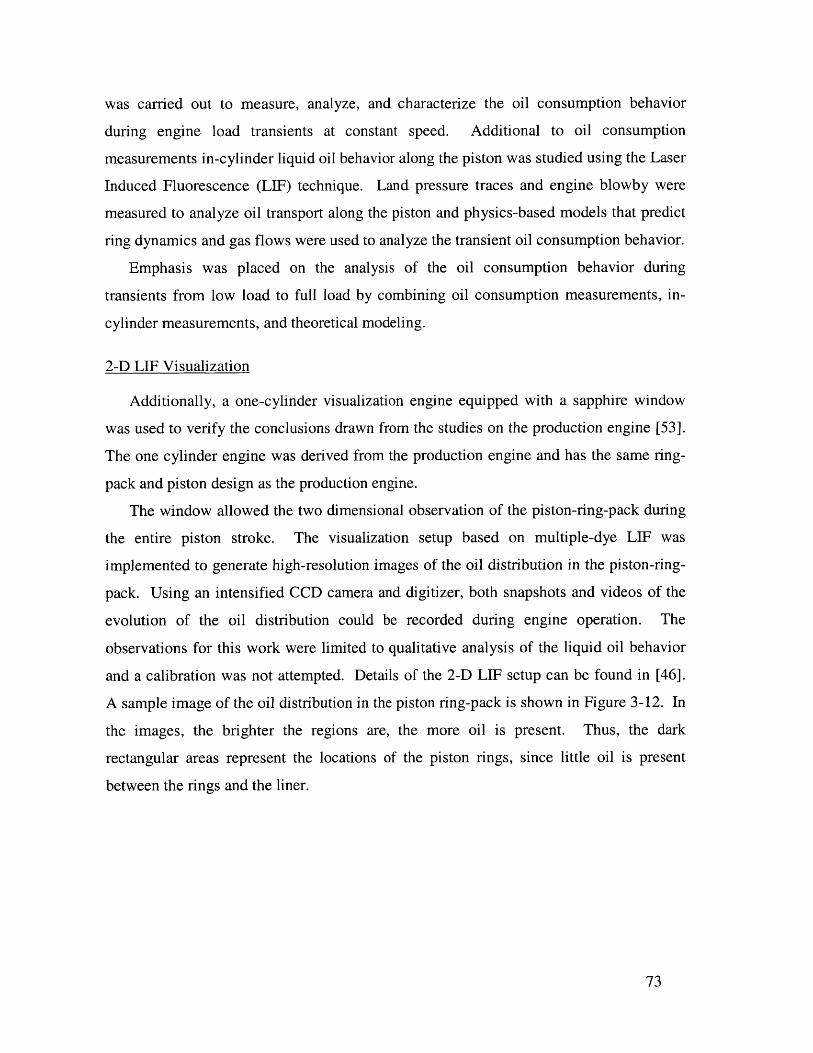
was carried out to measure, analyze, and characterize the oil consumption behavior
during engine load transients at constant speed. Additional to oil consumption
measurements in-cylinder liquid oil behavior along the piston was studied using the Laser
Induced Fluorescence (LIF) technique. Land pressure traces and engine blowby were
measured to analyze oil transport along the piston and physics-based models that predict
ring dynamics and gas flows were used to analyze the transient oil consumption behavior.
Emphasis was placed on the analysis of the oil consumption behavior during
transients from low load to full load by combining oil consumption measurements, in-
cylinder measurements, and theoretical modeling.
2-D LIF Visualization
Additionally, a one-cylinder visualization engine equipped with a sapphire window
was used to verify the conclusions drawn from the studies on the production engine [53].
The one cylinder engine was derived from the production engine and has the same ring-
pack and piston design as the production engine.
The window allowed the two dimensional observation of the piston-ring-pack during
the entire piston stroke. The visualization setup based on multiple-dye LIF was
implemented to generate high-resolution images of the oil distribution in the piston-ring-
pack. Using an intensified CCD camera and digitizer, both snapshots and videos of the
evolution of the oil distribution could be recorded during engine operation. The
observations for this work were limited to qualitative analysis of the liquid oil behavior
and a calibration was not attempted. Details of the 2-D LIF setup can be found in [46].
A sample image of the oil distribution in the piston ring-pack is shown in Figure 3-12. In
the images, the brighter the regions are, the more oil is present. Thus, the dark
rectangular areas represent the locations of the piston rings, since little oil is present
between the rings and the liner.
73
8.6 mm
Too] markson thepiston
L "
Ii V
Figure 3-12 Sample 2-D LIF image [53]
Piston-ring-pack
The measurements were conducted with the ring-pack design consisting of a barrel
faced top ring, a taper faced Napier (hook) scraper ring, and a two-piece oil control ring.
The details of the used ring-pack can be found in Section 2.4.2.
Operating Conditions
Several ramp transient measurements were conducted to investigate the impact of the
initial conditions, final conditions, and engine operating speed on oil consumption. First,
to understand the effects of engine operating speed, transients in load from no load (0%)
to full load (100%) were performed at different engine speeds. Second, the importance of
initial and final load conditions on oil consumption was investigated. The ramp transient
conditions studied are summarized in Table 2-6. The engine was always operated at
steady state conditions before the start of each transient.
3.4.2 Oil Consumption Measurements
Figure 3-13 and Figure 3-14 show the airflow rate, blowby rate, and oil consumption
measurements as a function of time before and after the ramp transient for different
74
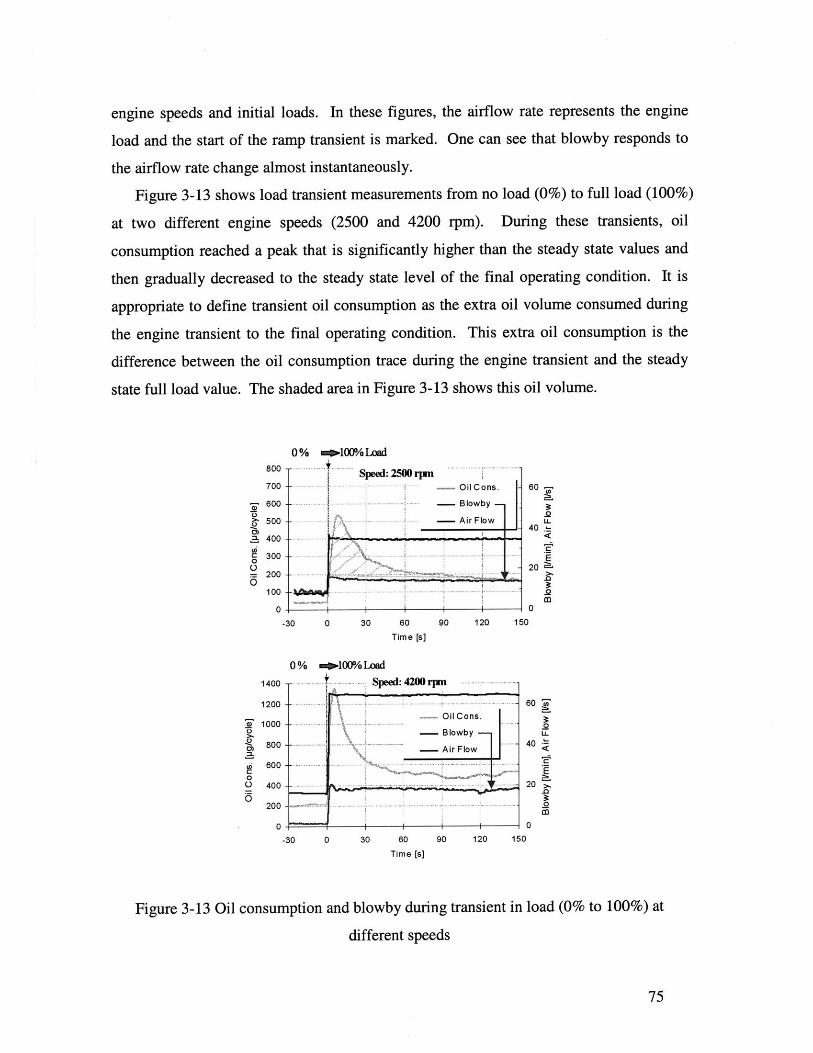
engine speeds and initial loads. In these figures, the airflow rate represents the engine
load and the start of the ramp transient is marked. One can see that blowby responds to
the airflow rate change almost instantaneously.
Figure 3-13 shows load transient measurements from no load (0%) to full load (100%)
at two different engine speeds (2500 and 4200 rpm). During these transients, oil
consumption reached a peak that is significantly higher than the steady state values and
then gradually decreased to the steady state level of the final operating condition. It is
appropriate to define transient oil consumption as the extra oil volume consumed during
the engine transient to the final operating condition. This extra oil consumption is the
difference between the oil consumption trace during the engine transient and the steady
state full load value. The shaded area in Figure 3-13 shows this oil volume.
0% mm100/oLoad
Sped 2500 rjn- ... ... .. .. ..
I0 30 60
Time [s]
Oil Cons.
- Blowby
- Air Flow -
I -
± -i 1 0
90 120 150-30
0 % P1000/ Load- - Speed: 4200 rpin - .-
- ---- - - Oil Cons.
-- Blowby
- Air Flow
-..- ..- .- --.-.- ---. ....... .. ... ..
0 30 60
Time [s]
90 120 150
Figure 3-13 Oil consumption and blowby during transient in load (0% to 100%) at
different speeds
75
800
700
600
500
400
300
200
100
0
1400
1200
1000
800
600
400
200
0
0
0
0)
0
60
U-40
20
n
co
60
LL
40
20
00
0
-30
-
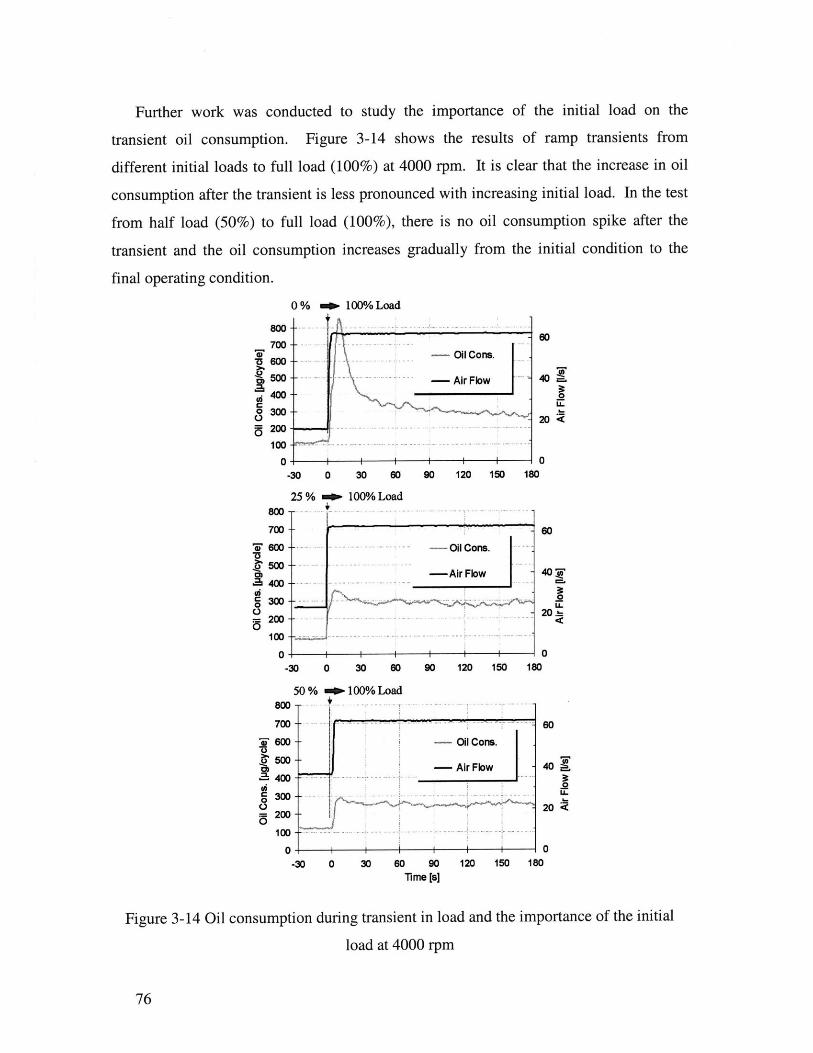
Further work was conducted to study the importance of the initial load on the
transient oil consumption. Figure 3-14 shows the results of ramp transients from
different initial loads to full load (100%) at 4000 rpm. It is clear that the increase in oil
consumption after the transient is less pronounced with increasing initial load. In the test
from half load (50%) to full load (100%), there is no oil consumption spike after the
transient and the oil consumption increases gradually from the initial condition to the
final operating condition.
0
800
700
600
500
400
300
200
100
0
0 % = 100% Load
OilCons.
Air Flow
I I I I
-30
25%.
01i
0
800
700
600
500
400
300
200
100
0-30 0
50%8W _0 -
C)0
OsC0C.)
70 0
600-
5004
4001
300-
200 -
100-
30 60
o 100% Load
30 60
100% Load
-30 0 30 60 90Time [s]
90 120 150 180
.... .. ... .... .. 1
400
20 <
0
60
40
U-20 .!
0 12 1 I 90 120 150 180
60
40
U.20 <
-i-I 0
120 150 180
Figure 3-14 Oil consumption during transient in load and the importance of the initial
load at 4000 rpm
76
Oil Cons.
-Air Flow
. .-
Oil Cons.
Air Flow
.. -
memo
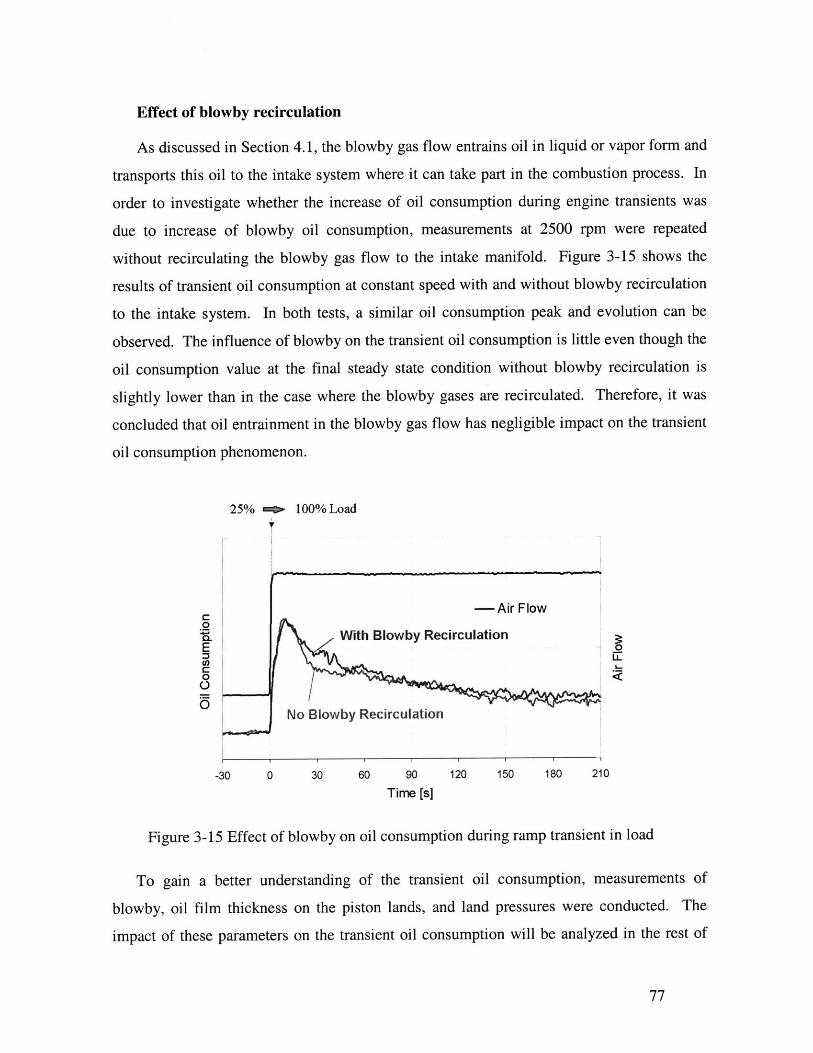
Effect of blowby recirculation
As discussed in Section 4.1, the blowby gas flow entrains oil in liquid or vapor form and
transports this oil to the intake system where it can take part in the combustion process. In
order to investigate whether the increase of oil consumption during engine transients was
due to increase of blowby oil consumption, measurements at 2500 rpm were repeated
without recirculating the blowby gas flow to the intake manifold. Figure 3-15 shows the
results of transient oil consumption at constant speed with and without blowby recirculation
to the intake system. In both tests, a similar oil consumption peak and evolution can be
observed. The influence of blowby on the transient oil consumption is little even though the
oil consumption value at the final steady state condition without blowby recirculation is
slightly lower than in the case where the blowby gases are recirculated. Therefore, it was
concluded that oil entrainment in the blowby gas flow has negligible impact on the transient
oil consumption phenomenon.
25% e 100% Load
-Air Flow0
With Blowby RecirculationE 0
(n LL
No Blowby Recirculation
-30 0 30 60 90 120 150 180 210
Time [s]
Figure 3-15 Effect of blowby on oil consumption during ramp transient in load
To gain a better understanding of the transient oil consumption, measurements of
blowby, oil film thickness on the piston lands, and land pressures were conducted. The
impact of these parameters on the transient oil consumption will be analyzed in the rest of
77
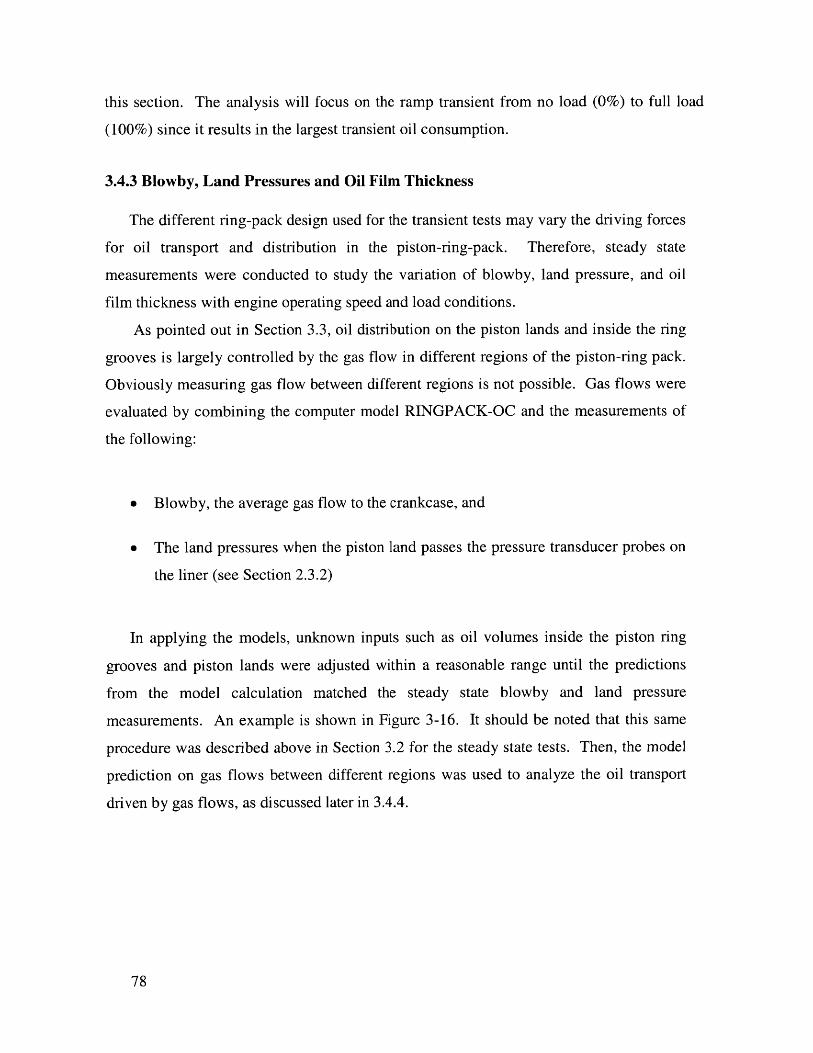
this section. The analysis will focus on the ramp transient from no load (0%) to full load
(100%) since it results in the largest transient oil consumption.
3.4.3 Blowby, Land Pressures and Oil Film Thickness
The different ring-pack design used for the transient tests may vary the driving forces
for oil transport and distribution in the piston-ring-pack. Therefore, steady state
measurements were conducted to study the variation of blowby, land pressure, and oil
film thickness with engine operating speed and load conditions.
As pointed out in Section 3.3, oil distribution on the piston lands and inside the ring
grooves is largely controlled by the gas flow in different regions of the piston-ring pack.
Obviously measuring gas flow between different regions is not possible. Gas flows were
evaluated by combining the computer model RINGPACK-OC and the measurements of
the following:
" Blowby, the average gas flow to the crankcase, and
" The land pressures when the piston land passes the pressure transducer probes on
the liner (see Section 2.3.2)
In applying the models, unknown inputs such as oil volumes inside the piston ring
grooves and piston lands were adjusted within a reasonable range until the predictions
from the model calculation matched the steady state blowby and land pressure
measurements. An example is shown in Figure 3-16. It should be noted that this same
procedure was described above in Section 3.2 for the steady state tests. Then, the model
prediction on gas flows between different regions was used to analyze the oil transport
driven by gas flows, as discussed later in 3.4.4.
78
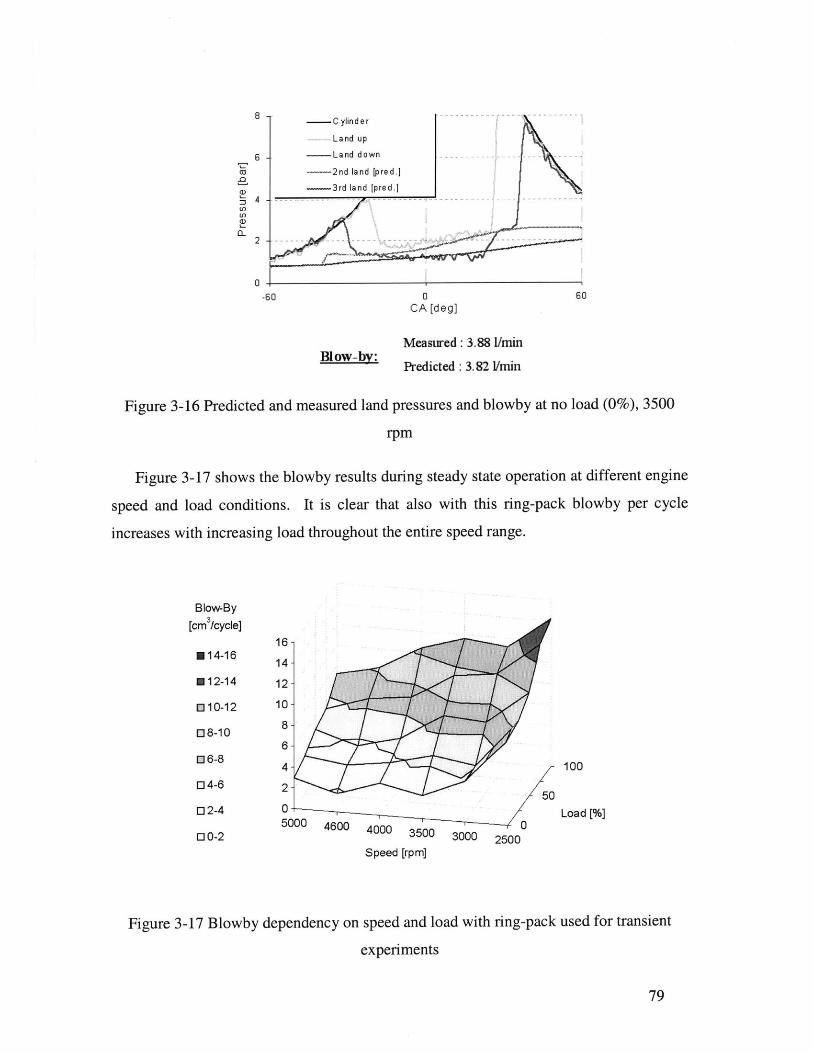
8 -- Cylinder
Land up
6 - Land down
-- 2nd land [pred.]
- 3rd land [pred.]4 -4
U)
0
-60 0 60CA [deg]
Measured: 3.88 1/minBlow-by: Predicted: 3.82 I/min
Figure 3-16 Predicted and measured land pressures and blowby at no load (0%), 3500
rpm
Figure 3-17 shows the blowby results during steady state operation at different engine
speed and load conditions. It is clear that also with this ring-pack blowby per cycle
increases with increasing load throughout the entire speed range.
Blow-By
[cm3/cycle]16
E14-16 14
N12-14 12
010-12 10
08-10 8-606-8-
E4 6-8 100
04-6 250
02-4 0 Load [%]5000 4600 4000 3500 3000 2500
0 0-2 30 0020Speed [rpm]
Figure 3-17 Blowby dependency on speed and load with ring-pack used for transient
experiments
79
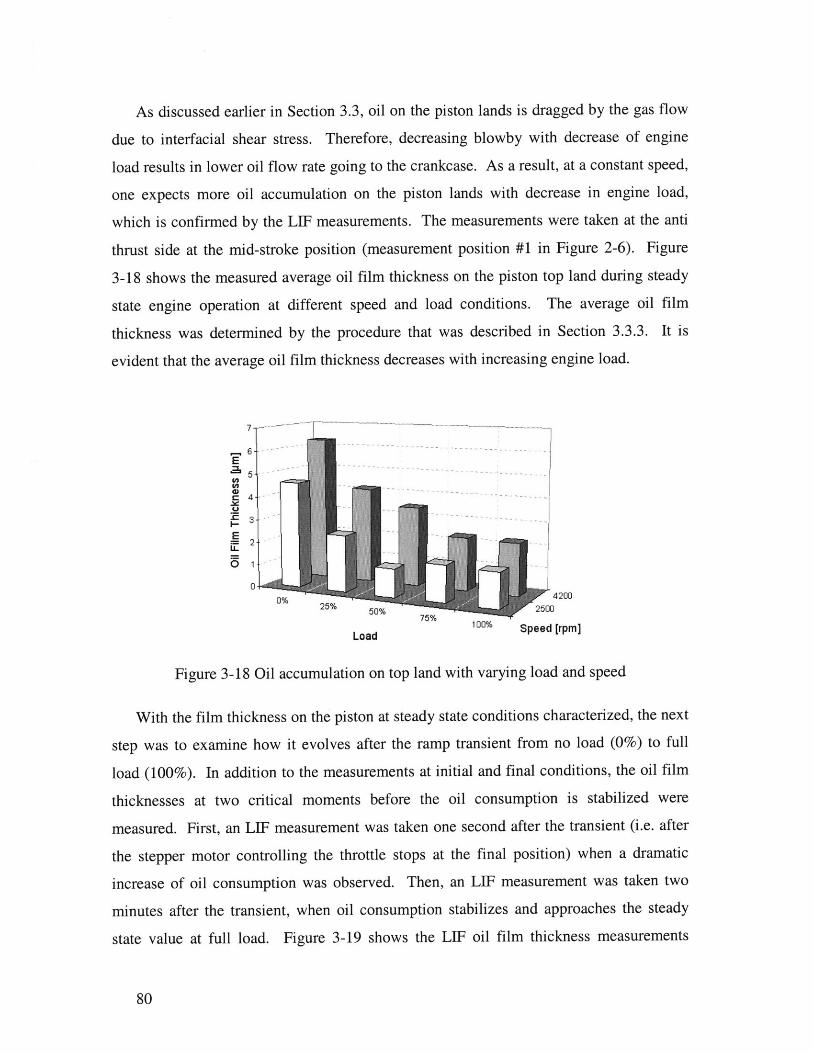
As discussed earlier in Section 3.3, oil on the piston lands is dragged by the gas flow
due to interfacial shear stress. Therefore, decreasing blowby with decrease of engine
load results in lower oil flow rate going to the crankcase. As a result, at a constant speed,
one expects more oil accumulation on the piston lands with decrease in engine load,
which is confirmed by the LIF measurements. The measurements were taken at the anti
thrust side at the mid-stroke position (measurement position #1 in Figure 2-6). Figure
3-18 shows the measured average oil film thickness on the piston top land during steady
state engine operation at different speed and load conditions. The average oil film
thickness was determined by the procedure that was described in Section 3.3.3. It is
evident that the average oil film thickness decreases with increasing engine load.
, , 6 --E
4-
E
0
0% -5 4200
2% 50% 250075%
Load 100% Speed [rpm]
Figure 3-18 Oil accumulation on top land with varying load and speed
With the film thickness on the piston at steady state conditions characterized, the next
step was to examine how it evolves after the ramp transient from no load (0%) to full
load (100%). In addition to the measurements at initial and final conditions, the oil film
thicknesses at two critical moments before the oil consumption is stabilized were
measured. First, an LIF measurement was taken one second after the transient (i.e. after
the stepper motor controlling the throttle stops at the final position) when a dramatic
increase of oil consumption was observed. Then, an LIF measurement was taken two
minutes after the transient, when oil consumption stabilizes and approaches the steady
state value at full load. Figure 3-19 shows the LIF oil film thickness measurements
80
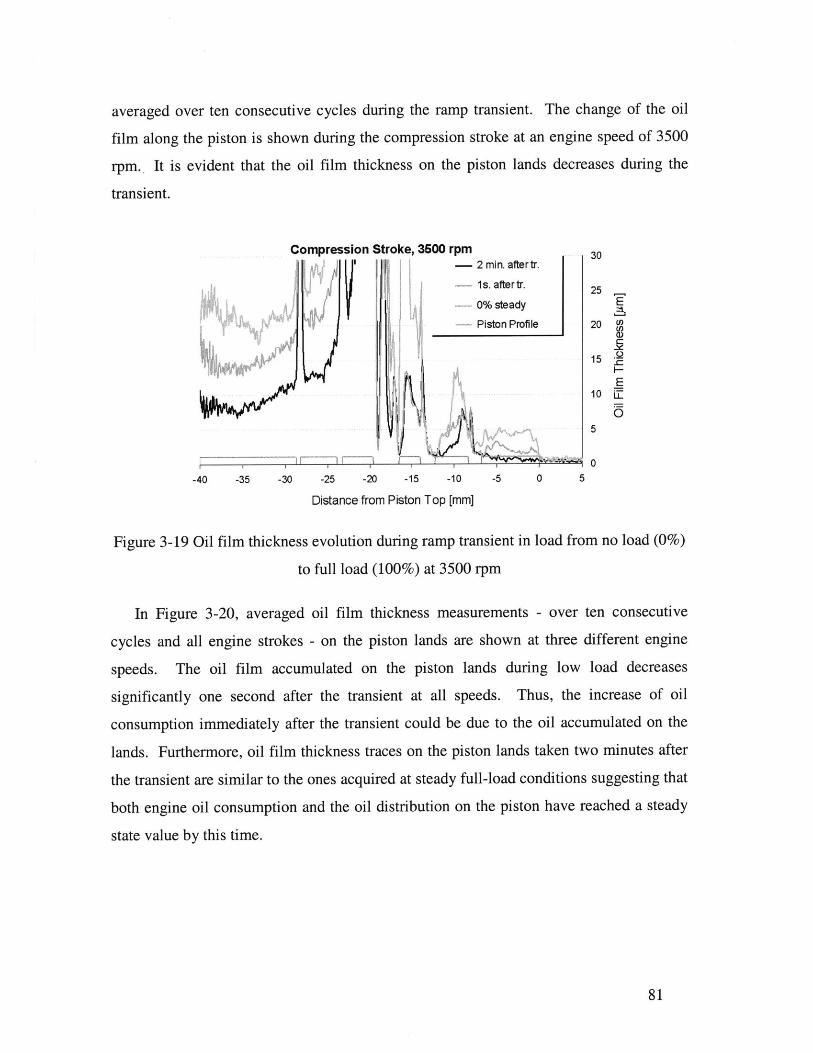
averaged over ten consecutive cycles during the ramp transient. The change of the oil
film along the piston is shown during the compression stroke at an engine speed of 3500
rpm.. It is evident that the oil film thickness on the piston lands decreases during the
transient.
Compression Stroke, 3600 rpm 302 min. aftertr.1s. aftertr. 25 _
0% steady E
Piston Profile 20 c)
15
10
-40 -35 -30 -25 -20 -15 -10 -5 0 5
Distance from Piston Top [mm]
Figure 3-19 Oil film thickness evolution during ramp transient in load from no load (0%)
to full load (100%) at 3500 rpm
In Figure 3-20, averaged oil film thickness measurements - over ten consecutive
cycles and all engine strokes - on the piston lands are shown at three different engine
speeds. The oil film accumulated on the piston lands during low load decreases
significantly one second after the transient at all speeds. Thus, the increase of oil
consumption immediately after the transient could be due to the oil accumulated on the
lands. Furthermore, oil film thickness traces on the piston lands taken two minutes after
the transient are similar to the ones acquired at steady full-load conditions suggesting that
both engine oil consumption and the oil distribution on the piston have reached a steady
state value by this time.
81
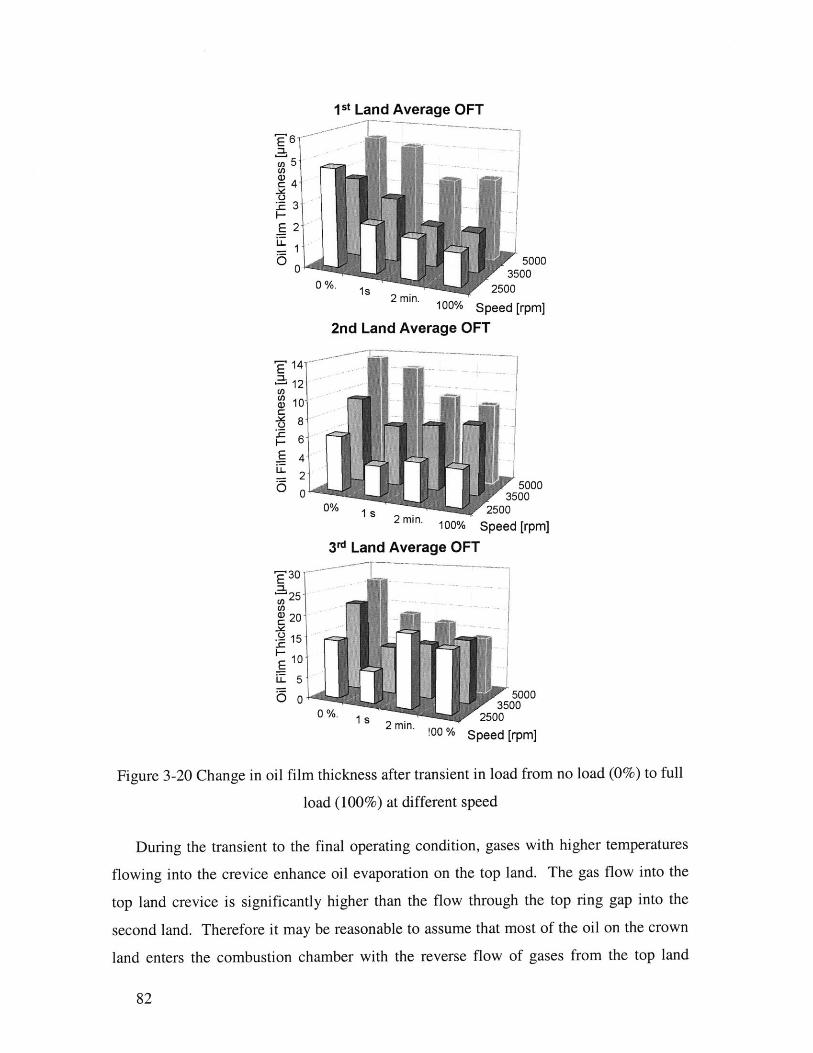
1 st Land Average OFT
6
co5
c4
.23
E --
0
EL
CnCOW,
H-0
50003500
0 %. 1S 2mn 2500
100% Speed [rpm]
2nd Land Average OFT
14
12
10
86
4
25000
0 35000% 2500
1 sin2 mn. 100% Speed [rpm]
3d Land Average OFT
320a
25
E 10
1510
0 0 50003500
0%. 1S 2 m . 250000 % Speed [rpm]
Figure 3-20 Change in oil film thickness after transient in load from no load (0%) to full
load (100%) at different speed
During the transient to the final operating condition, gases with higher temperatures
flowing into the crevice enhance oil evaporation on the top land. The gas flow into the
top land crevice is significantly higher than the flow through the top ring gap into the
second land. Therefore it may be reasonable to assume that most of the oil on the crown
land enters the combustion chamber with the reverse flow of gases from the top land
82
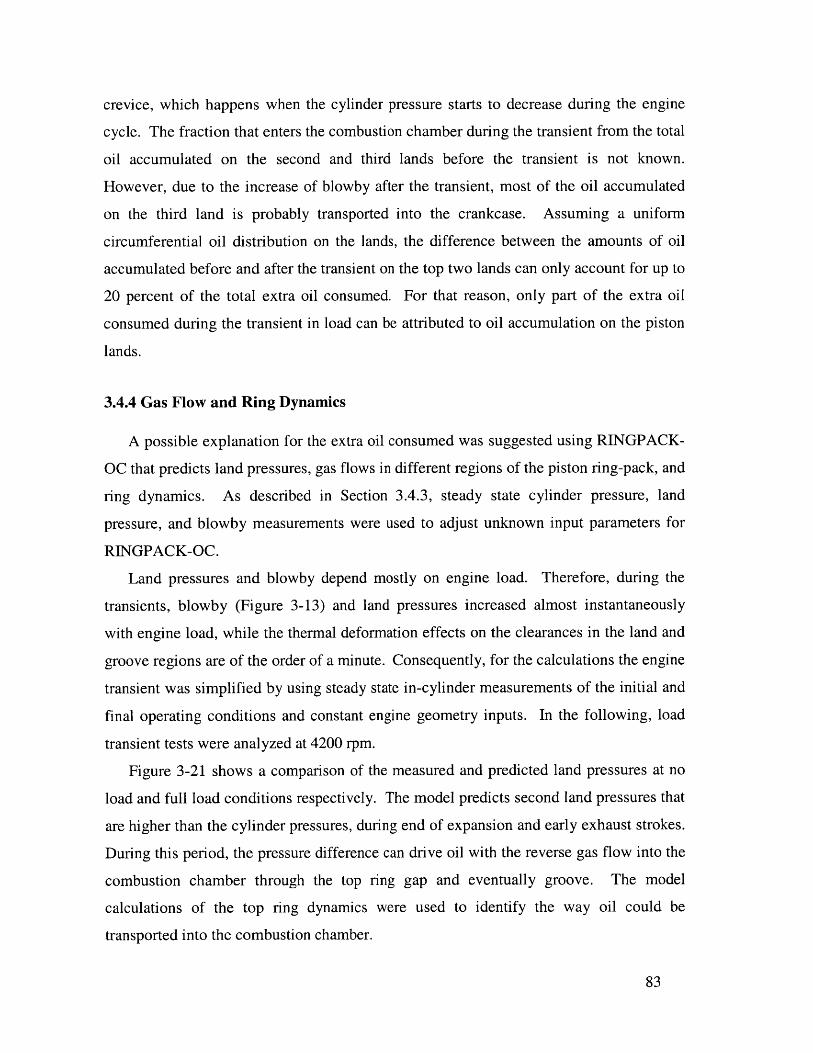
crevice, which happens when the cylinder pressure starts to decrease during the engine
cycle. The fraction that enters the combustion chamber during the transient from the total
oil accumulated on the second and third lands before the transient is not known.
However, due to the increase of blowby after the transient, most of the oil accumulated
on the third land is probably transported into the crankcase. Assuming a uniform
circumferential oil distribution on the lands, the difference between the amounts of oil
accumulated before and after the transient on the top two lands can only account for up to
20 percent of the total extra oil consumed. For that reason, only part of the extra oil
consumed during the transient in load can be attributed to oil accumulation on the piston
lands.
3.4.4 Gas Flow and Ring Dynamics
A possible explanation for the extra oil consumed was suggested using RINGPACK-
OC that predicts land pressures, gas flows in different regions of the piston ring-pack, and
ring dynamics. As described in Section 3.4.3, steady state cylinder pressure, land
pressure, and blowby measurements were used to adjust unknown input parameters for
RINGPACK-OC.
Land pressures and blowby depend mostly on engine load. Therefore, during the
transients, blowby (Figure 3-13) and land pressures increased almost instantaneously
with engine load, while the thermal deformation effects on the clearances in the land and
groove regions are of the order of a minute. Consequently, for the calculations the engine
transient was simplified by using steady state in-cylinder measurements of the initial and
final operating conditions and constant engine geometry inputs. In the following, load
transient tests were analyzed at 4200 rpm.
Figure 3-21 shows a comparison of the measured and predicted land pressures at no
load and full load conditions respectively. The model predicts second land pressures that
are higher than the cylinder pressures, during end of expansion and early exhaust strokes.
During this period, the pressure difference can drive oil with the reverse gas flow into the
combustion chamber through the top ring gap and eventually groove. The model
calculations of the top ring dynamics were used to identify the way oil could be
transported into the combustion chamber.
83

60 -
-180 0CA [deg]
180
No LoadCylinder
I (upper) 2,1, Land (predicted)
(lower)
Land
Land 2
-180 0
CA [deg]180
Figure 3-21 Comparison of measured and predicted land pressures at 4200rpm
Figure 3-22 shows the predicted normalized lift of the top ring center of gravity under
no load and full load conditions at 4200 rpm. It is evident that top ring dynamics is more
pronounced at full load, during the end of expansion and early exhaust strokes. During
and after load transients, higher cylinder pressures trigger higher second land pressures.
Therefore, during the end of expansion and early exhaust stroke, when the inertia force is
downward, significantly higher second land pressures cause the top ring to lose its sealing
84
Cylinder
md 1 (upper)
Land 2 (lower)
50
40CU
30
C2"0~
Full Load
2 nd Land (predicted)
UiL nd (predicted)
L
10
0 -
-360
14
12 2
360
10 -
8-
6-
4-
CU-o
ID-
0-
2 -
A -1--360 360
M
ability. Furthermore, the higher second land pressure induces ring flutter in the groove
introducing additional leakage paths for reverse blowby gases to flow into the
combustion chamber.
- Full Load0 .9 -- - - --- - - - -- - - - - - - - -
0.8 --------- -----N o L oad-
0.7 --------- ------- -------- - ------ 1--CLS0.6 1 1
-- - --- ----- 3 6
S 0.5 -- - - - - - - - - - - - - - - -
0CA-d-g-Fig04 3 T gd
Z0 0.3 ----- --- ]---------- ---
-360 -180 0 180 360CA [deg]
Figure 3-22 Top ring dynamics at 4200 rpm
Ring flutter has been characterized in earlier studies by Tian [43][44][54]. It is a
result of the competition between gas pressure and inertial forces on the ring at a certain
geometrical configuration with its groove. The top ring in its groove can only flutter and
cause reverse blowby gases to flow into the combustion chamber when three critical
conditions exist (see also Figure 3-23):
" The inertial force on the ring is pointing towards the crankcase
* The cylinder pressure is lower than the second land pressure and
" The relative angle between the top ring and its groove is positive as shown in
Figure 3-23
The relative angle between the top ring and its groove depends on the ring static and
dynamic twist, and on the top ring groove tilt. The top ring groove tilt is a result of
piston thermal and mechanical deformations during engine operation.
85
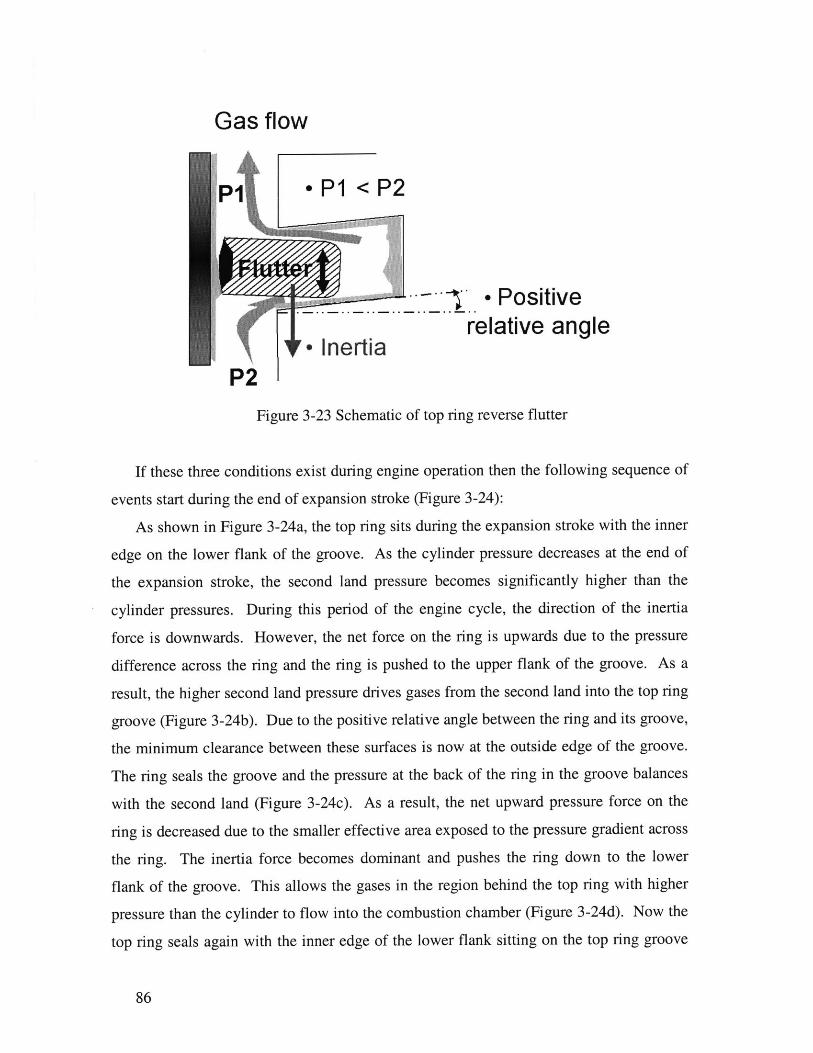
Gas flow
P1 - P1 < P2
- Positiverelative angle
-InertiaP2
Figure 3-23 Schematic of top ring reverse flutter
If these three conditions exist during engine operation then the following sequence of
events start during the end of expansion stroke (Figure 3-24):
As shown in Figure 3-24a, the top ring sits during the expansion stroke with the inner
edge on the lower flank of the groove. As the cylinder pressure decreases at the end of
the expansion stroke, the second land pressure becomes significantly higher than the
cylinder pressures. During this period of the engine cycle, the direction of the inertia
force is downwards. However, the net force on the ring is upwards due to the pressure
difference across the ring and the ring is pushed to the upper flank of the groove. As a
result, the higher second land pressure drives gases from the second land into the top ring
groove (Figure 3-24b). Due to the positive relative angle between the ring and its groove,
the minimum clearance between these surfaces is now at the outside edge of the groove.
The ring seals the groove and the pressure at the back of the ring in the groove balances
with the second land (Figure 3-24c). As a result, the net upward pressure force on the
ring is decreased due to the smaller effective area exposed to the pressure gradient across
the ring. The inertia force becomes dominant and pushes the ring down to the lower
flank of the groove. This allows the gases in the region behind the top ring with higher
pressure than the cylinder to flow into the combustion chamber (Figure 3-24d). Now the
top ring seals again with the inner edge of the lower flank sitting on the top ring groove
86
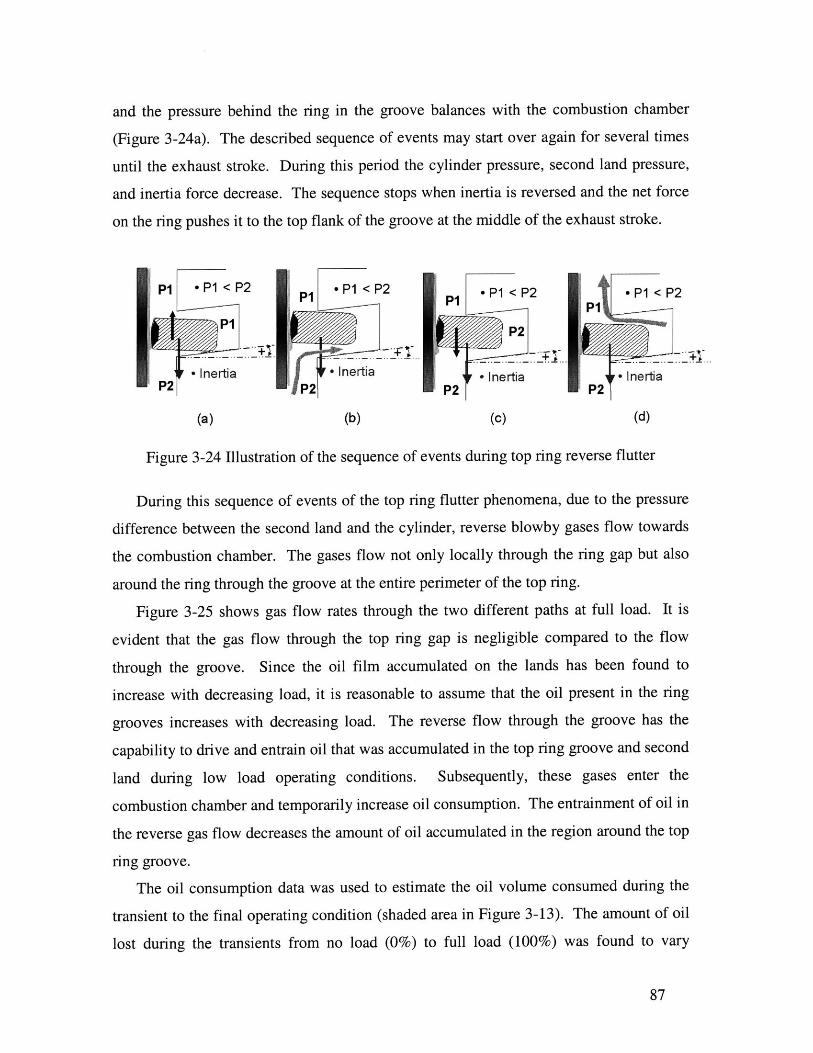
and the pressure behind the ring in the groove balances with the combustion chamber
(Figure 3-24a). The described sequence of events may start over again for several times
until the exhaust stroke. During this period the cylinder pressure, second land pressure,
and inertia force decrease. The sequence stops when inertia is reversed and the net force
on the ring pushes it to the top flank of the groove at the middle of the exhaust stroke.
P1 P1<-P2 P1 < P2
I P1 ~P - 1<PP P 21
P1 < P2 -P1 < P2
P 1P 1
2
Inertia - Inertia - Inertia InertiaP2 P2 P2 P2
(a) (b) (c) (d)
Figure 3-24 Illustration of the sequence of events during top ring reverse flutter
During this sequence of events of the top ring flutter phenomena, due to the pressure
difference between the second land and the cylinder, reverse blowby gases flow towards
the combustion chamber. The gases flow not only locally through the ring gap but also
around the ring through the groove at the entire perimeter of the top ring.
Figure 3-25 shows gas flow rates through the two different paths at full load. It is
evident that the gas flow through the top ring gap is negligible compared to the flow
through the groove. Since the oil film accumulated on the lands has been found to
increase with decreasing load, it is reasonable to assume that the oil present in the ring
grooves increases with decreasing load. The reverse flow through the groove has the
capability to drive and entrain oil that was accumulated in the top ring groove and second
land during low load operating conditions. Subsequently, these gases enter the
combustion chamber and temporarily increase oil consumption. The entrainment of oil in
the reverse gas flow decreases the amount of oil accumulated in the region around the top
ring groove.
The oil consumption data was used to estimate the oil volume consumed during the
transient to the final operating condition (shaded area in Figure 3-13). The amount of oil
lost during the transients from no load (0%) to full load (100%) was found to vary
87
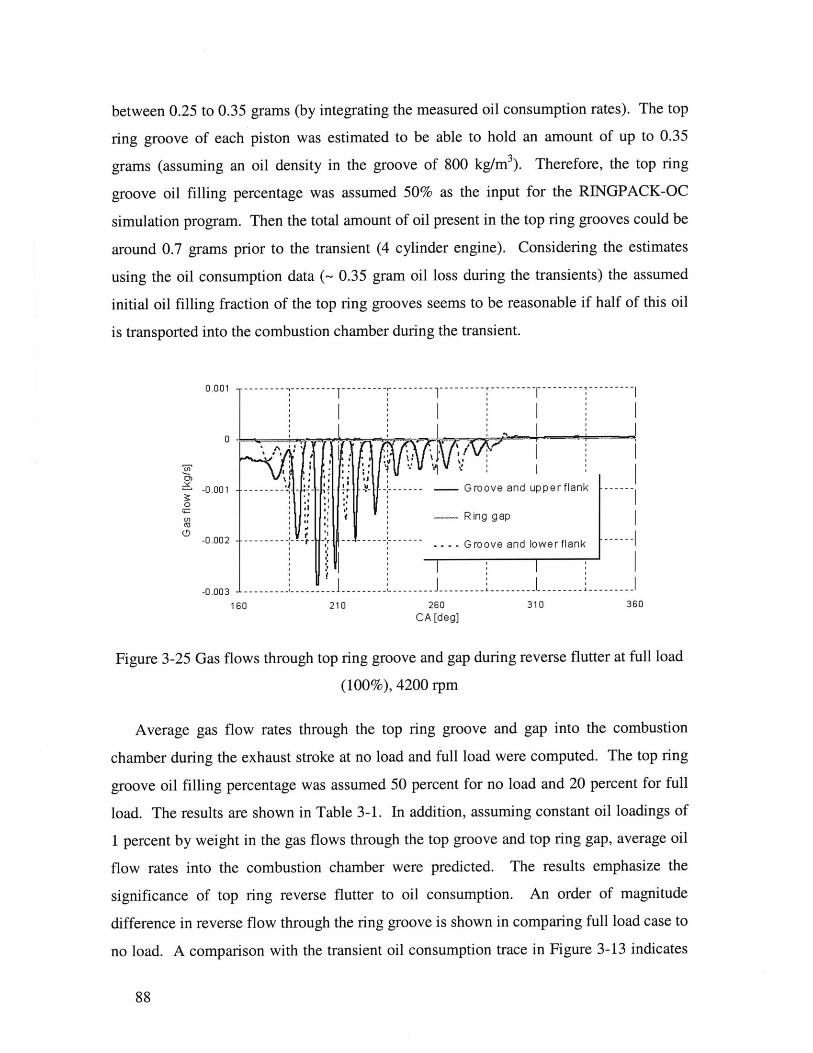
between 0.25 to 0.35 grams (by integrating the measured oil consumption rates). The top
ring groove of each piston was estimated to be able to hold an amount of up to 0.35
grams (assuming an oil density in the groove of 800 kg/m 3). Therefore, the top ring
groove oil filling percentage was assumed 50% as the input for the RINGPACK-OC
simulation program. Then the total amount of oil present in the top ring grooves could be
around 0.7 grams prior to the transient (4 cylinder engine). Considering the estimates
using the oil consumption data (- 0.35 gram oil loss during the transients) the assumed
initial oil filling fraction of the top ring grooves seems to be reasonable if half of this oil
is transported into the combustion chamber during the transient.
0.001
0
0
1-0.001 -
-0.002 -
-0.003 -L
16
------------------- -------- -------
-------- - - ------ - Groove and upperflank ------
- Ring gap
- - Groove and lower flank
------------------ ------------------ -------- -----------------
0 210 260 310 360CA [deg]
Figure 3-25 Gas flows through top ring groove and gap during reverse flutter at full load
(100%), 4200 rpm
Average gas flow rates through the top ring groove and gap into the combustion
chamber during the exhaust stroke at no load and full load were computed. The top ring
groove oil filling percentage was assumed 50 percent for no load and 20 percent for full
load. The results are shown in Table 3-1. In addition, assuming constant oil loadings of
1 percent by weight in the gas flows through the top groove and top ring gap, average oil
flow rates into the combustion chamber were predicted. The results emphasize the
significance of top ring reverse flutter to oil consumption. An order of magnitude
difference in reverse flow through the ring groove is shown in comparing full load case to
no load. A comparison with the transient oil consumption trace in Figure 3-13 indicates
88
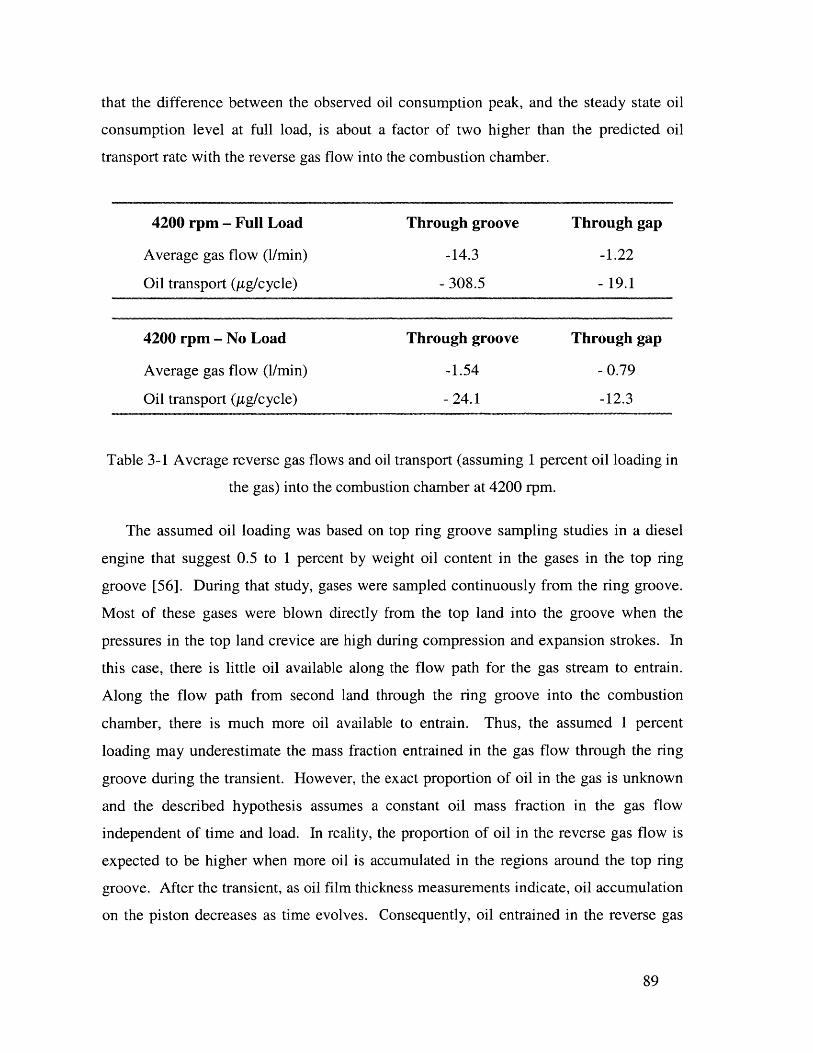
that the difference between the observed oil consumption peak, and the steady state oil
consumption level at full load, is about a factor of two higher than the predicted oil
transport rate with the reverse gas flow into the combustion chamber.
4200 rpm - Full Load Through groove Through gap
Average gas flow (1/min) -14.3 -1.22
Oil transport (ptg/cycle) - 308.5 - 19.1
4200 rpm - No Load Through groove Through gap
Average gas flow (1/min) -1.54 - 0.79
Oil transport (yg/cycle) - 24.1 -12.3
Table 3-1 Average reverse gas flows and oil transport (assuming 1 percent oil loading in
the gas) into the combustion chamber at 4200 rpm.
The assumed oil loading was based on top ring groove sampling studies in a diesel
engine that suggest 0.5 to 1 percent by weight oil content in the gases in the top ring
groove [56]. During that study, gases were sampled continuously from the ring groove.
Most of these gases were blown directly from the top land into the groove when the
pressures in the top land crevice are high during compression and expansion strokes. In
this case, there is little oil available along the flow path for the gas stream to entrain.
Along the flow path from second land through the ring groove into the combustion
chamber, there is much more oil available to entrain. Thus, the assumed 1 percent
loading may underestimate the mass fraction entrained in the gas flow through the ring
groove during the transient. However, the exact proportion of oil in the gas is unknown
and the described hypothesis assumes a constant oil mass fraction in the gas flow
independent of time and load. In reality, the proportion of oil in the reverse gas flow is
expected to be higher when more oil is accumulated in the regions around the top ring
groove. After the transient, as oil film thickness measurements indicate, oil accumulation
on the piston decreases as time evolves. Consequently, oil entrained in the reverse gas
89
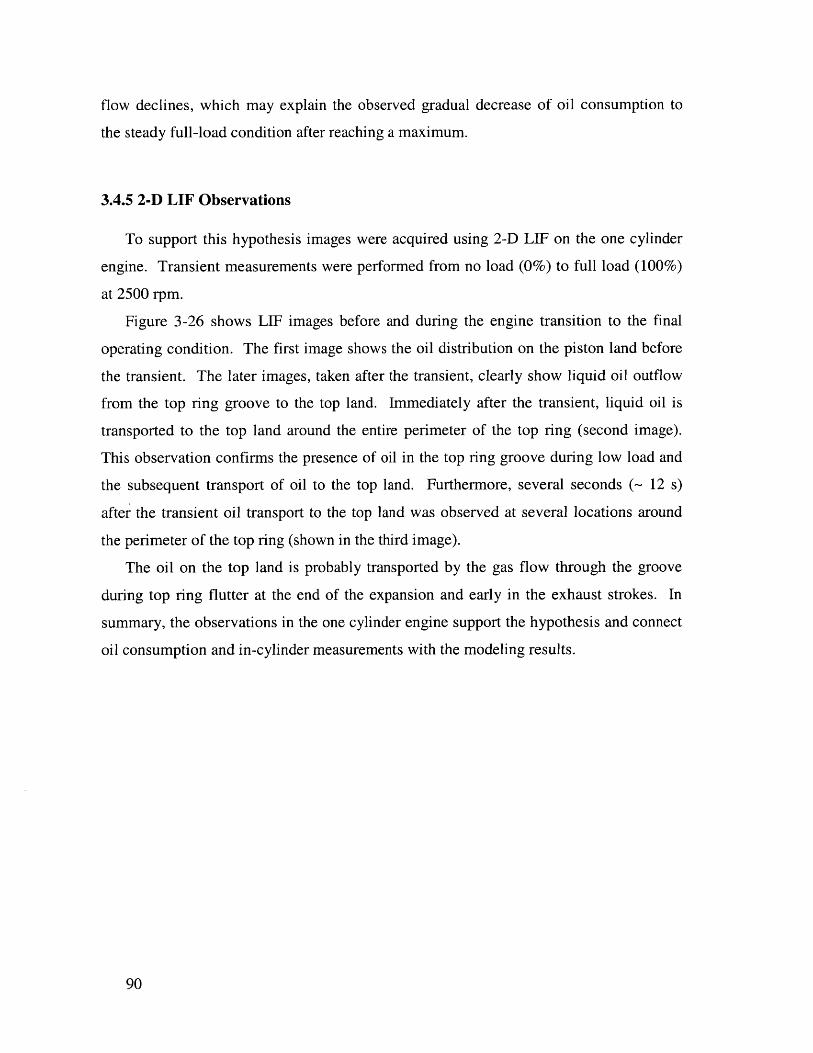
flow declines, which may explain the observed gradual decrease of oil consumption to
the steady full-load condition after reaching a maximum.
3.4.5 2-D LIF Observations
To support this hypothesis images were acquired using 2-D LIF on the one cylinder
engine. Transient measurements were performed from no load (0%) to full load (100%)
at 2500 rpm.
Figure 3-26 shows LIF images before and during the engine transition to the final
operating condition. The first image shows the oil distribution on the piston land before
the transient. The later images, taken after the transient, clearly show liquid oil outflow
from the top ring groove to the top land. Immediately after the transient, liquid oil is
transported to the top land around the entire perimeter of the top ring (second image).
This observation confirms the presence of oil in the top ring groove during low load and
the subsequent transport of oil to the top land. Furthermore, several seconds (- 12 s)
after the transient oil transport to the top land was observed at several locations around
the perimeter of the top ring (shown in the third image).
The oil on the top land is probably transported by the gas flow through the groove
during top ring flutter at the end of the expansion and early in the exhaust strokes. In
summary, the observations in the one cylinder engine support the hypothesis and connect
oil consumption and in-cylinder measurements with the modeling results.
90
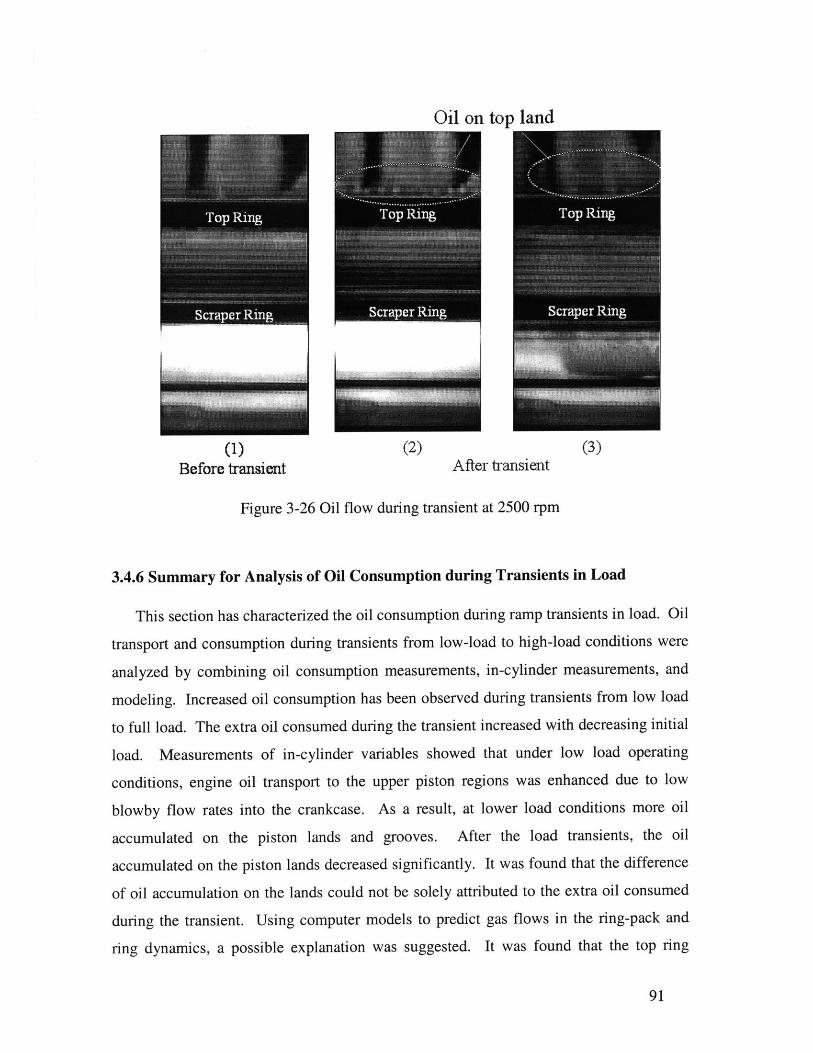
Oil on top land
(1) (2) (3)
Before transient After transient
Figure 3-26 Oil flow during transient at 2500 rpm
3.4.6 Summary for Analysis of Oil Consumption during Transients in Load
This section has characterized the oil consumption during ramp transients in load. Oil
transport and consumption during transients from low-load to high-load conditions were
analyzed by combining oil consumption measurements, in-cylinder measurements, and
modeling. Increased oil consumption has been observed during transients from low load
to full load. The extra oil consumed during the transient increased with decreasing initial
load. Measurements of in-cylinder variables showed that under low load operating
conditions, engine oil transport to the upper piston regions was enhanced due to low
blowby flow rates into the crankcase. As a result, at lower load conditions more oil
accumulated on the piston lands and grooves. After the load transients, the oil
accumulated on the piston lands decreased significantly. It was found that the difference
of oil accumulation on the lands could not be solely attributed to the extra oil consumed
during the transient. Using computer models to predict gas flows in the ring-pack and
ring dynamics, a possible explanation was suggested. It was found that the top ring
91
I
might lose its sealing ability and flutter during the transient at full load. During top ring
flutter, reverse gas flows through the groove, entraining the oil that was accumulated in
the groove during low load conditions and driving it into the combustion chamber. This
hypothesis was supported by the observations on a one-cylinder research engine with the
same ring-pack and engine design when images acquired using a 2-D LIEF technique
during the same load transients clearly showed liquid oil flowing out from the top ring
groove.
92
Chapter 4 Oil Consumption Sources
All oil consumption sources described in Chapter 1 contribute to total oil
consumption during engine operation. The contribution of each source depends on
different driving forces for oil transport, and on lubricant properties. For example, oil
evaporation is believed to depend largely on component temperatures, lubricant volatility,
the transport rate processes of the oil vapor into the cylinder gas, and the supply of oil to
regions of high evaporation. The entrainment of oil in the blowby flow depends on oil
transport, oil distribution, and the complex flow of gas in the piston-ring-pack. Most of
these controlling parameters for oil consumption change with engine operating conditions.
Consequently, also the oil consumption rate and the contribution of the different oil
consumption sources change with engine operating speed and load.
In this chapter, the contribution of different oil consumption sources to total engine
oil consumption is analyzed at various steady state speed and load conditions. The
contribution of oil entrained in the blowby gas to total engine oil consumption is
experimentally quantified and analyzed. Oil evaporation is then characterized,
combining oil consumption measurements, in-cylinder measurements, and theoretical
modeling. Finally, the experimental and modeling results are used to separate and assess
the contribution of three major oil consumption sources to total oil consumption at
different steady state speed and load conditions.
4.1 Blowby
Combustion chamber gases leak past the piston-ring-liner system into the crankcase
due to imperfect sealing by the piston rings. This leakage, also referred as blowby, is a
non-steady periodic flow containing combustion gases, soot, unburned mixture, and oil in
liquid and vapor form. The blowby flow characteristics were described in more detail in
Section 2.3.1.2. In modern engines, the crankcase is vented to the intake system and
blowby gases are recycled. The oil mist that is entrained in the blowby flow to the intake
system subsequently enters the combustion chamber and contributes to total engine oil
93
consumption. Earlier experimental studies have found that the blowby contribution to
total oil consumption could be significant for specific engines and operating conditions
[1][7]. In addition to this, the recycled oil in the blowby may form deposits on the intake
valves and on compressor blades of turbocharged engines causing engine performance
efficiency drops or even, in extreme cases, the failure of these components.
4.1.1 Blowby Contribution to Oil Consumption at Different Speed and Load
Oil from various sources in different regions is entrained in the blowby gas. Along
the blowby flow path from the combustion chamber to the crankcase, the gases flow
through various regions of the piston-ring-pack and entrain oil. The oil entrainment in
these regions is believed to be both in liquid and vapor form. More volatile oil
compounds are assumed to evaporate from hot surfaces into the blowby gas stream, and
the micron scale liquid oil film in the piston-ring-pack is atomized by locally high
velocity gas flows. On their flow path to the crankcase, the gases may flow through the
ring gaps, through the ring groove during ring flutter, and through the clearance between
ring and liner during ring collapse [43][44]. During most operating conditions, however,
ring stability is preserved and the main leakage of consequence is the gas flow from ring
gap to ring gap. This gas flow drags the oil on the piston lands toward the ring gaps due
to interfacial shear stresses. Experimental evidence from 2-D visualization suggests that
this oil atomizes in the ring gap as it flows through, dragged by the high velocity gas flow
[46]. A large fraction of this oil is believed to be entrained in the gas stream. The oil
transport to the ring gaps was found to depend on the average oil film thickness on the
piston lands and on the cumulative volumetric blowby gas flow rate (see Section 3.3.2.2).
Therefore, oil distribution on the piston lands and blowby flow are both believed to have
a significant impact on oil entrainment in the piston-ring-pack. After passing the piston
skirt, the oil-laden blowby gases enter the crankcase and mix with the crankcase gases.
In the crankcase, moving engine parts may reach significant velocities and the piston
alternating motion may generate locally high gas velocities. Here, additional oil
entrainment can be expected, aided by oil splashing from moving parts, oil leaks from the
bearings and the spray jet cooling of the piston. Spray jet cooling is employed in the test
engine to reduce the piston temperature by enhancing heat transfer and to supply
94
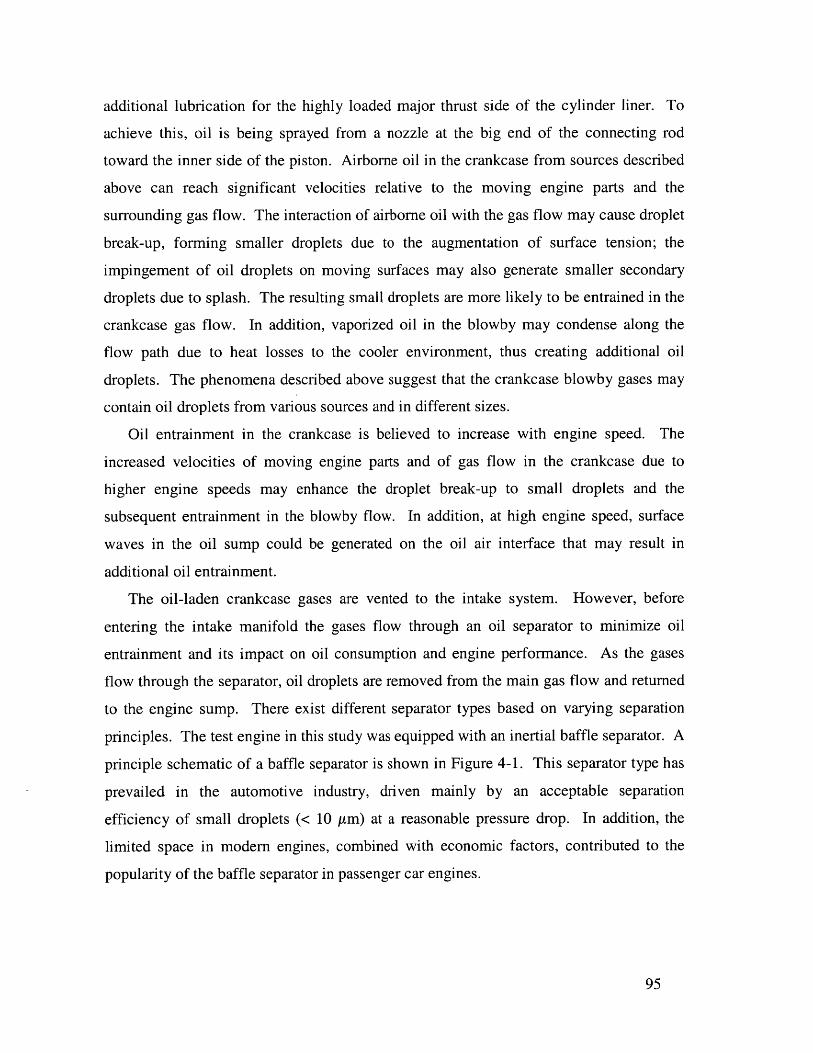
additional lubrication for the highly loaded major thrust side of the cylinder liner. To
achieve this, oil is being sprayed from a nozzle at the big end of the connecting rod
toward the inner side of the piston. Airborne oil in the crankcase from sources described
above can reach significant velocities relative to the moving engine parts and the
surrounding gas flow. The interaction of airborne oil with the gas flow may cause droplet
break-up, forming smaller droplets due to the augmentation of surface tension; the
impingement of oil droplets on moving surfaces may also generate smaller secondary
droplets due to splash. The resulting small droplets are more likely to be entrained in the
crankcase gas flow. In addition, vaporized oil in the blowby may condense along the
flow path due to heat losses to the cooler environment, thus creating additional oil
droplets. The phenomena described above suggest that the crankcase blowby gases may
contain oil droplets from various sources and in different sizes.
Oil entrainment in the crankcase is believed to increase with engine speed. The
increased velocities of moving engine parts and of gas flow in the crankcase due to
higher engine speeds may enhance the droplet break-up to small droplets and the
subsequent entrainment in the blowby flow. In addition, at high engine speed, surface
waves in the oil sump could be generated on the oil air interface that may result in
additional oil entrainment.
The oil-laden crankcase gases are vented to the intake system. However, before
entering the intake manifold the gases flow through an oil separator to minimize oil
entrainment and its impact on oil consumption and engine performance. As the gases
flow through the separator, oil droplets are removed from the main gas flow and returned
to the engine sump. There exist different separator types based on varying separation
principles. The test engine in this study was equipped with an inertial baffle separator. A
principle schematic of a baffle separator is shown in Figure 4-1. This separator type has
prevailed in the automotive industry, driven mainly by an acceptable separation
efficiency of small droplets (< 10 gm) at a reasonable pressure drop. In addition, the
limited space in modern engines, combined with economic factors, contributed to the
popularity of the baffle separator in passenger car engines.
95
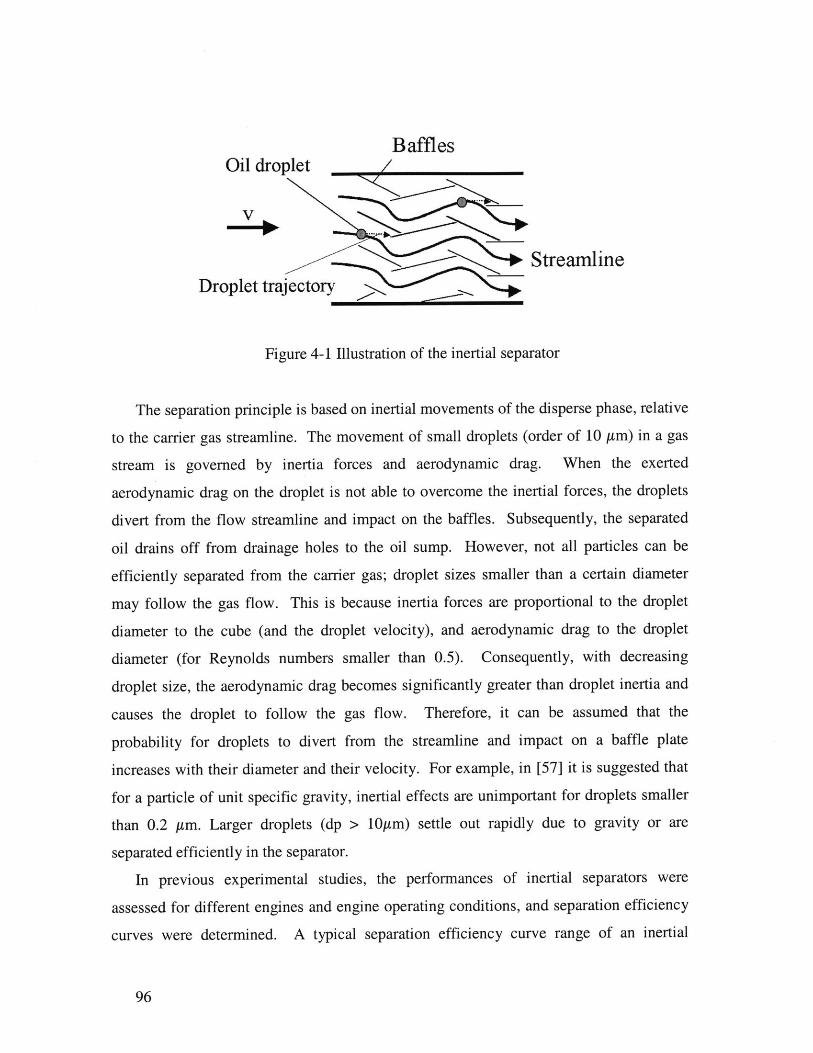
BafflesOil droplet /
V
StreamlineDroplet trajectory
Figure 4-1 Illustration of the inertial separator
The separation principle is based on inertial movements of the disperse phase, relative
to the carrier gas streamline. The movement of small droplets (order of 10 ptm) in a gas
stream is governed by inertia forces and aerodynamic drag. When the exerted
aerodynamic drag on the droplet is not able to overcome the inertial forces, the droplets
divert from the flow streamline and impact on the baffles. Subsequently, the separated
oil drains off from drainage holes to the oil sump. However, not all particles can be
efficiently separated from the carrier gas; droplet sizes smaller than a certain diameter
may follow the gas flow. This is because inertia forces are proportional to the droplet
diameter to the cube (and the droplet velocity), and aerodynamic drag to the droplet
diameter (for Reynolds numbers smaller than 0.5). Consequently, with decreasing
droplet size, the aerodynamic drag becomes significantly greater than droplet inertia and
causes the droplet to follow the gas flow. Therefore, it can be assumed that the
probability for droplets to divert from the streamline and impact on a baffle plate
increases with their diameter and their velocity. For example, in [57] it is suggested that
for a particle of unit specific gravity, inertial effects are unimportant for droplets smaller
than 0.2 Am. Larger droplets (dp > 10pim) settle out rapidly due to gravity or are
separated efficiently in the separator.
In previous experimental studies, the performances of inertial separators were
assessed for different engines and engine operating conditions, and separation efficiency
curves were determined. A typical separation efficiency curve range of an inertial
96

separator is shown in Figure 4-2 [8]. The parameter weight oversize R determines the
cumulative weight fraction of droplets above a certain droplet size. It is evident that the
separation of fine shares (droplets with dp < 21tm) is inefficient. These droplets
constitute about 80 percent of the total droplet mass in the blowby downstream the
separator, and therefore contribute significantly to the total oil in the blowby.
100 100
80 780-60
40
0 --0,4 0,6 0,8 1 2
Droplet Size d [pm
- 60 .2 _
0C')
20
4 6 8 10 LL
I
Figure 4-2 Typical efficiency curve of an inertial separator [8]
From the above description, it is apparent that the amount of oil carried to the intake
system depends not only on entrainment in the piston-ring-pack and crankcase, but also
on the separator performance. All above described aspects for oil entrainment and
separation vary with engine operating conditions, such as speed and load. Therefore, the
oil transported with the blowby to the intake system, thus contributing to total oil
consumption, varies with engine conditions, which emphasizes the complexity of these
phenomena.
For the test engine, the contribution of oil in the blowby to total oil consumption was
quantified at different engine load and speed conditions. This contribution was obtained
by determining the difference in oil consumption with and without blowby gas return to
the intake system. In the latter case, the blowby gases were vented to the test cell exhaust
trench after passing the oil separator. Figure 4-3 shows the oil consumption rate due to
blowby at different steady state engine operating conditions. A close dependence on
97
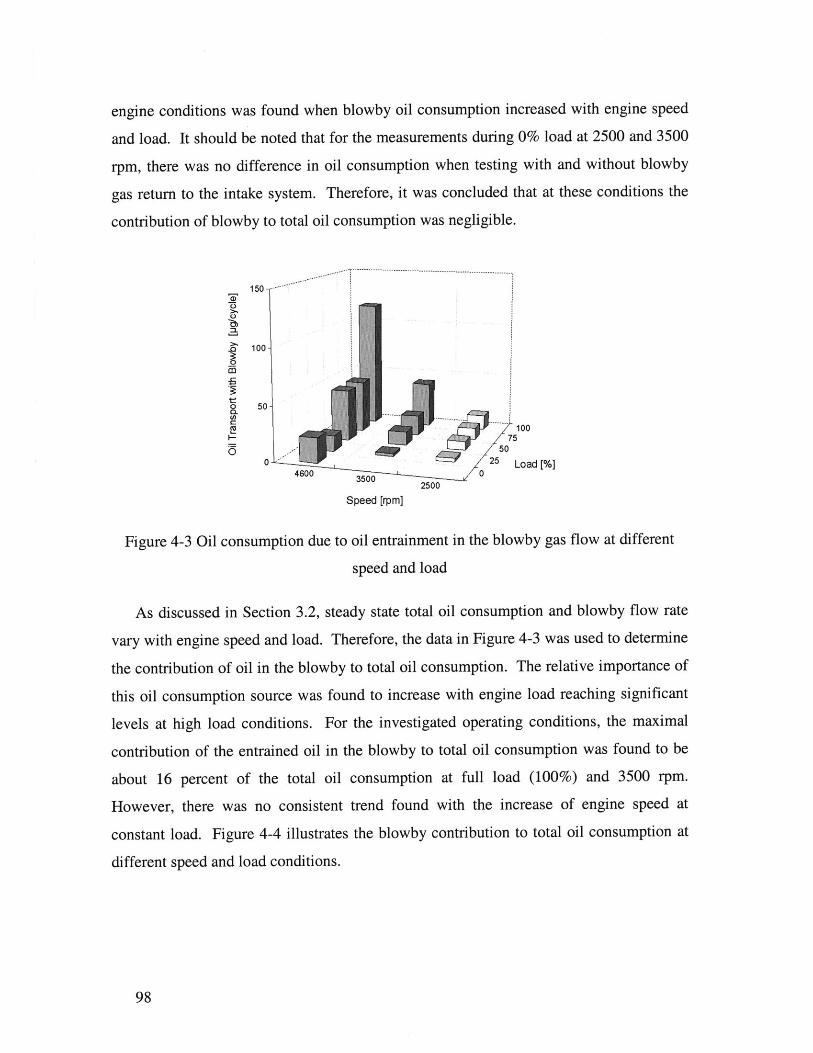
engine conditions was found when blowby oil consumption increased with engine speed
and load. It should be noted that for the measurements during 0% load at 2500 and 3500
rpm, there was no difference in oil consumption when testing with and without blowby
gas return to the intake system. Therefore, it was concluded that at these conditions the
contribution of blowby to total oil consumption was negligible.
150
100
50
10075
050
4600 3500 0 5 La2500
Speed [rpm]
Figure 4-3 Oil consumption due to oil entrainment in the blowby gas flow at different
speed and load
As discussed in Section 3.2, steady state total oil consumption and blowby flow rate
vary with engine speed and load. Therefore, the data in Figure 4-3 was used to determine
the contribution of oil in the blowby to total oil consumption. The relative importance of
this oil consumption source was found to increase with engine load reaching significant
levels at high load conditions. For the investigated operating conditions, the maximal
contribution of the entrained oil in the blowby to total oil consumption was found to be
about 16 percent of the total oil consumption at full load (100%) and 3500 rpm.
However, there was no consistent trend found with the increase of engine speed at
constant load. Figure 4-4 illustrates the blowby contribution to total oil consumption at
different speed and load conditions.
98
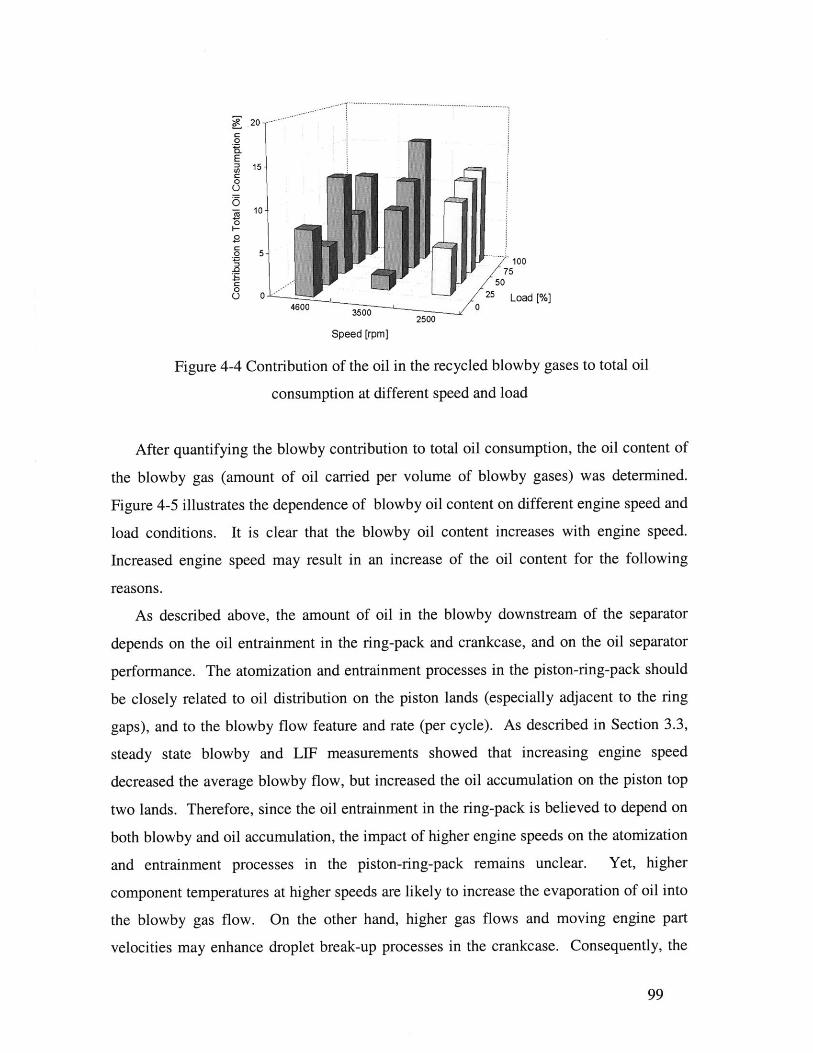
20
E15
t00
C7
010.
0 5
05
o 0 25 Load [%]46 0 3500 0
2500Speed [rpm]
Figure 4-4 Contribution of the oil in the recycled blowby gases to total oil
consumption at different speed and load
After quantifying the blowby contribution to total oil consumption, the oil content of
the blowby gas (amount of oil carried per volume of blowby gases) was determined.
Figure 4-5 illustrates the dependence of blowby oil content on different engine speed and
load conditions. It is clear that the blowby oil content increases with engine speed.
Increased engine speed may result in an increase of the oil content for the following
reasons.
As described above, the amount of oil in the blowby downstream of the separator
depends on the oil entrainment in the ring-pack and crankcase, and on the oil separator
performance. The atomization and entrainment processes in the piston-ring-pack should
be closely related to oil distribution on the piston lands (especially adjacent to the ring
gaps), and to the blowby flow feature and rate (per cycle). As described in Section 3.3,
steady state blowby and LIF measurements showed that increasing engine speed
decreased the average blowby flow, but increased the oil accumulation on the piston top
two lands. Therefore, since the oil entrainment in the ring-pack is believed to depend on
both blowby and oil accumulation, the impact of higher engine speeds on the atomization
and entrainment processes in the piston-ring-pack remains unclear. Yet, higher
component temperatures at higher speeds are likely to increase the evaporation of oil into
the blowby gas flow. On the other hand, higher gas flows and moving engine part
velocities may enhance droplet break-up processes in the crankcase. Consequently, the
99

entrainment of smaller oil droplets in the crankcase gases may increase with increasing
engine speed.
Increasing engine speed may also affect the oil separator's efficiency. Oil separator
efficiency and pressure drop both depend on gas flow characteristic and the size and
velocity of the entrained droplets. Increasing engine speed has little impact on the
average gas flow rate (per unit time), but it increases the frequency of flow pulsations.
The impact of speed on blowby pulsation amplitude and on separator efficiency, however,
is unknown. The understanding of the impact of engine speed on the separation
efficiency requires detailed analysis of gas flow through the separator, which is beyond
the scope of this work.
It can be summarized that increasing engine speed is likely to enhance the oil
entrainment in the crankcase and piston-ring-pack. This increased entrainment could be
the cause for the observed increase of the blowby oil content with engine speed. Even
though the oil content in the blowby increases with speed, the relative importance to total
oil consumption does not indicate speed dependence.
-.---..-------------.--..-.---------------------
15
10-
100
0 25 5Load [%]4600 3500
3500 2500
Speed [rpm]
Figure 4-5 Oil loading in the blowby gas flow into the intake manifold system
100
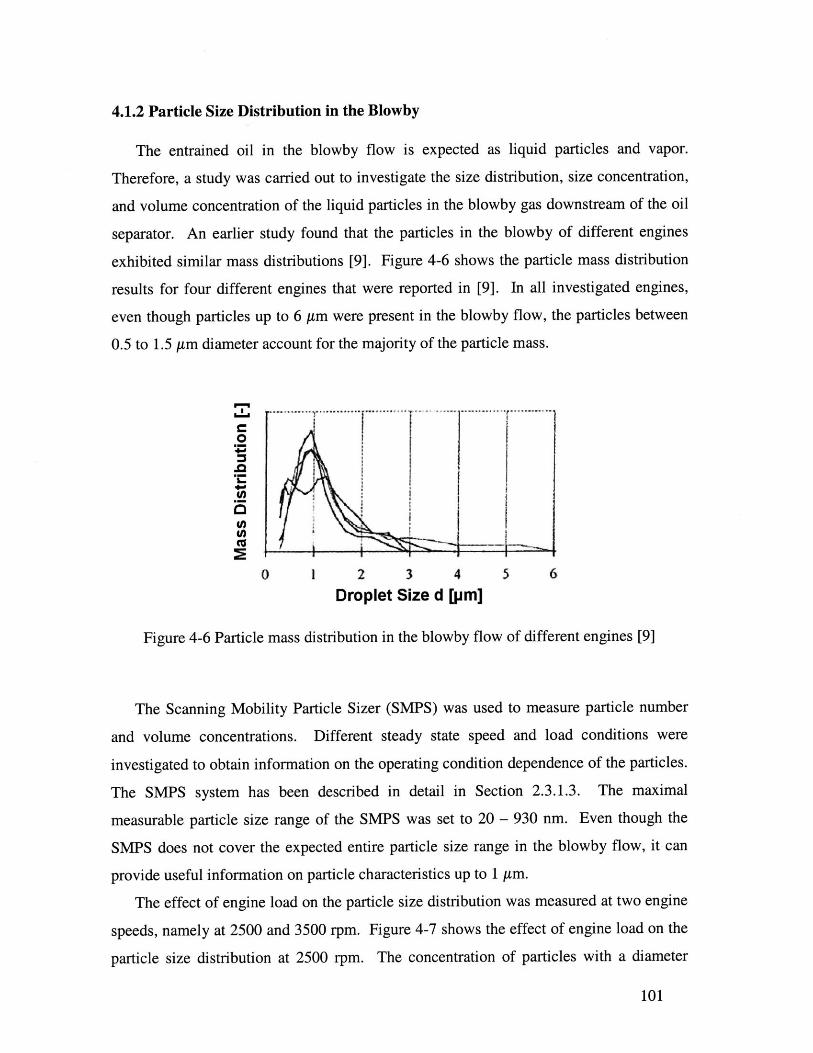
4.1.2 Particle Size Distribution in the Blowby
The entrained oil in the blowby flow is expected as liquid particles and vapor.
Therefore, a study was carried out to investigate the size distribution, size concentration,
and volume concentration of the liquid particles in the blowby gas downstream of the oil
separator. An earlier study found that the particles in the blowby of different engines
exhibited similar mass distributions [9]. Figure 4-6 shows the particle mass distribution
results for four different engines that were reported in [9]. In all investigated engines,
even though particles up to 6 /tm were present in the blowby flow, the particles between
0.5 to 1.5 /im diameter account for the majority of the particle mass.
. . .. .......... .. .... .... .....
o0
0 1 2 3 4 5 6Droplet Size d [pm]
Figure 4-6 Particle mass distribution in the blowby flow of different engines [9]
The Scanning Mobility Particle Sizer (SMPS) was used to measure particle number
and volume concentrations. Different steady state speed and load conditions were
investigated to obtain information on the operating condition dependence of the particles.
The SMPS system has been described in detail in Section 2.3.1.3. The maximal
measurable particle size range of the SMPS was set to 20 - 930 nm. Even though the
SMPS does not cover the expected entire particle size range in the blowby flow, it can
provide useful information on particle characteristics up to 1 Itm.
The effect of engine load on the particle size distribution was measured at two engine
speeds, namely at 2500 and 3500 rpm. Figure 4-7 shows the effect of engine load on the
particle size distribution at 2500 rpm. The concentration of particles with a diameter
101
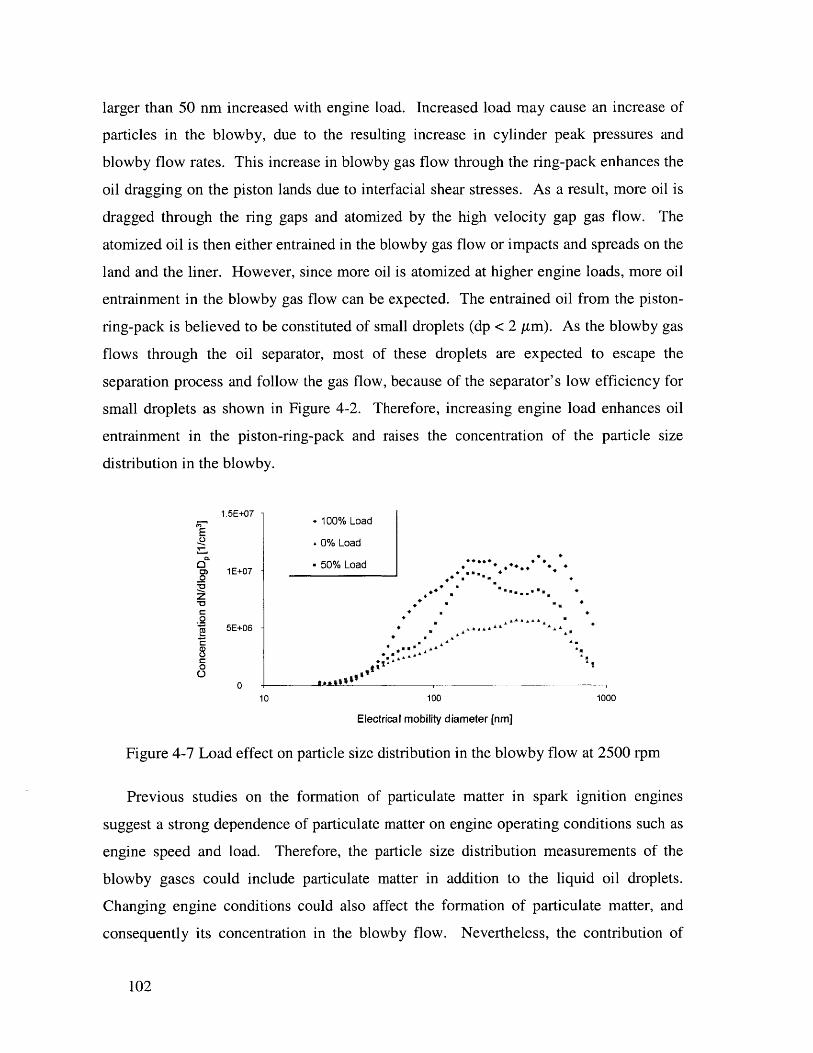
larger than 50 nm increased with engine load. Increased load may cause an increase of
particles in the blowby, due to the resulting increase in cylinder peak pressures and
blowby flow rates. This increase in blowby gas flow through the ring-pack enhances the
oil dragging on the piston lands due to interfacial shear stresses. As a result, more oil is
dragged through the ring gaps and atomized by the high velocity gap gas flow. The
atomized oil is then either entrained in the blowby gas flow or impacts and spreads on the
land and the liner. However, since more oil is atomized at higher engine loads, more oil
entrainment in the blowby gas flow can be expected. The entrained oil from the piston-
ring-pack is believed to be constituted of small droplets (dp < 2 am). As the blowby gas
flows through the oil separator, most of these droplets are expected to escape the
separation process and follow the gas flow, because of the separator's low efficiency for
small droplets as shown in Figure 4-2. Therefore, increasing engine load enhances oil
entrainment in the piston-ring-pack and raises the concentration of the particle size
distribution in the blowby.
1.5E+07 100% LoadE
0% Load
1E+0 7 - - 50% Load ***** ..1 1E+07
S5E+06
0 S
10 100 1000
Electrical mobility diameter [nm]
Figure 4-7 Load effect on particle size distribution in the blowby flow at 2500 rpm
Previous studies on the formation of particulate matter in spark ignition engines
suggest a strong dependence of particulate matter on engine operating conditions such as
engine speed and load. Therefore, the particle size distribution measurements of the
blowby gases could include particulate matter in addition to the liquid oil droplets.
Changing engine conditions could also affect the formation of particulate matter, and
consequently its concentration in the blowby flow. Nevertheless, the contribution of
102
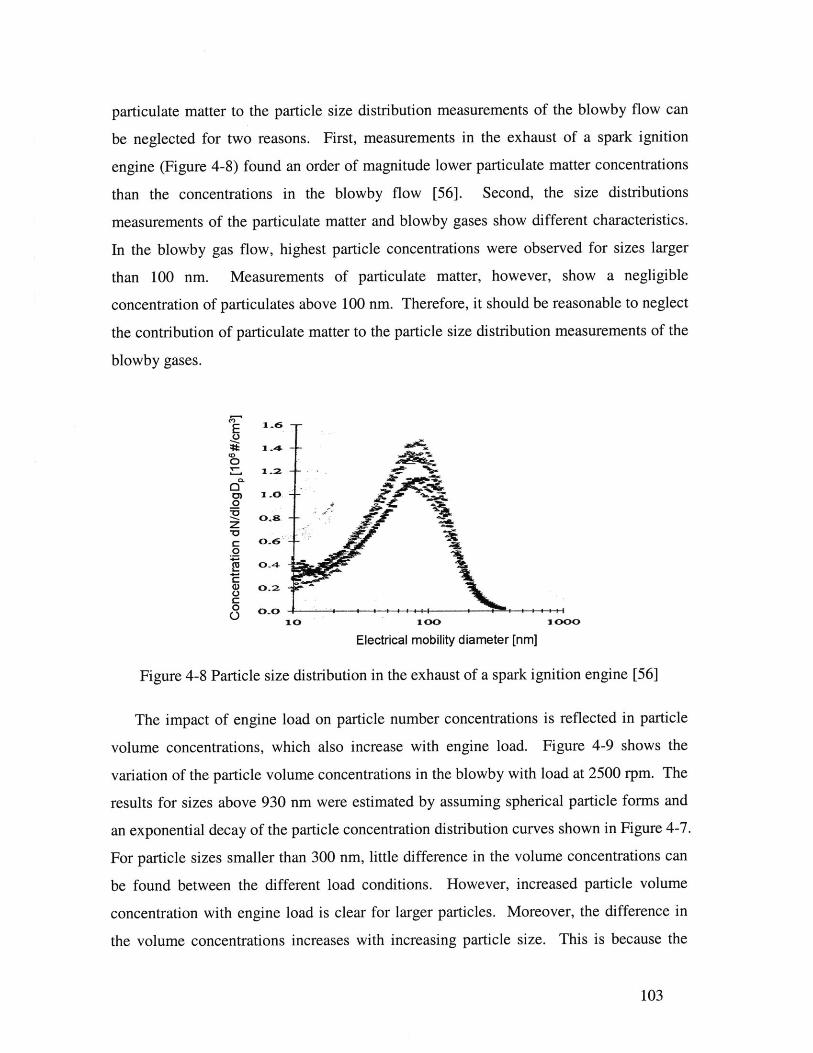
particulate matter to the particle size distribution measurements of the blowby flow can
be neglected for two reasons. First, measurements in the exhaust of a spark ignition
engine (Figure 4-8) found an order of magnitude lower particulate matter concentrations
than the concentrations in the blowby flow [56]. Second, the size distributions
measurements of the particulate matter and blowby gases show different characteristics.
In the blowby gas flow, highest particle concentrations were observed for sizes larger
than 100 nm. Measurements of particulate matter, however, show a negligible
concentration of particulates above 100 nm. Therefore, it should be reasonable to neglect
the contribution of particulate matter to the particle size distribution measurements of the
blowby gases.
E
CrL
0)1.
10100 1000
Electrical mobility diameter [nm]
Figure 4-8 Particle size distribution in the exhaust of a spark ignition engine [56]
The impact of engine load on particle number concentrations is reflected in particle
volume concentrations, which also increase with engine load. Figure 4-9 shows the
variation of the particle volume concentrations in the blowby with load at 2500 rpm. The
results for sizes above 930 nm were estimated by assuming spherical particle forms and
an exponential decay of the particle concentration distribution curves shown in Figure 4-7.
For particle sizes smaller than 300 nm, little difference in the volume concentrations can
be found between the different load conditions. However, increased particle volume
concentration with engine load is clear for larger particles. Moreover, the difference in
the volume concentrations increases with increasing particle size. This is because the
103
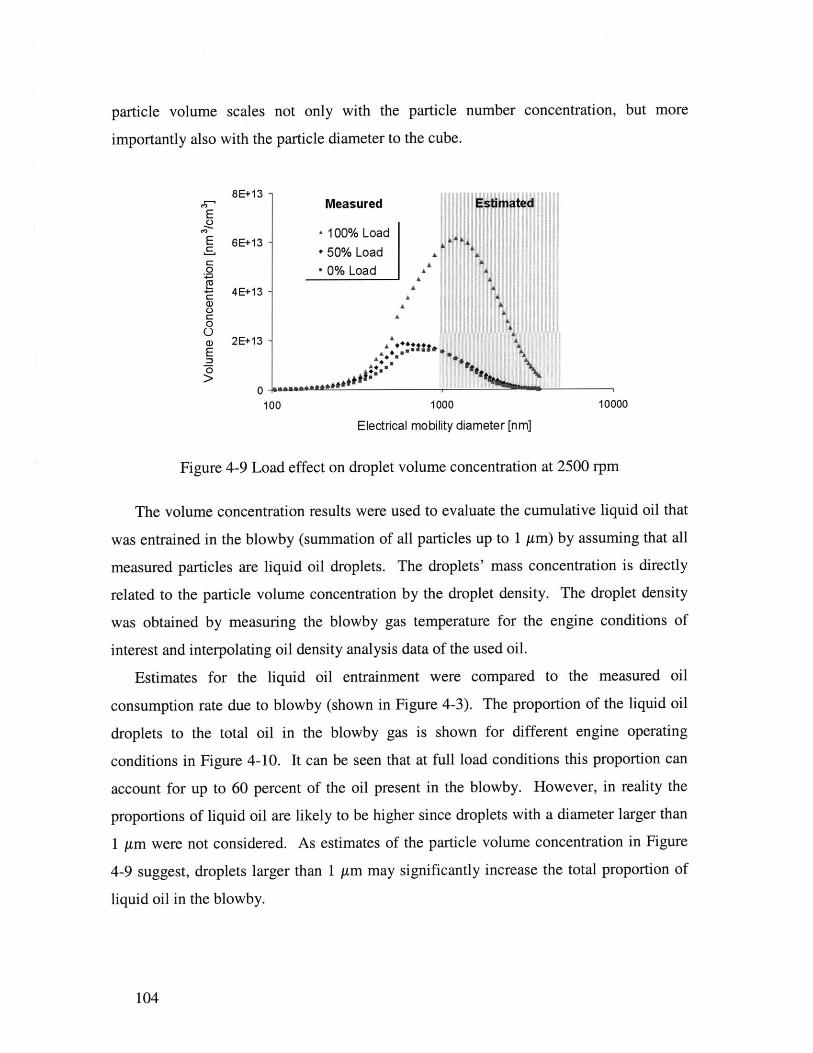
particle volume scales not only with the particle number concentration, but more
importantly also with the particle diameter to the cube.
8E+13 -C, Measured EstimatedE
100% LoadE 6E+13 -A
+50% Load0 0% Load A
4E+13 -ai)A
o AA
00 A A,
a) 2E+13 -A
100 1000 10000
Electrical mobility diameter [nm]
Figure 4-9 Load effect on droplet volume concentration at 2500 rpm
The volume concentration results were used to evaluate the cumulative liquid oil that
was entrained in the blowby (summation of all particles up to 1 Jim) by assuming that all
measured particles are liquid oil droplets. The droplets' mass concentration is directly
related to the particle volume concentration by the droplet density. The droplet density
was obtained by measuring the blowby gas temperature for the engine conditions of
interest and interpolating oil density analysis data of the used oil.
Estimates for the liquid oil entrainment were compared to the measured oil
consumption rate due to blowby (shown in Figure 4-3). The proportion of the liquid oil
droplets to the total oil in the blowby gas is shown for different engine operating
conditions in Figure 4-10. It can be seen that at full load conditions this proportion can
account for up to 60 percent of the oil present in the blowby. However, in reality the
proportions of liquid oil are likely to be higher since droplets with a diameter larger than
1 [im were not considered. As estimates of the particle volume concentration in Figure
4-9 suggest, droplets larger than 1 Am may significantly increase the total proportion of
liquid oil in the blowby.
104
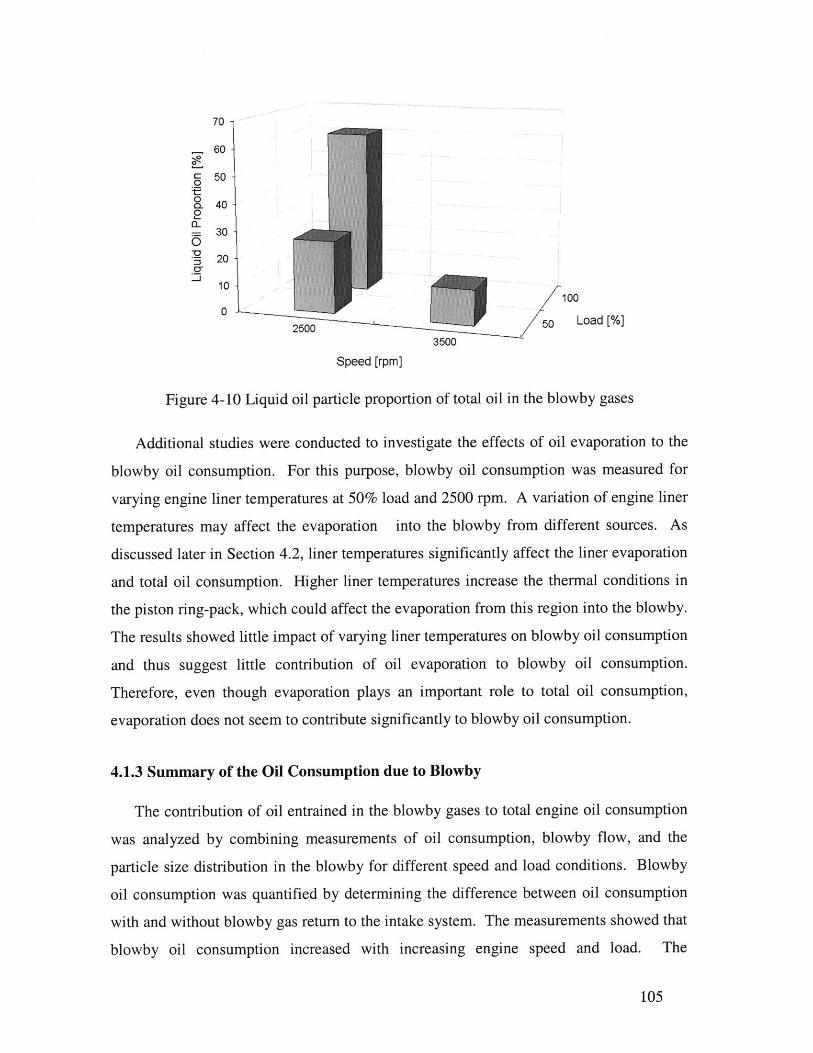
70
60
C 500
0a. 40
0
= 0
S20
0
100
10L50 1Load [%]3500
Speed [rpm]
Figure 4-10 Liquid oil particle proportion of total oil in the blowby gases
Additional studies were conducted to investigate the effects of oil evaporation to the
blowby oil consumption. For this purpose, blowby oil consumption was measured for
varying engine liner temperatures at 50% load and 2500 rpm. A variation of engine liner
temperatures may affect the evaporation into the blowby from different sources. As
discussed later in Section 4.2, liner temperatures significantly affect the liner evaporation
and total oil consumption. Higher liner temperatures increase the thermal conditions in
the piston ring-pack, which could affect the evaporation from this region into the blowby.
The results showed little impact of varying liner temperatures on blowby oil consumption
and thus suggest little contribution of oil evaporation to blowby oil consumption.
Therefore, even though evaporation plays an important role to total oil consumption,
evaporation does not seem to contribute significantly to blowby oil consumption.
4.1.3 Summary of the Oil Consumption due to Blowby
The contribution of oil entrained in the blowby gases to total engine oil consumption
was analyzed by combining measurements of oil consumption, blowby flow, and the
particle size distribution in the blowby for different speed and load conditions. Blowby
oil consumption was quantified by determining the difference between oil consumption
with and without blowby gas return to the intake system. The measurements showed that
blowby oil consumption increased with increasing engine speed and load. The
105
contribution of oil in the blowby gases to total oil consumption, however, was found to
increase only with engine load. Its contribution to oil consumption was negligible at low
load conditions (below 50% load), but reached significant levels at high load. The
maximal contribution of the blowby gases to oil consumption was found to be about 16
percent at 100% load and 3500 rpm. Blowby oil loading increased with engine speed,
suggesting an enhanced oil entrainment in either the ring-pack or the crankcase.
Measurements of the particle size distribution in the blowby also showed an increase
in particle concentration with engine load. Further analysis of the particle size
distribution indicated that a significant portion of the oil in the recycled blowby could be
liquid oil droplets.
4.2 Oil Evaporation
Despite much research, there is a lack of understanding and quantification of key oil
consumption sources due to the complex nature of the phenomena. One example is the
relationship between oil volatility and oil evaporation from the piston-ring-liner system,
and its impact on total oil consumption. This section presents an extensive experimental
and theoretical study on the contribution of oil evaporation to total oil consumption at
different steady state speed and load conditions.
4.2.1 Introduction
Oil consumption is directly related to physical oil properties, such as oil volatility and
viscosity. While the viscosity affects oil transport mechanisms on the liner and piston,
the volatility directly governs the oil evaporation rate from hot surfaces during the engine
cycle. Oil evaporating from the piston-ring-liner system is believed to contribute
significantly to total oil consumption, especially during severe operating conditions.
Earlier studies have demonstrated the significance of oil viscosity and volatility to oil
consumption [23][24]. There exist also some averaged oil consumption measurements in
passenger cars illustrating the effects of volatility and viscosity on oil consumption
[59][60][61]. In these studies, the cars were operated for a certain period in a mixed
cycle. Empirical formulas, often categorized in engine types, were developed from the
106
obtained results to correlate oil consumption with oil volatility and viscosity. However,
the impact of these physical oil properties on the oil transport and consumption
mechanisms is not completely understood. In another experimental study on a one-
cylinder hydrogen engine, oil volatility was found to be only critical at elevated liner
temperatures [22].
A number of solely theoretical approaches studied the oil evaporation from the
cylinder liner of internal combustion engines [40][41][42]. These models were based on
the diffusion process of oil vapor through the gas boundary layer on the liner surface.
The lubricant was modeled either as a mixture of a number of hydrocarbon species, or as
a single species oil. All approaches found a sensitivity of the evaporation process to oil
composition and cylinder liner temperature.
The purpose of the described work in this section is to characterize the contribution of
oil evaporation on oil consumption in the test engine. For this purpose the coolant outlet
temperature, oil volatility, and operating conditions were varied to examine their impact
on oil evaporation and oil consumption. The study was carried out by combining oil
consumption measurements, in-cylinder measurements, and theoretical modeling.
The dependence of oil consumption on coolant outlet temperature and oil volatility
was measured at different engine operating speed and load. Liquid oil distribution on
the piston was studied using the one-point Laser-Induced-Fluorescence (LIF). In addition,
important in-cylinder variables for oil evaporation, such as liner temperature and cylinder
pressure, were measured. A multi-species cylinder liner oil evaporation model was
developed to interpret the oil consumption data.
4.2.2 Experimental Methodology and Conditions
4.2.2.1 Oil Specifications
As mentioned earlier the oil transport and consumption are dependent on oil
properties such as viscosity and volatility. Several standardized laboratory test methods
determine these properties. Since this paper focuses on the volatility of two oils, a brief
discussion is presented on test methods that are currently used in the automotive industry
107
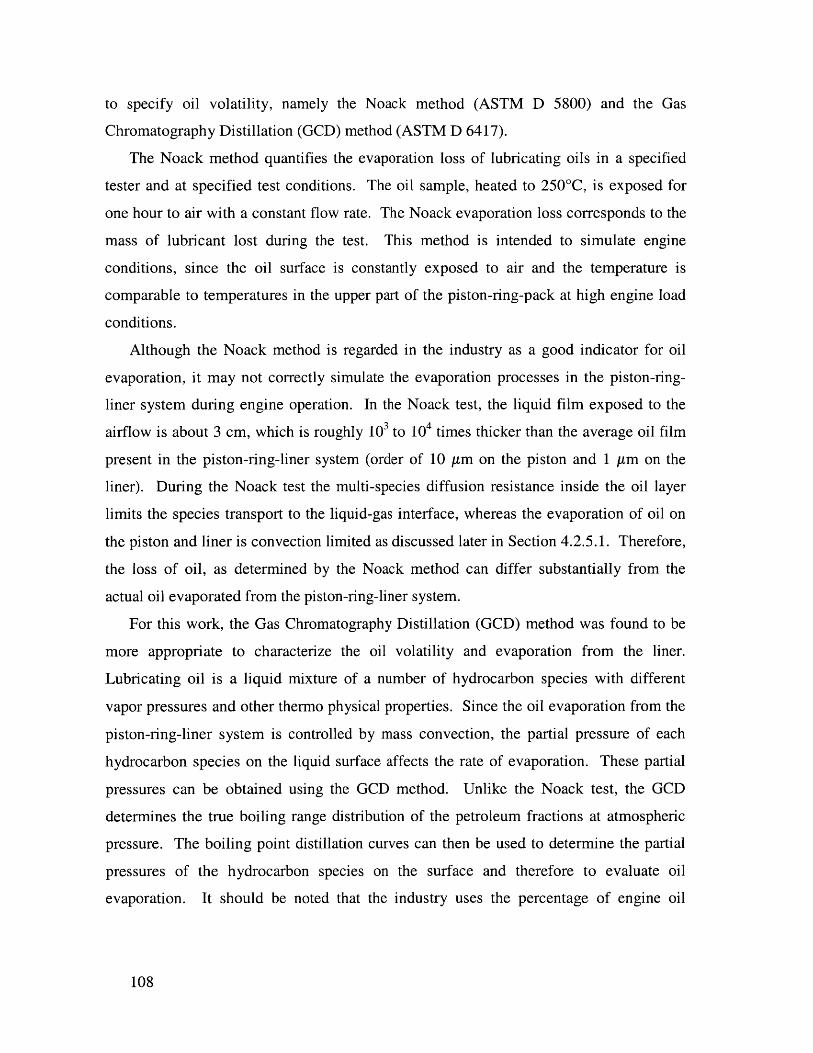
to specify oil volatility, namely the Noack method (ASTM D 5800) and the Gas
Chromatography Distillation (GCD) method (ASTM D 6417).
The Noack method quantifies the evaporation loss of lubricating oils in a specified
tester and at specified test conditions. The oil sample, heated to 250'C, is exposed for
one hour to air with a constant flow rate. The Noack evaporation loss corresponds to the
mass of lubricant lost during the test. This method is intended to simulate engine
conditions, since the oil surface is constantly exposed to air and the temperature is
comparable to temperatures in the upper part of the piston-ring-pack at high engine load
conditions.
Although the Noack method is regarded in the industry as a good indicator for oil
evaporation, it may not correctly simulate the evaporation processes in the piston-ring-
liner system during engine operation. In the Noack test, the liquid film exposed to the
airflow is about 3 cm, which is roughly 103 to 104 times thicker than the average oil film
present in the piston-ring-liner system (order of 10 yim on the piston and 1 stm on the
liner). During the Noack test the multi-species diffusion resistance inside the oil layer
limits the species transport to the liquid-gas interface, whereas the evaporation of oil on
the piston and liner is convection limited as discussed later in Section 4.2.5.1. Therefore,
the loss of oil, as determined by the Noack method can differ substantially from the
actual oil evaporated from the piston-ring-liner system.
For this work, the Gas Chromatography Distillation (GCD) method was found to be
more appropriate to characterize the oil volatility and evaporation from the liner.
Lubricating oil is a liquid mixture of a number of hydrocarbon species with different
vapor pressures and other thermo physical properties. Since the oil evaporation from the
piston-ring-liner system is controlled by mass convection, the partial pressure of each
hydrocarbon species on the liquid surface affects the rate of evaporation. These partial
pressures can be obtained using the GCD method. Unlike the Noack test, the GCD
determines the true boiling range distribution of the petroleum fractions at atmospheric
pressure. The boiling point distillation curves can then be used to determine the partial
pressures of the hydrocarbon species on the surface and therefore to evaluate oil
evaporation. It should be noted that the industry uses the percentage of engine oil
108
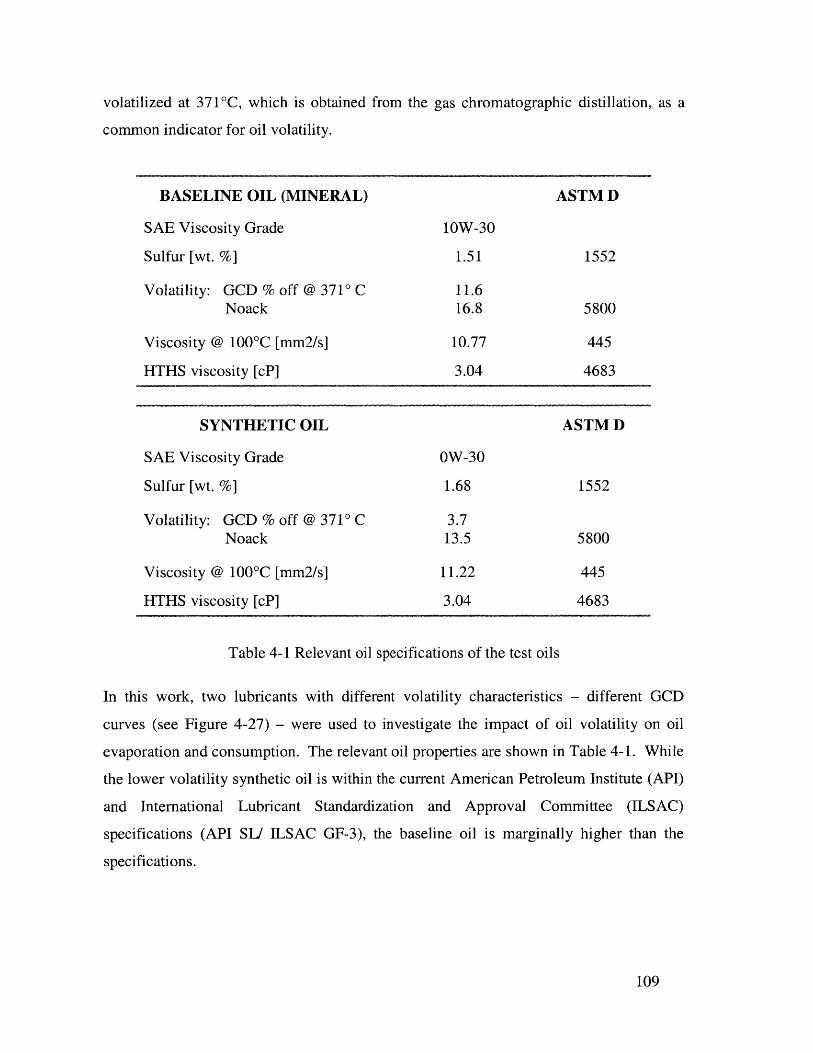
volatilized at 371'C, which is obtained from the gas chromatographic distillation, as a
common indicator for oil volatility.
BASELINE OIL (MINERAL) ASTM D
SAE Viscosity Grade 1OW-30
Sulfur [wt. %] 1.51 1552
Volatility: GCD % off @ 3710 C 11.6Noack 16.8 5800
Viscosity @ 1000C [mm2/s] 10.77 445
HTHS viscosity [cP] 3.04 4683
SYNTHETIC OIL ASTM D
SAE Viscosity Grade OW-30
Sulfur [wt. %] 1.68 1552
Volatility: GCD % off @ 371' C 3.7Noack 13.5 5800
Viscosity @ 100'C [mm2/s] 11.22 445
HTHS viscosity [cP] 3.04 4683
Table 4-1 Relevant oil specifications of the test oils
In this work, two lubricants with different volatility characteristics - different GCD
curves (see Figure 4-27) - were used to investigate the impact of oil volatility on oil
evaporation and consumption. The relevant oil properties are shown in Table 4-1. While
the lower volatility synthetic oil is within the current American Petroleum Institute (API)
and International Lubricant Standardization and Approval Committee (ILSAC)
specifications (API SI/ ILSAC GF-3), the baseline oil is marginally higher than the
specifications.
109
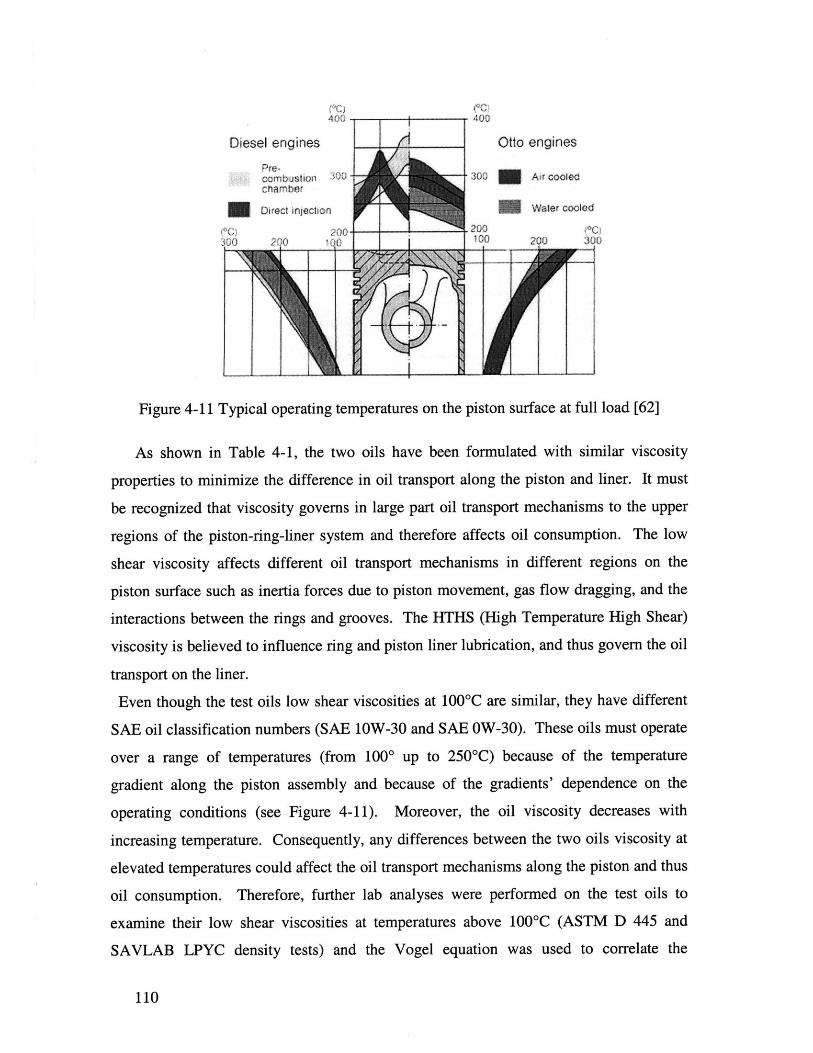
410 400
Diesel engines Otto engines
ccMr~fovri AX)j 300 0 Air cooled
W Diect njecionWfIer cooled
300 2-0 t'00 2 at0 30
Figure 4-11 Typical operating temperatures on the piston surface at full load [62]
As shown in Table 4-1, the two oils have been formulated with similar viscosity
properties to minimize the difference in oil transport along the piston and liner. It must
be recognized that viscosity governs in large part oil transport mechanisms to the upper
regions of the piston-ring-liner system and therefore affects oil consumption. The low
shear viscosity affects different oil transport mechanisms in different regions on the
piston surface such as inertia forces due to piston movement, gas flow dragging, and the
interactions between the rings and grooves. The HTHS (High Temperature High Shear)
viscosity is believed to influence ring and piston liner lubrication, and thus govern the oil
transport on the liner.
Even though the test oils low shear viscosities at 100*C are similar, they have different
SAE oil classification numbers (SAE 1OW-30 and SAE OW-30). These oils must operate
over a range of temperatures (from 1000 up to 250*C) because of the temperature
gradient along the piston assembly and because of the gradients' dependence on the
operating conditions (see Figure 4-11). Moreover, the oil viscosity decreases with
increasing temperature. Consequently, any differences between the two oils viscosity at
elevated temperatures could affect the oil transport mechanisms along the piston and thus
oil consumption. Therefore, further lab analyses were performed on the test oils to
examine their low shear viscosities at temperatures above 100*C (ASTM D 445 and
SAVLAB LPYC density tests) and the Vogel equation was used to correlate the
110
0
measured temperature-viscosity data. The obtained low shear viscosity-temperature
relation for both oils is shown in Figure 4-12, which confirms the similarity of the oil
viscosities at temperatures above 100 0C. Therefore, any difference in oil consumption
between the oils should be mainly a result of the difference in their volatilities.
10 a Baseline Oil Lab Analysis
Baseline Oil A Synthetic Oil Lab Analysis8
(U
0o6
u) AL
> 2 Synthetic Oil
0
100 120 140 160 180 200
Temperature [*C]
Figure 4-12 Comparison of the viscosity of both test oils
For both oils, the average sulfur concentration by weight (ASTM D 1552) was used
to determine the oil consumption rate. This is reasonable if the sulfur in the oil is
constant over the entire oil distillation range, as is the case for the baseline oil. Then the
consumed oil (liquid and evaporated) in the exhaust has the same concentration of sulfur
as in the original oil. However, Figure 4-13 shows that the synthetic oil sulfur content is
not constant with the distillation; the sulfur concentration at the 10 percent distillation
fraction is significantly higher than the average concentration. This distillation property
of the sulfur in the synthetic oil introduces a measurement error, namely an
overestimation of the oil evaporation and thus consumption rate. Nonetheless, further
analysis using oil evaporation estimations indicated that the introduced error is not
significant. The model predictions show that the high volatility oil species (first 6
percent of the distillation curve) contribute to about 80 percent of total oil evaporation.
Oil species present in the first 40 percent of the distillation curve contribute to at least 95
percent of the total oil evaporation. In addition, it was found that even at extreme
111
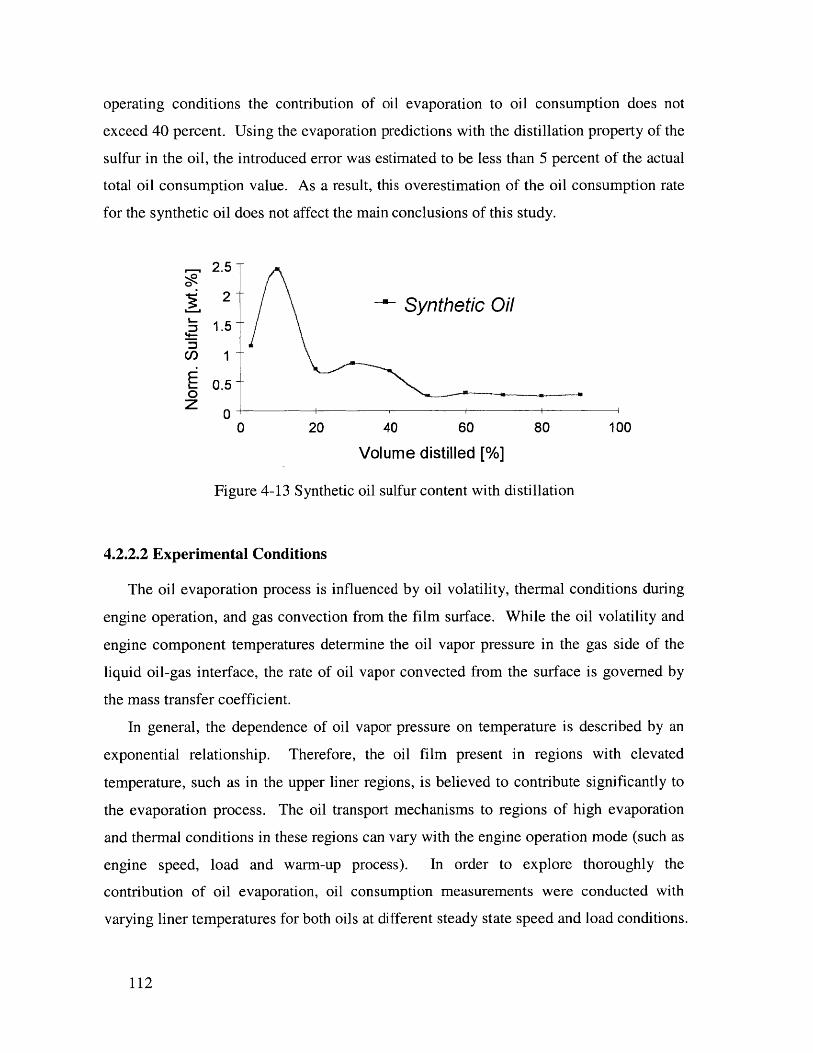
operating conditions the contribution of oil evaporation to oil consumption does not
exceed 40 percent. Using the evaporation predictions with the distillation property of the
sulfur in the oil, the introduced error was estimated to be less than 5 percent of the actual
total oil consumption value. As a result, this overestimation of the oil consumption rate
for the synthetic oil does not affect the main conclusions of this study.
,-, 2.5-
2 Synthetic OilE 1.5-
I) 1 -
O0.5 --0Z 0-
0 20 40 60 80 100
Volume distilled [%]
Figure 4-13 Synthetic oil sulfur content with distillation
4.2.2.2 Experimental Conditions
The oil evaporation process is influenced by oil volatility, thermal conditions during
engine operation, and gas convection from the film surface. While the oil volatility and
engine component temperatures determine the oil vapor pressure in the gas side of the
liquid oil-gas interface, the rate of oil vapor convected from the surface is governed by
the mass transfer coefficient.
In general, the dependence of oil vapor pressure on temperature is described by an
exponential relationship. Therefore, the oil film present in regions with elevated
temperature, such as in the upper liner regions, is believed to contribute significantly to
the evaporation process. The oil transport mechanisms to regions of high evaporation
and thermal conditions in these regions can vary with the engine operation mode (such as
engine speed, load and warm-up process). In order to explore thoroughly the
contribution of oil evaporation, oil consumption measurements were conducted with
varying liner temperatures for both oils at different steady state speed and load conditions.
112
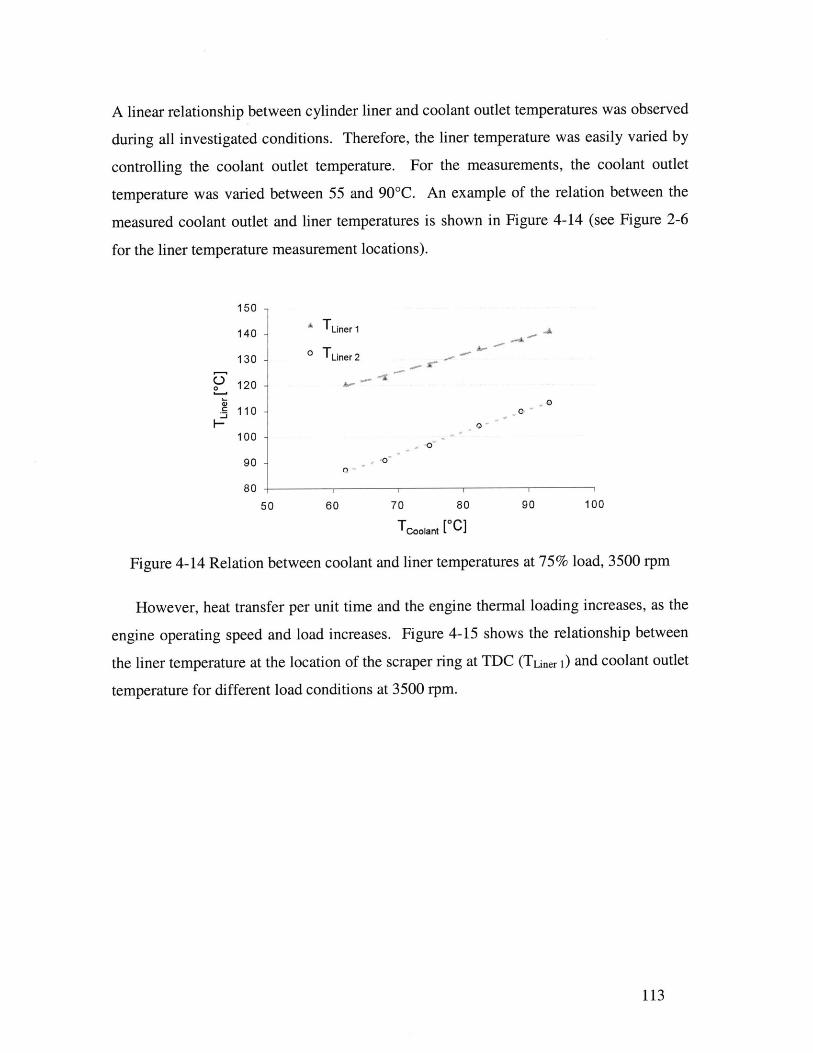
A linear relationship between cylinder liner and coolant outlet temperatures was observed
during all investigated conditions. Therefore, the liner temperature was easily varied by
controlling the coolant outlet temperature. For the measurements, the coolant outlet
temperature was varied between 55 and 90'C. An example of the relation between the
measured coolant outlet and liner temperatures is shown in Figure 4-14 (see Figure 2-6
for the liner temperature measurement locations).
150 -
140 - * TLiner 1
130 - o TLiner 2
120 -
110 0'0
100 -
90 -
80
50 60 70 80 90 100
TCoolant [0C]
Figure 4-14 Relation between coolant and liner temperatures at 75% load, 3500 rpm
However, heat transfer per unit time and the engine thermal loading increases, as the
engine operating speed and load increases. Figure 4-15 shows the relationship between
the liner temperature at the location of the scraper ring at TDC (TLiner 1) and coolant outlet
temperature for different load conditions at 3500 rpm.
113
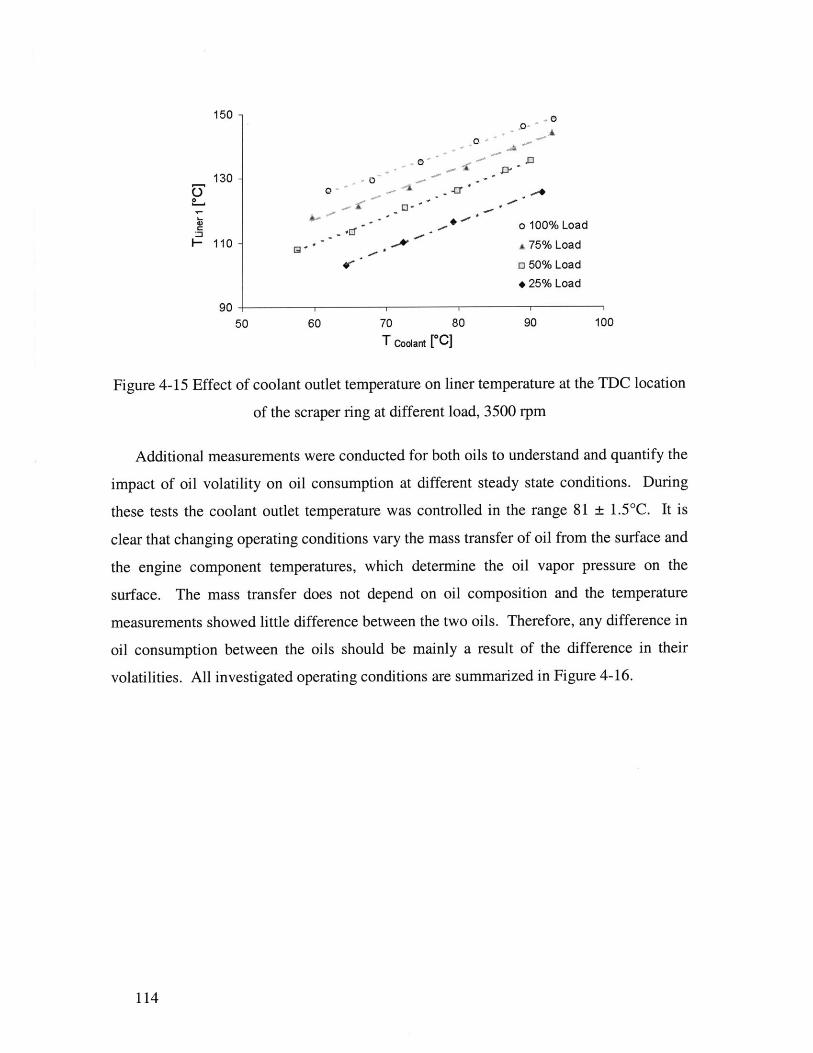
900
130o
1 10 -5-La
50 60 70 80 90 100
T Coolant [*CJ
Figure 4-15 Effect of coolant outlet temperature on liner temperature at the TDC location
of the scraper ring at different load, 3500 rpm
Additional measurements were conducted for both oils to understand and quantify the
impact of oil volatility on oil consumption at different steady state conditions. During
these tests the coolant outlet temperature was controlled in the range 81 ± 1.5 0C. It is
clear that changing operating conditions vary the mass transfer of oil from the surface and
the engine component temperatures, which determine the oil vapor pressure on the
surface. The mass transfer does not depend on oil composition and the temperature
measurements showed little difference between the two oils. Therefore, any difference in
oil consumption between the oils should be mainly a result of the difference in their
volatilities. All investigated operating conditions are summarized in Figure 4-16.
114
150 0
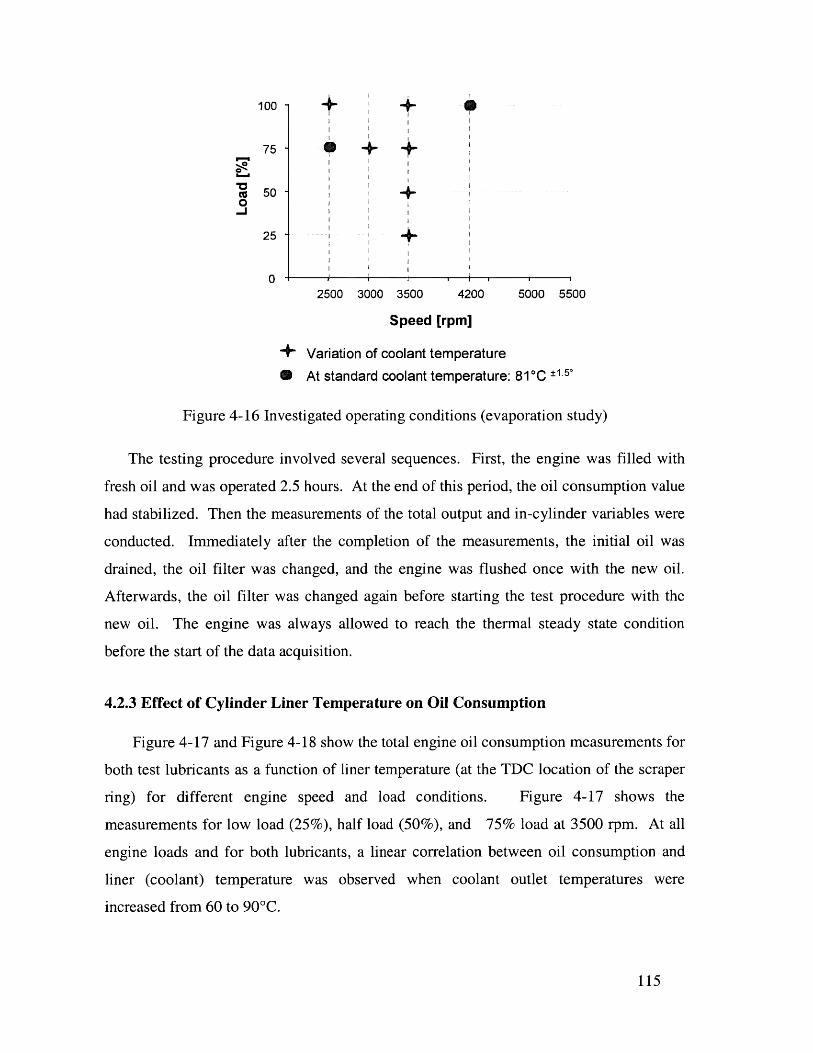
100
75
cc 50+0
25
02500 3000 3500 4200 5000 5500
Speed [rpm]
+ Variation of coolant temperature* At standard coolant temperature: 81C ±1.5'
Figure 4-16 Investigated operating conditions (evaporation study)
The testing procedure involved several sequences. First, the engine was filled with
fresh oil and was operated 2.5 hours. At the end of this period, the oil consumption value
had stabilized. Then the measurements of the total output and in-cylinder variables were
conducted. Immediately after the completion of the measurements, the initial oil was
drained, the oil filter was changed, and the engine was flushed once with the new oil.
Afterwards, the oil filter was changed again before starting the test procedure with the
new oil. The engine was always allowed to reach the thermal steady state condition
before the start of the data acquisition.
4.2.3 Effect of Cylinder Liner Temperature on Oil Consumption
Figure 4-17 and Figure 4-18 show the total engine oil consumption measurements for
both test lubricants as a function of liner temperature (at the TDC location of the scraper
ring) for different engine speed and load conditions. Figure 4-17 shows the
measurements for low load (25%), half load (50%), and 75% load at 3500 rpm. At all
engine loads and for both lubricants, a linear correlation between oil consumption and
liner (coolant) temperature was observed when coolant outlet temperatures were
increased from 60 to 90'C.
115
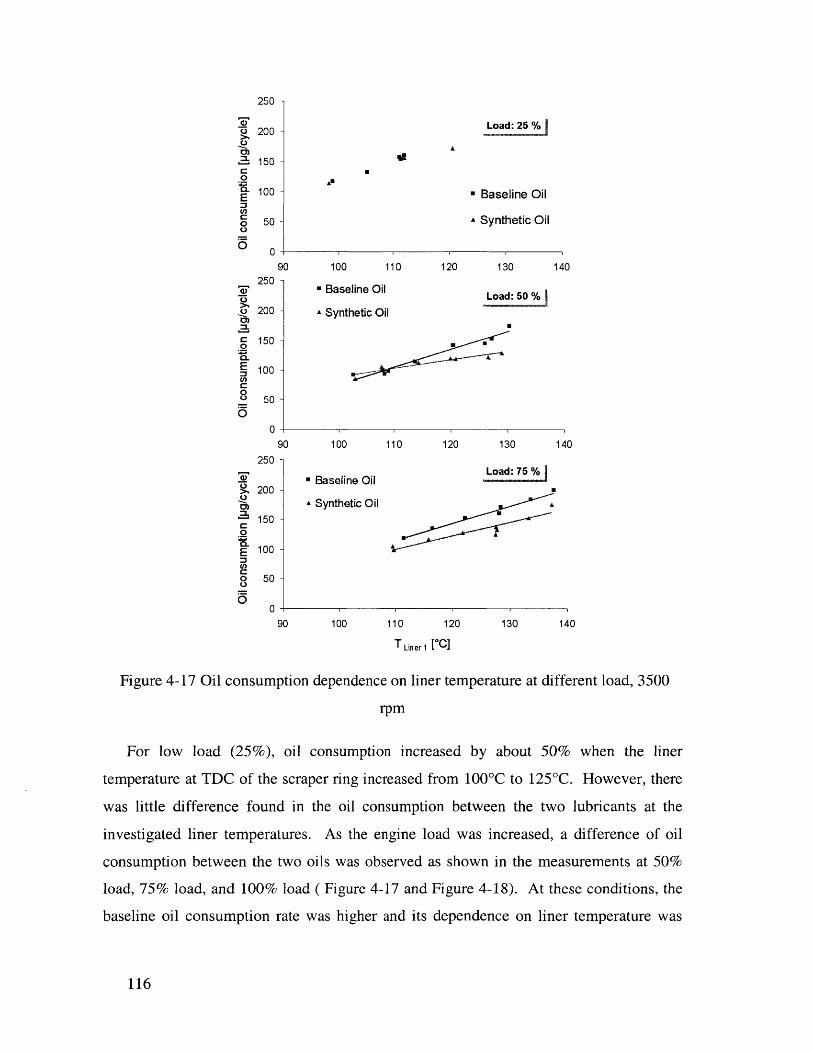
Load: 25 %
250 -
200 -
150 -
100 -
50 -
90 100 110 120 130 140
- Baseline Oil Load:50 %A Synthetic Oil
*-
90 100 110 120 130 14C
Load:75-%Baseline Oil
-U
A Synthetic Oil
A
90 100 110 12
T Liner 1 [00]
0 130 140
Figure 4-17 Oil consumption dependence on liner temperature at different load, 3500
rpm
For low load (25%), oil consumption increased by about 50% when the liner
temperature at TDC of the scraper ring increased from 1000C to 125'C. However, there
was little difference found in the oil consumption between the two lubricants at the
investigated liner temperatures. As the engine load was increased, a difference of oil
consumption between the two oils was observed as shown in the measurements at 50%
load, 75% load, and 100% load ( Figure 4-17 and Figure 4-18). At these conditions, the
baseline oil consumption rate was higher and its dependence on liner temperature was
116
IL
. Baseline Oil
A Synthetic Oil
0
250
200
150
100
50
0
250
200
150
100
50
0
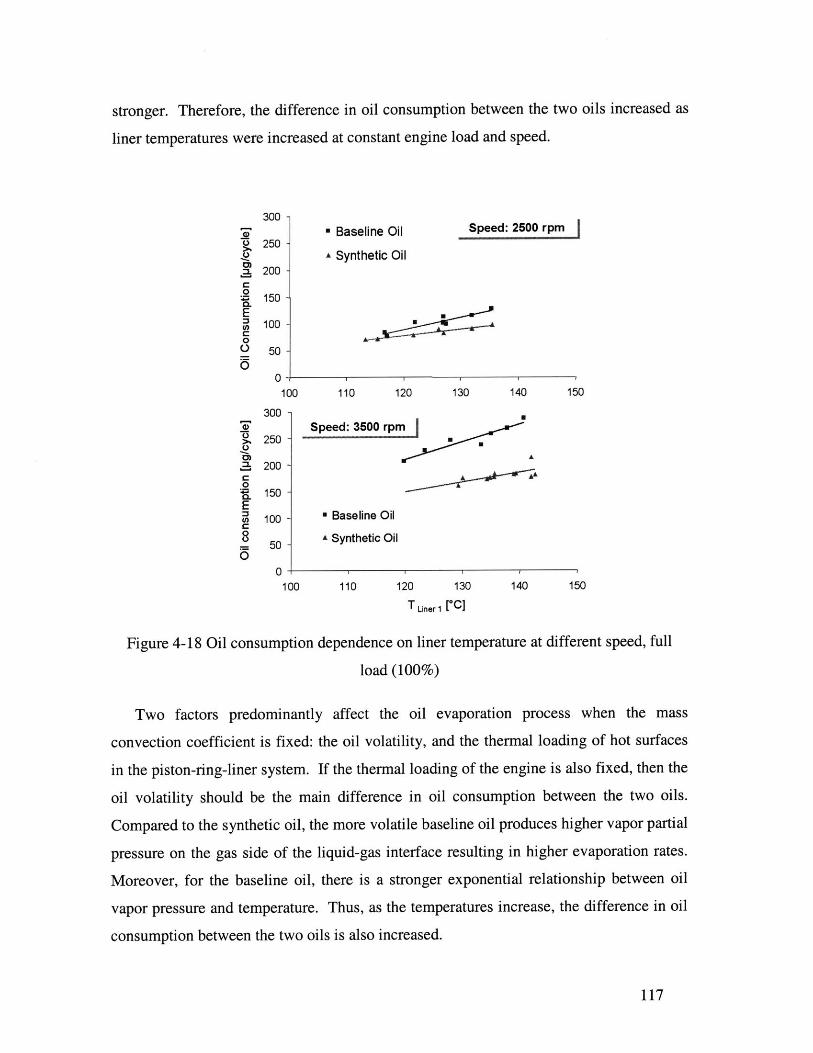
stronger. Therefore, the difference in oil consumption between the two oils increased as
liner temperatures were increased at constant engine load and speed.
300 --- Baseline Oil Speed: 2500 rpm
250 -A Synthetic Oil
:L 200 -
0.= 150 -0.E
100-0
50 -0
0100 110 120 130 140 150
300 -Speed: 3500 rpm
250 -CD A
.2 200 -C A&
0S150-
E100 - Baseline Oil
8 ASynthetic Oil50 50
0*
100 110 120 130 140 150
T Uner 1 [ci
Figure 4-18 Oil consumption dependence on liner temperature at different speed, full
load (100%)
Two factors predominantly affect the oil evaporation process when the mass
convection coefficient is fixed: the oil volatility, and the thermal loading of hot surfaces
in the piston-ring-liner system. If the thermal loading of the engine is also fixed, then the
oil volatility should be the main difference in oil consumption between the two oils.
Compared to the synthetic oil, the more volatile baseline oil produces higher vapor partial
pressure on the gas side of the liquid-gas interface resulting in higher evaporation rates.
Moreover, for the baseline oil, there is a stronger exponential relationship between oil
vapor pressure and temperature. Thus, as the temperatures increase, the difference in oil
consumption between the two oils is also increased.
117
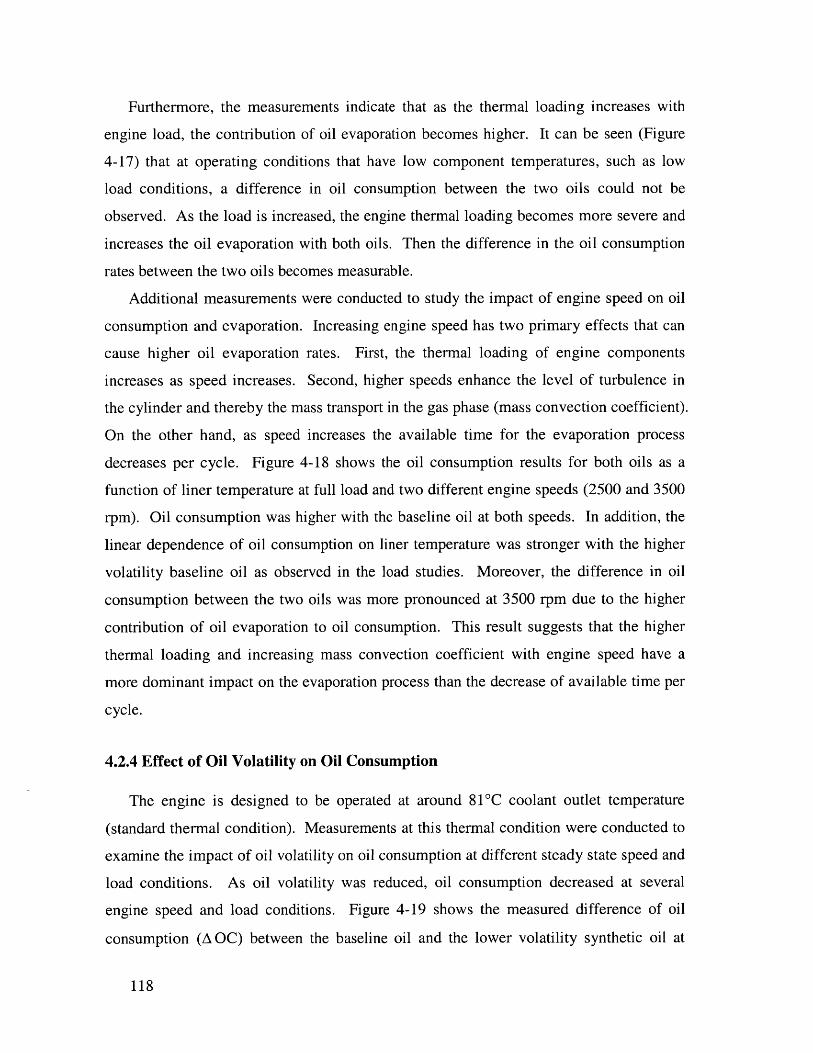
Furthermore, the measurements indicate that as the thermal loading increases with
engine load, the contribution of oil evaporation becomes higher. It can be seen (Figure
4-17) that at operating conditions that have low component temperatures, such as low
load conditions, a difference in oil consumption between the two oils could not be
observed. As the load is increased, the engine thermal loading becomes more severe and
increases the oil evaporation with both oils. Then the difference in the oil consumption
rates between the two oils becomes measurable.
Additional measurements were conducted to study the impact of engine speed on oil
consumption and evaporation. Increasing engine speed has two primary effects that can
cause higher oil evaporation rates. First, the thermal loading of engine components
increases as speed increases. Second, higher speeds enhance the level of turbulence in
the cylinder and thereby the mass transport in the gas phase (mass convection coefficient).
On the other hand, as speed increases the available time for the evaporation process
decreases per cycle. Figure 4-18 shows the oil consumption results for both oils as a
function of liner temperature at full load and two different engine speeds (2500 and 3500
rpm). Oil consumption was higher with the baseline oil at both speeds. In addition, the
linear dependence of oil consumption on liner temperature was stronger with the higher
volatility baseline oil as observed in the load studies. Moreover, the difference in oil
consumption between the two oils was more pronounced at 3500 rpm due to the higher
contribution of oil evaporation to oil consumption. This result suggests that the higher
thermal loading and increasing mass convection coefficient with engine speed have a
more dominant impact on the evaporation process than the decrease of available time per
cycle.
4.2.4 Effect of Oil Volatility on Oil Consumption
The engine is designed to be operated at around 81 C coolant outlet temperature
(standard thermal condition). Measurements at this thermal condition were conducted to
examine the impact of oil volatility on oil consumption at different steady state speed and
load conditions. As oil volatility was reduced, oil consumption decreased at several
engine speed and load conditions. Figure 4-19 shows the measured difference of oil
consumption (A OC) between the baseline oil and the lower volatility synthetic oil at
118
different speed and load conditions. This difference in oil consumption represents
mainly the effect of volatility, since the viscosities of the two oils are comparable. It is
clear that the impact of oil volatility on oil consumption increases with engine speed and
load.
At standard thermal condition:Coolant outlet temperature: 81*C C1.5-C
160
140-
120-
100
80 -
60
40-
20- 100
0 75
3500 2500 25
Speed [rpm]
Figure 4-19 Difference in oil consumption due to oil volatility at different speed and load
To further demonstrate the effect of oil volatility, the same data was used to
determine the improvement in oil economy due to the reduction in oil volatility - as a
percent of the baseline oil consumption. Figure 4-20 illustrates this improvement at
different speed and load conditions. Again, a close dependence on speed and load is
evident. For example at 4200 rpm and full load (100%), oil consumption was improved
by approximately 30 percent due to the reduction in oil volatility, implying a substantial
contribution of oil evaporation to total oil consumption at high speed and load conditions.
119
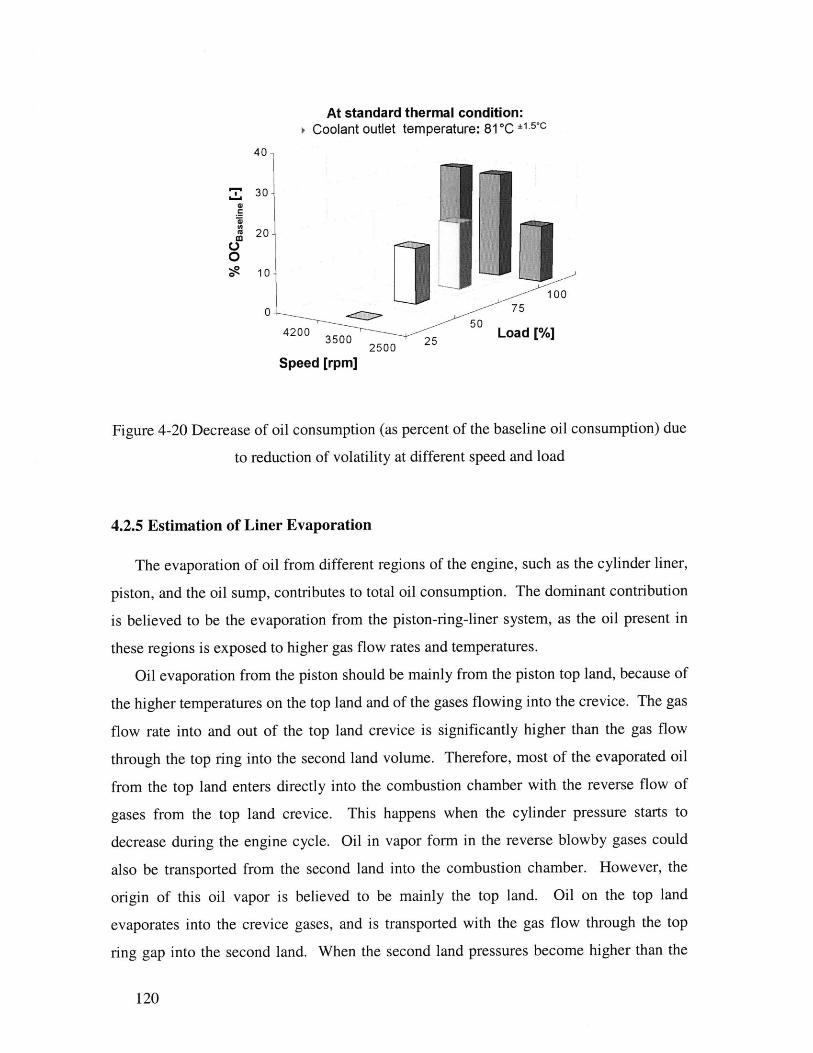
At standard thermal condition:o Coolant outlet temperature: 81C 11.5-C
40
30-
20-
0110
0504200 Load [%]
2500Speed [rpm]
Figure 4-20 Decrease of oil consumption (as percent of the baseline oil consumption) due
to reduction of volatility at different speed and load
4.2.5 Estimation of Liner Evaporation
The evaporation of oil from different regions of the engine, such as the cylinder liner,
piston, and the oil sump, contributes to total oil consumption. The dominant contribution
is believed to be the evaporation from the piston-ring-liner system, as the oil present in
these regions is exposed to higher gas flow rates and temperatures.
Oil evaporation from the piston should be mainly from the piston top land, because of
the higher temperatures on the top land and of the gases flowing into the crevice. The gas
flow rate into and out of the top land crevice is significantly higher than the gas flow
through the top ring into the second land volume. Therefore, most of the evaporated oil
from the top land enters directly into the combustion chamber with the reverse flow of
gases from the top land crevice. This happens when the cylinder pressure starts to
decrease during the engine cycle. Oil in vapor form in the reverse blowby gases could
also be transported from the second land into the combustion chamber. However, the
origin of this oil vapor is believed to be mainly the top land. Oil on the top land
evaporates into the crevice gases, and is transported with the gas flow through the top
ring gap into the second land. When the second land pressures become higher than the
120
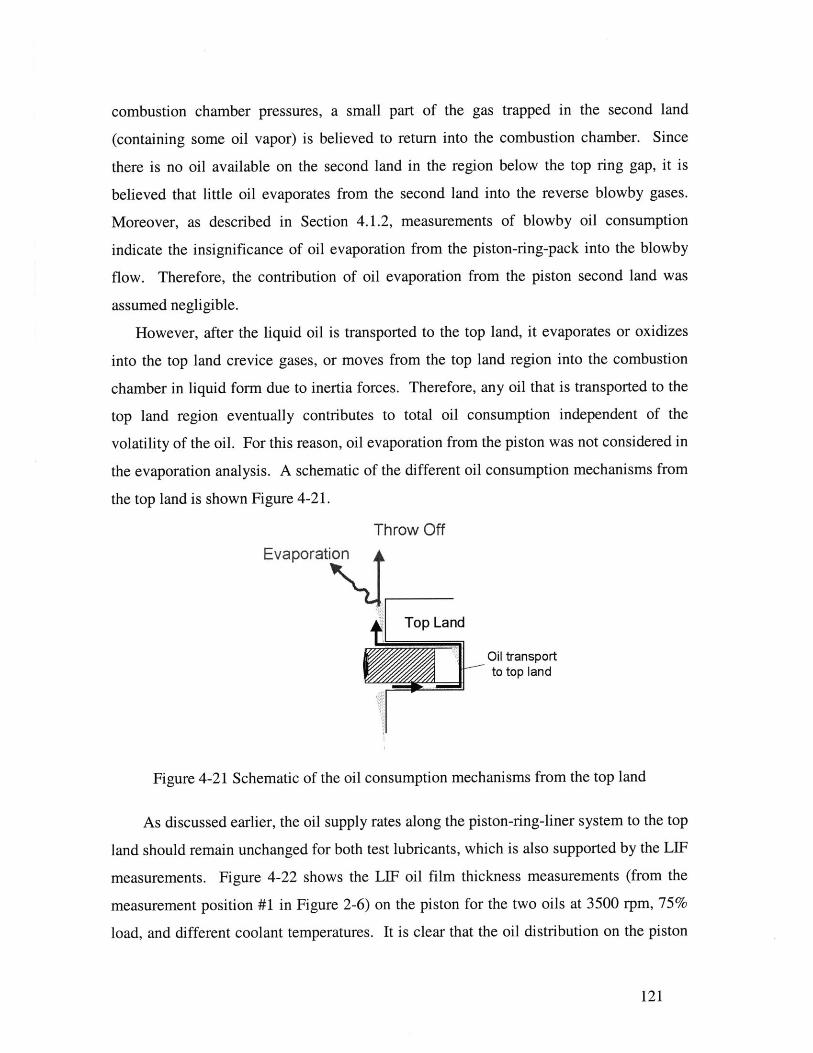
combustion chamber pressures, a small part of the gas trapped in the second land
(containing some oil vapor) is believed to return into the combustion chamber. Since
there is no oil available on the second land in the region below the top ring gap, it is
believed that little oil evaporates from the second land into the reverse blowby gases.
Moreover, as described in Section 4.1.2, measurements of blowby oil consumption
indicate the insignificance of oil evaporation from the piston-ring-pack into the blowby
flow. Therefore, the contribution of oil evaporation from the piston second land was
assumed negligible.
However, after the liquid oil is transported to the top land, it evaporates or oxidizes
into the top land crevice gases, or moves from the top land region into the combustion
chamber in liquid form due to inertia forces. Therefore, any oil that is transported to the
top land region eventually contributes to total oil consumption independent of the
volatility of the oil. For this reason, oil evaporation from the piston was not considered in
the evaporation analysis. A schematic of the different oil consumption mechanisms from
the top land is shown Figure 4-21.
Throw Off
Evaporation
Top Land
Oil transportto top land
Figure 4-21 Schematic of the oil consumption mechanisms from the top land
As discussed earlier, the oil supply rates along the piston-ring-liner system to the top
land should remain unchanged for both test lubricants, which is also supported by the LIEF
measurements. Figure 4-22 shows the LIF oil film thickness measurements (from the
measurement position #1 in Figure 2-6) on the piston for the two oils at 3500 rpm, 75%
load, and different coolant temperatures. It is clear that the oil distribution on the piston
121
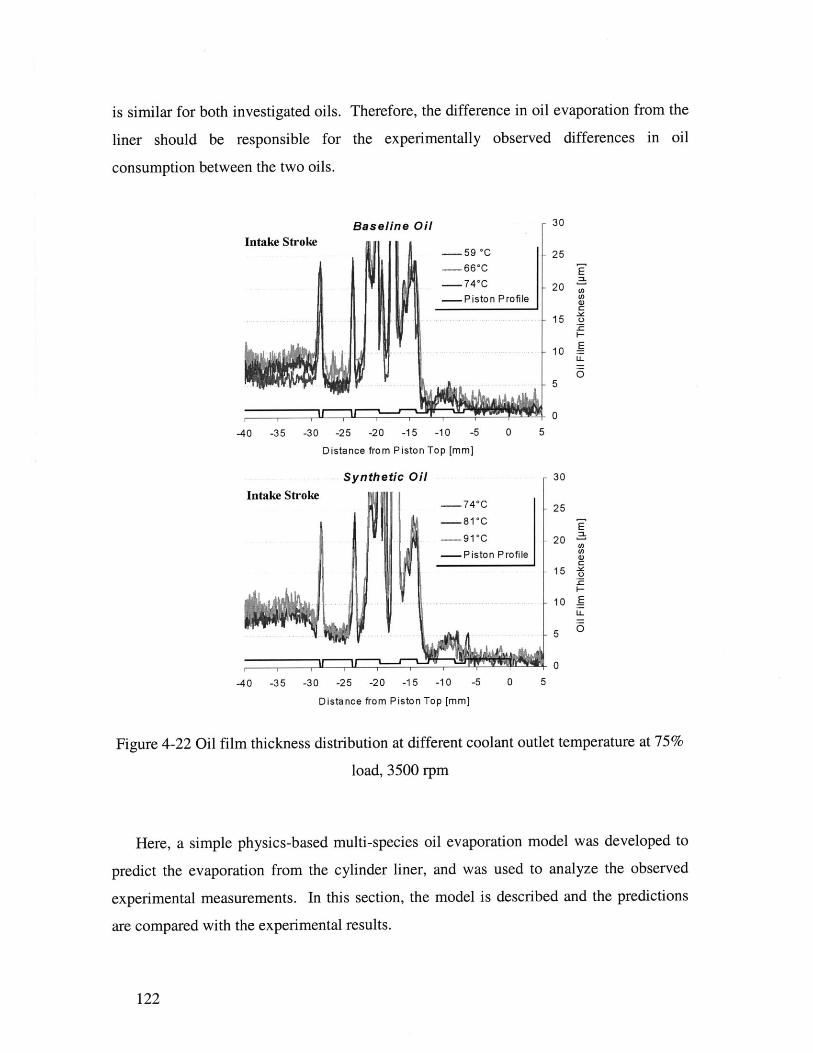
is similar for both investigated oils. Therefore, the difference in oil evaporation from the
liner should be responsible for the experimentally observed differences in oil
consumption between the two oils.
Baseline Oil - 30
Intake Stroke-59 *C - 25-66*C
-74C 20
-Pisto n Profile
215
r .0
-40 -35 -30 -25 -20 -15 -10 -5 0 5
Distance from Piston Top [mm]
Synthetic Oil 30
Intake Stroke--- 740C 25
U 1- --81 C-91*C 20-Piston Profile
C:15 *'
- 10
0
-40 -35 -30 -25 -20 -15 -10 -5 0 5
Distance from Piston Top [mm]
Figure 4-22 Oil film thickness distribution at different coolant outlet temperature at 75%
load, 3500 rpm
Here, a simple physics-based multi-species oil evaporation model was developed to
predict the evaporation from the cylinder liner, and was used to analyze the observed
experimental measurements. In this section, the model is described and the predictions
are compared with the experimental results.
122
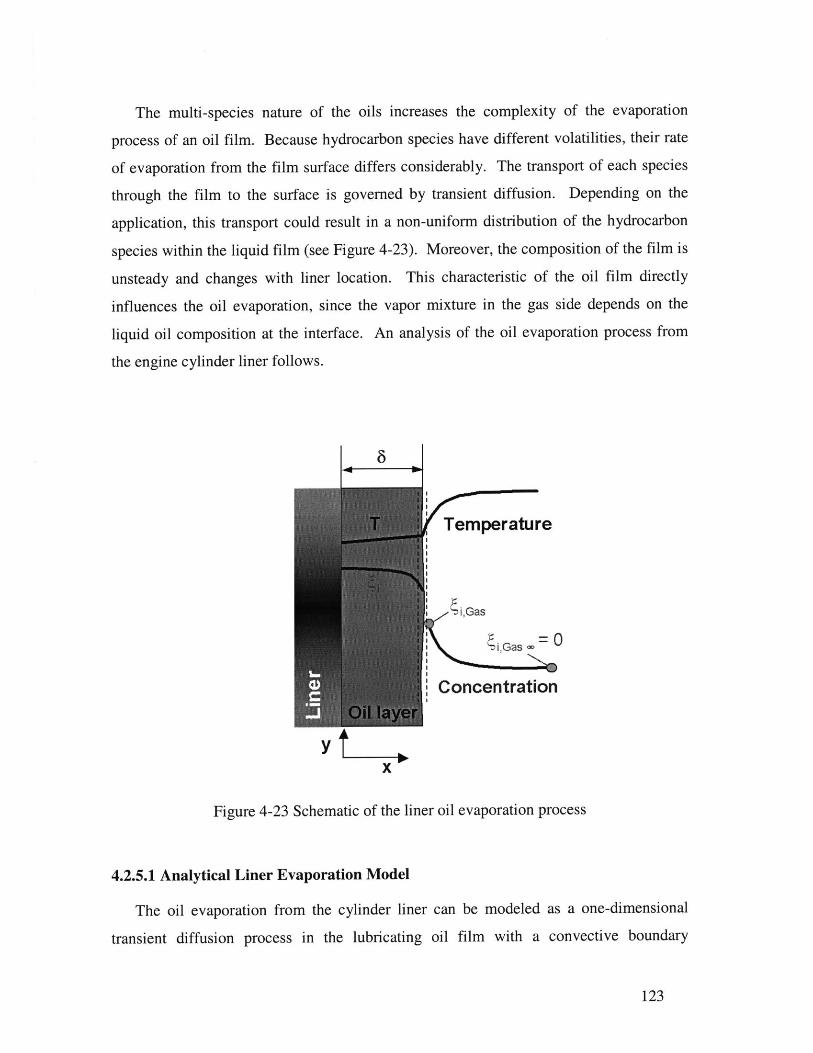
The multi-species nature of the oils increases the complexity of the evaporation
process of an oil film. Because hydrocarbon species have different volatilities, their rate
of evaporation from the film surface differs considerably. The transport of each species
through the film to the surface is governed by transient diffusion. Depending on the
application, this transport could result in a non-uniform distribution of the hydrocarbon
species within the liquid film (see Figure 4-23). Moreover, the composition of the film is
unsteady and changes with liner location. This characteristic of the oil film directly
influences the oil evaporation, since the vapor mixture in the gas side depends on the
liquid oil composition at the interface. An analysis of the oil evaporation process from
the engine cylinder liner follows.
Temperature
i,Gas
i,Gas < 0
Concentration
X
Figure 4-23 Schematic of the liner oil evaporation process
4.2.5.1 Analytical Liner Evaporation Model
The oil evaporation from the cylinder liner can be modeled as a one-dimensional
transient diffusion process in the lubricating oil film with a convective boundary
123
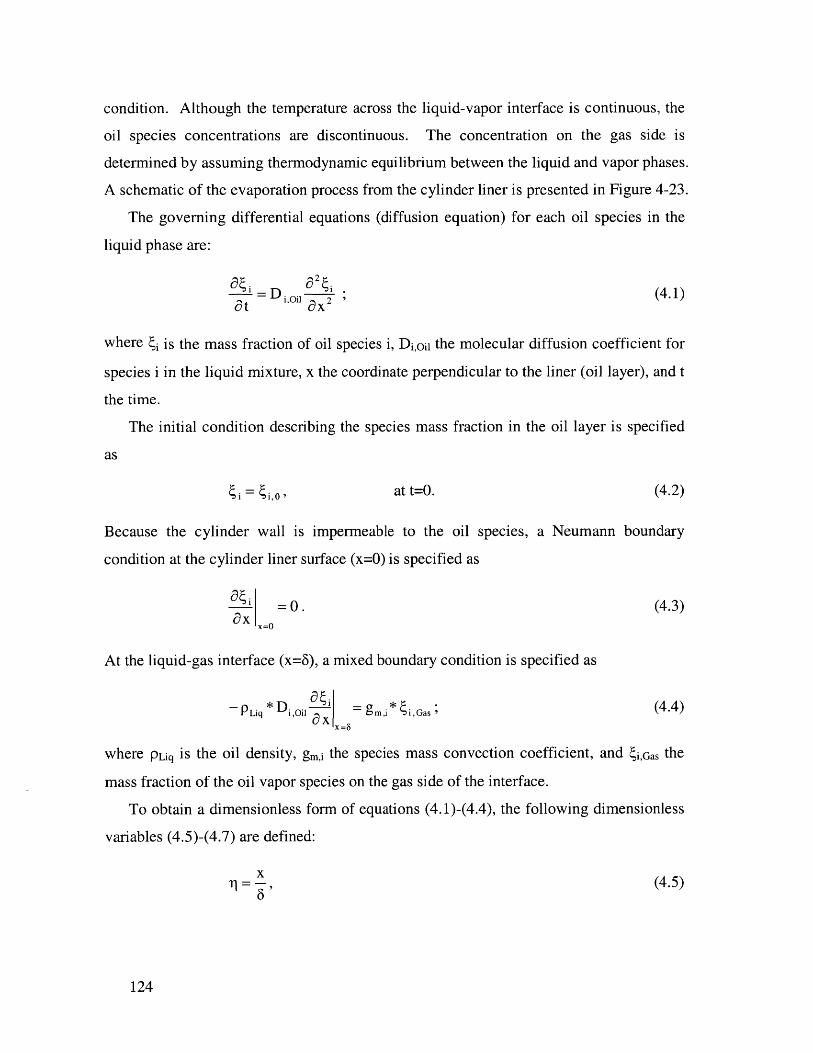
condition. Although the temperature across the liquid-vapor interface is continuous, the
oil species concentrations are discontinuous. The concentration on the gas side is
determined by assuming thermodynamic equilibrium between the liquid and vapor phases.
A schematic of the evaporation process from the cylinder liner is presented in Figure 4-23.
The governing differential equations (diffusion equation) for each oil species in the
liquid phase are:
= D ;, (4.1)at i8i x2
where i is the mass fraction of oil species i, D, 01 the molecular diffusion coefficient for
species i in the liquid mixture, x the coordinate perpendicular to the liner (oil layer), and t
the time.
The initial condition describing the species mass fraction in the oil layer is specified
as
at t=O. (4.2)
Because the cylinder wall is impermeable to the oil species, a Neumann boundary
condition at the cylinder liner surface (x=0) is specified as
=0. (4.3)ax
At the liquid-gas interface (x=6), a mixed boundary condition is specified as
P.g * D 134 = gm'i* 4i,Gas (4.4)a x
where PLiq is the oil density, gmi the species mass convection coefficient, and 4i,Gas the
mass fraction of the oil vapor species on the gas side of the interface.
To obtain a dimensionless form of equations (4.1)-(4.4), the following dimensionless
variables (4.5)-(4.7) are defined:
x (4.5)
6'
124

0i = 4i (4.6)
t * D
where i is the dimensionless coordinate perpendicular to the liner, Oi the dimensionless
liquid species mass fraction, and the dimensionless time. The dimensionless form of
the governing equations along with the initial condition and boundary conditions is
obtained by substituting the dimensionless variables (4.5)-(4.7) into equations (4.1)-(4.4):
1 . a20
DEQ: (4.8)a all 2
IC: O =1, at e=0, (4.9)
BC: N = 0 at i=O, (4.10)
ao. _ g j* j (4.11)BC: - *0'i * (4.11)C1 9=1 P *D c i =I
With the definition of the mass transfer Biot number
Bimi = g"*' * i,Gas (4.12)PLiq * Di1O 4i 1=1
equation (4.11) reduces to
ao = Bim, * 0i . (4.13)all
The mass transfer Biot number is defined as the ratio of the oil species diffusion
resistance in the liquid to the convection resistance in the gas phase.
Figure 4-24 shows the mass transfer Biot number for two oil species of the baseline
oil during the engine cycle at 100% load, 3500 rpm, and 93'C coolant outlet temperature
(upper bound). The model predicts maximum mass transfer Biot numbers in the order of
125
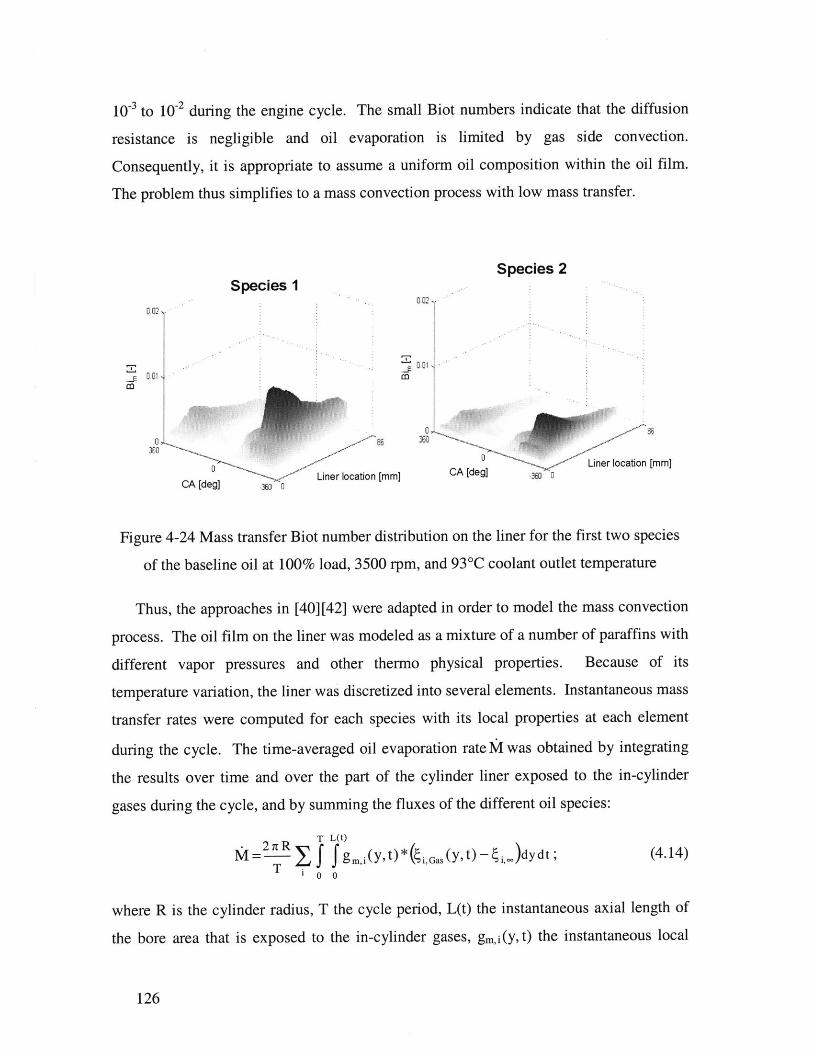
10-3 to 102 during the engine cycle. The small Biot numbers indicate that the diffusion
resistance is negligible and oil evaporation is limited by gas side convection.
Consequently, it is appropriate to assume a uniform oil composition within the oil film.
The problem thus simplifies to a mass convection process with low mass transfer.
Species 2Species 1
0002
Liner location [mm]C [d g
&.'CA Edeg Liner location -mm CAW Lie0o ain [ m
Figure 4-24 Mass transfer Biot number distribution on the liner for the first two species
of the baseline oil at 100% load, 3500 rpm, and 93'C coolant outlet temperature
Thus, the approaches in [40][42] were adapted in order to model the mass convection
process. The oil film on the liner was modeled as a mixture of a number of paraffins with
different vapor pressures and other thermo physical properties. Because of its
temperature variation, the liner was discretized into several elements. Instantaneous mass
transfer rates were computed for each species with its local properties at each element
during the cycle. The time-averaged oil evaporation rate M was obtained by integrating
the results over time and over the part of the cylinder liner exposed to the in-cylinder
gases during the cycle, and by summing the fluxes of the different oil species:
M= 2 1R T f Jg(yt)*(yi,Gast).. .)dydt; (4.14)T
where R is the cylinder radius, T the cycle period, L(t) the instantaneous axial length of
the bore area that is exposed to the in-cylinder gases, gm,i(y, t) the instantaneous local
126
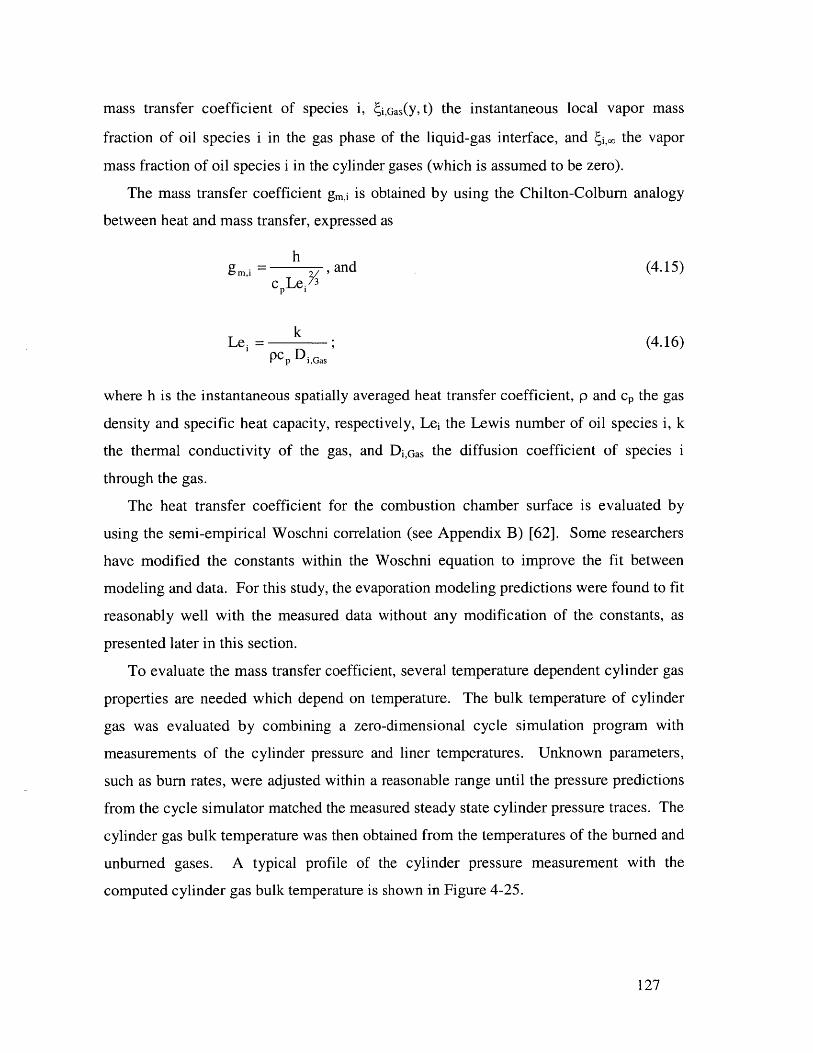
mass transfer coefficient of species i, 4i,Gas(Y, t) the instantaneous local vapor mass
fraction of oil species i in the gas phase of the liquid-gas interface, and 4i, the vapor
mass fraction of oil species i in the cylinder gases (which is assumed to be zero).
The mass transfer coefficient gm,i is obtained by using the Chilton-Colburn analogy
between heat and mass transfer, expressed as
hi , and (4.15)c Lei 3
kLeiP , (4.16)
pc DiGas
where h is the instantaneous spatially averaged heat transfer coefficient, p and cp the gas
density and specific heat capacity, respectively, Lei the Lewis number of oil species i, k
the thermal conductivity of the gas, and Di,Gas the diffusion coefficient of species i
through the gas.
The heat transfer coefficient for the combustion chamber surface is evaluated by
using the semi-empirical Woschni correlation (see Appendix B) [62]. Some researchers
have modified the constants within the Woschni equation to improve the fit between
modeling and data. For this study, the evaporation modeling predictions were found to fit
reasonably well with the measured data without any modification of the constants, as
presented later in this section.
To evaluate the mass transfer coefficient, several temperature dependent cylinder gas
properties are needed which depend on temperature. The bulk temperature of cylinder
gas was evaluated by combining a zero-dimensional cycle simulation program with
measurements of the cylinder pressure and liner temperatures. Unknown parameters,
such as burn rates, were adjusted within a reasonable range until the pressure predictions
from the cycle simulator matched the measured steady state cylinder pressure traces. The
cylinder gas bulk temperature was then obtained from the temperatures of the burned and
unburned gases. A typical profile of the cylinder pressure measurement with the
computed cylinder gas bulk temperature is shown in Figure 4-25.
127
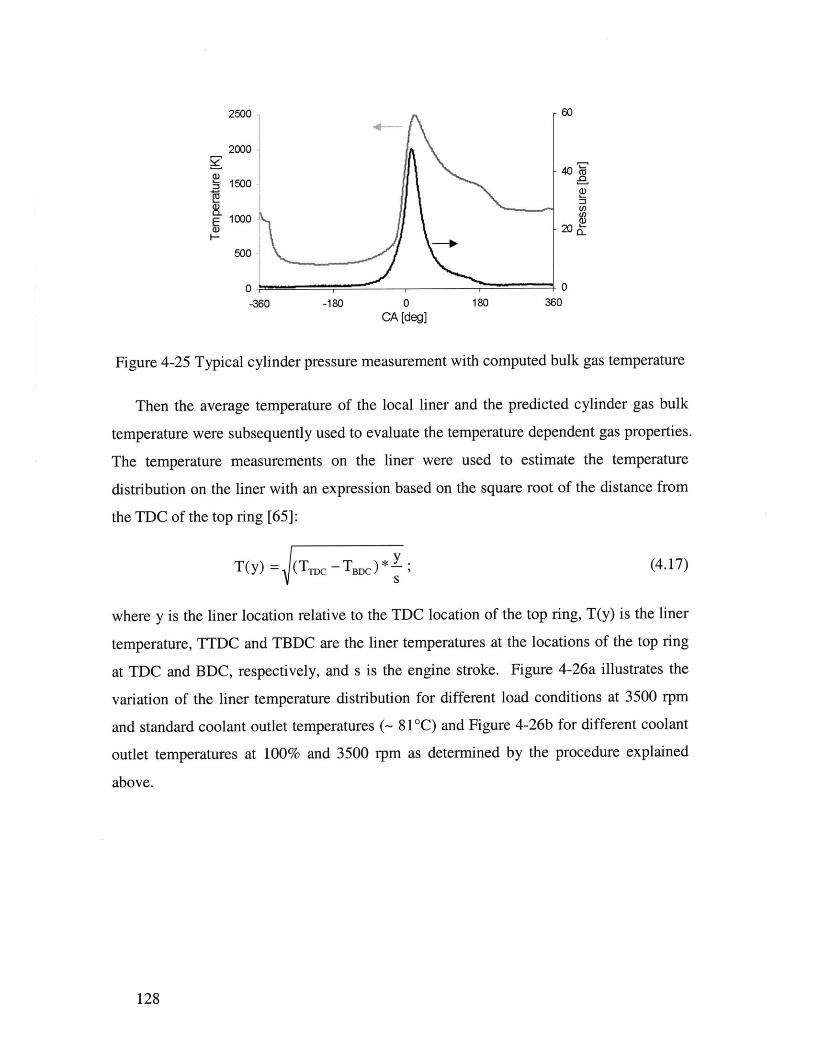
2000
-40
1500
E 1000-) 20 6
500
0-1 0-360 -180 0 180 360
CA [deg]
Figure 4-25 Typical cylinder pressure measurement with computed bulk gas temperature
Then the average temperature of the local liner and the predicted cylinder gas bulk
temperature were subsequently used to evaluate the temperature dependent gas properties.
The temperature measurements on the liner were used to estimate the temperature
distribution on the liner with an expression based on the square root of the distance from
the TDC of the top ring [65]:
T(y) = (TTc - TBDC (.7S
where y is the liner location relative to the TDC location of the top ring, T(y) is the liner
temperature, TTDC and TBDC are the liner temperatures at the locations of the top ring
at TDC and BDC, respectively, and s is the engine stroke. Figure 4-26a illustrates the
variation of the liner temperature distribution for different load conditions at 3500 rpm
and standard coolant outlet temperatures (~ 81'C) and Figure 4-26b for different coolant
outlet temperatures at 100% and 3500 rpm as determined by the procedure explained
above.
128
an
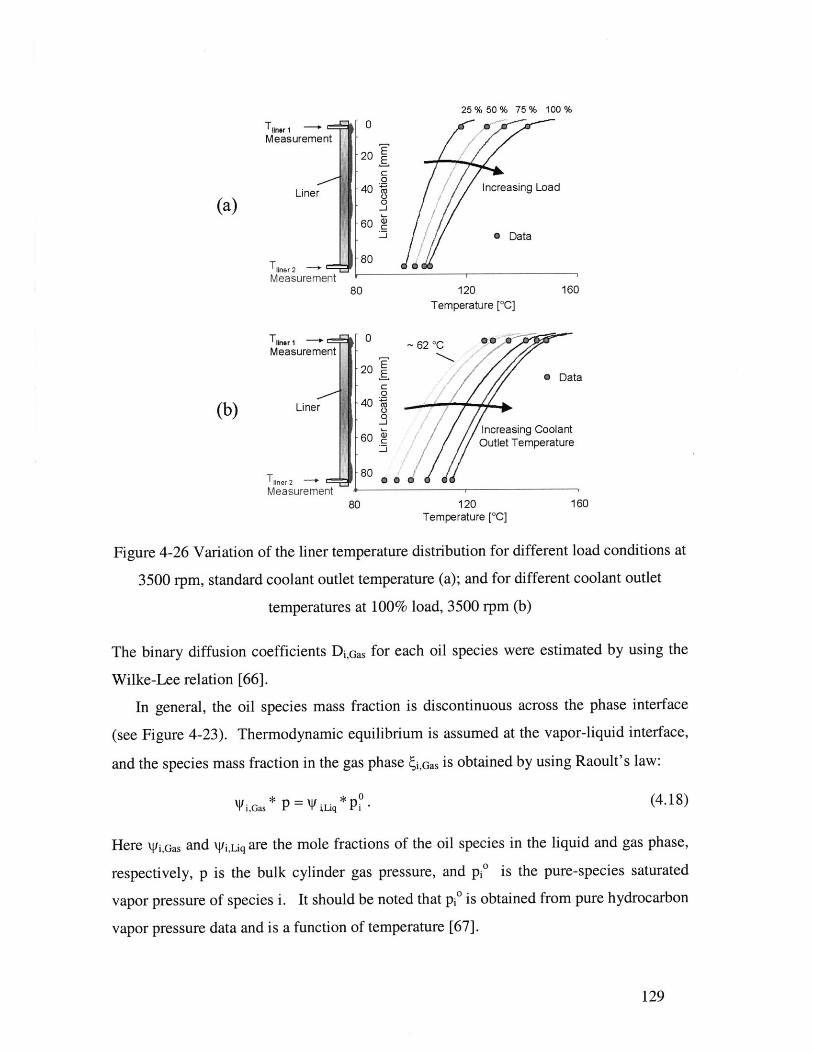
Measurement
Liner
T11ner 2 ~~
Measurement
Tiner 1 -
Measurement
Liner
Tner 2Measurement
0
20
40
60
80
80
E
0
C0D
25%50% 75% 100%
Increasing Load
S Data
120Temperature [0C]
0
20
40
60
80
80
160
~62 OC
Ee Data
Increasing Coolant
Outlet Temperature
T/
nresngColn
120Temperature [*C]
160
Figure 4-26 Variation of the liner temperature distribution for different load conditions at
3500 rpm, standard coolant outlet temperature (a); and for different coolant outlet
temperatures at 100% load, 3500 rpm (b)
The binary diffusion coefficients Di,Gas for each oil species were estimated by using the
Wilke-Lee relation [66].
In general, the oil species mass fraction is discontinuous across the phase interface
(see Figure 4-23). Thermodynamic equilibrium is assumed at the vapor-liquid interface,
and the species mass fraction in the gas phase i,Gas is obtained by using Raoult's law:
i,Gas *P ILiq Pi(4.18)
Here \i,Gas and WiLiq are the mole fractions of the oil species in the liquid and gas phase,
respectively, p is the bulk cylinder gas pressure, and pi0 is the pure-species saturated
vapor pressure of species i. It should be noted that pi0 is obtained from pure hydrocarbon
vapor pressure data and is a function of temperature [67].
129
(a)
(b)

The liquid phase mass fraction and boiling points of each oil species must be
specified. This information was obtained from atmospheric boiling point distillation
curves. These curves were determined using High Temperature Simulated Distillation
(HTSD) tests (also based on GCD as described in DIN 51435-2 and draft ASTM). Figure
4-27 shows the distillation curves of the fresh oils used for this study.
820780 Synthetic Oil
740
Baseline Oila)660-
620 T=371 0C580
5400 10 20 30 40 50 60 70 80 90 100
Percent of Mass Evaporated [%]
Figure 4-27 Distillation curves of baseline and synthetic oil
The oil film thickness on the liner was predicted at the anti-thrust side using the
simulation code Friction-OFT [68][43]. A typical plot of the oil film thickness left on the
liner after the intake and expansion strokes is shown in Figure 4-28. The binary diffusion
coefficient Di,ojj for species i through the oil film (used for the mass transfer Biot number)
was estimated using the Wilke-Chang method as described in [66].
130
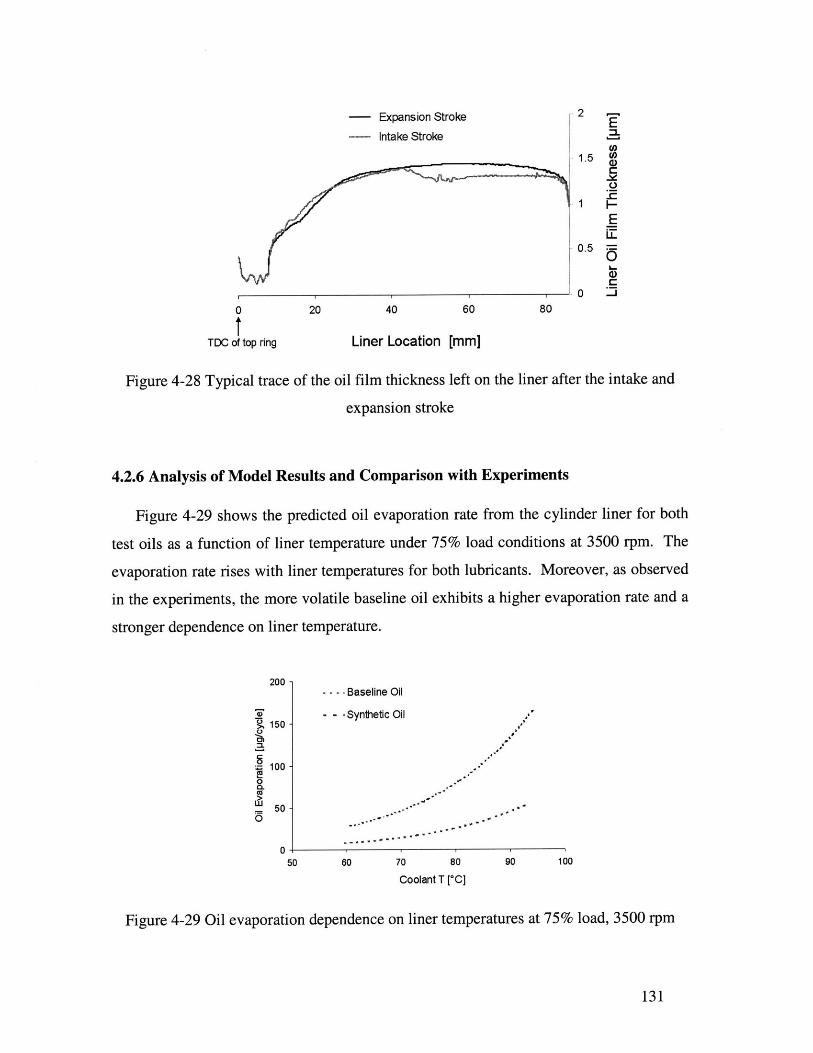
- Expansion Stroke
- Intake Stroke
200
TDC of top ring
40 60
Liner Location [mm]
Figure 4-28 Typical trace of the oil film thickness left on the liner after the intake and
expansion stroke
4.2.6 Analysis of Model Results and Comparison with Experiments
Figure 4-29 shows the predicted oil evaporation rate from the cylinder liner for both
test oils as a function of liner temperature under 75% load conditions at 3500 rpm. The
evaporation rate rises with liner temperatures for both lubricants. Moreover, as observed
in the experiments, the more volatile baseline oil exhibits a higher evaporation rate and a
stronger dependence on liner temperature.
200 -- - - Baseline Oil
- - -Synthetic Oil s'150-
100-0a.
0
- 0
50 60 70
C
Figure 4-29 Oil evaporation dependence on liner temperatures at 75% load, 3500 rpm
131
80
oolant T [0C]90 100
2E
1.5
E
0.5 =0-
0)
80. . 1
0

Figure 4-30 shows the experimentally obtained total oil consumption results and the
oil evaporation predicted by the model for both oils as a function of liner temperature
under different load conditions at 3500 rpm. It should be noted that the axis that
represents the evaporation results was shifted to compare it with the total oil consumption
data. For the synthetic oil, the predicted rate of change of oil evaporation with liner
temperature is similar to the measured rate of change of oil consumption for all load
conditions.
For the baseline oil, the dependencies of the measured oil consumption rate and the
predicted liner evaporation rate on liner temperatures are comparable when the liner
temperatures are low. Moreover, at low liner temperatures, the difference between the
liner evaporation rates of the two oils is comparable to the measured difference in oil
consumption for the 100% load and 75% load conditions. Under the 50% load condition
when component temperatures become lower, the oil consumption rate approaches the
same value for the two oils. The model, however, predicts a small difference between the
liner evaporation rates of the two oils.
At higher liner temperatures, the evaporation predictions for the baseline oil show a
stronger dependence on liner temperature than the oil consumption measurements. This
discrepancy between the model and experimental results for the baseline oil can be
attributed to the assumptions of the model on oil supply.
The evaporation model assumes an infinite supply of oil species on the entire liner
when the piston passes by during compression and exhaust strokes. However, in reality
the oil supply to the liner is limited. In particular, the top of the liner in the region
between the TDC location of the oil control ring and the TDC location of the top ring
[55]. Since the oil control ring and piston skirt never travels in this region the oil supply
can be either from the piston lands or along the liner due to ring-liner interaction. As
discussed in Section 3.3.3, LIF measurements indicate that there is little oil accumulation
on the piston top and second land at the investigated operating conditions. Therefore, oil
flow from the piston lands to the top of the liner is unlikely, and the ring-liner interface is
probably the only oil source of consequence. Therefore, the oil supply to the top of the
liner may depend mainly on the lubrication conditions of the top two rings and the
availability of oil before they enter this region, as described in [55]. In addition, the
132
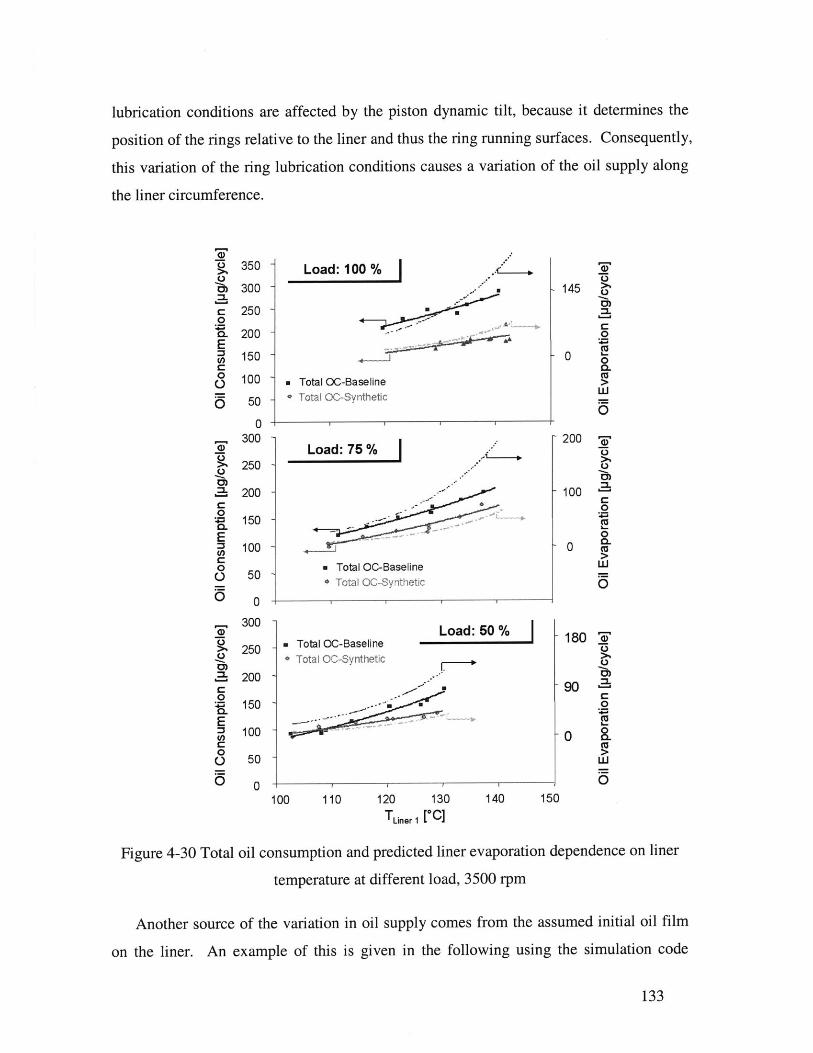
lubrication conditions are affected by the piston dynamic tilt, because it determines the
position of the rings relative to the liner and thus the ring running surfaces. Consequently,
this variation of the ring lubrication conditions causes a variation of the oil supply along
the liner circumference.
Load: 100 %
*Total 00-Base line*Total 00-Synthetic
* Total OC -Baseline- Total 0-Synthetic
350
300
250
200
150
100
50
0300
250
200
150
100
50
0
300
250
200
150
100
50
0120 130
TLiner 1 [o1
145
0)CL
U.0
200 r
100 =000
U
0
180 '3
90 -00
U
0
140 150
Figure 4-30 Total oil consumption and predicted liner evaporation dependence on liner
temperature at different load, 3500 rpm
Another source of the variation in oil supply comes from the assumed initial oil film
on the liner. An example of this is given in the following using the simulation code
133
100 110
Total 0C-Baseline' Total OC-Synthetic.
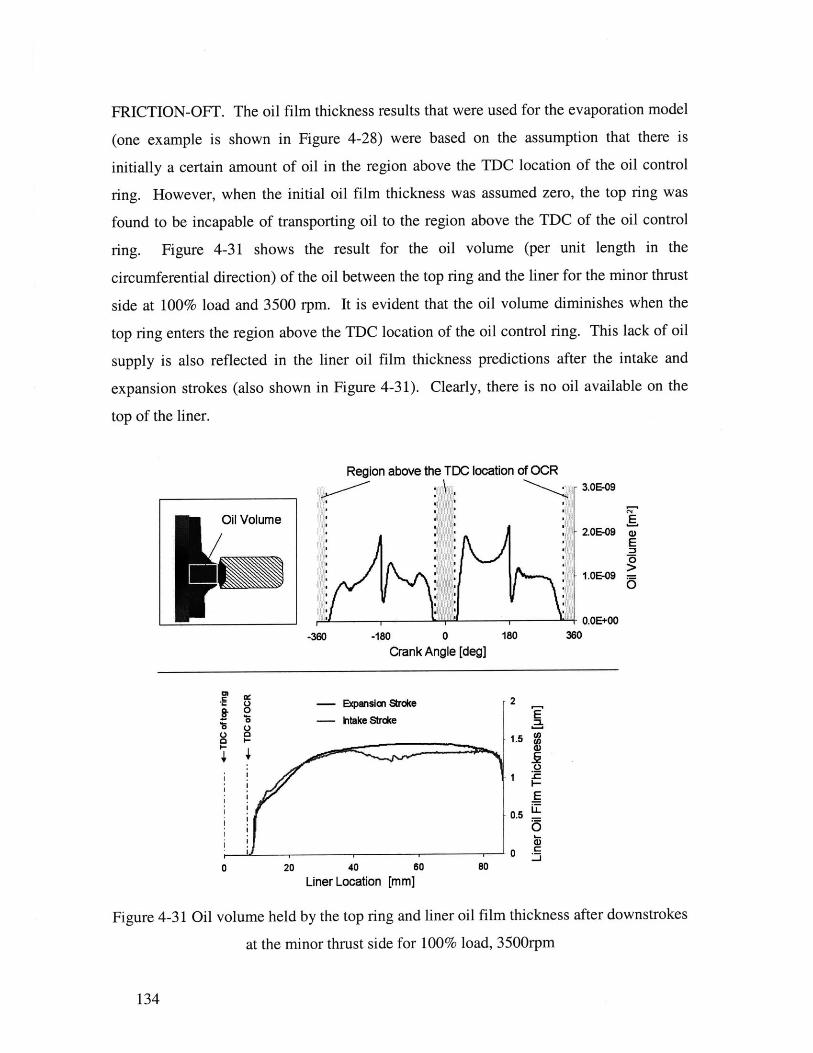
FRICTION-OFT. The oil film thickness results that were used for the evaporation model
(one example is shown in Figure 4-28) were based on the assumption that there is
initially a certain amount of oil in the region above the TDC location of the oil control
ring. However, when the initial oil film thickness was assumed zero, the top ring was
found to be incapable of transporting oil to the region above the TDC of the oil control
ring. Figure 4-31 shows the result for the oil volume (per unit length in the
circumferential direction) of the oil between the top ring and the liner for the minor thrust
side at 100% load and 3500 rpm. It is evident that the oil volume diminishes when the
top ring enters the region above the TDC location of the oil control ring. This lack of oil
supply is also reflected in the liner oil film thickness predictions after the intake and
expansion strokes (also shown in Figure 4-31). Clearly, there is no oil available on the
top of the liner.
Region above the TDC location of OCR3.OE-09
Oil VolumeE20E-09 w
- 1.OE-09 0
4 0.0E+00-360 -180 0 180 360
Crank Angle [deg]
-- Expansion Stroke r 2
- intake Strdo [m
1.5
.0.
0
a)0 .
0 20 40 so 80Liner Location [mm]
Figure 4-31 Oil volume held by the top ring and liner oil film thickness after downstrokes
at the minor thrust side for 100% load, 3500rpm
134
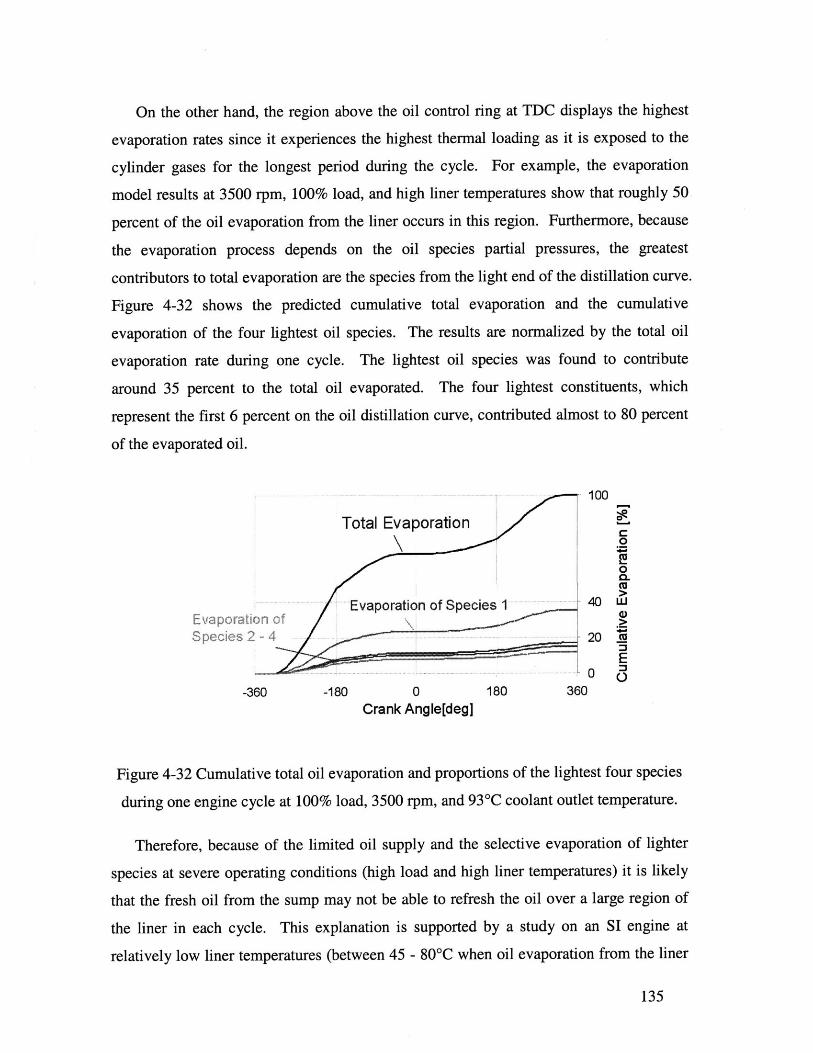
On the other hand, the region above the oil control ring at TDC displays the highest
evaporation rates since it experiences the highest thermal loading as it is exposed to the
cylinder gases for the longest period during the cycle. For example, the evaporation
model results at 3500 rpm, 100% load, and high liner temperatures show that roughly 50
percent of the oil evaporation from the liner occurs in this region. Furthermore, because
the evaporation process depends on the oil species partial pressures, the greatest
contributors to total evaporation are the species from the light end of the distillation curve.
Figure 4-32 shows the predicted cumulative total evaporation and the cumulative
evaporation of the four lightest oil species. The results are normalized by the total oil
evaporation rate during one cycle. The lightest oil species was found to contribute
around 35 percent to the total oil evaporated. The four lightest constituents, which
represent the first 6 percent on the oil distillation curve, contributed almost to 80 percent
of the evaporated oil.
100
Total Evaporation
CL0
. .... . . .... 40 WUEvaoraionofEvaporation of Species 1 4
Evprtion ofSpecies 2 - 4 20
-360 -180 0 180 360Crank Angle[deg]
Figure 4-32 Cumulative total oil evaporation and proportions of the lightest four species
during one engine cycle at 100% load, 3500 rpm, and 93*C coolant outlet temperature.
Therefore, because of the limited oil supply and the selective evaporation of lighter
species at severe operating conditions (high load and high liner temperatures) it is likely
that the fresh oil from the sump may not be able to refresh the oil over a large region of
the liner in each cycle. This explanation is supported by a study on an SI engine at
relatively low liner temperatures (between 45 - 80'C when oil evaporation from the liner
135
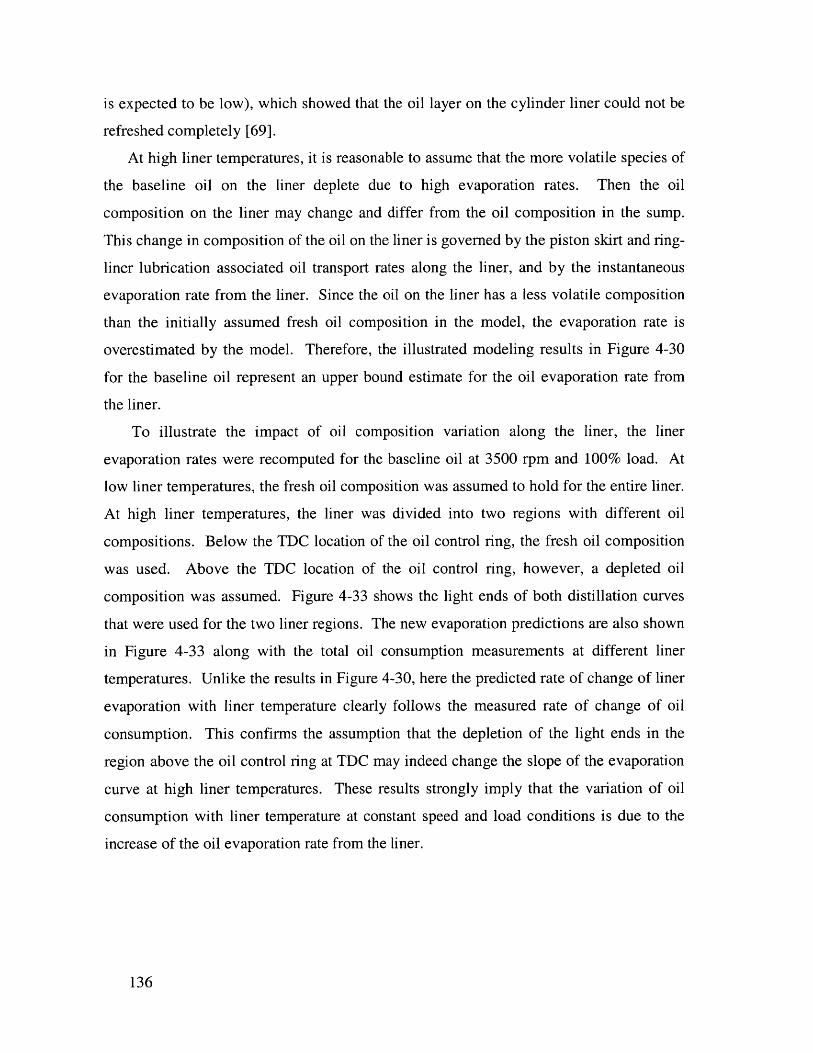
is expected to be low), which showed that the oil layer on the cylinder liner could not be
refreshed completely [69].
At high liner temperatures, it is reasonable to assume that the more volatile species of
the baseline oil on the liner deplete due to high evaporation rates. Then the oil
composition on the liner may change and differ from the oil composition in the sump.
This change in composition of the oil on the liner is governed by the piston skirt and ring-
liner lubrication associated oil transport rates along the liner, and by the instantaneous
evaporation rate from the liner. Since the oil on the liner has a less volatile composition
than the initially assumed fresh oil composition in the model, the evaporation rate is
overestimated by the model. Therefore, the illustrated modeling results in Figure 4-30
for the baseline oil represent an upper bound estimate for the oil evaporation rate from
the liner.
To illustrate the impact of oil composition variation along the liner, the liner
evaporation rates were recomputed for the baseline oil at 3500 rpm and 100% load. At
low liner temperatures, the fresh oil composition was assumed to hold for the entire liner.
At high liner temperatures, the liner was divided into two regions with different oil
compositions. Below the TDC location of the oil control ring, the fresh oil composition
was used. Above the TDC location of the oil control ring, however, a depleted oil
composition was assumed. Figure 4-33 shows the light ends of both distillation curves
that were used for the two liner regions. The new evaporation predictions are also shown
in Figure 4-33 along with the total oil consumption measurements at different liner
temperatures. Unlike the results in Figure 4-30, here the predicted rate of change of liner
evaporation with liner temperature clearly follows the measured rate of change of oil
consumption. This confirms the assumption that the depletion of the light ends in the
region above the oil control ring at TDC may indeed change the slope of the evaporation
curve at high liner temperatures. These results strongly imply that the variation of oil
consumption with liner temperature at constant speed and load conditions is due to the
increase of the oil evaporation rate from the liner.
136
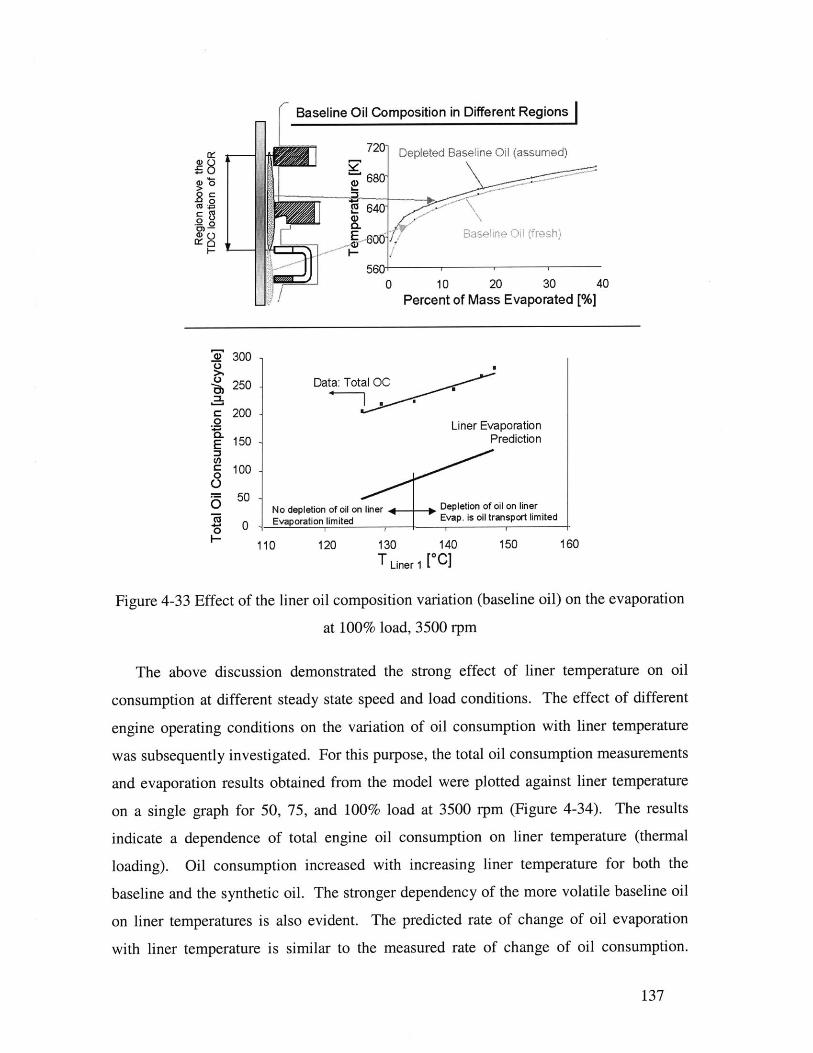
Baseline Oil Composition in Different Regions
720 Depleted Baseline Oi (assumed)
0 oW
560 10 20 30 40
Percent of Mass Evaporated [%]
i' 300-
0250 Data: Total 00
c 200 2
o P Liner Evaporation
150 D Prediction
c 100
50
-6 *Linier e eap tm r pra in d
00 No depletion of oil on liner .4Depletion of oil on liner
Ca 0 Evaporation limited Evap. is oil transport limited
110 120 130 140 150 160T Liner 1 [CC]
Figure 4-33 Effect of the liner oil composition variation (baseline oil) on the evaporation
at 100% load, 3500 rpm
The above discussion demonstrated the strong effect of liner temperature on oil
consumption at different steady state speed and load conditions. The effect of different
engine operating conditions on the variation of oil consumption with liner temperature
was subsequently investigated. For this purpose, the total oil consumption measurements
and evaporation results obtained from the model were plotted against liner temperature
on a single graph for 50, 75, and 100% load at 3500 rpm (Figure 4-34). The results
indicate a dependence of total engine oil consumption on liner temperature (thermal
loading). Oil consumption increased with increasing liner temperature for both the
baseline and the synthetic oil. The stronger dependency of the more volatile baseline oil
on liner temperatures is also evident. The predicted rate of change of oil evaporation
with liner temperature is similar to the measured rate of change of oil consumption.
137
There is also a strong correlation between predicted liner evaporation rates and liner
temperatures. This indicates that the evaporation process is less dependent on engine
load, which can be explained as follows. A variation in engine load affects both the oil
species mass transfer coefficient and the species vapor mass fraction in the liquid-gas
interface, which together govern the liner evaporation process (see equation (4.14)).
While the mass transfer coefficient increases with engine load, the vapor mass fraction
decreases with load due to the higher pressures in the combustion chamber. Therefore,
when load is varied, the competition of these two controlling parameters results only in a
small variation of the evaporation rate. It should be noted that the total engine oil
consumption data includes the blowby contribution to oil consumption, which varies
between the engine loads shown in figure (see Section 4.1.1). This blowby variation is
the likely cause of the weaker correlation coefficients for the experimental data.
300 4 + Total OC [Baseline] R2 = 0.78 300
I N Total OC [Synthetic] R2 = 0.92
> 250 -+ 250 >.Model [Baseline] R2 =0.98 -
200 a Model [Synthetic] R2 =0.98 200
1 00~ T2a O00
0I 4 0
E o50 -1500
A A
0 0 >010 10 10 13 4 5
oLnr 100>On 1e tTotal OC
Data 050- .4A i50
Evaporation rad one-
I- I Model 0
80 90 100 110 120 130 140 150 160
T Liner 1 [0C]
Figure 4-34 Measured total oil consumption and predicted liner evaporation dependence
on liner temperature at different load (50%, 75%, and 100%), 3500 rpm. Exponential
curve fit to each data set and corresponding R2 correlation coefficient shown.
Further work was conducted to examine the dependence of oil consumption on liner
temperatures at 2500 rpm. This change of speed is expected to affect the evaporation rate
by increasing the available time for evaporation during one engine cycle and by
138
M M
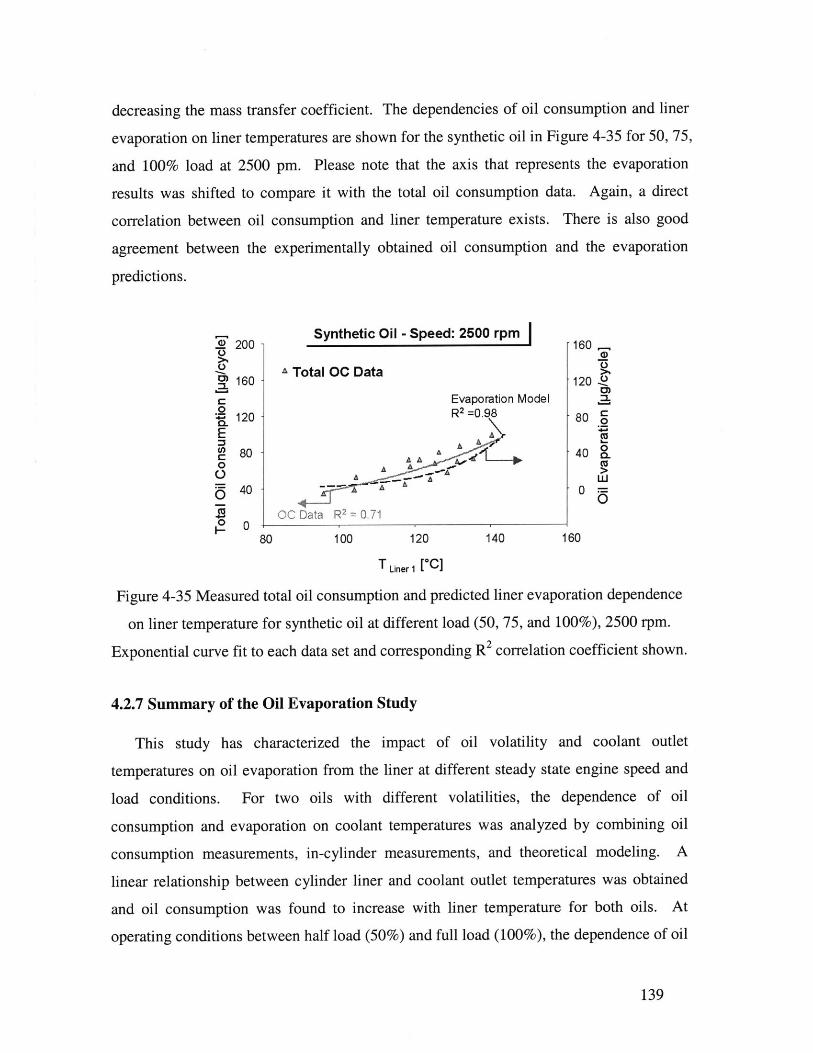
decreasing the mass transfer coefficient. The dependencies of oil consumption and liner
evaporation on liner temperatures are shown for the synthetic oil in Figure 4-35 for 50, 75,
and 100% load at 2500 pm. Please note that the axis that represents the evaporation
results was shifted to compare it with the total oil consumption data. Again, a direct
correlation between oil consumption and liner temperature exists. There is also good
agreement between the experimentally obtained oil consumption and the evaporation
predictions.
Synthetic Oil - Speed: 2500 rpm. 200 160
160 9 Total OC Data 120
c Evaporation Model a
120 .R 2 =0.98 80 C0E A
A080 1 42 11
A A kw_O AA >-A
Z_ A 0=
ig OC Data R 2 =0,71
80 100 120 140 160
TLiner 1 [0C]
Figure 4-35 Measured total oil consumption and predicted liner evaporation dependence
on liner temperature for synthetic oil at different load (50, 75, and 100%), 2500 rpm.
Exponential curve fit to each data set and corresponding R2 correlation coefficient shown.
4.2.7 Summary of the Oil Evaporation Study
This study has characterized the impact of oil volatility and coolant outlet
temperatures on oil evaporation from the liner at different steady state engine speed and
load conditions. For two oils with different volatilities, the dependence of oil
consumption and evaporation on coolant temperatures was analyzed by combining oil
consumption measurements, in-cylinder measurements, and theoretical modeling. A
linear relationship between cylinder liner and coolant outlet temperatures was obtained
and oil consumption was found to increase with liner temperature for both oils. At
operating conditions between half load (50%) and full load (100%), the dependence of oil
139
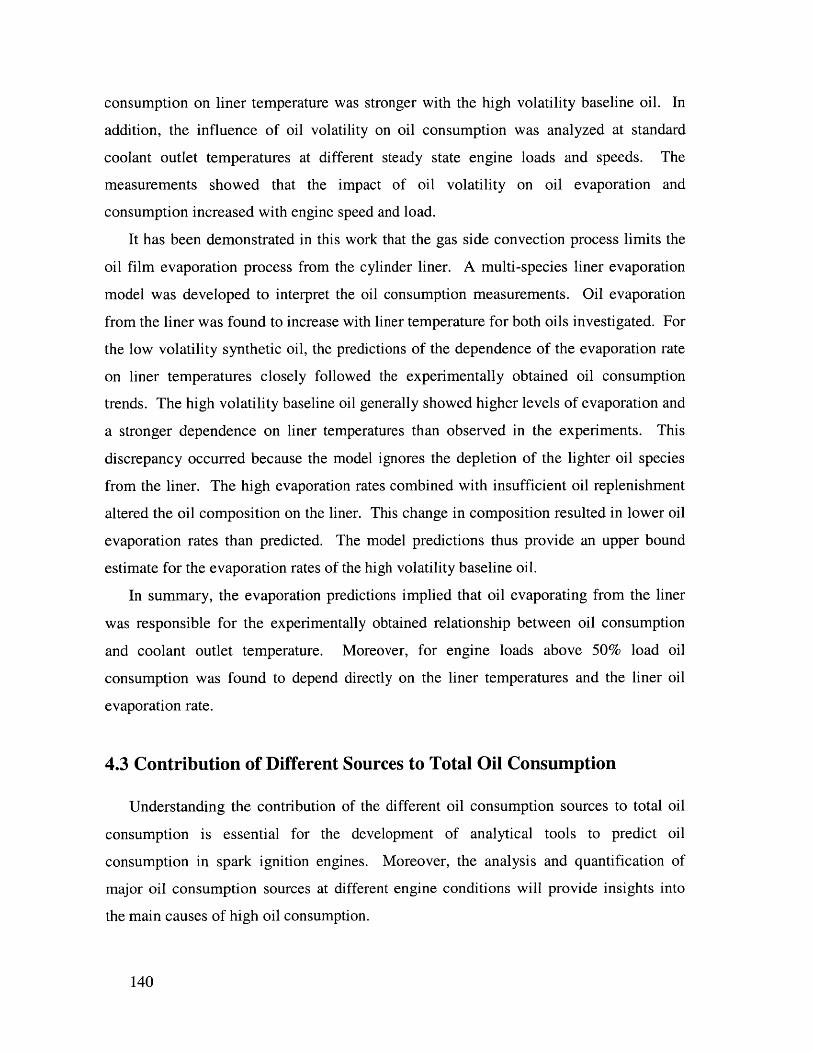
consumption on liner temperature was stronger with the high volatility baseline oil. In
addition, the influence of oil volatility on oil consumption was analyzed at standard
coolant outlet temperatures at different steady state engine loads and speeds. The
measurements showed that the impact of oil volatility on oil evaporation and
consumption increased with engine speed and load.
It has been demonstrated in this work that the gas side convection process limits the
oil film evaporation process from the cylinder liner. A multi-species liner evaporation
model was developed to interpret the oil consumption measurements. Oil evaporation
from the liner was found to increase with liner temperature for both oils investigated. For
the low volatility synthetic oil, the predictions of the dependence of the evaporation rate
on liner temperatures closely followed the experimentally obtained oil consumption
trends. The high volatility baseline oil generally showed higher levels of evaporation and
a stronger dependence on liner temperatures than observed in the experiments. This
discrepancy occurred because the model ignores the depletion of the lighter oil species
from the liner. The high evaporation rates combined with insufficient oil replenishment
altered the oil composition on the liner. This change in composition resulted in lower oil
evaporation rates than predicted. The model predictions thus provide an upper bound
estimate for the evaporation rates of the high volatility baseline oil.
In summary, the evaporation predictions implied that oil evaporating from the liner
was responsible for the experimentally obtained relationship between oil consumption
and coolant outlet temperature. Moreover, for engine loads above 50% load oil
consumption was found to depend directly on the liner temperatures and the liner oil
evaporation rate.
4.3 Contribution of Different Sources to Total Oil Consumption
Understanding the contribution of the different oil consumption sources to total oil
consumption is essential for the development of analytical tools to predict oil
consumption in spark ignition engines. Moreover, the analysis and quantification of
major oil consumption sources at different engine conditions will provide insights into
the main causes of high oil consumption.
140
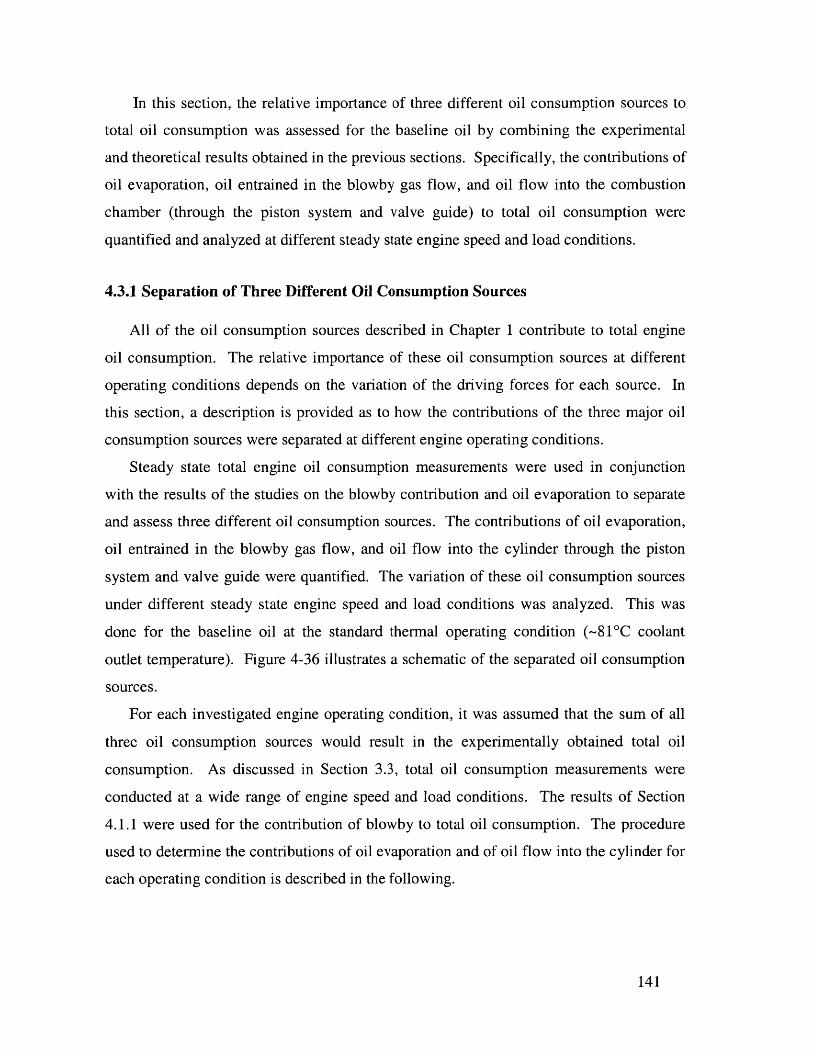
In this section, the relative importance of three different oil consumption sources to
total oil consumption was assessed for the baseline oil by combining the experimental
and theoretical results obtained in the previous sections. Specifically, the contributions of
oil evaporation, oil entrained in the blowby gas flow, and oil flow into the combustion
chamber (through the piston system and valve guide) to total oil consumption were
quantified and analyzed at different steady state engine speed and load conditions.
4.3.1 Separation of Three Different Oil Consumption Sources
All of the oil consumption sources described in Chapter 1 contribute to total engine
oil consumption. The relative importance of these oil consumption sources at different
operating conditions depends on the variation of the driving forces for each source. In
this section, a description is provided as to how the contributions of the three major oil
consumption sources were separated at different engine operating conditions.
Steady state total engine oil consumption measurements were used in conjunction
with the results of the studies on the blowby contribution and oil evaporation to separate
and assess three different oil consumption sources. The contributions of oil evaporation,
oil entrained in the blowby gas flow, and oil flow into the cylinder through the piston
system and valve guide were quantified. The variation of these oil consumption sources
under different steady state engine speed and load conditions was analyzed. This was
done for the baseline oil at the standard thermal operating condition (-81 C coolant
outlet temperature). Figure 4-36 illustrates a schematic of the separated oil consumption
sources.
For each investigated engine operating condition, it was assumed that the sum of all
three oil consumption sources would result in the experimentally obtained total oil
consumption. As discussed in Section 3.3, total oil consumption measurements were
conducted at a wide range of engine speed and load conditions. The results of Section
4.1.1 were used for the contribution of blowby to total oil consumption. The procedure
used to determine the contributions of oil evaporation and of oil flow into the cylinder for
each operating condition is described in the following.
141
Figure 4-36 Illustration of the separated oil consumption sources
Contribution of oil evaporation
The contribution of oil evaporation to total oil consumption for the baseline oil was
determined by combining oil consumption measurements and predictions of the in the
previous section proposed liner evaporation model. As discussed previously, the
evaporation model overestimated the evaporation of the baseline oil. However, good
agreement was obtained between the evaporation predictions and the oil consumption
measurements at the different engine operating conditions that were investigated for the
low volatility synthetic oil. Consequently, it was assumed that the liner evaporation
model holds for the synthetic oil. The evaporation rate for the baseline oil was estimated
by adding the measured difference in oil consumption (A OC) between the baseline and
the lower volatility synthetic oil to the evaporation predictions for the synthetic oil. This
difference in oil consumption (A OC) accounts for the additional evaporation of the
baseline oil due to its higher volatility than that of the synthetic oil. This approach is
possible because the oil consumption due to oil transport is assumed to not vary between
the two oils since their viscosities are comparable (see Section 4.2.4 and Figure 4-19).
The difference in oil consumption (A OC) is mainly due to the difference in liner
142
Oil transport into cylinderthrough groove
a~C -o0
through
Throw-off Oil mist in gas stream Valve guide
Blowby entrainment Oil evaporation
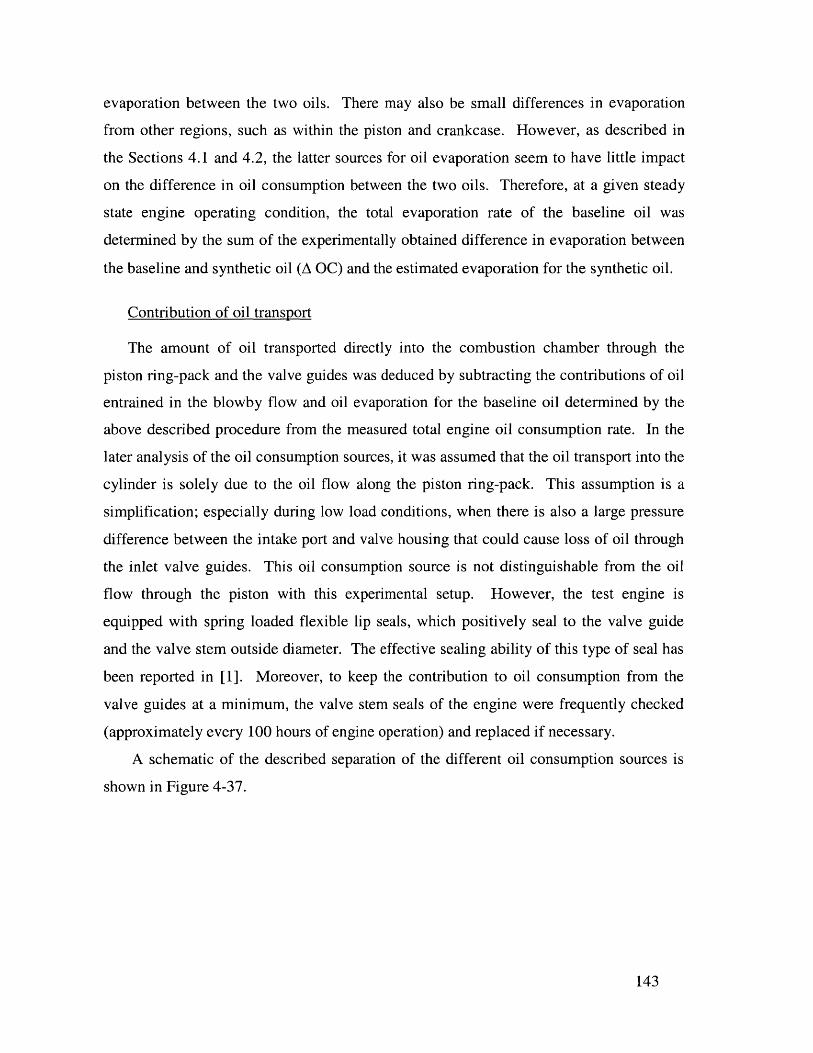
evaporation between the two oils. There may also be small differences in evaporation
from other regions, such as within the piston and crankcase. However, as described in
the Sections 4.1 and 4.2, the latter sources for oil evaporation seem to have little impact
on the difference in oil consumption between the two oils. Therefore, at a given steady
state engine operating condition, the total evaporation rate of the baseline oil was
determined by the sum of the experimentally obtained difference in evaporation between
the baseline and synthetic oil (A OC) and the estimated evaporation for the synthetic oil.
Contribution of oil transport
The amount of oil transported directly into the combustion chamber through the
piston ring-pack and the valve guides was deduced by subtracting the contributions of oil
entrained in the blowby flow and oil evaporation for the baseline oil determined by the
above described procedure from the measured total engine oil consumption rate. In the
later analysis of the oil consumption sources, it was assumed that the oil transport into the
cylinder is solely due to the oil flow along the piston ring-pack. This assumption is a
simplification; especially during low load conditions, when there is also a large pressure
difference between the intake port and valve housing that could cause loss of oil through
the inlet valve guides. This oil consumption source is not distinguishable from the oil
flow through the piston with this experimental setup. However, the test engine is
equipped with spring loaded flexible lip seals, which positively seal to the valve guide
and the valve stem outside diameter. The effective sealing ability of this type of seal has
been reported in [1]. Moreover, to keep the contribution to oil consumption from the
valve guides at a minimum, the valve stem seals of the engine were frequently checked
(approximately every 100 hours of engine operation) and replaced if necessary.
A schematic of the described separation of the different oil consumption sources is
shown in Figure 4-37.
143
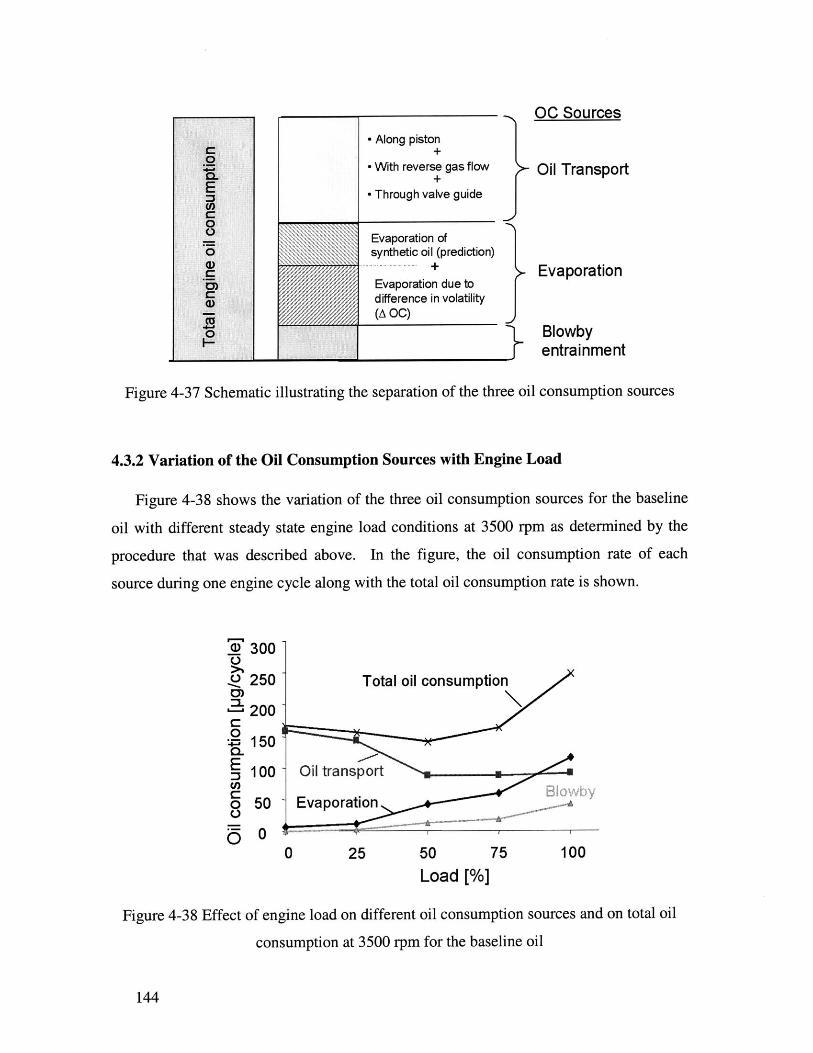
- Along piston
- With reverse gas flow
- Through valve guide
Evaporation ofsynthetic oil (prediction)
+Evaporation due todifference in volatility(A OC)
}
Figure 4-37 Schematic illustrating the separation of the three oil consumption sources
4.3.2 Variation of the Oil Consumption Sources with Engine Load
Figure 4-38 shows the variation of the three oil consumption sources for the baseline
oil with different steady state engine load conditions at 3500 rpm as determined by the
procedure that was described above. In the figure, the oil consumption rate of each
source during one engine cycle along with the total oil consumption rate is shown.
C)0)
E:3U)C0
0.
300
250
200
100-
50 -
00
Total oil consumption
Oil transport
Evaporation
25 50 75 100
Load [%]
Figure 4-38 Effect of engine load on different oil consumption sources and on total oil
consumption at 3500 rpm for the baseline oil
144
r-0.
E
0
5
0)
\ \
OC Sources
Oil Transport
Evaporation
Blowbyentrainment
1,
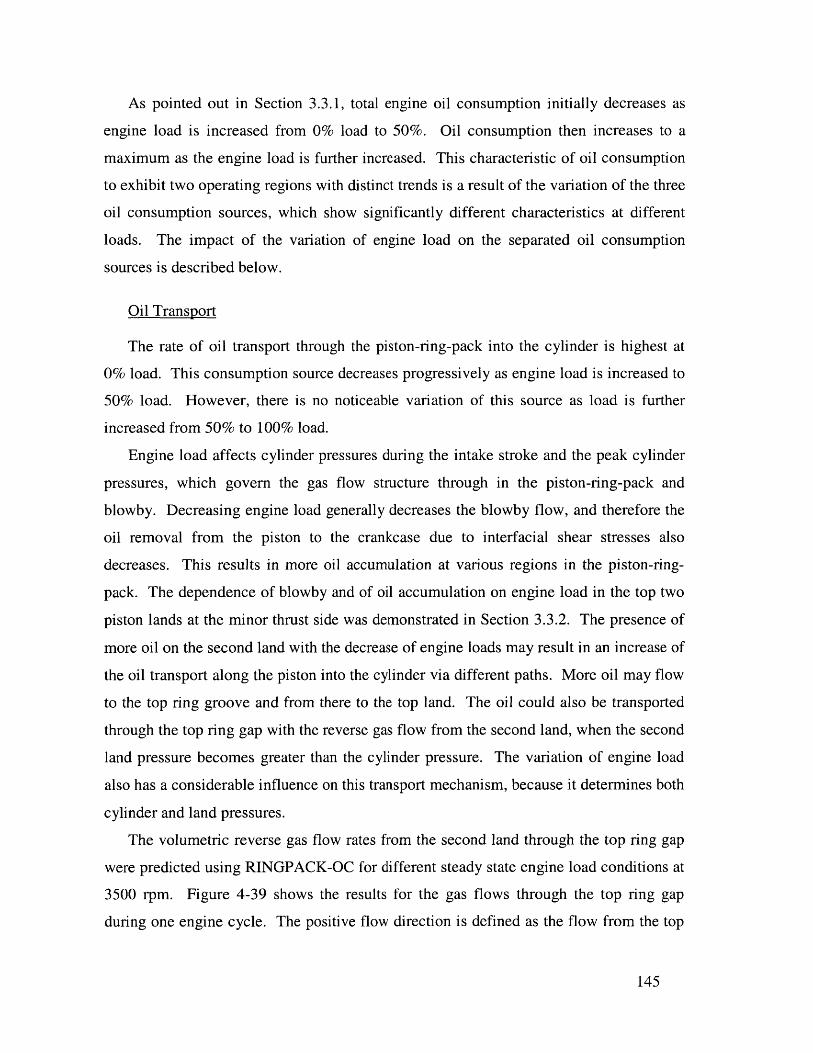
As pointed out in Section 3.3.1, total engine oil consumption initially decreases as
engine load is increased from 0% load to 50%. Oil consumption then increases to a
maximum as the engine load is further increased. This characteristic of oil consumption
to exhibit two operating regions with distinct trends is a result of the variation of the three
oil consumption sources, which show significantly different characteristics at different
loads. The impact of the variation of engine load on the separated oil consumption
sources is described below.
Oil Transport
The rate of oil transport through the piston-ring-pack into the cylinder is highest at
0% load. This consumption source decreases progressively as engine load is increased to
50% load. However, there is no noticeable variation of this source as load is further
increased from 50% to 100% load.
Engine load affects cylinder pressures during the intake stroke and the peak cylinder
pressures, which govern the gas flow structure through in the piston-ring-pack and
blowby. Decreasing engine load generally decreases the blowby flow, and therefore the
oil removal from the piston to the crankcase due to interfacial shear stresses also
decreases. This results in more oil accumulation at various regions in the piston-ring-
pack. The dependence of blowby and of oil accumulation on engine load in the top two
piston lands at the minor thrust side was demonstrated in Section 3.3.2. The presence of
more oil on the second land with the decrease of engine loads may result in an increase of
the oil transport along the piston into the cylinder via different paths. More oil may flow
to the top ring groove and from there to the top land. The oil could also be transported
through the top ring gap with the reverse gas flow from the second land, when the second
land pressure becomes greater than the cylinder pressure. The variation of engine load
also has a considerable influence on this transport mechanism, because it determines both
cylinder and land pressures.
The volumetric reverse gas flow rates from the second land through the top ring gap
were predicted using RINGPACK-OC for different steady state engine load conditions at
3500 rpm. Figure 4-39 shows the results for the gas flows through the top ring gap
during one engine cycle. The positive flow direction is defined as the flow from the top
145
land to the second land and thus negative gas flow rates indicate phases of the engine
cycle when gases flow from the second land to the top land.
There exist two periods during the engine cycle when gases may flow from the
second land to the top land due to negative pressure gradients across the top ring. The
cylinder pressure may become smaller than the second land pressure during the intake
stroke and during the late part of expansion and early exhaust strokes. Decreasing engine
load causes an increase of the reverse gas flow through the top ring gap during the intake
stroke due to the lower cylinder pressures. In addition, decreasing engine load also
increases the crank angle period during which gases flow into the cylinder due to the
pressure difference across the top ring. The reverse flow during late expansion and early
exhaust stroke is less prominent and the impact of engine load is small. Therefore, it can
be concluded that the overall reverse gas flow rate through the top ring gap increases as
engine load is decreased.
4.E-05
C)10 Load~.
50 %Load--
0% Load
0
-360 0 360
CA [deg]
Figure 4-39 Reverse gas flow through top ring gap at different engine load
In [46] a one-dimensional model was proposed for the average oil flow through ring
gaps (details of this model are described in Section 3.3.2.2) and the following expression
was suggested:
3* *2Q oi = Q Gas * Gas 2 Oil (4
Qil OhGas
146
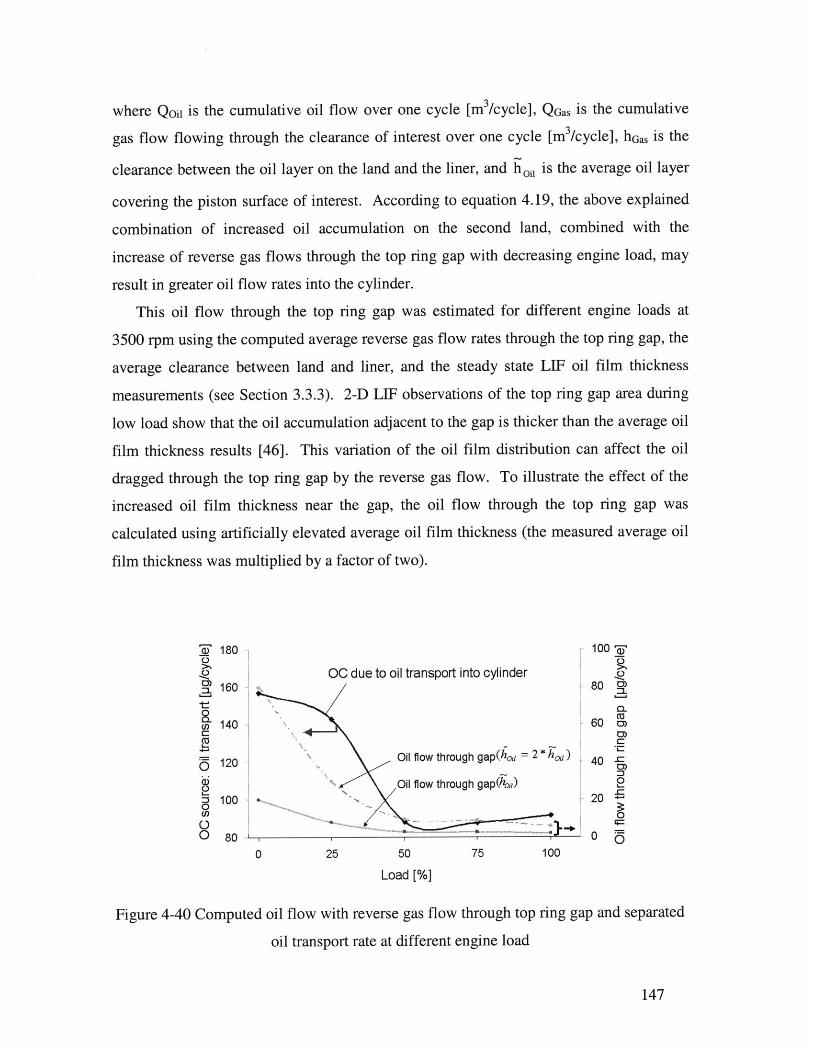
where Qoai is the cumulative oil flow over one cycle [m 3/cycle], QGas is the cumulative
gas flow flowing through the clearance of interest over one cycle [m 3/cycle], hGas is the
clearance between the oil layer on the land and the liner, and hOil is the average oil layer
covering the piston surface of interest. According to equation 4.19, the above explained
combination of increased oil accumulation on the second land, combined with the
increase of reverse gas flows through the top ring gap with decreasing engine load, may
result in greater oil flow rates into the cylinder.
This oil flow through the top ring gap was estimated for different engine loads at
3500 rpm using the computed average reverse gas flow rates through the top ring gap, the
average clearance between land and liner, and the steady state LIF oil film thickness
measurements (see Section 3.3.3). 2-D LIF observations of the top ring gap area during
low load show that the oil accumulation adjacent to the gap is thicker than the average oil
film thickness results [46]. This variation of the oil film distribution can affect the oil
dragged through the top ring gap by the reverse gas flow. To illustrate the effect of the
increased oil film thickness near the gap, the oil flow through the top ring gap was
calculated using artificially elevated average oil film thickness (the measured average oil
film thickness was multiplied by a factor of two).
a180 100-
OC due to oil transport into cylindera 160 80 0
co 140 60 d)
120 Oi Iflow through gap(hoi= 2 * hc) 40 0
Oil flow through gap(Ea)100 20
0
0 80 00 25 50 75 100
Load [%I
Figure 4-40 Computed oil flow with reverse gas flow through top ring gap and separated
oil transport rate at different engine load
147
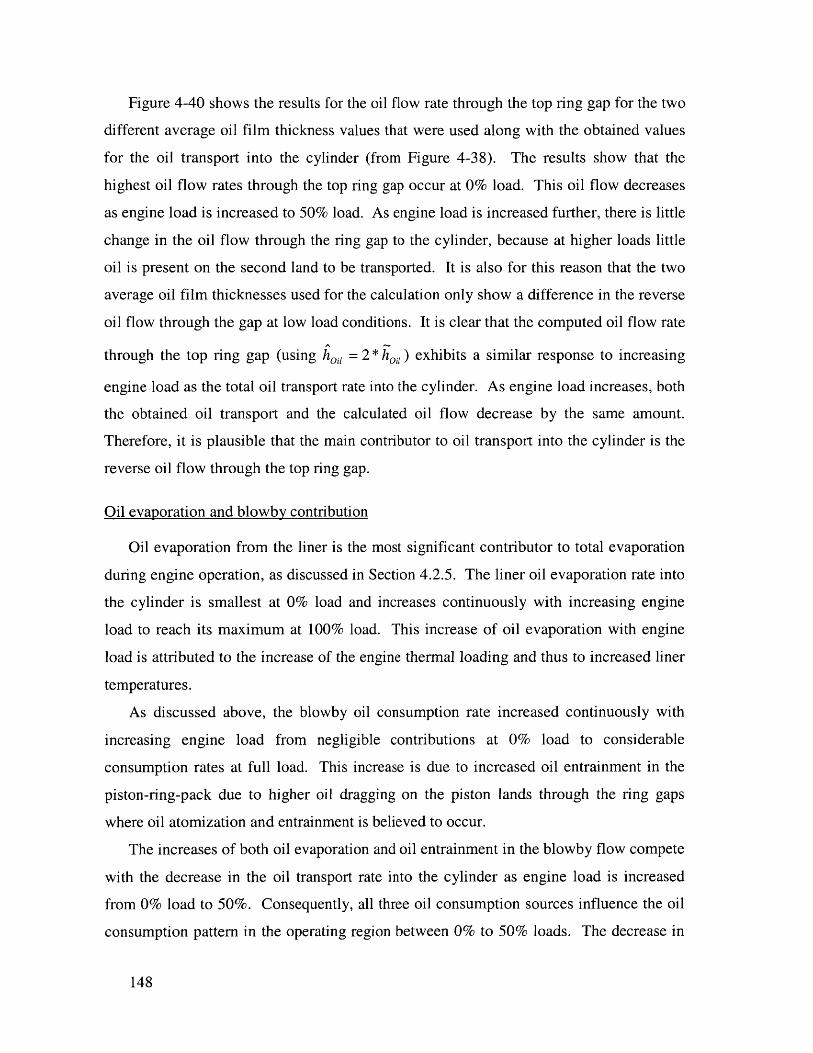
Figure 4-40 shows the results for the oil flow rate through the top ring gap for the two
different average oil film thickness values that were used along with the obtained values
for the oil transport into the cylinder (from Figure 4-38). The results show that the
highest oil flow rates through the top ring gap occur at 0% load. This oil flow decreases
as engine load is increased to 50% load. As engine load is increased further, there is little
change in the oil flow through the ring gap to the cylinder, because at higher loads little
oil is present on the second land to be transported. It is also for this reason that the two
average oil film thicknesses used for the calculation only show a difference in the reverse
oil flow through the gap at low load conditions. It is clear that the computed oil flow rate
through the top ring gap (using hIi = 2* hOj ) exhibits a similar response to increasing
engine load as the total oil transport rate into the cylinder. As engine load increases, both
the obtained oil transport and the calculated oil flow decrease by the same amount.
Therefore, it is plausible that the main contributor to oil transport into the cylinder is the
reverse oil flow through the top ring gap.
Oil evaporation and blowby contribution
Oil evaporation from the liner is the most significant contributor to total evaporation
during engine operation, as discussed in Section 4.2.5. The liner oil evaporation rate into
the cylinder is smallest at 0% load and increases continuously with increasing engine
load to reach its maximum at 100% load. This increase of oil evaporation with engine
load is attributed to the increase of the engine thermal loading and thus to increased liner
temperatures.
As discussed above, the blowby oil consumption rate increased continuously with
increasing engine load from negligible contributions at 0% load to considerable
consumption rates at full load. This increase is due to increased oil entrainment in the
piston-ring-pack due to higher oil dragging on the piston lands through the ring gaps
where oil atomization and entrainment is believed to occur.
The increases of both oil evaporation and oil entrainment in the blowby flow compete
with the decrease in the oil transport rate into the cylinder as engine load is increased
from 0% load to 50%. Consequently, all three oil consumption sources influence the oil
consumption pattern in the operating region between 0% to 50% loads. The decrease in
148
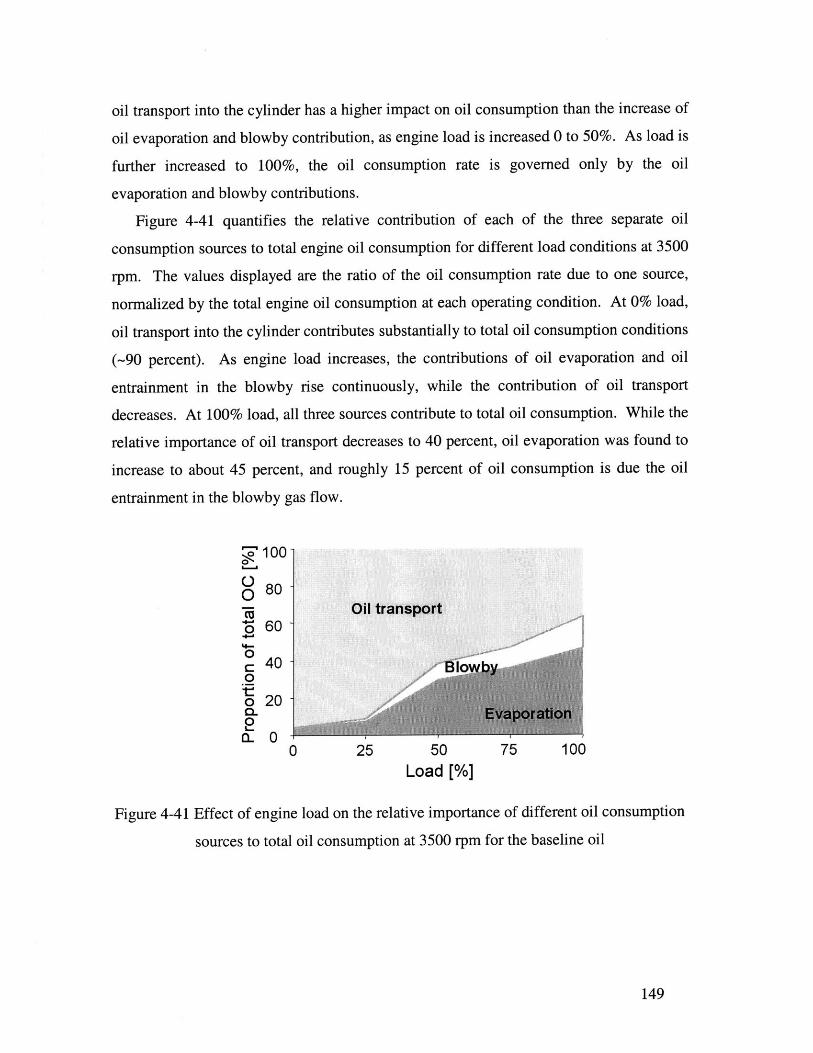
oil transport into the cylinder has a higher impact on oil consumption than the increase of
oil evaporation and blowby contribution, as engine load is increased 0 to 50%. As load is
further increased to 100%, the oil consumption rate is governed only by the oil
evaporation and blowby contributions.
Figure 4-41 quantifies the relative contribution of each of the three separate oil
consumption sources to total engine oil consumption for different load conditions at 3500
rpm. The values displayed are the ratio of the oil consumption rate due to one source,
normalized by the total engine oil consumption at each operating condition. At 0% load,
oil transport into the cylinder contributes substantially to total oil consumption conditions
(-90 percent). As engine load increases, the contributions of oil evaporation and oil
entrainment in the blowby rise continuously, while the contribution of oil transport
decreases. At 100% load, all three sources contribute to total oil consumption. While the
relative importance of oil transport decreases to 40 percent, oil evaporation was found to
increase to about 45 percent, and roughly 15 percent of oil consumption is due the oil
entrainment in the blowby gas flow.
100
0o80-j Oil transportc60
00o20CL
a-0
0 25 50 75 100Load [%]
Figure 4-41 Effect of engine load on the relative importance of different oil consumption
sources to total oil consumption at 3500 rpm for the baseline oil
149
4.3.3 Variation of the Oil Consumption Sources with Engine Speed
The influence of engine speed on the different oil consumption sources was studied at
3 different speeds and 100% load. Figure 4-42 shows the oil consumption rates of each
source during one engine cycle along with total engine oil consumption. Changing
engine speed affects all three oil consumption sources. Oil entrainment, oil evaporation,
and oil transport all increase as engine speed is increased from 2500 to 4200 rpm.
Consequently, all three oil consumption sources contribute to the increase of total oil
consumption with increasing engine speed.
' 600
SOC> Total oil consumption
400C01 300 Oil transportE3 200
Evaporation8 100
02000 2500 3000 3500 4000 4500
Speed [rpm]
Figure 4-42 Effect of engine speed on different oil consumption sources and on total oil
consumption at 100% load for the baseline oil.
The variation of engine speed affects three different mechanisms that control oil
transport and distribution in the piston-ring-liner system and therefore the oil
consumption sources:
* Increasing engine speed results in a decrease in the average blowby gas flow
rate per cycle, and thus a decrease in interfacial shear stresses that drive the oil
layer on the piston surface. Therefore, the removal of oil from the piston to
the crankcase decreases with increasing speed.
150
* Increasing engine speed causes higher inertial forces acting on the oil volume
that is accumulated on the piston due to the alternating motion of the piston.
The increase of inertia is expected to increase oil flow in the axial direction to
the upper piston regions. However, at high load conditions (as is the case
here), inertial oil transport is believed to be important only in regions on the
piston with significant oil accumulation, such as on the third land. This region
is in particularly important because the oil has only a short distance to travel
to reach the second ring groove.
" Increasing engine speed also increases the thermal loading on the engine.
Higher piston temperatures reduce the oil viscosity, and therefore may change
the oil transport along the piston. Moreover, higher liner temperatures will
increase oil evaporation.
With the increase of engine speed, more oil accumulation is expected in the upper
piston regions due to the decrease of blowby and the increase of inertial oil transport on
the piston. Therefore, the increase of oil consumption due to oil transport with engine
speed could be attributed to higher oil accumulation on the upper piston regions. It is
believed that increased oil accumulation in the region between the second land and top
ring groove (region (c) in Figure 1-2) may result in more oil flowing through the top ring
groove and gap into the cylinder.
As speed is increased, more oil must be entrained in the blowby because the average
blowby gas flow per cycle decreases, but blowby oil consumption increases. As
described in Section 4.1.1, oil entrainment in the blowby could be enhanced either in the
piston-ring-pack due to high velocity gas flows through the ring gaps and/or in the
crankcase.
Oil evaporation is mainly governed by engine liner temperature, mass transport in the
gas phase, and the available time for evaporation. Increases in engine speed increase
evaporation due to the enhancement of the mass transport in the gas phase and due to the
increased liner temperatures. The available time for evaporation decreases per cycle as
engine speed increases, which competes with the two above effects. Since the
contribution of oil evaporation increases with engine speed, the effect of higher liner
151
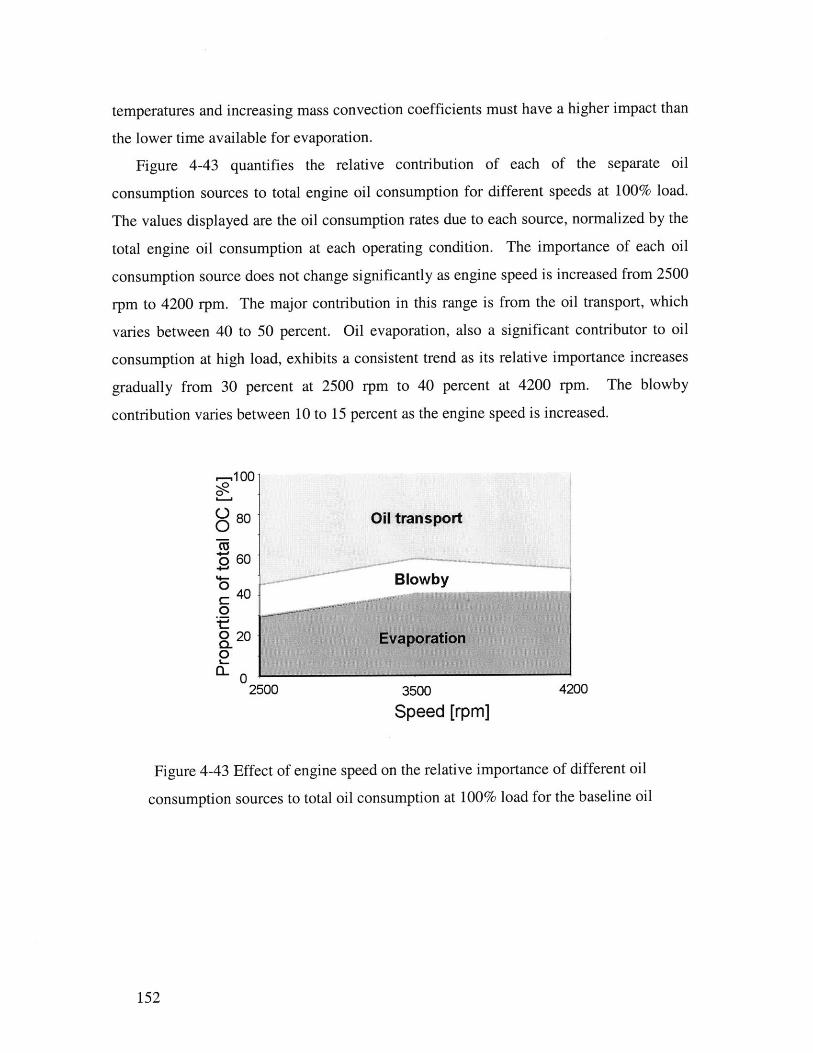
temperatures and increasing mass convection coefficients must have a higher impact than
the lower time available for evaporation.
Figure 4-43 quantifies the relative contribution of each of the separate oil
consumption sources to total engine oil consumption for different speeds at 100% load.
The values displayed are the oil consumption rates due to each source, normalized by the
total engine oil consumption at each operating condition. The importance of each oil
consumption source does not change significantly as engine speed is increased from 2500
rpm to 4200 rpm. The major contribution in this range is from the oil transport, which
varies between 40 to 50 percent. Oil evaporation, also a significant contributor to oil
consumption at high load, exhibits a consistent trend as its relative importance increases
gradually from 30 percent at 2500 rpm to 40 percent at 4200 rpm. The blowby
contribution varies between 10 to 15 percent as the engine speed is increased.
.-.1000
o 80 Oil transport0-FU
o60Blowby
S40
0 20 Evaporation0
2500 3500 4200
Speed [rpm]
Figure 4-43 Effect of engine speed on the relative importance of different oil
consumption sources to total oil consumption at 100% load for the baseline oil
152
4.3.4 Summary of the Contribution of Different Sources to Oil Consumption
This is the first attempt to separate and analyze the relative importance of three major
oil consumption sources to the total oil consumption of a spark ignition engine at
different steady state engine operating conditions. Engine test data and modeling results
were combined to quantify the contribution oil evaporation, oil entrained in the blowby
gas flow, and oil flow through piston and valve guide into the combustion chamber. The
results show that the contribution of each oil consumption source varies with engine
speed and load.
The impact of engine load on oil consumption and its sources show several important
characteristics. The consumption due to the oil transport through the piston into the
cylinder evinced two trends. At 0 to 50% load, oil transport was found to increase with
reduction in engine load that may be related to the decrease of blowby flow and the
associated increase of oil accumulation on the upper piston regions. Above 50% load, the
oil consumption due to oil transport through the piston and valve guide was found to vary
little with engine load. The oil evaporation rate and blowby oil consumption rate
increase with increasing engine load. Also the relative importance of these oil
consumption sources varied with engine load. At low load, oil transport through the
piston was found to be the major consumption source (- 90 percent), while the
contribution of oil evaporation and blowby oil consumption becomes more prominent
with increasing engine load.
The increase of engine speed from 2500 to 4200 rpm at 100% load increased all three
oil consumption sources. The relative importance of each source varies little in this range.
The major contribution is from the oil transport (40 to 50 percent) and from oil
evaporation (30 to 40 percent). The importance of blowby oil consumption varies
between 10 to 15 percent.
153
(This page was intentionally left blank)
154
Chapter 5 Conclusions
In this work, important oil consumption characteristics and oil consumption sources
in a production spark ignition engine were analyzed and quantified for different engine
operating conditions.
On a 2 liter, four-cylinder production spark ignition engine, a comprehensive
diagnostic system was implemented to measure engine oil consumption and in-cylinder
parameters that affect major oil transport mechanisms and oil consumption sources. A
sulfur-based oil consumption method was used to measure real-time oil consumption. A
blowby flow meter was used to measure the leakage gas flow past the piston-ring-liner
system. Several additional measurement probes were implemented to gain information
on the in-cylinder parameters. The one-point Laser Induced Fluorescence (LIF)
technique was used to study the oil distribution in the piston-ring-pack. Two pressure
transducers were positioned along the cylinder liner to measure inter-ring land pressures.
An additional pressure transducer mounted on the cylinder head provided cylinder
pressure traces. Two temperature probes along the cylinder liner provided liner
temperatures.
Total engine oil consumption, blowby, and in-cylinder parameters affecting oil
transport were measured at different engine operating conditions. Steady state oil
consumption and blowby measurements exhibited typical trends for spark ignition
engines. Oil consumption increased with increasing engine speed, and load and blowby
(per cycle) increased with engine load and decreased with speed.
Engine oil consumption behavior during ramp transients in load was analyzed by
combining oil consumption measurements, in-cylinder measurements, and modeling tools.
Increased oil consumption was observed during transients from low load to full load.
The analysis revealed that high oil accumulation in the top ring groove was the main
source of the additional oil consumed during the transient. At low load, the oil transport
to the upper piston regions was enhanced due to low blowby flow rates into the crankcase.
As a result, more oil accumulated on the piston and in the top ring groove. After the
155
transient to full load, the oil in the top ring groove was transported toward the combustion
chamber with the reverse gas flow through the top ring groove due to top ring flutter.
The relative importance of different oil consumption sources, and their dependence
on engine operating conditions was systematically analyzed.
The contribution of oil entrained in the blowby gas flow to total oil consumption was
quantified at several steady state engine load and speed conditions. Blowby contribution
to total oil consumption was found to increase with engine load. An insignificant amount
of oil was consumed due to blowby at low load but this contribution reached significant
levels at high load conditions
Oil evaporation from the liner was subsequently characterized. Analysis of the
evaporation process demonstrated that the gas side convection process limits the oil
evaporation from the cylinder liner. A multi-species liner evaporation model was
developed and verified by testing two oils with different volatility at varying cylinder
liner temperatures and steady state engine speed and load conditions. The results show
that total engine oil consumption is substantially affected by liner evaporation. Liner
evaporation, however, was found to be sensitive to liner temperatures, oil composition,
and oil transport to regions of high evaporation. High evaporation rates combined with
insufficient oil supply (generally in the region above the top dead center position of the
oil control ring) can alter the local oil composition on the liner, and thus the evaporation
rate. Therefore, the temperature distribution on the liner, local oil composition, oil
supply to the regions of high evaporation, and the convection of the oil vapor from the
gas side of the liquid-vapor interface all govern the amount of oil that is evaporated.
Finally, the relative importance of three major oil consumption sources to the total oil
consumption was analyzed. Engine test data and modeling results were combined to
quantify the contribution of oil evaporation, oil entrained in the blowby gas flow, and oil
flow through various pathways into the combustion chamber.
The relative importance of these oil consumption sources varied with engine load. At
low load, oil transport past the piston system was found to be the major consumption
source (90%), while the contribution of oil evaporation and blowby oil consumption
became more significant with increasing engine load.
156
The variation of engine speed (2500 to 4200 rpm) at full load increased the
contribution of all three oil consumption sources. However, the relative importance of
each source did not vary significantly with engine speed. The major contributions were
from the oil transport (40 to 50 percent) and oil evaporation (30 to 40 percent). The
importance of blowby oil consumption varied between 10 to 15 percent.
This work is an important step in advancing the understanding of oil consumption in
spark ignition engines. It connects oil consumption data and comprehensive in-cylinder
measurements with advanced modeling. The obtained oil consumption characteristics
and trends for the oil consumption sources at different operating conditions can provide
important guidelines for developing analytical tools to predict oil consumption in spark
ignition engines.
157
(This page was intentionally left blank)
158
References
[1] Hill, S., H., Sytsma, S., J.: "A Systems Approach to Oil Consumption", SAE paper910743, 1991.
[2] Heywood, J. B., Internal Combustion Engine Fundamentals, McGraw-Hill, 1988.
[3] Mayer, W. J., Lechman, D. C., and Hilden, D. L.: "The Contribution of Engine Oilto Diesel Exhaust Particulate Emissions," SAE paper 800256, 1980.
[4] Lepperhoff, G., and Schommers, J.: "Einfluss des Schmierils auf die PAH-Emissionen von Verbrennungsmotoren," Motorentechnische Zeitschrift (MTZ)Vol. 47, 1986.
[5] Drury, C., and Withehouse, S.: "The Effect of Lubricant Phosphorus Level onExhaust Emissions in a Field Trial of Gasoline Engine Vehicles," SAE paper940233, 1994.
[6] Ueda, F., Sugiyama, S., Arimura, K., Hamaguchi, S., and Akiyama, K.: "Engineadditive Effects on Deactivation of Monolithic Three-Way Catalysts and OxygenSensors," SAE paper 940746, 1994.
[7] Froelund, K.: " Real-Time Steady-State Measurement of PCV-Contribution to OilConsumption on Ford 4.6 L SI-Engine", SAE paper 2000-01-2876, 2000.
[8] Maassen, F., "New Approaches to Crankcase Ventilation and Oil Separation -Design of Oil Separators for Crankcase Ventilation Systems", FEVMotorentechnik, 1997.
[9] Busen, J., Klein, M., and Pietschner S.: "KurbelgehauseentliftungEntwicklungspartner Hengst", enclosure to Motorentechnische Zeitschrift (MTZ).
[10] Sauter, H. L., and Trautmann, P.: "Messung und Absheidung vonOlnebelaerosolen aus der Kurbelgehauseentl0ftung von Verbrennungsmotoren.Teil 1: Messung der Tropfengr6Benverteilung und der emittierten Olmenge,"Motorentechnische Zeitschrift (MTZ) Vol. 61, No. 12, pp. 874-878, 2000.
[11] Sauter, H. L., Trautmann, P., and Abendschein, M.: "Messung und Abscheidungvon Olnebelaerosolen aus der Kurbelgehauseentluftung von Verbrennungsmotoren.Teil 2: Konzepte zur Abscheidung von Oltrbpfchen bei derKurbelgehauseentluftung," Motorentechnische Zeitschrift (MTZ) Vol. 62, No. 1,pp. 80-83, 2001.
[12] Wentworth, J.: "Effect of Top Compression Ring Profile on Oil Consumption andBlowby with the Sealed Ring-Orifice Design," SAE paper 820089, 1982.
[13] Fesser, R.: "Small Engine Piston Ring Design for Reduced Oil Consumption,"SAE paper 881327, 1988.
159
[14] Jakobs, R. J., and Westbrooke, K.: " Aspects of Influencing Oil Consumption inDiesel Engines for Low Emissions," SAE paper 900587, 1990.
[15] Yoshida, H., Kusama, K., and Kobayashi, H.: "Diesel Engine Oil ConsumptionDepending on Piston Ring Design," SAE paper 911699, 1991.
[16] Mihara, K, and Inoue, H.: "Effect of Piston Top Ring Design on OilConsumption," SAE paper 950937,1995.
[17] Hill, S. H., Troy, C. K., Brown, J. R., and Hamelink, J. C.: "An ExperimentalStudy of the Effect of Cylinder Bore Finish on Engine Oil Consumption," SAEpaper 950938, 1995.
[18] Hegemeier, T., and Stewart, M.: "Some Effects of Liner Finish on Diesel EngineOperating Characteristics," SAE paper 930716, 1993.
[19] Hill, S. H.: "Cylinder Bore Finish and their Effect on Oil Consumption," SAEpaper 2001-01-3550, 2001.
[20] Schneider, E.W., Blossfeld, D.H., Lechman, D.C., Hill, R., Reising, R., andBrevick, J. E.: "Effect of Cylinder Bore Out-of Roundness on Piston RingRotation and Engine Oil Consumption," SAE paper 930796, 1993.
[21] Hitosugi, H., Nagoshi, K., Komada, M., and Furuhama, S.: "Study on Mechanismof Lubricating Oil Consumption Caused by Cylinder bore Deformation," SAEpaper 960305, 1996.
[22] Furuhama, S., Hiruma, M., and Yoshida, H.: "An Increase of Engine OilConsumption at High Temperature of Piston and Cylinder", SAE paper 810976,1981.
[23] Orrin, D. S., and Coles, B. W.: "Effects of Engine Oil Composition on OilConsumption", SAE paper 710141, 1971.
[24] Stewart, R. M., and Saely, T. W.: "The Relationship between Oil Viscosity EnginePerformance - A Literature Search", SAE paper 770372, 1977.
[25] Furuhama, S., Hiruma, M., and Tsuzita, M.: "Piston Ring Motion and Its Influenceon Engine Tribology," SAE paper 790860, 1979.
[26] Burnett, P.: "Relationship between Oil Consumption, Deposit Formation, andPiston Ring Motion for Single-Cylinder Diesel Engines," SAE paper 920089,1992.
[27] TSI Incorporated, Model 3934 SMPS (Scanning Mobility Particle Sizer)instruction manual, 1996.
[28] Hoult, D. P., Lux, J. P., Wong, V. W., and Billian, S. A.: "Calibration of LaserFluorescence Measurements of Lubricant Film Thickness in Engines", SAE paper881587, 1988.
160
[29] Wong, V. W., and Hoult, D. P.: "Experimental Survey of Lubricant-FilmCharacteristics and Oil Consumption in a Small Diesel Engine", SAE paper910741, 1991.
[30] Hoult, D. P., and Takiguchi, M.: "Calibration of the Laser Fluorescence TechniqueCompared With Quantum Theory," Society of Tribology and-5ubricationEngineers Transactions, Vol. 34, No.3, 440-444, 1991.
[31] Richardson, D. E., and Borman, G. B.: "Using Fiber Optics and LaserFluorescence for Measuring Thin Oil Films with Application to Engines", SAEPaper 912388, 1991.
[32] Tamai, G.: "Experimental Study of Engine Oil Film Thickness Dependence onLiner Location, Oil Properties and Operating Conditions", MS Thesis, Departmentof Mechanical Engineering, MIT, August 1995.
[33] Noordzji, B. L.: "Measurement and Analysis of Piston Inter-Ring pressure and OilFilm Thickness and their Effects on Engine Oil Consumption", MS Thesis,Department of Mechanical Engineering, MIT, June 1996.
[34] Arcoumanis, C., Duszynski, M., Pyke, E., and Preston, H.: "Cold-StartMeasurements of the Lubricant Film Thickness in the Cylinder of a Firing DieselEngine", SAE paper 982436, 1998.
[35] Casey, S.: "Analysis of lubricant Film Thickness and distribution along thePiston/Liner Interface in a Reciprocating Engine," MS Thesis, Department ofMechanical Engineering, MIT, February 1998.
[36] Nakashima, K., Ishihara, S., and Urano, K.: " Influence of Piston Ring Gaps onLubricant Oil Flow into the Combustion Chamber", SAE paper 952546, 1995.
[37] Saito, K., Igashira, T., and Nakada, M.: " Analysis of Oil Consumption byObserving Oil Behavior around Piston Ring Using a Glass Cylinder Engine", SAEpaper 892107, 1989.
[38] Inagaki, H., Saito, A., Murakami, M., and Konomi, T.: "Development of Two-Dimensional Oil Film Thickness Distribution Measuring System", SAE paper952346, 1995.
[39] Thirouard, B., Tian, T., and Hart, D. P.: "Investigation of Oil TransportMechanisms in the Piston Ring Pack of a Single Cylinder Diesel Engine, UsingTwo Dimensional Laser Induced Fluorescence", SAE paper 982658, 1998.
[40] Wahiduzzaman S., Keribar, R., Dursunkaya, Z., and Kelley, F. A.: "A Model forEvaporative Consumption of Lubricating Oil in Reciprocating Engines", SAEpaper 922202, 1992.
[41] De Petris, C., Gigilio, V., and Police, G.: "A Mathematical Model of theEvaporation of the Oil Film Deposed on the Cylinder Surface of IC Engines",SAE paper 972920, 1997.
161
[42] Audette III, W. E., and Wong, V. W.: "A Model for Estimating Oil Vaporizationfrom the Cylinder Liner as a Contributing Mechanism to Engine OilConsumption", SAE paper 1999-01-1520, 1999.
[43] Tian, T.: "Modeling the performance of the Piston Ring-Pack in InternalCombustion Engines," Ph.D. Thesis, Department of Mechanical Engineering, MIT,June 1997.
[44] Tian, T.: "Dynamic behaviours of piston rings and their practical impact. Part1:ring flutter and ring collapse and their effects on gas flow and oil transport",Proc. Instn Mech. Engrs, Vol. 216, Part J, Journal of Engineering Tribology, pp.209-228, 2002.
[45] Tian, T., Wong, V. W., and Heywood, J. B.: "Modeling the Dynamics andLubrication of Three Piece Oil Control Rings in Internal Combustion Engines,"SAE paper 982657, 1998.
[46] Thirouard, B.: "Characterization and Modeling of the Fundamental Aspects of Oiltransport in the Piston-Ring Pack of Internal Combustion Engines," Ph.D. Thesis,Department of Mechanical Engineering, MIT, May 2001.
[47] Bailey, B. K., and Ariga, S.: "On-Line Diesel Engine Oil ConsumptionMeasurement", SAE paper 902113, 1990.
[48] Froelund, K., Menezes, L. A., Johnson, H. R., and Rein, W. 0.: "Real-Timetransient and Steady-State Measurement of Oil Consumption for SeveralProduction SI-Engines", SAE paper 2001-01-1902, 2001.
[49] Inoue, T., Maeda, Y., Masashi, T., and Nakada, M.: "Study of Transient OilConsumption of Automotive Engine", SAE paper 892110, 1989.
[50] Lizumi, S., and Koyama, T.: "Measurement of Oil Consumption of Diesel Engineby S-Trace Method", SAE paper 860545, 1986.
[51] Ariga, S.: "Observation of Transient Oil Consumption with In-Cylinder Variables",SAE paper 961910, 1996.
[52] Carrie, 0., and Maerky, C.: "U-Flex as an Oil Control Ring for New GenerationEngines", Motorentechnische Zeitschrift (MTZ) Vol. 60, No. 4, pp. 570-575, 1999.
[53] Yilmaz, E., Thirouard, B., Tian, T., Wong, V. W., Heywood, J. B., and Lee, N.:"Analysis of Oil Consumption Behavior during Ramp Transients in a ProductionSpark Ignition Engine", SAE paper 2001-01-3544, 2001.
[54] Tian, T., Wong, W. V., Heywood, J. B., and Rabute, R.: "Effects of Piston-RingDynamics on Ring/Groove Wear and Oil Consumption in a Diesel Engine", SAEpaper 970835, 1997.
162
[55] Tian, T.: "Dynamic behaviours of piston rings and their practical impact. Part 2:oil transport, friction and wear of ring/liner interface and the effects of piston andring dynamics", Proc. Instn Mech. Engrs, Vol. 216, Part J, Journal of EngineeringTribology, pp. 229-247, 2002.
[56] Thompson, M., and Saville, S. B.: " The Use of Top Ring Zone oil Sampling andAnalysis to Investigate Oil Consumption Mechanisms," I. Mech. E. Conference,"Automotive Power Systems - Environmental Conservation", Paper No.C394/041, Chester 1990.
[57] Mills, A. F., Heat and Mass Transfer, Richard D. Irwin, 1995.
[58] Kayes, D.: "Particulate Matter Formation in Spark Ignition Engines," Ph.D. Thesis,Department of Mechanical Engineering, MIT, January 1999.
[59] Didot, F. E., Green, E., and Johnson, R. H.: "Volatility and Oil Consumption ofSAE 5W-30 Engine Oil", SAE paper 872126, 1987.
[60] Carey, L. C., Roberts, D. C., and Schaub, H.: "Factors Influencing OilConsumption in Today's Automotive Engines", SAE paper 892159, 1989.
[61] Manni, M., and Ciocco, G.: "An Experimental Study of Oil Consumption inGasoline Engines", SAE paper 922374, 1992.
[62] Mahle, Mini Piston Manual, Mahle GmbH, D-70369 Stuttgart, 1995
[63] Woschni, G., and Fieger, J.: " Experimentelle Bestimmung des 6rtlich gemitteltenWarmetbergangskoeffizienten im Ottomotor", Motorentechnische Zeitschrift(MTZ) Vol. 42, No.6, pp. 229-234, 1981.
[64] Poulos, S. G., and Heywood, J. B.: "The Effect of Chamber Geometry on SparkIgnition Engine Combustions", SAE paper 830334, 1983.
[65] Woschni, G., and Zeilinger, K.: "Vorausberechnung des Kolbenringverhaltens",FVV Workshop, Tribosystem Kolben-Kolbenring-Zylinderlaufflache, 10. Oktober,VDMA-Haus Frankfurt, 1989.
[66] Reid, R. C., Prausnitz, J. M., and Sherwood, T. K., The Properties of Gases andLiquids, 3 d Ed., McGraw-Hill, 1977.
[67] Zwolinski, B. J., Wilhoit, R. C., Handbook of Vapor Pressures and Heats ofVaporization of Hydrocarbons and Related Compounds, College Station:Thermodynamics Research Center, Dept. of Chemistry, Texas A & M University,1971.
[68] Tian, T., Wong, V. W., and Heywood, J. B.: "A Piston Ring-Pack Film Thicknessand Friction Model for Multigrade Oils and Rough Surfaces", SAE paper 962032,1996.
[69] Norris, G.M., and Hochgreb S.: "Novel Experiment on In-Cylinder Desorption ofFuel from the Oil Layer", SAE paper 941963, 1994.
163

(This page was intentionally left blank)
164

Appendices
Appendix A LIF window surface profiles
The surface characteristics of the liner with the windows were measured with stylus
instrument (Taylor Hubson Form Talysurf profiler) at ambient conditions. The unfiltered
primary surface profile measurements along the cylinder liner are shown in Figures A-1
to A-4.
2.53
0-
Liner Window Liner
gm
Epoxy
-25.99-Traversing length 6.8 mm
Figure A-1 LIF Window 2 and its adjacent liner
Liner Window Liner3.8
pm
Epoxy:
-17.6Traversing length 7.5 mm
Figure A-1 LIF Window 2 and its adjacent liner
165

5.230
Liner Window Liner
9mEpoxy
-66.167.728 a
Figure A-3 LIF Window 3 and its adjacent liner
Liner Window
PUoxy
Traversing length 10.9 mm -|
Figure A-4 LIF Window 4 and its adjacent liner
166
3.7
0-
gm
- 13.9
I
ILiner
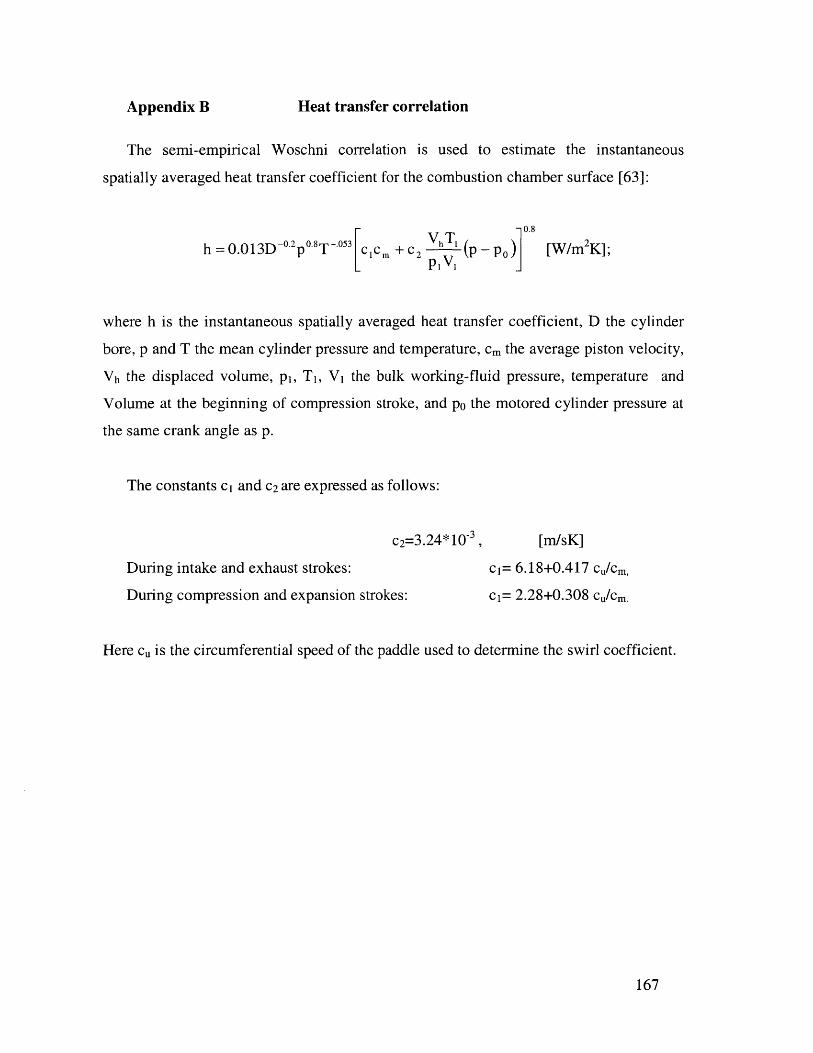
Heat transfer correlation
The semi-empirical Woschni correlation is used to estimate the instantaneous
spatially averaged heat transfer coefficient for the combustion chamber surface [63]:
c 'p - 0.8
h = 0.013D -O 2p"sT -.053 e CI M + C 2 h I V p - PO )][W/m2 K];
where h is the instantaneous spatially averaged heat transfer coefficient, D the cylinder
bore, p and T the mean cylinder pressure and temperature, cm the average piston velocity,
Vh the displaced volume, pi, T1, V, the bulk working-fluid pressure, temperature and
Volume at the beginning of compression stroke, and po the motored cylinder pressure at
the same crank angle as p.
The constants ci and c2 are expressed as follows:
c2=3.24*10-3,
During intake and exhaust strokes:
During compression and expansion strokes:
[m/sK]
c1= 6.18+0.417 cu/cm,
c1= 2.28+0.308 cu/cm.
Here cu is the circumferential speed of the paddle used to determine the swirl coefficient.
167
Appendix B


![arXiv:1810.01459v1 [astro-ph.EP] 2 Oct 2018](https://static.fdokumen.com/doc/165x107/6321558baa6c954bc7073632/arxiv181001459v1-astro-phep-2-oct-2018.jpg)

