Thermal Stability of Phosphorylated Cellulose Modified With Various Transition Metals
34
Journal of Analytical and Applied Pyrot$is, 9 (1986) 173-206 Elsevier Science Publishers B.V., Amsterdam - Printed in The Netherlands 173 THERMAL STABILITY OF PHOSPHORYLATED CELLULOSE MODIFIED WITH VARIOUS TRANSITION METALS BALJINDER KAUR, RAJESH K. JAIN, IS. GUR and HARI L. BHATNAGAR * Department of Chemistry, Kurukshetra University, Kurukshetra 132 I19 (India) HANS-ROLF SCHULTEN Department of Trace Analysis, Fachhochschule Fresenius, Dambachtal 20, 6200 Wiesbaden (F.R.G.) (Received May 29th, 1985; accepted September 18th, 1985) SUMMARY Complexes of cellulose phosphate with transition metals such as chromium, manganese, iron, cobalt, nickel, copper, zinc, zirconium, molybdenum, silver, cadmium and mercury have been characterized by reflectance UV-visible spectra. The thermal behaviour of cellulose and the metal complexes of cellulose phosphate in air has been studied by differential thermal analysis and thermogravimetry from ambient temperature to 75O’C. From the resulting data, various thermodynamic parameters for different stages of thermal degradation can be obtained following the method of Broido. The activation energies for decomposition of cellulose and metal complexes of cellulose phosphate were found to be in the range 168-238 kJ mol-‘. Pyrolysis-mass spectrometric studies of metal complexes of cellulose phosphate using soft ionization modes such as field ionization and field desorption give very low abundances of volatile products in the spectra compared with the yields with untreated cellulose. The IR and reflectance UV-visible spectra of the pyrolysis residues of metal complexes of cellulose phosphate indicate that dehydration takes place and the metal complexes are stable up to 250°C. At higher temperatures, a compound containing carbonyl groups is formed. A mechanism for the thermal degradation of metal complexes of cellulose phosphate is proposed which explains the generation of reduced amounts of smoke. Scanning electron microscopic studies of cellulose phosphate and its transition metal complexes showed that the fibrillar sites have mostly reacted and throw light on the morphological changes of treated cellulose in the thermal degradation range. The observed effects are of interest with respect to the flame-proofing of cellulose. INTRODUCTION The effects of fire retardants on both smoke generation and the toxicity of the combustion products have become of special importance, as fire-retar- 0165-2370/86/$03.50 0 1986 Elsevier Science Publishers B.V.
-
Upload
jainhospitals -
Category
Documents
-
view
3 -
download
0
Transcript of Thermal Stability of Phosphorylated Cellulose Modified With Various Transition Metals
Journal of Analytical and Applied Pyrot$is, 9 (1986) 173-206 Elsevier Science Publishers B.V., Amsterdam - Printed in The Netherlands
173
THERMAL STABILITY OF PHOSPHORYLATED CELLULOSE MODIFIED WITH VARIOUS TRANSITION METALS
BALJINDER KAUR, RAJESH K. JAIN, IS. GUR and HARI L. BHATNAGAR *
Department of Chemistry, Kurukshetra University, Kurukshetra 132 I19 (India)
HANS-ROLF SCHULTEN
Department of Trace Analysis, Fachhochschule Fresenius, Dambachtal 20, 6200 Wiesbaden (F.R.G.)
(Received May 29th, 1985; accepted September 18th, 1985)
SUMMARY
Complexes of cellulose phosphate with transition metals such as chromium, manganese, iron, cobalt, nickel, copper, zinc, zirconium, molybdenum, silver, cadmium and mercury have been characterized by reflectance UV-visible spectra. The thermal behaviour of cellulose and the metal complexes of cellulose phosphate in air has been studied by differential thermal analysis and thermogravimetry from ambient temperature to 75O’C. From the resulting data, various thermodynamic parameters for different stages of thermal degradation can be obtained following the method of Broido. The activation energies for decomposition of cellulose and metal complexes of cellulose phosphate were found to be in the range 168-238 kJ mol-‘.
Pyrolysis-mass spectrometric studies of metal complexes of cellulose phosphate using soft ionization modes such as field ionization and field desorption give very low abundances of volatile products in the spectra compared with the yields with untreated cellulose. The IR and reflectance UV-visible spectra of the pyrolysis residues of metal complexes of cellulose phosphate indicate that dehydration takes place and the metal complexes are stable up to 250°C. At higher temperatures, a compound containing carbonyl groups is formed. A mechanism for the thermal degradation of metal complexes of cellulose phosphate is proposed which explains the generation of reduced amounts of smoke.
Scanning electron microscopic studies of cellulose phosphate and its transition metal complexes showed that the fibrillar sites have mostly reacted and throw light on the morphological changes of treated cellulose in the thermal degradation range. The observed effects are of interest with respect to the flame-proofing of cellulose.
INTRODUCTION
The effects of fire retardants on both smoke generation and the toxicity of the combustion products have become of special importance, as fire-retar-
0165-2370/86/$03.50 0 1986 Elsevier Science Publishers B.V.
174
dant compositions have been reported to produce denser smoke than un- treated compositions [1,2]. The most successful method of smoke control to date is the use of heavy metal compounds, e.g., of iron or molybdenum, in the form of additives [3,4]. However, the additive fire retardants have only limited utility as they are not launder-proof.
In this work, metal ions were made to react chemically with cellulosic materials rendered flame-proof in an attempt to control smoke generation and toxicity.
Flame retardancy is believed to result from the presence of elements such as phosphorus, halogens or nitrogen in the retardants. Phosphorus com- pounds strongly affect pyrolysis and char formation, whereas the halogens considerably influence polymer breakdown and combustion. Nitrogen in combination with phosphorus and halogens has a synergistic effect. In these studies, coordinate complexes of cellulose phosphate with various transition metal ions were prepared and their thermal properties investigated. The kinetics of the thermal degradation of metal complexes of cellulose phos- phate and thermally degraded products were studied from ambient tempera- ture to 750°C using thermal analysis and soft ionization mass spectrometry. The spectroscopic techniques were employed with a view to evaluating their efficiency as flame-proofing materials. In addition, the morphology of the metal complexes of cellulose phosphate was studied in the thermal degrada- tion range by scanning electron microscopy.
EXPERIMENTAL
The following samples of cellulose, cellulose phosphate and its metal complexes were selected for study: (i) cellulose powder (Schleicher and Schiill, Dassel, F.R.G.) dried to a constant weight in vacua at 60°C; (ii) cellulose phosphate prepared [5] by treating cellulose with phosphorus oxychloride in pyridine at 95°C for 6 h and dried in vacua over phosphorus pentoxide; (iii-xiv) Cr(III), Mn(II), Fe(II), Co(II), Ni(II), Cu(II), Zn(II), Zr(IV), Mo(VI), Ag(I), Cd(I1) and Hg(I1) complexes of cellulose phosphate, respectively. Samples iii-xiv were prepared by treating 2.0 g of cellulose phosphate in each instance with 5% aqueous solutions of Cr,(SO,), - xH,O, MnSO, * H,O, FeSO, - 7H,O, CoSO, - H,O, NiSO, .6H,O, CuSO, - 5H,O, ZnSO, + 7H,O, ZrOCl, .8H,O, (NH,),Mo,O,, .4H,O, AgNO,, CdCl, . 2.5H,O or HgCl, at room temperature for 72 h with constant stirring. Each product was filtered, washed repeatedly with warm water until the filtrate was free from metal salt and finally dried in vacua over phosphorus pentoxide.
For the scanning electron microscopic studies, samples iii-ix were also prepared by taking cotton fibres instead of cellulose powder and following the same sequence of reactions as described above.
175
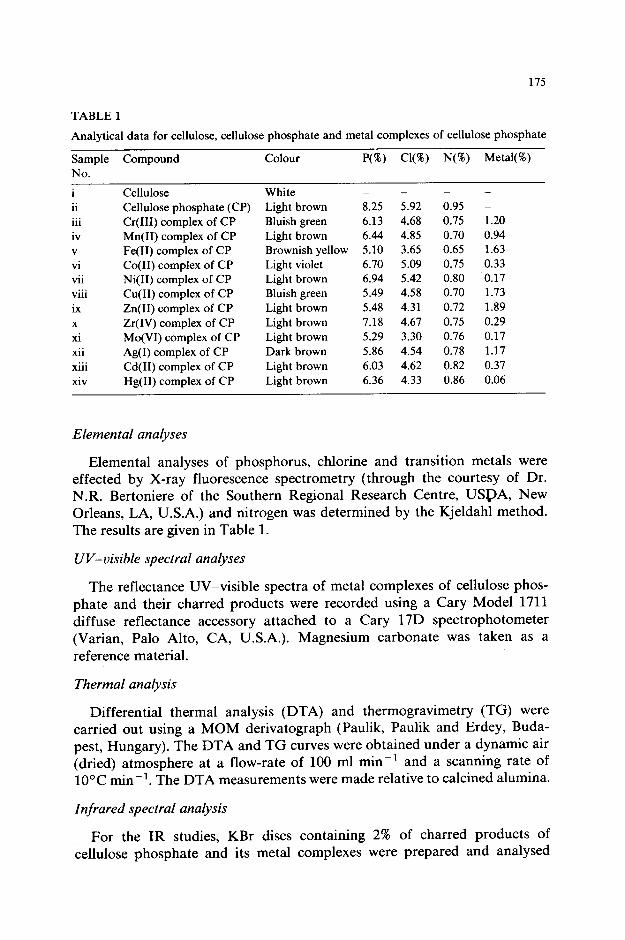
TABLE 1
Analytical data for cellulose, cellulose phosphate and metal complexes of cellulose phosphate
Sample Compound Colour P(W) Cl(%) N(%) Metal(S) No.
i ii
. 111
iv V
Vi
vii .
Vlll
ix X
xi xii
. . . x111
xiv
Cellulose White Cellulose phosphate (CP) Cr(III) complex of CP Mn(II) complex of CP Fe(H) complex of CP Co( II) complex of CP Ni(II) complex of CP Cu(II) complex of CP Zn(II) complex of CP Zr(IV) complex of CP Mo(V1) complex of CP A&I) complex of CP Cd(H) complex of CP Hg(II) complex of CP
Light brown Bluish green Light brown Brownish yellow Light violet Light brown Bluish green Light brown Light brown Light brown Dark brown Light brown Light brown
_ - _ -
8.25 5.92 0.95 - 6.13 4.68 0.75 1.20 6.44 4.85 0.70 0.94 5.10 3.65 0.65 1.63 6.70 5.09 0.75 0.33 6.94 5.42 0.80 ‘0.17 5.49 4.58 0.70 1.73 5.48 4.31 0.72 1.89 7.18 4.67 0.75 0.29 5.29 3.30 0.76 0.17 5.86 4.54 0.78 1.17 6.03 4.62 0.82 0.37 6.36 4.33 0.86 0.06
Elemental analyses
Elemental analyses of phosphorus, chlorine and transition metals were effected by X-ray fluorescence spectrometry (through the courtesy of Dr. N.R. Bertoniere of the Southern Regional Research Centre, USDA, New Orleans, LA, U.S.A.) and nitrogen was determined by the Kjeldahl method. The results are given in Table 1.
WV-visible spectral analyses
The reflectance UV-visible spectra of metal complexes of cellulose phos- phate and their charred products were recorded using a Cary Model 1711 diffuse reflectance accessory attached to a Cary 17D spectrophotometer (Varian, Palo Alto, CA, U.S.A.). Magnesium carbonate was taken as a reference material.
Thermal analysis
Differential thermal analysis (DTA) and thermogravimetry (TG) were carried out using a MOM derivatograph (Paulik, Paulik and Erdey, Buda- pest, Hungary). The DTA and TG curves were obtained under a dynamic air (dried) atmosphere at a flow-rate of 100 ml min-’ and a scanning rate of 10°C mm’. The DTA measurements were made relative to calcined alumina.
Infrared spectral analysis
For the IR studies, KBr discs containing 2% of charred products of cellulose phosphate and its metal complexes were prepared and analysed

176
using a Beckman IR-20 spectrophotometer. The charred samples were pre- pared by heating the compounds in a DTA cell. Heating was stopped at the desired temperature and the residues were allowed to cool and quickly transferred into a stoppered sample container.
Pyrolysis-mass spectrometry
Pyrolysis field ionization mass spectrometry (FIMS) and field desorption mass spectrometry (FDMS) of cellulose, cellulose phosphate and its metal complexes were recorded. The principle, method and important features of this technique have been discussed elsewhere [6-S]. In the FI work we used the conventional direct probe and programmed heating up to 500°C at 1 “C/s to volatilize the sample. For FD, high-temperature activated tungsten wire emitters were used as the means of sample introduction and volatiliza- tion, allowing immediate ionization in the high electric field on the surface of the emitter. In general, 50 mass spectra were accumulated and integrated to give a representative survey spectrum.
Scanning electron microscopy
Scanning electron microscopy (SEM) observations were made using Philips (Eindhoven, The Netherlands) PSEM-500 operated at 20 kV and 20 PA emission current with a specimen position tilt of 3?.5” and at a pressure of about 10e5 mmHg. Samples for SEM were mounted on metal stubs with adhesive tape and were sputtered with gold.
Characterization of the samples
Cellulose, on reaction with phosphorus oxychloride [9], forms predomi- nantly cellulose phosphate and chlorodeoxycellulose. Owing to the solvent employed, the pyridinium complex is also formed in very small amounts [9] (N < 1%).
It has been shown already that various metal ions can form complexes with cellulose phosphate [lo]. A general reaction between cellulose phos- phate and bivalent metals for the formation of complexes can be written as follows:
0
Cell -o-F-OH. Ali
+ 2H’
177
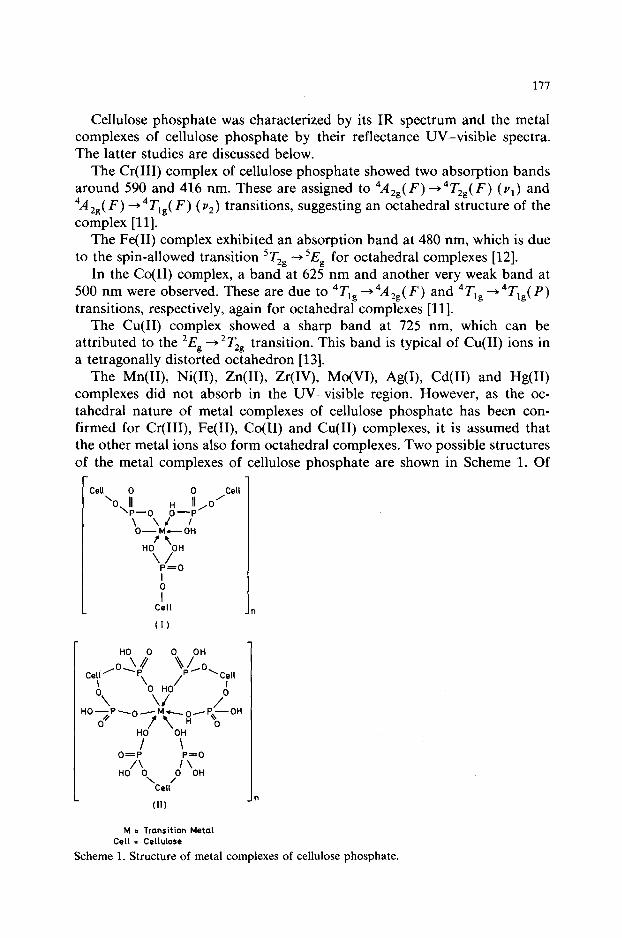
Cellulose phosphate was characterized by its IR spectrum and the metal complexes of cellulose phosphate by their reflectance UV-visible spectra. The latter studies are discussed below.
The Cr(II1) complex of cellulose phosphate showed two absorption bands around 590 and 416 nm. These are assigned to 4A2,( F) +47”& F) (Y,) and 4A 29( F) --) 4r,,( F) ( v2) transitions, suggesting an octahedral structure of the complex [ll].
The Fe(I1) complex exhibited an absorption band at 480 nm, which is due to the spin-allowed transition 5T2g + ‘Eg for octahedral complexes [12].
In the Co(I1) complex, a band at 625 nm and another very weak band at 500 nm were observed. These are due to 4Tlg +4A2g( F) and 4Tlg -+4Tlg( P) transitions, respectively, again for octahedral complexes [ll].
The Cu(I1) complex showed a sharp band at 725 nm, which can be attributed to the ‘Eg --) ‘TIg transition. This band is typical of Cu(I1) ions in a tetragonally distorted octahedron [13].
The Mn(II), Ni(II), Zn(II), Zr(IV), Mo(VI), Ag(I), Cd(I1) and Hg(I1) complexes did not absorb in the UV-visible region. However, as the oc- tahedral nature of metal complexes of cellulose phosphate has been con- firmed for Cr(III), Fe(II), Co(I1) and Cu(I1) complexes, it is assumed that the other metal ions also form octahedral complexes. Two possible structures of the metal complexes of cellulose phosphate are shown in Scheme 1. Of
r Cdl
‘0 1 0 Cdl
‘p-0 II 0’
OH--P’
'0 A.lL dti
HOP ‘OH \/
P=O
b I
Cell
I \ o=p p=o
HO”0 d ‘OH \
WI’
M E Transition Metal Cell = Cellulose
Scheme 1. Structure of metal complexes of cellulose phosphate.
178
these structures, structure I is the more probable; structure II, being a large-membered ring, would be less stable.
RESULTS AND DISCUSSION
Thermal analysis
Thermal degradation of cellulose proceeds essentially through two types of reaction. At lower temperatures, i.e., below 300°C there is a gradual degradation which involves dehydration, rearrangement, formation of carboxyl and carbonyl groups, evolution of carbon dioxide and carbon monoxide and formation of carbonaceous char [14]. At higher temperatures, rapid volatilization accompanied by the formation of intractable tars and carbonaceous residue occurs. The major product in the tar is laevoglucosan
TEMPERATURE , ‘C
100 200 300 LOO 500 600 700
7
1001 100 200 300 100 500 600 700
_ TEMPERATURE, l C
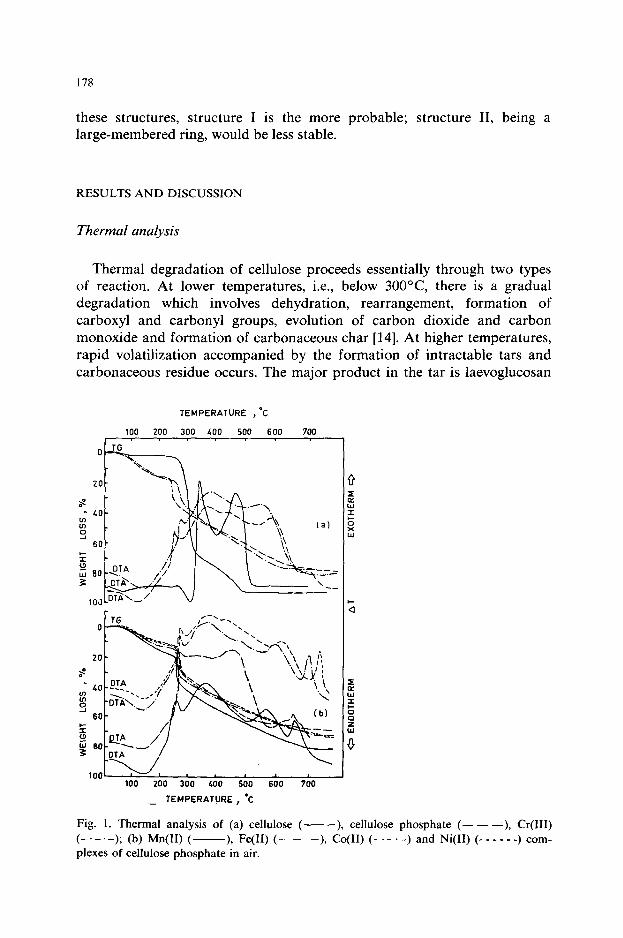
Fig. 1. Thermal analysis of (a) cellulose ( -), cellulose phosphate (- - -), Cr(II1)
(-.-.-); (b) Mn(I1) (- ), Fe(I1) (- - -), Co(I1) (-.-.-) and Ni(I1) (- - - - - -) com- plexes of cellulose phosphate in air.
179
(1,6-anhydro-P-D-glucopyranose), which may be obtained in yields of 40% or more together with polymeric materials, which are similar to the con- densation products of laevoglucosan and apparently randomly linked oligo- saccharides [15]. Laevoglucosan formation plays an important role in the flammability of cellulosics. The main role of flame retardants is to minimize its formation by lowering the decomposition temperature of cellulose and enhancing char formation by catalysing the dehydration and decomposition reactions [16].
The DTA and TG curves of (i) cellulose, (ii) cellulose phosphate, (iii) Cr(III), (iv) Mn(II), (v) Fe(II), (vi) Co(II), (vii) Ni(II), (viii) Cu(II), (ix) Zn(II), (x) Zr(IV), (xi) Mo(VI), (xii) Ag(I), (xiii) Cd(I1) and (xiv) Hg(I1) complexes of cellulose phosphate were obtained in a dynamic air medium, and are shown in Figs. 1 and 2. The peak temperatures for various endo- therms and exotherms of DTA for all the compounds investigated are given in Table 2.
The DTA curve of cellulose (Fig. la) shows a small endotherm below 100°C due to the evolution of sorbed moisture, followed by an exotherm and an endotherm (maxima at 274 and 314°C) due to the decomposition of cellulose, leading to the formation and evaporation of volatile products. This is followed by an exotherm peaking at 350°C due to oxidation of the volatile products and finally an exotherm with a maximum at 468OC, which repre- sents oxidation of the charred product. In comparison, the DTA curve of phosphorylated cellulose is completely different from that of pure cellulose.
During the phosphorylation of cellulose, chlorodeoxycellulose is formed, together with cellulose phosphate. Therefore, chlorine plays an important role in altering the course of thermal degradation. It has been shown by Shafizadeh et al. [17] that in the thermal decomposition of 6-chlorodeoxycel- lulose, the initial reaction begins with dehydrohalogenation around 200°C and the released hydrogen chloride then catalyses a series of heterolytic reactions. As in this work only cellulose phosphate forms complexes with transition metal ions, and chlorodeoxycellulose does not participate in complex formation, stress is put only on the thermal properties of cellulose phosphate and its metal complexes. However, the mechanism of degradation due to substituted chlorine remains the same in all the samples.
In cellulose phosphate, a large endotherm peaking at 131°C appears, which represents dephosphorylation, dehydrohalogenation and dehydration. This is followed by an exotherm with a maximum at 261”C, which represents decomposition processes leading to char formation. Subsequently there are three exotherms with maxima at 380, 596 and 702°C. The first two exo- therms correspond to the oxidation of char, being due to aliphatic and aromatic components of the char, respectively. The phosphoric acid released in the first step may polymerize to polyphosphate, which affects the decom- position process. The last exotherm is probably due to decomposition of this polyphosphate.

180
TABLE 2
Peak temperatures in the differential thermal analysis curves for cellulose, cellulose phosphate and metal complexes of cellulose phosphate in air
Sample Compound No.
DTA curve Nature of
Initiation Peak Termination the peak
temperature maxima temperature
(“C) (“C) (“C)
i Cellulose
ii Cellulose phosphate (CP)
. 111 Cr(II1) complex of CP
iv ~ntI1) complex of CP
V Fe(H) complex of CP
vi Co(I1) complex of CP
vii Ni(II) complex of CP
. . . VIII Cu( II) complex of CP
260 274 280 Exo (small)
280 314 325 Endo (large)
325 350 405 Exo (large)
405 468 520 Exo (large)
230 276 523 676
131 200 Endo (large) 261 276 Exo (large)
380 510 Exo (large)
596 676 Exo (large)
702 768 Exo (large)
232 292 508
142 200 Endo (large)
280 292 Exo (large)
382 508 Exo (large)
535 690 Exo (large)
- 140 205 Endo (large)
224 260 284 Exo (large)
284 369 505 Exo (large)
505 570 634 Exo (large)
634 660 770 Exo (large)
230 40.5 618
138 203 Endo (large)
283 305 Exo (large)
457 582 Exo (large)
656 700 Exo (large)
248 296 5.58 678
142 194 Endo (large)
278 296 Exo (large)
375 493 Exo (iarge) 600 678 Exo (large) 710 776 Exo (large)
- 140 208 Endo (large) 240 274 290 Exo (large) 290 375 510 Exo (large)
560 615 705 Exo (large) 705 736 766 Exo (large)
- 148 213 Endo (large) 228 268 276 Exo (large) 216 345 376 Exo (large) 376 425 552 Exo (large) 590 624 707 Exo (large)
181
TABLE 2 (continued)
Sample Compound No. -
DTA curve
Initiation Peak
Nature of
Termination the peak
temperature maxima temperature
(“C) (“C) (“C)
ix
X
xi
xii
. x111
xiv
Zn(II) complex of CP - 132 207
236 272 290
290 365 505
505 558 634
634 654 770
Zr(IV) complex of CP - 128 202
240 274 288
288 366 502
502 530 604
680 726 782
Mo(V1) complex of CP - 126 195
238 272 288
288 375 494
494 577 685
Ag(I) complex of CP - 130 198
234 258 278
278 376 470
470 552 650
650 674 760
Cd(I1) complex of CP - 126 193
236 272 289
289 367 489
489 575 655
682 700 760
Hg(I1) complex of CP - 132 192
237 272 287
287 365 490
490 590 662
662 706 772
Endo (large) Exo (large) Exo (large) Exo (large) Exo (large)
Endo (large) Exo (large) Exo (large) Exo (large) Exo (large)
Endo (large) Exo (large) Exo (large) Exo (large)
Endo (large) Exo (large) Exo (large) Exo (large) Exo (large)
Endo (large) Exo (large) Exo (large) Exo (large) Exo (large)
Endo (large) Exo (large) Exo (large) Exo (large) Exo (large)
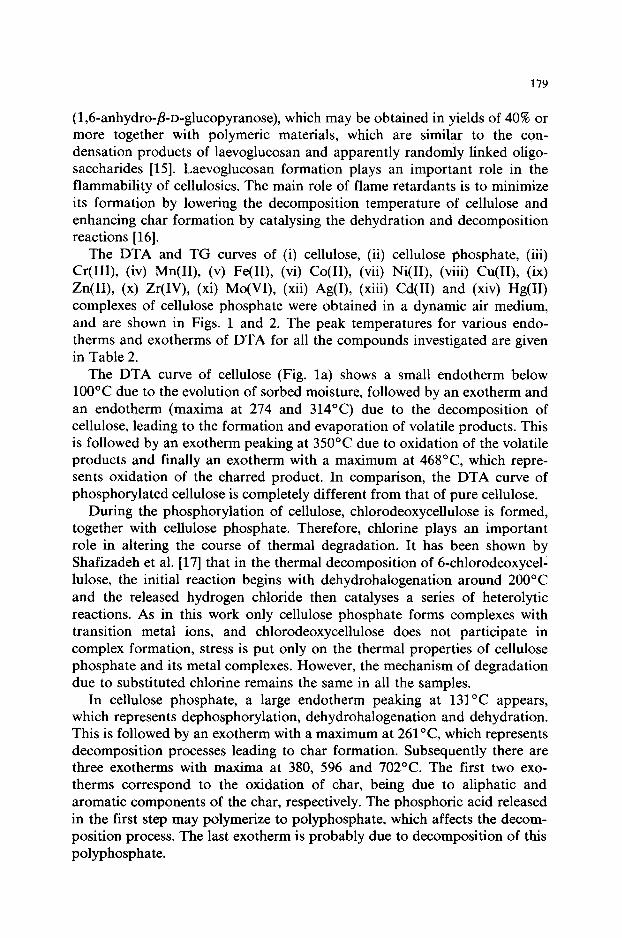
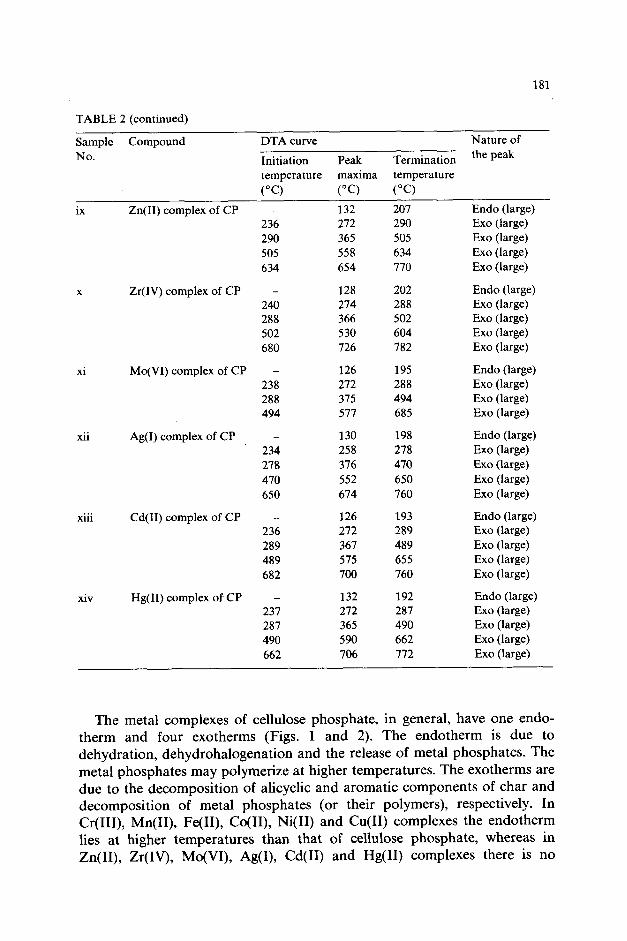
The metal complexes of cellulose phosphate, in general, have one endo- therm and four exotherms (Figs. 1 and 2). The endotherm is due to dehydration, dehydrohalogenation and the release of metal phosphates. The metal phosphates may polymerize at higher temperatures. The exotherms are due to the decomposition of alicyclic and aromatic components of char and decomposition of metal phosphates (or their polymers), respectively. In Cr(III), Mn(II), Fe(II), Co(II), Ni(I1) and Cu(I1) complexes the endotherm lies at higher temperatures than that of cellulose phosphate, whereas in Zn(II), Zr(IV), Mo(VI), Ag(I), Cd(I1) and Hg(I1) complexes there is no
182
TEMPERATURE . l C
100 200 300 LOO i.00 600 700
100 200 300 400 500 600 700 TEMPERATURE ;C
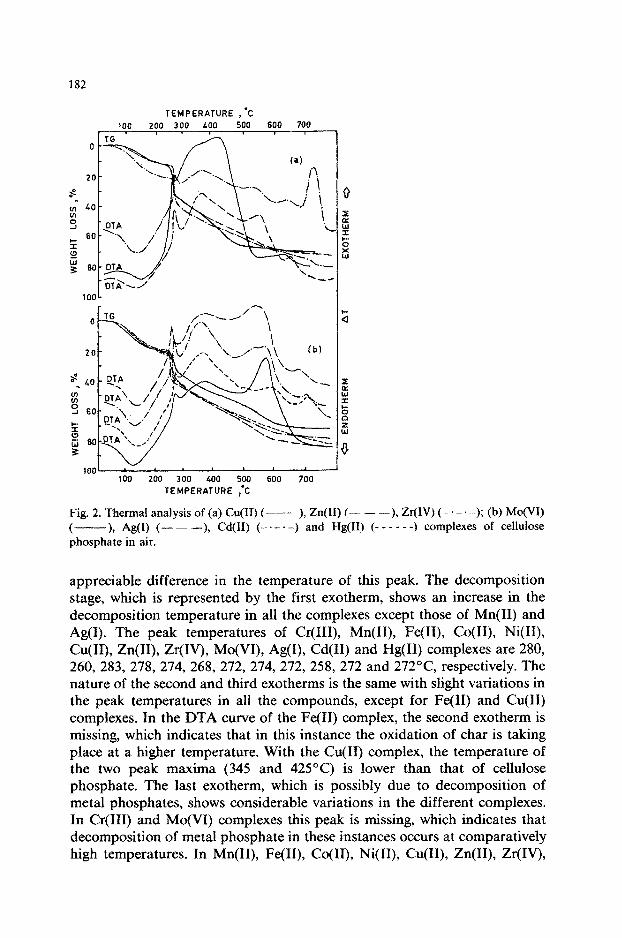
Fig. 2. Thermal analysis of (a) Cu(I1) ( -), Zn(I1) (- - -), Zr(IV) (- .-. -); (b) Mo(V1)
( -), Ag(I) (-- - -), Cd(I1) (---+--) and Hg(I1) (- - - - - -) complexes of cellulose phosphate in air.
appreciable difference in the temperature of this peak. The decomposition stage, which is represented by the first exotherm, shows an increase in the decomposition temperature in all the complexes except those of Mn(I1) and Ag(1). The peak temperatures of Cr(fII), Mn(II), Fe(II), Co(II), Ni(II), Cu(II), Zn(II), Zr(IV), Mo(VI), Ag(I), Cd(I1) and Hg(I1) complexes are 280, 260, 283, 278, 274, 268, 272, 274, 272, 258, 272 and 272OC, respectively. The nature of the second and third exotherms is the same with slight variations in the peak temperatures in all the compounds, except for Fe(I1) and Cu(I1) complexes. In the l3TA curve of the Fe(I1) complex, the second exotherm is missing, which indicates that in this instance the oxidation of char is taking place at a higher temperature. With the Cu(I1) complex, the temperature of the two peak maxima (345 and 425OC) is lower than that of cellulose phosphate. The last exotherm, which is possibly due to decomposition of metal phosphates, shows considerable variations in the different complexes. In Cr(II1) and Mo(V1) complexes this peak is missing, which indicates that d~omposition of metal phosphate in these instances occurs at comparatively high temperatures. In Mn(II), Fe(II), Co(II), Ni(II), Cu(II), Zn(II), Zr(IV),
183
Ag(I), Cd(I1) and Hg(I1) complexes, the peak temperatures are 660, 656, 710, 736,624, 654,726,674,700 and 706°C respectively.
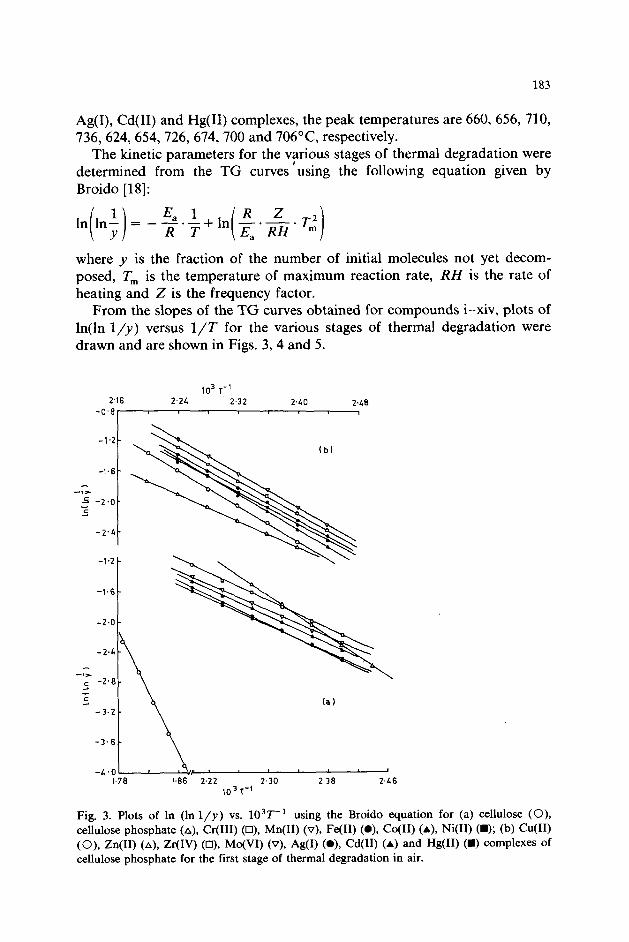
The kinetic parameters for the various stages of thermal degradation were determined from the TG curves ‘using the following equation given by Broido [18]:
where y is the fraction of the number of initial molecules not yet decom- posed, T, is the temperature of maximum reaction rate, RH is the rate of heating and 2 is the frequency factor.
From the slopes of the TG curves obtained for compounds i-xiv, plots of ln(ln l/y) versus l/T for the various stages of thermal degradation were drawn and are shown in Figs. 3,4 and 5.
10" T-’
2.16 2.24 2.32 2,LO 240 -0.81
(b)
(a)
1
2.30 2.38 2.46
103T-'
Fig. 3. Plots of In (In l/y) vs. lO’T_’ using the Broido equation for (a) cellulose (0), cellulose phosphate (A), Cr(II1) (O), Mn(II) (v), Fe(H) (O), Co(H) (A), Ni(I1) (W); (b) Cu(I1) (0), Zn(II) (A), Zr(IV) (Cl), Mo(VI) (v), Ag(1) (O), Cd(H) (A) and Hg(I1) (m) complexes of cellulose phosphate for the first stage of thermal degradation in air.
184
lO’T-’
1.66 1.72 1.76 P60 1.6L 1.68 1.92 1.96 0.L
-1.6
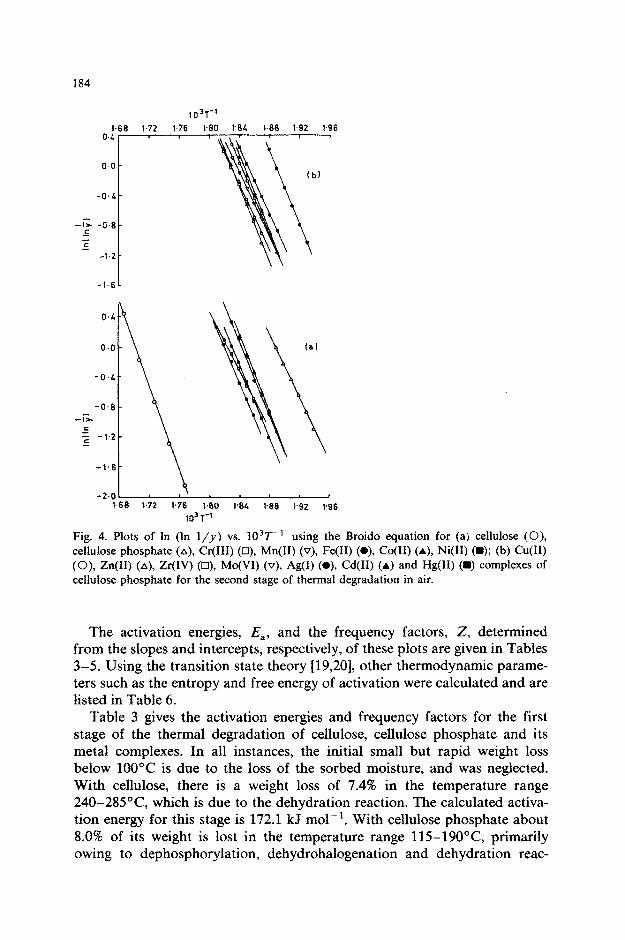
Fig. 4. Plots of In (In l/y) vs. 103T-’ using the Broido equation for (a) cellulose (0), cellulose phosphate (A), Cr(III) (O), Mn(II) (v), Fe@) (a), Co(U) (A), Ni(I1) (B); (b) Cu(I1) (0), Zn(II) (A), Zr(IV) (Cl), MO(W) (v), Ag(I) (o), Cd(H) (A) and Hg(I1) (II) complexes of cellulose phosphate for the second stage of thermal degradation in air.
The activation energies, E,, and the frequency factors, 2, determined from the slopes and intercepts, respectively, of these plots are given in Tables 3-5. Using the transition state theory [19,20], other thermodynamic parame- ters such as the entropy and free energy of activation were calculated and are listed in Table 6.
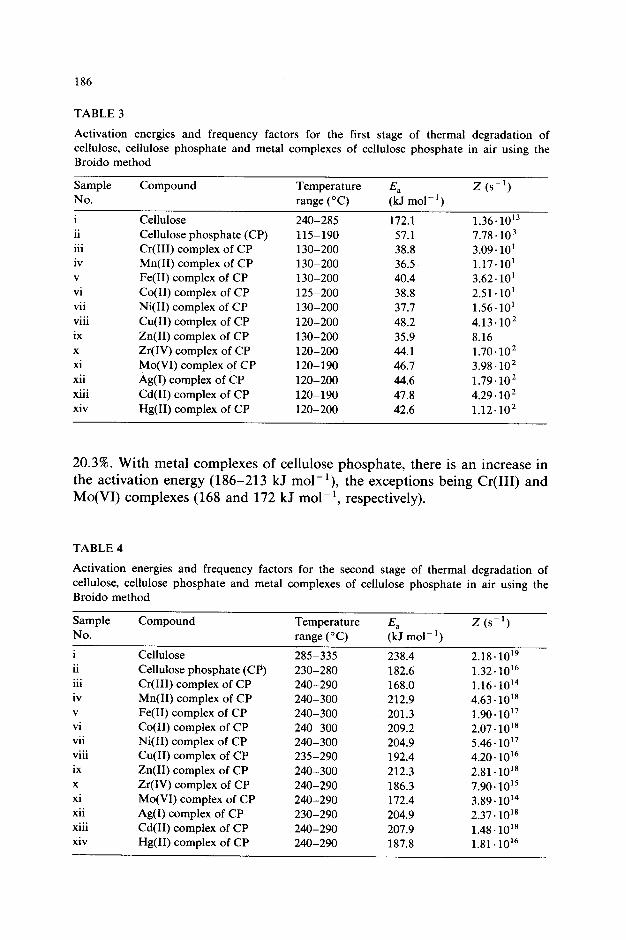
Table 3 gives the activation energies and frequency factors for the first stage of the thermal degradation of cellulose, cellulose phosphate and its metal complexes. In all instances, the initial small but rapid weight loss below 100°C is due to the loss of the sorbed moisture, and was neglected. With cellulose, there is a weight loss of 7.4% in the temperature range 240-285”C, which is due to the dehydration reaction. The calculated activa- tion energy for this stage is 172.1 kJ mol-‘. With cellulose phosphate about 8.0% of its weight is lost in the temperature range 115-190°C, primarily owing to dephosphorylation, dehydrohalogenation and dehydration reac-
185
103T-’
l.OL 1.12 I.20 1.28 1.36 Ph.4 I.52 1.60
“21
0.L -
-O,L-
-aa 5 -1.2-
c
-2,o-
-2.81
-2.8[ 0 I.04 1.12 1.20 1.28 1.36 1.u V52 I.60
lO”T-’
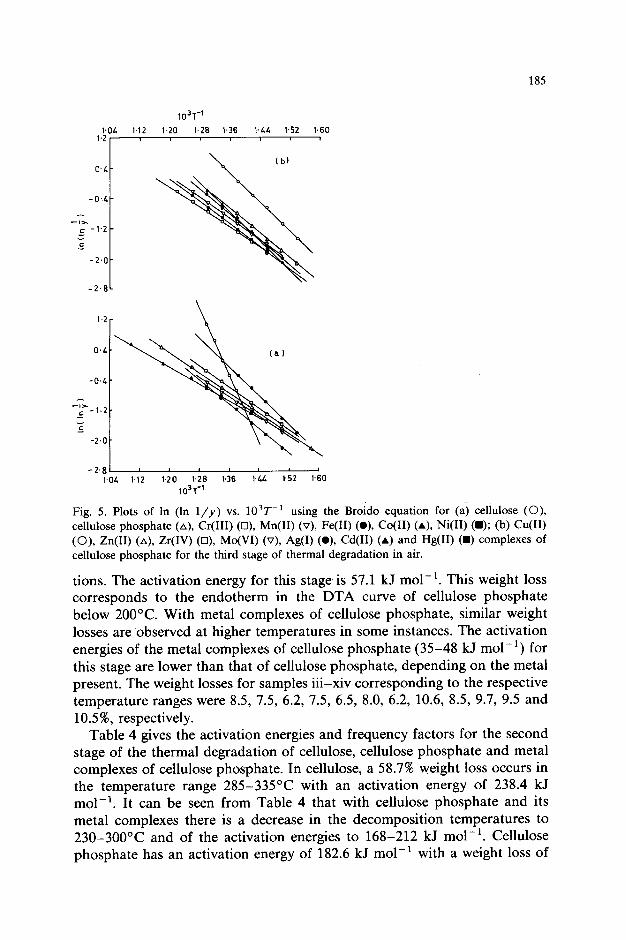
Fig. 5. Plots of In (In l/y) vs. 103T-’ using the Broido equation for (a7 cellulose (0), cellulose phosphate (A), Cr(II1) (Cl), Mn(I1) (v), Fe(I1) (a), Co(I1) (A), Ni(I1) (U); (b) Cu(I1) (0), Zn(I1) (A), Zr(IV) (O), Mo(VI) (v), Ag(I) (O), Cd(I1) (A) and Hg(I1) (m) complexes of cellulose phosphate for the third stage of thermal degradation in air.
tions. The activation energy for this stage is 57.1 kJ mol-‘. This weight loss corresponds to the endotherm in the DTA curve of cellulose phosphate below 2OOOC. With metal complexes of cellulose phosphate, similar weight losses are observed at higher temperatures in some instances. The activation energies of the metal complexes of cellulose phosphate (35-48 kJ mol-‘) for this stage are lower than that of cellulose phosphate, depending on the metal present. The weight losses for samples iii-xiv corresponding to the respective temperature ranges were 8.5, 7.5, 6.2, 7.5, 6.5, 8.0, 6.2, 10.6, 8.5, 9.7, 9.5 and 10.5%, respectively.
Table 4 gives the activation energies and frequency factors for the second stage of the thermal degradation of cellulose, cellulose phosphate and metal complexes of cellulose phosphate. In cellulose, a 58.7% weight loss occurs in the temperature range 285-335°C with an activation energy of 238.4 kJ mol-‘. It can be seen from Table 4 that with cellulose phosphate and its metal complexes there is a decrease in the decomposition temperatures to 230-300°C and of the activation energies to 168-212 kJ mol-‘. Cellulose phosphate has an activation energy of 182.6 kJ mall’ with a weight loss of
186
TABLE 3
Activation energies and frequency factors for the first stage of thermal degradation of cellulose, cellulose phosphate and metal complexes of cellulose phosphate in air using the Broido method
Sample No.
i ii 111
iv V
vi vii
Vlll
ix X
xi xii
. . x111
Xiv
Compound
Cellulose Cellulose phosphate (CP) Cr(III) complex of CP Mn(I1) complex of CP Fe(I1) complex of CP
Co(I1) complex of CP Ni(I1) complex of CP
Cu(I1) complex of CP Zn(I1) complex of CP Zr(IV) complex of CP Mo(V1) complex of CP Ag(I) complex of CP Cd(I1) complex of CP Hg(I1) complex of CP
Temperature E, range (“C) (kJ mol-‘)
240-285 172.1
115-190 57.1
130-200 38.8 130-200 36.5 130-200 40.4
125-200 38.8 130-200 37.7
120-200 48.2
130-200 35.9
120-200 44.1
120-190 46.7
120-200 44.6
120-190 47.8
120-200 42.6
z (SC’)
1.36.1013 7.78. lo3 3.09.10’ 1.17.10’ 3.62.10’ 2.51.10’ 1.56.10’ 4.13. lo2 8.16 1.70.102 3.98.102 1.79.102 4.29. lo2 1.12.102
20.3%. With metal complexes of cellulose phosphate, there is an increase in the activation energy (186-213 kJ mol-‘), the exceptions being Cr(II1) and Mo(V1) complexes (168 and 172 kJ mol-‘, respectively).
TABLE 4
Activation energies and frequency factors for the second stage of thermal degradation of cellulose, cellulose phosphate and metal complexes of cellulose phosphate in air using the Broido method
Sample No.
i ii . . . 111
iv V
vi vii
. . Vlll
ix X
xi xii
. . . x111
xiv
Compound
Cellulose Cellulose phosphate (CP) Cr(II1) complex of CP Mn(I1) complex of CP Fe(I1) complex of CP Co(I1) complex of CP Ni(I1) complex of CP Cu(I1) complex of CP Zn(I1) complex of CP Zr(IV) complex of CP Mo(V1) complex of CP Ag(I) complex of CP Cd(I1) complex of CP Hg(I1) complex of CP
Temperature E, range (“C) (kJ mol-‘)
285-335 238.4
230-280 182.6 240-290 168.0 240-300 212.9 240-300 201.3 240-300 209.2 240-300 204.9 235-290 192.4 240-300 212.3 240-290 186.3 240-290 172.4 230-290 204.9 240-290 207.9 240-290 187.8
z (SC’)
2.18. lOI 1.32. lOI 1.16.1014 4.63.10” 1.90.10’7 2.07.10’* 546.10” 4.20. 1Ou’ 2.81.10” 7.90.10’5 3.89. lOI 2.37.10” 1.48.10’” 1.81. lOI
187
TABLE 5
Activation energies and frequency factors for the third stage of thermal degradation of cellulose, cellulose phosphate and metal complexes of cellulose phosphate in air using the Broido method
Sample Compound Temperature E, z (SC’) No. range (“C)
i ii
. 111
iv V
vi vii Vlll
ix X
xi xii x111
xiv
Cellulose Cellulose phosphate (CP) Cr(II1) complex of CP Mn(I1) complex of CP Fe(I1) complex of CP Co(I1) complex of CP Ni(I1) complex of CP Cu(I1) complex of CP Zn(I1) complex of CP Zr(IV) complex of CP Mo(V1) complex of CP Ag(I) complex of CP Cd(I1) complex of CP Hg(I1) complex of CP
425-500 350-620 390-580 380-600 370-500 380-640 380-550 360-480 360-580 380-560 400-560 380-570 380-590 390-590
(kJ mol-‘)
187.1 56.1 59.2 53.8 81.1 47.7 67.8 80.7 66.8 54.4 58.7 68.4 78.7 60.7
1.03.10” 8.72 1.71 . 10’
4.95 1.46.103 1.55 5.25.10’ 1.93.103 6.42.10’
4.22 1.13.10’ 7.20.10’ 4.78.102 1.40.10’
For samples iii-xiv, weight losses in the second stage are 16.0, 23.0, 20.5, 22.0, 21.2, 22.8, 24.0, 19.5, 15.8, 23.0, 22.5 and 20.0% respectively. The weight loss in this stage corresponds to the first exotherm in the DTA curves.
TABLE 6
Entropies and free energies of activation for the second stage of thermal degradation of cellulose, cellulose phosphate and metal complexes of cellulose phosphate in air
Sample Compound AS* AC* Char yield at
No. (J K-’ mol-‘) (kJ mol-‘) 970 K in at 550 K at 550 K % (w/w)
i Cellulose 111.8 172.2 7.8 ii . . 111
iv V
vi vii
. . . Vlll
ix X
xi xii
. x111
xiv
Cellulose phosphate (CP) 50.3 150.4 23.5 Cr(II1) complex of CP 10.9 157.3 23.2
Mn(I1) complex of CP 99.1 153.9 20.0 Fe(I1) complex of CP 72.5 156.8 31.0 Co(I1) complex of CP 92.3 153.8 28.0
Ni(I1) complex of CP 81.2 155.6 30.8 Cu(I1) complex of CP 59.9 154.9 31.0
Zn(I1) complex of CP 94.8 155.5 30.0 Zr(IV) complex of CP 46.1 156.4 25.0
Mo(V1) complex of CP 21.0 156.3 28.5
Ag(I) complex of CP 93.4 148.9 18.8
Cd(I1) complex of CP 89.5 154.1 23.0
Hg(I1) complex of CP 52.9 154.1 21.0
188
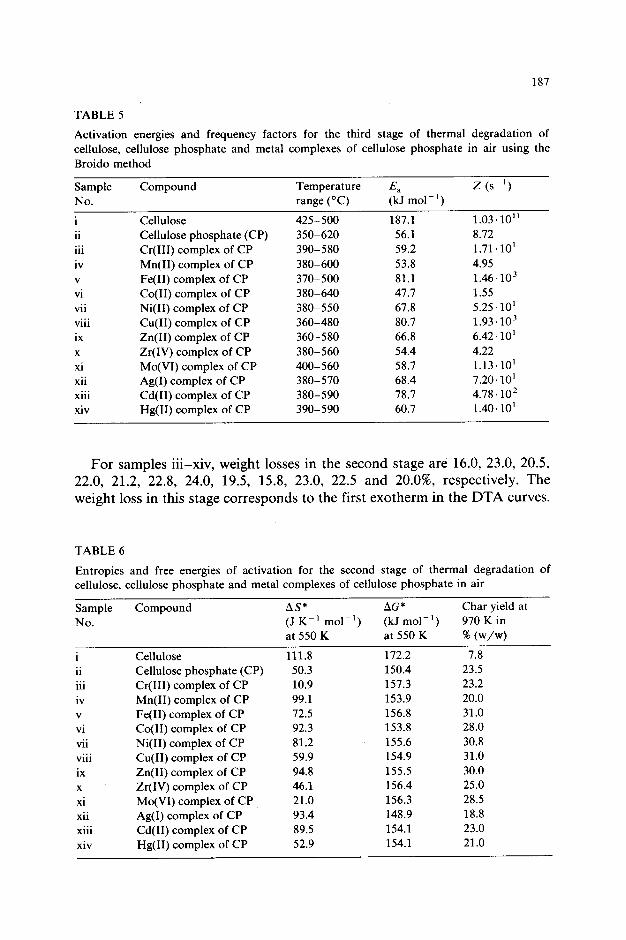
The activation energies and frequency factors for the third stage of thermal degradation, which is due to the oxidation of the charred residue, for various samples are given in Table 5. For cellulose, a 14.2% weight loss occurs in the temperature range 425-500°C with an activation energy of 187.1 kJ mall’. For cellulose phosphate, the activation energy is reduced to 56.1 kJ mol-’ with a weight loss of 27.0% in the temperature range 350-620°C. With the metal complexes, the activation energy and weight loss vary in the ranges 47-82 kJ mol-’ and 15-24%, respectively, depending on the metal present. This stage corresponds to the second and third exotherms of the DTA curves.
The entropies of activation, AS*, and the free energies of activation, AC*, at 550 K for the decomposition (second stage) of cellulose, cellulose phos- phate and metal complexes of cellulose phosphate were calculated and are given in Table 6. Cellulose phosphate and its metal complexes show varia- tions in the entropy of activation, but this variation is compensated for by a change in the enthalpy of activation, leading to almost the same value (149-156 kJ mol-‘) for the free energy of activation. This shows that the basic step involved in the decomposition stage of the thermal degradation of cellulose phosphate and its metal complexes is the same.
The char yields (in wt.%) of samples i-xiv obtained from the TG curves at 970 K are given in Table 6. The char yield of cellulose phosphate (23.5%) is much higher than that of pure cellulose (7.8%). This shows that POCl, is a good flame retardant, as it lowers the decomposition temperature and the activation energy for decomposition, and increases the char yield. With Fe(II), Co(II), Ni(II), Cu(II), Zn(I1) and Mo(V1) complexes, the char yield is higher than that from cellulose phosphate, the respective values being 31.0, 28.0, 30.8, 31.0, 30.0 and 28.5%. It is interesting that the activation energies for the decomposition stage in these instances also increased. The char yields from Cr(III), Mn(II), Zr(IV), Cd(I1) and Hg(I1) complexes are almost the same (20-25%) as that of cellulose phosphate, but with the Ag(1) complex the char yield is lower (18.8%) and this complex is therefore of little importance.
Spectral studies of char
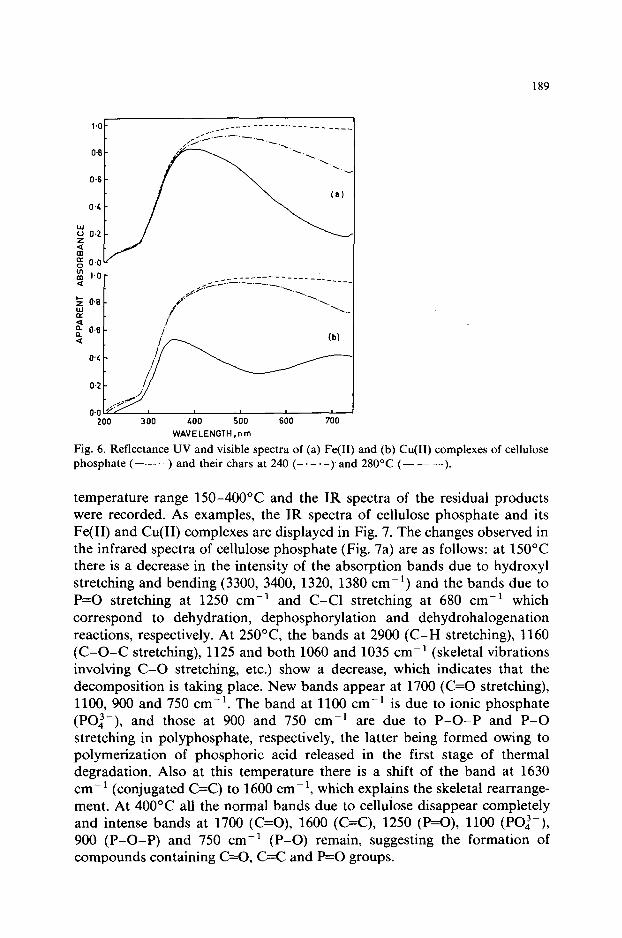
The chars of Fe(I1) and Cu(I1) complexes of cellulose phosphate were obtained by heating each of them at 240 and 280°C. The reflectance UV-visible spectra of the two complexes and their degraded products were recorded and are shown in Fig. 6. The bands at 480 nm in the iron complex (Fig. 6a) and 725 nm in the copper complex (Fig. 6b) disappear on heating to 240°C. At 280°C all the bands disappear completely. This shows that the octahedral complexes decompose around 240°C.
For IR studies of the chars of cellulose phosphate and its metal com- plexes, the compounds were subjected to thermal degradation in air in the
189
WAVELENGTH,nm
Fig. 6. Reflectance UV and visible spectra of (a) Fe(I1) and (b) Cu(II) complexes of cellulose phosphate (- ) and their chars at 240 (- -. -)‘ and 280°C (- - -).
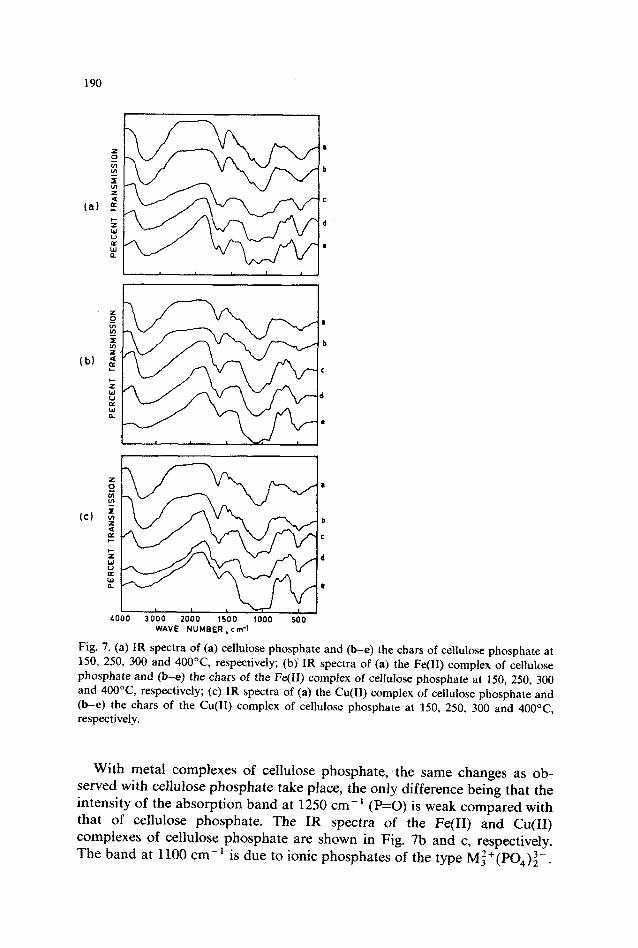
temperature range 150-400°C and the IR spectra of the residual products were recorded. As examples, the IR spectra of cellulose phosphate and its Fe(I1) and Cu(I1) complexes are displayed in Fig. 7. The changes observed in the infrared spectra of cellulose phosphate (Fig. 7a) are as follows: at 150°C there is a decrease in the intensity of the absorption bands due to hydroxyl stretching and bending (3300, 3400, 1320, 1380 cm-‘) and the bands due to P=O stretching at 1250 cm-’ and C-Cl stretching at 680 cm-’ which correspond to dehydration, dephosphorylation and dehydrohalogenation reactions, respectively. At 250°C the bands at 2900 (C-H stretching), 1160 (C-O-C stretching), 1125 and both 1060 and 1035 cm-’ (skeletal vibrations involving C-O stretching, etc.) show a decrease, which indicates that the decomposition is taking place. New bands appear at 1700 (C=O stretching), 1100, 900 and 750 cm-‘. The band at 1100 cm-’ is due to ionic phosphate (PO:-), and those at 900 and 750 cm-’ are due to P-O-P and P-O stretching in polyphosphate, respectively, the latter being formed owing to polymerization of phosphoric acid released in the first stage of thermal degradation. Also at this temperature there is a shift of the band at 1630 cm-’ (conjugated C=C) to 1600 cm-‘, which explains the skeletal rearrange- ment. At 400°C all the normal bands due to cellulose disappear completely and intense bands at 1700 (C=O), 1600 (C=C), 1250 (P=O), 1100 (PO:-), 900 (P-O-P) and 750 cm-’ (P-O) remain, suggesting the formation of compounds containing C=O, C=C and P=O groups.
1
b
- 1 LOO0 3000 2000 1500 1000 500
WAVE NUMBER,cm-1
Fig. 7. (a) IR spectra of (a) cellulose phosphate and (b-e) the chars of cellulose phosphate at 150, 250, 300 and 4OO”C, respectively; (b) IR spectra of (a) the Fe(I1) complex of cellulose phosphate and (b-e) the chars of the Fe(H) compiex of cellulose phosphate at 150, 250, 300 and 4OO”C, respectively; (c) IR spectra of (a) the Cu(II) complex of cellulose phosphate and (b-e) the chars of the Cu(II) complex of cellulose phosphate at 150, 250, 300 and 400°C. respectively.
With metal complexes of cellulose phosphate, the same changes as ob- served with cellulose phosphate take place, the only difference being that the intensity of the absorption band at 1250 cm-’ (P=O) is weak compared with that of cellulose phosphate. The IR spectra of the Fe(H) and Cu(II) complexes of cellulose phosphate are shown in Fig. 7b and c, respectiveIy. The band at 1100 cm-’ is due to ionic phosphates of the type M~+(PO,)~-.
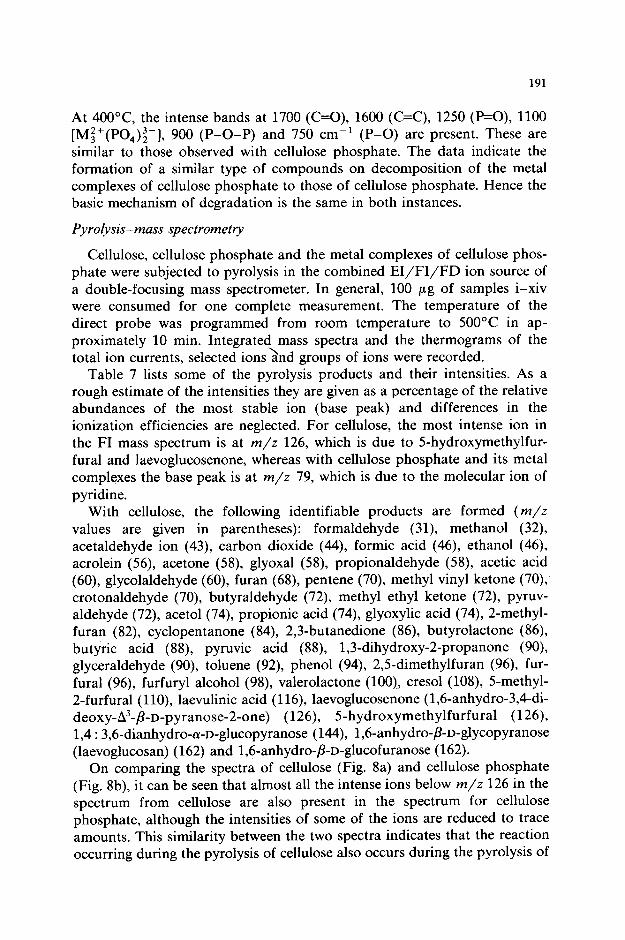
191
At 400°C the intense bands at 1700 (C=O), 1600 (C=C), 1250 (P=O), 1100 [M:+(PO,)q-1, 900 (P-O-P) and 750 cm-’ (P-O) are present. These are similar to those observed with cellulose phosphate. The data indicate the formation of a similar type of compounds on decomposition of the metal complexes of cellulose phosphate to those of cellulose phosphate. Hence the basic mechanism of degradation is the same in both instances.
Pyrolysis-mass spectrometry
Cellulose, cellulose phosphate and the metal complexes of cellulose phos- phate were subjected to pyrolysis in the combined EI/FI/FD ion source of a double-focusing mass spectrometer. In general, 100 pg of samples i-xiv were consumed for one complete measurement. The temperature of the direct probe was programmed from room temperature to 500°C in ap- proximately 10 min. Integrated mass spectra and the thermograms of the total ion currents, selected ions&d groups of ions were recorded.
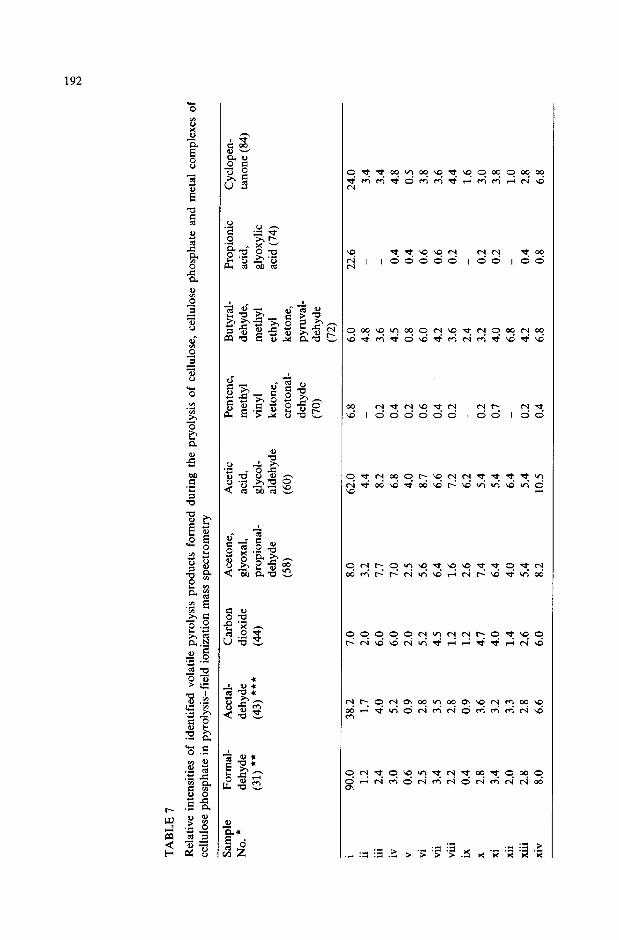
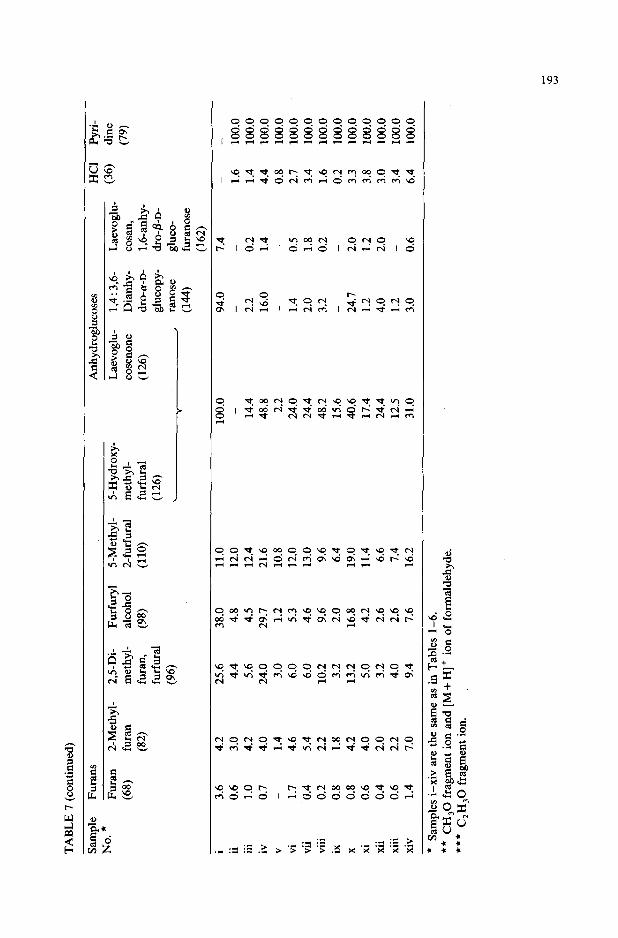
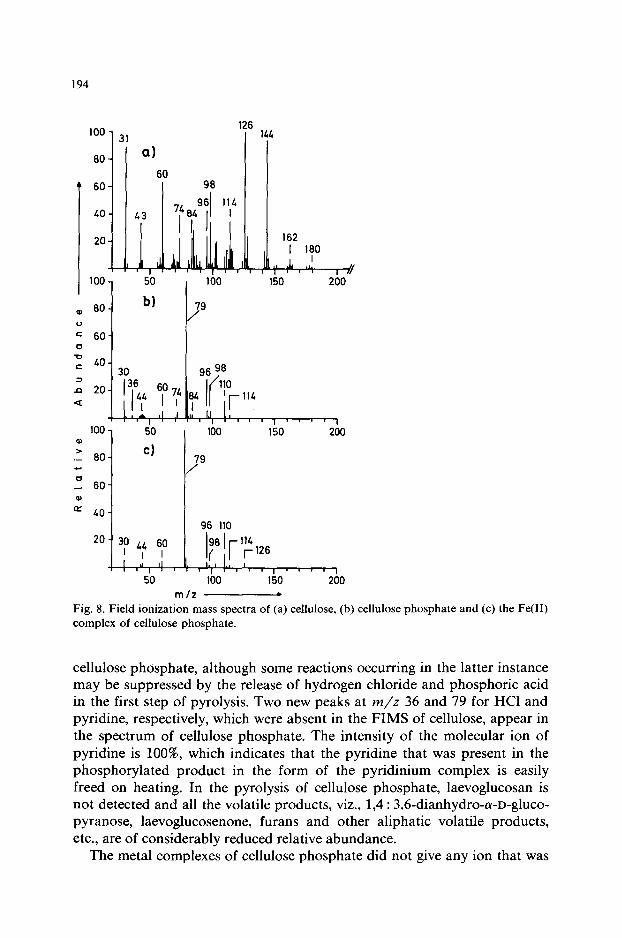
Table 7 lists some of the pyrolysis products and their intensities. As a rough estimate of the intensities they are given as a percentage of the relative abundances of the most stable ion (base peak) and differences in the ionization efficiencies are neglected. For cellulose, the most intense ion in the FI mass spectrum is at m/z 126, which is due to 5-hydroxymethylfur- fural and laevoglucosenone, whereas with cellulose phosphate and its metal complexes the base peak is at m/z 79, which is due to the molecular ion of pyridine.
With cellulose, the following identifiable products are formed (m/z values are given in parentheses): formaldehyde (31) methanol (32) acetaldehyde ion (43), carbon dioxide (44), formic acid (46), ethanol (46) acrolein (56), acetone (58), glyoxal (58), propionaldehyde (58) acetic acid (60), glycolaldehyde (60), furan (68), pentene (70), methyl vinyl ketone (70) crotonaldehyde (70), butyraldehyde (72), methyl ethyl ketone (72), pyruv- aldehyde (72), acetol (74), propionic acid (74), glyoxylic acid (74), 2-methyl- furan (82), cyclopentanone (84), 2,3-butanedione (86), butyrolactone (86), butyric acid (88), pyruvic acid (88), 1,3-dihydroxy-2-propanone (90), glyceraldehyde (90) toluene (92), phenol (94) 2,5-dimethylfuran (96), fur- fural (96), furfuryl alcohol (98), valerolactone (loo),, cresol (108), 5-methyl- 2-furfural (110) laevulinic acid (116), laevoglucosenone (1,6-anhydro-3,4-di- deoxy-A3-P-D-pyranose-2-one) (126), 5-hydroxymethylfurfural (126), 1,4 : 3,6-dianhydro-a-D-glucopyranose (144), 1,6-anhydro-P-D-glycopyranose (laevoglucosan) (162) and 1,6-anhydro-P-D-glucofuranose (162).
On comparing the spectra of cellulose (Fig. 8a) and cellulose phosphate (Fig. 8b), it can be seen that almost all the intense ions below m/z 126 in the spectrum from cellulose are also present in the spectrum for cellulose phosphate, although the intensities of some of the ions are reduced to trace amounts. This similarity between the two spectra indicates that the reaction occurring during the pyrolysis of cellulose also occurs during the pyrolysis of
TA
BL
E
7
Rel
ativ
e in
tens
ities
of
id
entif
ied
vola
tile
pyro
lysi
s pr
oduc
ts
form
ed
duri
ng
the
pryo
lysi
s of
ce
llulo
se,
cellu
lose
ph
osph
ate
and
met
al
com
plex
es
of
cellu
lose
ph
osph
ate
in p
yrol
ysis
-fie
ld
ioni
zatio
n m
ass
spec
trom
etry
Sam
ple
Form
al-
Ace
tal-
C
arbo
n A
ceto
ne,
Ace
tic
Pent
ene,
B
utyr
al-
Prop
ioni
c C
yclo
pen-
N
o. l
dehy
de
dehy
de
diox
ide
glyo
xal,
acid
, m
ethy
l de
hyde
, ac
id,
tano
ne
(84)
(31)
**
(4
3) l *
* (4
4)
prop
iona
l-
glyc
ol-
viny
l m
ethy
l gl
yoxy
lic
dehy
de
alde
hyde
ke
tone
, et
hyl
acid
(7
4)
(58)
(6
0)
crot
onal
- ke
tone
, de
hyde
py
ruva
l-
(70)
de
hyde
(72)
i 90
.0
38.2
7.
0 8.
0 62
.0
6.8
6.0
22.6
24
.0
ii . . .
111
iv
V
Vi vii . . .
Vlll
ix
X
Xi xii . .
xm
xiv
1.2
1.7
2.0
3.2
4.4
2.4
4.0
6.0
7.7
8.2
3.0
5.2
6.0
7.0
6.8
0.6
0.9
2.0
2.5
4.0
2.5
2.8
5.2
5.6
8.7
3.4
3.5
4.5
6.4
6.6
2.2
2.8
1.2
1.6
7.2
0.4
0.9
1.2
2.6
6.2
2.8
3.6
4.7
7.4
5.4
3.4
3.2
4.0
6.4
5.4
2.0
3.3
1.4
4.0
6.4
2.8
2.8
2.6
5.4
5.4
8.0
6.6
6.0
8.2
10.5
_ 0.2
0.4
0.2
0.6
0.4
0.2
- 0.2
0.7
_ 0.2
0.4
4.8
3.6
4.5
0.8
6.0
4.2
3.6
2.4
3.2
4.0
6.8
4.2
6.8
- 0.4
0.4
0.6
0.6
0.2
_ 0.2
0.2
- 0.4
0.8
3.4
3.4
4.8
0.5
3.8
3.6
4.4
1.6
3.0
3.8
1.0
2.8
6.8
TABL
E 7
(con
tinu
ed)
Sam
ple
Fura
ns
Anh
ydro
ghrc
oses
H
Cl
Pyri
- N
o. *
Fu
ran
2-M
ethy
l-
2,5-
Di-
Fu
rfur
yl
5-M
ethy
l-
%H
ydro
xy-
Lae
vogl
u-
1,4
: 3,6
- L
aevo
glu-
(3
6)
din
e
(68)
fu
ran
met
hyl-
al
coho
l 2-
furf
ural
m
ethy
l-
cose
none
D
ianh
y-
cosa
n,
(79)
(82)
fu
ran,
(9
8)
(HO
) fu
rfur
al
(126
) dr
o-a-
n-
1,6-
anhy
- fu
rfur
al
(126
) gh
~cop
y-
dro-
P-D
-
(96)
\
, ra
nose
gh
lco-
V
(1
44)
fura
nose
(162
)
i 3.
6 4.
2 25
.6
38.0
11
.0
100.
0 94
.0
7.4
ii 0.
6 3.
0
_ -
4.4
4.8
12.0
_
- _
1.6
100.
0 . . Il
l 1.
0 4.
2 5.
6 4.
5 12
.4
14.4
2.
2 0.
2 1.
4 10
0.0
iv
0.7
4.0
24.0
29
.7
21.6
48
.8
16.0
1.
4 4.
4 10
0.0
V
- 1.
4 3.
0 1.
2 10
.8
2.2
_ -
0.8
100.
0 vi
1.
7 4.
6 6.
0 5.
3 12
.0
24.0
1.
4 0.
5 2.
7 10
0.0
Vii
0.4
5.4
6.0
4.6
13.0
24
.4
2.0
1.8
3.4
100.
0 . .
. vl
ll 0.
2 2.
2 10
.2
9.6
9.6
48.2
3.
2 0.
2 1.
6 10
0.0
ix
0.8
1.8
3.2
2.0
6.4
15.6
_
- 0.
2 10
0.0
X
0.8
4.2
13.2
16
.8
19.0
40
.6
24.7
2.
0 3.
3 10
0.0
xi
0.6
4.0
5.0
4.2
11.4
17
.4
1.2
1.2
3.8
100.
0 xi
i 0.
4 2.
0 3.
2 2.
6 6.
6 24
.4
4.0
2.0
3.0
100.
0 . . .
xu
l 0.
6 2.
2 4.
0 2.
6 7.
4 12
.5
1.2
- 3.
4 10
0.0
Xiv
1.
4 7.
0 9.
4 7.
6 16
.2
31.0
3.
0 0.
6 6.
4 10
0.0
l
Sam
ples
i-x
iv
are
the
sam
e as
in
Tab
les
l-6.
l *
C
H,O
fr
agm
ent
ion
and
[M +
H]+
io
n of
for
mal
dehy
de.
l *
* C
,H,O
fr
agm
ent
ion.
126
IOO- 50 100 150 200
b) o) 60- 29 0 = 60- 0
z LO-
,: 20- Q:
I""I""I""1
loo- 50 100 150 200 0 ’
80-
cl
.- /” : 60- 0)
L?f 40- 96 110
I ’ ’ m ’ I 50 100 150 200
m/z .
Fig. 8. Field ionization mass spectra of (a) cellulose, (b) cellulose phosphate and (c) the Fe(H) complex of cellulose phosphate.
cellulose phosphate, although some reactions occurring in the latter instance may be suppressed by the release of hydrogen chloride and phosphoric acid in the first step of pyrolysis. Two new peaks at m/z 36 and 79 for HCl and pyridine, respectively, which were absent in the FIMS of cellulose, appear in the spectrum of cellulose phosphate. The intensity of the molecular ion of pyridine is loo%, which indicates that the pyridine that was present in the phosphorylated product in the form of the pyridinium complex is easily freed on heating. In the pyrolysis of cellulose phosphate, laevoglucosan is not detected and all the volatile products, viz., 1,4 : 3,6-dianhydro-a-D-gluco- pyranose, laevoglucosenone, furans and other aliphatic volatile products, etc., are of considerably reduced relative abundance.
The metal complexes of cellulose phosphate did not give any ion that was

195
not present in the pyrolysis-mass spectrum of cellulose phosphate, which suggests that the chemical processes occurring during the pyrolysis of metal complexes of cellulose phosphate are very similar to those occurring during the pyrolysis of cellulose phosphate. However, there is a change in the relative intensities for the various ions depending on the metal present. The sum of organic ions recorded and integrated for cellulose, cellulose phos- phate and its Fe(I1) complex (Fig. 8a, b and c) corresponds to the ratio 100:6:2.
The different products formed during the process are discussed below.
Carbon dioxide The intensity of the peak for carbon dioxide, a non-combustible pyrolysis
product, is reduced from 7% from cellulose to 2% from cellulose phosphate and 1.2-6.0% from metal complexes, the higher values being for Cr(III), Mn(II), Co(I1) and Hg(I1) complexes.
Anhydroglucoses Anhydroglucoses are the major volatile products formed during the pyrol-
ysis of cellulose. The yield of laevoglucosan is 7.4% from cellulose. With cellulose phosphate, Fe(II), Zn(I1) and Cd(I1) complexes it is not formed at all. The amounts of this product formed from Cr(III), Co(II), Cu(II) and Hg(II) complexes are fairly low, i.e., < l%, and from Mn(II), Ni(II), Zr(IV), Mo(VI) and Ag(1) complexes the levels are in the range l-2%.
The intensity of 1,4 : 3,6-dianhydro-a-glucopyranose, which has been ob- served as a high peak with cellulose, is also reduced to negligible amounts with treated celluloses. With cellulose phosphate, Fe(I1) (see Fig. 8c) and Zn(I1) complexes, it is not formed at all, whereas with Cr(III), Co(II), Ni(II), Cu(II), Mo(VI), Ag(I), Cd(I1) and Hg(I1) complexes the levels are in the range 1.2-4%. However, with Mn(I1) and Zr(IV) complexes it is 16.0 and 24.7%, respectively.
Laevoglucosenone (1,6-anhydro-3,4-dideoxy-A3-P-D-pyranose-2-one), which is abundant from cellulose, is not formed at all from cellulose phosphate and in the metal complexes of cellulose phosphate it is formed in comparatively less amounts.
Furans Furans, which include furan, 2-methylfuran, 2,5_dimethylfuran, furfuryl
alcohol, 5-methyl-2-furfural and 5-hydroxymethylfurfural, constitute the major part of the volatile products. The pattern of formation of these products is different from that of anhydroglucoses, as with certain of the metal complexes the intensities of some of them are increased. Furan, the yield of which from cellulose is 3.6% is produced in smaller amounts from treated cellulose (0.2-1.7%). The amount of 2-methylfuran formed from treated celluloses is not very different from that formed from cellulose
196
(4.2%). With cellulose phosphate, the amount of 2-methylfuran obtained decreases to 3.0% and with Fe(II), Cu(II), Zn(II), Ag(1) and Cd(I1) com- plexes it is 1.4-2.2%. However, in some instances, as with Ni(I1) and Hg(II), the levels are higher than that from cellulose, viz., 5.4 and 7.0%, respectively.
2,5-Dimethylfuran and furfural yields are reduced from 25.6% with cel- lulose to 4.4% with cellulose phosphate. Only with the complexes of Mn(II), Cu(II), Zr(IV) and Hg(I1) is the yield more than 9% and with all the remaining complexes of metals the yield is less than 5%.
Furfuryl alcohol (38% from cellulose) also shows a considerably reduced yield from cellulose phosphate (4.8%). With Fe(I1) (Fig. 8c) and Zn(I1) complexes, its yield is reduced to 1.2 and 2%, respectively. However, the yields from Mn(I1) and Zr(IV) complexes are fairly high (29.7 and 16.8%).
The intensity of 5-methyl-2-furfural was increased from 11% with cel- lulose to 12% with cellulose phosphate. With Mn(II), Zr(IV) and Hg(I1) complexes the values were much higher, namely, 21.6, 19.0 and 16.2%, respectively. With the other metal complexes they were in the range 6.4-13.0%.
5-Hydroxymethylfurfural, which is very intense in the pyrolysis of cel- lulose, is considerably reduced in some complexes. With cellulose phosphate it is not formed at all and its intensity is only 2.2% with the Fe(I1) complex. With Mn(II), Cu(I1) and Zr(IV) complexes the values are higher than others, viz., 48.8, 48.2 and 40.6%, respectively. With the other complexes, the values are in the range 12.5-31%.
It can be seen from the above data that the formation of furan derivatives in the pyrolysis of cellulose phosphate and its metal complexes is not reduced to the same extent as the formation of anhydroglucoses. This can be explained on the basis of the fact that phosphorus flame retardants behave as acids during pyrolysis and the acids promote dehydration and decarboxy- lation reactions in the solid phase. The fact that the acids promote furan formation in browning reactions [21] and in the aqueous decomposition of monosaccharides [22] may explain the higher yields of furans obtained from metal complexes of cellulose phosphate.
Other products The formation of acetone, acetic acid, propionic acid, glyoxal, glyoxylic
acid, crotonaldehyde, butyraldehyde, cyclopentanone, etc., is suppressed with cellulose phosphate and its metal complexes. With Fe(I1) and Zn(I1) complexes, the values were reduced considerably and in other instances also the values were lower than those from cellulose. Similarly, the pyrolysis FD mass spectra of the metal complexes gave very low yields of organic pyrolysates and at higher emitter heating currents consisted mainly of phosphate and metal cluster ions.
It can be concluded from the above discussion that the formation of volatile products from cellulose phosphate is greatly reduced. The decrease
197
in these products is much greater for the metal complexes of cellulose phosphate. Dehydration and char formation reactions are enhanced to a great extent at the expense of pyrolysis processes leading to the formation of volatile products.
Mechanism of thermal degradation The mechanism of thermal degradation of cellulose has been reviewed by
several workers [23-251. The thermal degradation of cellulose phosphate starts with the generation
of phosphoric acid, which then alters the thermal degradation in such a way that the production of laevoglucosan and other flammable products is minimized 1261. Phosphoric acid, on further heating, can polymerize to form polyphosphoric acid, which is a fairly effective catalyst in the dehydration reactions of cellulose. It can react with the cellulose moiety to form cellulose phosphate, which then breaks down to give water, phosphoric acid and the char. This has been discussed in detail elsewhere [27].
Chlorodeoxycellulose is also formed together with cellulose phosphate, so the mechanism of the thermal degradation of phosphorylated product is also affected by the chlorine content. The first step of the thermal degradation of chlorodeoxycellulose involves the dehydrohalogenation reaction. The re- leased hydrogen chloride then catalyses a series of heterolytic reactions, including transglycosylation, dehydration, inter- and intramolecular etherifi- cation, and other condensation reactions that provide laevoglucosenone and other volatile compounds including tarry products. Finally, the homolytic cleavage of the substituents on the carbon chain of the condensation products gives a carbonaceous char, still cont~ning trapped and relatively stable free radicals. A similar mechanism has been suggested by Shafizadeh et al. [17].
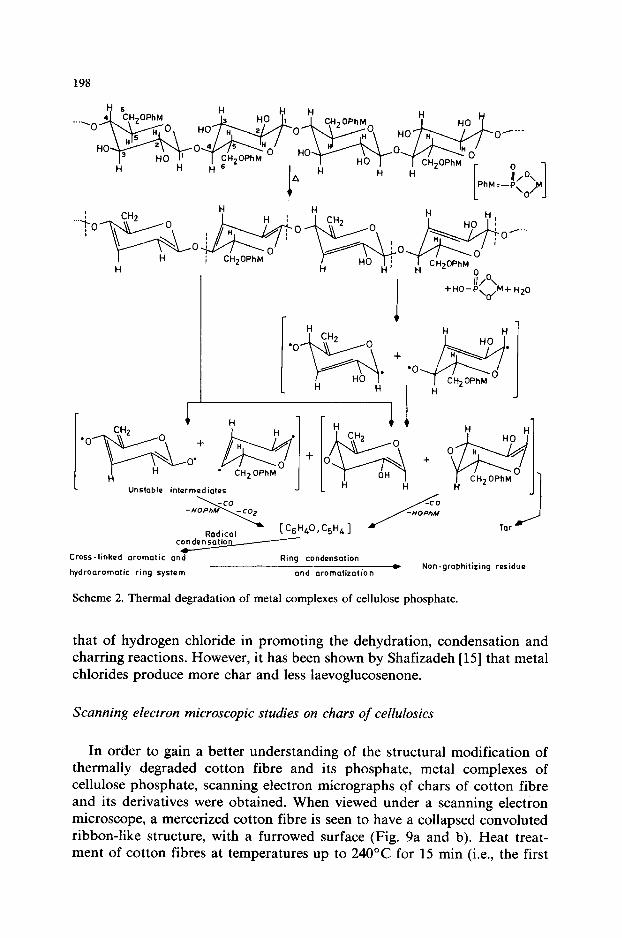
In the thermal degradation of metal complexes of cellulose phosphate, the first step is dephosphorylation, i.e., removal of the octahedral complex of metal phosphates from the cellulose moiety. This complex then decomposes to give a metal phosphate of the form M,(PO,), and phosphoric acid, as shown in Scheme 2. The values of x and y depend on the oxidation number of the cation. Both of the decomposition products can polymerize to form poly-metal phosphate and polyphosphoric acid, which in turn can again react with the cellulose moiety, forming cellulose phosphate or cellulose metal phosphate. On further heating, cellulose phosphate and cellulose metal phosphate break down to give water, phosphoric acid/metal phosphate and dehydrated char.
Thermal degradation of chlorodeoxycellulose present in the metal com- plexes of cellulose phosphate takes place in the same manner as described earlier. With metal complexes of cellulose phosphate there is a possibility that hydrogen chloride released in the decomposition of chlorodeoxycellu- lose may react with metal ions from the metal phosphate to form metal chloride. The effect of metal chlorides, which are Lewis acids, is similar to
198
condensation 4
Cross-linked aromatic ond
hydrooromotic ring system
Ring condensation
and aromatization + Non-grophitiring residue
Scheme 2. Thermal degradation of metal complexes of cellulose phosphate.
that of hydrogen chloride in promoting the dehydration, condensation and charring reactions. However, it has been shown by Shafizadeh [15] that metal chlorides produce more char and less laevoglucosenone.
Scanning electron microscopic studies on chars of cellulosics
In order to gain a better understanding of the structural modification of thermally degraded cotton fibre and its phosphate, metal complexes of cellulose phosphate, scanning electron micrographs of chars of cotton fibre and its derivatives were obtained. When viewed under a scanning electron microscope, a mercerized cotton fibre is seen to have a collapsed convoluted ribbon-like structure, with a furrowed surface (Fig. 9a and b). Heat treat- ment of cotton fibres at temperatures up to 240°C for 15 min (i.e., the first
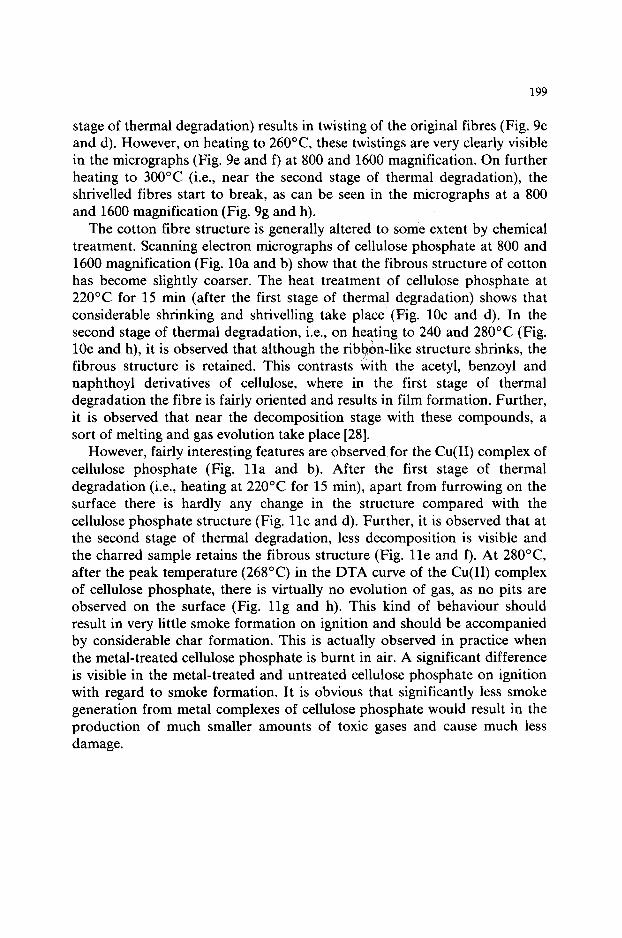
199
stage of thermal degradation) results in twisting of the original fibres (Fig. 9c and d). However, on heating to 260°C these twistings are very clearly visible in the micrographs (Fig. 9e and f) at 800 and 1600 magnification. On further heating to 300°C (i.e., near the second stage of thermal degradation), the shrivelled fibres start to break, as can be seen in the micrographs at a 800 and 1600 magnification (Fig. 9g and h).
The cotton fibre structure is generally altered to some extent by chemical treatment. Scanning electron micrographs of cellulose phosphate at 800 and 1600 magnification (Fig. 10a and b) show that the fibrous structure of cotton has become slightly coarser. The heat treatment of cellulose phosphate at 220°C for 15 min (after the first stage of thermal degradation) shows that considerable shrinking and shrivelling take place (Fig. 10~ and d). In the second stage of thermal degradation, i.e., on heating to 240 and 280°C (Fig. 10e and h), it is observed that although the ribbAn-like structure shrinks, the fibrous structure is retained. This contrasts with the acetyl, benzoyl and naphthoyl derivatives of cellulose, where in the first stage of thermal degradation the fibre is fairly oriented and results in film formation. Further, it is observed that near the decomposition stage with these compounds, a sort of melting and gas evolution take place [28].
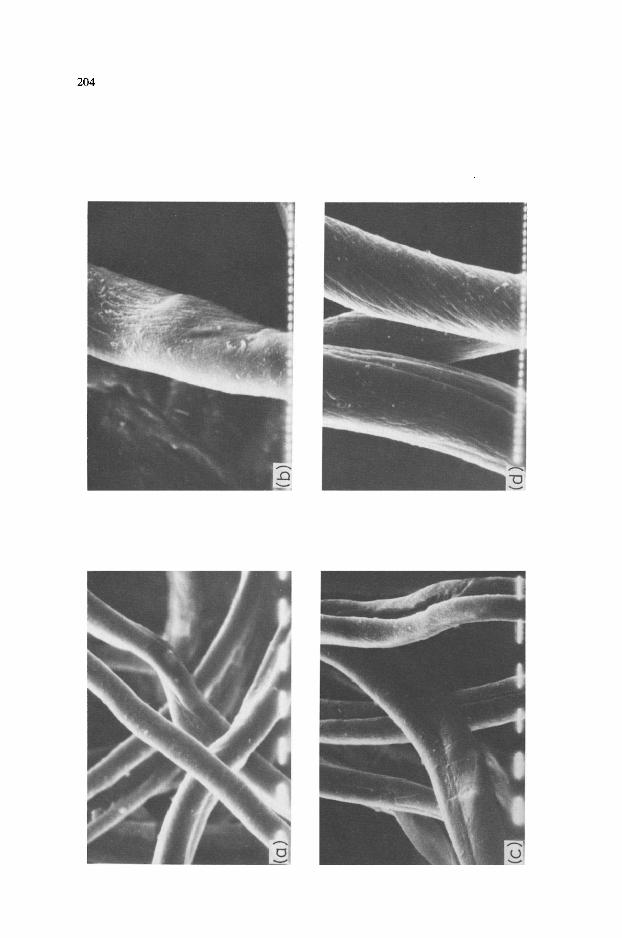
However, fairly interesting features are observed for the Cu(I1) complex of cellulose phosphate (Fig. lla and b). After the first stage of thermal degradation (i.e., heating at 220°C for 15 min), apart from furrowing on the surface there is hardly any change in the structure compared with the cellulose phosphate structure (Fig. llc and d). Further, it is observed that at the second stage of thermal degradation, less decomposition is visible and the charred sample retains the fibrous structure (Fig. lie and f). At 280°C after the peak temperature (268°C) in the DTA curve of the Cu(II) complex of cellulose phosphate, there is virtually no evolution of gas, as no pits are observed on the surface (Fig. llg and h). This kind of behaviour should result in very little smoke formation on ignition and should be accompanied by considerable char formation. This is actually observed in practice when the metal-treated cellulose phosphate is burnt in air. A significant difference is visible in the metal-treated and untreated cellulose phosphate on ignition with regard to smoke formation. It is obvious that significantly less smoke generation from metal complexes of cellulose phosphate would result in the production of much smaller amounts of toxic gases and cause much less damage.

200
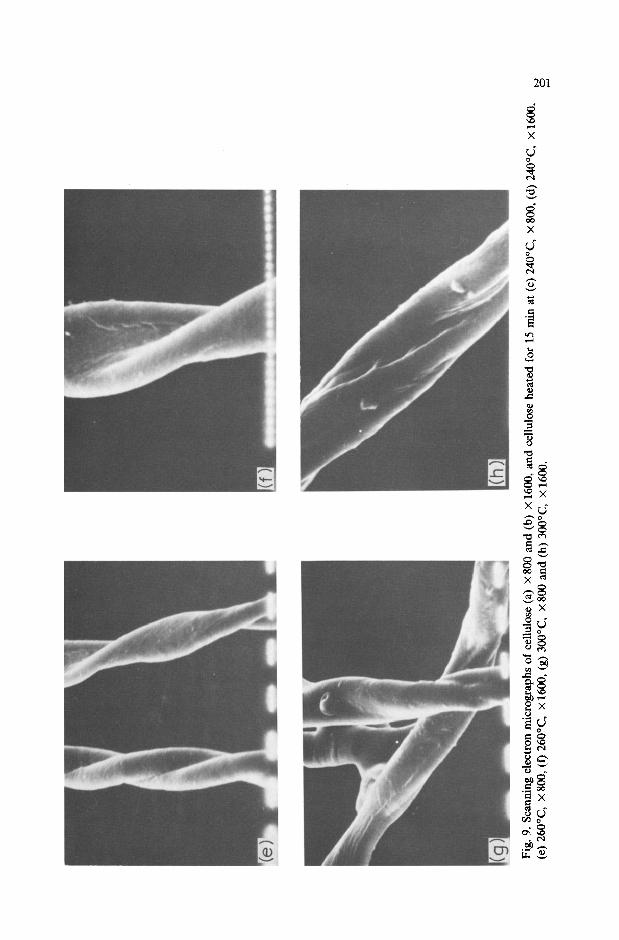
Fig.
9.
Scan
ning
el
ectr
on
mic
rogr
aphs
of
cel
lulo
se
(a)
X 8
00
and
(b)
X 1
600,
and
ce
llulo
se
heat
ed
for
15 m
in
at (
c) 2
4O”C
, X
800
, (d
) 24
O”C
, X
160
0,
(e)
260°
C,
x800
, (f
) 26
O”C
, x
1600
, (g
) 3O
O”C
, x80
0 an
d (h
) 30
0°C
, X
1600
. %
S
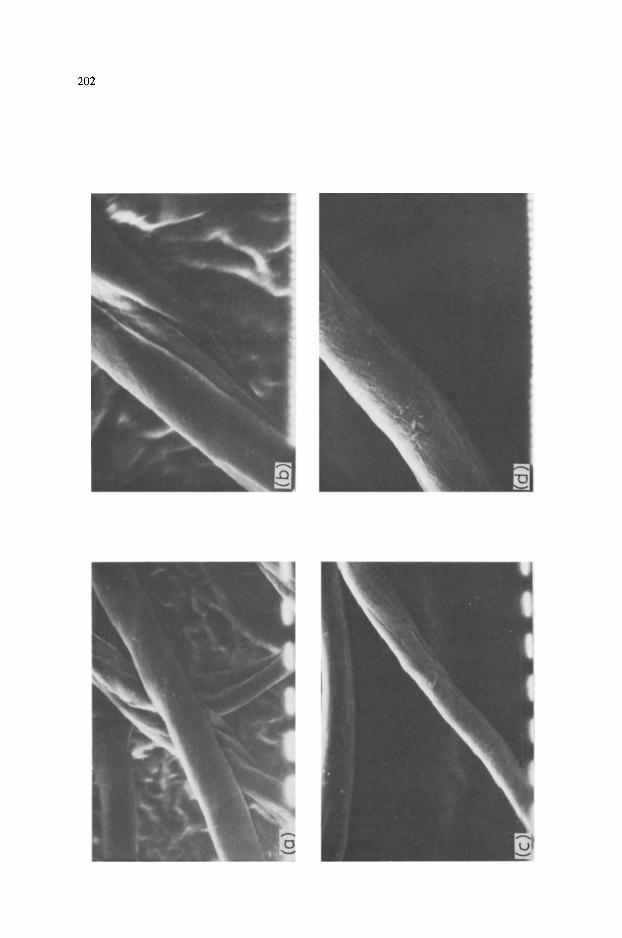
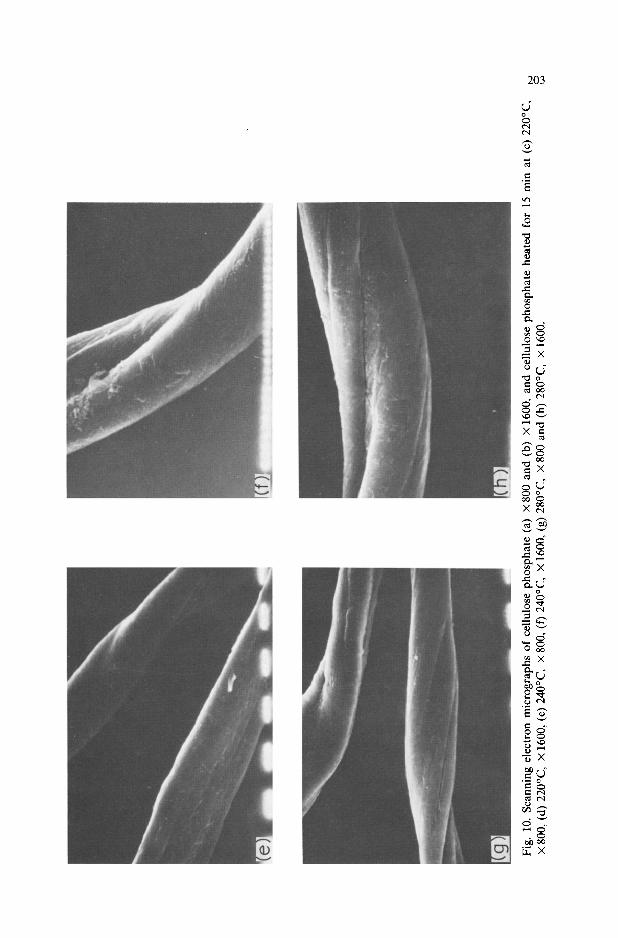
Fig.
10
. Sc
anni
ng
elec
tron
m
icro
grap
hs
of
cellu
lose
ph
osl
Jhat
e (a
) x
800
and
(b)
X 1
600,
an
d ce
llulo
se
phos
phat
e he
ated
fo
r 15
I
x 80
0, (
d)
22O
”C,
x 16
00,
(e)
240°
C,
X 8
00,
(f)
24O
”C,
X 1
600,
(g
) 28
O”C
, x
800
and
(h)
28O
”C,
x 16
00.
nin
at
(c)
22O
”C,
204
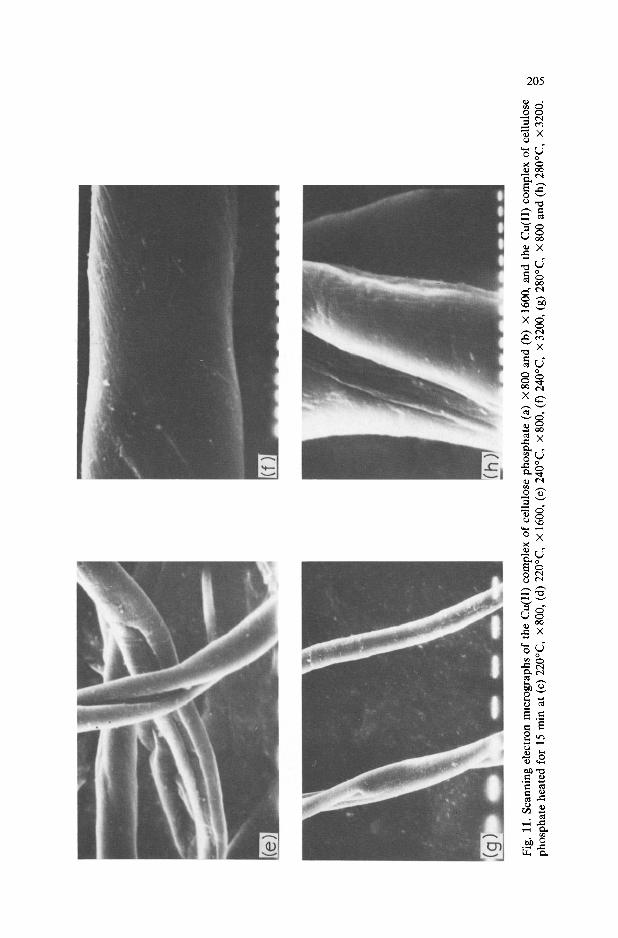
Fig.
11
. Sc
anni
ng
elec
tron
rm
crog
raph
s of
th
e C
u(II
) co
mpl
ex
of
cellu
lose
ph
osph
ate
(a)
X 8
00 a
nd
(b)
X 1
600,
an
d th
e C
u(II
) co
mpl
ex
of
cellu
lose
ph
osph
ate
heat
ed
for
15 m
in
at (
c)
220°
C,
X 8
00,
(d)
220°
C,
X 1
600,
(e
) 24
0°C
X
800
, (f
) 24
O”C
, X
320
0,
(g)
280°
C
X 8
00 a
nd
(h)
28O
”C,
X 3
200.
V
I g
206
ACKNOWLEDGEMENTS
One of the authors (B.K.) is grateful to the Council of Scientific and Industrial Research, New Delhi, for a Senior Fellowship award. Dr. R.K. Jain is grateful to the United States Department of Agriculture for the award of a Senior Research Associateship. This work was supported in part by the Deutsche Forschungsgemeinschaft and the Bundesministerium fur For- schung und Technologie, Bonn-Bad Godesberg (F.R.G.).
REFERENCES
1 J.R. Gaskill and CR. Veith, Fire Technol., 4 (1968) 185. 2 I.N. Einhorn, R.W. Michelson, B. Shah and R. Craig, J. Cell. Plast., 4 (1968) 188. 3 D.H. Cotton, N.J. Friswell and D.R. Jenkins, Combust. Flame, 17 (1971) 87. 4 L.C. Mitchell, U.S. Pat., 3,821,151 (June 28, 1974). 5 J.D. Reid and L.W. Mazzeno Jr., Ind. Eng. Chem., 41 (1949) 2828. 6 H.-R. Schulten and W. Goertz, Anal. Chem., 50 (1978) 428. 7 H.-R. Schulten, U. Bahr and P.B. Monkhouse, J. Biochem. Biophys. Methods, 8 (1983)
239. 8 H.-R. Schulten, J. Anal. Appl. Pyrol., 6 (1984) 251. 9 S.H. Zeronian, S. Adams, K. Alger and A.E. Lipska, J. Appl. Polym. Sci., 25 (1980) 519.
10 I.N. Ermolenko, S.S. Gusev and I.P. Lyubliner, Zh. Prikl. Khim., 42 (1969) 2302. 11 J. Lewis and R.G. Wilkins, Modern Coordination Chemistry, Interscience, New York,
1967. 12 R.A. Palmer and T.S. Piper, J. Inorg. Chem., 5 (1966) 864. 13 L.F. Larkworthy and K.C. Patel, J. Inorg. Nucl. Chem., 32 (1970) 1264. 14 F. Shafizadeh, J. Anal. Appl. Pyrol., 3 (1982) 283. 15 F. Shafizadeh, Appl. Polym. Symp., 28 (1975) 153. 16 F. Shafizadeh, P.S. Chin and W.F. DeGroot, J. Fire Flammability/Fire Retard. Chem.
Suppl., 2 (1975) 195. 17 F. Shafizadeh, Y.Z. Lai and C.R. McIntyre, J. Appl. Polym. Sci., 22 (1978) 1183. 18 A. Broido, J. Polym. Sci., Part A-2, 7 (1969) 1761. 19 K.J. Laidler, Chemical Kinetics, Tata McGraw-Hill, New Delhi, 1976, p. 86. 20 W.J. Moore, Physical Chemistry, Longmans, Edinburgh, 1966, p. 297. 21 J.H. Tatum, P.E. Shaw and R.E. Berry, J. Agric. Food Chem., 15 (1967) 773. 22 E. Jellum, H.C. Borresen and L. Eldjarn, Clin. Chim. Acta, 47 (1973) 191. 23 S.L. Madorsky, V.E. Hart and S. Straus, J. Res. Natl. Bur. Stand., 56 (1956) 343. 24 G.A. Byrne, D. Gardiner and F.H. Holmes, J. Appl. Chem., 16 (1966) 81. 25 K. Kato, Agr. Biol. Chem., 31 (1967) 657. 26 J.W. Lyons, J. Fire Flammability, 1 (1970) 302. 27 R.K. Jain, K. La1 and H.L. Bhatnagar, J. Appl. Polym. Sci., 30 (1985) 897. 28 R.K. Jain, K. La1 and H.L. Bhatnagar, J. Anal. Appl. Pyrol., 8 (1985) 359.