Thermal Spray Process Reliability: Sensors and Diagnostics
136
Summary of a Workshop held at National Institute of Standards and Technology Stephen D. Ridder U.S. DEPARTMENT OF COMMERCE Technology Administration Metallurgy Division Materials Science and Engineering Laboratory National Institute of Standards and Technology Gaithersburg, MD 20899 Technology Administration, U.S. Department of Commerce National Institute of Standards and Technology Thermal Spray Process Reliability: Sensors and Diagnostics NISTIR 6776
-
Upload
khangminh22 -
Category
Documents
-
view
1 -
download
0
Transcript of Thermal Spray Process Reliability: Sensors and Diagnostics

Summary of a Workshop held atNational Institute of Standards andTechnology
Stephen D. Ridder
U.S. DEPARTMENT OF COMMERCE
Technology AdministrationMetallurgy DivisionMaterials Science and Engineering LaboratoryNational Institute of Standards and TechnologyGaithersburg, MD 20899
Technology Administration, U.S. Department of CommerceNational Institute of Standards and Technology
Thermal Spray Process Reliability:Sensors and Diagnostics
NISTIR 6776

NISTIR 6776
Thermal Spray Process Reliabil ity:Thermal Spray Process Reliabil ity:Sensors and DiagnosticsSensors and DiagnosticsSummary o f a Workshop he ld a tSummary o f a Workshop he ld a tNat iona l Ins t i tu te o f S tandards andNat iona l Ins t i tu te o f S tandards andTechnologyTechnology
January 2001
UN
IT E D S TATES OF AM ERICA
DEPA
RTMENT OF COMMERC
E
U.S. DEPARTMENT OF COMMERCEDonald L. Evans, Secretary
TECHNOLOGY ADMINISTRATIONKaren H. Brown, Acting Under Secretary of Commercefor Technology
NATIONAL INSTITUTE OF STANDARDS AND TECHNOLOGYKaren H. Brown, Acting Director
Stephen D . R idderS tephen D . R idderU.S. DEPARTMENT OF COMMERCETechnology AdministrationMetallurgy DivisionMaterials Science and Engineering LaboratoryNational Institute of Standards and TechnologyGaithersburg, MD 20899

Table of Contents Page i
TABLE OF CONTENTS
TABLE OF CONTENTS.................................................................................................................i
DISCLAIMER.................................................................................................................................ii
WORKSHOP SUMMARY.............................................................................................................1
Purpose.......................................................................................................................................1
Results ........................................................................................................................................1
WORKSHOP AGENDA ................................................................................................................2
PRESENTATIONS.........................................................................................................................3
Introductory Presentations ..........................................................................................................3
Workshop Presentations .............................................................................................................3
DISCUSSION..................................................................................................................................6
CONCLUSIONS.............................................................................................................................9
ATTENDANCE LIST ..................................................................................................................11
Industry.....................................................................................................................................11
Academia..................................................................................................................................13
National Labs (non NIST)........................................................................................................14
NIST.........................................................................................................................................15
PRESENTATION SLIDES ..........................................................................................................17
Torch-Based Sensor Systems S. D. Ridder (NIST) .......................................................17
Plume-Based Sensors and Measurements S. P. Mates (NIST) ........................................................21
Substrate-Based Sensors:Optical Sensing of Thermal Spray Substrates
and Coatings J. Geist (Sequoyah Tech.).................................................27
Substrate-Based Sensors:
Radiation-Stimulated Sensing of Coating Properties D. Basak (NIST) ...........................................................31
Substrate Analysis: Surface Texture M. R. Stoudt (NIST).......................................................37
Substrate Analysis: Grit Blasting R. D. Jiggetts (NIST)......................................................41
In-Flight Temperature Measurement in the
Thermal Spray Process J. R. Fincke (INEEL) ......................................................45
Opportunities and Challenges for Advanced Process Control
in the Thermal Spray Industry C. Moreau (NRC-CNRC).................................................55
Materials of Interest:
NIST Ceramic Coatings Program S. J. Dapkunas (NIST) ....................................................65
Page ii Table of Contents
Materials of Interest:
Metal Coating Systems F. S. Biancaniello (NIST) .................................................73
Variability in Thermal Spray Materials: A Problem or an Opportunity?
C. C. Berndt (SUNY Stony Brook) .....................................77
NIST Role in Microstructure Characterization and Relationships Between the Microstructure and Properties for
Thermally Sprayed Deposits J. Ilavsky (NIST)...........................................................93
Rapid, Low Investment Tooling D. Collins (Ford Motor Corp.) ...........................................99
Imaging Pyrometer for Monitoring the Surface Temperature of a Spray Formed Steel Billet
J. E. Craig (Stratonics, Inc.).............................................105
High Enthalpy Plasma Spray L. George (Progressive Technologies, Inc.) ..........................113
NIST THERMAL SPRAY RESEARCH ...................................................................................125

Disclaimer Page iii
DISCLAIMER
This report is intended as a record of the presentations and discussions that took place at a NISTMetallurgy Division sponsored workshop. The opinions, conclusions, or recommendations that areexpressed herein are those of the organizers or individual presenters and do not necessarily reflectthe views of NIST. All references to commercial equipment in this report are for identificationpurposes only and in no way constitute any endorsement or evaluation of the relative merits ofsuch equipment by NIST.

Workshop Summary Page 1
WORKSHOP SUMMARY
PurposeThis report covers the second workshop on Thermal Spray (TS) coatings sponsored by the NISTMetallurgy Division. The first of these workshops, held in November, 1998, was documented inNISTIR 6460. The objectives of this current workshop included the presentation of NIST work onthermal spray sensors and diagnostics, as well as exploring the possibilities for collaborations withU.S. industry. Attendance from outside NIST was approximately 35, of whom approximately 15could be classified as thermal spray producers and users and 20 as the thermal spray diagnosticscommunity including instrument makers, universities, and national laboratories.
In the December 2000 issue of the Journal of Thermal Spray Technology, R.C. Tucker, Jr.discussed many of the issues covered in this workshop and stressed the need for higher quality inthermal spray coatings. Tucker’s comments are recommended background reading for this report1.
ResultsThe workshop participants expressed several needs and concerns regarding the use of sensors andprocess measurement technology. A coatings properties database of materials characterization,mechanical properties, and statistical analysis needs to be established. New technology for depositand substrate property measurements is needed, especially sensors to measure deposit thicknessand techniques to measure residual stresses in thick deposits. There are questions concerning thecalibration of non-contact temperature sensors, specifically as to how variations in materialproperties (e.g. particle shape, oxidation, etc.) will affect emissivity. Simple, reliable, ruggedsensors are required for industrial environments. The research community must show a correlationof improved sensor performance and accuracy to improved product performance.
1 R. C. Tucker, Jr. “Comments on the Status and Future of Thermal Spray Coatings,” JTST, Vol 9 No 4, 2000, pp. 431-433.
Page 2 Workshop Agenda
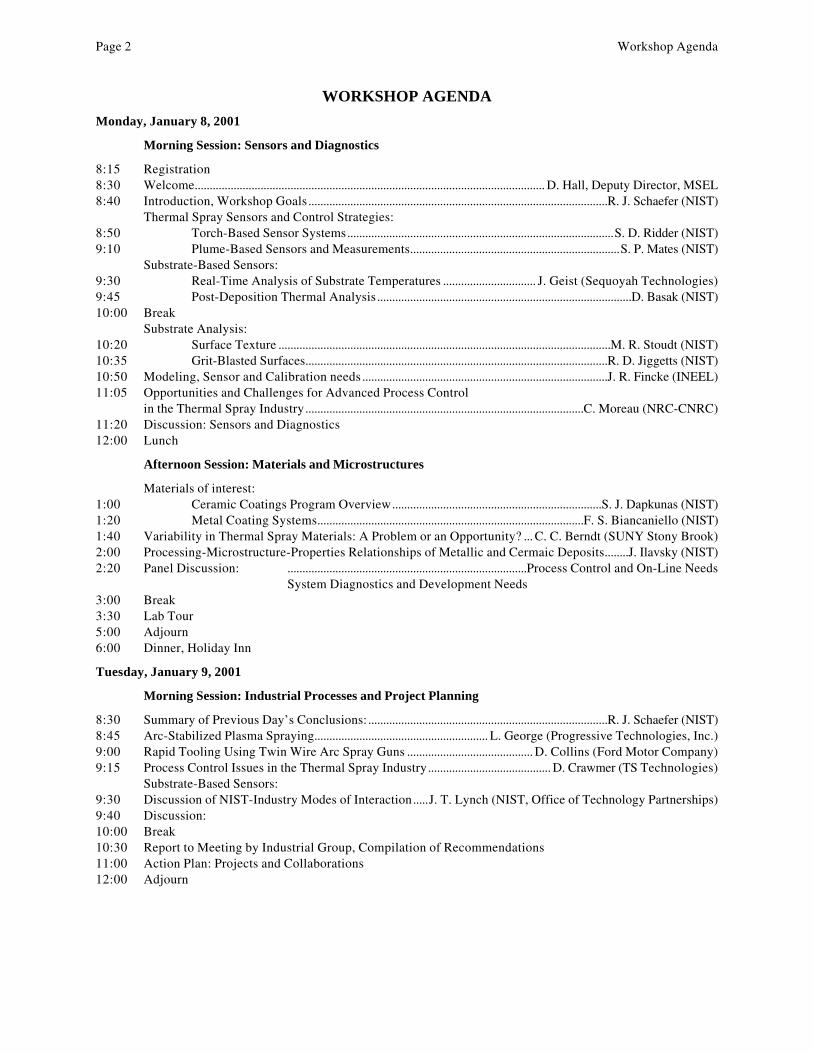
WORKSHOP AGENDA
Monday, January 8, 2001
Morning Session: Sensors and Diagnostics
8:15 Registration8:30 Welcome..................................................................................................................... D. Hall, Deputy Director, MSEL8:40 Introduction, Workshop Goals ....................................................................................................R. J. Schaefer (NIST)
Thermal Spray Sensors and Control Strategies:8:50 Torch-Based Sensor Systems.........................................................................................S. D. Ridder (NIST)9:10 Plume-Based Sensors and Measurements......................................................................S. P. Mates (NIST)
Substrate-Based Sensors:9:30 Real-Time Analysis of Substrate Temperatures ............................... J. Geist (Sequoyah Technologies)9:45 Post-Deposition Thermal Analysis .....................................................................................D. Basak (NIST)10:00 Break
Substrate Analysis:10:20 Surface Texture ...............................................................................................................M. R. Stoudt (NIST)10:35 Grit-Blasted Surfaces.....................................................................................................R. D. Jiggetts (NIST)10:50 Modeling, Sensor and Calibration needs ..................................................................................J. R. Fincke (INEEL)11:05 Opportunities and Challenges for Advanced Process Control
in the Thermal Spray Industry.............................................................................................C. Moreau (NRC-CNRC)11:20 Discussion: Sensors and Diagnostics12:00 Lunch
Afternoon Session: Materials and Microstructures
Materials of interest:1:00 Ceramic Coatings Program Overview......................................................................S. J. Dapkunas (NIST)1:20 Metal Coating Systems.........................................................................................F. S. Biancaniello (NIST)1:40 Variability in Thermal Spray Materials: A Problem or an Opportunity? ... C. C. Berndt (SUNY Stony Brook)2:00 Processing-Microstructure-Properties Relationships of Metallic and Cermaic Deposits........J. Ilavsky (NIST)2:20 Panel Discussion: ................................................................................Process Control and On-Line Needs
System Diagnostics and Development Needs3:00 Break3:30 Lab Tour5:00 Adjourn6:00 Dinner, Holiday Inn
Tuesday, January 9, 2001
Morning Session: Industrial Processes and Project Planning
8:30 Summary of Previous Day’s Conclusions: ................................................................................R. J. Schaefer (NIST)8:45 Arc-Stabilized Plasma Spraying.......................................................... L. George (Progressive Technologies, Inc.)9:00 Rapid Tooling Using Twin Wire Arc Spray Guns .......................................... D. Collins (Ford Motor Company)9:15 Process Control Issues in the Thermal Spray Industry......................................... D. Crawmer (TS Technologies)
Substrate-Based Sensors:9:30 Discussion of NIST-Industry Modes of Interaction.....J. T. Lynch (NIST, Office of Technology Partnerships)9:40 Discussion:10:00 Break10:30 Report to Meeting by Industrial Group, Compilation of Recommendations11:00 Action Plan: Projects and Collaborations12:00 Adjourn
Presentations Page 3
PRESENTATIONS
Introductory PresentationsThe program started with an introductory welcome by D. E. Hall, Deputy Director of the NISTMaterials Science and Engineering Laboratory. This was followed by a slide presentation by R. J.Schaefer outlining the goals of the workshop.
Workshop PresentationsThe program on Monday morning was devoted to the presentation of NIST work on sensors anddiagnostics since the previous workshop on November 19, 1998, while the afternoon includedpresentation of materials aspects of NIST work, including the Ceramics Coatings Program andmetallic coating materials. Before the laboratory tour which ended the day, there was a discussionof the topics on which NIST was seeking guidance. These were grouped under four categories,which were judged to be important based on needs expressed in previous workshops and on theNIST measurement mission:
• Thermal Spray Materials• Calibration and Resolution• Materials Measurements and Evaluations• Cost, Ease of Use
The program on Tuesday morning included a summary of the comments from the previous day,with additions from the audience. This was followed by presentations from industrial attendees,and a presentation by Terry Lynch of the NIST Office of Technology Partnerships describing thedifferent possible working relationships between NIST and industry. The workshop concludedwith comments that were invited from the outside participants on what areas they thought would bemost valuable for NIST to pursue.
MondayThe NIST work on the Sensors and Diagnostics project was presented as three parts: torch-basedsensors, plume-based sensors, and substrate-based sensors. Torch-based sensors were described byS. D. Ridder of the NIST Metallurgy Division. These include sensors that measure the input to thetorch of the numerous parameters such as electric power, water and gas flow, and thermal spraypowder flow. This presentation emphasized recent work with measurement of powder feed rateusing a Coriolis meter, which has much higher time resolution than the powder flow rate sensorsthat are normally used. This type of measurement (of a powder entrained in a gas flow) is a newapplication for a Coriolis meter and it appears to provide valuable information but will requireconsiderable further study for calibration. There also was a brief discussion about data acquisitionand control issues.
S. Mates, also of the NIST Metallurgy Division, discussed plume-based diagnostics, includingmeasurements of temperatures and velocities of particles using two-color imaging pyrometry. Hedescribed in some detail the calibration work on this instrument and the extensive challengesrelated to understanding material emissivities.
Several aspects of substrate-based sensors were then discussed. J. Geist, of SequoyahTechnologies, described optical sensing of substrate and deposit temperatures during a spraydeposition process, as applied to spray deposition onto a rotating cylindrical substrate. Thispresentation included a discussion of the features seen in the InGaAs sensor data stream during atypical deposition experiment. D. Basak, Guest Researcher at NIST from the University of
Page 4 Presentations
Tennessee, described two other substrate-based sensor systems. The first was a reflectometerintended for measurements of emissivity, as well as surface roughness parameters. The second wasa pulsed-laser coating analysis instrument intended for analysis of several coating properties,essentially by probing the thermal diffusivity.
The following two talks discussed surface topography: M. Stoudt, of the NIST MetallurgyDivision, discussed the different parameters that are used to describe surface roughness, with thepoint being made that the commonly cited parameter Ra is not in itself a characteristic measure ofthe suitability of a substrate for good adhesion. R. Jiggetts, also of the NIST Metallurgy Division,then described some measurements of the topography of grit-blasted surfaces, undertaken with thegoal of understanding the progression of topography as the sample progresses from under-blastedto properly blasted to over-blasted, and correlating this progression to what might be observed by anon-contact sensor such as the reflectometer described by D. Basak.
J. Fincke of the Idaho National Engineering and Environmental Laboratories described the needfor good emissivity values to enable better comparison of measured temperatures to those predictedby models. He showed a plot of collected values of emissivity as a function of temperature fortungsten, with such large scatter that the data were essentially useless. The following questionswere raised:How much of this scatter results from difficulty in measuring the emissivity? and,How much of this scatter results from the actual emissivity variations?
C. Moreau of the National Research Council Canada described the opportunities and challengesfor advanced process control in the thermal spray industry. He described a procedure in which a“green window” was identified representing the range of particle parameters which always gaveacceptable coating quality. He also described open-loop and closed-loop approaches for operationwith a model-based controller.
In the afternoon, the focus shifted to thermally sprayed materials. S. Dapkunas of the NISTCeramics Division reviewed the Ceramics Coatings Program, which has focussed on thermal spraydeposition of thermal barrier coatings. This project developed Standard Reference Materials forparticle size distribution, and developed a wide range of coating characterization measurements,including microstructure, residual stress, thermal conductivity, and elastic modulus. The currentstatus of the NIST Object Oriented Finite Element (OOF) project was also described. This publicdomain software tool simulates and elucidates macroscopic properties of complex materialsmicrostructures.
F. Biancaniello of the NIST Metallurgy Division described some of the alloys the Division hasworked on which have potential as thermal spray coatings, including nitrogenated stainless steels,white cast iron, and quasicrystals. The performance of these materials as thermal spray coatings,with outstanding combinations of corrosion and/or wear properties, could be beneficially exploredby combining the NIST capabilities in atomization and thermal spray.
C. Berndt, of SUNY Stony Brook, discussed whether variability in thermal spray coatings was aproblem or an opportunity. He discussed the wide range of powder types used for both abrasiveblasting and coating deposition and the problems of coating characterization. Surface roughness isrecognized as an important issue. With regard to characterization, he emphasized the usefulness ofWeibull charts for an understanding of the statistical nature of important properties. During his talkand at other times, he pointed out the benefits of using the Journal of Thermal Spray Technology

Presentations Page 5
and the Thermal Spray Society as media for spreading information.
J. Ilavsky of the NIST Ceramics Division discussed characterization techniques and structure-property relationships. He showed how scattering techniques could be used to determinecharacteristics such as Porod surface area, which provide a bulk average measure of anisotropicsurface area distribution. Such techniques may provide a better statistical measure than does directmetallography for correlation to processing conditions or properties.
TuesdayR. Schaefer summarized subjects that had been identified as important during the discussions onMonday. After additions from the audience, the list included:
I. Materials:A. Variability of feedstock materials: chemistry, particle size, size distribution, and
morphologyB. Material selectionC. Properties of monolithic vs. sprayed materialsD. Bond strengthsE. Modeling of failure modesF. Residual stress distributions, CTE
II. Calibration and ResolutionA. Temperature measurements
1. Absolute values are more important for R&D applications.2. Long-term stability is more important for industrial process.3. Extrapolation to high temperatures - how much difference does it make?4. Changes in emissivity due to particle oxidation, etc. can be real. How can one handle
them?B. Time variations
1. Powder pulsing - influenced by powder feed mechanism, powder characteristics,presence of gun, etc.
2. Torch pulsing - can convert to broader distributions downstream.3. Do these have any effect on deposit properties?
III. Materials Measurements and EvaluationsA. Roughness: What is the topography - adhesion linkage?B. Mechanical testing: What is the appropriate 4-point bend configuration?C. Statistical treatment of dataD. Variability of hardness test data
IV. Cost, Ease of UseSimple, real-time sensors are needed (coating thickness, deposition efficiency, ….)
D. Collins of Ford Motor Company then described Ford’s use of multiple twin wire arc spray gunsto produce sheet metal stamping dies. They deposit tool steel alloys with a thickness of typically19 mm to 25.4 mm (¾" to 1") onto a sacrificial ceramic form, producing finished dies with sizesranging up to 0.9 m × 0.9 m (3' × 3'). Larger dies can currently be formed by joining these, but thegoal is direct spraying of pieces with footprints of 2.4 m × 2.4 m (8' × 8'). Spray-formed tools canbe produced in (1 to 2) weeks compared to the (4 to 18) weeks required by conventional practices,and there is a 25 % to 30 % cost savings. Residual stresses are an important topic because of theneed to maintain dimensional tolerances.
Page 6 Discussion
J. Craig of Stratonics described the use of a two-wavelength camera in Ford’s facility to analyzethe surface temperature of the deposit. The camera uses an InGaAs detector with a 320 × 240 pixelarray and a cooled focal plane. To make temperature measurements, the spray forming head ismoved aside.
L. George of Progressive Technologies described the benefits of an axial feed gun technologywhich they have developed. This system has a stabilized arc with a uniform spray plume thatresults in high spray rates and improved deposition efficiency.
D. Crawmer discussed process control issues in the thermal spray industry and summarized thedifficulty of defining the control and reliability challenges in Crawmer’s First Law, “The onlyabsolute in thermal spray is that there are no absolutes.” The industry needs improved, inexpensivesensors to compensate for the many complex variables and complex interactions, and the lack ofoperator skill and regular maintenance. It needs data acquisition tools for statistical analysis of theprocess. It needs tools for control, process diagnostics, and troubleshooting. Important technicalaspects include surface preparation, powder quality, powder delivery, and plasma characteristics.Crawmer discussed some details of each of these aspects and concluded that cost effective sensorsand controls could be an effective short-term solution for the problems. (Slides for his presentationwere not available to include in this report.)
DISCUSSION
Visitors were asked to express their opinions, based on what they had heard about NIST’scapabilities, of what kind of work would be most valuable for NIST to do, particularly with respectto possible collaborations. The following comments were offered:
Sandia National Laboratory:R. Neiser: Sensors to measure the substrate and deposit can have a bigger impact than in-flightmeasurements and emissivity.
A. Mayer: On-line coating thickness measurement is an important parameter that needs moreattention.
Bechtel Bettis, Inc.:T. Hicks: Identification of a reproducible operating window for a quality product and developmentof nondestructive tests for quality control need to be addressed.
Los Alamos National Laboratory:R. Castro: Use NIST expertise in powder processing in conjunction with plasma spray research.
Naval Surface Warfare Center:L. Kohler: NSWC is currently working with the Osprey process; however, attended mainly to stayaware of latest sensor work.
SUNY Stony Brook:A. Kulkarni: There is a need for coating thickness measurement sensors and for a standardizedtest for thermal cycling.
Sulzer Metco:G. Wuest: There is a need for improved gas atomization to deliver a narrower range of particlesizes in an economic way. Also, materials property measurements, especially non-destructive, needto be developed.
Discussion Page 7
Crucible Compaction Metals:B. Hann: CCM attended as a powder metal producer to be educated on the needs of the thermalspray industry.
Drexel University:R. Knight: Drexel is looking for a role for students. NIST could have access to their facilities suchas an HVOF system. Drexel would like to see the development of a coatings properties databasefor designer information.
Stratonics:J. Craig: Stratonics would like NIST to continue to support sensors, especially calibration work.
Thermal Spray Society:C. Berndt (SUNY Stony Brook): The ASM TSS has 1000+ members who could contribute. Forexample, a data pooling effort could be initiated on materials characterization, mechanicalproperties, and statistical analysis. A roadmap is needed for the thermal spray industry.
Ford Motor Company:R. Allor: Work needs to be directed on property measurements of deposits. More work is neededon twin-wire arc spray, in particular, on measuring residual stresses in deposits (i.e. neutronscattering.) Round robin testing is needed.
Micro-Motion:R. Winget: Micro-Motion would like to continue working with NIST on Coriolis meter formeasurement of powder flow.
Progressive Technologies:L. Pollard: Efforts should be applied to the development of spray parameters for differentmaterials.
L. George: An in-situ coating thickness measurement sensor is needed.
Thermal Spray Technologies:D. Crawmer: Standardized calibration of emissivities is needed; pick a few key coating materialsto work on.
National Research Council of Canada:C. Moreau: More work is needed on diagnostics, the effects of shape of particles, vapor clouds,the effect of oxidation on emissivity, and what do we do about it. Temperature calibrations in areproducible manner are also needed.
Idaho National Environmental and Engineering Laboratory:J. Fincke: Optical properties of coating materials are needed, including the effects of evaporationand oxidation. More work should be carried out on high temperature thermophysics.
Siemens Westinghouse Power:R. Subramanian: (Comments were sent by e-mail after workshop.) Work is needed on thecorrelation of superior accuracy in sensors and diagnostics to superior performance and reliabilityof coatings. Robust and simple sensors for use in the field are also needed.

Conclusions Page 9
CONCLUSIONS
Based on participant comments, the following were identified as important issues that NIST shouldaddress directly or pursue as a collaborative project with outside researchers:
• A coating properties database of materials characterization, mechanical properties, andstatistical analysis should be developed.
• A need for more measurements of deposit properties such as residual stresses was expressed.Also, new deposit and substrate property sensors are needed, especially one for coatingthickness.
• Calibration procedures and emissivity data, especially as affected by variations in materialproperties (particle shape, oxidation) were cited as needs (caution - primarily by the sensorcommunity rather than the Thermal Spray user community).
• Simple, reliable, rugged sensors are needed for industrial environments.• A correlation of improved sensor performance and accuracy to improved product
performance should be shown.• NIST expertise in powder production by atomization should be combined with thermal spray
work.


Workshop Attendance Page 11
ATTENDANCE LIST
Industry
Richard AllorFord Motor Company2101 RotundaDearborn, MI 48121 [email protected]
Jacques BlainTECNAR Automation Ltée1321 Hocquart StreetSt. Bruno, QB J3V 6B5 CANADA450-461-1221450-461-0808 (fax)[email protected]
Andrew BurnsSiemens Westinghouse Power4400 Alafaya TrailOrlando, FL 32826 USA407-736-6656407-736-2334 (fax)[email protected]
Dave CollinsFord Motor CompanySouthgate, MI 48195 [email protected]
James E. CraigStratonics, Inc.23151 Verdugo Drive, Suite 114Laguna Hills, CA 92653-1340 USA949-461-7060949-461-7069 (fax)[email protected]
Daryl CrawmerThermal Spray Technologies515 Progress WaySun Prairie, WI 53590 USA608-825-2772608-825-2737 (fax)[email protected]
Shmuel EidelmanSAIC11705 Dinwiddie DriveRockville, MD 20852 USA703-676-6491703-676-5323 (fax)[email protected]
Jon GeistSequoyah Technologies4410 Winding Oak DriveOlney, MD 20832 [email protected]
Lou GeorgeProgressive Technologies4201 Patterson AveGrand Rapids, MI 49512 USA616-957-0871616-957-3484 (fax)[email protected]
Brian A. HannCrucible Compaction Metals1001 Robb Hill RoadOakdale, PA 15071toll free-888-923-2670412-923-2670412-788-4240 (fax)[email protected]
Trevor HicksBechtel Bettis, Inc.P.O. Box 79West Mifflin, PA 15122 USA412-476-7214412-476-6235 (fax)[email protected]

Page 12 Workshop Attendance
William KratochvilPraxair-TAFA146 Pembroke RoadConcord, NH 03301 [email protected]
Chijoke McbokenercFord Motor Company20000 Rotunda DriveDearborn, MI 48121 USA313-390-8596313-390-0514 (fax)
Francois NadeauTECNAR Automation Ltée1321 Hocquart StreetSt. Bruno, QB J3V 6B5 CANADA450-461-1221450-461-0808 (fax)[email protected]
Larry PollardProgressive Technologies4201 Patterson AveGrand Rapids, MI 49512 USA616-285-8350616-957-2509 (fax)[email protected]
Luc PouliotTECNAR Automation Ltée1321 Hocquart StreetSt. Bruno, QB J3V 6B5 CANADA450-461-1221450-461-0808 (fax)[email protected]
Allen RocheFord Motor Company2101 Village RoadSRL, MD 3135Dearborn, MI 48124 USA313-390-8889313-390-0514 (fax)[email protected]
SamirFord Motor Company20000 Rotunda DriveDearborn, MI 48121 USA313-337-6495
Ramesh SubramanianSiemens Westinghouse Power4400 Alafaya TrailMC 303Orlando, FL 32826 USA407-736-5591407-736-2334 (fax)[email protected]
Jason TingCrucible Research6008 Campbells Run RoadPittsburgh, PA 15025412-923-2955412-788-4665 (fax)[email protected]
Richard WingetMicro Motion7101 Union CourtNorth Wales, PA 19454 USA610-666-3317215-368-8002 (fax)[email protected]
Gregory WuestSulzer Metco (US), Inc.1101 Prospect Ave.Westbury, NY 11590 USA516-338-2217516-338-2488 (fax)[email protected]

Workshop Attendance Page 13
Academia
Christopher C. BerndtSUNY at Stony Brook306 Old EngineeringStony Brook, NY 11794 USA631-632-8507631-632-8525 (fax)[email protected]
Richard KnightDrexel University32nd & Chestnut StreetsDept. of Matls EngineeringPhiladelphia, PA 19104 USA215-895-1844215-895-2332 (fax)[email protected]
Anand KulkarniSUNY at Stony Brook676 Chapin ComplexStony Brook, NY 11790 USA631-632-8515631-632-8440 (fax)[email protected]
Thierry RenaultLaboratoire SPCTSFaculte des Sciences123 av AThomas 87060Limoges, FRANCE335-55457437335-55457211 (fax)[email protected]
Michel VardelleLaboratoire SPCTSFaculte des Sciences123 av AThomas 87060Limoges, [email protected]
Page 14 Workshop Attendance
National Labs (non NIST)
Jean-Francois BissonNational Research Council Canada75 De Mortagne Blvd.Boucherville, QB J4B 6Y4 CANADA450-641-5287450-641-5106 (fax)[email protected]
Richard G. CastroLos Alamos National LaboratoryP.O. Box 1663Los Alamos, NM 87544 USA505-667-5191505-667-5268 (fax)[email protected]
James R. FinckeINEELP.O. Box 1625Idaho Falls, ID 83415 USA208-526-2031208-526-5327 (fax)[email protected]
Leslie KohlerNSWC9500 MacArthur Blvd.West Bethesda, MD 20817 USA301-227-5096301-227-5548 (fax)[email protected]
Andrew MayerSandia National Labs1515 Eubank, SEMS 1130Albuquerque, NM 87123 USA505-845-4380505-844-6611 (fax)[email protected]
Christian MoreauNational Research Council Canada75 De MortagneBoucherville , QB J4B 6Y4 CANADA450-641-5228450-641-5106 (fax)[email protected]
Richard A. NeiserSandia National LaboratoriesMS 1130Albuquerque, NM 87185 USA505-845-4380505-844-0457 (fax)[email protected]
Maria PosadaNSWC9500 MacArthur Blvd.West Bethesda, MD 20817 USA301-227-5017301-227-5576 (fax)[email protected]
A. K. VasudevanOffice of Naval Research800 N. Quincy StreetArlington, VA 22217 USA703-696-8181

Workshop Attendance Page 15
NIST
Mail Address for NIST employees:NameNAT’L INST STDS & TECH100 BUREAU DR STOP xxxxGAITHERSBURG, MD 20899-xxxx
Clare M. AlloccaSTOP 4730301-975-4359301-548-1087 (fax)[email protected]
Frank S. BiancanielloSTOP 8556301-975-6177301-869-5629 (fax)[email protected]
Debasis BasakSTOP [email protected]
Stanley J. DapkunasSTOP 8520301-975-6130301-990-8729 (fax)[email protected]
Jan IlavskyNISTUNICAT, Bldg 438E, ANLArgonne, IL 60439 USA630-252-0866630-252-0862 (fax)[email protected]
Rodney D. JiggettsSTOP 8555301-975-5122301-869-5629 (fax)[email protected]
Steven P. MatesSTOP 8556301-975-8114301-869-5629 (fax)[email protected]
Richard E. RickerSTOP 8553301-975-6023301-975-4553 (fax)[email protected]
Stephen D. RidderSTOP 8556301-975-6175301-869-5629 (fax)[email protected]
Robert J. SchaeferSTOP 8555301-975-5961301-975-4553 (fax)[email protected]
Mark R. StoudtSTOP 8553301-975-6025301-869-5629 (fax)[email protected]

Workshop Slides Page 17
Torch-Based Sensor Systems
S. D. Ridder (NIST)
The NIST Metallurgy Division has initiated aresearch program to investigate coatings produced bythe Thermal Spray (TS) technique. The focus of thisresearch is the development of measurement toolsthat will aid in the understanding and/or control ofthis plasma spray process.
This talk will include a discussion of the results ofrecent work done at NIST on torch-based sensorsystems as well as a brief description of the NIST TSfacility and TS control system.
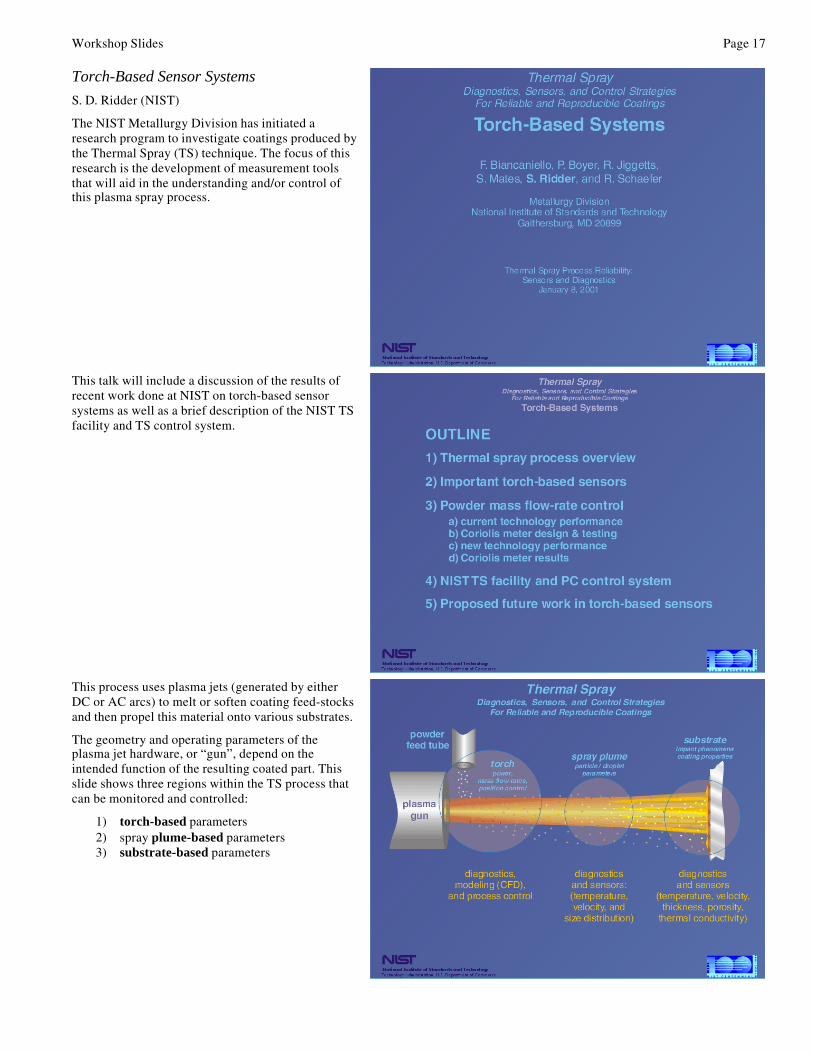
This process uses plasma jets (generated by eitherDC or AC arcs) to melt or soften coating feed-stocksand then propel this material onto various substrates.
The geometry and operating parameters of theplasma jet hardware, or “gun”, depend on theintended function of the resulting coated part. Thisslide shows three regions within the TS process thatcan be monitored and controlled:
1) torch-based parameters2) spray plume-based parameters3) substrate-based parameters
Page 18 Workshop Slides
Torch-Based Sensor Systems (cont.)
S. D. Ridder (NIST)
These are the important TS torch parameters. Mosttorch control consoles provide controls that regulatethe time-averaged arc current and process gas flow-rate. Arc efficiency and stability are not usuallymeasured or controlled. Arc efficiency can becalculated by measuring the power loss to the torchcooling water. Arc stability can be monitored bymeasuring the arc voltage at sufficiently highsampling rates (. 20 kHz for most DC Air PlasmaSpray (APS) systems) to resolve the voltage spikesthat result from arc restrikes. Torch position is oftencontrolled by robotic manipulators or translatingstages and/or rotary tables.
The current technology for powder mass flow-ratecontrol relies on the use of an electronic massbalance. The measurement of powder flow-rate witha mass balance requires a considerable integrationtime to resolve the changes in the powder hoppermass as powder is being fed to the torch. Also,vibrations from the powder feeder or from nearbymachinery must be removed from the mass balancereadings either by mechanical damping or by usingelectronic or software filters.
The powder mass flow sampling rate is, therefore,limited to . 0.1 Hz with the corresponding resolutionof flow-rate fluctuations limited to < 0.05 Hz.
Coriolis meters are used in a large variety ofindustrial processes to measure mass flow-rate ofliquids, gases, and slurry mixtures (powderssuspended in liquids).
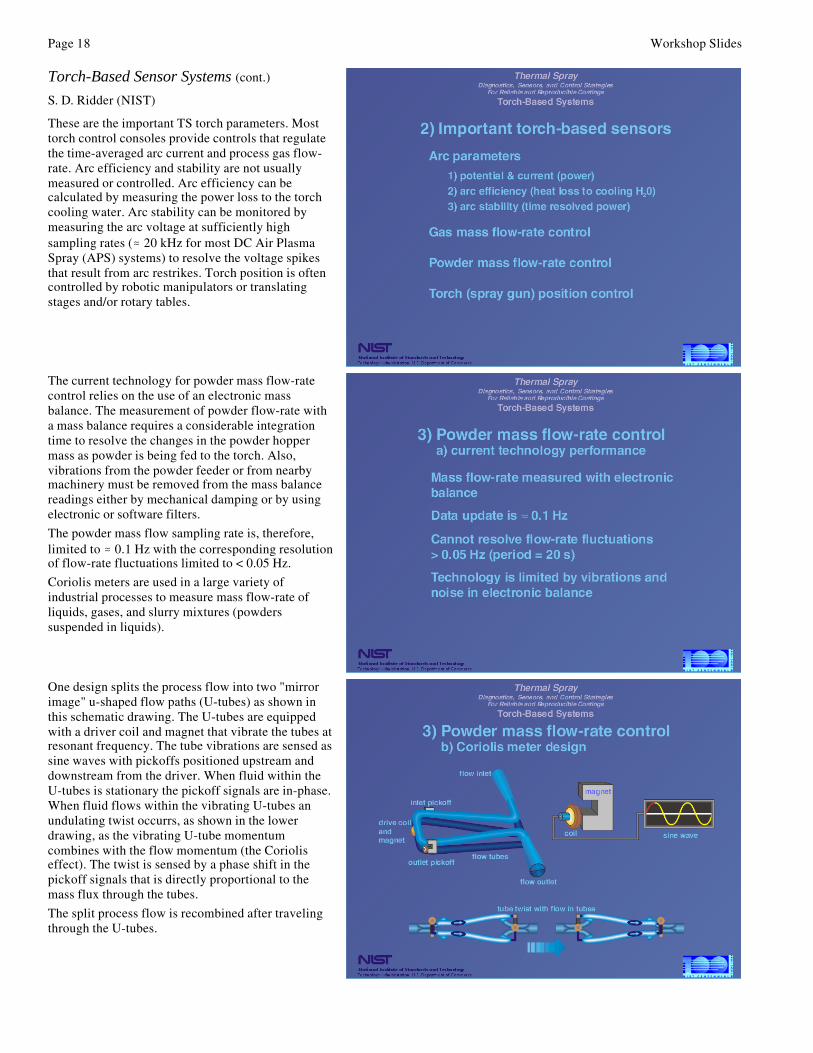
One design splits the process flow into two "mirrorimage" u-shaped flow paths (U-tubes) as shown inthis schematic drawing. The U-tubes are equippedwith a driver coil and magnet that vibrate the tubes atresonant frequency. The tube vibrations are sensed assine waves with pickoffs positioned upstream anddownstream from the driver. When fluid within theU-tubes is stationary the pickoff signals are in-phase.When fluid flows within the vibrating U-tubes anundulating twist occurrs, as shown in the lowerdrawing, as the vibrating U-tube momentumcombines with the flow momentum (the Corioliseffect). The twist is sensed by a phase shift in thepickoff signals that is directly proportional to themass flux through the tubes.
The split process flow is recombined after travelingthrough the U-tubes.
Workshop Slides Page 19
Torch-Based Sensor Systems (cont.)
S. D. Ridder (NIST)
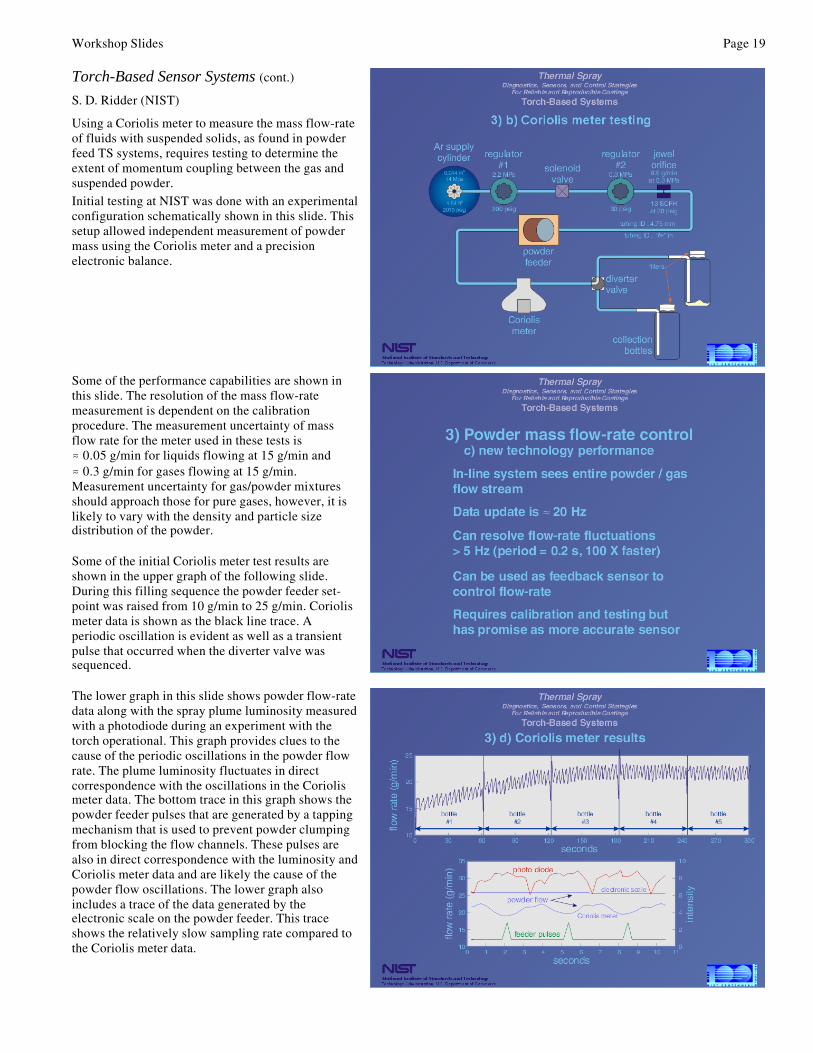
Using a Coriolis meter to measure the mass flow-rateof fluids with suspended solids, as found in powderfeed TS systems, requires testing to determine theextent of momentum coupling between the gas andsuspended powder.Initial testing at NIST was done with an experimentalconfiguration schematically shown in this slide. Thissetup allowed independent measurement of powdermass using the Coriolis meter and a precisionelectronic balance.
Some of the performance capabilities are shown inthis slide. The resolution of the mass flow-ratemeasurement is dependent on the calibrationprocedure. The measurement uncertainty of massflow rate for the meter used in these tests is. 0.05 g/min for liquids flowing at 15 g/min and. 0.3 g/min for gases flowing at 15 g/min.Measurement uncertainty for gas/powder mixturesshould approach those for pure gases, however, it islikely to vary with the density and particle sizedistribution of the powder.
Some of the initial Coriolis meter test results areshown in the upper graph of the following slide.During this filling sequence the powder feeder set-point was raised from 10 g/min to 25 g/min. Coriolismeter data is shown as the black line trace. Aperiodic oscillation is evident as well as a transientpulse that occurred when the diverter valve wassequenced.
The lower graph in this slide shows powder flow-ratedata along with the spray plume luminosity measuredwith a photodiode during an experiment with thetorch operational. This graph provides clues to thecause of the periodic oscillations in the powder flowrate. The plume luminosity fluctuates in directcorrespondence with the oscillations in the Coriolismeter data. The bottom trace in this graph shows thepowder feeder pulses that are generated by a tappingmechanism that is used to prevent powder clumpingfrom blocking the flow channels. These pulses arealso in direct correspondence with the luminosity andCoriolis meter data and are likely the cause of thepowder flow oscillations. The lower graph alsoincludes a trace of the data generated by theelectronic scale on the powder feeder. This traceshows the relatively slow sampling rate compared tothe Coriolis meter data.
Page 20 Workshop Slides
Torch-Based Sensor Systems (cont.)
S. D. Ridder (NIST)
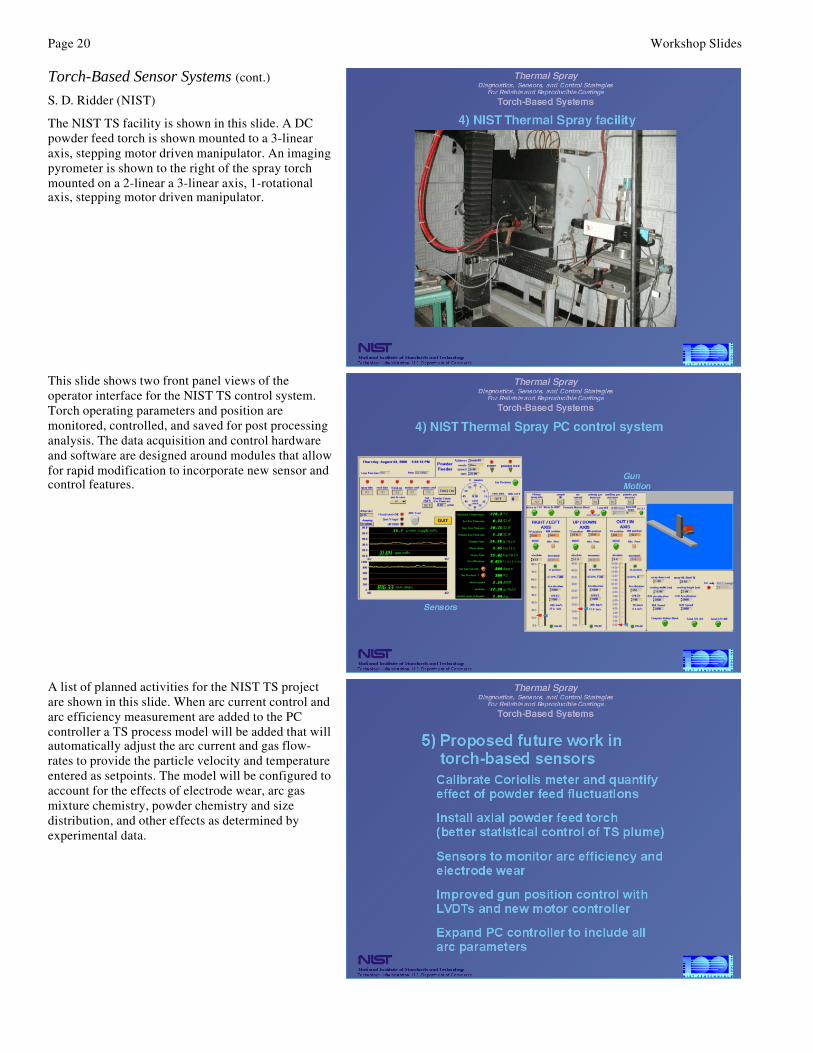
The NIST TS facility is shown in this slide. A DCpowder feed torch is shown mounted to a 3-linearaxis, stepping motor driven manipulator. An imagingpyrometer is shown to the right of the spray torchmounted on a 2-linear a 3-linear axis, 1-rotationalaxis, stepping motor driven manipulator.
This slide shows two front panel views of theoperator interface for the NIST TS control system.Torch operating parameters and position aremonitored, controlled, and saved for post processinganalysis. The data acquisition and control hardwareand software are designed around modules that allowfor rapid modification to incorporate new sensor andcontrol features.
A list of planned activities for the NIST TS projectare shown in this slide. When arc current control andarc efficiency measurement are added to the PCcontroller a TS process model will be added that willautomatically adjust the arc current and gas flow-rates to provide the particle velocity and temperatureentered as setpoints. The model will be configured toaccount for the effects of electrode wear, arc gasmixture chemistry, powder chemistry and sizedistribution, and other effects as determined byexperimental data.

Workshop Slides Page 21
Plume-Based Sensors and Measurements
S. P. Mates (NIST)
NIST Activities in Particle Diagnostics for Thermal Spray
Steven Mates
NRC Post-Doc
Metallurgy Division
January 8, 2001
Outline
• Introduction • NIST activities in Thermal Spray Particle
Sensing: Imaging Pyrometry– how it works; calibration; emissivity issues
• Summary• Current & Future Direction (?)
Repeatability refers to the ability to spray a givencoating onto a part time after time with consistentmicrostructure and properties. If process controlswere sufficient, the operator skill level needed toachieve reproducible coatings would be lessened.
The consensus is that the available controls arenot sufficient, but it is not clear exactly whatmore needs to be measured to achieve sufficientprocess control.
Repeatability in TS Coatings
• Repeatability problems linked to:– torch component wear
– booth set-up
– operator skill
– available controls are insufficient
• Additional sensors are needed to improve reliability– Plume-based sensors
Page 22 Workshop Slides
Plume-Based Sensors and Measurements(cont.)
S. P. Mates (NIST)
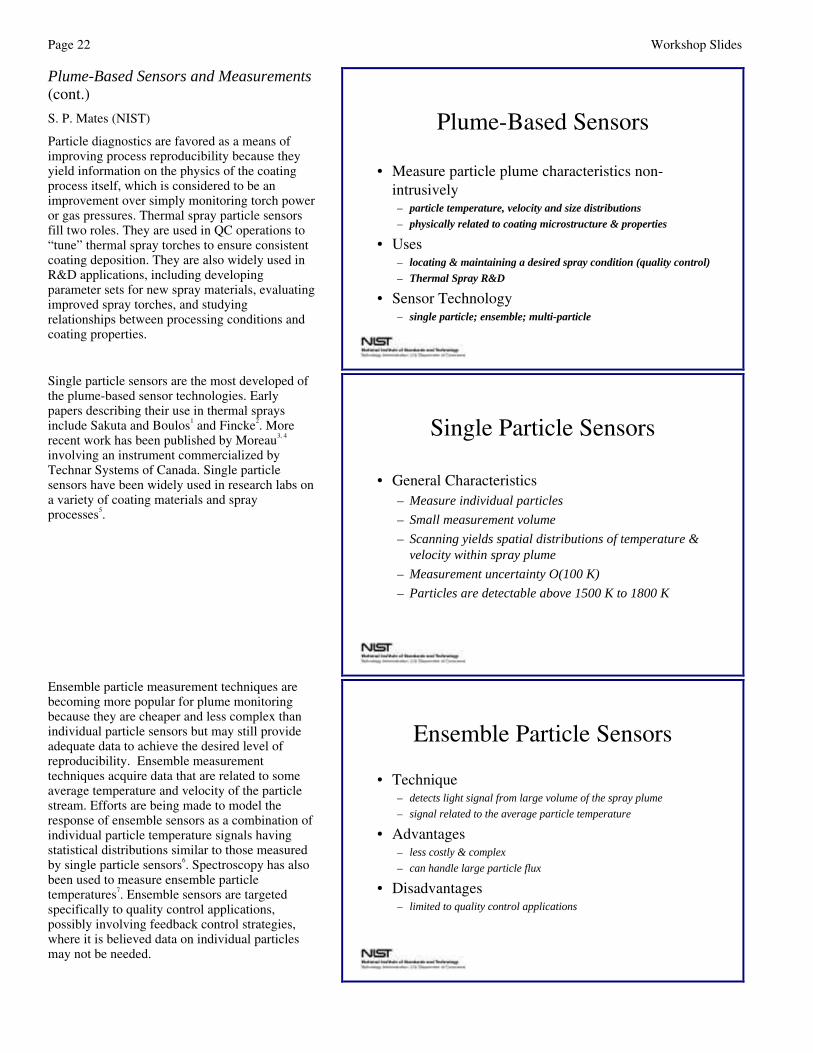
Particle diagnostics are favored as a means ofimproving process reproducibility because theyyield information on the physics of the coatingprocess itself, which is considered to be animprovement over simply monitoring torch poweror gas pressures. Thermal spray particle sensorsfill two roles. They are used in QC operations to“tune” thermal spray torches to ensure consistentcoating deposition. They are also widely used inR&D applications, including developingparameter sets for new spray materials, evaluatingimproved spray torches, and studyingrelationships between processing conditions andcoating properties.
Plume-Based Sensors
• Measure particle plume characteristics non-intrusively– particle temperature, velocity and size distributions
– physically related to coating microstructure & properties
• Uses– locating & maintaining a desired spray condition (quality control)
– Thermal Spray R&D
• Sensor Technology– single particle; ensemble; multi-particle
Single particle sensors are the most developed ofthe plume-based sensor technologies. Earlypapers describing their use in thermal spraysinclude Sakuta and Boulos1 and Fincke2. Morerecent work has been published by Moreau3, 4
involving an instrument commercialized byTechnar Systems of Canada. Single particlesensors have been widely used in research labs ona variety of coating materials and sprayprocesses5.
Single Particle Sensors
• General Characteristics– Measure individual particles
– Small measurement volume
– Scanning yields spatial distributions of temperature & velocity within spray plume
– Measurement uncertainty O(100 K)
– Particles are detectable above 1500 K to 1800 K
Ensemble particle measurement techniques arebecoming more popular for plume monitoringbecause they are cheaper and less complex thanindividual particle sensors but may still provideadequate data to achieve the desired level ofreproducibility. Ensemble measurementtechniques acquire data that are related to someaverage temperature and velocity of the particlestream. Efforts are being made to model theresponse of ensemble sensors as a combination ofindividual particle temperature signals havingstatistical distributions similar to those measuredby single particle sensors6. Spectroscopy has alsobeen used to measure ensemble particletemperatures7. Ensemble sensors are targetedspecifically to quality control applications,possibly involving feedback control strategies,where it is believed data on individual particlesmay not be needed.
Ensemble Particle Sensors
• Technique– detects light signal from large volume of the spray plume
– signal related to the average particle temperature
• Advantages– less costly & complex
– can handle large particle flux
• Disadvantages– limited to quality control applications

Workshop Slides Page 23
Plume-Based Sensors and Measurements(cont.)
S. P. Mates (NIST)
Imaging pyrometry measures multiple individualparticles simultaneously by imaging a largevolume of the spray plume. Measuring particlesacross the entire plume eliminates the need toscan the sensor to obtain spatial distributions ofparticle properties, and increases particle datarates. A fast-shutter CCD camera freezesindividual particle streaks so they can bemeasured. Particle velocity is determined bymeasuring streak lengths and dividing by theexposure time, while particle temperature isdetermined from their two-color intensity ratio.
Imaging Pyrometry
• Yields individual particle data like single particle sensors
• Large measurement volume like ensemble sensors– scanning not needed
– fast data rates (100’s to 1000’s per second)
– visual measurement
– time-resolved measurement
– both QC and R&D uses
SG-100Spray Gun
SprayHood
FocusingLens
Beam Splitting& Filtering Optics
Fast-GateableCCD Camera
ImagingPyrometer
Two images of the particle plume, representingdifferent spectral bandwidths, are focused side-by-side on a single CCD array. Software scanseach image to identify individual particle streaks,compute their intensity at each wavelength, anddetermine their apparent ratio temperature andvelocity. By integrating the intensity over eachentire streak, the intensity measurements are lesssensitive to optical aberrations and de-focusing.
How Imaging Pyrometry Works
Individual particle temperaturesare calculated from:
λS λL
7 mm
18 m
m
T = f
istreak, λ2
istreak, λ1Dual-Wavelength Image (15 µs)
In this experiment, torch parameters were selectedto vary particle temperatures but maintainconstant particle velocities using a simplified one-dimensional model to estimate the plasma jetenthalpy and dynamic pressure.
Sample Temperature Distributions
0
50
100
150
200
250
300
350
400
1200 1700 2200 2700 3200 3700 4200
Temperature [K]
# P
artic
les
"cold"
"medium"
"hot"
molybdenum
(varied arc current and main gas flow rate)
Page 24 Workshop Slides
Plume-Based Sensors and Measurements(cont.)
S. P. Mates (NIST)
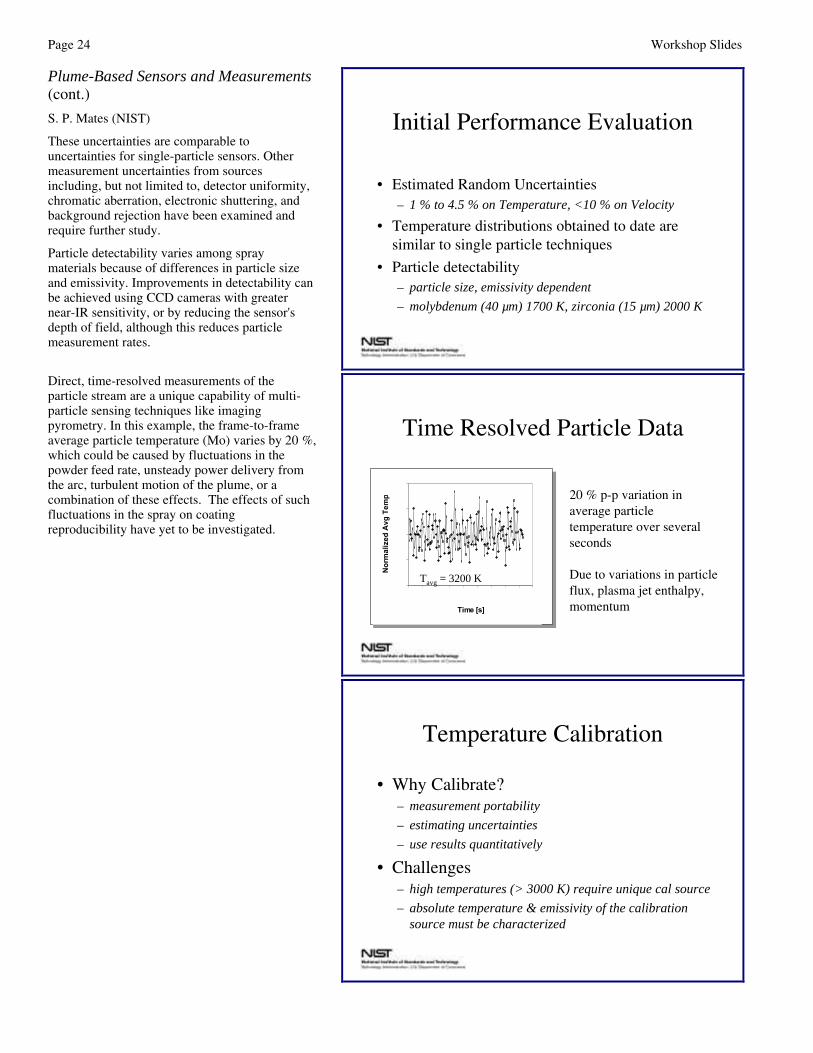
These uncertainties are comparable touncertainties for single-particle sensors. Othermeasurement uncertainties from sourcesincluding, but not limited to, detector uniformity,chromatic aberration, electronic shuttering, andbackground rejection have been examined andrequire further study.
Particle detectability varies among spraymaterials because of differences in particle sizeand emissivity. Improvements in detectability canbe achieved using CCD cameras with greaternear-IR sensitivity, or by reducing the sensor'sdepth of field, although this reduces particlemeasurement rates.
Initial Performance Evaluation
• Estimated Random Uncertainties – 1 % to 4.5 % on Temperature, <10 % on Velocity
• Temperature distributions obtained to date are similar to single particle techniques
• Particle detectability– particle size, emissivity dependent
– molybdenum (40 µm) 1700 K, zirconia (15 µm) 2000 K
Direct, time-resolved measurements of theparticle stream are a unique capability of multi-particle sensing techniques like imagingpyrometry. In this example, the frame-to-frameaverage particle temperature (Mo) varies by 20 %,which could be caused by fluctuations in thepowder feed rate, unsteady power delivery fromthe arc, turbulent motion of the plume, or acombination of these effects. The effects of suchfluctuations in the spray on coatingreproducibility have yet to be investigated.
Time Resolved Particle Data
0.8
0.9
1
1.1
1.2
0 1 2 3 4 5 6 7 8 9
Time [s]
No
rmal
ized
Avg
Tem
p 20 % p-p variation in average particle temperature over severalseconds
Due to variations in particle flux, plasma jet enthalpy,momentum
Tavg = 3200 K
Temperature Calibration
• Why Calibrate?– measurement portability
– estimating uncertainties
– use results quantitatively
• Challenges– high temperatures (> 3000 K) require unique cal source
– absolute temperature & emissivity of the calibration source must be characterized
Workshop Slides Page 25
Plume-Based Sensors and Measurements(cont.)
S. P. Mates (NIST)
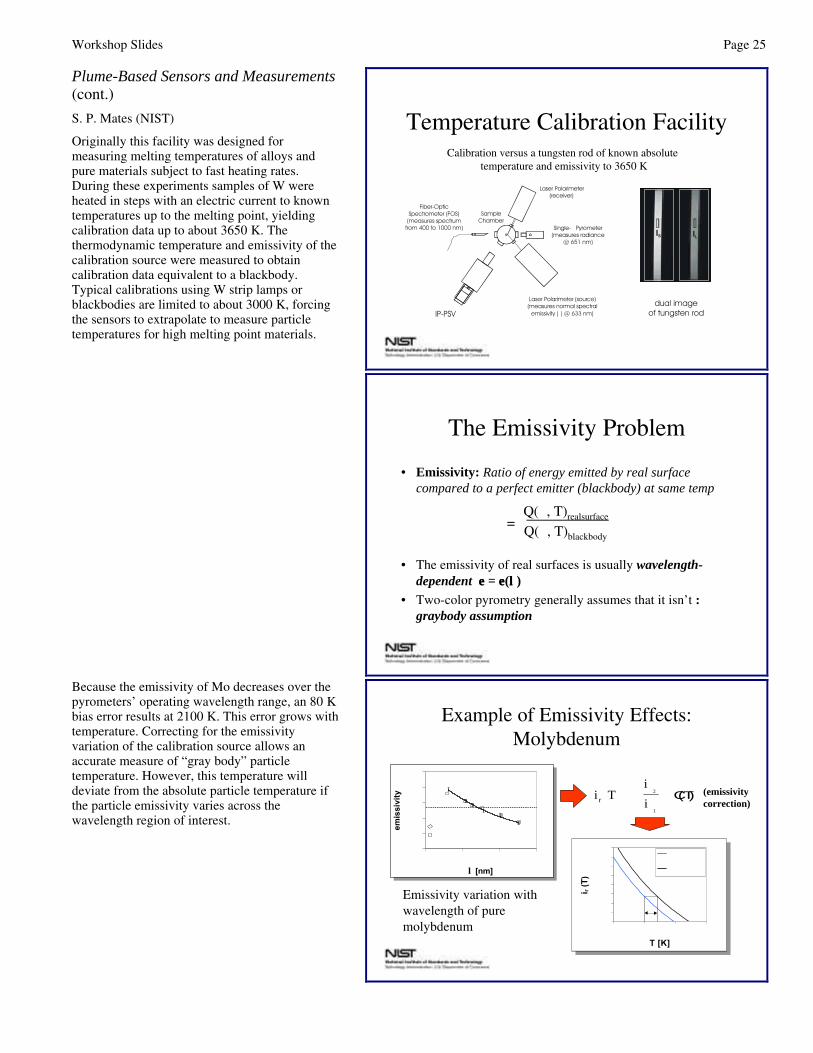
Originally this facility was designed formeasuring melting temperatures of alloys andpure materials subject to fast heating rates.During these experiments samples of W wereheated in steps with an electric current to knowntemperatures up to the melting point, yieldingcalibration data up to about 3650 K. Thethermodynamic temperature and emissivity of thecalibration source were measured to obtaincalibration data equivalent to a blackbody.Typical calibrations using W strip lamps orblackbodies are limited to about 3000 K, forcingthe sensors to extrapolate to measure particletemperatures for high melting point materials.
Temperature Calibration Facility
Single- Pyrometer(measures radiance
@ 651 nm)
λ
Laser Polarimeter(receiver)
Laser Polarimeter (source)(measures normal spectral
emissivity ( ) @ 633 nm)ε
Fiber-OpticSpectrometer (FOS)(measures spectrum
from 400 to 1000 nm)
IP-PSV
SampleChamber
dual imageof tungsten rod
IS
λS λL
IL
Calibration versus a tungsten rod of known absolute temperature and emissivity to 3650 K
The Emissivity Problem
• Emissivity: Ratio of energy emitted by real surface compared to a perfect emitter (blackbody) at same temp
• The emissivity of real surfaces is usually wavelength-dependent εε = εε(λλ)
• Two-color pyrometry generally assumes that it isn’t :graybody assumption
ε =Q(λ, T)blackbody
Q(λ, T)realsurface
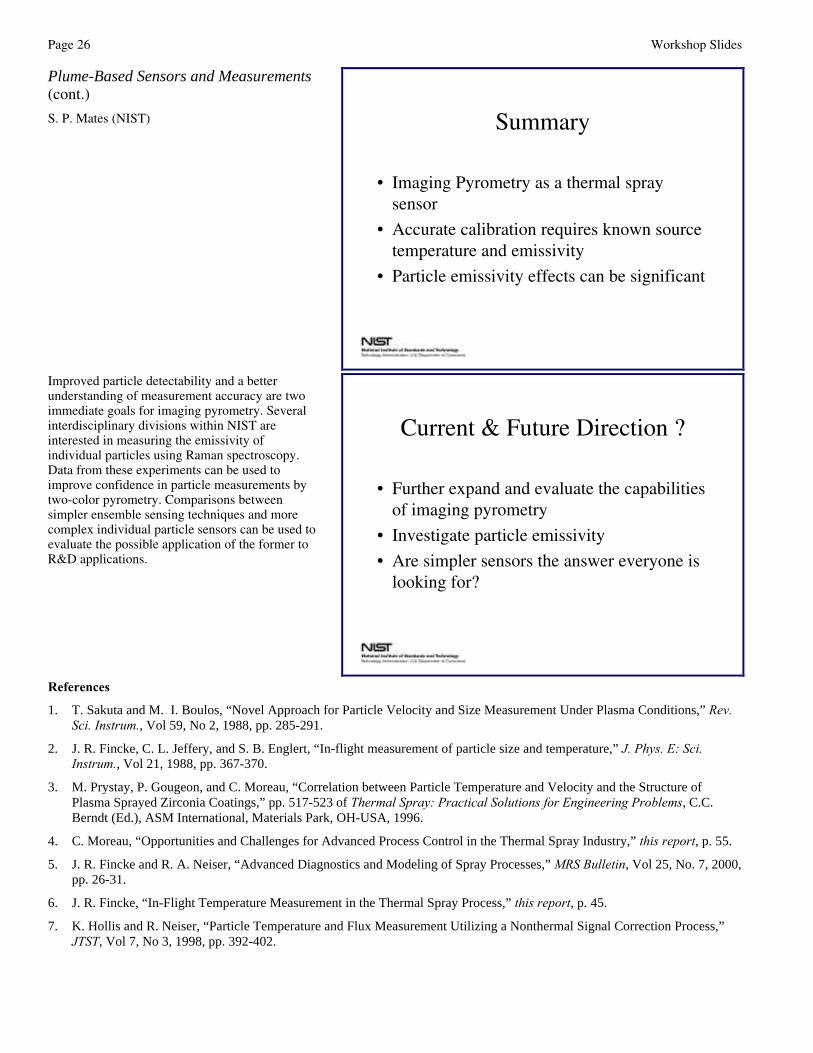
Because the emissivity of Mo decreases over thepyrometers’ operating wavelength range, an 80 Kbias error results at 2100 K. This error grows withtemperature. Correcting for the emissivityvariation of the calibration source allows anaccurate measure of “gray body” particletemperature. However, this temperature willdeviate from the absolute particle temperature ifthe particle emissivity varies across thewavelength region of interest.
Example of Emissivity Effects: Molybdenum
Emissivity variation withwavelength of pure molybdenum 0.7
0.750.8
0.850.9
0.951
1.051.1
1900 2100 2300 2500
T [K]
i r (T
)
EmissivityCorrectedUncorrected
80 K0.7
0.750.8
0.850.9
0.951
1.051.1
1900 2100 2300 2500
T [K]
i r (T
)
EmissivityCorrectedUncorrected
80 K
(emissivitycorrection)
( )i Ti
ir2
1
= ⋅λ
λ
CT( )
0.25
0.28
0.31
0.34
0.37
0.4
400 600 800 1000
λλ [nm]
emis
sivi
ty
2220 K2893 K
graybody
Page 26 Workshop Slides
Plume-Based Sensors and Measurements(cont.)
S. P. Mates (NIST) Summary
• Imaging Pyrometry as a thermal spray sensor
• Accurate calibration requires known source temperature and emissivity
• Particle emissivity effects can be significant
Improved particle detectability and a betterunderstanding of measurement accuracy are twoimmediate goals for imaging pyrometry. Severalinterdisciplinary divisions within NIST areinterested in measuring the emissivity ofindividual particles using Raman spectroscopy.Data from these experiments can be used toimprove confidence in particle measurements bytwo-color pyrometry. Comparisons betweensimpler ensemble sensing techniques and morecomplex individual particle sensors can be used toevaluate the possible application of the former toR&D applications.
Current & Future Direction ?
• Further expand and evaluate the capabilities of imaging pyrometry
• Investigate particle emissivity
• Are simpler sensors the answer everyone is looking for?
References
1. T. Sakuta and M. I. Boulos, “Novel Approach for Particle Velocity and Size Measurement Under Plasma Conditions,” Rev.Sci. Instrum., Vol 59, No 2, 1988, pp. 285-291.
2. J. R. Fincke, C. L. Jeffery, and S. B. Englert, “In-flight measurement of particle size and temperature,” J. Phys. E: Sci.Instrum., Vol 21, 1988, pp. 367-370.
3. M. Prystay, P. Gougeon, and C. Moreau, “Correlation between Particle Temperature and Velocity and the Structure ofPlasma Sprayed Zirconia Coatings,” pp. 517-523 of Thermal Spray: Practical Solutions for Engineering Problems, C.C.Berndt (Ed.), ASM International, Materials Park, OH-USA, 1996.
4. C. Moreau, “Opportunities and Challenges for Advanced Process Control in the Thermal Spray Industry,” this report, p. 55.
5. J. R. Fincke and R. A. Neiser, “Advanced Diagnostics and Modeling of Spray Processes,” MRS Bulletin, Vol 25, No. 7, 2000,pp. 26-31.
6. J. R. Fincke, “In-Flight Temperature Measurement in the Thermal Spray Process,” this report, p. 45.
7. K. Hollis and R. Neiser, “Particle Temperature and Flux Measurement Utilizing a Nonthermal Signal Correction Process,”JTST, Vol 7, No 3, 1998, pp. 392-402.

Workshop Slides Page 27
Optical Sensing of Thermal Spray Substrates andCoatings
J. Geist (Sequoyah Technology, LLC)
Optical Sensing of ThermalSpray Substrates and Coatings
Jon GeistSequoyah Technologies, LLC
The goal of this project is to study the feasibilityof using optical techniques to characterizedifferent properties of substrates and coatings. Optical Sensing of Thermal
Spray Substrates and Coatings
location in process- pre-deposition
- real time
- post-deposition
type of data- defect detection for quality control
X-Y scan gives uniformity variations
- coating property determinationdata + models gives coating properties
The project is currently looking into thepossibility of determining coating thickness bymeasuring the temperature of the coatingoptically while heated by variable-frequency,modulated-laser radiation.
Optical Sensing of ThermalSpray Substrates and Coatingssubstrate/coating temperature
substrate/coating reflectance
coating defect detection (relative)
coating properties (absolute)
- real-time feasibility demonstrated
- substrate quality monitor partially demonstrated
- hardware under development
- theory being developed
Page 28 Workshop Slides
Optical Sensing of Thermal Spray Substrates andCoatings (cont.)
J. Geist (Sequoyah Technology, LLC)
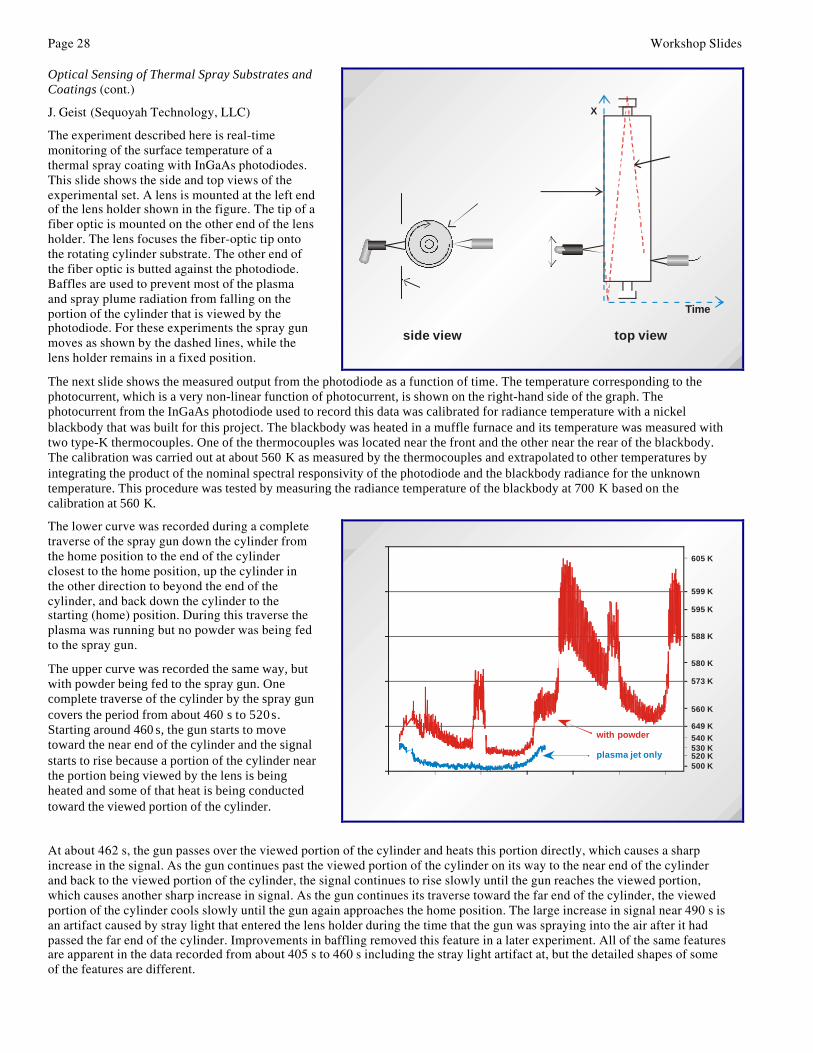
The experiment described here is real-timemonitoring of the surface temperature of athermal spray coating with InGaAs photodiodes.This slide shows the side and top views of theexperimental set. A lens is mounted at the left endof the lens holder shown in the figure. The tip of afiber optic is mounted on the other end of the lensholder. The lens focuses the fiber-optic tip ontothe rotating cylinder substrate. The other end ofthe fiber optic is butted against the photodiode.Baffles are used to prevent most of the plasmaand spray plume radiation from falling on theportion of the cylinder that is viewed by thephotodiode. For these experiments the spray gunmoves as shown by the dashed lines, while thelens holder remains in a fixed position.
Rotatingcylinder
side view
Spraygun
Lensholder
Baffle
Spraygun Lens
holder
Time
X-position of spray gun
X
top view
The next slide shows the measured output from the photodiode as a function of time. The temperature corresponding to thephotocurrent, which is a very non-linear function of photocurrent, is shown on the right-hand side of the graph. Thephotocurrent from the InGaAs photodiode used to record this data was calibrated for radiance temperature with a nickelblackbody that was built for this project. The blackbody was heated in a muffle furnace and its temperature was measured withtwo type-K thermocouples. One of the thermocouples was located near the front and the other near the rear of the blackbody.The calibration was carried out at about 560 K as measured by the thermocouples and extrapolated to other temperatures byintegrating the product of the nominal spectral responsivity of the photodiode and the blackbody radiance for the unknowntemperature. This procedure was tested by measuring the radiance temperature of the blackbody at 700 K based on thecalibration at 560 K.
The lower curve was recorded during a completetraverse of the spray gun down the cylinder fromthe home position to the end of the cylinderclosest to the home position, up the cylinder inthe other direction to beyond the end of thecylinder, and back down the cylinder to thestarting (home) position. During this traverse theplasma was running but no powder was being fedto the spray gun.
The upper curve was recorded the same way, butwith powder being fed to the spray gun. Onecomplete traverse of the cylinder by the spray guncovers the period from about 460 s to 520 s.Starting around 460 s, the gun starts to movetoward the near end of the cylinder and the signalstarts to rise because a portion of the cylinder nearthe portion being viewed by the lens is beingheated and some of that heat is being conductedtoward the viewed portion of the cylinder.
400 420 440 460 480 500 520
TIME (s)
PH
OT
OC
UR
RE
NT
(nA
)
TEM
PE
RATU
RE
0
5
10
15
20
25Entire Experiment
with powder
plasma jet only
605 K
500 K
649 K
573 K
599 K
588 K
520 K530 K540 K
595 K
560 K
580 K
At about 462 s, the gun passes over the viewed portion of the cylinder and heats this portion directly, which causes a sharpincrease in the signal. As the gun continues past the viewed portion of the cylinder on its way to the near end of the cylinderand back to the viewed portion of the cylinder, the signal continues to rise slowly until the gun reaches the viewed portion,which causes another sharp increase in signal. As the gun continues its traverse toward the far end of the cylinder, the viewedportion of the cylinder cools slowly until the gun again approaches the home position. The large increase in signal near 490 s isan artifact caused by stray light that entered the lens holder during the time that the gun was spraying into the air after it hadpassed the far end of the cylinder. Improvements in baffling removed this feature in a later experiment. All of the same featuresare apparent in the data recorded from about 405 s to 460 s including the stray light artifact at, but the detailed shapes of someof the features are different.
Workshop Slides Page 29
Optical Sensing of Thermal Spray Substrates andCoatings (cont.)
J. Geist (Sequoyah Technology, LLC)
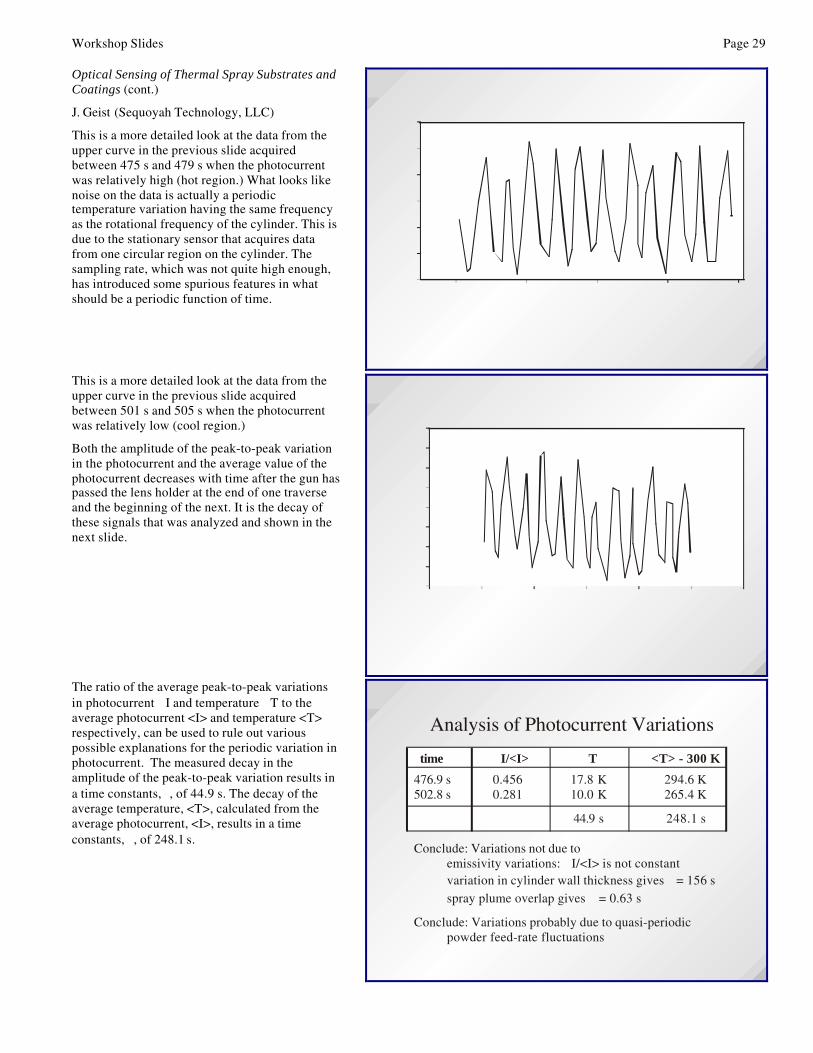
This is a more detailed look at the data from theupper curve in the previous slide acquiredbetween 475 s and 479 s when the photocurrentwas relatively high (hot region.) What looks likenoise on the data is actually a periodictemperature variation having the same frequencyas the rotational frequency of the cylinder. This isdue to the stationary sensor that acquires datafrom one circular region on the cylinder. Thesampling rate, which was not quite high enough,has introduced some spurious features in whatshould be a periodic function of time.
Hot Region
475
TIME (s)
476 477 478 479
PH
OTO
CU
RR
EN
T (n
A)
13
15
17
19
21
23
25
This is a more detailed look at the data from theupper curve in the previous slide acquiredbetween 501 s and 505 s when the photocurrentwas relatively low (cool region.)
Both the amplitude of the peak-to-peak variationin the photocurrent and the average value of thephotocurrent decreases with time after the gun haspassed the lens holder at the end of one traverseand the beginning of the next. It is the decay ofthese signals that was analyzed and shown in thenext slide.
Cool Region
PH
OTO
CU
RR
EN
T (n
A)
TIME (s)
500 501 502 503 504 505 5066.5
7.0
8.0
9.0
10.0
7.5
8.5
9.5
10.5
The ratio of the average peak-to-peak variationsin photocurrent ∆I and temperature ∆T to theaverage photocurrent <I> and temperature <T>respectively, can be used to rule out variouspossible explanations for the periodic variation inphotocurrent. The measured decay in theamplitude of the peak-to-peak variation results ina time constants, τ, of 44.9 s. The decay of theaverage temperature, <T>, calculated from theaverage photocurrent, <I>, results in a timeconstants, τ, of 248.1 s.
Analysis of Photocurrent Variations
Conclude: Variations not due toemissivity variations: I/<I> is not constantvariation in cylinder wall thickness gives = 156 sspray plume overlap gives = 0.63 s
∆τ
τ
Conclude: Variations probably due to quasi-periodicpowder feed-rate fluctuations
476.9 s502.8 s
time
τ
0.4560.281
∆I/<I>
44.9 s
17.8 K10.0 K
∆T
294.6 K265.4 K
<T> - 300 K
248.1 s
Page 30 Workshop Slides
Optical Sensing of Thermal Spray Substrates andCoatings (cont.)
J. Geist (Sequoyah Technology, LLC)
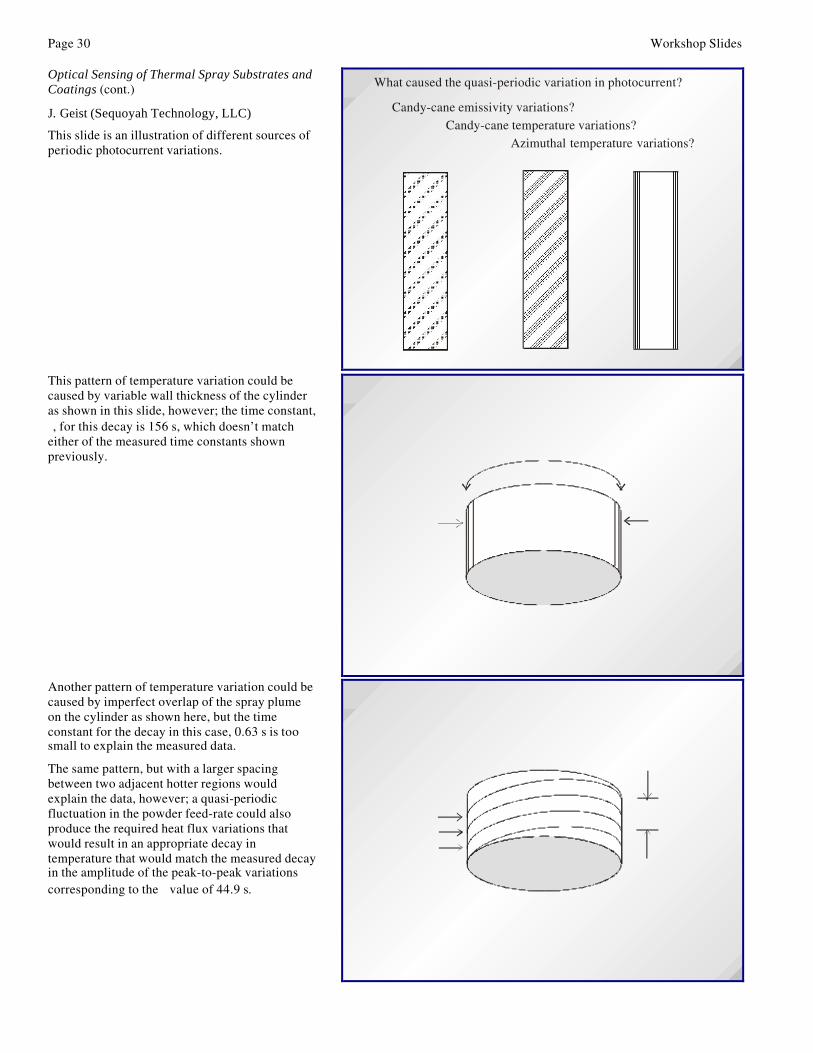
This slide is an illustration of different sources ofperiodic photocurrent variations.
What caused the quasi-periodic variation in photocurrent?
Candy-cane emissivity variations?Candy-cane temperature variations?
Azimuthal temperature variations?
This pattern of temperature variation could becaused by variable wall thickness of the cylinderas shown in this slide, however; the time constant,τ, for this decay is 156 s, which doesn’t matcheither of the measured time constants shownpreviously.
Hotter Hotter
15.7 cm
τ = 156 s
Cooler
Another pattern of temperature variation could becaused by imperfect overlap of the spray plumeon the cylinder as shown here, but the timeconstant for the decay in this case, 0.63 s is toosmall to explain the measured data.
The same pattern, but with a larger spacingbetween two adjacent hotter regions wouldexplain the data, however; a quasi-periodicfluctuation in the powder feed-rate could alsoproduce the required heat flux variations thatwould result in an appropriate decay intemperature that would match the measured decayin the amplitude of the peak-to-peak variationscorresponding to the τ value of 44.9 s.
CoolerHotter
Hotter
1 cm
τ = 0.63 s
Workshop Slides Page 31
Radiation-Stimulated Sensing of CoatingProperties
D. Basak (NIST) Radiation-Stimulated Sensing of Coating Properties
Bi-Directional Reflectometer and Pulsed-Laser Coating Analysis Instrument
Debasis BasakMetallurgy Division
National Institute of Standards and Technology
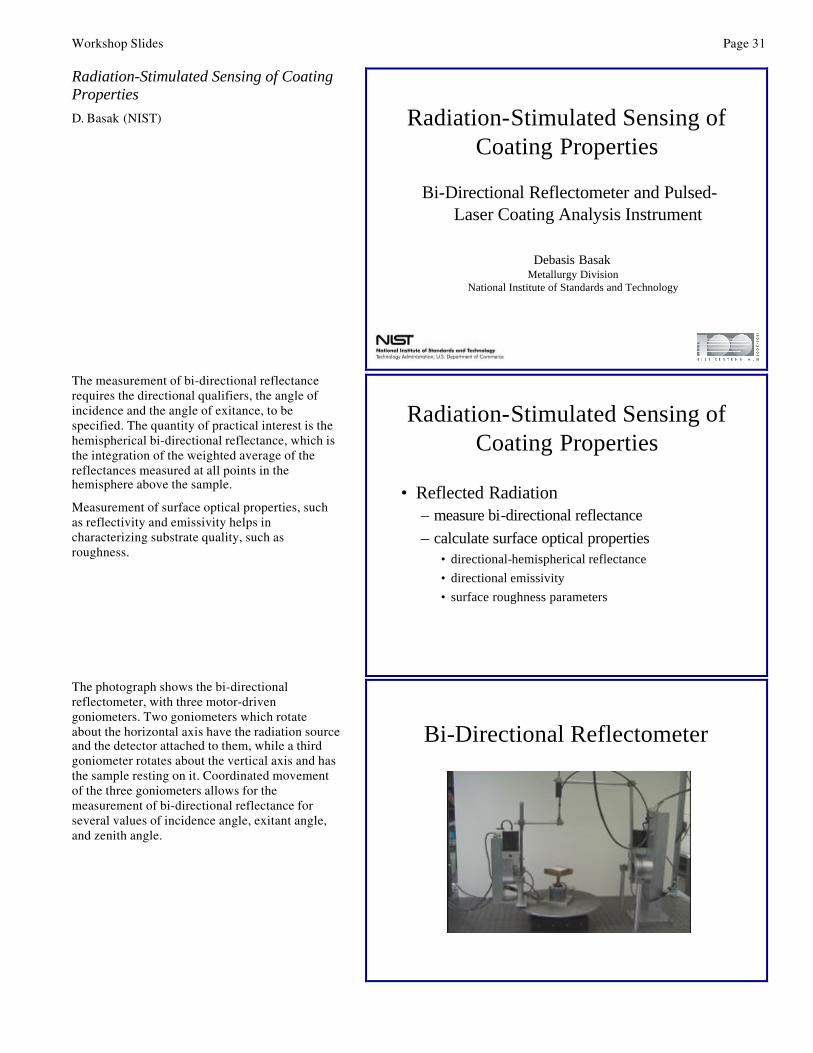
The measurement of bi-directional reflectancerequires the directional qualifiers, the angle ofincidence and the angle of exitance, to bespecified. The quantity of practical interest is thehemispherical bi-directional reflectance, which isthe integration of the weighted average of thereflectances measured at all points in thehemisphere above the sample.
Measurement of surface optical properties, suchas reflectivity and emissivity helps incharacterizing substrate quality, such asroughness.
Radiation-Stimulated Sensing of Coating Properties
• Reflected Radiation– measure bi-directional reflectance
– calculate surface optical properties• directional-hemispherical reflectance
• directional emissivity
• surface roughness parameters
The photograph shows the bi-directionalreflectometer, with three motor-drivengoniometers. Two goniometers which rotateabout the horizontal axis have the radiation sourceand the detector attached to them, while a thirdgoniometer rotates about the vertical axis and hasthe sample resting on it. Coordinated movementof the three goniometers allows for themeasurement of bi-directional reflectance forseveral values of incidence angle, exitant angle,and zenith angle.
Bi-Directional Reflectometer
Page 32 Workshop Slides
Radiation-Stimulated Sensing of CoatingProperties (cont.)
D. Basak (NIST)
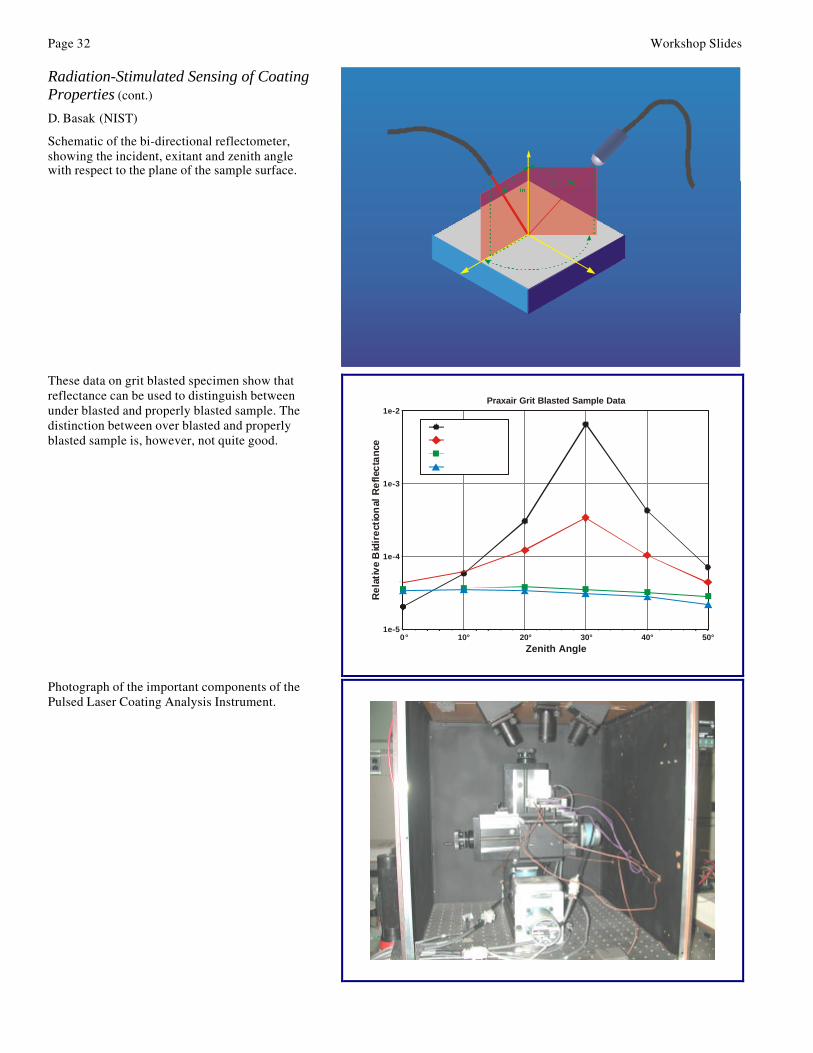
Schematic of the bi-directional reflectometer,showing the incident, exitant and zenith anglewith respect to the plane of the sample surface. θex
Axis 1
P l a n eof
ex i t ance
i n c i d e n tsource f i be r
e x i t a n tl igh t f iber
r e c e i v i n goptics
Axis 2Axis 3
Bi-Directional Reflectometer Geometry
φ
P l a n eofi n c i d e n c e
θin
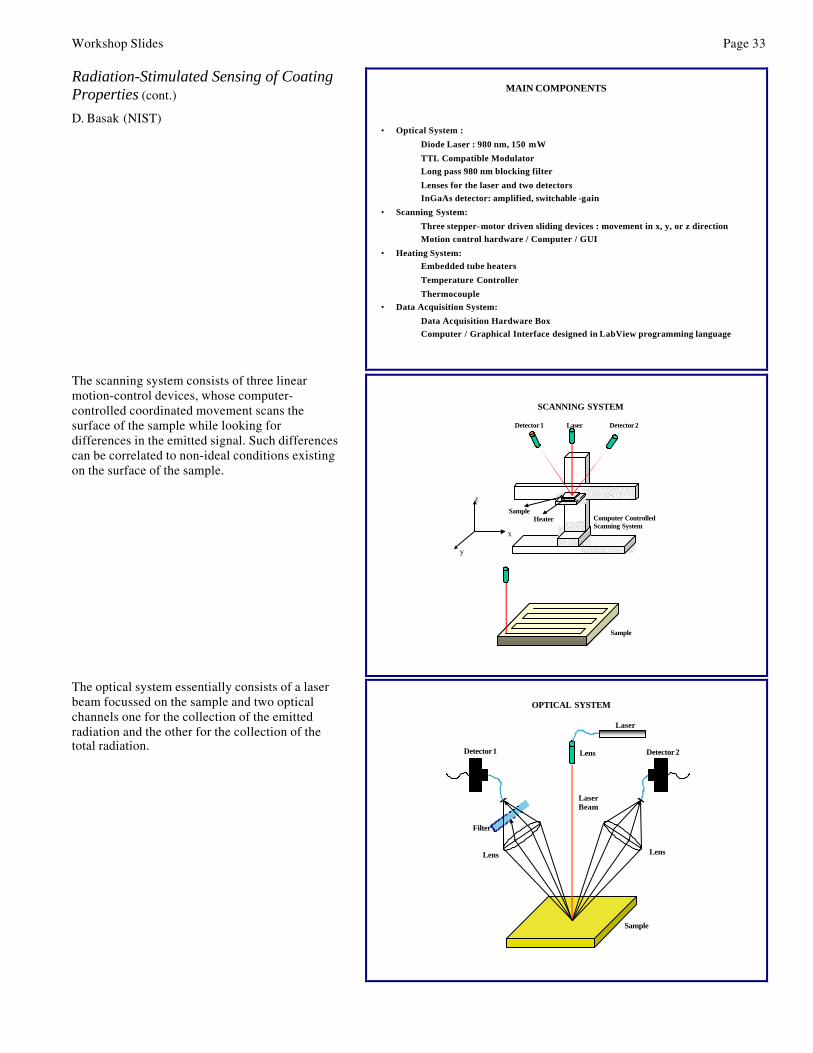
These data on grit blasted specimen show thatreflectance can be used to distinguish betweenunder blasted and properly blasted sample. Thedistinction between over blasted and properlyblasted sample is, however, not quite good.
1e-4
1e-3
1e-2
1e-5
Praxair Grit Blasted Sample Data
Zenith Angle
Re
lati
ve
Bid
ire
ctio
nal
Re
flec
tan
ce
10°0° 20° 30° 40° 50°
S m o o t h
Under B las ted
P r o p e r l y B l a s t e d
O v e r B l a s t e d
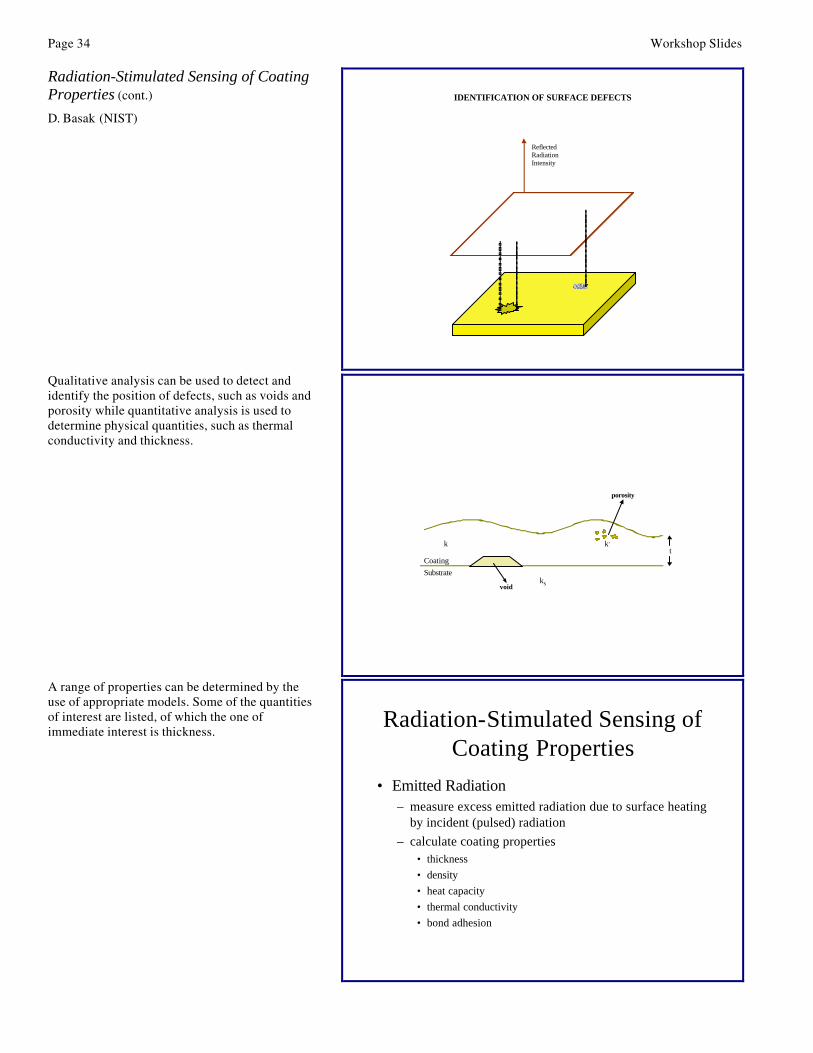
Photograph of the important components of thePulsed Laser Coating Analysis Instrument.
Workshop Slides Page 33
Radiation-Stimulated Sensing of CoatingProperties (cont.)
D. Basak (NIST)
MAIN COMPONENTS
• Optical System :
Diode Laser : 980 nm, 150 mW
TTL Compatible Modulator
Long pass 980 nm blocking filter
Lenses for the laser and two detectors
InGaAs detector: amplified, switchable -gain
• Scanning System:
Three stepper-motor driven sliding devices : movement in x, y, or z direction
Motion control hardware / Computer / GUI
• Heating System:
Embedded tube heaters
Temperature Controller
Thermocouple
• Data Acquisition System:
Data Acquisition Hardware Box
Computer / Graphical Interface designed in LabView programming language
The scanning system consists of three linearmotion-control devices, whose computer-controlled coordinated movement scans thesurface of the sample while looking fordifferences in the emitted signal. Such differencescan be correlated to non-ideal conditions existingon the surface of the sample.
y
x
z
Computer ControlledScanning System
LaserDetector 1 Detector 2
HeaterSample
Sample
SCANNING SYSTEM
The optical system essentially consists of a laserbeam focussed on the sample and two opticalchannels one for the collection of the emittedradiation and the other for the collection of thetotal radiation. Detector 1 Detector 2
Laser
Lens
Filter
LensLens
LaserBeam
Sample
OPTICAL SYSTEM
Page 34 Workshop Slides
Radiation-Stimulated Sensing of CoatingProperties (cont.)
D. Basak (NIST)
ReflectedRadiationIntensity
IDENTIFICATION OF SURFACE DEFECTS
Qualitative analysis can be used to detect andidentify the position of defects, such as voids andporosity while quantitative analysis is used todetermine physical quantities, such as thermalconductivity and thickness.
tk k’
ks
Substrate
Coating
void
porosity
A range of properties can be determined by theuse of appropriate models. Some of the quantitiesof interest are listed, of which the one ofimmediate interest is thickness.
Radiation-Stimulated Sensing of Coating Properties
• Emitted Radiation– measure excess emitted radiation due to surface heating
by incident (pulsed) radiation
– calculate coating properties• thickness
• density
• heat capacity
• thermal conductivity
• bond adhesion

Workshop Slides Page 35
Radiation-Stimulated Sensing of CoatingProperties (cont.)
D. Basak (NIST) Radiation-Stimulated Sensing of Coating Properties
results of X-Y scan of coating to detect non-uniformity of properties
qualitativedetect non-ideal conditions, e.g., de-bonding, porosity
calculation with models provide properties dataquantitativethermal conductivity, specific heat, density

Workshop Slides Page 37
Substrate Analysis: Surface Texture
M. R. Stoudt (NIST)
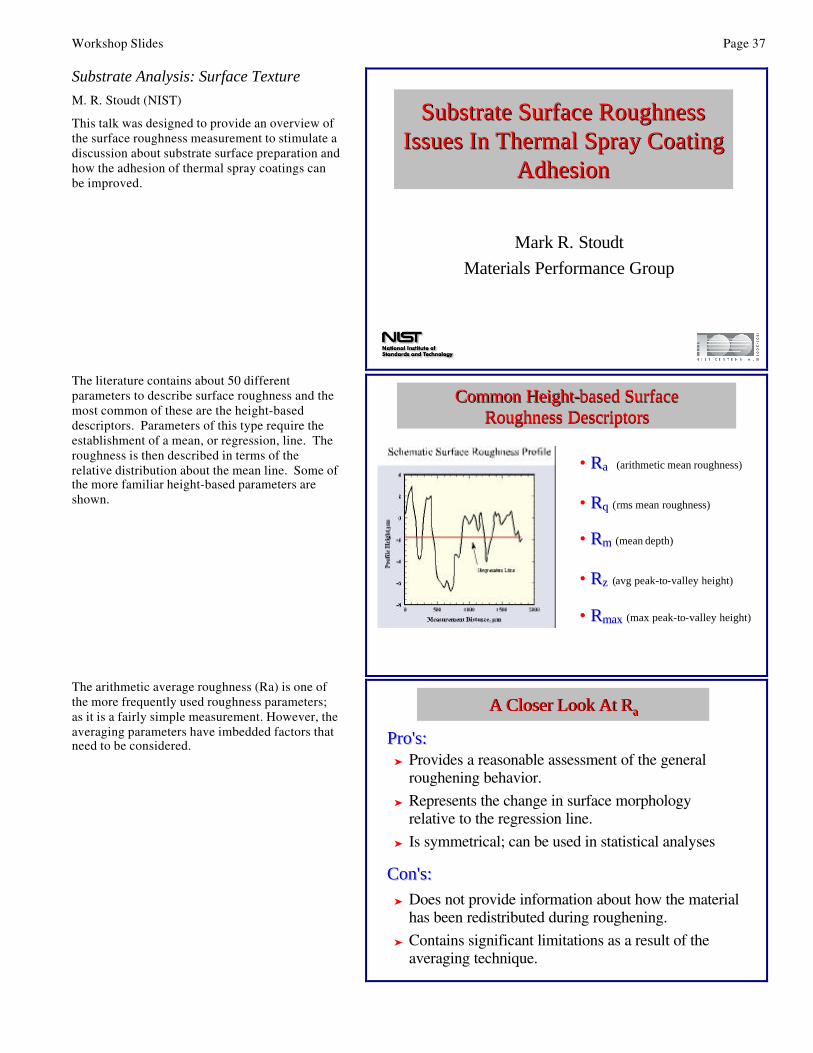
This talk was designed to provide an overview ofthe surface roughness measurement to stimulate adiscussion about substrate surface preparation andhow the adhesion of thermal spray coatings canbe improved.
Substrate Surface Roughness Substrate Surface Roughness Issues In Thermal Spray Coating Issues In Thermal Spray Coating
AdhesionAdhesion
Mark R. Stoudt
Materials Performance Group
The literature contains about 50 differentparameters to describe surface roughness and themost common of these are the height-baseddescriptors. Parameters of this type require theestablishment of a mean, or regression, line. Theroughness is then described in terms of therelative distribution about the mean line. Some ofthe more familiar height-based parameters areshown.
Common HeightCommon Height--based Surface based Surface Roughness DescriptorsRoughness Descriptors
• RRaa (arithmetic mean roughness)
• RRmaxmax (max peak-to-valley height)
• RRqq (rms mean roughness)
• RRmm (mean depth)
• RRzz (avg peak-to-valley height)
The arithmetic average roughness (Ra) is one ofthe more frequently used roughness parameters;as it is a fairly simple measurement. However, theaveraging parameters have imbedded factors thatneed to be considered.
A Closer Look At RA Closer Look At Raa
Provides a reasonable assessment of the general roughening behavior.
Represents the change in surface morphology relative to the regression line.
Is symmetrical; can be used in statistical analyses
Pro's:Pro's:
Con's:Con's: Does not provide information about how the material
has been redistributed during roughening.
Contains significant limitations as a result of the averaging technique.

Page 38 Workshop Slides
Substrate Analysis: Surface Texture (cont.)
M. R. Stoudt (NIST)
The schematic diagram illustrates how anaveraging roughness parameter can produce thesame result for two distinctly different surfacemorphologies. It also demonstrates how Ra doesnot provide information about the distribution ofthe peaks on the surface.
A Closer Look At RA Closer Look At Raa
Ra is an average so two vastly different surface morphologies may have the same Ra value!
Ra
Ra
This is an actual case where the Ra value is thesame for two different surface morphologies. Themicrographs shown are from experimentsperformed on 5052 aluminum. The figure on theleft is a fine-grained specimen pulled in tension tonominally 10 % plastic strain. The figure on theright is also 5052 aluminum, but it has a muchlarger grain size and it was pulled to nominally4 % plastic strain. Factoring in the range ofmeasurement errors, the two figures have thesame Ra.
AA5052 in H0 condition pulled to 4% plastic strain
Ra= 0.144 µm ± 0.007 µm
AA5052 in H32 condition pulled to 10% plastic strain
Ra= 0.142 µm ± 0.023 µm
A Closer Look At RA Closer Look At Raa
A Real World ExampleA Real World Example
No single parameter is sufficient to fullycharacterize a surface. However, there are severalapproaches to achieve a complete measure of thesurface roughness:
One approach is to simply combine differentparameters. Most systems are computercontrolled and the different parameter typesprovide flexibility in how the data can beinterpreted.
A second approach is to map the surfacetopography. Several techniques are available forthis purpose and a 3D representation of thesurface is generally more easy to interpret.
Techniques to Describe a Rough SurfaceTechniques to Describe a Rough Surface
A Combination of Different Roughness Parameters
Topographical Maps– Semi-quantitative description
of surface
The influence of grain size on the rate of surface roughening as measured by Ra and Rmax in AA5052.
Workshop Slides Page 39
Substrate Analysis: Surface Texture (cont.)
M. R. Stoudt (NIST)
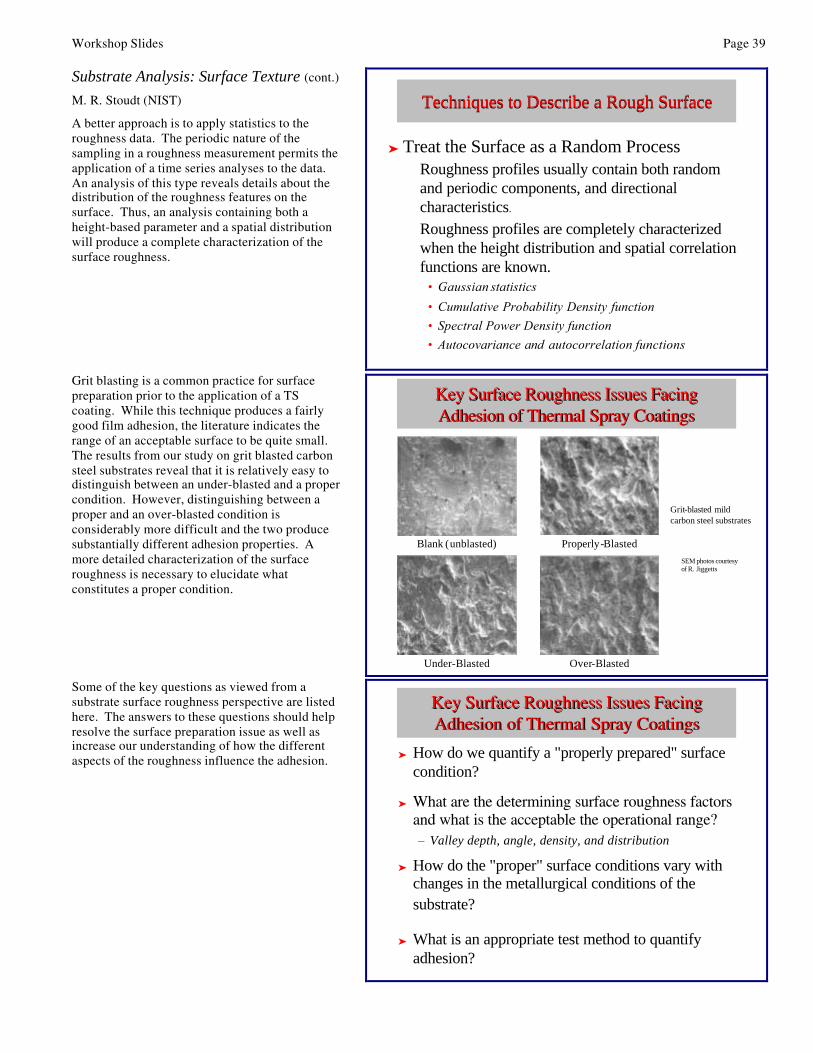
A better approach is to apply statistics to theroughness data. The periodic nature of thesampling in a roughness measurement permits theapplication of a time series analyses to the data.An analysis of this type reveals details about thedistribution of the roughness features on thesurface. Thus, an analysis containing both aheight-based parameter and a spatial distributionwill produce a complete characterization of thesurface roughness.
Treat the Surface as a Random ProcessRoughness profiles usually contain both random and periodic components, and directional characteristics.
Roughness profiles are completely characterized when the height distribution and spatial correlation functions are known.
• Gaussian statistics
• Cumulative Probability Density function• Spectral Power Density function• Autocovariance and autocorrelation functions
Techniques to Describe a Rough SurfaceTechniques to Describe a Rough Surface
Grit blasting is a common practice for surfacepreparation prior to the application of a TScoating. While this technique produces a fairlygood film adhesion, the literature indicates therange of an acceptable surface to be quite small.The results from our study on grit blasted carbonsteel substrates reveal that it is relatively easy todistinguish between an under-blasted and a propercondition. However, distinguishing between aproper and an over-blasted condition isconsiderably more difficult and the two producesubstantially different adhesion properties. Amore detailed characterization of the surfaceroughness is necessary to elucidate whatconstitutes a proper condition.
Key Surface Roughness Issues FacingKey Surface Roughness Issues FacingAdhesion of Thermal Spray CoatingsAdhesion of Thermal Spray Coatings
Blank (unblasted)
Over-BlastedUnder-Blasted
Properly-Blasted
SEM photos courtesy of R. Jiggetts
Grit-blasted mildcarbon steel substrates
Some of the key questions as viewed from asubstrate surface roughness perspective are listedhere. The answers to these questions should helpresolve the surface preparation issue as well asincrease our understanding of how the differentaspects of the roughness influence the adhesion. How do we quantify a "properly prepared" surface
condition?
What are the determining surface roughness factors and what is the acceptable the operational range?– Valley depth, angle, density, and distribution
How do the "proper" surface conditions vary with changes in the metallurgical conditions of the substrate?
What is an appropriate test method to quantify adhesion?
Key Surface Roughness Issues FacingKey Surface Roughness Issues FacingAdhesion of Thermal Spray CoatingsAdhesion of Thermal Spray Coatings

Workshop Slides Page 41
Substrate Analysis: Grit Blasting
R. D. Jiggetts (NIST)
Many discussions have stemmed from one simplequestion. "How do you determine a properlyprepared substrate?"

Page 42 Workshop Slides
Substrate Analysis: Grit Blasting (cont.)
R. D. Jiggetts (NIST)
To determine if grit blasting removed, or movedthe surface of a substrate, a mild steel substratewas coated (electro-deposited) with Ni then thecoating was polished down to ≈ 25 µm. Thesubstrate was then grit blasted under normalconditions. Metallography shows that the surface"is" removed and moved.
Workshop Slides Page 43
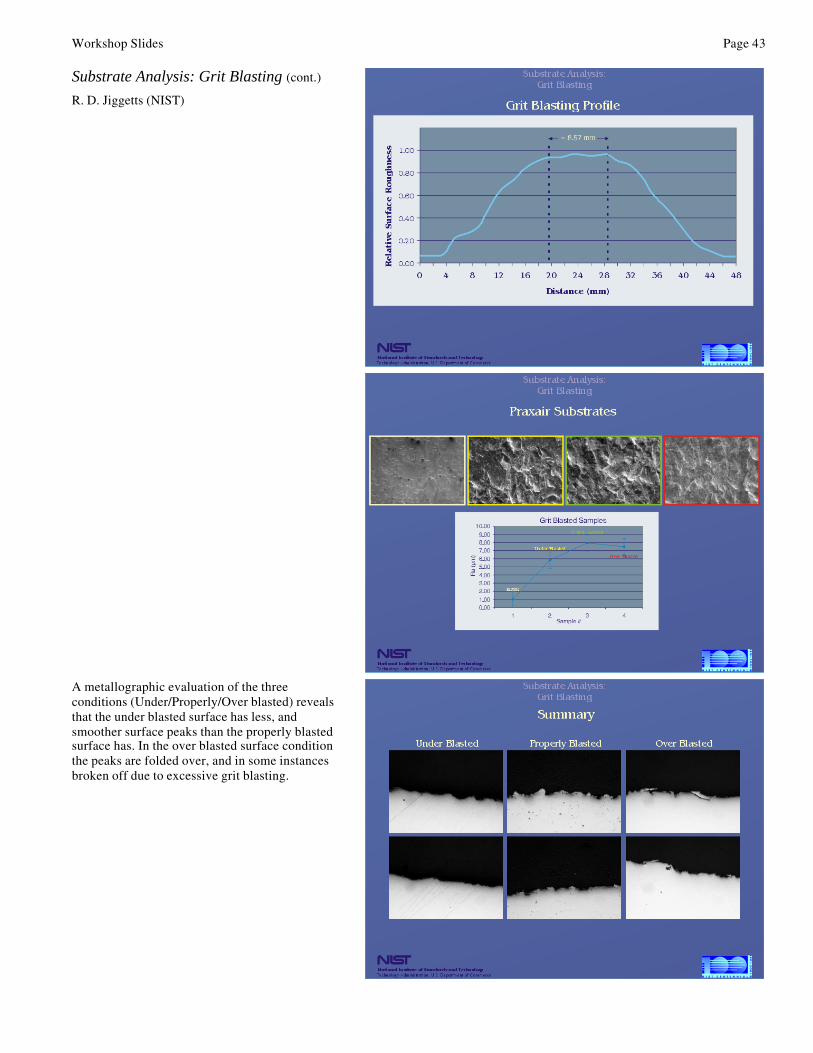
Substrate Analysis: Grit Blasting (cont.)
R. D. Jiggetts (NIST)
A metallographic evaluation of the threeconditions (Under/Properly/Over blasted) revealsthat the under blasted surface has less, andsmoother surface peaks than the properly blastedsurface has. In the over blasted surface conditionthe peaks are folded over, and in some instancesbroken off due to excessive grit blasting.

Page 44 Workshop Slides
Substrate Analysis: Grit Blasting (cont.)
R. D. Jiggetts (NIST)
Workshop Slides Page 45
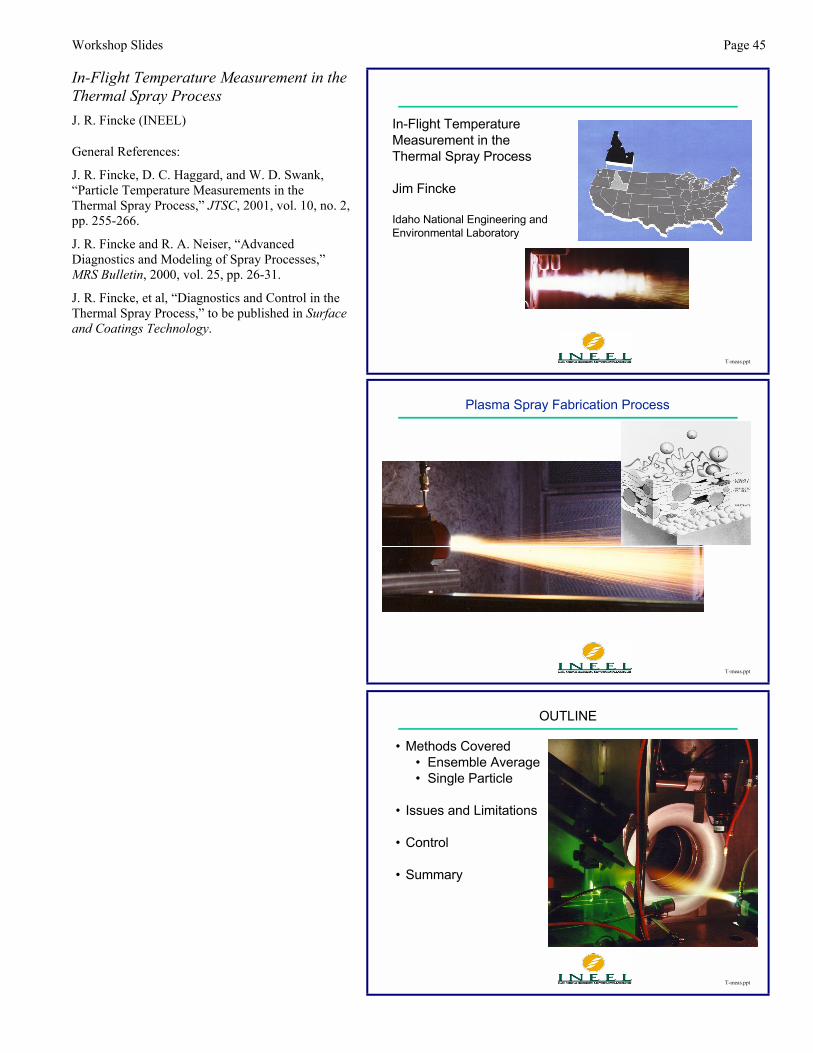
In-Flight Temperature Measurement in theThermal Spray ProcessJ. R. Fincke (INEEL)
General References:
J. R. Fincke, D. C. Haggard, and W. D. Swank,Particle Temperature Measurements in theThermal Spray Process, JTSC, 2001, vol. 10, no. 2,pp. 255-266.
J. R. Fincke and R. A. Neiser, AdvancedDiagnostics and Modeling of Spray Processes,MRS Bulletin, 2000, vol. 25, pp. 26-31.
J. R. Fincke, et al, Diagnostics and Control in theThermal Spray Process, to be published in Surfaceand Coatings Technology.
T-meas.ppt
In-Flight Temperature Measurement in the Thermal Spray Process
Jim Fincke
Idaho National Engineering and Environmental Laboratory
T-meas.ppt
Plasma Spray Fabrication Process
T-meas.ppt
OUTLINE
Methods Covered Ensemble Average Single Particle
Issues and Limitations
Control
Summary
Page 46 Workshop Slides
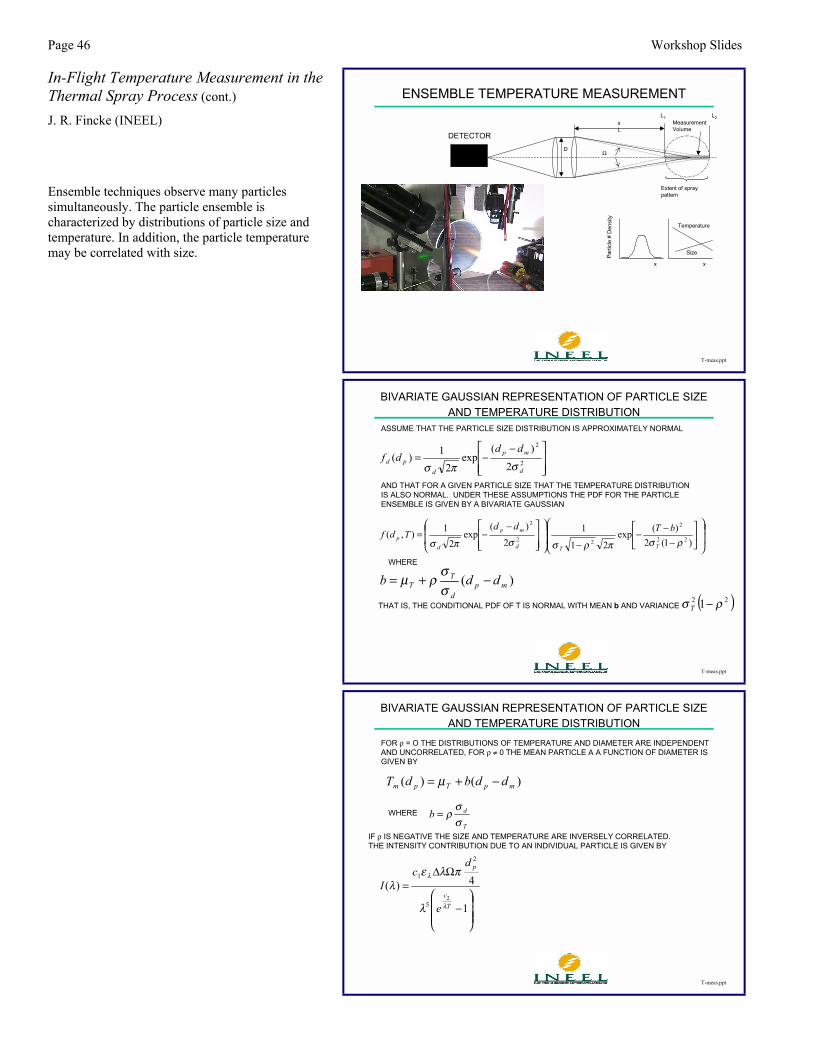
In-Flight Temperature Measurement in theThermal Spray Process (cont.)
J. R. Fincke (INEEL)
Ensemble techniques observe many particlessimultaneously. The particle ensemble ischaracterized by distributions of particle size andtemperature. In addition, the particle temperaturemay be correlated with size.
T-meas.ppt
ENSEMBLE TEMPERATURE MEASUREMENT
MeasurementVolume
xL
DΩ
Extent of spray pattern
Size
Temperature
xx
L1 L2
Parti
cle
# D
ensi
ty
DETECTOR
T-meas.ppt
BIVARIATE GAUSSIAN REPRESENTATION OF PARTICLE SIZE AND TEMPERATURE DISTRIBUTION
−−=
2
2
2
)(exp
21)(
d
mp
dpd
dddf
σπσ
−−
−−
−−=
)1(2)(
exp21
12
)(exp
21),(
22
2
22
2
ρσπρσσπσ TTd
mp
dp
bTddTdf
)( mpd
TT ddb −+=
σσ
ρµ
ASSUME THAT THE PARTICLE SIZE DISTRIBUTION IS APPROXIMATELY NORMAL
AND THAT FOR A GIVEN PARTICLE SIZE THAT THE TEMPERATURE DISTRIBUTION IS ALSO NORMAL. UNDER THESE ASSUMPTIONS THE PDF FOR THE PARTICLE ENSEMBLE IS GIVEN BY A BIVARIATE GAUSSIAN
WHERE
THAT IS, THE CONDITIONAL PDF OF T IS NORMAL WITH MEAN b AND VARIANCE ( )22 1 ρσ −T
T-meas.ppt
BIVARIATE GAUSSIAN REPRESENTATION OF PARTICLE SIZE AND TEMPERATURE DISTRIBUTION
)()( mpTpm ddbdT −+= µ
FOR ρ = O THE DISTRIBUTIONS OF TEMPERATURE AND DIAMETER ARE INDEPENDENT AND UNCORRELATED, FOR ρ ≠ 0 THE MEAN PARTICLE A A FUNCTION OF DIAMETER IS GIVEN BY
WHERE T
dbσσ
ρ=
−
Ω∆=
1
4)(2
5
2
1
Tc
p
e
dc
I
λ
λ
λ
πλελ
IF ρ IS NEGATIVE THE SIZE AND TEMPERATURE ARE INVERSELY CORRELATED. THE INTENSITY CONTRIBUTION DUE TO AN INDIVIDUAL PARTICLE IS GIVEN BY
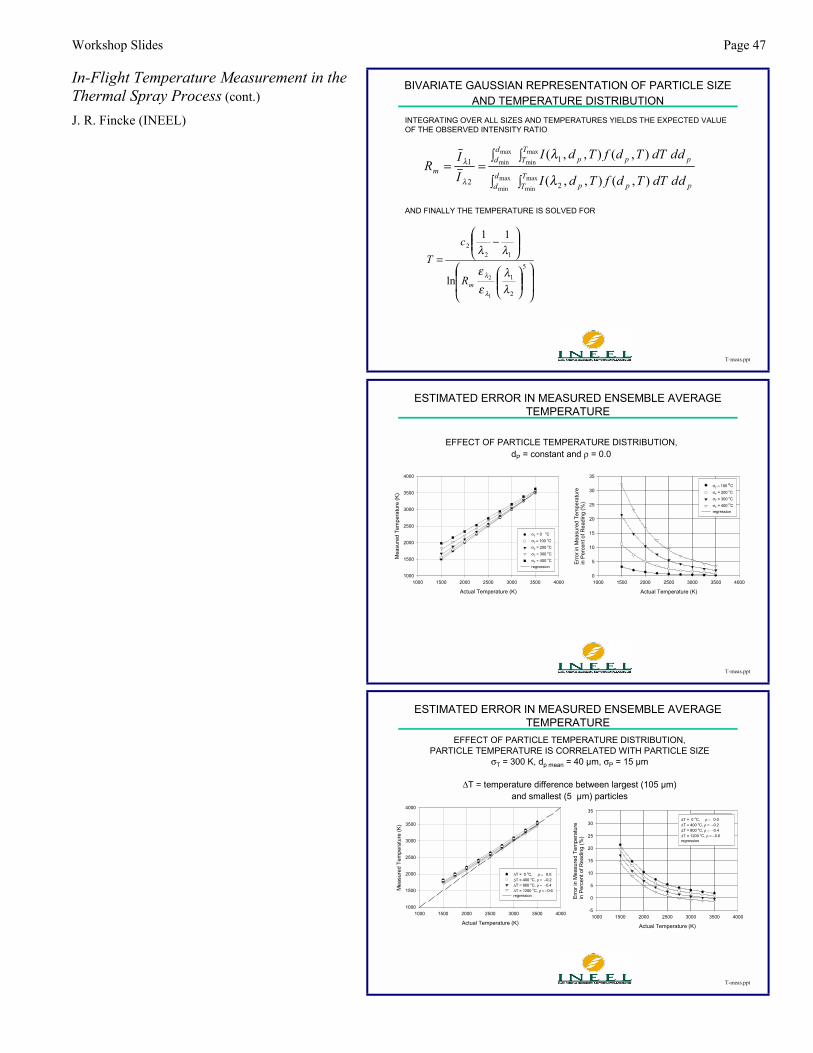
Workshop Slides Page 47
In-Flight Temperature Measurement in theThermal Spray Process (cont.)
J. R. Fincke (INEEL)
T-meas.ppt
BIVARIATE GAUSSIAN REPRESENTATION OF PARTICLE SIZE AND TEMPERATURE DISTRIBUTION
pTT pp
dd
pTT pp
dd
mdddTTdfTdI
dddTTdfTdI
II
R∫∫
∫∫==
maxmin
maxmin
maxmin
maxmin
),(),,(
),(),,(
2
1
2
1
λ
λ
λ
λ
−
=5
2
1
122
1
2ln
11
λλ
ε
ε
λλ
λ
λmR
cT
INTEGRATING OVER ALL SIZES AND TEMPERATURES YIELDS THE EXPECTED VALUE OF THE OBSERVED INTENSITY RATIO
AND FINALLY THE TEMPERATURE IS SOLVED FOR
T-meas.ppt
ESTIMATED ERROR IN MEASURED ENSEMBLE AVERAGE TEMPERATURE
Actual Temperature (K)
1000 1500 2000 2500 3000 3500 4000
Mea
sure
d Te
mpe
ratu
re (K
)
1000
1500
2000
2500
3000
3500
4000
σT = 0 oCσT = 100 oCσT = 200 oCσT = 300 oCσT = 400 oCregression
Actual Temperature (K)
1000 1500 2000 2500 3000 3500 4000Er
ror i
n M
easu
red
Tem
pera
ture
in P
erce
nt o
f Rea
ding
(%)
0
5
10
15
20
25
30
35
σΤ = 100 οCσT = 200 oCσT = 300 oCσT = 400 OCregression
EFFECT OF PARTICLE TEMPERATURE DISTRIBUTION, dP = constant and ρ = 0.0
T-meas.ppt
ESTIMATED ERROR IN MEASURED ENSEMBLE AVERAGE TEMPERATURE
Actual Temperature (K)
1000 1500 2000 2500 3000 3500 4000
Mea
sure
d Te
mpe
ratu
re (K
)
1000
1500
2000
2500
3000
3500
4000
∆T = 0 oC, ρ = 0.0 ∆T = 400 oC, ρ = −0.2∆T = 800 oC, ρ = −0.4∆T = 1200 oC, ρ = −0.6regression
Actual Temperature (K)
1000 1500 2000 2500 3000 3500 4000
Erro
r in
Mea
sure
d Te
mpe
ratu
rein
Per
cent
of R
eadi
ng (%
)
-5
0
5
10
15
20
25
30
35
∆Τ = 0 oC∆T = 400 oC∆T = 800 oC∆T = 1200 OCregression
∆T = 0 oC, ρ = 0.0 ∆T = 400 oC, ρ = −0.2∆T = 800 oC, ρ = −0.4∆T = 1200 oC, ρ = −0.6regression
EFFECT OF PARTICLE TEMPERATURE DISTRIBUTION,PARTICLE TEMPERATURE IS CORRELATED WITH PARTICLE SIZE
σT = 300 K, dp mean = 40 µm, σP = 15 µm
∆T = temperature difference between largest (105 µm)and smallest (5 µm) particles
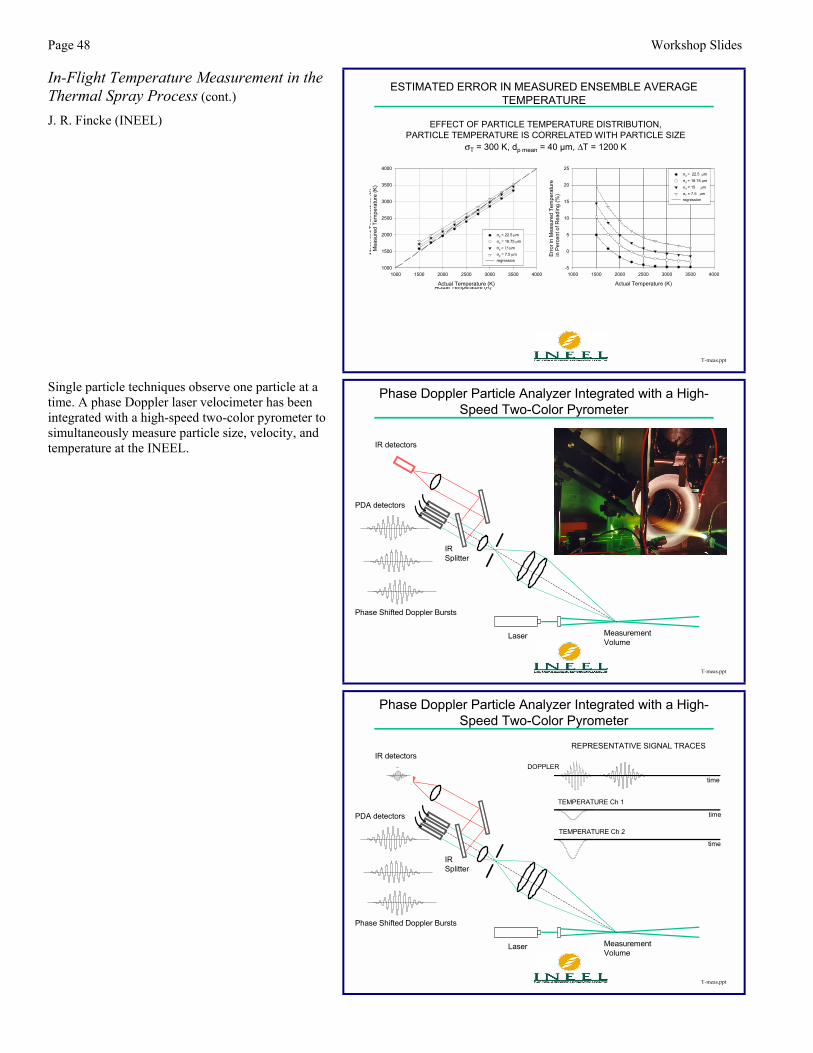
Page 48 Workshop Slides
In-Flight Temperature Measurement in theThermal Spray Process (cont.)
J. R. Fincke (INEEL)
T-meas.ppt
ESTIMATED ERROR IN MEASURED ENSEMBLE AVERAGE TEMPERATURE
Actual Temperature (K)
1000 1500 2000 2500 3000 3500 4000
Erro
r in
Mea
sure
d Te
mpe
ratu
rein
Per
cent
of R
eadi
ng (%
)
-5
0
5
10
15
20
25σd = 22.5 µmσd = 18.75 µmσd = 15 µmσT = 7.5 µmregression
EFFECT OF PARTICLE TEMPERATURE DISTRIBUTION,PARTICLE TEMPERATURE IS CORRELATED WITH PARTICLE SIZE
σT = 300 K, dp mean = 40 µm, ∆T = 1200 K
Actual Temperature (K)
1000 1500 2000 2500 3000 3500 4000
Mea
sure
d Te
mpe
ratu
re (K
)
1000
1500
2000
2500
3000
3500
4000
σd = 22.5 µmσd = 18.75 µmσd = 15 µm
σd = 7.5 µmregression
Actual Temperature (K)
1000 1500 2000 2500 3000 3500 4000
Mea
sure
d Te
mpe
ratu
re (K
)
1000
1500
2000
2500
3000
3500
4000
σd = 22.5 µmσd = 18.75 µmσd = 15 µm
σd = 7.5 µmregression
Single particle techniques observe one particle at atime. A phase Doppler laser velocimeter has beenintegrated with a high-speed two-color pyrometer tosimultaneously measure particle size, velocity, andtemperature at the INEEL.
T-meas.ppt
Phase Doppler Particle Analyzer Integrated with a High-Speed Two-Color Pyrometer
IR detectors
PDA detectors
Phase Shifted Doppler Bursts
Laser MeasurementVolume
IRSplitter
T-meas.ppt
Phase Doppler Particle Analyzer Integrated with a High-Speed Two-Color Pyrometer
IR detectors
PDA detectors
Phase Shifted Doppler Bursts
Laser MeasurementVolume
IRSplitter
REPRESENTATIVE SIGNAL TRACES
time
time
time
DOPPLER
TEMPERATURE Ch 1
TEMPERATURE Ch 2
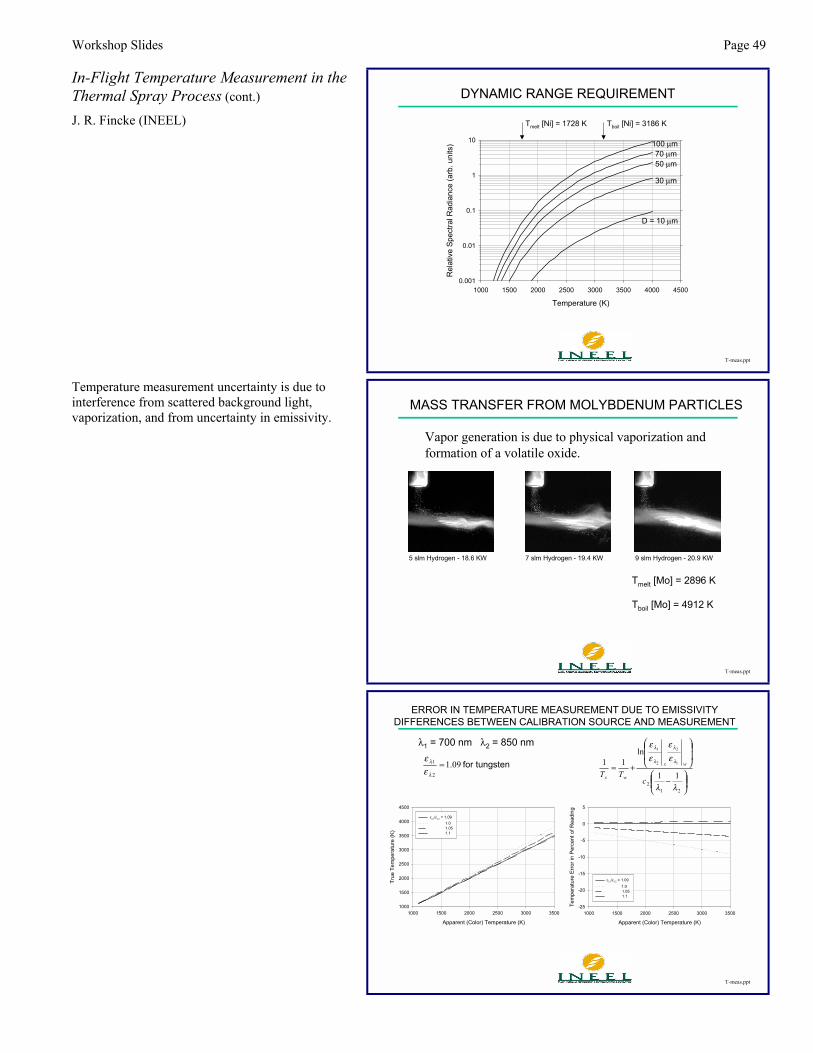
Workshop Slides Page 49
In-Flight Temperature Measurement in theThermal Spray Process (cont.)
J. R. Fincke (INEEL)
T-meas.ppt
DYNAMIC RANGE REQUIREMENT
Temperature (K)
1000 1500 2000 2500 3000 3500 4000 4500
Rel
ativ
e Sp
ectra
l Rad
ianc
e (a
rb. u
nits
)
0.001
0.01
0.1
1
10
Tmelt [Ni] = 1728 K Tboil [Ni] = 3186 K
100 µm70 µm50 µm
30 µm
D = 10 µm
Temperature measurement uncertainty is due tointerference from scattered background light,vaporization, and from uncertainty in emissivity.
T-meas.ppt
MASS TRANSFER FROM MOLYBDENUM PARTICLES
Tmelt [Mo] = 2896 K
Tboil [Mo] = 4912 K
9 slm Hydrogen - 20.9 KW7 slm Hydrogen - 19.4 KW5 slm Hydrogen - 18.6 KW
Vapor generation is due to physical vaporization and formation of a volatile oxide.
T-meas.ppt
ERROR IN TEMPERATURE MEASUREMENT DUE TO EMISSIVITY DIFFERENCES BETWEEN CALIBRATION SOURCE AND MEASUREMENT
Apparent (Color) Temperature (K)
1000 1500 2000 2500 3000 3500
True
Tem
pera
ture
(K)
1000
1500
2000
2500
3000
3500
4000
4500
ελ1/ελ2 = 1.09 1.0 1.05 1.1
Apparent (Color) Temperature (K)
1000 1500 2000 2500 3000 3500
Tem
pera
ture
Erro
r in
Perc
ent o
f Rea
ding
-25
-20
-15
-10
-5
0
5
ελ1/ελ2 = 1.09 1.0 1.05 1.1
λ1 = 700 nm λ2 = 850 nm
tungsten for 09.12
1 =λ
λ
εε
−
+=
212
11
ln11 1
2
2
1
λλ
ε
ε
ε
ε
λ
λ
λ
λ
cTT
wx
wx
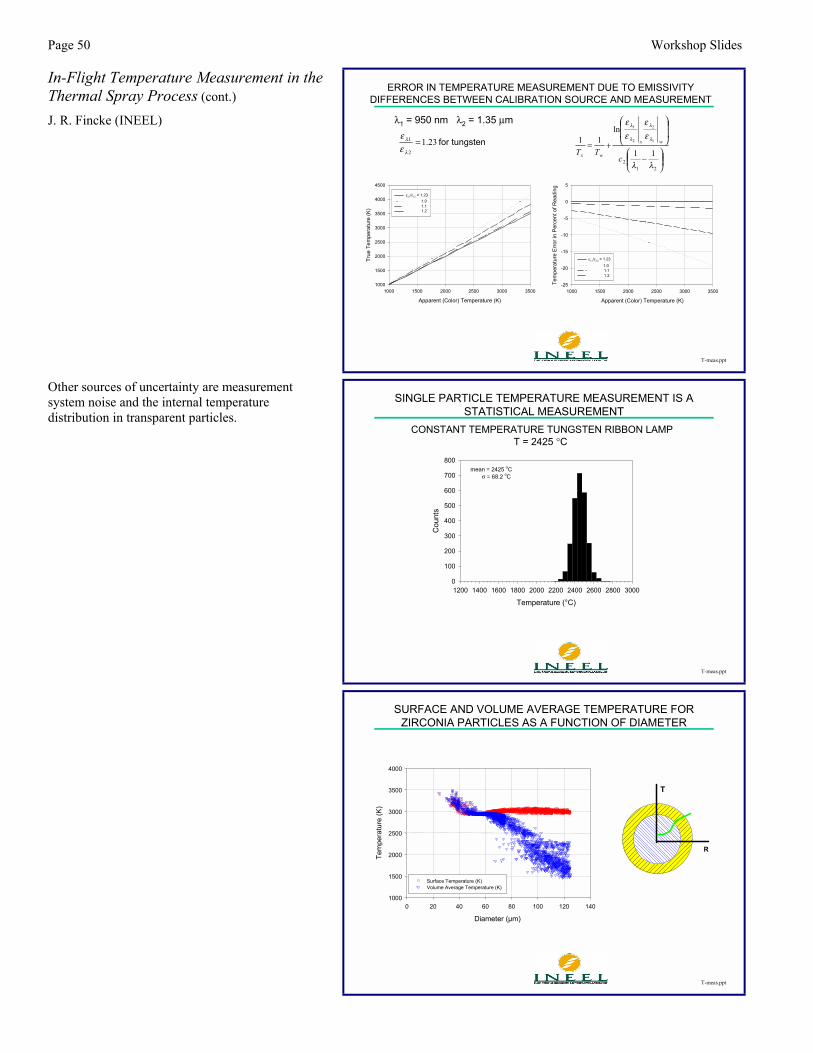
Page 50 Workshop Slides
In-Flight Temperature Measurement in theThermal Spray Process (cont.)
J. R. Fincke (INEEL)
T-meas.ppt
ERROR IN TEMPERATURE MEASUREMENT DUE TO EMISSIVITY DIFFERENCES BETWEEN CALIBRATION SOURCE AND MEASUREMENT
λ1 = 950 nm λ2 = 1.35 µm
tungsten for 23.12
1 =λ
λ
εε
Apparent (Color) Temperature (K)
1000 1500 2000 2500 3000 3500
Tem
pera
ture
Erro
r in
Perc
ent o
f Rea
ding
-25
-20
-15
-10
-5
0
5
ελ1/ελ2 = 1.23 1.0 1.1 1.2
Apparent (Color) Temperature (K)
1000 1500 2000 2500 3000 3500
True
Tem
pera
ture
(K)
1000
1500
2000
2500
3000
3500
4000
4500
ελ1/ελ2 = 1.23 1.0 1.1 1.2
−
+=
212
11
ln11 1
2
2
1
λλ
ε
ε
ε
ε
λ
λ
λ
λ
cTT
wx
wx
Other sources of uncertainty are measurementsystem noise and the internal temperaturedistribution in transparent particles.
T-meas.ppt
SINGLE PARTICLE TEMPERATURE MEASUREMENT IS A STATISTICAL MEASUREMENT
Temperature (°C)1200 1400 1600 1800 2000 2200 2400 2600 2800 3000
Cou
nts
0
100
200
300
400
500
600
700
800mean = 2425 oC σ = 68.2 oC
CONSTANT TEMPERATURE TUNGSTEN RIBBON LAMPT = 2425 °C
T-meas.ppt
Diameter (µm)
0 20 40 60 80 100 120 1401000
1500
2000
2500
3000
3500
4000
SURFACE AND VOLUME AVERAGE TEMPERATURE FOR ZIRCONIA PARTICLES AS A FUNCTION OF DIAMETER
R
T
Surface Temperature (K)Volume Average Temperature (K)
Tem
pera
ture
(K)
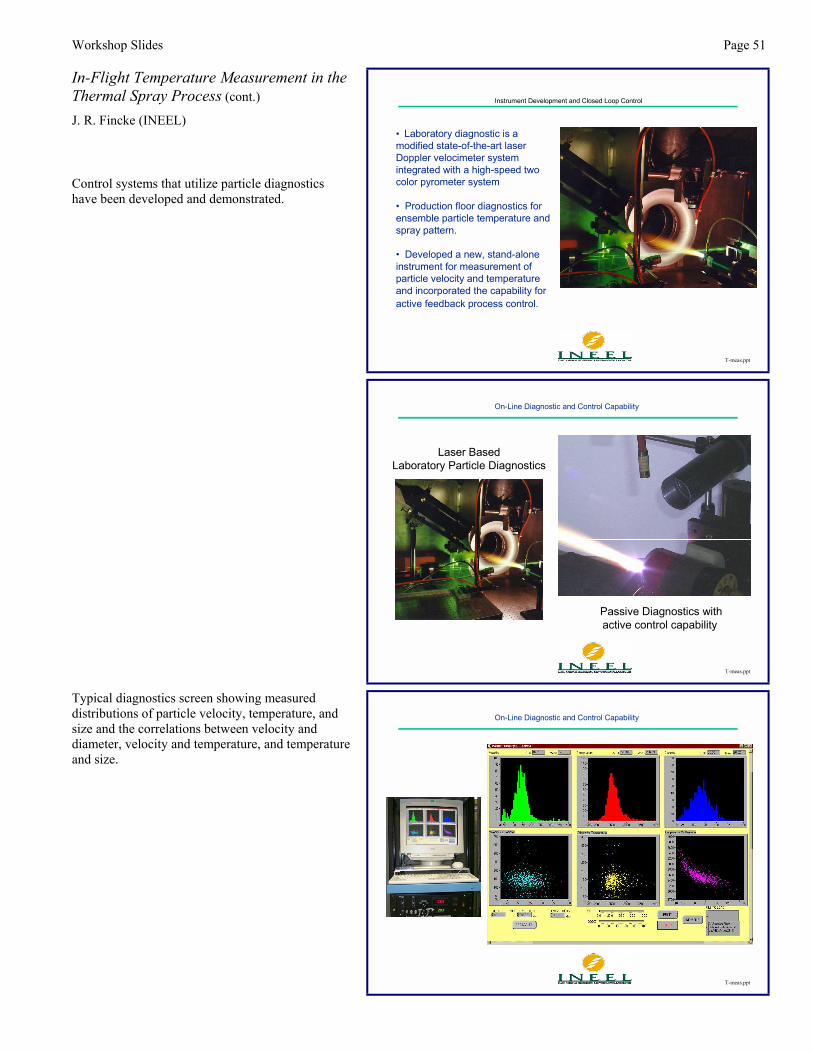
Workshop Slides Page 51
In-Flight Temperature Measurement in theThermal Spray Process (cont.)
J. R. Fincke (INEEL)
Control systems that utilize particle diagnosticshave been developed and demonstrated.
T-meas.ppt
Instrument Development and Closed Loop Control
Laboratory diagnostic is a modified state-of-the-art laser Doppler velocimeter system integrated with a high-speed two color pyrometer system
Production floor diagnostics for ensemble particle temperature and spray pattern.
Developed a new, stand-alone instrument for measurement of particle velocity and temperature and incorporated the capability for active feedback process control.
T-meas.ppt
On-Line Diagnostic and Control Capability
Laser BasedLaboratory Particle Diagnostics
Passive Diagnostics withactive control capability
Typical diagnostics screen showing measureddistributions of particle velocity, temperature, andsize and the correlations between velocity anddiameter, velocity and temperature, and temperatureand size.
T-meas.ppt
On-Line Diagnostic and Control Capability
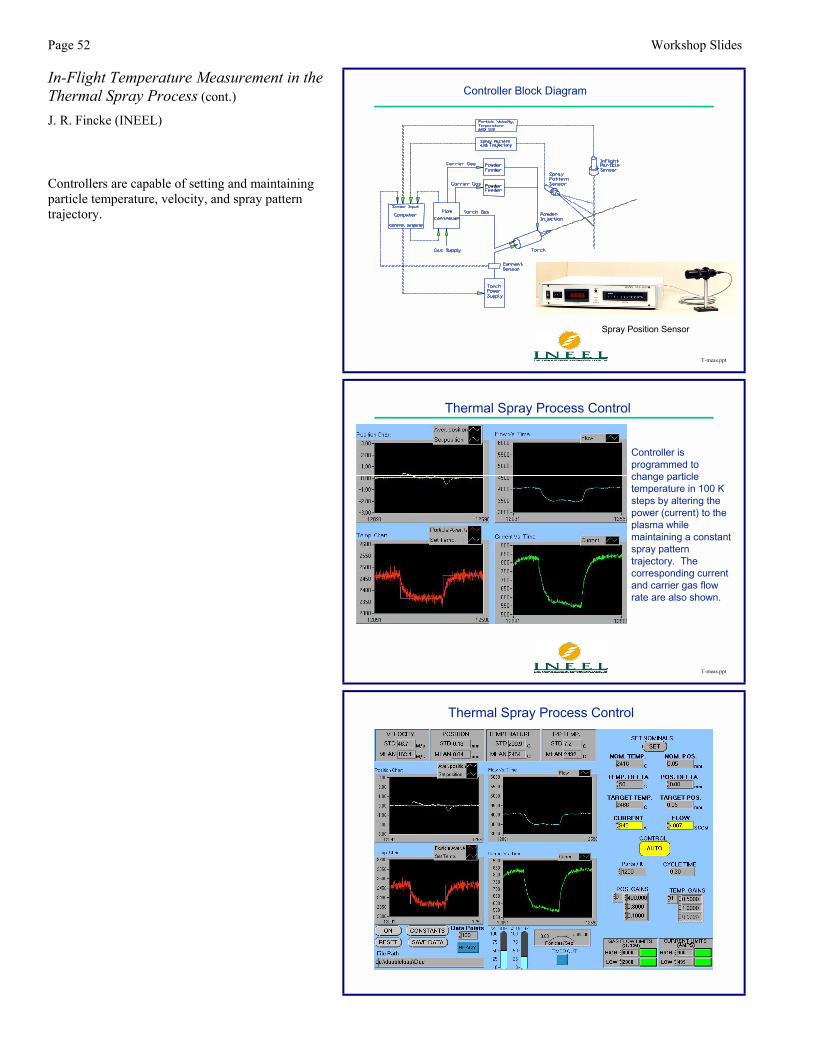
Page 52 Workshop Slides
In-Flight Temperature Measurement in theThermal Spray Process (cont.)
J. R. Fincke (INEEL)
Controllers are capable of setting and maintainingparticle temperature, velocity, and spray patterntrajectory.
T-meas.ppt
Controller Block Diagram
Spray Position Sensor
T-meas.ppt
Thermal Spray Process Control
Controller is programmed to change particle temperature in 100 K steps by altering the power (current) to the plasma while maintaining a constant spray pattern trajectory. The corresponding current and carrier gas flow rate are also shown.
Thermal Spray Process Control
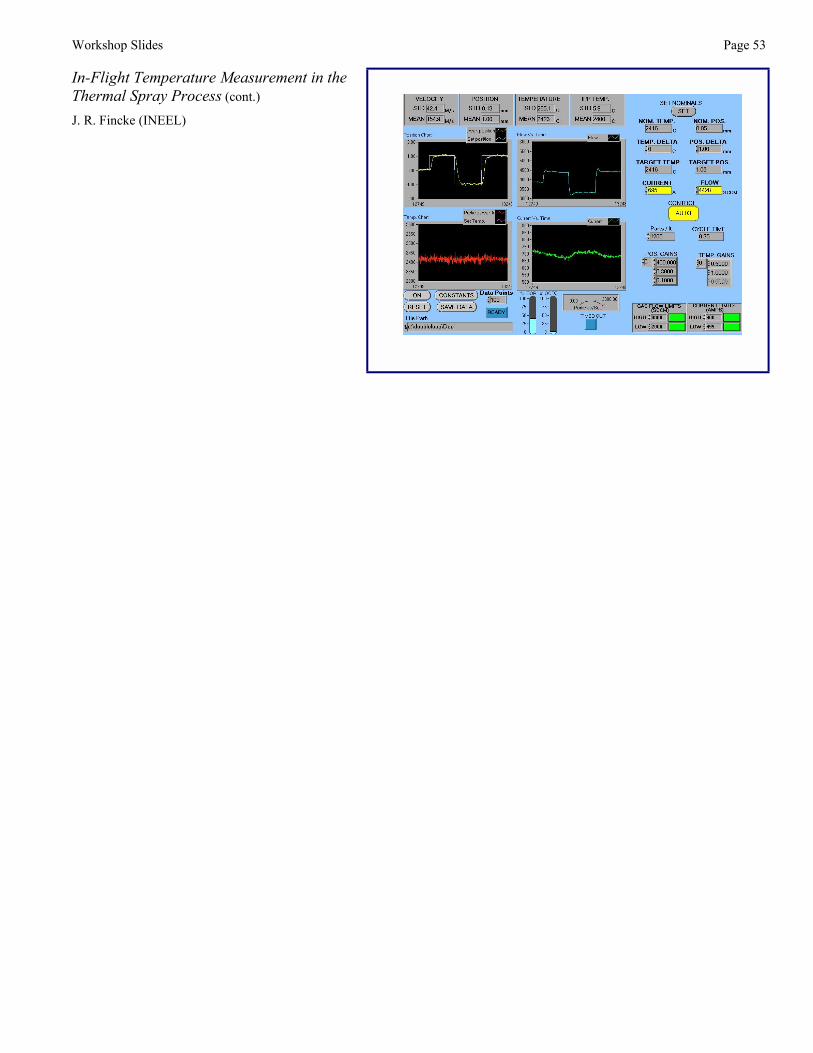
Workshop Slides Page 53
In-Flight Temperature Measurement in theThermal Spray Process (cont.)
J. R. Fincke (INEEL)


Workshop Slides Page 55
Opportunities and Challenges forAdvanced Process Control in the ThermalSpray Industry
C. Moreau (NRC-CNRC)
Opportunities and Challenges forAdvanced Process Control in the
Thermal Spray Industry
Christian Moreau and Jean-François BissonMaterials and Processes Section
Thermal Spray Process Reliability: Sensors and Diagnostics WorkshopJanuary 8 and 9, 2001NIST, Gaithersburg, MD
Introduction
n A closer control of the spray conditions is necessary to:– increase the reproducibility of the coating
characteristics on the production line– reduce testing during production– reduce time for coating optimization
– both very time consuming– increase electrode lifetime (possibly)
n Various sensors are currently available on the market
Commercial Sensors for Monitoring Particle Characteristics
n Individual particle monitoring– DPV-2000
– temperature, velocity and diameter– Therma Viz and Spraywatch cameras
– temperature and velocity n Global particle jet monitoring
– IPP-2000– temperature
– Accuraspray– temperature and velocity
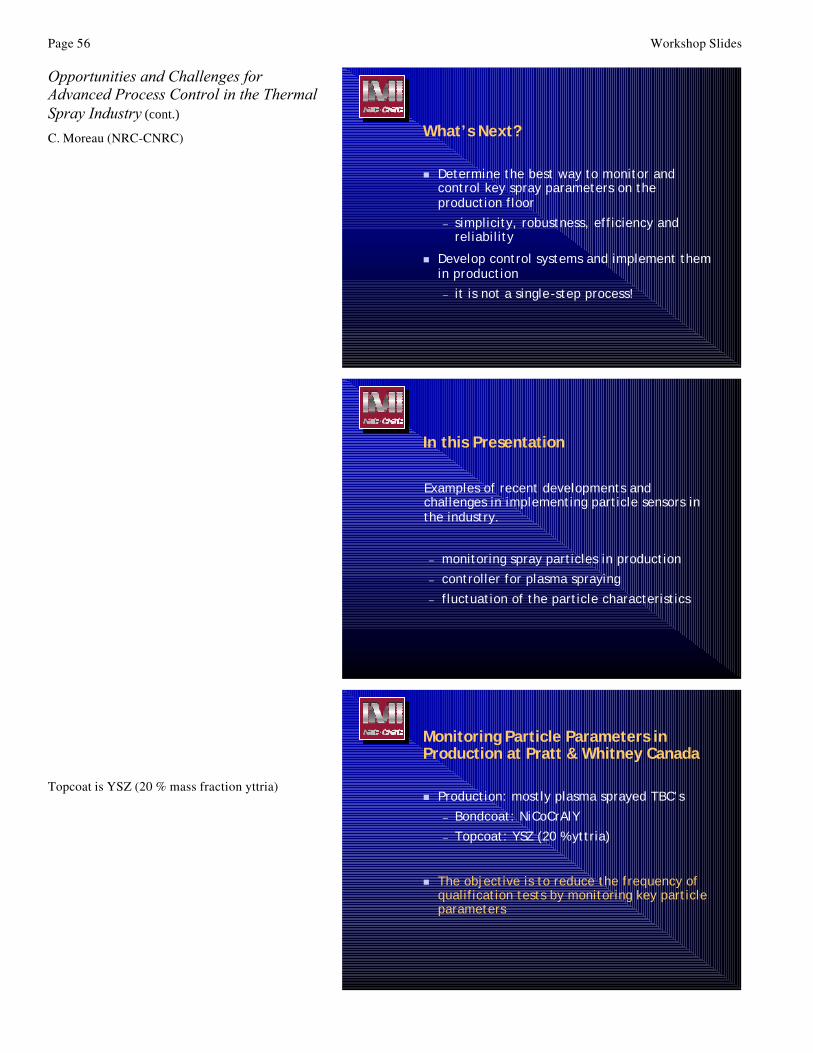
Page 56 Workshop Slides
Opportunities and Challenges forAdvanced Process Control in the ThermalSpray Industry (cont.)
C. Moreau (NRC-CNRC) What’s Next?
n Determine the best way to monitor and control key spray parameters on the production floor– simplicity, robustness, efficiency and
reliabilityn Develop control systems and implement them
in production– it is not a single-step process!
In this Presentation
Examples of recent developments and challenges in implementing particle sensors in the industry.
– monitoring spray particles in production– controller for plasma spraying– fluctuation of the particle characteristics
Topcoat is YSZ (20 % mass fraction yttria)
Monitoring Particle Parameters in Production at Pratt & Whitney Canada
n Production: mostly plasma sprayed TBC’s– Bondcoat: NiCoCrAlY– Topcoat: YSZ (20 % yttria)
n The objective is to reduce the frequency of qualification tests by monitoring key particle parameters
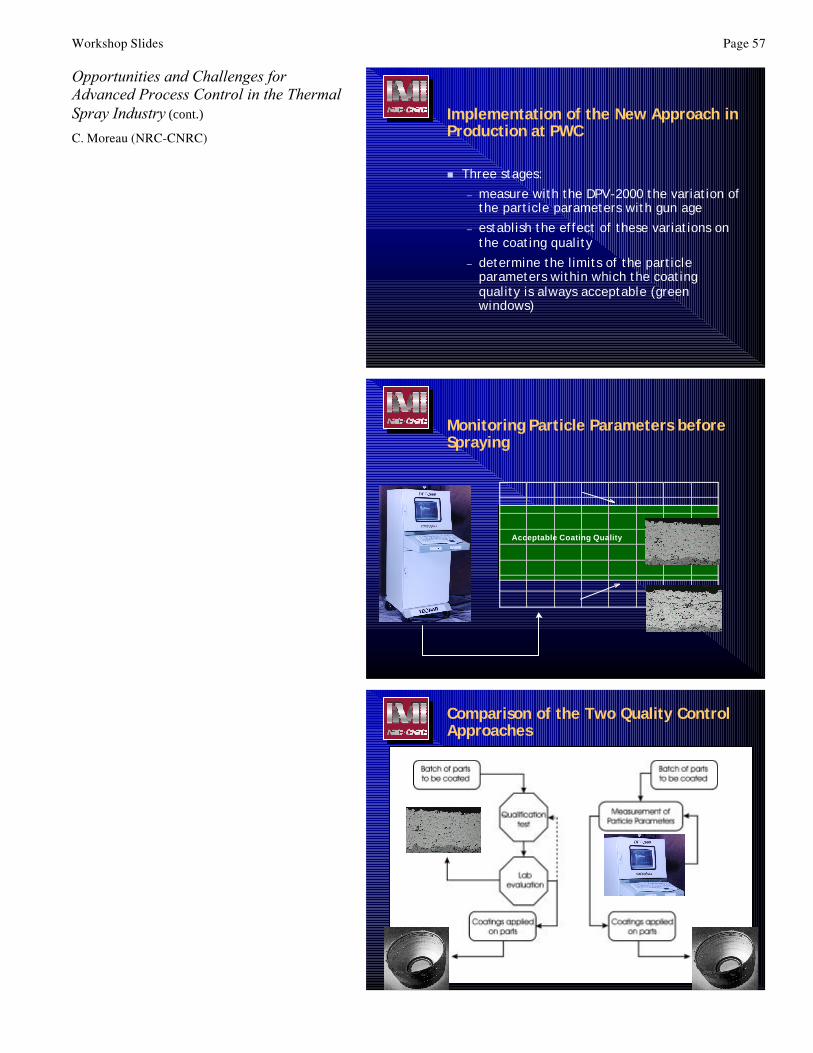
Workshop Slides Page 57
Opportunities and Challenges forAdvanced Process Control in the ThermalSpray Industry (cont.)
C. Moreau (NRC-CNRC)
Implementation of the New Approach in Production at PWC
n Three stages:– measure with the DPV-2000 the variation of
the particle parameters with gun age– establish the effect of these variations on
the coating quality– determine the limits of the particle
parameters within which the coating quality is always acceptable (green windows)
Monitoring Particle Parameters before Spraying
Gun Age (hours)
Pa
rtic
le T
em
pe
ratu
re (
C) Upper limit
Lower limit
Acceptable Coating Quality
Comparison of the Two Quality Control Approaches
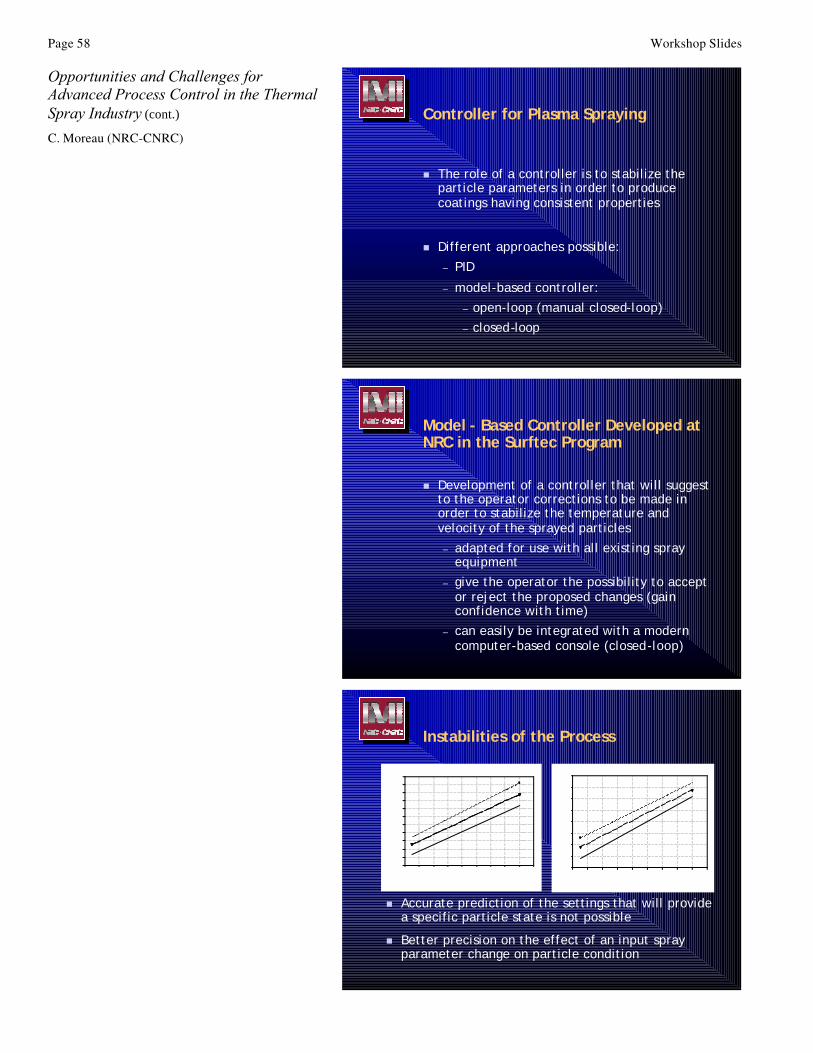
Page 58 Workshop Slides
Opportunities and Challenges forAdvanced Process Control in the ThermalSpray Industry (cont.)
C. Moreau (NRC-CNRC)
Controller for Plasma Spraying
n The role of a controller is to stabilize the particle parameters in order to produce coatings having consistent properties
n Different approaches possible:– PID– model-based controller:
– open-loop (manual closed-loop)– closed-loop
Model - Based Controller Developed at NRC in the Surftec Program
n Development of a controller that will suggest to the operator corrections to be made in order to stabilize the temperature and velocity of the sprayed particles– adapted for use with all existing spray
equipment– give the operator the possibility to accept
or reject the proposed changes (gain confidence with time)
– can easily be integrated with a modern computer-based console (closed-loop)
Influence of current on temperature
Current(A)
540 560 580 600 620 640 660 680 700 720
Te
mp
era
ture
(o
C)
2680
2700
2720
2740
2760
2780
2800
2820
2840
2860
2880
2900
Col 4 vs Col 1 Col 4 vs Col 2 Col 4 vs Col 3
Influence of current on velocity
Current
540 560 580 600 620 640 660 680 700 720
Vel
ocity
170
175
180
185
190
195
200
205
210
Instabilities of the Process
n Accurate prediction of the settings that will provide a specific particle state is not possible
n Better precision on the effect of an input spray parameter change on particle condition
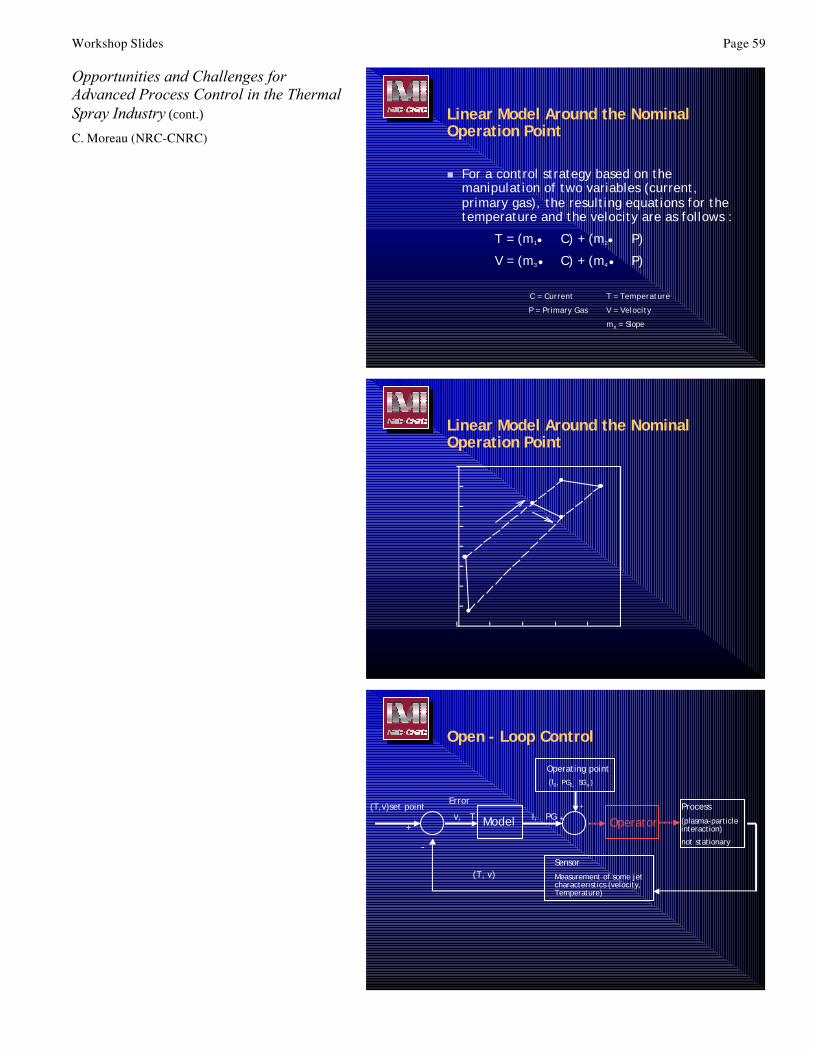
Workshop Slides Page 59
Opportunities and Challenges forAdvanced Process Control in the ThermalSpray Industry (cont.)
C. Moreau (NRC-CNRC)
Linear Model Around the Nominal Operation Point
n For a control strategy based on the manipulation of two variables (current, primary gas), the resulting equations for the temperature and the velocity are as follows :
∆T = (m1• ∆C) + (m2• ∆P)∆V = (m3• ∆C) + (m4• ∆P)
C = Current T = TemperatureP = Primary Gas V = Velocity
mx = Slope
Ar- 33% He
Yttria-stabilized zirconia
Velocity (m/sec)
220 240 260 280 300 320
Te
mp
era
ture
(°C
)
2650
2700
2750
2800
2850
2900
2950
3000
3050
currentincrease
gas flowincrease
Linear Model Around the Nominal Operation Point
ModelProcess(plasma-particle interaction)not stationary
SensorMeasurement of some jet characteristics (velocity, Temperature)
(T, v)
(T,v)set point Error∆v, ∆T
-+
∆I, ∆PG
Operating point(I0, PG0,, SGo )
++
Operator
Open - Loop Control
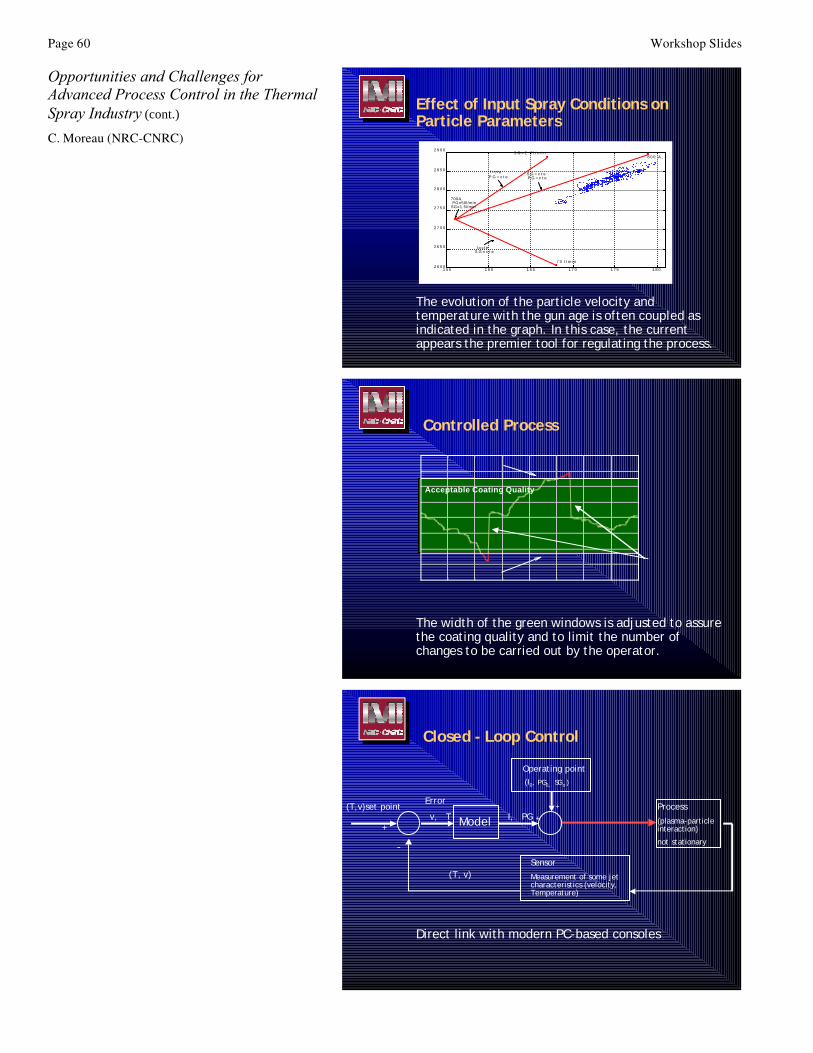
Page 60 Workshop Slides
Opportunities and Challenges forAdvanced Process Control in the ThermalSpray Industry (cont.)
C. Moreau (NRC-CNRC)
Effect of Input Spray Conditions on Particle Parameters
1 5 5 1 6 0 1 6 5 1 7 0 1 7 5 1 8 02 6 0 0
2 6 5 0
2 7 0 0
2 7 5 0
2 8 0 0
2 8 5 0
2 9 0 0
700A, PG=50l/min SG=1.5l/min
7 0 l / m i n
8 0 0 A ,
S G = 2 . 7 l / m i n
P G = c t e
S G = c t e
I = c t e
I = c t e
S G = c t e P G = c t e
The evolution of the particle velocity and temperature with the gun age is often coupled as indicated in the graph. In this case, the current appears the premier tool for regulating the process.
Controlled Process
Gun Age (hours)
Pa
rtic
le T
em
pe
ratu
re (
C) Upper limit
Lower limit
Acceptable Coating Quality
The width of the green windows is adjusted to assure the coating quality and to limit the number of changes to be carried out by the operator.
Changes made by the operator
ModelProcess(plasma-particle interaction)not stationary
SensorMeasurement of some jet characteristics (velocity, Temperature)
(T, v)
(T,v)set point Error∆v, ∆T
-+
∆I, ∆PG
Operating point(I0, PG0,, SGo )
++
Closed - Loop Control
Direct link with modern PC-based consoles
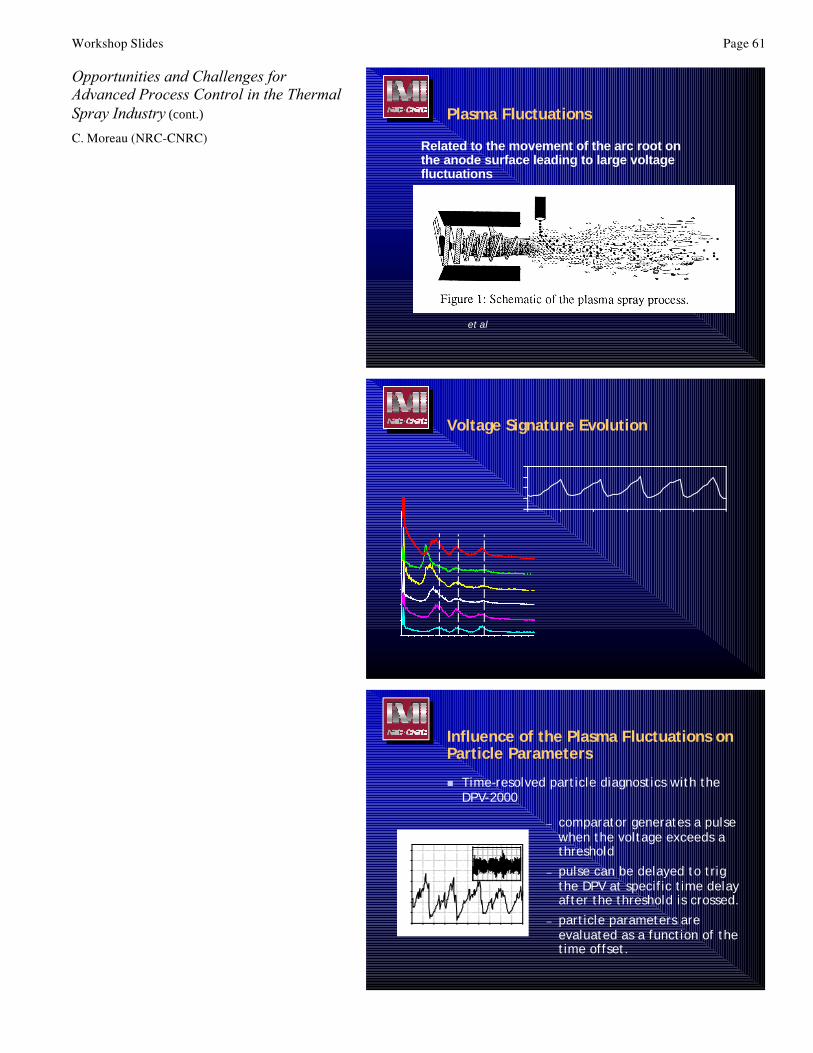
Workshop Slides Page 61
Opportunities and Challenges forAdvanced Process Control in the ThermalSpray Industry (cont.)
C. Moreau (NRC-CNRC)Related to the movement of the arc root on the anode surface leading to large voltage fluctuations
after Huang et al, Proc. ITSC'95, Kobe, p. 1159
Plasma Fluctuations
Frequency (kHz)0 5 10 15 20
0.4 hour
49 hours
30 hours
25 hours
18 hours
8 hoursSpe
ctra
l int
ensi
ty (
arbi
trar
y un
its)
Voltage Signature Evolution
Time (ms)
0.0 0.2 0.4 0.6 0.8 1.0 1.2
Vol
tage
(V
)
Influence of the Plasma Fluctuations on Particle Parameters
n Time-resolved particle diagnostics with the DPV-2000
Voltage dependance
Time (ms)
6.0 6.1 6.2 6.3 6.4 6.5 6.6 6.7 6.8 6.9 7.0
Vol
tage
(V)
20
40
60
80
100
120
140
160
Time (ms)
0 1 2 3 4 5 6 7 8 9 10
Voltag
e (V
)
20
40
60
80
100
120
– comparator generates a pulse when the voltage exceeds a threshold
– pulse can be delayed to trig the DPV at specific time delay after the threshold is crossed.
– particle parameters are evaluated as a function of the time offset.
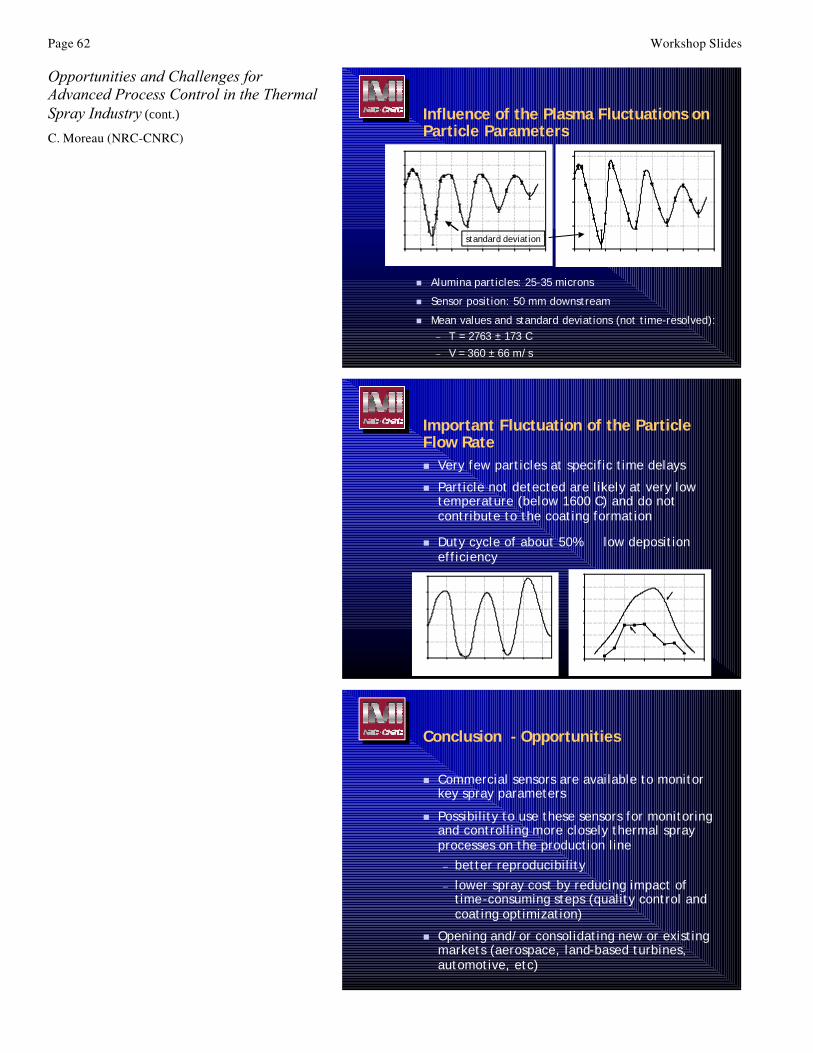
Page 62 Workshop Slides
Opportunities and Challenges forAdvanced Process Control in the ThermalSpray Industry (cont.)
C. Moreau (NRC-CNRC)
Influence of the Plasma Fluctuations on Particle Parameters
n Alumina particles: 25-35 micronsn Sensor position: 50 mm downstreamn Mean values and standard deviations (not time-resolved):
– T = 2763 ± 173 C– V = 360 ± 66 m/s
Time offset (µs)
0 100 200 300 400 500 600 700 800 900
Par
ticle
tem
pera
ture
(oC
)
2300
2400
2500
2600
2700
2800
2900
3000
213
174
117
136
9 6
151
136
133
180
181
166131
Time offset (µs)
0 100 200 300 400 500 600 700 800 900
Par
ticle
vel
ocity
(m
/s)
250
300
350
400
450
8188
61
50
32
44
21
82
77 86
91
standard deviation
Important Fluctuation of the Particle Flow Raten Very few particles at specific time delaysn Particle not detected are likely at very low
temperature (below 1600 C) and do not contribute to the coating formation
n Duty cycle of about 50% → low deposition efficiency
time offset (µs)
0 100 200 300 400 500 600
pa
rtic
le f
low
ra
te (
a.u
.)
0
1
2
3
4
5
vertical position (mm)
-6 -4 -2 0 2 4 6
pa
rtic
le f
low
ra
te (
a.u
.)
0
2
4
6
8
10
12
14
200µs (X10)
100µs
Conclusion - Opportunities
n Commercial sensors are available to monitor key spray parameters
n Possibility to use these sensors for monitoring and controlling more closely thermal spray processes on the production line– better reproducibility– lower spray cost by reducing impact of
time-consuming steps (quality control and coating optimization)
n Opening and/or consolidating new or existing markets (aerospace, land-based turbines, automotive, etc)

Workshop Slides Page 63
Opportunities and Challenges forAdvanced Process Control in the ThermalSpray Industry (cont.)
C. Moreau (NRC-CNRC)
Conclusion - Challenges
n Developing new controllers that will be easy to use, reliable and well adapted to the production floor
n Gain confidence of the sprayers and users in this new technology– this step is already on its way but must
continue on a larger basis
Conclusion - Challenges
n Developing a better understanding of the influence of key parameters on the structure and properties of the deposited coatings– plasma fluctuations– temperature of the substrate and top
coating surface during spraying– surface preparation– etc.
n Developing the corresponding sensing and control technology according to the actual needs of the industry.

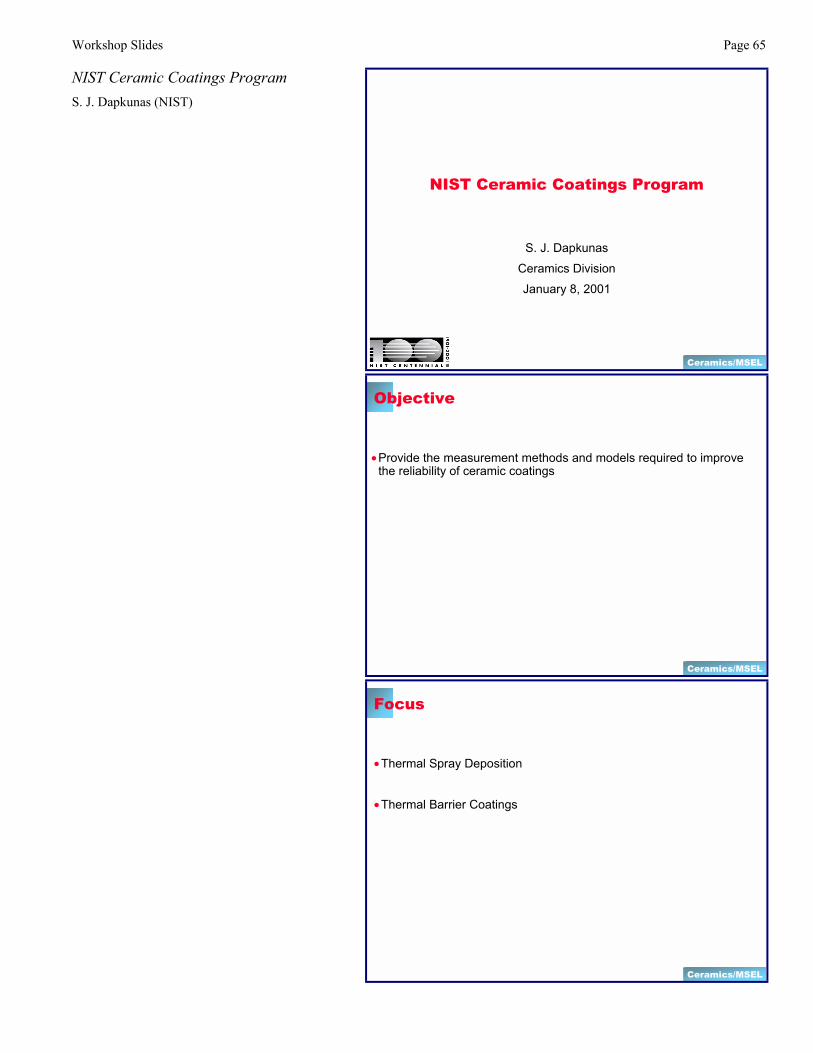
Workshop Slides Page 65
NIST Ceramic Coatings ProgramS. J. Dapkunas (NIST)
Ceramics/MSEL
NIST Ceramic Coatings Program
S. J. DapkunasCeramics DivisionJanuary 8, 2001
Ceramics/MSEL
Objective
• Provide the measurement methods and models required to improve the reliability of ceramic coatings
Ceramics/MSEL
Focus
• Thermal Spray Deposition
• Thermal Barrier Coatings

Page 66 Workshop Slides
NIST Ceramic Coatings Program (cont.)
S. J. Dapkunas (NIST)
Ceramics/MSEL
Approach
Capitalize on:
• Industry and academias processing capability
• NISTs measurement, characterization and modeling capability
Ceramics/MSEL
Reliability
Reliability = Reproducible Processing + Property and PerformancePrediction
Ceramics/MSEL
Reproducible Processing
• Development of Standard Reference Materials for particle size distribution of PSZ and WC/Co
• Chemical analysis of feedstock and deposits
• Relate microstructure to processing parameters

Workshop Slides Page 67
NIST Ceramic Coatings Program (cont.)
S. J. Dapkunas (NIST)
Ceramics/MSEL
Property and Performance Prediction
• Characterization of microstructure by SANS/USAXS• Residual stress measurements• Thermal conductivity measurements• Elastic modulus measurements by instrumented indentation and
neutron diffraction• Neutron diffraction analysis of time/temperature effects on phase
stability of PSZ• Thermal conductivity prediction using OOF• Lifetime prediction using fracture mechanics
http://www.ctcms.nist.gov/oof
NIST Object Oriented Finite Element(OOF) Project
Public domain software to simulate and elucidate macroscopic properties of complex materials microstructures
1999 Technologiesof the Year Award
Ceramics/MSEL
OBJECTIVESOBJECTIVESOBJECTIVESOBJECTIVES! To combine materials microstructure, data,
and theory in an easy-to-use graphical interface designed for materials scientists
! To provide a vehicle for incorporating well-known properties into complex systems
! To operate on real and simulated materials microstructures
Ceramics/MSEL
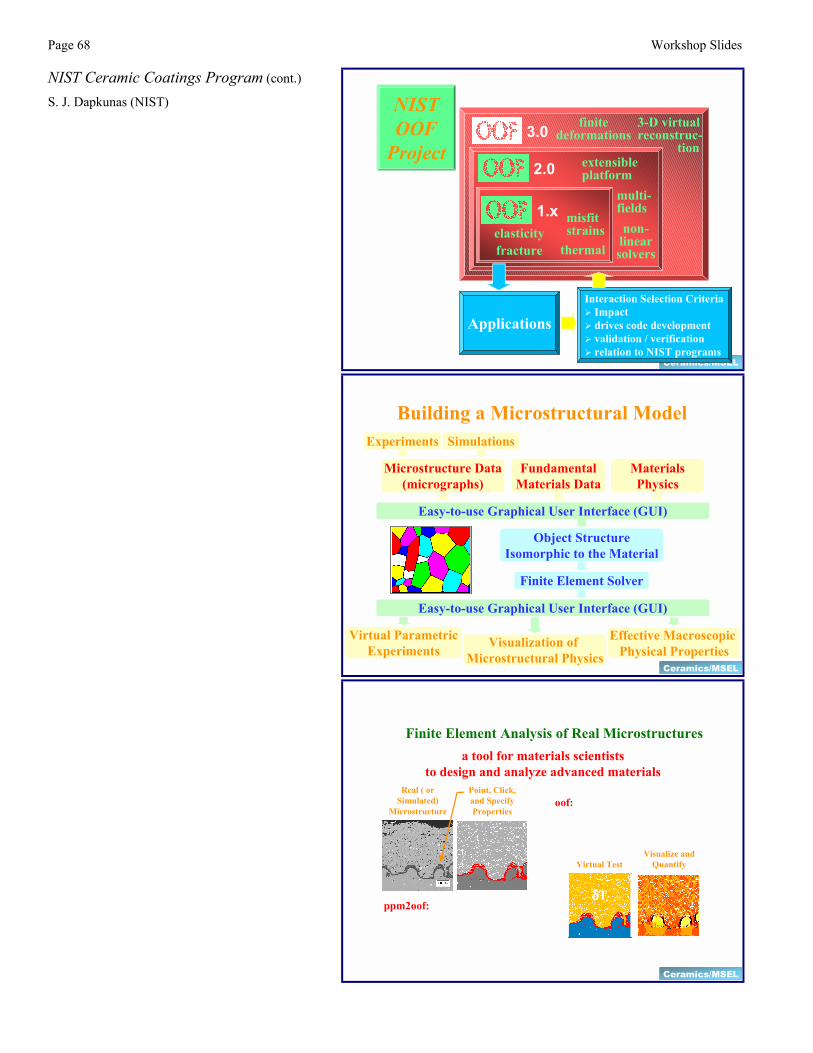
Page 68 Workshop Slides
NIST Ceramic Coatings Program (cont.)
S. J. Dapkunas (NIST)
Ceramics/MSEL
3.0 3-D virtualreconstruc-
tion
finitedeformations
2.0 extensibleplatform
multi-fieldsnon-
linearsolvers
1.x misfitstrainselasticity
fracture thermal
Applications
Interaction Selection Criteria" Impact" drives code development" validation / verification" relation to NIST programs
NISTOOF
Project
Building a Microstructural ModelSimulationsExperiments
FundamentalMaterials Data
MaterialsPhysics
Easy-to-use Graphical User Interface (GUI)
Object StructureIsomorphic to the Material
Finite Element Solver
Easy-to-use Graphical User Interface (GUI)
Visualization of Microstructural Physics
Virtual ParametricExperiments
Effective Macroscopic Physical Properties
Microstructure Data(micrographs)
Ceramics/MSEL
Ceramics/MSEL
Finite Element Analysis of Real Microstructuresa tool for materials scientists
to design and analyze advanced materials
ppm2oof:
Point, Click,and SpecifyProperties
Real ( orSimulated)
Microstructureoof:
Visualize andQuantifyVirtual Test
δδδδT
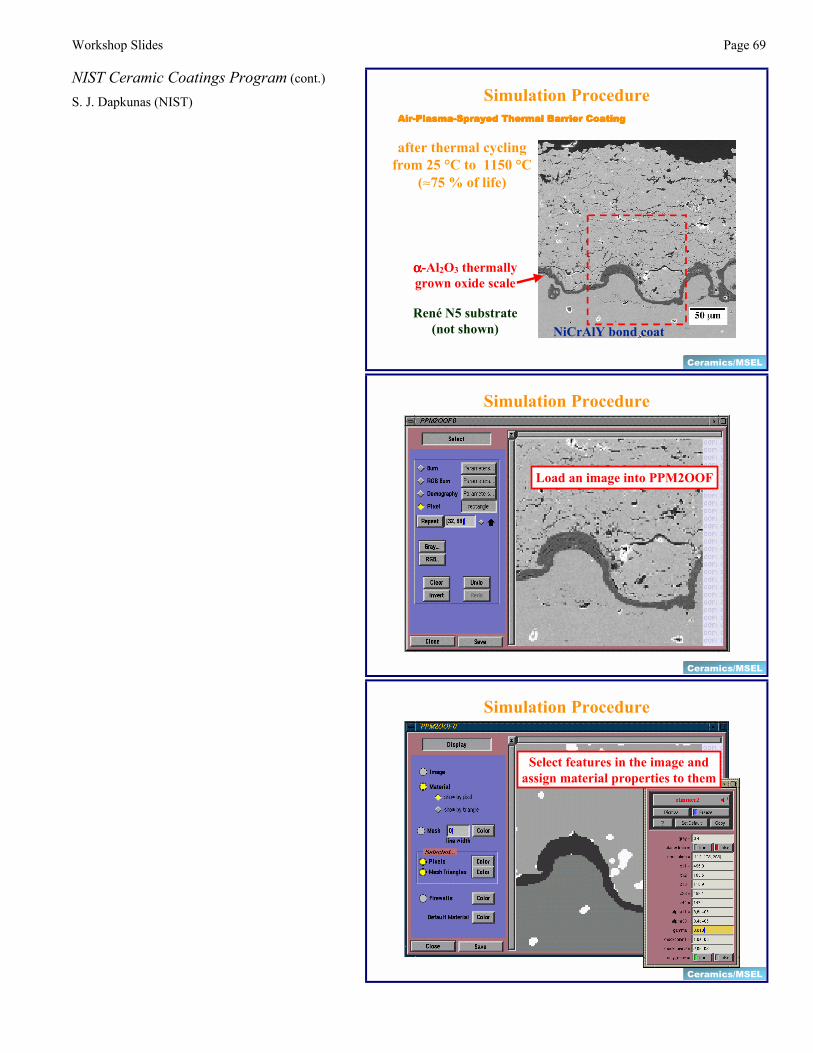
Workshop Slides Page 69
NIST Ceramic Coatings Program (cont.)
S. J. Dapkunas (NIST)AirAirAirAir----PlasmaPlasmaPlasmaPlasma----Sprayed Thermal Barrier CoatingSprayed Thermal Barrier CoatingSprayed Thermal Barrier CoatingSprayed Thermal Barrier Coating
after thermal cyclingfrom 25 °C to 1150 °C
(≈75 % of life)
NiCrAlY bond coatRené N5 substrate
(not shown)
αααα-Al2O3 thermally grown oxide scale
Simulation Procedure
Ceramics/MSEL
Load an image into PPM2OOF
Simulation Procedure
Ceramics/MSEL
Ceramics/MSEL
Simulation Procedure
Select features in the image andassign material properties to them
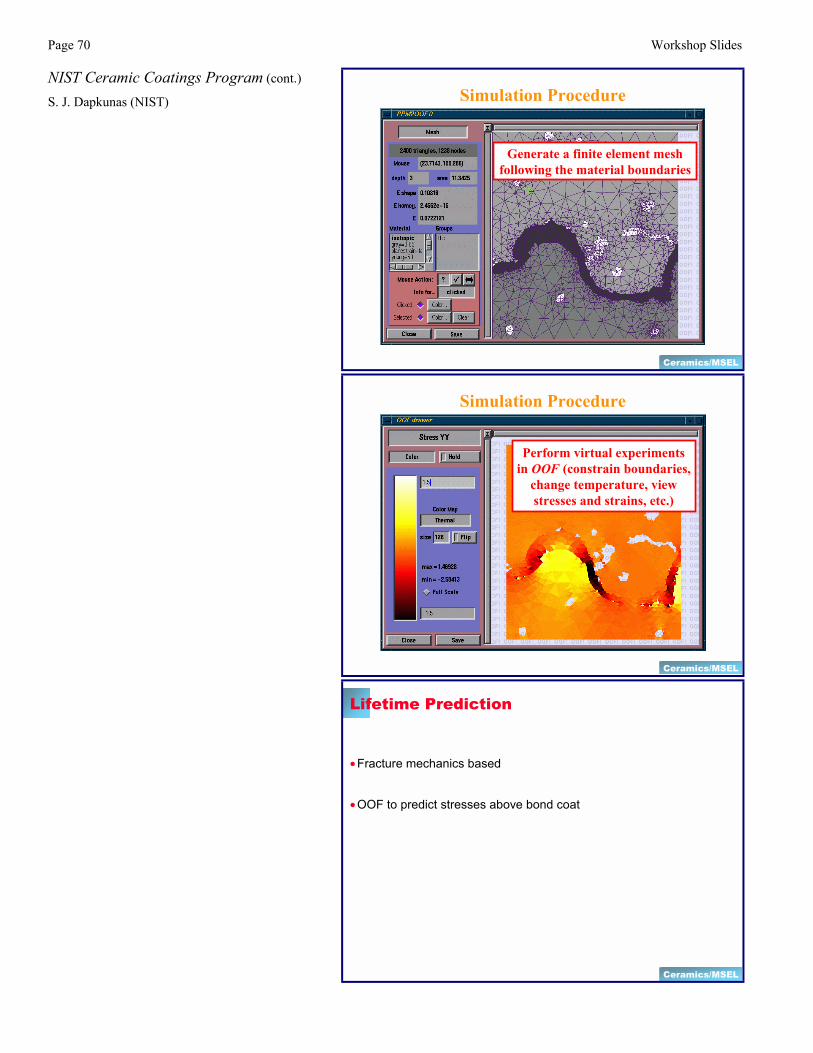
Page 70 Workshop Slides
NIST Ceramic Coatings Program (cont.)
S. J. Dapkunas (NIST)
Generate a finite element meshfollowing the material boundaries
Simulation Procedure
Ceramics/MSEL
Perform virtual experimentsin OOF (constrain boundaries,
change temperature, viewstresses and strains, etc.)
Simulation Procedure
Ceramics/MSEL
Ceramics/MSEL
Lifetime Prediction
• Fracture mechanics based
• OOF to predict stresses above bond coat

Workshop Slides Page 71
NIST Ceramic Coatings Program (cont.)
S. J. Dapkunas (NIST)
Ceramics/MSEL
Microstructure Based Thermal Conductivity Prediction
• Object oriented finite element (OOF) modeling• Capture microstructure, predict conductivity, validate
Ceramics/MSEL
Importance of Thermal Conductivity CharacterizationImportance of Thermal Conductivity CharacterizationImportance of Thermal Conductivity CharacterizationImportance of Thermal Conductivity Characterization
" Thermal properties are crucial to part design." TBC properties are highly dependent on
processing parameters and location on the part." As TBCs are used in more critical applications in
gas turbine design, accurate characterization of thermal conductivity becomes more important.
" Laser flash measurements of thermal conductivity are time consuming, expensive, and require special expertise. Accordingly, such measurements:
! are rarely made during materials development
! are used sparingly by turbine part designers! are typically not included in production
qualification and quality control
Ceramics/MSEL
Benefits of an Inexpensive, Widely Available, Rapid Predictor of TBC Thermal Conductivity
" Optimization of thermal conductivity (and other properties) during TBC material development
" New TBC materials with lower thermal conductivity designed on the computer
" More accurate cooling and life predictions for gas turbine parts by designers
" Spray vendors qualify their TBC's for thermal conductivity
Thermal Conductivity SimulationsThermal Conductivity SimulationsThermal Conductivity SimulationsThermal Conductivity Simulations
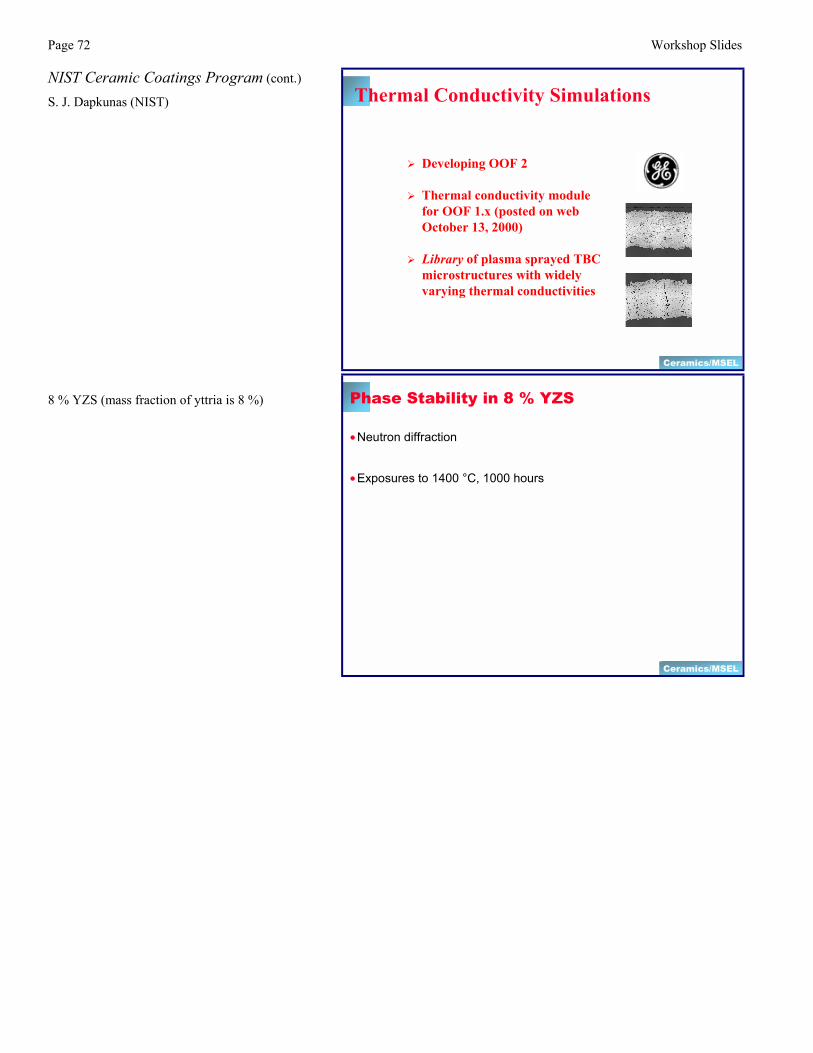
Page 72 Workshop Slides
NIST Ceramic Coatings Program (cont.)
S. J. Dapkunas (NIST)
Ceramics/MSEL
" Developing OOF 2
" Thermal conductivity module for OOF 1.x (posted on web October 13, 2000)
" Library of plasma sprayed TBC microstructures with widely varying thermal conductivities
Thermal Conductivity Simulations
κ = 1.66 W/mK
κ = 0.53 W/mK
8 % YZS (mass fraction of yttria is 8 %)
Ceramics/MSEL
Phase Stability in 8 % YZS
• Neutron diffraction
• Exposures to 1400 °C, 1000 hours
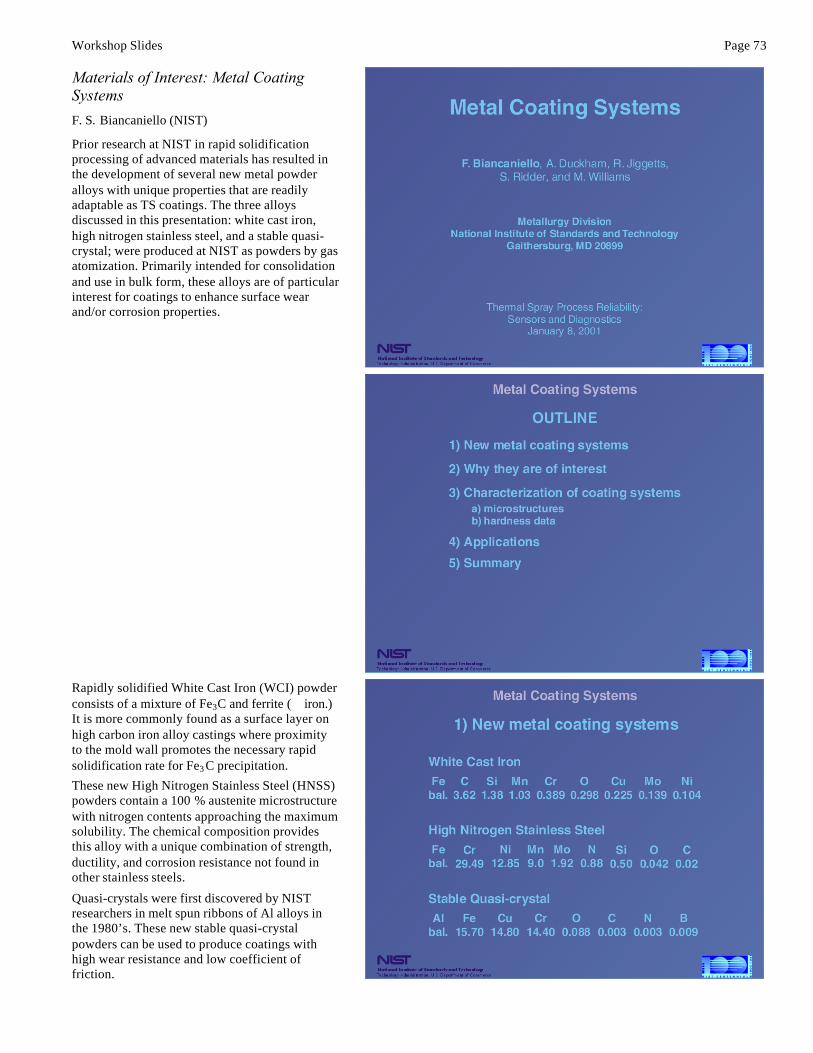
Workshop Slides Page 73
Materials of Interest: Metal CoatingSystems
F. S. Biancaniello (NIST)
Prior research at NIST in rapid solidificationprocessing of advanced materials has resulted inthe development of several new metal powderalloys with unique properties that are readilyadaptable as TS coatings. The three alloysdiscussed in this presentation: white cast iron,high nitrogen stainless steel, and a stable quasi-crystal; were produced at NIST as powders by gasatomization. Primarily intended for consolidationand use in bulk form, these alloys are of particularinterest for coatings to enhance surface wearand/or corrosion properties.
Rapidly solidified White Cast Iron (WCI) powderconsists of a mixture of Fe3C and ferrite (α iron.)It is more commonly found as a surface layer onhigh carbon iron alloy castings where proximityto the mold wall promotes the necessary rapidsolidification rate for Fe3 C precipitation.
These new High Nitrogen Stainless Steel (HNSS)powders contain a 100 % austenite microstructurewith nitrogen contents approaching the maximumsolubility. The chemical composition providesthis alloy with a unique combination of strength,ductility, and corrosion resistance not found inother stainless steels.
Quasi-crystals were first discovered by NISTresearchers in melt spun ribbons of Al alloys inthe 1980’s. These new stable quasi-crystalpowders can be used to produce coatings withhigh wear resistance and low coefficient offriction.
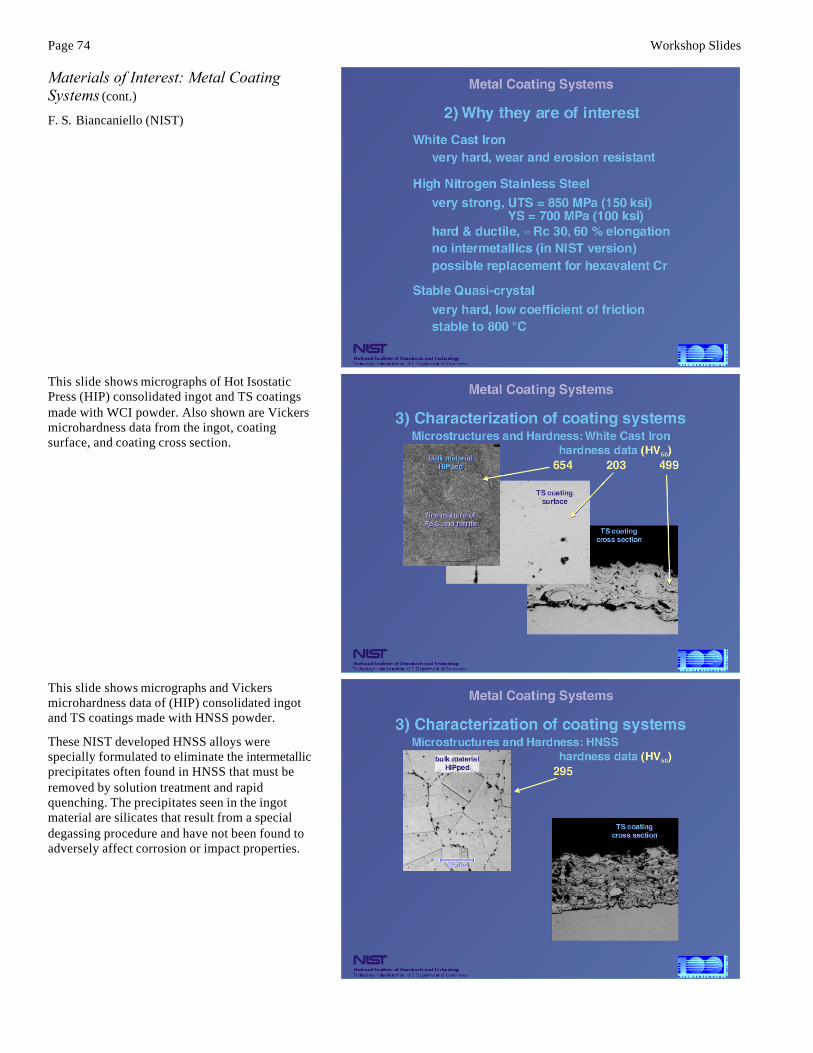
Page 74 Workshop Slides
Materials of Interest: Metal CoatingSystems (cont.)
F. S. Biancaniello (NIST)
This slide shows micrographs of Hot IsostaticPress (HIP) consolidated ingot and TS coatingsmade with WCI powder. Also shown are Vickersmicrohardness data from the ingot, coatingsurface, and coating cross section.
This slide shows micrographs and Vickersmicrohardness data of (HIP) consolidated ingotand TS coatings made with HNSS powder.
These NIST developed HNSS alloys werespecially formulated to eliminate the intermetallicprecipitates often found in HNSS that must beremoved by solution treatment and rapidquenching. The precipitates seen in the ingotmaterial are silicates that result from a specialdegassing procedure and have not been found toadversely affect corrosion or impact properties.
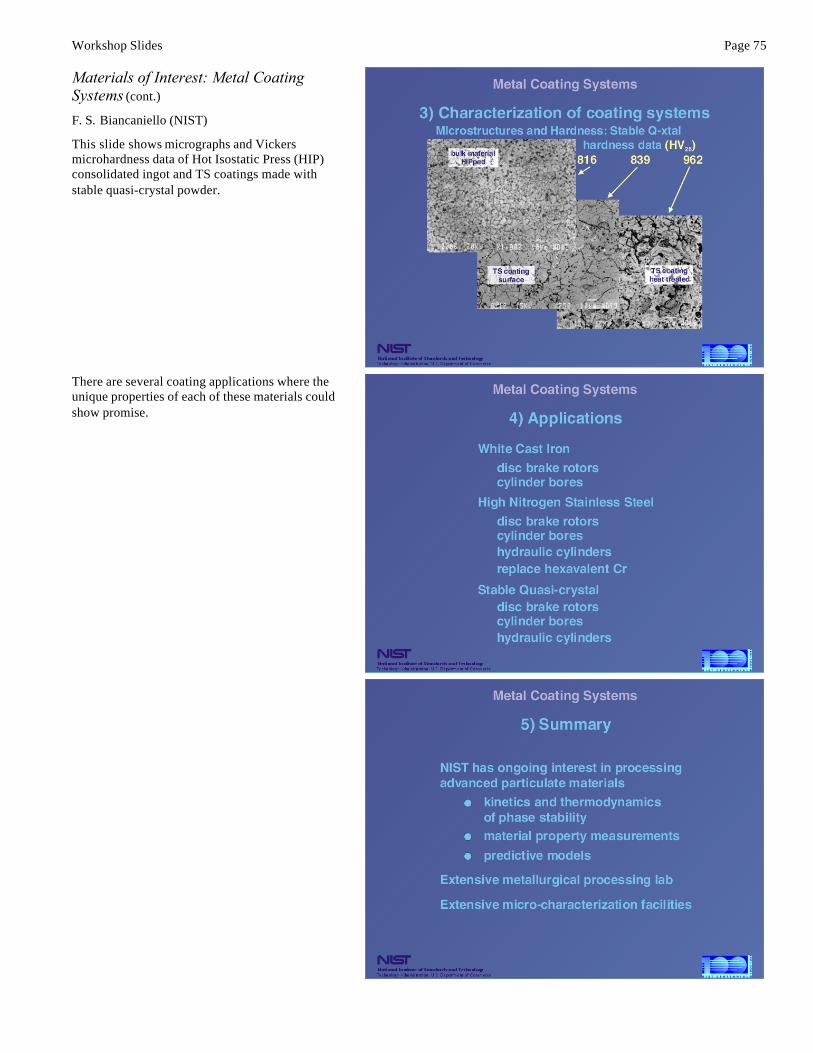
Workshop Slides Page 75
Materials of Interest: Metal CoatingSystems (cont.)
F. S. Biancaniello (NIST)
This slide shows micrographs and Vickersmicrohardness data of Hot Isostatic Press (HIP)consolidated ingot and TS coatings made withstable quasi-crystal powder.
There are several coating applications where theunique properties of each of these materials couldshow promise.

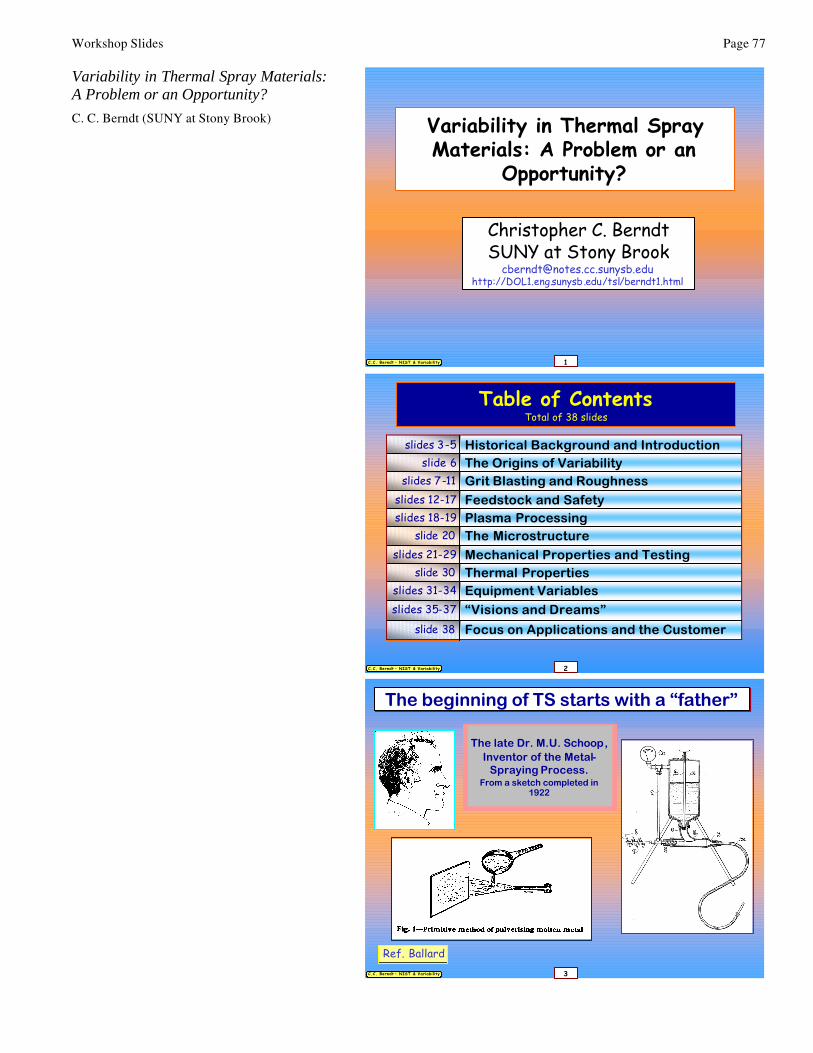
Workshop Slides Page 77
Variability in Thermal Spray Materials:A Problem or an Opportunity?
C. C. Berndt (SUNY at Stony Brook)
1C.C. Berndt – NIST & Variability
Variability in Thermal Spray Materials: A Problem or an
Opportunity?
Christopher C. BerndtSUNY at Stony Brook
[email protected]://DOL1.eng.sunysb.edu/tsl/berndt1.html
2C.C. Berndt – NIST & Variability
Table of ContentsTotal of 38 slides
Focus on Applications and the Customerslide 38
“Visions and Dreams”slides 35-37Equipment Variablesslides 31-34Thermal Propertiesslide 30Mechanical Properties and Testingslides 21-29The Microstructureslide 20Plasma Processingslides 18-19Feedstock and Safetyslides 12-17Grit Blasting and Roughnessslides 7-11The Origins of Variabilityslide 6Historical Background and Introductionslides 3-5
3C.C. Berndt – NIST & Variability
The beginning of TS starts with a “father” The beginning of TS starts with a “father”
Ref. Ballard
The late Dr. M.U. Schoop, Inventor of the Metal-
Spraying Process.From a sketch completed in
1922
The late Dr. M.U. Schoop, Inventor of the Metal-
Spraying Process.From a sketch completed in
1922
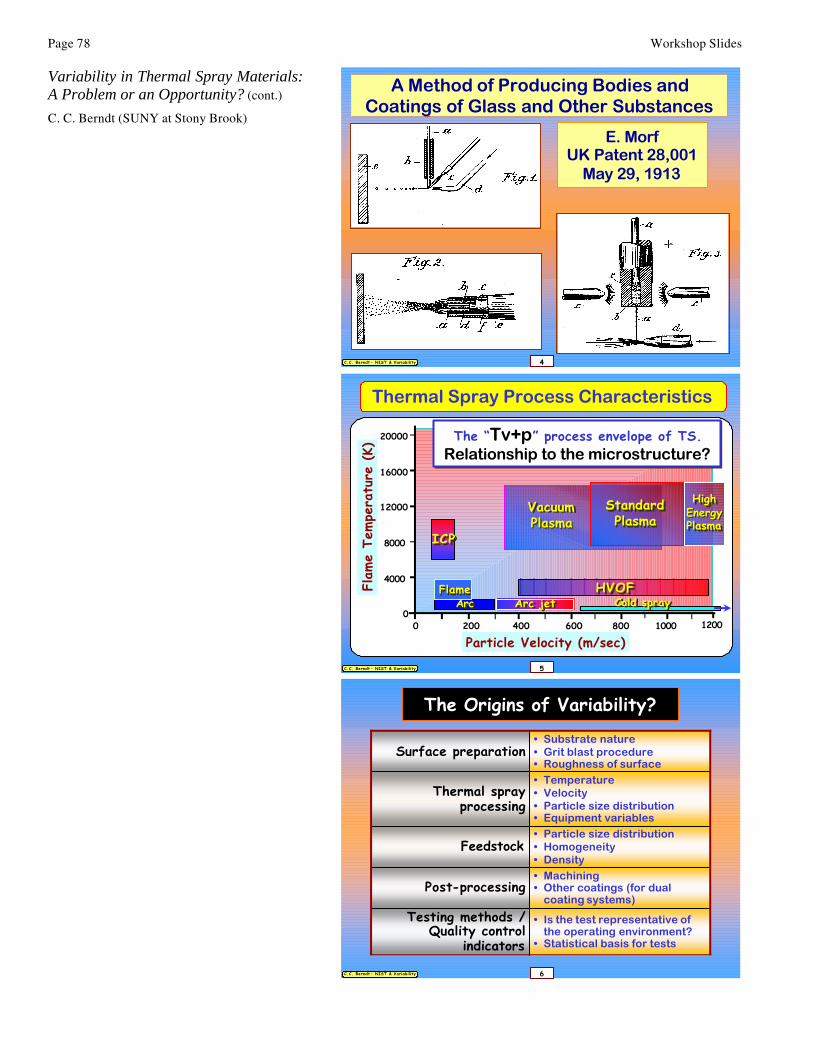
Page 78 Workshop Slides
Variability in Thermal Spray Materials:A Problem or an Opportunity? (cont.)
C. C. Berndt (SUNY at Stony Brook)
4C.C. Berndt – NIST & Variability
A Method of Producing Bodies and Coatings of Glass and Other Substances
A Method of Producing Bodies and Coatings of Glass and Other Substances
E. MorfUK Patent 28,001
May 29, 1913
5C.C. Berndt – NIST & Variability
Thermal Spray Process Characteristics
20000
16000
12000
8000
4000
0200 400 600 8000
Flam
e Te
mpe
ratu
re (K)
Particle Velocity (m/sec)
The “Tv+p” process envelope of TS.Relationship to the microstructure?The “Tv+p” process envelope of TS.
Relationship to the microstructure?
HVOFHVOFFlameFlameArc jetArc jetArcArc
ICPICP
1000 1200
Standard Plasma
Standard Plasma
High EnergyPlasma
High EnergyPlasma
VacuumPlasmaVacuumPlasma
Cold sprayCold spray
6C.C. Berndt – NIST & Variability
• Is the test representative of the operating environment?
• Statistical basis for tests
Testing methods / Quality control
indicators
• Machining• Other coatings (for dual
coating systems)Post-processing
• Particle size distribution• Homogeneity• Density
Feedstock
• Temperature• Velocity• Particle size distribution• Equipment variables
Thermal spray processing
• Substrate nature• Grit blast procedure• Roughness of surface
Surface preparation
The Origins of Variability?
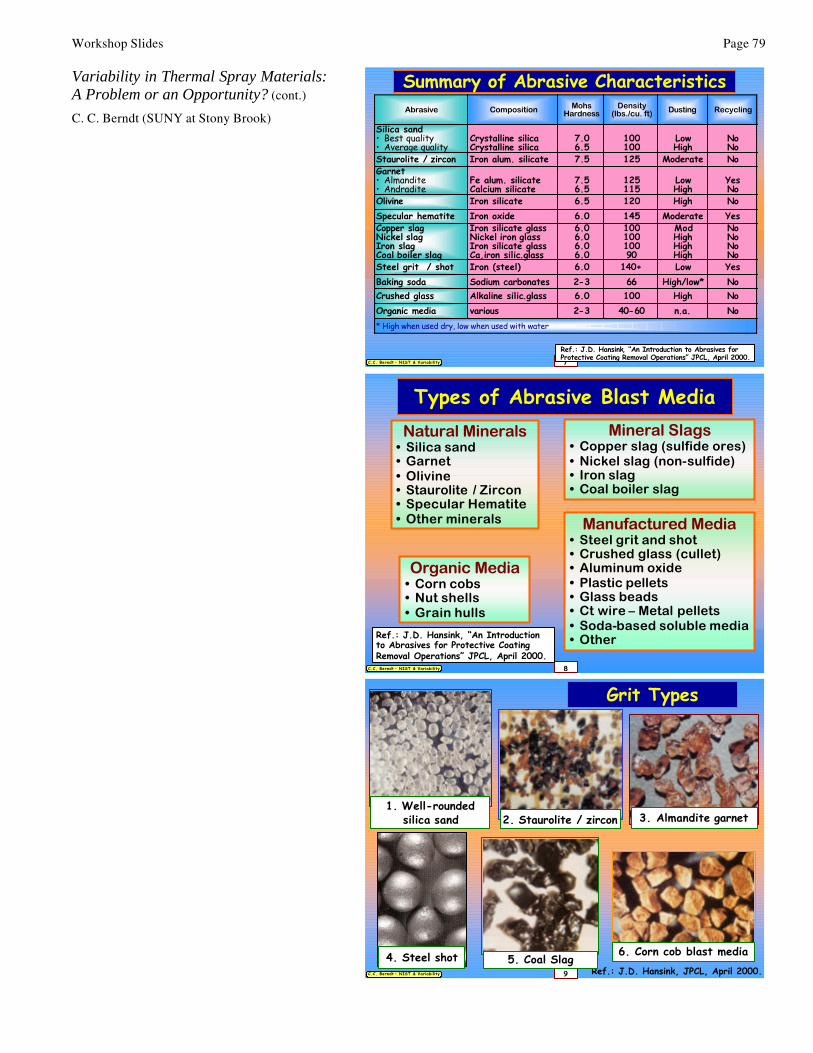
Workshop Slides Page 79
Variability in Thermal Spray Materials:A Problem or an Opportunity? (cont.)
C. C. Berndt (SUNY at Stony Brook)
7C.C. Berndt – NIST & Variability
Summary of Abrasive Characteristics
* High when used dry, low when used with water
Non.a.40-602-3variousOrganic mediaNoHigh1006.0Alkaline silic.glassCrushed glassNoHigh/low*662-3Sodium carbonatesBaking sodaYesLow140+6.0Iron (steel)Steel grit / shot
NoNoNoNo
ModHighHighHigh
10010010090
6.06.06.06.0
Iron silicate glassNickel iron glassIron silicate glassCa,iron silic.glass
Copper slagNickel slagIron slagCoal boiler slag
YesModerate1456.0Iron oxideSpecular hematiteNoHigh1206.5Iron silicateOlivine
YesNo
Low High
125115
7.56.5
Fe alum. silicateCalcium silicate
Garnet• Almandite• Andradite
NoModerate1257.5Iron alum. silicateStaurolite / zircon
NoNo
LowHigh
100100
7.06.5
Crystalline silicaCrystalline silica
Silica sand• Best quality• Average quality
RecyclingDustingDensity(lbs./cu. ft)
Mohs HardnessCompositionAbrasive
Ref.: J.D. Hansink, “An Introduction to Abrasives for Protective Coating Removal Operations” JPCL, April 2000.
8C.C. Berndt – NIST & Variability
Types of Abrasive Blast MediaNatural Minerals
• Silica sand• Garnet• Olivine• Staurolite / Zircon• Specular Hematite• Other minerals
Mineral Slags• Copper slag (sulfide ores)• Nickel slag (non-sulfide)• Iron slag• Coal boiler slag
Manufactured Media• Steel grit and shot• Crushed glass (cullet)• Aluminum oxide• Plastic pellets• Glass beads• Ct wire – Metal pellets• Soda-based soluble media• Other
Organic Media• Corn cobs• Nut shells• Grain hulls
Ref.: J.D. Hansink, “An Introduction to Abrasives for Protective Coating Removal Operations” JPCL, April 2000.
9C.C. Berndt – NIST & Variability
Grit Types
Ref.: J.D. Hansink, JPCL, April 2000.
2. Staurolite / zircon
4. Steel shot 5. Coal Slag6. Corn cob blast media
1. Well-rounded silica sand 3. Almandite garnet
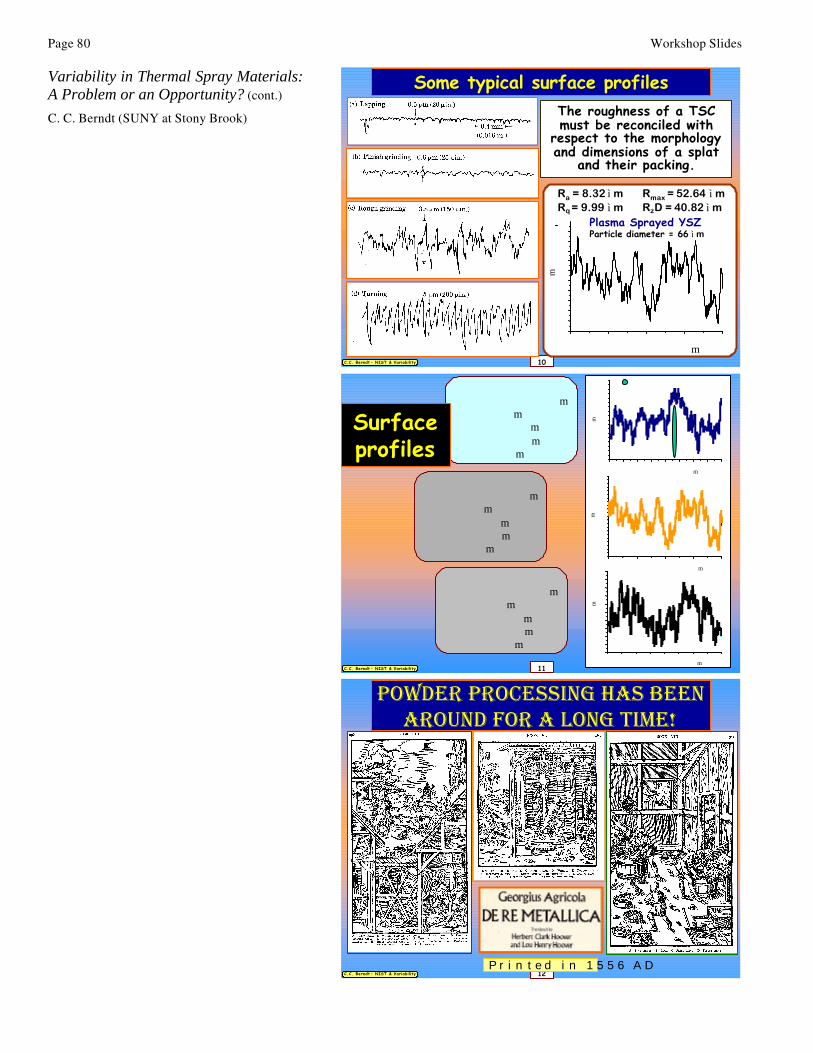
Page 80 Workshop Slides
Variability in Thermal Spray Materials:A Problem or an Opportunity? (cont.)
C. C. Berndt (SUNY at Stony Brook)
10C.C. Berndt – NIST & Variability
Some typical surface profilesThe roughness of a TSC must be reconciled with
respect to the morphology and dimensions of a splat
and their packing.
0 1000 2000 3000 4000-50
-40
-30
-20
-10
0
10
20
30
40
50
60
Y (
µm
)
Measuring Length (µm)
Plasma Sprayed YSZParticle diameter = 66 ì m
Ra = 8.32 ì mRq = 9.99 ì m
Rmax = 52.64 ì mRzD = 40.82 ì m
11C.C. Berndt – NIST & Variability
0 1000 2000 3000 4000-50
-40
-30
-20
-10
0
10
20
30
40
50
60
Y (
µm)
Measuring Length ( µm)
0 1000 2000 3000 4000-50
-40
-30
-20
-10
0
10
20
30
40
50
Y (
µm
)
Measuring Length ( µm)
0 500 1000 1500 2000 2500 3000 3500 4000-30
-20
-10
0
10
20
30
40
50
60
Y (
µm)
Measuring Length ( µm)
Cold Sprayed TiAverage size = ??µmRa= 9.35 µmRzD = 49.65 µmRmax = 58.38 µmRq = 11.53 µm
HOSP PSZAverage size = 66 µmRa= 8.32 µmRzD = 40.82 µmRmax = 52.64 µmRq = 9.99 µm
Nanostructured PSZAverage size = 23 µmRa= 5.79 µmRzD = 32.02 µmRmax = 39.86 µmRq = 7.35 µm
Surface profiles
12C.C. Berndt – NIST & Variability
Powder Processing has been around for a long time!
P r i n t e d i n 1 5 5 6 A D
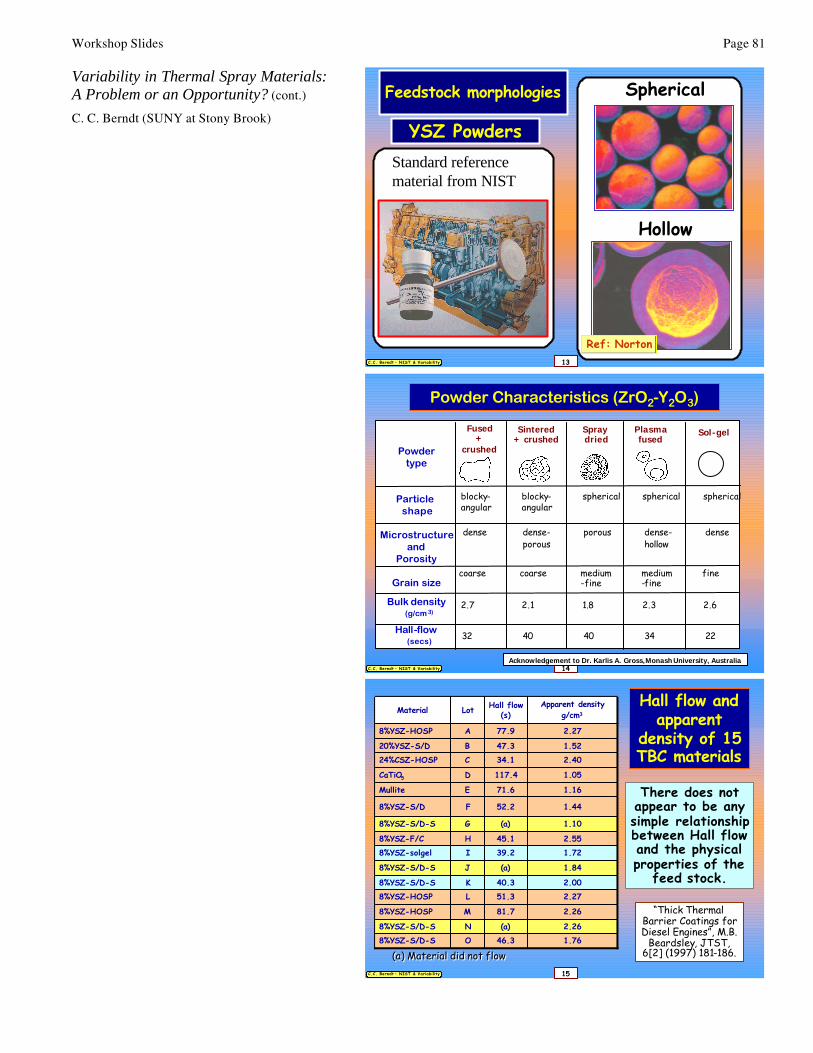
Workshop Slides Page 81
Variability in Thermal Spray Materials:A Problem or an Opportunity? (cont.)
C. C. Berndt (SUNY at Stony Brook)
13C.C. Berndt – NIST & Variability
Standard reference material from NIST
Hollow
Spherical
Ref: Norton
YSZ Powders
Feedstock morphologies
14C.C. Berndt – NIST & Variability
Powder Characteristics (ZrO2-Y2O3)
Fused +
crushed
Sintered+ crushed
Spraydried
Plasmafused
32 40 40 34 22
Powdertype
Particle shape
Microstructureand
Porosity
Grain size
Bulk density(g/cm 3)
Hall-flow(secs)
Sol-gel
blocky- blocky- spherical spherical sphericalangular angular
dense dense- porous dense- denseporous hollow
coarse coarse medium medium fine-fine -fine
2.7 2.1 1.8 2.3 2.6
Acknowledgement to Dr. Karlis A. Gross, MonashUniversity, Australia
15C.C. Berndt – NIST & Variability
Hall flow and apparent
density of 15 TBC materials
1.7646.3O8%YSZ-S/D-S2.26(a)N8%YSZ-S/D-S
2.2681.7M8%YSZ-HOSP
2.2751.3L8%YSZ-HOSP2.0040.3K8%YSZ-S/D-S
1.84(a)J8%YSZ-S/D-S
1.7239.2I8%YSZ-solgel2.5545.1H8%YSZ-F/C
1.10(a)G8%YSZ-S/D-S
1.4452.2F8%YSZ-S/D
1.1671.6EMullite
1.05117.4DCaTiO5
2.4034.1C24%CSZ-HOSP1.5247.3B20%YSZ-S/D
2.2777.9A8%YSZ-HOSP
Apparent densityg/cm3
Hall flow (s)LotMaterial
(a) Material did not flow(a) Material did not flow
“Thick Thermal Barrier Coatings for Diesel Engines”, M.B.
Beardsley, JTST, 6[2] (1997) 181-186.
There does not appear to be any simple relationship between Hall flow and the physical properties of the
feed stock.

Page 82 Workshop Slides
Variability in Thermal Spray Materials:A Problem or an Opportunity? (cont.)
C. C. Berndt (SUNY at Stony Brook)
16C.C. Berndt – NIST & Variability
Hazards posed by particulate materials
• Fine materials can be pyrophoric in nature, and therefore, be a spontaneous fire or explosive risk.
• The material may be carcinogenic.• Very fine materials (0.5 to 5 µµm)
may be able to penetrate the alveoli and cause fibrosis of the lungs.
• Large quantities of very fine materials present in the environment can be inhaled during normal breathing and damage the lungs.
• Fine materials are a skin and eye irritant.
17C.C. Berndt – NIST & Variability
“The Feed Me Catch 22”!The biggest and most significant part of TS!
“The Feed Me Catch 22”!The biggest and most significant part of TS!
• The feedstock that will most likely form a coating will be that which enters the TS process zone.
• The particles which are most easily “processed” are also the most difficult to feed into the TS process zone.
• The feedstock that will most likely form a coating will be that which enters the TS process zone.
• The particles which are most easily “processed” are also the most difficult to feed into the TS process zone.
18C.C. Berndt – NIST & Variability
Spray Parameters vs. DE and DRHow do these factors influence DE and DR?
• Spray foot print (cm2)
• Substrate cooling (m3s-1)• Powder injector (mm)• Traverse speed of torch (ms-1)
Hardware• Stand off distance (cm)• Feed gas and flow rate (slpm)• Secondary gas and flow rate (slpm)
• Primary gas and flow rate (slpm)• Volts and Amps = Power (kW)
• Torch type [anode, cathode, injector ring (in mm)]
Plasma Processing EquipmentDRDE
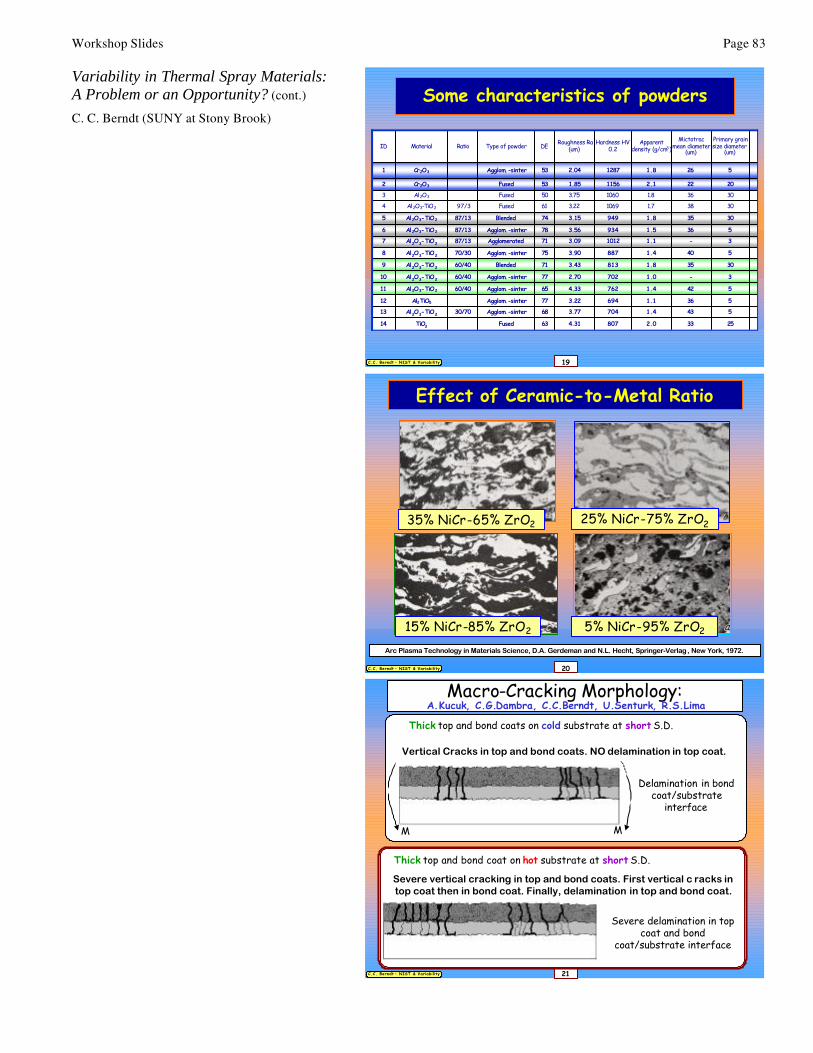
Workshop Slides Page 83
Variability in Thermal Spray Materials:A Problem or an Opportunity? (cont.)
C. C. Berndt (SUNY at Stony Brook)
19C.C. Berndt – NIST & Variability
Some characteristics of powders
25332.08074.3163FusedTiO214
5431.47043.7768Agglom.-sinter30/70Al2O3-TiO213
5361.16943.2277Agglom.-sinterAl2TiO512
5421.47624.3365Agglom.-sinter60/40Al2O3-TiO211
3-1.07022.7077Agglom.-sinter60/40Al2O3-TiO210
30351.88133.4371Blended60/40Al2O3-TiO29
5401.48873.9075Agglom.-sinter70/30Al2O3-TiO28
3-1.110123.0971Agglomerated87/13Al2O3-TiO27
5361.59343.5678Agglom.-sinter87/13Al2O3-TiO26
30351.89493.1574Blended87/13Al2O3-TiO25
30381.710693.2261Fused97/3Al2O3-TiO24
30361.810603.7550FusedAl2O33
20222.111561.8553FusedCr2O32
5261.812872.0453Agglom.-sinterCr2O31
Primary grain size diameter
(um)
Mictotrac mean diameter
(um)Apparent
density (g/cm3)Hardness HV
0.2Roughness Ra
(um)DEType of powderRatioMaterialID
20C.C. Berndt – NIST & Variability
Effect of Ceramic-to-Metal Ratio
Arc Plasma Technology in Materials Science, D.A. Gerdeman and N.L. Hecht, Springer-Verlag, New York, 1972.
15% NiCr-85% ZrO2 5% NiCr-95% ZrO2
35% NiCr-65% ZrO2 25% NiCr-75% ZrO2
21C.C. Berndt – NIST & Variability
Macro-Cracking Morphology:A.Kucuk, C.G.Dambra, C.C.Berndt, U.Senturk, R.S.Lima
Thick top and bond coats on cold substrate at short S.D.
M M
Vertical Cracks in top and bond coats. NO delamination in top coat.
Delamination in bond coat/substrate
interface
Thick top and bond coat on hot substrate at short S.D.
Severe vertical cracking in top and bond coats. First vertical c racks in top coat then in bond coat. Finally, delamination in top and bond coat.
Severe delamination in top coat and bond
coat/substrate interface
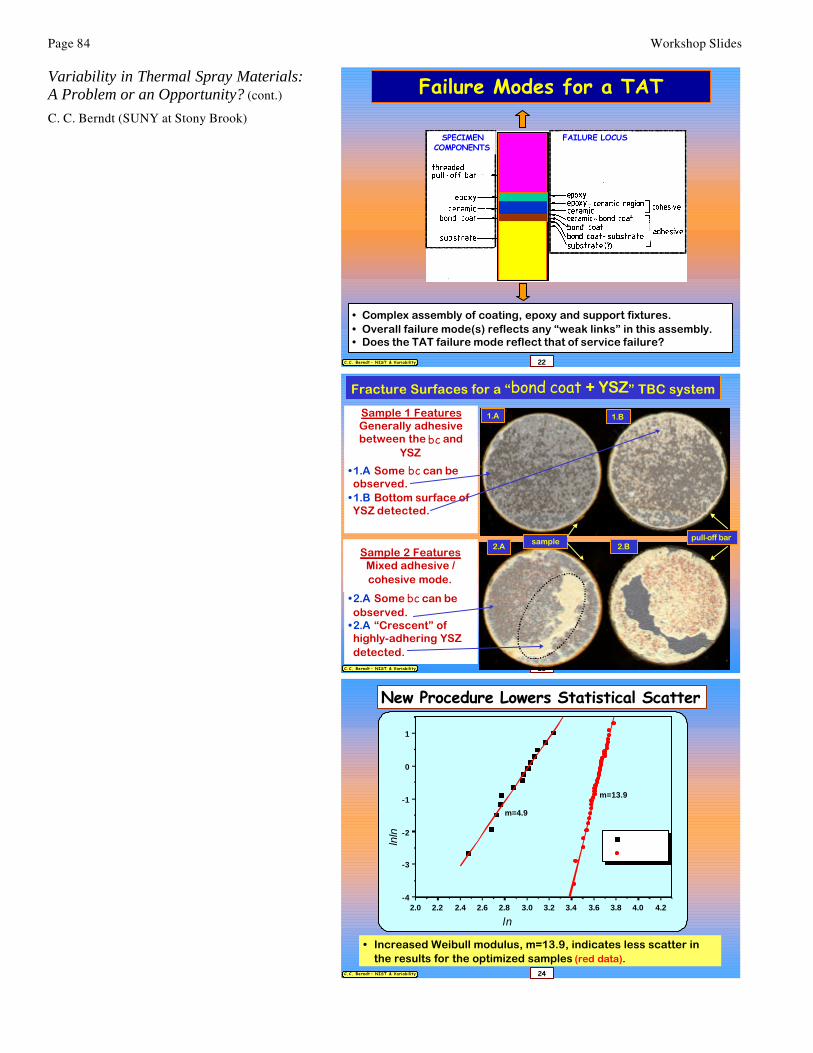
Page 84 Workshop Slides
Variability in Thermal Spray Materials:A Problem or an Opportunity? (cont.)
C. C. Berndt (SUNY at Stony Brook)
22C.C. Berndt – NIST & Variability
Failure Modes for a TAT
FAILURE LOCUSSPECIMEN COMPONENTS
• Complex assembly of coating, epoxy and support fixtures.• Overall failure mode(s) reflects any “weak links” in this assembly.• Does the TAT failure mode reflect that of service failure?
23C.C. Berndt – NIST & Variability
Fracture Surfaces for a “bond coat + YSZ” TBC system
•1.A Some bc can be observed.
•1.B Bottom surface of YSZ detected.
1.A
2.A
1.B
2.Bsample pull-off bar
Sample 1 FeaturesGenerally adhesive between the bc and
YSZ
•2.A Some bc can be observed.
•2.A “Crescent” of highly-adhering YSZ detected.
Sample 2 FeaturesMixed adhesive / cohesive mode.
24C.C. Berndt – NIST & Variability
• Increased Weibull modulus, m=13.9, indicates less scatter in the results for the optimized samples (red data).
New Procedure Lowers Statistical Scatter
2.0 2.2 2.4 2.6 2.8 3.0 3.2 3.4 3.6 3.8 4.0 4.2-4
-3
-2
-1
0
1
m=13.9
m=4.9
IMC.PLee.P
lnln
(1/(
1-P
))
ln (Strength-MPa)
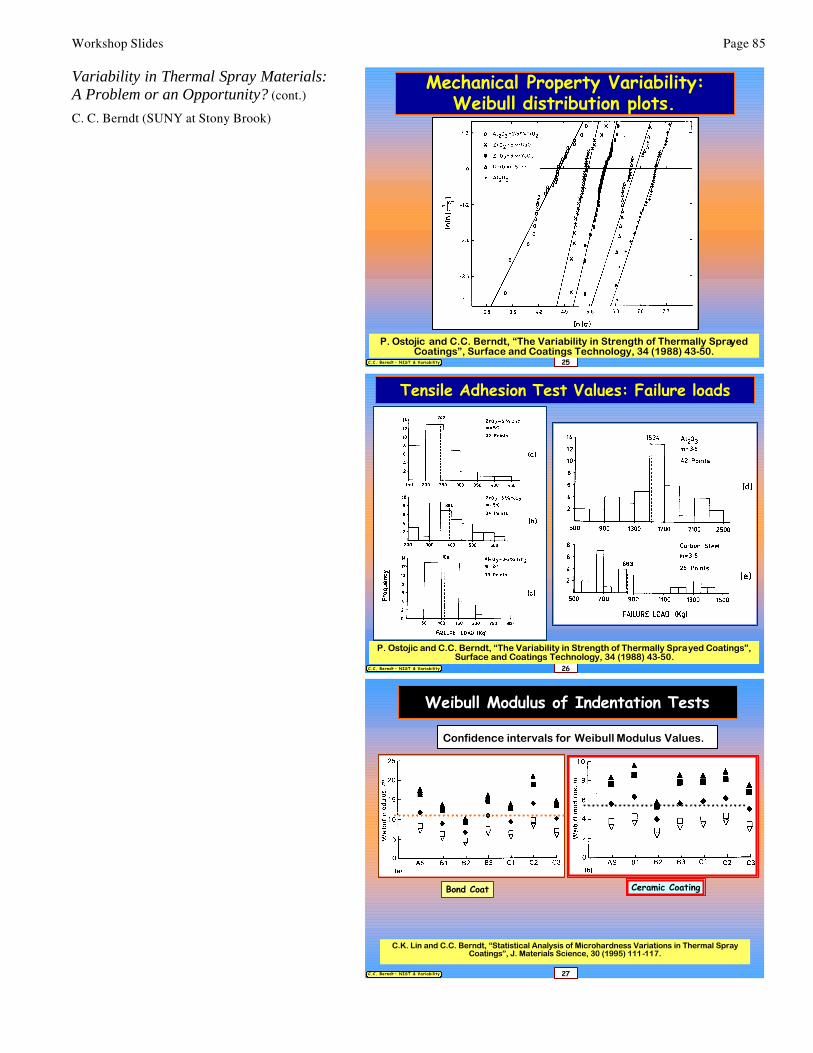
Workshop Slides Page 85
Variability in Thermal Spray Materials:A Problem or an Opportunity? (cont.)
C. C. Berndt (SUNY at Stony Brook)
25C.C. Berndt – NIST & Variability
Mechanical Property Variability:Weibull distribution plots.
P. Ostojic and C.C. Berndt, “The Variability in Strength of Thermally Sprayed Coatings”, Surface and Coatings Technology, 34 (1988) 43-50.
26C.C. Berndt – NIST & Variability
Tensile Adhesion Test Values: Failure loads
P. Ostojic and C.C. Berndt, “The Variability in Strength of Thermally Sprayed Coatings”, Surface and Coatings Technology, 34 (1988) 43-50.
27C.C. Berndt – NIST & Variability
Weibull Modulus of Indentation Tests
C.K. Lin and C.C. Berndt, “Statistical Analysis of Microhardness Variations in Thermal Spray Coatings”, J. Materials Science, 30 (1995) 111-117.
Confidence intervals for Weibull Modulus Values.
Ceramic CoatingBond Coat

Page 86 Workshop Slides
Variability in Thermal Spray Materials:A Problem or an Opportunity? (cont.)
C. C. Berndt (SUNY at Stony Brook)
28C.C. Berndt – NIST & Variability
Weibull Modulus for a “Variegated Experimental Feedstock”
6.0 6 .2 6 .4 6 .6 6 .8 7 .0 7 .2 7 .4 7 .6 7 .8 8 .0- 5
- 4
- 3
- 2
- 1
0
1
2
n = 8 0m = 3.91
m = 1.49
lnln
[1
/(1
-P)]
ln HK (10 g)
Set 1
Set 2
Set 3
Set 4
29C.C. Berndt – NIST & Variability
Microindentation: Stress loadingCourtesy: Prof. T. Nakamura (SUNY at Stony Brook)
Effective Stress δ = 0.2 µm Effective Stress δ = 0.4 µm Effective Stress δ = 0.6 µm
Effective Stress δ = 0.8 µm Effective Stress δ = 1.0 µm
30C.C. Berndt – NIST & Variability
C.C. Berndt et al., “Anisotropic Thermal Expansion Effects in Plasma-Sprayed ZrO2-8%Y2O3Coatings”, Ceramic Engineering and Science Proceedings, 4 [9/10] (1983) 792-801.
Anisotropic Thermal ExpansionLongitudinal and transverse expansion coefficients of coatings.
Heat treated in argon for 10 and 120 h.Heat treated in air for 10 and 120 h.

Workshop Slides Page 87
Variability in Thermal Spray Materials:A Problem or an Opportunity? (cont.)
C. C. Berndt (SUNY at Stony Brook)
31C.C. Berndt – NIST & Variability
L. Leblanc and C. Moreau, “Study on the Log-Term Stability of Plasma Spraying”, pp. 1233-1239 of “Thermal Spray: Surface Engineering via Applied Research, C.C. Berndt (Ed.), Pub. ASM International, Materials Park, OH-USA, 2000.
“Wear” of Thermal Spray Equipment
Correlation between particle temperature, gun power (A) and plasma net energy (B).
Evolution of the plasma gun parameters during 55 hours of spraying using the
nominal operating conditions (constant arc current). Arc current (A) and DC voltage (B) are used in the calculation of the gun
power (C) and plasma net energy (D).
32C.C. Berndt – NIST & Variability
Control Feedback Loops for Thermal SprayControl Feedback Loops for Thermal Spray
INSULATORCATHODE (W)
PLASMA FLAMEANODE
ARC
CIRCULATINGCOOLANT (WATER)
CARRIERGAS FEED
DC POWER
SPRAY POWDER SUSPENDED IN CARRIER GAS
SPRAYSTREAM
Power, gas flows, cooling, spray distance, powder injection geometry
and carrier gas flows
Particle velocity & temperature
SUBSTRATE
DEPOSIT
Thickness &temperature
33C.C. Berndt – NIST & Variability
A B C
Correlation function of off-line & on-line measured
parameters
Structure-property
relationship
• Power• Flow rate• Nozzle• Particle size
• Plasma tv• Particle tv• Particle trajectory• Build-up: thickness & roughness
• Deposit %• Porosity• Unmelts• Microstructure
Relationships between torch
physics and particle properties
Properties• Adhesion• Controlled density• High cycle life
PRODUCT
A B & C On-line links between the different sectors of IPM to form a product
e.g. e.g.e.g. e.g.
ControllableGun/ParticleParameters
On-lineMeasurableParameters
Off-lineMeasured
CharacteristicsTargetedProperties
ON-LINE CONTROL (Thermal Spray)

Page 88 Workshop Slides
Variability in Thermal Spray Materials:A Problem or an Opportunity? (cont.)
C. C. Berndt (SUNY at Stony Brook)
34C.C. Berndt – NIST & Variability
Feedstock(s)
Thermal Spray-Flame-particle interaction
Molten,semi-molten,unmelted particles;Temperature, Velocity, Particle size
No deposition(economic impact)
?Spreading?; Madejski Eqn:D/d=ARe
0.2
DepositionEfficiency
Built-up
Coating Characteristics = Func.Powder,Spray Parameters, DPV2000Characteristics, DE,Phase
Particle size, Phase, Binding strength
Spray Parameters
DPV2000“Tv+p”
Deposition
Poor coating(economic impact)
Good coating
(Microstructure, Roughness,Mechanical Properties, Thermal Properties etc.)
A Flow Chart of Particle Behavior
35C.C. Berndt – NIST & Variability
Visions and Dreams
36C.C. Berndt – NIST & Variability
TS:Which Direction? TS:
Which Direction?
TS:Which Direction?
TS:Which Direction?

Workshop Slides Page 89
Variability in Thermal Spray Materials:A Problem or an Opportunity? (cont.)
C. C. Berndt (SUNY at Stony Brook)
37C.C. Berndt – NIST & Variability
• ……………………………9
• The Weibull Modulus is an example of a material characteristic that needs to be closely examimed .8
• Should we have standardized tests for TS materials?7
• There needs to be coordination of TS activities on a national basis.6
• The present “combative mode” of industry and research institutions may be a short sighted vision to solve the really important problems that have yet to be identified.
5
• The “science” is still following the “engineering”>4
• Variability of coatings is limiting TS growth and new markets.3
• “Control of variability” may not necessarily by economically viable for all TS applications / markets.2
• Variability in TS deposits arises due to the intrinsic nature of the TS processing zone.1
Concluding Remarks
38C.C. Berndt – NIST & Variability
39C.C. Berndt – NIST & Variability
JTST - A Resource for Thermal Spray

Page 90 Workshop Slides
Variability in Thermal Spray Materials:A Problem or an Opportunity? (cont.)
C. C. Berndt (SUNY at Stony Brook)
40C.C. Berndt – NIST & Variability
Some “models” of particle behavior!
Agglomeration, sintering etc.
Spheroids
41C.C. Berndt – NIST & Variability
Feed Me!
42C.C. Berndt – NIST & Variability
SPLAT, SPLATTER, SPLOT, SPLOTCH, SPLUTTER, and SPLASH!

Workshop Slides Page 91
Variability in Thermal Spray Materials:A Problem or an Opportunity? (cont.)
C. C. Berndt (SUNY at Stony Brook)
43C.C. Berndt – NIST & Variability
Solidification Processing of Lamellae via Advanced Technology!

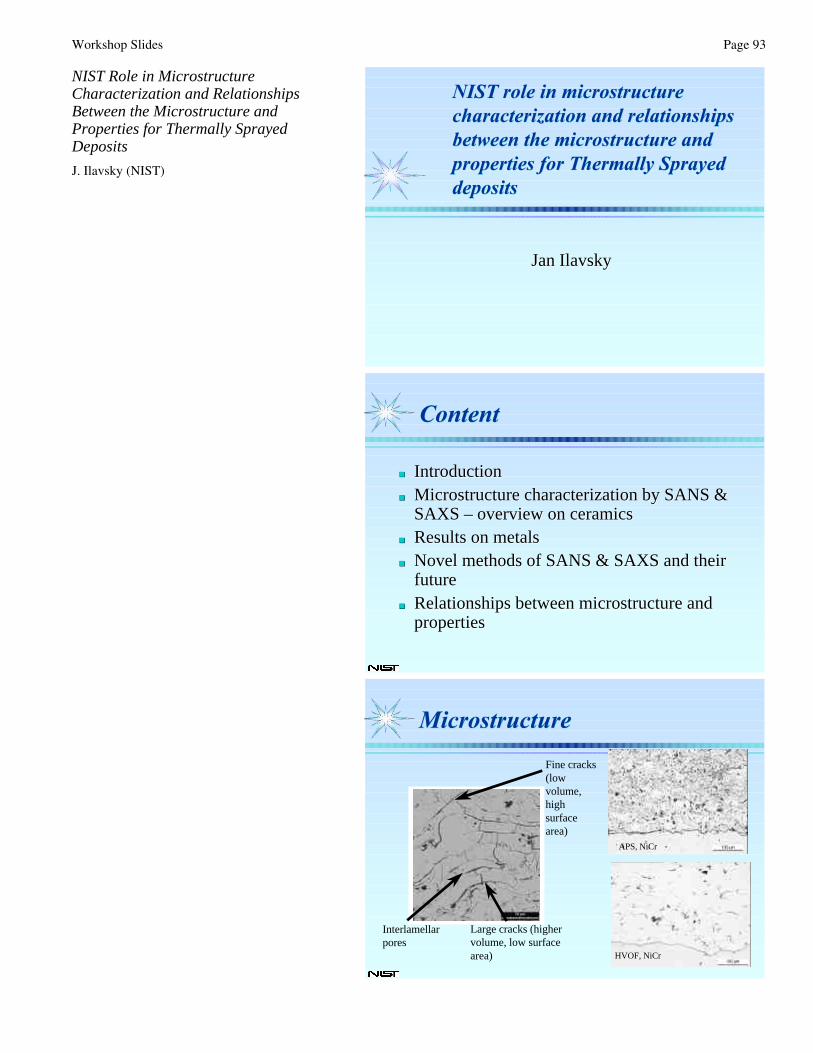
Workshop Slides Page 93
NIST Role in MicrostructureCharacterization and RelationshipsBetween the Microstructure andProperties for Thermally SprayedDeposits
J. Ilavsky (NIST)
NIST role in microstructure characterization and relationships between the microstructure and properties for Thermally Sprayed deposits
NIST role in microstructure characterization and relationships between the microstructure and properties for Thermally Sprayed deposits
Jan IlavskyJan Ilavsky
ContentContent
nn Introduction Introduction nn Microstructure characterization by SANS & Microstructure characterization by SANS &
SAXS SAXS –– overview on ceramicsoverview on ceramicsnn Results on metalsResults on metalsnn Novel methods of SANS & SAXS and their Novel methods of SANS & SAXS and their
futurefuturenn Relationships between microstructure and Relationships between microstructure and
propertiesproperties
MicrostructureMicrostructure
Fine cracks (low volume, high surface area)
Large cracks (higher volume, low surface area)
Interlamellar pores
HVOF, NiCr
APS, NiCr
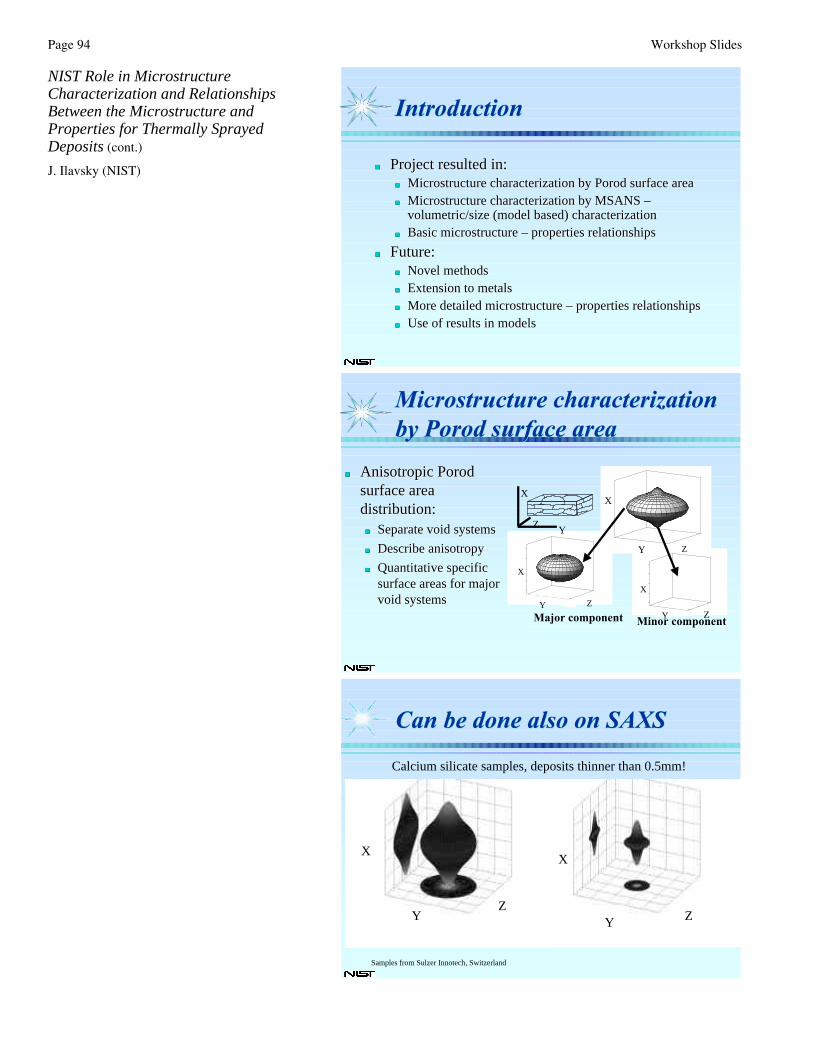
Page 94 Workshop Slides
NIST Role in MicrostructureCharacterization and RelationshipsBetween the Microstructure andProperties for Thermally SprayedDeposits (cont.)
J. Ilavsky (NIST)
IntroductionIntroduction
nn Project resulted in:Project resulted in:nn Microstructure characterization by Porod surface areaMicrostructure characterization by Porod surface areann Microstructure characterization by MSANS Microstructure characterization by MSANS ––
volumetric/size (model based) characterizationvolumetric/size (model based) characterizationnn Basic microstructure Basic microstructure –– properties relationshipsproperties relationships
nn Future:Future:nn Novel methodsNovel methodsnn Extension to metals Extension to metals nn More detailed microstructure More detailed microstructure –– properties relationshipsproperties relationshipsnn Use of results in modelsUse of results in models
Microstructure characterization by Porod surface areaMicrostructure characterization by Porod surface area
nn Anisotropic Porod Anisotropic Porod surface area surface area distribution:distribution:
nn Separate void systemsSeparate void systems
nn Describe anisotropyDescribe anisotropy
nn Quantitative specific Quantitative specific surface areas for major surface areas for major void systemsvoid systems
-20000
-10000
0
10000
20000
X-a
xis
dire
ctio
n of
the
sam
ple
-20000
-10000
0
10000
20000
Y direction (parallel substrate)
-20000-10000
010000
20000Z direction (parallel substrate)
-20000
-10000
0
10000
20000
X-a
xis
dire
ctio
n of
the
sam
ple
-20000
-10000
0
10000
20000
Y direction (parallel substrate)
-20000-10000
010000
20000Z direction (parallel substrate)
Major component
X
Y
X
Z
X
YZ
Y ZZ
X
YMinor component
Can be done also on SAXSCan be done also on SAXS
X
YZ
X
Y Z
Calcium silicate samples, deposits thinner than 0.5mm!
Samples from Sulzer Innotech, Switzerland
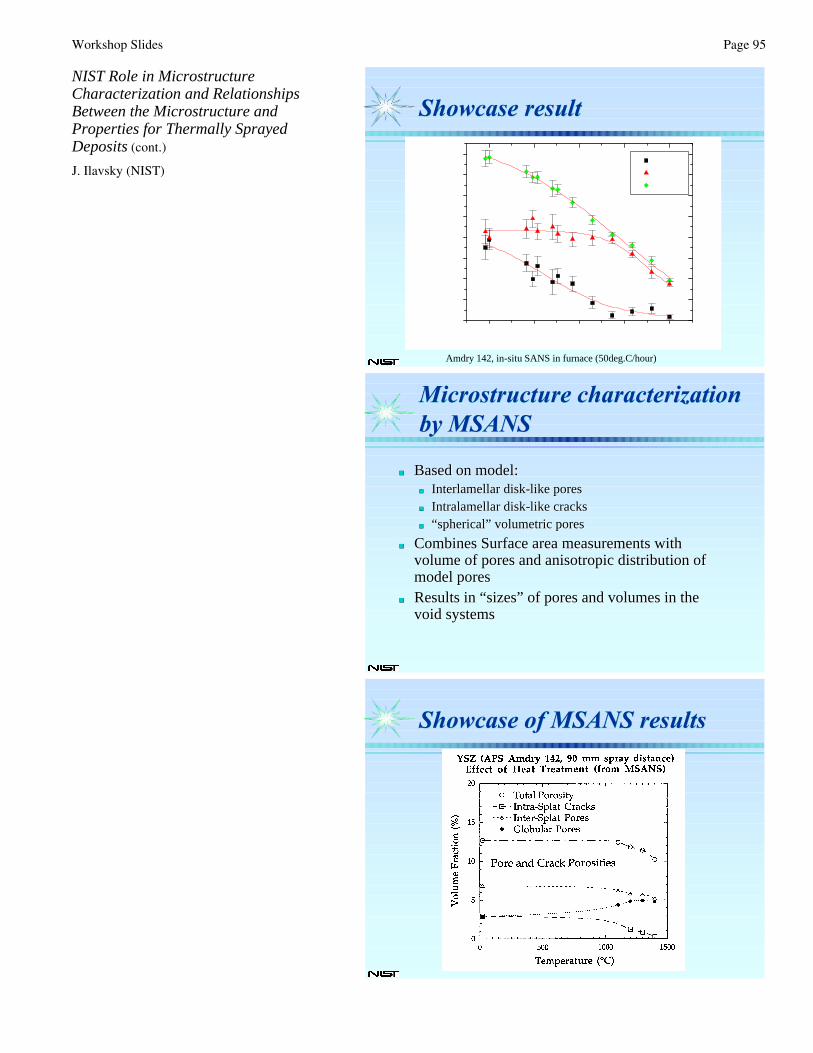
Workshop Slides Page 95
NIST Role in MicrostructureCharacterization and RelationshipsBetween the Microstructure andProperties for Thermally SprayedDeposits (cont.)
J. Ilavsky (NIST)
Showcase resultShowcase result
600 800 1000 1200 14000
5000
10000
15000
20000
25000
30000
35000
40000 Cracks
Pores
Total
Spe
cific
voi
ds s
urfa
ce a
rea
[cm
2 /cm
3 ]
Temperature [oC]
Amdry 142, in-situ SANS in furnace (50deg.C/hour)
Microstructure characterization by MSANSMicrostructure characterization by MSANS
nn Based on model:Based on model:nn Interlamellar Interlamellar diskdisk--like poreslike poresnn Intralamellar diskIntralamellar disk--like crackslike cracksnn “spherical” volumetric pores“spherical” volumetric pores
nn Combines Surface area measurements with Combines Surface area measurements with volume of pores and anisotropic distribution of volume of pores and anisotropic distribution of model poresmodel pores
nn Results in “sizes” of pores and volumes in the Results in “sizes” of pores and volumes in the void systems void systems
Showcase of MSANS resultsShowcase of MSANS results
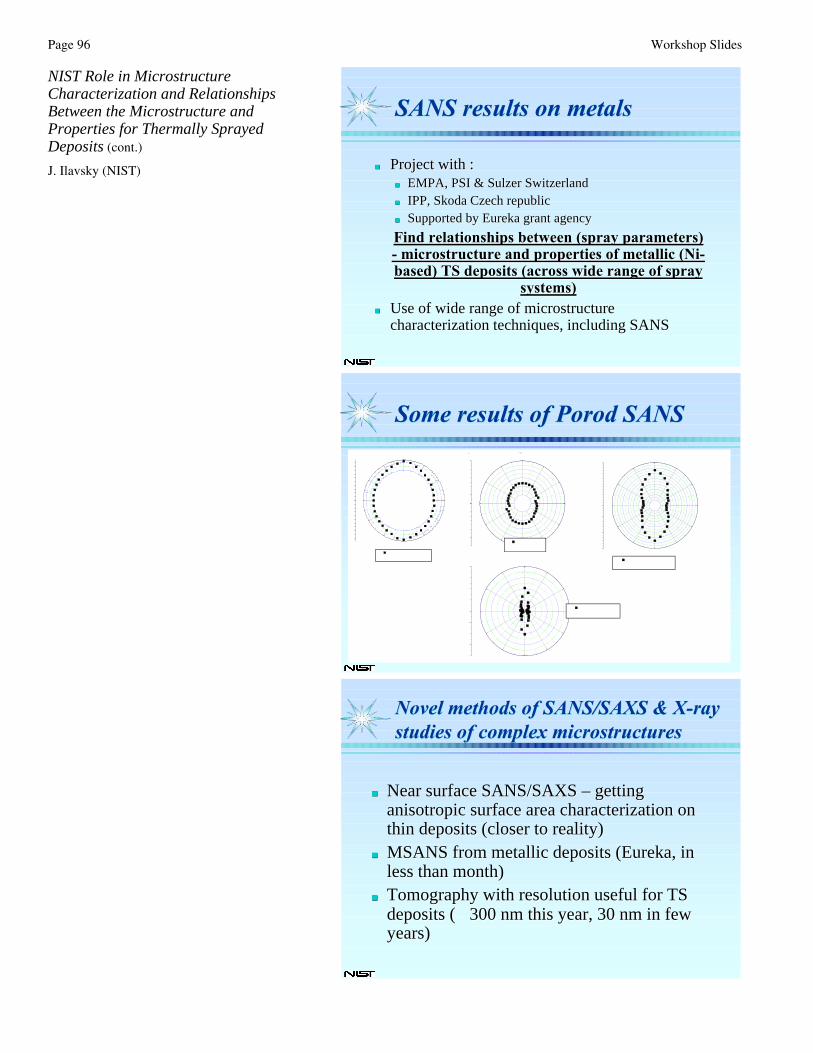
Page 96 Workshop Slides
NIST Role in MicrostructureCharacterization and RelationshipsBetween the Microstructure andProperties for Thermally SprayedDeposits (cont.)
J. Ilavsky (NIST)
SANS results on metalsSANS results on metals
nn Project with :Project with :nn EMPA, PSI & EMPA, PSI & Sulzer Sulzer SwitzerlandSwitzerlandnn IPP, IPP, Skoda Skoda Czech republicCzech republicnn Supported by Eureka grant agencySupported by Eureka grant agency
Find relationships between (spray parameters) Find relationships between (spray parameters) -- microstructure and properties of metallic (Nimicrostructure and properties of metallic (Ni--based) TS deposits (across wide range of spray based) TS deposits (across wide range of spray
systems)systems)nn Use of wide range of microstructure Use of wide range of microstructure
characterization techniques, including SANScharacterization techniques, including SANS
Some results of Porod SANSSome results of Porod SANS
0
30
60
90
120
150
180
210
240
270
300
330
5472 IP990623 16
WSP NiCr
0.00
0.01
0.02
0.03
0.04
0.05
0
30
60
90
120
150
180
210
240
270
300
330
0.00
0.01
0.02
0.03
0.04
0.05 SM991939
APS, NiCr
2700.05
90
0.000
0.001
0.002
0.003
0.004
0.005
0.006
0.007
0.008
0
30
60
90
120
150
180
210
240
270
300
330
0.000
0.001
0.002
0.003
0.004
0.005
0.006
0.007
0.008
5560SK99070131, HVOF NiCr
0.000
0.001
0.002
0.003
0.004
0
30
60
90
120
150
180
210
240
270
300
330
0.000
0.001
0.002
0.003
0.004
EM99070116
NiCrBSi VPS FUSED
Novel methods of SANS/SAXS & X-ray studies of complex microstructuresNovel methods of SANS/SAXS & X-ray studies of complex microstructures
nn Near surface SANS/SAXS Near surface SANS/SAXS –– getting getting anisotropic surface area characterization on anisotropic surface area characterization on thin deposits (closer to reality)thin deposits (closer to reality)
nn MSANS from metallic deposits (Eureka, in MSANS from metallic deposits (Eureka, in less than month)less than month)
nn Tomography with resolution useful for TS Tomography with resolution useful for TS deposits (deposits (≈≈ 300 nm this year, 30 nm in few 300 nm this year, 30 nm in few years)years)

Workshop Slides Page 97
NIST Role in MicrostructureCharacterization and RelationshipsBetween the Microstructure andProperties for Thermally SprayedDeposits (cont.)
J. Ilavsky (NIST)
0 200 400 600 800 1000 1200 14000
2
4
6
8
10
12
14
Porosity volume [%]
Por
osity
[%]
Annealing temperature [ °C]
0
5000
10000
15000
20000
25000
30000
35000
Specific voids surface area [cm2/cm3]
25 % decrease in Porosity60 % decrease in surface area2.5 -3.2 increase in Young Modulus
Zirconia Microstructure –elastic modulus relationshipZirconia Microstructure –elastic modulus relationship
Specific voids surface area [cm
2/cm3]
Microstructure properties relationships - anisotropyMicrostructure properties relationships - anisotropy
nn Found relationships Found relationships between SANS between SANS characteristics and characteristics and properties.properties.
nn Showcase: anisotropy of Showcase: anisotropy of electrical conductivity and electrical conductivity and elastic properties directly elastic properties directly related to SANS surface related to SANS surface area anisotropyarea anisotropy
0.9 3.1 3.8 8.6
1.1 1.4 1.4 1.4
E||/E⊥ 1.2 2.0 2.0 1.9
SANS aspect
ratio|| to ⊥
1.1 1.4 - 2.6
1 Electrical conductivity anisotropy2 Ultrasound speed anisotropy3 Elastic modulus anisotropy4 SANS surface area anisotropy
1
2
3
4
ρII
ρ⊥I
cL||/cL
⊥
Future of the program…Future of the program…
nn NIST more involved in metals NIST more involved in metals –– MSANS MSANS techniquetechnique
nn More detailed understanding of microstructureMore detailed understanding of microstructure--properties relationships, useful for modeling.properties relationships, useful for modeling.
nn Understanding of spray processing parameters Understanding of spray processing parameters (impact speed and temperature) and (impact speed and temperature) and microstructure, useful for modeling.microstructure, useful for modeling.
nn XX--ray and neutron techniques useful for ray and neutron techniques useful for industrially applicable deposits industrially applicable deposits –– and industrial and industrial research.research.

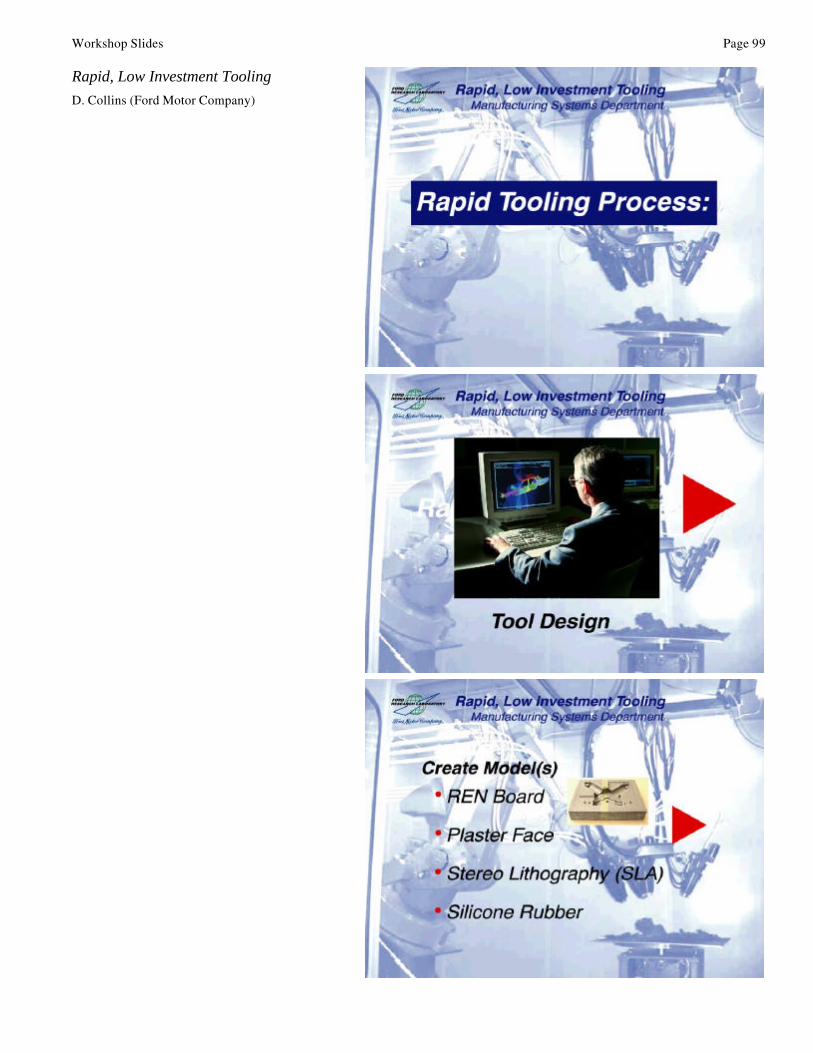
Workshop Slides Page 99
Rapid, Low Investment Tooling
D. Collins (Ford Motor Company)

Page 100 Workshop Slides
Rapid, Low Investment Tooling (cont.)
D. Collins (Ford Motor Company)
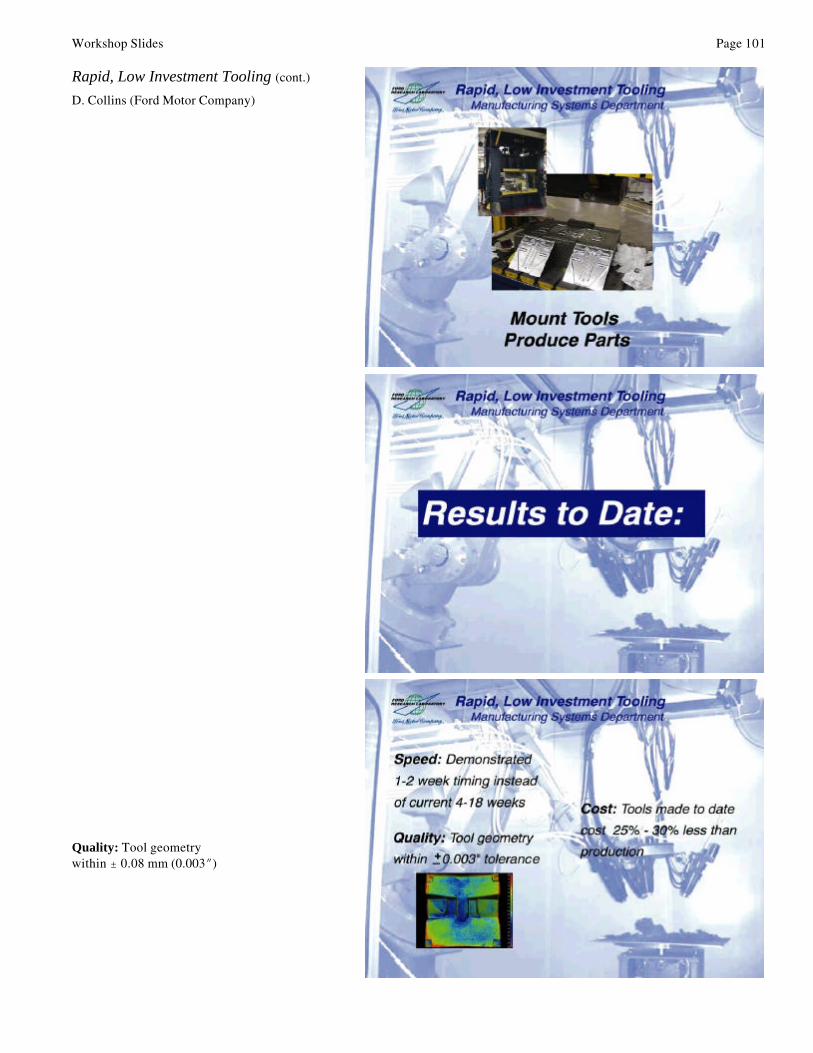
Workshop Slides Page 101
Rapid, Low Investment Tooling (cont.)
D. Collins (Ford Motor Company)
Quality: Tool geometrywithin " 0.08 mm (0.003O)
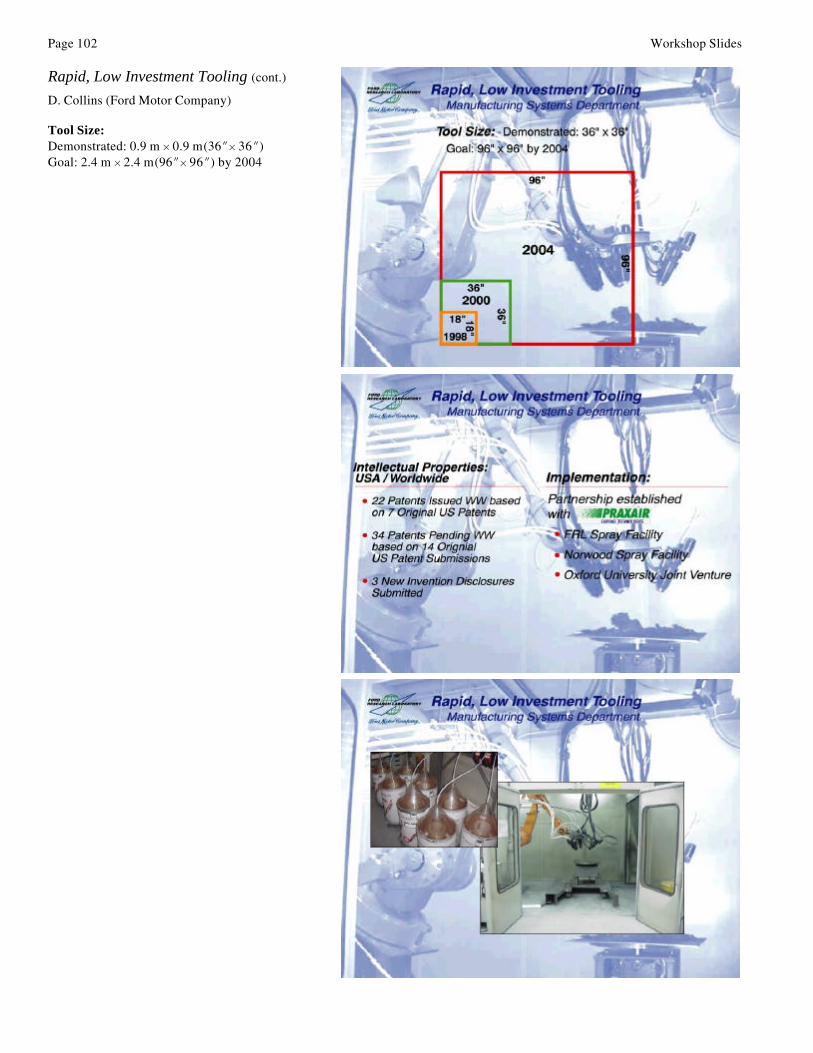
Page 102 Workshop Slides
Rapid, Low Investment Tooling (cont.)
D. Collins (Ford Motor Company)
Tool Size:Demonstrated: 0.9 m H 0.9 m(36OH 36O)Goal: 2.4 m H 2.4 m(96OH 96O) by 2004
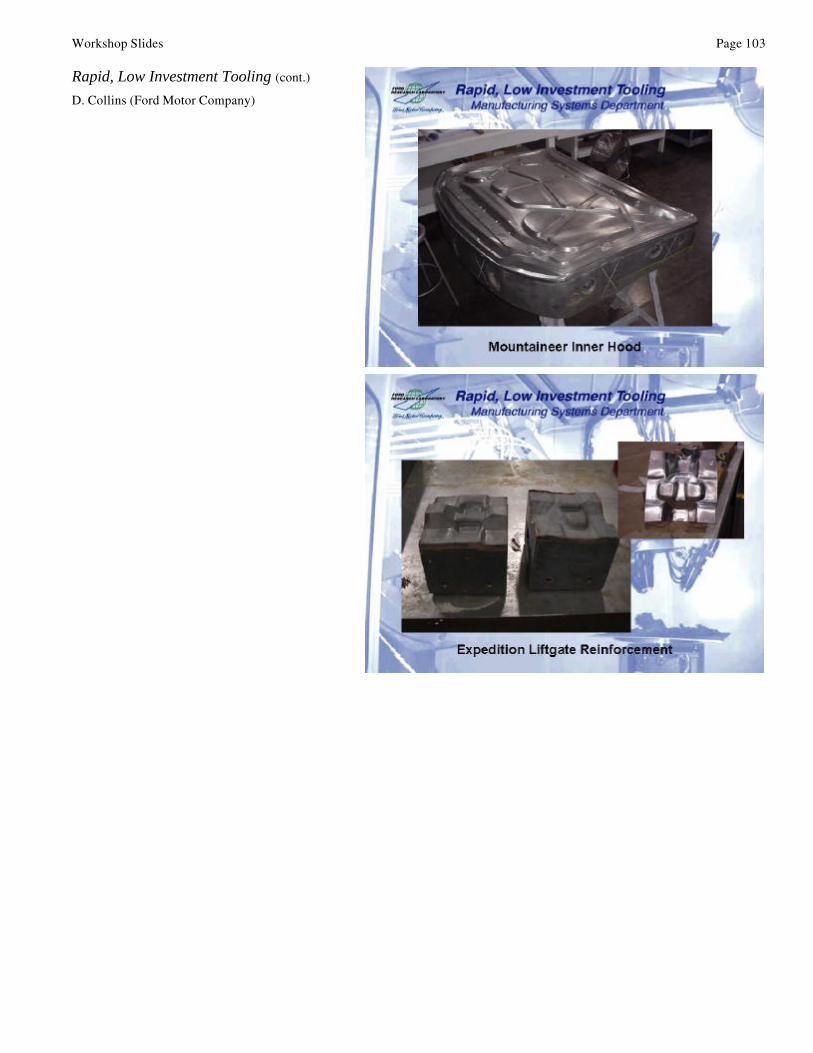
Workshop Slides Page 103
Rapid, Low Investment Tooling (cont.)
D. Collins (Ford Motor Company)

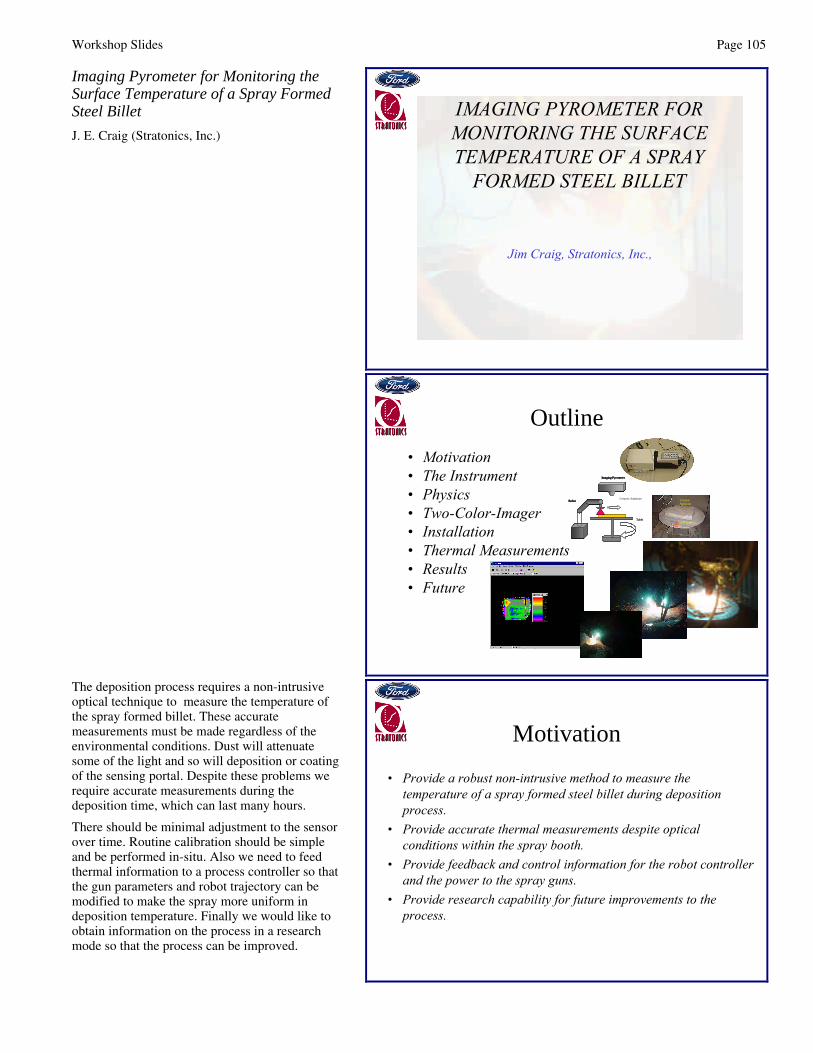
Workshop Slides Page 105
Imaging Pyrometer for Monitoring theSurface Temperature of a Spray FormedSteel Billet
J. E. Craig (Stratonics, Inc.)
IMAGING PYROMETER FOR MONITORING THE SURFACE TEMPERATURE OF A SPRAY
FORMED STEEL BILLET
Jim Craig, Stratonics, Inc.,
Outline
• Motivation• The Instrument• Physics• Two-Color-Imager• Installation• Thermal Measurements• Results• Future
Ceramic Substrate
Table
Robot
Imaging Pyrometer
Table
Robot
Imaging Pyrometer
Robot Robot
Imaging PyrometerImaging Pyrometer
CeramicSubstrate
Table Rotates
CeramicSubstrate
Table Rotates
The deposition process requires a non-intrusiveoptical technique to measure the temperature ofthe spray formed billet. These accuratemeasurements must be made regardless of theenvironmental conditions. Dust will attenuatesome of the light and so will deposition or coatingof the sensing portal. Despite these problems werequire accurate measurements during thedeposition time, which can last many hours.
There should be minimal adjustment to the sensorover time. Routine calibration should be simpleand be performed in-situ. Also we need to feedthermal information to a process controller so thatthe gun parameters and robot trajectory can bemodified to make the spray more uniform indeposition temperature. Finally we would like toobtain information on the process in a researchmode so that the process can be improved.
Motivation
• Provide a robust non-intrusive method to measure the temperature of a spray formed steel billet during deposition process.
• Provide accurate thermal measurements despite optical conditions within the spray booth.
• Provide feedback and control information for the robot controller and the power to the spray guns.
• Provide research capability for future improvements to the process.
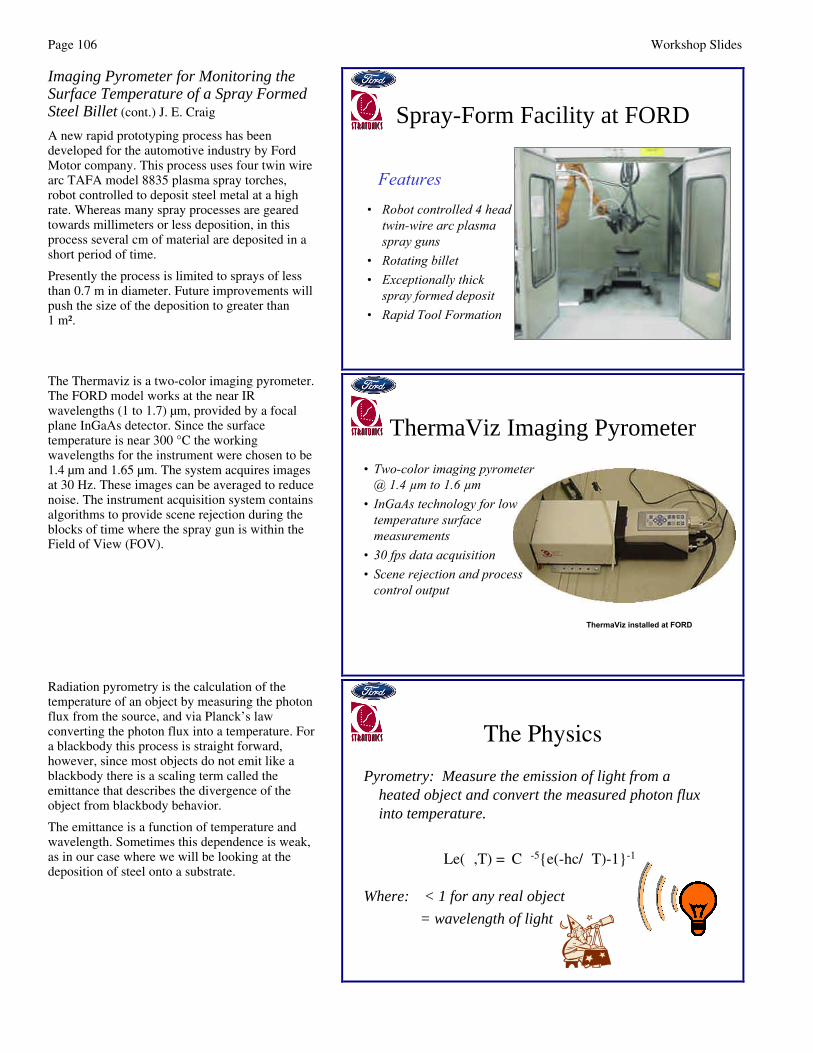
Page 106 Workshop Slides
Imaging Pyrometer for Monitoring theSurface Temperature of a Spray FormedSteel Billet (cont.) J. E. Craig
A new rapid prototyping process has beendeveloped for the automotive industry by FordMotor company. This process uses four twin wirearc TAFA model 8835 plasma spray torches,robot controlled to deposit steel metal at a highrate. Whereas many spray processes are gearedtowards millimeters or less deposition, in thisprocess several cm of material are deposited in ashort period of time.
Presently the process is limited to sprays of lessthan 0.7 m in diameter. Future improvements willpush the size of the deposition to greater than1 m².
Spray-Form Facility at FORD
• Robot controlled 4 head twin-wire arc plasma spray guns
• Rotating billet• Exceptionally thick
spray formed deposit• Rapid Tool Formation
Features
The Thermaviz is a two-color imaging pyrometer.The FORD model works at the near IRwavelengths (1 to 1.7) µm, provided by a focalplane InGaAs detector. Since the surfacetemperature is near 300 °C the workingwavelengths for the instrument were chosen to be1.4 µm and 1.65 µm. The system acquires imagesat 30 Hz. These images can be averaged to reducenoise. The instrument acquisition system containsalgorithms to provide scene rejection during theblocks of time where the spray gun is within theField of View (FOV).
ThermaViz Imaging Pyrometer
• Two-color imaging pyrometer @ 1.4 µm to 1.6 µm
• InGaAs technology for low temperature surface measurements
• 30 fps data acquisition• Scene rejection and process
control output
ThermaViz installed at FORD
Radiation pyrometry is the calculation of thetemperature of an object by measuring the photonflux from the source, and via Planck’s lawconverting the photon flux into a temperature. Fora blackbody this process is straight forward,however, since most objects do not emit like ablackbody there is a scaling term called theemittance that describes the divergence of theobject from blackbody behavior.
The emittance is a function of temperature andwavelength. Sometimes this dependence is weak,as in our case where we will be looking at thedeposition of steel onto a substrate.
The Physics
Pyrometry: Measure the emission of light from a heated object and convert the measured photon flux into temperature.
Le(λ,T) =εCλ-5e(-hc/λT)-1-1
Where: ε < 1 for any real object
λ = wavelength of light
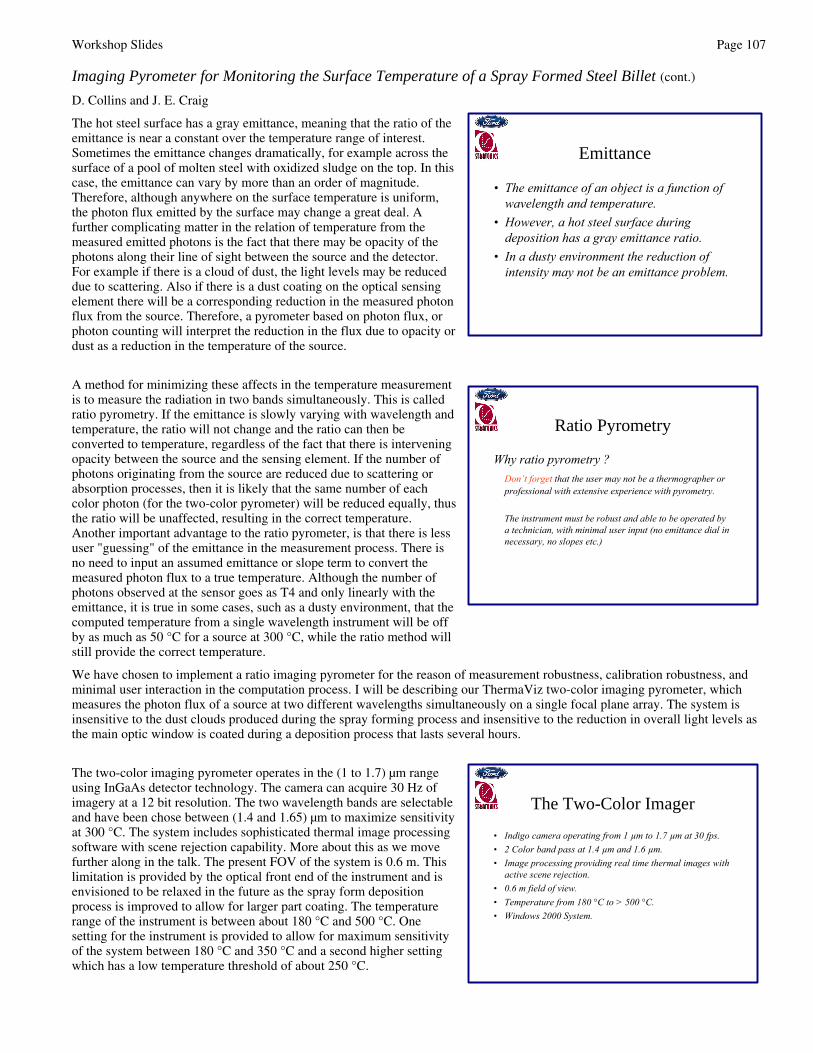
Workshop Slides Page 107
Imaging Pyrometer for Monitoring the Surface Temperature of a Spray Formed Steel Billet (cont.)
D. Collins and J. E. Craig
The hot steel surface has a gray emittance, meaning that the ratio of theemittance is near a constant over the temperature range of interest.Sometimes the emittance changes dramatically, for example across thesurface of a pool of molten steel with oxidized sludge on the top. In thiscase, the emittance can vary by more than an order of magnitude.Therefore, although anywhere on the surface temperature is uniform,the photon flux emitted by the surface may change a great deal. Afurther complicating matter in the relation of temperature from themeasured emitted photons is the fact that there may be opacity of thephotons along their line of sight between the source and the detector.For example if there is a cloud of dust, the light levels may be reduceddue to scattering. Also if there is a dust coating on the optical sensingelement there will be a corresponding reduction in the measured photonflux from the source. Therefore, a pyrometer based on photon flux, orphoton counting will interpret the reduction in the flux due to opacity ordust as a reduction in the temperature of the source.
A method for minimizing these affects in the temperature measurementis to measure the radiation in two bands simultaneously. This is calledratio pyrometry. If the emittance is slowly varying with wavelength andtemperature, the ratio will not change and the ratio can then beconverted to temperature, regardless of the fact that there is interveningopacity between the source and the sensing element. If the number ofphotons originating from the source are reduced due to scattering orabsorption processes, then it is likely that the same number of eachcolor photon (for the two-color pyrometer) will be reduced equally, thusthe ratio will be unaffected, resulting in the correct temperature.Another important advantage to the ratio pyrometer, is that there is lessuser "guessing" of the emittance in the measurement process. There isno need to input an assumed emittance or slope term to convert themeasured photon flux to a true temperature. Although the number ofphotons observed at the sensor goes as T4 and only linearly with theemittance, it is true in some cases, such as a dusty environment, that thecomputed temperature from a single wavelength instrument will be offby as much as 50 °C for a source at 300 °C, while the ratio method willstill provide the correct temperature.
We have chosen to implement a ratio imaging pyrometer for the reason of measurement robustness, calibration robustness, andminimal user interaction in the computation process. I will be describing our ThermaViz two-color imaging pyrometer, whichmeasures the photon flux of a source at two different wavelengths simultaneously on a single focal plane array. The system isinsensitive to the dust clouds produced during the spray forming process and insensitive to the reduction in overall light levels asthe main optic window is coated during a deposition process that lasts several hours.
The two-color imaging pyrometer operates in the (1 to 1.7) µm rangeusing InGaAs detector technology. The camera can acquire 30 Hz ofimagery at a 12 bit resolution. The two wavelength bands are selectableand have been chose between (1.4 and 1.65) µm to maximize sensitivityat 300 °C. The system includes sophisticated thermal image processingsoftware with scene rejection capability. More about this as we movefurther along in the talk. The present FOV of the system is 0.6 m. Thislimitation is provided by the optical front end of the instrument and isenvisioned to be relaxed in the future as the spray form depositionprocess is improved to allow for larger part coating. The temperaturerange of the instrument is between about 180 °C and 500 °C. Onesetting for the instrument is provided to allow for maximum sensitivityof the system between 180 °C and 350 °C and a second higher settingwhich has a low temperature threshold of about 250 °C.
Emittance
• The emittance of an object is a function of wavelength and temperature.
• However, a hot steel surface during deposition has a gray emittance ratio.
• In a dusty environment the reduction of intensity may not be an emittance problem.
Ratio Pyrometry
Why ratio pyrometry ?Don’t forget that the user may not be a thermographer or professional with extensive experience with pyrometry.
The instrument must be robust and able to be operated by a technician, with minimal user input (no emittance dial in necessary, no slopes etc.)
The Two-Color Imager
• Indigo camera operating from 1 µm to 1.7 µm at 30 fps.• 2 Color band pass at 1.4 µm and 1.6 µm.• Image processing providing real time thermal images with
active scene rejection.• 0.6 m field of view.• Temperature from 180 °C to > 500 °C.• Windows 2000 System.
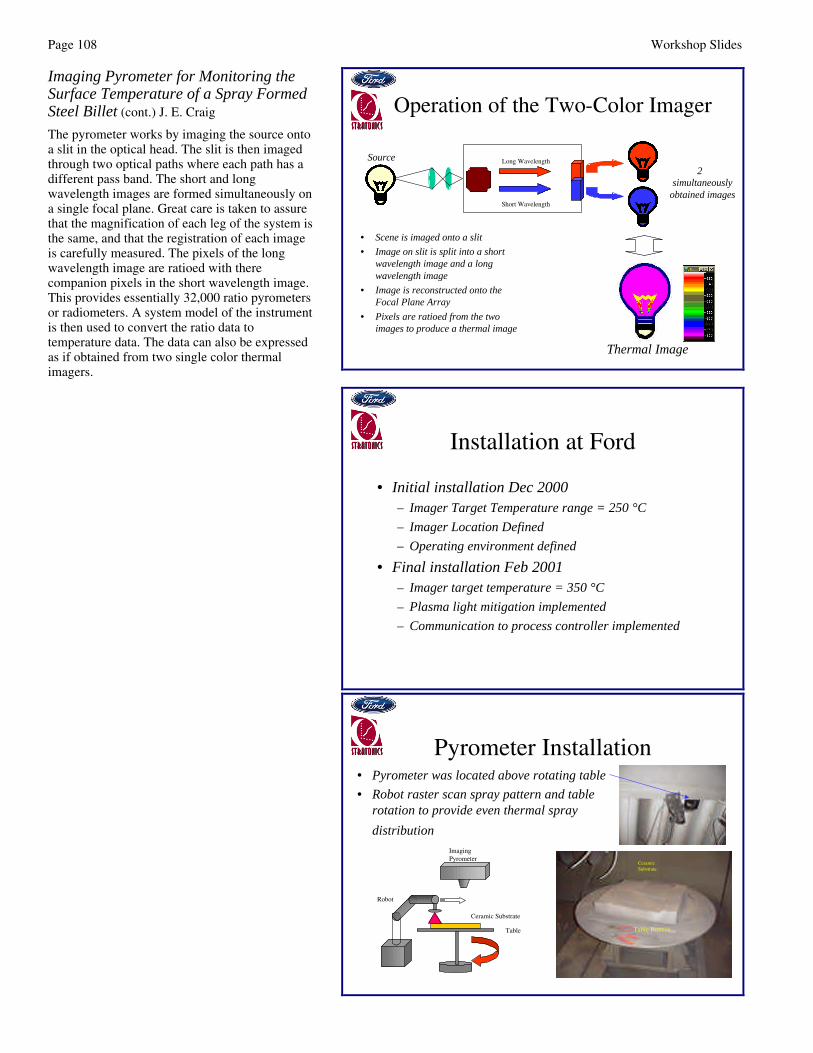
Page 108 Workshop Slides
Imaging Pyrometer for Monitoring theSurface Temperature of a Spray FormedSteel Billet (cont.) J. E. Craig
The pyrometer works by imaging the source ontoa slit in the optical head. The slit is then imagedthrough two optical paths where each path has adifferent pass band. The short and longwavelength images are formed simultaneously ona single focal plane. Great care is taken to assurethat the magnification of each leg of the system isthe same, and that the registration of each imageis carefully measured. The pixels of the longwavelength image are ratioed with therecompanion pixels in the short wavelength image.This provides essentially 32,000 ratio pyrometersor radiometers. A system model of the instrumentis then used to convert the ratio data totemperature data. The data can also be expressedas if obtained from two single color thermalimagers.
Long Wavelength
Short Wavelength
Thermal Image
• Scene is imaged onto a slit
• Image on slit is split into a short wavelength image and a long wavelength image
• Image is reconstructed onto the Focal Plane Array
• Pixels are ratioed from the two images to produce a thermal image
2λsimultaneously
obtained images
Source
Operation of the Two-Color Imager
Installation at Ford
• Initial installation Dec 2000– Imager Target Temperature range = 250 °C
– Imager Location Defined
– Operating environment defined
• Final installation Feb 2001– Imager target temperature = 350 °C
– Plasma light mitigation implemented
– Communication to process controller implemented
Pyrometer Installation• Pyrometer was located above rotating table
• Robot raster scan spray pattern and table rotation to provide even thermal spray
distribution
Ceramic Substrate
Table
Robot
Imaging Pyrometer
CeramicSubstrate
Table Rotates
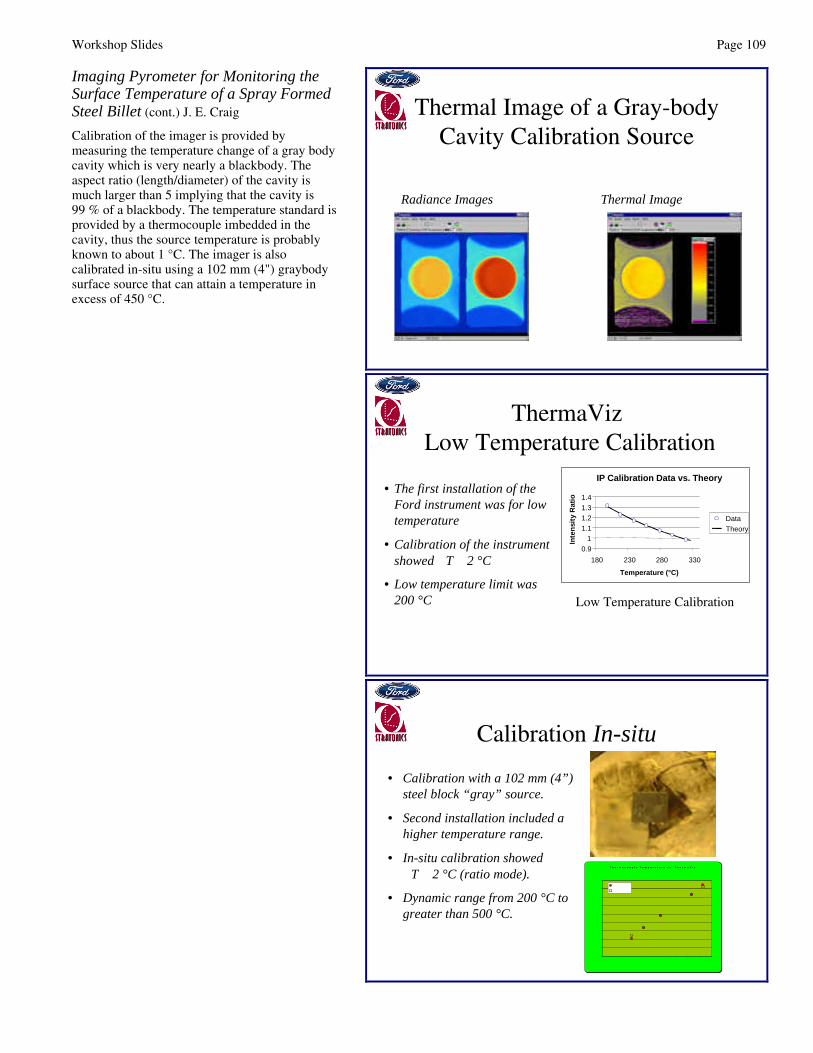
Workshop Slides Page 109
Imaging Pyrometer for Monitoring theSurface Temperature of a Spray FormedSteel Billet (cont.) J. E. Craig
Calibration of the imager is provided bymeasuring the temperature change of a gray bodycavity which is very nearly a blackbody. Theaspect ratio (length/diameter) of the cavity ismuch larger than 5 implying that the cavity is99 % of a blackbody. The temperature standard isprovided by a thermocouple imbedded in thecavity, thus the source temperature is probablyknown to about 1 °C. The imager is alsocalibrated in-situ using a 102 mm (4") graybodysurface source that can attain a temperature inexcess of 450 °C.
Thermal Image of a Gray-body Cavity Calibration Source
Radiance Images Thermal Image
ThermaVizLow Temperature Calibration
IP Calibration Data vs. Theory
0.91
1.11.21.31.4
180 230 280 330
Temperature (°C)In
ten
sity
Rat
io
DataTheory
Low Temperature Calibration
• The first installation of the Ford instrument was for low temperature
• Calibration of the instrument showed ∆T ≈ 2 °C
• Low temperature limit was 200 °C
Calibration In-situ
T h e r m o c o u p l e T e m p e r a t u r e v s . T h e r m a V i z
2 5 0
2 7 0
2 9 0
3 1 0
3 3 0
3 5 0
3 7 0
3 9 0
4 1 0
4 3 0
2 5 0 2 7 0 2 9 0 3 1 0 3 3 0 3 5 0 3 7 0 3 9 0 4 1 0 4 3 0
T h e r m a V i z T e m p e r a t u r e ( C )
So
urc
e T
em
pe
ratu
re (
C)
ThermaV iz
S o u r c e
• Calibration with a 102 mm (4”) steel block “gray” source.
• Second installation included a higher temperature range.
• In-situ calibration showed ∆T ≈ 2 °C (ratio mode).
• Dynamic range from 200 °C to greater than 500 °C.
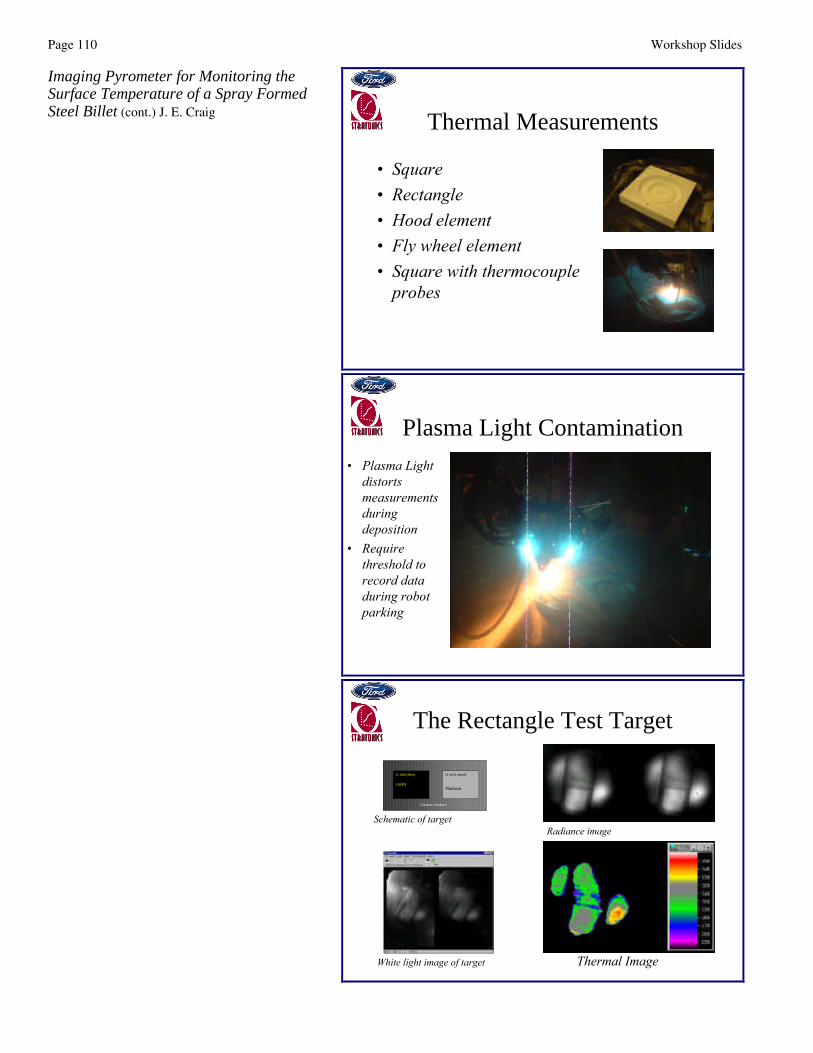
Page 110 Workshop Slides
Imaging Pyrometer for Monitoring theSurface Temperature of a Spray FormedSteel Billet (cont.) J. E. Craig Thermal Measurements
• Square• Rectangle• Hood element• Fly wheel element• Square with thermocouple
probes
Plasma Light Contamination • Plasma Light
distorts measurements during deposition
• Require threshold to record data during robot parking
The Rectangle Test Target
¼ inch deep cavity
¼ inch raised Platform
Ceramic Surface
Schematic of target
White light image of target
Radiance image
Thermal Image
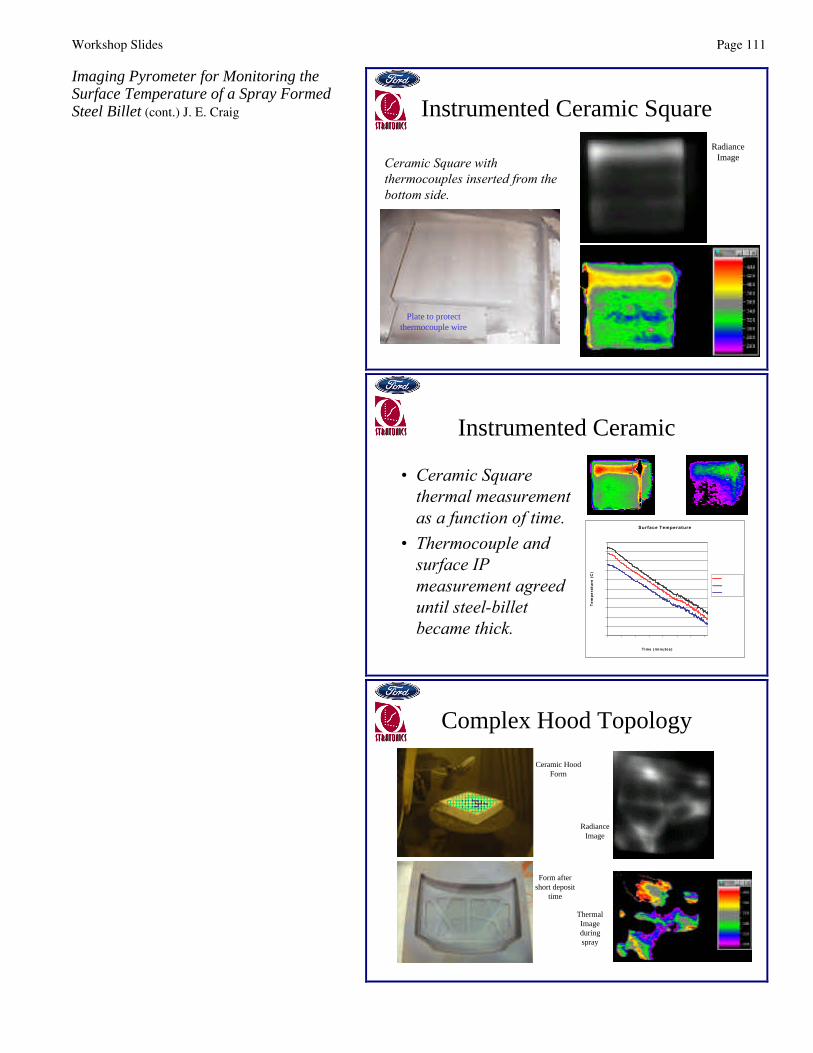
Workshop Slides Page 111
Imaging Pyrometer for Monitoring theSurface Temperature of a Spray FormedSteel Billet (cont.) J. E. Craig Instrumented Ceramic Square
Ceramic Square with thermocouples inserted from the bottom side.
Plate to protect thermocouple wire
Radiance Image
Instrumented Ceramic
• Ceramic Square thermal measurement as a function of time.
• Thermocouple and surface IP measurement agreed until steel-billet became thick.
Surface Temperature
200
220
240
260
280
300
320
340
360
380
400
0.00 0.46 0.92 1.87 2.33 3.66 4.12 5.16
Time (minutes)
Te
mp
era
ture
(C
)
Region #1
Region #2
Region #3
Complex Hood Topology
Ceramic Hood Form
Radiance Image
Form after short deposit
time
Thermal Image during spray
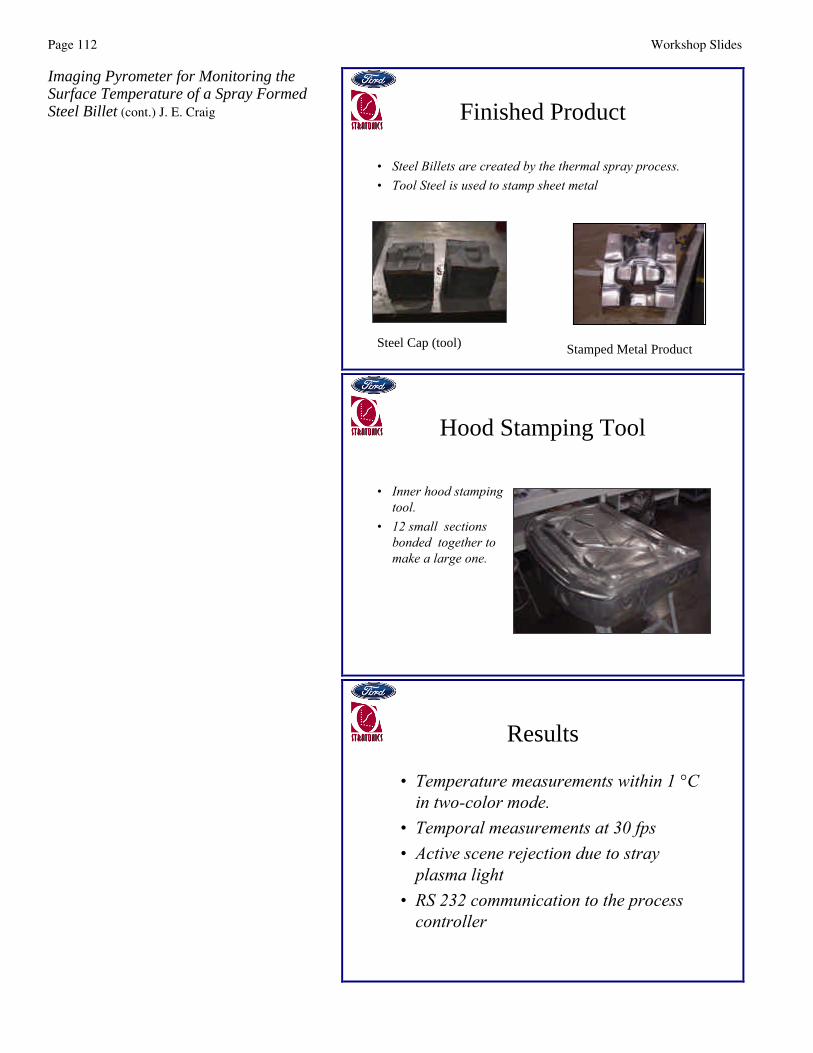
Page 112 Workshop Slides
Imaging Pyrometer for Monitoring theSurface Temperature of a Spray FormedSteel Billet (cont.) J. E. Craig Finished Product
• Steel Billets are created by the thermal spray process. • Tool Steel is used to stamp sheet metal
Steel Cap (tool) Stamped Metal Product
Hood Stamping Tool
• Inner hood stamping tool.
• 12 small sections bonded together to make a large one.
Results
• Temperature measurements within 1 °C in two-color mode.
• Temporal measurements at 30 fps• Active scene rejection due to stray
plasma light• RS 232 communication to the process
controller

Workshop Slides Page 113
High Enthalpy Plasma SprayL. George (Progressive Technologies, Inc)
HE Plasma Technology
High Enthalpy Plasma Spray
PROGRESSIVETECHNOLOGIES
PDiscuss Traditional Plasma Gun TechnologyPPresent PROGRESSIVEs HE Series of
Plasma GunsPCompare Performance Characteristics
withTraditional Plasma Guns
Todays Presentation
PProvide a stabilized electric arcP Introduce powders efficiently into the plasma
plumePProvide improved heating of powder particlesPEliminate segregation of powder particles
Plasma Process DevelopmentObjectives
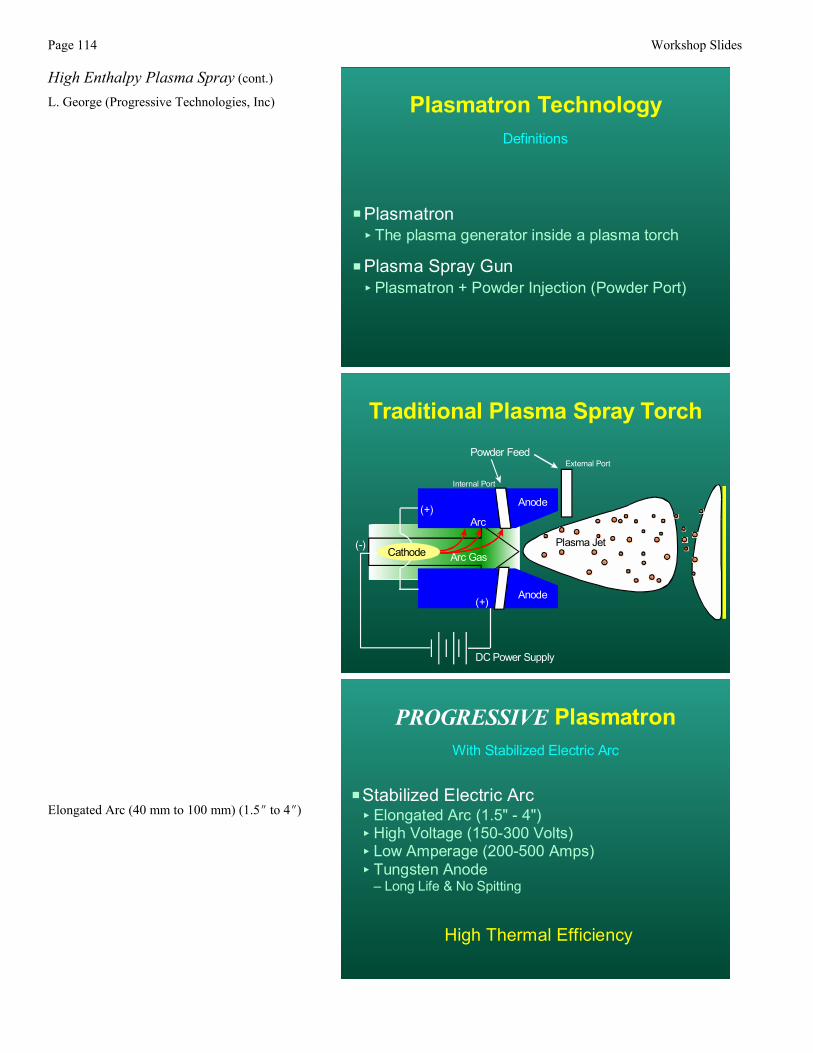
Page 114 Workshop Slides
High Enthalpy Plasma Spray (cont.)
L. George (Progressive Technologies, Inc)
PPlasmatron< The plasma generator inside a plasma torch
PPlasma Spray Gun< Plasmatron + Powder Injection (Powder Port)
Plasmatron TechnologyDefinitions
Traditional Plasma Spray Torch
(-)
(+)
(+)
DC Power Supply
Powder FeedExternal Port
Internal Port
Plasma JetCathode
Anode
Anode
Arc
Arc Gas
Elongated Arc (40 mm to 100 mm) (1.5O to 4O)PStabilized Electric Arc< Elongated Arc (1.5" - 4")< High Voltage (150-300 Volts)< Low Amperage (200-500 Amps)< Tungsten Anode
Long Life & No Spitting
PROGRESSIVE PlasmatronWith Stabilized Electric Arc
High Thermal Efficiency

Workshop Slides Page 115
High Enthalpy Plasma Spray (cont.)
L. George (Progressive Technologies, Inc)
Arc length ≈76 mm (3O)
PROGRESSIVEs AdvancedPlasmatron
withPatented Arc Root Stabilization Technology
PGun Does Not Function in Restrike Mode< Minimum Voltage Ripple< Highly Stable Plasma< Very Low Electrode Wear< Efficient Ternary Gas Operation
High Enthalpy Generated Y Increased Spray Rates Higher Plasma Ionization Y Increased D.E.
Patented Arc Root StabilizationTechnology
Benefits
P100HE plasmatron operates efficiently withternary plasma gas mixtures such asAr+N2+H2< Nitrogen and Hydrogen are complementary
plasma gasses< 20-30% higher enthalpy than conventional plasma
Typical enthalpy of 100HE Ar+N2+H2 plasma: 10-14kJ/l
PHigher heat transfer to powders due to 30-40% more thermal conductive gas mixtures.< N2 and H2 thermal conductivity peaks are located
adjacently at ~ 4000 EK and ~7000 EK
PROGRESSIVEs AdvancedPlasmatron
Superior Plasma Plume Generation
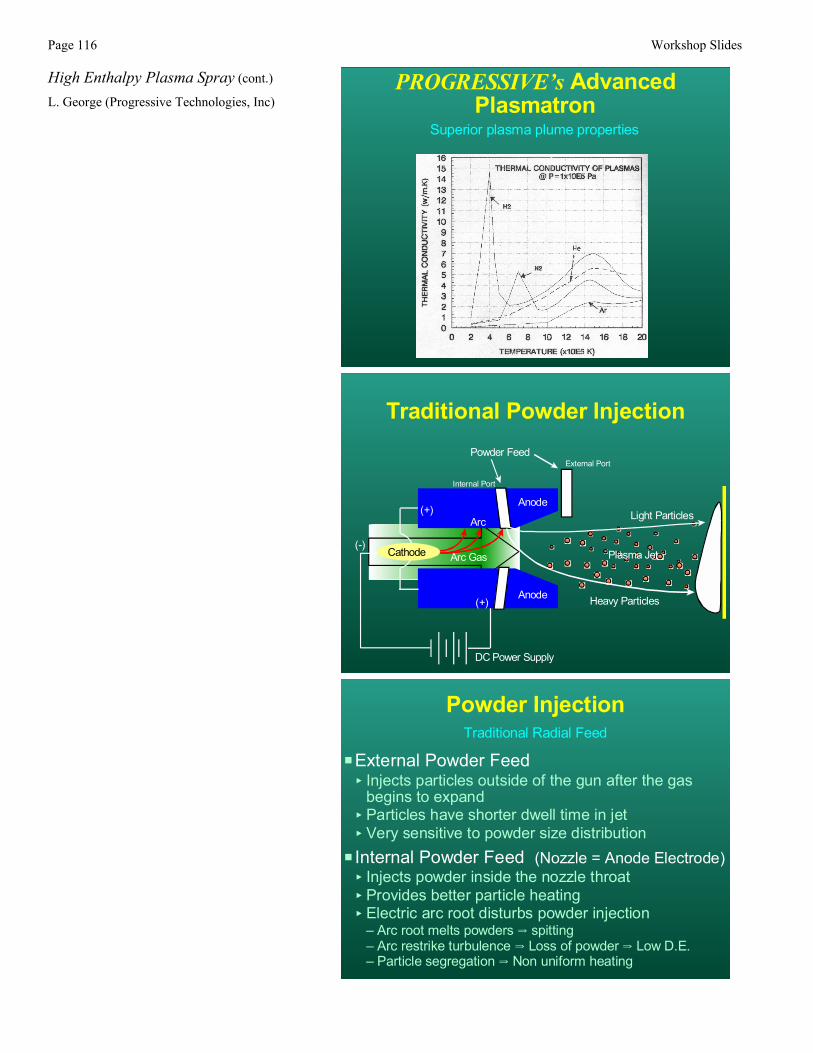
Page 116 Workshop Slides
High Enthalpy Plasma Spray (cont.)
L. George (Progressive Technologies, Inc)PROGRESSIVEs Advanced
PlasmatronSuperior plasma plume properties
Traditional Powder Injection
(-)
(+)
(+)
DC Power Supply
Powder FeedExternal Port
Internal Port
Plasma JetCathode
Anode
Anode
Arc
Arc Gas
Light Particles
Heavy Particles
PExternal Powder Feed< Injects particles outside of the gun after the gas
begins to expand< Particles have shorter dwell time in jet< Very sensitive to powder size distribution
P Internal Powder Feed (Nozzle = Anode Electrode)< Injects powder inside the nozzle throat< Provides better particle heating< Electric arc root disturbs powder injection
Arc root melts powders Y spitting Arc restrike turbulence Y Loss of powder Y Low D.E. Particle segregation Y Non uniform heating
Powder InjectionTraditional Radial Feed
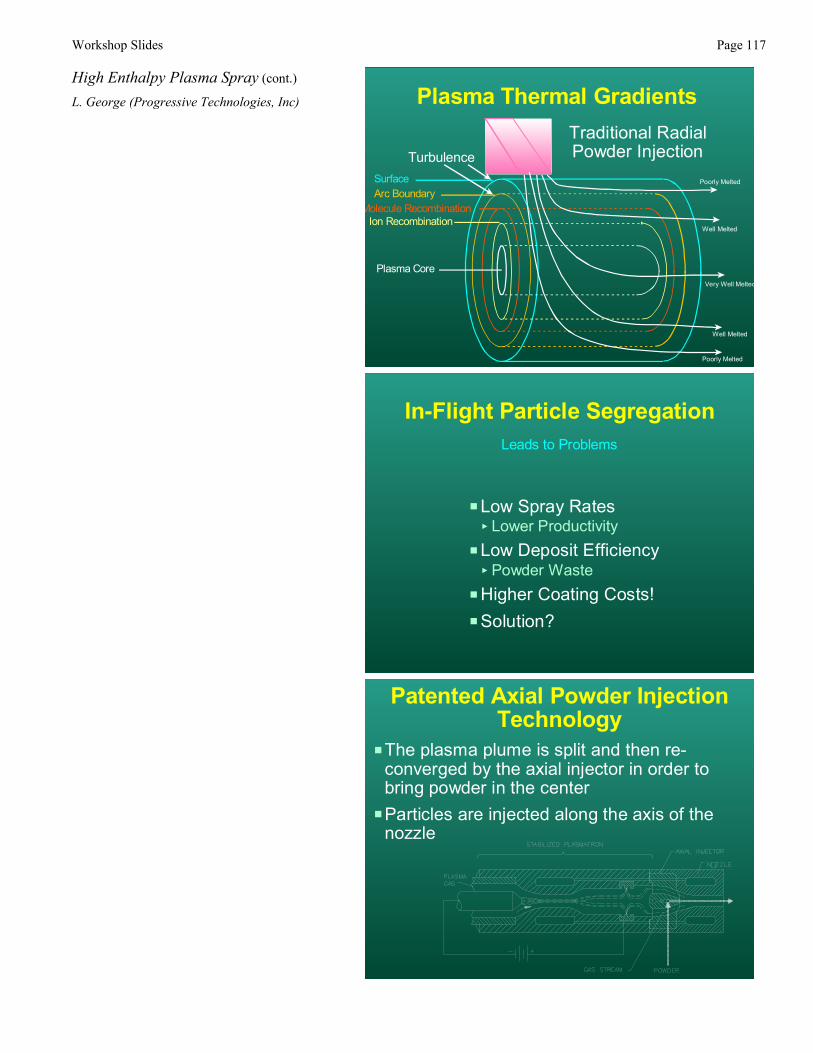
Workshop Slides Page 117
High Enthalpy Plasma Spray (cont.)
L. George (Progressive Technologies, Inc) Plasma Thermal Gradients
SurfaceArc Boundary
Molecule RecombinationIon Recombination
Plasma Core
Poorly Melted
Poorly Melted
Well Melted
Well Melted
Very Well Melted
Traditional RadialPowder InjectionTurbulence
PLow Spray Rates< Lower Productivity
PLow Deposit Efficiency< Powder Waste
PHigher Coating Costs!PSolution?
In-Flight Particle SegregationLeads to Problems
PThe plasma plume is split and then re-converged by the axial injector in order tobring powder in the center
PParticles are injected along the axis of thenozzle
Patented Axial Powder InjectionTechnology

Page 118 Workshop Slides
High Enthalpy Plasma Spray (cont.)
L. George (Progressive Technologies, Inc)
PPROGRESSIVEs 100HE Plasma Gun acceptsPatented Axial Powder Injection Technology< Increased Powder Entrainment in the Plume< Increased Heat Transfer to Powder
PWith Axial Feeding of Powder< Particles travel in direction of the plasma flow< Little or no segregation< Rapid particle acceleration
PMost Suitable for Metals, Alloys andCarbides Due to its High Velocity
Axial Powder Injection Technology
Axial Powder Injection
SurfaceLaminar Arc BoundaryMolecule Recombination
Ion Recombination
Plasma Core
Powder Feed
Very WellMelted
Advanced Radial InjectionTechnology

Workshop Slides Page 119
High Enthalpy Plasma Spray (cont.)
L. George (Progressive Technologies, Inc)
P PROGRESSIVE's 100HE plasma guns accept bothaxial and radial injection as quick screw-onattachments. < Simultaneous axial and radial injection for dissimilar materials is
also possible.P The separation of the anode from the nozzle (barrel)
and the stabilization of the electric arc allow the efficientuse of radial injection particularly for high melting pointceramics:< Lower particle velocity for improved melting< No arc boundary turbulence at injection port = laminar powder
feeding = Uniform particle heating = High Deposit Efficiency(Ex: 80-90% for YSZ)
< Anode separated from nozzle = No arc-powder interference< Symmetrical powder ports for high plume loading = High spray
rates
Advanced Radial Injection Technology
PReduced In-flight Particle Segregation< Higher Deposition Efficiency (up to 95%)
P Increased Plasma Loading< Higher Spray Rates (up to 4 times)
P Increased Plasma Ionization< Higher DE< Less Powder Waste
PReduced Coating Costs!
PROGRESSIVEsPowder Injection
PConventional $1,000 coating at ½ the cost< Takes 1/4 the time to produce< 75% increase in productivity
PEnables additional revenue throughincreased volumes
PFaster return on capital investmentPSubstantial savings in powder consumption
PROGRESSIVE Plasma SystemBenefits
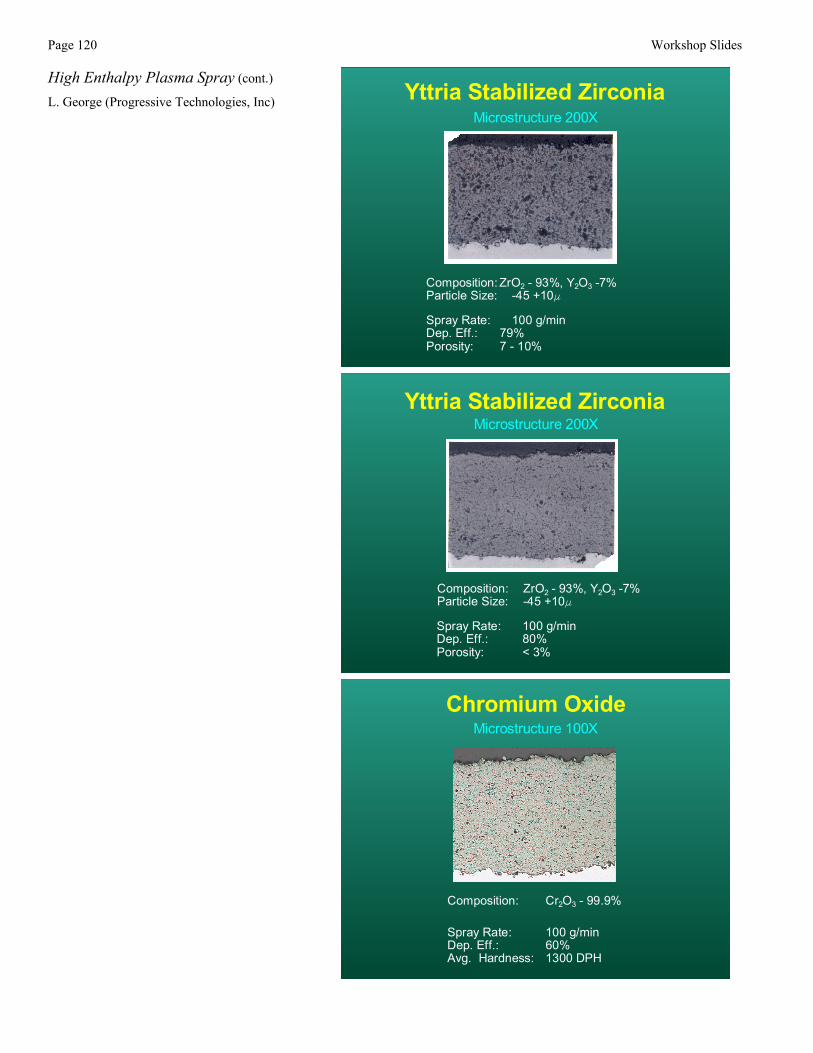
Page 120 Workshop Slides
High Enthalpy Plasma Spray (cont.)
L. George (Progressive Technologies, Inc) Yttria Stabilized ZirconiaMicrostructure 200X
Composition:ZrO2 - 93%, Y2O3 -7%Particle Size: -45 +10F
Spray Rate: 100 g/minDep. Eff.: 79%Porosity: 7 - 10%
Yttria Stabilized ZirconiaMicrostructure 200X
Composition: ZrO2 - 93%, Y2O3 -7%Particle Size: -45 +10F
Spray Rate: 100 g/minDep. Eff.: 80%Porosity: < 3%
Chromium OxideMicrostructure 100X
Composition: Cr2O3 - 99.9%
Spray Rate: 100 g/minDep. Eff.: 60%Avg. Hardness: 1300 DPH
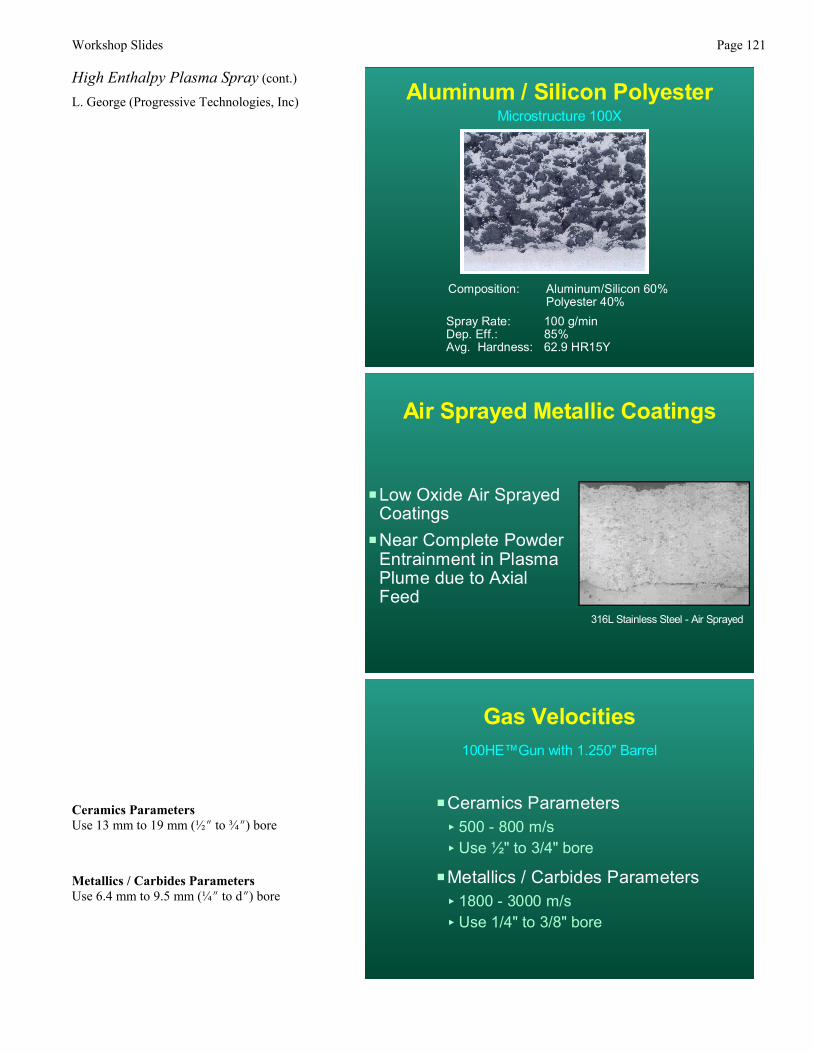
Workshop Slides Page 121
High Enthalpy Plasma Spray (cont.)
L. George (Progressive Technologies, Inc) Aluminum / Silicon PolyesterMicrostructure 100X
Composition: Aluminum/Silicon 60%Polyester 40%
Spray Rate: 100 g/minDep. Eff.: 85%Avg. Hardness: 62.9 HR15Y
PLow Oxide Air SprayedCoatings
PNear Complete PowderEntrainment in PlasmaPlume due to AxialFeed
Air Sprayed Metallic Coatings
316L Stainless Steel - Air Sprayed
Ceramics ParametersUse 13 mm to 19 mm (½O to ¾O) bore
Metallics / Carbides ParametersUse 6.4 mm to 9.5 mm (¼O to dO) bore
PCeramics Parameters< 500 - 800 m/s< Use ½" to 3/4" bore
PMetallics / Carbides Parameters< 1800 - 3000 m/s< Use 1/4" to 3/8" bore
Gas Velocities100HEGun with 1.250" Barrel
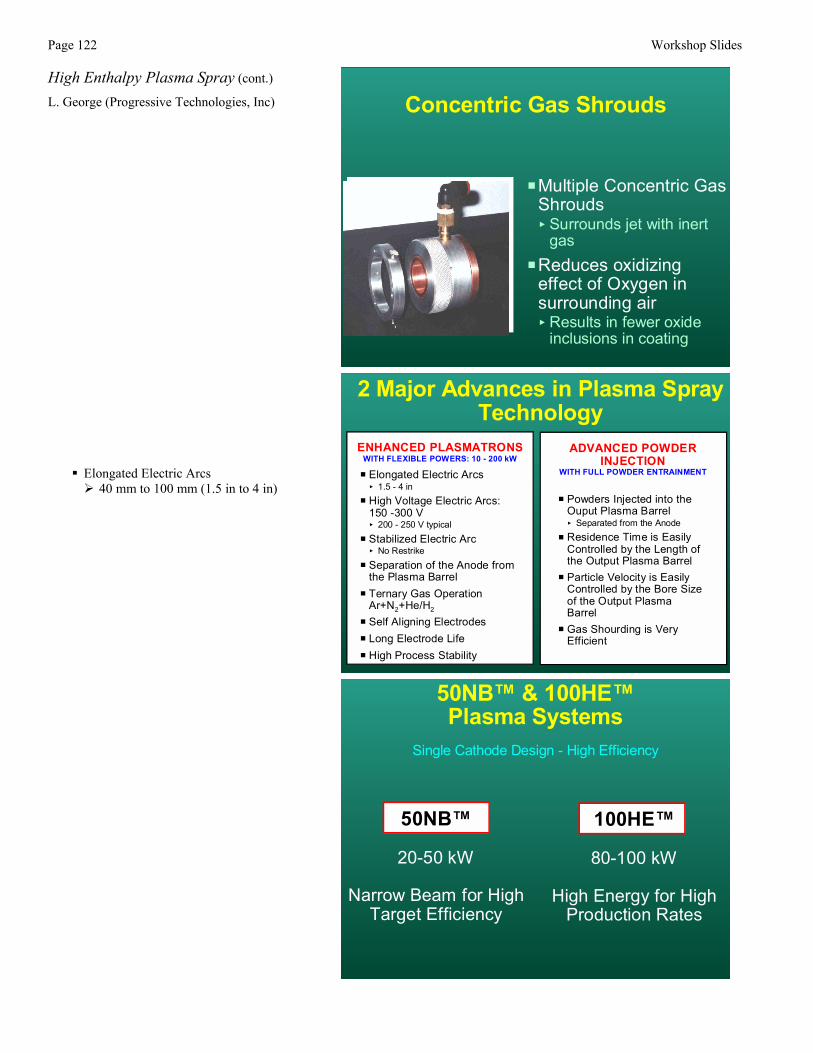
Page 122 Workshop Slides
High Enthalpy Plasma Spray (cont.)
L. George (Progressive Technologies, Inc)
PMultiple Concentric GasShrouds< Surrounds jet with inert
gasPReduces oxidizing
effect of Oxygen insurrounding air< Results in fewer oxide
inclusions in coating
Concentric Gas Shrouds
! Elongated Electric Arcs" 40 mm to 100 mm (1.5 in to 4 in)
2 Major Advances in Plasma SprayTechnology
P Elongated Electric Arcs< 1.5 - 4 in
P High Voltage Electric Arcs: 150 -300 V< 200 - 250 V typical
P Stabilized Electric Arc< No Restrike
P Separation of the Anode fromthe Plasma Barrel
P Ternary Gas OperationAr+N2+He/H2
P Self Aligning ElectrodesP Long Electrode LifeP High Process Stability
ENHANCED PLASMATRONSWITH FLEXIBLE POWERS: 10 - 200 kW
P Powders Injected into theOuput Plasma Barrel< Separated from the Anode
P Residence Time is EasilyControlled by the Length ofthe Output Plasma Barrel
P Particle Velocity is EasilyControlled by the Bore Sizeof the Output PlasmaBarrel
P Gas Shourding is VeryEfficient
ADVANCED POWDERINJECTION
WITH FULL POWDER ENTRAINMENT
50NB & 100HEPlasma Systems
Single Cathode Design - High Efficiency
50NB
20-50 kW
Narrow Beam for HighTarget Efficiency
100HE
80-100 kW
High Energy for HighProduction Rates
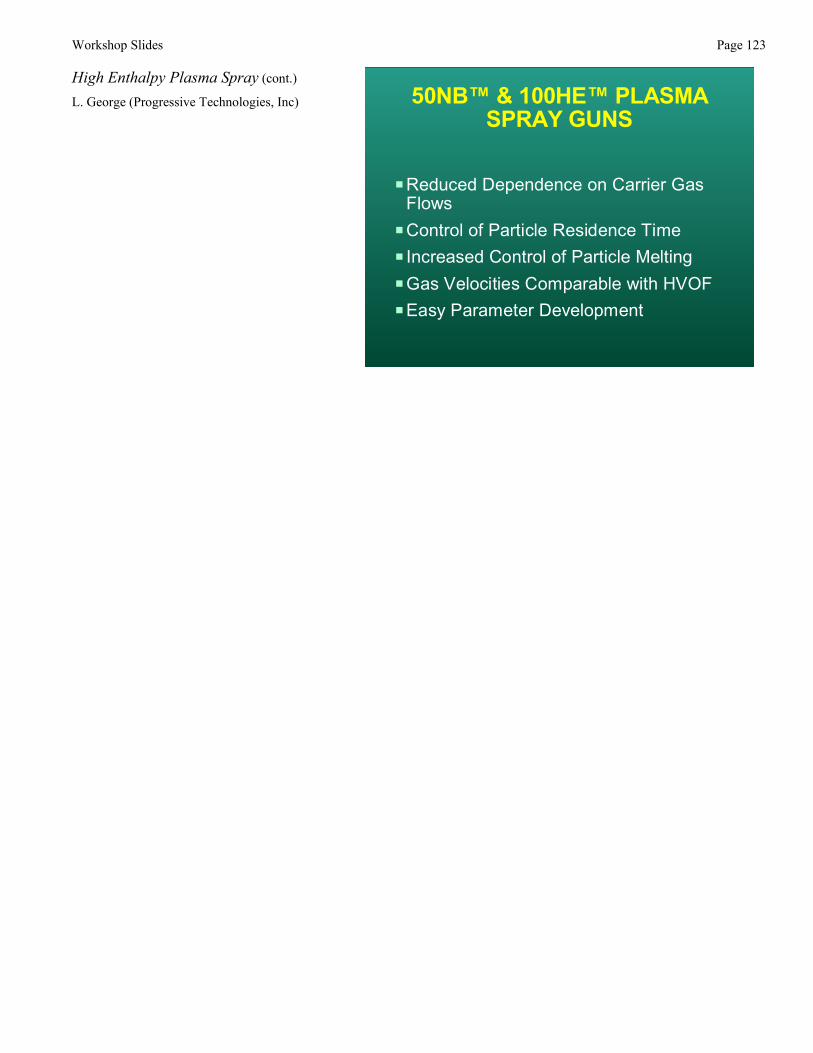
Workshop Slides Page 123
High Enthalpy Plasma Spray (cont.)
L. George (Progressive Technologies, Inc)
PReduced Dependence on Carrier GasFlows
PControl of Particle Residence TimeP Increased Control of Particle MeltingPGas Velocities Comparable with HVOFPEasy Parameter Development
50NB & 100HE PLASMASPRAY GUNS

NIST Thermal Spray Research Page 125
NIST Thermal Spray Research
Title: Ceramic Coatings Program (see presentation on page 65)following from: http://www.msel.nist.gov/ceramicoatings.htm
The Ceramic Coatings Program addresses plasma spray deposited and physical vapor depositedceramic thermal barrier coatings (TBC) used in aircraft, land-based turbines, and diesel engines aswell as wear resistant coatings used in many applications. These materials are a significant portion ofthe nearly one billion dollar North American ceramic coatings market. A primary goal of thisprogram is to improve the reliability of ceramic coatings. Collaborations have been established, e.g.,Pratt and Whitney, General Electric, Caterpillar, METCO, Praxair Coating Technologies, as well asthe Thermal Spray Laboratory at the State University of New York at Stony Brook, NASA LewisResearch Center and the Thermal Spray Laboratory at Sandia National Laboratory, to enableresearch on relevant materials and to transfer results to users. Collaborations are also underway withBundesanstalt für Materialfürschung und -prufung) (BAM) and Deutsche Forschungsanstalt fürLuft-und Raumfahrt (DLR), both in Germany, for the development of characterization techniques forthin, hard coatings and TBCs. A strong attribute of the coatings research program is the use ofcommon materials for which complementary data can provide a more complete understanding ofprocessing-microstructure-property relationships. Participants in the NIST program are located inMSEL, i.e., Ceramics Division, Materials Reliability Division, Metallurgy Division, and the NISTCenter for Neutron Research, as well as in the Chemical Science and Technology Laboratory. Theprogram has the following elements:
• Development of predictive models for the long-term reliability of ceramic coatings underoperating conditions.
• Relating microstructural characteristics such as fine voids and phase stability to thermal andmechanical properties.
• Developing and validating microstructure based models that predict coating performance.
• Development of measurement methods such as online instrumentation for improved controlof thermal spray processes and thermal properties.
Title: Processing-Structure-Property Data for Thermal Spray Coatings
The consensus of the participants of this workshop was that the reproducibility and reliability of TScoatings need to be improved in order to realize the full benefits of this technology. Also, theprocessing procedures and properties of TS coating systems are not well documented or available. AWeb-based source of TS coating processing-microstructure-property data could provide valuableguidance to current users and potential users of this technology.
In response to this need, the NIST thermal spray diagnostics project will assemble such a databasethrough a Working Group formed under the auspices of the ASM Thermal Spray Society and co-chaired by Christopher Berndt of SUNY (also Editor of the Journal of Thermal Spray Technology),Richard Knight of Drexel University, and Stephen Ridder of NIST. The workshop participants andothers from the TS community will provide data to be critically evaluated by the working groupbefore inclusion in the thermal spray coating database. It is expected that this database of processing-microstructure-property data will be disseminated through the equipment producers when newequipment is purchased, through ASM or NIST to current users, and through the well-attended ASMshort courses on “Thermal Spray Technology” taught by Berndt and Knight. A meeting is beingplanned to discuss the formation of this Working Group, the structure of the database, and a prioritylist of coating systems to be included.

Page 126 NIST Thermal Spray Research
Although the specific needs for database information have not been established, it is anticipated that,for most coating systems, the required data will include substrate composition, substrate residualstress, substrate cleaning and/or roughening by grit blasting, substrate preheat, powder feedstockdata, powder flow rate, particle temperature and velocity in plasma jet, gun position and velocityinformation, and the resulting coating properties. In order to produce high-priority, accurate datathat are needed but not available, NIST will work with the Center for Thermal Spray Research atSUNY - Stony Brook, Sandia National Laboratories, and INEEL to define and carry out thermalspray processing experiments under well controlled operating conditions. The generation of thisdatabase information requires the use of process measurement tools that provide the processparameter and coating property data as well as providing the process controls necessary forproducing reproducible TS coatings. It is expected that an additional deliverable will be a "bestpractices" guide for thermal spray processing.