A first map of tropical Africa's above-ground biomass derived from satellite imagery

Thermal insights into the dynamics of Nyiragongo lava lakefrom ground and satellite measurements
L. Spampinato,1 G. Ganci,1 P. A. Hernández,2,3 D. Calvo,2,3 D. Tedesco,4,5 N. M. Pérez,2,3
S. Calvari,1 C. Del Negro,1 and M. M. Yalire6
Received 11 July 2013; revised 25 October 2013; accepted 30 October 2013; published 15 November 2013.
[1] We present new insights into the short- and long-term thermal activity of theNyiragongo lava lake by ground-based and satellite infrared thermal imagery recorded inthe first half of 2012. This is the very first time in which FLIR camera and SEVIRI data havebeen compared at this volcano. Maximum temperatures recorded at the molten lava were of~1180 K, whereas the lake skin remained always below ~734 K in areas far from theupwelling zone and below ~843 K in those proximal to the source region. Ground-basedimagery yielded mean radiative power values between ~0.80 and 1.10 GW. Consistently,satellite observations showed similar mean values of 1.10 GW. Overall the thermal activityof the lava lake was quite variable along the three days of field measurements at both dailyand intradaily scale. SEVIRI radiative power values retrieved for the January–June 2012period revealed fluctuations within the same variability range suggesting that no significantchanges of the lava lake area had occurred over the six months. Comparison with previousradiative power estimates showed that our data well agree with the general increasing trendrecorded since the reappearance of the lava lake after the last flank eruption in 2002.
Citation: Spampinato, L., G. Ganci, P. A. Hernandez, D. Calvo, D. Tedesco, N. M. Perez, S. Calvari, C. Del Negro, and
M.M. Yalire (2013), Thermal insights into the dynamics of Nyiragongo lava lake from ground and satellite measurements,J. Geophys. Res. Solid Earth, 118, 5771–5784, doi:10.1002/2013JB010520.
1. Introduction
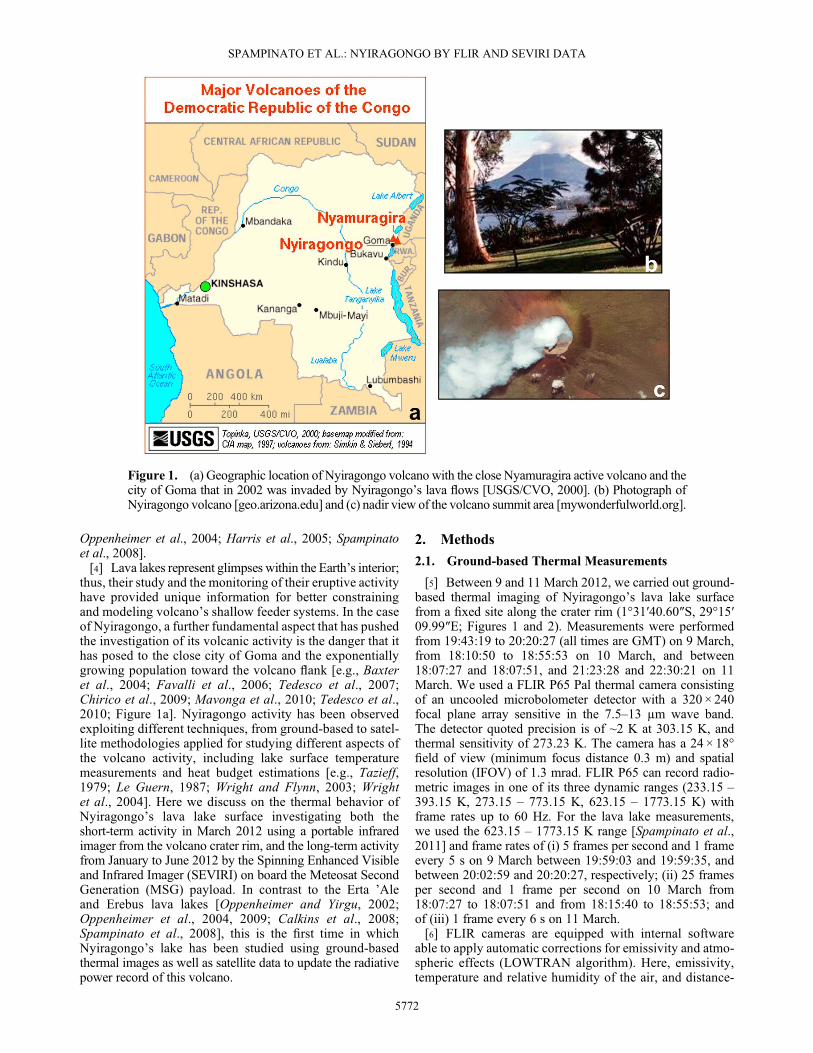
[2] Thermal remote sensing of persistently active lava lakeshas proved crucial to investigate and monitor the eruptiveactivity of hot volcanic bodies mostly confined in poorlyaccessible areas [e.g., Oppenheimer and Francis, 1997;Harris et al., 1999; Spampinato et al., 2011]. Nyiragongo(3469 m a.s.l.; 1.52°S, 29.25°E; Democratic Republic ofCongo, Africa; Figure 1) is a strato-volcano that has developedon the central segment of the western branch of the EastAfrican Rift System, and belongs to the Virunga volcanicchain (Figure 1). The volcano summit consists of a calderacharacterized by steep layered slopes, whose inner partpresents three main platforms with a lava lake surfaceemerging at the crater floor [e.g., Sawyer et al., 2008].
Nyiragongo is one of the few currently active volcanoeshosting a persistent lava lake, whose lava is of a rare nephelinitecomposition [Sahama, 1962, 1973; Tazieff, 1979, 1994;Chakrabarti et al., 2009]. The lake has been active at least since1928 [von Götzen, 1895 in Sahama and Meyer, 1958; Tazieff,1949, 1977; Richards, 1957]. Similarly to the other persistentlyactive lava lakes—i.e., Erta ’Ale in Ethiopia and Erebus inAntarctica—the longevity of Nyiragongo’s lake has beenexplained by magma convection and recycling within thevolcano shallow feeder system [e.g., Kazahaya et al., 1994;Tazieff, 1994; Stevenson and Blake, 1998; Huppert andHallworth, 2007]. The cyclic process has been modeled aslikely due to density contrasts resulting from degassing andheat loss from the lake surface and the hot, gas rich magma ris-ing toward the surface [e.g., Francis et al., 1993; Harris et al.,1999, 2005; Oppenheimer et al., 2004; Harris, 2008].[3] Some of the first scientific accounts of the existence of a
lava lake within the Nyiragongo summit crater and of its mainfeatures were reported by Tazieff [1979] in his “Nyiragongothe forbidden volcano,”where the author described not onlythe main lake characteristics, common also to other lavalakes, such as grayish lava skin, molten lava waves, incandes-cent cracks, explosion of gas bubbles, but also Nyiragongo’slake surface changes observed along an almost 20 year timeinterval. In detail, Tazieff [1979] observed variations in termsof intensity of the lake resurfacing and of both lake surfacesize and depth. These surface changes of the lake appearancehave been detected also at other volcanoes, and interpretedas manifestations of the state and dynamics of the volcano’sfeeder system [e.g., Oppenheimer and Francis, 1997, 1998;
1Istituto Nazionale di Geofisica e Vulcanologia, Catania, Italy.2Environmental Research Division, ITER, Granadilla de Abona,
Tenerife, Canary Islands, Spain.3Instituto Volcanológico de Canarias (INVOLCAN), Tenerife, Canary
Islands, Spain.4Department of Environmental Sciences, Second University of Naples,
Caserta, Italy.5Department of Science and Technology of Environment, Biology and
Pharmacy, Goma, Democratic Republic of Congo.6GomaVolcanological Observatory, Goma, Democratic Republic of Congo.
Corresponding author: L. Spampinato, Istituto Nazionale di Geofisica eVulcanologia, sezione di Catania, Osservatorio Etneo, piazza Roma 2, IT-95125, Catania, Italy. ([email protected])
©2013. American Geophysical Union. All Rights Reserved.2169-9313/13/10.1002/2013JB010520
5771
JOURNAL OF GEOPHYSICAL RESEARCH: SOLID EARTH, VOL. 118, 5771–5784, doi:10.1002/2013JB010520, 2013
Oppenheimer et al., 2004; Harris et al., 2005; Spampinatoet al., 2008].[4] Lava lakes represent glimpses within the Earth’s interior;
thus, their study and the monitoring of their eruptive activityhave provided unique information for better constrainingand modeling volcano’s shallow feeder systems. In the caseof Nyiragongo, a further fundamental aspect that has pushedthe investigation of its volcanic activity is the danger that ithas posed to the close city of Goma and the exponentiallygrowing population toward the volcano flank [e.g., Baxteret al., 2004; Favalli et al., 2006; Tedesco et al., 2007;Chirico et al., 2009; Mavonga et al., 2010; Tedesco et al.,2010; Figure 1a]. Nyiragongo activity has been observedexploiting different techniques, from ground-based to satel-lite methodologies applied for studying different aspects ofthe volcano activity, including lake surface temperaturemeasurements and heat budget estimations [e.g., Tazieff,1979; Le Guern, 1987; Wright and Flynn, 2003; Wrightet al., 2004]. Here we discuss on the thermal behavior ofNyiragongo’s lava lake surface investigating both theshort-term activity in March 2012 using a portable infraredimager from the volcano crater rim, and the long-term activityfrom January to June 2012 by the Spinning Enhanced Visibleand Infrared Imager (SEVIRI) on board the Meteosat SecondGeneration (MSG) payload. In contrast to the Erta ’Aleand Erebus lava lakes [Oppenheimer and Yirgu, 2002;Oppenheimer et al., 2004, 2009; Calkins et al., 2008;Spampinato et al., 2008], this is the first time in whichNyiragongo’s lake has been studied using ground-basedthermal images as well as satellite data to update the radiativepower record of this volcano.
2. Methods
2.1. Ground-based Thermal Measurements
[5] Between 9 and 11 March 2012, we carried out ground-based thermal imaging of Nyiragongo’s lava lake surfacefrom a fixed site along the crater rim (1°31′40.60″S, 29°15′09.99″E; Figures 1 and 2). Measurements were performedfrom 19:43:19 to 20:20:27 (all times are GMT) on 9 March,from 18:10:50 to 18:55:53 on 10 March, and between18:07:27 and 18:07:51, and 21:23:28 and 22:30:21 on 11March. We used a FLIR P65 Pal thermal camera consistingof an uncooled microbolometer detector with a 320 × 240focal plane array sensitive in the 7.5–13 μm wave band.The detector quoted precision is of ~2 K at 303.15 K, andthermal sensitivity of 273.23 K. The camera has a 24 × 18°field of view (minimum focus distance 0.3 m) and spatialresolution (IFOV) of 1.3 mrad. FLIR P65 can record radio-metric images in one of its three dynamic ranges (233.15 –393.15 K, 273.15 – 773.15 K, 623.15 – 1773.15 K) withframe rates up to 60 Hz. For the lava lake measurements,we used the 623.15 – 1773.15 K range [Spampinato et al.,2011] and frame rates of (i) 5 frames per second and 1 frameevery 5 s on 9 March between 19:59:03 and 19:59:35, andbetween 20:02:59 and 20:20:27, respectively; (ii) 25 framesper second and 1 frame per second on 10 March from18:07:27 to 18:07:51 and from 18:15:40 to 18:55:53; andof (iii) 1 frame every 6 s on 11 March.[6] FLIR cameras are equipped with internal software
able to apply automatic corrections for emissivity and atmo-spheric effects (LOWTRAN algorithm). Here, emissivity,temperature and relative humidity of the air, and distance-
Figure 1. (a) Geographic location of Nyiragongo volcano with the close Nyamuragira active volcano and thecity of Goma that in 2002 was invaded by Nyiragongo’s lava flows [USGS/CVO, 2000]. (b) Photograph ofNyiragongo volcano [geo.arizona.edu] and (c) nadir view of the volcano summit area [mywonderfulworld.org].
SPAMPINATO ET AL.: NYIRAGONGO BY FLIR AND SEVIRI DATA
5772
to-target need to be manually input within the camera software.Given that we lack of experimental data for Nyiragongo’slavas, for our measurements we used emissivity (ε) of0.96, thus considering the lava lake surface as a Hawaiian
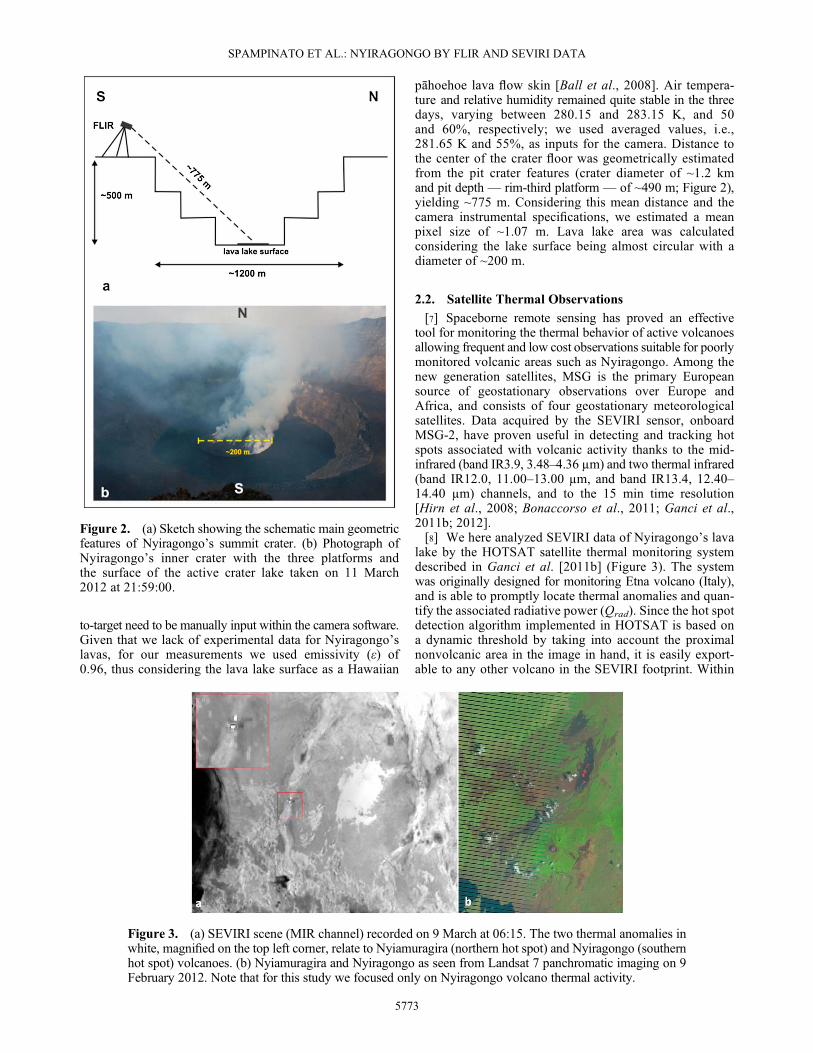
pāhoehoe lava flow skin [Ball et al., 2008]. Air tempera-ture and relative humidity remained quite stable in the threedays, varying between 280.15 and 283.15 K, and 50and 60%, respectively; we used averaged values, i.e.,281.65 K and 55%, as inputs for the camera. Distance tothe center of the crater floor was geometrically estimatedfrom the pit crater features (crater diameter of ~1.2 kmand pit depth — rim-third platform — of ~490 m; Figure 2),yielding ~775 m. Considering this mean distance and thecamera instrumental specifications, we estimated a meanpixel size of ~1.07 m. Lava lake area was calculatedconsidering the lake surface being almost circular with adiameter of ~200 m.
2.2. Satellite Thermal Observations
[7] Spaceborne remote sensing has proved an effectivetool for monitoring the thermal behavior of active volcanoesallowing frequent and low cost observations suitable for poorlymonitored volcanic areas such as Nyiragongo. Among thenew generation satellites, MSG is the primary Europeansource of geostationary observations over Europe andAfrica, and consists of four geostationary meteorologicalsatellites. Data acquired by the SEVIRI sensor, onboardMSG-2, have proven useful in detecting and tracking hotspots associated with volcanic activity thanks to the mid-infrared (band IR3.9, 3.48–4.36 μm) and two thermal infrared(band IR12.0, 11.00–13.00 μm, and band IR13.4, 12.40–14.40 μm) channels, and to the 15 min time resolution[Hirn et al., 2008; Bonaccorso et al., 2011; Ganci et al.,2011b; 2012].[8] We here analyzed SEVIRI data of Nyiragongo’s lava
lake by the HOTSAT satellite thermal monitoring systemdescribed in Ganci et al. [2011b] (Figure 3). The systemwas originally designed for monitoring Etna volcano (Italy),and is able to promptly locate thermal anomalies and quan-tify the associated radiative power (Qrad). Since the hot spotdetection algorithm implemented in HOTSAT is based ona dynamic threshold by taking into account the proximalnonvolcanic area in the image in hand, it is easily export-able to any other volcano in the SEVIRI footprint. Within
Figure 2. (a) Sketch showing the schematic main geometricfeatures of Nyiragongo’s summit crater. (b) Photograph ofNyiragongo’s inner crater with the three platforms andthe surface of the active crater lake taken on 11 March2012 at 21:59:00.
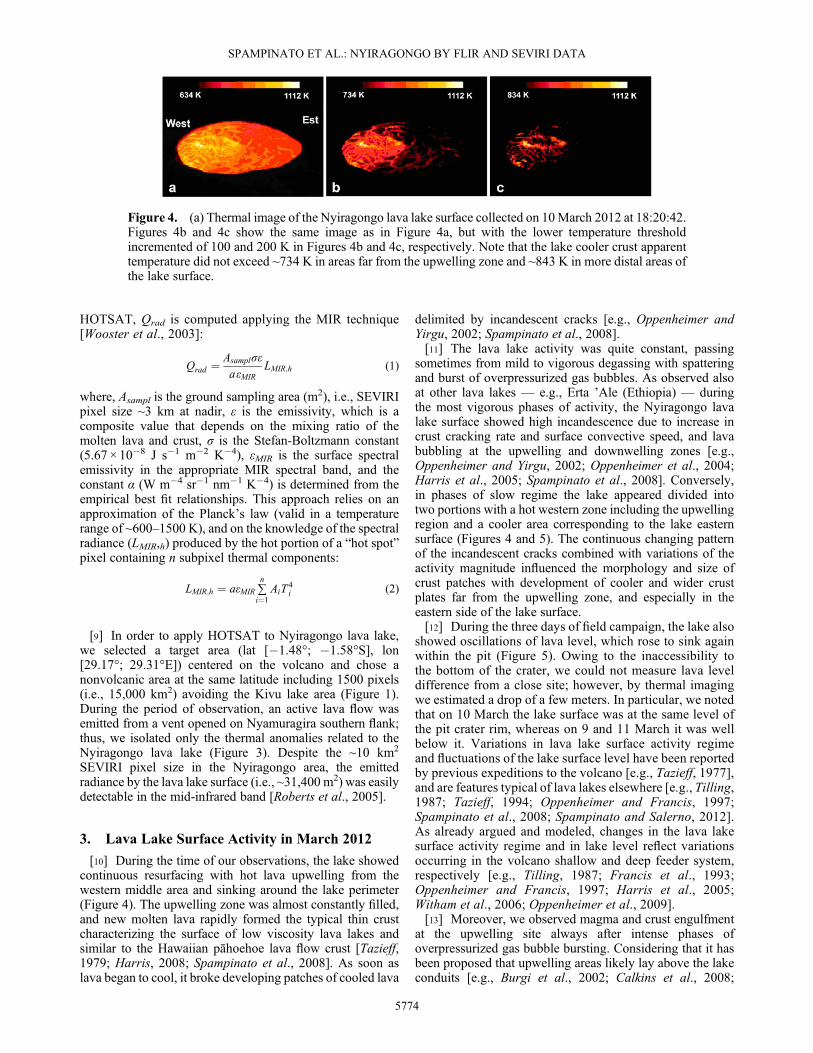
Figure 3. (a) SEVIRI scene (MIR channel) recorded on 9 March at 06:15. The two thermal anomalies inwhite, magnified on the top left corner, relate to Nyiamuragira (northern hot spot) and Nyiragongo (southernhot spot) volcanoes. (b) Nyiamuragira and Nyiragongo as seen from Landsat 7 panchromatic imaging on 9February 2012. Note that for this study we focused only on Nyiragongo volcano thermal activity.
SPAMPINATO ET AL.: NYIRAGONGO BY FLIR AND SEVIRI DATA
5773
HOTSAT, Qrad is computed applying the MIR technique[Wooster et al., 2003]:
Qrad ¼ AsamplσεaεMIR
LMIR;h (1)
where, Asampl is the ground sampling area (m2), i.e., SEVIRIpixel size ~3 km at nadir, ε is the emissivity, which is acomposite value that depends on the mixing ratio of themolten lava and crust, σ is the Stefan-Boltzmann constant(5.67 × 10�8 J s�1 m�2 K�4), εMIR is the surface spectralemissivity in the appropriate MIR spectral band, and theconstant α (W m�4 sr�1 nm�1 K�4) is determined from theempirical best fit relationships. This approach relies on anapproximation of the Planck’s law (valid in a temperaturerange of ~600–1500 K), and on the knowledge of the spectralradiance (LMIR,h) produced by the hot portion of a “hot spot”pixel containing n subpixel thermal components:
LMIR;h ¼ aεMIR ∑n
i¼1AiT
4i (2)
[9] In order to apply HOTSAT to Nyiragongo lava lake,we selected a target area (lat [�1.48°; �1.58°S], lon[29.17°; 29.31°E]) centered on the volcano and chose anonvolcanic area at the same latitude including 1500 pixels(i.e., 15,000 km2) avoiding the Kivu lake area (Figure 1).During the period of observation, an active lava flow wasemitted from a vent opened on Nyamuragira southern flank;thus, we isolated only the thermal anomalies related to theNyiragongo lava lake (Figure 3). Despite the ~10 km2
SEVIRI pixel size in the Nyiragongo area, the emittedradiance by the lava lake surface (i.e., ~31,400 m2) was easilydetectable in the mid-infrared band [Roberts et al., 2005].
3. Lava Lake Surface Activity in March 2012
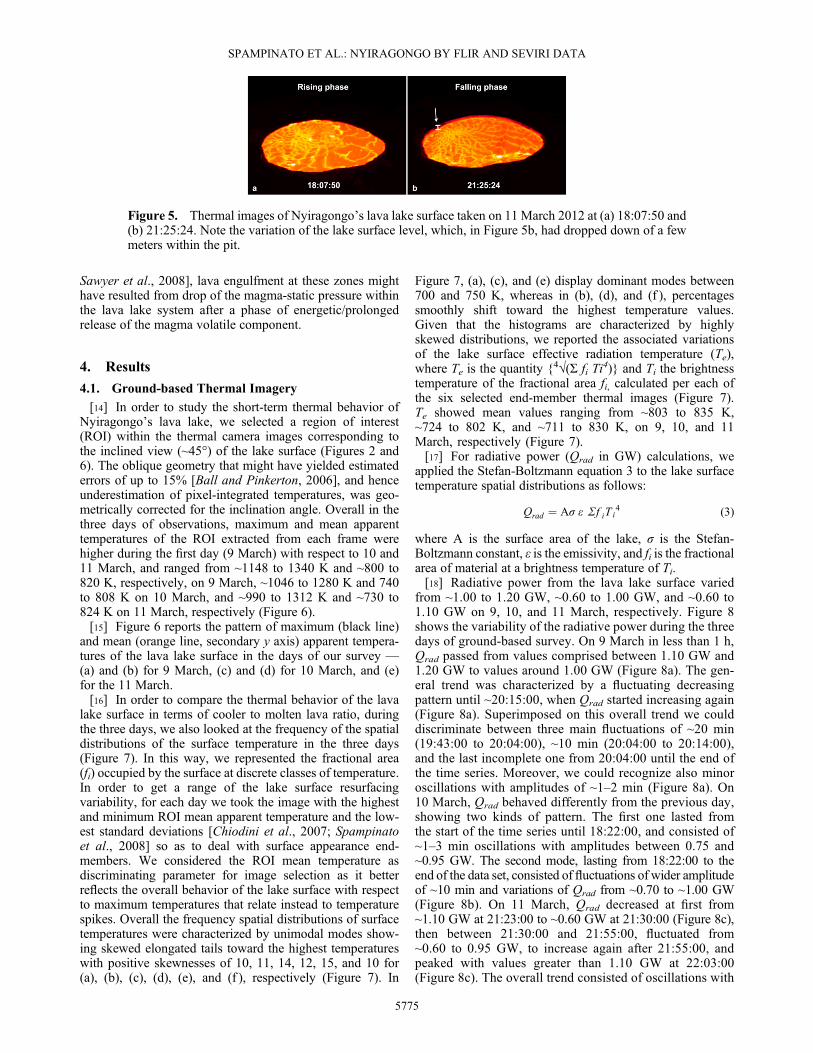
[10] During the time of our observations, the lake showedcontinuous resurfacing with hot lava upwelling from thewestern middle area and sinking around the lake perimeter(Figure 4). The upwelling zone was almost constantly filled,and new molten lava rapidly formed the typical thin crustcharacterizing the surface of low viscosity lava lakes andsimilar to the Hawaiian pāhoehoe lava flow crust [Tazieff,1979; Harris, 2008; Spampinato et al., 2008]. As soon aslava began to cool, it broke developing patches of cooled lava
delimited by incandescent cracks [e.g., Oppenheimer andYirgu, 2002; Spampinato et al., 2008].[11] The lava lake activity was quite constant, passing
sometimes from mild to vigorous degassing with spatteringand burst of overpressurized gas bubbles. As observed alsoat other lava lakes — e.g., Erta ’Ale (Ethiopia) — duringthe most vigorous phases of activity, the Nyiragongo lavalake surface showed high incandescence due to increase incrust cracking rate and surface convective speed, and lavabubbling at the upwelling and downwelling zones [e.g.,Oppenheimer and Yirgu, 2002; Oppenheimer et al., 2004;Harris et al., 2005; Spampinato et al., 2008]. Conversely,in phases of slow regime the lake appeared divided intotwo portions with a hot western zone including the upwellingregion and a cooler area corresponding to the lake easternsurface (Figures 4 and 5). The continuous changing patternof the incandescent cracks combined with variations of theactivity magnitude influenced the morphology and size ofcrust patches with development of cooler and wider crustplates far from the upwelling zone, and especially in theeastern side of the lake surface.[12] During the three days of field campaign, the lake also
showed oscillations of lava level, which rose to sink againwithin the pit (Figure 5). Owing to the inaccessibility tothe bottom of the crater, we could not measure lava leveldifference from a close site; however, by thermal imagingwe estimated a drop of a few meters. In particular, we notedthat on 10 March the lake surface was at the same level ofthe pit crater rim, whereas on 9 and 11 March it was wellbelow it. Variations in lava lake surface activity regimeand fluctuations of the lake surface level have been reportedby previous expeditions to the volcano [e.g., Tazieff, 1977],and are features typical of lava lakes elsewhere [e.g., Tilling,1987; Tazieff, 1994; Oppenheimer and Francis, 1997;Spampinato et al., 2008; Spampinato and Salerno, 2012].As already argued and modeled, changes in the lava lakesurface activity regime and in lake level reflect variationsoccurring in the volcano shallow and deep feeder system,respectively [e.g., Tilling, 1987; Francis et al., 1993;Oppenheimer and Francis, 1997; Harris et al., 2005;Witham et al., 2006; Oppenheimer et al., 2009].[13] Moreover, we observed magma and crust engulfment
at the upwelling site always after intense phases ofoverpressurized gas bubble bursting. Considering that it hasbeen proposed that upwelling areas likely lay above the lakeconduits [e.g., Burgi et al., 2002; Calkins et al., 2008;
Figure 4. (a) Thermal image of the Nyiragongo lava lake surface collected on 10March 2012 at 18:20:42.Figures 4b and 4c show the same image as in Figure 4a, but with the lower temperature thresholdincremented of 100 and 200 K in Figures 4b and 4c, respectively. Note that the lake cooler crust apparenttemperature did not exceed ~734 K in areas far from the upwelling zone and ~843 K in more distal areas ofthe lake surface.
SPAMPINATO ET AL.: NYIRAGONGO BY FLIR AND SEVIRI DATA
5774
Sawyer et al., 2008], lava engulfment at these zones mighthave resulted from drop of the magma-static pressure withinthe lava lake system after a phase of energetic/prolongedrelease of the magma volatile component.
4. Results
4.1. Ground-based Thermal Imagery
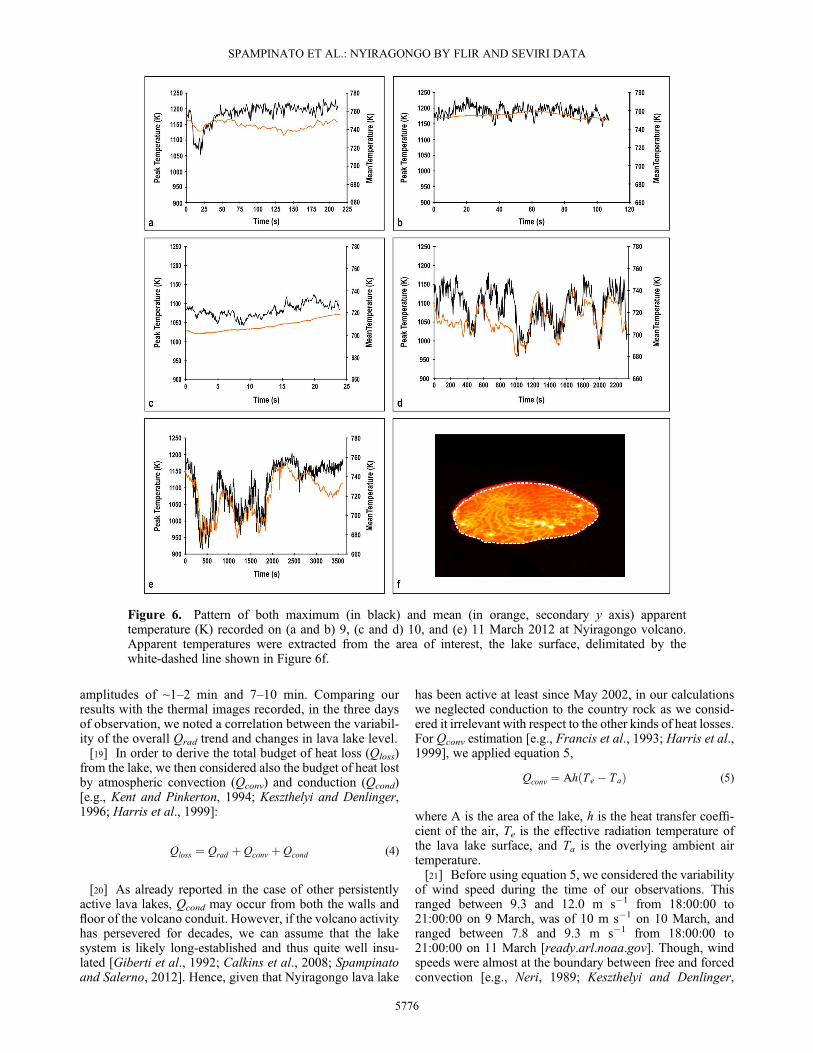
[14] In order to study the short-term thermal behavior ofNyiragongo’s lava lake, we selected a region of interest(ROI) within the thermal camera images corresponding tothe inclined view (~45°) of the lake surface (Figures 2 and6). The oblique geometry that might have yielded estimatederrors of up to 15% [Ball and Pinkerton, 2006], and henceunderestimation of pixel-integrated temperatures, was geo-metrically corrected for the inclination angle. Overall in thethree days of observations, maximum and mean apparenttemperatures of the ROI extracted from each frame werehigher during the first day (9 March) with respect to 10 and11 March, and ranged from ~1148 to 1340 K and ~800 to820 K, respectively, on 9 March, ~1046 to 1280 K and 740to 808 K on 10 March, and ~990 to 1312 K and ~730 to824 K on 11 March, respectively (Figure 6).[15] Figure 6 reports the pattern of maximum (black line)
and mean (orange line, secondary y axis) apparent tempera-tures of the lava lake surface in the days of our survey —(a) and (b) for 9 March, (c) and (d) for 10 March, and (e)for the 11 March.[16] In order to compare the thermal behavior of the lava
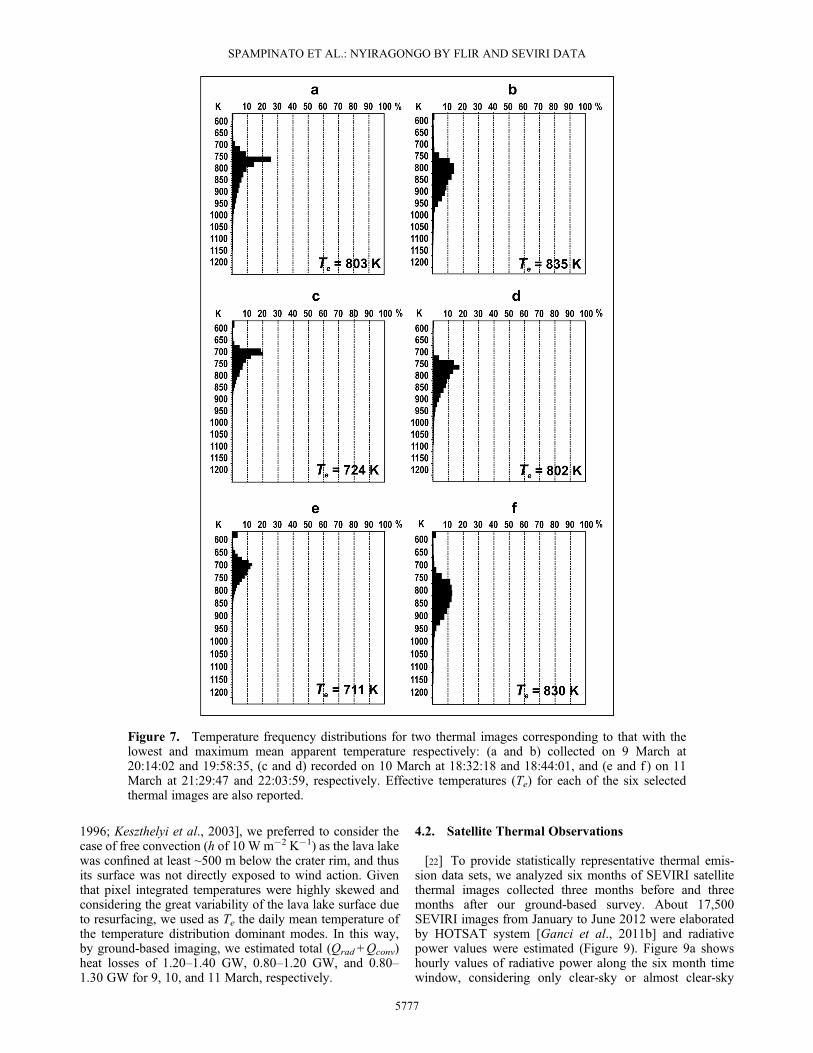
lake surface in terms of cooler to molten lava ratio, duringthe three days, we also looked at the frequency of the spatialdistributions of the surface temperature in the three days(Figure 7). In this way, we represented the fractional area(fi) occupied by the surface at discrete classes of temperature.In order to get a range of the lake surface resurfacingvariability, for each day we took the image with the highestand minimum ROI mean apparent temperature and the low-est standard deviations [Chiodini et al., 2007; Spampinatoet al., 2008] so as to deal with surface appearance end-members. We considered the ROI mean temperature asdiscriminating parameter for image selection as it betterreflects the overall behavior of the lake surface with respectto maximum temperatures that relate instead to temperaturespikes. Overall the frequency spatial distributions of surfacetemperatures were characterized by unimodal modes show-ing skewed elongated tails toward the highest temperatureswith positive skewnesses of 10, 11, 14, 12, 15, and 10 for(a), (b), (c), (d), (e), and (f ), respectively (Figure 7). In
Figure 7, (a), (c), and (e) display dominant modes between700 and 750 K, whereas in (b), (d), and (f ), percentagessmoothly shift toward the highest temperature values.Given that the histograms are characterized by highlyskewed distributions, we reported the associated variationsof the lake surface effective radiation temperature (Te),where Te is the quantity {4√(Σ fi Ti
4)} and Ti the brightnesstemperature of the fractional area fi, calculated per each ofthe six selected end-member thermal images (Figure 7).Te showed mean values ranging from ~803 to 835 K,~724 to 802 K, and ~711 to 830 K, on 9, 10, and 11March, respectively (Figure 7).[17] For radiative power (Qrad in GW) calculations, we
applied the Stefan-Boltzmann equation 3 to the lake surfacetemperature spatial distributions as follows:
Qrad ¼ Aσ ε Σf iT i4
� �(3)
where A is the surface area of the lake, σ is the Stefan-Boltzmann constant, ε is the emissivity, and fi is the fractionalarea of material at a brightness temperature of Ti.[18] Radiative power from the lava lake surface varied
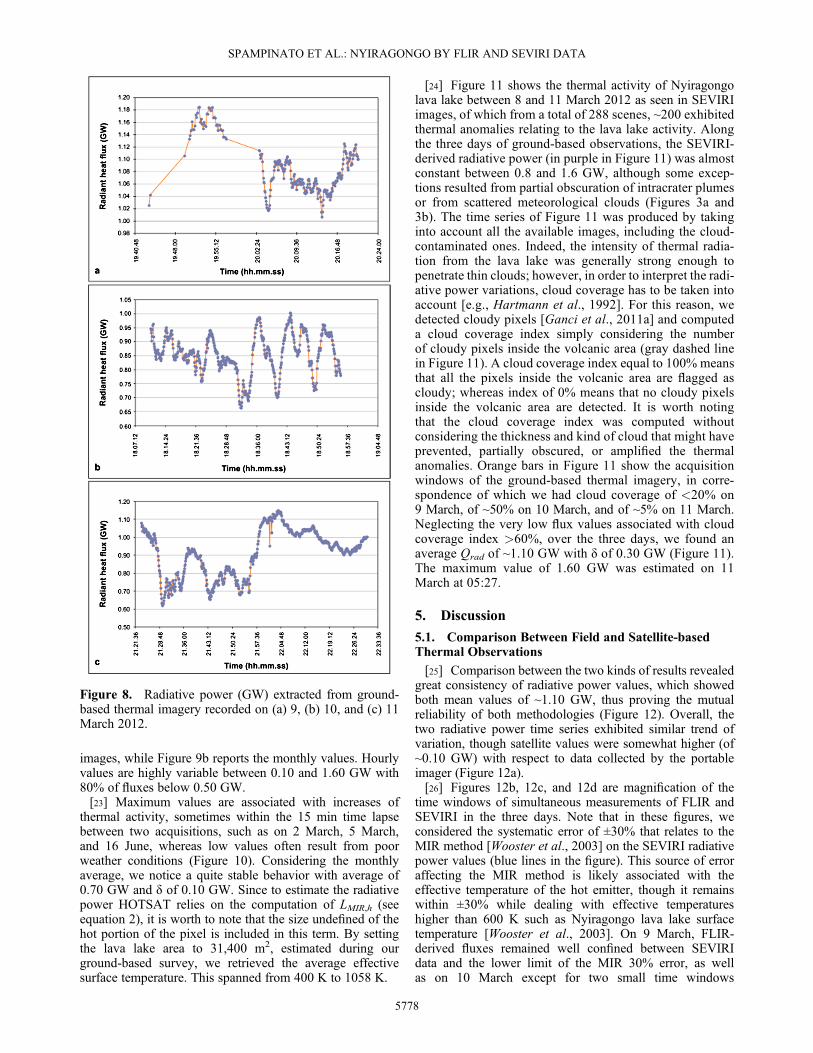
from ~1.00 to 1.20 GW, ~0.60 to 1.00 GW, and ~0.60 to1.10 GW on 9, 10, and 11 March, respectively. Figure 8shows the variability of the radiative power during the threedays of ground-based survey. On 9 March in less than 1 h,Qrad passed from values comprised between 1.10 GW and1.20 GW to values around 1.00 GW (Figure 8a). The gen-eral trend was characterized by a fluctuating decreasingpattern until ~20:15:00, when Qrad started increasing again(Figure 8a). Superimposed on this overall trend we coulddiscriminate between three main fluctuations of ~20 min(19:43:00 to 20:04:00), ~10 min (20:04:00 to 20:14:00),and the last incomplete one from 20:04:00 until the end ofthe time series. Moreover, we could recognize also minoroscillations with amplitudes of ~1–2 min (Figure 8a). On10 March, Qrad behaved differently from the previous day,showing two kinds of pattern. The first one lasted fromthe start of the time series until 18:22:00, and consisted of~1–3 min oscillations with amplitudes between 0.75 and~0.95 GW. The second mode, lasting from 18:22:00 to theend of the data set, consisted of fluctuations of wider amplitudeof ~10 min and variations of Qrad from ~0.70 to ~1.00 GW(Figure 8b). On 11 March, Qrad decreased at first from~1.10 GW at 21:23:00 to ~0.60 GW at 21:30:00 (Figure 8c),then between 21:30:00 and 21:55:00, fluctuated from~0.60 to 0.95 GW, to increase again after 21:55:00, andpeaked with values greater than 1.10 GW at 22:03:00(Figure 8c). The overall trend consisted of oscillations with
Figure 5. Thermal images of Nyiragongo’s lava lake surface taken on 11 March 2012 at (a) 18:07:50 and(b) 21:25:24. Note the variation of the lake surface level, which, in Figure 5b, had dropped down of a fewmeters within the pit.
SPAMPINATO ET AL.: NYIRAGONGO BY FLIR AND SEVIRI DATA
5775
amplitudes of ~1–2 min and 7–10 min. Comparing ourresults with the thermal images recorded, in the three daysof observation, we noted a correlation between the variabil-ity of the overall Qrad trend and changes in lava lake level.[19] In order to derive the total budget of heat loss (Qloss)
from the lake, we then considered also the budget of heat lostby atmospheric convection (Qconv) and conduction (Qcond)[e.g., Kent and Pinkerton, 1994; Keszthelyi and Denlinger,1996; Harris et al., 1999]:
Qloss ¼ Qrad þ Qconv þ Qcond (4)
[20] As already reported in the case of other persistentlyactive lava lakes, Qcond may occur from both the walls andfloor of the volcano conduit. However, if the volcano activityhas persevered for decades, we can assume that the lakesystem is likely long-established and thus quite well insu-lated [Giberti et al., 1992; Calkins et al., 2008; Spampinatoand Salerno, 2012]. Hence, given that Nyiragongo lava lake
has been active at least since May 2002, in our calculationswe neglected conduction to the country rock as we consid-ered it irrelevant with respect to the other kinds of heat losses.For Qconv estimation [e.g., Francis et al., 1993; Harris et al.,1999], we applied equation 5,
Qconv ¼ Ah Te � Tað Þ (5)
where A is the area of the lake, h is the heat transfer coeffi-cient of the air, Te is the effective radiation temperature ofthe lava lake surface, and Ta is the overlying ambient airtemperature.[21] Before using equation 5, we considered the variability
of wind speed during the time of our observations. Thisranged between 9.3 and 12.0 m s�1 from 18:00:00 to21:00:00 on 9 March, was of 10 m s�1 on 10 March, andranged between 7.8 and 9.3 m s�1 from 18:00:00 to21:00:00 on 11 March [ready.arl.noaa.gov]. Though, windspeeds were almost at the boundary between free and forcedconvection [e.g., Neri, 1989; Keszthelyi and Denlinger,
Figure 6. Pattern of both maximum (in black) and mean (in orange, secondary y axis) apparenttemperature (K) recorded on (a and b) 9, (c and d) 10, and (e) 11 March 2012 at Nyiragongo volcano.Apparent temperatures were extracted from the area of interest, the lake surface, delimitated by thewhite-dashed line shown in Figure 6f.
SPAMPINATO ET AL.: NYIRAGONGO BY FLIR AND SEVIRI DATA
5776
1996; Keszthelyi et al., 2003], we preferred to consider thecase of free convection (h of 10 W m�2 K�1) as the lava lakewas confined at least ~500 m below the crater rim, and thusits surface was not directly exposed to wind action. Giventhat pixel integrated temperatures were highly skewed andconsidering the great variability of the lava lake surface dueto resurfacing, we used as Te the daily mean temperature ofthe temperature distribution dominant modes. In this way,by ground-based imaging, we estimated total (Qrad +Qconv)heat losses of 1.20–1.40 GW, 0.80–1.20 GW, and 0.80–1.30 GW for 9, 10, and 11 March, respectively.
4.2. Satellite Thermal Observations
[22] To provide statistically representative thermal emis-sion data sets, we analyzed six months of SEVIRI satellitethermal images collected three months before and threemonths after our ground-based survey. About 17,500SEVIRI images from January to June 2012 were elaboratedby HOTSAT system [Ganci et al., 2011b] and radiativepower values were estimated (Figure 9). Figure 9a showshourly values of radiative power along the six month timewindow, considering only clear-sky or almost clear-sky
Figure 7. Temperature frequency distributions for two thermal images corresponding to that with thelowest and maximum mean apparent temperature respectively: (a and b) collected on 9 March at20:14:02 and 19:58:35, (c and d) recorded on 10 March at 18:32:18 and 18:44:01, and (e and f ) on 11March at 21:29:47 and 22:03:59, respectively. Effective temperatures (Te) for each of the six selectedthermal images are also reported.
SPAMPINATO ET AL.: NYIRAGONGO BY FLIR AND SEVIRI DATA
5777
images, while Figure 9b reports the monthly values. Hourlyvalues are highly variable between 0.10 and 1.60 GW with80% of fluxes below 0.50 GW.[23] Maximum values are associated with increases of
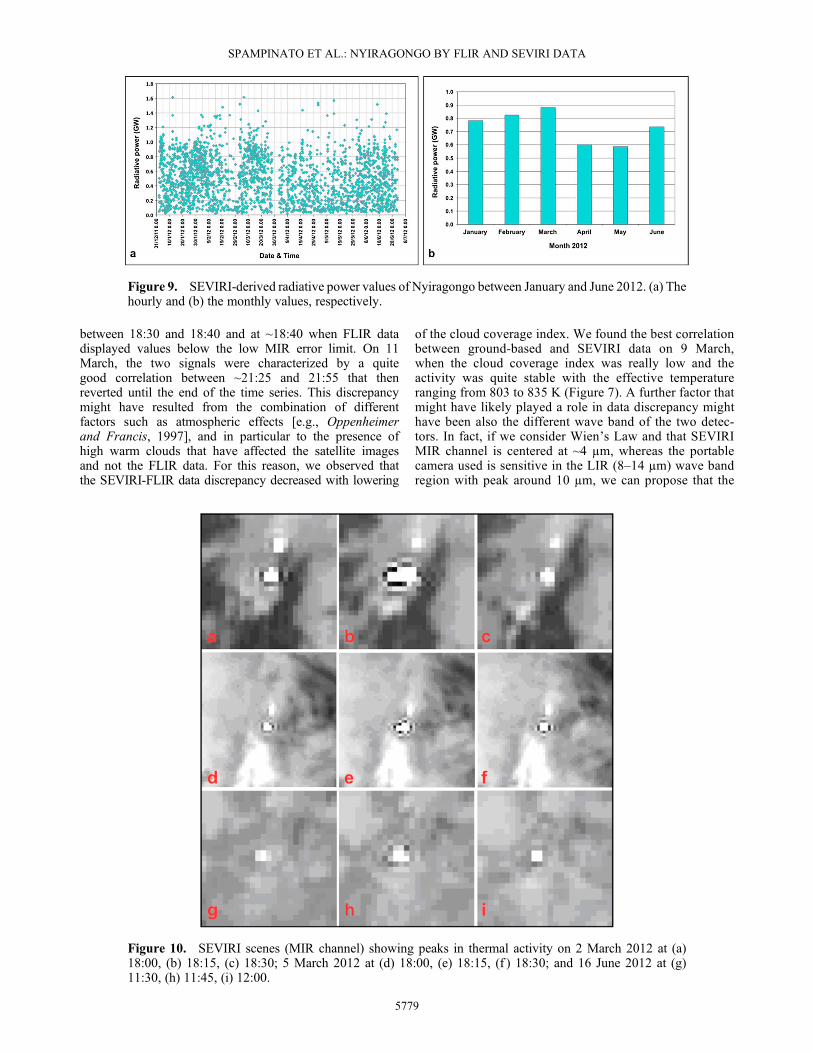
thermal activity, sometimes within the 15 min time lapsebetween two acquisitions, such as on 2 March, 5 March,and 16 June, whereas low values often result from poorweather conditions (Figure 10). Considering the monthlyaverage, we notice a quite stable behavior with average of0.70 GW and δ of 0.10 GW. Since to estimate the radiativepower HOTSAT relies on the computation of LMIR,h (seeequation 2), it is worth to note that the size undefined of thehot portion of the pixel is included in this term. By settingthe lava lake area to 31,400 m2, estimated during ourground-based survey, we retrieved the average effectivesurface temperature. This spanned from 400 K to 1058 K.
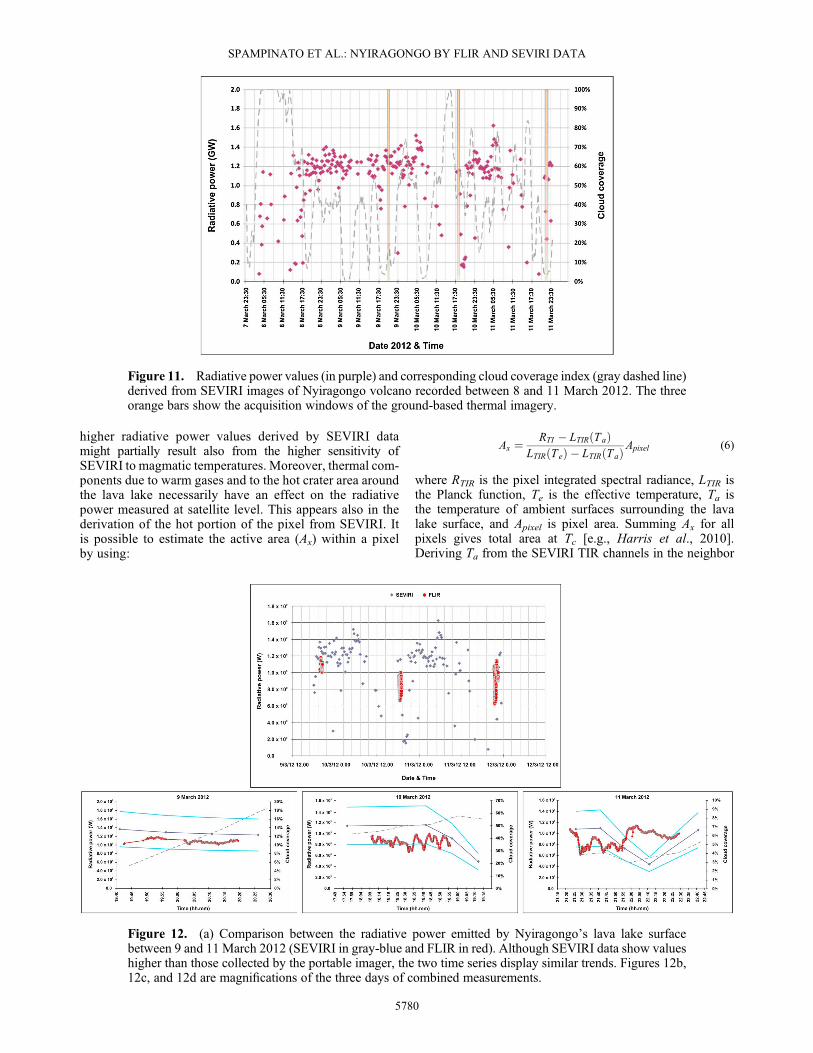
[24] Figure 11 shows the thermal activity of Nyiragongolava lake between 8 and 11 March 2012 as seen in SEVIRIimages, of which from a total of 288 scenes, ~200 exhibitedthermal anomalies relating to the lava lake activity. Alongthe three days of ground-based observations, the SEVIRI-derived radiative power (in purple in Figure 11) was almostconstant between 0.8 and 1.6 GW, although some excep-tions resulted from partial obscuration of intracrater plumesor from scattered meteorological clouds (Figures 3a and3b). The time series of Figure 11 was produced by takinginto account all the available images, including the cloud-contaminated ones. Indeed, the intensity of thermal radia-tion from the lava lake was generally strong enough topenetrate thin clouds; however, in order to interpret the radi-ative power variations, cloud coverage has to be taken intoaccount [e.g., Hartmann et al., 1992]. For this reason, wedetected cloudy pixels [Ganci et al., 2011a] and computeda cloud coverage index simply considering the numberof cloudy pixels inside the volcanic area (gray dashed linein Figure 11). A cloud coverage index equal to 100% meansthat all the pixels inside the volcanic area are flagged ascloudy; whereas index of 0% means that no cloudy pixelsinside the volcanic area are detected. It is worth notingthat the cloud coverage index was computed withoutconsidering the thickness and kind of cloud that might haveprevented, partially obscured, or amplified the thermalanomalies. Orange bars in Figure 11 show the acquisitionwindows of the ground-based thermal imagery, in corre-spondence of which we had cloud coverage of <20% on9 March, of ~50% on 10 March, and of ~5% on 11 March.Neglecting the very low flux values associated with cloudcoverage index >60%, over the three days, we found anaverage Qrad of ~1.10 GW with δ of 0.30 GW (Figure 11).The maximum value of 1.60 GW was estimated on 11March at 05:27.
5. Discussion
5.1. Comparison Between Field and Satellite-basedThermal Observations
[25] Comparison between the two kinds of results revealedgreat consistency of radiative power values, which showedboth mean values of ~1.10 GW, thus proving the mutualreliability of both methodologies (Figure 12). Overall, thetwo radiative power time series exhibited similar trend ofvariation, though satellite values were somewhat higher (of~0.10 GW) with respect to data collected by the portableimager (Figure 12a).[26] Figures 12b, 12c, and 12d are magnification of the
time windows of simultaneous measurements of FLIR andSEVIRI in the three days. Note that in these figures, weconsidered the systematic error of ±30% that relates to theMIR method [Wooster et al., 2003] on the SEVIRI radiativepower values (blue lines in the figure). This source of erroraffecting the MIR method is likely associated with theeffective temperature of the hot emitter, though it remainswithin ±30% while dealing with effective temperatureshigher than 600 K such as Nyiragongo lava lake surfacetemperature [Wooster et al., 2003]. On 9 March, FLIR-derived fluxes remained well confined between SEVIRIdata and the lower limit of the MIR 30% error, as wellas on 10 March except for two small time windows
Figure 8. Radiative power (GW) extracted from ground-based thermal imagery recorded on (a) 9, (b) 10, and (c) 11March 2012.
SPAMPINATO ET AL.: NYIRAGONGO BY FLIR AND SEVIRI DATA
5778
between 18:30 and 18:40 and at ~18:40 when FLIR datadisplayed values below the low MIR error limit. On 11March, the two signals were characterized by a quitegood correlation between ~21:25 and 21:55 that thenreverted until the end of the time series. This discrepancymight have resulted from the combination of differentfactors such as atmospheric effects [e.g., Oppenheimerand Francis, 1997], and in particular to the presence ofhigh warm clouds that have affected the satellite imagesand not the FLIR data. For this reason, we observed thatthe SEVIRI-FLIR data discrepancy decreased with lowering
of the cloud coverage index. We found the best correlationbetween ground-based and SEVIRI data on 9 March,when the cloud coverage index was really low and theactivity was quite stable with the effective temperatureranging from 803 to 835 K (Figure 7). A further factor thatmight have likely played a role in data discrepancy mighthave been also the different wave band of the two detec-tors. In fact, if we consider Wien’s Law and that SEVIRIMIR channel is centered at ~4 μm, whereas the portablecamera used is sensitive in the LIR (8–14 μm) wave bandregion with peak around 10 μm, we can propose that the
Figure 10. SEVIRI scenes (MIR channel) showing peaks in thermal activity on 2 March 2012 at (a)18:00, (b) 18:15, (c) 18:30; 5 March 2012 at (d) 18:00, (e) 18:15, (f ) 18:30; and 16 June 2012 at (g)11:30, (h) 11:45, (i) 12:00.
Figure 9. SEVIRI-derived radiative power values of Nyiragongo between January and June 2012. (a) Thehourly and (b) the monthly values, respectively.
SPAMPINATO ET AL.: NYIRAGONGO BY FLIR AND SEVIRI DATA
5779
higher radiative power values derived by SEVIRI datamight partially result also from the higher sensitivity ofSEVIRI to magmatic temperatures. Moreover, thermal com-ponents due to warm gases and to the hot crater area aroundthe lava lake necessarily have an effect on the radiativepower measured at satellite level. This appears also in thederivation of the hot portion of the pixel from SEVIRI. Itis possible to estimate the active area (Ax) within a pixelby using:
Ax ¼ RTI � LTIR Tað ÞLTIR Teð Þ � LTIR Tað ÞApixel (6)
where RTIR is the pixel integrated spectral radiance, LTIR isthe Planck function, Te is the effective temperature, Ta isthe temperature of ambient surfaces surrounding the lavalake surface, and Apixel is pixel area. Summing Ax for allpixels gives total area at Tc [e.g., Harris et al., 2010].Deriving Ta from the SEVIRI TIR channels in the neighbor
Figure 12. (a) Comparison between the radiative power emitted by Nyiragongo’s lava lake surfacebetween 9 and 11 March 2012 (SEVIRI in gray-blue and FLIR in red). Although SEVIRI data show valueshigher than those collected by the portable imager, the two time series display similar trends. Figures 12b,12c, and 12d are magnifications of the three days of combined measurements.
Figure 11. Radiative power values (in purple) and corresponding cloud coverage index (gray dashed line)derived from SEVIRI images of Nyiragongo volcano recorded between 8 and 11 March 2012. The threeorange bars show the acquisition windows of the ground-based thermal imagery.
SPAMPINATO ET AL.: NYIRAGONGO BY FLIR AND SEVIRI DATA
5780
pixels and using a range of Te according to the effectivetemperature range extracted from the thermal camera data,we found a warm area of 39,500 m2 ±30% with respect tothe 31,400 m2 obtained from ground observations. It isnoteworthy that this value represents the first effort of activearea estimation from SEVIRI data based on ground-basedthermal imagery at Nyiragongo volcano.
5.2. Nyiragongo Thermal Behavior in March 2012
[27] The analysis of thermal imagery recorded by bothground-based and satellite techniques allowed characteriza-tion of the thermal activity of Nyiragongo lava lake at bothshort- and long-time scale. Thermal images collectedbetween 9 and 11 March 2012 provided close-view estimatesof the variability and magnitude of the eruptive state and heatbudget released by the lava lake as well as high-temporalresolution observations on the lake surface features andprocesses. In the three days, the frequency distributions ofthe lava lake surface temperatures marked the predominanceof the cooled surface portion with respect to the hotter moltenlava lying below, thus remaining in line with the moderateeruptive activity of the lake. Apparent temperatures showedthat the cooler crust was always below ~734 K in areas farfrom the upwelling zone and below ~843 K in the lakesurface portion proximal to the vent region, thus confirming
a fairly steady thermal state of the lake resulting fromefficient heat supply. Maximum apparent temperaturesranged from 990 to 1340 K consistently with previoustemperature measurements of the lake surface [e.g., Tazieff,1984; Le Guern, 1987; Giordano et al., 2007; Sawyeret al., 2008]. The highest values were recorded at incandes-cent cracks and during bursts of hot gas bubbles exposingthe molten lava.[28] Variations resulted from magma convective processes
controlled by differences of magma density between thatresident in the lake and magma entering the lake, and magmasupply rates [e.g., Tazieff, 1994; Francis et al., 1993; Harriset al., 1999; Harris, 2008] or alternatively by the periodicarrival of bubbly wakes, i.e., a hot and bubbly magma, withinthe lava lake that could have also prevented lake cooling[Bouche et al., 2010]. According to this last model, theamount of heat needed to maintain the thermal equilibriumof lava lakes is provided by part of the detached bubblywakes that, remaining in the lava lake, releases the heatacquired during bubble formation in the conduit, to the lavalake [Bouche et al., 2010]. Independently from the modelinvoked, in order to quantify the amount of heat released bythe lava lake, we analyzed thermal imagery collected by bothground-based surveys and satellite (SEVIRI) measurementsso as to derive the total budget of heat radiated by the lava
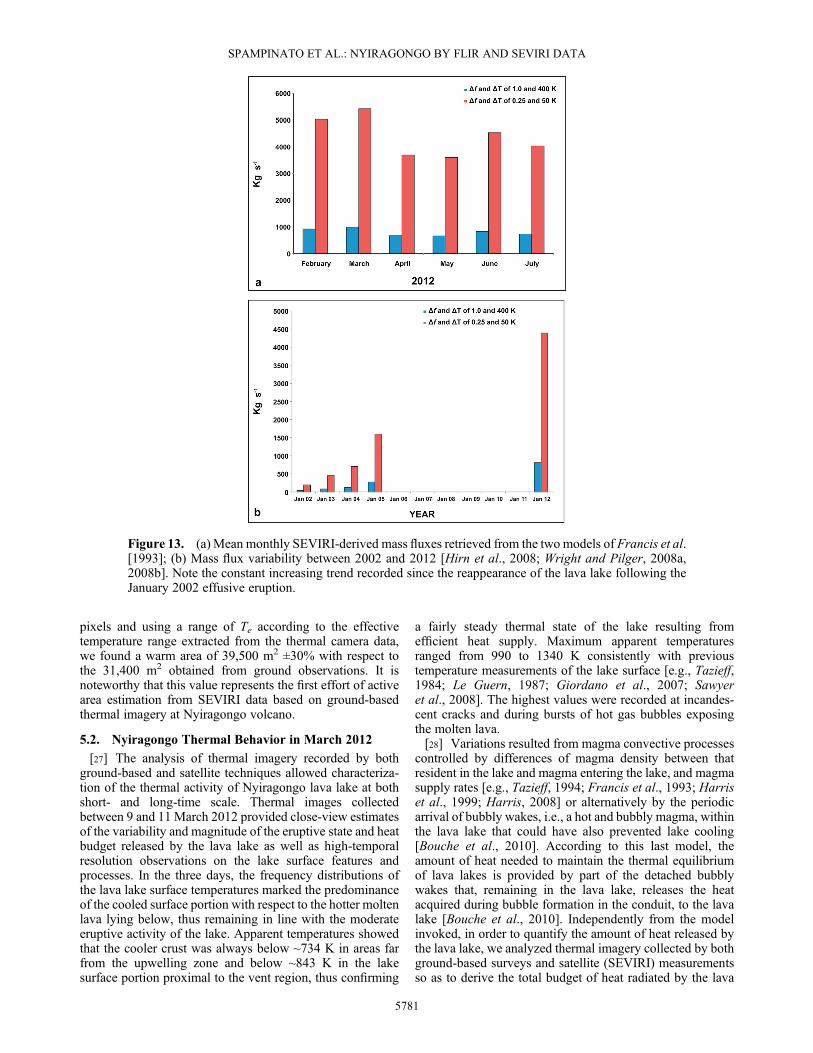
Figure 13. (a) Mean monthly SEVIRI-derived mass fluxes retrieved from the two models of Francis et al.[1993]; (b) Mass flux variability between 2002 and 2012 [Hirn et al., 2008; Wright and Pilger, 2008a,2008b]. Note the constant increasing trend recorded since the reappearance of the lava lake following theJanuary 2002 effusive eruption.
SPAMPINATO ET AL.: NYIRAGONGO BY FLIR AND SEVIRI DATA
5781
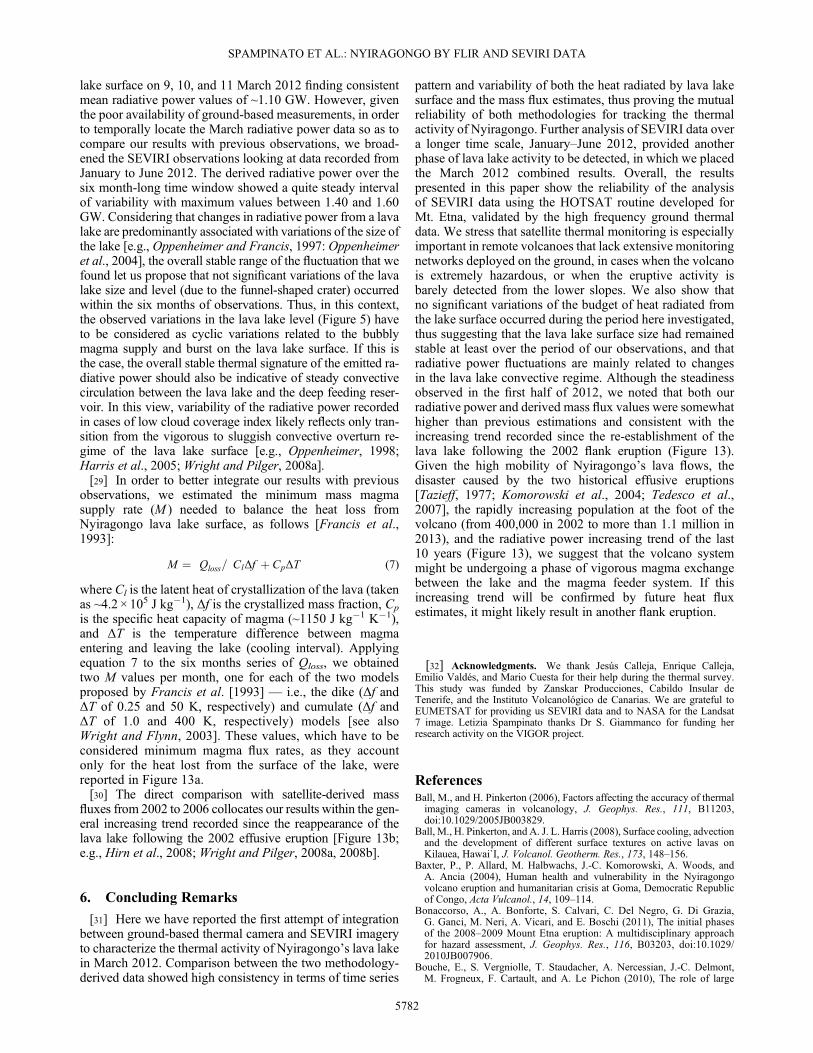
lake surface on 9, 10, and 11 March 2012 finding consistentmean radiative power values of ~1.10 GW. However, giventhe poor availability of ground-based measurements, in orderto temporally locate the March radiative power data so as tocompare our results with previous observations, we broad-ened the SEVIRI observations looking at data recorded fromJanuary to June 2012. The derived radiative power over thesix month-long time window showed a quite steady intervalof variability with maximum values between 1.40 and 1.60GW. Considering that changes in radiative power from a lavalake are predominantly associated with variations of the size ofthe lake [e.g., Oppenheimer and Francis, 1997: Oppenheimeret al., 2004], the overall stable range of the fluctuation that wefound let us propose that not significant variations of the lavalake size and level (due to the funnel-shaped crater) occurredwithin the six months of observations. Thus, in this context,the observed variations in the lava lake level (Figure 5) haveto be considered as cyclic variations related to the bubblymagma supply and burst on the lava lake surface. If this isthe case, the overall stable thermal signature of the emitted ra-diative power should also be indicative of steady convectivecirculation between the lava lake and the deep feeding reser-voir. In this view, variability of the radiative power recordedin cases of low cloud coverage index likely reflects only tran-sition from the vigorous to sluggish convective overturn re-gime of the lava lake surface [e.g., Oppenheimer, 1998;Harris et al., 2005; Wright and Pilger, 2008a].[29] In order to better integrate our results with previous
observations, we estimated the minimum mass magmasupply rate (M ) needed to balance the heat loss fromNyiragongo lava lake surface, as follows [Francis et al.,1993]:
M ¼ Qloss= ClΔf þ CpΔT� �� �
(7)
where Cl is the latent heat of crystallization of the lava (takenas ~4.2 × 10⁵ J kg�1), Δf is the crystallized mass fraction, Cp
is the specific heat capacity of magma (~1150 J kg�1 K�1),and ΔT is the temperature difference between magmaentering and leaving the lake (cooling interval). Applyingequation 7 to the six months series of Qloss, we obtainedtwo M values per month, one for each of the two modelsproposed by Francis et al. [1993] — i.e., the dike (Δf andΔT of 0.25 and 50 K, respectively) and cumulate (Δf andΔT of 1.0 and 400 K, respectively) models [see alsoWright and Flynn, 2003]. These values, which have to beconsidered minimum magma flux rates, as they accountonly for the heat lost from the surface of the lake, werereported in Figure 13a.[30] The direct comparison with satellite-derived mass
fluxes from 2002 to 2006 collocates our results within the gen-eral increasing trend recorded since the reappearance of thelava lake following the 2002 effusive eruption [Figure 13b;e.g., Hirn et al., 2008; Wright and Pilger, 2008a, 2008b].
6. Concluding Remarks
[31] Here we have reported the first attempt of integrationbetween ground-based thermal camera and SEVIRI imageryto characterize the thermal activity of Nyiragongo’s lava lakein March 2012. Comparison between the two methodology-derived data showed high consistency in terms of time series
pattern and variability of both the heat radiated by lava lakesurface and the mass flux estimates, thus proving the mutualreliability of both methodologies for tracking the thermalactivity of Nyiragongo. Further analysis of SEVIRI data overa longer time scale, January–June 2012, provided anotherphase of lava lake activity to be detected, in which we placedthe March 2012 combined results. Overall, the resultspresented in this paper show the reliability of the analysisof SEVIRI data using the HOTSAT routine developed forMt. Etna, validated by the high frequency ground thermaldata. We stress that satellite thermal monitoring is especiallyimportant in remote volcanoes that lack extensive monitoringnetworks deployed on the ground, in cases when the volcanois extremely hazardous, or when the eruptive activity isbarely detected from the lower slopes. We also show thatno significant variations of the budget of heat radiated fromthe lake surface occurred during the period here investigated,thus suggesting that the lava lake surface size had remainedstable at least over the period of our observations, and thatradiative power fluctuations are mainly related to changesin the lava lake convective regime. Although the steadinessobserved in the first half of 2012, we noted that both ourradiative power and derived mass flux values were somewhathigher than previous estimations and consistent with theincreasing trend recorded since the re-establishment of thelava lake following the 2002 flank eruption (Figure 13).Given the high mobility of Nyiragongo’s lava flows, thedisaster caused by the two historical effusive eruptions[Tazieff, 1977; Komorowski et al., 2004; Tedesco et al.,2007], the rapidly increasing population at the foot of thevolcano (from 400,000 in 2002 to more than 1.1 million in2013), and the radiative power increasing trend of the last10 years (Figure 13), we suggest that the volcano systemmight be undergoing a phase of vigorous magma exchangebetween the lake and the magma feeder system. If thisincreasing trend will be confirmed by future heat fluxestimates, it might likely result in another flank eruption.
[32] Acknowledgments. We thank Jesús Calleja, Enrique Calleja,Emilio Valdés, and Mario Cuesta for their help during the thermal survey.This study was funded by Zanskar Producciones, Cabildo Insular deTenerife, and the Instituto Volcanológico de Canarias. We are grateful toEUMETSAT for providing us SEVIRI data and to NASA for the Landsat7 image. Letizia Spampinato thanks Dr S. Giammanco for funding herresearch activity on the VIGOR project.
ReferencesBall, M., and H. Pinkerton (2006), Factors affecting the accuracy of thermalimaging cameras in volcanology, J. Geophys. Res., 111, B11203,doi:10.1029/2005JB003829.
Ball, M., H. Pinkerton, and A. J. L. Harris (2008), Surface cooling, advectionand the development of different surface textures on active lavas onKilauea, Hawai`I, J. Volcanol. Geotherm. Res., 173, 148–156.
Baxter, P., P. Allard, M. Halbwachs, J.-C. Komorowski, A. Woods, andA. Ancia (2004), Human health and vulnerability in the Nyiragongovolcano eruption and humanitarian crisis at Goma, Democratic Republicof Congo, Acta Vulcanol., 14, 109–114.
Bonaccorso, A., A. Bonforte, S. Calvari, C. Del Negro, G. Di Grazia,G. Ganci, M. Neri, A. Vicari, and E. Boschi (2011), The initial phasesof the 2008–2009 Mount Etna eruption: A multidisciplinary approachfor hazard assessment, J. Geophys. Res., 116, B03203, doi:10.1029/2010JB007906.
Bouche, E., S. Vergniolle, T. Staudacher, A. Nercessian, J.-C. Delmont,M. Frogneux, F. Cartault, and A. Le Pichon (2010), The role of large
SPAMPINATO ET AL.: NYIRAGONGO BY FLIR AND SEVIRI DATA
5782
bubbles detected from acoustic measurements on the dynamics ofErta ’Ale lava lake (Ethiopia), Earth Planet. Sci. Lett., 295, 37–48.
Burgi, P. Y., M. Caillet, and S. Haefeli (2002), Field temperature mea-surements at Erta ’Ale lava lake, Ethiopia, Bull. Volcanol., 64,472–485.
Calkins, J., C. Oppenheimer, and P. R. Kyle (2008), Ground-based thermalimaging of phonolite lava lakes at Erebus volcano, Antarctica,J. Volcanol. Geotherm. Res., 177, 695–704.
Chakrabarti, R., A. R. Basu, D. Tedesco, and A. Santo (2009), Isotopic andgeochemical study of the Nyiragongo and Nyamulagira volcanic in thewestern side of the East African rift System, Chem. Geol., 259,273–289.
Chiodini, G., G. Vilardo, V. Augusti, D. Granieri, S. Caliro, C. Minopoli,and C. Terranova (2007), Thermal monitoring of hydrothermal activityby permanent infrared automatic stations: Results obtained at Solfataradi Pozzuoli, campi Flegrei (Italy), J. Geophys. Res., 112, B12206,doi:10.1029/2007JB005140.
Chirico, G. D., M. Favalli, P. Papale, E. Boschi, M. T. Pareschi, andA. Mamou-Mani (2009), Lava flow hazard at Nyiragongo Volcano,DRC, Hazard reduction in urban areas, Bull. Volcanol., 71, 375–387.
Favalli, M., G. D. Chirico, P. Papale, M. T. Pareschi, M. Coltelli, N. Lucana,and E. Boschi (2006), Computer simulations of lava flow paths in the townof Goma, Nyiragongo volcano, Democratic Republic of Congo, J. Geophys.Res., 111, B06202, doi:10.1029/2004JB003527.
Francis, P. W., C. Oppenheimer, and D. Stevenson (1993), Endogenousgrowth of persistently active volcanoes, Nature, 366, 554–557.
Ganci, G., A. Vicari, S. Bonfiglio, G. Gallo, and C. Del Negro (2011a), Atexton-based cloud detection algorithm for MSG-SEVIRI multispec-tral images, Geomatics Nat. Hazards Risk, 2, 1–12, doi:10.1080/19475705.2011.5782633.
Ganci, G., A. Vicari, L. Fortuna, and C. Del Negro (2011b), The HOTSATvolcano monitoring system based on a combined use of SEVIRI andMODIS multispectral data, Ann. Geophys., 54(5), 544–550.
Ganci, G., A. J. L. Harris, C. Del Negro, Y. Guehenneux, A. Cappello,P. Labazuy, S. Calvari, and M. Gouhier (2012), A year of lava fountainingat Etna: Volumes from SEVIRI, Geophys.Res. Lett., 39, L06305,doi:10.1029/2012GL051026.
Giberti, G., C. Jaupart, and G. Sartoris (1992), Steady-state operation ofStromboli volcano, Italy: Constraints on the feeding system, Bull.Volcanol., 54, 535–541.
Giordano, D., M. Polacci, A. Longo, P. Papale, D. B. Dingwell, E. Boschi,and M. Kasereka (2007), Thermo-rheological magma control on theimpact of highly fluid lava flows at Mt. Nyiragongo, Geophys. Res. Lett.,34, L06301, doi:10.1029/2006GL028459.
Harris, A. J. L., L. Flynn, D. A. Rothery, C. Oppenheimer, andS. B. Sherman (1999), Mass flux measurements at active lava lakes:Implications for magma recycling, J. Geophys. Res., 104, 7117–7136.
Harris, A. J. L., R. Carniel, and J. Jones (2005), Identification of variableconvective regimes at Erta ’Ale lava lake, J. Volcanol. Geotherm. Res.,142, 207–223.
Harris, A. J. L. (2008), Modeling lava lake heat loss, rheology, and convec-tion, Geophys. Res. Lett., 35, L07303, doi:10.1029/2008GL033190.
Harris, A., M. Favalli, A. Steffke, A. Fornaciai, and E. Boschi (2010), Arelation between lava discharge rate, thermal insulation, and flow areaset using lidar data, Geophys. Res. Lett., 37, L20308, doi:10.1029/2010GL044683.
Hartmann, D. L., M. E. Ockert-Bell, and M. L. Michelsen (1992), The effectof cloud type on Earth’s energy balance: global analysis, J. Clim., 5,1281–1304.
Hirn, B., C. Di Bartola, F. Ferro, and F. Ferrucci (2008), MODIS borneanalysis of long series of radiant fluxes at active lava lakes, Geosci.Remote Sens. Symp., IGARSS 2008, IEEE International, 3, 370–373,doi:10.1109/IGARSS.2008.4779360.
Huppert, H. E., and M. A. Hallworth (2007), Bi-directional flows inconstrained systems, J. Fluid Mech., 578, 95–112.
Kazahaya, K., H. Shinohara, and G. Saito (1994), Excessive degassing ofIzu-Oshima volcano: Magma convection in a conduit, Bull. Volcanol., 56,207–216.
Kent, R. M., and H. Pinkerton (1994), Modelling lava flow cooling using afinite difference numerical approximation, vol. XXV, pp. 691–692, LunarPlanet. Sci.
Keszthelyi, L., and R. Denlinger (1996), The initial cooling of pahoehoeflow lobes, Bull. Volcanol., 58, 5–18.
Keszthelyi, L., A. J. L. Harris, and J. Dehn (2003), Observations of the effectof wind on the cooling of active lava flows, Geophys. Res. Lett., 30(19),1989, doi:10.1029/2003GL017994.
Komorowski, J.-C., et al. (2004), The January 2002 flank eruption ofNyiragongo volcano (Democratic Republic of Congo): Chronology,evidence for a tectonic rift trigger, and impact of lava flows on the cityof Goma, Acta Vulcanol., 15(1–2), 27–61.
Le Guern, F. (1987), Mechanism of energy transfer in the lava lake ofNiragongo (Zaire), 1959–1977, J. Volcanol. Geotherm. Res., 31,17–31.
Mavonga, T., N. Zana, and R. J. Durrheim (2010), Studies of crustalstructure, seismic precursors to volcanic eruptions and earthquake hazardin the eastern provinces of the Democratic Republic of Congo, J. Afr.Earth Sci., 58, 623–633.
Neri, A. (1989), A local heat transfer analysis of lava cooling in the atmo-sphere: application to thermal diffusion-dominated lava flows, J. Volcanol.Geotherm. Res., 81, 215–243.
Oppenheimer, C., and P. Francis (1997), Remote sensing of heat, lava andfumarole emissions from Erta ’Ale volcano, Ethiopia, Int. J. Remote Sens.,18(8), 1661–1692.
Oppenheimer, C. (1998), Satellite observations of lava lake activity atNyiragongo volcano, ex-Zaire, during the Rwandan refugee crisis,Disasters, 22(3), 268–281.
Oppenheimer, C., and P. Francis (1998), Implications of longeval lava lakesfor geomorphological and plutonic processes at Erta ’Ale volcano, Afar,J. Volcanol. Geotherm. Res., 80, 101–111.
Oppenheimer, C., and G. Yirgu (2002), Thermal imaging of an activelava lake: Erta ’Ale volcano, Ethiopia, Int. J. Remote Sens., 23,4777–4782.
Oppenheimer, C., A. J. S. McGonigle, P. Allard, M. J. Wooster, andV. Tsanev (2004), Sulphur, heat, and magma budget of Erta ’Ale lava lakeEthiopia, Geology, 32, 509–512.
Oppenheimer, C., A. S. Lomakina, P. R. Kyle, N. G. Kingsbury, andM. Boichu (2009), Pulsatory magma supply to a phonolite lava lake,Earth Planet. Sci. Lett., 284, 392–398.
Richard, J. J. (1957), Nyamuragira-Nyiragongo, in Part IV. Catalogue of theActive Volcanoes and Solfatara Field of Africa and the Red Sea,Catalogue of the Active Volcanoes of the World Including SolfataraFields, edited by J. J. Richard and M. Neumann van Padang, pp. 91–112,International Volcanological Association, Napoli Italy.
Roberts, G., M. J. Wooster, G. L. W. Perry, N. Drake, L.-M. Rebelo, andF. Dipotso (2005), Retrieval of biomass combustion rates and totals fromfire radiative power observations: Application to southern Africa usinggeostationary SEVIRI imagery, J. Geophys. Res., 110, D21111,doi:10.1029/2005JD006018.
Sahama, G., and A. Meyer (1958), Study of the volcano Niragongo, Aprogress Report, Exploration du parc National Albert, mission d’étudevolcanologique, Fasc. 2, Institut des Parcs Nationaux du Congo Belge,Bruxelles 1958.
Sahama, T. G. (1962), Petrology of Mt. Nyragongo: A review, Trans.Edinburgh Geol. Soc., 19, 1–28.
Sahama, T. G. (1973), Evolution of Nyragongo magma, J. Petrol., 14,33–48.
Sawyer, G. M., S. A. Carn, V. I. Tsanev, C. Oppenheimer, and M. Burton(2008), Investigation into magma degassing at Nyragongo volcano,Democratic Republic of Congo, Geochem. Geophys. Geosyst., 9,Q02017, doi:10.1029/2007GC001829.
Spampinato, L., C. Oppenheimer, S. Calvari, A. Cannata, and P. Montalto(2008), Lava lake characterization by thermal imaging: Erta ’Ale volcano(Ethiopia), Geochem. Geophys. Geosyst., 9, Q12008, doi:10.1029/2008GC002164.
Spampinato, L., S. Calvari, C. Oppenheimer, and E. Boschi (2011), Volcanosurveillance using infrared cameras, Earth Sci. Rev., 106, 63–91.
Spampinato, L., and G. Salerno (2012), Heat and SO2 emission rates atactive volcanoes – the case study of Masaya, Nicaragua, in NewAchievements in Geoscience, vol. 5, edited by L. Hwee-San, pp. 107–130,Intech, China.
Stevenson, D. S., and S. Blake (1998), Modelling the dynamics and thermo-dynamics of volcanic degassing, Bull. Volcanol., 60, 307–317.
Tazieff, H. (1949), Première exploration du cratère du volcan Nyiragongo,Bull. Soc. Belge Géol., 58, 165–172.
Tazieff, H. (1977), An exceptional eruption: Mt. Nyiragongo, January 10th,1977, Bull. Volcanol., 40, 189–200.
Tazieff, H. (1979), Nyiragongo, the Forbidden Volcano, 1st ed., pp. 287,Barron’s/Woodbury Publisher, New York.
Tazieff, H. (1984), Mt. Nyiragongo: Renewed activity of the lava lake,J. Volcanol. Geotherm. Res., 20, 267–280.
Tazieff, H. (1994), Permanent lava lakes: observed facts and inducedmechanisms, J. Volcanol. Geotherm. Res., 63, 3–11.
Tedesco, D., O. Vaselli, P. Papale, S. A. Carn, M. Voltaggio,G. M. Sawyer, J. Durieux, K. Mahinda, and F. Tassi (2007), January2002 volcano-tectonic eruption of Nyiragongo volcano, DemocraticRepublic of Congo, J. Geophys. Res., 112, B09202, doi:10.1029/2006JB004762.
Tedesco D., F. Tassi, O. Vaselli, R. J. Poreda, T. H. Darrah, E. Cuoco, andM. M. Yalire (2010), Gas isotopic signatures (He, C and Ar) in the lakeKivu region (western branch of the East African Rift System): geodynamic
SPAMPINATO ET AL.: NYIRAGONGO BY FLIR AND SEVIRI DATA
5783

end volcanological implications, J. Geophys. Res., 115, B01205, doi:10.1029/2008JB006227.
Tilling, R. I. (1987), Fluctuations in surface height of active lava lakes during1972–1974 Mauna Ulu eruption, Kilauea volcano, Hawaii, J. Geophys.Res., 92, 13,721–13,730.
Witham, F., A. W. Woods, and C. Gladstone (2006), An analogue experimentalmodel of depth fluctuations in lava lakes, Bull. Volcanol., 69, 51–56.
Wooster, M. J., B. Zhukov, and D. Oertel (2003), Fire radiative energy forquantitative study of biomass burning: derivation from the BIRD experi-mental satellite and comparison to MODIS fire products, Remote Sens.Environ., 86, 83–107.
Wright, R., and L. P. Flynn (2003), Satellite observations of thermal emis-sion before, during, and after, the January 2002 eruption of Nyiragongo,Acta Vulcanol., 15, 67–74.
Wright, R., L. P. Flynn, H. Garbeil, A. J. L. Harris, and E. Pilger (2004),MOLDVOLC: near-real-time thermal monitoring of global volcanism,J. Volcanol. Geotherm. Res., 135, 29–49.
Wright, R., and E. Pilger (2008a), Satellite observations reveal little inter-annual variability in the radiant flux from the Mount Erebus lava lake,J. Volcanol. Geotherm. Res., 177, 687–694.
Wright, R., and E. Pilger (2008b), Radiant flux from Earth’s subaeriallyerupting volcanoes, Int. J. Remote Sens., 29(22), 6443–6466.
SPAMPINATO ET AL.: NYIRAGONGO BY FLIR AND SEVIRI DATA
5784
Copyright © 2022 FDOKUMEN