The Influence of Intellectual Capital on Firm Performance Among Slovak SMEs
10
The Influence of Intellectual Capital on Firm Performance Among Slovak SMEs Anna Pilková, Jana Volná, Ján Papula and Marián Holienka Faculty of Management, Comenius University, Bratislava, Slovak Republic [email protected] [email protected] jan.papula @fm.uniba.sk [email protected] Abstract: Intellectual capital, which incorporates skills and knowledge at all levels of an organization, has become the most important economic resource and is replacing financial and physical capitals as the most important capital in the new economy. Uniqueness, and hence the possibility of a longer validity of chosen competitive strategy lies within the internal environment of the organization, not external. The ability to identify opportunities does not make the competitive ability long‐term, or even sustainable. Sustainability is built and affected by the ability of a company to set up correctly its internal resources, not only tangible but intangible as well, with a focus on maximizing the creation of value added in the value chain. In relation with this view, the explanation why some companies have long been successful, while others fail, may just be answered through the analysis of their resources and capabilities. Issue of intellectual capital and its influence on firm performance is still under investigated among SMEs in Slovakia. Positive influence of intellectual capital on firm performance has been proved in numerous studies around the world, but the empirical evidence in case of Slovak SMEs has not yet been provided. In these studies, to measure the level of intellectual capital and its respective components in SMEs, value added intellectual coefficient (VAIC™), as developed by Ante Pulic, providing the information about the efficiency of tangible and intangible assets that can be used to generate value to a firm, is being applied. Keywords: intellectual capital, firm performance, VAIC™, SMEs, forward stepwise regression analysis 1. Introduction According to the resource‐based view on the organization, the sustainable competitive advantage is being achieved by continuous development of existing and by creating of new company’s’ resources and capabilities in response to quickly changing market conditions. The main sources of a company, which have been developed in terms of today’s economy, are intangible resources, also referred to as the intellectual capital of the company. Intellectual capital, which incorporates skills and knowledge at all levels of an organization, has become the most important economic resource that is replacing financial and physical capitals as the most important source in the new economy. The growing awareness and acceptance of the importance of intellectual capital as a source of competitive advantage has led to the need for an acceptable measurement model, given that traditional financial tools do not address the necessary concepts of intellectual capital (Volkov 2012). The value added intellectual coefficient (VAIC™), method developed by Ante Pulic (Pulic 2004), uses financial statements of a firm to calculate the efficiency coefficient on three types of capital – human capital, structural capital and capital employed. This measure, however being criticized by some authors, is the most frequent metric used to evaluate intellectual capital and its components using financial data. Due using information from accounting statements as a basis, VAIC™ is a suitable method when providing analyses of human capital efficiency, structural capital efficiency, capital employed efficiency and firm performance on a macro level due better comparability between companies, sectors or nations. 2. Intellectual capital and its influence on firm performance Intellectual capital, defined as any knowledge convertible into value (Edvinsson 1997), brings the right schema for presenting qualities and potentials for company stakeholders. There are several views at the breakdown structure of intellectual capital model presented in literature, usually consisting of three main components: human capital, structural capital (also labeled as internal or organizational capital) and relational capital (also labeled as external capital) including customer relationship component (Edvinsson 1997, Sveiby 1997, Stewart 1998, MERITUM 2002, Bontis 2002, Mouritsen et al 2002, Pablos 2003). To define every component of intellectual capital independently, human capital can be described as combinations of knowledge, skills, innovativeness and ability of the company’s individual employees (Edvinsson and Malone 1997). The human capital cannot be owned; it can only be rented (Edvinsson 1997). The structural capital consists of internal structure, which includes patents, concepts, models, computer, and administrative systems. Popular is defining the structural capital as knowledge that does not go home at night (Stewart 1998), or what left behind when 329 Pilková, A. - Papula, J. - Volná, J. – Holienka, M. (2013) “The influence of intellectual capital on firm performance among Slovak SMEs“, Proceedings of the 10th International Conference on Intellectual Capital, Knowledge Management and Organisational Learning. Reading: Academic Conferences and Publishing International Limited. ISBN 978-1-909507-80-7. pp. 329-338
Transcript of The Influence of Intellectual Capital on Firm Performance Among Slovak SMEs
The Influence of Intellectual Capital on Firm Performance Among Slovak SMEs
Anna Pilková, Jana Volná, Ján Papula and Marián Holienka Faculty of Management, Comenius University, Bratislava, Slovak Republic [email protected] [email protected] [email protected] [email protected]
Abstract: Intellectual capital, which incorporates skills and knowledge at all levels of an organization, has become the most important economic resource and is replacing financial and physical capitals as the most important capital in the new economy. Uniqueness, and hence the possibility of a longer validity of chosen competitive strategy lies within the internal environment of the organization, not external. The ability to identify opportunities does not make the competitive ability long‐term, or even sustainable. Sustainability is built and affected by the ability of a company to set up correctly its internal resources, not only tangible but intangible as well, with a focus on maximizing the creation of value added in the value chain. In relation with this view, the explanation why some companies have long been successful, while others fail, may just be answered through the analysis of their resources and capabilities. Issue of intellectual capital and its influence on firm performance is still under investigated among SMEs in Slovakia. Positive influence of intellectual capital on firm performance has been proved in numerous studies around the world, but the empirical evidence in case of Slovak SMEs has not yet been provided. In these studies, to measure the level of intellectual capital and its respective components in SMEs, value added intellectual coefficient (VAIC™), as developed by Ante Pulic, providing the information about the efficiency of tangible and intangible assets that can be used to generate value to a firm, is being applied.
Keywords: intellectual capital, firm performance, VAIC™, SMEs, forward stepwise regression analysis
1. Introduction
According to the resource‐based view on the organization, the sustainable competitive advantage is being achieved by continuous development of existing and by creating of new company’s’ resources and capabilities in response to quickly changing market conditions. The main sources of a company, which have been developed in terms of today’s economy, are intangible resources, also referred to as the intellectual capital of the company. Intellectual capital, which incorporates skills and knowledge at all levels of an organization, has become the most important economic resource that is replacing financial and physical capitals as the most important source in the new economy. The growing awareness and acceptance of the importance of intellectual capital as a source of competitive advantage has led to the need for an acceptable measurement model, given that traditional financial tools do not address the necessary concepts of intellectual capital (Volkov 2012). The value added intellectual coefficient (VAIC™), method developed by Ante Pulic (Pulic 2004), uses financial statements of a firm to calculate the efficiency coefficient on three types of capital – human capital, structural capital and capital employed. This measure, however being criticized by some authors, is the most frequent metric used to evaluate intellectual capital and its components using financial data. Due using information from accounting statements as a basis, VAIC™ is a suitable method when providing analyses of human capital efficiency, structural capital efficiency, capital employed efficiency and firm performance on a macro level due better comparability between companies, sectors or nations.
2. Intellectual capital and its influence on firm performance
Intellectual capital, defined as any knowledge convertible into value (Edvinsson 1997), brings the right schema for presenting qualities and potentials for company stakeholders. There are several views at the breakdown structure of intellectual capital model presented in literature, usually consisting of three main components: human capital, structural capital (also labeled as internal or organizational capital) and relational capital (also labeled as external capital) including customer relationship component (Edvinsson 1997, Sveiby 1997, Stewart 1998, MERITUM 2002, Bontis 2002, Mouritsen et al 2002, Pablos 2003). To define every component of intellectual capital independently, human capital can be described as combinations of knowledge, skills, innovativeness and ability of the company’s individual employees (Edvinsson and Malone 1997). The human capital cannot be owned; it can only be rented (Edvinsson 1997). The structural capital consists of internal structure, which includes patents, concepts, models, computer, and administrative systems. Popular is defining the structural capital as knowledge that does not go home at night (Stewart 1998), or what left behind when
329Pilková, A. - Papula, J. - Volná, J. – Holienka, M. (2013) “The influence of intellectual capital on firm performance among Slovak SMEs“, Proceedings of the 10th International Conference on Intellectual Capital, Knowledge Management and Organisational Learning. Reading: Academic Conferences and Publishing International Limited. ISBN 978-1-909507-80-7. pp. 329-338
reference
Pilková, Anna - Papula, Ján - Volná, Jana - Holienka, Marian (2013) “The influence of intellectual capital on firm performance among Slovak SMEs“, Proceedings of the 10th International Conference on Intellectual Capital, Knowledge Management and Organisational Learning. Reading: Academic Conferences and Publishing International Limited. ISBN 978-1-909507-80-7. pp. 329-338
Anna Pilková et al.
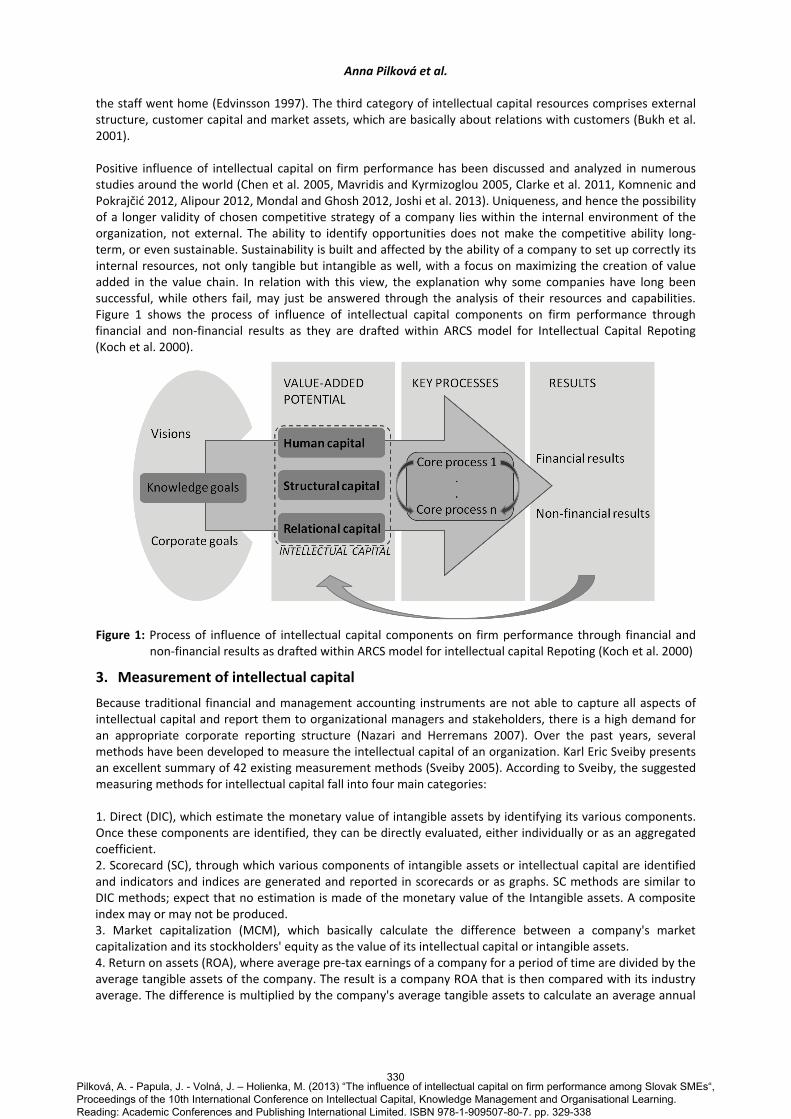
the staff went home (Edvinsson 1997). The third category of intellectual capital resources comprises external structure, customer capital and market assets, which are basically about relations with customers (Bukh et al. 2001). Positive influence of intellectual capital on firm performance has been discussed and analyzed in numerous studies around the world (Chen et al. 2005, Mavridis and Kyrmizoglou 2005, Clarke et al. 2011, Komnenic and Pokrajčić 2012, Alipour 2012, Mondal and Ghosh 2012, Joshi et al. 2013). Uniqueness, and hence the possibility of a longer validity of chosen competitive strategy of a company lies within the internal environment of the organization, not external. The ability to identify opportunities does not make the competitive ability long‐term, or even sustainable. Sustainability is built and affected by the ability of a company to set up correctly its internal resources, not only tangible but intangible as well, with a focus on maximizing the creation of value added in the value chain. In relation with this view, the explanation why some companies have long been successful, while others fail, may just be answered through the analysis of their resources and capabilities. Figure 1 shows the process of influence of intellectual capital components on firm performance through financial and non‐financial results as they are drafted within ARCS model for Intellectual Capital Repoting (Koch et al. 2000).
Figure 1: Process of influence of intellectual capital components on firm performance through financial and non‐financial results as drafted within ARCS model for intellectual capital Repoting (Koch et al. 2000)
3. Measurement of intellectual capital
Because traditional financial and management accounting instruments are not able to capture all aspects of intellectual capital and report them to organizational managers and stakeholders, there is a high demand for an appropriate corporate reporting structure (Nazari and Herremans 2007). Over the past years, several methods have been developed to measure the intellectual capital of an organization. Karl Eric Sveiby presents an excellent summary of 42 existing measurement methods (Sveiby 2005). According to Sveiby, the suggested measuring methods for intellectual capital fall into four main categories: 1. Direct (DIC), which estimate the monetary value of intangible assets by identifying its various components. Once these components are identified, they can be directly evaluated, either individually or as an aggregated coefficient. 2. Scorecard (SC), through which various components of intangible assets or intellectual capital are identified and indicators and indices are generated and reported in scorecards or as graphs. SC methods are similar to DIC methods; expect that no estimation is made of the monetary value of the Intangible assets. A composite index may or may not be produced. 3. Market capitalization (MCM), which basically calculate the difference between a company's market capitalization and its stockholders' equity as the value of its intellectual capital or intangible assets. 4. Return on assets (ROA), where average pre‐tax earnings of a company for a period of time are divided by the average tangible assets of the company. The result is a company ROA that is then compared with its industry average. The difference is multiplied by the company's average tangible assets to calculate an average annual
330
Pilková, A. - Papula, J. - Volná, J. – Holienka, M. (2013) “The influence of intellectual capital on firm performance among Slovak SMEs“, Proceedings of the 10th International Conference on Intellectual Capital, Knowledge Management and Organisational Learning. Reading: Academic Conferences and Publishing International Limited. ISBN 978-1-909507-80-7. pp. 329-338
Anna Pilková et al.
earning from the Intangibles. Dividing the above‐average earnings by the company's average cost of capital or an interest rate, one can derive an estimation of the value of its intangible assets or intellectual capital.
ROA methods are based on the assumption that the existence of intellectual capital / intangible resources in an organization, which are generally not captured in the balance sheet of the company, affect operating results of an organization recorded in the profit and loss statement of that organization.
First two categories, the direct and scorecard intellectual capital measurement methods might be very useful at a company level, as a basis for internal management information especially in the connection with business strategy management. Actually, these methods are operating with indicators and calculations at business level, what results in worse inter‐company comparability. On the other hand, market capitalization and ROA are methods, which should be generally preferred when providing analyses on a macro level due better comparability between companies, sectors or nations due using information from accounting statements as a basis.
4. Value added intellectual coefficient (VAIC™)
From the mentioned 42 measurement methods, value added intellectual coefficient (VAIC™), a method developed by Ante Pulic (Pulic 2004), as the only one doesn’t quite fit any of the four listed categories, although it closest fits the ROA measurement methods (Sveiby 2005). According to Pulic, VAIC™ is an equation, which measures how much and how efficiently intellectual capital and capital employed create value (Pulic 2004). Ante Pulic (Pulic 2004) was one of the first scholars in the field of IC research to focus explicitly on the connection between IC and economic performance and the first to base his analyses solely on company balance sheet figures, i.e. financial indicators (Stahle et al. 2011). Until present times, VAIC™ has been frequently quoted in academic research papers through various analyses investigating the performance of individual companies, often on sectorial or national level (Mavridis and Kyrmizoglou 2005, Chen et al. 2005, Nazari and Herremans 2007, Kiong Ting and Lean 2009, Laing et al. 2010, Aras et al. 2011, Clarke et al. 2011, Pal and Soriya 2012, Pucar 2012, Alipour 2012, Mondal and Ghosh 2012, Komnenic and Pokrajcic 2012, Joshi et al. 2013).
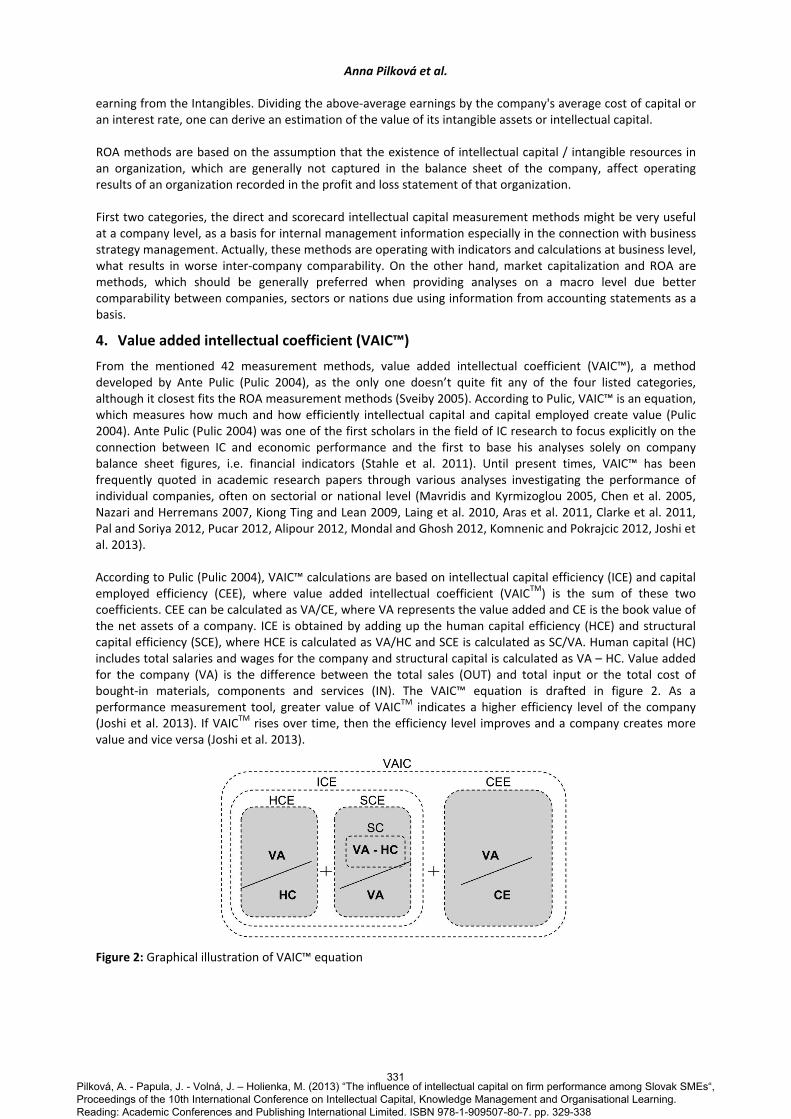
According to Pulic (Pulic 2004), VAIC™ calculations are based on intellectual capital efficiency (ICE) and capital employed efficiency (CEE), where value added intellectual coefficient (VAICTM) is the sum of these two coefficients. CEE can be calculated as VA/CE, where VA represents the value added and CE is the book value of the net assets of a company. ICE is obtained by adding up the human capital efficiency (HCE) and structural capital efficiency (SCE), where HCE is calculated as VA/HC and SCE is calculated as SC/VA. Human capital (HC) includes total salaries and wages for the company and structural capital is calculated as VA – HC. Value added for the company (VA) is the difference between the total sales (OUT) and total input or the total cost of bought‐in materials, components and services (IN). The VAIC™ equation is drafted in figure 2. As a performance measurement tool, greater value of VAICTM indicates a higher efficiency level of the company (Joshi et al. 2013). If VAICTM rises over time, then the efficiency level improves and a company creates more value and vice versa (Joshi et al. 2013).
Figure 2: Graphical illustration of VAIC™ equation
331Pilková, A. - Papula, J. - Volná, J. – Holienka, M. (2013) “The influence of intellectual capital on firm performance among Slovak SMEs“, Proceedings of the 10th International Conference on Intellectual Capital, Knowledge Management and Organisational Learning. Reading: Academic Conferences and Publishing International Limited. ISBN 978-1-909507-80-7. pp. 329-338
Anna Pilková et al.
5. Research methodology
5.1 Research goal The aim of this paper is to examine whether and to what extent the efficiency of intellectual capital and capital employed of a company as defined within VAIC™ model developed by Pulic (Pulic 2004) and its individual components affect the firm performance among SMEs in different industries in Slovakia. VAIC™ method uses financial statements of a firm to calculate the efficiency coefficient on three types of capital; human capital by the medium of human capital efficiency coefficient (HCE), structural capital by the medium of structural capital efficiency coefficient (SCE) and capital employed by the medium of capital employed efficiency coefficient (CEE). As a proxy for profitability, we have deployed return on assets of a company (ROA) due its general acceptance as a performance measure in entrepreneurship and strategy research. While investigating the effect of VAIC™ components on SME performance, our analysis also accounts for return on equity (ROE), leverage of the firm and firm size as control variables.
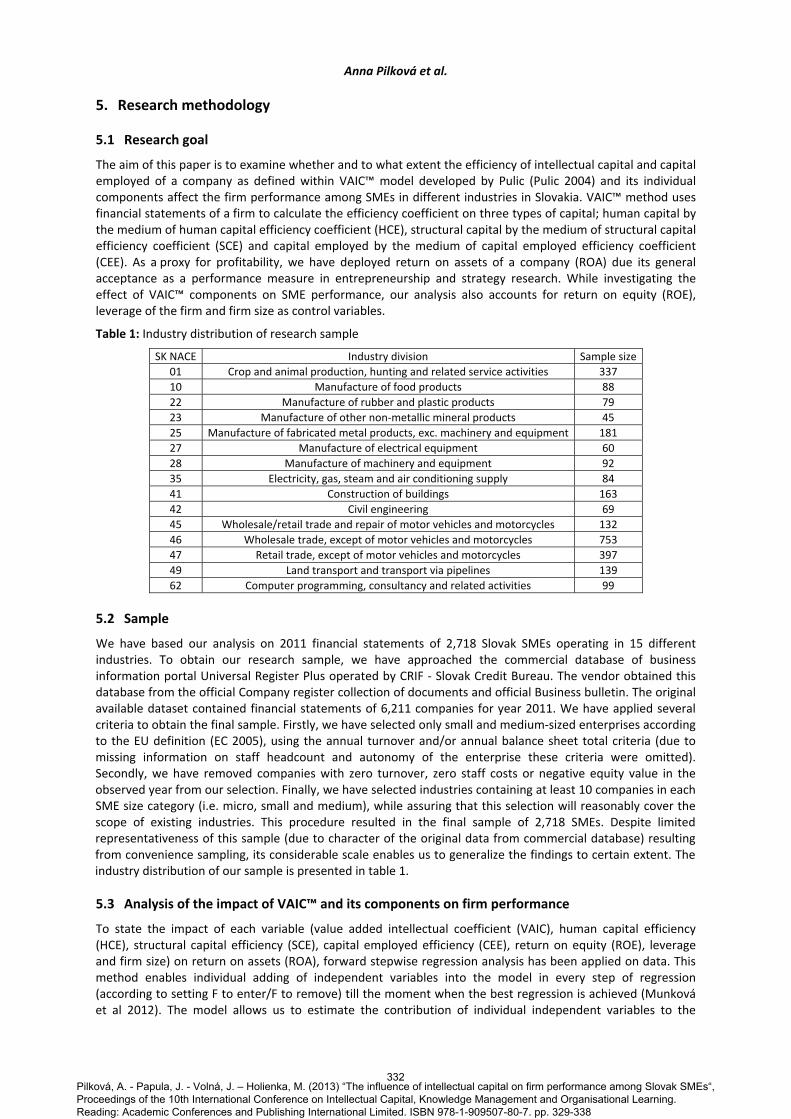
Table 1: Industry distribution of research sample
SK NACE Industry division Sample size 01 Crop and animal production, hunting and related service activities 337 10 Manufacture of food products 88 22 Manufacture of rubber and plastic products 79 23 Manufacture of other non‐metallic mineral products 45 25 Manufacture of fabricated metal products, exc. machinery and equipment 181 27 Manufacture of electrical equipment 60 28 Manufacture of machinery and equipment 92 35 Electricity, gas, steam and air conditioning supply 84 41 Construction of buildings 163 42 Civil engineering 69 45 Wholesale/retail trade and repair of motor vehicles and motorcycles 132 46 Wholesale trade, except of motor vehicles and motorcycles 753 47 Retail trade, except of motor vehicles and motorcycles 397 49 Land transport and transport via pipelines 139 62 Computer programming, consultancy and related activities 99
5.2 Sample
We have based our analysis on 2011 financial statements of 2,718 Slovak SMEs operating in 15 different industries. To obtain our research sample, we have approached the commercial database of business information portal Universal Register Plus operated by CRIF ‐ Slovak Credit Bureau. The vendor obtained this database from the official Company register collection of documents and official Business bulletin. The original available dataset contained financial statements of 6,211 companies for year 2011. We have applied several criteria to obtain the final sample. Firstly, we have selected only small and medium‐sized enterprises according to the EU definition (EC 2005), using the annual turnover and/or annual balance sheet total criteria (due to missing information on staff headcount and autonomy of the enterprise these criteria were omitted). Secondly, we have removed companies with zero turnover, zero staff costs or negative equity value in the observed year from our selection. Finally, we have selected industries containing at least 10 companies in each SME size category (i.e. micro, small and medium), while assuring that this selection will reasonably cover the scope of existing industries. This procedure resulted in the final sample of 2,718 SMEs. Despite limited representativeness of this sample (due to character of the original data from commercial database) resulting from convenience sampling, its considerable scale enables us to generalize the findings to certain extent. The industry distribution of our sample is presented in table 1.
5.3 Analysis of the impact of VAIC™ and its components on firm performance
To state the impact of each variable (value added intellectual coefficient (VAIC), human capital efficiency (HCE), structural capital efficiency (SCE), capital employed efficiency (CEE), return on equity (ROE), leverage and firm size) on return on assets (ROA), forward stepwise regression analysis has been applied on data. This method enables individual adding of independent variables into the model in every step of regression (according to setting F to enter/F to remove) till the moment when the best regression is achieved (Munková et al 2012). The model allows us to estimate the contribution of individual independent variables to the
332
Pilková, A. - Papula, J. - Volná, J. – Holienka, M. (2013) “The influence of intellectual capital on firm performance among Slovak SMEs“, Proceedings of the 10th International Conference on Intellectual Capital, Knowledge Management and Organisational Learning. Reading: Academic Conferences and Publishing International Limited. ISBN 978-1-909507-80-7. pp. 329-338
Anna Pilková et al.
variability explanation of the dependent variable ROA. All variables have been divided into 3 groups: Dependent, independent and control.
5.3.1 Dependent variable
As a dependent variable reflecting performance of a firm, we have used return on assets of a company financial indicator (ROA). This indicator is calculated as the ratio of operating income to book value of the total assets of the company and it shows how profitable a company is relative to its total assets. ROA is commonly used as a key performance indicator of profitability of companies in their annual reports and it has been widely used as a measure of financial performance in earlier research (Joshi et al. 2013).
5.3.2 Independent variables
As independent variables, VAIC™ indicator as well as its components have been taken, specifically the human capital efficiency (HCE), structural capital efficiency (SCE) and capital employed efficiency (CEE) and their impact on ROA has been analyzed. VAIC™ is a coefficient, which measures how much and how efficiently intellectual capital and capital employed create value (Pulic 2004). As described earlier, it consists of three individual parts, the HCE, SCE and CEE.
Human capital efficiency coefficient (HCE) is calculated by dividing a company’s value added by its human capital to indicate in practice the real productivity of the company’s personnel, i.e. how much value the company creates through one monetary unit invested in human resources (Stahle et al. 2011). There are three groups of possible results of HCE measure. If it is given the value more than “1”, this means that the created value added must have been greater than the human resources costs. If it is given the value less than “1”, the created value added is less than the human resources costs and if the measure gives exactly the value “1”, created value added accurately equals the costs of human resources. Structural capital efficiency (SCE) measures how much capital a company can create through one monetary unit invested in value added, i.e. it measures the productivity or efficiency of value added (Stahle et al. 2011). It is given by the formula SC/VA. Since SC equals VA – HC, exactly the same input data (HC and VA) enter into this measure as into human capital efficiency component (HCE). Capital employed efficiency coefficient (CEE) is created as value added divided by net assets of the company. This metric reflects how much value the company creates relative to its capital employed, expressed by net assets as a proxy.
5.3.3 Control variables
To check the impact of other variables that may explain observed relationships with firm performance (ROA), three control variables have been included within the regression analysis: Return on equity (ROE), leverage and size of the firm.
Return on equity (ROE) is calculated as the ratio of operating income of a business to its stockholders' equity. It is a measure of profitability of stockholders' investments. Leverage of the firm is calculated as the ratio of total debt to book value of the total assets of the company. A high proportion of debt may lead a firm to primarily focus on the needs of debt holders (Williams 2000). This is not consistent with the stakeholder view assumed by value added and VAIC™ (Clarke et al. 2011). Alternatively, firms that rely heavily on debt may lack the security required to attract investors, and will likely have higher interest payments, reflecting on the riskiness and returns of he firm (Clarke et al. 2011). The size of the firm is determined as a book value of total assets. Because it may have an impact on the dependent variable (ROA), it has been used as a control variable in the regression models. In our analysis we employed a natural logarithm of this figure.
6. Results
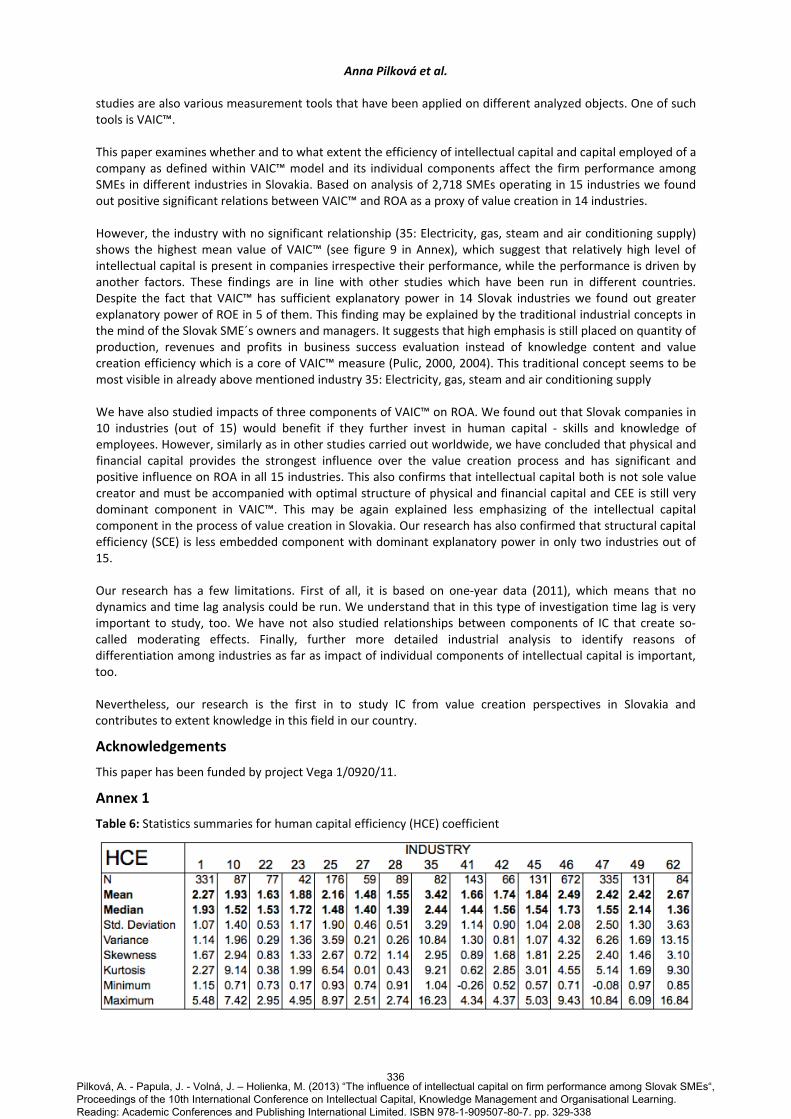
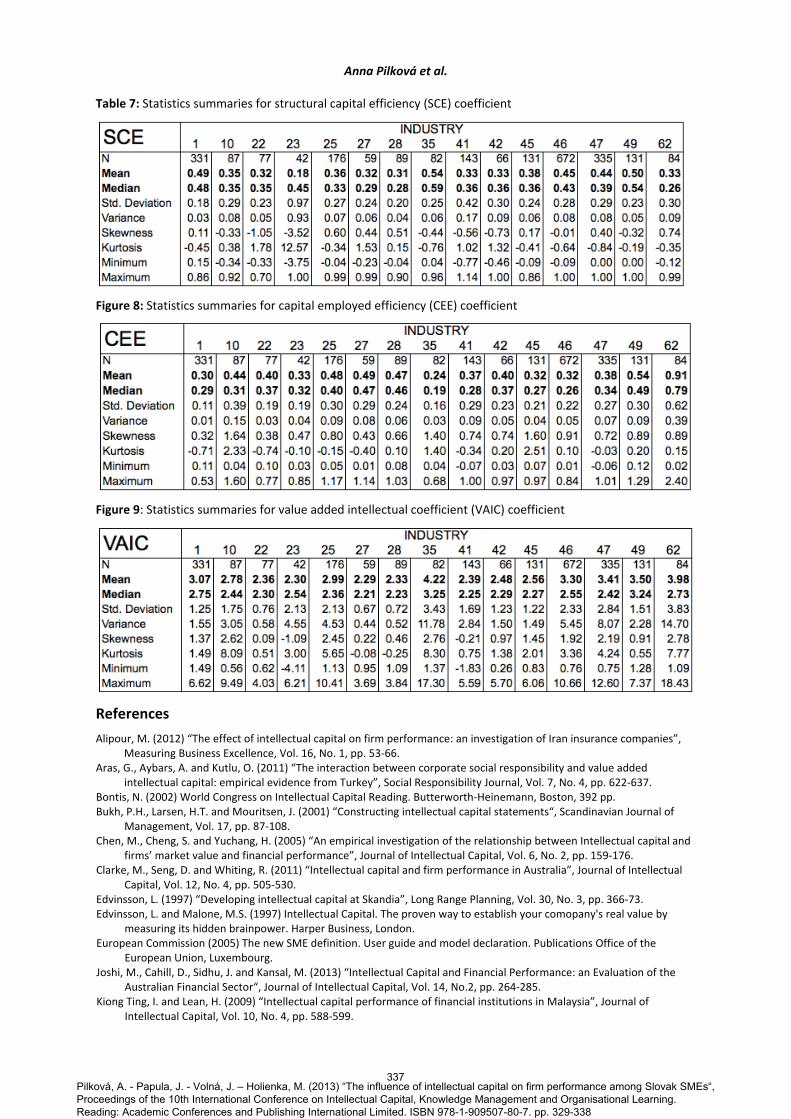
6.1 Descriptive statistics Main descriptive statistics such as mean, median, minimum, maximum, standard deviation, variance, kurtosis and skewness individually for human capital efficiency coefficient (HCE), structural capital efficiency coefficient (SCE), capital employed efficiency coefficient (CEE) and value added intellectual coefficient (VAIC) are presented in the annex of this paper.
333Pilková, A. - Papula, J. - Volná, J. – Holienka, M. (2013) “The influence of intellectual capital on firm performance among Slovak SMEs“, Proceedings of the 10th International Conference on Intellectual Capital, Knowledge Management and Organisational Learning. Reading: Academic Conferences and Publishing International Limited. ISBN 978-1-909507-80-7. pp. 329-338
Anna Pilková et al.
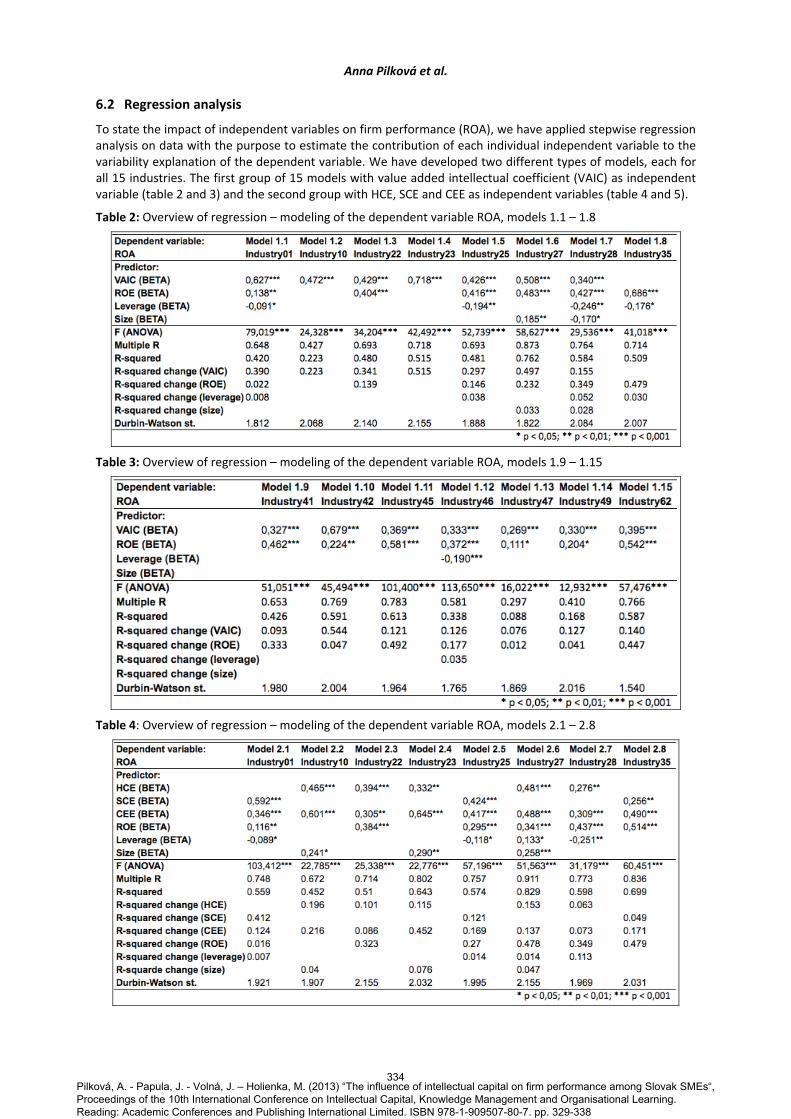
6.2 Regression analysis To state the impact of independent variables on firm performance (ROA), we have applied stepwise regression analysis on data with the purpose to estimate the contribution of each individual independent variable to the variability explanation of the dependent variable. We have developed two different types of models, each for all 15 industries. The first group of 15 models with value added intellectual coefficient (VAIC) as independent variable (table 2 and 3) and the second group with HCE, SCE and CEE as independent variables (table 4 and 5).
Table 2: Overview of regression – modeling of the dependent variable ROA, models 1.1 – 1.8
Table 3: Overview of regression – modeling of the dependent variable ROA, models 1.9 – 1.15
Table 4: Overview of regression – modeling of the dependent variable ROA, models 2.1 – 2.8
334
Pilková, A. - Papula, J. - Volná, J. – Holienka, M. (2013) “The influence of intellectual capital on firm performance among Slovak SMEs“, Proceedings of the 10th International Conference on Intellectual Capital, Knowledge Management and Organisational Learning. Reading: Academic Conferences and Publishing International Limited. ISBN 978-1-909507-80-7. pp. 329-338
Anna Pilková et al.
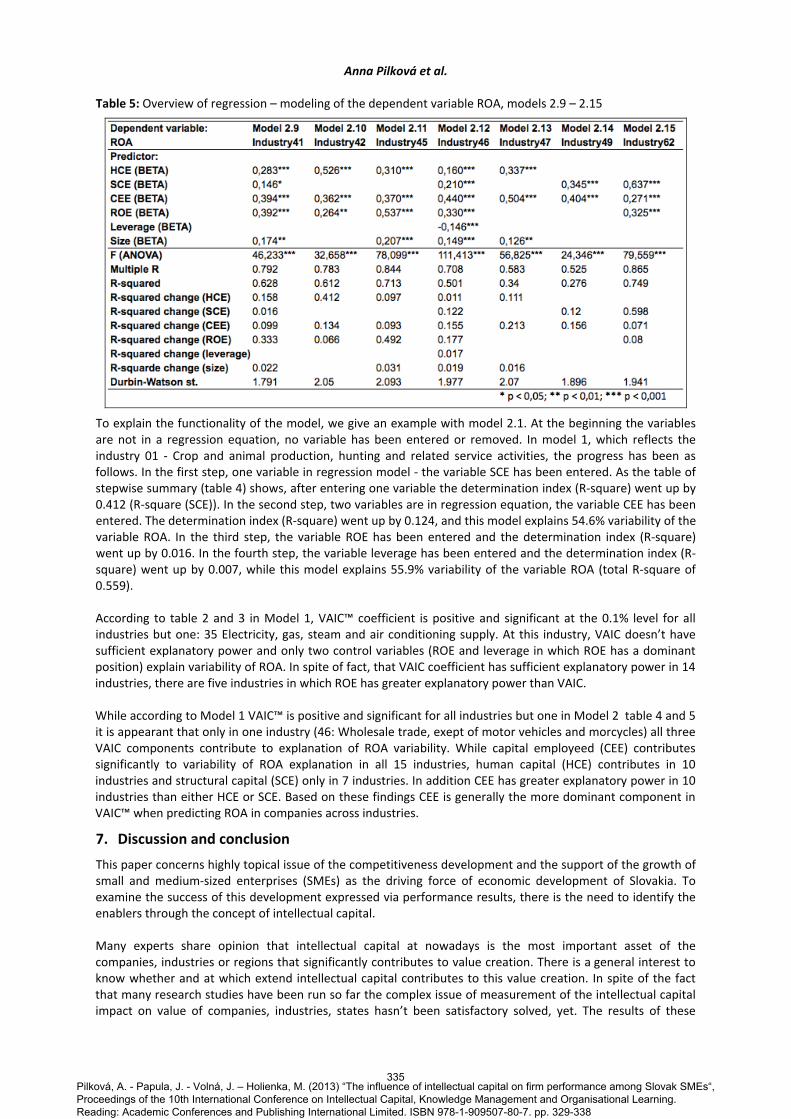
Table 5: Overview of regression – modeling of the dependent variable ROA, models 2.9 – 2.15
To explain the functionality of the model, we give an example with model 2.1. At the beginning the variables are not in a regression equation, no variable has been entered or removed. In model 1, which reflects the industry 01 ‐ Crop and animal production, hunting and related service activities, the progress has been as follows. In the first step, one variable in regression model ‐ the variable SCE has been entered. As the table of stepwise summary (table 4) shows, after entering one variable the determination index (R‐square) went up by 0.412 (R‐square (SCE)). In the second step, two variables are in regression equation, the variable CEE has been entered. The determination index (R‐square) went up by 0.124, and this model explains 54.6% variability of the variable ROA. In the third step, the variable ROE has been entered and the determination index (R‐square) went up by 0.016. In the fourth step, the variable leverage has been entered and the determination index (R‐square) went up by 0.007, while this model explains 55.9% variability of the variable ROA (total R‐square of 0.559).
According to table 2 and 3 in Model 1, VAIC™ coefficient is positive and significant at the 0.1% level for all industries but one: 35 Electricity, gas, steam and air conditioning supply. At this industry, VAIC doesn’t have sufficient explanatory power and only two control variables (ROE and leverage in which ROE has a dominant position) explain variability of ROA. In spite of fact, that VAIC coefficient has sufficient explanatory power in 14 industries, there are five industries in which ROE has greater explanatory power than VAIC.
While according to Model 1 VAIC™ is positive and significant for all industries but one in Model 2 table 4 and 5 it is appearant that only in one industry (46: Wholesale trade, exept of motor vehicles and morcycles) all three VAIC components contribute to explanation of ROA variability. While capital employeed (CEE) contributes significantly to variability of ROA explanation in all 15 industries, human capital (HCE) contributes in 10 industries and structural capital (SCE) only in 7 industries. In addition CEE has greater explanatory power in 10 industries than either HCE or SCE. Based on these findings CEE is generally the more dominant component in VAIC™ when predicting ROA in companies across industries.
7. Discussion and conclusion
This paper concerns highly topical issue of the competitiveness development and the support of the growth of small and medium‐sized enterprises (SMEs) as the driving force of economic development of Slovakia. To examine the success of this development expressed via performance results, there is the need to identify the enablers through the concept of intellectual capital.
Many experts share opinion that intellectual capital at nowadays is the most important asset of the companies, industries or regions that significantly contributes to value creation. There is a general interest to know whether and at which extend intellectual capital contributes to this value creation. In spite of the fact that many research studies have been run so far the complex issue of measurement of the intellectual capital impact on value of companies, industries, states hasn’t been satisfactory solved, yet. The results of these
335Pilková, A. - Papula, J. - Volná, J. – Holienka, M. (2013) “The influence of intellectual capital on firm performance among Slovak SMEs“, Proceedings of the 10th International Conference on Intellectual Capital, Knowledge Management and Organisational Learning. Reading: Academic Conferences and Publishing International Limited. ISBN 978-1-909507-80-7. pp. 329-338
Anna Pilková et al.
studies are also various measurement tools that have been applied on different analyzed objects. One of such tools is VAIC™. This paper examines whether and to what extent the efficiency of intellectual capital and capital employed of a company as defined within VAIC™ model and its individual components affect the firm performance among SMEs in different industries in Slovakia. Based on analysis of 2,718 SMEs operating in 15 industries we found out positive significant relations between VAIC™ and ROA as a proxy of value creation in 14 industries. However, the industry with no significant relationship (35: Electricity, gas, steam and air conditioning supply) shows the highest mean value of VAIC™ (see figure 9 in Annex), which suggest that relatively high level of intellectual capital is present in companies irrespective their performance, while the performance is driven by another factors. These findings are in line with other studies which have been run in different countries. Despite the fact that VAIC™ has sufficient explanatory power in 14 Slovak industries we found out greater explanatory power of ROE in 5 of them. This finding may be explained by the traditional industrial concepts in the mind of the Slovak SME´s owners and managers. It suggests that high emphasis is still placed on quantity of production, revenues and profits in business success evaluation instead of knowledge content and value creation efficiency which is a core of VAIC™ measure (Pulic, 2000, 2004). This traditional concept seems to be most visible in already above mentioned industry 35: Electricity, gas, steam and air conditioning supply We have also studied impacts of three components of VAIC™ on ROA. We found out that Slovak companies in 10 industries (out of 15) would benefit if they further invest in human capital ‐ skills and knowledge of employees. However, similarly as in other studies carried out worldwide, we have concluded that physical and financial capital provides the strongest influence over the value creation process and has significant and positive influence on ROA in all 15 industries. This also confirms that intellectual capital both is not sole value creator and must be accompanied with optimal structure of physical and financial capital and CEE is still very dominant component in VAIC™. This may be again explained less emphasizing of the intellectual capital component in the process of value creation in Slovakia. Our research has also confirmed that structural capital efficiency (SCE) is less embedded component with dominant explanatory power in only two industries out of 15. Our research has a few limitations. First of all, it is based on one‐year data (2011), which means that no dynamics and time lag analysis could be run. We understand that in this type of investigation time lag is very important to study, too. We have not also studied relationships between components of IC that create so‐called moderating effects. Finally, further more detailed industrial analysis to identify reasons of differentiation among industries as far as impact of individual components of intellectual capital is important, too. Nevertheless, our research is the first in to study IC from value creation perspectives in Slovakia and contributes to extent knowledge in this field in our country.
Acknowledgements
This paper has been funded by project Vega 1/0920/11.
Annex 1
Table 6: Statistics summaries for human capital efficiency (HCE) coefficient
336
Pilková, A. - Papula, J. - Volná, J. – Holienka, M. (2013) “The influence of intellectual capital on firm performance among Slovak SMEs“, Proceedings of the 10th International Conference on Intellectual Capital, Knowledge Management and Organisational Learning. Reading: Academic Conferences and Publishing International Limited. ISBN 978-1-909507-80-7. pp. 329-338
Anna Pilková et al.
Table 7: Statistics summaries for structural capital efficiency (SCE) coefficient
Figure 8: Statistics summaries for capital employed efficiency (CEE) coefficient
Figure 9: Statistics summaries for value added intellectual coefficient (VAIC) coefficient
References
Alipour, M. (2012) “The effect of intellectual capital on firm performance: an investigation of Iran insurance compaMeasuring Business Excellence, Vol. 16, No. 1, pp. 53‐66.
nies”,
and
ctual
Aras, G., Aybars, A. and Kutlu, O. (2011) “The interaction between corporate social responsibility and value added intellectual capital: empirical evidence from Turkey”, Social Responsibility Journal, Vol. 7, No. 4, pp. 622‐637.
Bontis, N. (2002) World Congress on Intellectual Capital Reading. Butterworth‐Heinemann, Boston, 392 pp. Bukh, P.H., Larsen, H.T. and Mouritsen, J. (2001) “Constructing intellectual capital statements“, Scandinavian Journal of
Management, Vol. 17, pp. 87‐108. Chen, M., Cheng, S. and Yuchang, H. (2005) “An empirical investigation of the relationship between Intellectual capital
firms’ market value and financial performance”, Journal of Intellectual Capital, Vol. 6, No. 2, pp. 159‐176. Clarke, M., Seng, D. and Whiting, R. (2011) “Intellectual capital and firm performance in Australia”, Journal of Intelle
Capital, Vol. 12, No. 4, pp. 505‐530. Edvinsson, L. (1997) “Developing intellectual capital at Skandia”, Long Range Planning, Vol. 30, No. 3, pp. 366‐73. Edvinsson, L. and Malone, M.S. (1997) Intellectual Capital. The proven way to establish your comopany's real value by
measuring its hidden brainpower. Harper Business, London. European Commission (2005) The new SME definition. User guide and model declaration. Publications Office of the
European Union, Luxembourg. Joshi, M., Cahill, D., Sidhu, J. and Kansal, M. (2013) “Intellectual Capital and Financial Performance: an Evaluation of the
Australian Financial Sector“, Journal of Intellectual Capital, Vol. 14, No.2, pp. 264‐285. Kiong Ting, I. and Lean, H. (2009) “Intellectual capital performance of financial institutions in Malaysia”, Journal of
Intellectual Capital, Vol. 10, No. 4, pp. 588‐599.
337Pilková, A. - Papula, J. - Volná, J. – Holienka, M. (2013) “The influence of intellectual capital on firm performance among Slovak SMEs“, Proceedings of the 10th International Conference on Intellectual Capital, Knowledge Management and Organisational Learning. Reading: Academic Conferences and Publishing International Limited. ISBN 978-1-909507-80-7. pp. 329-338
Anna Pilková et al.
an
tand
Koch, G., Leitner, K.H. and Bornemann, M. (2000) “Measuring and reporting intangible assets and results in a EuropeContract Research Organization”, Paper prepared for the Joint German‐OECD Conference Benchmarking Industry‐Science Relationships, Berlin, October 16‐17.
Komnenic, B. and Pokrajčić, D. (2012) “Intellectual capital and corporate performance of MNCs in Serbia”, Journal of Intellectual Capital, Vol. 13, No. 1, pp. 106‐119.
Laing, G., Dunn, J. and Hughes‐Lucas, S. (2010) “Applying the VAIC model to Australian hotels”, Journal of Intellectual Capital, Vol. 11, No. 3, pp. 269‐283.
Mavridis, D. and Kyrmizoglou, P. (2005) “Intellectual Capital Performance Drivers in the Greek Banking Sector”, Management Research News, Vol. 28, No. 5, pp. 43‐62.
MERITUM (2002) “MERITUM Guidelines for Managing and Reporting on Intangibles, Measuring Intangibles to Undersand Improve Innovation Management”, [online], InCaS. http://ec.europa.eu/research/social‐sciences/projects/073_en.html.
Mondal, A. and Ghosh, S. (2012) “Intellectual capital and financial performance of Indian banks”, Journal of IntelleCapital, Vol. 13, No. 4, pp. 515‐530.
ctual
l,
‐
,
Mouritsen, J., Bukh, P.N., Larsen, H.T. and Johansen, M.R. (2002) “Developing and managing knowledge through intellectual capital statements”, Journal of Intellectual Capital, Vol. 3, No. 1, pp. 10‐29.
Munková, D., Stranovská, E. and Ďuračková, B. (2012) “Impact of Cognitive‐Individual Variables on Process of Foreign Language Learning”, Procedia ‐ Social and Behavioral Sciences 46, 5430‐5434.
Nazari, J. and Herremans, I. (2007) “Extended VAIC model: measuring intellectual capital components”, Journal of Intellectual Capital, Vol. 8, No. 4, pp. 595‐609.
Pablos, P.O.D. (2003) “Knowledge management projects: state of the art in the Spanish manufacturing industry International”, Journal of Manufacturing Technology and Management, Vol. 14, No. 4, pp. 297‐310.
Pal, K. and Soriya, S. (2012) “IC performance of Indian pharmaceutical and textile industry”, Journal of Intellectual CapitaVol. 13, No. 1, pp. 120‐137.
Pucar, S. (2012) “The influence of intellectual capital on export performance”, Journal of Intellectual Capital, Vol. 13, No. 2, pp. 248‐261.
Pulic, A. (2004) “Intellectual capital – does it create or destroy value?”, Measuring Business Excellence, Vol. 8, No. 1, pp. 6268.
Stähle, P., Stähle, S. and Aho, S. (2011) “Value added intellectual coefficient (VAIC): a critical analysis”, Journal of Intellectual Capital, Vol. 12, No. 4, pp. 531‐551.
Stewart, T. (1998) Intellectual Capital Nicholas Brealey Publishing, London. Sveiby, K. E. (1997) The New Organizational Wealth: Managing and Measuring Knowledge‐based Assets. Barrett‐Kohler
San Francisco. Sveiby, K.E. (2005) “Methods for measuring intangible assets”, [online].
www.sveiby.com/Portals/0/articles/IntangibleMethods.htm. Volkov, A. (2012) “Value Added Intellectual Co‐efficient (VAIC): A Selective Thematic‐Bibliography”, Journal New Busine
Ideas and Trends, Vol. 10, No. 1, pp. 14‐24. ss
l Williams, M. (2000) “The Association between Gender and Ethnic Diversity of Board Structure on the Intellectual CapitaPerformance of Publicly Listed Companies from an Emerging Economy: Evidence from South Africa”, [online]. www.vaic–on.net/download/Paper3.pdf.
338Pilková, A. - Papula, J. - Volná, J. – Holienka, M. (2013) “The influence of intellectual capital on firm performance among Slovak SMEs“, Proceedings of the 10th International Conference on Intellectual Capital, Knowledge Management and Organisational Learning. Reading: Academic Conferences and Publishing International Limited. ISBN 978-1-909507-80-7. pp. 329-338