Support of the SMEs within the cross-border cooperation between the Slovak Republic and Ukraine
Upload
independentCategory
view
4download
0
ELSEVIER Journal of Geochemical Exploration 66 (1999) 151–158www.elsevier.com/locate/jgeoexp
Environmental–geochemical mapping program in the Slovak Republic
Stanislav Rapant a,Ł, Maria Raposova b, Dusan Bodis a, Karol Marsina a, Igor Slaninka a
a Geological Survey of the Slovak Republic, Mylnska dolina c. 1, 81704 Bratislava, Slovakiab Ministry of the Environment of the Slovak Republic, Section of Geology and Natural Resources, Nam. L., Stura 1,
35812 Bratislava, Slovakia
Accepted 6 April 1999
Abstract
The paper presents a review of environmental–geochemical mapping of the Slovak Republic. The project ‘GeochemicalAtlas of the Slovak Republic’ (implemented at the beginning of 1991), comprises completed (or nearly completed)geochemical atlases of groundwater, soils, stream sediments, forest biomass, rocks and natural radioactivity of the SlovakRepublic at a scale of 1 : 1,000,000. These serve as background for environmental–geochemical mapping in selectedregions at a scale of 1 : 50,000 which is now in progress (for water, soil, sediment and rock). In order to allow forcompatibility between individual regions, methodological guidelines were developed (as required for all studies funded bythe Ministry of the Environment of the Slovak Republic). 1999 Elsevier Science B.V. All rights reserved.
Keywords: environmental–geochemical maps; Geochemical Atlas; Slovakia
1. Introduction
Slovakia is one of those countries in which theextensive and ecologically uncontrolled industrialand agricultural production during the last decadeshas resulted in enormous contamination of the en-vironment by chemical compounds. Since 1990, thenational approach to preserve the environment led toa reorientation of geological projects funded by thegovernment. Today, nearly half of these funds areallocated to ecologically oriented projects.
Regional environmental–geochemical mappinghas been carried out to determine the scale and natureof chemical contaminants. The project entitled ‘In-vestigation of geological factors of the Environment’(Vrana, 1992), begun in 1991 represents the begin-
Ł Corresponding author. E-mail: [email protected]
ning of modern environmental–geochemical map-ping of the Slovak Republic; this has yielded thefirst geochemical atlases (groundwater, rocks, forestbiomass) and the basic methods to assess and portrayindividual components of the environment (Fig. 1).
The main objective is to assess primary andsecondary contents of elements and compounds inrocks, soils, stream sediments and waters (ground-and surface waters). Organic contaminants are alsomonitored regionally, but to a lesser degree, as sepa-rate components of the environment.
2. Geochemical atlas
The initial objective of the Geochemical Atlasproject was to construct national monoelementalmaps at a scale of 1 : 1,000,000 and to create in-
0375-6742/99/$ – see front matter 1999 Elsevier Science B.V. All rights reserved.PII: S 0 3 7 5 - 6 7 4 2 ( 9 9 ) 0 0 0 3 7 - 0

152 S. Rapant et al. / Journal of Geochemical Exploration 66 (1999) 151–158
14
13
12
11
10
987
6
5
2
117
15
43
16
HUNGARY
UK
RA
INE
POLAND
CZECH REPUBLIC
I II
AU
ST
RIA
Fig. 1. Review of mapped regions: I D regions compiled in 1991–93; 1 D Horna Nitra, 2 D Nızke Tatry Mts., 3 D Hornadska kotlinadepression and eastern part of Slovenske rudohorie Ore Mountains, 4 D Kosicka kotlina depression and Slanske vrchy Mts., 5 D Ziarskakotlina depression and Banska Stiavnica area, 6 D Mala Fatra Mts. and some adjoining depressions, I D) Vel’ka Bratislava urban area(1 : 25,000); II D regions under study; 8 D Galanta District, 9 D northeastern part of Levice District, 10 D Central Povazie, 11 D Kysucadrainage system, 12 D Banska Bystrica–Zvolen, 13 D Vysoke Tatry Mts.–Ruzomberok–Liptovsky Mikulas, 14 D Jelsava–Lubenık–Hnust’a, 15D Slana drainage area, 16 D Kosice urban area (1 : 25,000), 17 D Tibreg.
teractive databases for groundwaters, soils, streamsediments, forest biomass and natural radioactivity.The first product was the ‘Map of LithogeochemicalRock Types’, 1 : 500,000, including the catalogueof chemical analyses of the main rock types. Thegeneral characteristics of the atlas and completedsections are given in Table 1.
New interactive geochemical databases for the
Table 1General characteristics of individual parts of the Geochemical Atlas of the Slovak Republic a
Media Sampling density Number of samples Note Institution
Groundwater 1 sample=3 km2 16,359 Springs, wells drillholes adits Geol. Surv. Slovak Rep.Stream sediments 1 sample=2 km2 24,422 Active stream sediments <0.125 mm Geol. Surv. Slovak Rep.Rocks Irregular grid 3,839 ‘main rock types’ Geol. Surv. Slovak Rep.Soils 1 profile=10 km2 9,892 1 profile D 2 samples (A and C horizons) Soil Fertility Research Inst.,
BratislavaForest biomass 1 sample=16 km2 3,063 Composite sample Forest Research Inst., ZvolenRadioactivity 1 point=10 km2 4,900 – Total natural radioactivity URANPRES Ltd., Spisska,
Nova Ves(points recorded) – Individual components of natural
radioactivity, K, U, Th, Rn
a The following maps have been published to date (generally in Slovak and English): Groundwater (Rapant et al., 1997); ForestBiomass (Mankovska, 1997); Natural Radioactivity (Daniel et al., 1997); abbreviated version of the lithochemistry (Marsina et al., 1997);preliminary results of soil geochemistry (Curlık and Sefcık, 1997). The following are presently being prepared for publication: Soilsgeochemistry; Stream sediment geochemistry. All compilations are carried out based on the International Geological Correlation Program— IGCP project 259 (Darnley et al., 1995).
most important components of the environment wereprepared and allow detailed follow-up studies.
3. Environmental–geochemical maps
Environmental–geochemical mapping of selectedareas of the Slovak Republic (1 : 50,000, and
S. Rapant et al. / Journal of Geochemical Exploration 66 (1999) 151–158 153
Svinianka
526Polonec
501
466
489
Breznik
Vrchy
510
Bukovec612
672
482
518Borgy
PORÚBKA
TURIE
VIŠÒOVÉ
LIETAVSKÁ LÚÈKA
0 0.5 1 2km
NO2
NO2
NO2
Al, NO 3
SO , NO4 3
SO4
Fig. 2. Map of Natural Water Quality (segment). Shades of grey represent defined water types: O � 1 D sample collection sites; rasterrepresents genetic types of groundwaters; NO3, Al, NH4, SO4: elements exceeding upper permissible limits.
Fig. 3. Stream Sediment Geochemistry Map (segment). Multi-element map; shades of grey represent areas of excessive contents ofindividual elements. White represents non-contaminated areas.
154 S. Rapant et al. / Journal of Geochemical Exploration 66 (1999) 151–158
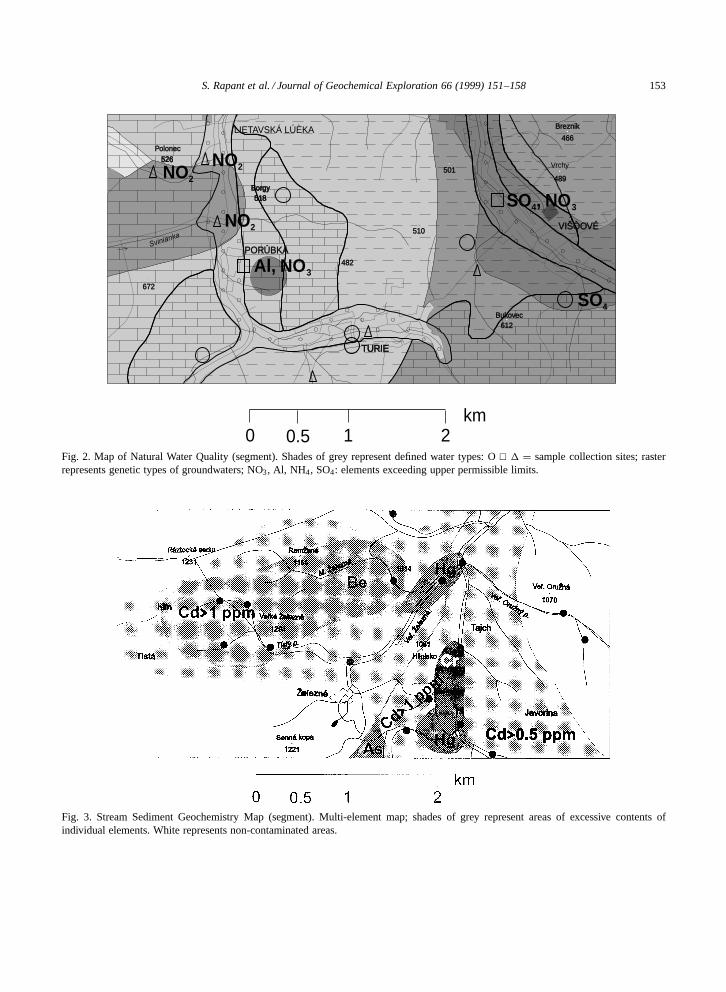
Fig. 4. Map of Geochemical Rock Types (segment). Shades of grey represent geochemically defined rock types. Raster shows genetictype (magmatic, metamorphic, sedimentary, etc.) and aggregate type (fine, coarse-grained, breccias, etc.) of rocks. Representation of twodifferent rock types (e.g., claystones, sandstones) is shown as oblique bands.
Fig. 5. Map of the Groundwater Contamination Degree .Cd/, Slovak Republic.
1 : 25,000 in urban areas) is being carried out. Thesefocus on sediments, soils, waters (ground-, surface,precipitation) and rocks. Parallel studies include hy-drogeological, engineering-geological, pedological
and natural radioactivity maps. Maps of six Slovakregions and of the Bratislava area were completedby 1993, and work in ten other regions is now inprogress.

S. Rapant et al. / Journal of Geochemical Exploration 66 (1999) 151–158 155
Al
3T
1T
Al
CdCd
1T
Se
2Pg
Al
Al
Se
Al
As
As
5T1T
0 0.5 1 2km
Fig. 6. Map of Areas with Contaminated Groundwater (segment). Shades represent the regions of groundwater contamination (darker Dhigher contamination). The contaminating elements are marked (Al, Cd, Se, etc.). Geological age of an aquifer is shown as a symbol (PgD Paleogene, D crystalline rocks). Rasters represent type of aquifer permeability. Numbers show degree of water-bearing aquifers (1D very high, 2 D high : : : ; 5 D area without aquifers).
T2
Q3
Pg4
44
48 12
Bukovec
612
466
501
Stráòavy
Polom
Hoblík
933
828
Valentinov diel
Trnovka
Trnovka
0 0.5 1 2km
Fig. 7. Map of Chemical Time Bombs (segment). Shades represent critical areas, plotted on the basis of potential CTB sources(contaminated water, sediment, both). Squares represent critical CTB sites. Square sizes show the degree of toxicity and grey tone showspotential of spreading into the environment. Description of the rock environment as in Fig. 6.

156 S. Rapant et al. / Journal of Geochemical Exploration 66 (1999) 151–158
The following maps are standard for each area:natural water quality; stream sediments; lithochem-istry; pedogeochemistry. In certain cases, and if nec-essary, the following maps are also prepared: snowgeochemistry (urban areas); time bomb maps; con-taminated areas; degree of contamination; criticalloads. The environmental–geochemical maps showall environmentally significant anomalies (positiveand negative) of both anthropogenic and natural ori-gin, based on national standards. Regional featuresare shown as areal anomalies and individual pollu-tion sites are shown as anomalous points.
The number of elements monitored for the geo-chemical mapping usually ranges between 25 and30, and at times more. The data are assembled eitherinto separate toxicity, or related geochemical prop-erty groups, in which case the elements are groupedon the maps (e.g., natural water quality; Rapant andBodis, 1995a; Fig. 2), or a method is applied tovisualize anomalous contents as intersections of sub-sets of monoelemental anomalies, shown as a colourfor one subset, and as a contour for another subset(e.g., stream sediment geochemistry map, Bodis and
Fig. 8. Critical Acidity Loads, Slovak Republic (receptor: groundwater).
Rapant, 1995; Fig. 3). For lithochemical maps (e.g.,Marsina and Lexa, 1995; Fig. 4), average chemicalcontents are used.
The contamination degree Cd (Rapant et al., 1997)is used to determine excessive values of monitoredelements, and is determined as follows:
Cd DiD1X
n
Cf;i
where
Cf;i D CA;i
CN;i� 1
Cf;i D contamination factor for the i-th component,CA;i D analytical value of the i-th element (com-ponent), CN;i D upper permissible limits (normativevalues).
The norms for upper permissible limits in theSlovak Republic are based on the following:
(a) Surface Water: STN 75 7221; classification ofsurface water quality
(b) Groundwater: STN 75 7111; water quality,drinking water

S. Rapant et al. / Journal of Geochemical Exploration 66 (1999) 151–158 157
Fig. 9. Acidity of snowpack, Slovak Republic (mean contents after 20 years of monitoring, 1977–1996).
(c) Soils and Sediments: Law No. 307=1994;limiting values of hazardous compounds in soil.
Elements below the detection limit are not takeninto consideration. The contamination degree can bedisplayed either through mathematical interpolationand smoothing (Rapant et al., 1997; Fig. 5), or byassembling areas of equal contamination degree intoanomalous zones by the author of the map (3–4 de-gree Cd scale is used) (e.g., Backman et al., 1998;Fig. 6). Chemical Time Bombs (CTB) maps showseveral environmental components including anoma-lies in groundwaters, surface waters and stream sed-iments, together with point sources (landfills), and‘hot spots’ (Rapant and Bodis, 1995b; Fig. 7).
Mapping of critical loads was carried out in co-operation with the Norwegian Institute for WaterResearch (NIVA), using the method of Henrikson etal. (1992) for surface and groundwater. The calcu-lated critical loads reflect, in practice, the conditionsin which the chemical composition of water devel-oped, especially the geological setting and the hy-drodynamic conditions of circulation. Locally highersensitivity results from the outflow from mine worksand secondary sources of contamination (Bodis etal., 1995; Fig. 8). Mapping the chemical composi-tion of snow cover has been carried out since 1977(Gazda and Lopasovsky, 1983; Rapant et al., 1997;Fig. 9).
References
Backman, B., Bodis, D., Lahermo, P., Rapant, S., Tarvainen, T.,1998. Application of a groundwater contamination index inFinland and Slovakia. Environ. Geol. 36 (12), 55–64.
Bodis, D., Rapant, S., 1995. Methods of compiling streamsediment geochemical map at a scale of 1 : 50,000. GUDS,Bratislava, 15 pp. (in Slovak).
Bodis, D., Babiakova, G., Rapant, S., Roncak, P., Zavodsky,D., 1995. Mapping critical loads: natural waters of Slovakia.Slovak Geol. Mag. 1-95, 71–76.
Curlık, J., Sefcık, P., 1997. Geochemical Atlas of the SlovakRepublic, Soils. Slovak Geol. Mag. 1-97, 37–52.
Daniel, J., Luciviansky, L., Sterz, M., 1997. Geochemical Atlasof the Slovak Republic, Natural Radioactivity. Geol. Surv.Slovak Republic, 86 pp.
Darnley, A.G., Bjorklund, A., Bolviken, B., Gustavsson, N., Ko-val, P.V., Plant, J.A., Steenfelt, A., Tauchid, M., Xie Xuejing,1995. A global geochemical database for environmental andresource management. Earth Science 19, UNESCO, 122 pp.
Gazda, S., Lopasovsky, K., 1983. Chemical composition ofwinter precipitation of Slovakia (in Slovak). In: Hydrogeo-chemical Problems of Natural Water Contamination. GUDS,Bratislava, pp. 63–71.
Henrikson, A., Kamari, J., Posch, M., Wilander, A., 1992. Criti-cal loads of acidity: Nordic Surface Waters. Ambio 21, 356–363.
Mankovska, B., 1997. Geochemical Atlas of the Slovak Repub-lic, Forest Biomass. Geol. Surv. Slovak Republic, 87 pp.
Marsina, K., Lexa, J., 1995. Methods of compiling lithogeochem-ical map at a scale 1 : 50,000 (in Slovak). GUDS, Bratislava,16 pp.
Marsina, K., Kohut, M., Lexa, J., Vozarova, A., Janak, M., 1997.

158 S. Rapant et al. / Journal of Geochemical Exploration 66 (1999) 151–158
Geochemical Atlas of the Slovak Republic, Rocks. SlovakGeol. Mag. 1-97, 27–36.
Rapant, S., Bodis, D., 1995a. Methods of compiling of naturalwater quality map at a scale 1 : 50,000 (in Slovak). GUDS,Bratislava, 16 pp.
Rapant, S., Bodis, D., 1995b. Chemical time bombs — proposedmethod for map presentation. Slovak Geol. Mag. 1-95, 65–69.
Rapant, S., Vrana, K., Bodis, D. 1997. Geochemical Atlas of theSlovak Republic, Groundwater. Geol. Surv. Slovak Republic,127 pp.
Vrana, K., 1992. Investigation of the geofactors of the envi-ronment — a perspective programme of Slovak geology (inSlovak). Miner. Slov. 24, 441–451.
Copyright © 2022 FDOKUMEN


![Od Abraháma k ABRAHÁMOVINÁM // From Abraham to Slovak ABRAHÁMOVINY ‘50th birthday’ [in Slovak]](https://static.fdokumen.com/doc/165x107/63208d6f069357aa45063fd4/od-abrahama-k-abrahamovinam-from-abraham-to-slovak-abrahamoviny-50th-birthday.jpg)