republic of turkey
170
REPUBLIC OF TURKEY ERCIYES UNIVERSITY GRADUATE SCHOOL OF NATURAL AND APPLIED SCIENCES DEPARTMENT OF AGRICULTURAL SCIENCE AND TECHNOLOGIES INTERACTIONS BETWEEN CLIMATE CHANGE AND PADDY PRODUCTION AND ITS IMPACTS ON RURAL DEVELOPMENT IN IRAQ Prepared By Jawad Hassan HUMAIDY Supervisor Prof. Dr. Zeki GÖKALP Ph. D. Thesis July 2019 KAYSERİ
-
Upload
khangminh22 -
Category
Documents
-
view
0 -
download
0
Transcript of republic of turkey
REPUBLIC OF TURKEY
ERCIYES UNIVERSITY
GRADUATE SCHOOL OF NATURAL AND APPLIED
SCIENCES
DEPARTMENT OF AGRICULTURAL SCIENCE AND
TECHNOLOGIES
INTERACTIONS BETWEEN CLIMATE CHANGE AND
PADDY PRODUCTION AND ITS IMPACTS ON RURAL
DEVELOPMENT IN IRAQ
Prepared By
Jawad Hassan HUMAIDY
Supervisor
Prof. Dr. Zeki GÖKALP
Ph. D. Thesis
July 2019
KAYSERİ

REPUBLIC OF TURKEY
ERCIYES UNIVERSITY
GRADUATE SCHOOL OF NATURAL AND APPLIED
SCIENCES
DEPARTMENT OF AGRICULTURAL SCIENCE AND
TECHNOLOGIES
INTERACTIONS BETWEEN CLIMATE CHANGE AND
PADDY PRODUCTION AND ITS IMPACTS ON RURAL
DEVELOPMENT IN IRAQ
(Ph.D. Thesis)
Prepared By
Jawad Hassan HUMAIDY
Supervisor
Prof. Dr. Zeki GÖKALP
July 2019
KAYSERİ

iv
ACKNOWLEDGMENTS
Doing a Ph.D. was one of my dreams since when I was a kid and getting to do so is
such a rewarding experience. This incredible experience could not have been completed
without the support of many people who I am in debt.
First, all praises belong to Allah, The Most Gracious and Most Merciful, for His
blessings that enabled me to accomplish this dissertation.
Second, the accomplishment of this thesis would not have been possible without the
assistance of many people, who have supported me throughout my academic years.
And, this study is a product of many hands that directly and indirectly pushed me to gait
the next steps. It is my pleasure to express my gratitude to individuals for their help and
support.
Above all, I would like to thank my supervisor, Assoc. Prof. Dr. Zeki GÖKALP for
his human and professional quality, his patience, his time, his knowledge; the fact
that his door was always open, and he was willing to discuss any issues that I
encountered. I’ve learned a lot from him not only in the professional but in the
personal levels, his guidance and thoughts have encouraged me to complete and
consolidate the presented work.
He has turned my education into a unique and joyful experience.
Without his guidance, support and encouragement; this study could not have been
established.
He was like a star in my sky, make them my leading point, I am very grateful to him.
My wife (Um Ahmed); she smiles in my face while she is facing death back home,
she mighty faces.
Parliamentarian Zeinab Al-Tai; she has assisted me during my study period.
Turkey: the country, who believes in me and gives me a big chance.
Erciyes University: the place that supports me and gave me a big chance too, I love
it a lot.
The dean of the faculty of Agriculture science and technology, Professor Mehmet
Arsalan, Dr. Mehmet Ulas and all the faculty staff: who can forget him never?

v
The staff of Agriculture extension center in Al Muthanna, Thi Qar, and Al
Qadisiyah; has assisted me during my research work.
My friends in Iraq and in Turkey, who give me a motivation to go, feed me with
love.
For all this and more give with love my efforts.
Jawad Hassan HUMAIDY
Kayseri, July 2019
vi
INTERACTIONS BETWEEN CLIMATE CHANGE AND PADDY
PRODUCTION AND ITS IMPACTS ON RURAL DEVELOPMENT IN IRAQ
Jawad Hassan HUMAIDY
Erciyes University, Graduate School of Natural and Applied Sciences
Ph.D. Thesis, July 2019
Supervisor: Assoc. Prof. Dr. Zeki GÖKALP
ABSTRACT
Climate change is inevitable and will continue into the next century. Since the
agricultural sector in Iraq is most vulnerable to climate change, a thorough
understanding of adaptive measures is important for formulating effective policy
decisions. This study provides an overview of the status of climate change and
adaptation in the paddy sector and its impacts on rural development in four Districts (Al
Najaf, Al Qadisiyah, Al Muthanna and Thi Qar) for the period 1966-2015 in South of
Iraq. First, the study relies on descriptive statistics and maps to explore the long-term
changes at both country and local level in climatic variables such as temperature,
rainfall, and humidity. Second, it uses regression models to estimate the impact of
climate change on Iraq paddy productivity. The primary data used in this study were
collected through structured questionnaires administered to 223 randomly selected rice
farmers and the secondary data were collected from the official organizations of Iraq.
Statistical analyses revealed increasing average yearly minimum and maximum
temperatures and decreasing total yearly rainfall in time. This scenario explicitly
indicates how Iraqi agriculture (especially paddy production) and irrigation sectors are
suffering from the scarcity of rainfall and rising in temperatures because of Iraqi
agriculture and irrigation systems largely dependent on these two factors. The findings
also revealed that increasing temperatures and decreasing precipitations had significant
correlations with the outcomes of two primary water resources of Iraq (Tigris and
Euphrates). Then, excessive water scarcity in two main rivers had adverse effects on
rice yield of the study area. It was concluded that Iraqi government should take some
initiatives to mitigate the negative effects of climate change on paddy yields. Iraqi
government should give more interests on policy formulation and to find out the ways
of adaptation and mitigation of adverse effects of climate change. Strong emphasis
should be given on redesign of the water management plan, introducing suitable
cropping pattern and varieties, developing awareness among the farmers and

vii
strengthening the agricultural research and extension systems to lessen the detrimental
effects of climate change as well as to ensure the sustainable agricultural development
of Iraq.
Keywords: Climate change, Adaptation, Paddy production, rural development,
Irrigation water scarcity, Rural economic.
viii
İKLİM DEĞİŞİKLİĞİNİN ÇELTİK ÜRETİMİ İLE ETKİLEŞİMİ VE IRAK
KIRSAL KALKINMASI ÜZERİNE ETKİLERİ
Jawad Hassan HUMAIDY
Fen Bilimleri Enstitüsü
Tarım Bilimleri ve Teknolojileri Anabilim Dalı
Doktora Tezi, Temmuz 2019
Danışman: Doç. Dr. Zeki GÖKALP
ÖZET
İklim değişikliği kaçınılmaz bir olgu olup önümüzdeki yüzyılda da devam etmesi
beklenmektedir. Tarım sektörü iklim değişikliğine karşı en hassas sektör olduğundan
etkin bir politika geliştirebilmek için iklim değişikliğine adaptasyona yönelik önlemler
büyük önem arz etmektedir. Bu çalışmada 1966-2015 periyodunda Irak’ın dört farklı
bölgesinde (Al Najaf, Al Qadisiyah, Al Muthanna ve Thi Qar) iklim değişikliğinin
mevcut durumu analiz edilmiş ve çeltik sektörü ve buna bağlı olarak da kırsal kalkınma
üzerine etkileri değerlendirilmiştir. Çalışma öncelikli olarak sıcaklık, yağış ve nem gibi
ilklim parametrelerinde yerel ve ulusal düzeyde uzun vadede gözlenen değişimleri
tanımlayıcı istatistikler ve haritalar ile analiz etmekte, ikinci aşamada ise belirlenen
bölgelerde çeltik tarımı ve kırsal kalkınma üzerine etkilerini regresyon modelleri ortaya
koymaktadır. Araştırmada kullanılan veriler tesadüfi örnekleme ile seçilmiş 223 çeltik
üreticisi ile yüz-yüze görüşmelerle gerçekleştirilen anket çalışması ve Irak resmi
makamları ile yapılan görüşmeler ile elde edilmiştir. İstatistiksel analizler söz konusu
periyot boyunca yıllık minimum ve maksimum sıcaklıkların arttığını ve yıllık toplam
yağışın azaldığını işaret etmiştir. Mevcut senaryo Irak tarımının (özellikle de çeltik
üretiminin) ve sulama sektörünün yağış azlığı ve artan sıcaklardan ne denli etkilindigini
olduğunu ortaya koymaktadır çünkü Irak tarımı ve sulama sistemleri tümüyle bu iki
faktöre bağlıdır. Mevcut bulgular artan sıcaklık ve azalan yağışların bölgenin iki temel
su kaynağının (Dicle ve Fırat) verimleri ile de önemli ilişkiler sergilediğini ortaya
koymaktadır. Bu iki nehirde yaşanan su kısıtı çalışma alanı çeltik verimleri üzerine de
olumsuz etkiler sergilemektedir. Tüm hususlar göz önünde bulundurulduğunda, Irak
hükümetinin girişimde bulunup iklim değişikliğinin olumsuz etkilerini hafifletici
tedbirler alması gerektiği aşikardır. Irak hükümeti bu konuda polika oluşturmaya
özellikle özen gösterip iklim değişikliğine adaptasyon ve olumsuz etkilerini hafifletici
tedbirler üzerine odaklanmalıdır. Özellikle su kaynakları yönetimi ve bitki deseni

ix
üzerinde durulup çiftçiler arasında bir bilinç uyandırmak için yayım servislerini
güçlendirirek iklim değişikliğinin olumsuz etkilerini hafifletme ve sürdürülebilir bir
tarımsal gelişme sağlanması gerektiği aşikardır.
Anahtar Kelimeler: İklim değişikliği, Adaptasyon, Çeltik üretimi, kırsal kalkınma,
Sulama suyu kısıtı, Kırsal ekonomi
x
CONTENTS
INTERACTIONS BETWEEN CLIMATE CHANGE AND PADDY
PRODUCTION AND ITS IMPACTS ON RURAL DEVELOPMENT IN IRAQ
SCIENTIFIC ETHICS SUITABILITY ............................................................................. i
SUITABILITY FOR GUIDE............................................................................................ ii
ACCEPTANCE AND APPROVAL PAGE .................................................................... iii
ACKNOWLEDGMENTS ............................................................................................... iv
ABSTRACT ..................................................................................................................... vi
ÖZET ............................................................................................................................. viii
CONTENTS ...................................................................................................................... x
ABBREVIATIONS ....................................................................................................... xiii
LIST OF TABLES .......................................................................................................... xv
LIST OF FIGURES ..................................................................................................... xviii
INTRODUCTION ........................................................................................................... 1
CHAPTER ONE
LITERATURE REVIEW
1.1. Effects of Climate Changes ..................................................................................... 6
1.1.1. Effects of Climate change on Water Resource .............................................. 9
1.1.2. Effects of Climate change on Agriculture .................................................... 10
1.1.2.1. Climate Change Effect on Crop Yields ................................................. 11
1.1.2.2. Impacts on Rice Production ................................................................... 12
1.1.3. Effects of Climate Change on Rural Population ......................................... 15
1.2. Impacts of Water Resources, Agriculture and Paddy Production on Rural
Development ........................................................................................................... 17
1.2.1. Effects of Water Resources on Rural Development .................................... 17
1.2.2. Effects of Agriculture on Rural Development ............................................. 19
1.2.3. The Paddy production and Rural Development .......................................... 20
xi
1.3. Background of the Study ....................................................................................... 21
1.3.1. Agriculture Sector in Iraq ............................................................................. 24
1.3.2. Agro-Climate Zones in Iraq .......................................................................... 27
1.3.3. Surface Water Resources and Irrigation in Iraq ........................................ 29
1.3.4. Iraqi Population .............................................................................................. 29
CHAPTER TWO
MATERIALS AND METHODS
2.1. Research Design ..................................................................................................... 31
2.2. Description of the Research Site ........................................................................... 33
2.3. Sources of Data collection ...................................................................................... 35
2.4. Questionnaire Survey on Interaction of Climate change with Paddy farming
in Rural areas of the Research Sites ..................................................................... 37
2.5. Validity and Reliability .......................................................................................... 38
2.6. Limitations and Challenges to the Study ............................................................. 38
2.7. Statistical Analysis ................................................................................................. 39
CHAPTER THREE
RESULTS AND DISCUSSION
3.1. Extreme Precipitation Trends and Indices of Temperature for Study Areas .. 40
3.2. Rainfall in Iraq ....................................................................................................... 40
3.3. The Temperature in Iraq ...................................................................................... 49
3.4. Relative Humidity .................................................................................................. 65
3.5. Production of Paddy in Different Agronomic and Climate Scenarios for
the Study Area ....................................................................................................... 74
3.6. River Water Availability for Irrigation and Water Resource in Iraq .............. 89
3.7. Data Analysis .......................................................................................................... 92
3.8. Analysis of Questionnaire Responses ................................................................... 99
xii
CHAPTER FOUR
CONCLUSION AND RECOMMENDATIONS
4.1. Conclusion............................................................................................................. 123
4.2. Recommendations ................................................................................................ 127
REFERENCES ............................................................................................................ 130
APPENDIX .................................................................................................................. 136
CURRICULUM VITAE ............................................................................................. 147
xiii
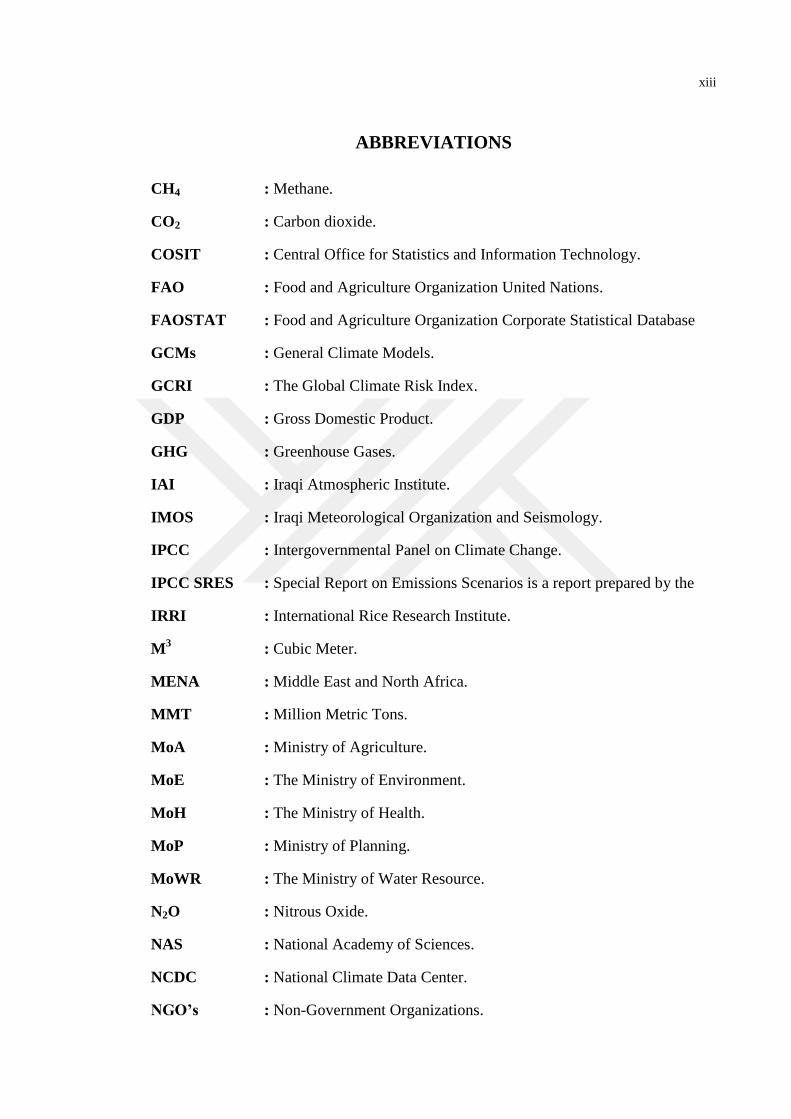
ABBREVIATIONS
CH4 : Methane.
CO2 : Carbon dioxide.
COSIT : Central Office for Statistics and Information Technology.
FAO : Food and Agriculture Organization United Nations.
FAOSTAT : Food and Agriculture Organization Corporate Statistical Database
GCMs : General Climate Models.
GCRI : The Global Climate Risk Index.
GDP : Gross Domestic Product.
GHG : Greenhouse Gases.
IAI : Iraqi Atmospheric Institute.
IMOS : Iraqi Meteorological Organization and Seismology.
IPCC : Intergovernmental Panel on Climate Change.
IPCC SRES : Special Report on Emissions Scenarios is a report prepared by the
IRRI : International Rice Research Institute.
M3 : Cubic Meter.
MENA : Middle East and North Africa.
MMT : Million Metric Tons.
MoA : Ministry of Agriculture.
MoE : The Ministry of Environment.
MoH : The Ministry of Health.
MoP : Ministry of Planning.
MoWR : The Ministry of Water Resource.
N2O : Nitrous Oxide.
NAS : National Academy of Sciences.
NCDC : National Climate Data Center.
NGO’s : Non-Government Organizations.
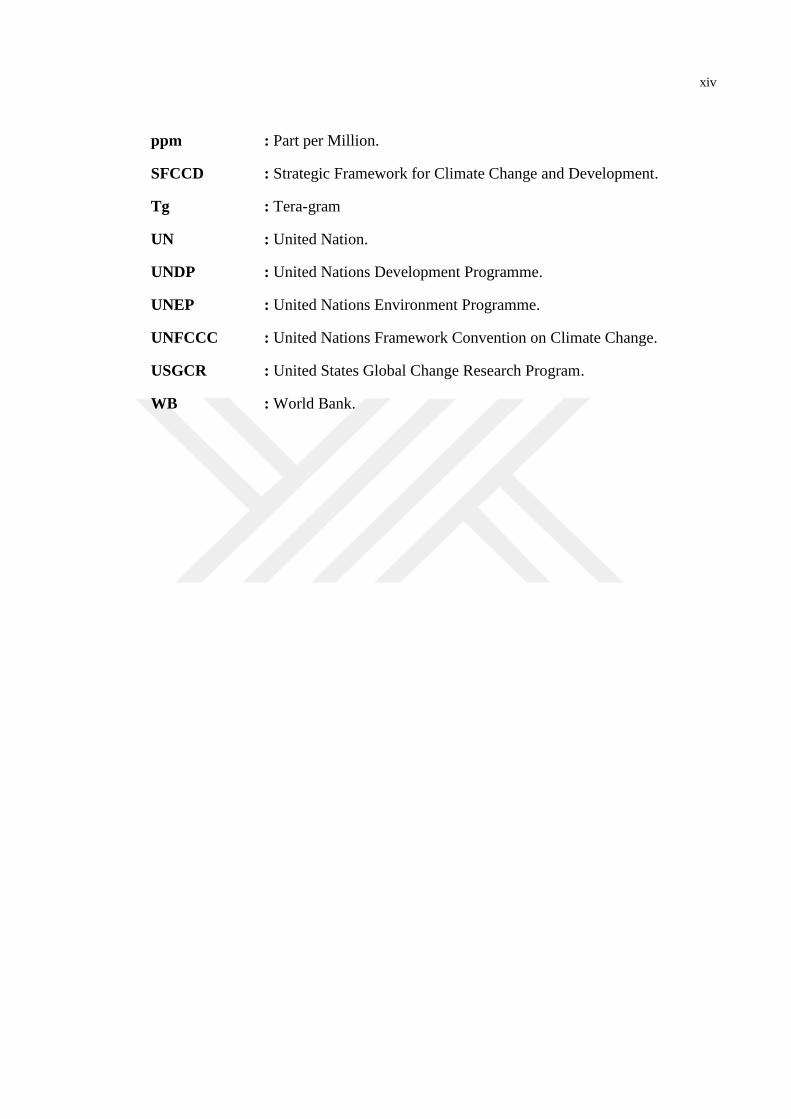
xiv
ppm : Part per Million.
SFCCD : Strategic Framework for Climate Change and Development.
Tg : Tera-gram
UN : United Nation.
UNDP : United Nations Development Programme.
UNEP : United Nations Environment Programme.
UNFCCC : United Nations Framework Convention on Climate Change.
USGCR : United States Global Change Research Program.
WB : World Bank.
xv
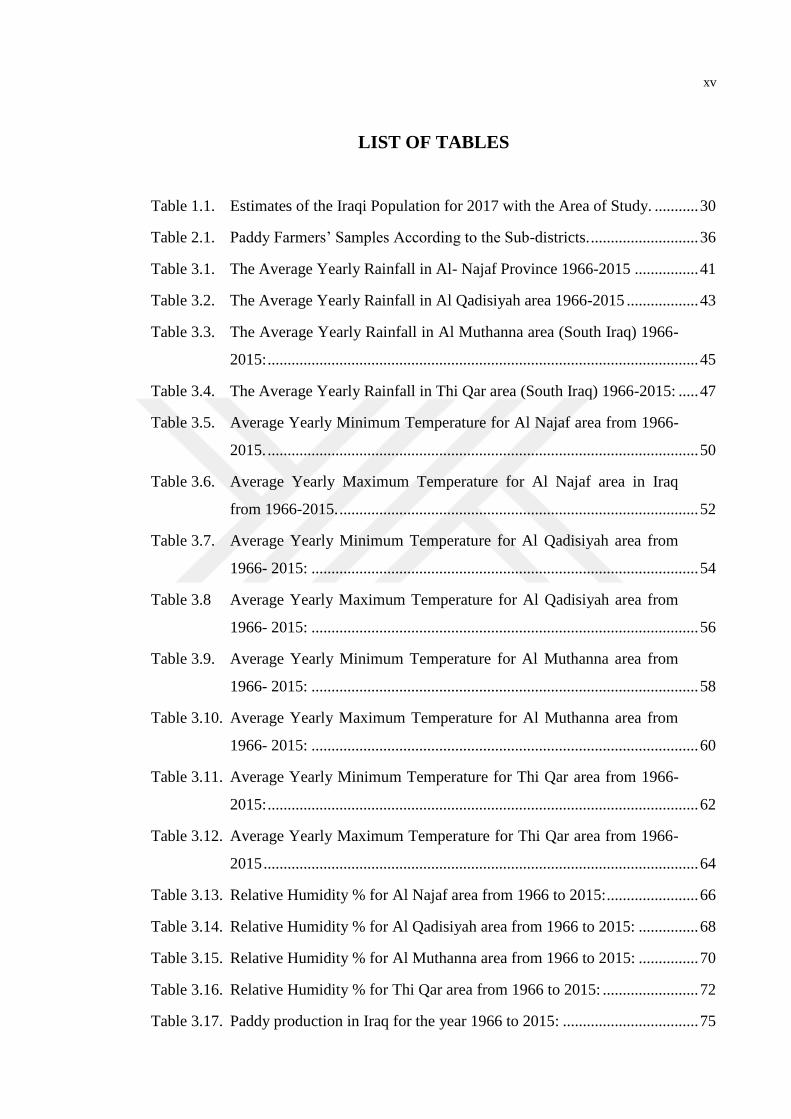
LIST OF TABLES
Table 1.1. Estimates of the Iraqi Population for 2017 with the Area of Study. ........... 30
Table 2.1. Paddy Farmers’ Samples According to the Sub-districts. ........................... 36
Table 3.1. The Average Yearly Rainfall in Al- Najaf Province 1966-2015 ................ 41
Table 3.2. The Average Yearly Rainfall in Al Qadisiyah area 1966-2015 .................. 43
Table 3.3. The Average Yearly Rainfall in Al Muthanna area (South Iraq) 1966-
2015: ............................................................................................................ 45
Table 3.4. The Average Yearly Rainfall in Thi Qar area (South Iraq) 1966-2015: ..... 47
Table 3.5. Average Yearly Minimum Temperature for Al Najaf area from 1966-
2015. ............................................................................................................ 50
Table 3.6. Average Yearly Maximum Temperature for Al Najaf area in Iraq
from 1966-2015. .......................................................................................... 52
Table 3.7. Average Yearly Minimum Temperature for Al Qadisiyah area from
1966- 2015: ................................................................................................. 54
Table 3.8 Average Yearly Maximum Temperature for Al Qadisiyah area from
1966- 2015: ................................................................................................. 56
Table 3.9. Average Yearly Minimum Temperature for Al Muthanna area from
1966- 2015: ................................................................................................. 58
Table 3.10. Average Yearly Maximum Temperature for Al Muthanna area from
1966- 2015: ................................................................................................. 60
Table 3.11. Average Yearly Minimum Temperature for Thi Qar area from 1966-
2015: ............................................................................................................ 62
Table 3.12. Average Yearly Maximum Temperature for Thi Qar area from 1966-
2015 ............................................................................................................. 64
Table 3.13. Relative Humidity % for Al Najaf area from 1966 to 2015: ....................... 66
Table 3.14. Relative Humidity % for Al Qadisiyah area from 1966 to 2015: ............... 68
Table 3.15. Relative Humidity % for Al Muthanna area from 1966 to 2015: ............... 70
Table 3.16. Relative Humidity % for Thi Qar area from 1966 to 2015: ........................ 72
Table 3.17. Paddy production in Iraq for the year 1966 to 2015: .................................. 75
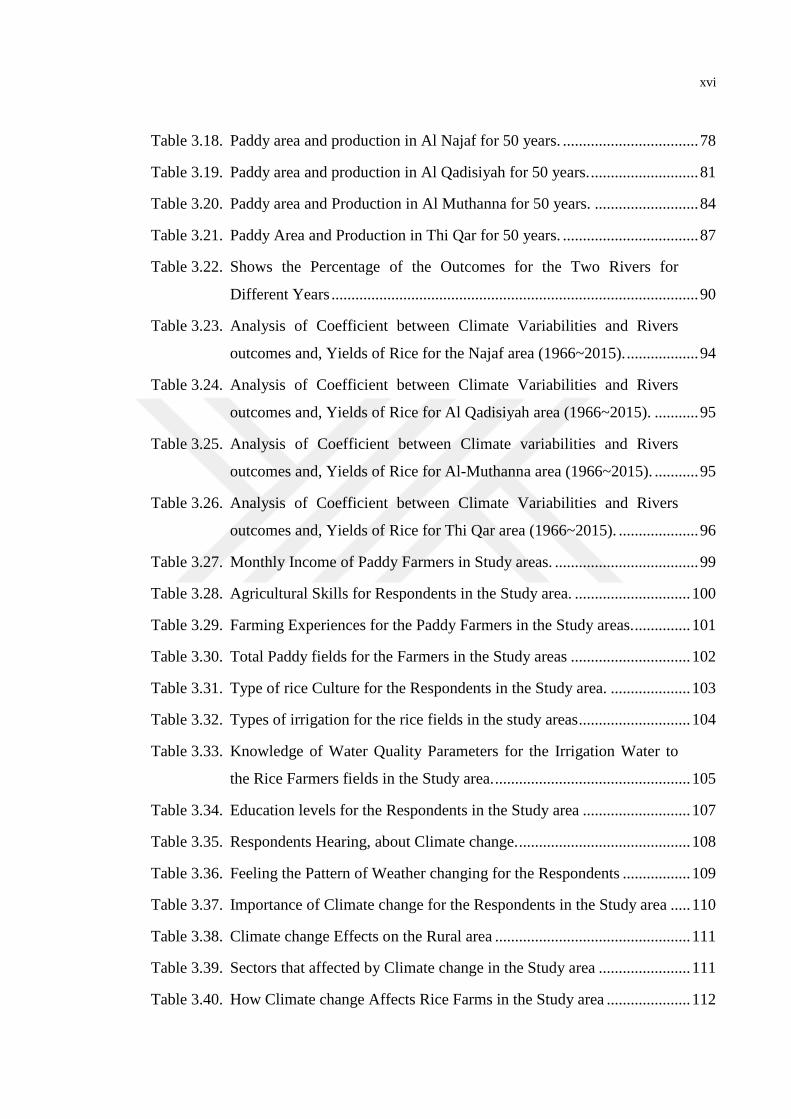
xvi
Table 3.18. Paddy area and production in Al Najaf for 50 years. .................................. 78
Table 3.19. Paddy area and production in Al Qadisiyah for 50 years. ........................... 81
Table 3.20. Paddy area and Production in Al Muthanna for 50 years. .......................... 84
Table 3.21. Paddy Area and Production in Thi Qar for 50 years. .................................. 87
Table 3.22. Shows the Percentage of the Outcomes for the Two Rivers for
Different Years ............................................................................................ 90
Table 3.23. Analysis of Coefficient between Climate Variabilities and Rivers
outcomes and, Yields of Rice for the Najaf area (1966~2015). .................. 94
Table 3.24. Analysis of Coefficient between Climate Variabilities and Rivers
outcomes and, Yields of Rice for Al Qadisiyah area (1966~2015). ........... 95
Table 3.25. Analysis of Coefficient between Climate variabilities and Rivers
outcomes and, Yields of Rice for Al-Muthanna area (1966~2015). ........... 95
Table 3.26. Analysis of Coefficient between Climate Variabilities and Rivers
outcomes and, Yields of Rice for Thi Qar area (1966~2015). .................... 96
Table 3.27. Monthly Income of Paddy Farmers in Study areas. .................................... 99
Table 3.28. Agricultural Skills for Respondents in the Study area. ............................. 100
Table 3.29. Farming Experiences for the Paddy Farmers in the Study areas. .............. 101
Table 3.30. Total Paddy fields for the Farmers in the Study areas .............................. 102
Table 3.31. Type of rice Culture for the Respondents in the Study area. .................... 103
Table 3.32. Types of irrigation for the rice fields in the study areas ............................ 104
Table 3.33. Knowledge of Water Quality Parameters for the Irrigation Water to
the Rice Farmers fields in the Study area. ................................................. 105
Table 3.34. Education levels for the Respondents in the Study area ........................... 107
Table 3.35. Respondents Hearing, about Climate change. ........................................... 108
Table 3.36. Feeling the Pattern of Weather changing for the Respondents ................. 109
Table 3.37. Importance of Climate change for the Respondents in the Study area ..... 110
Table 3.38. Climate change Effects on the Rural area ................................................. 111
Table 3.39. Sectors that affected by Climate change in the Study area ....................... 111
Table 3.40. How Climate change Affects Rice Farms in the Study area ..................... 112
xvii
Table 3.41. Strategies for Adaptation to Climate change for the Respondents in Al
Najaf area .................................................................................................. 114
Table 3.42. Strategies for Adaptation to Climate change for the Respondents in Al
Qadisiyah area ........................................................................................... 114
Table 3.43. Strategies for Adaptation to Climate change for the Respondents in Al
Muthanna Area .......................................................................................... 115
Table 3.44. Strategies for Adaptation to Climate change for the Respondents in
Thi Qar area ............................................................................................... 115
Table 3.45. Climate change Influencing Criteria of Water Management .................... 116
Table 3.46. Rice Production affects the Livelihood of Rural People in the Study
area ............................................................................................................ 117
Table 3.47. Decline in Rice Production affects the Rural area .................................... 118
Table 3.48. How the Decline in rice production affects the rural people in the
study area ................................................................................................... 119
Table 3.49. Rice Production over the Last 10 Years in the Study area ........................ 120
Table 3.50. The Main Reasons for the low productivity in the study areas ................. 121
Table 3.51. Agree or Disagree Statements ................................................................... 122
xviii
LIST OF FIGURES
Figure 1.1. Projected Impacts of Climate Change ......................................................... 6
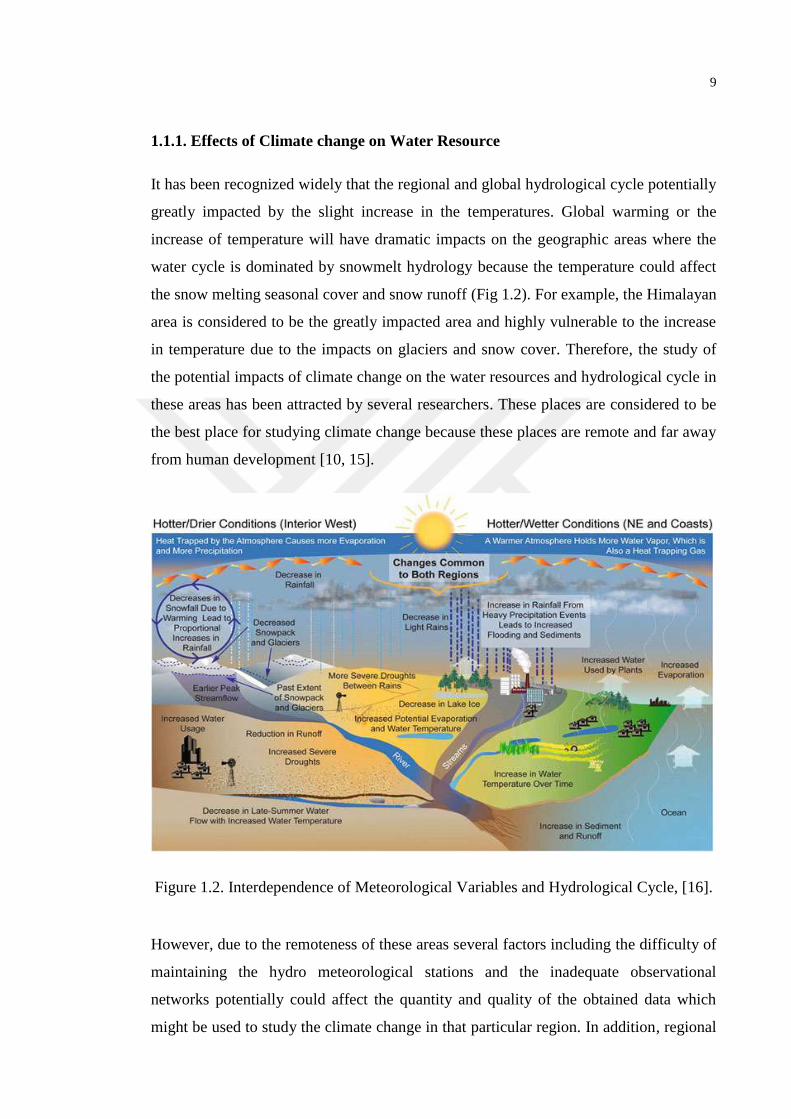
Figure 1.2. Interdependence of Meteorological Variables and Hydrological
Cycle ............................................................................................................ 9
Figure 1.3. Different Images of the Effect of Temperature on Rice Yield in
different Stages of Growth ......................................................................... 13
Figure 1.4. MENA Population. .................................................................................... 16
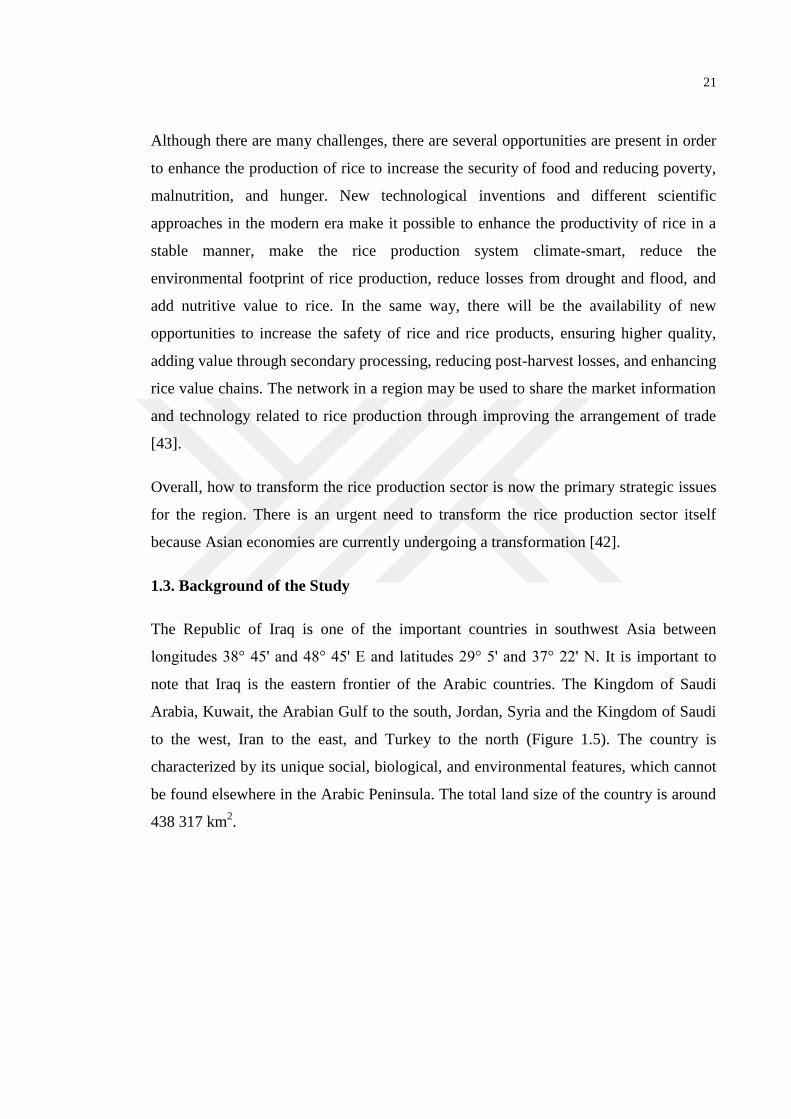
Figure 1.5 Map of Iraq ................................................................................................ 22
Figure 1.6. Population Density of Iraq for 2016 Records ............................................ 22
Figure 1.7. Summer crops ........................................................................................... 25
Figure 1.8. Winter crops ............................................................................................... 25
Figure 1.9. Iraq’s Crop Calendar .................................................................................. 26
Figure 1.10. Agro-Climate Zones in Iraq ....................................................................... 28
Figure 2.1. Research Methodology .............................................................................. 32
Figure 2.2. Research Site. ............................................................................................. 33
Figure 2.3. Questionnaire Processes in Al Muthanna. ................................................. 38
Figure 3.1. The Average Yearly Rainfall in Al- Najaf Province 1966-2015 ............... 42
Figure 3.2. The Average Yearly Rainfall in Al Qadisiyah Province 1966-2015 ......... 44
Figure 3.3. The Average Yearly Rainfall in Al Muthanna Province 1966-2015 ......... 46
Figure 3.4. The Average Yearly Rainfall in Thi Qar Province 1966-2015 .................. 48
Figure 3.5. Average Yearly Minimum Temperature in Al Najaf from 1966-2015 ..... 51
Figure 3.6. Average Yearly Maximum Temperature in Al Najaf from 1966-2015 ..... 53
Figure 3.7. Average Yearly Minimum Temperature in Al Qadisiyah from 1966-
2015 ........................................................................................................... 55
Figure 3.8. Average Yearly Maximum Temperature in Al Qadisiyah from 1966-
2015 ........................................................................................................... 57
Figure 3.9. Average Yearly Minimum Temperature in Al Muthanna from 1966-
2015 ........................................................................................................... 59
Figure 3.10. Average Yearly Maximum Temperature in Al Muthanna from 1966-
2015 ........................................................................................................... 61
Figure 3.11. Average Yearly Minimum Temperature in Thi Qar from 1966-2015 ....... 63
xix
Figure 3.12. Average Yearly Maximum temperature in Al Thi Qar from 1966-
2015 ........................................................................................................... 65
Figure 3.13. Relative Humidity % for Al Najaf area from 1966 to 2015 ...................... 67
Figure 3.14. Relative Humidity % for Al Qadisiyah area from 1966 to 2015 ............... 69
Figure 3.15. Relative Humidity % for Al Muthanna area from 1966 to 2015 ............... 71
Figure 3.16. Relative Humidity % for Thi Qar area from 1966 to 2015 ........................ 73
Figure 3.17. Paddy Production in Iraq, 1966-2015 ........................................................ 76
Figure 3.18. Paddy Area in Iraq, 1966-2015 ................................................................... 76
Figure 3.19. Al Najaf Rice Production ........................................................................... 77
Figure 3.20. Rice crop in Al Najaf. ................................................................................ 77
Figure 3.21. Paddy Area and Production in Al Najaf for 50 years. Source: MoA,
Baghdad. .................................................................................................... 79
Figure 3.22 Paddy yield in Al Najaf for 50 years ......................................................... 79
Figure 3.23. Paddy Total production in Al Najaf for 50 years ....................................... 80
Figure 3.24. Paddy Area in Al Qadisiyah for 50 years. Source: (MoA). Baghdad. ....... 82
Figure 3.25. Paddy Yield in Al Qadisiyah for 50 years ................................................. 82
Figure 3.26. Paddy Total Production in Al Qadisiyah for 50 years ............................... 83
Figure 3.27. Paddy area in Al Muthanna for 50 years ................................................... 85
Figure 3.28. Paddy Yield in Al Muthanna for 50 years ................................................. 85
Figure 3.29. Paddy Production in Al Muthanna for 50 years ........................................ 86
Figure 3.30 Al Muthanna Rice crop. ............................................................................. 86
Figure 3.31. Paddy Area in Thi Qar for 50 years ........................................................... 88
Figure 3.32. Paddy Yield in Thi Qar for 50 years .......................................................... 88
Figure 3.33. Paddy Production in Thi Qar for 50 years ................................................. 89
Figure 3.34. Outcomes for Tigris River (dry and wet season) M3 ................................. 91
Figure 3.35. Outcomes for Euphrates River (dry and wet season) M3 ........................... 91
Figure 3.36. Analysis of coefficient between climate variabilities and rivers
outcomes and, yields of rice for the Najaf area (1966~2015). ................... 96
Figure 3.37. Analysis of Coefficient between Climate Variabilities and Rivers
outcomes and, Yields of Rice for Al Qadisiyah area (1966~2015). .......... 97
xx
Figure 3.38. Analysis of Coefficient between Climate variabilities and Rivers
outcomes and, Yields of Rice for the Al Muthanna area (1966–
2015). ......................................................................................................... 97
Figure 3.39. Analysis of Coefficient between Climate variabilities and Rivers
outcomes and, Yields of Rice for Thi Qar area (1966–2015). ................... 98
Figure 3.40. Monthly Income for Paddy Farmers in Study areas ................................ 100
Figure 3.41. Agricultural Skills for Respondents in the Study area.............................. 101
Figure 3.42. Farming experiences for the paddy farmers in the study areas. ............... 102
Figure 3.43. Paddy Fields area for the Farmers in the Study areas. .............................. 103
Figure 3.44. Type of Rice Culture for the Respondents in the study area ................... 104
Figure 3.45. Types of Irrigation for the Rice Fields in the Study areas ........................ 105
Figure 3.46. Knowledge of Water Quality Parameters ................................................ 106
Figure 3.47. Education levels for the Respondents in the Study area .......................... 107
Figure 3.48. Respondents Hearing, about Climate change. .......................................... 108
Figure 3.49. Feeling the Pattern of Weather changing for the Respondents ................ 109
Figure 3.50. Importance of Climate change for the Respondents in the Study area .... 110
Figure 3.51. Climate change Effects on the rural area ................................................. 111
Figure 3.52. Sectors affected by Climate change in the Study area ............................. 112
Figure 3.53. Type of Climate change Effects ............................................................... 113
Figure 3.54. Climate change Influencing Criteria of Water Management ................... 116
Figure 3.55. Rice production affects the Livelihood of Rural People in the Study
area ........................................................................................................... 117
Figure 3.56. The Decline in Rice Production Affects the Rural Area ......................... 118
Figure 3.57. The Decline in rice production affects the rural people in the study
area ........................................................................................................... 119
Figure 3.58. Rice Production over the last 10 Years in the Study area ........................ 120
Figure 3.59. The Main Reasons for the low Productivity in the Study Areas .............. 121
1
INTRODUCTION
Climate change is one of the major environmental changes which affecting the humans
live and ecosystem and a topical subject of global importance. Over the last several
years, because of both human activities and natural phenomenon, the climate in the
globe has changed. These changes have been shown to be more intense and frequent as
well as disasters such as tsunami, storms, droughts, and floods induced irregular
changes within and over the years. It is true that these changes have immense impacts
on environmental, economic, and social systems and shaped the rural development and
prospects for sustainable agriculture [1].
The evidence from several scientific researches made scientists speculate that
greenhouses gases could promote changes. Although there is world-wide socio-
economic suffering due to climate change, the majority of the empirical studies are
focusing on the developed countries [2]. However, it is a common belief that the
developing or underdeveloped countries are more prone to climate change due to their
dependency on the agricultural system. The hypothesis of more difficulty of adapting to
climate change by the low capital agriculture has never been tested although has been
assumed. Even though the ability to project the differences in the regional level in
impact is still showing lower effects, the climate change consequence in the future use
of the use of agricultural land would be more drastic in the tropical or semi-tropical
countries like [3].
Therefore, people living in underdeveloped or developing country citizens are highly
prone to the impacts caused by climate change as they do not have preparation to
withstanding a deleterious impact. It has been estimated that if there is an increase in
global mean temperature at the lowest level, the global economy will be crumbling and
there will be several negative impacts on developing countries. It is important to note
that the climate change induced impact will fall unequally over the developing countries
2
and thereby poorer people will exacerbate inequities health status and access to other
resources, clean water, and adequate food [2].
Moreover, the absence of creating condition and poverty conditions of many of the
lower adaptive capabilities of these developing countries have clearly contribute on the
people live conditions. Therefore, most of these countries including Iraq, have no
sufficient infrastructure to combat against such hazardous situation. The primary reason
behind this situation is that these countries are mostly preoccupied with more pressing
concerns such as recent urbanization, lack of infrastructure, a rapidly growing young
population, primary education, drinking water supply, and malnutrition. Therefore, the
environmental concerns of the most developing countries are dominated by the lack of
investment and infrastructure [4].
As well as, agriculture and water resource are primarily dependent on the natural
climate in many of the developing countries. Therefore, minimal changes in the climate
such as the sunshine and rainfall would cause huge impacts on agricultural sector
compared to other sectors such as manufacturing [5]. Different variables of the climate
including temperature, humidity and rainfall level of the atmospheric carbon dioxide,
etc. are found to be highly impacted the outcome of agriculture in developing countries.
It has been projected using scientific models that the production of several cereal crops
will be decreased due to a slight increase in the temperature caused by climate change
[6].
It is important to note that the agricultural sector currently using 40% of the land area
with accounts for about 24% of the world output [7]. This sector is highly dependent on
the natural climate of the region and human are depending on the agricultural
livelihood, the particularly poor community is more dependent on this sector. Therefore,
to assess the impacts of climate change on the people in the rural area, agriculture has
been a focus of those modeling [8].
It has been projected by [2] that the production of cereal in a global level could increase
up to 4.8 billion tones by the end of 2080 if there is no climate change. It is true that
specific climatic condition is the prerequisite to grow specific crops with higher
performance. Any variations of the climatic condition may have harmful effects on crop
production as well as the economic outcome.
3
Over the last three decades, Iraq has been facing low rainfall with higher temperatures.
In addition, it has been estimated that the country could face a yearly mean temperature
rise of 1.0 °C by 2030, 1.4 °C by 2050 and 2.4 °C by 2100. The cropping system and
the plant yield is directly impacted by the weather and climate changes. Therefore, the
variability in climatic condition and the function of weather could play a crucial role in
the growth and yield of rice in Iraq [9]. The growth process could be hampered by the
occurrence of unusual climatic events during the critical developmental stages or
growing season resulting in the reduction in yield.
In this work, we will present the impacts of climatic variation on the production of rice
in Iraq. In addition, this work will also highlight the impacts of rice production and
climate changes on rural population and rural areas in Iraq. Based on the system-based
studies and example cases in Iraq, the impacts of the climatic change will be described.
In addition, measures of variability and key climate variables will be examined first and
then the analysis of short-term weather episodes and long-term variability in the weather
will be performed to distinguish the impacts.
However, the hypothesis of the study refers that Iraq is the second of Arab countries in
oil production and the third largest populated and fast-growing economies among the
Arab countries. However, it has several issues related to a social and economic
condition which is unable to cope with the speed of economic growth. It is true that
approximately 34% of the Iraqi population is living in rural areas. Therefore, there is a
saying in Iraq that ―Iraqi lives are in villages‖. However, the fast-paced economic
growth is completely absent in the rural area and does not truly benefit the people in the
rural area [2]. Reduction of agricultural production is one of the major challenges faced
by Iraqi people nowadays. This is mainly due to the rapid industrialization and
urbanization along with the climatic change that resulted in the destruction of the
agricultural land [10].
As in the introduction chapter, this study will be addressed the effect of global warming
and climate change with its factors (Temperature, Rainfall and Humidity) on: paddy
farms (production and yields) and rural development in area study of Iraq for four
province Al Najaf, Al Muthanna, Al Qadisiyah and Thi Qar.
4
In order to obtain an idea about the climate change-induced changes in the socio-
economic condition affect the use of agricultural land in Iraq, it is important to measure
the use of agricultural land effects of climate change. The most important hypothesis is
summarized below:
1- Severity of climate change effects (states or regions that are most vulnerable) on the
regions in Iraq caused drastic irrigation water scarcity and agricultural productivity
reduction.
2- Lack of adaptation of the modern agriculture technologies in the rural part of Iraq
resulted in a critical impact on rice production as well as on the agricultural production
patterns in Iraq.
3- One of the major socio-economic problems in Iraq is the rural poverty which is not
only greatly influenced by the climatic and socio-economic factors but also related to
the performance of the agriculture of the region or state.
4- There is a direct relationship between the socio-economic status of the area and the
vulnerability against climate change e.g. rice production reduction, destruction of
agricultural land, migratory situation, infrastructure index, less economic growth, etc.
5- Measuring the interactions index between the rural population and paddy production
with climate changes in this area, is this index negative or positive for rural
development.
The primary goal of the study is to understand whether the climate and weather have a
direct effect on the development and growth and occurrence of climatic disasters and
any fluctuation in the temperature could impact in the crucial stage of growth and
finally reduce the productivity significantly. Because of that, variability in the climate
and weather will play a significant role and will have a direct influence in rural socio-
economic condition. Therefore, the major objectives of the current study are to find out
the following: -
5
1. Explore the impacts of climate change on the agricultural sector and this
including: -
Paddy production.
Paddy Adaptation.
2. Analyze the impacts of climate change on water resources and this including: -
Water resource quantity.
Irrigation water quality.
Irrigation systems.
3. Explore the effects of irrigation water quantity on paddy production.
4. Explore the impacts of paddy production, water resources, and climate change
on rural development in the study area this including: -
Economic.
Relationship.
Landscape.
Rural immigration.
Several studies have aimed to examine the weather influence and/or variations on the
production of crops including rice and different strategies adopted by the framers in the
Asian region and beyond. However, in each location, the outcome is different and
primarily depends on the location-specific management, the response of the crops and
the magnitude of these changes. Therefore, to understand the location-specific climate
change effects on the production of paddy and to recommend proper corrective
procedures, it is very important to study the impacts of climate change in the farm level
and rural people using farm-level survey data. The rationale of the current study is
interactions between climate change and paddy productions and its impacts on rural
development in Iraq.
6
CHAPTER ONE
LITERATURE REVIEW
1.1. Effects of Climate Changes
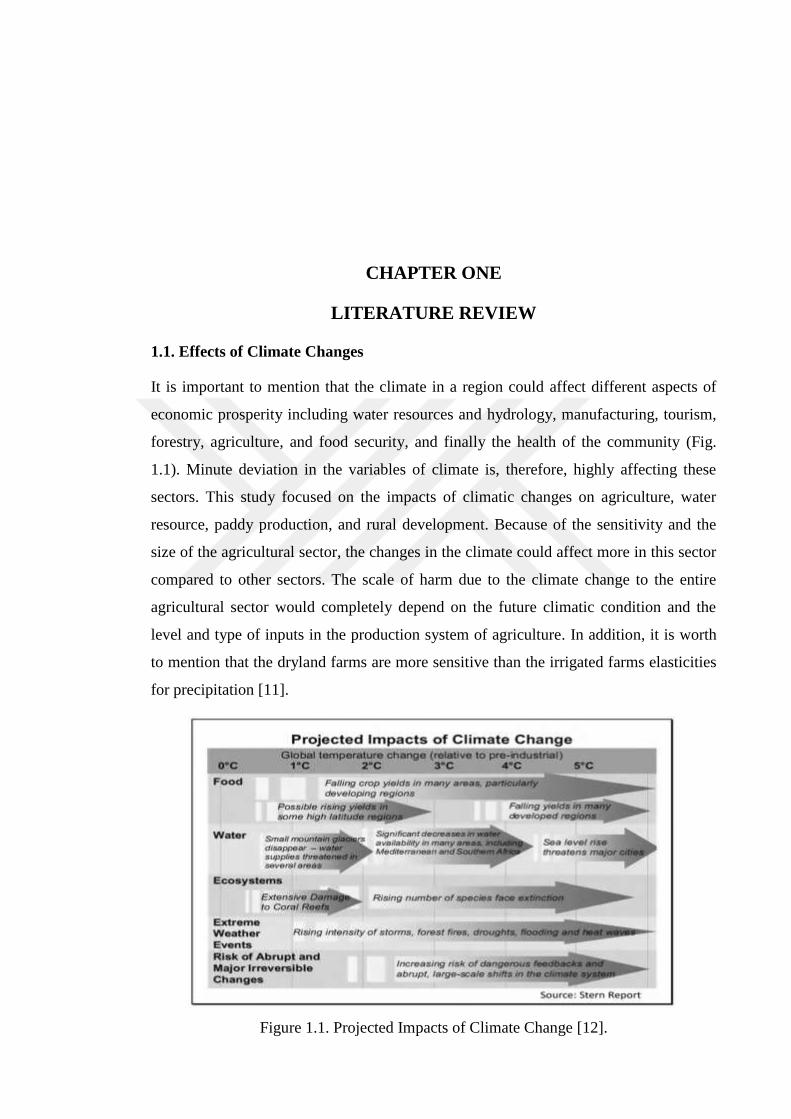
It is important to mention that the climate in a region could affect different aspects of
economic prosperity including water resources and hydrology, manufacturing, tourism,
forestry, agriculture, and food security, and finally the health of the community (Fig.
1.1). Minute deviation in the variables of climate is, therefore, highly affecting these
sectors. This study focused on the impacts of climatic changes on agriculture, water
resource, paddy production, and rural development. Because of the sensitivity and the
size of the agricultural sector, the changes in the climate could affect more in this sector
compared to other sectors. The scale of harm due to the climate change to the entire
agricultural sector would completely depend on the future climatic condition and the
level and type of inputs in the production system of agriculture. In addition, it is worth
to mention that the dryland farms are more sensitive than the irrigated farms elasticities
for precipitation [11].
Figure 1.1. Projected Impacts of Climate Change [12].
7
On the other hand, it is worth to point out that climate change is not just affecting the
agriculture- the production system of agriculture could also need to be exacerbated or
mitigate the trend of climate change. It is also important to mention that the
Intergovernmental Panel on Climate Change [13] has shown that the agricultural sector
influencing the climate change by contributing around 13.5% of the total GHG
(greenhouse gas) emission. The agricultural production system is producing some major
GHGs including nitrous oxide (N2O), methane (CH4), and carbon dioxide (CO2) [14].
Although the agricultural production system in the United States is one of the major
sources of N2O and CH4 emission, it is relatively a small producer of CO2 from on-farm
energy use. In the US, the agricultural activities producing a total of 413.1 Tg CO2eq,
which is estimated 5.8% of the total GHG emission in the US. The agriculture activity
categories comprise the contribution of the following [14]:
A broad array of activities including irrigation, production of N fixing crops and
forages, soil cultivation, manure deposition by grazing animals, fertilization with
synthetic fertilizer and other activities are covered by Agricultural Soil
Management. The category covers GHGs emission from both grassland and
cropland. Total GHG emissions of more than 200 Tg.
The digestive system of the agricultural animals, particularly both the small and
large ruminants, are producing methane (CH4) gas. Total GHG emissions more
than 140 Tg.
During the storage and handling, nitrous oxide and methane gas are emitted
which belongs to Manure Management emissions. Total GHG emissions around
60 Tg.
Cultivation of rice under anaerobic conditions in the flooded fields in the US
resulted in methane emission. Total GHG emissions around 10 Tg.
The CO2 emissions due to the burning of agricultural residues in the field results
in huge CO2 emissions, however, it is not counted due to the reason that the
plants may reabsorb CO2 in the next growing season. It is important to note that
field burning not only producing CO2 but also nitrous oxide, methane, and other
minor GHGs.
8
In above we addressed the effect of agriculture on climate change, this part of this
chapter will be addressed the impacts of climate change on the socio-economic security
in the MENA (Middle East and North Africa) region felt greatly in the water sector, yet
few adaptive measures and proactive policies are required to solve this crisis. It is true
that the policy measures are sometimes in response to a definite problem where the
resulted impacts are generally clearly seen and create sufficient media exposure, such
aquifer and drought depletion, which straightly limits the supply of water. In many of
the cases, it is just agricultural output decrease and lack of water in the cities that the
reforms of water policy to address the security concerns in human society. Besides the
climatic factors, the scarcity of water in the MENA region is derived from the
continuously increasing demands along with demographic growth that occurs rapidly. It
has been concluded by reviewing many studies that was investigated the flow of Nile
and climatic models since 1981 that the climate change-related impact on the flow of
Nile will be relatively lower in comparison with other changes induced by human
including development strategies, choice of land use, and population growth [1].
The population size of the MENA region is expected to increase from 300 million in
2000 to about 540 million in 2025. It has also been estimated that the availability of
water will vary by different orders of magnitudes for the various countries towards the
region of MENA and the water availability per capita will be ranged from low water-
stressed countries like Iraq (4,340 m3/year/capita) to high water-stressed countries like
Jordan (200 m3/year/capita). It is important to note that the ground water-based
countries have a significantly higher level of water stress, while the countries based on
surface water flows (Iraq, Syria, Lebanon, and Egypt) are with surplus water. It has
been predicted by the researchers that the water stress will be increased in the MENA
region dramatically due to the increase in the population in 2025 and the availability of
water is expected to be reduced 30% - 70% per capita. The estimated enhancement in
the stress of water could affect countries in the MENA region, although countries based
on groundwater sources expected to exacerbate the already existing problem related
with water crisis [1].
9
1.1.1. Effects of Climate change on Water Resource
It has been recognized widely that the regional and global hydrological cycle potentially
greatly impacted by the slight increase in the temperatures. Global warming or the
increase of temperature will have dramatic impacts on the geographic areas where the
water cycle is dominated by snowmelt hydrology because the temperature could affect
the snow melting seasonal cover and snow runoff (Fig 1.2). For example, the Himalayan
area is considered to be the greatly impacted area and highly vulnerable to the increase
in temperature due to the impacts on glaciers and snow cover. Therefore, the study of
the potential impacts of climate change on the water resources and hydrological cycle in
these areas has been attracted by several researchers. These places are considered to be
the best place for studying climate change because these places are remote and far away
from human development [10, 15].
Figure 1.2. Interdependence of Meteorological Variables and Hydrological Cycle, [16].
However, due to the remoteness of these areas several factors including the difficulty of
maintaining the hydro meteorological stations and the inadequate observational
networks potentially could affect the quantity and quality of the obtained data which
might be used to study the climate change in that particular region. In addition, regional
10
conflicts and disputes could severely complicate the inset data collection in some of
these regions.
It is important to note that global warming is a recent phenomenon and has been
accelerated in the past few decades. For instance, while, there was about 0.18°C
increase in the temperature in each decade in the last 25 years, there was about 0.75°C
increase in the temperature in the last 100. The increase in the temperature has been
observed in both oceans and lands. Increase in the temperature due to global warming
resulted in glaciers melt, rise in the sea level, and changes in precipitation patterns. It is
true that in general, extreme weather events in recent days are increasing in terms of
their intensity and frequency [17].
Climate change has an impact on both oceans and freshwater resources in terms of coral
reef bleaching and acidification. The ocean’s capacity to absorb CO2 from the
atmosphere is likely to be reduced by a slight increase in the ocean acidity. Therefore,
the effects of climate change are huge in marine life and could affect the total ocean
food chain. According to the above, the result is that climate changes affect the
irrigation sources that user in agriculture. In addition, different river basins and regions,
groundwater and surface resources are overexploited which resulted in permanent
damage in the ecosystem by reducing the water flow in wetlands, lakes, and rivers.
However, in some area, the situation is slightly different. For example, a huge amount
of untapped water in Sub-Saharan Africa could be major source of water and expected
to be generating economic prosperity because of its use in the agricultural activities.
Therefore, it is true that the major challenge in the development of agriculture in the
future is the management of water resources sustainably [18].
1.1.2. Effects of Climate change on Agriculture
Increase in climate change risks and projected changes in the climate over the 21st
century pose serious challenges to developing countries in terms of development in the
agricultural system [19]. Due to the poor infrastructure and low adaptive capacity, Iraq
is one of the most vulnerable countries against climate change. By examining the
extreme weather events and climate change in a period of 1995 to 2014, the Global
Climate Risk Index (GCRI) ranked Iraq in number 8 in the list of most affected
countries. Because of climate variability and extreme events, the livelihoods in the rural
11
area and the major crop productivity including date palm, rice, barley, and wheat have
been affected in a great scale over the last few decades [20].
The dependency of the agriculture on the climatic condition is the primary obstacle for
the socio-economic prosperity in Iraq because more than two third of the country’s
population lives in rural regions and completely dependent on the agricultural system
for their livelihood [21]. In addition, it is important to note that climate change has huge
implications on local food security in underdeveloped countries through the adverse
effects on the food price and cereal productivity. Therefore, the big gap between the
potential and actual crop production is the primary factor that contributes to the
inadequate supply of cereal grains in the countries [20]. This part of this study will be
addressed the influence of climate change on the production of major crops.
1.1.2.1. Climate Change Effect on Crop Yields
Because of the fact that CO2 could increase photosynthesis in both C4 and C3 crops,
there is a potential benefit if the atmospheric CO2 increases. It is important to mention
that both the pasture and crop production and yield potentially enhanced due to the
efficient use of water caused by reduced stomatal conductance at the time of higher CO2
concentration. However, change in precipitation and increased temperature are the
limiting factors in plant response to enhanced CO2
concentrations. Decreased
phosphorus and nitrogen level in the soil that is the case of several parts of Asia could
potentially limit the plant response to increased CO2 concentrations. It has been
demonstrated by Cheng; et al. [22], that the enhanced level of CO2 concentration is
stimulating the release of cations from the soil and influence the growth of plants in a
positive manner. However, in the long run, CO2-induced cation release could accelerate
the loss of cation from the soil and causes soil erosion [11].
Rainfall, the concentration of CO2, and changes in the level of temperature could have a
huge impact on the reproduction, distribution, development, survival, life cycle duration
population dynamics of many pathogens and pests. Altered patterns of crop yield
system because of the climatic condition may also influence the kind of pathogens and
pests that affect the crop production. Therefore, it is clear that the status of the pest on
these organisms completely depends on the climatic condition and greatly influenced by
climate change as well as disease and pest management strategies. Similar to the
12
economically important crop plants, the development and growth of the weed species
are indirectly and directly influenced by the increase in the temperatures, increase in the
CO2 concentration, and patterns of the rainfall. Therefore, the crop-weed
relationship/interaction will be determined by the differences in response to these
changes of environment [11]. It has been shown by several studies that crop production
in the Asian area is likely to be decreased in the changed climatic condition in the
future.
1.1.2.2. Impacts on Rice Production
Rice is the staple food for more than half of the world’s population and considered to be
one of the important food crops. It has been estimated that the production of rice should
be increased by around 60% by the year 2025 in order to mitigate the requirement of the
increasing world’s population [23]. However, several factors including scarcity of
irrigation water, shrinking of arable land, global warming, and increased environmental
stress pose a grave threat in rice production globally. Because of the fact that the rice is
extremely sensitive to any kind of change in the climate particularly related to the
extended drought period, fluctuation of the CO2 concentration, an increase in the
temperature, adjusting with the demand of rice globally would be a difficult task [24].
It has been estimated by a different study that the simulated production reduction of 5-
7% major crops including rice due the rise of 1 °C mean daily temperature. It is
important to note that the reduction in the production was mostly related to the increase
in maintenance respiration, shortening of growth duration, and decrease sink formation
[25].
It has been shown that the enrichment in the atmospheric level of CO2 concentration has
a significant increase in the yields (15-39%) and biomass (25-40%) in rice production
when the temperature was ambient. However, these advantages in productivity seem to
be decreased when the temperature is increasing along with the CO2 level. The decrease
in the yield due to the continuous temperature and CO2 increase are basically caused by
high-temperature-induced spikelet sterility. It is important to note that if the night
temperature is more than 21°C, a higher level of CO2 could result in direct inhibition of
the maintenance respiration. The response of rising to an enhanced level of CO2
atmosphere could also depend on the supply of nitrogen. However, it is important to
13
note that the growth response and photosynthesis could be highly affected by the
additional CO2 is given when N is limited. Although new genes, mechanisms, and traits
associated with the temperature and CO2 concentration increase have not been
completely identified, there is plenty of evidence that there is the occurrence of
genotypic variations because of climate change [26].
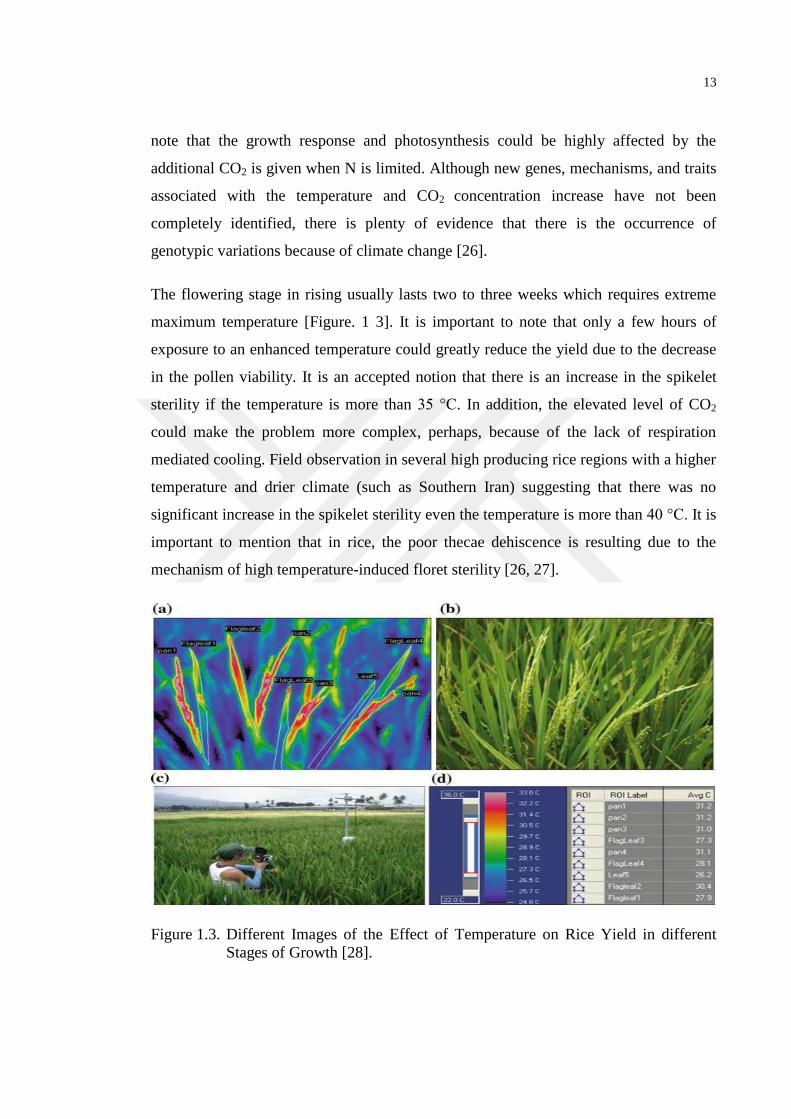
The flowering stage in rising usually lasts two to three weeks which requires extreme
maximum temperature [Figure. 1 3]. It is important to note that only a few hours of
exposure to an enhanced temperature could greatly reduce the yield due to the decrease
in the pollen viability. It is an accepted notion that there is an increase in the spikelet
sterility if the temperature is more than 35 °C. In addition, the elevated level of CO2
could make the problem more complex, perhaps, because of the lack of respiration
mediated cooling. Field observation in several high producing rice regions with a higher
temperature and drier climate (such as Southern Iran) suggesting that there was no
significant increase in the spikelet sterility even the temperature is more than 40 °C. It is
important to mention that in rice, the poor thecae dehiscence is resulting due to the
mechanism of high temperature-induced floret sterility [26, 27].
Figure 1.3. Different Images of the Effect of Temperature on Rice Yield in different
Stages of Growth [28].
14
Changing of time-of-day when flowering commences to the cooler periods is another
strategy. It is important to mention that there are almost 3 hours differences in the time
of flowering in the wild rice accessions which have been evaluated at IRRI
(International Rice Research Institute). To avoid the adverse effects of climate change,
rice fertility could be protected by shifting the flowering time to the early morning hours
[29].
Interestingly, the effects of increasing minimum temperature on the production and
growth of rice are not well understood compared to the effects of extremely high day
temperatures on spikelet sterility. There is plenty of evidence that the spikelet sterility is
due to the increase in the mean night temperature since the middle of the 20th
century.
Differences in the radiation of solar increased the differential effects of day vs. night or
respiration losses of maintenance in crop phonology, grain filling, stem elongation, leaf-
area expansion, till ring have been proposed as a possible reason [2].
It is true that climatic alteration is likely to have a crucial influence on the efficiency of
the use of water and water maintenance. Increase in the temperature generally resulted
in higher evapotranspiration losses. However, it is also important to note that the new
evidence suggesting the increase of CO2 concentration may lead to the increased
efficiency of the water use because of the combination of increased biomass production
and reduced transpiration resulting from increased shading from large leaves and
decreased stromal conductance [30].
The change of climatic condition could also impact on the production of rice by
increasing the sea level. The analysis of the observation of the tide gauges revealed that
there is an increase of mean global sea level rise from about 10 to 25 cm over the last
100 years. This increase in the sea level could be the result of climate change and
increase of temperature. Increased temperature resulted in the melting of polar
deposition of ice. To identify the future rise of the sea level, various models were
employed, and the results indicated that the rise of sea level will be between 13 to 94 cm
by the end of 2100 with an average rise of 49 cm. Cultivation of rising is the dominant
use of land in the different deltaic and coastal region of the tropics. It is important to
note that other crops except rice may be unable to grow under the salinity and in the
majority of the location unstable water levels. The consequence is the increase in the
15
production of rice in the delta of Asian areas contributing to the quick growth in the
global production of rice and facilitates the export of balk rice from countries including
Vietnam. It is worth to mention that there was a transformation of floating and deep-
water rice ecosystem to the irrigated rice ecosystem in these delta regions in Asia.
However, an increase in the sea level could decrease the production of rice in the highly
productive rice delta in these areas. For instance, in the Mekong Delta, it can be noticed
from the Cambodian border that the sea level has risen. The sea level rise may become a
crucial obstacle to the global as well as the national supply of rice because these areas
are the major exporter of the rice in the world [26].
1.1.3. Effects of Climate Change on Rural Population
Climatic change is one of the biggest threats to human health in the 21st Century. Many
climate change hotspots lie in rural and remote communities. Climate change and
associated impacts will affect everything and everyone the young and the old, the
healthy and the infirmed, the rich and the poor, some by a little and some by a lot.
While some of the changes, like more intense heat waves, will affect us directly, many
of the impacts are likely to be experienced through impacts on the natural world on
which we depend. Although preparation and adaptation can moderate some of the
impacts, new ones are likely to arise as the global energy system is changed to limit
emissions of the gases and aerosols that cause climate change (Figure. 1. 4). A few of
the changes may lead to local opportunities and gains, but many are likely to result in
negative consequences, many arising because the extremes that already impose costs
will occur more frequently and be even further from the norms to which society and the
environment have become reasonably adapted [31,32].
16
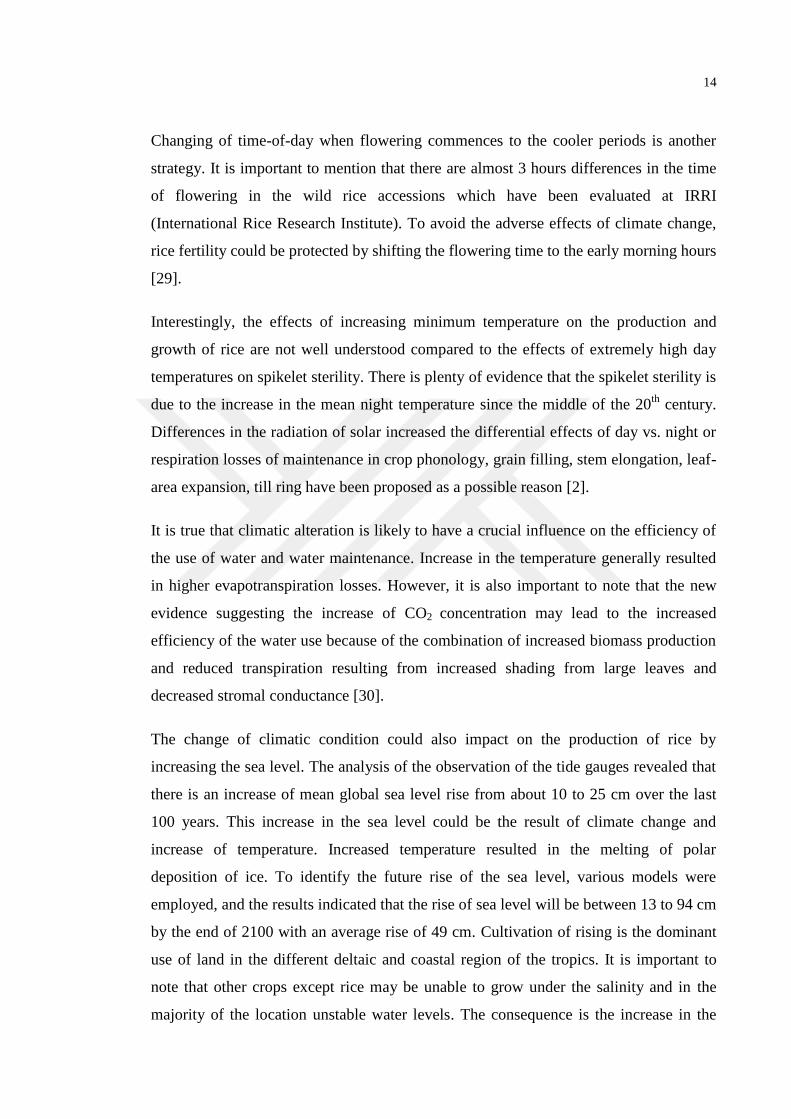
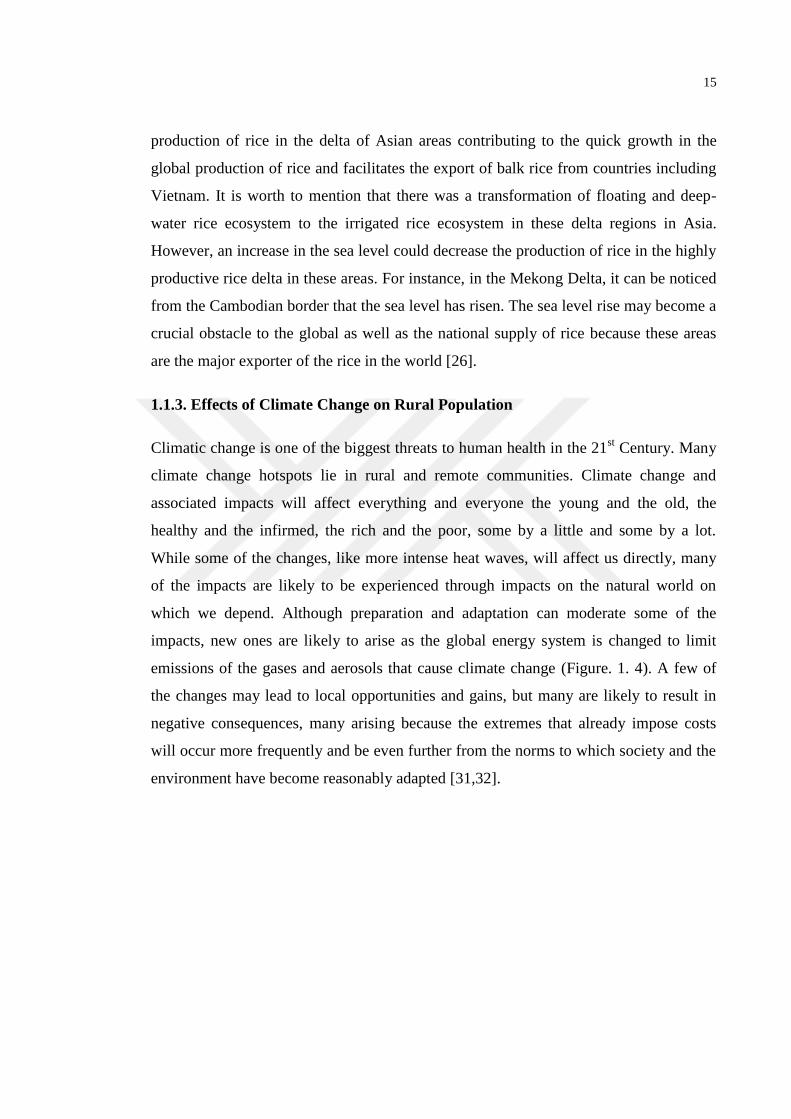
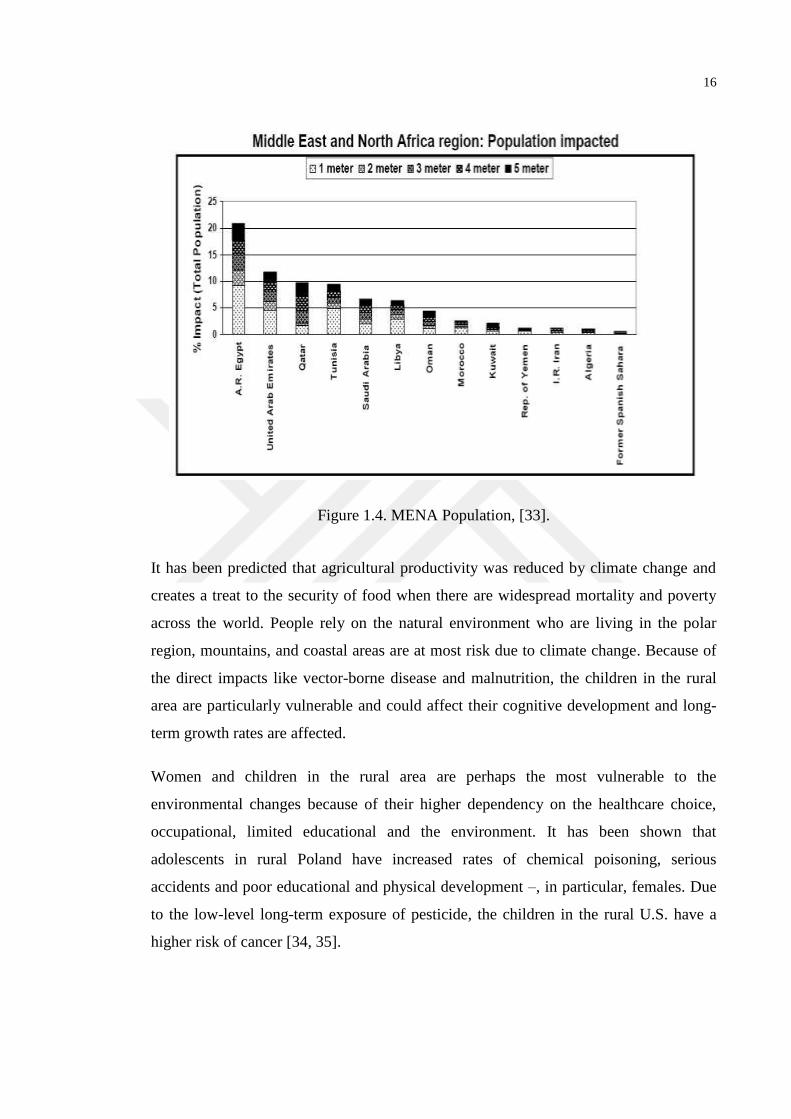
Figure 1.4. MENA Population, [33].
It has been predicted that agricultural productivity was reduced by climate change and
creates a treat to the security of food when there are widespread mortality and poverty
across the world. People rely on the natural environment who are living in the polar
region, mountains, and coastal areas are at most risk due to climate change. Because of
the direct impacts like vector-borne disease and malnutrition, the children in the rural
area are particularly vulnerable and could affect their cognitive development and long-
term growth rates are affected.
Women and children in the rural area are perhaps the most vulnerable to the
environmental changes because of their higher dependency on the healthcare choice,
occupational, limited educational and the environment. It has been shown that
adolescents in rural Poland have increased rates of chemical poisoning, serious
accidents and poor educational and physical development –, in particular, females. Due
to the low-level long-term exposure of pesticide, the children in the rural U.S. have a
higher risk of cancer [34, 35].
17
1.2. Impacts of Water Resources, Agriculture and Paddy Production on Rural
Development
The major objective of this part of the chapter is to examine the economic indicators
focusing on the regions of a rural area and to find out which indicators can be used to
examine rural development. There are several environmental, cultural, social, and
economic indicators and factors which may be used to measure the development in the
rural area. It is true that there is no consensus about how to identify the major factors
that affect the development in a rural area, although the rural development phenomena
are discussed by many institutes, authorities, and authors for decades.
Agricultural growth with water resources remains two key pillars of the development of
economies in the agriculture dominating economies, but, difficulties still persists to
investigate environmental constraints, institutional innovations, technological
advancement, food value chains, and integrating the rural development that has changed
in the context of agriculture's role. The attention on narrowing urban-rural disparities,
reducing vulnerability and poverty and accelerating economic growth for developing
and underdeveloped countries through the development of agriculture. To benefit
economic growth and to address the different dimensions of socioeconomic
development in the rural area, it is important to keep a focus on new agriculture for
development framework.
1.2.1. Effects of Water Resources on Rural Development
Water and food security are intimately connected. In the rural social system and
economy, water is considered as the lifeline especially in the semi-arid and arid areas of
the countries in the globe, where the means of irrigation is extremely limited, and the
agriculture is heavily depending on the natural rainfall. Therefore, the development
strategies in these areas are focusing on ensuring the water availability for drinking and
irrigation [36].
In the current world, many of the people are living in water-scarce regions and still go
hungry. It was understood that limited water access is one of the major constraints to
increase the production of food when FAO started a special program for Food Security
in 1994. Therefore, now the primary question is whether storage of water will act as a
18
thoughtful brake on the production of food in the future. Several people, many people
confess in order to obtain the answer: the major point of their argument is that the
renewable sources of water in the world is fixed and it cannot be changed. Therefore, as
a result of population increase, the per capita allocation of water is decreased [37].
It seems that the researches who are optimistic about the water resources in the future
are as rare as thunderstorms in the desert. However, there are few articles that discussed
water resources management in the future. One of the article’s key message is that in the
coming 30 years, we are able to increase the total area under irrigation in the developing
countries by 34%, and importantly, we need only 14% more water to do this job. Is it
really possible? There could be two possible explanations. One way is to change of food
habits of the inhabitants of the developing countries could help to increase the
efficiency of water which could be used further in the crop production. For instance,
rice is a very water intensive crop and require two times more water than wheat per
hectare. Therefore, when people eat more wheat and less rice, less water for irrigation
will be needed. Although the effect of the trend is very minute, however, it will be
noticeable by the end of 2030 [38, 39].
It is important that we believe the efficiency of the use of water for irrigation may be
increased over the next 30 years, from an average of 42% to 38%. An analysis of a total
of 93 developing countries done by FAO revealed that their abstraction of water in the
agricultural area in 1998 was around 2 128 km3
/year. If it is possible to increase the
irrigation efficiency by 42%, with a constructed effort, using the advanced technology,
we assume that only 2 420 km3 of water may be needed to abstract in 2030 for irrigating
a net harvested area more than one-third larger than it is today. We must not forget that
in several countries, water supply is already limited and in many other countries, they
are suffering a severe shortage of water locally. It is important to note that these regions
and countries may need extra attention will need special attention in the coming years.
Furthermore, it is necessary to increase the efficiency of irrigation by more than just
4%. Getting more crop per drop- increase the efficiency of irrigation — should,
therefore, become the top priorities on our list [40, 41].
It is important to note that water availability worldwide will be the major key issue in
the 21st century. Per capita, the availability of water is going to be projected to decrease
19
from 6600 to 4800 m3 between the year 2000 and 2025 due to the lack of even
distribution of water resources. However, the majority of the population of the world
will have been lower than 1700 m3 per capita. Water availability is a major concern in
the rural communities of the world. Past and current high rates of population growth in
rural communities have contributed significantly to the increase in water consumption.
Efficient management of water resources is therefore important if the health and well-
being of the people, particularly in rural areas, is to be maintained [1].
1.2.2. Effects of Agriculture on Rural Development
Providing food for more than seven billion people is the major challenge in the world
today. It is important to note that this challenge will not end here. It has been estimated
that by the middle of this century the world’s population may increase more than nine
billion. This looming scenario needs dramatic improvement in the efficiency in the
production of agricultural research.
The energy, water, and arable land are the most important resources for the production
of food that are interlinked in a multitude of dependency. There is a consistent
competition for the use of resources in different sectors. It is true that the largest user of
natural resources is the agriculture and also provide huge opportunities to use the
resources in a sustainable way [30].
Agricultural production for food, fiber, fuels, and industrial inputs and an increasingly
wide range of products are becoming the inseparable part of the living standard of more
than 2.6 billion inhabitants. More importantly, many of the people are living in
developing countries and their average income is lower than $2 per day [35]. Since the
2008-2009 global financial meltdown and the crisis of food price in 2006-2008, it has
been estimated by the FAO that more than 1.02 billion people are not getting the
nutrition properly and the majority of them are living in the rural areas [32]. The crisis
of food in the year 2007-2008 has shown that for food security producing more food is
not a solution but is a strategic option for the development of economic condition [31].
The report by World Bank regarding agriculture for development (2007) indicating that
to move more than hundred million poor people out of poverty through the introduction
of smallholder animal husbandry and framing, jobs in the rural area, entrepreneurship,
20
employment in high-value products, agriculture is the vital option. It has been indicated
in this report that these objectives can be achieved through increasing the
competitiveness and productivity of the agricultural system in general and generating
the opportunity of non-farm employment in the rural area in the first place. Secondly, by
increasing the support system and capabilities of small-scale farms.
New technologies related to the agricultural production must fulfill the potentially
conflicting dual goals such as providing food for increasing demand and preserving the
natural resources. Now the prime question is how prepared we are?
1.2.3. The Paddy production and Rural Development
It is important to note that rice is the central ingredient of the food security of more than
half of the world’s community and is the staple food in many of the Asian countries.
More than 90% of the consumption and production of rice is accounted for by Asian
countries. It is important to note that production of rice is one of the major sources of
livelihood of more than 140 million rice-farming households. Due to the fact that the
overall political stability and economic growth of a region, it is considered as a strategic
commodity and affordable and continuous supply of this commodity is crucial in this
regard. There are still several important challenges remain to ensure the stable and
adequate supply of this important food ingredient to the consumer with an affordable
price, although several important technologies have been employed in the production of
rice in the wake of Green Revolution [37]. Therefore, the primary challenges in this
regard are the production of more rice to mitigate the increasing demand due to the
exponential population growth. In addition, changes in the demographic composition of
labor in rural areas; changes in dietary composition with income growth and
urbanization; increasing competition for water, labor, and land from industrial and
urban sectors; global climate change; a decline in rice biodiversity and loss of rice
heritage; environmental degradation associated with intensive rice production; and the
deceleration in the growth of rice yield are the major points to be considered to increase
the production of rice under climate change. In the same way, to achieve the stability of
the price of rice is one of the major challenges if we consider the transmission context
of hocks because of the higher interrelationship of rice with various sectors and the
major affected areas will be the export areas of a country [37,42].
21
Although there are many challenges, there are several opportunities are present in order
to enhance the production of rice to increase the security of food and reducing poverty,
malnutrition, and hunger. New technological inventions and different scientific
approaches in the modern era make it possible to enhance the productivity of rice in a
stable manner, make the rice production system climate-smart, reduce the
environmental footprint of rice production, reduce losses from drought and flood, and
add nutritive value to rice. In the same way, there will be the availability of new
opportunities to increase the safety of rice and rice products, ensuring higher quality,
adding value through secondary processing, reducing post-harvest losses, and enhancing
rice value chains. The network in a region may be used to share the market information
and technology related to rice production through improving the arrangement of trade
[43].
Overall, how to transform the rice production sector is now the primary strategic issues
for the region. There is an urgent need to transform the rice production sector itself
because Asian economies are currently undergoing a transformation [42].
1.3. Background of the Study
The Republic of Iraq is one of the important countries in southwest Asia between
longitudes 38° 45' and 48° 45' E and latitudes 29° 5' and 37° 22' N. It is important to
note that Iraq is the eastern frontier of the Arabic countries. The Kingdom of Saudi
Arabia, Kuwait, the Arabian Gulf to the south, Jordan, Syria and the Kingdom of Saudi
to the west, Iran to the east, and Turkey to the north (Figure 1.5). The country is
characterized by its unique social, biological, and environmental features, which cannot
be found elsewhere in the Arabic Peninsula. The total land size of the country is around
438 317 km2.
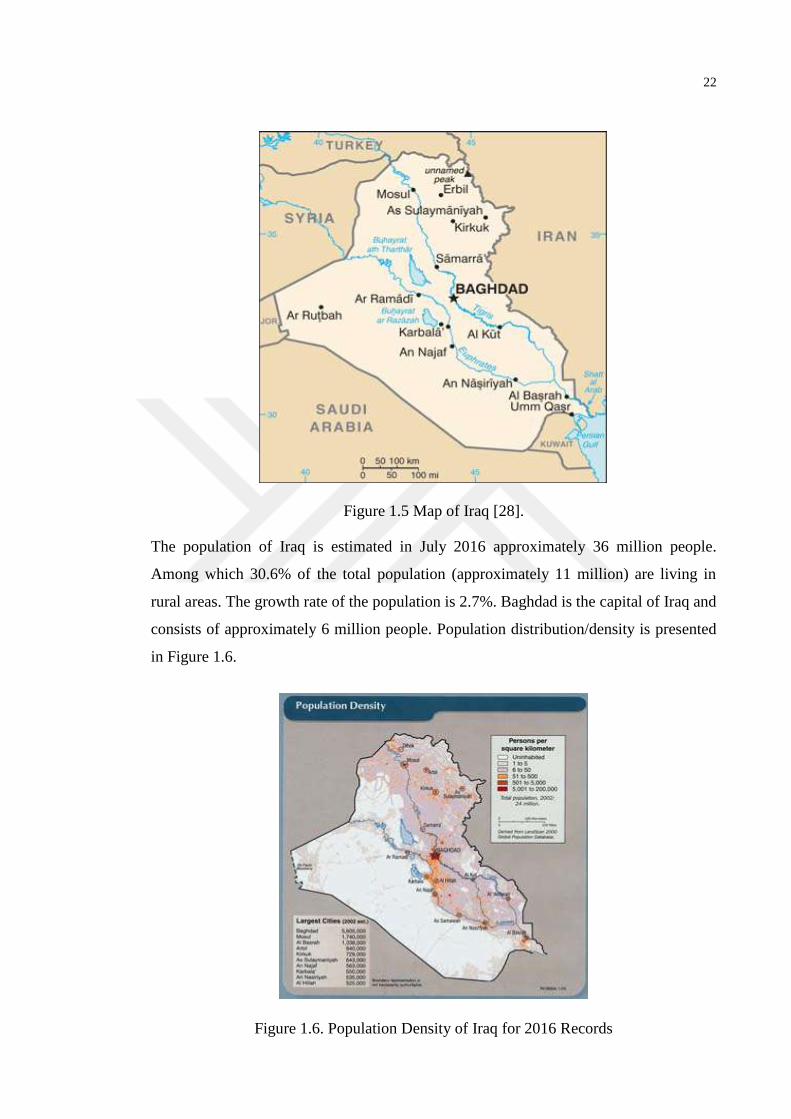
22
Figure 1.5 Map of Iraq [28].
The population of Iraq is estimated in July 2016 approximately 36 million people.
Among which 30.6% of the total population (approximately 11 million) are living in
rural areas. The growth rate of the population is 2.7%. Baghdad is the capital of Iraq and
consists of approximately 6 million people. Population distribution/density is presented
in Figure 1.6.
Figure 1.6. Population Density of Iraq for 2016 Records
23
Approximately, 97% of the total land in the country is arid with erratic and low rainfall.
The agricultural sector in most part of Iraq is suffering from the higher rate of
evapotranspiration and the rate is more than rainfall. Particularly in the desert area, the
temperature ranges widely from 10 to 46°C during the growing season of rice.
The agricultural system in Iraq still highly rely on the rainfall for both sheep and crop
production, although irrigation is available in a considerable portion of its agricultural
lands foothills, mountainous, and desert areas are heavily depending on the rainfed
agricultural practice.
Although crop production and climate change are an international concern, they are also
very important for the development of sustainable agriculture in Iraq as well. Due to the
physiographic status and geographic position, Iraq is a country of diverse climate
throughout the year. The climate conditions and the unfavorable weather condition are
always affecting the agricultural sector. It is true that the climate and weather are key
determinants for the sustainability and productivity of agriculture, although a significant
technological advancement has been achieved. Therefore, the agricultural sector in Iraq
is under huge pressure, both from the obstacles related to the degradation of agricultural
land and water endowments as well as huge and increasing demands for food. Any
external and internal risk (environmental, natural, political, and social) to agriculture
could directly affect the food security of the country as well as the production of rice.
Often the relationship between the production loss and these key factors are indirect,
many of the cases the circumstance is obvious. Iraq’s capability for restoring its
development is experienced with significant challenges and confounded by climate
change, although the recent strides regarding gaining sustainable development.
However, Iraq is a different case or situation because the Iraqi government does not care
about this problem even though Iraq is also having serious conflicts which are more
important than climate change for Iraqis to be considered. At the same time, there are
many individual studies about the main factors to prove the change in the climate, the
increase in temperature, the number of the dust storms and the decrease of rain levels. It
is important to note that at the end of the 21st century, the irrigation water and
agricultural production will be sustainably impacted by climate change in many parts of
the world including Iraq. It is worth to mention that the many of the farmlands in the
24
south and middle of Iraq is depending on the Tigris and Euphrates River for the
irrigation. The Iraqi government has taken water development programs which have
connected most of the water resources in Iraq that contribute significantly in the local
economy. In Iraq, more than 10 million people who live in a rural area, completely
depends on the irrigation system for their agriculture. Approximately, 20% of the
national employment is contributed by the agricultural sector.
Iraq is facing mixed prospects for the next year’s grain crop of the winter season. Will-
below-average winter precipitation and late plantings across the areas that are
depending on the rainfall, particularly in the areas of northern Iraq are reducing the
prospect of production of grains in the winter in Iraq. Due to the fact that the vegetative
growth decreased in many irrigated areas in Iraq, the increase in the planted area under
irrigation is still under question. In the present study, we include several climatic tables
and maps which are highlighting the principal zones of agriculture in Iraq, and it also
accumulated several historical data to understand the evolution of the production of the
agricultural system in the 21st century Iraq [44].
1.3.1. Agriculture Sector in Iraq
A small but vital proportion of the Iraqi economy is represented by the agricultural
sector. However, limited land coupled with the exponential growth of the population
and general inactivity in the productivity of the agriculture has consistently increased
the dependency on the import of food crops to mitigate the increasing demand since the
mid-1960s. Agriculture was Iraq’s primary economic activity before the development of
the petroleum industry. As late as 1976, employed more than half the total labor force
and it still contributed about 10% of Iraq’s GDP. Different natural factors like shortage
arable lands, scarcity water resources, and climate change, and several political factors
like involvement in military conflicts, particularly during the 2003 war, 1991 Gulf War,
and 1980-88 Iraq-Iran war, have been heavily influencing the role of agriculture in the
national economy [42].
The production system of the agriculture in Iraq is primarily divided into irrigated
agriculture, mainly in the plain of the Mesopotamia including the Euphrates and Tigris
rivers and rain-fed agriculture, mainly in the North of the country. Barley and wheat are
the most important rain-fed in the North, both of them are growing in the months of
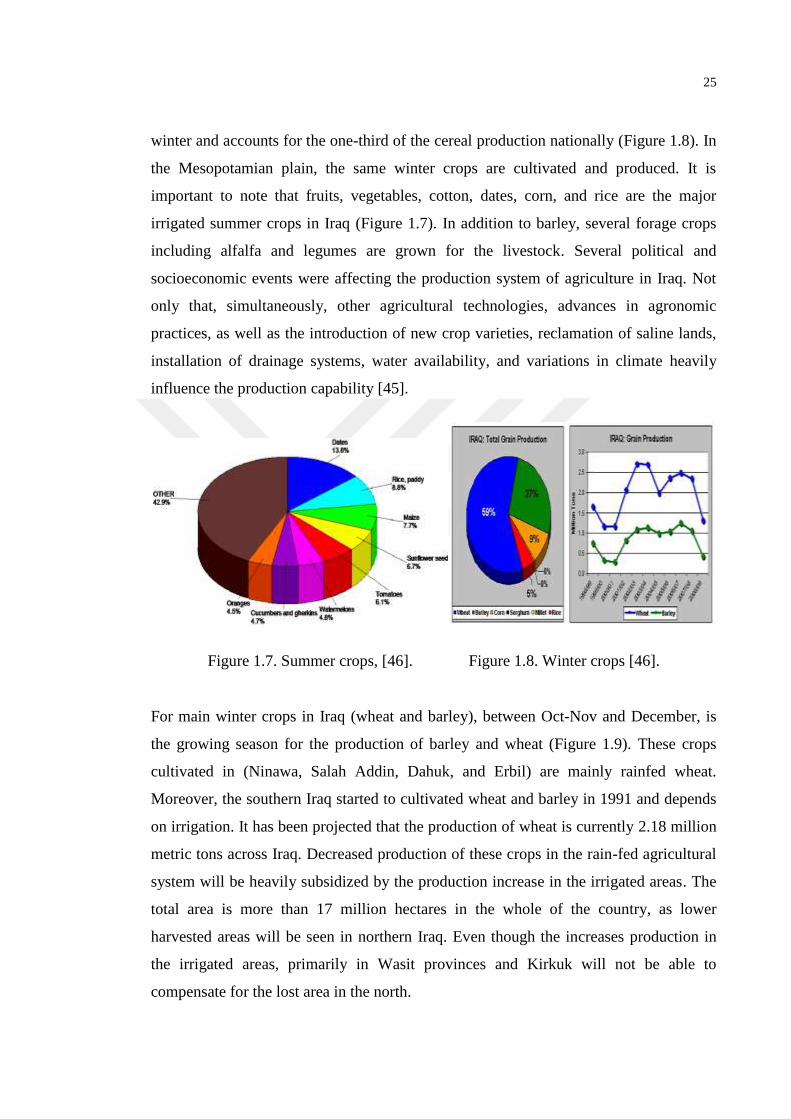
25
winter and accounts for the one-third of the cereal production nationally (Figure 1.8). In
the Mesopotamian plain, the same winter crops are cultivated and produced. It is
important to note that fruits, vegetables, cotton, dates, corn, and rice are the major
irrigated summer crops in Iraq (Figure 1.7). In addition to barley, several forage crops
including alfalfa and legumes are grown for the livestock. Several political and
socioeconomic events were affecting the production system of agriculture in Iraq. Not
only that, simultaneously, other agricultural technologies, advances in agronomic
practices, as well as the introduction of new crop varieties, reclamation of saline lands,
installation of drainage systems, water availability, and variations in climate heavily
influence the production capability [45].
Figure 1.7. Summer crops, [46]. Figure 1.8. Winter crops [46].
For main winter crops in Iraq (wheat and barley), between Oct-Nov and December, is
the growing season for the production of barley and wheat (Figure 1.9). These crops
cultivated in (Ninawa, Salah Addin, Dahuk, and Erbil) are mainly rainfed wheat.
Moreover, the southern Iraq started to cultivated wheat and barley in 1991 and depends
on irrigation. It has been projected that the production of wheat is currently 2.18 million
metric tons across Iraq. Decreased production of these crops in the rain-fed agricultural
system will be heavily subsidized by the production increase in the irrigated areas. The
total area is more than 17 million hectares in the whole of the country, as lower
harvested areas will be seen in northern Iraq. Even though the increases production in
the irrigated areas, primarily in Wasit provinces and Kirkuk will not be able to
compensate for the lost area in the north.
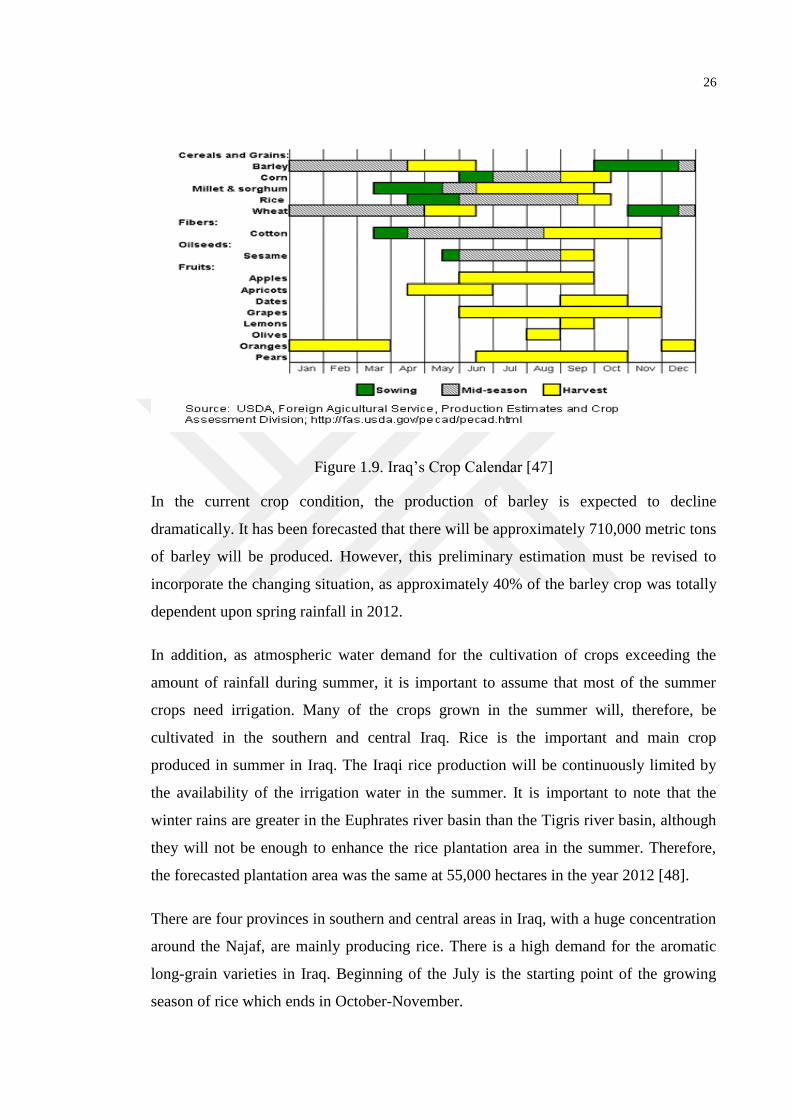
26
Figure 1.9. Iraq’s Crop Calendar [47]
In the current crop condition, the production of barley is expected to decline
dramatically. It has been forecasted that there will be approximately 710,000 metric tons
of barley will be produced. However, this preliminary estimation must be revised to
incorporate the changing situation, as approximately 40% of the barley crop was totally
dependent upon spring rainfall in 2012.
In addition, as atmospheric water demand for the cultivation of crops exceeding the
amount of rainfall during summer, it is important to assume that most of the summer
crops need irrigation. Many of the crops grown in the summer will, therefore, be
cultivated in the southern and central Iraq. Rice is the important and main crop
produced in summer in Iraq. The Iraqi rice production will be continuously limited by
the availability of the irrigation water in the summer. It is important to note that the
winter rains are greater in the Euphrates river basin than the Tigris river basin, although
they will not be enough to enhance the rice plantation area in the summer. Therefore,
the forecasted plantation area was the same at 55,000 hectares in the year 2012 [48].
There are four provinces in southern and central areas in Iraq, with a huge concentration
around the Najaf, are mainly producing rice. There is a high demand for the aromatic
long-grain varieties in Iraq. Beginning of the July is the starting point of the growing
season of rice which ends in October-November.
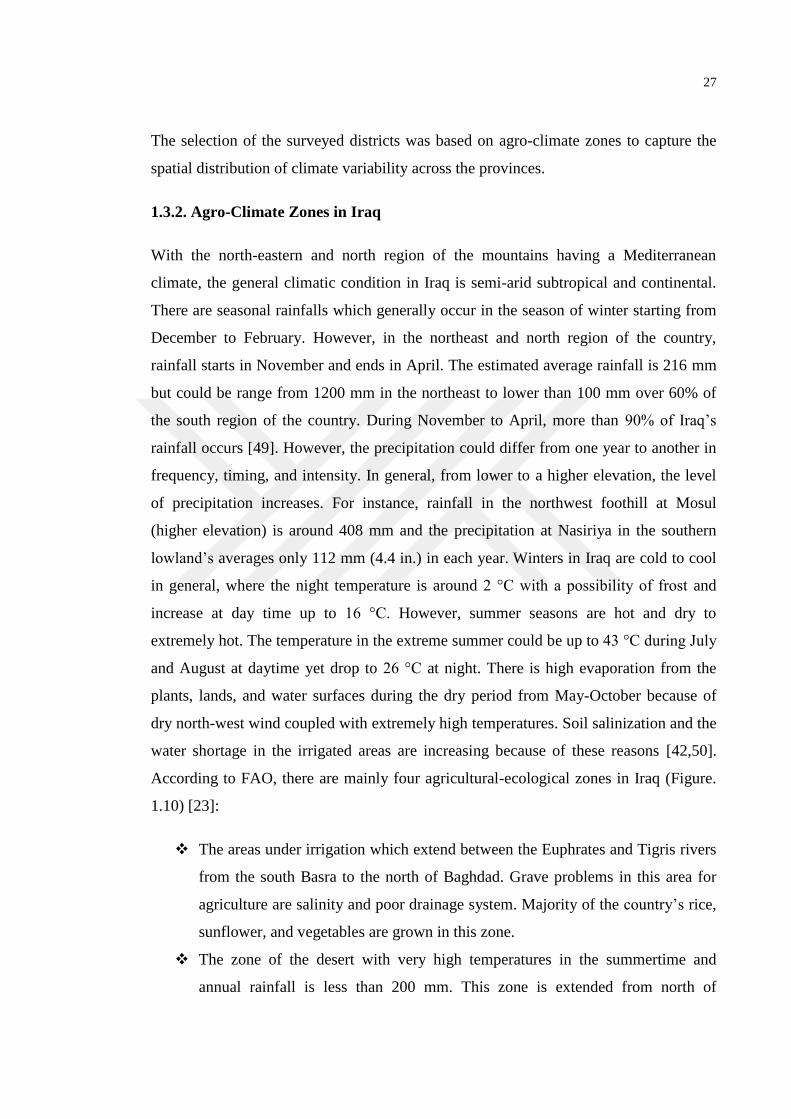
27
The selection of the surveyed districts was based on agro-climate zones to capture the
spatial distribution of climate variability across the provinces.
1.3.2. Agro-Climate Zones in Iraq
With the north-eastern and north region of the mountains having a Mediterranean
climate, the general climatic condition in Iraq is semi-arid subtropical and continental.
There are seasonal rainfalls which generally occur in the season of winter starting from
December to February. However, in the northeast and north region of the country,
rainfall starts in November and ends in April. The estimated average rainfall is 216 mm
but could be range from 1200 mm in the northeast to lower than 100 mm over 60% of
the south region of the country. During November to April, more than 90% of Iraq’s
rainfall occurs [49]. However, the precipitation could differ from one year to another in
frequency, timing, and intensity. In general, from lower to a higher elevation, the level
of precipitation increases. For instance, rainfall in the northwest foothill at Mosul
(higher elevation) is around 408 mm and the precipitation at Nasiriya in the southern
lowland’s averages only 112 mm (4.4 in.) in each year. Winters in Iraq are cold to cool
in general, where the night temperature is around 2 °C with a possibility of frost and
increase at day time up to 16 °C. However, summer seasons are hot and dry to
extremely hot. The temperature in the extreme summer could be up to 43 °C during July
and August at daytime yet drop to 26 °C at night. There is high evaporation from the
plants, lands, and water surfaces during the dry period from May-October because of
dry north-west wind coupled with extremely high temperatures. Soil salinization and the
water shortage in the irrigated areas are increasing because of these reasons [42,50].
According to FAO, there are mainly four agricultural-ecological zones in Iraq (Figure.
1.10) [23]:
The areas under irrigation which extend between the Euphrates and Tigris rivers
from the south Basra to the north of Baghdad. Grave problems in this area for
agriculture are salinity and poor drainage system. Majority of the country’s rice,
sunflower, and vegetables are grown in this zone.
The zone of the desert with very high temperatures in the summertime and
annual rainfall is less than 200 mm. This zone is extended from north of
28
Baghdad to Jordanian and Saudi Arabian borders. The population in this zone is
very light and there are few irrigated spots to grow few crops.
Steppes where the annual rainfall is around 200–400 mm. Although winters are
cold, summers are extremely hot. The desert zone and Mediterranean areas fall
in this zone. It includes the feed barley production areas, limited wheat
production, and it has limited irrigation.
Mediterranean climate with semi-arid and arid zones. In this zone, the growing
season is around nine months. More than 400 mm rainfall is expected each year
in the winter and mild/warm summers prevail. This zone covers mainly the
northern governorates of Iraq.
Although other field crops are also produced in smaller quantities, chickpea,
rice, barley, and wheat are the major crop in this zone. From bores, streams, and
springs there is some irrigation in this zone as well.
Figure 1.10. Agro-Climate Zones in Iraq [23]
The soil of Iraq is generally fertile and can be cultivated easily for the agricultural
purpose. There are two major types of soil can be seen- lighter soils which lack in
humus and clay content but contain wind-deposited nutrient and heavy alluvial deposits
of the Tigris-Euphrates Plain containing a significant amount of clay and humus.
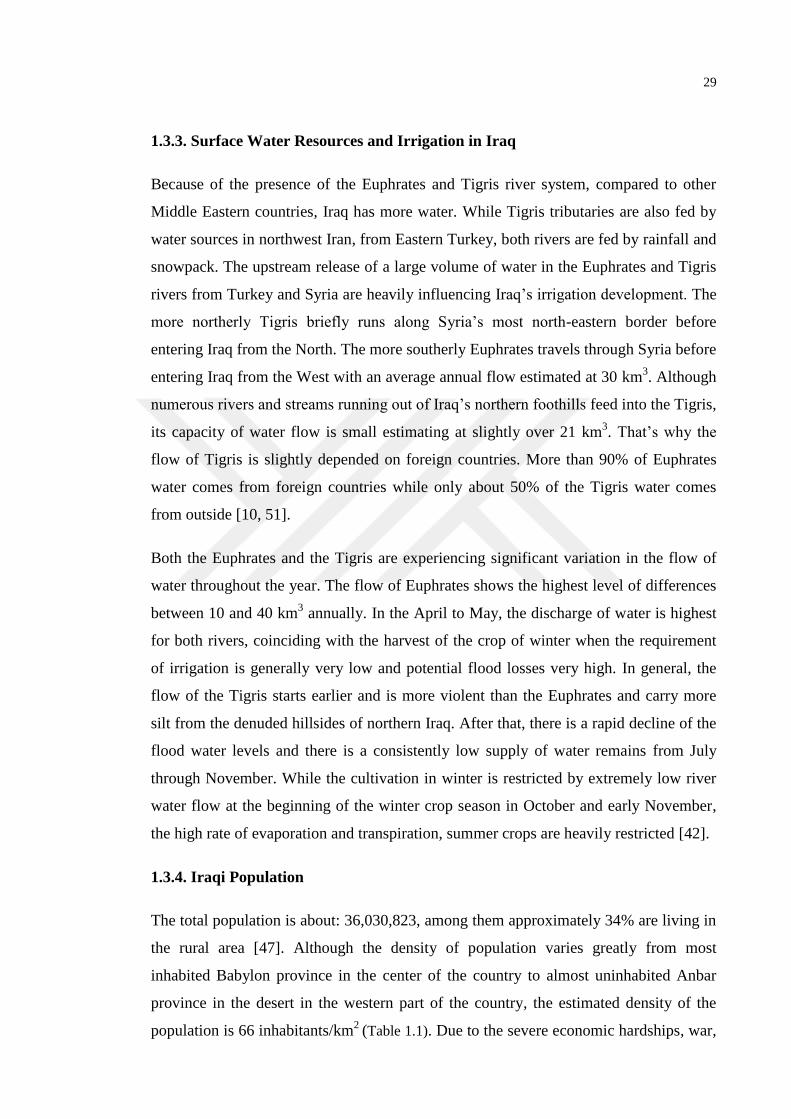
29
1.3.3. Surface Water Resources and Irrigation in Iraq
Because of the presence of the Euphrates and Tigris river system, compared to other
Middle Eastern countries, Iraq has more water. While Tigris tributaries are also fed by
water sources in northwest Iran, from Eastern Turkey, both rivers are fed by rainfall and
snowpack. The upstream release of a large volume of water in the Euphrates and Tigris
rivers from Turkey and Syria are heavily influencing Iraq’s irrigation development. The
more northerly Tigris briefly runs along Syria’s most north-eastern border before
entering Iraq from the North. The more southerly Euphrates travels through Syria before
entering Iraq from the West with an average annual flow estimated at 30 km3. Although
numerous rivers and streams running out of Iraq’s northern foothills feed into the Tigris,
its capacity of water flow is small estimating at slightly over 21 km3. That’s why the
flow of Tigris is slightly depended on foreign countries. More than 90% of Euphrates
water comes from foreign countries while only about 50% of the Tigris water comes
from outside [10, 51].
Both the Euphrates and the Tigris are experiencing significant variation in the flow of
water throughout the year. The flow of Euphrates shows the highest level of differences
between 10 and 40 km3 annually. In the April to May, the discharge of water is highest
for both rivers, coinciding with the harvest of the crop of winter when the requirement
of irrigation is generally very low and potential flood losses very high. In general, the
flow of the Tigris starts earlier and is more violent than the Euphrates and carry more
silt from the denuded hillsides of northern Iraq. After that, there is a rapid decline of the
flood water levels and there is a consistently low supply of water remains from July
through November. While the cultivation in winter is restricted by extremely low river
water flow at the beginning of the winter crop season in October and early November,
the high rate of evaporation and transpiration, summer crops are heavily restricted [42].
1.3.4. Iraqi Population
The total population is about: 36,030,823, among them approximately 34% are living in
the rural area [47]. Although the density of population varies greatly from most
inhabited Babylon province in the center of the country to almost uninhabited Anbar
province in the desert in the western part of the country, the estimated density of the
population is 66 inhabitants/km2
(Table 1.1). Due to the severe economic hardships, war,
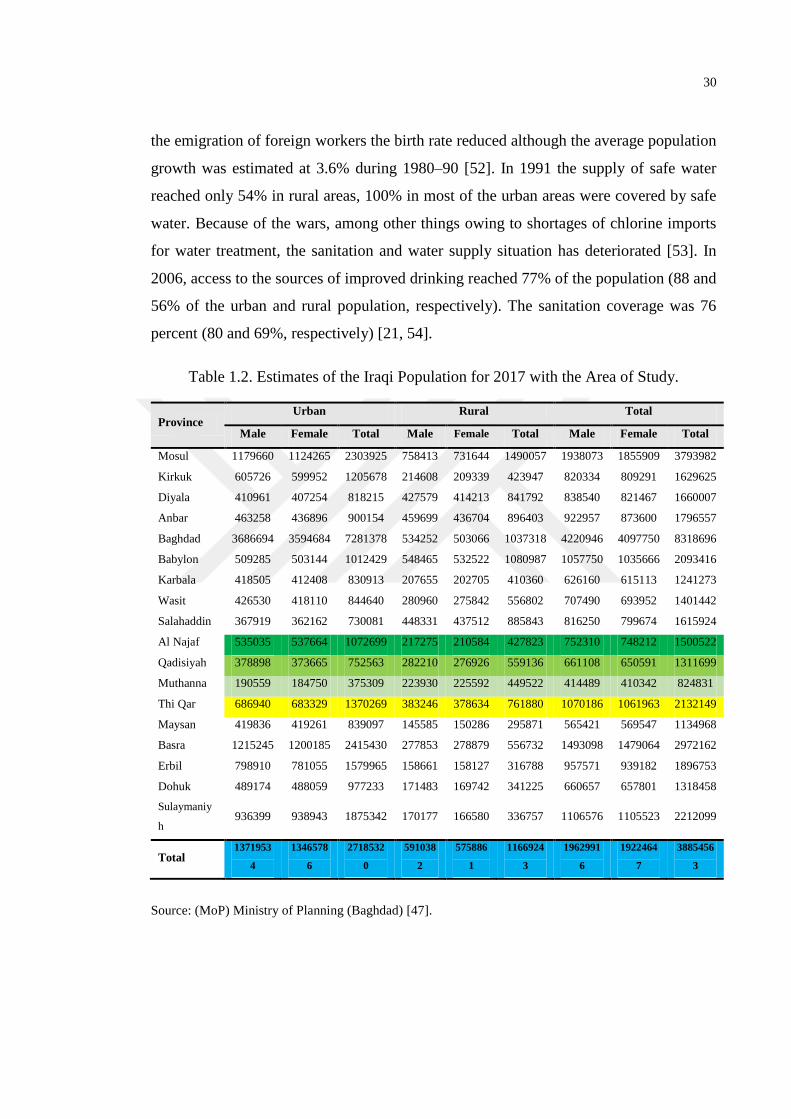
30
the emigration of foreign workers the birth rate reduced although the average population
growth was estimated at 3.6% during 1980–90 [52]. In 1991 the supply of safe water
reached only 54% in rural areas, 100% in most of the urban areas were covered by safe
water. Because of the wars, among other things owing to shortages of chlorine imports
for water treatment, the sanitation and water supply situation has deteriorated [53]. In
2006, access to the sources of improved drinking reached 77% of the population (88 and
56% of the urban and rural population, respectively). The sanitation coverage was 76
percent (80 and 69%, respectively) [21, 54].
Table 1.2. Estimates of the Iraqi Population for 2017 with the Area of Study.
Province Urban Rural Total
Male Female Total Male Female Total Male Female Total
Mosul 1179660 1124265 2303925 758413 731644 1490057 1938073 1855909 3793982
Kirkuk 605726 599952 1205678 214608 209339 423947 820334 809291 1629625
Diyala 410961 407254 818215 427579 414213 841792 838540 821467 1660007
Anbar 463258 436896 900154 459699 436704 896403 922957 873600 1796557
Baghdad 3686694 3594684 7281378 534252 503066 1037318 4220946 4097750 8318696
Babylon 509285 503144 1012429 548465 532522 1080987 1057750 1035666 2093416
Karbala 418505 412408 830913 207655 202705 410360 626160 615113 1241273
Wasit 426530 418110 844640 280960 275842 556802 707490 693952 1401442
Salahaddin 367919 362162 730081 448331 437512 885843 816250 799674 1615924
Al Najaf 535035 537664 1072699 217275 210584 427823 752310 748212 1500522
Qadisiyah 378898 373665 752563 282210 276926 559136 661108 650591 1311699
Muthanna 190559 184750 375309 223930 225592 449522 414489 410342 824831
Thi Qar 686940 683329 1370269 383246 378634 761880 1070186 1061963 2132149
Maysan 419836 419261 839097 145585 150286 295871 565421 569547 1134968
Basra 1215245 1200185 2415430 277853 278879 556732 1493098 1479064 2972162
Erbil 798910 781055 1579965 158661 158127 316788 957571 939182 1896753
Dohuk 489174 488059 977233 171483 169742 341225 660657 657801 1318458
Sulaymaniy
h 936399 938943 1875342 170177 166580 336757 1106576 1105523 2212099
Total 1371953
4
1346578
6
2718532
0
591038
2
575886
1
1166924
3
1962991
6
1922464
7
3885456
3
Source: (MoP) Ministry of Planning (Baghdad) [47].
31
CHAPTER TWO
MATERIALS AND METHODS
This study aims to investigate the Interactions between paddy production and climate
change and its Impact on rural development in Iraq.
The methodology chapter will show how this paper sizes up the big changes in the
environment, precipitation (rain), temperature and rivers levels and how affected in the
agriculture (especially paddy production), water resources of the study area, and how
the decreasing or increasing in paddy yields affected the rural livelihood in Iraq.
This paper will try to explain the phenomena, analyze the cause-effect and recommend
the policies suitable for Iraq. Both qualitative and quantitative designs methods are used
in this study as a questionnaire which included matters relating to the agricultural
production system and climate change was used in the interviews. In addition, after the
face to face interview with the farmers, focus group discussions were conducted. Paddy
farmers are the target group of this survey and were interviewed at their door house.
Primary data were obtained from interviews with the household head using a
questionnaire. It is important to note that the secondary data were obtained primarily
from recognized the internet, books, journals, research articles, international and
national organizations, and the data were described with Pearson correlation coefficient
analysis and appropriate descriptive statistical methods.
2.1. Research Design
The goals of this paper are to give the right answer to the questions or even give the
nearest solutions. This study chose to depend on fact data from some Iraqi ministries
and other studies and carried out based on exploratory research design to show the
effects of the climate change in Iraq, with doing a questionnaire to prove the second part
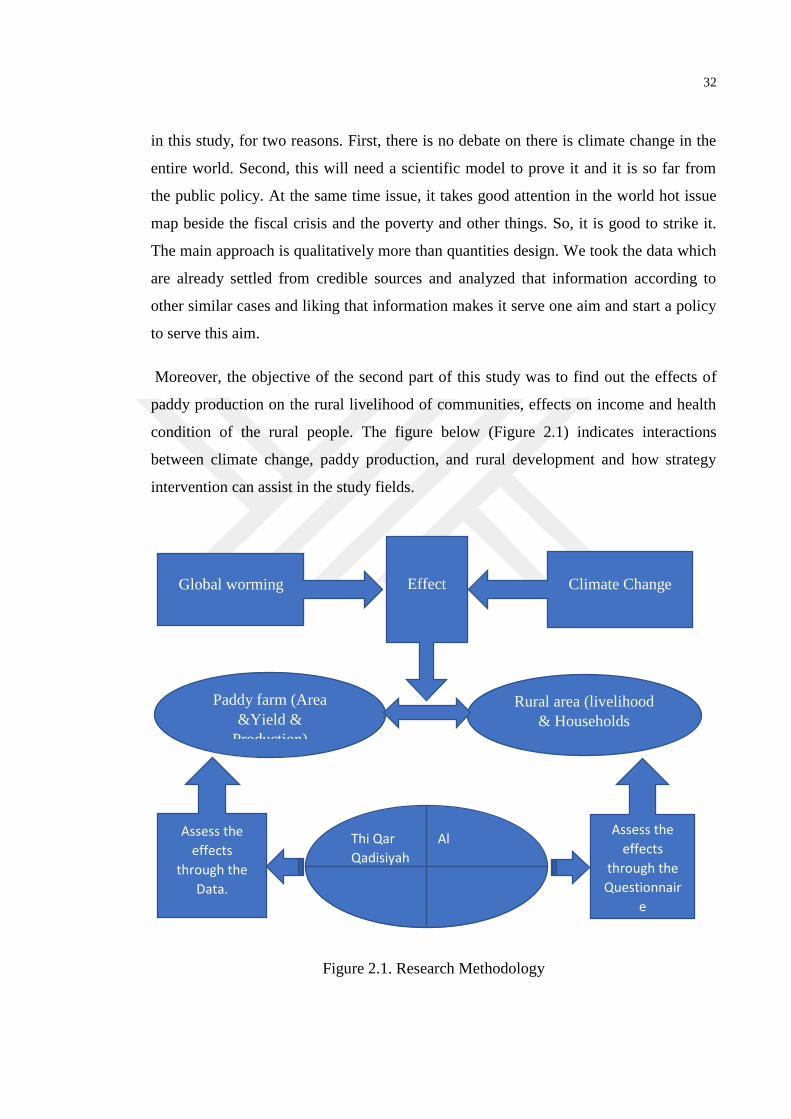
32
in this study, for two reasons. First, there is no debate on there is climate change in the
entire world. Second, this will need a scientific model to prove it and it is so far from
the public policy. At the same time issue, it takes good attention in the world hot issue
map beside the fiscal crisis and the poverty and other things. So, it is good to strike it.
The main approach is qualitatively more than quantities design. We took the data which
are already settled from credible sources and analyzed that information according to
other similar cases and liking that information makes it serve one aim and start a policy
to serve this aim.
Moreover, the objective of the second part of this study was to find out the effects of
paddy production on the rural livelihood of communities, effects on income and health
condition of the rural people. The figure below (Figure 2.1) indicates interactions
between climate change, paddy production, and rural development and how strategy
intervention can assist in the study fields.
Figure 2.1. Research Methodology
Global worming Effect Climate Change
Paddy farm (Area
&Yield &
Production)
Rural area (livelihood
& Households
Assess the
effects
through the
Questionnair
e
Assess the
effects
through the
Data.
Thi Qar Al
Qadisiyah
Al Muthanna Al Najaf
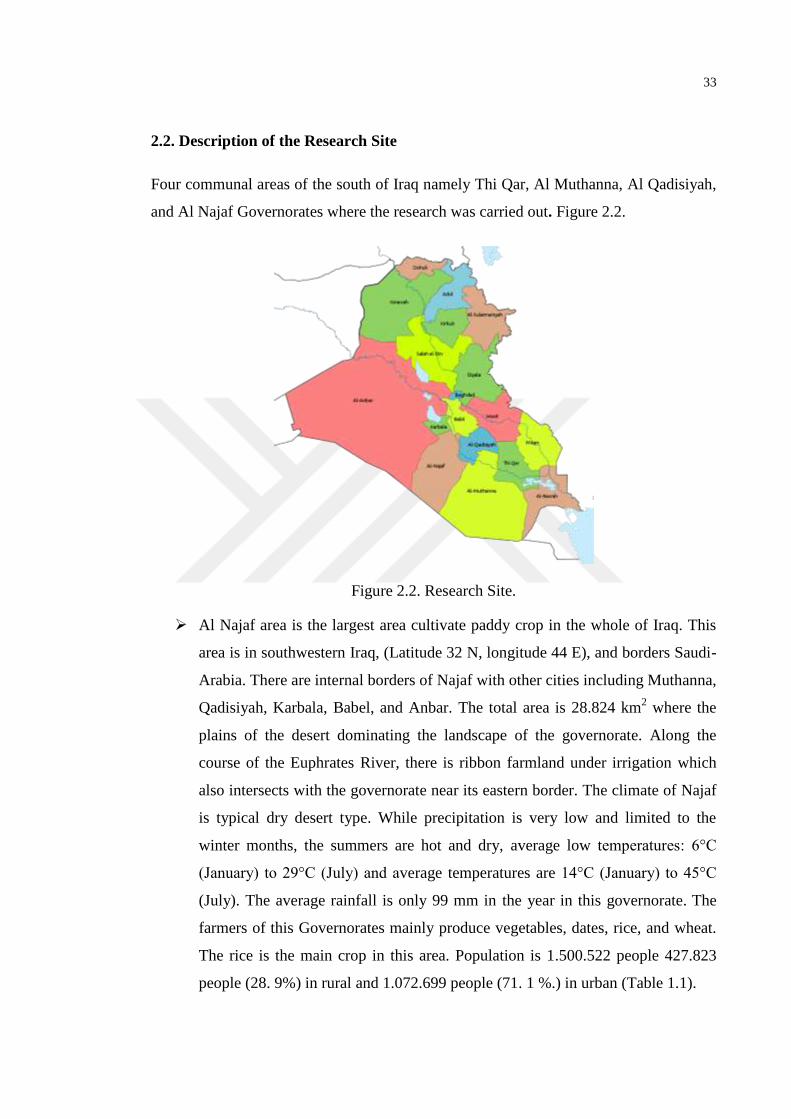
33
2.2. Description of the Research Site
Four communal areas of the south of Iraq namely Thi Qar, Al Muthanna, Al Qadisiyah,
and Al Najaf Governorates where the research was carried out. Figure 2.2.
Figure 2.2. Research Site.
Al Najaf area is the largest area cultivate paddy crop in the whole of Iraq. This
area is in southwestern Iraq, (Latitude 32 N, longitude 44 E), and borders Saudi-
Arabia. There are internal borders of Najaf with other cities including Muthanna,
Qadisiyah, Karbala, Babel, and Anbar. The total area is 28.824 km2 where the
plains of the desert dominating the landscape of the governorate. Along the
course of the Euphrates River, there is ribbon farmland under irrigation which
also intersects with the governorate near its eastern border. The climate of Najaf
is typical dry desert type. While precipitation is very low and limited to the
winter months, the summers are hot and dry, average low temperatures: 6°C
(January) to 29°C (July) and average temperatures are 14°C (January) to 45°C
(July). The average rainfall is only 99 mm in the year in this governorate. The
farmers of this Governorates mainly produce vegetables, dates, rice, and wheat.
The rice is the main crop in this area. Population is 1.500.522 people 427.823
people (28. 9%) in rural and 1.072.699 people (71. 1 %.) in urban (Table 1.1).
34
The second largest area of paddy production in Iraq is Al Qadisiyah, which is
also pronounced as Qadisiyah or Kadissiya, is in the plains of central and
southern areas of Iraq. The total area of this region is around 8153 km2. The
governorates of Thi-Qar, Wasit, Babel, Najaf, and Muthanna are bordered with
Qadisiyah. The Euphrates and the Shamiya River, both run through the
governorate. This rich fertile soil and abundance of water make this governorate
most fertile area of the country. With hot, dry summers, Qadisiyah has a typical
desert climate type. Average temperatures were 15°C (January) to 45°C (July-
August) and cooler winters, with average low temperatures: 6°C (January) and
27°C (July). There is a limited rainfall of 110 mm yearly in this governorate.
The number of Population is 1.311.699 people (559,136 people) (42.62%) in
rural and 752.563 people (57.38 %.) in urban (Table 1.1).
The third study area is Al Muthanna governorate is in the southwestern Iraq.
Muthanna shares internal boundaries with the governorates of Basrah, Thi-Qar,
Qadisiyah, and Najaf and international borders Saudi-Arabia. Although there is a
narrow ribbon of irrigated farmland along the Euphrates River in the north, the
governorate’s landscape is dominated by desert plains. A Salt Lake called Lake
Sawa is located to the west of the governorate’s capital Samawah. The total area
around 51.740 km2 and population is 824.831 people, (449.522 people (54.49%)
in rural and 375.309 people (45.51 %.) in urban (Table 1.1). The climate of this
study area is mainly dry desert type. While rainfall is very limited and restricted
to the winter months, in summer days the temperature could easily surpass 45°C.
The last area of this study is Thi Qar which is also spelled Thi-Qar alternatively.
This governorate situated in the southeast of Iraq which has internal borders with
Nissan, Wasit, Qadisiyah, Muthanna, and Basrah. The Hammar marshes in this
study area are fed by the Euphrates River. It is important to note that this marsh
covers one-third of the governorate’s surface. However, there is a drastic
shrinking following the draining campaign of the 1990s. For the oil exploration
and clear the land, in the 1970s and 1980s, parts of the marshlands had already
been drained. However, more than 90% of the marshland vanished by the time
of the 2003 invasion. It is important to note that there were several efforts to
increase the flow of water in this marshland which is partially successful.
35
However, the full restoration is hampered by the decreasing water levels in the
Euphrates and Tigris and the drought. It is also very important to point out that
the draining of water into the marshland also increasing the level of salt in the
water and soil of the area. Thi Qar total area around 12900 km2 and the
population is 2.132.149 people (761.880 people (35.73%) in rural and 1.370.269
people (64.27 %.) in urban (Table 1.1).
The region of Thi Qar has a typical dry desert climate. While the winters are
mild, the summers are dry and hot, with an average high temperature of 45°C.
Limited rainfall of around 100 mm in the months of November to April is the
characteristics of this area.
2.3. Sources of Data collection
Using the questionnaire survey method, the primary data were obtained directly from
the farmers. However, in the case of secondary data which were obtained through
searching related websites, organizations related to the environment, experts, from
individuals, published and unpublished documents, presentations, and different reports.
Parameters related to humidity, rainfall, and temperature of past 50 years (from 1966 to
2015) for the selected four districts were gathered from the Meteorological Services of
Iraq. 50 years of data regarding percent area planted, production, tons, and Paddy yield
was acquired from the Ministry of Agriculture, Baghdad. Before the questionnaire
survey, permission was obtained from the respective district offices to conduct a
questionnaire survey. The following local area was visited: 4 Governorates with 10 Sub-
districts, as a following: Al Najaf 3 Sub-districts, Al Qadisiyah 3 Sub-districts, Al
Muthanna 2 Sub-districts, and Thi Qar 2 Sub-districts. The survey targeted 223 farmers
in the area study Subdistricts. This number was a result of 3% of a total of paddy
farmers in each area (Table 2.1).
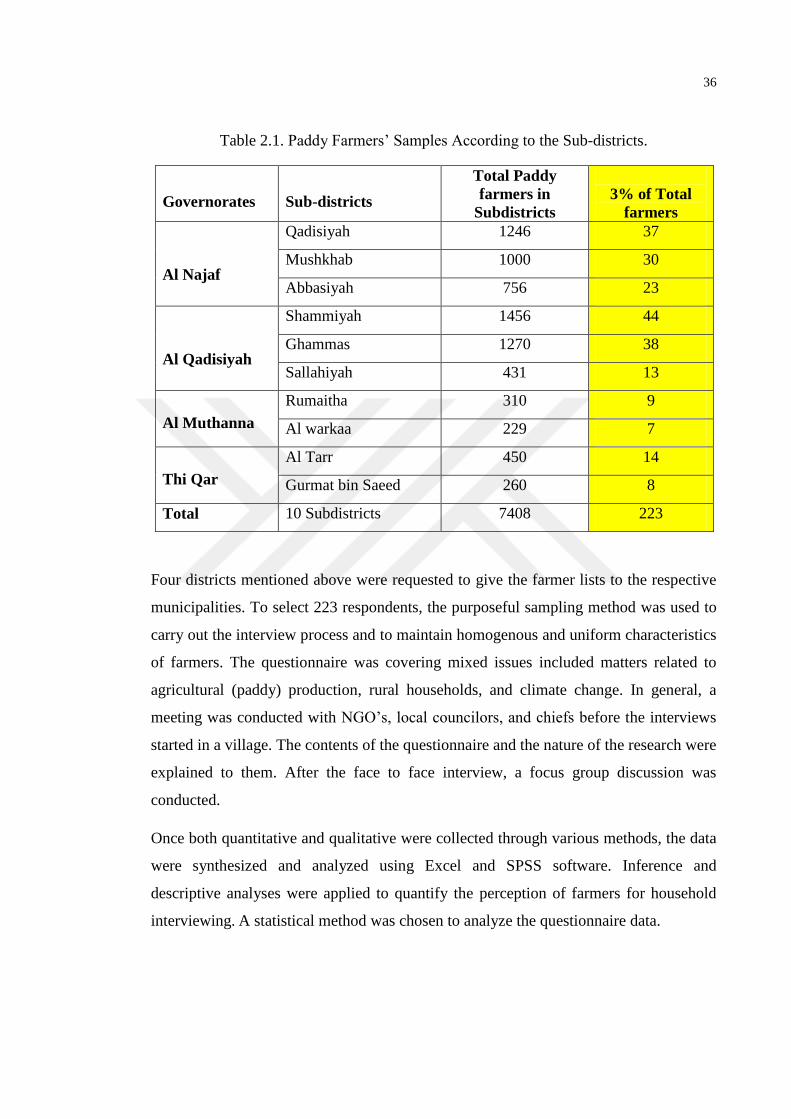
36
Table 2.1. Paddy Farmers’ Samples According to the Sub-districts.
Governorates
Sub-districts
Total Paddy
farmers in
Subdistricts
3% of Total
farmers
Al Najaf
Qadisiyah 1246 37
Mushkhab 1000 30
Abbasiyah 756 23
Al Qadisiyah
Shammiyah 1456 44
Ghammas 1270 38
Sallahiyah 431 13
Al Muthanna
Rumaitha 310 9
Al warkaa 229 7
Thi Qar
Al Tarr 450 14
Gurmat bin Saeed 260 8
Total 10 Subdistricts 7408 223
Four districts mentioned above were requested to give the farmer lists to the respective
municipalities. To select 223 respondents, the purposeful sampling method was used to
carry out the interview process and to maintain homogenous and uniform characteristics
of farmers. The questionnaire was covering mixed issues included matters related to
agricultural (paddy) production, rural households, and climate change. In general, a
meeting was conducted with NGO’s, local councilors, and chiefs before the interviews
started in a village. The contents of the questionnaire and the nature of the research were
explained to them. After the face to face interview, a focus group discussion was
conducted.
Once both quantitative and qualitative were collected through various methods, the data
were synthesized and analyzed using Excel and SPSS software. Inference and
descriptive analyses were applied to quantify the perception of farmers for household
interviewing. A statistical method was chosen to analyze the questionnaire data.

37
2.4. Questionnaire Survey on Interaction of Climate change with Paddy farming
in Rural areas of the Research Sites
Awareness of climate change issues has increased along with the breadth of studies on
the impact of climate change and global warming on various sectors. In addition to the
environmental field, other sectors that are directly related to human activities, such as
economic, social, and governance, also facing barriers and obstacles to climate change
issues. One of the systems likely to be affected by the climate condition is agriculture.
Climate change affects agricultural production due to the presence of extreme weather,
temperature changes, humidity, rainfall fluctuation, and seasonal patterns shift. The
changes and anomalies in climate can also be troublesome to predict the schedule of
planting and harvesting, as well as the water availability for irrigation. Cropping pattern
in the study area still highly depend on agro-climate condition, especially for paddy
farming systems which became the main food crops and agricultural commodities
featured for most farmers in the rural area.
A questionnaire survey will be conducted to provide the basic quantitative information
of paddy farmer’s knowledge of climate change, affected paddy production on rural
households, perception and risk perception of climate variability, also the adaptation
measure that has been taken by farmers. A total (223) paddy farmers have responded
from (10) sub-district. The characteristic of farmers was also identified through the
questionnaire on the level of education, farming experience, agricultural skill, land
ownership, cultivation area, type of rice field, and the field distance to the water
resource. The questionnaire form is presented in Annex. It has four sections; each one
has many specific factors. The first section represents the common personal
information, the second section is talking about the land information, the third and
fourth about a specific question about climate change, paddy production and rural
households in the study area (Figure 2.3).
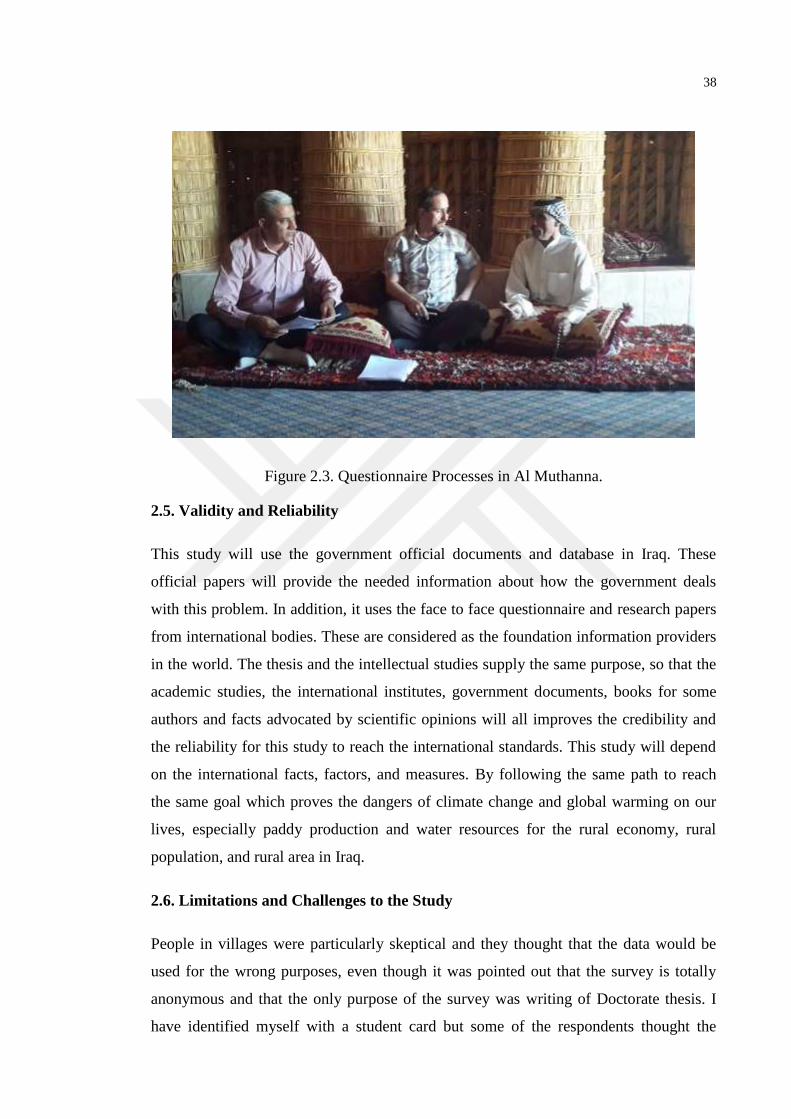
38
Figure 2.3. Questionnaire Processes in Al Muthanna.
2.5. Validity and Reliability
This study will use the government official documents and database in Iraq. These
official papers will provide the needed information about how the government deals
with this problem. In addition, it uses the face to face questionnaire and research papers
from international bodies. These are considered as the foundation information providers
in the world. The thesis and the intellectual studies supply the same purpose, so that the
academic studies, the international institutes, government documents, books for some
authors and facts advocated by scientific opinions will all improves the credibility and
the reliability for this study to reach the international standards. This study will depend
on the international facts, factors, and measures. By following the same path to reach
the same goal which proves the dangers of climate change and global warming on our
lives, especially paddy production and water resources for the rural economy, rural
population, and rural area in Iraq.
2.6. Limitations and Challenges to the Study
People in villages were particularly skeptical and they thought that the data would be
used for the wrong purposes, even though it was pointed out that the survey is totally
anonymous and that the only purpose of the survey was writing of Doctorate thesis. I
have identified myself with a student card but some of the respondents thought the
39
survey was a type of a check of the financial status by non-governmental organizations
that might have political intentions or by the banks itself. This situation had an effect on
the number of respondents, it was planned for more than 223 households, 50 in each
municipality, but only 223 respondents were interviewed.
This study will try to change the government policies to reduce impacts of climate
change on rural human health and the environment and improve the economic sector in
a rural area (agriculture and water resource) through reduced or at least improved the
methods to deal with it, and it is not a simple task. There are a series of influential actors
that display complex relations within themselves. In the same time targeting this issue
will have some an acceptance from many sides, especially Iraq and the entire world
interring a new and critical situation through the war against terrorism, so the general
idea about the climate is much less important than terrorism.
Nevertheless, this study managing to identify some elements of approaches to
agriculture especially rice production, and some economic policies that potentially
reduces negative side-effects from climate change at least in some area in Iraq. The
resulting policy conclusions take into shown in a country case study and the probable
future development that could have an impact on paddy production in rural area
policies. The government also has provided a concrete example of specific policies and
programs, some of this experience under specific needs. The policy will conclusion later
are based on analytical results and aim at promoting environmental and economic
sustainability.
2.7. Statistical Analysis
The questionnaire and primary data were analyzed by using the Statistical Package for
the Social Sciences (SPSS, version 21.0). One-Way and Two-Way Analysis of Variance
test (ANOVA) were used to compare data regarding studied factors. The levels of
significance were 5% (p < 0.05) and 1% (p < 0.01).
40
CHAPTER THREE
RESULTS AND DISCUSSION
3.1. Extreme Precipitation Trends and Indices of Temperature for Study Areas
Iraq faces a unique set of environmental challenges, considering that it is one of the
most vulnerable countries in the Arabic region. In recent years, the impact of changing
weather pattern has already made themselves felt (temperature increasing and rainfall
decreasing), with rising environmental degradation and higher intensity and frequency
of the events of extreme weather throughout the country.
While monthly rainfall data were used to compute rainfall indices, the monthly mean,
minimum, and maximum temperature were used to compute the different extreme
temperature indices in the areas studied. The data were obtained from the Iraqi
Meteorological Services Department.
3.2. Rainfall in Iraq
The in most of Iraq the climate is semi-arid and subtropical. It is important to note that
the rainfall in Iraq is very seasonal. Rainfall distribution is temporally and spatially
uneven. Roughly 90% of the annual rainfall happens in the month of Octobers to May.
The highest level of precipitation was recorded in the month of December and February.
The remaining months are dry, particularly the hottest ones from June to August.
It has been estimated that the average annual rainfall is 154 mm, but it could range from
less than 100 mm in the south (60% of the country) to 1,200 mm in the mountainous
region of the countries north-eastern region. It is important to note that the central or
southern desert region receives less rainfall than northern Iraq’s mountainous region. In
the northeast of the country, there is a higher practice of rain fed agriculture. There is
very little rainfall and agriculture is primarily dependent on the irrigation system in the
plains, where most of the population lives. This is due to the fact that in recent years
Iraq is facing very cold winters, but with a shortage of rainfall. Because of that, Iraq
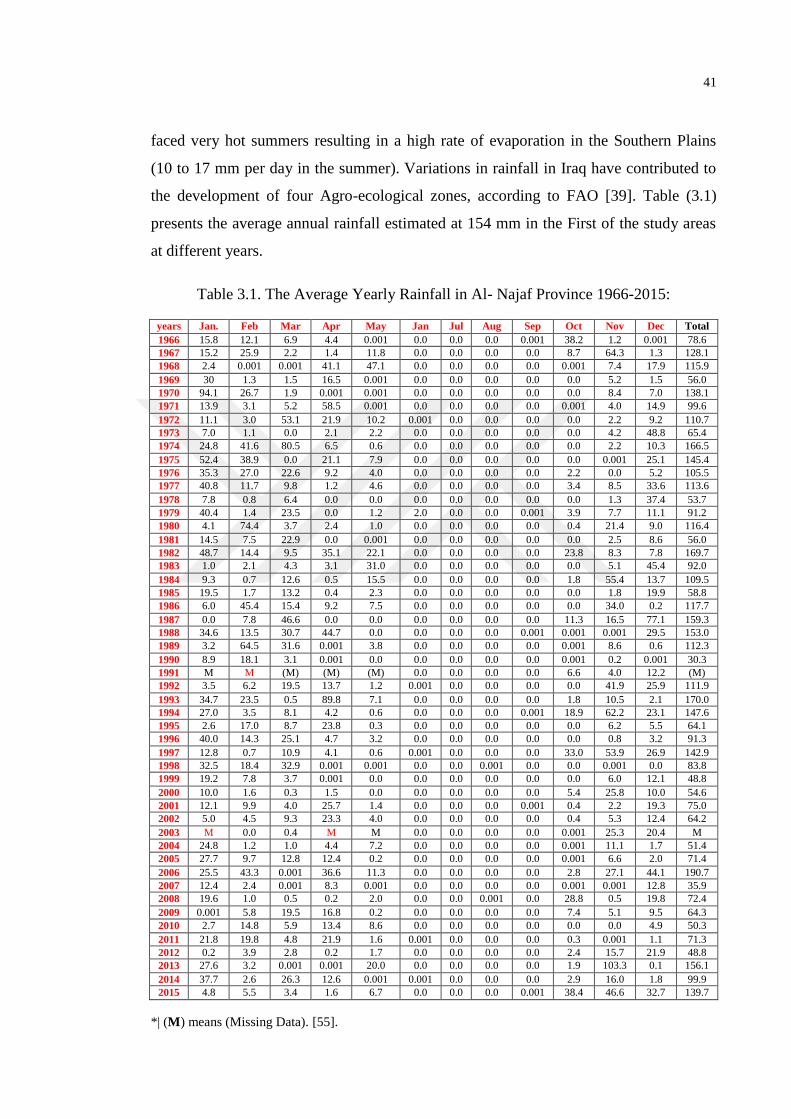
41
faced very hot summers resulting in a high rate of evaporation in the Southern Plains
(10 to 17 mm per day in the summer). Variations in rainfall in Iraq have contributed to
the development of four Agro-ecological zones, according to FAO [39]. Table (3.1)
presents the average annual rainfall estimated at 154 mm in the First of the study areas
at different years.
Table 3.1. The Average Yearly Rainfall in Al- Najaf Province 1966-2015:
years Jan. Feb Mar Apr May Jan Jul Aug Sep Oct Nov Dec Total
1966 15.8 12.1 6.9 4.4 0.001 0.0 0.0 0.0 0.001 38.2 1.2 0.001 78.6
1967 15.2 25.9 2.2 1.4 11.8 0.0 0.0 0.0 0.0 8.7 64.3 1.3 128.1
1968 2.4 0.001 0.001 41.1 47.1 0.0 0.0 0.0 0.0 0.001 7.4 17.9 115.9
1969 30 1.3 1.5 16.5 0.001 0.0 0.0 0.0 0.0 0.0 5.2 1.5 56.0
1970 94.1 26.7 1.9 0.001 0.001 0.0 0.0 0.0 0.0 0.0 8.4 7.0 138.1
1971 13.9 3.1 5.2 58.5 0.001 0.0 0.0 0.0 0.0 0.001 4.0 14.9 99.6
1972 11.1 3.0 53.1 21.9 10.2 0.001 0.0 0.0 0.0 0.0 2.2 9.2 110.7
1973 7.0 1.1 0.0 2.1 2.2 0.0 0.0 0.0 0.0 0.0 4.2 48.8 65.4
1974 24.8 41.6 80.5 6.5 0.6 0.0 0.0 0.0 0.0 0.0 2.2 10.3 166.5
1975 52.4 38.9 0.0 21.1 7.9 0.0 0.0 0.0 0.0 0.0 0.001 25.1 145.4
1976 35.3 27.0 22.6 9.2 4.0 0.0 0.0 0.0 0.0 2.2 0.0 5.2 105.5
1977 40.8 11.7 9.8 1.2 4.6 0.0 0.0 0.0 0.0 3.4 8.5 33.6 113.6
1978 7.8 0.8 6.4 0.0 0.0 0.0 0.0 0.0 0.0 0.0 1.3 37.4 53.7
1979 40.4 1.4 23.5 0.0 1.2 2.0 0.0 0.0 0.001 3.9 7.7 11.1 91.2
1980 4.1 74.4 3.7 2.4 1.0 0.0 0.0 0.0 0.0 0.4 21.4 9.0 116.4
1981 14.5 7.5 22.9 0.0 0.001 0.0 0.0 0.0 0.0 0.0 2.5 8.6 56.0
1982 48.7 14.4 9.5 35.1 22.1 0.0 0.0 0.0 0.0 23.8 8.3 7.8 169.7
1983 1.0 2.1 4.3 3.1 31.0 0.0 0.0 0.0 0.0 0.0 5.1 45.4 92.0
1984 9.3 0.7 12.6 0.5 15.5 0.0 0.0 0.0 0.0 1.8 55.4 13.7 109.5
1985 19.5 1.7 13.2 0.4 2.3 0.0 0.0 0.0 0.0 0.0 1.8 19.9 58.8
1986 6.0 45.4 15.4 9.2 7.5 0.0 0.0 0.0 0.0 0.0 34.0 0.2 117.7
1987 0.0 7.8 46.6 0.0 0.0 0.0 0.0 0.0 0.0 11.3 16.5 77.1 159.3
1988 34.6 13.5 30.7 44.7 0.0 0.0 0.0 0.0 0.001 0.001 0.001 29.5 153.0
1989 3.2 64.5 31.6 0.001 3.8 0.0 0.0 0.0 0.0 0.001 8.6 0.6 112.3
1990 8.9 18.1 3.1 0.001 0.0 0.0 0.0 0.0 0.0 0.001 0.2 0.001 30.3
1991 M M (M) (M) (M) 0.0 0.0 0.0 0.0 6.6 4.0 12.2 (M)
1992 3.5 6.2 19.5 13.7 1.2 0.001 0.0 0.0 0.0 0.0 41.9 25.9 111.9
1993 34.7 23.5 0.5 89.8 7.1 0.0 0.0 0.0 0.0 1.8 10.5 2.1 170.0
1994 27.0 3.5 8.1 4.2 0.6 0.0 0.0 0.0 0.001 18.9 62.2 23.1 147.6
1995 2.6 17.0 8.7 23.8 0.3 0.0 0.0 0.0 0.0 0.0 6.2 5.5 64.1
1996 40.0 14.3 25.1 4.7 3.2 0.0 0.0 0.0 0.0 0.0 0.8 3.2 91.3
1997 12.8 0.7 10.9 4.1 0.6 0.001 0.0 0.0 0.0 33.0 53.9 26.9 142.9
1998 32.5 18.4 32.9 0.001 0.001 0.0 0.0 0.001 0.0 0.0 0.001 0.0 83.8
1999 19.2 7.8 3.7 0.001 0.0 0.0 0.0 0.0 0.0 0.0 6.0 12.1 48.8
2000 10.0 1.6 0.3 1.5 0.0 0.0 0.0 0.0 0.0 5.4 25.8 10.0 54.6
2001 12.1 9.9 4.0 25.7 1.4 0.0 0.0 0.0 0.001 0.4 2.2 19.3 75.0
2002 5.0 4.5 9.3 23.3 4.0 0.0 0.0 0.0 0.0 0.4 5.3 12.4 64.2
2003 M 0.0 0.4 M M 0.0 0.0 0.0 0.0 0.001 25.3 20.4 M
2004 24.8 1.2 1.0 4.4 7.2 0.0 0.0 0.0 0.0 0.001 11.1 1.7 51.4
2005 27.7 9.7 12.8 12.4 0.2 0.0 0.0 0.0 0.0 0.001 6.6 2.0 71.4
2006 25.5 43.3 0.001 36.6 11.3 0.0 0.0 0.0 0.0 2.8 27.1 44.1 190.7
2007 12.4 2.4 0.001 8.3 0.001 0.0 0.0 0.0 0.0 0.001 0.001 12.8 35.9
2008 19.6 1.0 0.5 0.2 2.0 0.0 0.0 0.001 0.0 28.8 0.5 19.8 72.4
2009 0.001 5.8 19.5 16.8 0.2 0.0 0.0 0.0 0.0 7.4 5.1 9.5 64.3
2010 2.7 14.8 5.9 13.4 8.6 0.0 0.0 0.0 0.0 0.0 0.0 4.9 50.3
2011 21.8 19.8 4.8 21.9 1.6 0.001 0.0 0.0 0.0 0.3 0.001 1.1 71.3
2012 0.2 3.9 2.8 0.2 1.7 0.0 0.0 0.0 0.0 2.4 15.7 21.9 48.8
2013 27.6 3.2 0.001 0.001 20.0 0.0 0.0 0.0 0.0 1.9 103.3 0.1 156.1
2014 37.7 2.6 26.3 12.6 0.001 0.001 0.0 0.0 0.0 2.9 16.0 1.8 99.9
2015 4.8 5.5 3.4 1.6 6.7 0.0 0.0 0.0 0.001 38.4 46.6 32.7 139.7
*| (M) means (Missing Data). [55].
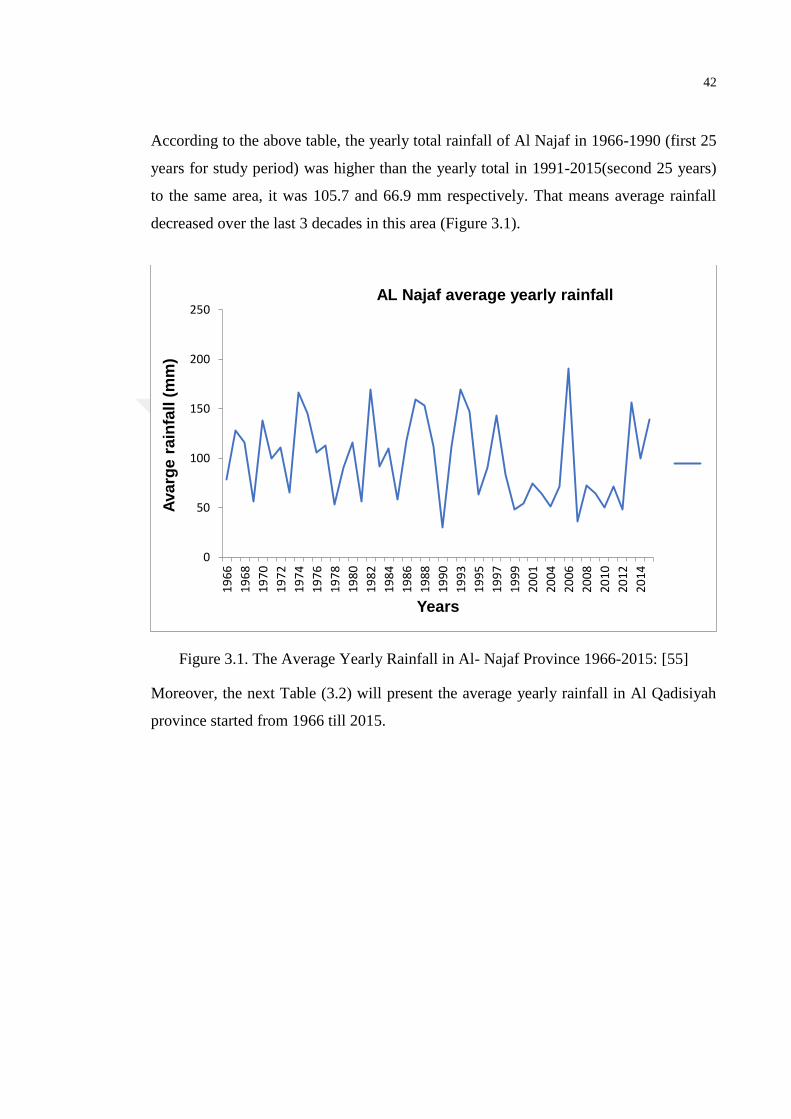
42
According to the above table, the yearly total rainfall of Al Najaf in 1966-1990 (first 25
years for study period) was higher than the yearly total in 1991-2015(second 25 years)
to the same area, it was 105.7 and 66.9 mm respectively. That means average rainfall
decreased over the last 3 decades in this area (Figure 3.1).
Figure 3.1. The Average Yearly Rainfall in Al- Najaf Province 1966-2015: [55]
Moreover, the next Table (3.2) will present the average yearly rainfall in Al Qadisiyah
province started from 1966 till 2015.
0
50
100
150
200
250
19
66
19
68
19
70
19
72
19
74
19
76
19
78
19
80
19
82
19
84
19
86
19
88
19
90
19
93
19
95
19
97
19
99
20
01
20
04
20
06
20
08
20
10
20
12
20
14
Ava
rge
ra
infa
ll (
mm
)
Years
AL Najaf average yearly rainfall
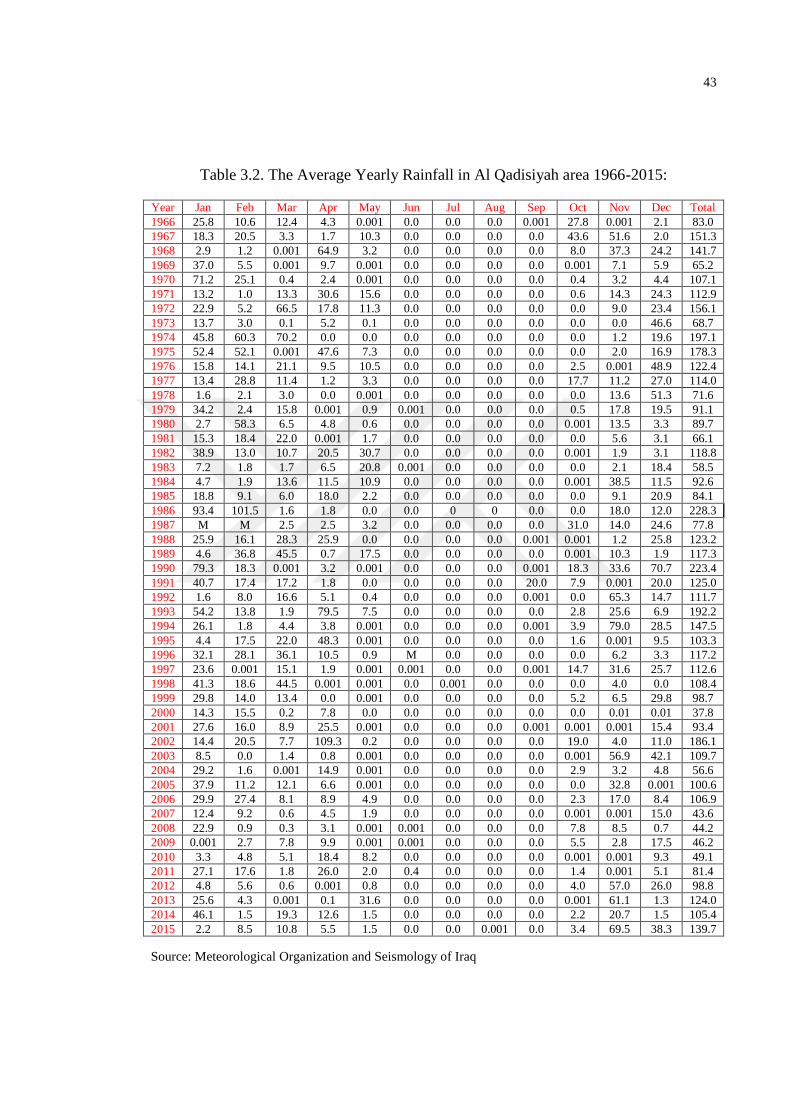
43
Table 3.2. The Average Yearly Rainfall in Al Qadisiyah area 1966-2015:
Year Jan Feb Mar Apr May Jun Jul Aug Sep Oct Nov Dec Total
1966 25.8 10.6 12.4 4.3 0.001 0.0 0.0 0.0 0.001 27.8 0.001 2.1 83.0
1967 18.3 20.5 3.3 1.7 10.3 0.0 0.0 0.0 0.0 43.6 51.6 2.0 151.3
1968 2.9 1.2 0.001 64.9 3.2 0.0 0.0 0.0 0.0 8.0 37.3 24.2 141.7
1969 37.0 5.5 0.001 9.7 0.001 0.0 0.0 0.0 0.0 0.001 7.1 5.9 65.2
1970 71.2 25.1 0.4 2.4 0.001 0.0 0.0 0.0 0.0 0.4 3.2 4.4 107.1
1971 13.2 1.0 13.3 30.6 15.6 0.0 0.0 0.0 0.0 0.6 14.3 24.3 112.9
1972 22.9 5.2 66.5 17.8 11.3 0.0 0.0 0.0 0.0 0.0 9.0 23.4 156.1
1973 13.7 3.0 0.1 5.2 0.1 0.0 0.0 0.0 0.0 0.0 0.0 46.6 68.7
1974 45.8 60.3 70.2 0.0 0.0 0.0 0.0 0.0 0.0 0.0 1.2 19.6 197.1
1975 52.4 52.1 0.001 47.6 7.3 0.0 0.0 0.0 0.0 0.0 2.0 16.9 178.3
1976 15.8 14.1 21.1 9.5 10.5 0.0 0.0 0.0 0.0 2.5 0.001 48.9 122.4
1977 13.4 28.8 11.4 1.2 3.3 0.0 0.0 0.0 0.0 17.7 11.2 27.0 114.0
1978 1.6 2.1 3.0 0.0 0.001 0.0 0.0 0.0 0.0 0.0 13.6 51.3 71.6
1979 34.2 2.4 15.8 0.001 0.9 0.001 0.0 0.0 0.0 0.5 17.8 19.5 91.1
1980 2.7 58.3 6.5 4.8 0.6 0.0 0.0 0.0 0.0 0.001 13.5 3.3 89.7
1981 15.3 18.4 22.0 0.001 1.7 0.0 0.0 0.0 0.0 0.0 5.6 3.1 66.1
1982 38.9 13.0 10.7 20.5 30.7 0.0 0.0 0.0 0.0 0.001 1.9 3.1 118.8
1983 7.2 1.8 1.7 6.5 20.8 0.001 0.0 0.0 0.0 0.0 2.1 18.4 58.5
1984 4.7 1.9 13.6 11.5 10.9 0.0 0.0 0.0 0.0 0.001 38.5 11.5 92.6
1985 18.8 9.1 6.0 18.0 2.2 0.0 0.0 0.0 0.0 0.0 9.1 20.9 84.1
1986 93.4 101.5 1.6 1.8 0.0 0.0 0 0 0.0 0.0 18.0 12.0 228.3
1987 M M 2.5 2.5 3.2 0.0 0.0 0.0 0.0 31.0 14.0 24.6 77.8
1988 25.9 16.1 28.3 25.9 0.0 0.0 0.0 0.0 0.001 0.001 1.2 25.8 123.2
1989 4.6 36.8 45.5 0.7 17.5 0.0 0.0 0.0 0.0 0.001 10.3 1.9 117.3
1990 79.3 18.3 0.001 3.2 0.001 0.0 0.0 0.0 0.001 18.3 33.6 70.7 223.4
1991 40.7 17.4 17.2 1.8 0.0 0.0 0.0 0.0 20.0 7.9 0.001 20.0 125.0
1992 1.6 8.0 16.6 5.1 0.4 0.0 0.0 0.0 0.001 0.0 65.3 14.7 111.7
1993 54.2 13.8 1.9 79.5 7.5 0.0 0.0 0.0 0.0 2.8 25.6 6.9 192.2
1994 26.1 1.8 4.4 3.8 0.001 0.0 0.0 0.0 0.001 3.9 79.0 28.5 147.5
1995 4.4 17.5 22.0 48.3 0.001 0.0 0.0 0.0 0.0 1.6 0.001 9.5 103.3
1996 32.1 28.1 36.1 10.5 0.9 M 0.0 0.0 0.0 0.0 6.2 3.3 117.2
1997 23.6 0.001 15.1 1.9 0.001 0.001 0.0 0.0 0.001 14.7 31.6 25.7 112.6
1998 41.3 18.6 44.5 0.001 0.001 0.0 0.001 0.0 0.0 0.0 4.0 0.0 108.4
1999 29.8 14.0 13.4 0.0 0.001 0.0 0.0 0.0 0.0 5.2 6.5 29.8 98.7
2000 14.3 15.5 0.2 7.8 0.0 0.0 0.0 0.0 0.0 0.0 0.01 0.01 37.8
2001 27.6 16.0 8.9 25.5 0.001 0.0 0.0 0.0 0.001 0.001 0.001 15.4 93.4
2002 14.4 20.5 7.7 109.3 0.2 0.0 0.0 0.0 0.0 19.0 4.0 11.0 186.1
2003 8.5 0.0 1.4 0.8 0.001 0.0 0.0 0.0 0.0 0.001 56.9 42.1 109.7
2004 29.2 1.6 0.001 14.9 0.001 0.0 0.0 0.0 0.0 2.9 3.2 4.8 56.6
2005 37.9 11.2 12.1 6.6 0.001 0.0 0.0 0.0 0.0 0.0 32.8 0.001 100.6
2006 29.9 27.4 8.1 8.9 4.9 0.0 0.0 0.0 0.0 2.3 17.0 8.4 106.9
2007 12.4 9.2 0.6 4.5 1.9 0.0 0.0 0.0 0.0 0.001 0.001 15.0 43.6
2008 22.9 0.9 0.3 3.1 0.001 0.001 0.0 0.0 0.0 7.8 8.5 0.7 44.2
2009 0.001 2.7 7.8 9.9 0.001 0.001 0.0 0.0 0.0 5.5 2.8 17.5 46.2
2010 3.3 4.8 5.1 18.4 8.2 0.0 0.0 0.0 0.0 0.001 0.001 9.3 49.1
2011 27.1 17.6 1.8 26.0 2.0 0.4 0.0 0.0 0.0 1.4 0.001 5.1 81.4
2012 4.8 5.6 0.6 0.001 0.8 0.0 0.0 0.0 0.0 4.0 57.0 26.0 98.8
2013 25.6 4.3 0.001 0.1 31.6 0.0 0.0 0.0 0.0 0.001 61.1 1.3 124.0
2014 46.1 1.5 19.3 12.6 1.5 0.0 0.0 0.0 0.0 2.2 20.7 1.5 105.4
2015 2.2 8.5 10.8 5.5 1.5 0.0 0.0 0.001 0.0 3.4 69.5 38.3 139.7
Source: Meteorological Organization and Seismology of Iraq
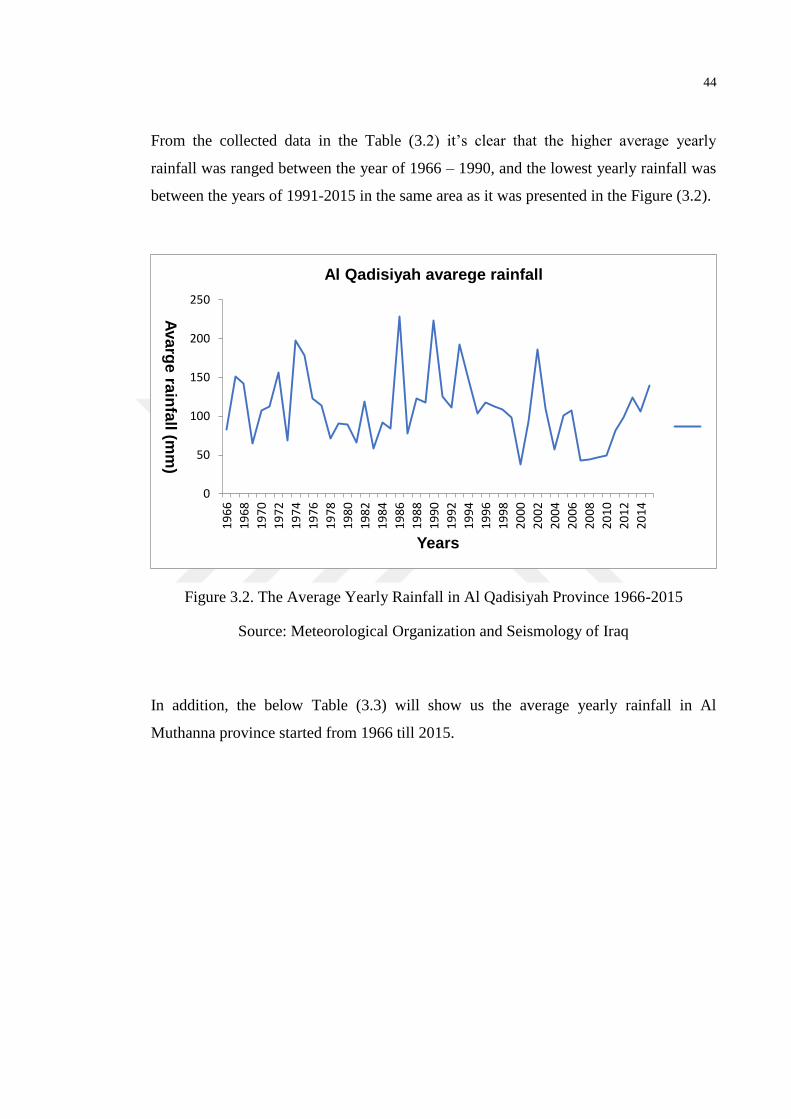
44
From the collected data in the Table (3.2) it’s clear that the higher average yearly
rainfall was ranged between the year of 1966 – 1990, and the lowest yearly rainfall was
between the years of 1991-2015 in the same area as it was presented in the Figure (3.2).
Figure 3.2. The Average Yearly Rainfall in Al Qadisiyah Province 1966-2015
Source: Meteorological Organization and Seismology of Iraq
In addition, the below Table (3.3) will show us the average yearly rainfall in Al
Muthanna province started from 1966 till 2015.
0
50
100
150
200
250
19
66
19
68
19
70
19
72
19
74
19
76
19
78
19
80
19
82
19
84
19
86
19
88
19
90
19
92
19
94
19
96
19
98
20
00
20
02
20
04
20
06
20
08
20
10
20
12
20
14
Ava
rge
rain
fall (m
m)
Years
Al Qadisiyah avarege rainfall
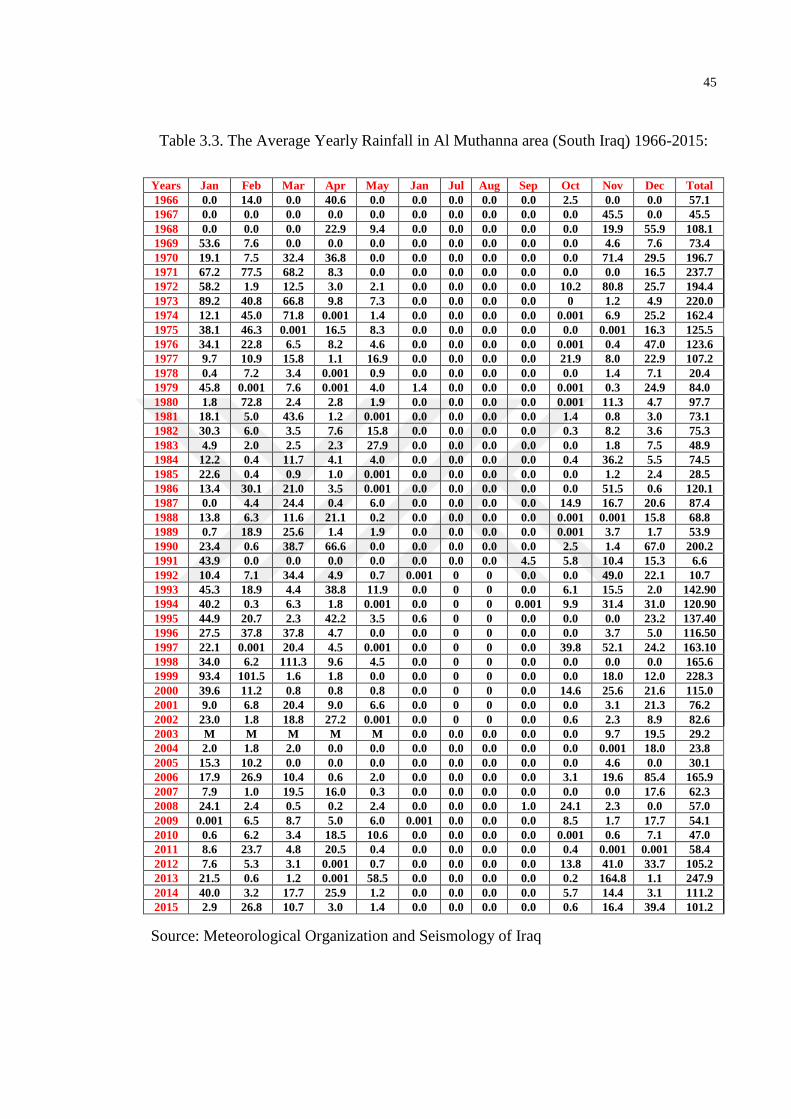
45
Table 3.3. The Average Yearly Rainfall in Al Muthanna area (South Iraq) 1966-2015:
Years Jan Feb Mar Apr May Jan Jul Aug Sep Oct Nov Dec Total
1966 0.0 14.0 0.0 40.6 0.0 0.0 0.0 0.0 0.0 2.5 0.0 0.0 57.1
1967 0.0 0.0 0.0 0.0 0.0 0.0 0.0 0.0 0.0 0.0 45.5 0.0 45.5
1968 0.0 0.0 0.0 22.9 9.4 0.0 0.0 0.0 0.0 0.0 19.9 55.9 108.1
1969 53.6 7.6 0.0 0.0 0.0 0.0 0.0 0.0 0.0 0.0 4.6 7.6 73.4
1970 19.1 7.5 32.4 36.8 0.0 0.0 0.0 0.0 0.0 0.0 71.4 29.5 196.7
1971 67.2 77.5 68.2 8.3 0.0 0.0 0.0 0.0 0.0 0.0 0.0 16.5 237.7
1972 58.2 1.9 12.5 3.0 2.1 0.0 0.0 0.0 0.0 10.2 80.8 25.7 194.4
1973 89.2 40.8 66.8 9.8 7.3 0.0 0.0 0.0 0.0 0 1.2 4.9 220.0
1974 12.1 45.0 71.8 0.001 1.4 0.0 0.0 0.0 0.0 0.001 6.9 25.2 162.4
1975 38.1 46.3 0.001 16.5 8.3 0.0 0.0 0.0 0.0 0.0 0.001 16.3 125.5
1976 34.1 22.8 6.5 8.2 4.6 0.0 0.0 0.0 0.0 0.001 0.4 47.0 123.6
1977 9.7 10.9 15.8 1.1 16.9 0.0 0.0 0.0 0.0 21.9 8.0 22.9 107.2
1978 0.4 7.2 3.4 0.001 0.9 0.0 0.0 0.0 0.0 0.0 1.4 7.1 20.4
1979 45.8 0.001 7.6 0.001 4.0 1.4 0.0 0.0 0.0 0.001 0.3 24.9 84.0
1980 1.8 72.8 2.4 2.8 1.9 0.0 0.0 0.0 0.0 0.001 11.3 4.7 97.7
1981 18.1 5.0 43.6 1.2 0.001 0.0 0.0 0.0 0.0 1.4 0.8 3.0 73.1
1982 30.3 6.0 3.5 7.6 15.8 0.0 0.0 0.0 0.0 0.3 8.2 3.6 75.3
1983 4.9 2.0 2.5 2.3 27.9 0.0 0.0 0.0 0.0 0.0 1.8 7.5 48.9
1984 12.2 0.4 11.7 4.1 4.0 0.0 0.0 0.0 0.0 0.4 36.2 5.5 74.5
1985 22.6 0.4 0.9 1.0 0.001 0.0 0.0 0.0 0.0 0.0 1.2 2.4 28.5
1986 13.4 30.1 21.0 3.5 0.001 0.0 0.0 0.0 0.0 0.0 51.5 0.6 120.1
1987 0.0 4.4 24.4 0.4 6.0 0.0 0.0 0.0 0.0 14.9 16.7 20.6 87.4
1988 13.8 6.3 11.6 21.1 0.2 0.0 0.0 0.0 0.0 0.001 0.001 15.8 68.8
1989 0.7 18.9 25.6 1.4 1.9 0.0 0.0 0.0 0.0 0.001 3.7 1.7 53.9
1990 23.4 0.6 38.7 66.6 0.0 0.0 0.0 0.0 0.0 2.5 1.4 67.0 200.2
1991 43.9 0.0 0.0 0.0 0.0 0.0 0.0 0.0 4.5 5.8 10.4 15.3 6.6
1992 10.4 7.1 34.4 4.9 0.7 0.001 0 0 0.0 0.0 49.0 22.1 10.7
1993 45.3 18.9 4.4 38.8 11.9 0.0 0 0 0.0 6.1 15.5 2.0 142.90
1994 40.2 0.3 6.3 1.8 0.001 0.0 0 0 0.001 9.9 31.4 31.0 120.90
1995 44.9 20.7 2.3 42.2 3.5 0.6 0 0 0.0 0.0 0.0 23.2 137.40
1996 27.5 37.8 37.8 4.7 0.0 0.0 0 0 0.0 0.0 3.7 5.0 116.50
1997 22.1 0.001 20.4 4.5 0.001 0.0 0 0 0.0 39.8 52.1 24.2 163.10
1998 34.0 6.2 111.3 9.6 4.5 0.0 0 0 0.0 0.0 0.0 0.0 165.6
1999 93.4 101.5 1.6 1.8 0.0 0.0 0 0 0.0 0.0 18.0 12.0 228.3
2000 39.6 11.2 0.8 0.8 0.8 0.0 0 0 0.0 14.6 25.6 21.6 115.0
2001 9.0 6.8 20.4 9.0 6.6 0.0 0 0 0.0 0.0 3.1 21.3 76.2
2002 23.0 1.8 18.8 27.2 0.001 0.0 0 0 0.0 0.6 2.3 8.9 82.6
2003 M M M M M 0.0 0.0 0.0 0.0 0.0 9.7 19.5 29.2
2004 2.0 1.8 2.0 0.0 0.0 0.0 0.0 0.0 0.0 0.0 0.001 18.0 23.8
2005 15.3 10.2 0.0 0.0 0.0 0.0 0.0 0.0 0.0 0.0 4.6 0.0 30.1
2006 17.9 26.9 10.4 0.6 2.0 0.0 0.0 0.0 0.0 3.1 19.6 85.4 165.9
2007 7.9 1.0 19.5 16.0 0.3 0.0 0.0 0.0 0.0 0.0 0.0 17.6 62.3
2008 24.1 2.4 0.5 0.2 2.4 0.0 0.0 0.0 1.0 24.1 2.3 0.0 57.0
2009 0.001 6.5 8.7 5.0 6.0 0.001 0.0 0.0 0.0 8.5 1.7 17.7 54.1
2010 0.6 6.2 3.4 18.5 10.6 0.0 0.0 0.0 0.0 0.001 0.6 7.1 47.0
2011 8.6 23.7 4.8 20.5 0.4 0.0 0.0 0.0 0.0 0.4 0.001 0.001 58.4
2012 7.6 5.3 3.1 0.001 0.7 0.0 0.0 0.0 0.0 13.8 41.0 33.7 105.2
2013 21.5 0.6 1.2 0.001 58.5 0.0 0.0 0.0 0.0 0.2 164.8 1.1 247.9
2014 40.0 3.2 17.7 25.9 1.2 0.0 0.0 0.0 0.0 5.7 14.4 3.1 111.2
2015 2.9 26.8 10.7 3.0 1.4 0.0 0.0 0.0 0.0 0.6 16.4 39.4 101.2
Source: Meteorological Organization and Seismology of Iraq
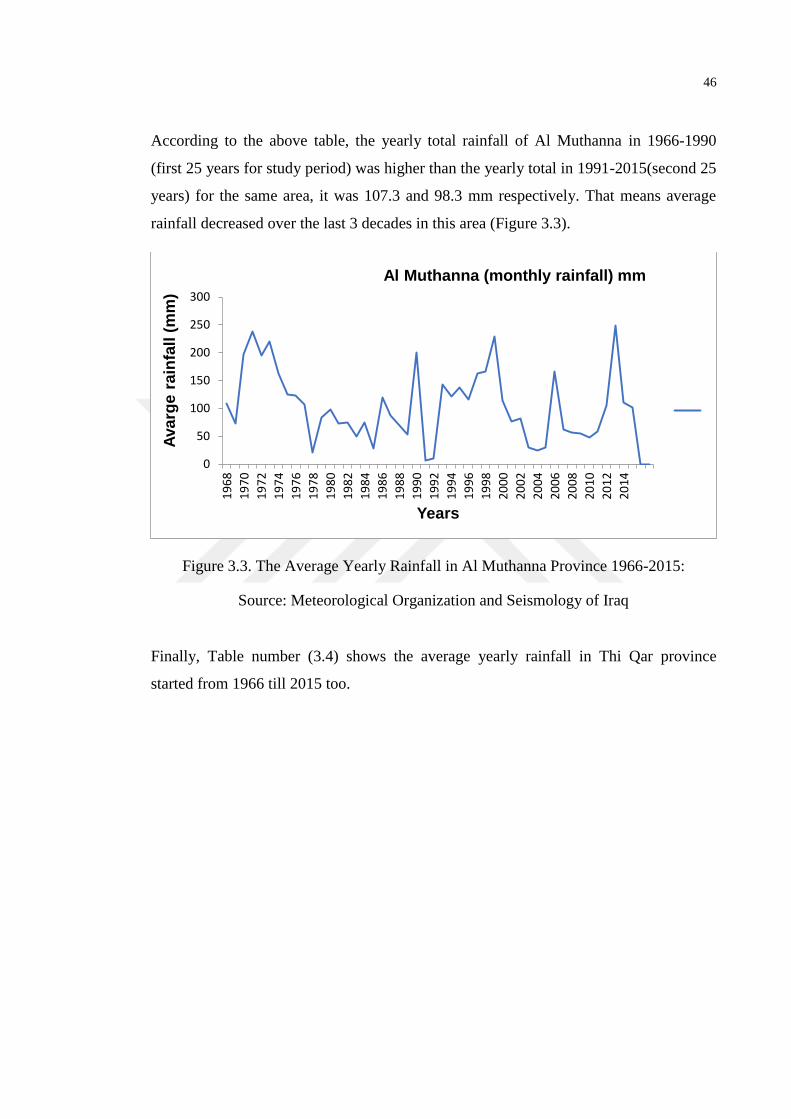
46
According to the above table, the yearly total rainfall of Al Muthanna in 1966-1990
(first 25 years for study period) was higher than the yearly total in 1991-2015(second 25
years) for the same area, it was 107.3 and 98.3 mm respectively. That means average
rainfall decreased over the last 3 decades in this area (Figure 3.3).
Figure 3.3. The Average Yearly Rainfall in Al Muthanna Province 1966-2015:
Source: Meteorological Organization and Seismology of Iraq
Finally, Table number (3.4) shows the average yearly rainfall in Thi Qar province
started from 1966 till 2015 too.
0
50
100
150
200
250
300
19
68
19
70
19
72
19
74
19
76
19
78
19
80
19
82
19
84
19
86
19
88
19
90
19
92
19
94
19
96
19
98
20
00
20
02
20
04
20
06
20
08
20
10
20
12
20
14
Ava
rge
ra
infa
ll (
mm
)
Years
Al Muthanna (monthly rainfall) mm
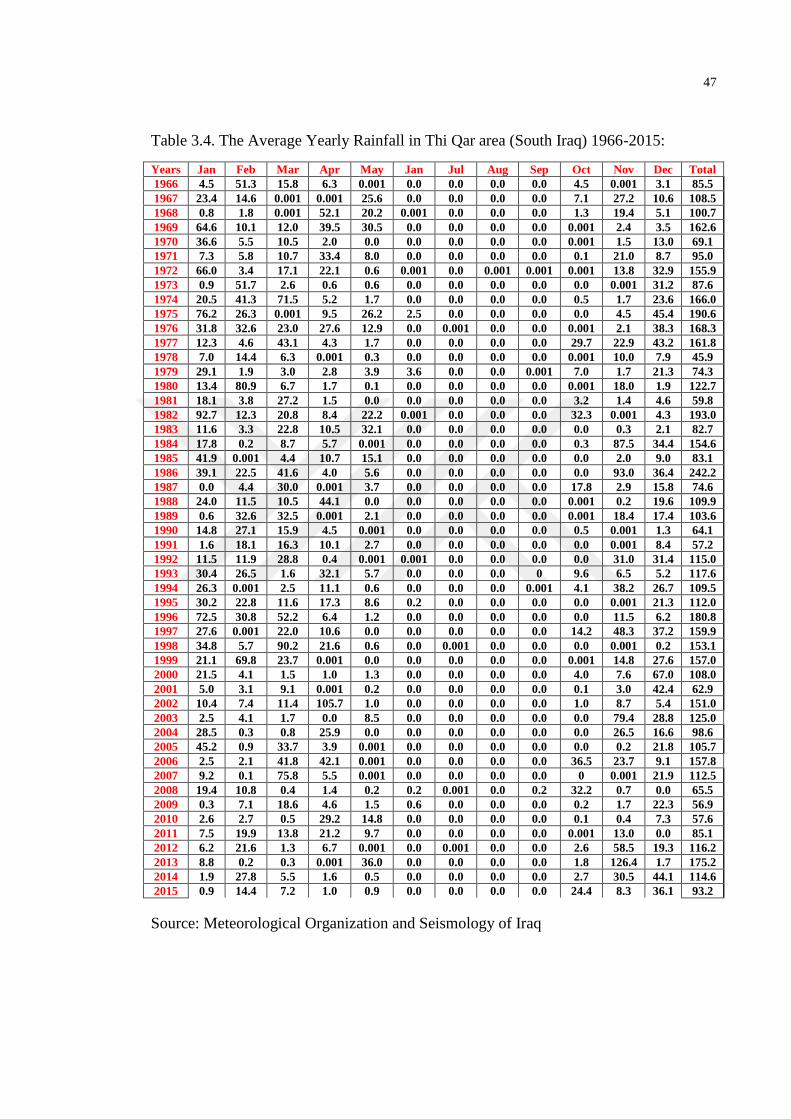
47
Table 3.4. The Average Yearly Rainfall in Thi Qar area (South Iraq) 1966-2015:
Years Jan Feb Mar Apr May Jan Jul Aug Sep Oct Nov Dec Total
1966 4.5 51.3 15.8 6.3 0.001 0.0 0.0 0.0 0.0 4.5 0.001 3.1 85.5
1967 23.4 14.6 0.001 0.001 25.6 0.0 0.0 0.0 0.0 7.1 27.2 10.6 108.5
1968 0.8 1.8 0.001 52.1 20.2 0.001 0.0 0.0 0.0 1.3 19.4 5.1 100.7
1969 64.6 10.1 12.0 39.5 30.5 0.0 0.0 0.0 0.0 0.001 2.4 3.5 162.6
1970 36.6 5.5 10.5 2.0 0.0 0.0 0.0 0.0 0.0 0.001 1.5 13.0 69.1
1971 7.3 5.8 10.7 33.4 8.0 0.0 0.0 0.0 0.0 0.1 21.0 8.7 95.0
1972 66.0 3.4 17.1 22.1 0.6 0.001 0.0 0.001 0.001 0.001 13.8 32.9 155.9
1973 0.9 51.7 2.6 0.6 0.6 0.0 0.0 0.0 0.0 0.0 0.001 31.2 87.6
1974 20.5 41.3 71.5 5.2 1.7 0.0 0.0 0.0 0.0 0.5 1.7 23.6 166.0
1975 76.2 26.3 0.001 9.5 26.2 2.5 0.0 0.0 0.0 0.0 4.5 45.4 190.6
1976 31.8 32.6 23.0 27.6 12.9 0.0 0.001 0.0 0.0 0.001 2.1 38.3 168.3
1977 12.3 4.6 43.1 4.3 1.7 0.0 0.0 0.0 0.0 29.7 22.9 43.2 161.8
1978 7.0 14.4 6.3 0.001 0.3 0.0 0.0 0.0 0.0 0.001 10.0 7.9 45.9
1979 29.1 1.9 3.0 2.8 3.9 3.6 0.0 0.0 0.001 7.0 1.7 21.3 74.3
1980 13.4 80.9 6.7 1.7 0.1 0.0 0.0 0.0 0.0 0.001 18.0 1.9 122.7
1981 18.1 3.8 27.2 1.5 0.0 0.0 0.0 0.0 0.0 3.2 1.4 4.6 59.8
1982 92.7 12.3 20.8 8.4 22.2 0.001 0.0 0.0 0.0 32.3 0.001 4.3 193.0
1983 11.6 3.3 22.8 10.5 32.1 0.0 0.0 0.0 0.0 0.0 0.3 2.1 82.7
1984 17.8 0.2 8.7 5.7 0.001 0.0 0.0 0.0 0.0 0.3 87.5 34.4 154.6
1985 41.9 0.001 4.4 10.7 15.1 0.0 0.0 0.0 0.0 0.0 2.0 9.0 83.1
1986 39.1 22.5 41.6 4.0 5.6 0.0 0.0 0.0 0.0 0.0 93.0 36.4 242.2
1987 0.0 4.4 30.0 0.001 3.7 0.0 0.0 0.0 0.0 17.8 2.9 15.8 74.6
1988 24.0 11.5 10.5 44.1 0.0 0.0 0.0 0.0 0.0 0.001 0.2 19.6 109.9
1989 0.6 32.6 32.5 0.001 2.1 0.0 0.0 0.0 0.0 0.001 18.4 17.4 103.6
1990 14.8 27.1 15.9 4.5 0.001 0.0 0.0 0.0 0.0 0.5 0.001 1.3 64.1
1991 1.6 18.1 16.3 10.1 2.7 0.0 0.0 0.0 0.0 0.0 0.001 8.4 57.2
1992 11.5 11.9 28.8 0.4 0.001 0.001 0.0 0.0 0.0 0.0 31.0 31.4 115.0
1993 30.4 26.5 1.6 32.1 5.7 0.0 0.0 0.0 0 9.6 6.5 5.2 117.6
1994 26.3 0.001 2.5 11.1 0.6 0.0 0.0 0.0 0.001 4.1 38.2 26.7 109.5
1995 30.2 22.8 11.6 17.3 8.6 0.2 0.0 0.0 0.0 0.0 0.001 21.3 112.0
1996 72.5 30.8 52.2 6.4 1.2 0.0 0.0 0.0 0.0 0.0 11.5 6.2 180.8
1997 27.6 0.001 22.0 10.6 0.0 0.0 0.0 0.0 0.0 14.2 48.3 37.2 159.9
1998 34.8 5.7 90.2 21.6 0.6 0.0 0.001 0.0 0.0 0.0 0.001 0.2 153.1
1999 21.1 69.8 23.7 0.001 0.0 0.0 0.0 0.0 0.0 0.001 14.8 27.6 157.0
2000 21.5 4.1 1.5 1.0 1.3 0.0 0.0 0.0 0.0 4.0 7.6 67.0 108.0
2001 5.0 3.1 9.1 0.001 0.2 0.0 0.0 0.0 0.0 0.1 3.0 42.4 62.9
2002 10.4 7.4 11.4 105.7 1.0 0.0 0.0 0.0 0.0 1.0 8.7 5.4 151.0
2003 2.5 4.1 1.7 0.0 8.5 0.0 0.0 0.0 0.0 0.0 79.4 28.8 125.0
2004 28.5 0.3 0.8 25.9 0.0 0.0 0.0 0.0 0.0 0.0 26.5 16.6 98.6
2005 45.2 0.9 33.7 3.9 0.001 0.0 0.0 0.0 0.0 0.0 0.2 21.8 105.7
2006 2.5 2.1 41.8 42.1 0.001 0.0 0.0 0.0 0.0 36.5 23.7 9.1 157.8
2007 9.2 0.1 75.8 5.5 0.001 0.0 0.0 0.0 0.0 0 0.001 21.9 112.5
2008 19.4 10.8 0.4 1.4 0.2 0.2 0.001 0.0 0.2 32.2 0.7 0.0 65.5
2009 0.3 7.1 18.6 4.6 1.5 0.6 0.0 0.0 0.0 0.2 1.7 22.3 56.9
2010 2.6 2.7 0.5 29.2 14.8 0.0 0.0 0.0 0.0 0.1 0.4 7.3 57.6
2011 7.5 19.9 13.8 21.2 9.7 0.0 0.0 0.0 0.0 0.001 13.0 0.0 85.1
2012 6.2 21.6 1.3 6.7 0.001 0.0 0.001 0.0 0.0 2.6 58.5 19.3 116.2
2013 8.8 0.2 0.3 0.001 36.0 0.0 0.0 0.0 0.0 1.8 126.4 1.7 175.2
2014 1.9 27.8 5.5 1.6 0.5 0.0 0.0 0.0 0.0 2.7 30.5 44.1 114.6
2015 0.9 14.4 7.2 1.0 0.9 0.0 0.0 0.0 0.0 24.4 8.3 36.1 93.2
Source: Meteorological Organization and Seismology of Iraq
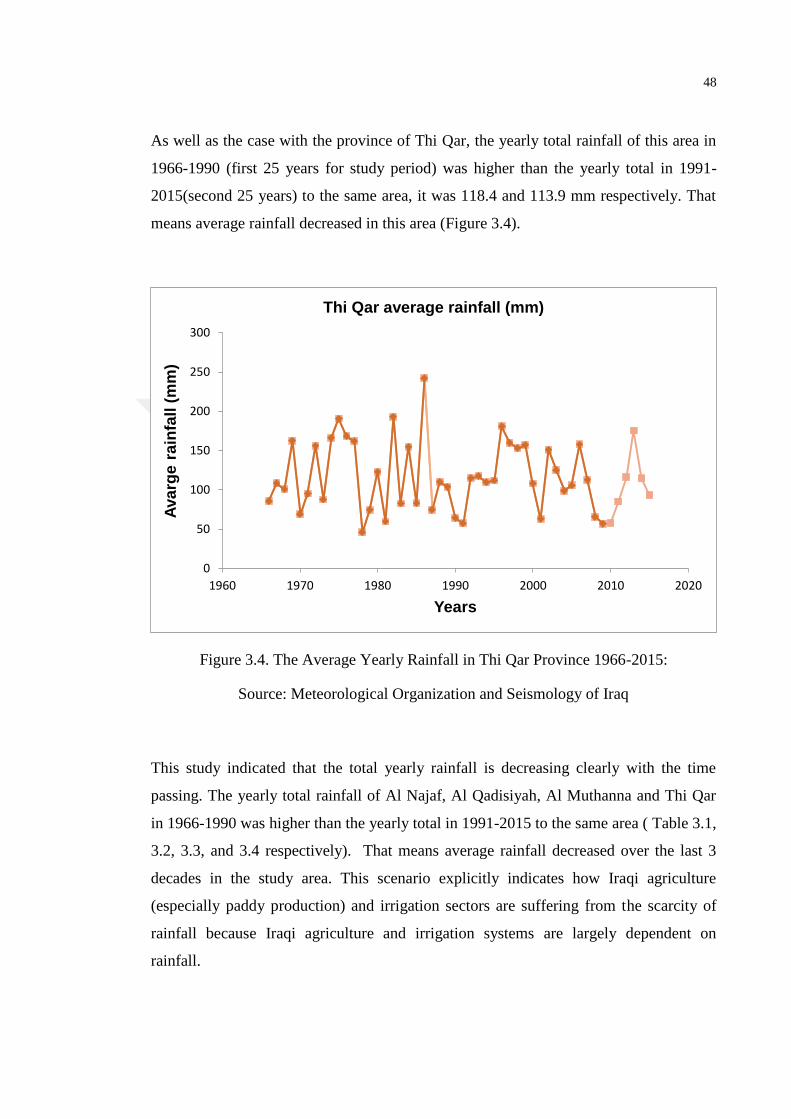
48
As well as the case with the province of Thi Qar, the yearly total rainfall of this area in
1966-1990 (first 25 years for study period) was higher than the yearly total in 1991-
2015(second 25 years) to the same area, it was 118.4 and 113.9 mm respectively. That
means average rainfall decreased in this area (Figure 3.4).
Figure 3.4. The Average Yearly Rainfall in Thi Qar Province 1966-2015:
Source: Meteorological Organization and Seismology of Iraq
This study indicated that the total yearly rainfall is decreasing clearly with the time
passing. The yearly total rainfall of Al Najaf, Al Qadisiyah, Al Muthanna and Thi Qar
in 1966-1990 was higher than the yearly total in 1991-2015 to the same area ( Table 3.1,
3.2, 3.3, and 3.4 respectively). That means average rainfall decreased over the last 3
decades in the study area. This scenario explicitly indicates how Iraqi agriculture
(especially paddy production) and irrigation sectors are suffering from the scarcity of
rainfall because Iraqi agriculture and irrigation systems are largely dependent on
rainfall.
0
50
100
150
200
250
300
1960 1970 1980 1990 2000 2010 2020
Ava
rge
ra
infa
ll (
mm
)
Years
Thi Qar average rainfall (mm)
49
3.3. The Temperature in Iraq
Similar to Middle East countries, there are four seasons Iraq: winter (December,
January, and February), Spring (March, April, May), summer (June, July, and August),
and autumn (September, October, and November). It is important to note that the
climate in Iraq is similar to the southwestern US with a pleasant spring, cold winters,
hot, dry summers, and fall throughout the summer, Iraq is hot and dry. The hottest part
of the country is the desert. Because of the fact that it cannot retain heat after sunset and
the air is so dry, diurnal temperature spreads are the widest of the year in summer. In the
July-August, the average temperature in Iraq is more than 48 ºC (120 Fahrenheit) and to
below freezing in January. It is comparatively cooler in the mountains because it can
respite the underlying heat. The temperature in the mountain provided below is for
inhabited areas, commonly valleys. Although the October is still quite warm,
temperatures cool from the blistering heat of summer. Combination of humidity and
extreme temperatures in addition to the water scarcity will affect both men and
equipment. Vehicle movement induced clouds of dust will increase the detection ability
in the desert region during the dry season.
Who lived in Iraq before 1970 to the current time, saw clearly the difference in Iraqi
climatic especially temperature, rainfall and dust storms. For example, it is evident from
a recent incident, the Iraqi Government declared holidays for the all government’s
offices in Baghdad, central and southern areas of Iraq due to the extremely elevated
temperature over 51 ºC for a few days in August 2017 (Al Iraqi a Iraqi Government
channel, in Monday 1st of August 2017 at 7:30 pm). From this incident, we can
understand how rising temperature is affecting the normal lifestyle of the Iraqi people.
The next tables show the average minimum and maximum temperatures in the study
area (Al Najaf, Al Qadisiyah, Al Muthanna, and Thi Qar) in different years. First, Table
3.5 and 3.6 presented the minimum and maximum temperature in Al Najaf province
respectively.
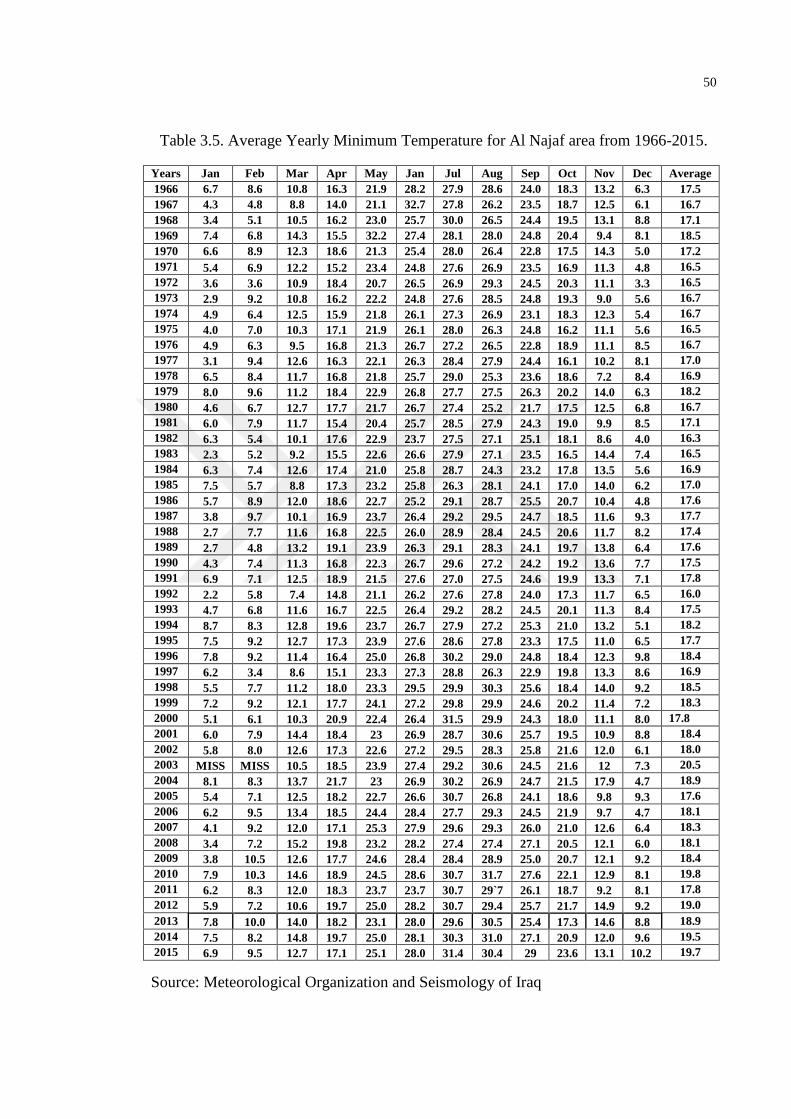
50
Table 3.5. Average Yearly Minimum Temperature for Al Najaf area from 1966-2015.
Years Jan Feb Mar Apr May Jan Jul Aug Sep Oct Nov Dec Average
1966 6.7 8.6 10.8 16.3 21.9 28.2 27.9 28.6 24.0 18.3 13.2 6.3 17.5
1967 4.3 4.8 8.8 14.0 21.1 32.7 27.8 26.2 23.5 18.7 12.5 6.1 16.7
1968 3.4 5.1 10.5 16.2 23.0 25.7 30.0 26.5 24.4 19.5 13.1 8.8 17.1
1969 7.4 6.8 14.3 15.5 32.2 27.4 28.1 28.0 24.8 20.4 9.4 8.1 18.5
1970 6.6 8.9 12.3 18.6 21.3 25.4 28.0 26.4 22.8 17.5 14.3 5.0 17.2
1971 5.4 6.9 12.2 15.2 23.4 24.8 27.6 26.9 23.5 16.9 11.3 4.8 16.5
1972 3.6 3.6 10.9 18.4 20.7 26.5 26.9 29.3 24.5 20.3 11.1 3.3 16.5
1973 2.9 9.2 10.8 16.2 22.2 24.8 27.6 28.5 24.8 19.3 9.0 5.6 16.7
1974 4.9 6.4 12.5 15.9 21.8 26.1 27.3 26.9 23.1 18.3 12.3 5.4 16.7
1975 4.0 7.0 10.3 17.1 21.9 26.1 28.0 26.3 24.8 16.2 11.1 5.6 16.5
1976 4.9 6.3 9.5 16.8 21.3 26.7 27.2 26.5 22.8 18.9 11.1 8.5 16.7
1977 3.1 9.4 12.6 16.3 22.1 26.3 28.4 27.9 24.4 16.1 10.2 8.1 17.0
1978 6.5 8.4 11.7 16.8 21.8 25.7 29.0 25.3 23.6 18.6 7.2 8.4 16.9
1979 8.0 9.6 11.2 18.4 22.9 26.8 27.7 27.5 26.3 20.2 14.0 6.3 18.2
1980 4.6 6.7 12.7 17.7 21.7 26.7 27.4 25.2 21.7 17.5 12.5 6.8 16.7
1981 6.0 7.9 11.7 15.4 20.4 25.7 28.5 27.9 24.3 19.0 9.9 8.5 17.1
1982 6.3 5.4 10.1 17.6 22.9 23.7 27.5 27.1 25.1 18.1 8.6 4.0 16.3
1983 2.3 5.2 9.2 15.5 22.6 26.6 27.9 27.1 23.5 16.5 14.4 7.4 16.5
1984 6.3 7.4 12.6 17.4 21.0 25.8 28.7 24.3 23.2 17.8 13.5 5.6 16.9
1985 7.5 5.7 8.8 17.3 23.2 25.8 26.3 28.1 24.1 17.0 14.0 6.2 17.0
1986 5.7 8.9 12.0 18.6 22.7 25.2 29.1 28.7 25.5 20.7 10.4 4.8 17.6
1987 3.8 9.7 10.1 16.9 23.7 26.4 29.2 29.5 24.7 18.5 11.6 9.3 17.7
1988 2.7 7.7 11.6 16.8 22.5 26.0 28.9 28.4 24.5 20.6 11.7 8.2 17.4
1989 2.7 4.8 13.2 19.1 23.9 26.3 29.1 28.3 24.1 19.7 13.8 6.4 17.6
1990 4.3 7.4 11.3 16.8 22.3 26.7 29.6 27.2 24.2 19.2 13.6 7.7 17.5
1991 6.9 7.1 12.5 18.9 21.5 27.6 27.0 27.5 24.6 19.9 13.3 7.1 17.8
1992 2.2 5.8 7.4 14.8 21.1 26.2 27.6 27.8 24.0 17.3 11.7 6.5 16.0
1993 4.7 6.8 11.6 16.7 22.5 26.4 29.2 28.2 24.5 20.1 11.3 8.4 17.5
1994 8.7 8.3 12.8 19.6 23.7 26.7 27.9 27.2 25.3 21.0 13.2 5.1 18.2
1995 7.5 9.2 12.7 17.3 23.9 27.6 28.6 27.8 23.3 17.5 11.0 6.5 17.7
1996 7.8 9.2 11.4 16.4 25.0 26.8 30.2 29.0 24.8 18.4 12.3 9.8 18.4
1997 6.2 3.4 8.6 15.1 23.3 27.3 28.8 26.3 22.9 19.8 13.3 8.6 16.9
1998 5.5 7.7 11.2 18.0 23.3 29.5 29.9 30.3 25.6 18.4 14.0 9.2 18.5
1999 7.2 9.2 12.1 17.7 24.1 27.2 29.8 29.9 24.6 20.2 11.4 7.2 18.3
2000 5.1 6.1 10.3 20.9 22.4 26.4 31.5 29.9 24.3 18.0 11.1 8.0 17.8
2001 6.0 7.9 14.4 18.4 23 26.9 28.7 30.6 25.7 19.5 10.9 8.8 18.4
2002 5.8 8.0 12.6 17.3 22.6 27.2 29.5 28.3 25.8 21.6 12.0 6.1 18.0
2003 MISS MISS 10.5 18.5 23.9 27.4 29.2 30.6 24.5 21.6 12 7.3 20.5
2004 8.1 8.3 13.7 21.7 23 26.9 30.2 26.9 24.7 21.5 17.9 4.7 18.9
2005 5.4 7.1 12.5 18.2 22.7 26.6 30.7 26.8 24.1 18.6 9.8 9.3 17.6
2006 6.2 9.5 13.4 18.5 24.4 28.4 27.7 29.3 24.5 21.9 9.7 4.7 18.1
2007 4.1 9.2 12.0 17.1 25.3 27.9 29.6 29.3 26.0 21.0 12.6 6.4 18.3
2008 3.4 7.2 15.2 19.8 23.2 28.2 27.4 27.4 27.1 20.5 12.1 6.0 18.1
2009 3.8 10.5 12.6 17.7 24.6 28.4 28.4 28.9 25.0 20.7 12.1 9.2 18.4
2010 7.9 10.3 14.6 18.9 24.5 28.6 30.7 31.7 27.6 22.1 12.9 8.1 19.8
2011 6.2 8.3 12.0 18.3 23.7 23.7 30.7 29`7 26.1 18.7 9.2 8.1 17.8
2012 5.9 7.2 10.6 19.7 25.0 28.2 30.7 29.4 25.7 21.7 14.9 9.2 19.0
2013 7.8 10.0 14.0 18.2 23.1 28.0 29.6 30.5 25.4 17.3 14.6 8.8 18.9
2014 7.5 8.2 14.8 19.7 25.0 28.1 30.3 31.0 27.1 20.9 12.0 9.6 19.5
2015 6.9 9.5 12.7 17.1 25.1 28.0 31.4 30.4 29 23.6 13.1 10.2 19.7
Source: Meteorological Organization and Seismology of Iraq
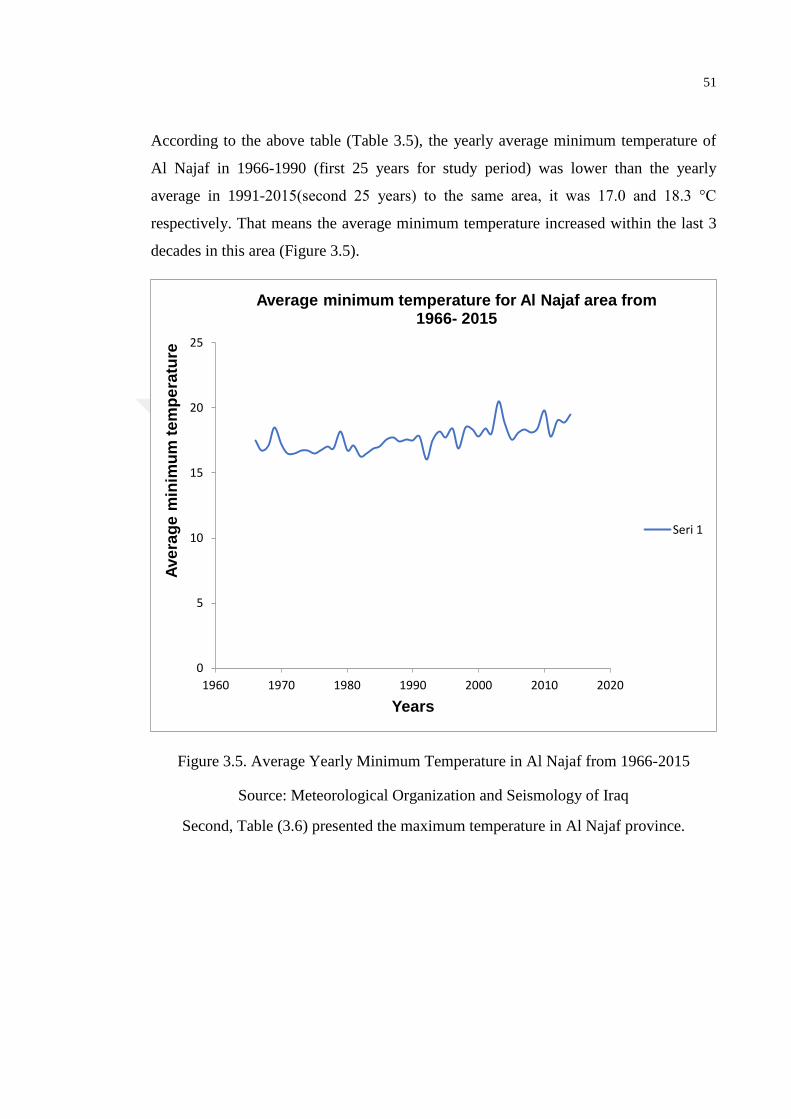
51
According to the above table (Table 3.5), the yearly average minimum temperature of
Al Najaf in 1966-1990 (first 25 years for study period) was lower than the yearly
average in 1991-2015(second 25 years) to the same area, it was 17.0 and 18.3 °C
respectively. That means the average minimum temperature increased within the last 3
decades in this area (Figure 3.5).
Figure 3.5. Average Yearly Minimum Temperature in Al Najaf from 1966-2015
Source: Meteorological Organization and Seismology of Iraq
Second, Table (3.6) presented the maximum temperature in Al Najaf province.
0
5
10
15
20
25
1960 1970 1980 1990 2000 2010 2020
Ave
rag
e m
inim
um
tem
pe
ratu
re
Years
Average minimum temperature for Al Najaf area from 1966- 2015
Seri 1
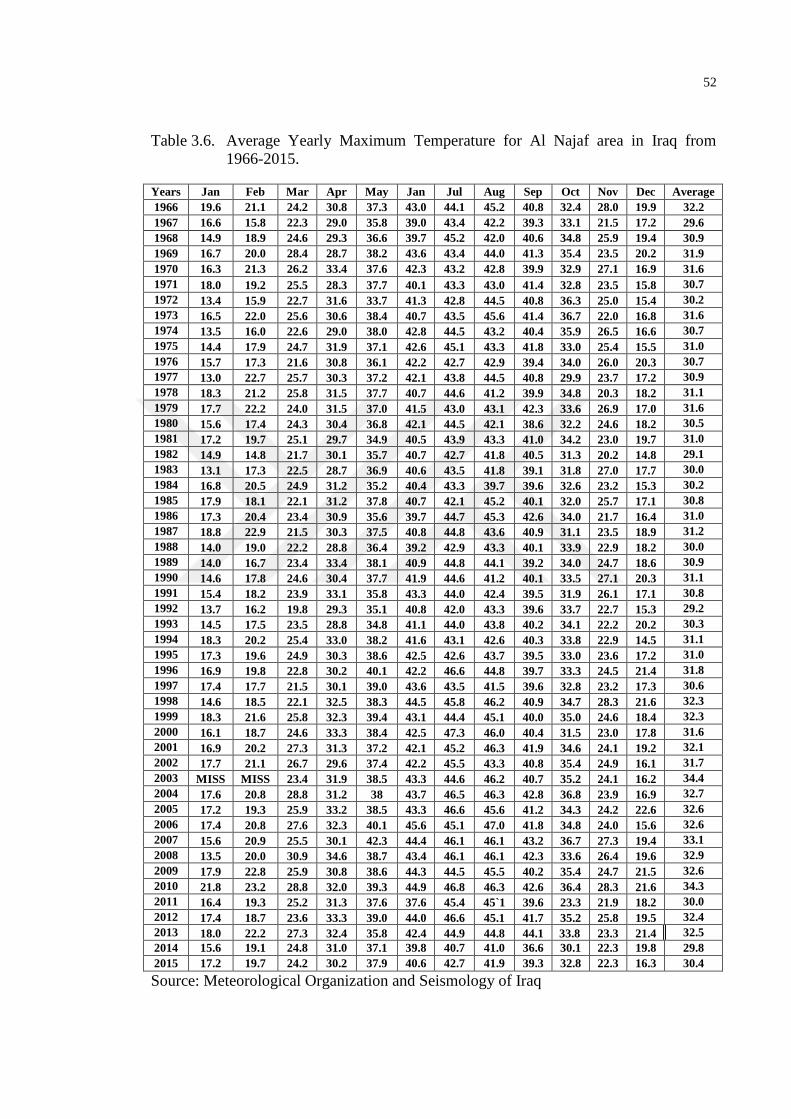
52
Table 3.6. Average Yearly Maximum Temperature for Al Najaf area in Iraq from
1966-2015.
Years Jan Feb Mar Apr May Jan Jul Aug Sep Oct Nov Dec Average
1966 19.6 21.1 24.2 30.8 37.3 43.0 44.1 45.2 40.8 32.4 28.0 19.9 32.2
1967 16.6 15.8 22.3 29.0 35.8 39.0 43.4 42.2 39.3 33.1 21.5 17.2 29.6
1968 14.9 18.9 24.6 29.3 36.6 39.7 45.2 42.0 40.6 34.8 25.9 19.4 30.9
1969 16.7 20.0 28.4 28.7 38.2 43.6 43.4 44.0 41.3 35.4 23.5 20.2 31.9
1970 16.3 21.3 26.2 33.4 37.6 42.3 43.2 42.8 39.9 32.9 27.1 16.9 31.6
1971 18.0 19.2 25.5 28.3 37.7 40.1 43.3 43.0 41.4 32.8 23.5 15.8 30.7
1972 13.4 15.9 22.7 31.6 33.7 41.3 42.8 44.5 40.8 36.3 25.0 15.4 30.2
1973 16.5 22.0 25.6 30.6 38.4 40.7 43.5 45.6 41.4 36.7 22.0 16.8 31.6
1974 13.5 16.0 22.6 29.0 38.0 42.8 44.5 43.2 40.4 35.9 26.5 16.6 30.7
1975 14.4 17.9 24.7 31.9 37.1 42.6 45.1 43.3 41.8 33.0 25.4 15.5 31.0
1976 15.7 17.3 21.6 30.8 36.1 42.2 42.7 42.9 39.4 34.0 26.0 20.3 30.7
1977 13.0 22.7 25.7 30.3 37.2 42.1 43.8 44.5 40.8 29.9 23.7 17.2 30.9
1978 18.3 21.2 25.8 31.5 37.7 40.7 44.6 41.2 39.9 34.8 20.3 18.2 31.1
1979 17.7 22.2 24.0 31.5 37.0 41.5 43.0 43.1 42.3 33.6 26.9 17.0 31.6
1980 15.6 17.4 24.3 30.4 36.8 42.1 44.5 42.1 38.6 32.2 24.6 18.2 30.5
1981 17.2 19.7 25.1 29.7 34.9 40.5 43.9 43.3 41.0 34.2 23.0 19.7 31.0
1982 14.9 14.8 21.7 30.1 35.7 40.7 42.7 41.8 40.5 31.3 20.2 14.8 29.1
1983 13.1 17.3 22.5 28.7 36.9 40.6 43.5 41.8 39.1 31.8 27.0 17.7 30.0
1984 16.8 20.5 24.9 31.2 35.2 40.4 43.3 39.7 39.6 32.6 23.2 15.3 30.2
1985 17.9 18.1 22.1 31.2 37.8 40.7 42.1 45.2 40.1 32.0 25.7 17.1 30.8
1986 17.3 20.4 23.4 30.9 35.6 39.7 44.7 45.3 42.6 34.0 21.7 16.4 31.0
1987 18.8 22.9 21.5 30.3 37.5 40.8 44.8 43.6 40.9 31.1 23.5 18.9 31.2
1988 14.0 19.0 22.2 28.8 36.4 39.2 42.9 43.3 40.1 33.9 22.9 18.2 30.0
1989 14.0 16.7 23.4 33.4 38.1 40.9 44.8 44.1 39.2 34.0 24.7 18.6 30.9
1990 14.6 17.8 24.6 30.4 37.7 41.9 44.6 41.2 40.1 33.5 27.1 20.3 31.1
1991 15.4 18.2 23.9 33.1 35.8 43.3 44.0 42.4 39.5 31.9 26.1 17.1 30.8
1992 13.7 16.2 19.8 29.3 35.1 40.8 42.0 43.3 39.6 33.7 22.7 15.3 29.2
1993 14.5 17.5 23.5 28.8 34.8 41.1 44.0 43.8 40.2 34.1 22.2 20.2 30.3
1994 18.3 20.2 25.4 33.0 38.2 41.6 43.1 42.6 40.3 33.8 22.9 14.5 31.1
1995 17.3 19.6 24.9 30.3 38.6 42.5 42.6 43.7 39.5 33.0 23.6 17.2 31.0
1996 16.9 19.8 22.8 30.2 40.1 42.2 46.6 44.8 39.7 33.3 24.5 21.4 31.8
1997 17.4 17.7 21.5 30.1 39.0 43.6 43.5 41.5 39.6 32.8 23.2 17.3 30.6
1998 14.6 18.5 22.1 32.5 38.3 44.5 45.8 46.2 40.9 34.7 28.3 21.6 32.3
1999 18.3 21.6 25.8 32.3 39.4 43.1 44.4 45.1 40.0 35.0 24.6 18.4 32.3
2000 16.1 18.7 24.6 33.3 38.4 42.5 47.3 46.0 40.4 31.5 23.0 17.8 31.6
2001 16.9 20.2 27.3 31.3 37.2 42.1 45.2 46.3 41.9 34.6 24.1 19.2 32.1
2002 17.7 21.1 26.7 29.6 37.4 42.2 45.5 43.3 40.8 35.4 24.9 16.1 31.7
2003 MISS MISS 23.4 31.9 38.5 43.3 44.6 46.2 40.7 35.2 24.1 16.2 34.4
2004 17.6 20.8 28.8 31.2 38 43.7 46.5 46.3 42.8 36.8 23.9 16.9 32.7
2005 17.2 19.3 25.9 33.2 38.5 43.3 46.6 45.6 41.2 34.3 24.2 22.6 32.6
2006 17.4 20.8 27.6 32.3 40.1 45.6 45.1 47.0 41.8 34.8 24.0 15.6 32.6
2007 15.6 20.9 25.5 30.1 42.3 44.4 46.1 46.1 43.2 36.7 27.3 19.4 33.1
2008 13.5 20.0 30.9 34.6 38.7 43.4 46.1 46.1 42.3 33.6 26.4 19.6 32.9
2009 17.9 22.8 25.9 30.8 38.6 44.3 44.5 45.5 40.2 35.4 24.7 21.5 32.6
2010 21.8 23.2 28.8 32.0 39.3 44.9 46.8 46.3 42.6 36.4 28.3 21.6 34.3
2011 16.4 19.3 25.2 31.3 37.6 37.6 45.4 45`1 39.6 23.3 21.9 18.2 30.0
2012 17.4 18.7 23.6 33.3 39.0 44.0 46.6 45.1 41.7 35.2 25.8 19.5 32.4
2013 18.0 22.2 27.3 32.4 35.8 42.4 44.9 44.8 44.1 33.8 23.3 21.4 32.5
2014 15.6 19.1 24.8 31.0 37.1 39.8 40.7 41.0 36.6 30.1 22.3 19.8 29.8
2015 17.2 19.7 24.2 30.2 37.9 40.6 42.7 41.9 39.3 32.8 22.3 16.3 30.4
Source: Meteorological Organization and Seismology of Iraq
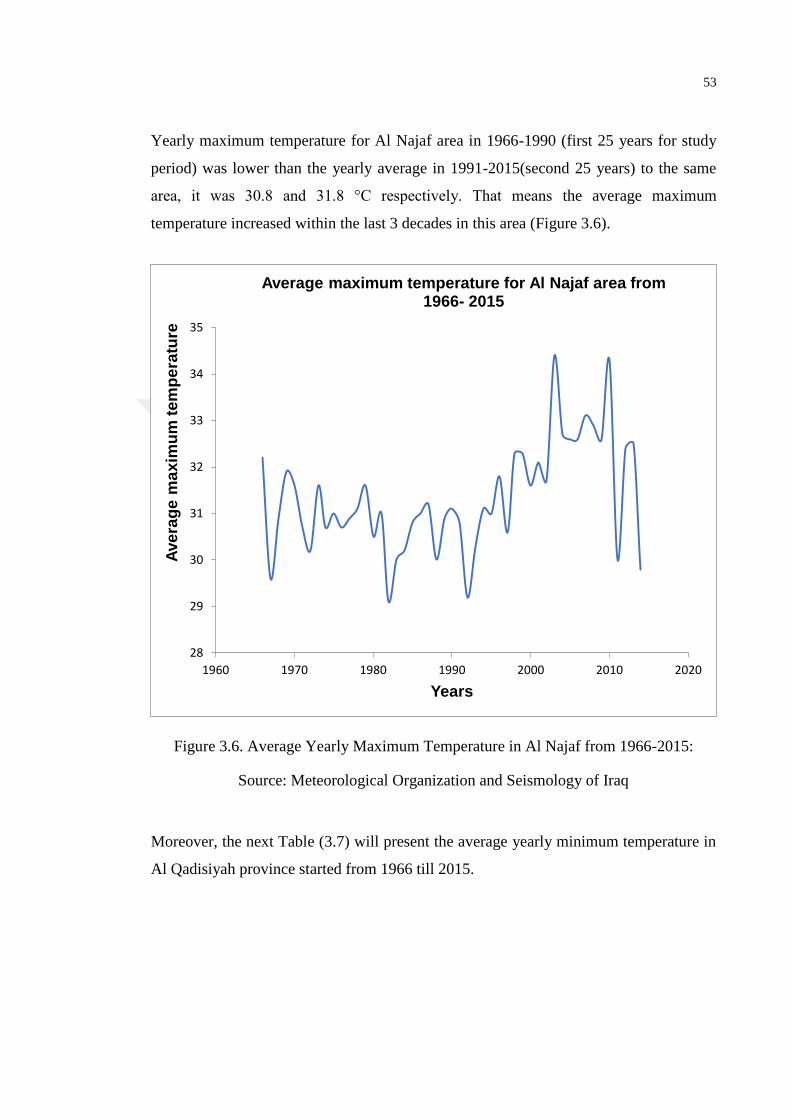
53
Yearly maximum temperature for Al Najaf area in 1966-1990 (first 25 years for study
period) was lower than the yearly average in 1991-2015(second 25 years) to the same
area, it was 30.8 and 31.8 °C respectively. That means the average maximum
temperature increased within the last 3 decades in this area (Figure 3.6).
Figure 3.6. Average Yearly Maximum Temperature in Al Najaf from 1966-2015:
Source: Meteorological Organization and Seismology of Iraq
Moreover, the next Table (3.7) will present the average yearly minimum temperature in
Al Qadisiyah province started from 1966 till 2015.
28
29
30
31
32
33
34
35
1960 1970 1980 1990 2000 2010 2020
Ave
rag
e m
ax
imu
m t
em
pe
ratu
re
Years
Average maximum temperature for Al Najaf area from 1966- 2015
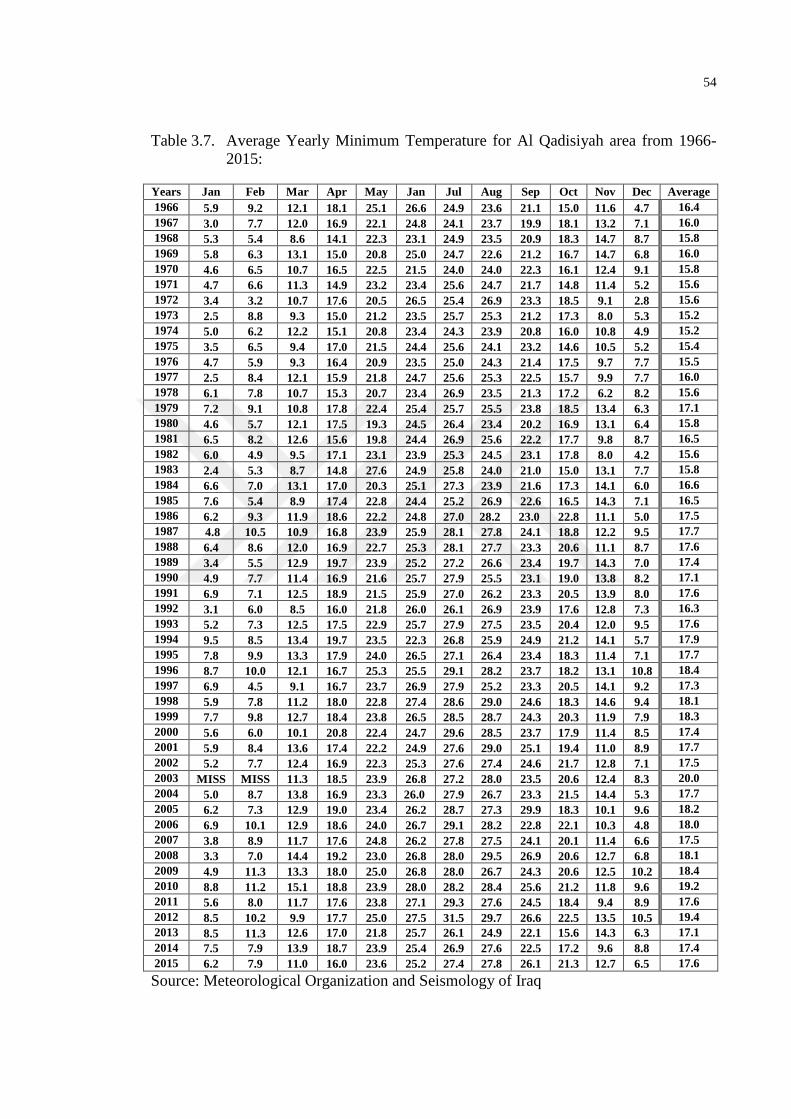
54
Table 3.7. Average Yearly Minimum Temperature for Al Qadisiyah area from 1966-
2015:
Years Jan Feb Mar Apr May Jan Jul Aug Sep Oct Nov Dec Average
1966 5.9 9.2 12.1 18.1 25.1 26.6 24.9 23.6 21.1 15.0 11.6 4.7 16.4
1967 3.0 7.7 12.0 16.9 22.1 24.8 24.1 23.7 19.9 18.1 13.2 7.1 16.0
1968 5.3 5.4 8.6 14.1 22.3 23.1 24.9 23.5 20.9 18.3 14.7 8.7 15.8
1969 5.8 6.3 13.1 15.0 20.8 25.0 24.7 22.6 21.2 16.7 14.7 6.8 16.0
1970 4.6 6.5 10.7 16.5 22.5 21.5 24.0 24.0 22.3 16.1 12.4 9.1 15.8
1971 4.7 6.6 11.3 14.9 23.2 23.4 25.6 24.7 21.7 14.8 11.4 5.2 15.6
1972 3.4 3.2 10.7 17.6 20.5 26.5 25.4 26.9 23.3 18.5 9.1 2.8 15.6
1973 2.5 8.8 9.3 15.0 21.2 23.5 25.7 25.3 21.2 17.3 8.0 5.3 15.2
1974 5.0 6.2 12.2 15.1 20.8 23.4 24.3 23.9 20.8 16.0 10.8 4.9 15.2
1975 3.5 6.5 9.4 17.0 21.5 24.4 25.6 24.1 23.2 14.6 10.5 5.2 15.4
1976 4.7 5.9 9.3 16.4 20.9 23.5 25.0 24.3 21.4 17.5 9.7 7.7 15.5
1977 2.5 8.4 12.1 15.9 21.8 24.7 25.6 25.3 22.5 15.7 9.9 7.7 16.0
1978 6.1 7.8 10.7 15.3 20.7 23.4 26.9 23.5 21.3 17.2 6.2 8.2 15.6
1979 7.2 9.1 10.8 17.8 22.4 25.4 25.7 25.5 23.8 18.5 13.4 6.3 17.1
1980 4.6 5.7 12.1 17.5 19.3 24.5 26.4 23.4 20.2 16.9 13.1 6.4 15.8
1981 6.5 8.2 12.6 15.6 19.8 24.4 26.9 25.6 22.2 17.7 9.8 8.7 16.5
1982 6.0 4.9 9.5 17.1 23.1 23.9 25.3 24.5 23.1 17.8 8.0 4.2 15.6
1983 2.4 5.3 8.7 14.8 27.6 24.9 25.8 24.0 21.0 15.0 13.1 7.7 15.8
1984 6.6 7.0 13.1 17.0 20.3 25.1 27.3 23.9 21.6 17.3 14.1 6.0 16.6
1985 7.6 5.4 8.9 17.4 22.8 24.4 25.2 26.9 22.6 16.5 14.3 7.1 16.5
1986 6.2 9.3 11.9 18.6 22.2 24.8 27.0 28.2 23.0 22.8 11.1 5.0 17.5
1987 4.8 10.5 10.9 16.8 23.9 25.9 28.1 27.8 24.1 18.8 12.2 9.5 17.7
1988 6.4 8.6 12.0 16.9 22.7 25.3 28.1 27.7 23.3 20.6 11.1 8.7 17.6
1989 3.4 5.5 12.9 19.7 23.9 25.2 27.2 26.6 23.4 19.7 14.3 7.0 17.4
1990 4.9 7.7 11.4 16.9 21.6 25.7 27.9 25.5 23.1 19.0 13.8 8.2 17.1
1991 6.9 7.1 12.5 18.9 21.5 25.9 27.0 26.2 23.3 20.5 13.9 8.0 17.6
1992 3.1 6.0 8.5 16.0 21.8 26.0 26.1 26.9 23.9 17.6 12.8 7.3 16.3
1993 5.2 7.3 12.5 17.5 22.9 25.7 27.9 27.5 23.5 20.4 12.0 9.5 17.6
1994 9.5 8.5 13.4 19.7 23.5 22.3 26.8 25.9 24.9 21.2 14.1 5.7 17.9
1995 7.8 9.9 13.3 17.9 24.0 26.5 27.1 26.4 23.4 18.3 11.4 7.1 17.7
1996 8.7 10.0 12.1 16.7 25.3 25.5 29.1 28.2 23.7 18.2 13.1 10.8 18.4
1997 6.9 4.5 9.1 16.7 23.7 26.9 27.9 25.2 23.3 20.5 14.1 9.2 17.3
1998 5.9 7.8 11.2 18.0 22.8 27.4 28.6 29.0 24.6 18.3 14.6 9.4 18.1
1999 7.7 9.8 12.7 18.4 23.8 26.5 28.5 28.7 24.3 20.3 11.9 7.9 18.3
2000 5.6 6.0 10.1 20.8 22.4 24.7 29.6 28.5 23.7 17.9 11.4 8.5 17.4
2001 5.9 8.4 13.6 17.4 22.2 24.9 27.6 29.0 25.1 19.4 11.0 8.9 17.7
2002 5.2 7.7 12.4 16.9 22.3 25.3 27.6 27.4 24.6 21.7 12.8 7.1 17.5
2003 MISS MISS 11.3 18.5 23.9 26.8 27.2 28.0 23.5 20.6 12.4 8.3 20.0
2004 5.0 8.7 13.8 16.9 23.3 26.0 27.9 26.7 23.3 21.5 14.4 5.3 17.7
2005 6.2 7.3 12.9 19.0 23.4 26.2 28.7 27.3 29.9 18.3 10.1 9.6 18.2
2006 6.9 10.1 12.9 18.6 24.0 26.7 29.1 28.2 22.8 22.1 10.3 4.8 18.0
2007 3.8 8.9 11.7 17.6 24.8 26.2 27.8 27.5 24.1 20.1 11.4 6.6 17.5
2008 3.3 7.0 14.4 19.2 23.0 26.8 28.0 29.5 26.9 20.6 12.7 6.8 18.1
2009 4.9 11.3 13.3 18.0 25.0 26.8 28.0 26.7 24.3 20.6 12.5 10.2 18.4
2010 8.8 11.2 15.1 18.8 23.9 28.0 28.2 28.4 25.6 21.2 11.8 9.6 19.2
2011 5.6 8.0 11.7 17.6 23.8 27.1 29.3 27.6 24.5 18.4 9.4 8.9 17.6
2012 8.5 10.2 9.9 17.7 25.0 27.5 31.5 29.7 26.6 22.5 13.5 10.5 19.4
2013 8.5 11.3 12.6 17.0 21.8 25.7 26.1 24.9 22.1 15.6 14.3 6.3 17.1
2014 7.5 7.9 13.9 18.7 23.9 25.4 26.9 27.6 22.5 17.2 9.6 8.8 17.4
2015 6.2 7.9 11.0 16.0 23.6 25.2 27.4 27.8 26.1 21.3 12.7 6.5 17.6
Source: Meteorological Organization and Seismology of Iraq
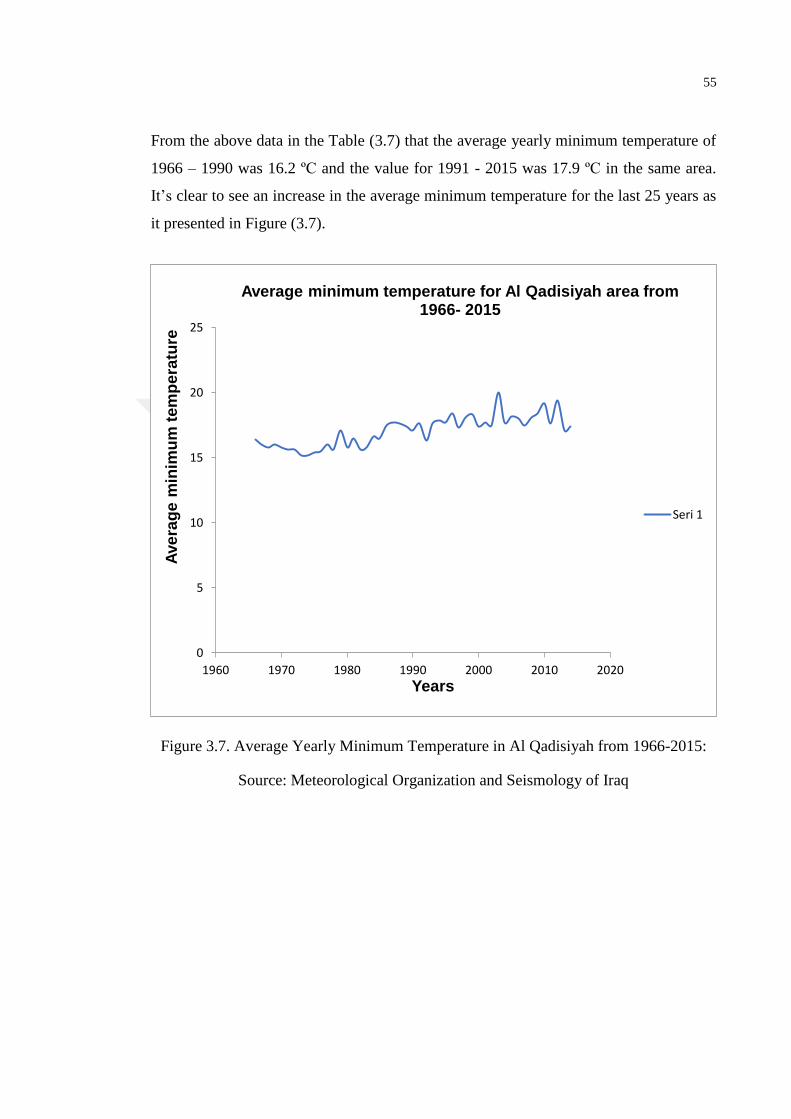
55
From the above data in the Table (3.7) that the average yearly minimum temperature of
1966 – 1990 was 16.2 ºC and the value for 1991 - 2015 was 17.9 ºC in the same area.
It’s clear to see an increase in the average minimum temperature for the last 25 years as
it presented in Figure (3.7).
Figure 3.7. Average Yearly Minimum Temperature in Al Qadisiyah from 1966-2015:
Source: Meteorological Organization and Seismology of Iraq
0
5
10
15
20
25
1960 1970 1980 1990 2000 2010 2020
Ave
rag
e m
inim
um
tem
pe
ratu
re
Years
Average minimum temperature for Al Qadisiyah area from 1966- 2015
Seri 1
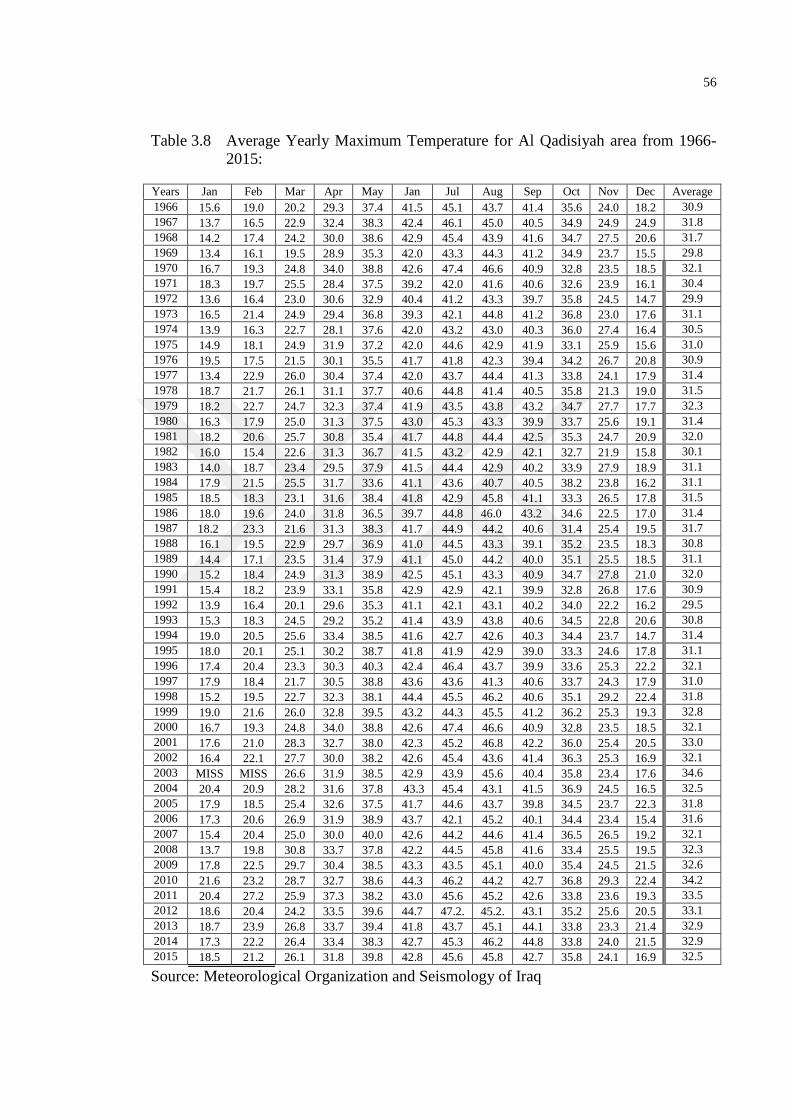
56
Table 3.8 Average Yearly Maximum Temperature for Al Qadisiyah area from 1966-
2015:
Years Jan Feb Mar Apr May Jan Jul Aug Sep Oct Nov Dec Average
1966 15.6 19.0 20.2 29.3 37.4 41.5 45.1 43.7 41.4 35.6 24.0 18.2 30.9
1967 13.7 16.5 22.9 32.4 38.3 42.4 46.1 45.0 40.5 34.9 24.9 24.9 31.8
1968 14.2 17.4 24.2 30.0 38.6 42.9 45.4 43.9 41.6 34.7 27.5 20.6 31.7
1969 13.4 16.1 19.5 28.9 35.3 42.0 43.3 44.3 41.2 34.9 23.7 15.5 29.8
1970 16.7 19.3 24.8 34.0 38.8 42.6 47.4 46.6 40.9 32.8 23.5 18.5 32.1
1971 18.3 19.7 25.5 28.4 37.5 39.2 42.0 41.6 40.6 32.6 23.9 16.1 30.4
1972 13.6 16.4 23.0 30.6 32.9 40.4 41.2 43.3 39.7 35.8 24.5 14.7 29.9
1973 16.5 21.4 24.9 29.4 36.8 39.3 42.1 44.8 41.2 36.8 23.0 17.6 31.1
1974 13.9 16.3 22.7 28.1 37.6 42.0 43.2 43.0 40.3 36.0 27.4 16.4 30.5
1975 14.9 18.1 24.9 31.9 37.2 42.0 44.6 42.9 41.9 33.1 25.9 15.6 31.0
1976 19.5 17.5 21.5 30.1 35.5 41.7 41.8 42.3 39.4 34.2 26.7 20.8 30.9
1977 13.4 22.9 26.0 30.4 37.4 42.0 43.7 44.4 41.3 33.8 24.1 17.9 31.4
1978 18.7 21.7 26.1 31.1 37.7 40.6 44.8 41.4 40.5 35.8 21.3 19.0 31.5
1979 18.2 22.7 24.7 32.3 37.4 41.9 43.5 43.8 43.2 34.7 27.7 17.7 32.3
1980 16.3 17.9 25.0 31.3 37.5 43.0 45.3 43.3 39.9 33.7 25.6 19.1 31.4
1981 18.2 20.6 25.7 30.8 35.4 41.7 44.8 44.4 42.5 35.3 24.7 20.9 32.0
1982 16.0 15.4 22.6 31.3 36.7 41.5 43.2 42.9 42.1 32.7 21.9 15.8 30.1
1983 14.0 18.7 23.4 29.5 37.9 41.5 44.4 42.9 40.2 33.9 27.9 18.9 31.1
1984 17.9 21.5 25.5 31.7 33.6 41.1 43.6 40.7 40.5 38.2 23.8 16.2 31.1
1985 18.5 18.3 23.1 31.6 38.4 41.8 42.9 45.8 41.1 33.3 26.5 17.8 31.5
1986 18.0 19.6 24.0 31.8 36.5 39.7 44.8 46.0 43.2 34.6 22.5 17.0 31.4
1987 18.2 23.3 21.6 31.3 38.3 41.7 44.9 44.2 40.6 31.4 25.4 19.5 31.7
1988 16.1 19.5 22.9 29.7 36.9 41.0 44.5 43.3 39.1 35.2 23.5 18.3 30.8
1989 14.4 17.1 23.5 31.4 37.9 41.1 45.0 44.2 40.0 35.1 25.5 18.5 31.1
1990 15.2 18.4 24.9 31.3 38.9 42.5 45.1 43.3 40.9 34.7 27.8 21.0 32.0
1991 15.4 18.2 23.9 33.1 35.8 42.9 42.9 42.1 39.9 32.8 26.8 17.6 30.9
1992 13.9 16.4 20.1 29.6 35.3 41.1 42.1 43.1 40.2 34.0 22.2 16.2 29.5
1993 15.3 18.3 24.5 29.2 35.2 41.4 43.9 43.8 40.6 34.5 22.8 20.6 30.8
1994 19.0 20.5 25.6 33.4 38.5 41.6 42.7 42.6 40.3 34.4 23.7 14.7 31.4
1995 18.0 20.1 25.1 30.2 38.7 41.8 41.9 42.9 39.0 33.3 24.6 17.8 31.1
1996 17.4 20.4 23.3 30.3 40.3 42.4 46.4 43.7 39.9 33.6 25.3 22.2 32.1
1997 17.9 18.4 21.7 30.5 38.8 43.6 43.6 41.3 40.6 33.7 24.3 17.9 31.0
1998 15.2 19.5 22.7 32.3 38.1 44.4 45.5 46.2 40.6 35.1 29.2 22.4 31.8
1999 19.0 21.6 26.0 32.8 39.5 43.2 44.3 45.5 41.2 36.2 25.3 19.3 32.8
2000 16.7 19.3 24.8 34.0 38.8 42.6 47.4 46.6 40.9 32.8 23.5 18.5 32.1
2001 17.6 21.0 28.3 32.7 38.0 42.3 45.2 46.8 42.2 36.0 25.4 20.5 33.0
2002 16.4 22.1 27.7 30.0 38.2 42.6 45.4 43.6 41.4 36.3 25.3 16.9 32.1
2003 MISS MISS 26.6 31.9 38.5 42.9 43.9 45.6 40.4 35.8 23.4 17.6 34.6
2004 20.4 20.9 28.2 31.6 37.8 43.3 45.4 43.1 41.5 36.9 24.5 16.5 32.5
2005 17.9 18.5 25.4 32.6 37.5 41.7 44.6 43.7 39.8 34.5 23.7 22.3 31.8
2006 17.3 20.6 26.9 31.9 38.9 43.7 42.1 45.2 40.1 34.4 23.4 15.4 31.6
2007 15.4 20.4 25.0 30.0 40.0 42.6 44.2 44.6 41.4 36.5 26.5 19.2 32.1
2008 13.7 19.8 30.8 33.7 37.8 42.2 44.5 45.8 41.6 33.4 25.5 19.5 32.3
2009 17.8 22.5 29.7 30.4 38.5 43.3 43.5 45.1 40.0 35.4 24.5 21.5 32.6
2010 21.6 23.2 28.7 32.7 38.6 44.3 46.2 44.2 42.7 36.8 29.3 22.4 34.2
2011 20.4 27.2 25.9 37.3 38.2 43.0 45.6 45.2 42.6 33.8 23.6 19.3 33.5
2012 18.6 20.4 24.2 33.5 39.6 44.7 47.2. 45.2. 43.1 35.2 25.6 20.5 33.1
2013 18.7 23.9 26.8 33.7 39.4 41.8 43.7 45.1 44.1 33.8 23.3 21.4 32.9
2014 17.3 22.2 26.4 33.4 38.3 42.7 45.3 46.2 44.8 33.8 24.0 21.5 32.9
2015 18.5 21.2 26.1 31.8 39.8 42.8 45.6 45.8 42.7 35.8 24.1 16.9 32.5
Source: Meteorological Organization and Seismology of Iraq
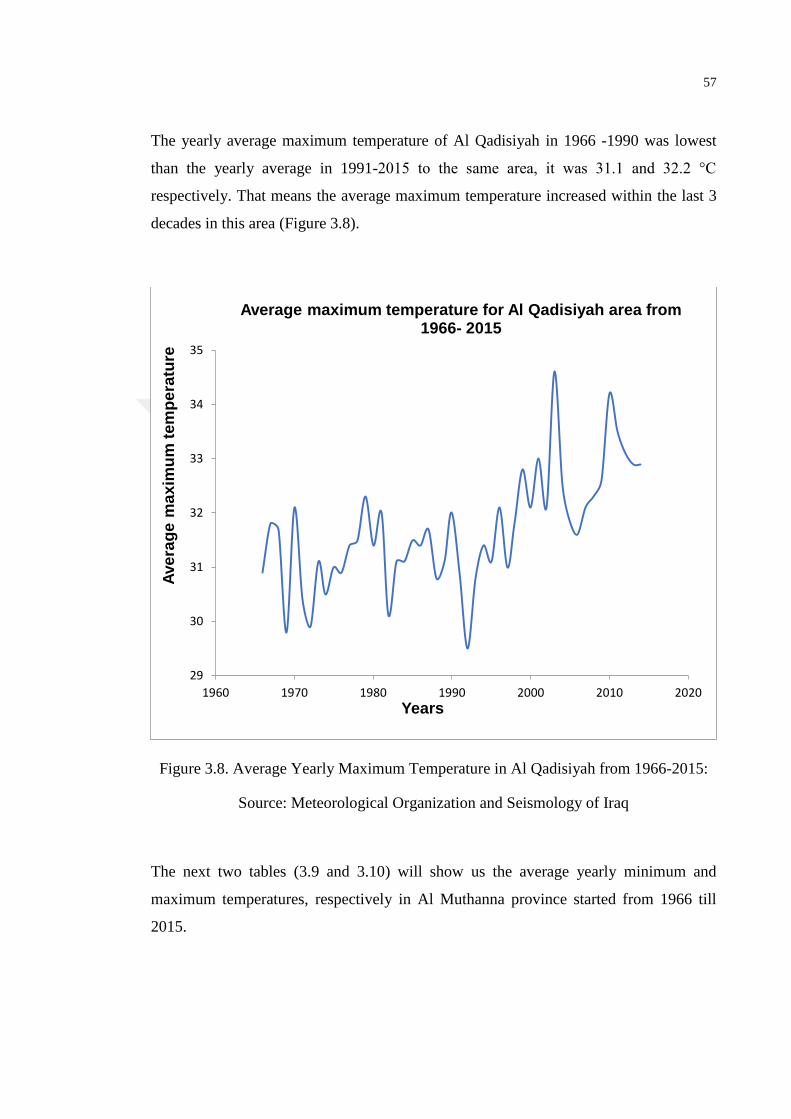
57
The yearly average maximum temperature of Al Qadisiyah in 1966 -1990 was lowest
than the yearly average in 1991-2015 to the same area, it was 31.1 and 32.2 °C
respectively. That means the average maximum temperature increased within the last 3
decades in this area (Figure 3.8).
Figure 3.8. Average Yearly Maximum Temperature in Al Qadisiyah from 1966-2015:
Source: Meteorological Organization and Seismology of Iraq
The next two tables (3.9 and 3.10) will show us the average yearly minimum and
maximum temperatures, respectively in Al Muthanna province started from 1966 till
2015.
29
30
31
32
33
34
35
1960 1970 1980 1990 2000 2010 2020
Ave
rag
e m
ax
imu
m t
em
pe
ratu
re
Years
Average maximum temperature for Al Qadisiyah area from 1966- 2015
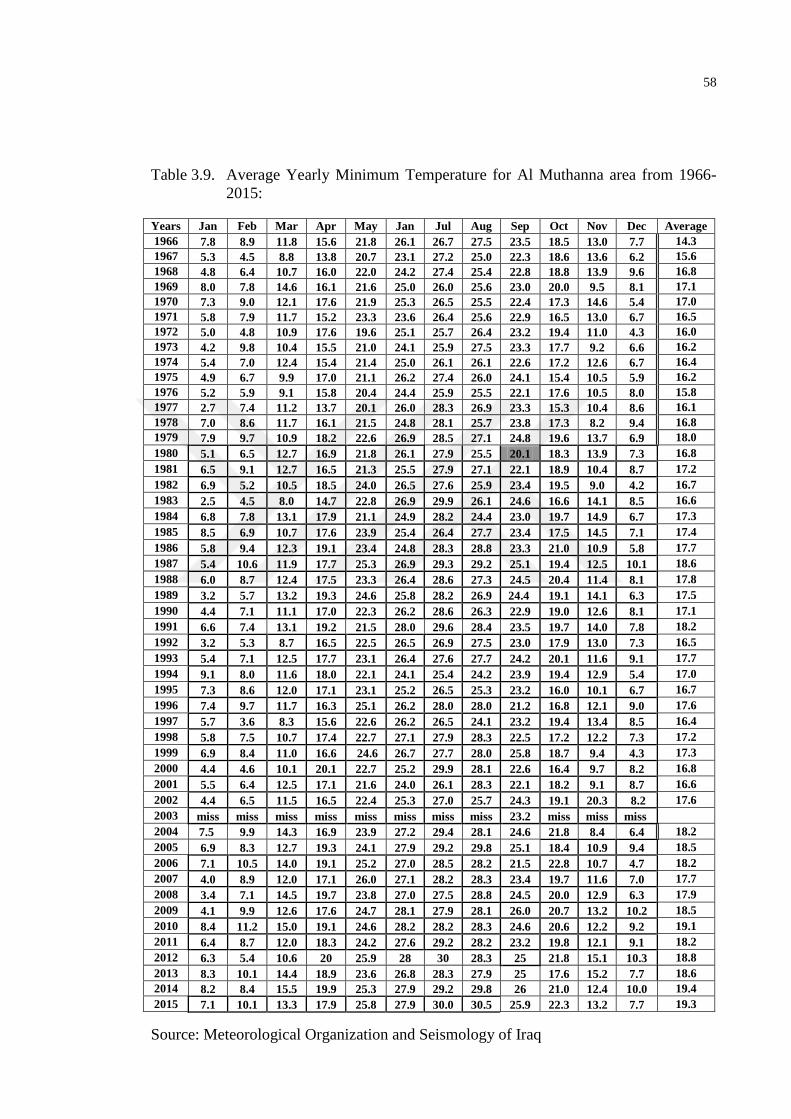
58
Table 3.9. Average Yearly Minimum Temperature for Al Muthanna area from 1966-
2015:
Years Jan Feb Mar Apr May Jan Jul Aug Sep Oct Nov Dec Average
1966 7.8 8.9 11.8 15.6 21.8 26.1 26.7 27.5 23.5 18.5 13.0 7.7 14.3
1967 5.3 4.5 8.8 13.8 20.7 23.1 27.2 25.0 22.3 18.6 13.6 6.2 15.6
1968 4.8 6.4 10.7 16.0 22.0 24.2 27.4 25.4 22.8 18.8 13.9 9.6 16.8
1969 8.0 7.8 14.6 16.1 21.6 25.0 26.0 25.6 23.0 20.0 9.5 8.1 17.1
1970 7.3 9.0 12.1 17.6 21.9 25.3 26.5 25.5 22.4 17.3 14.6 5.4 17.0
1971 5.8 7.9 11.7 15.2 23.3 23.6 26.4 25.6 22.9 16.5 13.0 6.7 16.5
1972 5.0 4.8 10.9 17.6 19.6 25.1 25.7 26.4 23.2 19.4 11.0 4.3 16.0
1973 4.2 9.8 10.4 15.5 21.0 24.1 25.9 27.5 23.3 17.7 9.2 6.6 16.2
1974 5.4 7.0 12.4 15.4 21.4 25.0 26.1 26.1 22.6 17.2 12.6 6.7 16.4
1975 4.9 6.7 9.9 17.0 21.1 26.2 27.4 26.0 24.1 15.4 10.5 5.9 16.2
1976 5.2 5.9 9.1 15.8 20.4 24.4 25.9 25.5 22.1 17.6 10.5 8.0 15.8
1977 2.7 7.4 11.2 13.7 20.1 26.0 28.3 26.9 23.3 15.3 10.4 8.6 16.1
1978 7.0 8.6 11.7 16.1 21.5 24.8 28.1 25.7 23.8 17.3 8.2 9.4 16.8
1979 7.9 9.7 10.9 18.2 22.6 26.9 28.5 27.1 24.8 19.6 13.7 6.9 18.0
1980 5.1 6.5 12.7 16.9 21.8 26.1 27.9 25.5 20.1 18.3 13.9 7.3 16.8
1981 6.5 9.1 12.7 16.5 21.3 25.5 27.9 27.1 22.1 18.9 10.4 8.7 17.2
1982 6.9 5.2 10.5 18.5 24.0 26.5 27.6 25.9 23.4 19.5 9.0 4.2 16.7
1983 2.5 4.5 8.0 14.7 22.8 26.9 29.9 26.1 24.6 16.6 14.1 8.5 16.6
1984 6.8 7.8 13.1 17.9 21.1 24.9 28.2 24.4 23.0 19.7 14.9 6.7 17.3
1985 8.5 6.9 10.7 17.6 23.9 25.4 26.4 27.7 23.4 17.5 14.5 7.1 17.4
1986 5.8 9.4 12.3 19.1 23.4 24.8 28.3 28.8 23.3 21.0 10.9 5.8 17.7
1987 5.4 10.6 11.9 17.7 25.3 26.9 29.3 29.2 25.1 19.4 12.5 10.1 18.6
1988 6.0 8.7 12.4 17.5 23.3 26.4 28.6 27.3 24.5 20.4 11.4 8.1 17.8
1989 3.2 5.7 13.2 19.3 24.6 25.8 28.2 26.9 24.4 19.1 14.1 6.3 17.5
1990 4.4 7.1 11.1 17.0 22.3 26.2 28.6 26.3 22.9 19.0 12.6 8.1 17.1
1991 6.6 7.4 13.1 19.2 21.5 28.0 29.6 28.4 23.5 19.7 14.0 7.8 18.2
1992 3.2 5.3 8.7 16.5 22.5 26.5 26.9 27.5 23.0 17.9 13.0 7.3 16.5
1993 5.4 7.1 12.5 17.7 23.1 26.4 27.6 27.7 24.2 20.1 11.6 9.1 17.7
1994 9.1 8.0 11.6 18.0 22.1 24.1 25.4 24.2 23.9 19.4 12.9 5.4 17.0
1995 7.3 8.6 12.0 17.1 23.1 25.2 26.5 25.3 23.2 16.0 10.1 6.7 16.7
1996 7.4 9.7 11.7 16.3 25.1 26.2 28.0 28.0 21.2 16.8 12.1 9.0 17.6
1997 5.7 3.6 8.3 15.6 22.6 26.2 26.5 24.1 23.2 19.4 13.4 8.5 16.4
1998 5.8 7.5 10.7 17.4 22.7 27.1 27.9 28.3 22.5 17.2 12.2 7.3 17.2
1999 6.9 8.4 11.0 16.6 24.6 26.7 27.7 28.0 25.8 18.7 9.4 4.3 17.3
2000 4.4 4.6 10.1 20.1 22.7 25.2 29.9 28.1 22.6 16.4 9.7 8.2 16.8
2001 5.5 6.4 12.5 17.1 21.6 24.0 26.1 28.3 22.1 18.2 9.1 8.7 16.6
2002 4.4 6.5 11.5 16.5 22.4 25.3 27.0 25.7 24.3 19.1 20.3 8.2 17.6
2003 miss miss miss miss miss miss miss miss 23.2 miss miss miss
2004 7.5 9.9 14.3 16.9 23.9 27.2 29.4 28.1 24.6 21.8 8.4 6.4 18.2
2005 6.9 8.3 12.7 19.3 24.1 27.9 29.2 29.8 25.1 18.4 10.9 9.4 18.5
2006 7.1 10.5 14.0 19.1 25.2 27.0 28.5 28.2 21.5 22.8 10.7 4.7 18.2
2007 4.0 8.9 12.0 17.1 26.0 27.1 28.2 28.3 23.4 19.7 11.6 7.0 17.7
2008 3.4 7.1 14.5 19.7 23.8 27.0 27.5 28.8 24.5 20.0 12.9 6.3 17.9
2009 4.1 9.9 12.6 17.6 24.7 28.1 27.9 28.1 26.0 20.7 13.2 10.2 18.5
2010 8.4 11.2 15.0 19.1 24.6 28.2 28.2 28.3 24.6 20.6 12.2 9.2 19.1
2011 6.4 8.7 12.0 18.3 24.2 27.6 29.2 28.2 23.2 19.8 12.1 9.1 18.2
2012 6.3 5.4 10.6 20 25.9 28 30 28.3 25 21.8 15.1 10.3 18.8
2013 8.3 10.1 14.4 18.9 23.6 26.8 28.3 27.9 25 17.6 15.2 7.7 18.6
2014 8.2 8.4 15.5 19.9 25.3 27.9 29.2 29.8 26 21.0 12.4 10.0 19.4
2015 7.1 10.1 13.3 17.9 25.8 27.9 30.0 30.5 25.9 22.3 13.2 7.7 19.3
Source: Meteorological Organization and Seismology of Iraq
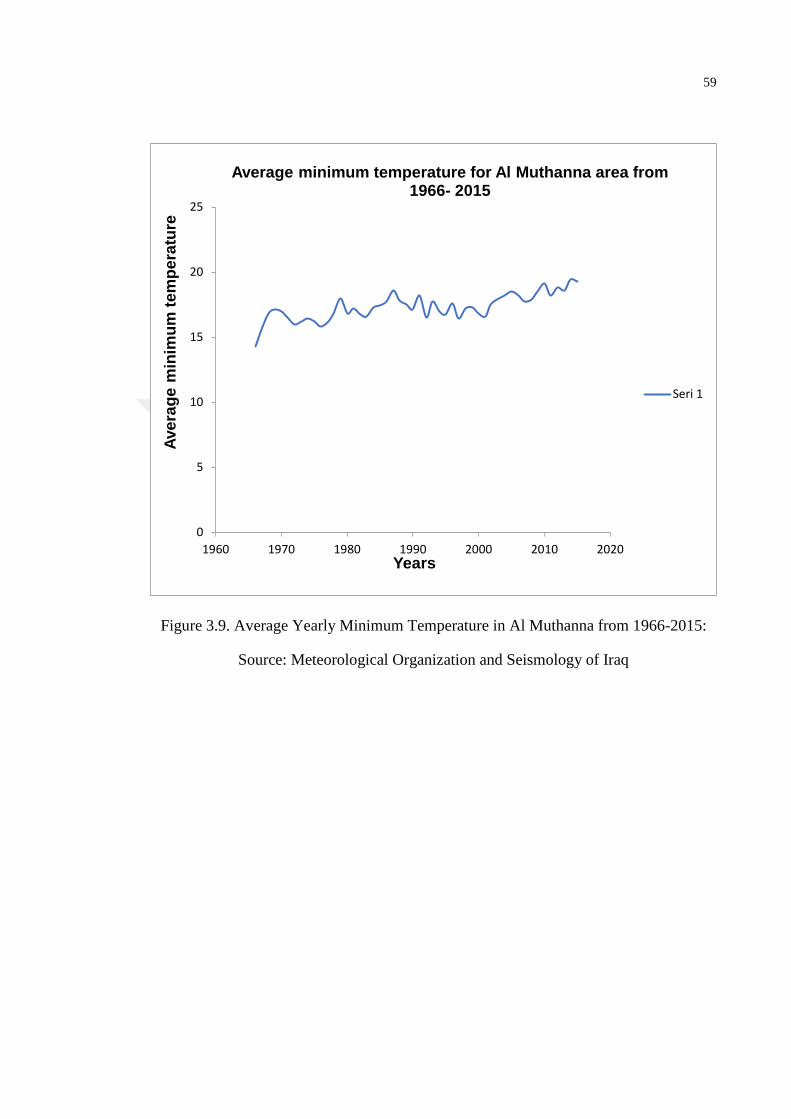
59
Figure 3.9. Average Yearly Minimum Temperature in Al Muthanna from 1966-2015:
Source: Meteorological Organization and Seismology of Iraq
0
5
10
15
20
25
1960 1970 1980 1990 2000 2010 2020
Ave
rag
e m
inim
um
tem
pe
ratu
re
Years
Average minimum temperature for Al Muthanna area from 1966- 2015
Seri 1
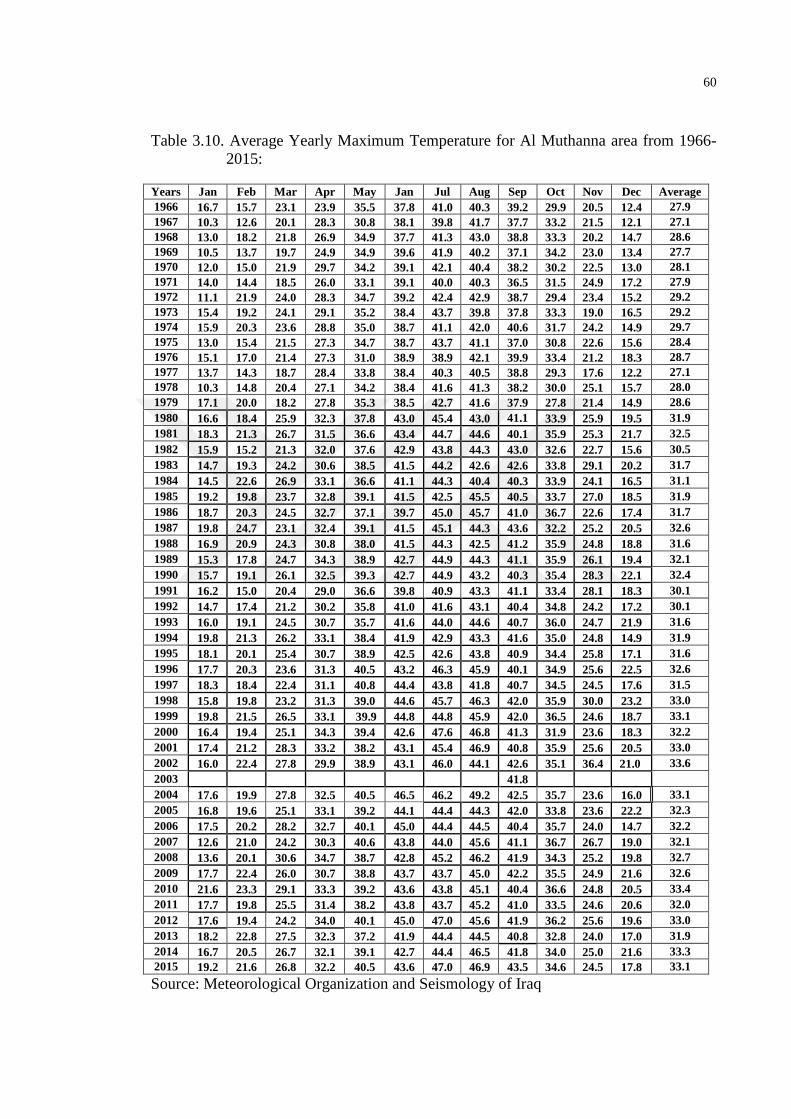
60
Table 3.10. Average Yearly Maximum Temperature for Al Muthanna area from 1966-
2015:
Years Jan Feb Mar Apr May Jan Jul Aug Sep Oct Nov Dec Average
1966 16.7 15.7 23.1 23.9 35.5 37.8 41.0 40.3 39.2 29.9 20.5 12.4 27.9
1967 10.3 12.6 20.1 28.3 30.8 38.1 39.8 41.7 37.7 33.2 21.5 12.1 27.1
1968 13.0 18.2 21.8 26.9 34.9 37.7 41.3 43.0 38.8 33.3 20.2 14.7 28.6
1969 10.5 13.7 19.7 24.9 34.9 39.6 41.9 40.2 37.1 34.2 23.0 13.4 27.7
1970 12.0 15.0 21.9 29.7 34.2 39.1 42.1 40.4 38.2 30.2 22.5 13.0 28.1
1971 14.0 14.4 18.5 26.0 33.1 39.1 40.0 40.3 36.5 31.5 24.9 17.2 27.9
1972 11.1 21.9 24.0 28.3 34.7 39.2 42.4 42.9 38.7 29.4 23.4 15.2 29.2
1973 15.4 19.2 24.1 29.1 35.2 38.4 43.7 39.8 37.8 33.3 19.0 16.5 29.2
1974 15.9 20.3 23.6 28.8 35.0 38.7 41.1 42.0 40.6 31.7 24.2 14.9 29.7
1975 13.0 15.4 21.5 27.3 34.7 38.7 43.7 41.1 37.0 30.8 22.6 15.6 28.4
1976 15.1 17.0 21.4 27.3 31.0 38.9 38.9 42.1 39.9 33.4 21.2 18.3 28.7
1977 13.7 14.3 18.7 28.4 33.8 38.4 40.3 40.5 38.8 29.3 17.6 12.2 27.1
1978 10.3 14.8 20.4 27.1 34.2 38.4 41.6 41.3 38.2 30.0 25.1 15.7 28.0
1979 17.1 20.0 18.2 27.8 35.3 38.5 42.7 41.6 37.9 27.8 21.4 14.9 28.6
1980 16.6 18.4 25.9 32.3 37.8 43.0 45.4 43.0 41.1 33.9 25.9 19.5 31.9
1981 18.3 21.3 26.7 31.5 36.6 43.4 44.7 44.6 40.1 35.9 25.3 21.7 32.5
1982 15.9 15.2 21.3 32.0 37.6 42.9 43.8 44.3 43.0 32.6 22.7 15.6 30.5
1983 14.7 19.3 24.2 30.6 38.5 41.5 44.2 42.6 42.6 33.8 29.1 20.2 31.7
1984 14.5 22.6 26.9 33.1 36.6 41.1 44.3 40.4 40.3 33.9 24.1 16.5 31.1
1985 19.2 19.8 23.7 32.8 39.1 41.5 42.5 45.5 40.5 33.7 27.0 18.5 31.9
1986 18.7 20.3 24.5 32.7 37.1 39.7 45.0 45.7 41.0 36.7 22.6 17.4 31.7
1987 19.8 24.7 23.1 32.4 39.1 41.5 45.1 44.3 43.6 32.2 25.2 20.5 32.6
1988 16.9 20.9 24.3 30.8 38.0 41.5 44.3 42.5 41.2 35.9 24.8 18.8 31.6
1989 15.3 17.8 24.7 34.3 38.9 42.7 44.9 44.3 41.1 35.9 26.1 19.4 32.1
1990 15.7 19.1 26.1 32.5 39.3 42.7 44.9 43.2 40.3 35.4 28.3 22.1 32.4
1991 16.2 15.0 20.4 29.0 36.6 39.8 40.9 43.3 41.1 33.4 28.1 18.3 30.1
1992 14.7 17.4 21.2 30.2 35.8 41.0 41.6 43.1 40.4 34.8 24.2 17.2 30.1
1993 16.0 19.1 24.5 30.7 35.7 41.6 44.0 44.6 40.7 36.0 24.7 21.9 31.6
1994 19.8 21.3 26.2 33.1 38.4 41.9 42.9 43.3 41.6 35.0 24.8 14.9 31.9
1995 18.1 20.1 25.4 30.7 38.9 42.5 42.6 43.8 40.9 34.4 25.8 17.1 31.6
1996 17.7 20.3 23.6 31.3 40.5 43.2 46.3 45.9 40.1 34.9 25.6 22.5 32.6
1997 18.3 18.4 22.4 31.1 40.8 44.4 43.8 41.8 40.7 34.5 24.5 17.6 31.5
1998 15.8 19.8 23.2 31.3 39.0 44.6 45.7 46.3 42.0 35.9 30.0 23.2 33.0
1999 19.8 21.5 26.5 33.1 39.9 44.8 44.8 45.9 42.0 36.5 24.6 18.7 33.1
2000 16.4 19.4 25.1 34.3 39.4 42.6 47.6 46.8 41.3 31.9 23.6 18.3 32.2
2001 17.4 21.2 28.3 33.2 38.2 43.1 45.4 46.9 40.8 35.9 25.6 20.5 33.0
2002 16.0 22.4 27.8 29.9 38.9 43.1 46.0 44.1 42.6 35.1 36.4 21.0 33.6
2003 41.8
2004 17.6 19.9 27.8 32.5 40.5 46.5 46.2 49.2 42.5 35.7 23.6 16.0 33.1
2005 16.8 19.6 25.1 33.1 39.2 44.1 44.4 44.3 42.0 33.8 23.6 22.2 32.3
2006 17.5 20.2 28.2 32.7 40.1 45.0 44.4 44.5 40.4 35.7 24.0 14.7 32.2
2007 12.6 21.0 24.2 30.3 40.6 43.8 44.0 45.6 41.1 36.7 26.7 19.0 32.1
2008 13.6 20.1 30.6 34.7 38.7 42.8 45.2 46.2 41.9 34.3 25.2 19.8 32.7
2009 17.7 22.4 26.0 30.7 38.8 43.7 43.7 45.0 42.2 35.5 24.9 21.6 32.6
2010 21.6 23.3 29.1 33.3 39.2 43.6 43.8 45.1 40.4 36.6 24.8 20.5 33.4
2011 17.7 19.8 25.5 31.4 38.2 43.8 43.7 45.2 41.0 33.5 24.6 20.6 32.0
2012 17.6 19.4 24.2 34.0 40.1 45.0 47.0 45.6 41.9 36.2 25.6 19.6 33.0
2013 18.2 22.8 27.5 32.3 37.2 41.9 44.4 44.5 40.8 32.8 24.0 17.0 31.9
2014 16.7 20.5 26.7 32.1 39.1 42.7 44.4 46.5 41.8 34.0 25.0 21.6 33.3
2015 19.2 21.6 26.8 32.2 40.5 43.6 47.0 46.9 43.5 34.6 24.5 17.8 33.1
Source: Meteorological Organization and Seismology of Iraq
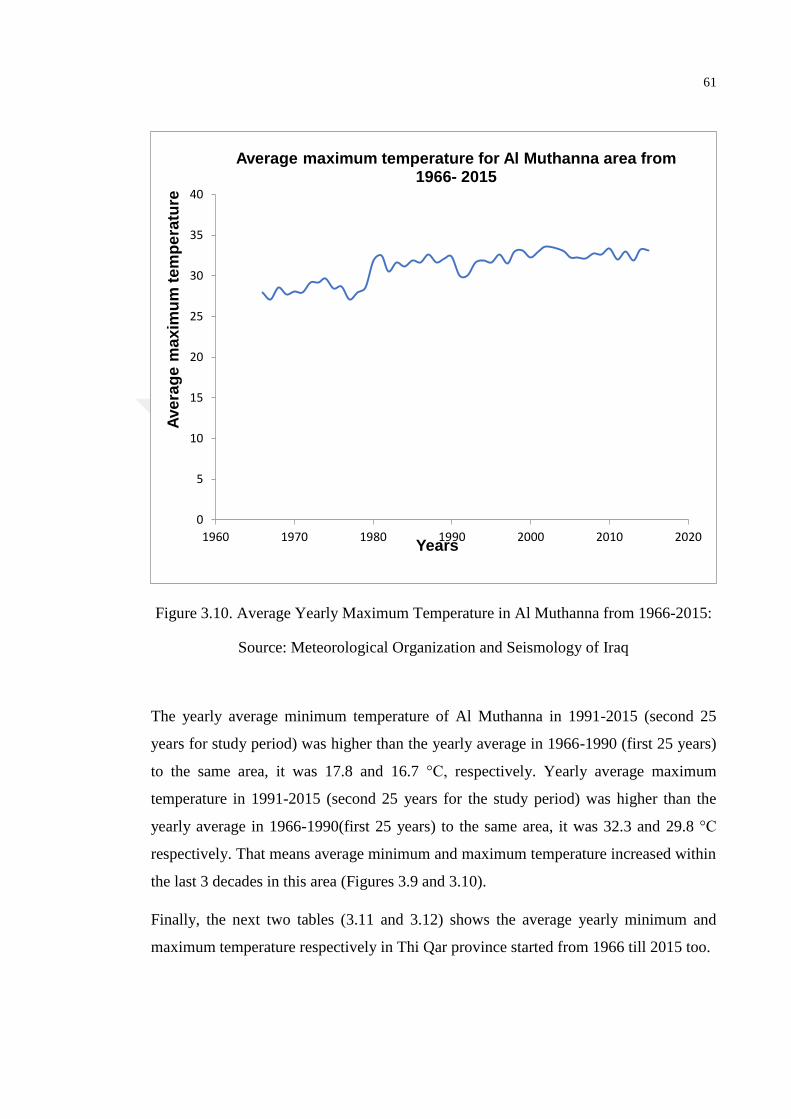
61
Figure 3.10. Average Yearly Maximum Temperature in Al Muthanna from 1966-2015:
Source: Meteorological Organization and Seismology of Iraq
The yearly average minimum temperature of Al Muthanna in 1991-2015 (second 25
years for study period) was higher than the yearly average in 1966-1990 (first 25 years)
to the same area, it was 17.8 and 16.7 °C, respectively. Yearly average maximum
temperature in 1991-2015 (second 25 years for the study period) was higher than the
yearly average in 1966-1990(first 25 years) to the same area, it was 32.3 and 29.8 °C
respectively. That means average minimum and maximum temperature increased within
the last 3 decades in this area (Figures 3.9 and 3.10).
Finally, the next two tables (3.11 and 3.12) shows the average yearly minimum and
maximum temperature respectively in Thi Qar province started from 1966 till 2015 too.
0
5
10
15
20
25
30
35
40
1960 1970 1980 1990 2000 2010 2020
Ave
rag
e m
ax
imu
m t
em
pe
ratu
re
Years
Average maximum temperature for Al Muthanna area from 1966- 2015
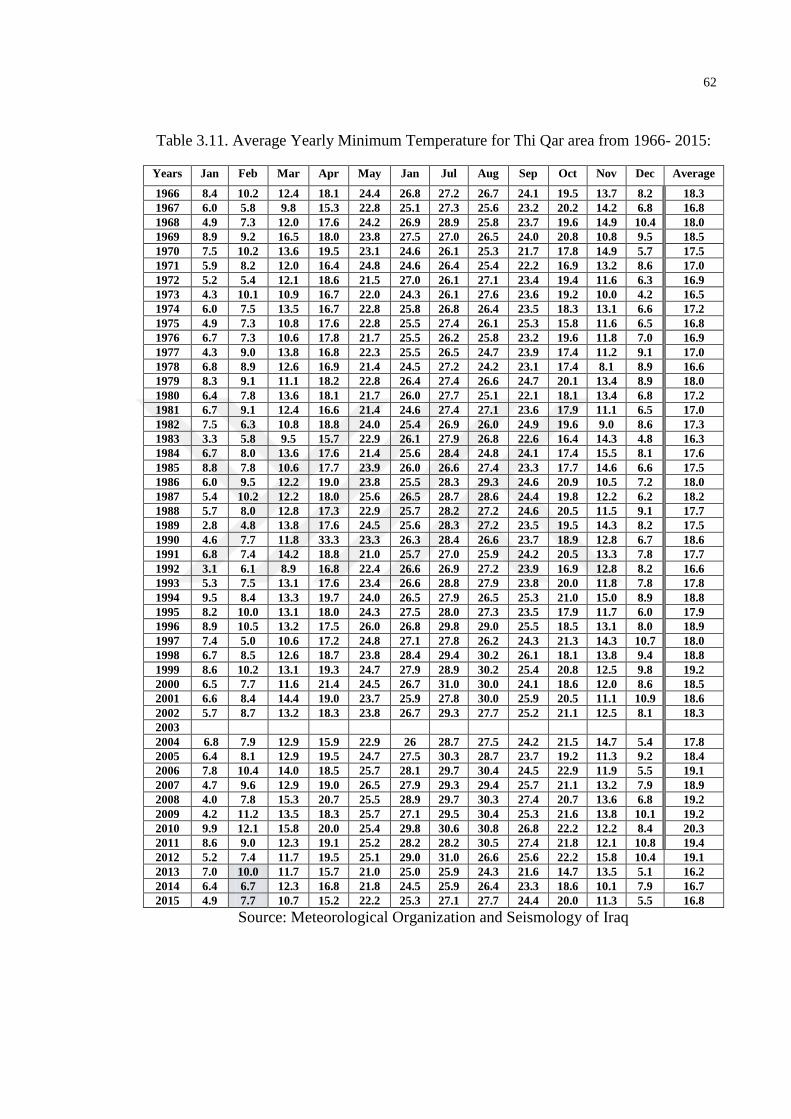
62
Table 3.11. Average Yearly Minimum Temperature for Thi Qar area from 1966- 2015:
Years Jan Feb Mar Apr May Jan Jul Aug Sep Oct Nov Dec Average
1966 8.4 10.2 12.4 18.1 24.4 26.8 27.2 26.7 24.1 19.5 13.7 8.2 18.3
1967 6.0 5.8 9.8 15.3 22.8 25.1 27.3 25.6 23.2 20.2 14.2 6.8 16.8
1968 4.9 7.3 12.0 17.6 24.2 26.9 28.9 25.8 23.7 19.6 14.9 10.4 18.0
1969 8.9 9.2 16.5 18.0 23.8 27.5 27.0 26.5 24.0 20.8 10.8 9.5 18.5
1970 7.5 10.2 13.6 19.5 23.1 24.6 26.1 25.3 21.7 17.8 14.9 5.7 17.5
1971 5.9 8.2 12.0 16.4 24.8 24.6 26.4 25.4 22.2 16.9 13.2 8.6 17.0
1972 5.2 5.4 12.1 18.6 21.5 27.0 26.1 27.1 23.4 19.4 11.6 6.3 16.9
1973 4.3 10.1 10.9 16.7 22.0 24.3 26.1 27.6 23.6 19.2 10.0 4.2 16.5
1974 6.0 7.5 13.5 16.7 22.8 25.8 26.8 26.4 23.5 18.3 13.1 6.6 17.2
1975 4.9 7.3 10.8 17.6 22.8 25.5 27.4 26.1 25.3 15.8 11.6 6.5 16.8
1976 6.7 7.3 10.6 17.8 21.7 25.5 26.2 25.8 23.2 19.6 11.8 7.0 16.9
1977 4.3 9.0 13.8 16.8 22.3 25.5 26.5 24.7 23.9 17.4 11.2 9.1 17.0
1978 6.8 8.9 12.6 16.9 21.4 24.5 27.2 24.2 23.1 17.4 8.1 8.9 16.6
1979 8.3 9.1 11.1 18.2 22.8 26.4 27.4 26.6 24.7 20.1 13.4 8.9 18.0
1980 6.4 7.8 13.6 18.1 21.7 26.0 27.7 25.1 22.1 18.1 13.4 6.8 17.2
1981 6.7 9.1 12.4 16.6 21.4 24.6 27.4 27.1 23.6 17.9 11.1 6.5 17.0
1982 7.5 6.3 10.8 18.8 24.0 25.4 26.9 26.0 24.9 19.6 9.0 8.6 17.3
1983 3.3 5.8 9.5 15.7 22.9 26.1 27.9 26.8 22.6 16.4 14.3 4.8 16.3
1984 6.7 8.0 13.6 17.6 21.4 25.6 28.4 24.8 24.1 17.4 15.5 8.1 17.6
1985 8.8 7.8 10.6 17.7 23.9 26.0 26.6 27.4 23.3 17.7 14.6 6.6 17.5
1986 6.0 9.5 12.2 19.0 23.8 25.5 28.3 29.3 24.6 20.9 10.5 7.2 18.0
1987 5.4 10.2 12.2 18.0 25.6 26.5 28.7 28.6 24.4 19.8 12.2 6.2 18.2
1988 5.7 8.0 12.8 17.3 22.9 25.7 28.2 27.2 24.6 20.5 11.5 9.1 17.7
1989 2.8 4.8 13.8 17.6 24.5 25.6 28.3 27.2 23.5 19.5 14.3 8.2 17.5
1990 4.6 7.7 11.8 33.3 23.3 26.3 28.4 26.6 23.7 18.9 12.8 6.7 18.6
1991 6.8 7.4 14.2 18.8 21.0 25.7 27.0 25.9 24.2 20.5 13.3 7.8 17.7
1992 3.1 6.1 8.9 16.8 22.4 26.6 26.9 27.2 23.9 16.9 12.8 8.2 16.6
1993 5.3 7.5 13.1 17.6 23.4 26.6 28.8 27.9 23.8 20.0 11.8 7.8 17.8
1994 9.5 8.4 13.3 19.7 24.0 26.5 27.9 26.5 25.3 21.0 15.0 8.9 18.8
1995 8.2 10.0 13.1 18.0 24.3 27.5 28.0 27.3 23.5 17.9 11.7 6.0 17.9
1996 8.9 10.5 13.2 17.5 26.0 26.8 29.8 29.0 25.5 18.5 13.1 8.0 18.9
1997 7.4 5.0 10.6 17.2 24.8 27.1 27.8 26.2 24.3 21.3 14.3 10.7 18.0
1998 6.7 8.5 12.6 18.7 23.8 28.4 29.4 30.2 26.1 18.1 13.8 9.4 18.8
1999 8.6 10.2 13.1 19.3 24.7 27.9 28.9 30.2 25.4 20.8 12.5 9.8 19.2
2000 6.5 7.7 11.6 21.4 24.5 26.7 31.0 30.0 24.1 18.6 12.0 8.6 18.5
2001 6.6 8.4 14.4 19.0 23.7 25.9 27.8 30.0 25.9 20.5 11.1 10.9 18.6
2002 5.7 8.7 13.2 18.3 23.8 26.7 29.3 27.7 25.2 21.1 12.5 8.1 18.3
2003
2004 6.8 7.9 12.9 15.9 22.9 26 28.7 27.5 24.2 21.5 14.7 5.4 17.8
2005 6.4 8.1 12.9 19.5 24.7 27.5 30.3 28.7 23.7 19.2 11.3 9.2 18.4
2006 7.8 10.4 14.0 18.5 25.7 28.1 29.7 30.4 24.5 22.9 11.9 5.5 19.1
2007 4.7 9.6 12.9 19.0 26.5 27.9 29.3 29.4 25.7 21.1 13.2 7.9 18.9
2008 4.0 7.8 15.3 20.7 25.5 28.9 29.7 30.3 27.4 20.7 13.6 6.8 19.2
2009 4.2 11.2 13.5 18.3 25.7 27.1 29.5 30.4 25.3 21.6 13.8 10.1 19.2
2010 9.9 12.1 15.8 20.0 25.4 29.8 30.6 30.8 26.8 22.2 12.2 8.4 20.3
2011 8.6 9.0 12.3 19.1 25.2 28.2 28.2 30.5 27.4 21.8 12.1 10.8 19.4
2012 5.2 7.4 11.7 19.5 25.1 29.0 31.0 26.6 25.6 22.2 15.8 10.4 19.1
2013 7.0 10.0 11.7 15.7 21.0 25.0 25.9 24.3 21.6 14.7 13.5 5.1 16.2
2014 6.4 6.7 12.3 16.8 21.8 24.5 25.9 26.4 23.3 18.6 10.1 7.9 16.7
2015 4.9 7.7 10.7 15.2 22.2 25.3 27.1 27.7 24.4 20.0 11.3 5.5 16.8
Source: Meteorological Organization and Seismology of Iraq
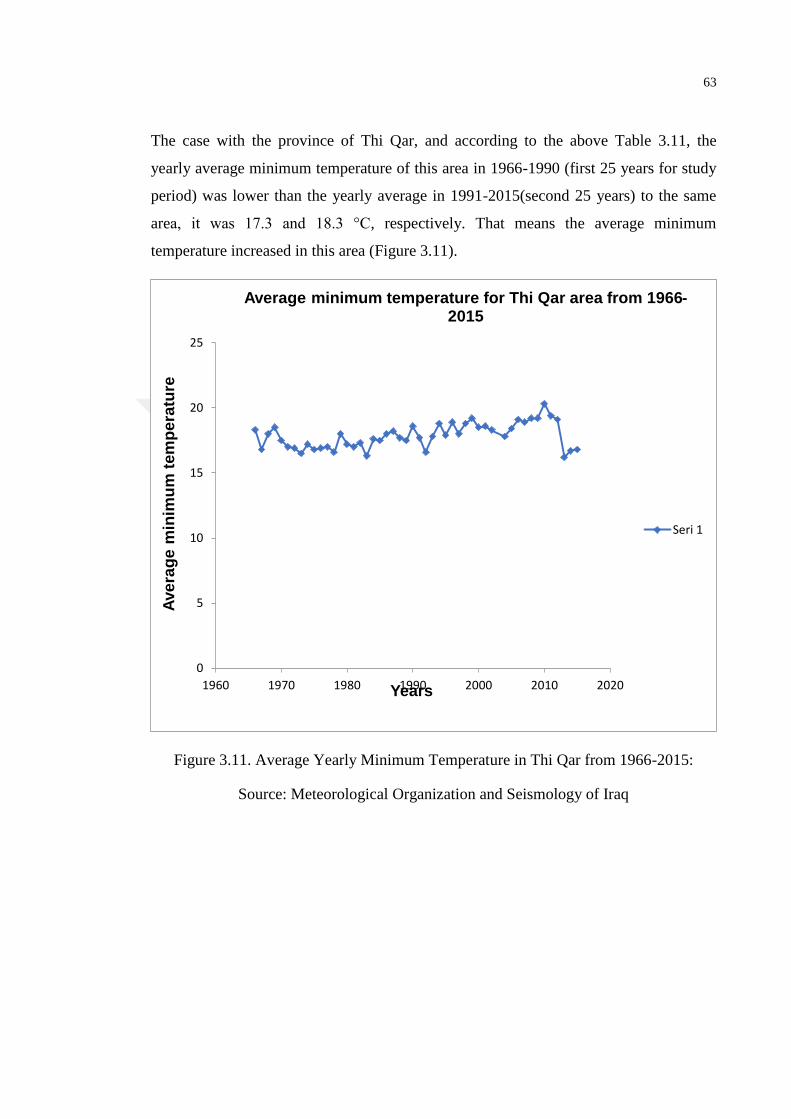
63
The case with the province of Thi Qar, and according to the above Table 3.11, the
yearly average minimum temperature of this area in 1966-1990 (first 25 years for study
period) was lower than the yearly average in 1991-2015(second 25 years) to the same
area, it was 17.3 and 18.3 °C, respectively. That means the average minimum
temperature increased in this area (Figure 3.11).
Figure 3.11. Average Yearly Minimum Temperature in Thi Qar from 1966-2015:
Source: Meteorological Organization and Seismology of Iraq
0
5
10
15
20
25
1960 1970 1980 1990 2000 2010 2020
Ave
rag
e m
inim
um
tem
pe
ratu
re
Years
Average minimum temperature for Thi Qar area from 1966- 2015
Seri 1
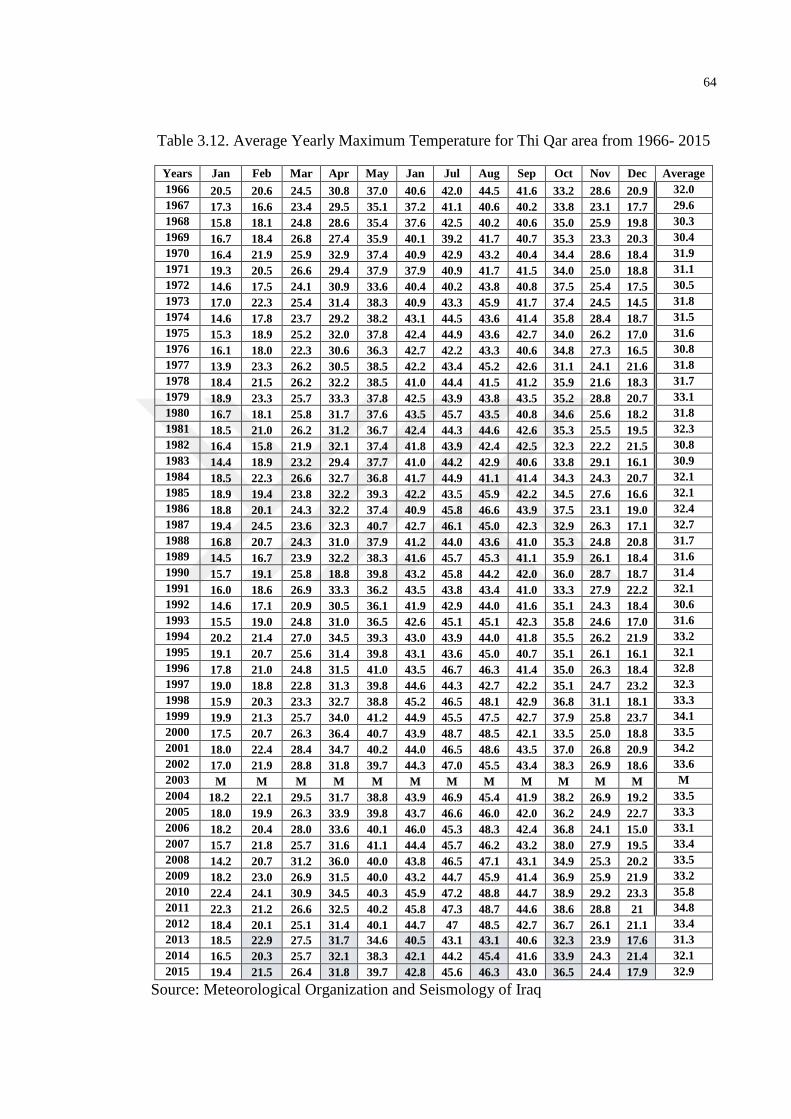
64
Table 3.12. Average Yearly Maximum Temperature for Thi Qar area from 1966- 2015
Years Jan Feb Mar Apr May Jan Jul Aug Sep Oct Nov Dec Average
1966 20.5 20.6 24.5 30.8 37.0 40.6 42.0 44.5 41.6 33.2 28.6 20.9 32.0
1967 17.3 16.6 23.4 29.5 35.1 37.2 41.1 40.6 40.2 33.8 23.1 17.7 29.6
1968 15.8 18.1 24.8 28.6 35.4 37.6 42.5 40.2 40.6 35.0 25.9 19.8 30.3
1969 16.7 18.4 26.8 27.4 35.9 40.1 39.2 41.7 40.7 35.3 23.3 20.3 30.4
1970 16.4 21.9 25.9 32.9 37.4 40.9 42.9 43.2 40.4 34.4 28.6 18.4 31.9
1971 19.3 20.5 26.6 29.4 37.9 37.9 40.9 41.7 41.5 34.0 25.0 18.8 31.1
1972 14.6 17.5 24.1 30.9 33.6 40.4 40.2 43.8 40.8 37.5 25.4 17.5 30.5
1973 17.0 22.3 25.4 31.4 38.3 40.9 43.3 45.9 41.7 37.4 24.5 14.5 31.8
1974 14.6 17.8 23.7 29.2 38.2 43.1 44.5 43.6 41.4 35.8 28.4 18.7 31.5
1975 15.3 18.9 25.2 32.0 37.8 42.4 44.9 43.6 42.7 34.0 26.2 17.0 31.6
1976 16.1 18.0 22.3 30.6 36.3 42.7 42.2 43.3 40.6 34.8 27.3 16.5 30.8
1977 13.9 23.3 26.2 30.5 38.5 42.2 43.4 45.2 42.6 31.1 24.1 21.6 31.8
1978 18.4 21.5 26.2 32.2 38.5 41.0 44.4 41.5 41.2 35.9 21.6 18.3 31.7
1979 18.9 23.3 25.7 33.3 37.8 42.5 43.9 43.8 43.5 35.2 28.8 20.7 33.1
1980 16.7 18.1 25.8 31.7 37.6 43.5 45.7 43.5 40.8 34.6 25.6 18.2 31.8
1981 18.5 21.0 26.2 31.2 36.7 42.4 44.3 44.6 42.6 35.3 25.5 19.5 32.3
1982 16.4 15.8 21.9 32.1 37.4 41.8 43.9 42.4 42.5 32.3 22.2 21.5 30.8
1983 14.4 18.9 23.2 29.4 37.7 41.0 44.2 42.9 40.6 33.8 29.1 16.1 30.9
1984 18.5 22.3 26.6 32.7 36.8 41.7 44.9 41.1 41.4 34.3 24.3 20.7 32.1
1985 18.9 19.4 23.8 32.2 39.3 42.2 43.5 45.9 42.2 34.5 27.6 16.6 32.1
1986 18.8 20.1 24.3 32.2 37.4 40.9 45.8 46.6 43.9 37.5 23.1 19.0 32.4
1987 19.4 24.5 23.6 32.3 40.7 42.7 46.1 45.0 42.3 32.9 26.3 17.1 32.7
1988 16.8 20.7 24.3 31.0 37.9 41.2 44.0 43.6 41.0 35.3 24.8 20.8 31.7
1989 14.5 16.7 23.9 32.2 38.3 41.6 45.7 45.3 41.1 35.9 26.1 18.4 31.6
1990 15.7 19.1 25.8 18.8 39.8 43.2 45.8 44.2 42.0 36.0 28.7 18.7 31.4
1991 16.0 18.6 26.9 33.3 36.2 43.5 43.8 43.4 41.0 33.3 27.9 22.2 32.1
1992 14.6 17.1 20.9 30.5 36.1 41.9 42.9 44.0 41.6 35.1 24.3 18.4 30.6
1993 15.5 19.0 24.8 31.0 36.5 42.6 45.1 45.1 42.3 35.8 24.6 17.0 31.6
1994 20.2 21.4 27.0 34.5 39.3 43.0 43.9 44.0 41.8 35.5 26.2 21.9 33.2
1995 19.1 20.7 25.6 31.4 39.8 43.1 43.6 45.0 40.7 35.1 26.1 16.1 32.1
1996 17.8 21.0 24.8 31.5 41.0 43.5 46.7 46.3 41.4 35.0 26.3 18.4 32.8
1997 19.0 18.8 22.8 31.3 39.8 44.6 44.3 42.7 42.2 35.1 24.7 23.2 32.3
1998 15.9 20.3 23.3 32.7 38.8 45.2 46.5 48.1 42.9 36.8 31.1 18.1 33.3
1999 19.9 21.3 25.7 34.0 41.2 44.9 45.5 47.5 42.7 37.9 25.8 23.7 34.1
2000 17.5 20.7 26.3 36.4 40.7 43.9 48.7 48.5 42.1 33.5 25.0 18.8 33.5
2001 18.0 22.4 28.4 34.7 40.2 44.0 46.5 48.6 43.5 37.0 26.8 20.9 34.2
2002 17.0 21.9 28.8 31.8 39.7 44.3 47.0 45.5 43.4 38.3 26.9 18.6 33.6
2003 M M M M M M M M M M M M M
2004 18.2 22.1 29.5 31.7 38.8 43.9 46.9 45.4 41.9 38.2 26.9 19.2 33.5
2005 18.0 19.9 26.3 33.9 39.8 43.7 46.6 46.0 42.0 36.2 24.9 22.7 33.3
2006 18.2 20.4 28.0 33.6 40.1 46.0 45.3 48.3 42.4 36.8 24.1 15.0 33.1
2007 15.7 21.8 25.7 31.6 41.1 44.4 45.7 46.2 43.2 38.0 27.9 19.5 33.4
2008 14.2 20.7 31.2 36.0 40.0 43.8 46.5 47.1 43.1 34.9 25.3 20.2 33.5
2009 18.2 23.0 26.9 31.5 40.0 43.2 44.7 45.9 41.4 36.9 25.9 21.9 33.2
2010 22.4 24.1 30.9 34.5 40.3 45.9 47.2 48.8 44.7 38.9 29.2 23.3 35.8
2011 22.3 21.2 26.6 32.5 40.2 45.8 47.3 48.7 44.6 38.6 28.8 21 34.8
2012 18.4 20.1 25.1 31.4 40.1 44.7 47 48.5 42.7 36.7 26.1 21.1 33.4
2013 18.5 22.9 27.5 31.7 34.6 40.5 43.1 43.1 40.6 32.3 23.9 17.6 31.3
2014 16.5 20.3 25.7 32.1 38.3 42.1 44.2 45.4 41.6 33.9 24.3 21.4 32.1
2015 19.4 21.5 26.4 31.8 39.7 42.8 45.6 46.3 43.0 36.5 24.4 17.9 32.9
Source: Meteorological Organization and Seismology of Iraq
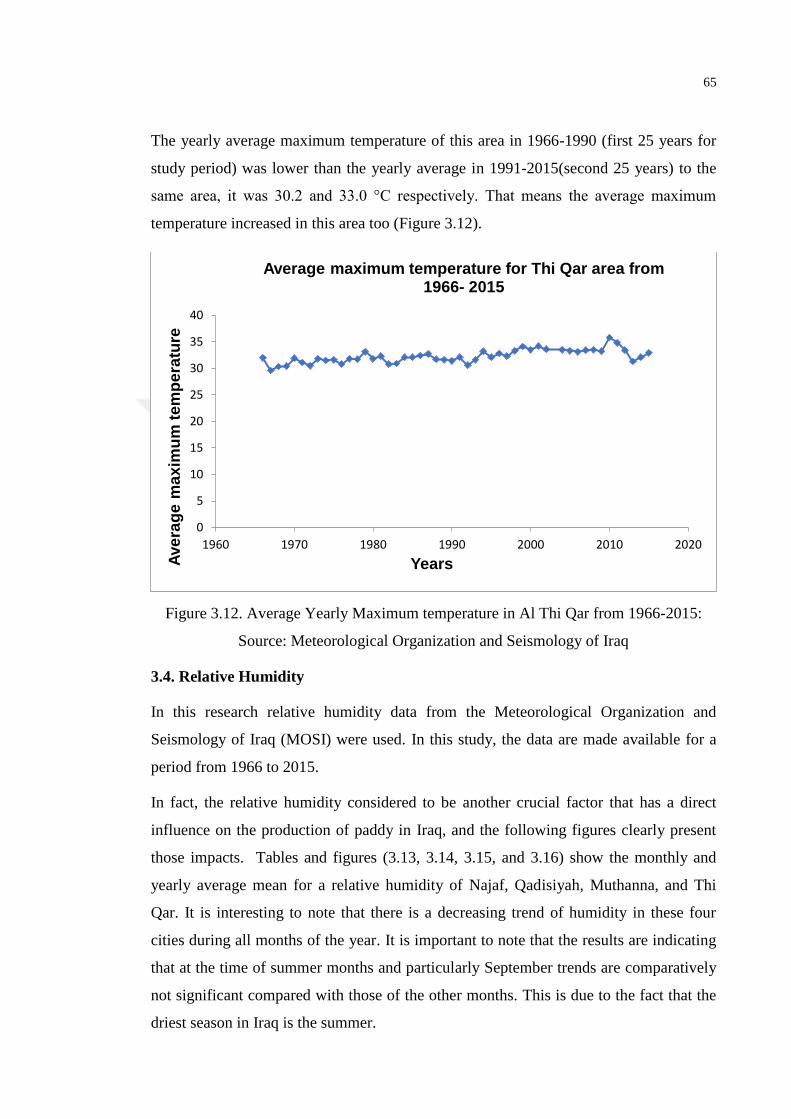
65
The yearly average maximum temperature of this area in 1966-1990 (first 25 years for
study period) was lower than the yearly average in 1991-2015(second 25 years) to the
same area, it was 30.2 and 33.0 °C respectively. That means the average maximum
temperature increased in this area too (Figure 3.12).
Figure 3.12. Average Yearly Maximum temperature in Al Thi Qar from 1966-2015:
Source: Meteorological Organization and Seismology of Iraq
3.4. Relative Humidity
In this research relative humidity data from the Meteorological Organization and
Seismology of Iraq (MOSI) were used. In this study, the data are made available for a
period from 1966 to 2015.
In fact, the relative humidity considered to be another crucial factor that has a direct
influence on the production of paddy in Iraq, and the following figures clearly present
those impacts. Tables and figures (3.13, 3.14, 3.15, and 3.16) show the monthly and
yearly average mean for a relative humidity of Najaf, Qadisiyah, Muthanna, and Thi
Qar. It is interesting to note that there is a decreasing trend of humidity in these four
cities during all months of the year. It is important to note that the results are indicating
that at the time of summer months and particularly September trends are comparatively
not significant compared with those of the other months. This is due to the fact that the
driest season in Iraq is the summer.
0
5
10
15
20
25
30
35
40
1960 1970 1980 1990 2000 2010 2020
Ave
rag
e m
ax
imu
m t
em
pe
ratu
re
Years
Average maximum temperature for Thi Qar area from 1966- 2015
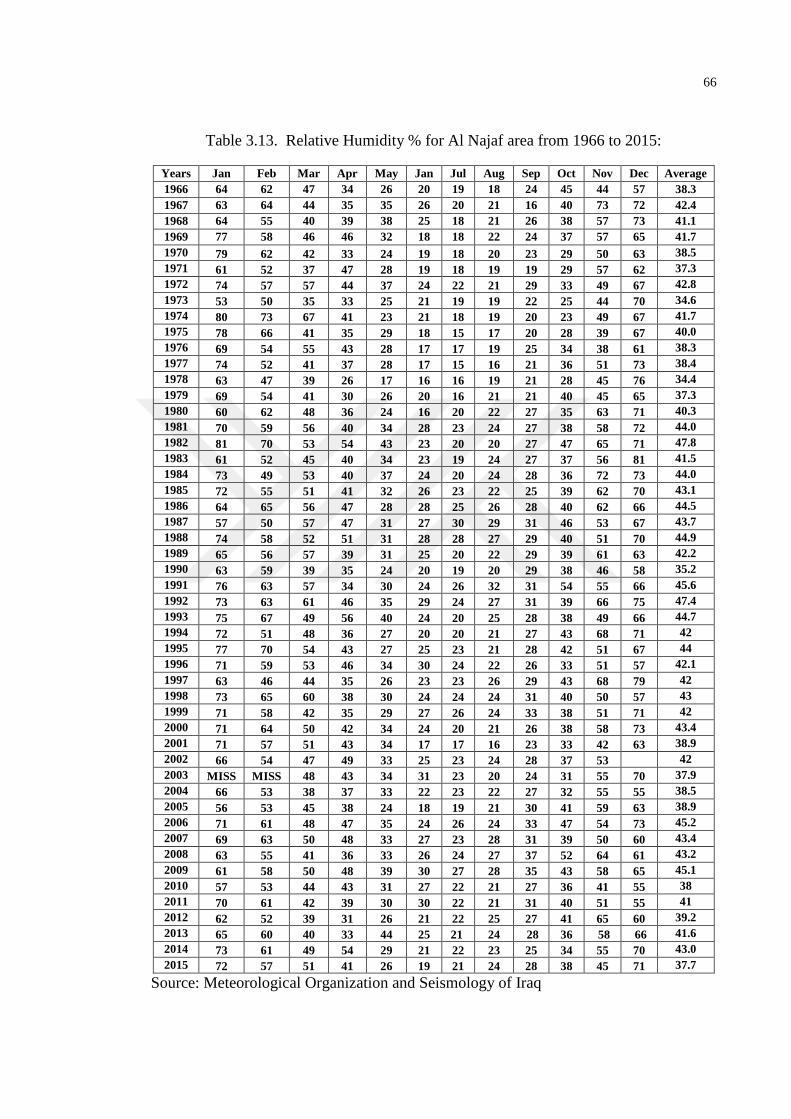
66
Table 3.13. Relative Humidity % for Al Najaf area from 1966 to 2015:
Years Jan Feb Mar Apr May Jan Jul Aug Sep Oct Nov Dec Average
1966 64 62 47 34 26 20 19 18 24 45 44 57 38.3
1967 63 64 44 35 35 26 20 21 16 40 73 72 42.4
1968 64 55 40 39 38 25 18 21 26 38 57 73 41.1
1969 77 58 46 46 32 18 18 22 24 37 57 65 41.7
1970 79 62 42 33 24 19 18 20 23 29 50 63 38.5
1971 61 52 37 47 28 19 18 19 19 29 57 62 37.3
1972 74 57 57 44 37 24 22 21 29 33 49 67 42.8
1973 53 50 35 33 25 21 19 19 22 25 44 70 34.6
1974 80 73 67 41 23 21 18 19 20 23 49 67 41.7
1975 78 66 41 35 29 18 15 17 20 28 39 67 40.0
1976 69 54 55 43 28 17 17 19 25 34 38 61 38.3
1977 74 52 41 37 28 17 15 16 21 36 51 73 38.4
1978 63 47 39 26 17 16 16 19 21 28 45 76 34.4
1979 69 54 41 30 26 20 16 21 21 40 45 65 37.3
1980 60 62 48 36 24 16 20 22 27 35 63 71 40.3
1981 70 59 56 40 34 28 23 24 27 38 58 72 44.0
1982 81 70 53 54 43 23 20 20 27 47 65 71 47.8
1983 61 52 45 40 34 23 19 24 27 37 56 81 41.5
1984 73 49 53 40 37 24 20 24 28 36 72 73 44.0
1985 72 55 51 41 32 26 23 22 25 39 62 70 43.1
1986 64 65 56 47 28 28 25 26 28 40 62 66 44.5
1987 57 50 57 47 31 27 30 29 31 46 53 67 43.7
1988 74 58 52 51 31 28 28 27 29 40 51 70 44.9
1989 65 56 57 39 31 25 20 22 29 39 61 63 42.2
1990 63 59 39 35 24 20 19 20 29 38 46 58 35.2
1991 76 63 57 34 30 24 26 32 31 54 55 66 45.6
1992 73 63 61 46 35 29 24 27 31 39 66 75 47.4
1993 75 67 49 56 40 24 20 25 28 38 49 66 44.7
1994 72 51 48 36 27 20 20 21 27 43 68 71 42
1995 77 70 54 43 27 25 23 21 28 42 51 67 44
1996 71 59 53 46 34 30 24 22 26 33 51 57 42.1
1997 63 46 44 35 26 23 23 26 29 43 68 79 42
1998 73 65 60 38 30 24 24 24 31 40 50 57 43
1999 71 58 42 35 29 27 26 24 33 38 51 71 42
2000 71 64 50 42 34 24 20 21 26 38 58 73 43.4
2001 71 57 51 43 34 17 17 16 23 33 42 63 38.9
2002 66 54 47 49 33 25 23 24 28 37 53 42
2003 MISS MISS 48 43 34 31 23 20 24 31 55 70 37.9
2004 66 53 38 37 33 22 23 22 27 32 55 55 38.5
2005 56 53 45 38 24 18 19 21 30 41 59 63 38.9
2006 71 61 48 47 35 24 26 24 33 47 54 73 45.2
2007 69 63 50 48 33 27 23 28 31 39 50 60 43.4
2008 63 55 41 36 33 26 24 27 37 52 64 61 43.2
2009 61 58 50 48 39 30 27 28 35 43 58 65 45.1
2010 57 53 44 43 31 27 22 21 27 36 41 55 38
2011 70 61 42 39 30 30 22 21 31 40 51 55 41
2012 62 52 39 31 26 21 22 25 27 41 65 60 39.2
2013 65 60 40 33 44 25 21 24 28 36 58 66 41.6
2014 73 61 49 54 29 21 22 23 25 34 55 70 43.0
2015 72 57 51 41 26 19 21 24 28 38 45 71 37.7
Source: Meteorological Organization and Seismology of Iraq
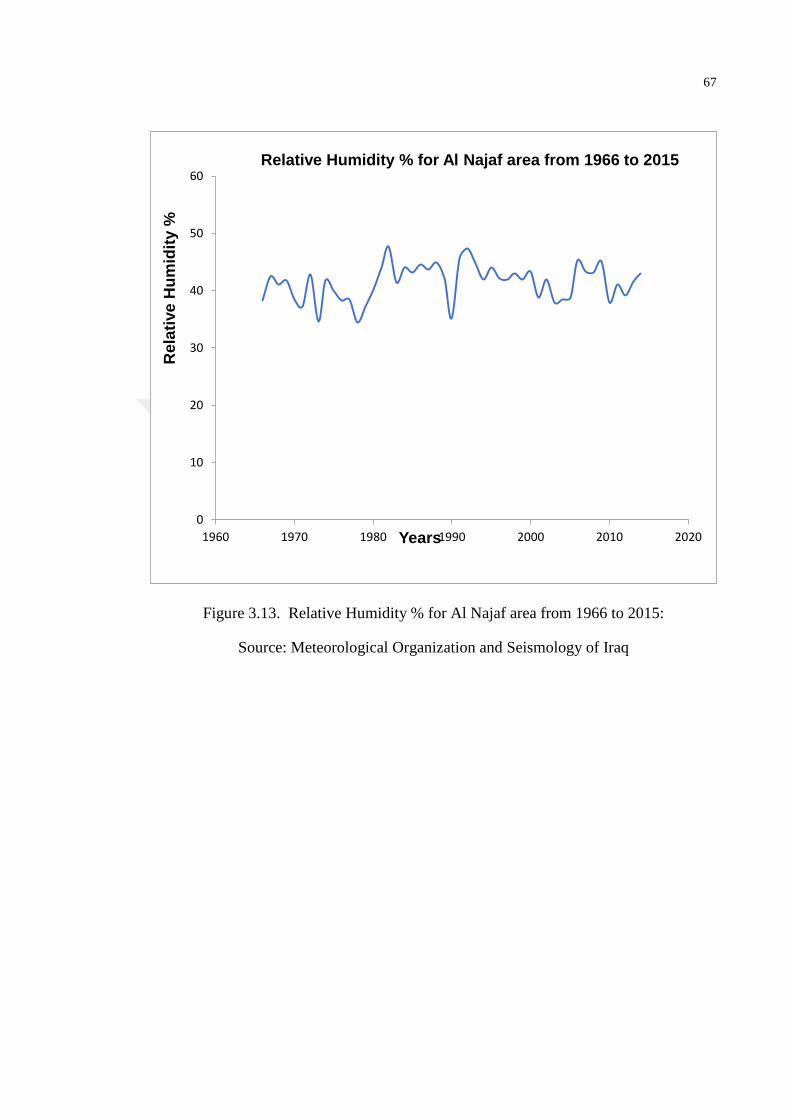
67
Figure 3.13. Relative Humidity % for Al Najaf area from 1966 to 2015:
Source: Meteorological Organization and Seismology of Iraq
0
10
20
30
40
50
60
1960 1970 1980 1990 2000 2010 2020
Rela
tive
Hu
mid
ity %
Years
Relative Humidity % for Al Najaf area from 1966 to 2015
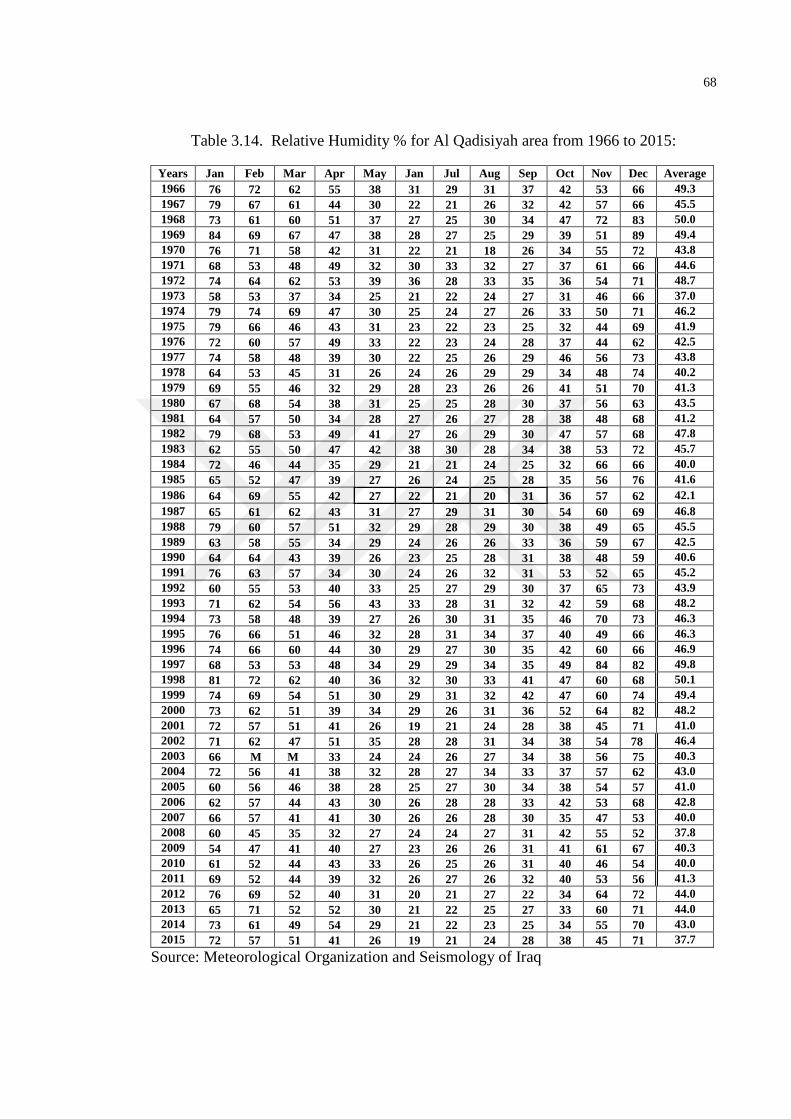
68
Table 3.14. Relative Humidity % for Al Qadisiyah area from 1966 to 2015:
Years Jan Feb Mar Apr May Jan Jul Aug Sep Oct Nov Dec Average
1966 76 72 62 55 38 31 29 31 37 42 53 66 49.3
1967 79 67 61 44 30 22 21 26 32 42 57 66 45.5
1968 73 61 60 51 37 27 25 30 34 47 72 83 50.0
1969 84 69 67 47 38 28 27 25 29 39 51 89 49.4
1970 76 71 58 42 31 22 21 18 26 34 55 72 43.8
1971 68 53 48 49 32 30 33 32 27 37 61 66 44.6
1972 74 64 62 53 39 36 28 33 35 36 54 71 48.7
1973 58 53 37 34 25 21 22 24 27 31 46 66 37.0
1974 79 74 69 47 30 25 24 27 26 33 50 71 46.2
1975 79 66 46 43 31 23 22 23 25 32 44 69 41.9
1976 72 60 57 49 33 22 23 24 28 37 44 62 42.5
1977 74 58 48 39 30 22 25 26 29 46 56 73 43.8
1978 64 53 45 31 26 24 26 29 29 34 48 74 40.2
1979 69 55 46 32 29 28 23 26 26 41 51 70 41.3
1980 67 68 54 38 31 25 25 28 30 37 56 63 43.5
1981 64 57 50 34 28 27 26 27 28 38 48 68 41.2
1982 79 68 53 49 41 27 26 29 30 47 57 68 47.8
1983 62 55 50 47 42 38 30 28 34 38 53 72 45.7
1984 72 46 44 35 29 21 21 24 25 32 66 66 40.0
1985 65 52 47 39 27 26 24 25 28 35 56 76 41.6
1986 64 69 55 42 27 22 21 20 31 36 57 62 42.1
1987 65 61 62 43 31 27 29 31 30 54 60 69 46.8
1988 79 60 57 51 32 29 28 29 30 38 49 65 45.5
1989 63 58 55 34 29 24 26 26 33 36 59 67 42.5
1990 64 64 43 39 26 23 25 28 31 38 48 59 40.6
1991 76 63 57 34 30 24 26 32 31 53 52 65 45.2
1992 60 55 53 40 33 25 27 29 30 37 65 73 43.9
1993 71 62 54 56 43 33 28 31 32 42 59 68 48.2
1994 73 58 48 39 27 26 30 31 35 46 70 73 46.3
1995 76 66 51 46 32 28 31 34 37 40 49 66 46.3
1996 74 66 60 44 30 29 27 30 35 42 60 66 46.9
1997 68 53 53 48 34 29 29 34 35 49 84 82 49.8
1998 81 72 62 40 36 32 30 33 41 47 60 68 50.1
1999 74 69 54 51 30 29 31 32 42 47 60 74 49.4
2000 73 62 51 39 34 29 26 31 36 52 64 82 48.2
2001 72 57 51 41 26 19 21 24 28 38 45 71 41.0
2002 71 62 47 51 35 28 28 31 34 38 54 78 46.4
2003 66 M M 33 24 24 26 27 34 38 56 75 40.3
2004 72 56 41 38 32 28 27 34 33 37 57 62 43.0
2005 60 56 46 38 28 25 27 30 34 38 54 57 41.0
2006 62 57 44 43 30 26 28 28 33 42 53 68 42.8
2007 66 57 41 41 30 26 26 28 30 35 47 53 40.0
2008 60 45 35 32 27 24 24 27 31 42 55 52 37.8
2009 54 47 41 40 27 23 26 26 31 41 61 67 40.3
2010 61 52 44 43 33 26 25 26 31 40 46 54 40.0
2011 69 52 44 39 32 26 27 26 32 40 53 56 41.3
2012 76 69 52 40 31 20 21 27 22 34 64 72 44.0
2013 65 71 52 52 30 21 22 25 27 33 60 71 44.0
2014 73 61 49 54 29 21 22 23 25 34 55 70 43.0
2015 72 57 51 41 26 19 21 24 28 38 45 71 37.7
Source: Meteorological Organization and Seismology of Iraq
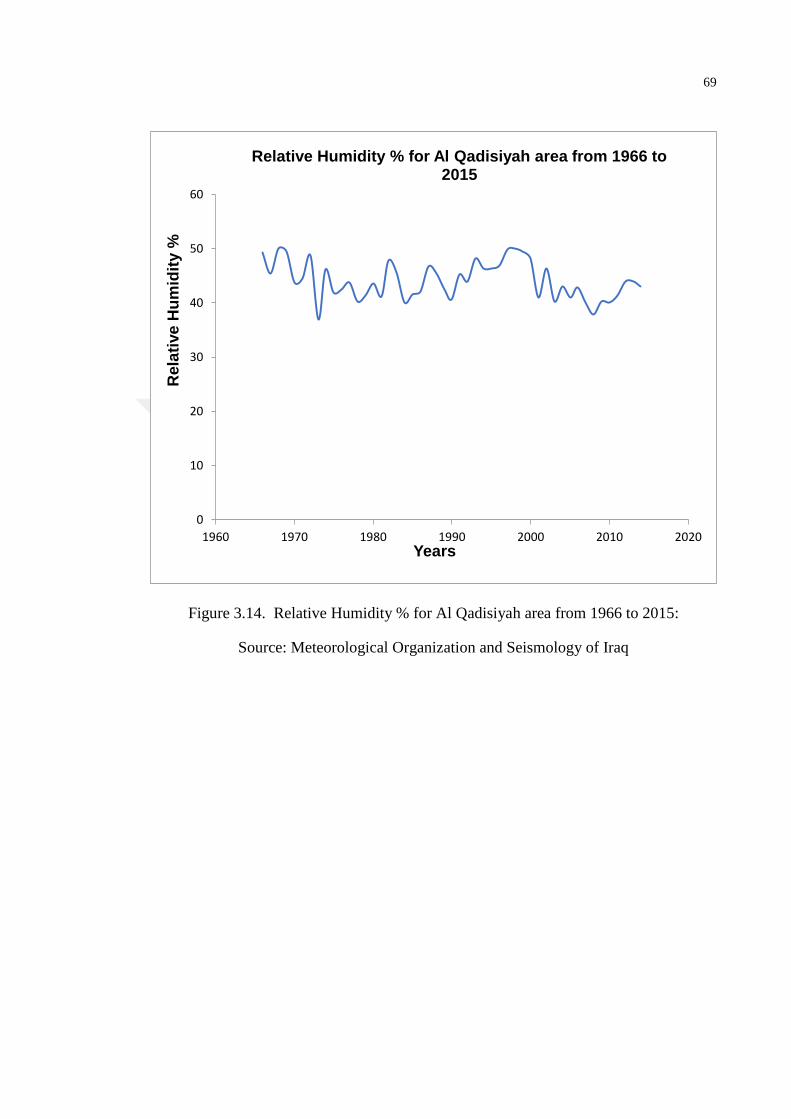
69
Figure 3.14. Relative Humidity % for Al Qadisiyah area from 1966 to 2015:
Source: Meteorological Organization and Seismology of Iraq
0
10
20
30
40
50
60
1960 1970 1980 1990 2000 2010 2020
Rela
tive
Hu
mid
ity %
Years
Relative Humidity % for Al Qadisiyah area from 1966 to 2015
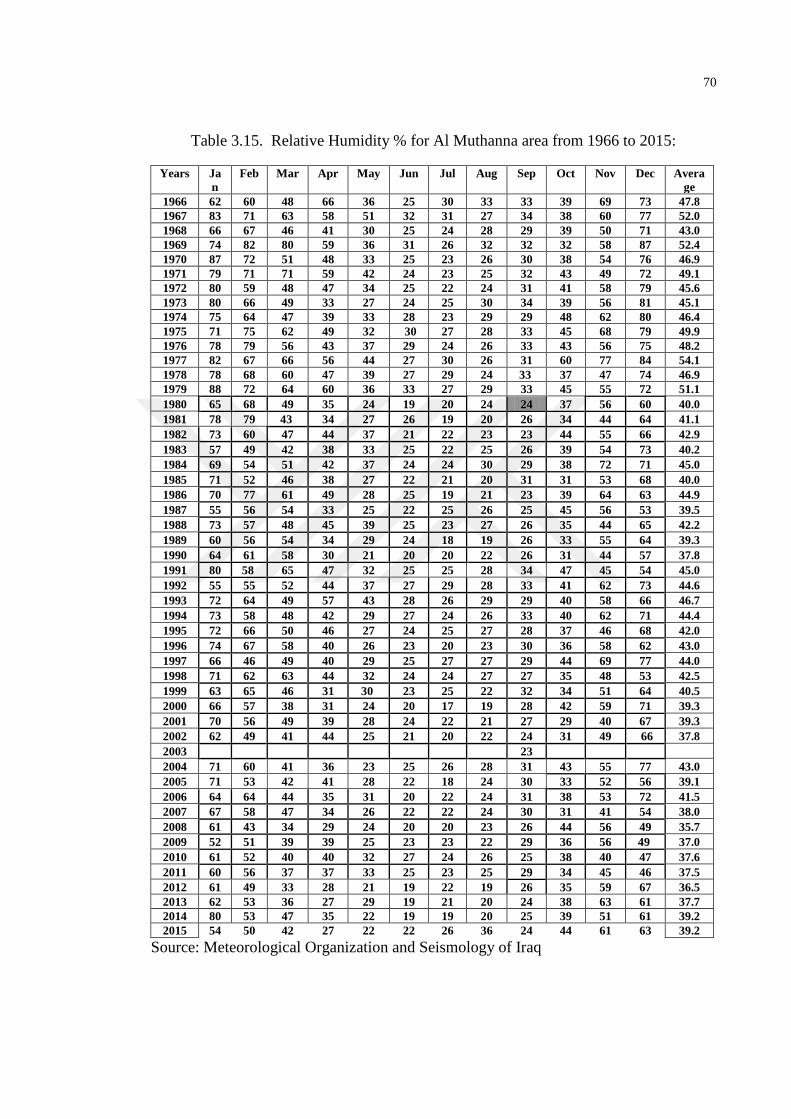
70
Table 3.15. Relative Humidity % for Al Muthanna area from 1966 to 2015:
Years Ja
n
Feb Mar Apr May Jun Jul Aug Sep Oct Nov Dec Avera
ge
1966 62 60 48 66 36 25 30 33 33 39 69 73 47.8
1967 83 71 63 58 51 32 31 27 34 38 60 77 52.0
1968 66 67 46 41 30 25 24 28 29 39 50 71 43.0
1969 74 82 80 59 36 31 26 32 32 32 58 87 52.4
1970 87 72 51 48 33 25 23 26 30 38 54 76 46.9
1971 79 71 71 59 42 24 23 25 32 43 49 72 49.1
1972 80 59 48 47 34 25 22 24 31 41 58 79 45.6
1973 80 66 49 33 27 24 25 30 34 39 56 81 45.1
1974 75 64 47 39 33 28 23 29 29 48 62 80 46.4
1975 71 75 62 49 32 30 27 28 33 45 68 79 49.9
1976 78 79 56 43 37 29 24 26 33 43 56 75 48.2
1977 82 67 66 56 44 27 30 26 31 60 77 84 54.1
1978 78 68 60 47 39 27 29 24 33 37 47 74 46.9
1979 88 72 64 60 36 33 27 29 33 45 55 72 51.1
1980 65 68 49 35 24 19 20 24 24 37 56 60 40.0
1981 78 79 43 34 27 26 19 20 26 34 44 64 41.1
1982 73 60 47 44 37 21 22 23 23 44 55 66 42.9
1983 57 49 42 38 33 25 22 25 26 39 54 73 40.2
1984 69 54 51 42 37 24 24 30 29 38 72 71 45.0
1985 71 52 46 38 27 22 21 20 31 31 53 68 40.0
1986 70 77 61 49 28 25 19 21 23 39 64 63 44.9
1987 55 56 54 33 25 22 25 26 25 45 56 53 39.5
1988 73 57 48 45 39 25 23 27 26 35 44 65 42.2
1989 60 56 54 34 29 24 18 19 26 33 55 64 39.3
1990 64 61 58 30 21 20 20 22 26 31 44 57 37.8
1991 80 58 65 47 32 25 25 28 34 47 45 54 45.0
1992 55 55 52 44 37 27 29 28 33 41 62 73 44.6
1993 72 64 49 57 43 28 26 29 29 40 58 66 46.7
1994 73 58 48 42 29 27 24 26 33 40 62 71 44.4
1995 72 66 50 46 27 24 25 27 28 37 46 68 42.0
1996 74 67 58 40 26 23 20 23 30 36 58 62 43.0
1997 66 46 49 40 29 25 27 27 29 44 69 77 44.0
1998 71 62 63 44 32 24 24 27 27 35 48 53 42.5
1999 63 65 46 31 30 23 25 22 32 34 51 64 40.5
2000 66 57 38 31 24 20 17 19 28 42 59 71 39.3
2001 70 56 49 39 28 24 22 21 27 29 40 67 39.3
2002 62 49 41 44 25 21 20 22 24 31 49 66 37.8
2003 23
2004 71 60 41 36 23 25 26 28 31 43 55 77 43.0
2005 71 53 42 41 28 22 18 24 30 33 52 56 39.1
2006 64 64 44 35 31 20 22 24 31 38 53 72 41.5
2007 67 58 47 34 26 22 22 24 30 31 41 54 38.0
2008 61 43 34 29 24 20 20 23 26 44 56 49 35.7
2009 52 51 39 39 25 23 23 22 29 36 56 49 37.0
2010 61 52 40 40 32 27 24 26 25 38 40 47 37.6
2011 60 56 37 37 33 25 23 25 29 34 45 46 37.5
2012 61 49 33 28 21 19 22 19 26 35 59 67 36.5
2013 62 53 36 27 29 19 21 20 24 38 63 61 37.7
2014 80 53 47 35 22 19 19 20 25 39 51 61 39.2
2015 54 50 42 27 22 22 26 36 24 44 61 63 39.2
Source: Meteorological Organization and Seismology of Iraq
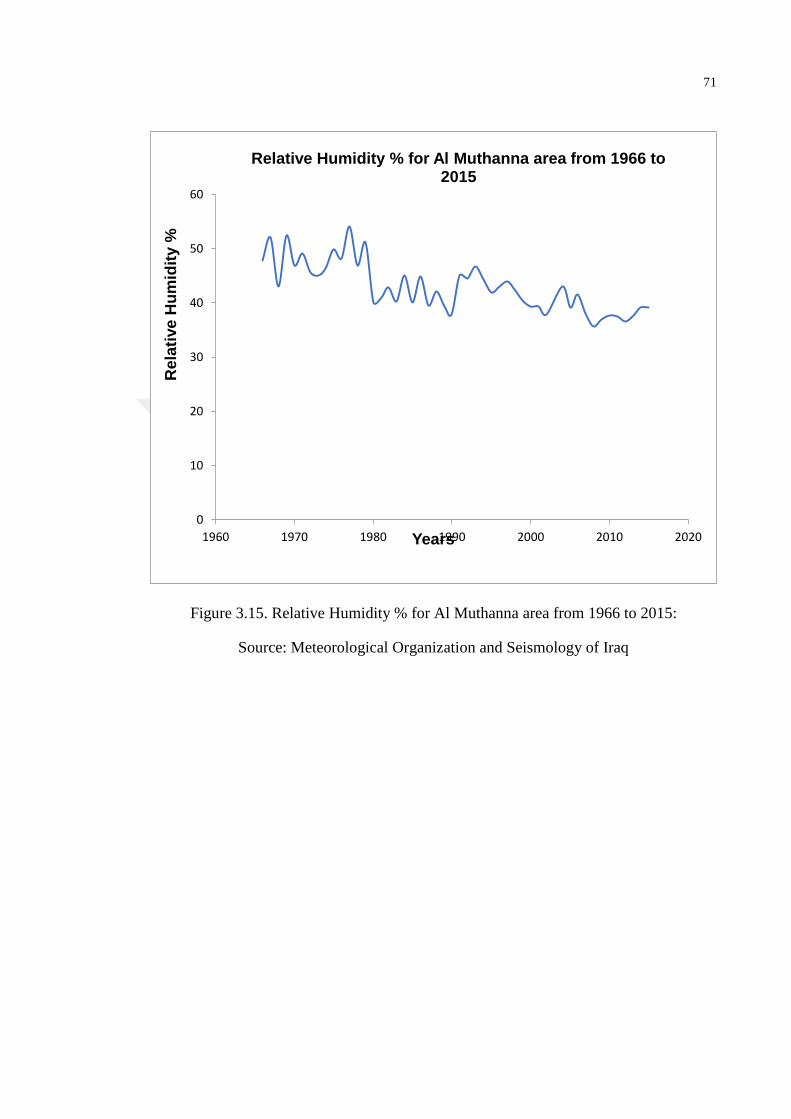
71
Figure 3.15. Relative Humidity % for Al Muthanna area from 1966 to 2015:
Source: Meteorological Organization and Seismology of Iraq
0
10
20
30
40
50
60
1960 1970 1980 1990 2000 2010 2020
Rela
tive
Hu
mid
ity %
Years
Relative Humidity % for Al Muthanna area from 1966 to 2015
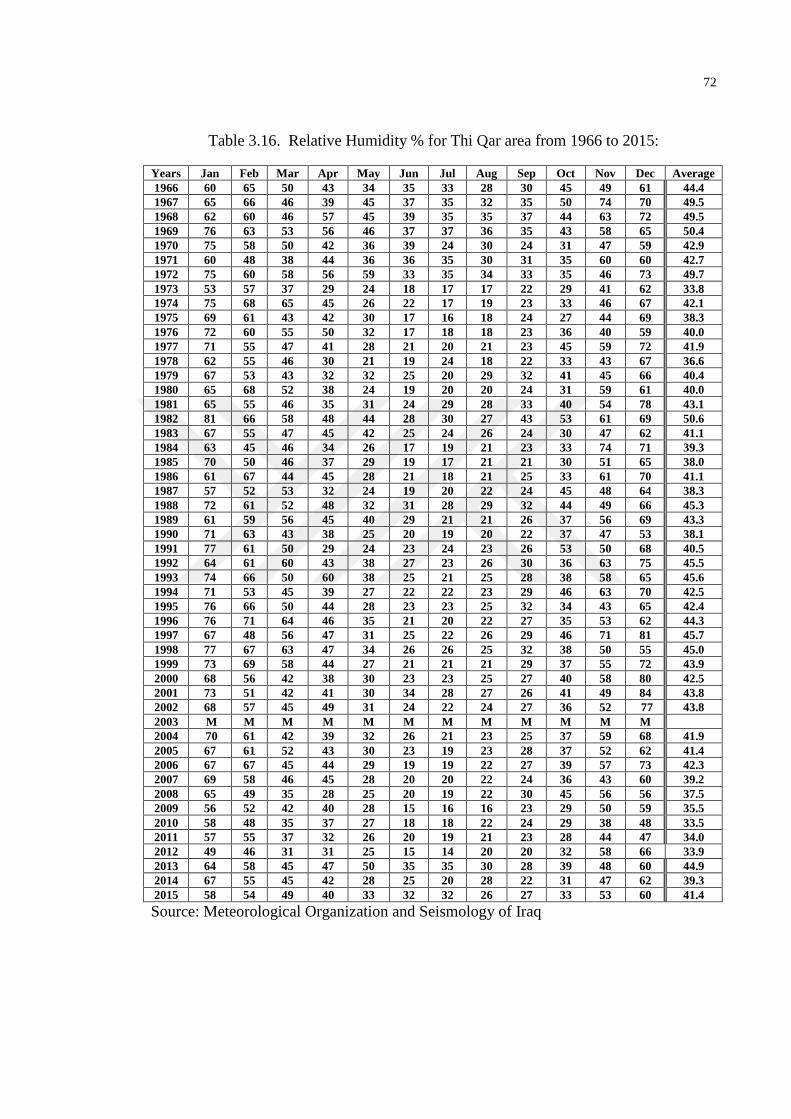
72
Table 3.16. Relative Humidity % for Thi Qar area from 1966 to 2015:
Years Jan Feb Mar Apr May Jun Jul Aug Sep Oct Nov Dec Average
1966 60 65 50 43 34 35 33 28 30 45 49 61 44.4
1967 65 66 46 39 45 37 35 32 35 50 74 70 49.5
1968 62 60 46 57 45 39 35 35 37 44 63 72 49.5
1969 76 63 53 56 46 37 37 36 35 43 58 65 50.4
1970 75 58 50 42 36 39 24 30 24 31 47 59 42.9
1971 60 48 38 44 36 36 35 30 31 35 60 60 42.7
1972 75 60 58 56 59 33 35 34 33 35 46 73 49.7
1973 53 57 37 29 24 18 17 17 22 29 41 62 33.8
1974 75 68 65 45 26 22 17 19 23 33 46 67 42.1
1975 69 61 43 42 30 17 16 18 24 27 44 69 38.3
1976 72 60 55 50 32 17 18 18 23 36 40 59 40.0
1977 71 55 47 41 28 21 20 21 23 45 59 72 41.9
1978 62 55 46 30 21 19 24 18 22 33 43 67 36.6
1979 67 53 43 32 32 25 20 29 32 41 45 66 40.4
1980 65 68 52 38 24 19 20 20 24 31 59 61 40.0
1981 65 55 46 35 31 24 29 28 33 40 54 78 43.1
1982 81 66 58 48 44 28 30 27 43 53 61 69 50.6
1983 67 55 47 45 42 25 24 26 24 30 47 62 41.1
1984 63 45 46 34 26 17 19 21 23 33 74 71 39.3
1985 70 50 46 37 29 19 17 21 21 30 51 65 38.0
1986 61 67 44 45 28 21 18 21 25 33 61 70 41.1
1987 57 52 53 32 24 19 20 22 24 45 48 64 38.3
1988 72 61 52 48 32 31 28 29 32 44 49 66 45.3
1989 61 59 56 45 40 29 21 21 26 37 56 69 43.3
1990 71 63 43 38 25 20 19 20 22 37 47 53 38.1
1991 77 61 50 29 24 23 24 23 26 53 50 68 40.5
1992 64 61 60 43 38 27 23 26 30 36 63 75 45.5
1993 74 66 50 60 38 25 21 25 28 38 58 65 45.6
1994 71 53 45 39 27 22 22 23 29 46 63 70 42.5
1995 76 66 50 44 28 23 23 25 32 34 43 65 42.4
1996 76 71 64 46 35 21 20 22 27 35 53 62 44.3
1997 67 48 56 47 31 25 22 26 29 46 71 81 45.7
1998 77 67 63 47 34 26 26 25 32 38 50 55 45.0
1999 73 69 58 44 27 21 21 21 29 37 55 72 43.9
2000 68 56 42 38 30 23 23 25 27 40 58 80 42.5
2001 73 51 42 41 30 34 28 27 26 41 49 84 43.8
2002 68 57 45 49 31 24 22 24 27 36 52 77 43.8
2003 M M M M M M M M M M M M
2004 70 61 42 39 32 26 21 23 25 37 59 68 41.9
2005 67 61 52 43 30 23 19 23 28 37 52 62 41.4
2006 67 67 45 44 29 19 19 22 27 39 57 73 42.3
2007 69 58 46 45 28 20 20 22 24 36 43 60 39.2
2008 65 49 35 28 25 20 19 22 30 45 56 56 37.5
2009 56 52 42 40 28 15 16 16 23 29 50 59 35.5
2010 58 48 35 37 27 18 18 22 24 29 38 48 33.5
2011 57 55 37 32 26 20 19 21 23 28 44 47 34.0
2012 49 46 31 31 25 15 14 20 20 32 58 66 33.9
2013 64 58 45 47 50 35 35 30 28 39 48 60 44.9
2014 67 55 45 42 28 25 20 28 22 31 47 62 39.3
2015 58 54 49 40 33 32 32 26 27 33 53 60 41.4
Source: Meteorological Organization and Seismology of Iraq

73
Figure 3.16. Relative Humidity % for Thi Qar area from 1966 to 2015.
Source: Meteorological Organization and Seismology of Iraq
According to the tables and figures above, the annual relative humidity fluctuates
around 37 - 47% for the Najaf city and around 37 - 50% for Al Qadisiyah city, and
around 35 - 54% for Al Muthanna and around 33 - 50% in Thi Qar in the south of Iraq
(Tables 3.13, 3.14, 3.15, and 3.16).
On the other hand, if we look at the previous humidity figures accurately (Figures 3.13,
3.14, 3.15 and 3.16) we can see a clear decrease in the average annual relative humidity
from 1966 to 2015, with elevated temperature in the same period and the same areas.
For all these indicators, rice production is expected to decrease due to an average
temperature increase of 32 ° C, all studies indicate the ideal temperature of pollen
maturity stage for rice flowers were between 28 and 32 °C.
In addition, some of the studies refer that the rise in temperature will have significant
effects on the production of rice. The yield of rice will be decreased with the increase of
temperature. The impact of the rise of temperature will be in both the irrigated and rain
fed paddy fields. The production of rice will be decreased nationally at a level of
approximately 11% in the irrigated field while approximately 14.4% production loss in
the rain fed field for each 1°C increase of temperature [56].
0
10
20
30
40
50
60
1960 1970 1980 1990 2000 2010 2020
Rela
tive
Hu
mid
ity %
Years
Relative Humidity % for Thi Qar area from 1966 to 2015
74
3.5. Production of Paddy in Different Agronomic and Climate Scenarios for the
Study Area
Coping or adaptation strategies, constraints to the production of rice as well as the
agronomic practices of farmers in the area of the study were evaluated using both
qualitative and quantitative methods. The primary data were collected from a total of
223 farmers using face to face interviews in the household. By contracting with the
village head or agricultural office, we first generated a respondent list and from the list
using a random systematic sampling method we selected the respondents in the four
district areas. To obtain maximum information from the respondent, a questionnaire was
tested and developed for the household survey.
In terms of productivity and planting area, rice is the second largest crop cultivated in
Iraq. The growing area of rice is not stable in Iraq. Based on the water availability the
production area of rice is changing because water is the limiting factor in the cultivation
of rice. In the following Tables presented due to change in the water availability how
the rice production areas have oscillated in the recent year.
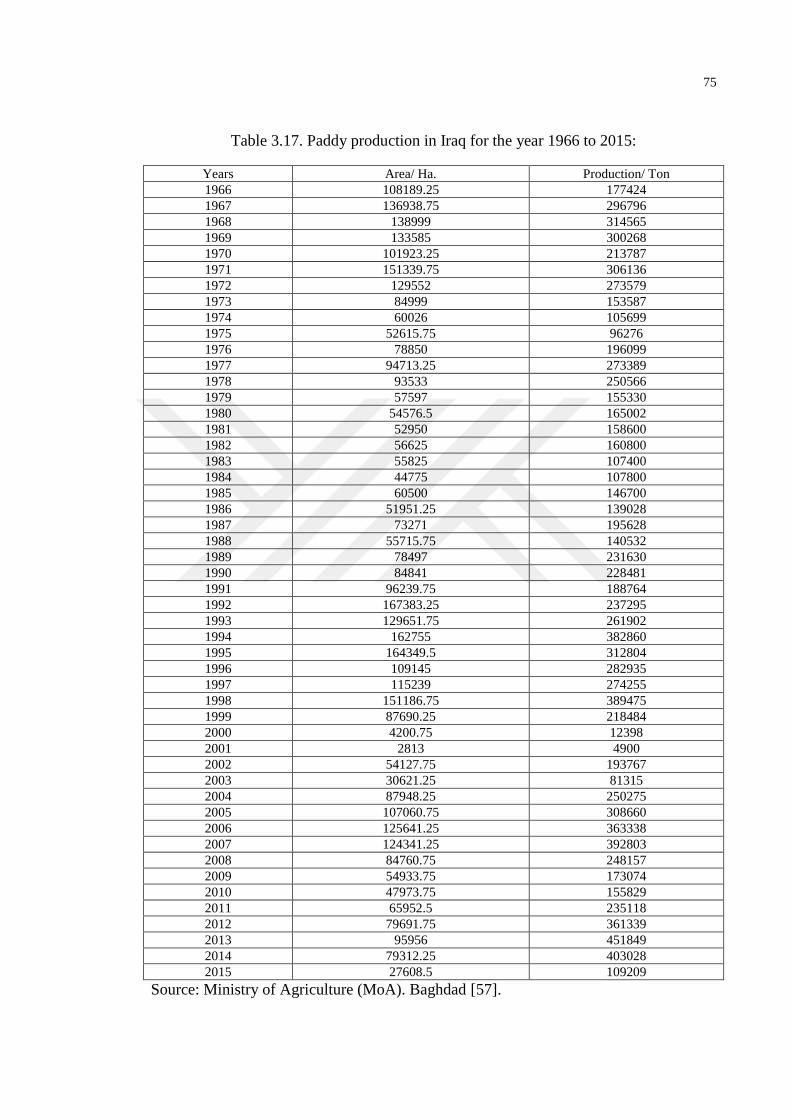
75
Table 3.17. Paddy production in Iraq for the year 1966 to 2015:
Years Area/ Ha. Production/ Ton
1966 108189.25 177424
1967 136938.75 296796
1968 138999 314565
1969 133585 300268
1970 101923.25 213787
1971 151339.75 306136
1972 129552 273579
1973 84999 153587
1974 60026 105699
1975 52615.75 96276
1976 78850 196099
1977 94713.25 273389
1978 93533 250566
1979 57597 155330
1980 54576.5 165002
1981 52950 158600
1982 56625 160800
1983 55825 107400
1984 44775 107800
1985 60500 146700
1986 51951.25 139028
1987 73271 195628
1988 55715.75 140532
1989 78497 231630
1990 84841 228481
1991 96239.75 188764
1992 167383.25 237295
1993 129651.75 261902
1994 162755 382860
1995 164349.5 312804
1996 109145 282935
1997 115239 274255
1998 151186.75 389475
1999 87690.25 218484
2000 4200.75 12398
2001 2813 4900
2002 54127.75 193767
2003 30621.25 81315
2004 87948.25 250275
2005 107060.75 308660
2006 125641.25 363338
2007 124341.25 392803
2008 84760.75 248157
2009 54933.75 173074
2010 47973.75 155829
2011 65952.5 235118
2012 79691.75 361339
2013 95956 451849
2014 79312.25 403028
2015 27608.5 109209
Source: Ministry of Agriculture (MoA). Baghdad [57].
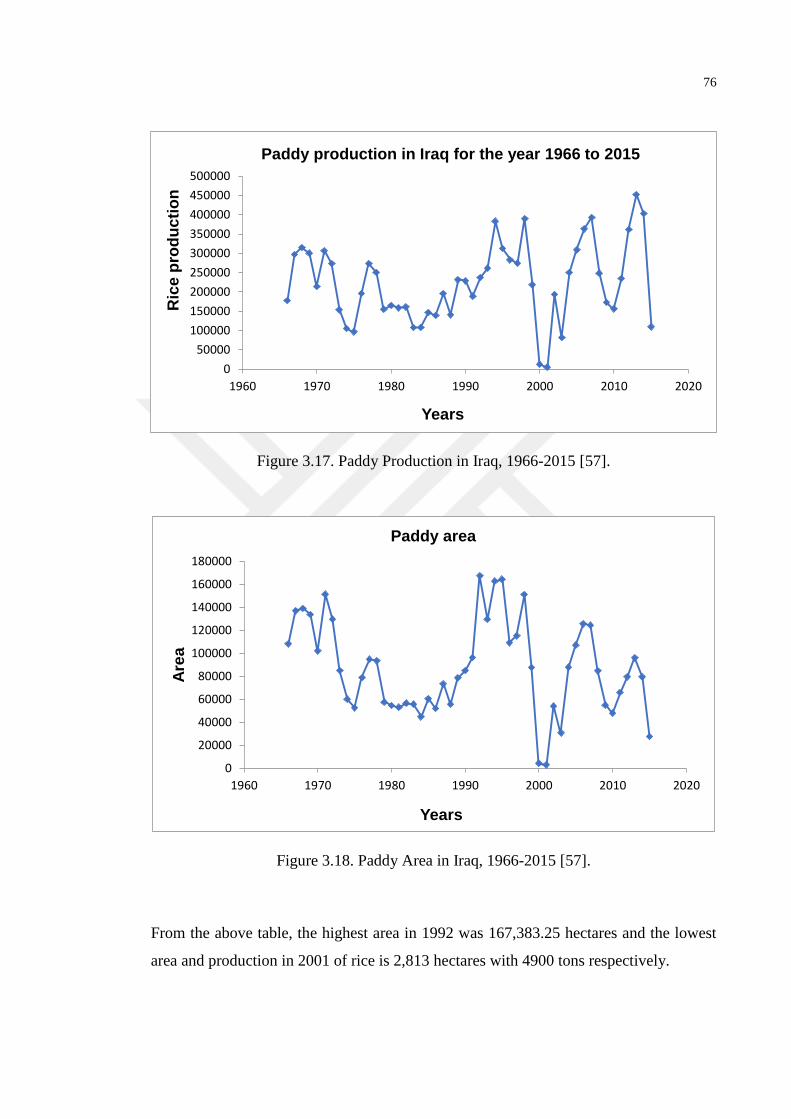
76
Figure 3.17. Paddy Production in Iraq, 1966-2015 [57].
Figure 3.18. Paddy Area in Iraq, 1966-2015 [57].
From the above table, the highest area in 1992 was 167,383.25 hectares and the lowest
area and production in 2001 of rice is 2,813 hectares with 4900 tons respectively.
0
50000
100000
150000
200000
250000
300000
350000
400000
450000
500000
1960 1970 1980 1990 2000 2010 2020
Ric
e p
rod
uc
tio
n
Years
Paddy production in Iraq for the year 1966 to 2015
0
20000
40000
60000
80000
100000
120000
140000
160000
180000
1960 1970 1980 1990 2000 2010 2020
Are
a
Years
Paddy area
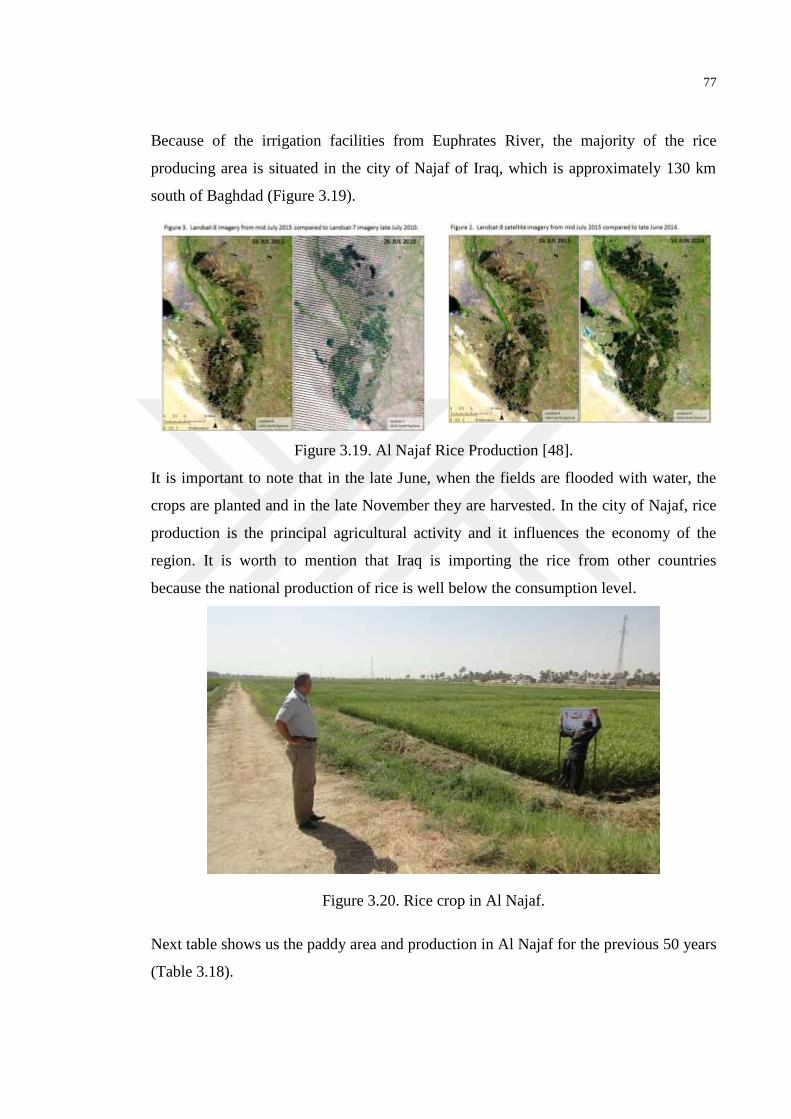
77
Because of the irrigation facilities from Euphrates River, the majority of the rice
producing area is situated in the city of Najaf of Iraq, which is approximately 130 km
south of Baghdad (Figure 3.19).
Figure 3.19. Al Najaf Rice Production [48].
It is important to note that in the late June, when the fields are flooded with water, the
crops are planted and in the late November they are harvested. In the city of Najaf, rice
production is the principal agricultural activity and it influences the economy of the
region. It is worth to mention that Iraq is importing the rice from other countries
because the national production of rice is well below the consumption level.
Figure 3.20. Rice crop in Al Najaf.
Next table shows us the paddy area and production in Al Najaf for the previous 50 years
(Table 3.18).
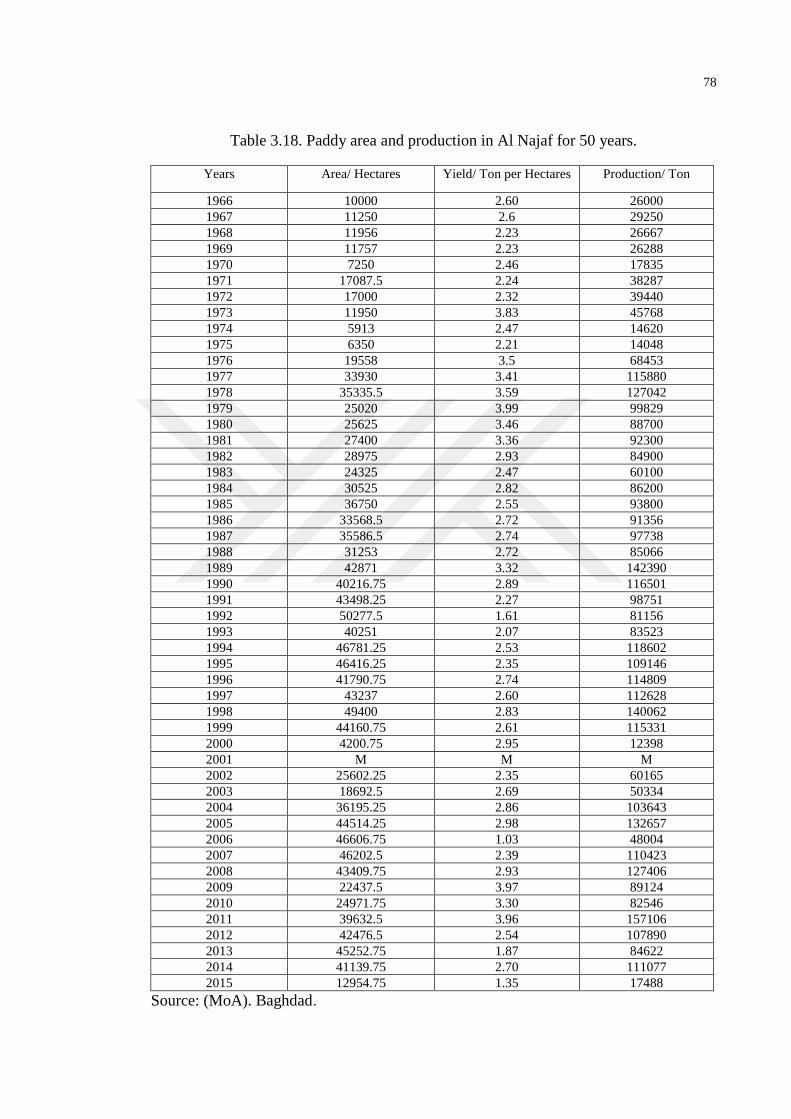
78
Table 3.18. Paddy area and production in Al Najaf for 50 years.
Years Area/ Hectares Yield/ Ton per Hectares Production/ Ton
1966 10000 2.60 26000
1967 11250 2.6 29250
1968 11956 2.23 26667
1969 11757 2.23 26288
1970 7250 2.46 17835
1971 17087.5 2.24 38287
1972 17000 2.32 39440
1973 11950 3.83 45768
1974 5913 2.47 14620
1975 6350 2.21 14048
1976 19558 3.5 68453
1977 33930 3.41 115880
1978 35335.5 3.59 127042
1979 25020 3.99 99829
1980 25625 3.46 88700
1981 27400 3.36 92300
1982 28975 2.93 84900
1983 24325 2.47 60100
1984 30525 2.82 86200
1985 36750 2.55 93800
1986 33568.5 2.72 91356
1987 35586.5 2.74 97738
1988 31253 2.72 85066
1989 42871 3.32 142390
1990 40216.75 2.89 116501
1991 43498.25 2.27 98751
1992 50277.5 1.61 81156
1993 40251 2.07 83523
1994 46781.25 2.53 118602
1995 46416.25 2.35 109146
1996 41790.75 2.74 114809
1997 43237 2.60 112628
1998 49400 2.83 140062
1999 44160.75 2.61 115331
2000 4200.75 2.95 12398
2001 M M M
2002 25602.25 2.35 60165
2003 18692.5 2.69 50334
2004 36195.25 2.86 103643
2005 44514.25 2.98 132657
2006 46606.75 1.03 48004
2007 46202.5 2.39 110423
2008 43409.75 2.93 127406
2009 22437.5 3.97 89124
2010 24971.75 3.30 82546
2011 39632.5 3.96 157106
2012 42476.5 2.54 107890
2013 45252.75 1.87 84622
2014 41139.75 2.70 111077
2015 12954.75 1.35 17488
Source: (MoA). Baghdad.
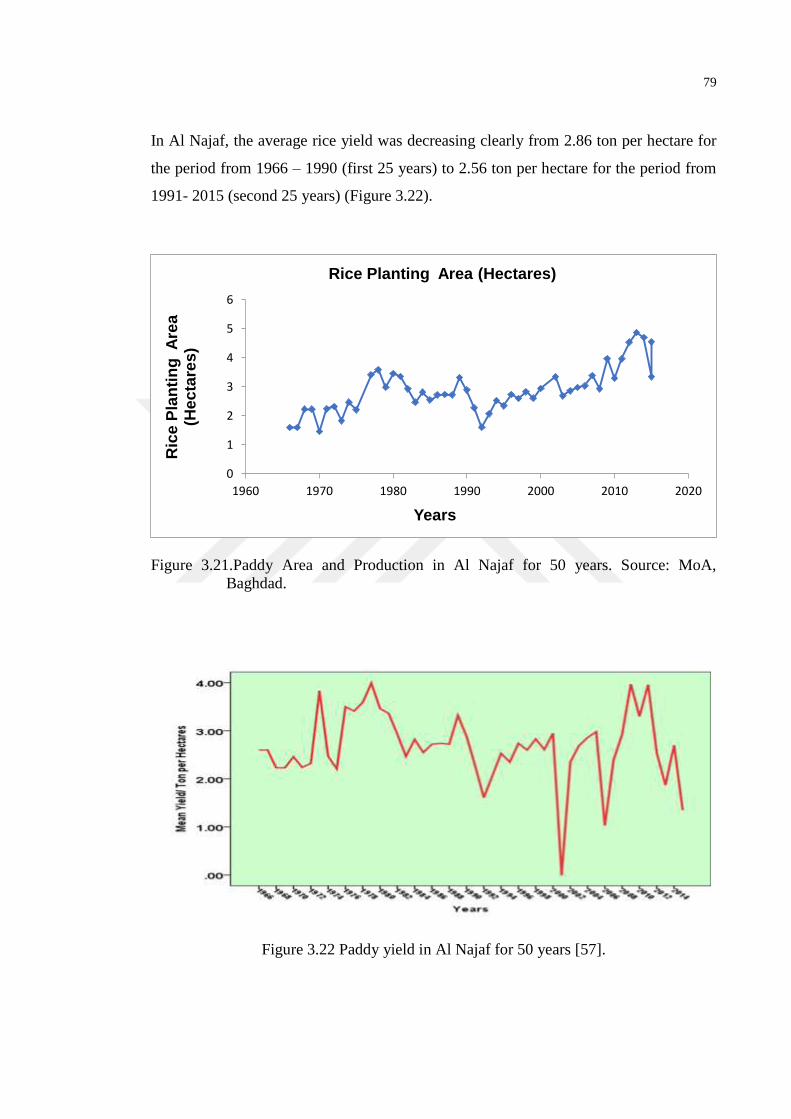
79
In Al Najaf, the average rice yield was decreasing clearly from 2.86 ton per hectare for
the period from 1966 – 1990 (first 25 years) to 2.56 ton per hectare for the period from
1991- 2015 (second 25 years) (Figure 3.22).
Figure 3.21.Paddy Area and Production in Al Najaf for 50 years. Source: MoA,
Baghdad.
Figure 3.22 Paddy yield in Al Najaf for 50 years [57].
0
1
2
3
4
5
6
1960 1970 1980 1990 2000 2010 2020
Ric
e P
lan
tin
g A
rea
(H
ec
tare
s)
Years
Rice Planting Area (Hectares)
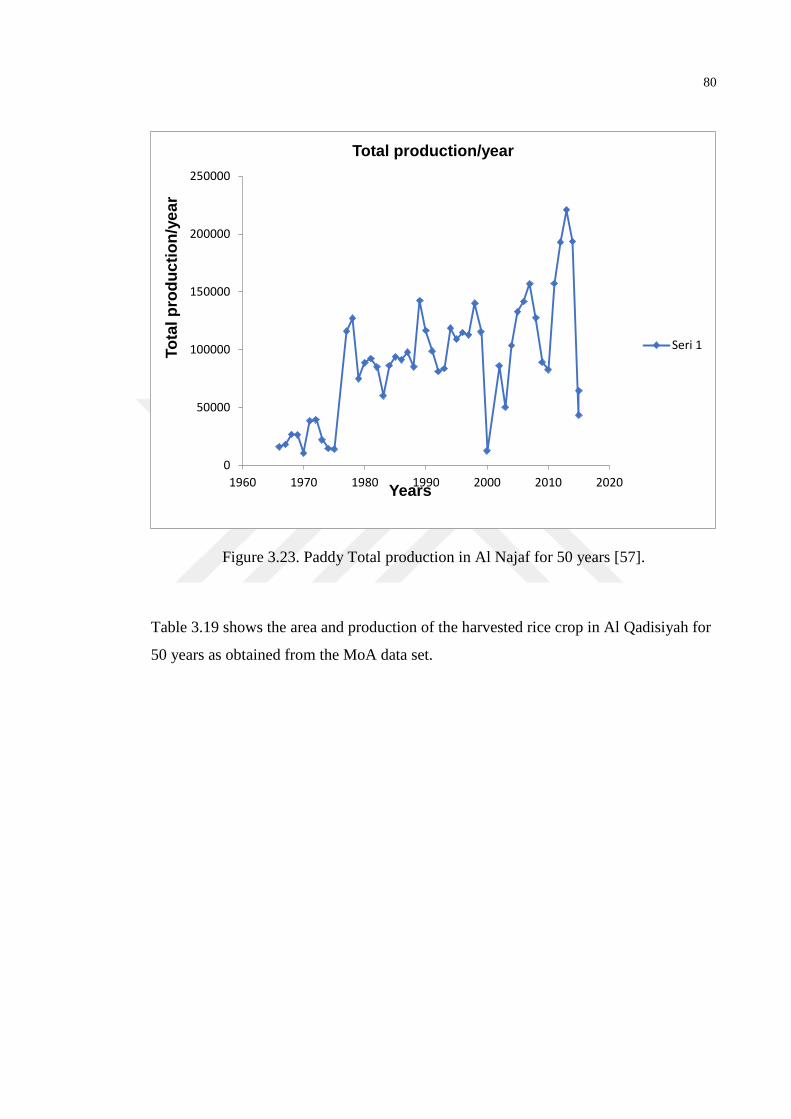
80
Figure 3.23. Paddy Total production in Al Najaf for 50 years [57].
Table 3.19 shows the area and production of the harvested rice crop in Al Qadisiyah for
50 years as obtained from the MoA data set.
0
50000
100000
150000
200000
250000
1960 1970 1980 1990 2000 2010 2020
To
tal p
rod
uc
tio
n/y
ea
r
Years
Total production/year
Seri 1
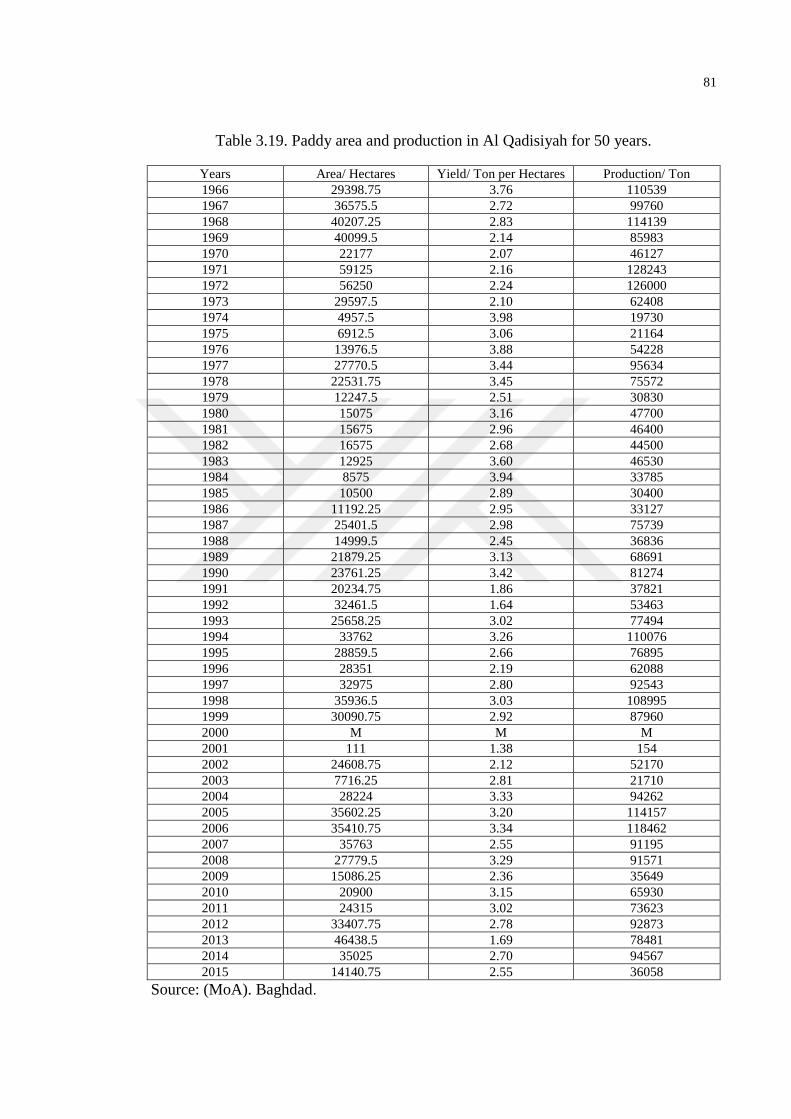
81
Table 3.19. Paddy area and production in Al Qadisiyah for 50 years.
Years Area/ Hectares Yield/ Ton per Hectares Production/ Ton
1966 29398.75 3.76 110539
1967 36575.5 2.72 99760
1968 40207.25 2.83 114139
1969 40099.5 2.14 85983
1970 22177 2.07 46127
1971 59125 2.16 128243
1972 56250 2.24 126000
1973 29597.5 2.10 62408
1974 4957.5 3.98 19730
1975 6912.5 3.06 21164
1976 13976.5 3.88 54228
1977 27770.5 3.44 95634
1978 22531.75 3.45 75572
1979 12247.5 2.51 30830
1980 15075 3.16 47700
1981 15675 2.96 46400
1982 16575 2.68 44500
1983 12925 3.60 46530
1984 8575 3.94 33785
1985 10500 2.89 30400
1986 11192.25 2.95 33127
1987 25401.5 2.98 75739
1988 14999.5 2.45 36836
1989 21879.25 3.13 68691
1990 23761.25 3.42 81274
1991 20234.75 1.86 37821
1992 32461.5 1.64 53463
1993 25658.25 3.02 77494
1994 33762 3.26 110076
1995 28859.5 2.66 76895
1996 28351 2.19 62088
1997 32975 2.80 92543
1998 35936.5 3.03 108995
1999 30090.75 2.92 87960
2000 M M M
2001 111 1.38 154
2002 24608.75 2.12 52170
2003 7716.25 2.81 21710
2004 28224 3.33 94262
2005 35602.25 3.20 114157
2006 35410.75 3.34 118462
2007 35763 2.55 91195
2008 27779.5 3.29 91571
2009 15086.25 2.36 35649
2010 20900 3.15 65930
2011 24315 3.02 73623
2012 33407.75 2.78 92873
2013 46438.5 1.69 78481
2014 35025 2.70 94567
2015 14140.75 2.55 36058
Source: (MoA). Baghdad.
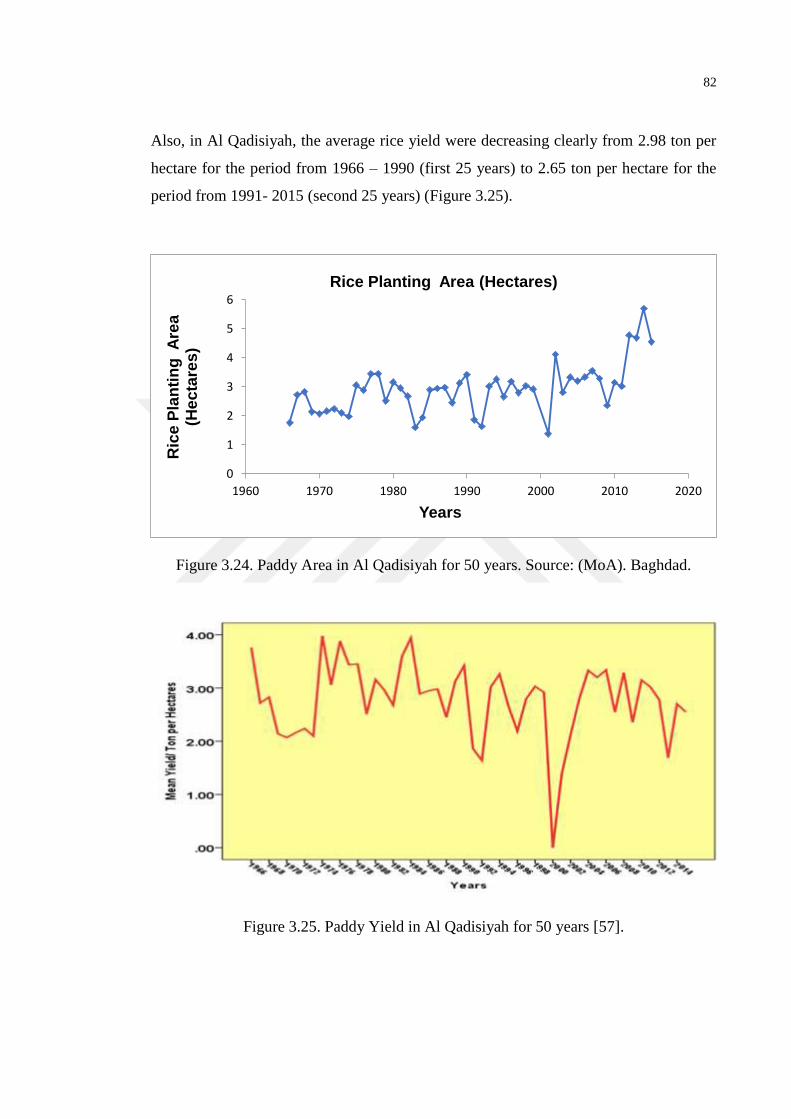
82
Also, in Al Qadisiyah, the average rice yield were decreasing clearly from 2.98 ton per
hectare for the period from 1966 – 1990 (first 25 years) to 2.65 ton per hectare for the
period from 1991- 2015 (second 25 years) (Figure 3.25).
Figure 3.24. Paddy Area in Al Qadisiyah for 50 years. Source: (MoA). Baghdad.
Figure 3.25. Paddy Yield in Al Qadisiyah for 50 years [57].
0
1
2
3
4
5
6
1960 1970 1980 1990 2000 2010 2020
Ric
e P
lan
tin
g A
rea
(H
ec
tare
s)
Years
Rice Planting Area (Hectares)
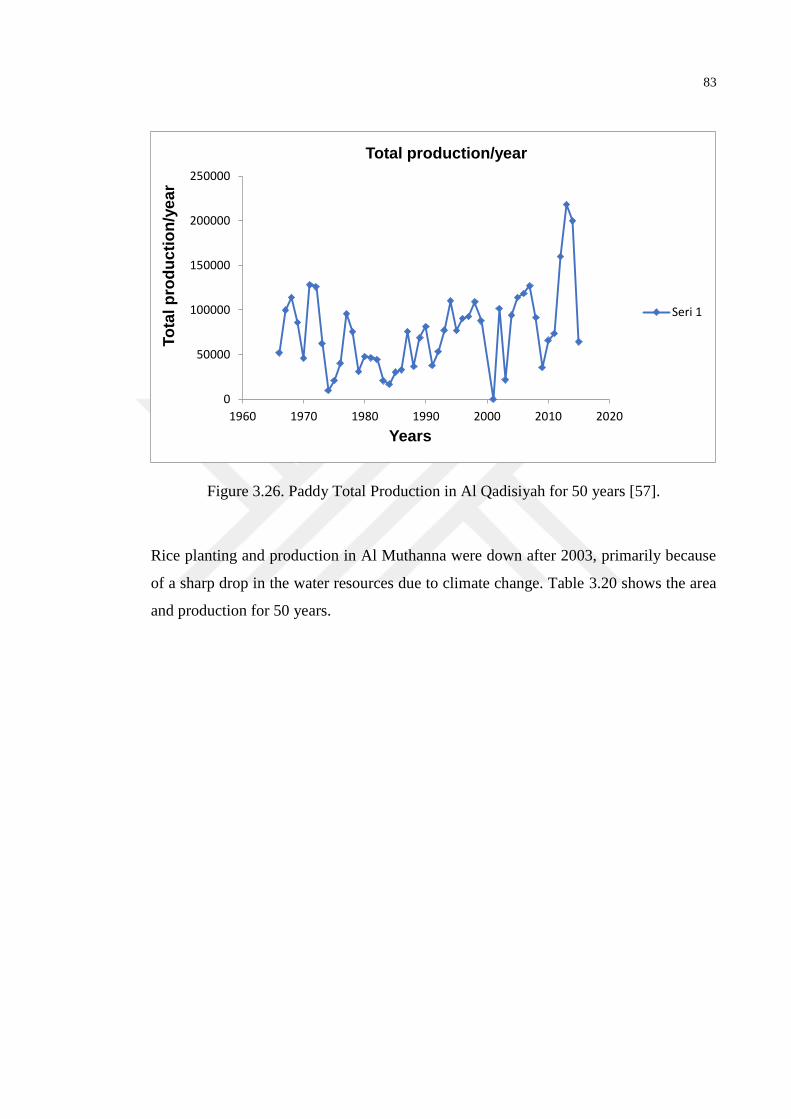
83
Figure 3.26. Paddy Total Production in Al Qadisiyah for 50 years [57].
Rice planting and production in Al Muthanna were down after 2003, primarily because
of a sharp drop in the water resources due to climate change. Table 3.20 shows the area
and production for 50 years.
0
50000
100000
150000
200000
250000
1960 1970 1980 1990 2000 2010 2020
To
tal p
rod
uc
tio
n/y
ea
r
Years
Total production/year
Seri 1
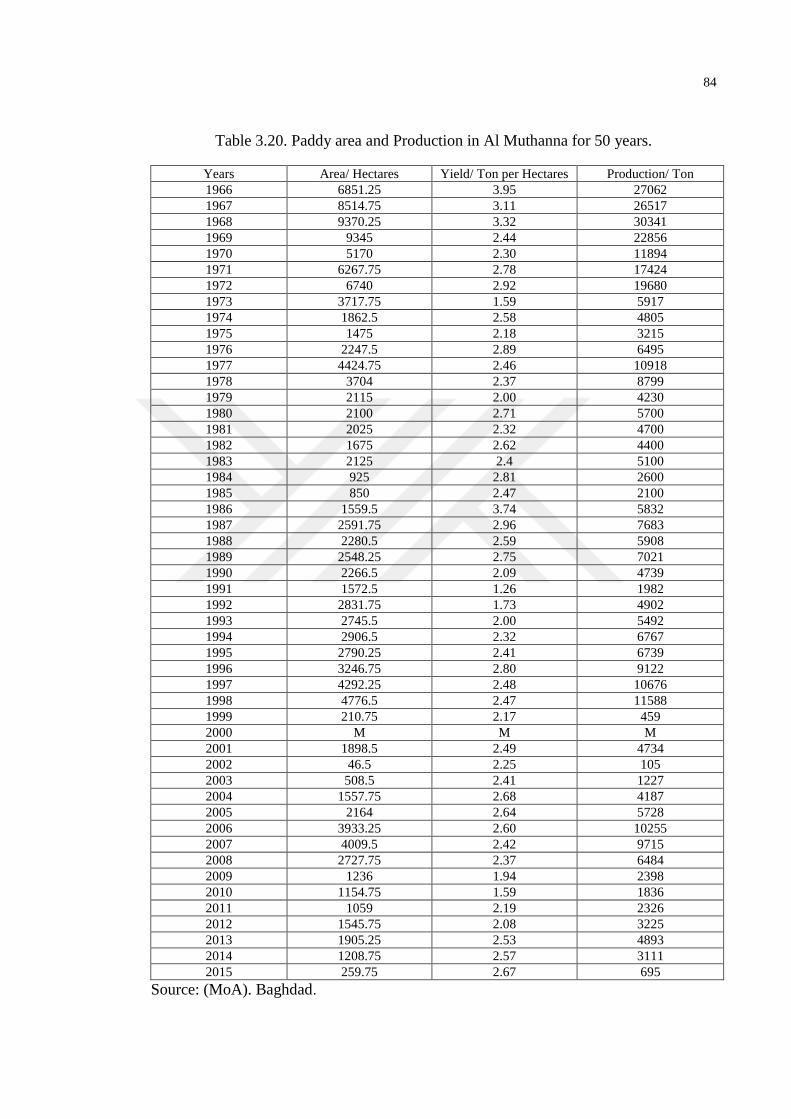
84
Table 3.20. Paddy area and Production in Al Muthanna for 50 years.
Years Area/ Hectares Yield/ Ton per Hectares Production/ Ton
1966 6851.25 3.95 27062
1967 8514.75 3.11 26517
1968 9370.25 3.32 30341
1969 9345 2.44 22856
1970 5170 2.30 11894
1971 6267.75 2.78 17424
1972 6740 2.92 19680
1973 3717.75 1.59 5917
1974 1862.5 2.58 4805
1975 1475 2.18 3215
1976 2247.5 2.89 6495
1977 4424.75 2.46 10918
1978 3704 2.37 8799
1979 2115 2.00 4230
1980 2100 2.71 5700
1981 2025 2.32 4700
1982 1675 2.62 4400
1983 2125 2.4 5100
1984 925 2.81 2600
1985 850 2.47 2100
1986 1559.5 3.74 5832
1987 2591.75 2.96 7683
1988 2280.5 2.59 5908
1989 2548.25 2.75 7021
1990 2266.5 2.09 4739
1991 1572.5 1.26 1982
1992 2831.75 1.73 4902
1993 2745.5 2.00 5492
1994 2906.5 2.32 6767
1995 2790.25 2.41 6739
1996 3246.75 2.80 9122
1997 4292.25 2.48 10676
1998 4776.5 2.47 11588
1999 210.75 2.17 459
2000 M M M
2001 1898.5 2.49 4734
2002 46.5 2.25 105
2003 508.5 2.41 1227
2004 1557.75 2.68 4187
2005 2164 2.64 5728
2006 3933.25 2.60 10255
2007 4009.5 2.42 9715
2008 2727.75 2.37 6484
2009 1236 1.94 2398
2010 1154.75 1.59 1836
2011 1059 2.19 2326
2012 1545.75 2.08 3225
2013 1905.25 2.53 4893
2014 1208.75 2.57 3111
2015 259.75 2.67 695
Source: (MoA). Baghdad.
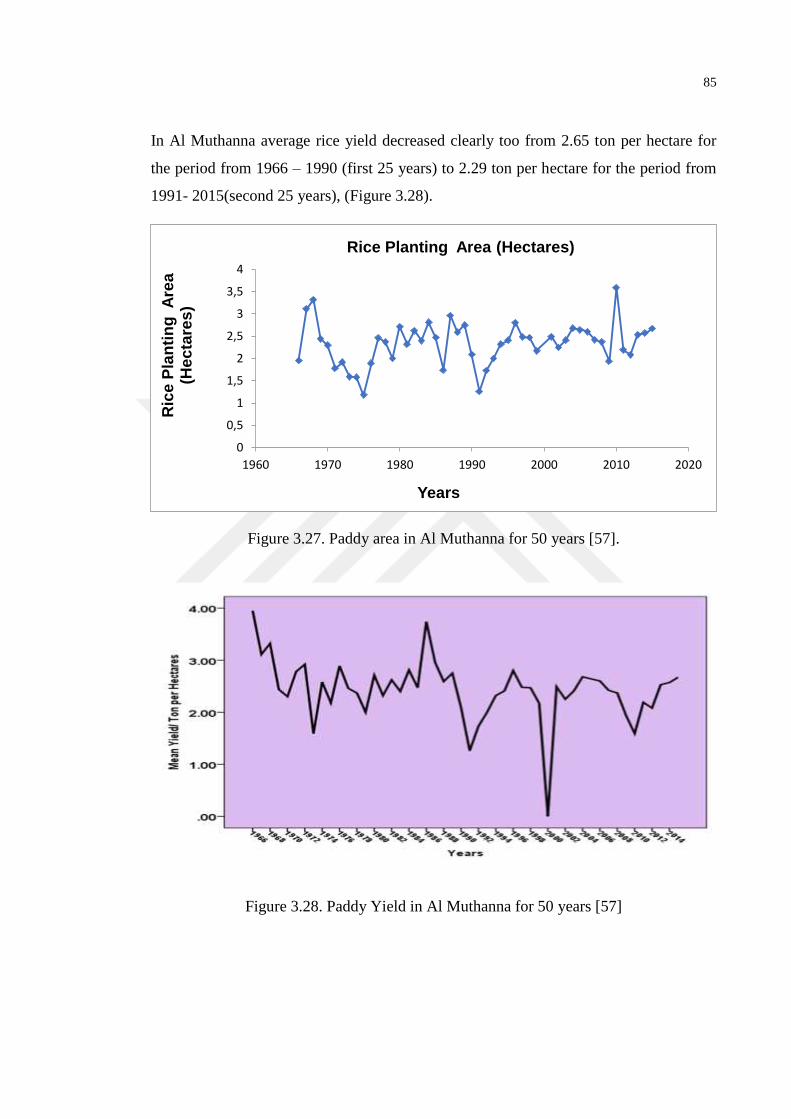
85
In Al Muthanna average rice yield decreased clearly too from 2.65 ton per hectare for
the period from 1966 – 1990 (first 25 years) to 2.29 ton per hectare for the period from
1991- 2015(second 25 years), (Figure 3.28).
Figure 3.27. Paddy area in Al Muthanna for 50 years [57].
Figure 3.28. Paddy Yield in Al Muthanna for 50 years [57]
0
0,5
1
1,5
2
2,5
3
3,5
4
1960 1970 1980 1990 2000 2010 2020
Ric
e P
lan
tin
g A
rea
(H
ec
tare
s)
Years
Rice Planting Area (Hectares)
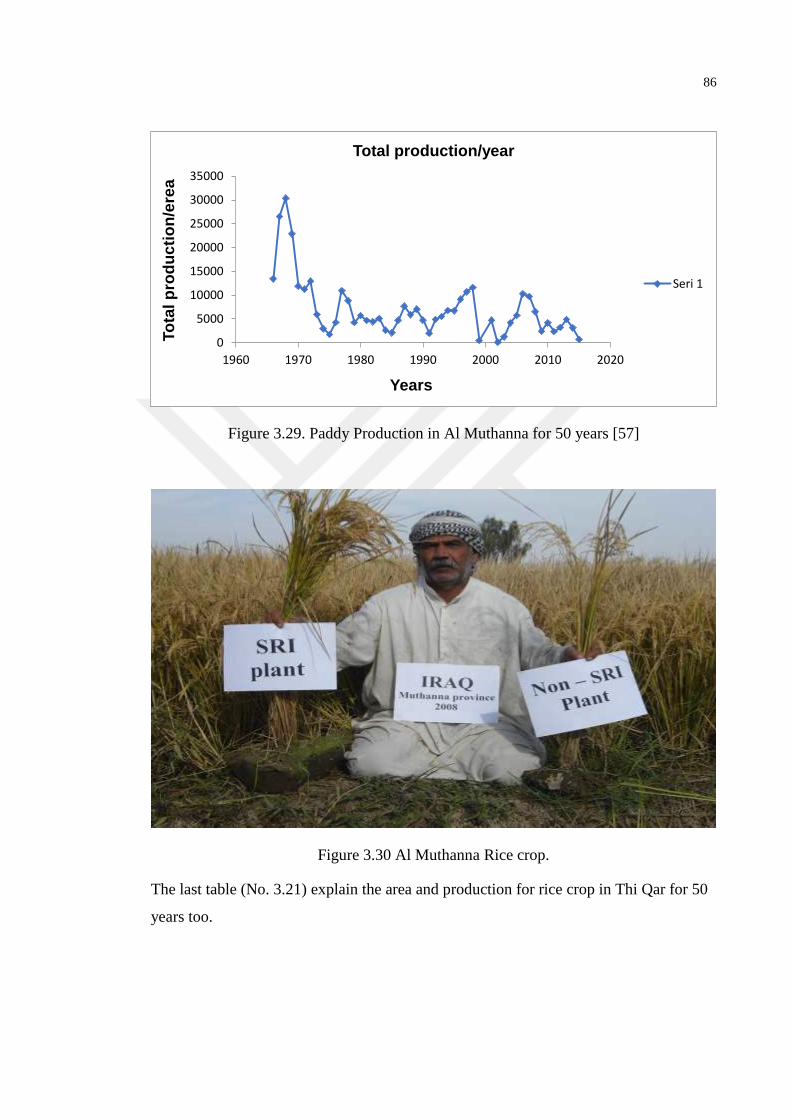
86
Figure 3.29. Paddy Production in Al Muthanna for 50 years [57]
Figure 3.30 Al Muthanna Rice crop.
The last table (No. 3.21) explain the area and production for rice crop in Thi Qar for 50
years too.
0
5000
10000
15000
20000
25000
30000
35000
1960 1970 1980 1990 2000 2010 2020
To
tal p
rod
uc
tio
n/e
rea
Years
Total production/year
Seri 1
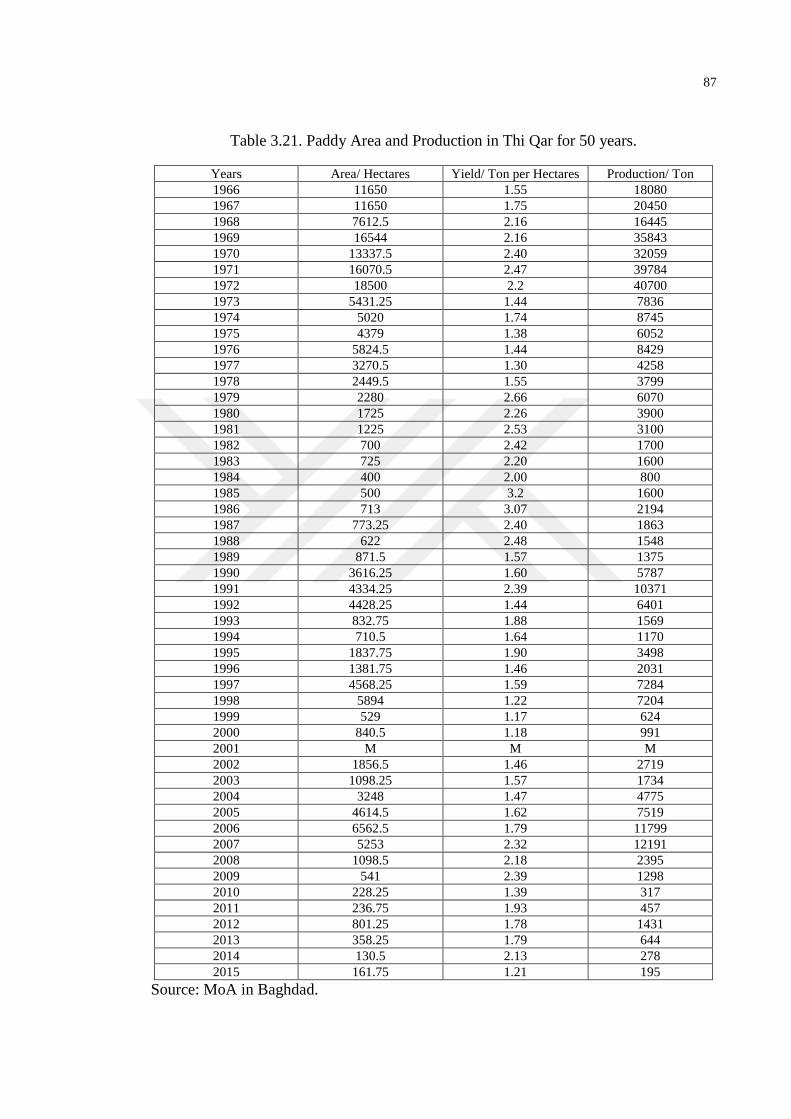
87
Table 3.21. Paddy Area and Production in Thi Qar for 50 years.
Years Area/ Hectares Yield/ Ton per Hectares Production/ Ton
1966 11650 1.55 18080
1967 11650 1.75 20450
1968 7612.5 2.16 16445
1969 16544 2.16 35843
1970 13337.5 2.40 32059
1971 16070.5 2.47 39784
1972 18500 2.2 40700
1973 5431.25 1.44 7836
1974 5020 1.74 8745
1975 4379 1.38 6052
1976 5824.5 1.44 8429
1977 3270.5 1.30 4258
1978 2449.5 1.55 3799
1979 2280 2.66 6070
1980 1725 2.26 3900
1981 1225 2.53 3100
1982 700 2.42 1700
1983 725 2.20 1600
1984 400 2.00 800
1985 500 3.2 1600
1986 713 3.07 2194
1987 773.25 2.40 1863
1988 622 2.48 1548
1989 871.5 1.57 1375
1990 3616.25 1.60 5787
1991 4334.25 2.39 10371
1992 4428.25 1.44 6401
1993 832.75 1.88 1569
1994 710.5 1.64 1170
1995 1837.75 1.90 3498
1996 1381.75 1.46 2031
1997 4568.25 1.59 7284
1998 5894 1.22 7204
1999 529 1.17 624
2000 840.5 1.18 991
2001 M M M
2002 1856.5 1.46 2719
2003 1098.25 1.57 1734
2004 3248 1.47 4775
2005 4614.5 1.62 7519
2006 6562.5 1.79 11799
2007 5253 2.32 12191
2008 1098.5 2.18 2395
2009 541 2.39 1298
2010 228.25 1.39 317
2011 236.75 1.93 457
2012 801.25 1.78 1431
2013 358.25 1.79 644
2014 130.5 2.13 278
2015 161.75 1.21 195
Source: MoA in Baghdad.
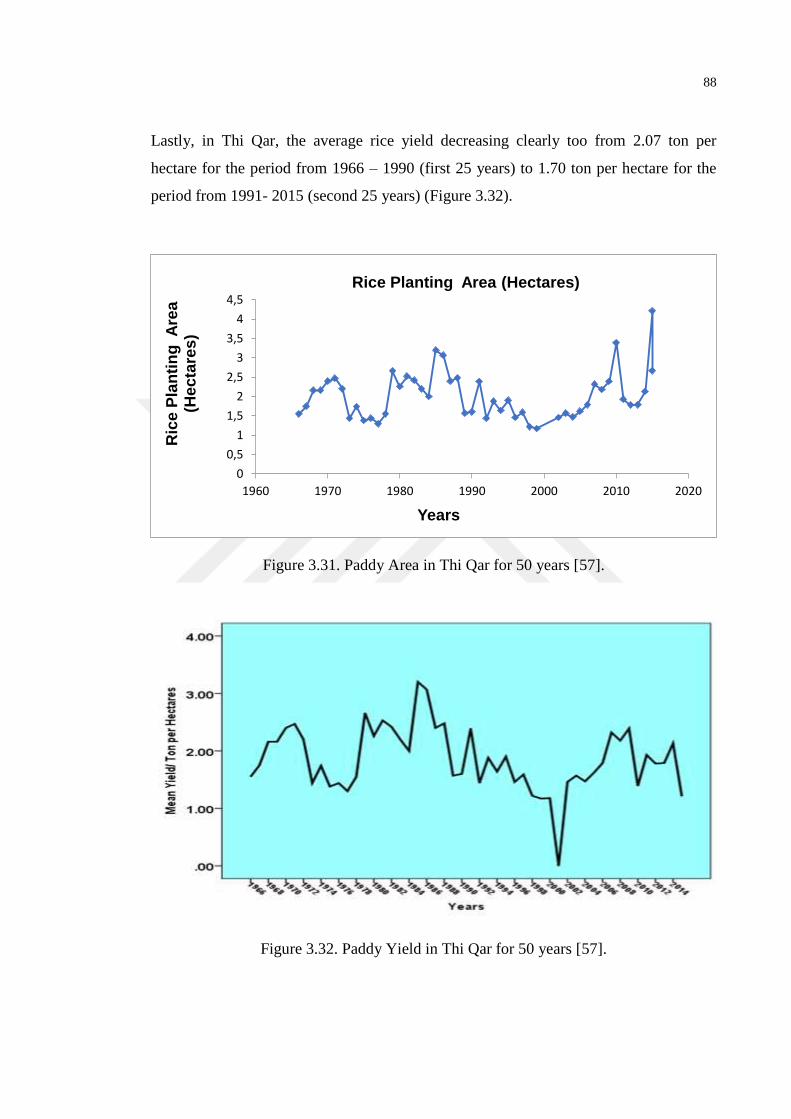
88
Lastly, in Thi Qar, the average rice yield decreasing clearly too from 2.07 ton per
hectare for the period from 1966 – 1990 (first 25 years) to 1.70 ton per hectare for the
period from 1991- 2015 (second 25 years) (Figure 3.32).
Figure 3.31. Paddy Area in Thi Qar for 50 years [57].
Figure 3.32. Paddy Yield in Thi Qar for 50 years [57].
0
0,5
1
1,5
2
2,5
3
3,5
4
4,5
1960 1970 1980 1990 2000 2010 2020
Ric
e P
lan
tin
g A
rea
(H
ec
tare
s)
Years
Rice Planting Area (Hectares)
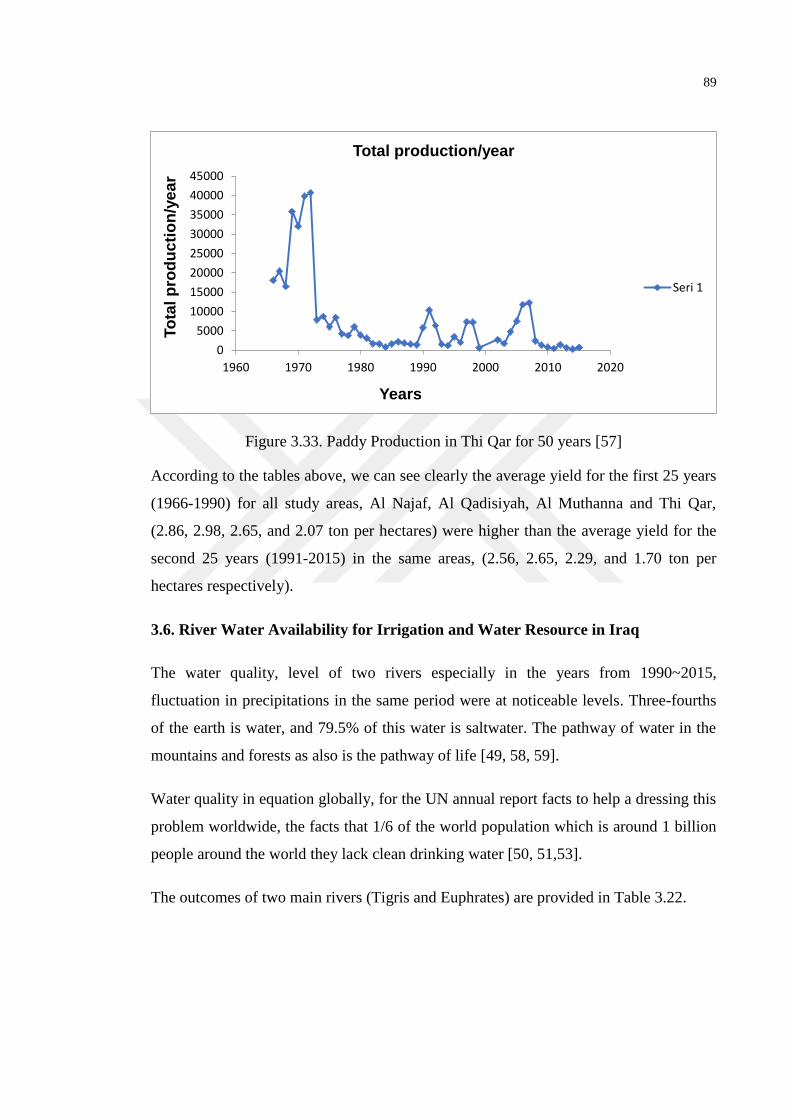
89
Figure 3.33. Paddy Production in Thi Qar for 50 years [57]
According to the tables above, we can see clearly the average yield for the first 25 years
(1966-1990) for all study areas, Al Najaf, Al Qadisiyah, Al Muthanna and Thi Qar,
(2.86, 2.98, 2.65, and 2.07 ton per hectares) were higher than the average yield for the
second 25 years (1991-2015) in the same areas, (2.56, 2.65, 2.29, and 1.70 ton per
hectares respectively).
3.6. River Water Availability for Irrigation and Water Resource in Iraq
The water quality, level of two rivers especially in the years from 1990~2015,
fluctuation in precipitations in the same period were at noticeable levels. Three-fourths
of the earth is water, and 79.5% of this water is saltwater. The pathway of water in the
mountains and forests as also is the pathway of life [49, 58, 59].
Water quality in equation globally, for the UN annual report facts to help a dressing this
problem worldwide, the facts that 1/6 of the world population which is around 1 billion
people around the world they lack clean drinking water [50, 51,53].
The outcomes of two main rivers (Tigris and Euphrates) are provided in Table 3.22.
0
5000
10000
15000
20000
25000
30000
35000
40000
45000
1960 1970 1980 1990 2000 2010 2020
To
tal p
rod
uc
tio
n/y
ea
r
Years
Total production/year
Seri 1
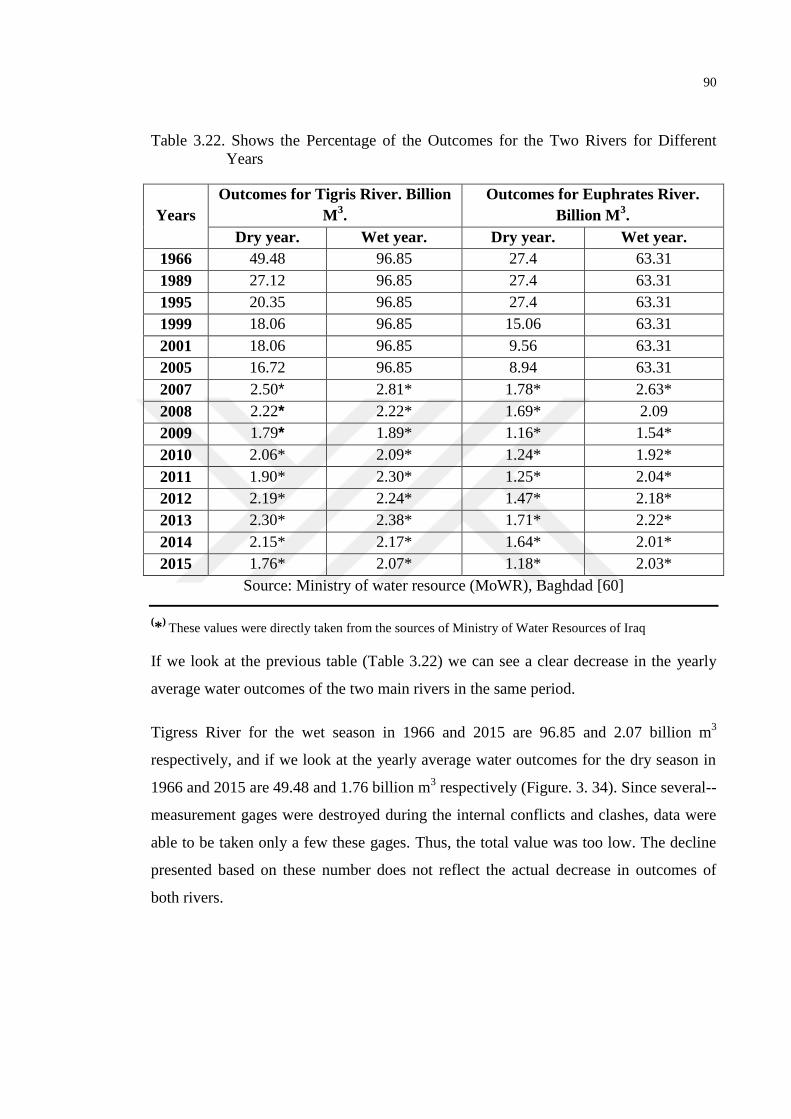
90
Table 3.22. Shows the Percentage of the Outcomes for the Two Rivers for Different
Years
Years
Outcomes for Tigris River. Billion
M3.
Outcomes for Euphrates River.
Billion M3.
Dry year. Wet year. Dry year. Wet year.
1966 49.48 96.85 27.4 63.31
1989 27.12 96.85 27.4 63.31
1995 20.35 96.85 27.4 63.31
1999 18.06 96.85 15.06 63.31
2001 18.06 96.85 9.56 63.31
2005 16.72 96.85 8.94 63.31
2007 2.50* 2.81* 1.78* 2.63*
2008 2.22* 2.22* 1.69* 2.09
2009 1.79* 1.89* 1.16* 1.54*
2010 2.06* 2.09* 1.24* 1.92*
2011 1.90* 2.30* 1.25* 2.04*
2012 2.19* 2.24* 1.47* 2.18*
2013 2.30* 2.38* 1.71* 2.22*
2014 2.15* 2.17* 1.64* 2.01*
2015 1.76* 2.07* 1.18* 2.03*
Source: Ministry of water resource (MoWR), Baghdad [60]
(*
) These values were directly taken from the sources of Ministry of Water Resources of Iraq
If we look at the previous table (Table 3.22) we can see a clear decrease in the yearly
average water outcomes of the two main rivers in the same period.
Tigress River for the wet season in 1966 and 2015 are 96.85 and 2.07 billion m3
respectively, and if we look at the yearly average water outcomes for the dry season in
1966 and 2015 are 49.48 and 1.76 billion m3 respectively (Figure. 3. 34). Since several--
measurement gages were destroyed during the internal conflicts and clashes, data were
able to be taken only a few these gages. Thus, the total value was too low. The decline
presented based on these number does not reflect the actual decrease in outcomes of
both rivers.
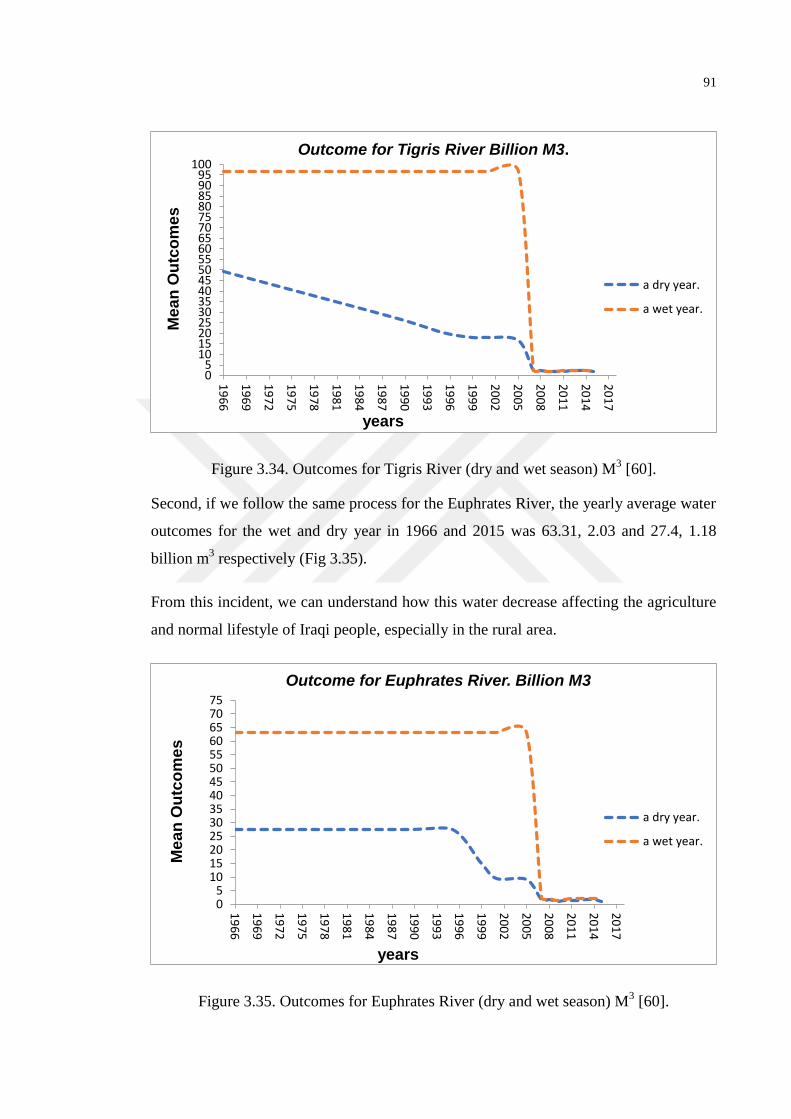
91
Figure 3.34. Outcomes for Tigris River (dry and wet season) M3 [60].
Second, if we follow the same process for the Euphrates River, the yearly average water
outcomes for the wet and dry year in 1966 and 2015 was 63.31, 2.03 and 27.4, 1.18
billion m3 respectively (Fig 3.35).
From this incident, we can understand how this water decrease affecting the agriculture
and normal lifestyle of Iraqi people, especially in the rural area.
Figure 3.35. Outcomes for Euphrates River (dry and wet season) M3 [60].
05
101520253035404550556065707580859095
100
19
66
19
69
19
72
19
75
19
78
19
81
19
84
19
87
19
90
19
93
19
96
19
99
20
02
20
05
20
08
20
11
20
14
20
17
Me
an
Ou
tco
me
s
years
Outcome for Tigris River Billion M3.
a dry year.
a wet year.
05
1015202530354045505560657075
19
66
19
69
19
72
19
75
19
78
19
81
19
84
19
87
19
90
19
93
19
96
19
99
20
02
20
05
20
08
20
11
20
14
20
17
Me
an
Ou
tco
me
s
years
Outcome for Euphrates River. Billion M3
a dry year.
a wet year.
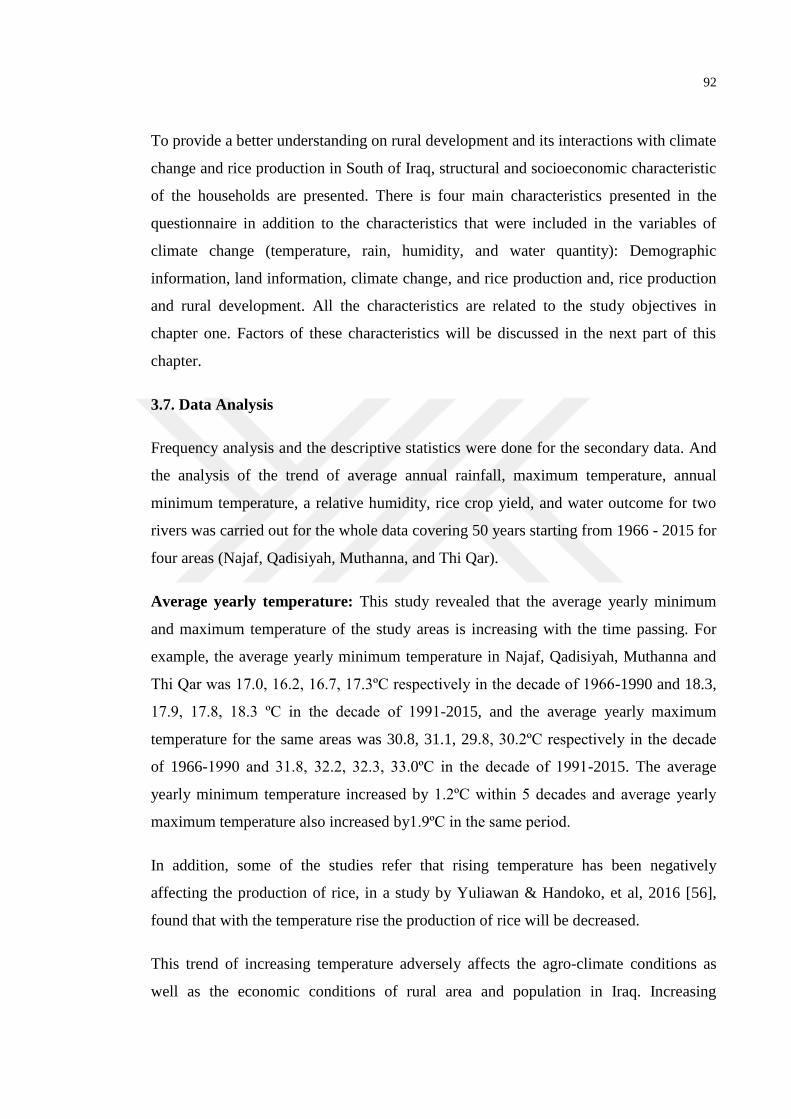
92
To provide a better understanding on rural development and its interactions with climate
change and rice production in South of Iraq, structural and socioeconomic characteristic
of the households are presented. There is four main characteristics presented in the
questionnaire in addition to the characteristics that were included in the variables of
climate change (temperature, rain, humidity, and water quantity): Demographic
information, land information, climate change, and rice production and, rice production
and rural development. All the characteristics are related to the study objectives in
chapter one. Factors of these characteristics will be discussed in the next part of this
chapter.
3.7. Data Analysis
Frequency analysis and the descriptive statistics were done for the secondary data. And
the analysis of the trend of average annual rainfall, maximum temperature, annual
minimum temperature, a relative humidity, rice crop yield, and water outcome for two
rivers was carried out for the whole data covering 50 years starting from 1966 - 2015 for
four areas (Najaf, Qadisiyah, Muthanna, and Thi Qar).
Average yearly temperature: This study revealed that the average yearly minimum
and maximum temperature of the study areas is increasing with the time passing. For
example, the average yearly minimum temperature in Najaf, Qadisiyah, Muthanna and
Thi Qar was 17.0, 16.2, 16.7, 17.3ºC respectively in the decade of 1966-1990 and 18.3,
17.9, 17.8, 18.3 ºC in the decade of 1991-2015, and the average yearly maximum
temperature for the same areas was 30.8, 31.1, 29.8, 30.2ºC respectively in the decade
of 1966-1990 and 31.8, 32.2, 32.3, 33.0ºC in the decade of 1991-2015. The average
yearly minimum temperature increased by 1.2ºC within 5 decades and average yearly
maximum temperature also increased by1.9ºC in the same period.
In addition, some of the studies refer that rising temperature has been negatively
affecting the production of rice, in a study by Yuliawan & Handoko, et al, 2016 [56],
found that with the temperature rise the production of rice will be decreased.
This trend of increasing temperature adversely affects the agro-climate conditions as
well as the economic conditions of rural area and population in Iraq. Increasing
93
temperature not only affects the Iraqi paddy production sector but also enhances the
intensity of dust storm which hampers the normal lifestyle.
Average yearly total rainfall: The total yearly rainfall is decreasing clearly with the
time passing. The average yearly total rainfall of Najaf, Qadisiyah, Muthanna, and Thi
Qar in 1966- 1990 was 105.7, 117.6, 107.3, 118.4 mm respectively, and in the year
1991- 2015, the amount of average rainfall was 66.9, 101.6, 98.3, 113.9 mm
respectively. This scenario explicitly indicates how Iraqi agriculture and irrigation
sectors are suffering from the scarcity of rainfall because of Iraqi agriculture and
irrigation systems largely dependent on rainfall. As the situation (scarcity of rainfall) is
worsening day by day, so Iraqi people especially paddy farmers are becoming more
frustrated with thinking about the future as well as agricultural sustainability.
Average yearly relative humidity: The recorded mean average yearly humidity in
percentage was recorded in the range of 50-55%. It is important to note that a higher
level of daily humidity is crucial for the proper growth of the paddy plant and therefore,
significantly affects the total production of rice. This condition is particularly true for
the offseason planting and production were the areas with a lower level of precipitation.
In the area where there is an insufficient percentage of humidity could be affected in
terms of the growth cycle of the paddy plant; nevertheless, the ability of the paddy plant
to regulate its own microclimate would raise the relative humidity within the crop when
enough irrigation is supplied [61,25,62].
Irrigation water: Iraqi irrigation system mainly depends on two main rivers namely the
Tigris and Euphrates, but recently river flows of those two rivers are decreasing
drastically. In 1966, the total outcomes of water in the dry season of Tigris and
Euphrates were 49.48 and 27.4 billion M3 respectively, whereas the total outcomes in
2015 were 1.76 and 1.18 billion M3 respectively. in addition to, in 1966 the total
outcomes of water in the wet season of Tigris and Euphrates were 96.85 and 63.31
billion M3 respectively and in 2015 were 2.07 and 2.03 billion M
3 respectively too
(ministry of water resource in Iraq). Therefore, the scarcity of river water is increasing
day by day by affecting Iraqi agriculture and irrigation sectors adversely. So Iraqi paddy
production is decreasing because of the negative effect of climate change.
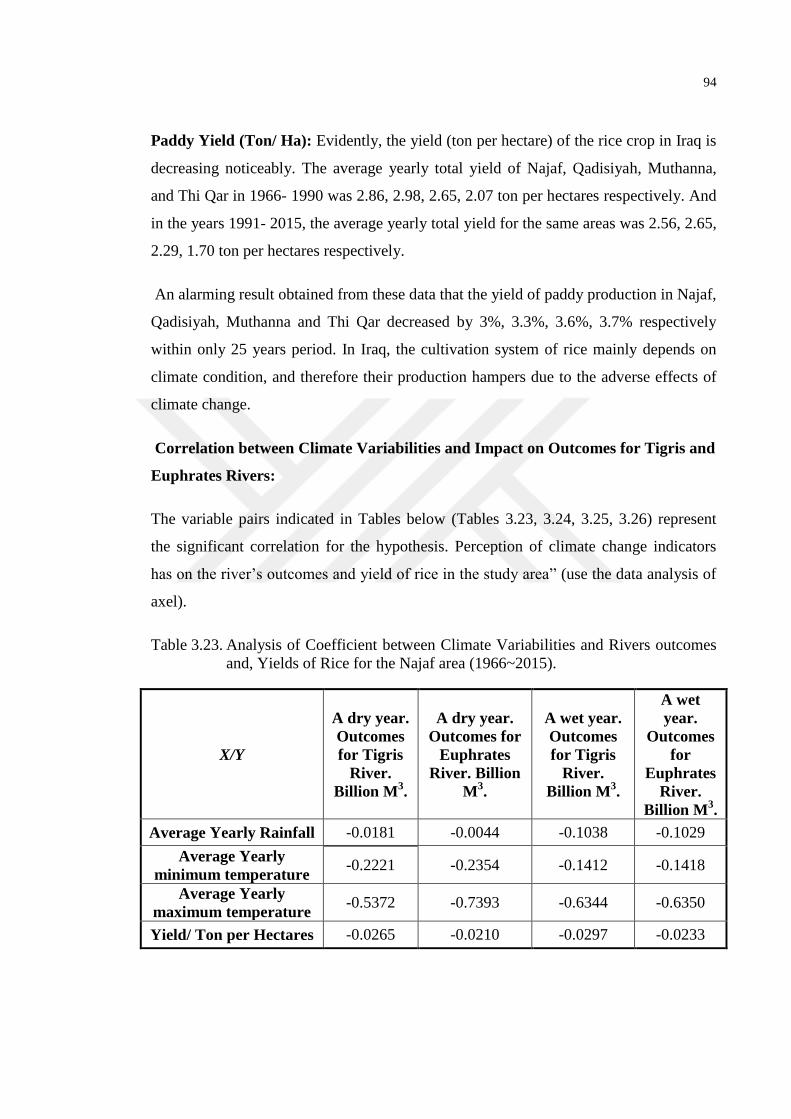
94
Paddy Yield (Ton/ Ha): Evidently, the yield (ton per hectare) of the rice crop in Iraq is
decreasing noticeably. The average yearly total yield of Najaf, Qadisiyah, Muthanna,
and Thi Qar in 1966- 1990 was 2.86, 2.98, 2.65, 2.07 ton per hectares respectively. And
in the years 1991- 2015, the average yearly total yield for the same areas was 2.56, 2.65,
2.29, 1.70 ton per hectares respectively.
An alarming result obtained from these data that the yield of paddy production in Najaf,
Qadisiyah, Muthanna and Thi Qar decreased by 3%, 3.3%, 3.6%, 3.7% respectively
within only 25 years period. In Iraq, the cultivation system of rice mainly depends on
climate condition, and therefore their production hampers due to the adverse effects of
climate change.
Correlation between Climate Variabilities and Impact on Outcomes for Tigris and
Euphrates Rivers:
The variable pairs indicated in Tables below (Tables 3.23, 3.24, 3.25, 3.26) represent
the significant correlation for the hypothesis. Perception of climate change indicators
has on the river’s outcomes and yield of rice in the study area‖ (use the data analysis of
axel).
Table 3.23. Analysis of Coefficient between Climate Variabilities and Rivers outcomes
and, Yields of Rice for the Najaf area (1966~2015).
X/Y
A dry year.
Outcomes
for Tigris
River.
Billion M3.
A dry year.
Outcomes for
Euphrates
River. Billion
M3.
A wet year.
Outcomes
for Tigris
River.
Billion M3.
A wet
year.
Outcomes
for
Euphrates
River.
Billion M3.
Average Yearly Rainfall -0.0181 -0.0044 -0.1038 -0.1029
Average Yearly
minimum temperature -0.2221 -0.2354 -0.1412 -0.1418
Average Yearly
maximum temperature -0.5372 -0.7393 -0.6344 -0.6350
Yield/ Ton per Hectares -0.0265 -0.0210 -0.0297 -0.0233
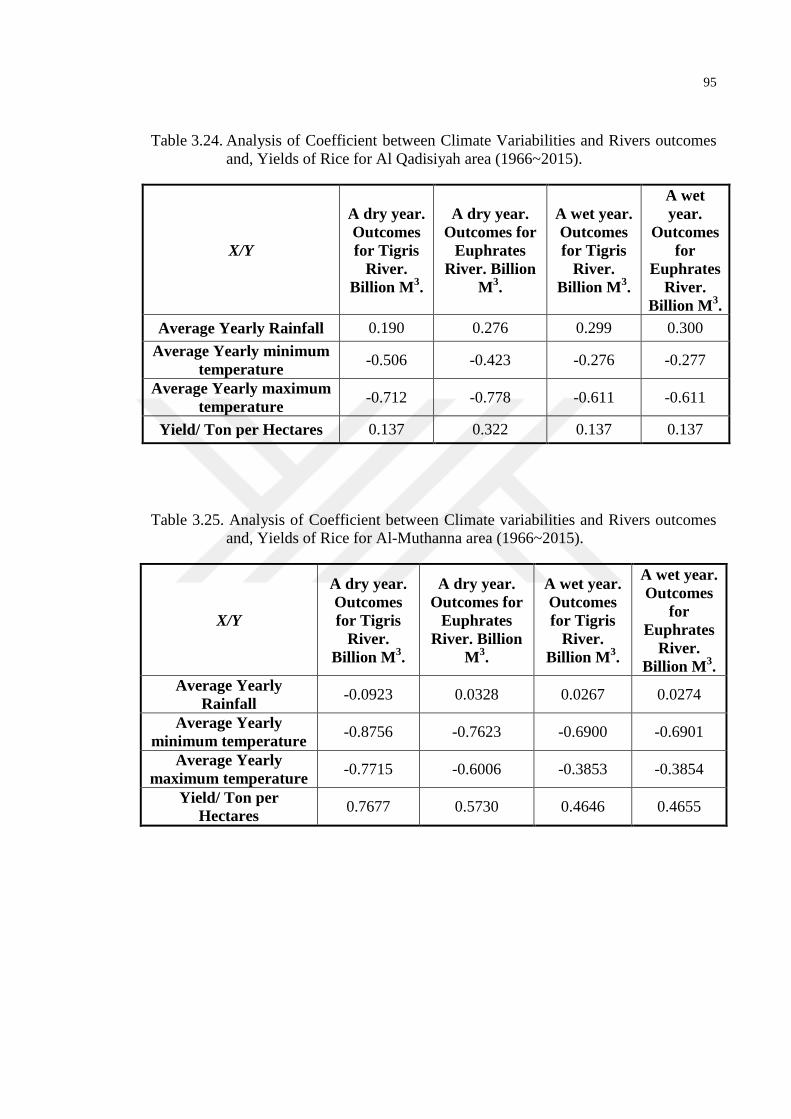
95
Table 3.24. Analysis of Coefficient between Climate Variabilities and Rivers outcomes
and, Yields of Rice for Al Qadisiyah area (1966~2015).
X/Y
A dry year.
Outcomes
for Tigris
River.
Billion M3.
A dry year.
Outcomes for
Euphrates
River. Billion
M3.
A wet year.
Outcomes
for Tigris
River.
Billion M3.
A wet
year.
Outcomes
for
Euphrates
River.
Billion M3.
Average Yearly Rainfall 0.190 0.276 0.299 0.300
Average Yearly minimum
temperature -0.506 -0.423 -0.276 -0.277
Average Yearly maximum
temperature -0.712 -0.778 -0.611 -0.611
Yield/ Ton per Hectares 0.137 0.322 0.137 0.137
Table 3.25. Analysis of Coefficient between Climate variabilities and Rivers outcomes
and, Yields of Rice for Al-Muthanna area (1966~2015).
X/Y
A dry year.
Outcomes
for Tigris
River.
Billion M3.
A dry year.
Outcomes for
Euphrates
River. Billion
M3.
A wet year.
Outcomes
for Tigris
River.
Billion M3.
A wet year.
Outcomes
for
Euphrates
River.
Billion M3.
Average Yearly
Rainfall -0.0923 0.0328 0.0267 0.0274
Average Yearly
minimum temperature -0.8756 -0.7623 -0.6900 -0.6901
Average Yearly
maximum temperature -0.7715 -0.6006 -0.3853 -0.3854
Yield/ Ton per
Hectares 0.7677 0.5730 0.4646 0.4655
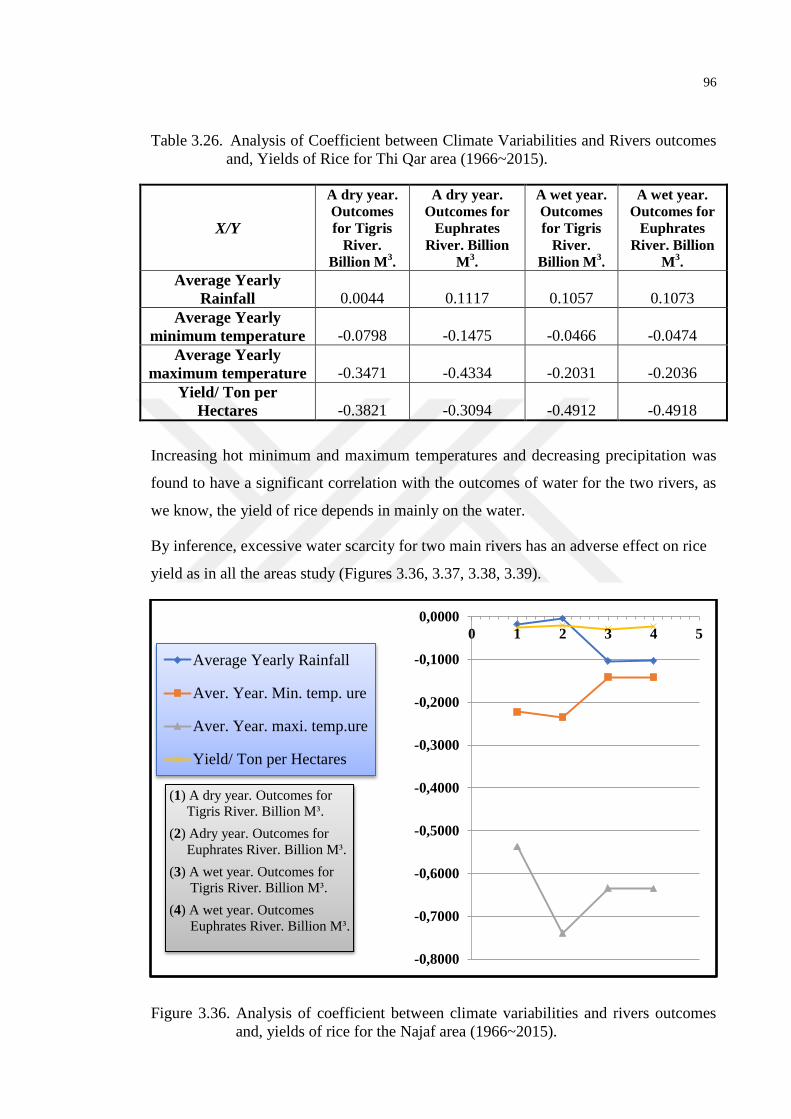
96
Table 3.26. Analysis of Coefficient between Climate Variabilities and Rivers outcomes
and, Yields of Rice for Thi Qar area (1966~2015).
X/Y
A dry year.
Outcomes
for Tigris
River.
Billion M3.
A dry year.
Outcomes for
Euphrates
River. Billion
M3.
A wet year.
Outcomes
for Tigris
River.
Billion M3.
A wet year.
Outcomes for
Euphrates
River. Billion
M3.
Average Yearly
Rainfall 0.0044 0.1117 0.1057 0.1073
Average Yearly
minimum temperature -0.0798 -0.1475 -0.0466 -0.0474
Average Yearly
maximum temperature -0.3471 -0.4334 -0.2031 -0.2036
Yield/ Ton per
Hectares -0.3821 -0.3094 -0.4912 -0.4918
Increasing hot minimum and maximum temperatures and decreasing precipitation was
found to have a significant correlation with the outcomes of water for the two rivers, as
we know, the yield of rice depends in mainly on the water.
By inference, excessive water scarcity for two main rivers has an adverse effect on rice
yield as in all the areas study (Figures 3.36, 3.37, 3.38, 3.39).
Figure 3.36. Analysis of coefficient between climate variabilities and rivers outcomes
and, yields of rice for the Najaf area (1966~2015).
-0,8000
-0,7000
-0,6000
-0,5000
-0,4000
-0,3000
-0,2000
-0,1000
0,0000
0 1 2 3 4 5
(1) A dry year. Outcomes for
Tigris River. Billion M³.
(2) Adry year. Outcomes for
Euphrates River. Billion M³.
(3) A wet year. Outcomes for
Tigris River. Billion M³.
(4) A wet year. Outcomes
Euphrates River. Billion M³.
Average Yearly Rainfall
Aver. Year. Min. temp. ure
Aver. Year. maxi. temp.ure
Yield/ Ton per Hectares
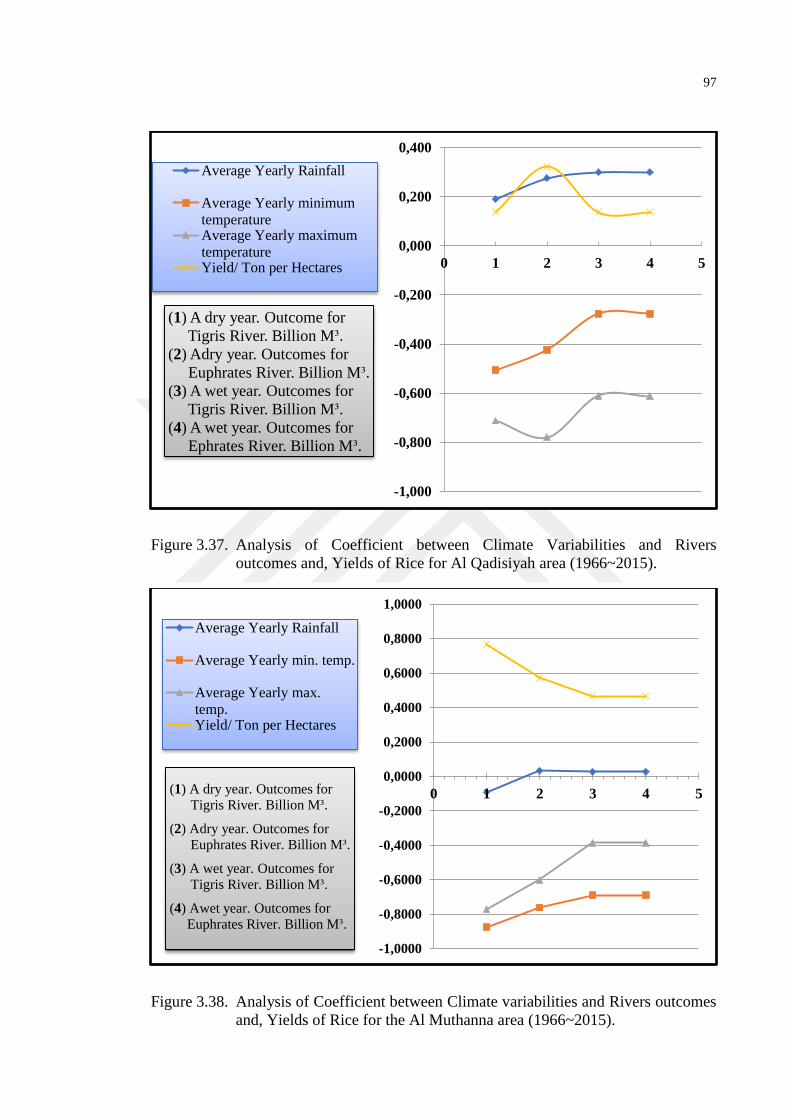
97
Figure 3.37. Analysis of Coefficient between Climate Variabilities and Rivers
outcomes and, Yields of Rice for Al Qadisiyah area (1966~2015).
Figure 3.38. Analysis of Coefficient between Climate variabilities and Rivers outcomes
and, Yields of Rice for the Al Muthanna area (1966~2015).
-1,000
-0,800
-0,600
-0,400
-0,200
0,000
0,200
0,400
0 1 2 3 4 5
(1) A dry year. Outcome for
Tigris River. Billion M³.
(2) Adry year. Outcomes for
Euphrates River. Billion M³.
(3) A wet year. Outcomes for
Tigris River. Billion M³.
(4) A wet year. Outcomes for
Ephrates River. Billion M³.
Average Yearly Rainfall
Average Yearly minimum
temperatureAverage Yearly maximum
temperatureYield/ Ton per Hectares
-1,0000
-0,8000
-0,6000
-0,4000
-0,2000
0,0000
0,2000
0,4000
0,6000
0,8000
1,0000
0 1 2 3 4 5
(1) A dry year. Outcomes for
Tigris River. Billion M³.
(2) Adry year. Outcomes for
Euphrates River. Billion M³.
(3) A wet year. Outcomes for
Tigris River. Billion M³.
(4) Awet year. Outcomes for
Euphrates River. Billion M³.
Average Yearly Rainfall
Average Yearly min. temp.
Average Yearly max.
temp.Yield/ Ton per Hectares
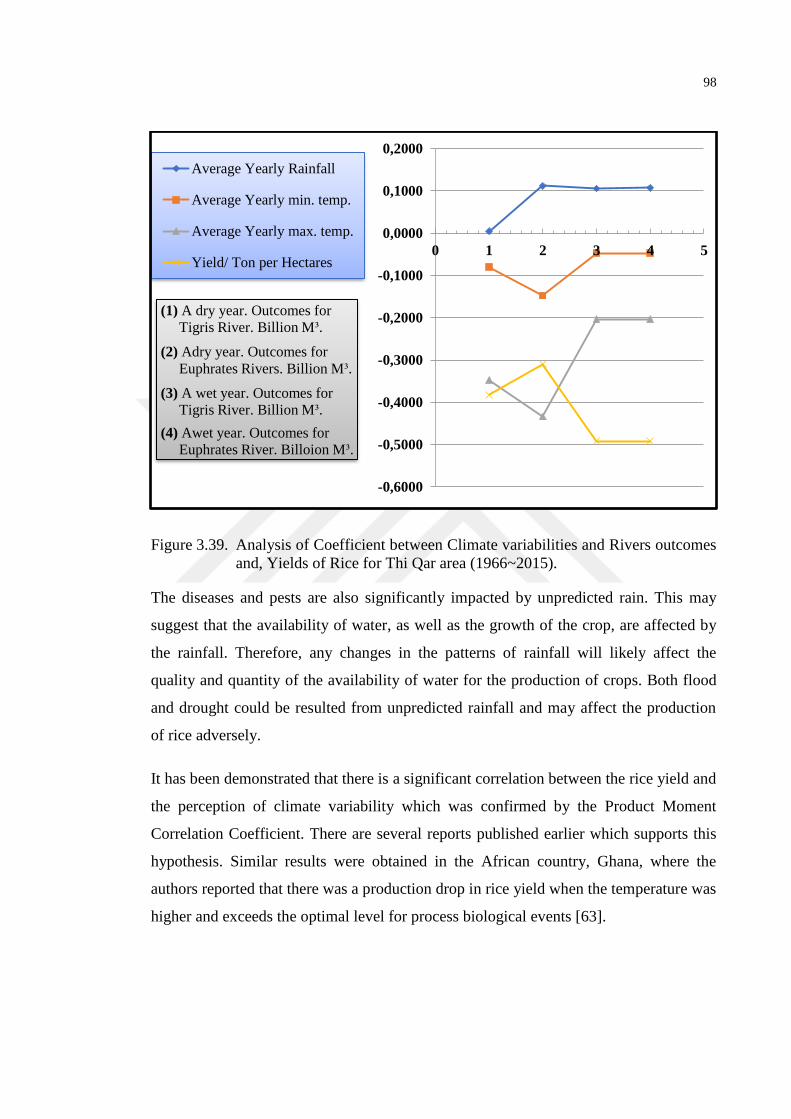
98
Figure 3.39. Analysis of Coefficient between Climate variabilities and Rivers outcomes
and, Yields of Rice for Thi Qar area (1966~2015).
The diseases and pests are also significantly impacted by unpredicted rain. This may
suggest that the availability of water, as well as the growth of the crop, are affected by
the rainfall. Therefore, any changes in the patterns of rainfall will likely affect the
quality and quantity of the availability of water for the production of crops. Both flood
and drought could be resulted from unpredicted rainfall and may affect the production
of rice adversely.
It has been demonstrated that there is a significant correlation between the rice yield and
the perception of climate variability which was confirmed by the Product Moment
Correlation Coefficient. There are several reports published earlier which supports this
hypothesis. Similar results were obtained in the African country, Ghana, where the
authors reported that there was a production drop in rice yield when the temperature was
higher and exceeds the optimal level for process biological events [63].
-0,6000
-0,5000
-0,4000
-0,3000
-0,2000
-0,1000
0,0000
0,1000
0,2000
0 1 2 3 4 5
(1) A dry year. Outcomes for
Tigris River. Billion M³.
(2) Adry year. Outcomes for
Euphrates Rivers. Billion M³.
(3) A wet year. Outcomes for
Tigris River. Billion M³.
(4) Awet year. Outcomes for
Euphrates River. Billoion M³.
Average Yearly Rainfall
Average Yearly min. temp.
Average Yearly max. temp.
Yield/ Ton per Hectares
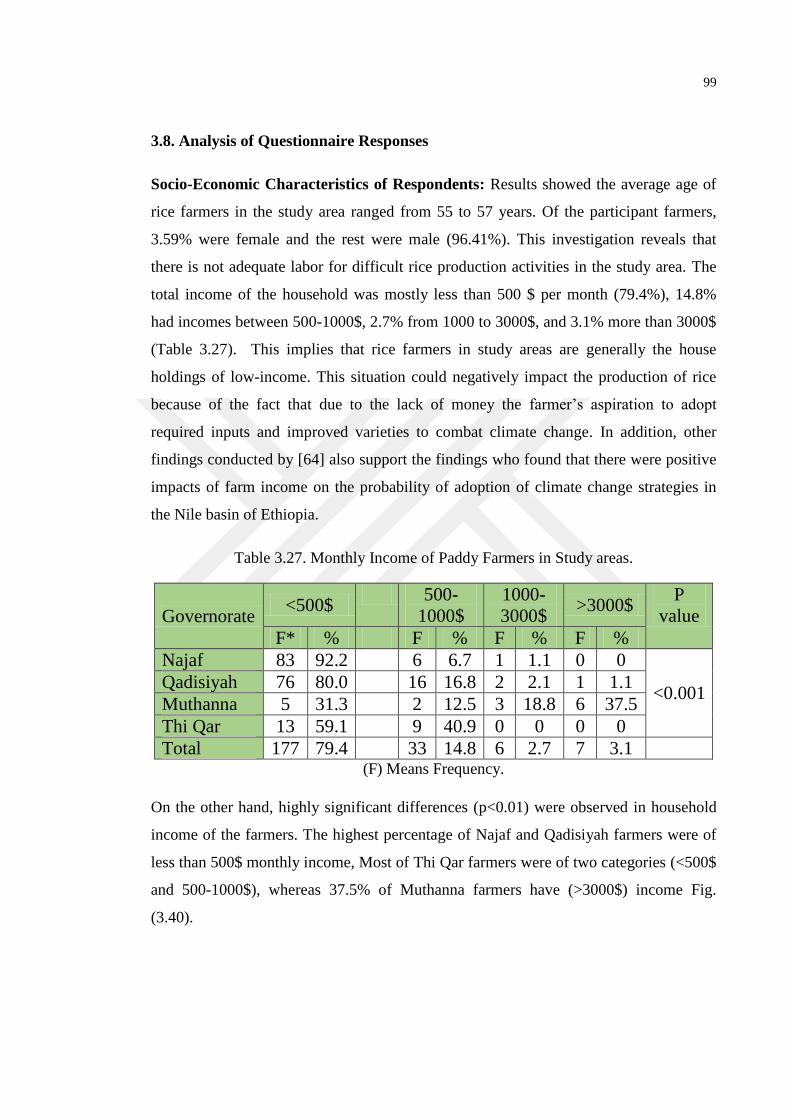
99
3.8. Analysis of Questionnaire Responses
Socio-Economic Characteristics of Respondents: Results showed the average age of
rice farmers in the study area ranged from 55 to 57 years. Of the participant farmers,
3.59% were female and the rest were male (96.41%). This investigation reveals that
there is not adequate labor for difficult rice production activities in the study area. The
total income of the household was mostly less than 500 $ per month (79.4%), 14.8%
had incomes between 500-1000$, 2.7% from 1000 to 3000$, and 3.1% more than 3000$
(Table 3.27). This implies that rice farmers in study areas are generally the house
holdings of low-income. This situation could negatively impact the production of rice
because of the fact that due to the lack of money the farmer’s aspiration to adopt
required inputs and improved varieties to combat climate change. In addition, other
findings conducted by [64] also support the findings who found that there were positive
impacts of farm income on the probability of adoption of climate change strategies in
the Nile basin of Ethiopia.
Table 3.27. Monthly Income of Paddy Farmers in Study areas.
Governorate <500$
500-
1000$
1000-
3000$ >3000$
P
value
F* % F % F % F %
Najaf 83 92.2 6 6.7 1 1.1 0 0
<0.001 Qadisiyah 76 80.0 16 16.8 2 2.1 1 1.1
Muthanna 5 31.3 2 12.5 3 18.8 6 37.5
Thi Qar 13 59.1 9 40.9 0 0 0 0
Total 177 79.4 33 14.8 6 2.7 7 3.1 (F) Means Frequency.
On the other hand, highly significant differences (p<0.01) were observed in household
income of the farmers. The highest percentage of Najaf and Qadisiyah farmers were of
less than 500$ monthly income, Most of Thi Qar farmers were of two categories (<500$
and 500-1000$), whereas 37.5% of Muthanna farmers have (>3000$) income Fig.
(3.40).
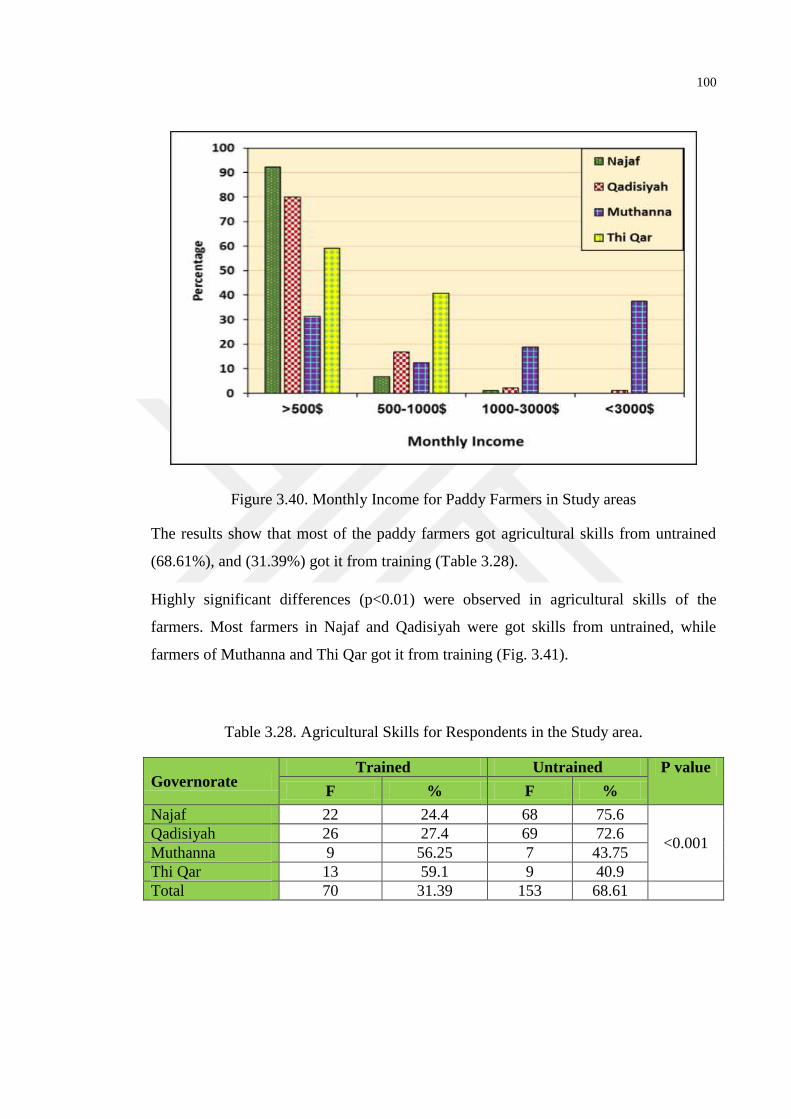
100
Figure 3.40. Monthly Income for Paddy Farmers in Study areas
The results show that most of the paddy farmers got agricultural skills from untrained
(68.61%), and (31.39%) got it from training (Table 3.28).
Highly significant differences (p<0.01) were observed in agricultural skills of the
farmers. Most farmers in Najaf and Qadisiyah were got skills from untrained, while
farmers of Muthanna and Thi Qar got it from training (Fig. 3.41).
Table 3.28. Agricultural Skills for Respondents in the Study area.
Governorate Trained Untrained P value
F % F %
Najaf 22 24.4 68 75.6
<0.001 Qadisiyah 26 27.4 69 72.6
Muthanna 9 56.25 7 43.75
Thi Qar 13 59.1 9 40.9
Total 70 31.39 153 68.61
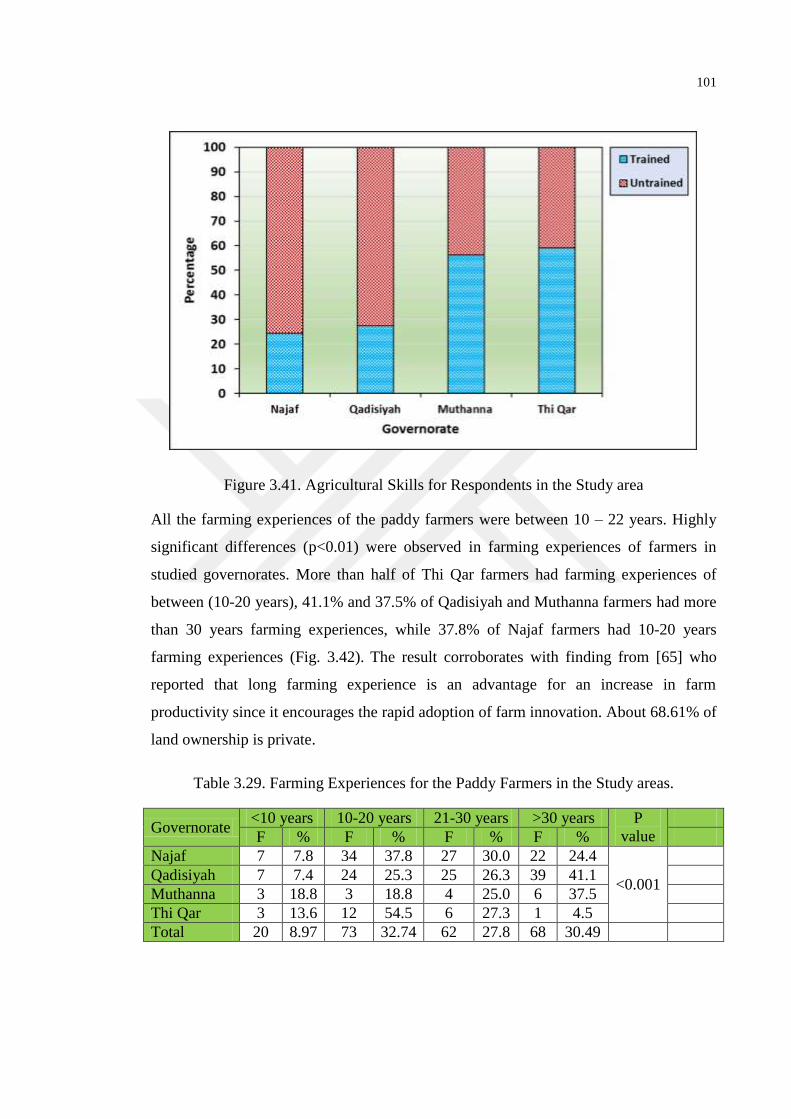
101
Figure 3.41. Agricultural Skills for Respondents in the Study area
All the farming experiences of the paddy farmers were between 10 – 22 years. Highly
significant differences (p<0.01) were observed in farming experiences of farmers in
studied governorates. More than half of Thi Qar farmers had farming experiences of
between (10-20 years), 41.1% and 37.5% of Qadisiyah and Muthanna farmers had more
than 30 years farming experiences, while 37.8% of Najaf farmers had 10-20 years
farming experiences (Fig. 3.42). The result corroborates with finding from [65] who
reported that long farming experience is an advantage for an increase in farm
productivity since it encourages the rapid adoption of farm innovation. About 68.61% of
land ownership is private.
Table 3.29. Farming Experiences for the Paddy Farmers in the Study areas.
Governorate <10 years 10-20 years 21-30 years >30 years P
value
F % F % F % F %
Najaf 7 7.8 34 37.8 27 30.0 22 24.4
<0.001
Qadisiyah 7 7.4 24 25.3 25 26.3 39 41.1
Muthanna 3 18.8 3 18.8 4 25.0 6 37.5
Thi Qar 3 13.6 12 54.5 6 27.3 1 4.5
Total 20 8.97 73 32.74 62 27.8 68 30.49
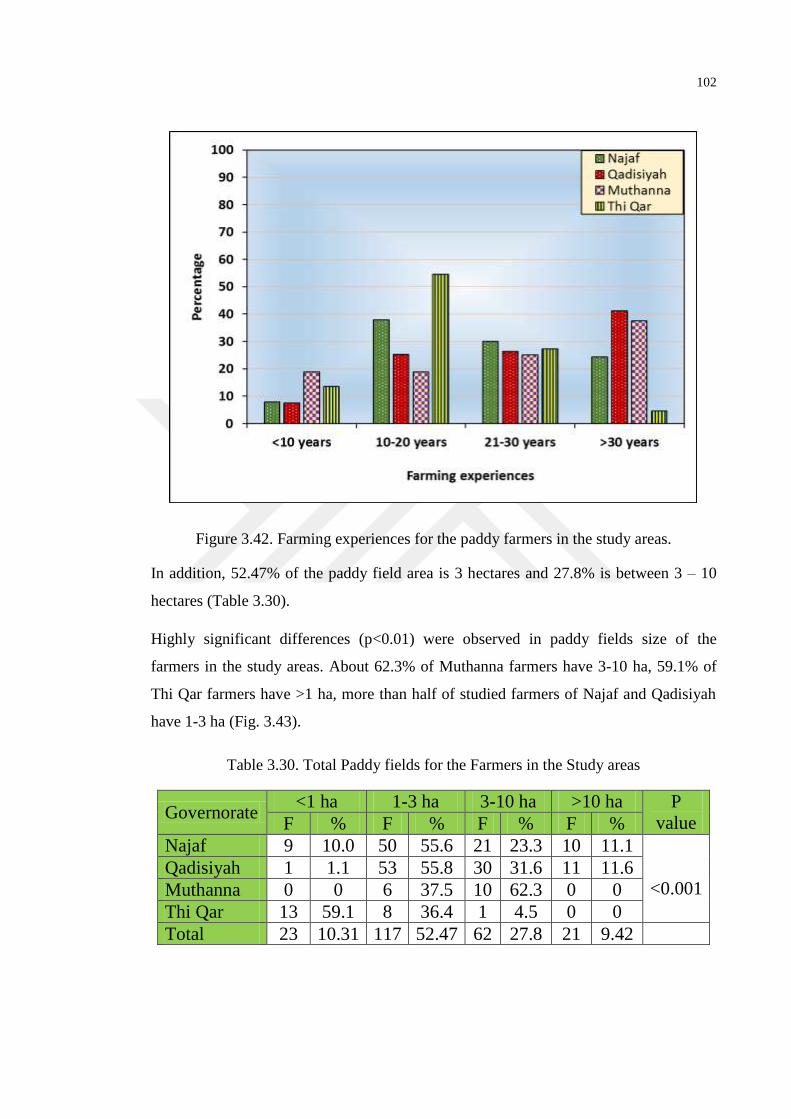
102
Figure 3.42. Farming experiences for the paddy farmers in the study areas.
In addition, 52.47% of the paddy field area is 3 hectares and 27.8% is between 3 – 10
hectares (Table 3.30).
Highly significant differences (p<0.01) were observed in paddy fields size of the
farmers in the study areas. About 62.3% of Muthanna farmers have 3-10 ha, 59.1% of
Thi Qar farmers have >1 ha, more than half of studied farmers of Najaf and Qadisiyah
have 1-3 ha (Fig. 3.43).
Table 3.30. Total Paddy fields for the Farmers in the Study areas
Governorate <1 ha 1-3 ha 3-10 ha >10 ha P
value F % F % F % F %
Najaf 9 10.0 50 55.6 21 23.3 10 11.1
<0.001 Qadisiyah 1 1.1 53 55.8 30 31.6 11 11.6
Muthanna 0 0 6 37.5 10 62.3 0 0
Thi Qar 13 59.1 8 36.4 1 4.5 0 0
Total 23 10.31 117 52.47 62 27.8 21 9.42
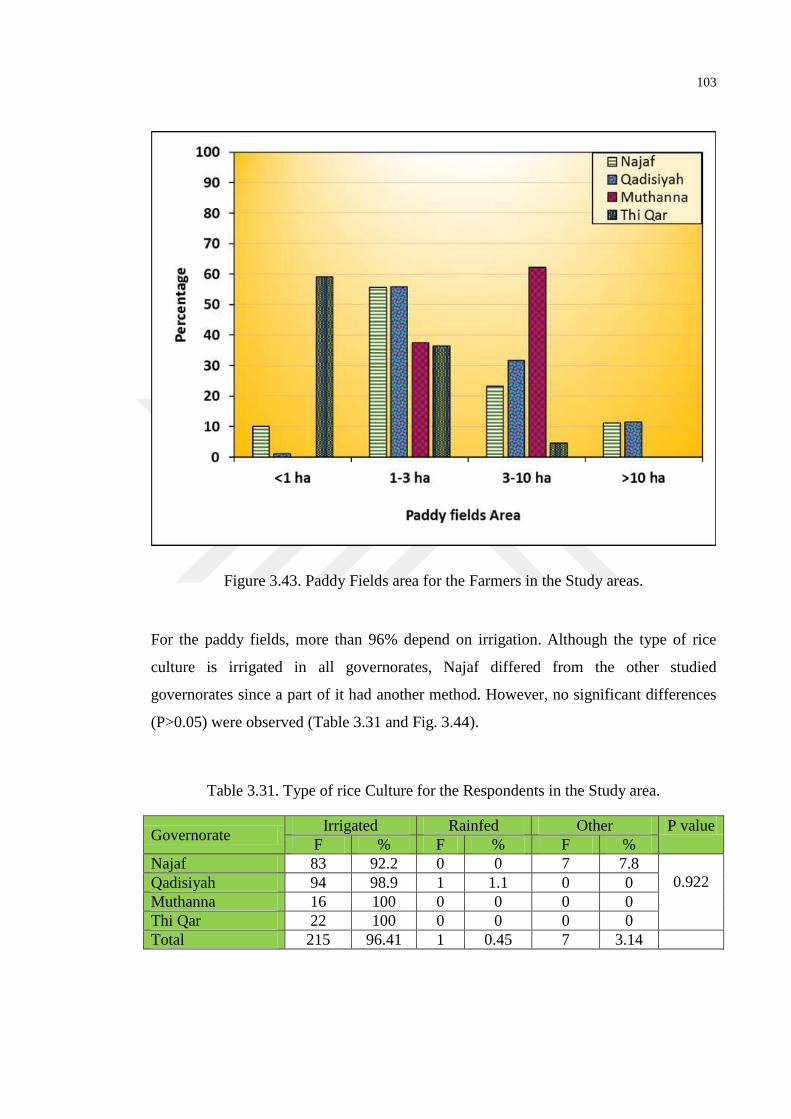
103
Figure 3.43. Paddy Fields area for the Farmers in the Study areas.
For the paddy fields, more than 96% depend on irrigation. Although the type of rice
culture is irrigated in all governorates, Najaf differed from the other studied
governorates since a part of it had another method. However, no significant differences
(P>0.05) were observed (Table 3.31 and Fig. 3.44).
Table 3.31. Type of rice Culture for the Respondents in the Study area.
Governorate Irrigated Rainfed Other P value
F % F % F %
Najaf 83 92.2 0 0 7 7.8
0.922 Qadisiyah 94 98.9 1 1.1 0 0
Muthanna 16 100 0 0 0 0
Thi Qar 22 100 0 0 0 0
Total 215 96.41 1 0.45 7 3.14
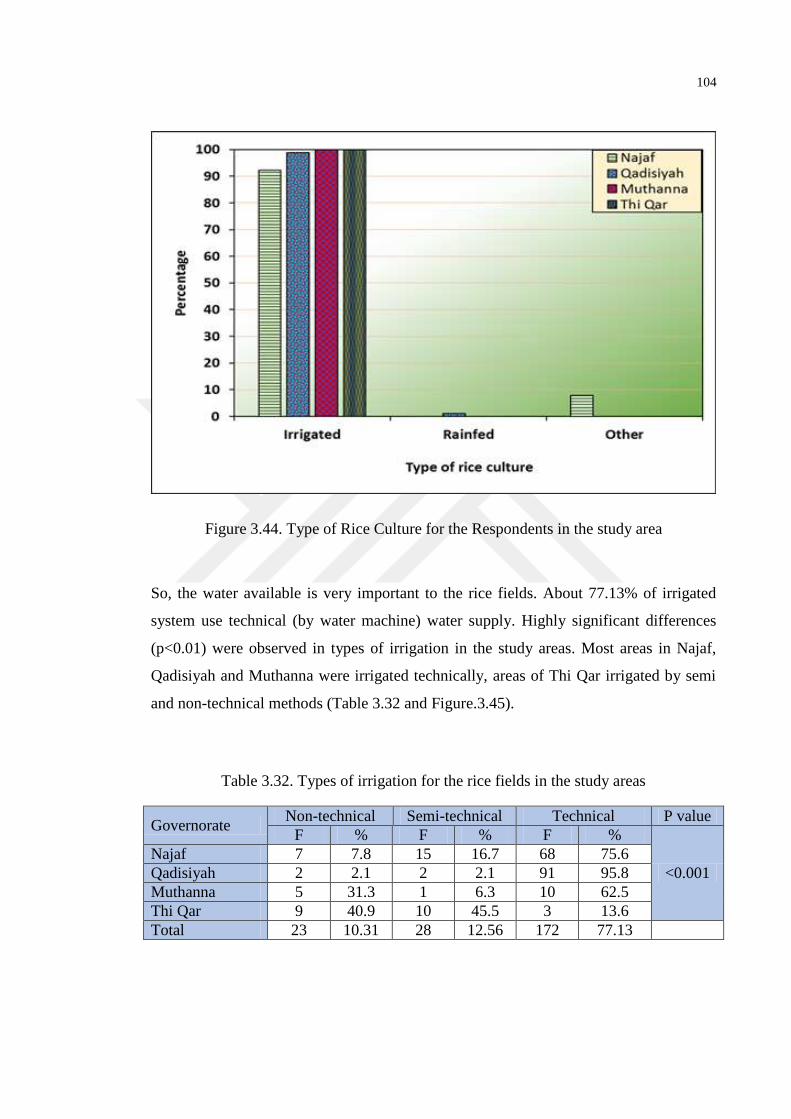
104
Figure 3.44. Type of Rice Culture for the Respondents in the study area
So, the water available is very important to the rice fields. About 77.13% of irrigated
system use technical (by water machine) water supply. Highly significant differences
(p<0.01) were observed in types of irrigation in the study areas. Most areas in Najaf,
Qadisiyah and Muthanna were irrigated technically, areas of Thi Qar irrigated by semi
and non-technical methods (Table 3.32 and Figure.3.45).
Table 3.32. Types of irrigation for the rice fields in the study areas
Governorate Non-technical Semi-technical Technical P value
F % F % F %
<0.001
Najaf 7 7.8 15 16.7 68 75.6
Qadisiyah 2 2.1 2 2.1 91 95.8
Muthanna 5 31.3 1 6.3 10 62.5
Thi Qar 9 40.9 10 45.5 3 13.6
Total 23 10.31 28 12.56 172 77.13
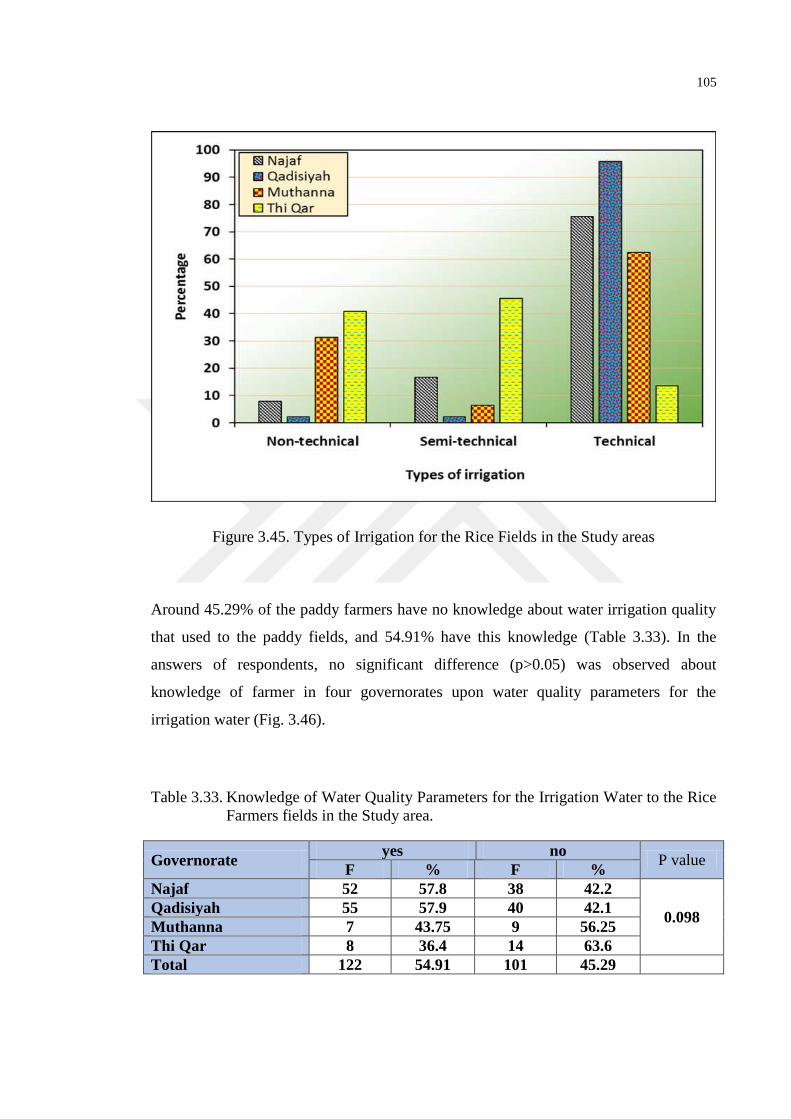
105
Figure 3.45. Types of Irrigation for the Rice Fields in the Study areas
Around 45.29% of the paddy farmers have no knowledge about water irrigation quality
that used to the paddy fields, and 54.91% have this knowledge (Table 3.33). In the
answers of respondents, no significant difference (p>0.05) was observed about
knowledge of farmer in four governorates upon water quality parameters for the
irrigation water (Fig. 3.46).
Table 3.33. Knowledge of Water Quality Parameters for the Irrigation Water to the Rice
Farmers fields in the Study area.
Governorate yes no
P value F % F %
Najaf 52 57.8 38 42.2
0.098 Qadisiyah 55 57.9 40 42.1
Muthanna 7 43.75 9 56.25
Thi Qar 8 36.4 14 63.6
Total 122 54.91 101 45.29
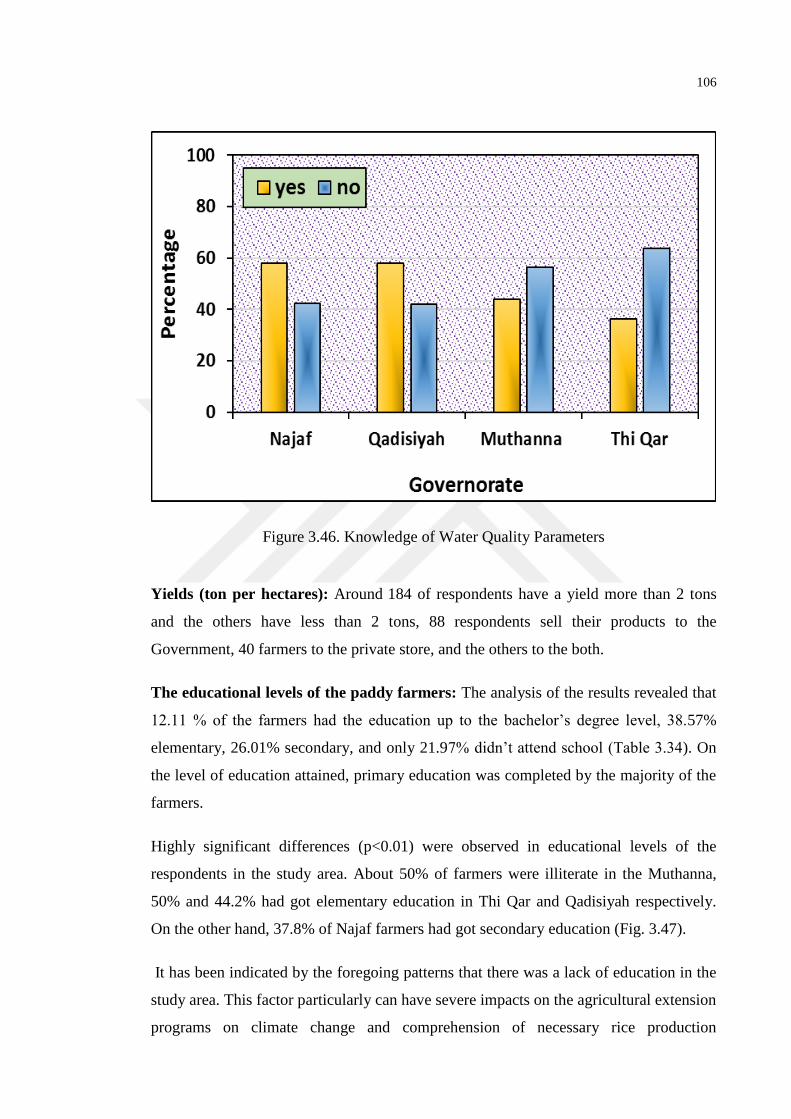
106
Figure 3.46. Knowledge of Water Quality Parameters
Yields (ton per hectares): Around 184 of respondents have a yield more than 2 tons
and the others have less than 2 tons, 88 respondents sell their products to the
Government, 40 farmers to the private store, and the others to the both.
The educational levels of the paddy farmers: The analysis of the results revealed that
12.11 % of the farmers had the education up to the bachelor’s degree level, 38.57%
elementary, 26.01% secondary, and only 21.97% didn’t attend school (Table 3.34). On
the level of education attained, primary education was completed by the majority of the
farmers.
Highly significant differences (p<0.01) were observed in educational levels of the
respondents in the study area. About 50% of farmers were illiterate in the Muthanna,
50% and 44.2% had got elementary education in Thi Qar and Qadisiyah respectively.
On the other hand, 37.8% of Najaf farmers had got secondary education (Fig. 3.47).
It has been indicated by the foregoing patterns that there was a lack of education in the
study area. This factor particularly can have severe impacts on the agricultural extension
programs on climate change and comprehension of necessary rice production
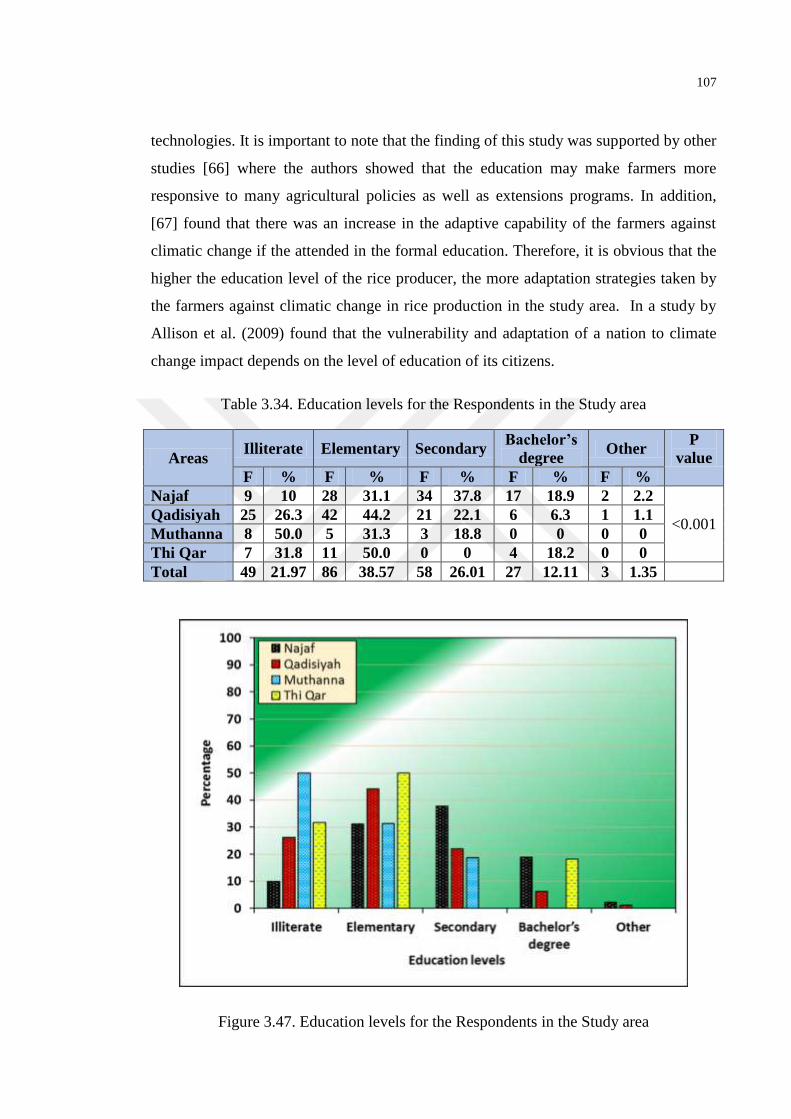
107
technologies. It is important to note that the finding of this study was supported by other
studies [66] where the authors showed that the education may make farmers more
responsive to many agricultural policies as well as extensions programs. In addition,
[67] found that there was an increase in the adaptive capability of the farmers against
climatic change if the attended in the formal education. Therefore, it is obvious that the
higher the education level of the rice producer, the more adaptation strategies taken by
the farmers against climatic change in rice production in the study area. In a study by
Allison et al. (2009) found that the vulnerability and adaptation of a nation to climate
change impact depends on the level of education of its citizens.
Table 3.34. Education levels for the Respondents in the Study area
Areas Illiterate Elementary Secondary
Bachelor’s
degree Other
P
value
F % F % F % F % F %
Najaf 9 10 28 31.1 34 37.8 17 18.9 2 2.2
<0.001 Qadisiyah 25 26.3 42 44.2 21 22.1 6 6.3 1 1.1
Muthanna 8 50.0 5 31.3 3 18.8 0 0 0 0
Thi Qar 7 31.8 11 50.0 0 0 4 18.2 0 0
Total 49 21.97 86 38.57 58 26.01 27 12.11 3 1.35
Figure 3.47. Education levels for the Respondents in the Study area
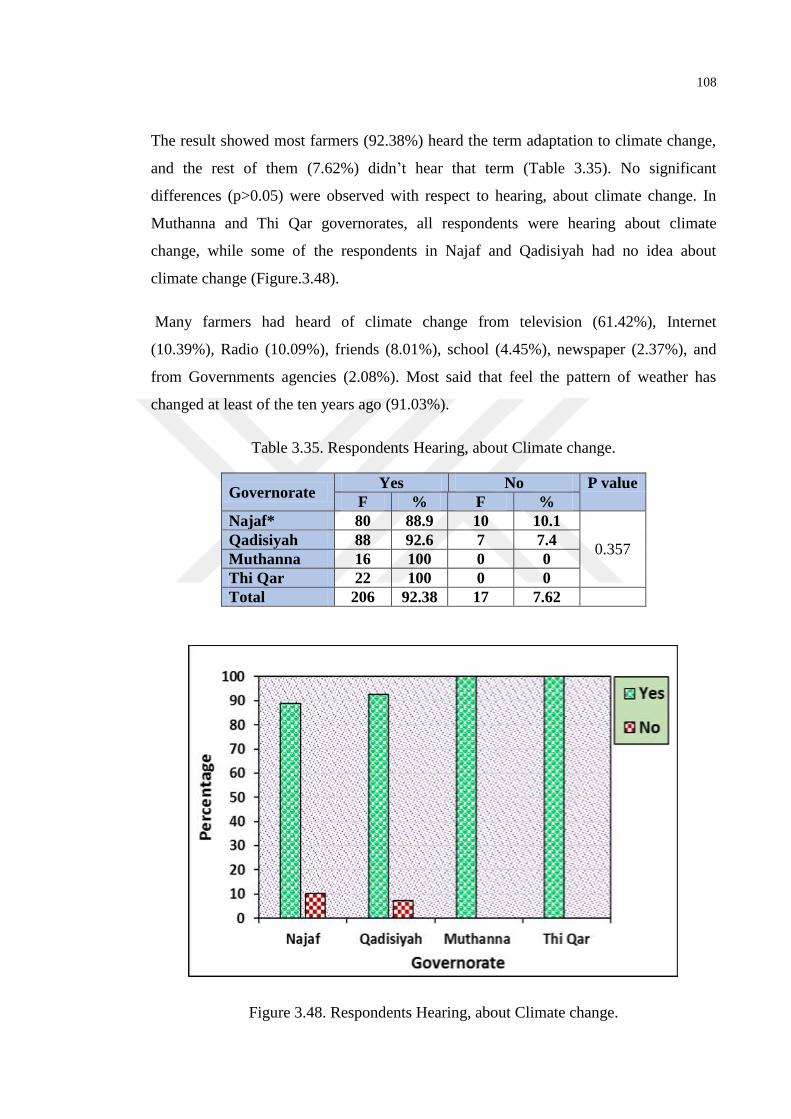
108
The result showed most farmers (92.38%) heard the term adaptation to climate change,
and the rest of them (7.62%) didn’t hear that term (Table 3.35). No significant
differences (p>0.05) were observed with respect to hearing, about climate change. In
Muthanna and Thi Qar governorates, all respondents were hearing about climate
change, while some of the respondents in Najaf and Qadisiyah had no idea about
climate change (Figure.3.48).
Many farmers had heard of climate change from television (61.42%), Internet
(10.39%), Radio (10.09%), friends (8.01%), school (4.45%), newspaper (2.37%), and
from Governments agencies (2.08%). Most said that feel the pattern of weather has
changed at least of the ten years ago (91.03%).
Table 3.35. Respondents Hearing, about Climate change.
Governorate Yes No P value
F % F %
Najaf* 80 88.9 10 10.1
0.357 Qadisiyah 88 92.6 7 7.4
Muthanna 16 100 0 0
Thi Qar 22 100 0 0
Total 206 92.38 17 7.62
Figure 3.48. Respondents Hearing, about Climate change.
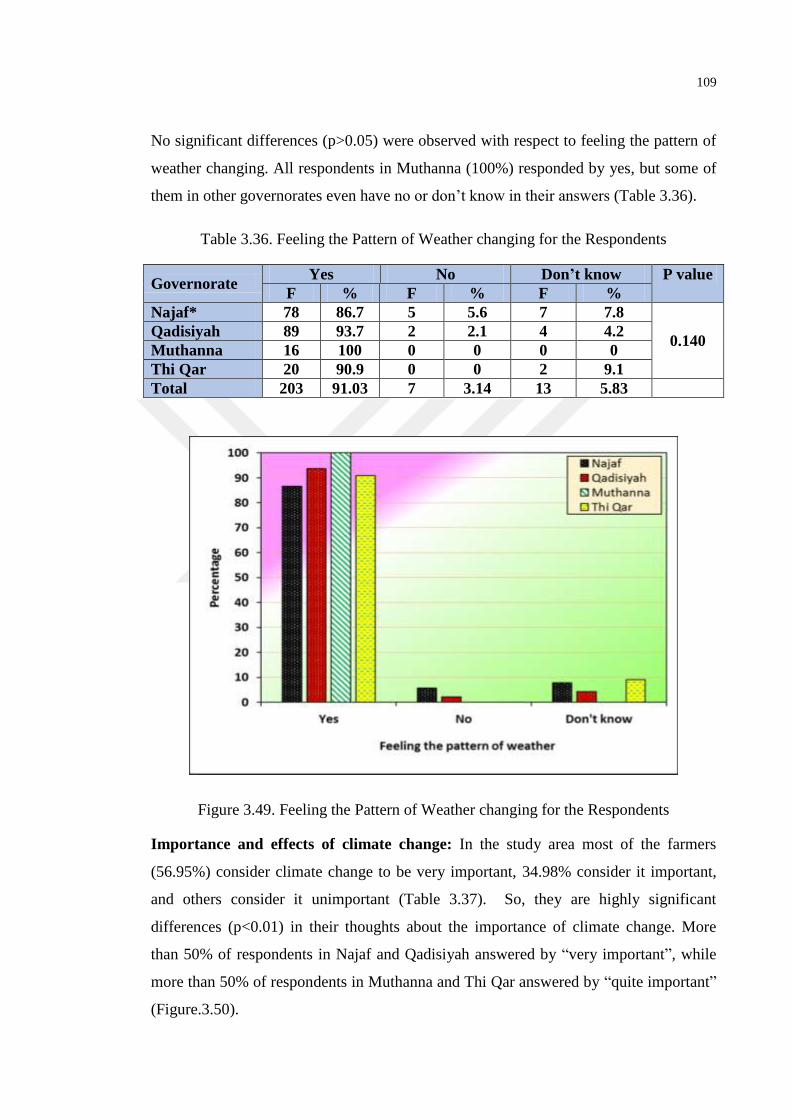
109
No significant differences (p>0.05) were observed with respect to feeling the pattern of
weather changing. All respondents in Muthanna (100%) responded by yes, but some of
them in other governorates even have no or don’t know in their answers (Table 3.36).
Table 3.36. Feeling the Pattern of Weather changing for the Respondents
Governorate Yes No Don’t know P value
F % F % F %
Najaf* 78 86.7 5 5.6 7 7.8
0.140 Qadisiyah 89 93.7 2 2.1 4 4.2
Muthanna 16 100 0 0 0 0
Thi Qar 20 90.9 0 0 2 9.1
Total 203 91.03 7 3.14 13 5.83
Figure 3.49. Feeling the Pattern of Weather changing for the Respondents
Importance and effects of climate change: In the study area most of the farmers
(56.95%) consider climate change to be very important, 34.98% consider it important,
and others consider it unimportant (Table 3.37). So, they are highly significant
differences (p<0.01) in their thoughts about the importance of climate change. More
than 50% of respondents in Najaf and Qadisiyah answered by ―very important‖, while
more than 50% of respondents in Muthanna and Thi Qar answered by ―quite important‖
(Figure.3.50).
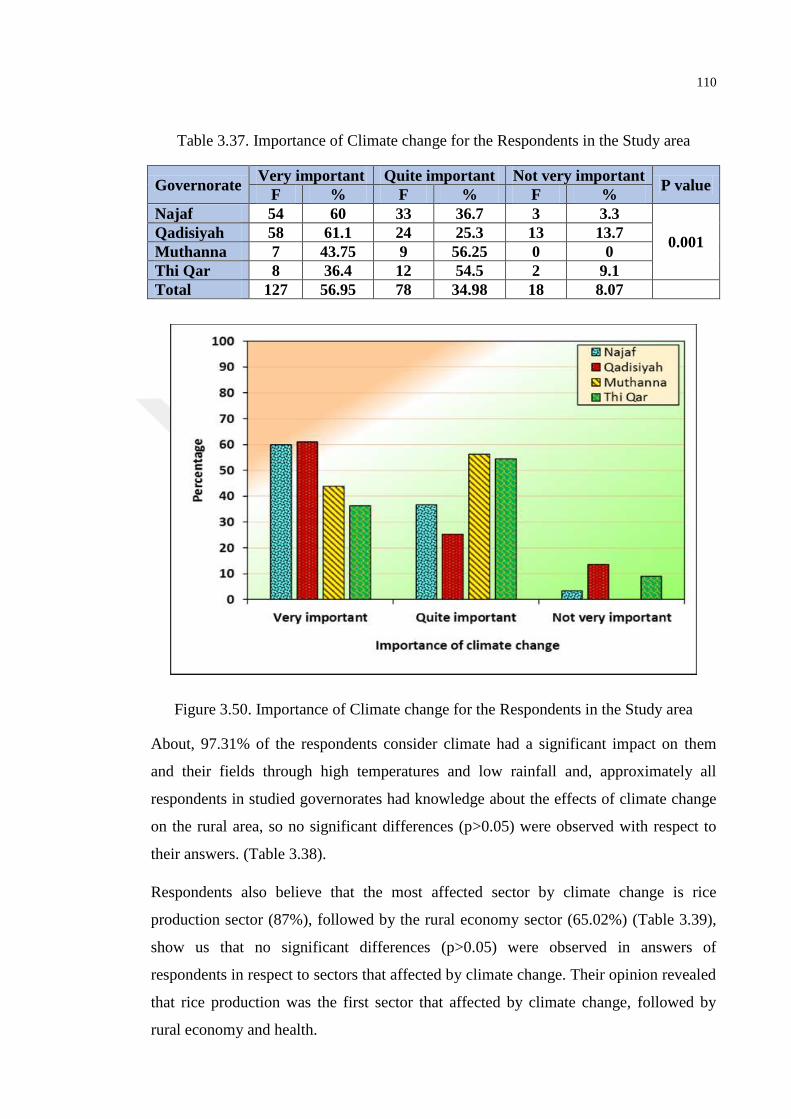
110
Table 3.37. Importance of Climate change for the Respondents in the Study area
Governorate Very important Quite important Not very important
P value F % F % F %
Najaf 54 60 33 36.7 3 3.3
0.001 Qadisiyah 58 61.1 24 25.3 13 13.7
Muthanna 7 43.75 9 56.25 0 0
Thi Qar 8 36.4 12 54.5 2 9.1
Total 127 56.95 78 34.98 18 8.07
Figure 3.50. Importance of Climate change for the Respondents in the Study area
About, 97.31% of the respondents consider climate had a significant impact on them
and their fields through high temperatures and low rainfall and, approximately all
respondents in studied governorates had knowledge about the effects of climate change
on the rural area, so no significant differences (p>0.05) were observed with respect to
their answers. (Table 3.38).
Respondents also believe that the most affected sector by climate change is rice
production sector (87%), followed by the rural economy sector (65.02%) (Table 3.39),
show us that no significant differences (p>0.05) were observed in answers of
respondents in respect to sectors that affected by climate change. Their opinion revealed
that rice production was the first sector that affected by climate change, followed by
rural economy and health.
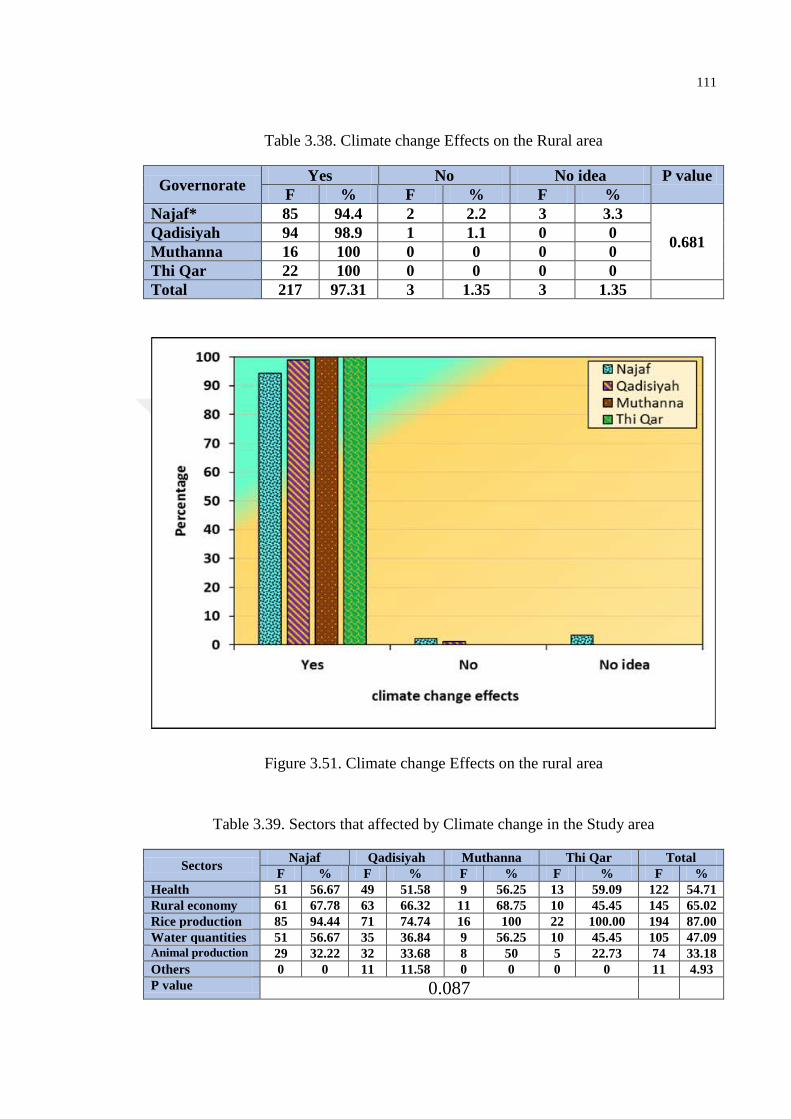
111
Table 3.38. Climate change Effects on the Rural area
Governorate Yes No No idea P value
F % F % F %
Najaf* 85 94.4 2 2.2 3 3.3
0.681 Qadisiyah 94 98.9 1 1.1 0 0
Muthanna 16 100 0 0 0 0
Thi Qar 22 100 0 0 0 0
Total 217 97.31 3 1.35 3 1.35
Figure 3.51. Climate change Effects on the rural area
Table 3.39. Sectors that affected by Climate change in the Study area
Sectors Najaf Qadisiyah Muthanna Thi Qar Total
F % F % F % F % F %
Health 51 56.67 49 51.58 9 56.25 13 59.09 122 54.71
Rural economy 61 67.78 63 66.32 11 68.75 10 45.45 145 65.02
Rice production 85 94.44 71 74.74 16 100 22 100.00 194 87.00
Water quantities 51 56.67 35 36.84 9 56.25 10 45.45 105 47.09
Animal production 29 32.22 32 33.68 8 50 5 22.73 74 33.18
Others 0 0 11 11.58 0 0 0 0 11 4.93
P value 0.087
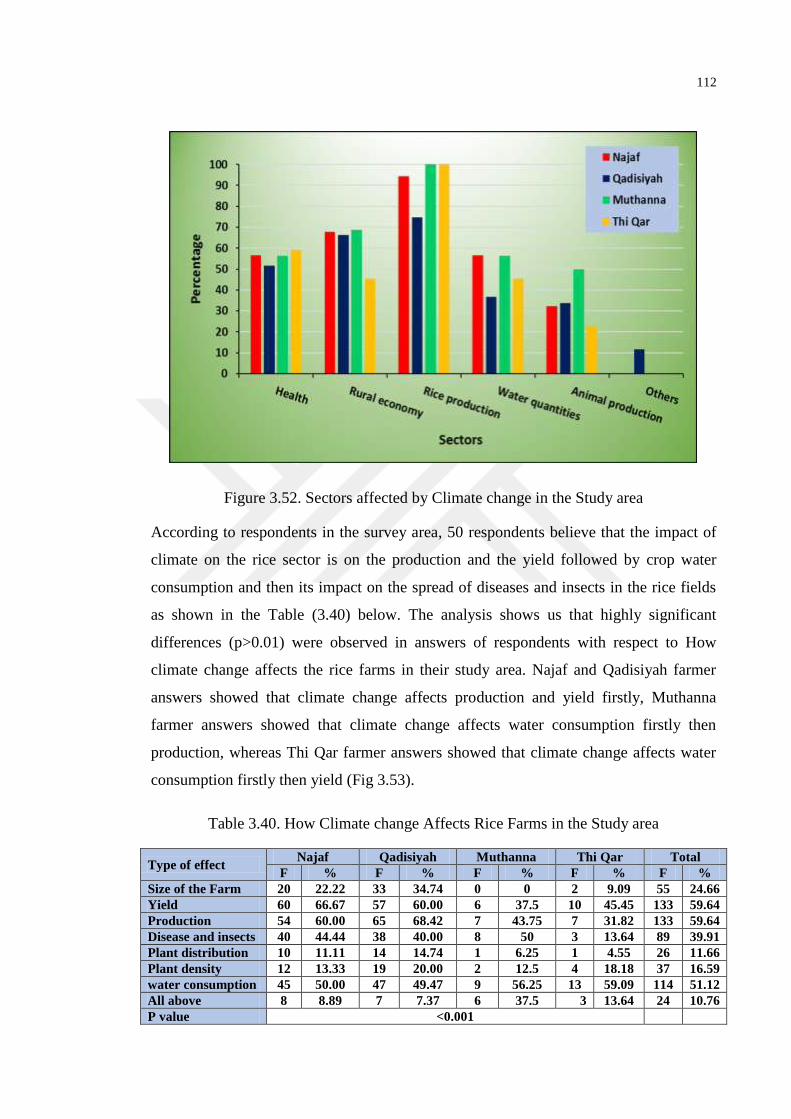
112
Figure 3.52. Sectors affected by Climate change in the Study area
According to respondents in the survey area, 50 respondents believe that the impact of
climate on the rice sector is on the production and the yield followed by crop water
consumption and then its impact on the spread of diseases and insects in the rice fields
as shown in the Table (3.40) below. The analysis shows us that highly significant
differences (p>0.01) were observed in answers of respondents with respect to How
climate change affects the rice farms in their study area. Najaf and Qadisiyah farmer
answers showed that climate change affects production and yield firstly, Muthanna
farmer answers showed that climate change affects water consumption firstly then
production, whereas Thi Qar farmer answers showed that climate change affects water
consumption firstly then yield (Fig 3.53).
Table 3.40. How Climate change Affects Rice Farms in the Study area
Type of effect Najaf Qadisiyah Muthanna Thi Qar Total
F % F % F % F % F %
Size of the Farm 20 22.22 33 34.74 0 0 2 9.09 55 24.66
Yield 60 66.67 57 60.00 6 37.5 10 45.45 133 59.64
Production 54 60.00 65 68.42 7 43.75 7 31.82 133 59.64
Disease and insects 40 44.44 38 40.00 8 50 3 13.64 89 39.91
Plant distribution 10 11.11 14 14.74 1 6.25 1 4.55 26 11.66
Plant density 12 13.33 19 20.00 2 12.5 4 18.18 37 16.59
water consumption 45 50.00 47 49.47 9 56.25 13 59.09 114 51.12
All above 8 8.89 7 7.37 6 37.5 3 13.64 24 10.76
P value <0.001
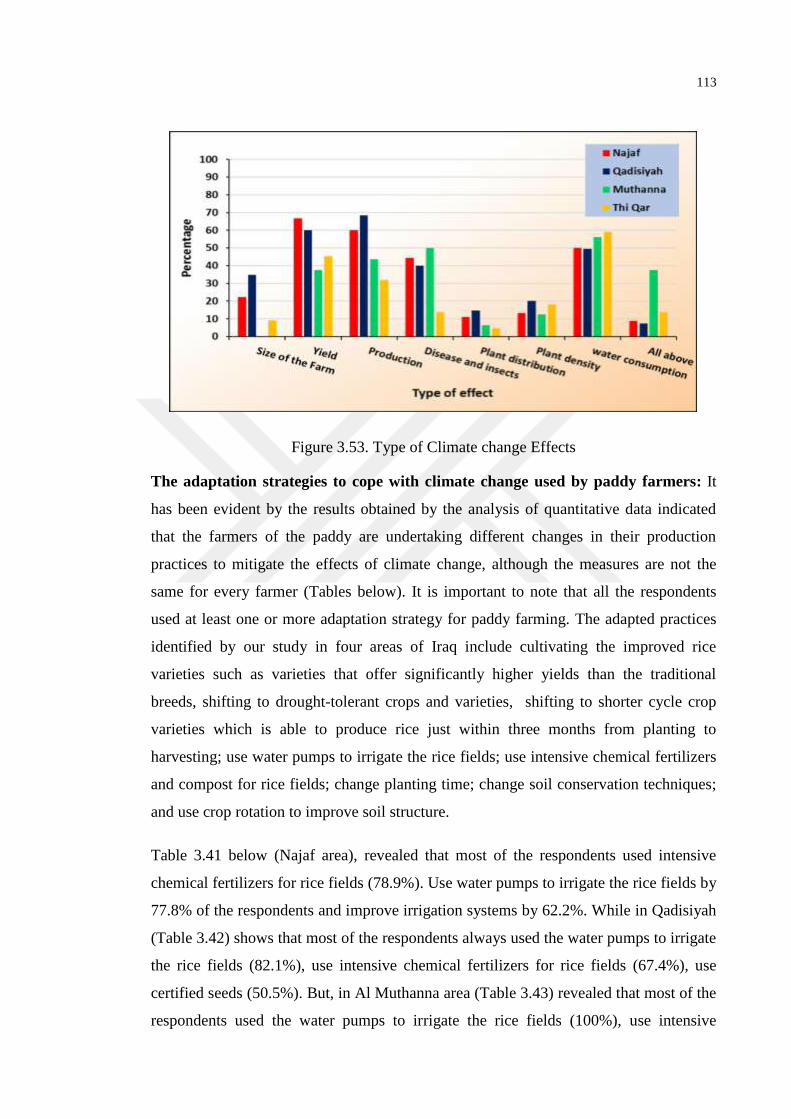
113
Figure 3.53. Type of Climate change Effects
The adaptation strategies to cope with climate change used by paddy farmers: It
has been evident by the results obtained by the analysis of quantitative data indicated
that the farmers of the paddy are undertaking different changes in their production
practices to mitigate the effects of climate change, although the measures are not the
same for every farmer (Tables below). It is important to note that all the respondents
used at least one or more adaptation strategy for paddy farming. The adapted practices
identified by our study in four areas of Iraq include cultivating the improved rice
varieties such as varieties that offer significantly higher yields than the traditional
breeds, shifting to drought-tolerant crops and varieties, shifting to shorter cycle crop
varieties which is able to produce rice just within three months from planting to
harvesting; use water pumps to irrigate the rice fields; use intensive chemical fertilizers
and compost for rice fields; change planting time; change soil conservation techniques;
and use crop rotation to improve soil structure.
Table 3.41 below (Najaf area), revealed that most of the respondents used intensive
chemical fertilizers for rice fields (78.9%). Use water pumps to irrigate the rice fields by
77.8% of the respondents and improve irrigation systems by 62.2%. While in Qadisiyah
(Table 3.42) shows that most of the respondents always used the water pumps to irrigate
the rice fields (82.1%), use intensive chemical fertilizers for rice fields (67.4%), use
certified seeds (50.5%). But, in Al Muthanna area (Table 3.43) revealed that most of the
respondents used the water pumps to irrigate the rice fields (100%), use intensive
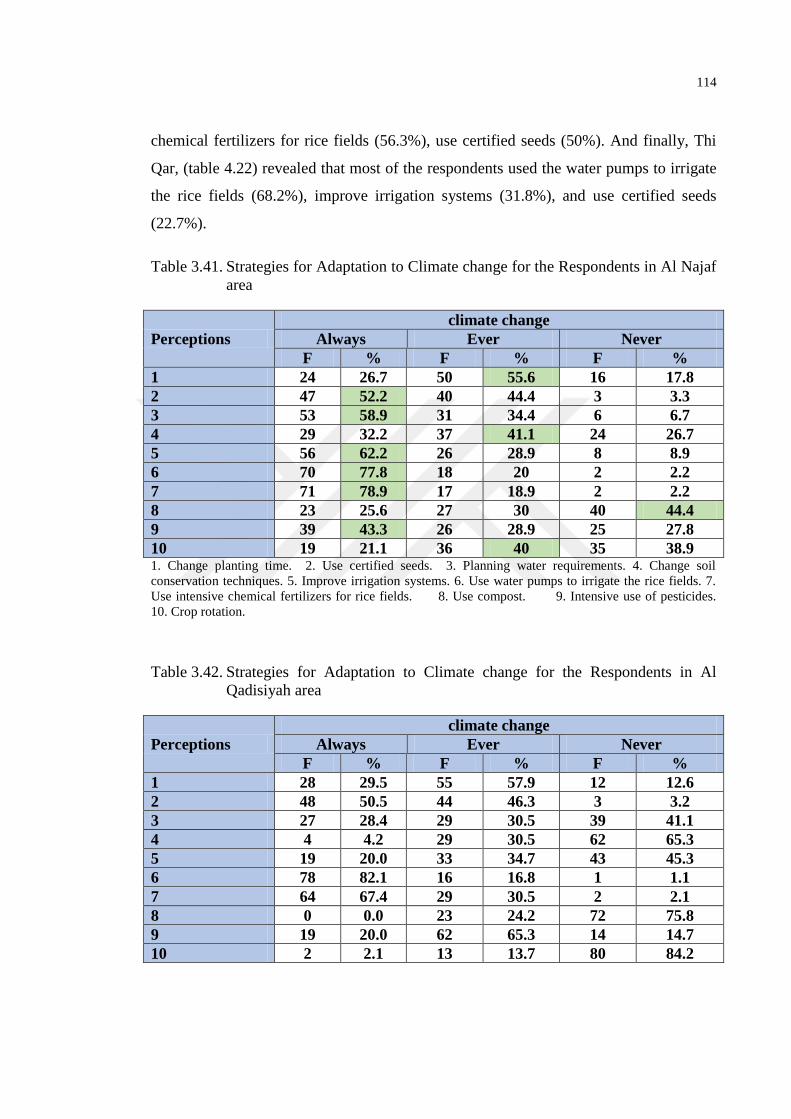
114
chemical fertilizers for rice fields (56.3%), use certified seeds (50%). And finally, Thi
Qar, (table 4.22) revealed that most of the respondents used the water pumps to irrigate
the rice fields (68.2%), improve irrigation systems (31.8%), and use certified seeds
(22.7%).
Table 3.41. Strategies for Adaptation to Climate change for the Respondents in Al Najaf
area
Perceptions
climate change
Always Ever Never
F % F % F %
1 24 26.7 50 55.6 16 17.8
2 47 52.2 40 44.4 3 3.3
3 53 58.9 31 34.4 6 6.7
4 29 32.2 37 41.1 24 26.7
5 56 62.2 26 28.9 8 8.9
6 70 77.8 18 20 2 2.2
7 71 78.9 17 18.9 2 2.2
8 23 25.6 27 30 40 44.4
9 39 43.3 26 28.9 25 27.8
10 19 21.1 36 40 35 38.9 1. Change planting time. 2. Use certified seeds. 3. Planning water requirements. 4. Change soil
conservation techniques. 5. Improve irrigation systems. 6. Use water pumps to irrigate the rice fields. 7.
Use intensive chemical fertilizers for rice fields. 8. Use compost. 9. Intensive use of pesticides.
10. Crop rotation.
Table 3.42. Strategies for Adaptation to Climate change for the Respondents in Al
Qadisiyah area
Perceptions
climate change
Always Ever Never
F % F % F %
1 28 29.5 55 57.9 12 12.6
2 48 50.5 44 46.3 3 3.2
3 27 28.4 29 30.5 39 41.1
4 4 4.2 29 30.5 62 65.3
5 19 20.0 33 34.7 43 45.3
6 78 82.1 16 16.8 1 1.1
7 64 67.4 29 30.5 2 2.1
8 0 0.0 23 24.2 72 75.8
9 19 20.0 62 65.3 14 14.7
10 2 2.1 13 13.7 80 84.2
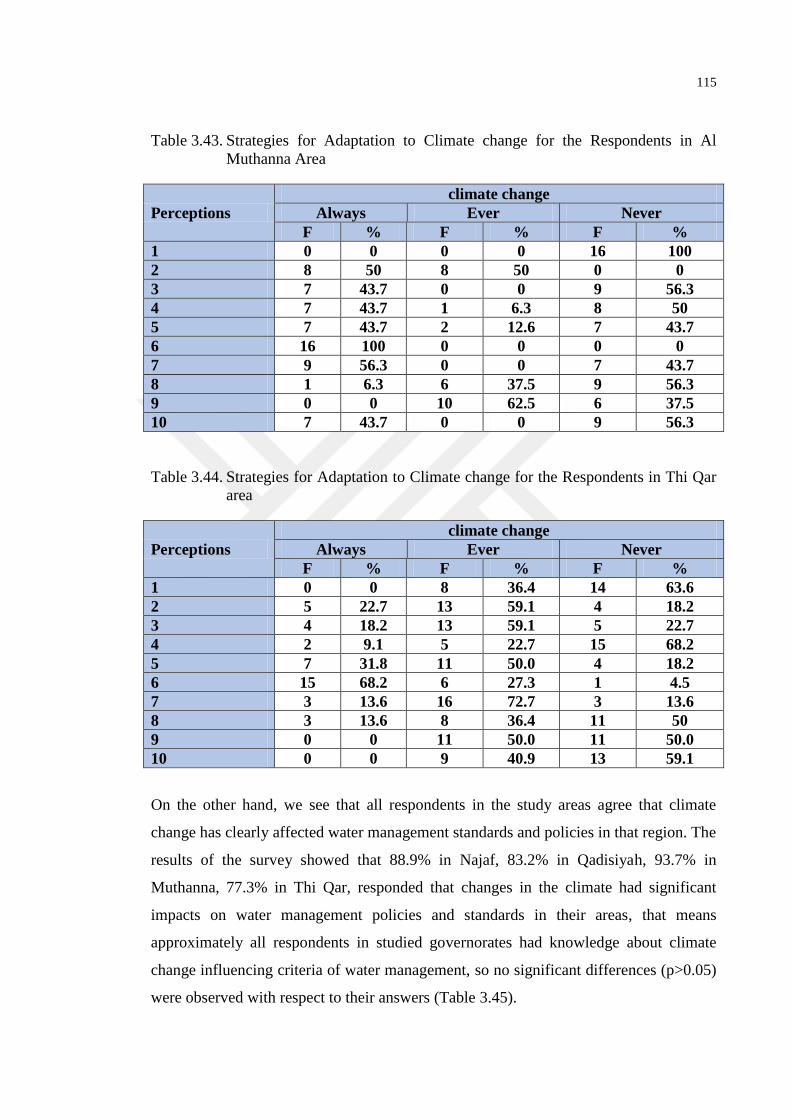
115
Table 3.43. Strategies for Adaptation to Climate change for the Respondents in Al
Muthanna Area
Perceptions
climate change
Always Ever Never
F % F % F %
1 0 0 0 0 16 100
2 8 50 8 50 0 0
3 7 43.7 0 0 9 56.3
4 7 43.7 1 6.3 8 50
5 7 43.7 2 12.6 7 43.7
6 16 100 0 0 0 0
7 9 56.3 0 0 7 43.7
8 1 6.3 6 37.5 9 56.3
9 0 0 10 62.5 6 37.5
10 7 43.7 0 0 9 56.3
Table 3.44. Strategies for Adaptation to Climate change for the Respondents in Thi Qar
area
Perceptions
climate change
Always Ever Never
F % F % F %
1 0 0 8 36.4 14 63.6
2 5 22.7 13 59.1 4 18.2
3 4 18.2 13 59.1 5 22.7
4 2 9.1 5 22.7 15 68.2
5 7 31.8 11 50.0 4 18.2
6 15 68.2 6 27.3 1 4.5
7 3 13.6 16 72.7 3 13.6
8 3 13.6 8 36.4 11 50
9 0 0 11 50.0 11 50.0
10 0 0 9 40.9 13 59.1
On the other hand, we see that all respondents in the study areas agree that climate
change has clearly affected water management standards and policies in that region. The
results of the survey showed that 88.9% in Najaf, 83.2% in Qadisiyah, 93.7% in
Muthanna, 77.3% in Thi Qar, responded that changes in the climate had significant
impacts on water management policies and standards in their areas, that means
approximately all respondents in studied governorates had knowledge about climate
change influencing criteria of water management, so no significant differences (p>0.05)
were observed with respect to their answers (Table 3.45).

116
Table 3.45. Climate change Influencing Criteria of Water Management
Governorate Yes No Don’t know P value
F % F % F %
Najaf 80 88.9 4 4.3 6 6.7
0.964 Qadisiyah 79 83.2 4 4.3 12 12.6
Muthanna 15 93.7 1 6.3 0 0
Thi Qar 17 77.3 0 0 5 22.7
Total 191 85.65 9 4.04 23 10.31
Figure 3.54. Climate change Influencing Criteria of Water Management
It is clearly evident from the current study that the paddy producers have different, in
most cases negative, opinion/attitude regarding the current status of the climatic
condition during the period and witnessed many changes in the climatic condition that
took place in the region over the time. This means that the hypothesis that made in the
first chapter is fully consistent with the findings of analyzed data and the results of the
questionnaire analysis about the impacts of climatic change on the Rural people,
production of rice and water quantities, because of, the production of paddy remains a
primary income source in the selected areas as well as in the rural communities in Iraq.
Data analysis and the obtained results from the questionnaire clearly showed a rise in
temperature with a very low rainfall. This change affected the yield of rice as well as
water quantities.
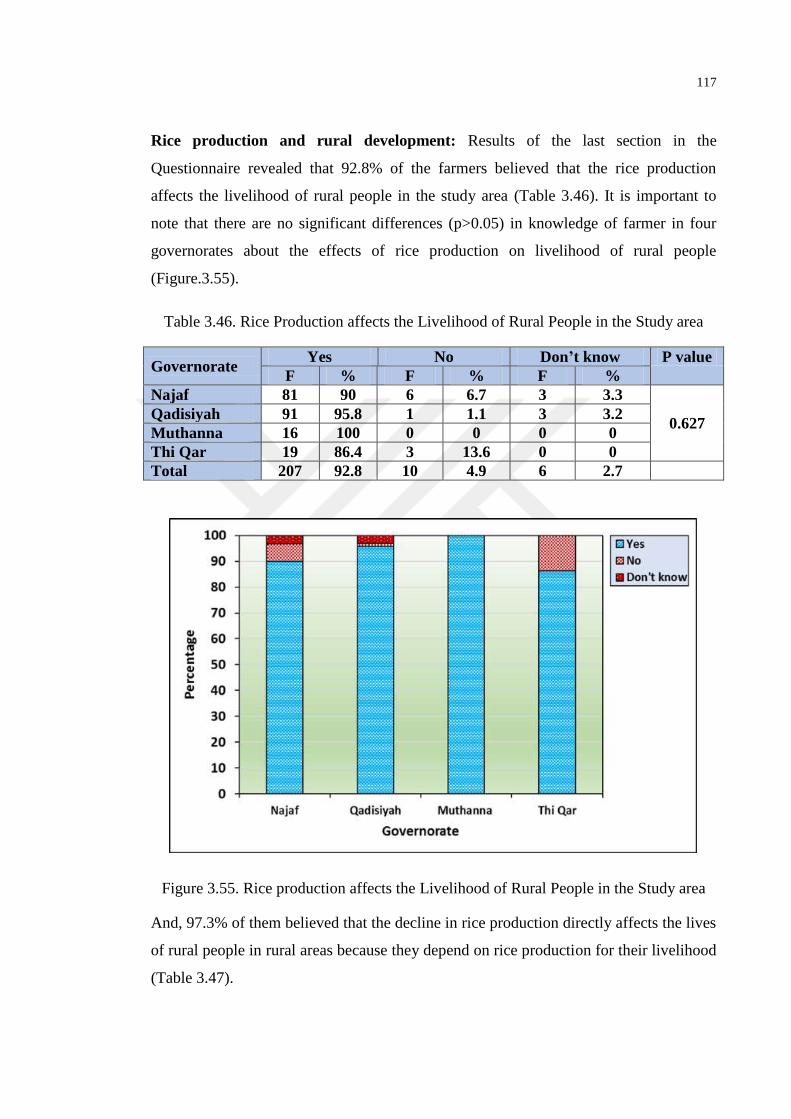
117
Rice production and rural development: Results of the last section in the
Questionnaire revealed that 92.8% of the farmers believed that the rice production
affects the livelihood of rural people in the study area (Table 3.46). It is important to
note that there are no significant differences (p>0.05) in knowledge of farmer in four
governorates about the effects of rice production on livelihood of rural people
(Figure.3.55).
Table 3.46. Rice Production affects the Livelihood of Rural People in the Study area
Governorate Yes No Don’t know P value
F % F % F %
Najaf 81 90 6 6.7 3 3.3
0.627 Qadisiyah 91 95.8 1 1.1 3 3.2
Muthanna 16 100 0 0 0 0
Thi Qar 19 86.4 3 13.6 0 0
Total 207 92.8 10 4.9 6 2.7
Figure 3.55. Rice production affects the Livelihood of Rural People in the Study area
And, 97.3% of them believed that the decline in rice production directly affects the lives
of rural people in rural areas because they depend on rice production for their livelihood
(Table 3.47).

118
So, there are no significant differences (p>0.05) in knowledge of farmer in four
governorates about effects of declining rice productions on the rural area (Figure. 3.56).
Table 3.47. Decline in Rice Production affects the Rural area
Governorate Yes No Don’t know P value
F % F % F %
Najaf 88 97.8 2 2.2 0 0
0.795 Qadisiyah 95 100 0 0 0 0
Muthanna 16 100 0 0 0 0
Thi Qar 18 81.8 4 18.2 0 0
Total 217 97.3 6 2.7 0 0
Figure 3.56. The Decline in Rice Production Affects the Rural Area
Effects of declining rice production on the rural area was identified as poverty (74.4%),
migration (45.74%), and health deterioration (13%) (Table 3.48). A higher level of
significant differences (p>0.01) was seen in answers of respondents with respect to how
the decline in rice production affects the rural people in the study area. Most Najaf and
Thi Qar farmers thought that decline in rice production leads to poverty, Qadisiyah
farmers thought that decline in rice production leads to poverty and migration, While
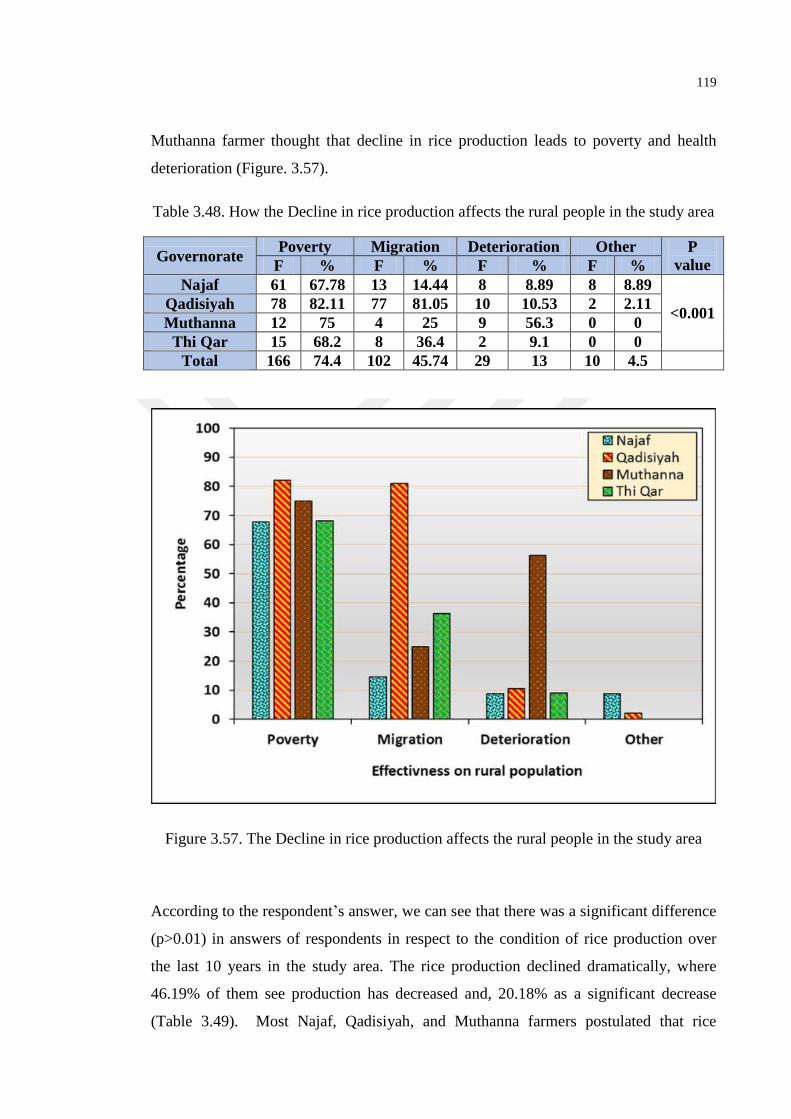
119
Muthanna farmer thought that decline in rice production leads to poverty and health
deterioration (Figure. 3.57).
Table 3.48. How the Decline in rice production affects the rural people in the study area
Governorate Poverty Migration Deterioration Other P
value F % F % F % F %
Najaf 61 67.78 13 14.44 8 8.89 8 8.89
<0.001 Qadisiyah 78 82.11 77 81.05 10 10.53 2 2.11
Muthanna 12 75 4 25 9 56.3 0 0
Thi Qar 15 68.2 8 36.4 2 9.1 0 0
Total 166 74.4 102 45.74 29 13 10 4.5
Figure 3.57. The Decline in rice production affects the rural people in the study area
According to the respondent’s answer, we can see that there was a significant difference
(p>0.01) in answers of respondents in respect to the condition of rice production over
the last 10 years in the study area. The rice production declined dramatically, where
46.19% of them see production has decreased and, 20.18% as a significant decrease
(Table 3.49). Most Najaf, Qadisiyah, and Muthanna farmers postulated that rice
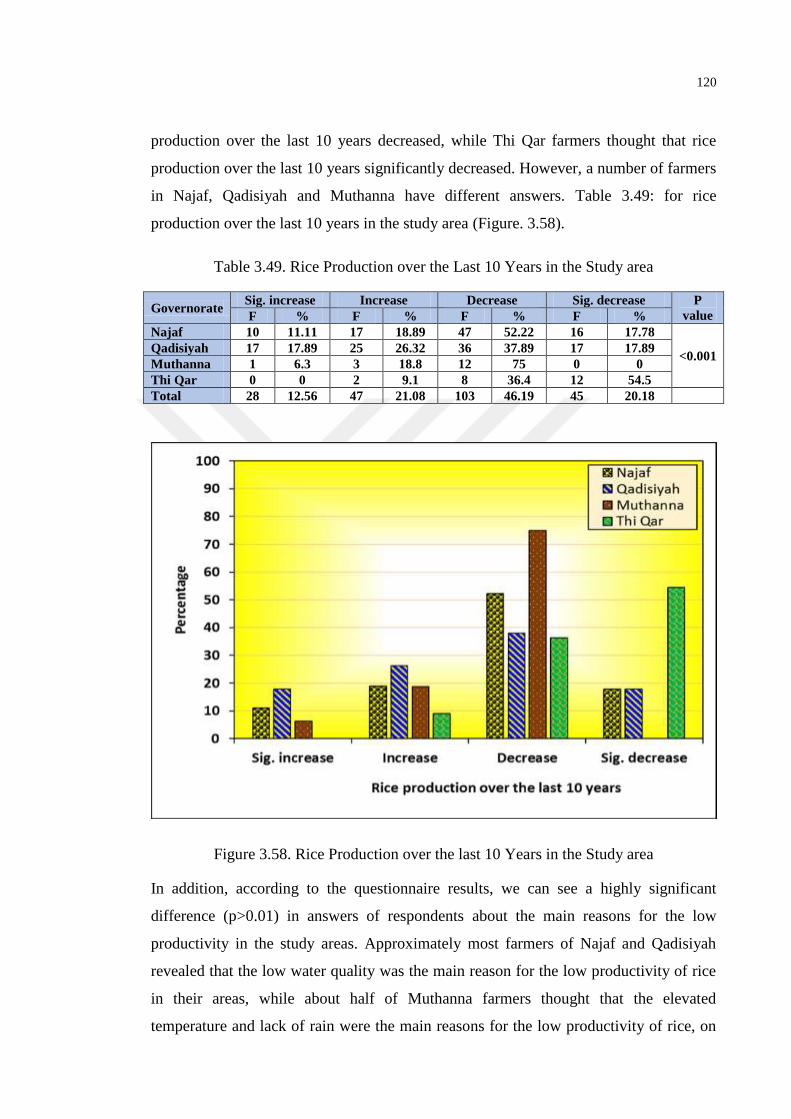
120
production over the last 10 years decreased, while Thi Qar farmers thought that rice
production over the last 10 years significantly decreased. However, a number of farmers
in Najaf, Qadisiyah and Muthanna have different answers. Table 3.49: for rice
production over the last 10 years in the study area (Figure. 3.58).
Table 3.49. Rice Production over the Last 10 Years in the Study area
Governorate Sig. increase Increase Decrease Sig. decrease P
value F % F % F % F %
Najaf 10 11.11 17 18.89 47 52.22 16 17.78
<0.001 Qadisiyah 17 17.89 25 26.32 36 37.89 17 17.89
Muthanna 1 6.3 3 18.8 12 75 0 0
Thi Qar 0 0 2 9.1 8 36.4 12 54.5
Total 28 12.56 47 21.08 103 46.19 45 20.18
Figure 3.58. Rice Production over the last 10 Years in the Study area
In addition, according to the questionnaire results, we can see a highly significant
difference (p>0.01) in answers of respondents about the main reasons for the low
productivity in the study areas. Approximately most farmers of Najaf and Qadisiyah
revealed that the low water quality was the main reason for the low productivity of rice
in their areas, while about half of Muthanna farmers thought that the elevated
temperature and lack of rain were the main reasons for the low productivity of rice, on
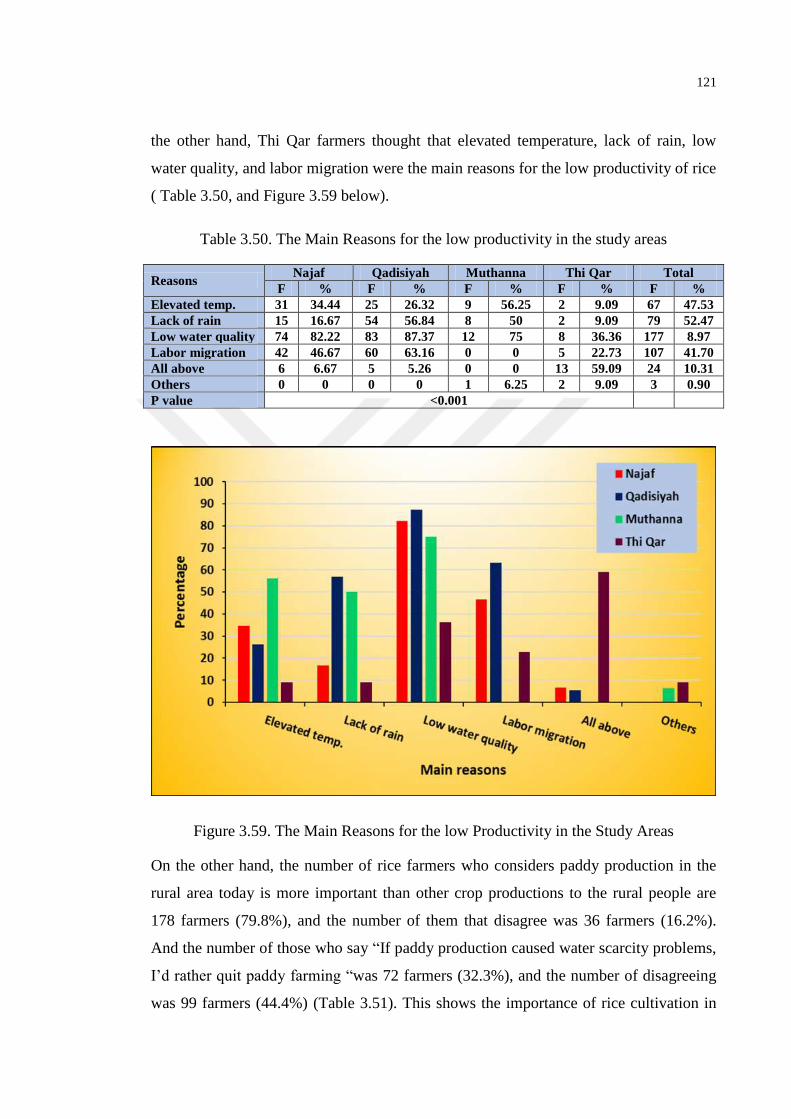
121
the other hand, Thi Qar farmers thought that elevated temperature, lack of rain, low
water quality, and labor migration were the main reasons for the low productivity of rice
( Table 3.50, and Figure 3.59 below).
Table 3.50. The Main Reasons for the low productivity in the study areas
Reasons Najaf Qadisiyah Muthanna Thi Qar Total
F % F % F % F % F %
Elevated temp. 31 34.44 25 26.32 9 56.25 2 9.09 67 47.53
Lack of rain 15 16.67 54 56.84 8 50 2 9.09 79 52.47
Low water quality 74 82.22 83 87.37 12 75 8 36.36 177 8.97
Labor migration 42 46.67 60 63.16 0 0 5 22.73 107 41.70
All above 6 6.67 5 5.26 0 0 13 59.09 24 10.31
Others 0 0 0 0 1 6.25 2 9.09 3 0.90
P value <0.001
Figure 3.59. The Main Reasons for the low Productivity in the Study Areas
On the other hand, the number of rice farmers who considers paddy production in the
rural area today is more important than other crop productions to the rural people are
178 farmers (79.8%), and the number of them that disagree was 36 farmers (16.2%).
And the number of those who say ―If paddy production caused water scarcity problems,
I’d rather quit paddy farming ―was 72 farmers (32.3%), and the number of disagreeing
was 99 farmers (44.4%) (Table 3.51). This shows the importance of rice cultivation in
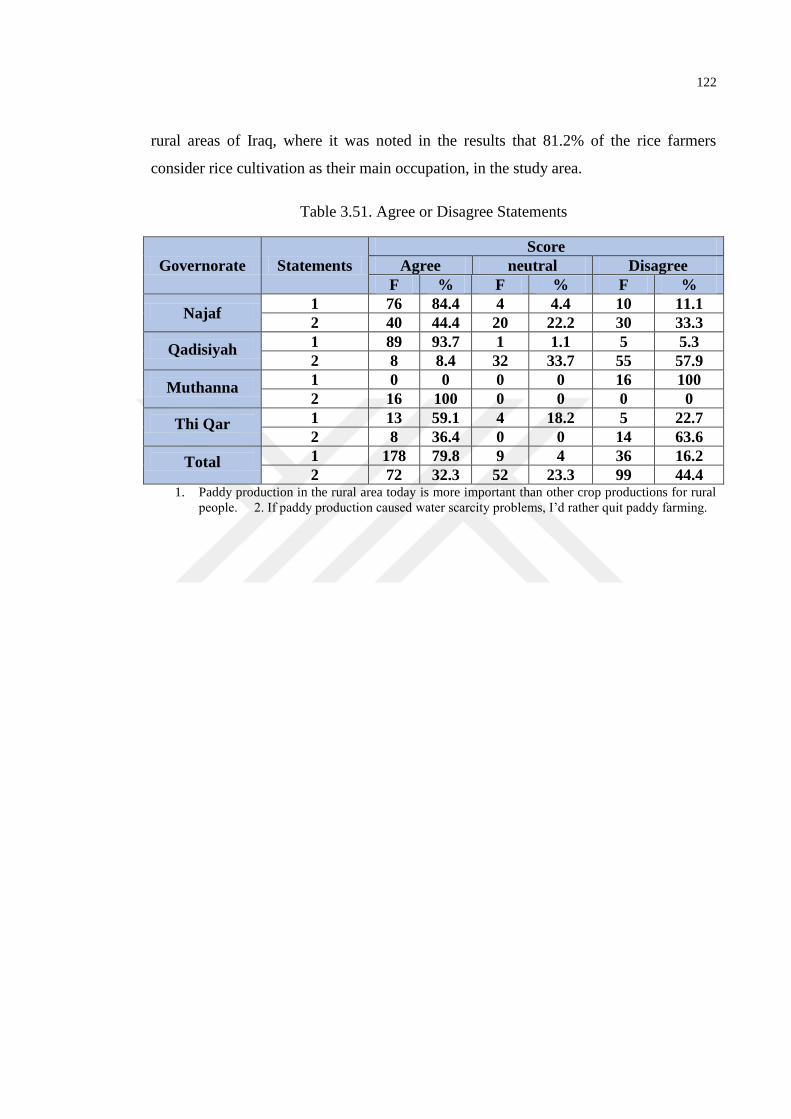
122
rural areas of Iraq, where it was noted in the results that 81.2% of the rice farmers
consider rice cultivation as their main occupation, in the study area.
Table 3.51. Agree or Disagree Statements
Governorate Statements
Score
Agree neutral Disagree
F % F % F %
Najaf 1 76 84.4 4 4.4 10 11.1
2 40 44.4 20 22.2 30 33.3
Qadisiyah 1 89 93.7 1 1.1 5 5.3
2 8 8.4 32 33.7 55 57.9
Muthanna 1 0 0 0 0 16 100
2 16 100 0 0 0 0
Thi Qar 1 13 59.1 4 18.2 5 22.7
2 8 36.4 0 0 14 63.6
Total 1 178 79.8 9 4 36 16.2
2 72 32.3 52 23.3 99 44.4 1. Paddy production in the rural area today is more important than other crop productions for rural
people. 2. If paddy production caused water scarcity problems, I’d rather quit paddy farming.
123
CHAPTER FOUR
CONCLUSION AND RECOMMENDATIONS
4.1. Conclusion
Changes in the climate could alter the intensity and frequency of the events of weather
which will highly challenge the natural and human ecosystem more than baseline
variability in climate and weather. It has been shown by the World Bank (2013) that
there are a 0.8°C differences (warmer) between the pre-industrial era and now. It has
also been predicted that there will be approximately 2°C increase in the temperature in
one generation. It has been reported that the Iraqis drought-prone areas are drier and
warmer compared to the situation 50 years earlier. Furthermore, the current projection
and predictions suggesting that many of Iraq’s agricultural land will face frequent
drought and will become hotter due to the lack of rainfall. There will be adverse impacts
on food security, poverty, production of paddy, overall agricultural productivity due to
the changes in the climatic variability.
It is true that in the current socio-economic settings in Iraq, agriculture is highly
vulnerable industry to any change in the climatic condition. The primary objective of
the current study is to determine the impacts of climatic change on Iraqi agriculture
especially paddy production and irrigation sectors and its interactions with rural
development on four rice production area (Najaf, Qadisiyah, Muthanna and Thi Qar).
It is worth to mention that there is no substantial estimation of the impacts caused by
climate change on the productivity of the paddy. Although there are a few studies that
estimated the global impact of climatic change, temporal and local/regional variations
were not taken under consideration in their studies. Therefore, in the current study, we
planned to accumulate a unique set of data representing the periods from 1966-2015 (50
years). Using year fixed and regional effects, we have estimated different impacts of the
124
climate changes on rice production in the study areas. Characterization of the
socioeconomic condition of the farmers is one of the major findings that we also
described in this study.
It is important to note that we obtained the primary data through face to face interview
of a total of 223 farmers in the study area using a structured questionnaire. The
respondents were selected randomly. On the other hand, the secondary data were
collected from the much official organization in Iraq. The data were analyzed using both
inferential statistics and descriptive statistics. The data obtained through the
questionnaire were analyzed through the Statistical Package for the Social Sciences
(SPSS, version 21.0). To compare data regarding the studied factors, One-Way and
Two-Way Analysis of Variance test (ANOVA) were used. Differences at 5% (p < 0.05)
and 1% (p < 0.01) levels were considered as significant. It is important to note that the
size and sign of the estimate are significantly changing when we consider the regional
variations. While the inferential statistics used product Moment Correlation coefficient,
the descriptive statistics include means, percentages, and frequencies.
When this about people than a number, it is extremely hard to summarize their
experiences and thoughts in a thesis. In my opinion, the most important findings of my
thesis are aligned with in-depth interviews and the experiences and events in their life
that 15 farmers shared with me.
This study revealed that the average yearly minimum and maximum temperature of the
study areas is increasing with the time passing. This trend of increasing temperature
adversely affects the agro-climate conditions as well as the economic conditions of rural
area and population in Iraq. Increasing temperature not only affects the Iraqi paddy
production sector but also enhances the intensity of dust storm which hampers the
normal lifestyle.
This study also indicated that the total yearly rainfall is decreasing clearly with the time
passing. This scenario explicitly indicates how Iraqi agriculture and irrigation sectors
are suffering from the scarcity of rainfall because of Iraqi agriculture and irrigation
systems are largely dependent on rainfall. The scarcity of rainfall is also enhancing the
desertification process by creating a great threat to Iraqi agriculture. As the situation
(scarcity of rainfall) is worsening day by day, so Iraqi people especially paddy farmers
125
are becoming more frustrated with thinking about the future as well as agricultural
sustainability.
Iraqi irrigation system mainly depends on two main rivers namely the Tigris and
Euphrates, but recently river flows of those two rivers are decreasing drastically.
Therefore, the scarcity of river water is increasing day by day by affecting Iraqi
agriculture and irrigation sectors adversely.
As temperature, rainfall and availability of irrigation water have cumulative effects on
paddy production and all those components are adversely affected by climate change,
Iraqi paddy production is decreasing with the negative effects of climate change.
Evidently, the yield (ton per hectare) of the rice crop in Iraq is decreasing noticeably.
Around 34% population of the study areas live in a rural area and their livelihood
directly or indirectly dependent on agriculture and rice production. Therefore, the
negative trend of agricultural and rice production will not only hamper the food security
of these areas but also will affect rural livelihood at large.
Moreover, the current study was aimed to identify the impacts of climatic change on
the production of the rice crop and rural farmers in four districts of Iraq, used the
questionnaire survey. Because of the fact that the cultivation and production of paddy is
the primary source of the income in the rural communities in the selected areas as well
as in Iraq, it is necessary to take adaptation strategies by the farmers to mitigate the
impacts of climatic change in order to ensure food security and to improve their
livelihoods. However, it is extremely important to develop policies aimed to promote
successful strategies of adaptation in this sector, a thorough understanding of the
adaptation strategies adopted by the paddy farmers, and ongoing impacts are crucial.
Questionnaire results revealed that 3.59% of farmers were Female and the rest were
Male (96.41%). the average age of rice farmers in the study area ranged from 55 to 57
years. The high percentage for the total income of the household was less than 500 $per
month, a larger proportion of the farmers had primary education. The results from the
current study indicating that many of the farmers (approximately 92.38%) are familiar
with the term climate change adaptation, and others (7.62%) don’t know about the term
126
and had never heard about it. Approximately 61.42% of the respondents said that they
learned about climate change from television programs.
There were highly significant differences (p<0.01) in income of the household,
agricultural skills, farming experiences of farmers, paddy fields size, types of irrigation,
and education levels. Significant differences were also observed in farmer attitudes
toward to importance of climate change, how climate change affects the rice farms,
how the decline in rice production affects the rural people, condition of rice production
over the last 10 years, and main reasons for the low paddy productivity in the study
areas. On the other hand, there were no significant differences (p>0.05) in the type of
rice culture, knowledge of farmer upon water quality parameters, hearing about
climate change, feeling the pattern of weather change, knowledge about the effects
climate change on the rural area, sectors that affected by climate change, about the
effects of climate change on water management, knowledge of farmer about the effects
of rice production on the livelihood of rural people, and the effects of declining rice
production on the rural area of the study areas.
Considering the above-mentioned issues, the Iraqi government has taken some
initiatives to mitigate the negative effects of climate change on rice crop, but those
policies and programs are not enough to cope with the severity of the climate change.
So, the government of Iraq should give more emphasis on policy formulation and to
find out the ways of adaptation and mitigation of adverse effects of climate change.
In the summary, based on the primary and secondary data, I am confident enough to
conclude that due to the increase in the temperature in the last few decades, the paddy
farmers in Iraq is facing several challenges such as shortage of water for irrigation,
lower level of rainfall, and longer dry periods. Because of the fact that the water is the
limiting factor for the production of paddy, these problems are severely affecting the
production of paddy in the selected four study areas. It is important to note that similar
problems exist throughout Iraq. To mitigate the challenges arose due to climate changes
farmers are adopting different strategies. One of the common strategies is changing the
varieties of rice from traditional breed to high producing breeds. Some farmers are also
interested in growing drought tolerant rice varieties as this is the major problem in the
rainfed paddy farming. In addition, farmers are also preferring the variety that can be
127
cultivated within three months (seeding to harvesting). From the analysis of the
secondary data and the primary data, it is clear that climate change is real, and the paddy
farmers of Iraq is already suffering from the impacts of climate change.
4.2. Recommendations
Based on the results of the current study, we can propose some recommendations that
can be used by other farmers in Iraq, as well as the farmers under similar environmental
conditions throughout the world. Furthermore, these recommendations can be used by
the government offices in order to develop policies to protect the paddy farmers from
the effects of climate change.
The Extensional centers must have different programs to train farmers on how to
adapt to climate change, by teaching them to change the planting time, use
certified seeds, improve irrigation systems, and use a Crop rotation.
Different development actors, as well as the government, should develop
trustable meteorological centers in rural Iraq disseminate the information to
farmers through television and radio programs.
Proper and adequate training of the extension workers of the extension
organizations and research centers.
Develop a vigorous dissemination program as well as the strategic
communication to provide accessible information regarding climate change.
The programs should be developed in such a way that the rural illiterate farmers
can understand the main message.
There should be a balance between the measures to cope with climate change
and measures to determine the causes of climatic change.
Paddy production adaptation may be grouped as farm financial management,
farm production practices, government programs, and technological
developments to mitigate the impacts of climate change in the rural areas of Iraq.
It is necessary to build cooperation across the administrative sectors, agricultural
sectors, and meteorological sectors across the country to mitigate or create
adaptation strategies to cope with the changes in climate.
Introduction of new rice varieties that are adaptable to a wide variety of climatic
conditions by the governmental office in the study area.
128
NGOs and government agencies should work together to boost the production
of rice by encouraging rice cultivation through the provision of incentives.
Due to the high temperatures during the rice crop planting time, the agricultural
extension workers should inform the farmers about the delay in planting the rice
so that the date of flowering is within the appropriate temperature.
Proper training of the paddy farmers to cope with the high temperature and dry
climate in the study area as well as in Iraq through vigorous extension programs.
The production practices of farms and individual farmers need to be updated
with the changes of climate factors.
Farmers should be informed about the benefits of crop substitutions, crop
portfolio, and crop rotation to enhance the production of paddy and to adapt with
the changed climatic condition.
The paddy farmers must be careful about the proper management of irrigation
water and should be aware of the uncertainty of heavy rainfall as well as low
rainfall
It is also important to understand the exact timing and quickly move forward
with the sign of rainfall and warning.
Finally, the paddy farmers must take initiatives for cooperative activities,
insurance, hedging, forward rating, and crop sharing.
NGOs and government should take initiatives in order to boost the production of
rice in the rural area by youth participation through the provision of incentives.
The Government should assist in the opening of advanced centers for the
education of adult women and men in rural areas in which agricultural workers
participate.
Creating a proper drainage system in the rural area for agricultural use.
Dramatic improvement is necessary in the mechanization of agriculture in the
rural areas of Iraq in order to have significantly higher production of paddy as
well as other important crops.
Control measures should be taken by the government in order to limit the level
of migration from rural to urban areas.
129
It is necessary to build modern facilities including a bank, agricultural offices,
climate, and weather-related offices, supermarkets, schools, and other facilities
in the rural areas of Iraq to prevent the rural migration towards cities.
Introduction of high productive seeds that are adapted in a wide range of
climatic condition.
The agricultural offices in the respective areas and the paddy farmers in the rural
areas must work together in order to decrease the waste and loss of water during
the paddy cultivation.
The proper balance would necessary to promote non-farm economic activities
alongside climate change resilient forms of agriculture.
Training must provide to improve the soil texture using soil compost, causing
poor soil texture, due to overlapping with rice and wheat cultivation in some
areas, thus non-response increases yield.
To improve the financial management and production at the farm level, the
government must carefully identify its priority zones to provide subsidy supports
and incentive programs.
The government must ensure the proper price of the produced paddy nationally
to protect the paddy farmers from the middlemen in the rural areas.
The government must introduce improved rice varieties to the paddy farmers in
the rural areas that are adaptable to the flood and drought conditions.
New research centers must be established in rural areas in order to discover the
problems faced by farmers in the area due to climate change and find coping
strategies.
The government should reinvigorate national research and extension programs
in the optimal use of water sources.
The water allocation in different farm activities must be reconsidered by the
Iraqi government and priority should be given to the paddy farmers to promote
paddy production.
130
REFERENCES
1. Weinthal, E., Sowers, J., Vengosh, A., 2010. Climate change, water resources, and
the politics of human security in the Middle East and North Africa. Human
Development.
2. Land, A., Changes, U., 2010. Socio-Economics Of Climate Change (Impact on
Agriculture Land Use Changes in India).
3. Agricultural Research Center for climate change –Jeju Island (South Korea), 2011
www.nihhs.go.kr
4. Dumenu, W. K., Obeng, E. A., 2016. Climate change and rural communities in
Ghana: Social vulnerability, impacts, adaptations and policy implications.
Environmental Science and Policy, 55: 208–217. http://doi.org/10.
1016/j.envsci.2015.10.010.
5. IPCC, 2007. Climate Change 2007: Impacts, Adaptation, and Vulnerability. The
contribution of Working Group II to the Fourth Assessment Report of the
Intergovernmental Panel on Climate Change, Cambridge University Press,
Cambridge, UK, 2007.
6. IPCC, 2001. Climate Change, 2001: The Scientific Basis, Contribution of Working
Group I to the IPCC Third Assessment Report 2001.Cambridge, UK
Cambridge University Press.
7. International Panel on Climate Change (IPCC), 2001. Climate Change 2001:
Synthesis Report. A Contribution of Working Groups I, II, and III to the
Third Assessment Report, ed. R.T. Watson and the Core Writing Team.
Cambridge and New York: Cambridge University Press.
8. UNFCCC United Nations Framework Convention on Climate Change.
9. IRRI, International Rice Research Institute, 2015.
10. Bozkurt, D., Sen, O. L., 2013. Climate change impacts in the Euphrates–Tigris
Basin based on a different model and scenario simulations. Journal of
Hydrology, 480: 149–161.
131
11. Veronica Makuvaro, B., Crimp, S., 2014. Impact of Climate Change on
Smallholder Farming in Zimbabwe, Using a Modelling Approach By
Veronica Makuvaro Submitted in fulfillment of a Ph.D. Degree in
Agricultural Meteorology Department of Soil, Crop and Climate Sciences
Faculty of Natural and Agricu, (January).
12. www.en.wikipedia.org/wiki/Stern- Review 2006.
13. IPCC 2001, p, 263 www.ipcc.ch/pdf/climate -changes-2001.
14. Meyer, L., 2005. Policy position paper: National EMS organizations oppose
establishing a U.S. Emergency Medical Services Administration within the
Department of Homeland Security; support alternative approaches increasing
federal support for EMS systems. Prehospital Emergency Care, 9(4): 468–
469. http://doi.org/10.1007/0-387-29298-5_113.
15. Internet: government of Canada climate change website‖.
16. USGCRP, United States Global Change Research Program.
17. Internet ―copyright @2009weather-and-climate.com.
18. World Bank Group SFCCD, environment and climate change, 2008.
19. IPCC SRES, Special Report on Emissions Scenarios is a report prepared by the
Intergovernmental Panel on Climate Change, 2014.
20. Abid, M., Schneider, U. A., Scheffran, J., 2016. Adaptation to climate change and
its impacts on food productivity and crop income: Perspectives of farmers in
rural Pakistan. Journal of Rural Studies, 47: 254–266. http://doi.org/10.
1016/j.jrurstud.2016.08.005.
21. Iraq, Ministry of planning, ―statistical data for the annual human report, 2017‖
ministry database, Baghdad.
22. Land, A., Changes, U., 2010. Socio-Economics Of Climate Change (Impact on
Agriculture Land Use Changes in India).
23. FAO, 2002. The state of food and agriculture 2002, Food and Agriculture
Organization of the United Nations, Rome.
132
24. Korres, N. E., Norsworthy, J. K., Burgos, N. R., Oosterhuis, D. M., 2017.
Temperature and drought impacts on rice production: An agronomic
perspective regarding short- and long-term adaptation measures. Water
Resources and Rural Development, 9: 12–27. http://doi.org/10.1016/
j.wrr.2016.10.001.
25. Mojtaba R., Vahed, H. S., Amiri, E., Motamed, M. K., Azarpour, E., 2009. The
effect of irrigation and nitrogen management on yield and water productivity
of rice. World Applied Sciences Journal, 7(2): 203-210.
26. Wassmann, R., Dobermann, a., 2007. Climate change adaptation through rice
production in regions with high poverty levels. SAT. Journal ICRISAT,
4(1): 1–24. Retrieved from http://www.icrisat.org/Journal/SpecialProject/
sp8.pdf.
27. National Climate Data Center, NCDC, 2009.
28. CIA (Central Intelligence Agency) World factbook March 11, 2010.
29. SFCCD Strategic Framework for Climate Change and Development.
30. Kriesemer, S. K., 2013. Rice cropping systems and resource efficiency, 41.
Retrieved from https://www.giz.de/fachexpertise/downloads/giz2013-en-
study-rice-cropping-sys-low-res.pdf.
31. FAO, 2011. Food and Agriculture Organization of the United Nation, Rome.
32. FAO, 2009. Food and Agriculture Organization of the United Nations, Rome.
33. Climate change on Egypt, Chapter three, 115-138.
34. World Bank Report No. 36297-IQ, June 28, 2006.
35. World Bank Report December 28, 2007.
36. Turkish State Hydraulic Works.
37. FAO Regional Office for Asia and the Pacific, F, 2014. A Regional Rice Strategy
for Sustainable Food Security in Asia and the Pacific.
38. Internet: http://www.state.gov/g/prm/108717.htm
39. AQUASTAT- FAO, 2015.
133
40. UNDP United Nations Development Programme, 2014.
41. UNEP United Nations Environment Programme, 2016.
42. Schnepf, R., 2004. Iraq Agriculture and Food Supply: Background and Issues.
Production, 57. Retrieved from http://nationalaglawcenter.org/assets/crs/
RL32093.pdf.
43. Alobaidi, A. H., 2015. Analysis of Relative Humidity in Iraq for the Period.pdf,
5(5) 1–9.
44. Central Office for Statistics and Information Technology (COSIT).
45. Report B2. 1 Historical agricultural production data in Iraq. (n.d.).
46. FAOSTAT, 2001. Food and Agricultural Organization, United Nations,
http://apps.fao.org/.. Intergovernmental Panel on climate change synthesis
report,
47. MoP, The Ministry of Planning, Baghdad, 2015.
48. United States Department of agriculture, available on www.pecad.fas.usda.
gov/highlights/2015/08/Iraq/index.htm
49. Iraqi atmospheric institute report (IAI) ―the project proposal by Mustanserea Univ.
clouds seeding, March, 2005~2007‖ GOV database.
50. AFP, 2008. Agency France-press.
51. U.S. Government Accountability Office (GAO) report, ―Financial Risks to Federal
and Private Insurers Coming Decades are Potentially Significant,‖ March
2007, p.2 (based on IPCC definition), available at http://www.gao.gov/new.
items/d07285.pdf.
52. MoH, Ministry of Health and Environment, Baghdad, 2017.
53. IPCC, 2007. Climate Change 2007: The Physical Science Basis. The contribution
of Working Group I to the Fourth Assessment Report of the
Intergovernmental Panel on Climate Change Solomon, S., D. Qin, M.
Manning, Z. Chen, M. Marquis, K.B. Averyt, M. Tignor and H.L. Miller
(Eds.). Cambridge University Press, Cambridge, United Kingdom and New
York, NY, USA.
134
54. Intergovernmental Panel on climate change synthesis report, 2001.
www.ipcc.ch/pdf/climate- change-2001.
55. Meteorological Organization and Seismology of Iraq, 2017.
56. Yuliawan, T., Handoko, I., 2016. The Effect of Temperature Rise to Rice Crop
Yield in Indonesia uses Sherry Rice Model with Geographical Information
System (GIS) Feature. Procedia Environmental Sciences, 33: 214–220.
http://doi.org/10.1016/j.proenv.2016.03.072.
57. MoA, Ministry of Agriculture Baghdad, 2017.
58. U.S. Environmental Protection Agency (EPA), ―Climate Change, Greenhouse Gas
Overview,‖ available at http://www.epa.gov/climatechange/emissions/
index.html.
59. WRI, 2005. Earth Trends Data Tables: Climate and Atmosphere, World Resources
Institute, Washington D.C. Online at http://www.earthtrends.wri.org/
60. MOWR, Ministry of Water Resource, Baghdad, 2016.
61. Grist, D. H., 1983. Rice. Singapore: Longman Group Limited. Singapore National
Printers Ltd.
62. Sharfi, P., Hashem, A., 2010. Evaluation eighteen rice genotypes in cold tolerance
at the germination stage. World Applied Sciences Journal, 11 (11): 1476-
1480.
63. Kim, I., Elisha, I., Lawrence, E., Moses, M., 2017. Farmers Adaptation Strategies
to the Effect of Climate Variation on Rice Production : Insight from Benue
State, Nigeria. Environment and Ecology Research, 5(4): 289–301.
64. Climate Change and Rice Yields in Diverse Agro-Environments of India, 2002. II
Effects of Uncertainties in Scenarios and Crop Models on Impact
Assessment. Aggarwal, P.K. and Mall, R.K. s.l. Climate Change, 52:331-
333.
65. Agronomic Impacts of Climatic Variability on Rice Production in the Philippines.
Lansigan, F.P., de Los Santos, W.L. and Coladilla, J.O, 2000. Agriculture,
Ecosystems and environment, 82(1-3): 129-137.

135
66. Adoption of improved cassava production technologies by small-scale farmers in
Bendel State. Obinne, C.P.O, 1991. Journal of Agricultural Science and
Technology, 1(1): 12-15.
67. Indigenous people's perception of climate change and adaptation strategies in
Jama'a Local Government Area of Kaduna State, Nigeria. Ishaya, S. and
Abaje, I.B, 2008. Journal of Geography and Regional Planning, 1(8): 138-
143.
136
APPENDIX
Questionnaire about Climate Change and paddy production in the
Rural area
My name is Jawad Hassan Humaidy and I am currently working on a research project
about climate change and paddy production in the rural area. Most of this research is
being carried out in the Al Najaf, Al Qadisiyah, Al Muthanna and Thi Qar area, and
your address has been selected by a scientific sampling method to ensure a
representative picture of people's views. Your help and assistance in completing the
enclosed questionnaire will be invaluable for the study.
If you agree to participate, all the information you provide will be completely
anonymous and confidential.
The questionnaire starts by asking you about a range of climate change and paddy
production issues that may affect you and moves on to ask you how you feel about
global warming problems. If you don't want to answer all the questions, you don't have
to - please just do what you can. It shouldn’t take long to complete, and I hope you’ll
enjoy it.
Once you've completed the questionnaire, please could you return it to me?
Thank you very much for your kind help and assistance.
Yours faithfully,
Ph.D. candidate
Jawad Hassan Humaidy
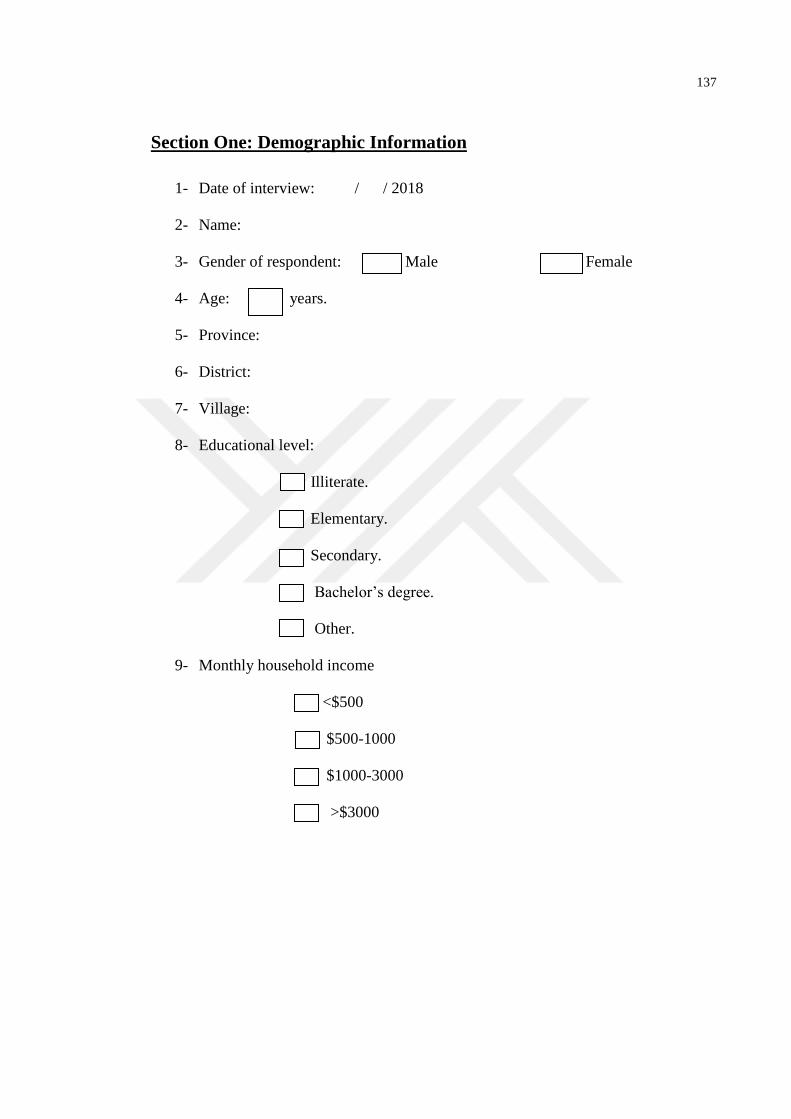
137
Section One: Demographic Information
1- Date of interview: / / 2018
2- Name:
3- Gender of respondent: Male Female
4- Age: years.
5- Province:
6- District:
7- Village:
8- Educational level:
Illiterate.
Elementary.
Secondary.
Bachelor’s degree.
Other.
9- Monthly household income
<$500
$500-1000
$1000-3000
>$3000
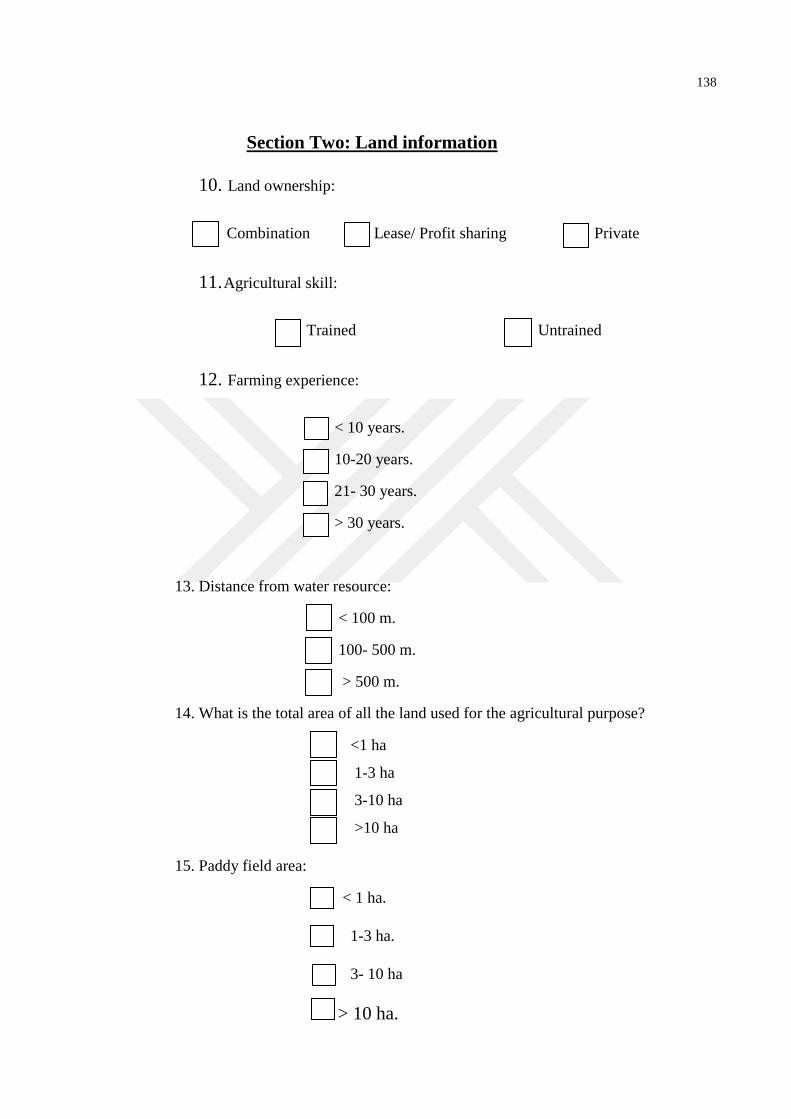
138
Section Two: Land information
10. Land ownership:
Combination Lease/ Profit sharing Private
11. Agricultural skill:
Trained Untrained
12. Farming experience:
< 10 years.
10-20 years.
21- 30 years.
> 30 years.
13. Distance from water resource:
< 100 m.
100- 500 m.
> 500 m.
14. What is the total area of all the land used for the agricultural purpose?
<1 ha
1-3 ha
3-10 ha
>10 ha
15. Paddy field area:
< 1 ha.
1-3 ha.
3- 10 ha
> 10 ha.
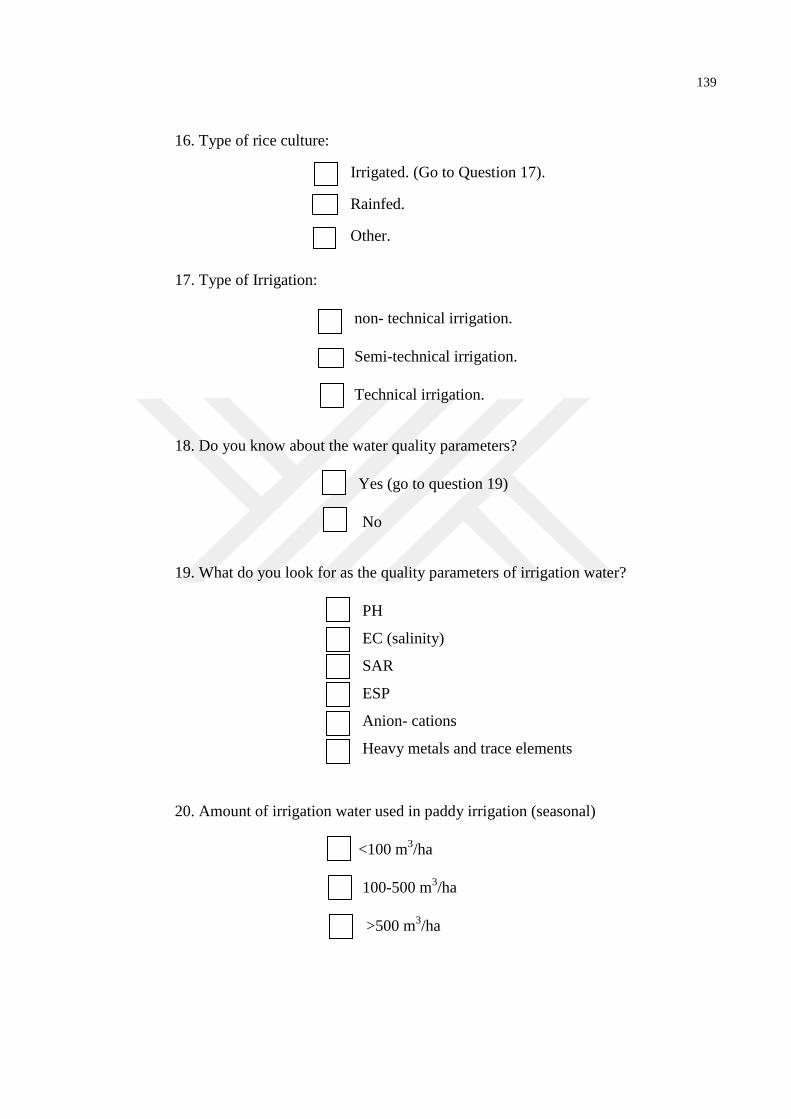
139
16. Type of rice culture:
Irrigated. (Go to Question 17).
Rainfed.
Other.
17. Type of Irrigation:
non- technical irrigation.
Semi-technical irrigation.
Technical irrigation.
18. Do you know about the water quality parameters?
Yes (go to question 19)
No
19. What do you look for as the quality parameters of irrigation water?
PH
EC (salinity)
SAR
ESP
Anion- cations
Heavy metals and trace elements
20. Amount of irrigation water used in paddy irrigation (seasonal)
<100 m3/ha
100-500 m3/ha
>500 m3/ha
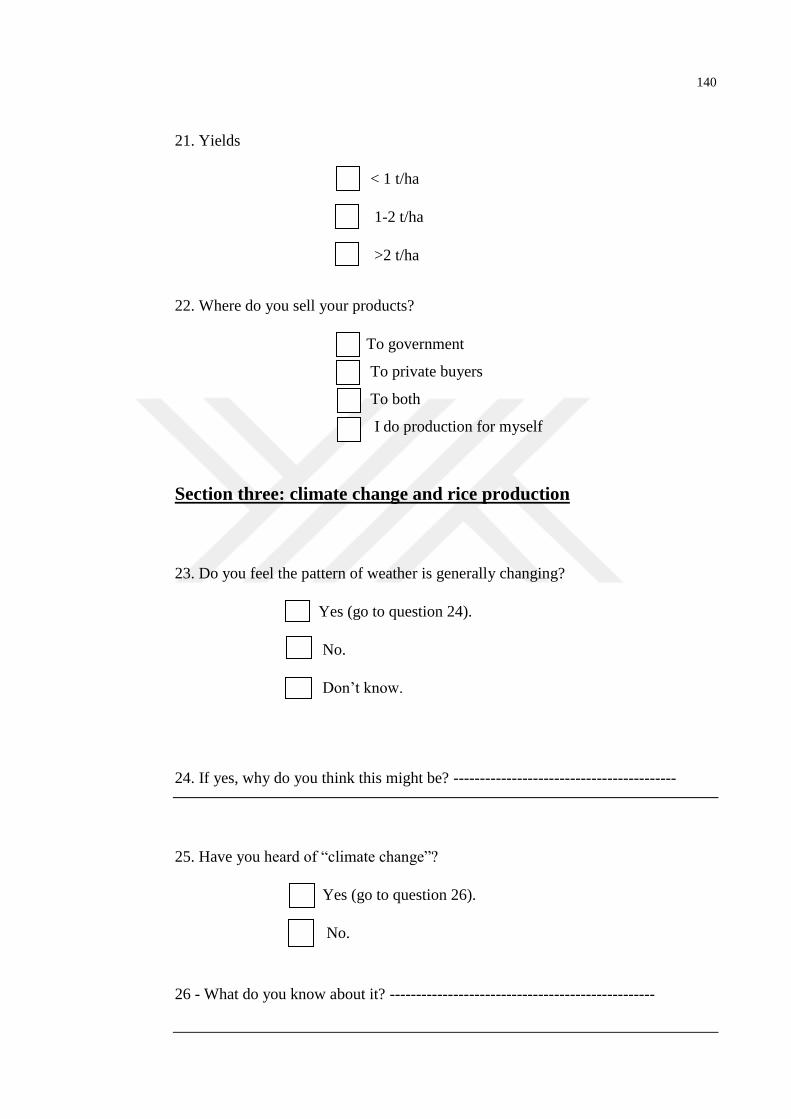
140
21. Yields
< 1 t/ha
1-2 t/ha
>2 t/ha
22. Where do you sell your products?
To government
To private buyers
To both
I do production for myself
Section three: climate change and rice production
23. Do you feel the pattern of weather is generally changing?
Yes (go to question 24).
No.
Don’t know.
24. If yes, why do you think this might be? ------------------------------------------
25. Have you heard of ―climate change‖?
Yes (go to question 26).
No.
26 - What do you know about it? --------------------------------------------------

141
27. Where have you heard about climate change? (Tick as many as you fell apply).
Television. school, college, University.
Radio. Government agencies.
Newspaper. Friends, family.
Internet. Others.
28. How important is the issue of climate change to you personally?
Very important. (Go to question 29).
Important. (Go to question 29).
Not important. (Go to question 30).
29. Why is it important to you? ----------------------------------------------------------
30. What do you think causes climate change? ----------------------------------------
31. What impacts, if any, do you think climate change may have? -----------------
32. Do you think climate change is something that affecting or going to affect you,
and rural households?
Yes. (Go to question 33).
No.
No idea.
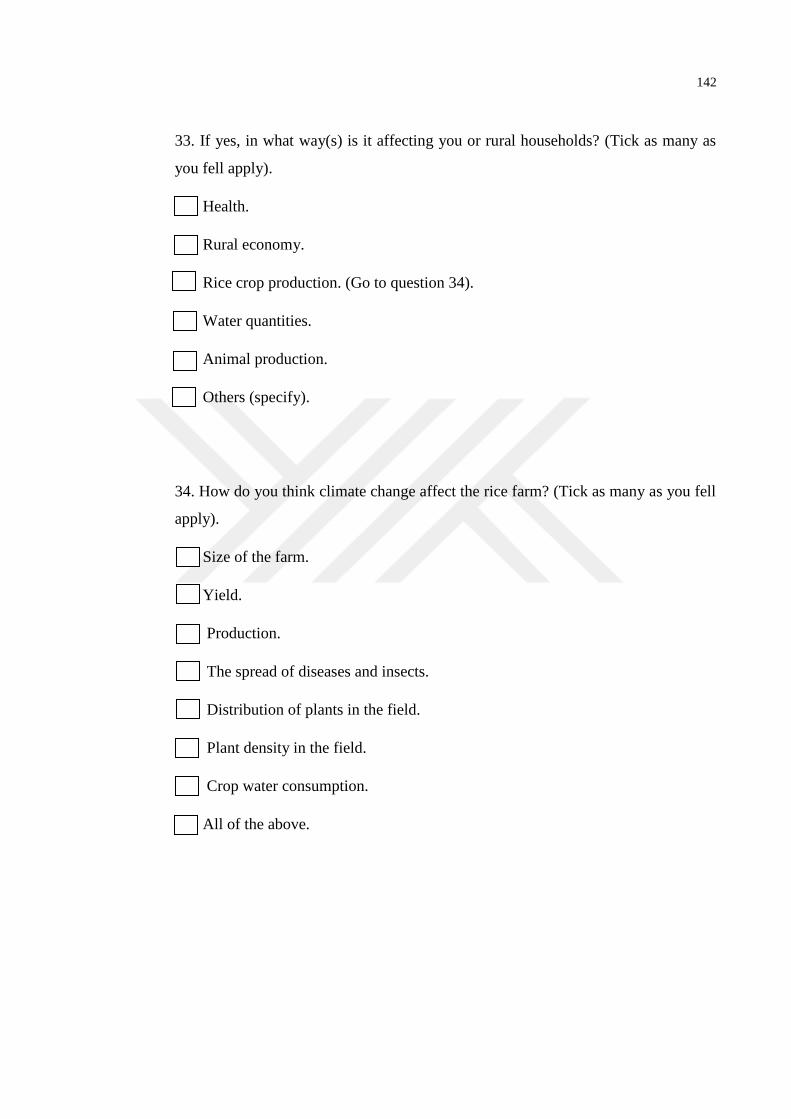
142
33. If yes, in what way(s) is it affecting you or rural households? (Tick as many as
you fell apply).
Health.
Rural economy.
Rice crop production. (Go to question 34).
Water quantities.
Animal production.
Others (specify).
34. How do you think climate change affect the rice farm? (Tick as many as you fell
apply).
Size of the farm.
Yield.
Production.
The spread of diseases and insects.
Distribution of plants in the field.
Plant density in the field.
Crop water consumption.
All of the above.
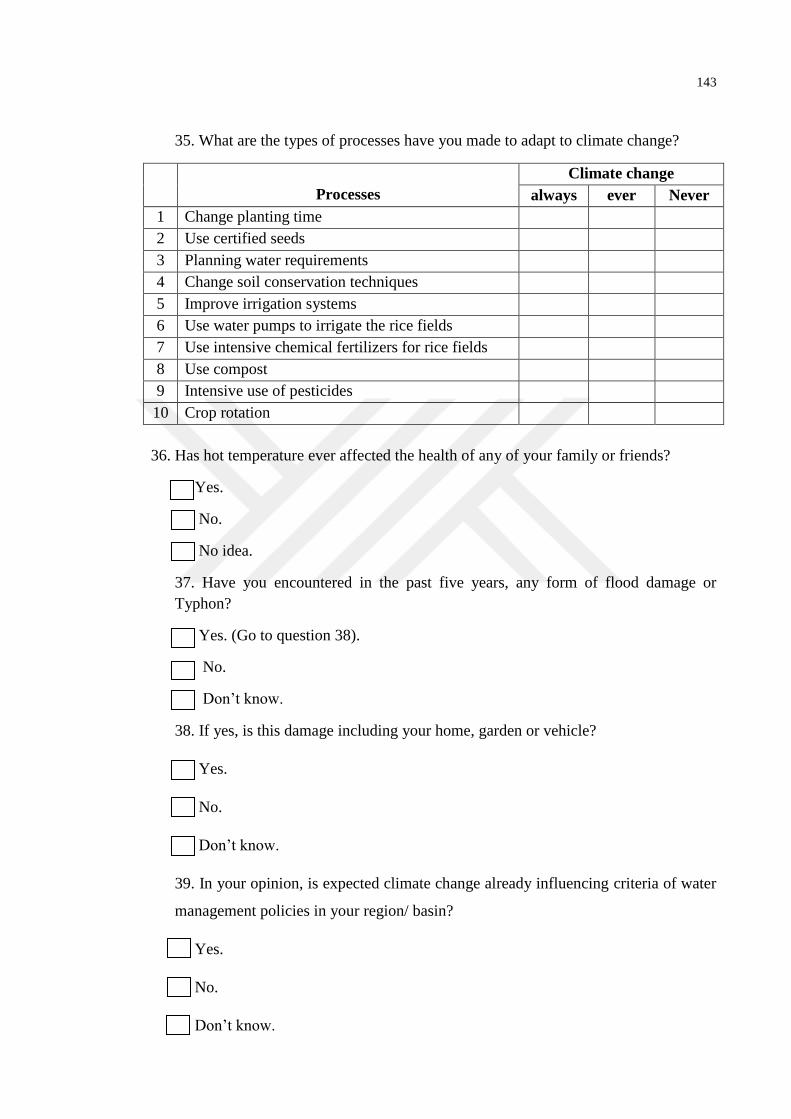
143
35. What are the types of processes have you made to adapt to climate change?
Processes
Climate change
always ever Never
1 Change planting time
2 Use certified seeds
3 Planning water requirements
4 Change soil conservation techniques
5 Improve irrigation systems
6 Use water pumps to irrigate the rice fields
7 Use intensive chemical fertilizers for rice fields
8 Use compost
9 Intensive use of pesticides
10 Crop rotation
36. Has hot temperature ever affected the health of any of your family or friends?
Yes.
No.
No idea.
37. Have you encountered in the past five years, any form of flood damage or
Typhon?
Yes. (Go to question 38).
No.
Don’t know.
38. If yes, is this damage including your home, garden or vehicle?
Yes.
No.
Don’t know.
39. In your opinion, is expected climate change already influencing criteria of water
management policies in your region/ basin?
Yes.
No.
Don’t know.
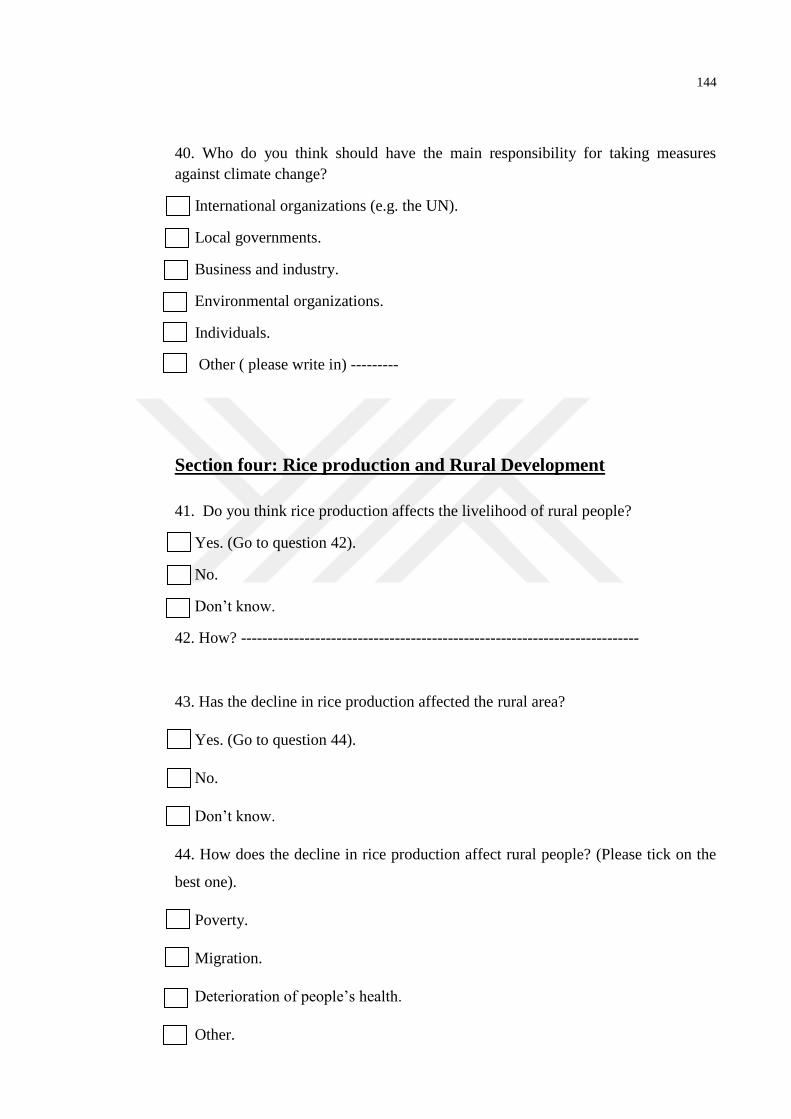
144
40. Who do you think should have the main responsibility for taking measures
against climate change?
International organizations (e.g. the UN).
Local governments.
Business and industry.
Environmental organizations.
Individuals.
Other ( please write in) ---------
Section four: Rice production and Rural Development
41. Do you think rice production affects the livelihood of rural people?
Yes. (Go to question 42).
No.
Don’t know.
42. How? ---------------------------------------------------------------------------
43. Has the decline in rice production affected the rural area?
Yes. (Go to question 44).
No.
Don’t know.
44. How does the decline in rice production affect rural people? (Please tick on the
best one).
Poverty.
Migration.
Deterioration of people’s health.
Other.

145
45. How was rice productivity been on your farm over the last 10 years?
Significantly increased.
Increased.
Decreased. (Go to question 46).
Significantly decreased. (Go to question 46).
46. In your opinion, what is the main reason for the low rice productivity? (Please
tick as one or many as you feel apply).
Elevated temperature.
Lack of rain.
Low water quantities.
Labor migration.
All of the above.
Other. (Please write on): ----------------------------
47. Is rice farming your main occupation?
Yes.
No.
Don’t know.

146
48. Now please indicate how much you agree or disagree with the following general
statements by ticking on the box on each row:
General Statements
Rows
Agree Neutral Disagree
a. Paddy production in the rural
area today is more important
than other crop productions for
rural people.
b. If paddy production caused
water scarcity problems, I’d
rather quit paddy farming.
If you have anything to add to the issues raised in this questionnaire or any comments
about the questionnaire itself, please write them here: ----------------------
It’s really kind of you and I would like to thank you for giving up your
time and attention to complete this questionnaire.
It is very much appreciated.

147
CURRICULUM VITAE
Name and surname: Jawad Hassan HUMAIDY
Nationality: IRAQ
Birthdate and place: Najaf 1970
Marital status: Married
Cell phone: Turkey / 05362500302
E-mail: [email protected]
Correspondence Address: Talas/KAYSERİ
EDUCATION
Degree Institution Date of graduation
Ph.D. Institute of Science and Technology 2019
M.Sc. Hankyong National University- South Korea 2012
B.Sc. Baghdad University 1991
High school Al Abbasiyah secondary school 1987
FOREIGN LANGUAGE
Arabic
English
Korean
Turkish