Slaheddine Kaabachi Project coordinator Evaluators REPUBLIC OF TUNISIA MINISTRY OF EDUCATION
Upload
khangminh22Category
view
3download
0
-WMINISTRY OF THE ENVIRONMENTOF THE SLOVAK REPUBLIC
SK99K0193
I I I
STATE OF THE ENVIRONMENTREPORT
SLOVAK REPUBLIC1997
3 0 - 4 3

Ministry of the Environmentof the Slovak Republic

State of the Environment Report - the Slovak Republic 1997
Publishers
Composers
Co-opeeration
Published
STATE OF THE ENVIRONMENT REPORT - THE SLOVAK REPUBLIC 1997
MINISTRY OF THE ENVIRONMENT OF THE SLOVAK REPUBLICNamestie tudovfta Stiira 1, 812 35 Bratislava, SlovakiaSLOVAK ENVIRONMENT AGENCYTajovskeho 28, 975 90 Banska Bystrica, Slovakia
RNDr. Jozef KLINDA, Ing. Zuzana LIESKOVSKA and collective
Branches of the MZP SR, Centres of SAZP and other institutions listed as sources
Ing. Pavol CIKATRICIS, RNDr. Jozef KLINDA©1998 EM DESIGN - Ing. Milos SABLATURA, Rakos 12, 960 01 Zvolen
Juraj BOBULA, Lubor CACKO, Jozef KLINDA, Roman LEHOCKY,Peter SEVEC, Miloslav BADIK, SAZP archive
EM DESIGN & KO-PRINT
I
1 000 pcs
118
ISBN 80-88833-13-2

State of the Environment Report - the Slovak Republic 1997
about the Slovak Republic
SK99K0194
The Slovak Republic \v;is established on January I -'1993 after the peaceful split of the former Czechoslovakia imotwo independent sovereign countries. The country lies in theheart of the Central Europe with geographical centre ofEurope being situated on its territory.
Total population of the Slovak Republic is 5 387 650,lhai represent population density 109.9 inhabitants per km'(as of December 3 1st, 1997).
According lo the Act of the NC SR No. 221/1996 Coll. on Territorial and Administrative Divisionof the SR, the country is divided into 8 regions and 79 districts. Within this broader administrative divi-sion there arc 2 875 municipalities including 136 towns.
Table 1 Population size by region (as of December 31st, 1997)
Territory
Slovak RepublicBratislava region (BA)Trnava region ( IT)Trenai l region (TN)Nilra region (NR)Zilina region (ZA)Banska livslrica region (BU)I'resov region (I'K)kosiee region (IslO
TerritoryArea
kin2
49 0342 0534 14.S4 5016 3436 78N9 455K 9') !
() 753
Population density
inhabitantsper km2
109.9301.4152.513?. ft1 13.1101 .ft70.2Sd.4
112.7
Number cifiiulepciulent
i n ii ii i c i p D l i t i e s
2 87572
249
275347314515(><>>45 S
Average numberinhiib. per
municipality
1 S74.0X 592.72 207.52 219.52 079.02 195.91 2S9.21 K.N.9
1 757.7
A\eiage si/.e olmunicipality
km2
17.05
2S.5I
16.6616.37
IS.2S
21.61
1X.56
I.V55"l?Ti~
N n l e : N u n i h c i " o C u u l c p c m l c i i l n u i i ] i c i p ; i l i t i c s d i K ' s m i l i n c l u d e B i ; i l i s h i \ a ; incl K o s i c c l i n \ n / o n e s . Source: Si: SR
Natural migration of the Slovak population caused an increase in total population by 7 thou-sands inhabitants. Registered total increase in the population was 8.7 thousands inhabitants.
Figure 1 Population increase (1993-1997)
25000 ._
\ O20000
I 5000
10000
5000
0
natural increase
Source: Sli SR
Total area of the Slovak Republic territory in 1997 was 4 903 455 ha. In terms of the totalregion area, Banska Bystrica region was the largest region and Bratislava region was the smallest. Thehighest percentage of agricultural land was in Nitra region. On the other hand, Zilina region was theregion with the smallest proportion of agricultural land. In terms of forest land, Zilina region enjoyedthe highest percentage of it. On the contrary, Nitra region had the smallest proportion the foresi landwithin the territory of Slovakia. Bratislava region recorded the highest percentage of build-up land asopposed to Banska Bystrica region with the smallest build-up land proportion.
State of the Environment Report - the Slovak Republic 1997
Table 2 Land use by region (as of December 31st , 1997) in ha
Region
BA'ITTNNRZABBPRKH .Total
Arable
land
77 605
264 774
105 221
408 107
70 491
171 677
163 955
210 294
1 472 124
Hop-
gardens
-
184815260----
1 25')
Vineyards
5 0664 737
6912317
3 589
243 007
28 809
Gardens
4 530
8 277
8 356
14 340
6 138
11 425
11 079
13 738
77 883
Orchards
1 3672 6653 0025 326444
1 9212 5071 736
18 968
Permanent
grassland
7 623
13 935
69 766
29 560
172 398
232 177
209 845
110 287
845 591
Agricultura
land
96 191
294 572
187 229
469 910
249 471
420 789
387 410
339 062
2 444 634
Forest
land
75 467
65 127
220 092
95 867
373 498
460 961
439 929
265 432
1 996 373
Water
bodies
5 636
14 472
6 232
15 722
12 786
7 937
14 245
16 280
93 310
Build-
up land
13 975
25 759
22 899
34 104
24 476
32 419
31 028
33 924
218 584
Total area
205 323
414 773
450 081
634 335
678 835
945 501
899 308
675 299
4 903 455
Note: Oilier land category included in llic total area is nol listed separately in the table Source: SU SR

State of the Environment Report - the Slovak Republic 1997
SK99K0195
Integrated EnvironmentalMonitoring and Information
SystemThe Concept of the Environmental Monitoring within
the territory of the Slovak Republic and The Concept of theIntegrated Environment Information System of the SlovakRepublic were accepted and confirmed by the GovernmentOrder No.449/1992. The state monitoring system covering thewhole territory of Slovakia is the most important and consistsof 13 Partial Monitoring Systems (PMSs).
Table 3 Partial Monitoring Systems
Partial Monitoring System
AirWaterBiota (Fauna and Flora)WasteSettlementLand useGeological factorsSoilForestXenobiotics in food and animal feedPressures on population caused byenvironmental factorsRadiation and other physical fieldsMeteorology and Climatology
PMSGuaranteed by
MZPSRMZPSRMZPSRMZPSRMZPSRMZPSRMZPSRMPSRMl' SRMZSRMZ SR
MZSRMZP SR
I'MS Centre
Slovak llydromctcorological Institute, BratislavaSlovak Mydrometeorological Institute, BratislavaSlovak Environment Agency, Banska BystricaSlovak Environment Agency, Banska BystricaSlovak Environment Agency, Banska BystricaSlovak Environment Agency, Banska BystricaGeological Service of the SR, BratislavaSoil Fertility Research Institute BratislavaForest Research Institute, ZvolcnFood Research Institute, BratislavaState Health Institute, Bratislava
Slate Health Institute, BratislavaSlovak 1 lydromctcorological Institute, Bratislava
Source: MZI'SR
The above listed PMSs are managed accor-ding to the concept of the Sectoral InformationSystem (SIS) of the MZP SR which was estab-lished by the National Council Act No. 261/1995Coll. on the SIS. The SIS consists of 18 subsystems:
1. Management of the SIS development of the MZP SR2. Internal SIS of the MZP SR3. Cross-sectional SIS of Administrative Activities4. Cross-sectional SIS of Economic and Administrative Activities5. Cross-sectional SIS of Specialist Activities6. Cross-sectional SIS of Scientific and Technological Information7. Environmental SIS8. Territorial SIS9. SIS of Monitoring
10. SIS of the Slovak Hydrometeorological Institute11. SIS of the Slovak Environment Agency12. SIS of the Geological Service of the SR13. SIS of the Slovak Environmental Inspectorate14. SIS of the Administration of the Slovak Caves15. SIS of the Administration of National Parks of the SR16. SIS of the State Environmental Fund17. SIS of Environmental Departments of State Administration18. Communication System of the SIS, sectoral network
Table 4 Budget of PMSs - overview (mil Sk)
Yeari 994199519961997
financial resources60.6
71.463.1
1 19.2
Source: MZPSR

State of the Environment Report - the Slovak Republic 1997
Environmentalpublications and periodicals
of the MZP SR
CERVENAMtnych *ut»v itiOin • f Kvticltov Sfl • CH
ENVIRO iAKCJT
NATIONALENVIRONMENTAL
ACTION PROGRAMME
AGENDAS[
•- ' •
Atlas Atlasgeotermalnej, ,of;Geotherrnal
energie EnergySlovenska of Slovakia
PROGRAMODPADOrtHO HDSPODARSTVASlOTtHSKEJ BEPUBLIHrDO RQKU200a

State of the Environment Report - the Slovak Republic 1997
Total Emissions of Basic Polluting SubstancesEmissions of basic polluting substances within the territory of the Slovak Republic are regularly monitored and
the results are updated in a database called "The Register of Emissions on Air Pollution Sources (REZZO) ; this
data has been recorded since 1985 by SHMU in Bratislava. The register is divided into 4 categories according to ihe
output, size and type of the source of the emissions:
REZZO 1 - stationary units for fuel combustion with a total thermal output of more than 5 MW (large pollution
sources with the heaviest impact on the environment). In addition to these, selected technologies are included. This
database comprises continually recorded data since 1985 with 982 facilitators of pollution sources being registered.
REZZO 2 - stationary units for fuel combustion with a total thermal output of 0.2 to 5 MW (medium pollution
sources with medium impact on the environment. Also include are certain selected technologies. The third data update,
completed in 1996, was carried out in co-operation with environmental offices within the period 1993-1996.
REZZO 3 - stationary local units for fuel combustion with small pollution sources with a total thermal output of less
than 0.2 MW. This database is being annually updated with emissions calculations based on the emission factors and
total fuel consumption data.
REZZO 4 - mobile units, regardless of their output. The COPERT Method, recommended by 'The Convention on
Long-range Transboundary Air Pollution (Geneva 1979) 'for its member states, is used for emission data calculation.
Data for 1996 are available.
Between 1996 and 1997, emission reductions in all fundamental polluting substances were recorded.
Table 5 Emissions of fundamental polluting substances (in thousand tonnes)
PollulingsubstanceSO,NO,SI'MCO
1989
569.022226.622320.991491.028
1990
538.977226.739299.368488.698
1991
441.89021 1.980229.608439.110
1992
377.634191.709
177.481
382.271
1993
323.175183.863143.318408.345
1994
235.763173.015
87.301
374.682
1995
236.386180.95088.978
404.639
1996
224.199139.55166.977
373.315
1997
199.228123.12360.290
345.975Source: SI IMU
Table 6 Total emissions of fundamental polluting substances (1997)
Source category
REZZO 1
REZZO 2*
REZZO 3
REZZO 4*
TOTAL
SO2
thous. t176.564
10.57712.087
199.228
%88.7
5.36
100.0
NOS
thous. I
70.5833.96
5.177
43.403
123.123
%57.3
3.2
4.2
35.3
100.0
COthou.s. I
141.636
12.03738.029
154.273: 345.975
%40.9
3.5
11.0
44.6
100.0
SI'Mllious. 1
36.6469.478
14.166
60.290
%60.815.7
23.5
100.0* tlata from 19% Source: SI IMU

Figure 2 Emissions of SO2
600
500
Figure 4 Specific territorial emissions of NOX (tonnes per km2)
Source: SHMU
Prt
o
W3
O
O
1989 1990 1991 1992 1993 1994 1995 1996 1997
oo
Note: Following records from The Convention on SO, Emissions Reduction (Helsinki 1985 ; accession of the for-mer Czechoslovak Socialist Republic notified in 1986 and succession of the Slovak Republic notified in Oslo 1994)the SR is obliged to reduce emissions of SO2 by 60% (by the year 2000) , by 65% by 2005 and by 72% by 2010- all values in comparison to 1980 values Source: SHMU
Figure 3 Specific territorial emissions of SO2 (tonnes per km2)
Source: SHMU
Figure 5 Emissions of NOX
250
200
1989 1990 1991 1992 1993 1994 1995 1996 1997
Note: According to the Protocol of "The Convention on NOX Emissions Reduction (Sofia 1988, accession ofthe former CSSR in 1988, succession of the SR in 1994) the main aim of the SR is to stabilise NOX emis-sions values by the year 1994, based on 1987 data on NOX emissions Source: SHMU
o*
-a
colCO-

Figure 6 Emissions of SPM
1989 1990 1991 1992 1993 1994 1995 1996 1997
Source: SHMU
Figure 7 Specific territorial emissions of SPM (tonnes per km2)
Source: SHMU
Figure 8 Specific territorial emissions of CO (tonnes per km2)
Figure 9 Emissions of CO
Source: SHMU
1989 1990 1991 1992 1993 1994 1995 1996 1997
Source: SHMU
l]1 - 5[ 5 - 1 0
CO
nW
O3
J
o
cr

State of the Environment Report - the Slovak Republic 1997
Total Emissions of Greenhouse GasesAccording to the summary for 1996, the total amount of CO2 anthropogenic emissions reached
46 mil tonnes (in 1990 it was 60 mil tonnes, in 1988 more than 61 mil tonnes).The CO2 retained in for-est ecosystems hovers around the level of 6 mil tonnes and since 1990, a moderate increase has been reg-istered.
Methane emissions have reached the level of 320 thousand tonnes (in 1990 it was more than 400thousand tonnes). N2O total emissions have been estimated at 8 thousand tonnes (as opposed to 13thousand tonnes in 1990). Greenhouse gases emissions peaked at the end of 1980's. Between 1990 and1994 a 25% decrease was registered. Since 1994, a slight increase in the amount of emissions has beenrecorded.
Figure 10 Individual sources and their percentage contribution to greenhouse gases emissions
Source: SHMU
Total Emissions of Volatile Organic CompoundsBased on the summary relating to year 1996, total emis-
sions of volatile organic compounds (VOC) reached 104 074tonnes (compared to 148 724 tonnes in 1990).
Table 7 Total emissions of VOC, sectors of their production division
Sector
Paintings ami adhesive utilisationChemical treatment and degreasing
Exploitation, transport and crude oilrefinementFuel distributionIndustrial organic chemistryIncineration & combustion processesFood-processingIndustrial production and metal processingWasteAgricultureIndustrial productsTransportTotal
Emissions 1990
tonnes3 2X1.1
() 650.5
22 386
3 623.96 436.7
1 1 4654 001.316248 298
6518 278
42 499148 724
%22.064.47
15.05
2.444.337.712.691.095.580.445.57
28.58100
Emissions 1993
tonnes1l) 34')10 36617313
3 673,63 51 8,911 3173 541,32 1361 572,5436
8 27842 161
123 663
%16.592.87
14.84
3.153.029.703.041.831.350.377.10
36.14100
Emissions 1996
tonnesi<; 122
12 108
12 657
3 8081 3863 8892 5252 108
526436
8 27837 231
104 074
%IS
1212
41422108
36100
Source: SHMU
10

State of the Environment Report - the Slovak Republic 1997
Table 8 Air quality standards for selected polluting substances
Polluting substance
Particuhite matterSulphur dioxideSulphur dioxide and particulatcmatterNitrogen oxidesCarbon monoxideOzoneLead in participate matterCadmium in particulate matterMa [odours substance
Expressed as
SO,SO2+p.p.
NO2
CO
O.i
I'b
Cd
Air quality standards (flg.m"')AQSV
6060
80
0.50.01
AQS,,150
150250*
1005 000
nuisl nol occur in concenlra
AQS,,,,
110
AQSS
500
500
20010 000
ions to he public nuisance* Caleulaled aridinielic sum of bnlli componenl's daily averages conecnlration
F.xplanal ion of symbols:
AQS; average annual concentration of the polluting substance
Average concentration is a mean concentration level recorded at a designated point within a span of one year. The result is givenin the form <>/ an arithmetic mean calculated from average daily concentrationsAQSt: average daily concentration of the polluting substanceAverage daily concentration is a mean concentration level recorded at a designated point within a pan of 24 hours. Average dailyconcentration is also understood as the mean of at least 12 (periodical) average concentration levels recorded every 30 minutes with-in a span of 24 hours (arithmetic mean)AQSHh: average 8-hour-concentration of the polluting substance
Average 8-hour-concentration is a mean concentration level recorded at a designated point within a span of 8 hoursAQSj average 30-minute-concentration oj the polluting substance
Average 30-minute-concentralion is a mean concentration level recorded at a designated point within a span of 30 minutesLimiting criteria: AQSj and AQSsfor parliculate matter, SO,, NOX and CO cannot be exceeded in the course of the year in morethan 5% of cases. - '
Local Air Pollution
32 local and 7 regional air pollution monitoringstations were in operation within the territory of theSlovak Republic in 1997.
11

State of the Environment Report - the Slovak Republic 1997
Figure 11 Localization of air pollution monitoring stations
PrešovKrompachy *
Rudňanv • * Vranov nad • HumennéJ Topľou • •
StrážskeJClsaVd Štúrova »z« . . , . , ,
í I d a . Galaktická •Milhostov
Handlová»Bystričany* L.£>
Lovca** Žiar nadHronom
Trnavskémýto Turbínová
námestieMamatevova
i Source: SUMU© Regional stations - HMI.LP - monitoring network
0 Other regional stations
• Local monitoring stations1 area of Bratislava2 area of Košice3 area of Banská Bystrica4 area of Žilina5 area of Ružomberok
Sulphur DioxideDaily ambient air limit of sulphur dioxide (an average daily concentration) was exceeded only in
the Horná Nitra region - station Handlová: 2.5% of days within a year.
Figure 12 Average annual concentrations of SO2 at the selected monitoring stations(AQS 60 Mg per m3)
60
50
40
30
20
10
0Uralisi;
Trnavskí
Mýto
Kosii* -
PodhraiiiiYii
• 1992
El 1993
D 1994
E! 1995
U 1996
• 1997
Source: SHMU
Nitrogen oxidesAQS(j level of an average daily concentration of 100 mg per m3 was most frequently exceed i
Bratislava 38.5% of days within a year. Average annual concentrations exceeded the yearly AQS; imissiolimits of 80 /u,g per m3 in Bratislava, Banská Bystrica and Žilina.
12

State of the Environment Report - the Slovak Republic 1997
Figure 13 Average annual concentrations of NOx at the selected monitoring stations (AQSy 80jug per m3)
200
180
160
140
120
100
80
60
40
20
0
• 1992
01993
• 1994
• 1995
01996
111997
Bralislava
TmavskcMvlo
KoSicc - I'rcsovodhnidnvi'i
Source: SHMU
Particulate MatterParticulate matter daily concentrations exceeded the AQS(I limit of 150 ̂ g per m3 most frequently
in Kosice 6.6% of days within a year. Paniculate matter air pollution exceeding the annual AQS; imissionlimit of 60 ng per m3 was recorded in some regions of the Central Slovakia and in Kosice.
Figure 14 Average annual concentration of particulate matter at the selected monitoring stations(AQSy 60 jag per m3)
• 1992
IS 1993
• 1994
BI995
01996
01997
I'rcsuv
Source: SHMU
Air Pollution Indices (API)More complex classification of air pollution is available through the air-pollution-indices-assess-
ment, based on the cumulative effect of selected pollutants. According to the air-pollution-indices-clas-sification, 11 out of a total number of evaluated monitoring stations were classified as those with heavypollution (pollution index 2 or more) which means a decrease of 1 station as opposed to year 1996.
Evaluation of the air pollution level, following the approved indices classification, was based on thehighest value of a pollution indices values most often equal to those of the daily air pollution index
13

State of the Environment Report - the Slovak Republic 1997
Table 9 Air pollution indices for year 1997
Area
Bratislava
Station
MamateyovaKamenné námTurbínová ul.Trnavskémýto
SenicaBanskáBystricaRužomberokŽiar nad
HronomHorná Nitra
Žilina
HnúSťaKošice
Veľká IdaPrešovKrompachyStrážskeVranov nadTopľouHumenné
nám. SlobodySásováSihoťŽiar nadHronomLovčicaPrievidzaHandlováBystričanyVeľkáOkružnáVlčince
PodhradováŠtúrova
APIyNOx0.70.60.71.3
0.41.20.90.50.3
0.30.60.30.31.0
0.70.40.30.80.40.60.40.40.5
0.2
so20.30.4
. 0.60.3
0.40.40.20.5. .0.3
0.50.71.00.70.5
0.40.30.30.40.70.40.60.20.3
0.2
PM0.80.60.80.7
0.61.00.6
-• 1 . 0
0.8
0.21.00.60.51.1
1.20.70.51.01.50.40.60.60.6
0.6
total1.81.62.12.3
1.42.61.72.01.4
1.02.31.91.52.6
2.31.41.12.02.61.41.61.21.4
1.0
API,,NO,
1.00.81.32.6
0.72.42.01.00.6
0.51.30.50.51.7
1.40.80.51.30.60.80.80.60.8
0.3
so20.40.40.60.3
0.60.40.30.60.5
0.60.71.30.80.6
0.50.40.30.40.90.30.60.20.2
0.2
PM0.60.40.60.5
0.50.80.41.30.6
0.20.90.50.50.9
1.00.60.40.71.20.30.60.40.5
0.4
total2.01.62.53.4
1.83.62.72.91.7
1.32.92.31.83.2
2.91.81.22.42.71.42.01.21.5
0.9
API,NO,
0.70.50.81.7
0.41.41.10.60.4
0.30.70.30.31.1
0.80.50.30.80.40.50.40.40.5
0.2
so20.10.10.20.1
0.20.20.10.20.2
0.20.30.40.30.2
0.20.10.10.10.30.10.20.10.1
0.1
PM0.20.20.20.2
0.80.20.20.40.2
0.10.30.20.10.3
0.40.20.10.30.50.10.50.20.2
0.5
total1.00.81.22.0
0.71.91.41.20.8
0.61.30.90.71.6
1.40.80.51.21.20.71.10.70.8
0.8Source: SHMU
Regional Air Pollution
Regional Concentration of Sulphur Dioxide and SulphatesIn 1997 regional concentration of sulphur dioxide (SO2-S) ranged between 1.15 /xgS per m3
(Chopok) and 7.81 /i.gS per m3 (Mochovce). Compared to the previous year, the values for sulphur dioxideconcentration have decreased at a majority of the monitoring stations excluding Mochovce and Liesek.The upper limit of the concentration range is equal to 78% of the sulphure dioxide critical concentrationlevel value (the critical value for forests and natural vegetation landcover is lOjugS per m3 and 15 /igS perm3 for agricultural crops).
In 1997, concentration of sulphates in atmospheric aerosol recorded by all regional monitoring sta-tions showed a reduction when compared to 1996. The lowest sulphates concentration was at the Chopokstation 0.69 /xgS per m3. On the contrary, the highest concentration was recorded at the Mochovce station1.94 /j,gS per m3. The percentage sulphates content in the total atmospheric aerosol volume was between11-16%.
Regional Concentration of Nitrogen OxidesConcentration of nitrogen oxides monitored at regional stations, stated as N02-N, varied from 1.3
to 3.8 ,ugN per m3. The lowest average concentration level of 1.3 /xgN per m3 was recorded at the Chopokstation, whereas the highest concentration level of 3.81 p,gN per m3 was recorded at the Topol'niky sta-tion in lowland territory of Slovakia.
In 1997 the critical concentration level of nitrogen oxides (9 /igN per m3 applied to all ecosystems)was not exceeded at any of regional monitoring stations.
Heavy Metals in Particulate MatterAt the majority of monitoring stations, heavy metals concentrations in atmospheric aerosol are
lower than in 1996. This data applies to the majority of heavy metals with the exception of the Chopokstation where only a decrease in the concentrations of copper, zinc and vanadium was recorded.
14

State of the Environment Report - the Slovak Republic 1997
Table 10 1997 Heavy metals concentrations in particulate matter - data supplied by the regionalmonitoring stations
ChopokMochovccTopoPnikyMilhostovSlarinaStarA Lesna
Liesck
I'MHR.m "-1
14.4
37.0
33.150.426.226.640.1
l'bng.m •'
4.217.420.531.117.530.820.2
Mn"S-m"'
3.37.1
7.0
8.2
4.0
5.116.5
Cung.m -'
1.83.64.65.6
3.4
7.66.0
Ctlng.m"3
0.20.40.60.7
0.5
0.6
0.6
Zn"S-m '•'
6.623.925.937.8
21.5
85.733.5
Ning.m J
3.12.50.8
2.4
1.6
1.34.1
Vng.m -1
0.62.23.52.5
1.6
1.42.5
Crng.m -1
1.70.81.31.0
1.(1
0.7
2.6
Source: SHMU
Analyses of atmospheric precipitation as well as pHmeasurement's indicate a slight decrease in acidity at the major-ity of monitoring stations.The pH value interval of monthlyprecipitation, fluctuated between A.4 (Chopok) and 5.8(Milhostov). This trend was not observed at Chopok and inBratislava where pH values indicated a slight decrease. Theamount of the precipitation varied from 524 mm (Milhostov)to 993 mm (Chopok).
Average ozone concentrations recorded on the territoryof Slovakia within the period of 1973 to 1993 indicated anincrease of approximately 1 ,ug per in1 per year. Since 1990, nosignificant changes within the whole of the Central Europeanregion have been obse'rved.
The annual average ground level ozone concentrationsmeasured in urban and industrial zones in 1997 fell into inter-val of 30-52 fxg per m\ On the rest of the Slovak territory,depending on altitude, values rose to 78 /zg per m3 (the Chopokhilltop station).
Within the whole Slovak territory, ozone exposure indexes AOT40 regarding agricultural crop andforest ecosystems were exceeded. At the upper tree line, the value doubled. Some stations recorded con-centrations higher than 180 /xg per nr' (information available to public); concentrations exceeding 360/xgper m3 (warning value for public) were not recorded.
15
State of the Environment Report - the Slovak Republic 1997
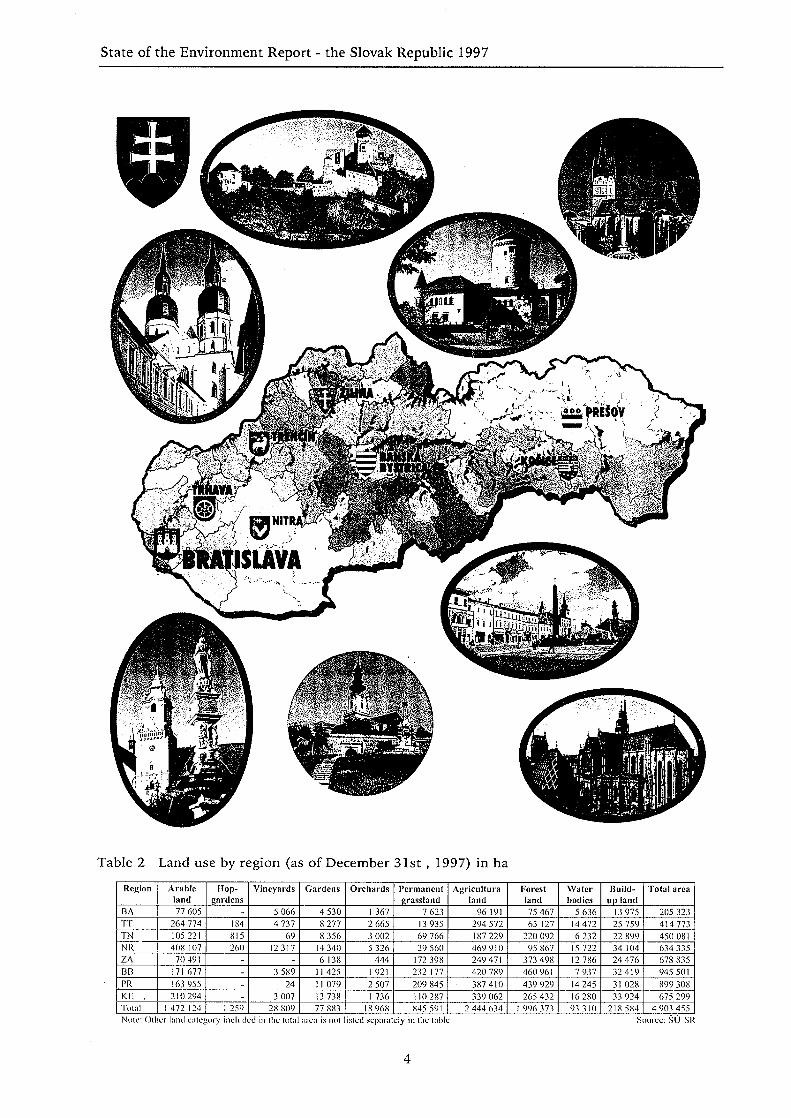
Water
Precipitation and Runoff Conditions
In 1997, total precipitation on the Slovak Republic territory reached value of 756 mm which re-presents 99% of standard.
Table 11 Average total precipitation on the territory of the Slovak Republic (1997)
Month
[mm]
% of standard
Surplus (+)/Delicit(-) [mm]
Rainfall periodcharacteristics
I.
19
41
-27
VS
II.
36
86-6
N
III.
22
47
-25
VS
IV.
50
91
-5
N
V.
78
103
2
N
VI.
89
1033
N
VII.
184
204
94
MV
VIII
50
62
-31
S
IX.
38
60
-25
S
X.
43
70
-18
S
XI.
109
176
47
VV
XII.
38
72
-15
S
Year
756
99-6
N
N - normal MV - extremely high rainfall S - dry VS - very dry VV - high rainfall Source: SHMU
Slovak rivers belong to 2 sea catchment areas:• the Black Sea catchment area that includes 10 subcatchment areas - the Danube, Morava, Vah, Hron,
Ipel', Slana, Hornad, Bodva and Bodrog (96% of the Slovak territory)• the Baltic Sea catchment area - 1 subcatchment area - the Poprad (4% of the Slovak territory)
Average annual water discharge value ranged from 50% to 120% of standard.
Table 12 Average amount of rainfall and runoff in the following catchment areas (1997)
Catchment areaSubcatchmentarea
catchment area|km2|averageprecipitation|mm|% of standardrainfall periodcharacteristicsannual runoff|mm|% of standard
Dunaj*Morava
2 282
690
101N
145
123
*Dunaj
1 138
539
86S
61
169
VahVah
14 268
893
106N
407
114
Nitra
4 501
672
97N
131
83
HronHron
5 465
721
92N
200
63
*Iper
3 649
568
83S
69
44
Slana
3217
655
83S
145
69
Bodrog a HornadBodva
858
695
95N
107
50
Hornad
4414
708
104N
207
91
*Bodrog
7 272
736
104N
201
86
*Poprada
Dunajec
1 950
984
117V
517
140
SR
49 014
756
99N
247
94' watercourses and all above mentioned data take into account only the Slovak part of their catchment area Source: SHMU
16

State of the Environment Report - the Slovak Republic 1997
In 1997, registered volume of water inflow into the Slovak territory overcame that of 1996 by1 027 mil m3. Total amount of water being accumulated in existing reservoirs in 1997 equals 179.6 mil m3.Total volume in existing reservoirs was increased by 87.1 mil m3 as of the end of 1997.
Table 13 Total hydrological balance (Slovak territory)
Hydrological balance
RainfallAnnual inflowAnnual runoffAnnual runoff from the territory of the SRWater management balanceTotal abstraction in the SREvaporation from water reservoirs and damsDischarge into surface watersImpact of water reservoirs
Total volume in water reservoirs as of 1st Januaryof the following year% of supply volume in accumulation water reservoirs
Volume |mil m3]
199641 12765 46579 99612 842
199737 05866 49278 23012 106
1 359.8
46.8971 160.314
144.878Accumulation
857.3
69
1 369.93546.42
1 114.62179.6
Accumulation944.4
76Source: SHMU
Surface Water ExploitationIn 1997 surface water abstraction recorded in the Slovak Republic reached the amount of 811.55
mil m3 that represents a decrease by 2.2% in comparison to the previous year. Industry with its 690.759mil m3 of water being abstracted is proved to be the major Slovak water abstractor. However, in 1997 aslight decline in water abstraction for industrial purposes (representing 1.7%) was observed, as comparedto 1996. Also water discharge in 1997 showed a slight decline by 3.9%.
Table 14 Surface water exploitation in the Slovak Republic (mil m3)
Year
1997
Publicwater
supplies73.843
Industry
690.759
Irrigation
46.91
Agriculture(excluding irrigation)
0.036
Total
811.55
Discharge
1 114.62Source: SHMU
Figure 15 Surface water exploitation in the SR in the period 1980-1997 (mil m3)
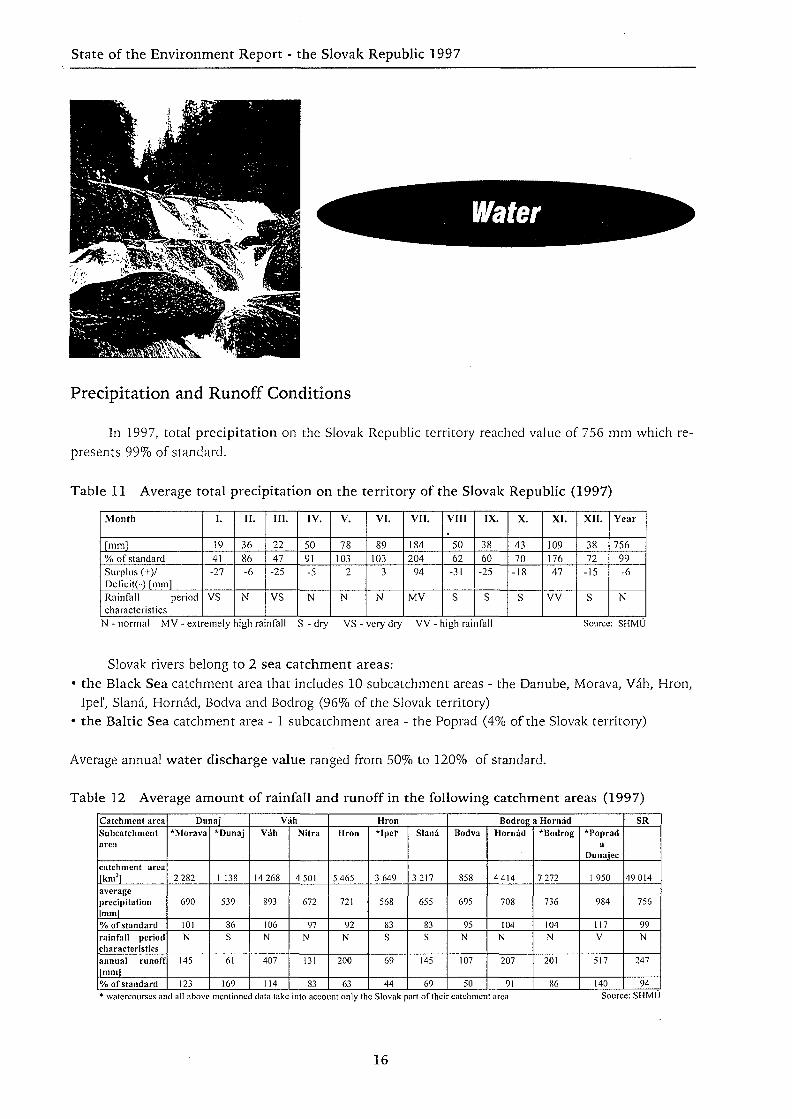
Surface Water QualityIn 1997, quality of surface water in Slovakia was monitored at 254 basic and 6 special sampling
sites. At the basic sampling sites, the following indicators were monitored: oxygen demand indicators
17

State of the Environment Report - the Slovak Republic 1997
(A-group), basic chemical indicators (B-group) and additional chemical indicators (C-group), biologicaland microbiological indicators (E-group). At selected places, also heavy metals (D-group) andradioactivity indicators (F-group) were monitored. Assessment process was carried out in compliancewith STN 75 7221 Standard. This standard recognises 5 water quality classes - from category I (veryclean water) to category V (extremely heavily polluted water).
Table 15 List of monitored surface water sampling sites (1997)
Catchment area
DunajV i h : • • • • • . • •• '••• . -
• H r o n • • • • • . . . • • • ' . . . •: • : "
: :.
:. . ' - . . • • . .. • • '
Bodrog a HornddTotal
Sampling sitesBasic
44' :'5652
102254
Special-5.16
Monitored length(km)
855.51 422.51 269.61 746.95 294.5
Source: SHMU
The River Danube Catchment AreaThe River Danube catchment area includes the River Danube, Maly Dunaj and Morava sub-
catchment areas. Monitored length 855.5 km represents 21.3% of total length of all watercourses belong-ing to the River Danube catchment area on the territory of the SR.
Table 16 Assessed length of watercourses with water quality belonging to the cetegory V (1997) (km)
Quality category V
A — groupB - groupC - groupD - groupE - groupmonitored lengthassessed length
SubcatchmentDunaj (Danube)
38.0183.0179.1
Morava33.3579.9533.35
1.8
356.5259.15
Maty Dunaj31.931.931.9
31.9316.0259.8
Indicators used for classification:A - group: biochemical oxygen demand (BOD5X chemical oxygen demand (CODc), O2B - group: specific conductivity, soluble solids (SS), insoluble solids (IS), N-NH4, N ^ , P,oUiC - group: extractible non-polar substances (ENP^v), SO4 'D — group: ZnE - group: coliform bacteria, saprobic index
Source: SHMU
The River Vah Catchment AreaThe River Vah catchment area includes the River Vah and Nitra subcatchment areas . Monitored
length of 1 422.5 km represents 17.9% of the total length of all watercourses belonging to the River Vahcatchment area.
Table 17 Assessed length of watercourses with water quality belonging to the category V (1997) (km)
Quality category V
A - groupB - groupC-groupE - groupmonitored lengthassessed length
SubcatchmentVah
29.1118.927.9
106.11021.1755.5
Nitra25.8
129.247.648.3
401.4286.0
Indicators used for classification:A - group BOD j , CODM,,, CODcr, O2
B - group IS, N-NH4, P^ui, pHC - group ENPuvE - group colifonn bacteria, saprobic index
Source: SHMU
18

State of the Environment Report - the Slovak Republic 1997
The River Hron Catchment AreaThe River Hron catchment area includes the River Hron, Ipel',and Slana subcatchment areas.
Monitored length of 1 269.6 km represents 21.6% of the total length of all watercourses belonging to theRiver Hron catchment area.
Table 18 Assessed length of watercourses with water quality belonging to the category V (1997) (km)
Quality category V
A — groupB - groupC-groupD-groupE — groupmonitored lengthassessed length
SubcatchmentHron
109.241.4
301.9528.9337.8
Ipel'5.3
17.617.5
88.7463.7224.4
Slana
54.460.7
155.2277.0179.9
Indicators used for classification:A - group CODCr
B - group IS, N-NH4, PtMh NorB.
Source: SUMUC- group ENI'uvE - group coliibrm bacteria
The River Bodrog and Hornad Catchment AreaThe River Bodrog and Hornad catchment area includes the River Bodrog, Tisa, Hornad, Bodva,
Poprad and Dunajec subcatchment areas . Monitored length of 1 746.9 km represents 19.5% of the totallength of all watercourses belonging to this catchment area.
Table 19 Assessed length of watercorses with water quality belonging to the category V (1997) (km)
Quality category V
A - groupB - groupC — groupD — groupE - groupmonitored lengthassessed length
SubcatchmentBodrog
33.8223.4
87.6551.4761.6571.8
Tisa
5.2
5.25.25.2
Hornad17.2
323.88.1
116.5406.5673.3485.3
Bodva
19.7
17.279.2
127.497.7
Poprad
72.3
76.3162.5139.5
Indicators used for classification:A - group BOD5, CODCr, O2
B - group pH, IS, Fc, Mn, N-NH4, P,olil|C - group SO,2'
Source: SHMUD - group Hg, Zn, CuE - group coliform bacteria, saprobic index
Groundwater LevelsIn 1997, average annual water levels in the SR varied in
comparison to their long-term average levels. Excluding thesouthern parts of Slovakia, average annual levels were close tothe long-term average levels. In the River Morava, Poprad,Laborec and Torysa catchment areas the difference wasbetween -20 cm and +30 cm; in the lower Vah area and Nitracatchment areas it was between -20 and +50cm; in the middle and upper Vah areas differences werebetween -60 and +40 cm; in the Hornad catchment area it was between -60 and +20 cm and in the
19
Table 20 Percentage of the water quality classes according to sampling sites on the monitored watercourses
too
Water qualitycategory according
to the STN75 7221 standard
I
II
in
IV
V
Total
year
199319941995199619971993199419951996199719931994199519961997199319941995199619971993199419951996199719931994199519961997
Aoxygen demand
indicators
Number*00000
8074
1149594
1179684
10510836312932435831131215
291232240244260
%00000
27.53247.53936.240.241354341.512.4132.1
13.116.519.9135.44.95.8
100100100100100
Bbasic chemical
indicators
Number*0000000000
5250
1141071126153747970
178129525878
291232240244260
%0000000000
17.92247.543.843.1212330.82.4
26.961.25521.723.830
100100100100100
cadditional chemical
indicators
Number*5048545163
7566656675363329283991636273623922302621
291232240244260
%17.22122.520.924.225.82827.12728.812.41412.111.51531.32725.829.923.913.41012.510.78.1
100100 ^100100100
E>heavy metals
Number*163326
5526342625513517121822152138401812242719
1629199
105108
%9.9331.95.6
342934.424.823.131.539
7.211.416.713.61621.236.23712.41324.225.717.6
100100100100100
Ebiological and
microbiolog. indicators
Number*0000060211
45332220227053
1199399
17014697
130138291232240244260
%000002.100.8 /0.4 '0.4
15.5149.28.28.5
24.12349.638.138.158.46340.453.353
100100100100100
Fradioactivity
indicators
Number*116522
1675
1220
14 .2462220000000
3019141828
%36.73235.711.17.2
53.33735.766.771.43.3
2114.322.221.4
6.71014.30000000
100100100100100
*- number of sampling sites Source: SHMU

State of the Environment Report - the Slovak Republic 1997
Ondava catchment area it was up to 40cm.In Southern Slovakia average annual water levels recorded were mostly lower than their corre-
sponding long-term average annual values. In the River Hron, Ipel' and Slana catchment areas valuesranged mostly from -50 or even -70 cm to 10-30 cm. In the River Bodrog catchment area only loweraverage annual levels (from -60 to -90 cm) were registered.
Springs EfficiencyIn 1997, average annual spring efficiency values within the territory of Slovakia varied consider-
ably. A significant difference was recorded mainly between the south of Slovakia and the rest of its terri-tory. In most parts of Slovakia (excluding southern areas) average annual spring efficiency values wereclose to long- term average annual spring efficiency values or they exceeded them. On the contrary, insouthern areas values recorded were significantly lower than long-term average values, reaching only40-90 % of total value (the Slana catchment area).
Groundwater ExtractionIn 1997, decrease by 5.9% (as compared to 1996) in groundwater extraction was recorded. The
amount of groundwater being extracted in 1997 reached 15 774.4 1 per sec. Total groundwater extractionin 1997 represents only 21.3% of total groundwater supply available on the territory of the SR.
Table 21 Groundwater exploitation in the SR
Year
1997 Ls-1
Public watersupplies
12 400
Food-processingindustry
373
Industryexcluding
food-processing
978
Agriculture &livestock
576
Cropproducts,irrigation
16
Socialsphere
346
Other
1 084Source: SIIMU
Decline in exploitation was also reflected in the assessment of total values being recorded in thefollowing years. Ratio of accessible amount of groundwater and exploited amount in 1996 equalled to4.42. In 1997, the value increased to 4.7.
Figure 16 Groundwater extraction in the SRin the period 1980-1997
25O0O ,
1980 1990 1991 1992 1993 1994 1995 1996 1997
El extraction in I per sec Source: SI IMU
Following the assessment of groundwater exploitation according to the purpose, it is possible tosay that Slovakia has recorded a water demand decline in all monitored spheres of life. However, in 1997groundwater extraction for the purposes of irrigation and agricultural crop production as well as for thepurposes of social sphere insignificantly increased. The most significant decrease was recorded in publicwater supplies (-785 1 per sec as related to 1996 value).
21

State of the Environment Report - the Slovak Republic 1997
Groundwater QualityGroundwater quality in the SR has been monitored since 1982 with a focus on 27 important
water management areas. In total, 291 monitoring stations within established monitoring networkgathered data with twice-a-year monitoring frequency.
The Zitny ostrov area belongs to one of the largest groundwater resource areas in the CentralEurope region. Logically, a great emphasis is placed on the Zitny ostrov groundwater quality standardthus creating a separate part of the Slovak groundwater monitoring network. In 1997, quality was mon-itored at 46 monitoring objects located in 4 areas with a frequency between 2 - 1 2 times a year.Groundwater sample analyses were carried out for the basic group of indicators, general organic sub-stances and special organic substances with regard to vulnerability and sensitivity of particular regions,bacteriological and biological analyses were not included.
Laboratory analyses results were evaluated in compliance with STN 75 7111 Standard 'DrinkingWater' through comparison of measured and limit values for all analysed indicators.
In the River Vah alluvium limit values as stated in STN 75 7111 Standard were most frequentlyexceeded for the following chemical elements and substances: Fe, ENPUV (Extractable Non-polarSubstances), nitrates, Mn, sulphates. In the River Vah - its lower part also CODMn, chlorides, volatile phe-noles released together with vapour and NH4
+ were exceeding limit values of their concentrations. Withregard to specific organic substances, TCE (1,1,2-trichloroethane) - at Sokolovce was detected. Excessiveoccurrence of Al was recorded in Zlien and Horenicka Horka.
The River Bela alluvium belongs to those Slovak regions with satisfactory groundwater quality.Excesive concentrations were detected only in Vavrisovo (Fe).
Groundwater samples gathered from the River Orava alluvium showed excessive concentrations ofFe, ENPuv and nitrogen compounds (NO,', NO2", NHi)
+).In the Kysucka kotlina basin groundwater resources continual contamination by ENP has been
observed. Unfavourable groundwater redox potential characteristic for this area demonstrates relativelyfrequent excessive amount of Fe and Mn limit values. In Rakova, excessive occurrence of Ai was recorded.
In the Turcianska kotlina basin area the most frequently recorded concentrations were those ofFe, ENPnv and Mn. In certain areas, also excessive concentrations of nitrogen compounds in Kost'any,Socovce, and Ivaneina were recorded.
Groundwater quality standard in the Strazovske Vrchy hills is consistently high. However, exces-sive content of ENPm, present in groundwater should not be ignored. In Hradiste and Diviaky nadNitricou excessive concentration of Fe and Al were registered.
Groundwater quality standard of the River Nitra alluvium changes when comparing the upperriver area to the middle river area. The upper river area enjoys a high groundwater quality standardexcluding Opatovce and Novaky. The quality of groundwater in the middle river area is to a high extentaffected by human activities. Increased content of ENPiiv, CODM , Fe, Mn, sulphates, chlorides andammonium ions was due to agricultural and industrial activities. Excessive occurrence of phenols wasfairly frequently recorded. Regarding chlorinated hydrocarbons, excessive amounts of TCE (in Novaky)and HCB (hexachlorobenzene) in Banov were found.
The characteristic features of groundwater in the Solosnicko-Pernecka quarternary alluviumarea are excessive concentrations of nitrogen compounds (caused by agriculture production) and Fe, Mn(unfavourable redox potential). As for organic substances groundwater contamination, excessive con-tents of phenols were recorded in Plavecky Mikulas, Plavecke Podhradie and Pernek. Comparing to 1996,groundwater quality standard monitored in 1997 improved. Excessive values of ENPuv and specific organ-ic substances were not recorded and as for Mn concentration it showed a decrease in the amount presentin groundwater. Groundwater bound to Mesozoic carbonatic complex of this area has satisfactory physi-co-chemical properties.
22

State of the Environment Report - the Slovak Republic 1997
Groundwater of the River Danube surrounded area (from Komarno to Sturovo) shows increasedmineralization caused by soil salinization, present only locally. Limit values were most frequently exceed-ed in the cases of Fe, Mn, phenols and sulphates. Locally, also higher contents of ENPuv, Cl, CODMn andMg were registered. In monitored groundwater, continual contamination caused by chlorinated organicsubstances was detected (Komarno - TCE contamination and Muzl'a - HCB contamination).
In the River Hron alluvium, anthropogenic contamination effects on groundwater are reflected inexcessive ENPuv, Fe, Mn concentrations (in some cases also of inorganic nitrogen forms). Excessive con-centrations of Al, Cr and As were detected in the area between Ziar nad Hronom and Zeliezovce.
Groundwater of the Nfzke Tatry Mesozoic shows fairly high quality standards, with the exceptionof ENP content.
IIV
Groundwater of the Neovolcanics area ranks among those of the highest quality standards beingmonitored within the territory of the SR and within the framework of the groundwater quality monitor-ing system.
Groundwater oxygen regime in the Krupinica and Litava valleys is considered to be inappropriateand is linked to increased Mn, Fe, NH4
+ and H2S content. As in 1996, higher ENPiiv content was detect-ed once again.
Groundwater quality in the River Ipel' alluvium is affected by the redox potential conditions ofthe environment and by athropogenic activities in this area. Higher Fe, Mn, and NH4
+ content is directlylinked to the above mentioned factors. Excessive ENPuv concentrations were also detected. Continuing inthe trends from the previous years, decreased nitrates and sulphates concentrations were again recorded.Increased Al ( heavy metal) concentrations were locally registered - such as in Bol'kovce.
In groundwater of the River Slana alluvium, high content of nitrogen compounds (NGy, NO2',NH4
+), sulphates, chlorides, Mn and Fe was recorded. ENPuv concentration still persists despite itsdecrease in comparison to 1996 value. Higher Al content were detected in some areas such as Betliar andRoznava.
Comparing to previous years, groundwater quality in the River Poprad alluvium remained stabile.Most frequently recorded excessive concentrations were those of groundwater quality indicators (such asFe, Mn, NO.,", NH4
H), resulting from redox potential conditions of the environment and from agricultur-al activities. Excessive Al contents were registered nearly at all monitored sites.
Groundwater in the River Hornad alluvium is persistently contaminated mainly by nitrogen sub-stances. Apart from that, increased Fe and Mn content raises concern amount specialists. Higher TCEcontent was recorded in Hutnfky - Sokol'any (81.7 g per 1) . Excessive ENPUV and heavy metals concen-trations were not detected.
Groundwater of the River Bodva alluvium is characterised by higher values of Fe, Mn, NH4+, H2S
that point out to a low content of dissolved oxygens. As for chlorinated hydrocarbonbs excessive con-centrations were recorded for 1,2-dichloroethane (in Budulov), 1,1,2,2-tetrachloroethene (in Moldavanad Bodvou) and 1,1,2-trichloroethene (in Budulov). Regarding heavy metals, excessive Al concentra-tions were found in Budulov and Buzica. Higher ENPUV contents were observed only in Buzica.
Groundwater quality standard of the Slovensky kras karst Mesozoic is relatively high thanks tohigh oxygen content.
Groundwater in the River Ondava alluvium area is very often not suitable for drinking purposesdue to excessive Fe, Mn, Al and ENPuv contents. In comparison to 1996 number of samples with higherNH4
+ concentration decreased.In the River Torysa alluvium, groundwater samples did not comply with STN 75 7111 Standard
because of excessive values of ENPiiv, nitrates and Al being recorded. However, comparing to 1996,groundwater quality standard improved as for content of nitrates and specific organic substances. Alsoexcessive Mn and Fe concentrations were not registered. Pecovska Nova Ves ranks among the most con-taminated areas within the River Torysa alluvium.
23

State of the Environment Report - the Slovak Republic 1997
Groundwater quality standard in the River Cirocha and Laborec alluvium is determined byreduction environment of the alluvium and by negative impact of anthropogenic pollution in this area.As a consequence, increased Fe, Mn, ammonium ions and nitrites concentrations were recorded. Nitrateslimit value was exceeded only in the case of groundwater sample taken from Michalovce - Topol'any(54.26 mg per 1). In comparison to 1996 higher trace elements contents were not detected. ENPuv con-tent was detected only in Michalovce-Topofany.
In the Medzibodrozie and River Ronava alluvium reduction conditions in their groundwateraquifers persisted and caused increased content of some water quality indicators such as ammonium ions,Fe and Mn. Due to anthropogenic pollution limit values of the following indicators were exceeded:• A l in S o m o t o r , P l e s a n y , C e r h o v ••••..
• Hg in Vel'ky Hores• Ni in Plesany• ENPuv in Somotor.
In Bratislava area groundwater contamination by sulphates, specific organic substances, ENPUV,phenols and chlorinated hydrocarbons still persists. The main contamination causing source is petro-chemical industry.
Regarding in situ measured groundwater quality indicators within the Zitny ostrov territory, dis-solved oxygen content did not comply with the limits set in all monitored sites; in some cases ground-water temperature (44 analyses), conductivity (17 analyses) and pH (4 analyses) did not meet the crite-ria.
With regard to other chemical elements, compounds and substances excessive values were record-ed for Fe, Mn, ammonium ions, nitrates, nitrites, CODMn, sulphates and fluoranthene. Excessive con-centrations of volatile phenoles released together with vapour and those of ENPuv were also detected. Alconcentrations were exceeded 4 times (Kalinkovo 721 291, KFucovec 736 692, Kvetoslavov 724 192,Ol'dza 601 192). From the organic substances group, excessive concentrations of the following com-pounds were recorded during analysing process:• benzo(e)pyrene (in Dobrohost', Dvorniky, Gabcikovo, Most pri Bratislave, Slovnaft, Kolarovo)• dichlorophenols (in Vel'ke Blahovo 729391)• 1,4-dichlorobenzene (in Gabcikovo)• benzene (in Vel'ke Blahovo)• l,l,dichloroethene (in Vel'ke Blahovo, Vlky)• hexachlorobenzene (in Vel'ky Meder).
When assessing groundwater quality standard on the ground ofSTN 75 7111 we must conclude that unfavourable results still prevail.As in the previous years, most frequent groundwater contaminants areENPuv, Fe and Mn. Frequent excessive Fe concentrations result frominadequate oxygen regime which causes heavy metals activation. Thisfact results from environmental conditions and anthropogenic impact.Regarding other indicators, most frequently recorded excessive concen-tration, were those of the following substances: inorganic nitrogenforms, chlorides, sulphates, H2S and chlorinated hydrocarbons. Alsoobserved was frequent Al occurrence. From trace elements, Hg, Ni, Asand Cr were only seldom detected.
Results of analyses have shown that in all monitored areas thegroundwater quality standard is affected by anthropogenic factorsexcluding areas with low concentrations of industrial zones and condi-tions not suitable for agricultural purposes.
24

State of the Environment Report - the Slovak Republic 1997
Contamination of Waste Water discharged intoWatercourses
In 1997, further slight decrease in the amount of wastewater discharge into the Slovak watercourses was observed.In numbers it represents a change from 1 139 980.643 thousand m3 per year to 1 108 538.075 thousandm3 per year. Equally, a decline in total amount of all assessed indicators, that is most obvious in treat-ed waste water, was registered.
Table 22 Contamination of waste water discharged into watercourses
Discharged wastewater
Treated
Untreated
Total
Volume(thous.m3.year"')
799 588.513
308 949.562
1 108 538.075
IS(t.year"1)
24 857.19
12 149.2
37 006.39
BOD5
(t.year'1)
18 167.08
4 434.41
22 601.49
COD C r
(t.year"1)
58 127.37
10 743.92
68 871.29
ENP(t.year-')
498.67
66.01
564.68Source: SHMU
Regarding the presence of nutrients in waste water only the amounts of ammonium-nitrogen wereanalysed. Amounts being discharged into different catchment areas on the territory of Slovakia are shownin the following chart.
Table 23 Discharged amount of N-NH4+ in waste waters in the following catchment areas (tonnes
per year)
N-NH4+
19961997
Danube535.1533.9
Vah3 137.4
2 966.3
Hron499.3487.1
Bodrog and Hornad1 079.11 030.5
SR5 250.95 017.8
Source: SHMU
Public Water-Supply and Sewerage SystemsIn 1997, the total number of inhabitants being supplied with water from public water supplies
reached 4 343.247 thousand which represents 80.8%. In T9'96Tit was 4 287.752 thousand inhabitantswhich equals to 79.7%.
The length of water supply network excluding service pipes was 22 040 km , that is 349 km morethan in 1996. The length of water supply network per capita with direct water supply was 5.07 m (5.05 min 1996). The number of service pipes reached 612 454 pcs which represents increase by 7 558 pcs incomparison to 1996. The length of service pipes system increased by 12 km thus reaching 4 898 km.The number of metering units rose by 4 533 pcs to the total number of 593 113 in 1997 (in comparisonto 1996). The total capacity of utilised water resources was 32 512 litre per sec in 1997. Comparing tothe state in 1996 it represents an increase by 478 1 per sec. In 1997, water management facilities 446.457mil m3 of drinking water which represents decrease by 14.077 mil m3 comparing to 1996.
25

State of the Environment Report - the Slovak Republic 1997
Figure 17 Supplying with drinking water from public water supplies (%)
RO
2 "2 78IE| 77
| 76
^ 75
74
1992 1993 1994 1995 1996 1997
•'•••••• Source: SU SR
Figure 18 Average water consumption in household (litre per capita per day)
2 0 0 ' 8 3 - ' ITOl171 S
I I I I I I II9')l 1992 1993 1994 1995 1996 1997
Source: 50 SR
Percentage of population connected to the public sewerage system increased by 39.98 thousand (com-pared to 1996) thus reaching 2 892.938 thousand inhabitants which equals 53.7% of the total population.
The length of sewerage network reached 5 940 km, which is an increase by 151 km (compared to1996). Per capita it means 2.05 m (2.02 m in 1996).
The total number of sewerage pipes rose to 187 765 pcs (174 667 pcs in 1996). The total length ofsewerage pipes system was 1 490 km (1 447 km in 1996).
The number of waste water treatment plants rose by 15 reaching 296.In 1997, the amount of waste waters discharged into watercourses via public sewerage system was
506.832 mil m-\ in 1996 it was 543.711 mil m3. It shows decrease by 36.879 mil m3.In 1997, the amount of treated waste waters discharged into public sewerage system reached
483 518 thousand m3. Treated waste water percentage was 95.4% as opposed to 93.5 % in 1996.
Figure 19 Percentage of population connected to public sewerage system.
54
5X5c
.2 53
f 515S. 52
| 51.5
I 5Ig 50.5
50
49.5
51.551.2 ^ _
I I I
53.7
• i l l1991 1992 1993 1994 1995 1996 1997
Source: SO SR
Table 24 Amount of waste water discharged to public sewerage system
YearAmount of waste water(mil m3)Amount of treated waste water(mil m3)Percentage of treated wastewater (%)
1991558.4
508.2
90.8
1992542.0
492.4
91.0
1993550.4
460.3
83.6
1994557.6
494.4
88.7
1995551.1
503.9
91.4
1996543.7
508.3
93.5
1997506.8
483.5
95.4
Source: SU SR
26

State of the Environment Report - the Slovak Republic 1997
i i
^^Z'^yi <,'!(
Drinking Water Quality
In 1997, 204 236 analyses of specified water quality
indicators in a total number of 13 794 samples taken from
3 090 sampling sites of distribution network were carried out
by VaK laboratories.
No significant changes between yeas 1996 and 1997 occurred in the quality standard of drinking
water produced and supplied to consumers by VaK . Percentage of drinking water samples not comply-
ing with the STN 75 71111 Standard 'Drinking Water' did not exceed the level of 5 %. Indicators most
considerably contributing to this percentage were identical to those of previous years and their limit va-
lues are specified in the above mentioned standard. The indicators with the highest limit value occurred
only in the minimal number of cases and indicators with limit value of acceptable risk were not present
at all.
Epidemiological Safety Indicators
In order to safeguard the purity of drinking water microbio-
logical and biological indicators of water quality must be regular-
ly monitored. Problem-causing indicators in 1997 were:
• cesspit (thermotollerant) coliform bacteria
• coliform bacteria
• enterococcus (cesspit streptococcus)
• psychophilic and mesophilic bacteria
• living organisms.
Table 25 Drinking water epidemiological safety indicators - results of monitoring in 1997 (in the SR)
Indicator
Cesspit coliform bacteriaColiform bacteriaEnterococcusMesophilic bacteriaPsychophilic bacteriaLiving organisms
Number ofanalyses11 75012 79012 58812 79312 7794 440
% of analyses complying with STN•'s ..,., standard
97.7394.3198.1398.4299.7298.27
Source: VUVH
Chemical Safety IndicatorsWith reference to inorganic water quality indicators in 1997, limit values of the following indica-
tors were most frequently exceeded: nitrates, manganese, iron, ammonium ions, nitrites. To a lesserextent drinking water pH and CODMn caused problems.
27

State of the Environment Report - the Slovak Republic 1997
Table 26 Drinking water inorganic quality indicators - the results of analyses carried out in 1997 (SR)
Indicator
NitratesManganeseIronAmmonium ionsNitritesWater pHCOD M n
Number ofanalyses8816
6 770
9 188
8 59910 300
9 026
10 568
% of analyses complying withSTN standard
99.0799.08
97.94
99.7499.74
97.08
99.82Source: VUVH
With regard to drinking water quality organic indicators, limit values specified in STN were not excee-ded, however, the frequency of their determination is significantly lower than it is with inorganic substances.
Within the group of radiological safety indicators total bulk activity Alpha and bulk activity of Radon222 were analysed . Total bulk activity Beta did not exceed limit values.
Table 27 Drinking water radiological safety indicators - results of analyses in 1997 (SR)Indicator
Total bulk activity AlphaBulk activity of Radon 222
Number of analyses
186167
% of analyses complying with STNstandard
95.1689.82
Source: VUVH
DisinfectionChlorination is currently the dominating method of disinfection. Limit value for active chlorine
content present in treated water is 0.3 mg per 1. In distribution network the minimal value of active chlo-rine should be 0.05 mg per 1.
In 1997, the percentage of non-compliant samples regarding the active chlorine content variedfrom 12 to 42%. Majority of analysed samples contained less than 0.05 mg per 1 of active chlorine or thepresence of active chlorine was not detected at all. These values concern samples taken from the distri-bution network.
Despite the fact that almost 40% of analysed samples taken from the distribution network con-tained less active chlorine than required, microbiological water quality complied with STN.
Geology
Endogeneous and exogenetic geological factors as mainfactors causing lithospheric changes significantly affect globaldevelopment of the Earth. These geofactors (objects andprocesses) can be divided into two categories - geobarriersand geopotentials - resulting from their impact on environ-mental quality changes. Geobarriers can cause:• direct threat to population (life losses)• efficiency and durability decrease regarding technical works• decrease in safety of technical works operation• damage to geological and nature environment inter-related to technical works impact.
One of the most promising geopotentials of the SR is represented by geothermal energy.
28

State of the Environment Report - the Slovak Republic 1997
Table 28 Volume of geothermal energy accessible (MW)
Verified155
Renewable resourcesPredicted
85
total: 561
Possible321
total:
Verified29
6 354
Non-renewable resourcesPredicted
445
total: 5 793
Possible5 319
Source: MZP SR
List and content of geofactors being monitored within the framework of CMS (Partial MonitoringSystem) Geological Factors are stated below.
Table 29 Structure of Partial Projects monitored within the framework of CMS 'Geological Factors'
of;
si
[02i:
03!
' • , •
. • • • •
04̂
I*-- ! . • • ; . "
0?
06
W.
08;
OS
•13; ]
•• Name of snbprojects -'Landslides and otherslope deformation
Koston processes:•:,y >::'%
Weathering proce«e«
• • • • . • . . . . • • • . • • • . ; • . ' • : • • : ;
Physical and chemical/;. :; sagging: of the basement••SollSfitV.':'••,.?-:•=;;• >fiy-:••".v V; J ,
' ; V - : 7 v ; . ; . . ' ••-'•-;••. •'•::: .-:y-.:'y-
Impact of mining 5 ; j sxactivities on the ?;;S;: i
• environment :;:; £:;;;; j;;j;:;ii
• . .'"•«•:• • : ; ; i :^" : i :i': :' ::-S'Sir";*:'':V i s '
Changes $V; ;:.:;<;•.Sfcjianthropbgeneouj;: i ;
The;stabflift,qf;:;i::.::':;';S:;Kbasement rocka under;historical monuments ;
Searching and;-;;;.' j; •;;:;; > •documenUtiod of the
anthropogeneous :
Tectonic and seismic
Sno^cpver^oality-j'^i-;:
moiUto]ring:ff:':':v::l''i:::KK
Monitoring of seismic •;:•;•events in fliieMfSS^WjActive stroini-sediment
Partial infoinaiaapiiWiljs y s t e m ' ' * : ; * i s ; ^ S : ; - : ?
" '_:• ;••• y:«'; :ii 5r;ft::Is»ne of concernMonitoring of areas sensitive to crashlandslides and research of the quality ofrealising remediation actions for theirminimisation
Research of evolution, tendency and dynamicof the processes influencing me recentgeomorhologic relief of the SR
Problems of the stability of line engineeringstructures after cutting of rock massifs - fromthe poit of view of supplies of weatheredmaterial released from unprotected rockblocksStability of the areas consisting of thick layersof loess in which as a consequence ofdrenching and/or vertical additional loadoccurs desintegration of 1heir structure andreduction of their volumeDetermination and monitoring of damages inthe environment arising from mining activities(subsidence processes, changes inhydrological current, chemical composition ofwater and soil etc.)
Study of changes occured in the fine-grainedsediments of settling pits of various origin
Study of gravitational slope events, evaluationof causes of their origin and specification ofother secondary factors (i.e. climate etc.)affecting these eventsDocumentation of "hidden1 anthropogeneousdeposits filled by waste of various origin inthe sites of previous mining activities
Study and evaluation of movement activity ofgeological structures and relative ratemovement along the faults
Country - wide evaluation of chemicalcomposition of the snow cover on the territoryof the SR from the point of view of their impacton groundwater reserves, chemicalcomposition of groundwater, soil acidificationand contamination of the environment of the SR
Continuous registration of seismic events onthe territory of SlovakiaFocus on effects of human activities on thequality of active stream sediments andevaluation of their impact on the quality ofsurface waterIS2PSR
Locality• Western Carpathian flysch sediments territory (Harvelka,
KlieStini, Liptovsld Mara, OkolifcniS a Oravsky Podzamok)• Neogene depressions: (Hlohovec a ViStuk),• Neovolcanic areas and Core Mountains (Slanske vrchy
Mountain: Velicalzra, KoSicky Klecenov, Sokof)• Harmanec, Liptovske" Man'a$ovcc-Huty, Banska Stiavnica• Myjavska pahorkatma Upland, Hornonitrianska kotlina
Basin, Krupinski planina Plateau• Kohut zone of Vepor area, Flysch belt, Klippen belt,
Central Carphatian Pateogene• PreSovska kotlina Basin, V^chodoslovenskd panva BasinMalinec, Kostelec pri Ducovom, Cervena skala near Podbiel,LiptovskJ Hradok, Banska1 Stiavnica, Liptovske MatiaSovce -Huty, Nova1 Bystrica, Bratislava - Sldviiie udolic Valley,Harmancc, Lipovnfk - Jablonov n. Tun'iou, Slarina, Demjata
• TmavskS pahorkatina Upland• Nitrianskapahorkatina Upland
• Localities with considerable level of disruption of theenvironment: Rudnany-PoraC, Banska Stiavnica, Smolnik,Novoveska Huta, Bind-Zavadka, Slovinky-Gelnica,JcBava-Lubcnlk-Burda-Ploski, KoSice-Bankov, Handlovaand Cigcl' brown coal-fields, Pezinok, Spania dolina Valley,Liptovska Diibrava, Roinava ore-field, Ni&a Slana,Novaky coal-mine, Bai^a Dolina-Modry Kamefi coal mine,HnuSl'a-Mutnik
• Ash from the power station Novaky: Zemianske Kostol'any,BystriJany-Chalmovd, Chalmova
• Sludge and sediments coming from the extraction andprocessing of ore minerals in the locality Banska Stiavnica:slime beds (tailings) 7 iien and Lintych
• Industrial sludge from the Duslo Sala chemical plant: slimebeds (tailings) Amcrika and RSTO
Strecno Castle, SpiJsky hrad Castle, Skalka Cloister, Plavecand Lietava Castle
• Great Bratislava area• area of Zitny ostrov zone• selected areas of the Middle Slovakia region (Stiavnicke1
and Krcninicke vrchy Mountains, Starohorske vrchyMountains, Nizke Tatry Mountains - North and South),etc...
Institutions and seismic stations of the Geophysical Instituteof the Slovak Academy of Sciences: ZST (Bratislava), MOD(Modra),MB (Hurbanovo), SRO (Srobarova), VYH(Vyhne), SPC (Skalnati Pleso), KOS (KoSice)Approximately 44 sampling sites: Bratislava-Slovnaft andZeleznd studienka, Pernek, Skalica, Stary Hrozenkov,Trcnfianskc Jastrabic, Homolka, Nitra, Patincc, Opavski horaMount, BanskJ Studenec, Lehfltka pod Brehy, Handlova -Nova Lehota, Podhradie pri Novikoch, Martinski hole,Vratna dolina Valley, OSSadnica, Lokca, Ruzomberok,T'.upcianska dolina Valley, Donovaly, Homy Tisovnik atd'.Seismic stations of the Geophysical Institute of the SlovakAcademy of SciencesIt is proposed to establish the monitoring network with 47reference sampling sites
Geological Service of the SR Bratislava
Zdroj: GS SR
29

State of the Environment Report - the Slovak Republic 1997
Maintenance of Old Mining WorksDuring inventory process (1992-1996) o:
mining works the following objects were registc203 shafts, 4 971 mine adits, 6 sludge pits, 4 200 pand ping drifts, 6 025 pit heaps and 1 142 gangwa)mining drifts 16 547 objects altogether on the terriof the SR. Documentation for each of the above ntioned objects has been elaborated; it containsfollowing information:
• localization• geological data• technical data
• other important data referring to the object includdata on its impact on the environment.
This information pack is available in a digital form (at scale 1:10 000). Special-purpose mapsscales 1:50 000 and 1:400 000 have been prepared. At present, MZP SR is preparing data regarding stpliers' selection for maintenance and destruction of old mining works with recorded negative impactsthe environment.
Table 30 Fuel deposits (1997) Table 32 Non-metallic ore deposits (199
Raw material
GasolineNon-bitumen gasesNon-paraffin oilSemi-paraffin oilNatural gasAnthraciteBrown coalLigniteUranium oreBitumen sediments
Number of depositsI*82
49
391
13831
II*6036
2417611
I* - deposits included in Hie balanceII* - deposits with tree balance resources
Table 31 Ore deposits (1997)
Source: CIS SR
Type of ore
Sb oresSn oresComplex Fe oresMn oresCu oresNi, Co oresHg oresOther oresPoly-metallic oresPyriteWolfram oresGold and silver oresFe oresMolybdenum ores
Number of deposits1*11
1124
24151
1542
1252
11*314031(10601630
I* - deposits included in the balanceII* - deposits with free balance resources
Source: GS SR
Raw material
AnhydrideAsbestosBaryteBentoniteCast basaltDecorative rockDiatomitcDolomitellalloysiteRock saltKaolinKaolinitic clayKaolinitic sandsCeramic materialsQuartzQuart/.iteMagncsiteTalcPearlitePyriteGypsumSialitic raw materialsBuilding rockGravel sands and sandsBrick clayTech. usable mineral crystalsLimestone-unspecifiedHigh-content limestoneCalcateous marlZeoliteFoundry sandsRefractory clayTotal
Number of deposits1*546
16
5
202
1723516
278
10
126544
141744283
1241245
2010
566
II*522
145
182
1723216
208
!l)103504
131673773
123113577
495Source: GS SR
H* - deposits with free balance resources
30

State of the Environment Report - the Slovak Republic 1997
In 1997, in total there was 49.9% of agricultural land and 51.1% of non-agricultural land in the SR.In comparison to 1996 agricultural land area increased by 189 ha, forest land area increased by 3 007 haand build-up area by 22 441 ha. The other area decreased by 25 000 ha.
Table 33 Total area of the main land categories (state as of December 31st, 1997)
Land categoryAgricultural landForest landWater bodiesBuild-up landOther landTotal area
Area (ha)2 444 6341 996 373
93 310218 584150 554
4 903 455
% of total area49.940.7
1.94.43.1
100.0Source: UGKK SR
Year 1997 was the first year of the second stage of the statesoil monitoring system. Soil samples were gathered from all sitesof the basic monitoring network that means 312 monitoring siteson agricultural land and from 21 key monitoring sites. Currentlythe analyses of the gathered samples are being carried out.Therefore, the listed data regarding the amount of contaminantsare related to soil contamination in 1996.
31
State of the Environment Report - the Slovak Republic 1997
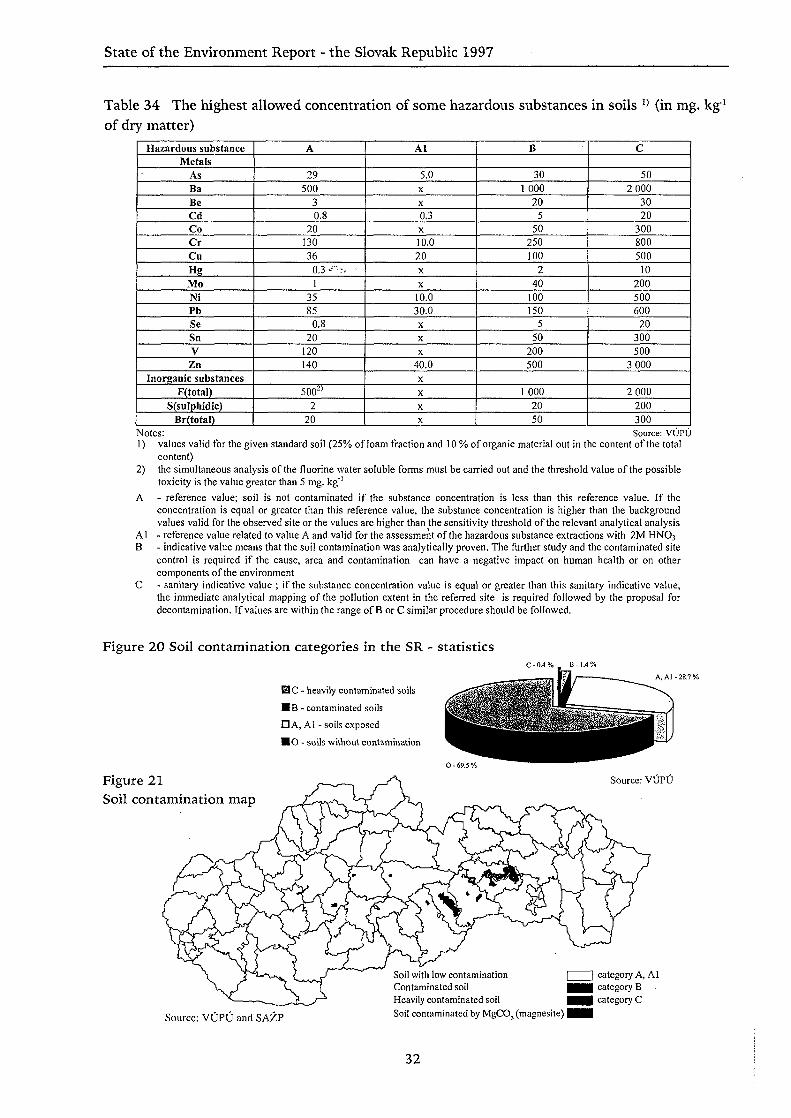
Table 34 The highest allowed concentration of some hazardous substances in soils l) (in mg. kg1
of dry matter)Hazardous substance
MetalsAsBaBeCdCoCrCuHgMoNiPbSeSnV
ZnInorganic substances
F(total)S(su)phidic)
Br(total)
A
29500
30.8
2013036
0 .3 - - • • • - -
I3585
0.820
120140
5002)
220
Al
5.0X
X
0.3X
10.020X
X
10.030.0
X
X
X
40.0X
X
X
X
B
301000
205
50250100
240
100150
550
200500
1 0002050
C
502 000
3020
300800500
10200500600
20300500
3 000
2 000200300
Notes: Source: VUPU1) values valid for the given standard soil (25% of loam fraction and 10 % of organic material out in the content of the total
content)2) the simultaneous analysis of the fluorine water soluble forms must be carried out and the threshold value of the possible
toxicity is the value greater than 5 mg. kg"1
A - reference value; soil is not contaminated if the substance concentration is less than this reference value. If theconcentration is equal or greater than this reference value, the substance concentration is higher than the backgroundvalues valid for the observed site or the values are higher than the sensitivity threshold of the relevant analytical analysis
Al - reference value related to value A and valid for the assessment of the hazardous substance extractions with 2M HNO3
B - indicative value means that the soil contamination was analytically proven. The further study and the contaminated sitecontrol is required if the cause, area and contamination can have a negative impact on human health or on othercomponents of the environment
C - sanitary indicative value ; if the substance concentration value is equal or greater than this sanitary indicative value,the immediate analytical mapping of the pollution extent in the referred site is required followed by the proposal fordecontamination. If values are within the range of B or C similar procedure should be followed.
Figure 20 Soil contamination categories in the SR - statistics
0 C - heavily contaminated soils
KB - contaminated soils
DA, Al - soils exposed
• O - soils without contamination
Figure 21Soil contamination map
C-0.4%. B-l.4%
A,Al-28.7%
Source: VUPU
Source: VUPU and SAZP
Soil with low contamination [Contaminated soil |Heavily contaminated soil |Soil contaminated by MgCO3 (magnesite) I
category A, Alcategory Bcategory C
32

State of the Environment Report - the Slovak Republic 1997
On the Slovak territory the relations between occurrence of some trace elements and the soil attri-butes are rather complicated, especially in mountain ranges proximity, due to the endogenneous geo-chemical anomalies. However, the results of monitoring indicate that the soils in the SR are contamina-ted by hazardous substances at relatively low level. Note that the greatest part of the category A, Al(category with the largest area) is represented by forest land. Soils with significant contamination repre-sent only 1.4% of the category B and 0.4% of the category C.
The analyses of mobile and potential mobile forms of trace elements are very important in relationto the risk assessment of their possible penetration entry into the food chain and biological circulationwith negative impacts on mankind and the environment. The order of trace elements share bound byplants in comparison to total accessible content is as follows: Cd > Zn > Ni > Pb > Cu > Cr.Due to this fact, Cd and also Zn and Ni are the trace elements of extra importance. Zn and Cu are clas-sified at mainly lower levels as micronutrients rather than contaminants. The mobility of Cr is very low.
Figure 22 Cadmium content (extraction with 2M HNO3) in the upper soil horizon in the SR
<0.1 ppm• 0.1 -0.2 ppm• 0.2-0.3 ppmlH 0.3 -0.4 ppm
Source: VUPU
Figure 23 Plumbum content (extraction with 2M HNO3) in the upper soil horizon in the SR
P I 0.4-0.5 ppm• 0.5-0.6 ppmB >0-6 PPm
H < 10 ppm HO 30-40 ppm• 10-20 ppm S 40-50 ppm• 20-30 ppm H > 50 ppm
Source: VUPU
33

State of the Environment Report - the Slovak Republic 1997
/ i»;':;/; j *;'.} v 5 '4/'iy --Vri1! l!^
The graph represents the both increase and decrease inthe soil reaction in CaCl2 since 1994 monitored on the keysites. Significant decrease of pH in CaCl2 observed during1995 and 1996 was replaced by an increase of pH to 76% in1997.
Figure 24 pH changes in CaCl on key sites
19941996
1997
decrease of pH
increase of pH
Source: VUPU
Considering total acreage of agricultural land in the SR,presently 40% out of total, are soils heavily affected by watererosion. As for deflation 5% of agricultural land would fallinto category of mild intensity and only 2% would belong tothe strong erosion intensity category. For these numbersbeing low and insignificant in the overall context, this erosionform currently is not subject of the monitoring.
34

State of the Environment Report - the Slovak Republic 1997
Flora and Fauna
National Strategy of Biodiversity Protection in the Slovak Republic was approved by theGovernment of the SR on April 1st 1997 and by the Slovak National Council on July 2nd 1997, follow-ing the ratification of the Convention on Biological Diversity (Rio de Janeiro, 1992) from May 19th 1993.
The evaluation of potentionally endangered and threa-tened species of wild growing plants is based on the study byMarhold K. & Hindak F. (eds.), 1998 called: 'Checklist ofnon-vascular and vascular plants of Slovakia.' (Veda, pub-lishing house of SAV, Bratislava, 687 pp.). The Checklist was
compiled within a framework of the state project order No. 5305/025 called 'Biodiversity of Slovak Flora'.Also international project 'Kartierung der Flora der Slowakei' coordinated by the Austrian Academy ofSciences was used as supportive material during the elaboration process.
Table 35 Endagered flora species in 1997
Group
Cyanophytes andAlgaeLower FungiHigher FungiLichensBryophytesVascular Plants
Total number of taxonsWorld estimation
50 000
80 00020 00020 00020 000 .
Slovakia2 989
12952 4691508
9054 178
Endangered (1UCN categories)Ex
1003039
E
2012961
173
Vm
00
321
V
4624961
263
R
70100195297
I
18169170
Ed
127Source: BU SAV
35

State of the Environment Report - the Slovak Republic 1997
Figure 25 Statistics comparing total number of plant taxons toendangered taxons
Total number
Endangered taxons- IUCN catagorisation
Vascular plants Uryophytcs Higher fungi
Source: BU SAV
Figure 26 Endangered taxons within IUCN categorisation- Vascular plants
Source: BU SAV
Figure 27 Endangered taxons within IUCN categorisation - Bryophytes
Legend:
Ex - extinctE - critically endangeredV - vulnerable / endangeredR - rareI - indeterminatedVm - very sensitiveEd — endemic species
40
35
30
25
% 2 0
Ex Vm V R I
Source: BU SAV
In 1997, 4 319 to date known sites with presence of rare and endangered species were monitoredand presence of species was confirmed. 536 sites were recorded for the first time and 32 sites were with-drawn from the inventory.
The total number of species under state protection remained unchanged since 1958 (the Regulationof the Deputy of Education and Culture No.21/1958 Coll. from December 23rd 1958 on Protected Speciesof Plants and Protection Conditions). In total, legislative protection is applied to 127 taxons on species andsubspecies level, one family and 9 genuses (252 taxons of vascular plants altogether).
In the period of 1983-1996, 57 proposals of the specific protection regime plans were elaborat-ed mainly for critically endangered plant species. In 1997, plans of the specific protection regime for thefollowing species were completed:• Anacamptis pyramidalis• Juncus sphaerocarpus• Carex buxbaumanii
36
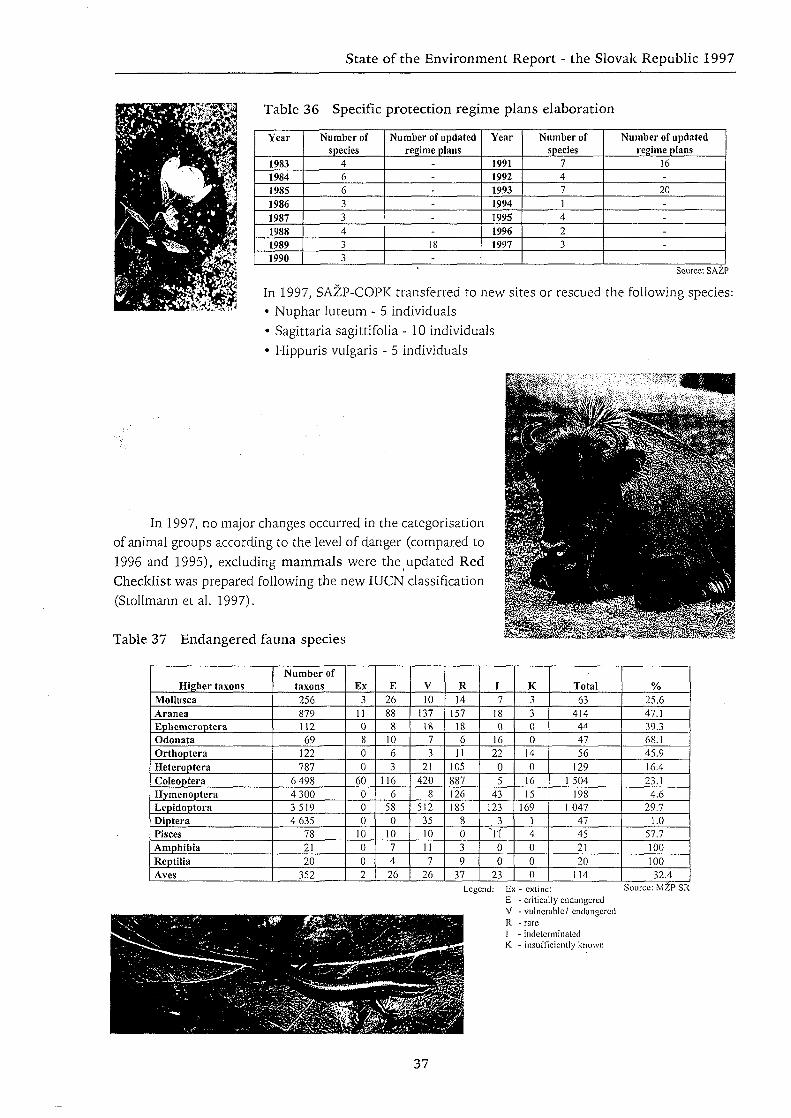
State of the Environment Report - the Slovak Republic 1997
Table 36 Specific protection regime plans elaboration
Year
19831984198519861987198819891990
Number ofspecies
4
663343
3
Number of updatedregime plans
------18
-
Year
1991199219931994199519961997
Number ofspecies
74
71423
Number of updatedregime plans
16-
20----
Source: SAZP
In 1997, SAZP-COPK transferred to new sites or rescued the following species:• Nuphar luteum - 5 individuals• Sagittaria sagittifolia - 10 individuals• Hippuris vulgaris - 5 individuals
In 1997, no major changes occurred in the categorisationof animal groups according to the level of danger (compared to1996 and 1995), excluding mammals were theupdated RedChecklist was prepared following the new IUCN classification(Stollmann et al. 1997).
Table 37 Endangered fauna species
Higher taxonsMolluscaAraneaEphcmcropteraOdonataOrthopteraHeteroptcraColeopteraHymenopteraLepidoptoraDipteraPiscesAmphibiaReptiliaAvcs
Number oftaxons256879112
69122787
6 4984 30035194 635
782120
352
Ex3
110
800
60000
10002
E2688
81063
1166
580
107426
V10
137
18
73
21420
85123510117
26
R14
157186
11105887126185
8039
37
I7
180
16
2205
43123
3'ft
00
23
K33
0
0140
1615
169
14000
Total63
414
44
4756
1291504
1981 047
47452120
114
%25.647.139.368.145.916.423.14.6
29.71.0
57.710010032.4
Legend: Ex - extinct£ - critically endangeredV - vulnerable/ endangeredR - rare1 - indeterminaledK - insufficiently known
Source: MZI> SR
37
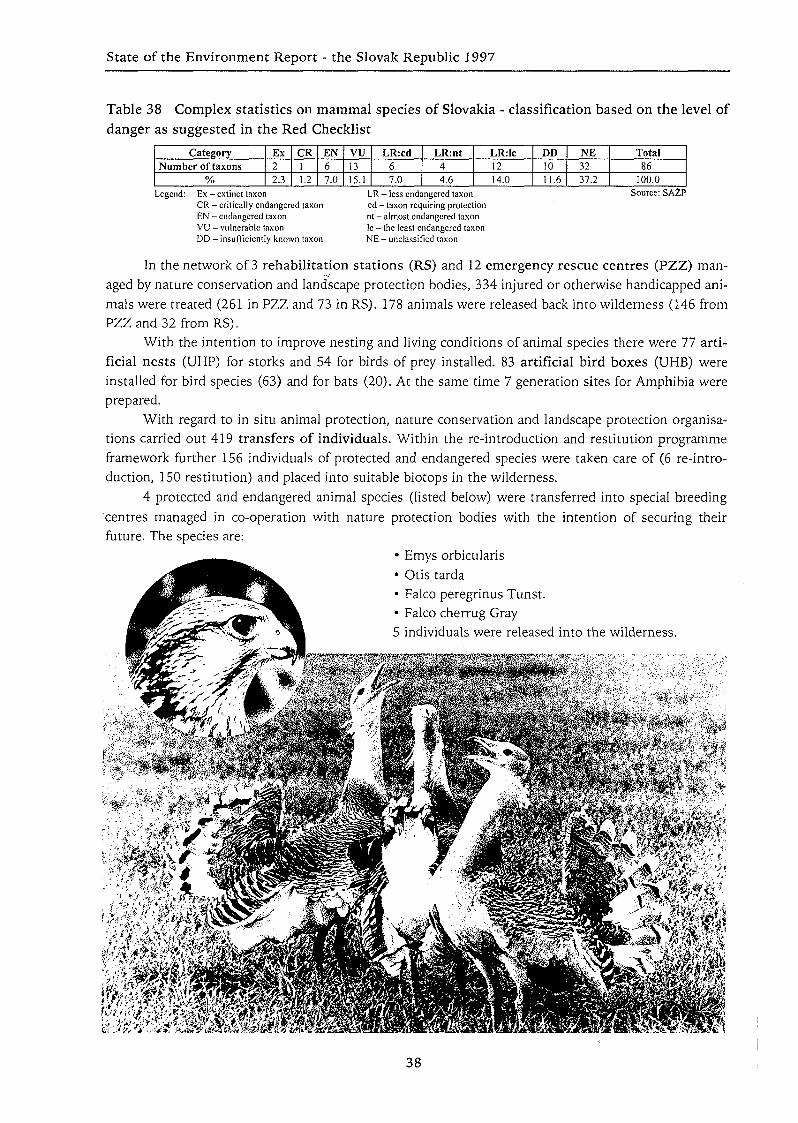
State of the Environment Report - the Slovak Republic 1997
Table 38 Complex statistics on mammal species of Slovakia - classification based on the level ofdanger as suggested in the Red Checklist
CategoryNumber of taxons
%
Ex22.3
CR11.2
EN67.0
vu1315.1
LR:cd67.0
LR:nt4
4.6
LR.Ic1214.0
DD1011.6
NE3237.2
Total86
100.0Legend: Ex - extinct taxon
CR - critically endangered taxonEN - endangered taxonVU - vulnerable taxonDD - insufficiently known taxon
LR - less endangered taxoncd - taxon requiring protectionnt - almost endangered taxonlc - the least endangered taxonNE - unclassified taxon
Source: SAZP
In the network of 3 rehabilitation stations (RS) and 12 emergency rescue centres (PZZ) man-aged by nature conservation and landscape protection bodies, 334 injured or otherwise handicapped ani-mals were treated (261 in PZZ and 73 in RS). 178 animals were released back into wilderness (146 fromPZZ and 32 from RS).
With the intention to improve nesting and living conditions of animal species there were 77 arti-ficial nests (UHP) for storks and 54 for birds of prey installed. 83 artificial bird boxes (UHB) wereinstalled for bird species (63) and for bats (20). At the same time 7 generation sites for Amphibia wereprepared.
With regard to in situ animal protection, nature conservation and landscape protection organisa-tions carried out 419 transfers of individuals. Within the re-introduction and restitution programmeframework further 156 individuals of protected and endangered species were taken care of (6 re-intro-duction, 150 restitution) and placed into suitable biotops in the wilderness.
4 protected and endangered animal species (listed below) were transferred into special breedingcentres managed in co-operation with nature protection bodies with the intention of securing theirfuture. The species are:
• Emys orbicularis• Otis tarda• Falco peregrinus Tunst.• Falco cherrug Gray5 individuals were released into the wilderness.
'< 4
38

State of the Environment Report - the Slovak Republic 1997
Nature and Landscapeprotection
Natural Heritage
In accordance with the NCSR (National Council of the Slovak Republic) Act No.287/1994 Coll. onNature and Landscape Protection, the system of complex nature and landscape protection has beendesigned based on five levels of protection .
I. level of protection- the territory of the SR not included in anyof the higher levels of protection
II. level of protection - Protected Landscape Area (PLA)III. level of protection - National Park (NP)IV. level of protection - Protected Site (PS)V. level of protection - Nature Reserve (NR)
- Nature Monument (NM)- National Nature Reserve (NNR)- National Nature Monument (NNM)
In 1997, 56 protected area proposals were elaborated and 15 new NR with total area of 3 214 ha,5 NM with total area 86 ha and 3 PS with total area of 129 ha were designated. With regard to large-scaleprotected areas 2 new national parks were designated, namely NP Muranska Planina Plateau with atotal area of 20 318 ha (former PLA) and NP Poloniny with the total area 29 805 ha (formerly part ofPLA Vychodne Karpaty). The law on their designation came into effect on October 1st, 1997.
Furthermore, 3 protected sites were withdrawn from the list of protected areas of Slovakia.
Table 39 Categories of Protected Areas in the SR (as of December 3Lst ,1997)
Category
Protected Landscape ArejiNational ParkProtected Site-Nature ReserveNational Nature ReserveNature MonumentNational Nature Monument
Number
157
17434722921445
Area of protected territory(ha)
598 5X5243 219
4 397.744713 885.438082 121.89071 377.0270
55.3181
Area of protective zone(ha)
-238 124
2 263.2476318.4179
3 162.2489232.6567
26.6225Source: SAZI', S NP SR
Within the 4th and 5th levels of protection, 270 protected areas with a total area of 19 805 ha arelocated within designated PLA boundaries, 192 protected areas with a total area 63 691 ha are locatedwithin designated NP boundaries and their protective zones. 547 protected areas lie outside designatedPLA, NP and their protective zones. Protected areas belonging to the 4th and 5th levels of protection sta-tistics based on 3 categories according to the level of potential danger are listed in the following table.
39

State of the Environment Report - the Slovak Republic 1997
Table 40 The Categories of Protected Areas as of December 31st, 1997
Category
NNRNRPSNNMNM
Number
22934717445
214
Area *(ha)
82 12213 8854 398
551 377
OptimalNumber1501814730
118
Area69 147
9 9211334
22938
ThreatenedNumber
77161961593
Area12 9523 9052 092
33421
DegradedNumber
25
31-3
Area2359
972-18
*area excluding protective zone Source: SAZP, SNPSR
Figure 28Protected Areasof the SR
nutiona! parkp ot te hn 1 c | e aforest Source: MZPSR
• national nature monumenta nature monument• national nature reserve '-. nature reserveA protected site
Category Optimal Protected Area referers to all pro-tected areas where subject of protection is not threatened byhuman activities and develops according to protectionobjectives. Category Threatened Protected Area refers toall protected areas where subject of protection is being negatively affected by human activities to suchextent that without regulation measures its existence is threatened. Category Degraded Protected Arearefers to all protected areas where changes, respectively destruction of natural ecosystem were causedeither by human activities or evolution.
From the total number of 1 009 small-size protected areas:• 41 fall into category Degraded (representing 1% of the total
area)• 442 fall into category Threatened (19% of the total area)• 526 fall into category Optimal (80% of the total area)The most serious situation is in the group Protected Site where:• 17.82% of areas fall into category Degraded (22.10% of the
total area)• 55.17% of areas fall into category Threatened (45.57% of the
total area).In the group Nature Reserve 46.39% (28.13% of the total
area) fall into category Threatened. In the group Nature Monument 43.35% (30.59 of the total area) fall intocategory Threatened. Protected Tree group includes 463 trees growing outside forest and their clumps.
Nature protection bodies have so far elaborated 24 inventory reasearch theses and 8 specific pro-tection regime plans which form base for practical protection measures.
40

State of the Environment Report - the Slovak Republic 1997
Cultural Monuments
Fundamentals of historical settlements in the countryare represented by immovable cultural monuments. In com-parison to 1996, total number of immovable cultural monu-ments rose in 1997 by 314 monuments.
Table 41 Cultural Monuments - their structure and categories
Category
Architectural monumentsArchaeological monumentsHistorical monumentsHistorical gardens and parksFolk architecturemonumentsTechnical monumentsArt work monumentsTotal
Year19926 888
3281 478
3171 534
418649
11 612
19936 999
3441 478
3201 508
423660
1 1 732
1994 19957 098
3621 419
3311 516
434739
11 899
7 028362
1 416332
1 526
435739
12018
19967 247
3641 417
3341 537
437742
12 078
19977 353
3661 419
3351 721
446752
12 392Source: Nl'KC
In 1997, total number of movable cultural monuments in evidence reached 28 359.The total number of cultural monuments include 94 castles and mansions, 430 manor houses and 72national cultural monuments.
Table 42 Legislative Protection of Cultural Monuments
Cultural Monument
DesignatedWithdrawn
Year199212549
19938717
19946422
199510813
1996123
12
1997328
14Source: NPKC
Regarding technical state, 27% of cultural monuments were in unsatisfactory state or in very badconditions requiring immediate action and 7% of cultural monuments were undergoing reconstruction.
Table 43 Technical State of Cultural Monuments in 1997
StateIn good conditionsSatisfactoryUnsatisfactoryIn bad conditionsUnder reconstructionTotal
Number3 9414 2752 588
686902
12 392
%323421
67
100Source: NPKC
In accordance with the NCSR Act No. 27/1987 Coll. on State Conservation of CulturalMonuments, owner of the cultural monument is obliged to carry out maintenance and reconstruction attheir own expense. The MK SR annualy provides funding covering cultural monuments' reconstruction.This is done through the State Cultural Fund called 'Pro Slovakia'.
41

State of the Environment Report - the Slovak Republic 1997
Table 44 State Cultural Fund 'Pro Slovakia' funding provided for cultural monuments recon-struction
YearNumber of projectsTotal funding in Sk
199453
20 750 000
199546
26 400 000
199668
29019 180
199722
12 200 000Source: MK SRTSFK SR
Table 45 Protected Parks
RegionBanska Bystrica regionBratislava regionKoslce regionNitra regionPrcSoY regionTrencin regionTrnava regionZilina region
Total
Number of protected parks7618
10382
270Source: NPKC
Slovak Contributionto the World Heritage
By the end of 1997, World Heritage (WH) Committeebased in Paris included 552 sites (properties) into the UNESCOWorld Heritage List. Four sites inscribed into the list can befound on the territory of the Slovakia:1. the Vlkoh'nec Folk Architecture Reserve2. the National Cultural Monument Spissky Castle and its neigh-
bouring historical monuments - the Spisska Kapitula Historical Town Reserve, Spisske Podhradie HistoricalZone and the Church of the Holy Ghost in Zehra
3. the Banska Stiavnica Historical Town Reserve and its neighbouring technical monuments4. the caves of the Slovensky kras karst and Aggtelek kras karst
Other properties proposed for inscription to the WH List:1. the Kysuce - Orava Switch-back Railway2. the Ravines of the Slovak Paradise and the Dobsinska ice caveProperties from tentative list for nomination:A. Natural heritage properties (together with Poland)1. the Belianske Tatry NNR -
Bielovodska dolina valley NNR2. the Prielom Dunajca NNRB. Cultural heritage properties1. Inclusion of the Levoca Historical
Town Reserve into the WHS of the Spissky Castle and its surroundings2. Wooden churches in the Beskydy (together with Poland)3. Wooden Protestant church and the historical centre of Kezmarok4. Medieval murals in the churches of Gemer region and Abov5. Bardejov Historical Town Reserve6. Kosice Historical Town Reserve
42

Figure 29 Historical Town Reserves and Folk ArchitrectureReserves, Zones and the WH Sites in the SR
(author: J. Klinda and col.)
World Heritage Sites (4)
Properties nominated as WHS (2)
Cultural Properties from tentative list for nomination as WHS (6)
Natural Properties from tentative list for nomination as WHS (2)
& Historical town reserves (18)
Jk. Folk architecture reserves (10)
® Historical and folk architecture zones (84)

State of the Environment Report - the Slovak Republic 1997
SK99K0198
ENVlRONtffl
AKTUALIZACIAWIRONMENTAUEJ REOK)•IALIZACIE SIO/ENSK*ttKONANAVROKUOT/
IEGH
The State of theEnvironment in Selected
Regions
There are five levels of the quality of environment thatwere defined by the new environmental classification basedon the complete assessment of the state of air, groundwater,surface water, soil, rock environment, biota and other factors:
Table 46 Basic criteria of environmental regional classification of the Slovak Republic accordingto the number of population and area
Quality
levelI. and II.
III.IV.V.
Specification of quality
High quality environment, satisfactory environment
Moderately deteriorated environment
Deteriorated environment
Heavily deteriorated environment
Population of SR
number2 379 000
964 000
752 000
I 262 000
5 357 000
%44.5
18.0
14.0
23.5
100.0
Area <if SR
km2
36 824
7 306
2 795
2 109
49 034
%75.1
14.9
5.7
4.3
100.0
Source: SAZP
Endangered territories of Slovakia according to theenvironmental classification are the territories where theenvironmental quality reaches levels IV. and V. at thesame time. The percentage of population living in these ter-ritories is approx. 33.2% and they occupy 9.5% of the totalarea of the Slovak Republic. These territories are usuallylinked to large urban and industrial areas. The territoriesbelonging only to the level IV. of environmental quality arenot a part of defined areas. There are approx. 233 000inhabitants living on these territories. The following settle-
ments together with their own urban areas belong to this group: Senica, Surany, Sahy, Zeliezovce, Levice,Nova Bafta, Lucenec, Svit and Presov.
Table 47 The following endangered territories in Slovakia were selected
Endangered region
1. Bratislava region2. Trnava-Galanta region3. Upper Nitru region4. Upper Povazie region5. Middle Pohronie region6. Middle SpiS region7. Middle Gemer region8. KoSice region9. Middle Zemplin regionTotal
Number ofpopulation491 000162 000179 000162 000170 00087 00056 000
267 000207 000
1 781 000
Area(km2)710384519183371364401658
1 OSl
4 671
Source: SAZP
44

State of the Environment Report - the Slovak Republic 1997
Figure 30 Quality of the environment in the Slovak Republic
Qualify of the environment1" degree - high quality environment
] 2nd degree - suitable quality environmenti 3'" degree - moderately deteriorated environmentI 4'" degree - deteriorated environment
m 5"'degree - heavily deteriorated environment
While the territories with heavily deteriorated environment in Bratislava, Trnava-Galanta, HornaNitra and Kosice regions are relatively compact, the other are not. They create a mosaic, divided by sig-nificant natural barriers that partly eliminate the negative impact.
This region consists of the capital city of the SR area, that means Bratislava Districts I.-V. and theparts of near-by districts of Malacky, Pezinok and Senec. The number of inhabitants is 491 000, numberof settlements is 17 and only Bratislava is a municipal industrial and administrative agglomeration. Theendangered area of Bratislava region occupies 710 km2.
Air PollutionTable 48 The largest sources of air pollution in Bratislava endangered region according to theemissions of basic air pollutants from 1996 to 1997 (t per year)
Basic characteristics of main producers of airpollution and pollutants• The emission of basic pollutants from allsources in the Bratislava endangered regionwas 33 757 tin 1997• The industry and transport are the princi-pal pollution sources• Slovnaft a.s. Bratislava has a contributionof approx. 83.9% of the total amount ofbasic pollutants from all the large sources inthe region
Pollution source
Slovnaft a. s.BratislavaZHZ 5. p. Bratislava,Vylircvna BratislavaJuli7X-Z 5. p. Bratislava,Heating Plant IIMaladorcx a.s.BratislavaIstroclicm a. s.BratislavaOLO a. s. Bratislava,Municipal WasteIncinerator
SPM1996
1 181.3
103.9
16.9
36.8
31.9
105.4
19971 264.0
41.2
23/i
18.7
10.7
100.5
SO,1996
24 006.0
] 645.3
108.7
640.5
130.5
73..1
199721 924.2
621.2
206.6
312.3
190.5
74.2
KO,1996
3 836.7
309.9
243.6
110.3
15.0
110.3
19974 460.6
158.2
262.9
65.5
II.1
111.5
CO1996
784.6
25.2
7(..5
9.2
1.2
0.3
1997702.6
23.2
77.9
8.2
1.5
0.3
45

State of the Environment Report - the Slovak Republic 1997
• Slovnaft a.s. Bratislava emitted considerable volume of other pollutants, esp. benzene (314 t in 1996 and 312 t in
1997) and inorganic compounds of hydrochloric acid (19 t in 1996 and 1997) excluding basic pollutants.
The toulene emissions produced in Slovenskd Grafika a.s. Bratislava reached 277 t in 1997.
Water PollutionTable 49 The largest sources of surface water pollution in Bratislava endangered region accor-ding to the selected indicators of discharged pollutants in 1996 and 1997
Basic characteristics of the quality of surface
watercourses at the checkpoints in 1997
• Danube-Bratislava middle course: the group
of oxygen demand indicators reached quality
category II, groups of basic and additional
chemical indicators reached category III and
biological and microbiological indicators
reached quality category IV. The concentra-
Pollutionsource
Slovnarta.s.WWTPIstrochema.s. WWTP
Slovnarcbl. 17- ISVaK-WWTPVrakufiaVaK-\V\VITPclrialka
I1OD51 per year
199ft72.43
638.94
751.78
283.82
f.2.25
I9M7N7.5K
805.68
415.69
249.60
88.95
CODC r 1 per year
1996316.90
1 904.77
1 433.08
1 753.40
303.49
19973.S4.-19
2 2C5.99
1 351.01
1 533.26
.17O.f.2
SS 1 per year
19964 75.1.46
19 136.10
20 556.45
26 427.17
6 162.70
19974 3X7.94
15 998.65
2 020.49
23 771.58
6 196.87
[S t per year
1996217.30
172.80
! 644.52
1 135.30
3-10.65
199787.58
197.82
1 616.59
1 010.29
281.67
WWTP- Waste Water Treatment Plant Source: SIIMU dons of zinc reached category II and other
heavy metals category I
• Estuary of Mldka watercourse: the group of oxygen demand indicators and the group of basic and additional chemical
indicators reached category V and biological and microbiological indicators reached quality category IV. High concentra-
tions of organic substances and nitrogen and phosphorus compounds were recorded
• The upper course of the River Maly Dunaj: the group of oxygen demand indicators reached quality category II and the
group of basic chemical indicators reached category HI. The group of heavy metals and biological, microbiological and addi-
tional indicators reached quality category IV.
Soil PollutionAccording to the Soil Fertility Research Institute (VUPU) monitoring, the soil in Bratislava endan-
gered region did not reach the level of heavily contaminated soil.
Waste ManagementThe principal method of waste treatment in Bratislava region is incineration in the city, incinera-
tor that is going to be upgraded and reconstructed. The incineration residues (solid particular matter,clinker) are treated at the landfill site of the construction category III. near Pezinok. A serious problemof this area is the environmental impact of old unregistered landfill sites in various city districts. One ofthe most dangerous is gudrone landfill site in Devinska Nova Ves and also the waste from former CHZJD(Chemical works) in the natural bed in Mlynsky arm of the River Maly Dunaj near Vrakufia. The prob-lem of remediation of these landfill sites has not been solved yet. The largest waste producer in this areais Slovnaft a.s. Since the incinerator in this plant does not fulfill the demands of emission limits, the con-struction of the new incinerator with the capacity of 12 000 t.p.a. is prepared.
The region occupies the area of Podunajska Highland with the part of Trnava and Podunajska Plainwith the parts of Galanta and Sal'a districts. The axis of this region is broad flood plain of the River Vah.
46

PoUatfoa source :
Duak>8^.SaEVZEZJ..p.Brat*lava,Heating plant :TrnavaCUKOS»^.SUdlajviJovoSugar Factory S. p.Tnara
• SPM199«674.750.3
19Z0
1997632.0a o j
220.4
28J
SO,
2 479.276S.8
230.9
454.9
19S72 293.7
281.9
196.7
467.8
: ' N O , •1.-:.1
I9SS2 0S7.7
I82J
70.2
80.6
19971672.5
107.1
62.1
83.1
CO1996102.524.4
10Z9
62
\m94.7214
86.5
6.3
Source: SHMU
The environmental impact is mostly from agriculture (food production), energy and chemical industries.In this endangered region, there are 162 000 inhabitants living in 20 settlements, out of which five aremunicipal. The region occupies the area of 384 km2.
Air PollutionTable 50 The largest sources of air pollution in Trnava-Galanta region according to the emissionsof basic air pollutants from 1996 to 1997 (t per year)
The basic characteristics of main producers of air
pollution sources and pollutants
• The emission of basic pollutants from all sources
in this endangered region was 9 840 t in 1997
• From other pollutants, Duslo Sal'a a.s. emitted
ammonia (341 tonnes per year in 1996 and 1997)
' The secondary source of air pollution caused by
SPM pollutants is the leach sludge pit.
Water PollutionTable 51 The largest sources of surface water pollution in Trnava-Galanta endangered regionaccording to selected indicators of discharged pollutants in 1996 and 1997
Basic characteristics of the quality of surface water-
courses at the checkpoints in 1997
• Vdh-Hlohovec: quality category IV caused by the
considerable number of coliform bacteria
• The improvement was indicated in the area of
Selice where the River Vdh leaves the endangered region. The quality level changed from the category V to category TV in
the case ofENP indicator which indicates petroleum products pollution. Other indicators reached category III
• The most heavily polluted are the Horny Dudvdh and Trndvka tributaries - in most cases in category V. Trndvka pod
Trnavou belongs to the long-term watercourses with the heaviest organic pollution in the watershed of the River Vdh.
Soil PollutionDespite the fact that production in Nickel Metallurgical Works a.s. in Sered' stopped, the residues
still contaminate the soil (Ni, Cr) as a result of environmental impact caused by the leach waste bank thatcontains poly-metallic dust with the high concentrations of Ni, Cr, Co and Fe.
Waste ManagementMost of the landfill sites for bulky municipal and industrial waste built in this endangered area are
without proper insulation from the bedrock. Duslo a.s. Sal'a is also the source of hazardous waste whichis treated in the factory incinerator together with hazardous waste from other sources.
Table 52 Landfill sites in Trnava-Galanta endangered region
Pollution Source
Doslo a. g. SatiCUKOS i J-.O.SlidlroviiSovDZiVsKitaavn
BOD,tperyear19M
173.11S6.6
672.7
1997183.9188.9
174.5
CODfv t per year
630.7243.6
1 125.7
1S975663144 2
353.4
SS t per year1996
11004.0308.3
3 614.9
19979 226.3
343.7
191.7
IS t per year1996133.0246.9
411.8
1S97120.3276.7
191.7
District
Galanta
Sal'aTrnava
Industrial waste landfill ofconstruction category ID.
In accordanceto the
governmentalregulation No.
606/92 CoU.
-
-1 (outside the
region)
Specialconditionsissued in
accordance to§15 Act No.238/91 CoIL
1
1-
Operated by
•CUKOSSladkovi£ovo s.r.o.
•Duslo Sara a.s.•Chemolak a_s.Smolenice
Municipal landfill of construction category III.
In accordanceto the
governmentalregulation No,
606/92 Coll.
2
12
Specialconditions
issued inaccordance to
§15 Act No.238/91 CoIL
1
14
Under thereconstruction
/lathepreparation
1
11
Sludge pitsIn
accordanceto Act. No.327/96 Coll.
1
1-
Source: SAZP
47

State of the Environment Report - the Slovak Republic 1997
Pollution source
SEa.s. ENONovaky, o.z.
NCHZ a.s. (Chemicalplanl) Novaky
HormmitrianskcMines a.s. BanaCigcr
SPM
1996] 110.0
667.0
68.0
1997902.5
47S.5
36.4
SO,
199645 900.0
26.0
218.0
199744 425.5
19.8
249.0
NO,1996
4 186.0
109.0
33.0
19973 939.7
53.1
36.')
CO
1996690.0
48.0
111.0
1997647.0
49.4
13.7
This region is negatively influenced by mining, energy and chemical industries. The region includesHorna Nitra basin stretching from Prievidza to Topolcany with the heart of pollution in Novaky andZemianske Kostol'any. This part influences Prievidza, Partizanske and Topolcany districts. There are179 000 inhabitants in 31 settlements (five are municipal) living in the stressed environment. Areaoccupies 519 km2.
Air PollutionTable 53 The largest sources of air pollution in Horna Nitra region according to the emissionsof basic air pollutants from 1996 to 1997 (t per year)
Basic characteristics of main producers of air
pollution and pollutants:
• In 1997, the emission of basic pollutants
from the largest sources in this endangered
region was 50 908.5 t
• Novaky power station finished the recon-
struction of blocks 1,2 ENO B in order to desulphurize the emissions. This reconstruction will contribute to the decrease
of 30-40 000 t.p.a. of sulphurdioxide emissions in 1999 when this device will work at total power
* Novaky Chemical Plant a.s. Novdky produced other special pollutants esp. the carbide and calcareous dust, chlorine,
vinyl chloride, ethyleneoxide and propyleneoxide.
Water PollutionTable 54 The largest sources of surface water pollution in Horna Nitra endangered region accord-ing to selected indicators of discharged pollutants in 1996 and 1997
Basic characteristics of the quality of surface
watercourses at the checkpoints in 1997
• Since the high concentration ofENP and con-
siderable amount ofcoliform bacteria, the quali-
ty of water at the checkpoint Opatovce nad
Nitrou is in the category IV
• At Chalmova checkpoint, the water quality
reached category V because of high concentrations of IS and ENPm. The oxygen demand indicators with microbiological
indicators reached quality category IV in this part of the watercourse. The contamination caused by Hg, Pb, As and Cu
was also serious
• The most heavily polluted tributary of the River Nitra is Handlovka in the quality category V.
Soil PollutionHorna Nitra region is heavily contaminated by anthropogenic sources (Novaky surroundings). The
arsenic content reached concentrations from 61 mg.kg'1 to more than 100 mg.kg'1. Extremely high arsenic
Pollution source
HomnnitrianskeMines a. s. BanaCigar
NCHZa.s.Novakysi; a.s. I;NONovaky, 0.7..ScVaK Prievidza
BOD^t per year
1996
0.00
437.68
16.52
205.30
1997
0.0
319.2
9..1
182.1
COD (> t per year1996
36.';
1 984.3
111.5
877.0
1997
4U.I
1 426.9
7<>.X
537.2
SS t per year1996
(1.0
22 326.8
95(1.2
2 108.1
1997
0.(1
16215.7
X94.7
1 220.0
IS t per year1996
460.8
210.6
2112.4
236.0
1997
564.08
227.23
206.18
162.06
48

State of the Environment Report - the Slovak Republic 1997
concentrations are in the south of Novaky under the sedimentary reservoir of fly ash produced inZemianske Kostol'any power station. This reservoir is on the flood plain of the River Nitra which wasflooded by this waste when the dam of this reservoir was damaged in 1965. Except this hazardous ele-ment, there are also high concentrations of Cd, Sr, Al and Fe in this area. The estimate of contaminatedarea is 19 000 ha.
Waste ManagementSince the municipal waste in Horna Nitra endangered region is treated at the landfill sites that
comply with the legislative criteria, the situation of waste management is much more better than it wasin the past. The most serious problem is still the waste produced in heat-producing devices in ZemianskeKostol'any power station. This waste is partly used for the production of prefab parts and the rest isdeposited at the landfill sites for fly ash (Chalmova, Bystricany). NCHZ a.s. Novaky is also the source ofthe variety of waste esp. of carbide lime. Novaky and Handlova mines deposit the mining waste in wasterock banks.
Table 55 Landfill sites in Horna Nitra endangered region
District
Prievidza
Partizanskc
Industrial waste landfillof construction category III.
In accordanceto the
governmentalregulation No.
606/92 Coll.
1
Specialconditions
issued inaccordance to
§15 Act No.238/91 Coll.
2
Operated by
•UNO ZcmianskeKostol'any,Cercnany villase.
•Cebo Moldinga.s. Slovakia, ,Parlizanskc
Municipal landfill of construction category 111.
In accordanceto the
governmentalregulation No.
606/92 Coll.
3
1
Specialconditions
issued inaccordance to
§15 Act No.238/91 Coll.
2
Under thereconstruction
/ In thepreparation
1
Sludge pitsin
accordanceto Act. No.
327/96 Coll.
4
Source: SAZP
HornePovazie(Upper Povazie)
This region is not compact and is situated in the north - west of Slovakia. The region occupies theagglomeration of Zilina in Zilina basin and the industrial zone of Ruzomberok in Liptov basin. Theendangered region includes the territory of Istebne with the local environmental impact. The regionreaches Zilina, Ruzomberok, Dolny Kubin, Martin and Liptovsky Mikulas districts. The environmentalimpact is caused by energetic, chemical, machine, metallurgical and pulp and paper-making industries.The region is also exposed to the long-range transfer of pollutants from Ostrava and Katowice industrialzones. In this endangered region, there are 162 000 inhabitants living in 14 settlements, three are muni-cipal. The region occupies the area of 183 km2.
49

State of the Environment Report - the Slovak Republic 1997
Pollution source
S<v«roiloYc(ulc4 :Pulp and PaperPftldncPluil 1.1.Rniombeml (SCP)
PcrafcUCbcsUolPlot i * iHfctt (PCH23
PUnt huntSEZJ.p. Heartingl'Unl M«rUnOFZa.«.I««lmt(plants in IitciiaiandSirolci)
SPM
1596
678.9
0.1
207.8
57.7
771.6
1997
1 073.7
0.1
202.5
56.4
572.9
S O ,1996
2 656.9
185.2
4 210.5
4 360.0
819.1
1S97
2 476.0
232.4
3 388.5
4 638.5
1 387.3
N O ,
1996
1280.2
173.0
1049.6
660.7
1 162.2
19*7
1 195.9
237.4
995.1
623.9
931.3
CO
1996
1 989.6
0.4
145.4
130.8
1 718.5
15J7
2 183.2
0.6
137.4
130.9
2 611.4
Source: SI1MU
Air PollutionTable 56 The largest sources of air pollution in Home Povazie region according to the emissionsof basic air pollutants from 1996 to 1997 (t per year)
Basic characteristics of main producers of air
pollution and pollutants
• The emission of basic pollutants in 1997
was 4 700 tonnes from ten largest sources of
air pollution in this endangered region
• The construction of electrostatic precipitator
in devulcanizing pan in SCP a.s. Ruzomberok
was finished in 1997. The next emission
reduction is expected after the construction of
gas-steam process and after the reconstruction of waste cauldron used for wood stuff. The factory also carried out the tech-
nological change of pulp-bleaching process that will come to operation in 1998:
• The heating plants in Zilina and Martin will introduce gas to the selected heating units
• The ratio of natural gas combustion to fuming oil combustion with high content of sulphur has increased to 70:30.
Water PollutionTable 57 The largest sources of surface water pollution in Home Povazie endangered regionaccording to selected indicators of discharged pollutants in 1996 and 1997
Basic characteristics of the quality of surface
watercourses at the checkpoints in 1997
• The endangered area is in the territory of
the River Vdh watershed
• The watercourse of the River Vdh at the
checkpoints from Cierny Vdh dam to Liskovd
is in the quality category II according to oxy-
gen demand indicators. According to the
group of basic chemical indicators the watercourse is in category III caused by water pH and locally by the volume of IS
• The volume ofcoliform bacteria from the Biely Vdh checkpoint as far as Vazec and Vdh - Liskovd indicates quality cate-
gory IV in this part of the River Vdh watercourse
• In 1997, higher presence of coliform bacteria than in 1995-1996 period was registered, thus putting the Hubovd stretch
of the river into the category V of quality.
Soil PollutionThe largest sources of soil pollution in this region are chemical and metallurgical industries
(Istebne, Zilina, Martin) and other unspecified sources as well (Ruzomberok, Liptovsky Mikulas sur-roundings). The soil in Dolna Orava near Istebne belongs to the area with the highest impact of chrom-mium imissions. The content of Crf>+ is 1.746 mg.kg-' and this represents 1.877% of the harmful contentof chrommium.
Waste ManagementThere are good conditions for bulky municipal waste disposal in Home Povazie region. The land-
fill sites selection for the construction category III. is in progress or has just finished. The selection is inaccordance to the Act No. 127/194 Coll. Elimination of the old environmental impacts is still a seriousproblem. The improvement of waste management was indicated in the industrial factories that arefocused on the waste reduction and on the reutilization of waste and the building of new landfill sites(SCP a.s. Ruzomberok, OFZ a.s. Istebne, PCHZ a.s. Zilina).
Pollution source
SCP a. >. Svpni
SCP a.s. Cefpap
OFZ a. s. Istebae
PCHZ us. 2jlma
ScVaK ! .p , o xRuiomberok
SeVaKS.p. 2ilinaScVaK l .p, o xL.MikuKJScVaK S.p, ox,Martin-Vriitlcy
BOD, tper year19S6
272.02
139.74
23.29
103.99529.81
125.12440.70
150.36
1997188.4
104.7
22.3
153.1399.4
140.3471.6
87.9
CODrv t per vear19M
715.1
505.9
62.6400.2
4471.7
571.1932.6
508.2
1997603.0
244.2
65.0
477.4
4S98J
808.01 567.6
528.6
SStperywI99*3 657.20
819.50
1244.67656.94
22 840.26
5 408.6210 058.83
4450.66
19973 217.97
96134
919J27
768.0120 728.57
6 202.949310.73
4 541.61
IStperyeftT
1996480.05
42.73
167.41
82.511622.39
161.45338.11
150J6
1997387.02
47.77
135.92128.74
1S92J6
335.83595.28
223.36
50

State of the Environment Report - the Slovak Republic 1997
Table 58 Landfill sites in Home Povazie endangered region
District
Dolny Kubin
LiptovskyMikulasMartinRuzomberok
Zilina
Industrial waste landfill ofconstruction category III.
Inaccordance
to thegovernmental
regulationNo. 606/92
Coll.
-
-
-1
-
Specialconditions issuedin accordance to
§15 Act No.238/91 Coll.
2
1
11
-
Operated by
•OFZ a.s.Islebne, Siroka
•Koi zavody (LeatherManufacturer)
•Ekopolis a.s.•SCI' a.s.Ruzomberok
-
Municipal landfill of construction category III.
In accordanceto the
governmentalregulation No.
606/92 Coll.
-
1
11
1
Specialconditions issuedin accordance to
§15 Act No.238/91 Coll.
1
2
-
1
Under thereconstruction
/ In thepreparation
-
-
-1
-
Sludge pitsin
accordanceto Act. No.
327/96 Coll.
1
-
2
-
1
Source: SAZP
This region is situated in the watershed of the River Hron in Ziar and Zvolen basins. The regionoccupies the area of Ziar nad Hronom, Zvolen and Banska Bystrica districts. The pollution is caused bymetallurgic and wood-processing industries. In this endangered region there are 170 000 inhabitantsliving in 18 settlements, three are municipal. The region occupies the area of 371 km2.
Air PollutionTable 59 The largest sources of air pollution in Stredne Pohronie region according to the emis-sions of basic air pollutants from 1996 to 1997 (t per year)
Basic characteristics of main producers of air
pollution sources and pollutants
* The emission of basic pollutants from the 13
largest sources of air pollution in this endan-
gered region was 25 294.8 tonnes of basic
pollutants (it is approx. 2 OOOt less then inSource: SHMU 1 QQC)
• Compared to the year 1996, there was a slight increas ofSPM emission in 1997 with the exception ofZSNP a.s. Ziar
nad Hronom (68.3 t less)
• The increase of sulphur e dioxide was indicated in all of these sources with the exception of Stredoslovenske cementdrne
a.s. B. Bystrica (the highest increase by 1 1011 in SEZ s.p. Heating Plant Zvolen)
• In total, NOX emissions decreased by 72.1 t in 1997
• Compared to the year 1996, the total volume of CO emissions was 168.9 t more.
The increase of sulphur dioxide emissions in the heating plant in Zvolen in 1997 was caused bythe combustion of the fuel with high concentration of sulphur (Slovak lignite). The introduction of gasin K6 heating unit was carried out in 1997 but the plans for desulphurization and denitrification were not
Pollution source
ZSNP a. s. Ziar nadHronom(AluminiumWorks)
SEZ5. p. HeatingPlant ZvolcnBucina a. s. ZvolcnStredoslovcnskCCement 1'Iant a.s.Banska Bystrica
SPM1996
'108.2
33.5
211."
S4.K
1997
339.9
47.1
212.2
77.X
SO,1996
2 170.7
2 787.5
0.3
147.8
1997
2 588.3
3 8SS.7
10.3
71.0
NO,1996
389.9
685.8
37.9
K49.8
1997
421.7
682.0
245.8
541.8
CO1996
1 1 171.4
85.5
1,1-1.7
3KO.8
1997
10M0.5
95.3
832.fi
372.'J
51

State of the Environment Report - the Slovak Republic 1997
realized. The change of aluminium production technology in ZSNP a.s. Ziar nad Hronom in 1997 causedthe decrease of fluorine and tar emissions with the content of polycyclic hydrocarbons. Compared to1995, in the years of 1996 and 1997 the rapid increase of carbon monoxide emissions was indicated (in1995 - 959 t, in 1996 - 11 171 t, in 1997 - 10 640 t) but the ratio of the volume of CO emissions to thevolume of aluminium produced has showed decreasing trend.
Figure 31 The trend in emissions of fluorine and polycyclic hydrocarbons in Ziar basin
1000
v 600
1 400
2 200
0
199! 1995 1996 1997
D Fluorine
• Polycyclichydrocarbons
Source: ZSNP a.s.Ziar nad Hronom
Pollutionsource
Biotika a.s.SlovenskaUurrfaFermas s.r.o.SlovenskaUuocaZSNP a.s. Ziarnad HronomHarmanecW papier-ne a.s. [Paper Hill)
Budina a.s.ZvolenPreqleika. a. s.ZarnovicaStVaK s.o.BanskaBvstricaStVaK i .p.,o.z. Zvolen
BODs t oer vear
1996185.8
53.1
38.6
116.3
34.4
14.5
1 092.9
110.4
1997190.0
36.3
32.1
131.2
27.2
16.3
794.8
78.8
CODcf t Der vear
1996587.2
310.9
450.3
445.6
107.3
47.1
2 876.1
536.1
1997715.4
182.9
235.9
508.2
95.7
50.8
2 384.4
315.4
SS t oer vear
19961 012.6
1 673.6
2 862.8
525.1
306.0
190.0
6 219.5
2 231.2
1997996.9
1 647.8
1 667.3
450.9
179.7
129.8
6 975.8
2 554.4
IS t Der
199676.7
137.2
1 351.0
58.1
54.3
12.3
1 006.6
149.8
vear
1997129.0
86.7
375.3
44.3
44.0
13.8
724.1
118.3
Source: SHMU
Water PollutionTable 60 The largest sources of surface water pollution in Stredne Pohronie endangered regionaccording to selected indicators of discharged pollutants in 1996 and 1997
Basic characteristics of the quality of surface
watercourses at the checkpoints in 1997
• The endangered area is in the territory of the
River Hron watershed
• The water quality according to oxygen
demand indicators at the checkpoint in Budca is
between the category II and the category III
• For high CODCr from the checkpoint in Budca
to the checkpoint in Kalnd nad Hronom, the
water quality reached category IV and in some
parts, for high content of IS, reaches quality cat-
egory V.
The increased concentrations of heavy metals (Hg, Pb and Cu - quality category II, Zn-IV) were indicated at the check-
points in Ziar nad Hronom, in Zarnovica and in Tekovskd Breznica. High values ofENP and coliform bacteria were mea-
sured in the whole area. These values correspond to the quality categories IV and V.
Soil PollutionThe most serious soil damage was caused by the emissions of industrial production emitted in Ziar
basin and in Banska Bystrica surroundings. Ziar basin is under the impact of fluorine emissions esp. thearea close to ZSNP a.s. in Ziar nad Hronom. The concentrations of water-soluble fluorine reaches from 35mg.kg*1 near the source to 5 mg.kg"1 in the south-east of the source. The area of contaminated soil in Ziarnad Hronom - Lovcica - Trubi'n - Stara Kremnicka - Dolna Trnavka is 9 048 ha. It is necessary to establishspecial methods of soil exploitation in this area, to eliminate wheat growing for food production and cere-al fodder crops. A small area with the high concentration of mercury is situated south to Harmanec.
Waste ManagementSince the municipal waste is treated in the landfill sites of construction category III., the waste
management in the Stredne Pohronie endangered region is good. The new regional landfill site for themunicipal waste for Banska Bystrica and villages near-by is to open in 1998. The largest sources of indus-trial waste are ZSNP a.s. Ziar nad Hronom and Petrochema a.s. Dubova. ZSNP a.s. Ziar nad Hronom has
52

State of the Environment Report - the Slovak Republic 1997
completed the construction of bentonite wall that would prevent any discharge of red and brown sludgefrom the sludge pit.
Table 61 Landfill sites in Stredne Pohronie endangered region
District
B. BystricaBrezno
Zarnovica
Ziar nadHronomZvolen
Industrial waste landfill ofconstruction category III.
Inaccordance
to thegovernmental
regulationNo. 606/92
Coll.
-1
2
1
-
Specialconditionsissued in
accordance to§15 Act No.238/91 Coll.
-1
-
-
Operated by
-
•Pctrochema a.s.Dubova,
• Ironworks a.s.Podbrczova
•Izomal a.s. NovaBaiia,
•TS Nova Bafia•ZSNP a.s. Ziar nadHronom
-
Municipal landfill of construction categoryIII.
Inaccordance
to thegovernmenta1 regulationNo. 606/92
Coll.
-1
1
I
1
Specialconditionsissued in
accordance to§15 Act No.238/91 Coll.
1
-
-
Under thereconstruction
/In thepreparation
1
-
-
Sludge pits inaccordance to
Act. No.327/96 Coll.
-
2
1
Source: SAZP
The Stredny Spis region mostly occupies the area of Gelnica and Spisska Nova Ves districts. Thenegative impact on this region is caused by mining and the treatment of complex copper and iron ore.The region has three principal sources of pollution and these are the industrial zones in Rudriany,Krompachy and Spisska Nova Ves. The environmental impact also includes the environmental problemsof old mining and machine industry production in the territory of Prakovce, Slovinky and Gelnica. In thisendangered region, there are 87 000 inhabitants living in 21 settlements, three are municipal. Theregion occupies the area of 364 km2.
Air PollutionTable 62 The largest sources of air pollution in Stredny Spis region according to the emissionsof basic air pollutants from 1996 to 1997 (in t per year)
Basic characteristics of main producers of air pollutionand pollutants
• In 1997, the decrease ofS02 emissions in Kovohutya.s. Krompachy was caused by the lower concentra-tions of sulphur in the input concentrate. The increaseof SPM emissions compared to the year 1996 was
caused by expansion of the production. The decrease of pollution is expected due to 1998 after the start of environmen-tally friendly production technology* The largest source of heavy metal pollution is Zelba a.s. Spisska Nova Ves, plant in Rudnany. Little improvement ofheavy metal contamination was caused by the decrease in extraction and production after 1992.
Pollution source
Kovohuty a.s.KrompRchyZelba U.S. SpiSskaNovi Ves,0. z. Rudilany
KiniS a.s.S[ii!skii
Nova Ves
SPM
1996187.4
14.5
147.3
1997296.0
10.9
140.9
SO,
1996
9O08.0
60.9
399.0
19977 236.0
43.3
229.7
NO,
199689.9
8.5
95.0
1997
98.9
6.1
28.S
CO
19961 024.5
21.1
190.0
1997689.2
11.5
66.6
Source: SHMU
53

State of the Environment Report - the Slovak Republic 1997
Pollution source
Kovohuty a.s.KnrnipachvSK/.a.s.Krompachy
Zclba Rudnany
VVaKSpiSskaNovS Vcs
BOD5 t per year
!9964.0
5.4
0.1
153.3
19973.9
5.(.
O.I
75.2
CODCr t per
19966.5
8.')
O.S
425.S
19978.4
15.1
1.0
292.5
SS t per year
1996317.2
2-K..4
39.5
1788.1
[997
306.3
268.5
52.9
2 172.8
IS t per year
1996
19.0
J2.2
0.5
212.9
199720.4
36.2
0.9
83.6
Water PollutionTable 63 The largest sources of surface water pollution in Stredny Spis endangered regionaccording to selected indicators of discharged pollutants in 1996 and 1997
Basic characteristics of the quality of surface
watercourses at the checkpoints in 1997
• The endangered area is in the territory of the
River Hornad watershed
• The watershed is under the impact of high con-
centrations of heavy metals (Hg, Cu, Zn) that are
the extraction and treatment waste and this is the
cause of the quality category V of this watershed
• The volume ofcoliform bacteria is the cause for the quality category V too.
Soil PollutionThere is the heterogeneous soil contamination by mercury and other heavy metals (Cu, Pb, Cd, Zn)
that are waste from the extraction and treatment companies. The area of contaminated and degraded agri-culture land is approx. 9 000 ha. The considerable concentrations of Hg reached the levels above A, B andalso C in the surroundings of Rudnany and Gelnica. High concentrations of magnesium are in the acidsoils in the area near Krompachy, Kluknava, Richnava, Hnisovce and Slovinky. The concentration of cop-per in the area of Krompachy, Kluknava and Mnisok nad Hnilcom is above the indication limit C.
Waste ManagementThe regional landfill site of the construction category III., which is possible to expand, is used for
the municipal waste treatment. Another landfill site for municipal waste treatment near Spisske Vlachyis under the long-term reconstruction. There are a lot of large and small unregistered landfill sites formunicipal waste treatment in this endangered region. The clearance of these landfill sites is slow becauseof problematic financial situation.
Table 64 Landfill sites in Stredny Spis endangered region
District
SpiSska NovaVes
Industrial waste landfill ofconstruction category III.
Inaccordance
to thegovernmental
regulationNo. 606/92
Coll.
Specialconditions issuedin accordance to
§15 Act No.238/91 Coll.
7
Operated by
•SEZ a.s. Krompachy,•Kovohuty a.s.Krompachy,
•ZZS Prakovce,•NPZ Rudnany
Municipal landfill of construction category III.
In accordanceto the
governmentalregulation No.
606/92 Coll.
1
Specialconditions issuedin accordance to
§15 Act No.238/91 Coll.
7
Under thereconstruction
/ In thepreparation
1
Sludge pitsin
accordanceto Act. No.
327/96 Coll.
3
Source: SAZ!>
54

State of the Environment Report - the Slovak Republic 1997
Stredny Gemer(Middle Gemer)
Region
Pollution source
Slovinag a. s.Lubenik
Slovak MagnesiumWorks (SMZ) a. s.JelSava
Zclba a. s. SpiSskaNova Vcs, 0. z.Sidcril Niina Slana
Slovcnske luSobnezavody (SLZ) a. s.HiuiSfa
SPM
1996135.4
166.0
297.2
177.3
1997
130.O
154.9
152.3
13.1
SO,1996
69.1
232.1
2 709.0
30.ci
1997
25.9
21.4
2 787.0
11.3
NO,
1996494.7
333.5
307.1
38.1
199744S.9
233.7
304.7
14.1
CO
19961 077.S
133.7
2 066.2
32.2
19971088.5
163.8
2 129.0
13.5
Source: S1IMU
The region of Stredny Gemer is surrounded by Muran valley stretching from Revuca, Lubenik andJelsava valley, by Rimava valley stretching from Hnust'a to Hacava and finally by Slana valley stretchingfrom Nizna Slana to Slavec. The whole region is a part of Revuca Highland connected to Roznava basinand occupies the regions of three districts: Rimavska Sobota, Revuca and Roznava. The environmentalimpact on this region is caused by the extraction and treatment of mineral raw materials and by chemi-cal industry. In this endangered region, there are 56 000 inhabitants living in 19 settlements, three aremunicipal, under the environmental impact. The region occupies the area of 401 km2.
Air PollutionTable 65 The largest sources of air pollution in Stredny Gemer region according to the emissionsof basic air pollutants from 1996 to 1997 (t per year)
Basic characteristics of main producers of air pol-
lution and pollutants:
• The emission of basic pollutants from the four
largest sources of air pollution in this endangered
region was 7 692 t in 1997, that means the
decrease by 608 t compared to the year 1996
• The decrease of the volume of SO2 emissions
(210.7 t less than in 1996) in SMZ a.s. Jelsava
was caused by the change of fuel (now the gas is
used)
• The decrease of SPM emissions (145 t less than in 1996) came in Siderit Nizna Slana when the new electromagnetic
separator started working
• The technical and technological measures on air protection and also reduction or even abandonment of some technolo-
gies in SLZ a.s. Hnust'a, caused the decrease of the volume of basic pollutants by 226 t (it is less then in 1996)
• The solid pollutants from SMZ a.s. Jelsava and Slovmag a.s. Lubenik contained high concentrations of Mg and from
the point of hygiene were significant the concentrations of Cd and Pb as well.
Water PollutionTable 66 The largest sources of surface water pollution in Stredny Gemer endangered regionaccording to selected indicators of discharged pollutants in 1996 and 1997
Basic characteristics of the quality of surface
watercourses at the checkpoints in 1997
• The high values of CODCr at the checkpoint
bellow Jelsava in the watercourse of the River
Muran in the last year were the reasons for the
change of water quality category to the catego-
ry HI
• To the lower quality level were also put the
waters in the River Rimava watershed at the
Pollution source
Ferrous Ore Mines (ZRB)S.p. Nizna SlanaSlavoSovcc Paper Mill a.s.
Slovmag a.s. Lubenik
Slovcnskc luCobnczavody (SI.Z) a.s. Hnuffa- channel 600
SLZ a.s. llnusTa -deepchannel
SLZa.s. HnusTa-WWTP
Slovcnskc' MagnesiumWorks a.s. (SMZ) JelSava
BODVC
1996
33.3
67.2
1.3
16.5
31.3
16.5
3.2
tper
1997
24.3
r.o.o0.9
10.1
20.5
4.7
1.1
CODCr t peryr;r
1996
122.2179.1
6.0
32.S
63.3
29.9
17.4
1997
82.0170.0
3.5
37.7,
73.3
37.8
4.6
S S t p
1996
2 343.3
526.2112.0
87.4
r year
1997
2 604.1
469.9
65.9
78.3
192.4
35.7
76.3
lStpc
1996
137.558.2
3.8
7.0
24.1
10.5
6.4
r year
1997
141.0
46.0
2.2
9.0
35.5
7.2
2.3
Source: S11MU
55

State of the Environment Report - the Slovak Republic 1997
checkpoint bellow Hacava because of the high content of IS, Mn and Fe (IS - category V, Mn- category III). The high val-ues ofENP and bacteriological indicators were the reasons for the change of water quality category to categories IV and V
• The waters in the River Stand watershed are in the quality category III - V because of their pollution by the industrialproduction in SLZ a.s. Hnust'a, Paper Mill a.s. Slavosovce, SMZ a.s. Jelsava and Slovmag a.s. Lubenik
• The new mechanico-chemical WWTP started working in 1997 and 30-50 % of treated water is reutilized during pro-duction. When the project of reconstruction of charcoal production was completed in SLZ a.s. Hnust'a, the production ofwaste water was 600 - 800 t of BOD5 lower.
Soil PollutionThe soil quality was degraded esp. by solid pollutants of MgO, Fe2Ov CaO, SiO2 with the high con-
tent of magnesium, cadmium and lead. Magnesium is not a dangerous trace element but the consider-able volume of this element near the plants for magnesium production can cause direct physical damageto soil. The considerable reduction of soil production is evident in the soil of category 3 and 5. Soil of ca-tegory 5 is degraded in some territories to such extent, that the production is impossible. The damage ofthe forest land is also indicated in the area of 16 728.7 ha (levels A-D) of endangered forest land. The soilcontamination by heavy metals such as As, Ni, Cu, Hg, Mn near Nizna Slana was caused by mining andthe treatment of mineral raw materials.
Waste ManagementThere is only one registered regional landfill site for the treatment of bulky municipal waste. Large
factories treat their waste in accordance to the legislation. The environment impact is caused by the min-ing and the treatment production in Slovmag a.s. Lubenik and SMZ a.s. Jelsava.
Table 67 Landfill sites in Stredny Gemer endangered region
District
Reviica
RimavskaSobota
Industrial waste landfill ofconstruction category III.
Inaccordance
to thegovernmental
regulationNo. 606/92
Coll.-
1
Specialconditionsissued in
accordance to§15 Act No.238/!M Coll.
2"
Operated by
•Slovmag a.s.Lubenik,
•SMZ a.s.! Inust'a
•SLZ a.s. Hnust'a
Municipal landfill of construction category III.
In accordanceto the
governmentalregulation No.
606/92 Coll.
-
1
Specialconditions
issued inaccordance to
§15 Act No.238/91 Coll.
3
-
Under thereconstruction
/ In thepreparation
1
-
Sludge pits inaccordance to
Act. No.327/96 Coll.
-
landfill sites of construction category I. Source: SAZP
Kosice region occupies the major part of Kosice basin that includes four districts of Kosice City andthe southern part of Kosice-Surrouding District. The region is heavily polluted by metallurgy and energyindustries. There are 267 000 inhabitants in 19 settlements, Kosice is the only municipal settlementunder the environmental impact in this endangered region. The region occupies the area of 658 km2.
56

State of the Environment Report - the Slovak Republic 1997
Follutloa loarce
VS2s.a.KoSieefSte*lWork»)SB a. s. HeatEnergy, plant inKfliiceCentre for WasteTreatment a.r.o. (CZO)Xnikc -Incinerator
Cement Works"nirfia nadBodvoa
STM
199610 3S3.O
126.6
55.6
53.9
1997102SS.2
121.6
822
55.3
SO,
199616 07O.O
1 701.8
19.9
231.6
1997IS 049.0
2 566.4
48.3
123.0
NO.:1996
16 075.0
IB02.4
73.4
430.9
199713 600.0
2 165.0
94.2
206.7
CO1996
75 018.O
183.1
145.2
151.1
199783 822.0
61.9
42.7
109.5
Air PollutionTable 68 The largest sources of air pollution in Kosice region according to the emissions of basicair pollutants from 1996 to 1997 (t per year)
Basic characteristics of main producers of air
pollution and pollutants:
• The emission of basic pollutants from the
largest sources of air pollution in this endan-
gered region was 128 413 t in 1997, that
means 3 871 t more compared to the year
1996. The SPM emissions decreased by
65 t, SO2 by 2 287 t, NOX by 2 475 t but
the CO emissions increased by 8 539 t
• The total volume of emissions produced in VSZ a.s. Kosice in 1997 was 3 220 t more than in 1996. This increase was
caused by the increase of CO emissions (8 804 t more then in 1996). The decrease of emissions was indicated in the case
ofS02 (3 021 t less) and in the case ofNOx (2 475 t less)
• The increase of coal combustion with the decrease of natural gas combustion caused the increase ofSO2 andNOx in SE
a.s. Tepelna energetika, Kosice o.z.
• The increase of SPM, SOV NOX compared with the year 1996 was shown by the Centre for Waste Treatment (CZO)
s.r.o. Kosice- incinerator of municipal waste. This state is caused by the absence of the second level treatment.
Water PollutionTable 69 The largest sources of surface water pollution in Kosice endangered region accordingto selected indicators of discharged pollutants in 1996 and 1997
Basic characteristics of the quality of surface
watercourses at the checkpoints in 1997
* Although the volume of coliform bacteria
decreased, this amount is still the reason for the
water quality category V in the River Bodva.
High concentrations of zinc caused water quality category V at the checkpoint in Moldva nad Bodvou
• For coliform bacteria volume, the River Horndd reaches the quality category V. The concentrations of mercury are in
the interval of quality category III - V.
Soil PollutionThe soil in Kosice basin is in the A, Al category, that means not contaminated soil with possible
negative impact on the environment. The area of former Kosicky Magnezit s.p. Tahanovce indicates thelong-term magnesium contamination of soil. The acidification of soil within and near the area of VSZ a.s.Kosice caused the destruction of mineral constituents and organic part of the sorption content of the soilcolloidal complex. There are still significant deposits of sulphrum and heavy metals, the principal are Mn,Mg, Cr, Al, As and Pb as well as Fe.
Waste ManagementThe treatment of bulky municipal waste in Kosice endangered area is carried out by the incinerat-
ing and by the depositing in landfill sites. The municipal waste incinerator in Koksov-Baksi is due toreconstruction and modernization. VSZ a.s. Kosice is the largest source of assorted waste (other, special,hazardous). The industrial waste is in various forms of consistency and has various physical and chemi-cal properties. The principal is metallurgy and machine industries waste. The serious environmentalproblem is the hazardous waste landfill site that belonged to the former Tesla in Moldava nad Bodvou.This waste consists of glass and metals contaminated by mercury. The landfill site is outside the factoryin Mokrance surroundings.
Pollution aoaree
\St a.1.KoikeWaKi-p.KoSice
BOD< 1 per yewIMC
94.2
1 182.6
199792.4
819,9
COD,, tpcrytar1996
693.0
2956.5
1997924.0
1 803.9
SS t per yew19967 320.8
14191.2
19977 392.0
15 455.8
IS t per year1996
373.2
2 759.4
1997369.6
2 254.8
Source: SHMU
57

State of the Environment Report - the Slovak Republic 1997
Table 70 Landfill sites in Kosice endangered region
District
Kosice-City
KoSice-Surroundings
Industrial waste landfill ofconstruction category III.
In accordanceto the
governmentalregulationNo. 606/92
Coll.2
-
Specialconditions
issued inaccordance to§15 Act No.238/91 Coll.
3
I
Operated by
•CZO KoSicc,•VSZ a.s. Kosice•Tesla Moldavanaci Hodvou
Municipal landfill of construction category III.
In accordanceto the
governmentregulationNo. 606/92
Coll.-
1
Specialconditions
issued inaccordance to§15 Act No.238/91 Coll.
-
5
Under thereconstruction /
In thepreparation
-
1
Sludge pitsin
accordanceto Act. No.
327/96 Coll.
4
-
Source: SAZP
This endangered region is marked off by the towns Vranov nad Topl'ou, Humenne and Michalovcewith- the centre around Strazske. The region goes south esp. to Vojany and Trebisov settlements. Theregion occupies the area of Humenne, Vranov nad Topl'ou, Trebisov and Michalovce districts. The pollu-tion is mainly caused by the chemical and energy industries. In this endangered region, there are 207 000inhabitants living in 57 settlements, eight are municipal. The region occupies the area of 1 081 km2.
Air PollutionTable 71 The largest sources of air pollution in Stredny Zemplin region according to the emis-sions of basic air pollutants from 1996 to 1997 (t per year)
Basic characteristics of main producers of air
pollution and pollutants
• The emission of basic pollutants from the
largest sources of air pollution in this endan-
gered region was 74 484 t in 1997, that means
2 659 t less than in 1996
• The slight decrease of SPM emissions was
indicated in 1997 with the exception of Vojany
power station, which produced 2 017 t moreSource: SI IMl'I . . , r 1 • r \ • •
emissions because oj the increase of electricity
production
• The total volume of SO2 emissions from the largest sources was 3 380 t more then in 1996. The increase ofSO2 emis-
sion by 465 t was indicated in Chemko a.s. Strazske and by 256 t in Bukoza a.s. Vranov nad Topl'ou
• The total volume of NOx and CO emissions slightly decreased, compared to the year 1996
• The emissions of chlorine, mercaptan and hydrogene sulphide (Bukoza a.s. Vranov nad Topl'ou), ammonia, formalde-
hyde, acetaldehyde, cyclohexane, cyclohexanone and alkylalcohol (Chemko a.s. Strdzske) were also important.
Pollutionsources
SE a. s.TowerStationVojany(EVO)
Chemko a.s.StrafakeBukdza a.s.Vranov nadToprouChcmcs a s.tlumenn£Potravlnarskykomblna! a.s.TrcbiSov
SPM
19968 580.')
642.6
363.4
<>72.2
20.1
199710 607.0
580.6
369.3
569.1)
11.4
SO,
199625 578.fi
8 039.5
2 948.0
2XS1.I
232.2
199722 [177.0
9 404.5
3 204.0
2 332.0
181.0
NO,
199617 587.7
2 7S7.7
761.0
676.1
74.3
199717 302.0
1 000.0
806.0
758.0
210.8
CO
1996722.X
2 608.3
344.4
612.4
11.3
1997729.0
2 641).]
344.0
447.0
9.7
58

State of the Environment Report - the Slovak Republic 1997
Fdliitfoa loarce
Bvk&x ».i.VnmovnidToprovCbemko tta.Str0»keFotraviairtkykombuiii Ll.TrcbSoT
W«KS.p , cz .MkbOovc.
BOD, t1956
295.7
138.S
31.5
500.2
425.7
per yew1997
297.9
133.6
34.5
488.8
381.6
CODp, t p*r yeir19962 534.9
735.9
108.2
8SS.7
922.4
19972 904.7
847.9
125.9
879.9
901.9
SStperye*r199610 213.3
3 188.8
421.0
913.8
2 188.7
199710001.6
3 753.8
439.9
684J
1873.2
IS t p«rye*r1996
549.2
360.0
45.7
432.8
319.3
1997532.0
213.7
48.3
342.2
3122
Water PollutionTable 72 The largest sources of surface water pollution in Stredny Zemplin endangered regionaccording to selected indicators of discharged pollutants in 1996 and 1997
Basic characteristics of the quality of surface
watercourses at the checkpoints in 1997
• For the high concentrations of mercury, the
River Laborec is put to water quality category
IV - V. Coliform bacteria in all checkpoints
put the group of biological and microbiologi-
cal indicators to category V - as a consequence
-. —-f of improper water treatment in WWTP in
Michalovce and WWl'P in Humenne
• The water quality in the River Latorica and
Uh tributaries running from Ukraine was in the quality category III - V. The category V was caused by coliform bacteria
• The River Ondava watercourse bellow Vranov nad Topl'ou is in all assessed groups of indicators in the categories IV -
V. This quality level is caused by CODCr> IS, ENPuv, zinc and coliform bacteria indicators.
Soil PollutionThe soil in this region is under the long-term impact of emissions from various sources. The acid-
ification is apparent from the past production of Vojany power station and Chemko a.s. Strazske. The soilis in the category O-A not contaminated - risk soil according to the Soil Fertility Research Institute sur-vey. The contamination by petroleum products was caused outside the territory of Slovakia (Ukraine) bythe accidents that led to the contamination of the Rivers Uh and Latorica (in 1993 and 1994).
Waste ManagementAll district towns in this region have problems with the waste treatment. This situation is caused
by the lack of landfill sites capacities and by the lack of appropriate landfill sites. The assessment of theenvironmental impact in Michalovce and Michalovce surroundings forced to find a new area for the newregional landfill site.
The largest producers of waste - hazardous including (Chemes a.s. Humenne, Chemko a.s.Strazske, Bukoza a.s. Vranov nad Topl'ou, Vojany power plant) solved the problem of waste managementby the construction of their own landfill sites, incinerators and sludge pits so the waste management inthese companies is in accordance to the legislation (except Bukoza a.s. Vranov nad Topl'ou). There is awaste separation plant operating in Michalovce.
Table 73 Landfill sites in Stredny Zemplin region
District
Michalovce
Uumenne
Vranov nadTopl'ou
Trebisov
Industrial waste landfillof construction category HI.
In accordanceto the
governmentalregulation No.606/92 CoIL
3
1
-
Specialconditionsissued in
accordance to§15 Act No.238/91 Coll.
-
1
-
Operated by
•Vojany PowerStation,
•Chemko a.s.Stra&ke
•Nafta a.s. Gbcly•Chemes a.s.Humenne
•Bukoza a.s.Vranov nadTopl'ou
-
Municipal landfillof construction category HI.
1°accordance to
thegovernmental
regulationNo. 606/92
CoU,1
0
2
0
Specialconditionsissued in
accordance to§15 Art No.238/91 ColL
2
1
0
1
Under thereconstruction
/In thepreparation
2
1
1
1
Sludge pits inaccordance to
Act No.327/96 CoU.
2
-
-Note: Thia chart contains only the district landfills thai are within Ihc endangered area. Source: SA^P
59

State of the Environment Report - the Slovak Republic 1997
SK99K0199
tate of the Environment •Causes and Consequence',
Economic Developmentand Technologies
In 1997, Gross Domestic Product (GDP) in the Slovak Republic equalled to 653.9 billion Sk incurrent prices. In comparison to 1996 GDP growth reached the level of 6.5%. Year-to-year GDP growthindex came up to 113.6 . All economic spheres contributed to its growth. From industrial fields withmajor contribution to environmental problems industry attained growth index of 106.5 and agricul-ture&forestry sector growth index of 106.0.
Table 74 GDP according to main economic sectors
Total GDPAgriculture and forestryIndustryConstructionMarket servicesOther
GDP percentage share (%)1993100
6.636.8
6.728.021.9
1994100
7.430.65.0
41.615.4
1995100
5.628.6
4.641.020.2
1996100
5.226.3
4.741.422.4
1997100
4.828.2
5.343.418.3
Source: SU SR
Industrial contribution to GDP in 1997 was 28.2%. Incomparison to 1996, industrial commodities output in 1997increased by 5.9%. Considering industries with significantnegative impacts on the environment, the output growth inthe following sectors is important:
• processing industry - growth by 6%• mining and quarrying - growth by 9.9%• electricity generation and distribution - growth by 4.4%.In 1997, continuing in trends of previous years, principal shares in industrial output were as follows:• metal processing - 16%• machinery and vehicle production - 15%• food processing - 14.1%.
60

State of the Environment Report - the Slovak Republic 1997
Less important contributors to total industrial output were:• leather processing industry - 0.9%• wood-processing industry - 1.5%.
Table 75 Basic indicators of industrial output development (statistics including only enterpris-es with more than 25 employees)
Sector
Industry and energyMining and quarryingProcessing industries including:Food-processing industryTextile and fabric industryLeather-processing industryWood-processing industryPulp / paper-making industryCoke production, crude oil refining, nuclear fuelsChemical industry- rubber productionMetal-processing industryMachinery and vehicle productionOthersElectricity, gas and water production and supply
Commodities production(mil Sk) - 1997
475 71311478.
413 6726691814 6004 2577 308
26 18837 53856 26676 25471 56852 77550 563
Index1997/19961
105.9109.9106.0105.495.070.8
105.610.0
108.8100.1109.7108.0111.7104.4
Sector's share in commoditiesproduction (%)-1997
2.487.014.13.10.91.55.57.9
11.816.015.011.210.6
'index calculated from fixed prices (excluding consumption and VAT) Source: SO SR
Industrial activities have considerably high, mostly negative impact on the main components of theenvironment. Main negative effects of industrial production on the Slovak environment are listed below:• air pollution• water pollution• soil contamination• mineral environment damage• post-accident risk <•• industrial waste production• reduction of agricultural land.
Regarding waste waters discharge, positive trend meaning reduc-tion of total volume (by 71 603 thousand m3 in comparison to 1994)was recorded. This trend also regards decline in a level of pollution forthe following pollutants (amounts compared to 1996):
• IS (Insoluble solids) by 1 605 tonnes• BOD5 (Biochemical oxygen demand) by 182.9 tonnes• CODCr (Chemical oxygen demand) by 1 915.3 tonnes• ENP (Extractable non-polar substances) by 92 tonnes.
Table 76 Volume of discharged industrial waste waters (1997)
Industrial wastewater-
Treated
Untreated
Total
Volume(thous.m3.year"')
305 303.156
272 795.022
578 098.178
IS(t.year"1)
8 349.51
8 925.78
17 275.29
BOD5
(t.year"1)
7 136.16
1 073.81
8 209.97
CODCr
(tyear'1)
22 574.97
2 576.54
25 151.51
ENP(t.year'')
150.36
24.70
175.06Source:SHMU
In the area of basic pollutants emissions produced during technological processes the decline intotal amount of SO2, NOX and solid substances was recorded. However, CO production was increased by12 249 tonnes, compared to 1996.
61

State of the Environment Report - the Slovak Republic 1997
Table 77 Industrial sectors contribution to waste production - excluding other waste (tonnes)
SectorMining and quarryingFood-processing industryTextile and fabric industryLeather-processing industryWood-processing industryPulp / paper-making industryCoke production, crude oil refining, nuclear fuelsChemical industry- rubber productionMetal processingMachinery and vehicle productionOthersElectricity, gas and water production and supplyTotal
Waste volume21 058
165 62215 78014 86046 15158 928
224 543236 951333 206291 575
1 851148 644
1 559 169Source: SA2P
Table 78 Emission released into air during technologic processes - classification based on indus-trial sectors (REZZO1) . Results given in tonnes (1997)
Kind ofproduction
Metallurgy-ferrous metalsMetallurgy-non-ferrous metalsChemicalindustryCement & LimeworksWood-processingindustry pulp /paper-makingindustryCrude oilrefineryOther industryTechnologicalprocesses fromREZZO 1 total(REZZO 1)
SPM
Amount7 718
568
1 648
1 689
779
163
140113 966
36 646
(%)21.06
1.55
4.50
4.60
2.13
0.44
3.8438.11
100.00
SOj
Amount8 372
8 248
569
321
2 297
3 609
1 38824 804
176 564
(%)4.74
4.67
0.32
0.18
1.30
0.7914.05
100.00
NO,
Amount4 408
169
1629
3 193
1796
4 506
3 59919 300
70 583
(%)6.24
0.24
2.31
4.52
2.54
6.38
5.1027.34
100.00
CO
Amount80 447
11 214
2 652
18 747
341
3 737
2 521119 659
141 636
(%)56.80
7.92
1.87
13.23
0.24
2.63
1.7884.48
100.00Source: SHMU
•},) I
In 1997, 439 mines were in operation on the territory ofthe SR. Mineral resources exploitation took place at 607exclusive mineral deposits of which 379 deposits were withexploitation site regarded as protected deposit area. This num-ber included:• 5 coal deposits• 31 crude oil and natural gas deposits• 22 ore and magnesite deposits• 321 non-metallic ore deposits.
62

State of the Environment Report - the Slovak Republic 1997
The statistics shows that 107 exclusive mineral deposits were only with protected deposit sitesbeing approved and 61 exclusive deposits were undergoing approval procedure. As of December 31, 1997,167 exclusive deposits were not exploited including:• 10 coal deposits• 5 crude oil and natural deposits• 26 ore and magnesite deposits• 126 non-metallic ore deposits.
Besides exclusive deposit exploitation was in progress also at 224 non-limited mineral deposits.In 1997, stabilisation trend in mining prevailed. In some cases such as coal mining and magnesite
exploitation a slight increase was recorded. From the total amount of coal mined approx. 85% was usedfor energy production, 15% was distributed in a form of graded coal.
In 1997, from the total amount of 64 483 tonnes of crude oil exploited 4 214 tonnes were of non-paraffin oil and 44 934 tonnes were of semi-paraffin oil.
In 1997, a decline by 27 677 thousand m3 in natural gas exploitation was recorded (as comparedto 1996). Ptruksa - the most important natural gas deposit allows even propane-butane extraction of1 023 tonnes a year which covers demand of East Slovakia region and partly also that of Central Slovakiaregion.
Ore exploitation in 1996 took place at branch enterprise Rudnany Zelba shared comp. with head-quarters at Spisska Nova Ves (complex baryte-siderite-sulphide ores). In 1997, the total production atZelba rose by 9.5 kilotons, in comparison to 1996. However, total concentrate production fell by 3.7 kilo-tons. At branch enterprise Siderit - Nizna Slana monomineral siderite replacement ores were mined.Non-ferrous ores were mined only by the Slovak Mining Comp. s.r.o.. Hodrusa-Hamre. In 1997, it pro-duced 66.3 kilotons of gold ore and 1.75 kilotons of concentrates. Programmes following reduction oftotal ores output were under way in Rudne Bane, State Mining Comp. Banska Bystrica and Spisska NovaVes State Mining Comp.
Table 79 Mineral resources exploitation (as of December 31,1997)
Raw material Units ExploitationFuelsBrown coal and ligniteCrude oil including gasolineNatural gas
ktkt
thous. m3
4 297.664.48
289 431.0
OresComplex Fe, Cu, Hg oresFe oresGold and Silver oresOres (total)
ktktktkt
106.14962.166.3
1 134.54Non-metallic oresMagnesiteRock saltBentoniteZeoliteTalcGypsum and AnhydrideQuartzite
ktkt
thous. m3
thous.m3
ktkt
thous. m3
1 580.7105.247.2
5.6-
102.08.3
Building materialBuilding rockGravel sands and sandsBrick clayLimestone
Limestone for specific purposes
High-content Limestone
thous. m3
thous. m3
thous. m3
thous. m3
ktthous. m3
ktthous. m3
kt
5 022.56 255.1
457.6312.5
1 406.3970.9519.0
1 230.02 867.3
Source: HBU SR
63
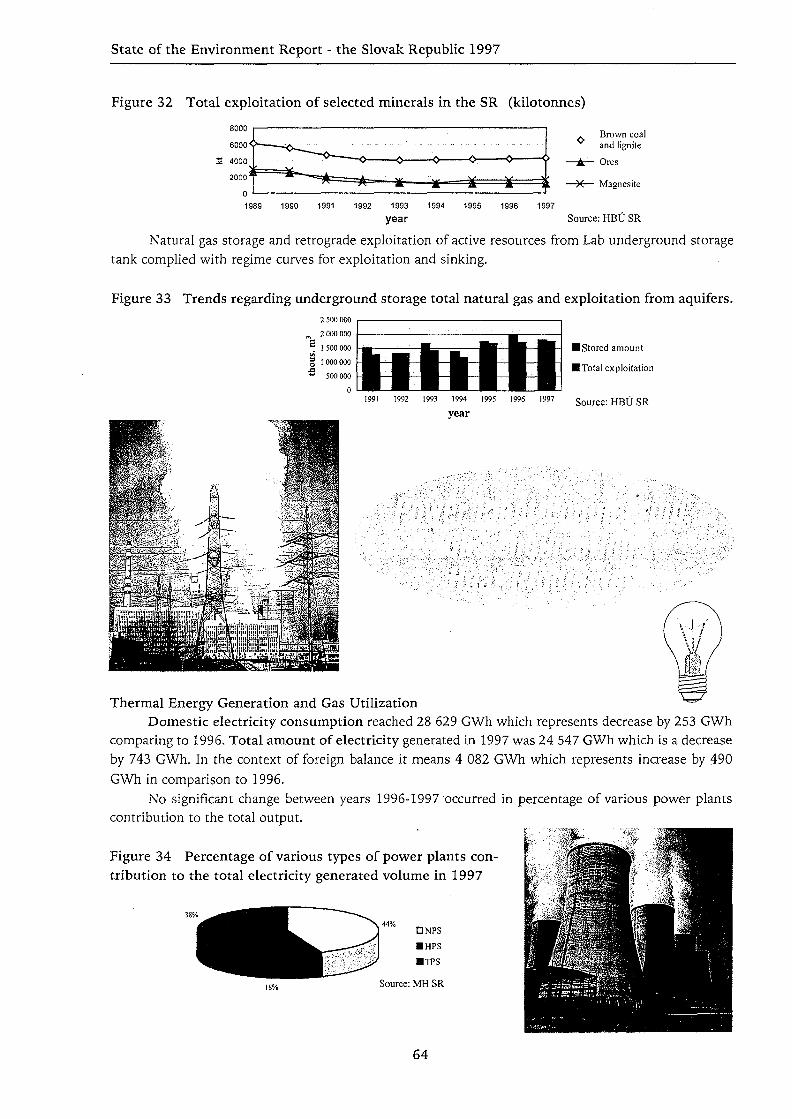
State of the Environment Report - the Slovak Republic 1997
Figure 32 Total exploitation of selected minerals in the SR (kilotonnes)
» Brown coaland lignite
A Ores
K— Magnesite
1989 1990 1991 1992 1993 1994 1995 1996 1997
year Source: HBU SR
Natural gas storage and retrograde exploitation of active resources from Lab underground storagetank complied with regime curves for exploitation and sinking.
Figure 33 Trends regarding underground storage total natural gas and exploitation from aquifers.
• Stored amount
• Total exploitation
Source: HBU SRI99I 1992 1993 1994 1995 1996 1997
year
Thermal Energy Generation and Gas UtilizationDomestic electricity consumption reached 28 629 GWh which represents decrease by 253 GWh
comparing to 1996. Total amount of electricity generated in 1997 was 24 547 GWh which is a decreaseby 743 GWh. In the context of foreign balance it means 4 082 GWh which represents increase by 490GWh in comparison to 1996.
No significant change between years 1996-1997 occurred in percentage of various power plantscontribution to the total output.
Figure 34 Percentage of various types of power plants con-tribution to the total electricity generated volume in 1997
44%
18%
• NPS
• UPS
• TPS
Source: MH SR
64

State of the Environment Report - the Slovak Republic 1997
When comparing years 1996 and 1997 we can say that only insignificant changes occurred in thepercentage of various power plant types related to the total electricity produced.
Table 80 Produced and imported amount of electricity in the SR in 1997 (GWh)
Grip generation, SEv REP, :ZE t- including:': :''^X";: f; ;
S l o v a k E l e ( ^ c i t y C o n ^ ; : ( S E ) :::::; i::; •,^[l\fyj: yi •. »''
R e g i o n a l E n e r g y S u p p l y i n g C o m p l ; ; ( R E P ) • ? • ; ; ; : : : \
Power plants linked: to ^independent industrial' unite
I m p o r t from a b r o a d •-...::'•'•• •'"••'••'' ' • " :
E x p o r t a b r o a d . ; . : : : ; :
I n d e p e n d e n t p r o d u c e r s y ' : •:: .••.•.:;;.• •/••.•;:;••;, ̂ ^ . - ^ ;:; : k
Total wtheSR ;] --Xr-X
GWh
24 547
21171
630
2 744
6 825
2 743
2
31372
Index 1997/1996
97.06
96.20
106.06
102.05
114.80
116.57
-
100.44
Source: SE a.s
Table 81 Power plants installed output in the SR (MW) - type classification
Indicator
Nuclear power stations (NPS)
Thermal power stations(TPS)Hydroelectric flow powerstations (HPS)Hydroelectric repumpingpower stations (HPS)Total
1995
SR1 760.00
2 981.14
1 640.27
735.16
7116.57
SE1 760.00
1 989.14
1 633.66
735.16
6 118.62
1996
SR1 760.00
2 995.31
1 640.27
735.16
7 130.74
SE1 760.00
2 017.80
1 633.66
735.16
6 146.62
1997
SR1 760.00
2 995.31
1 640.27
735.16
7 130.74
SE1 760.00
2 017.80
1 633.66
735.16
6 146.62
Index 19W1996
SR100
100
100
100
100
SE100
100
100
100
100Source: SE a.s.
Table 82 Comparison of electricity generated in the SR - technology based
Nuclear power stations
Thermal power stations
Hydroelectric powerstationsPower stations linked toindependent industrialunits
Total generation ; : .
Including: SSE
• / • • • " : V ; Z S E ^ •••••';. , ;
Foreign balanced:
Consumption - total
1996
(GWh)
11 261
6 862
4 478
2 689
25 290
344
251
3 592
28 882
% of total electricitygenerated
28.99
23.76
15.5
9.31
87.56
1.19
0.87
12.44
100.00
1997
(GWh)
10 797
6 697
4 309
2 744
24 547
387
245
4 082
28 629
% of total electricitygenerated
37.71
23.39
15.05
9.58
85.74
1.35
0.86
14.26
100.00
1997/1996
Index
95.88
97.6
96.23
102.05
97.06
112.5
97.61
113.64
99.12
Source: SE a.s.
Table 83 Fuel and energy consumption in 1997 - sectoral split - agriculture, forestry, trans-portation, industry and Construction
Fuel and energyAnthracite, brown coal, cokeM o t o r a n d h e a t i n g o i l i : ^ ; v : ' ^ :: :.:: ; •:•.•'•;•'••' .••••'
H e a t i n g o i l s ; • ;' ' • • ' : ' • • • ' • > : ' > • : . : •-• • v :•:•• . : ' : ' . V ' ' : "
: N a t U r a I . g a S ' : : ' < : . V . : V 1 : ^ 1: ^ : . V v V . . : - 1 : : . ' •. " • / • i ' - - - i - . :
: - : . • > ; • : : . • . • : • : . : • • • • ? . : : :•::; :
E l e c t r i c i t y : - ; : : i v ' •,'••' : ' " V : ' : '•:••••••• - r ^ y ' ^ r / ' v - : " :::.':-
• T h e r r n a l . e n e r g y : ' . : v v / ^ ' ^ ; : . ' •• • • • ' : • • ; • ; • ; • •; : ' : : ; ' > : , , ; • • • . . . • • • . • : .
Volume11 745 thous.t
824 thous.t675 thous.t
5 439 mil m3
21 201 GWh133 368 TJ
Source: Su SR
65

State of the Environment Report - the Slovak Republic 1997
Table 84 Primary energy resources used in the SR (1997) - based on the fuel categories
Fuel categories
Solid
Liquid..:;; ...• u:;:y.: . :
F l u i d , ; ; . • : : • : : ? • • : • • : ' - : : , ^ : : . . ^ y '
TJ
209 460
120 453
235 187
Source: SU SR
With installed output of 6 147 MW, SE a.s. secures 86% of total Slovak electricity generation.Nuclear power stations generate 51% of total annual electricity production supplied by SE a.s. Thermalpower station produced 29% and hydroelectric power station contribute by approx. 20%.High percentage of electricity generated by nuclear and hydroelectric power stations minimalizes theamount of emissions released into air.
In total, emissions of basic pollutants decreased comparing to 1996 by 2 407 tonnes of solid sub-stances, 16 169 tonnes of SO2, by 5 150 tonnes of NOX and 2 655 tonnes of CO.
Table 85 Air pollution related to energy production in the SR (REZZO1 - statistics for 1997 in tonnes)
Method ofgenerationREZZO1totalEnergy generationincluding:SystematicIndustrialMunicipal
SPMAmount36 646
22 680
12 6398 4111 630
. . ( % ) • • .
-
61.89
34.4922.954.48
SO*Amount176 564
151 760
72 77059 43719 553
(%)-
85.95
41.2133.6611.07
NO,Amount70 583
51 283
25 13519 2416 907
-
72.66
35.6127.269.79
COAmount141 636
21 977
4 69215 1022 183
-
15.52
3.3110.661.54
Source: SHMU
Table 86 Proportional comparison of emissions of systematic and other energy generation (years1996-1997, in tonnes)
Indicator
Energy generationtotal includingSystematic energygenerationPercentage %Industrial andmunicipal sourcesPercentage %
SPM1996
25 087
11030
44.014 057
56.0
199722 680
12 639
55.710 041
44.3
SOZ
1996167 929
78 514
46.889415
53.2
1997151 760
72 770
47.978 990
52.0
NO,1996
56 433
26 555
47.129 878
52.9
199751283
25 135
49.026 148
51.0
CO1996
24 632
5 035
0.419 597
79.6
199721 977
4 692
21.317 285
78.6Source: SHMU
For information about waste generation related to electricity, gas, water production and supply seesection Industry within this chapter.
As of the end 1997, the total length of operated domestic gas distribution networks was 21 503km (19 152 km) in 1996; the length of long-distance networks was 5 580 km (5 340 km in 1996) of totallength (21 503 km) and distribution network accounted for 15 923 km of the total length (13 812 km in1996). In 1997, 226 new villages were linked to the existing distribution network thus increasing thetotal number to 1 419 villages.
Table 87 Natural gas consumers chart
Number of consumers
P o p u l a t i o n ;: .;•:; •'•'•••:'
Small consumers
Major consumers
Total
906 889
27 697
3 448
938 034
1993
951 049
29 571
3 750
984 370
y:: :T994;>:;,
996 177
31349
4 063
1 031 589
1044 123
32 991
4 244
1 081358
1996
1 100 878
35 216
4 503
1140 597
1997
1 164 172
39 621
4 781
1 208 574
Source: SPP §.p.
66

State of the Environment Report - the Slovak Republic 1997
The Slovak Republic with its forest cover of 40.65 %(1 990 603 ha) belongs to one of those European countrieswith the highest proportion of forests set against the overall .country area. In European context only Scandinavian states ofFinland (77%) and Sweden (69%) and Austria (46%) inCentral Europe enjoy higher forest cover. Timber land (land intended for growing forest species) occu-pies 1 919 911 ha (96.45% of forest land fund). In the context of prevailing forest functions and fromthem resulting management methods the forests are divided into 3 categories:• commercial forests (1 296 005 ha, 67.50%)• special-purpose forests (334 777 ha, 17.44%) with special functions• protection forests (289 129 ha, 15.06%) securing principle ecological and conservation functions.
Figure 35 Forest categories according to acreagein the SR (%)
15.06%
M Commercial forests
H Special-purpose forests
H Protection forests
Source: Lesoprojekl Zvolen
Table 88 Proportion of stand types in the SR
Stand typeDwarf-pine forestSpruce forestFir forestPine forestOak forestBeech forestMixed Oak-Beech forestMixed Beech-Oak forestRobinia (Locust) forestMixed Spruce-Fir-Beech forestMixed Beech-Fir-Spruce forestOthers
%1.11
19.960.496.567.36
21.017.334.621.80
14.4112.296.06
Source: Lcsoprojckt Zvolcn
Proportion of broad-leaved and coniferous forests in the SR is as below:• broad-leaved forests - 57.55 % of the total forested area• coniferous forests - 42.45 % of the total forested area.
At the moment, trend in tree species representation favours higher percentage of broad-leavedspecies in forest ecosystems thus creating more favourable preconditions for achieving ecological stabi-lity of forest stands.
67

State of the Environment Report - the Slovak Republic 1997
More complex view on tree species representation is given in the statistics of stand type represen-tation as this also reflects tree species mixture, combination and their spatial distribution.
Table 89 Spatial tree species distribution in the SR
Tree speciesSpruceFirPineLarchDwarf-pineOther coniferous speciesConiferous totalOakTurkey oakBeechHornbeamMapleAshElmRobiniaBirchLime-treeAlderDomestic poplar speciesHybrid poplar speciesWillowOther broad-leaved speciesBroad-leaved total
%27.10
4.397.642.281.020.02
42.4511.202.40
30.045.601.681.190.051.741.340.340.710.370.580.110.20
57.55Source: Lesoprojekt Zvolcn
Age structure of the Slovak forests is not optimal and is being described as unbalanced. Regardingproportion of age categories in the Slovak forested areas, percentage of age categories 1-4 (forest standsbetween 1-40 years of age) is subnormal (30.52%), percentage of age categories 5-9 (forest stands between41-90 years of age) is on the contrary higher than optimal percentage (50.93%). Older mature forest standswith age limit 91 and over (age category 10 and more) have proportion lower than optimal (18.55%).
Effective management and forest protection measures taking into consideration ecological aspectsare made possible thanks to existing forest transport system (LDS) allowing optimal access to all forest-ed areas. The most important component of LDS is forest haulage road system with its length of 20 645km in 1997 (10.4 m per ha of forest land). Total length of skidding roads and lines was 15 037 km(7.6 m per ha).
In 1997, the total area of 13 239 ha was afforested of which 11 562 ha was artificial regenerationand 1 677 ha was down to natural regeneration.
Total growing stock was 390 mil m3 of timber to the top of 7 cm o.b. without bark which representsincreased by 6 mil m3 (384 mil m3 in 1996). Total 1997 volume of harvested timber was 5 944 thou-sand m3 (coniferous species - 3 686 thousand m3, broad-leaved species 2 258 thousand m3). Incidentalfelling reached 3 396 thousand m3 which represents 57.1% of total volume of harvested timber.
Figure 36 Percentage of incidental felling in total volume of harvested timber (SR)
1988 !')89 \V)0 1991 1992 1993 1994 1995 1996 1997
Source: MP SR, Lesoprojekt Zvolen
68

State of the Environment Report - the Slovak Republic 1997
Abiotic harmful factors are consideredto be principal causes of incidental felling.Range of damages caused by their activity in1997 is as follows:• windthrow hazard• snow• frost deposit
forest firesdroughtunknown cases
- 2 082 thousand m3
58 thousand m3
- 100 thousand m3
10 thousand m3
- 145 thousand m3
- 118 thousand m3.
Table 90 Proportion of damages caused by main abiotic harmful factors (1988-1997) in thousandm3 of timber
Year
1988198919901991199219931994199519961997
Windthrowhazard825
I 3371 480849827666794823
1 9972 082
Snow
1761651671241067051124013358
Frost deposit
146574510126121182100
Drought
584266172149201179257430145
Total
1 2051 6011 7581 1551 094943
1 4851 3422 7422 385
Source: LVU Zvolcn
Main biotic harmful factors contributing to incidental felling:bark - beetle species and woodwormleaf-eating and sucking insectsrotstracheomycosisgame
- 644 thousand m3
- 14 thousand ha- 18 thousand m3
- 57 thousand m3
0.64 thousand ha.
Other harmful factors contributing to forest damage are ambient air quality, grazing and tourism,/olume of timber damaged by ambient air quality reached 381 535 m3 in total. Out of this number sprucelamage accounted for 79% , fir damage 16%, oak 2%, pine 2%. In comparison to 1996, total damagesaused by ambient air quality are lower by 0.4%.
Monitoring plays an important part in forest health state monitoring. In 1997, Forestry Researchnstitute (LVU Zvolen) carried out 11th monitoring cycle within 16 x 16 km monitoring network indu-ing 11 permanent monitoring sites.
According to the monitoring results for 1997 (based on damage levels and % of defoliation) 18%f trees fell into category 0 - Healthy trees (0-10 % defoliation) and 82% of trees fell into the categoryinge 1-4 (11-100 % defoliation) out of which 31% of trees showed signs of heavy damage. 1% of trees•ere considered to be dying or already dead.
According to survey, broad-leaved species are more resistant to harmful factors than conifers. Theast damaged broad-leaved species appear to be hornbeam (6.1%) and beech (13.5%). The most suf-ring and sensitive species with the highest percentage in the categories 2-4 are fir (59%) and spruce•4%). From broad-leaved species the least tolerant species appears to be oak (41.9%).
69

State of the Environment Report - the Slovak Republic 1997
Table 91 Forest health state monitoring results (1987-1997)
Year
1987
1988
1989
1990
1991
1992
1993
1994
1995
1996
1997
Species
coniferousbroad-leavedtotalconiferousbroad-leavedtotalconiferousbroad-leavedtotalconiferousbroad-leavedtotalconiferousbroad-leavedtotalconiferousbroad-leavedtotalconiferousbroad-leavedtotalconiferousbroad-leavedtotalconiferousbroad-leavedtotalconiferousbroad-leavedtotalconiferousbroad-leavedtotal
Percentage of trees according to damage level (%)01126191433259
20151423201441301531248
28208
201581914121513132218
I364742333936323836304539473842444042424343414543404644475753455551
2412232432332493742472534341724332327462533443136463238372630382128
31157956946856433756333545523212322
410010
;
212101
1-4897481866775918085867780865970856976927280928085928186888587877882
2-4S32739532839594249563241392128412934502837513642523542412834422331
3-41257105710579775448674447S6634424423
Legend describing damage levels:0 - 0-10 % without defoliation - healthy trees1 -11-25% slight defoliation - slightly damaged trees2 -26-60% medium defoliation - medium damaged trees
1 Source: LVU Zvolcn3 - 61-99% heavy defoliation - heavily damaged trees4 -100% dying or already dead trees
Comparison of dynamics of forest health state changes between year 1996-1997 (expressed bylevel of defoliation) in 24% of trees the health state improvement was recorded, 58% trees no changeswere observed, in 18% of trees the health state deteriorated.To conclude, we can say that a slightimprovement in the health state of Slovak forest was observed in comparison to 1996. The differencerepresents 6%. Broad-leaved species in general show higher resistance and more tolerance to harmful fac-tors.
In 1997, agriculture contribution to GDP was 28 867mil Sk in current prices which represents 4.41% of total GDP,as opposed to 4.7% in 1996.
In 1997, a slight decline in the total acreage of arable land was recorded but, on the contrary, per-manent grassland area increased by a few hectares.
70

State of the Environment Report - the Slovak Republic 1997
Table 92 Structure of agricultural land fund as of January 1st, 1998
Land category
Agricultural land in totalArable land
Hop-gardensVineyardsGardensOrchardsPermanent grasslandTotal SR area
Area(thousand ha)
19962 444.01 475.0
1.029.078.019.0
842.0.4 903.46
19972 444.631472.12
1.2628.8177.8918.97
845.594 903.46
Percentage(%)
199610060.35
0.041.183.190.77
34.45-
199710060.22
0.051.183.190.78
34.59-
Source: UGKK SR
In annual production, trend in decreasing numbers of livestock, swine, sheep and horses wasdetained. The only exception to this trend were numbers of goats and poultry that continued to growfollowing the trend from previous years.
Table 93 Livestock statistics 1997 (in pcs)
CategoryCattleSwineSheepGoatsPoultryHorses
1995929 000
2 076 000428 000
X
13 382 000X
1996891 991
1 985 223418 823
26 14714 147 177
9 722
1997803 398
1 809 868417 337
26 77814 221 713
9 533x - data not available Source: SU SR
In 1997, an increase in area of complex cultivated patterns was recorded only in case of cereals, oilproducing plants, sugar beet and vegetables. However, a significant decrease in complex cultivated areaof potatoes, edible legumes and root forage plants was observed.
Total volume of industrial fertilizers consumption rose in 1997 by 19.7 % comparing to 1996.Use of pesticides showed a decreasing trend as in previous years.
Table 94 Consumption of fertilizers in 1996 / 1997 (tonnes)
Fertilizers
SR total
Calcareous
854 233.21
Nitrogenous
88 016.58
Phosphate
24 493.60
Potassium
20 477.40
Industrialfertilizers total132 987.68
Manure
7 961 988.65Source: SO SR
Figure 37 Consumption of industrial fertilizers in the SR (in tonnes of pure nutrient)
3O. 300000
C
o
1993
Source: SU SR
71

State of the Environment Report - the Slovak Republic 1997
Table 95 Consumption of NPK fertilizers per 1 ha of agricultural land (in kg of pure nutrients)
Fertilizer type
Nitrogenous
Phosphate
Potassium
Industrial fertilizers intotal
Consumption per 1 ha of agricultural land1995
30.6
7.8
6.645.0
199632.8
8.8
7.3
48.9
199737.7
10.5
8.8
57.0
Source: §11 SR
Table 96 Consumption of pesticides in 1997 (tonnes)
TypePesticides - totalInsecticides -totalChlorinated HydrocarbonPhosphorus organic compoundsCarbamate insecticidesPyrethrum insecticidesMineral oil insecticidesother insecticidesBiological pesticides
Herbicides - totalPhenol- group AcidsTriazinesAcetamidesCarbamatesDinitroanilineMineral oilsOther herbicides
Fungicides - totalOther chemicals - totalMordantsDesiccators and defoliatorsMorphoregulatorsChemicals limiting harvest lossesRodenticidesRepellentsTenzidesAdditivesAntitranspirantsSoil remediation substances
Consumption3 512.5
159.20.1
83.113.942.1
6.512.21.3
2 523.4658.6356.3527.2131.472.3
2.5775.1506.4323.5
92.6115.078.814.39.80.24.76.80.40.9
Source: UKSUP
In 1997, agriculture produced 4.18 mil tonnes of waste in total (data represents summary of agri-cultural waste, game management and related services waste excluding other waste).
Comparing to 1996, total amount of discharged waste water fell by 84 thousand m3.Simultaneously the decrease of CODCr and BOD5 and increase of IS and ENP were registered.
Table 97 Amount of discharged wastewater related to agriculture activities
Waste waterproduced byagricultureTreated
Untreated
Total
Volume(thous.m3.year"')
2 375.343
67.160
2 442.503
IS(t.year1)
122.33
5.48
127.81
BODS
(t.year"1)
86.89
5.78
92.67
CODCr
(t-year1)
297.65
21.22
318.87
ENP(tyear"1)
1.390.01
1.40Source: SHMU
HydromeliorationNo change between 1996 and 1997 was recorded.
Table 98 Transformation of principal melioration facilities in the SR (ha)
SRIrrigation system
320 091
Drainage system458 500
Source: VUZH Bratislava
72

State of the Environment Report - the Slovak Republic 1997
Transport NetworkIn 1997, transport network of the SR included 17 629 km of roads and motorways of which
218.9 km were motorways. As for railway transport network there were 3 673 railway tracks out ofwhich 1 516 were electrified railway tracks. The length of navigable watercourses remainedunchanged 182 km of which channel length represented 38.45 km.
The amount of passengers carried by road vehicles fell by 17 310 passengers. Similar trend wasobserved in railway transport with the number of passengers decreased by 3 703 persons. A sharp declinewas recorded in number of persons carried by air. Increased by 1 thousand carried passengers was record-ed by shipping. In case of freight all type of transport excluding shipping recorded an increase.
Table 99 Freight and passengers shipping
Type of transportRoad transportcarried passengers (in thousands)efficiency - (mil persons per km)freight shipping (in thous. tonnes)efficiency in (mil tonnes per km)Railway transportcarried passengers (in thousands)efficiency - (mil persons per km)freight shipping (in thous. tonnes)efficiency (in mil tonnes per km)Shippingcarried passengers (in thousands)efficiency - (mil persons per km)freight shipping (in thous. tonnes)efficiency (in mil tonnes per km)Air transportcarried passengers (in thousands)efficiency - (mil persons per km)freight shipping (in thous. tonnes)efficiency (in mil tonnes per km)
1993
825 6771144537 826
5 464
86 7272 948
64 82514 304
1347
1 399843
34210375.920.5
1994
761 43910 57428 465
4 910
99 1014 548
58 95312 236
1517
1 416846
6 78094
7.420.3
1995
722 51011 19132 043
5 158
89 4714 202
60 77613 674
1387
1 6611 468
111 388153
1.850.4
1996
699 75811 09734 745
5 171
74 2943 752
58 06612017
805
1 4131 597
125 104193
3.10.4
1997
682 1489 969
41 1083 779
70 5913 057
59 37712 373
814
1 3281 519
177231
1191
Source: SU SR
Continual increase in a number vehicles was again recorded in 1997.
Table 100 Number of vehicles according to the categories (as of December 31s t, 1997)
IndicatorTotal number of vehicles including:
Passenger cars
Vans
Lorries / trucks
SpecialBuses
19971 623 305
1 135 914
14 061
89 019
45 97611 235
Source: SU SR
73

State of the Environment Report - the Slovak Republic 1997
Figure 38 Total number of registered vehicles
• • • I I Iyear
19% IW7
Source: SO SR
Figure 39 Trends in the selected vehicle categories
3
§> 1000000
• passenger cars
• vans
• lorries/trucks
• special
IS buses
Source: §U SR
Emissions from Traffic
During 1997 only the summary of 1996 emission situation in traffic was elaborated.
Table 101 Emissions from traffic (1996)Sector
Road transport• Passenger cars• Light lorries• Heavy lorries• MotorbikesOther means oftransport• Railway transport• Shipping• Air transportTotal
NO,(t)
37 760153141 066
21 34337
5 643
3 5812011
5143 403
CO(t)
152 446119 161
4 54711 65917 0791 827
754431642
154 273
NMVOC(t)
36 62322 181
7404 8008 902
609
320183106
37 232
SO2
m1 971
339
189144
6.372 310
NH3
(t)161
161
CO2
(thous.t)3 8221 600
2491 891
83341
20011426
4 164
CH4
(t)1 158
19
127
1 177
N2O(thous. t)
234
135
8649
369Source: SHMU
Figure 40 Trends in traffic emissions
1995 1996
Source: SHMU
74

State of the Environment Report - the Slovak Republic 1997
199S 1996
Source: SHMU
NMVOC
1987 1990 1994 1995 1996
Source: SHMU
Traffic NoiseTraffic noise pollution assessment is a part of 'Risk Factors in the Environment' chapter.
Traffic Generated WasteIn 1997, traffic generated waste - belonging into the category of special waste - reached following
volumes:• ground transport, pipe system transport 51 222.3 tonnes• shipping 210.7 tonnes• air transport 124.7 tonnes.
Public Health
In 1997, average life expectancy at birth reached 68.91 for men and 76.73 for women. A slightincrease in the average life expectancy results from a positive trends observed in a baby death rate.Comparing to the rest of Europe on average life expectancy of the Slovak population is lower (men by6-7 years, women by 4-5 years).
World wide analyses carried out to date have shown that the impact of environmental pollution onhuman health is not significant. This fact has also been confirmed in Slovak conditions. Life expectancyof mail population in 3 most polluted districts (Bratislava - city, Kosice - city and Prievidza) was the hig-hest in the whole Slovakia. On the Slovak territory in general we can observe considerable differences ina life expectancy. The difference can be as high as 6 years between individual districts of Slovakia.
75

State of the Environment Report - the Slovak Republic 1997
Figure 41 Average life expectancy at birth - female population - in the Slovak districts (1993-1995)
Source: SU SR
Figure 42 Average life expectancy at birth - male population - in the Slovak districts (1993-1995)
69-7168-6967-6866 - 67
• • 64 - 66Source: SU SR
The shortest life expectancy is recorded in districts with low percentage of male population withuniversity or high school education background, on the contrary with high percentage of male populationwith only basic school education. The mentioned phenomena points out to a direct link between lifeexpectancy and differences in life-style.
Short life expectancy of the Slovak population is caused mainly by high death rate of middle-agepopulation group. In 1997, according to the statistics for the Slovak Republic, 52 124 men and womendied. In 3 quarters of cases diseases of cardiovascular system and cancer are to blame. Other categoriesof diseases namely diseases of respiratory tract, alimentary tract, urinary system and reproductive systemas well as outside causes of death contributed to the total death-rate by less than one quarter.
Figure 43 Basic factors influencing the death-rate of the Slovak populationDiseases of cardiovascular system
76

State of the Environment Report - the Slovak Republic 1997
tumors
19% I9')7
Source: UPK.M
Statistically, the highest long-term death-rate among the Slovak population is that caused by cir-culatory system diseases. In 1997, 28.5 thousand of patients died of this cause. As for age group andgender, male population is most severely affected in the age group of 70-79 years. Comparatively, themost severely affected age group among female population appears to be that of 70-89 years. Fromdiseases included in this category, heart attack and cerebrovascular diseases are the prevalent causeof death. The second most frequent cause of death occurring among the Slovak population is cancer andtumors, momentarily showing an increasing trend. In 1997, 1.3 thousand of people died of these caus-es. The most affected age groups are:• Male population between 65-74 years of age• Female population between 65-79 years of age
The following types of cancer are the most common: trachea, bronchi and lung tumors and cancer,malignant cancer of stomach and large intestine. A slight increase in occurrence of respiratory diseases wasregistered. In 1997, 3.7 thousand of persons died of this cause (50.4 % of males, 49.6% of females).
The male population death rate is most obvious in groups between 65-84 years of age. As forfemale population, it is the group of 75 years of age and more. The typical death causing diseases arechronic pneumonia and influenza.
Figure 44 Causes of death in 1997
Alimentary Iract diseases
4.2% Others
Injuries ;IIKI poisonings •
7.1%
Respiratorydiseases
7.2%
Cancer and tumors
21.7%
Circulatorydiseases
54.7%
Source: 50 SR
In statistics, rather than the total death rate comprising death in all age groups, indicator showingpremature death (0-64 year interval) is more significant. In the Central Europe, premature cardiovascu-lar deaths serving also as the principal indicator of the total death-rate which has been dependent on thesocietal-political organisation since the second half of 1960-ties. In democratic societies (Germany,Austria and Switzerland), the cardiovascular diseases death rate was showing a continual decrease. Onthe contrary, in geographically close countries of the Central Europe (Hungary, Poland, the formerCzechoslovakia) it showed a steady, significant growth. The trend in premature oncological diseasesdeaths was also unfavourable. Differences in prematurely occurred death caused by widespread diseasescontinue to exist in the Central region to these days.
In the long-term prospect, positive trends in baby death rate were observed, in percentage almost
reaching the level common for developed countries. In 1997, 514 babies died before reaching their first
77

State of the Environment Report - the Slovak Republic 1997
year. In comparison to 1996 this number is lower by 101 cases. The similar statistics in 1993 showed 525more deaths in this category. Before reaching 28 days of their life, 321 babies died as compared to 415in 1996.
Table 102 Public health - selected indicators
IndicatorLife expectancy at birth• Male• FemaleLive-births per 1 thousandinhabitantsDead before reaching 1" year ofage per one thousand live birthsBaby death rateDeaths in totalDeaths per one thousandinhabitants
1992
67.5676.2214.1
12.6
8.453 432
10.0
1993
68.3576.6613.8
10.4
7.552 707
9.9
1994
68.3476.4812.4
11.2
7.451 386
9.6
1995
68.476.311.5
11.0
7.952 686
9.8
1996
68.876.611.2
10.2
6.951 236
9.5
1997
68.9176.7311.0
8.7
5.452 124
9.7
Source: SU SR
78

State of the Environment Report - the Slovak Republic 1997
Environmental RiskFactors and PressuresPhysical Risk Factors
In 1997, input of the air-dose-equivalent (PDE) remained constant as compared to previousyears. PDE value ranged from 88 to 184 nSv per hour (average value - 124 nSv.h"1)- The average annualeffective-dose within Slovakia calculated from the data mentioned above equalled to 811mSv.
Table 103 Average radiation exposure (1997)
Author
Spumy (1997)SURMS(1997)
H,
inSv. h"1]
124.8124.0
Ka
[nSv. h l]
108.4107.8
E
[jiSv per year]
811811
Measuring device
GM Tube STS 6FAG 621 B
Hx - input of air-cffcctivc-dosc per hourK°- input of air-photon-radiation -dose per hour
E - effective dose per year Source: UPK.M
Air ContaminationIn 1997, the trend set in 1996 continued as continued deviations in artificial radionuclides air con-
tamination. As for artificial radionuclides, only those of 137Cs were detected. In 1997, their values rangedrrom 0.25 to 0.95 /xBq.nr3. In analysed samples, also natural radionuclides 7Be (100 - 5 000 juBq.nr3) and10Pb (40 - 1300 ,uBq.m"3) were present and detected. In the period 1993 - 1997, a gradual decrease in37Cs volume activity was recorded. 7Be volume activity did not show any significant year-to-year varia-ion. However, seasonal maximal and minimal values were recorded within a year period.
able 104 137Cs air volume activity (1993-1997)
YearNumber of samplesSamples exceeding MDAMinimal valueMaximal valueAverage value
Unit
ruBqnv1!ruBqm-3l[uBqm-3!
19932373.49.15.8
19942916
I.I13.84.5
19952920
0.57.31.7
199632170.4
2.91.4
199731150.250.950.60
MDA - minimal delectable activity Source: UPKM
mtamination of the Environment ComponentsComponents of the environment were contaminated with 137Cs nuclides gradually falling out from
: upper atmosphere layers. Surface fallout activity was measured in samples gathered within a period)ne month. 137Cs values ranged from 2 to 2 500 mBq per m2 (average value - 280 mBq per m2). Surface'. drinking water contamination was lower than 0.02 Bq per 1 (minimal detectable activity) in all)rd.ed cases. Tritium contamination was also measured and recorded and its values ranged from 8 tobq per 1 (average value - 17 Bq per I).
79

State of the Environment Report - the Slovak Republic 1997
Table 105 137Cs activity in the individual components of the environment (1997)
ComponentAirFallout-monthlySoilWaterWater (tritium)
UnitBq.m"3
Bq.m'2
Bq.kg'Bq.r'Bq.K1
Average5.7 E-072.8E-01
not recorded4.0 E-031.7E+01
Band2.5 E-07 - 9.5 E-072.0 E-03 - 2.5 E+00
not recorded1.0 E-03-3.0 E-02
8E+00-4.65E+02Source: UPKM
Food ContaminationWith regard to artificial radionuclides, only 137Cs radionuclide was detected in food samples
analysed. Its content fell in the majority of samples below the level 0.5 Bq per kg.
Table 106 137Cs activity in food and agricultural products (in Bq per kg or Bq per 1)
ProductMilkBeefPorkGamePoultryCerealsPotatoesVegetablesFruitForest berriesGrassMushrooms
TypeFreshFreshFreshFreshFresh
dry matterdry matterdry matterdry matter
FreshFresh
dry matter
Average1.22 E-21.80E-011.62E-013.26E+006.12E-027.58E-021.58E-021.94E-027.07E-02
*1.50E-01
Minl.OOE-035.00E-022.50E-022.50E-01
<0.005<0.005<0.005<0.005O.005<0.005
5.00E-023.00E-01
Max1.50E-016.50E-011.05E+004.25E+017.50E-011.15E+00
5.00E-027.50E-021.00E+008.50E+01
4.50E-012.50E+01
Source: UPKM
"I M l> I ', i '
Radon and its radioactive decay products represent themost significant source of human radiation exposure (approximately43 % of annual radiation effective equivalent). For this reason a spe-cial attention is paid to natural radioactivity and potential radon risk.Natural radioactivity is the most usually calculated in Gamma radia-tion dose input.
Data recorded on the territory of Slovakia (63.3 nGy per hour) exceeded set the European limit.Average concentrations of K reached 2.52 %, Th 9.4 ppm and U 3.3 ppm. The highest concentrations ofU are common for rocks of Permian ages in which also uranium ore mineralisations are present(Novoveska Huta, Povazsky Inovec, hronicum system of the Nfzke Tatry Mountains).
In 1997, the study 'Radon Risk Assessment from Geological Bedrock of Towns with PopulationExceeding 10 000 and District Towns with Medium and High Radon Risk' was completed.Simultaneously, radon risk map at scales 1: 500 000 and 1: 200 000 including the whole territory ofSlovakia was created. High potential radon risk was recognised in Spissko-gemerske rudohorieMountains area (Smolnik, Rozriava, Hnilcik, Poproc, Medzev, Hnilec, Novoveska Huta), in Horehronskepodolie basin, in Bratislava, Kosice, Banska Bystrica, Kremnica and their surrounding areas as well as inthe town of Levice, Roznava, Zilina, Partizanske, Bytca and mainly Pezinok. High radium and radon val-ues were recorded in water samples taken from different thermal and mineral springs (e.g. Oravice,Besenova, Plavnica). However, the highest occurrence of waters with high radon values was registered inwaters coming from core areas (such as Male Karpaty Mountains, Povazsky Inovec Mountains, Tn'bec
80

State of the Environment Report - the Slovak Republic 1997
Mountains, etc.) and in waters of Veporske and Stolicke crystalline Mountains.Importance of radon health risk in indoor facilities (work places and living areas) is stated for dif-
ferent radon volume equivalent activity intervals (EOAR) and is based on representative survey results.The survey was conducted by UPKM and included 2 745 housing units and 650 nursery schools and edu-cational facilities, serving as sample material. The above mentioned data represents approximately 1.5 %oof the Slovak housing fund. According to the survey results given in cartographic form it is possible to saythat weighted arithmetic mean (AP) EOAR calculated from the population distribution is equal to 48 Bqper m3. When comparing samples of family houses and blocks of flats the following differences wererecorded: family houses - AP - 125 Bq per m3, GN (geometric mean) - 73 Bq per m3 and blocks of flats -AP - 22 Bq per m3, GN - 14 Bq per m3 (EOAR). The maximal recorded value of EOAR is 1 500 Bq per m3
and the average radon decay products inhalation effective dose in indoor facilities per capita is 3 mSv.
Table 107 EOAR values recorded in indoor facilities (SR)
EOAR-3
[Bq.m ]<20
20-199200 - 599600 - 999
> 1000
Number of flats
7281651
336273
Number of flatsto/ I
26.560.212.21.00.1
Source: UPKM
According to the Regulation of the MZ SR No. 406/1992 Coll. on existing developments, so-calledaction level (400 Bq per m3), is recommended. This regulation allows the executive bodies to decide uponintroduction of corrective measures. In case of new indoor facilities development so - called reference level (100Bq per m3) is used. This level has been set for areas with medium or high risk of the radon content in soil air.
Table 108 Districts with the highest average EOAR values and average annual radon and itsdecay products exposure effective dose in indoor facilities (per capita)
1.2.3.4.5.6.7.8.9.10.
District
Ro2navaKoSice-vidiekSpiSska NovaVesRimavska SobotaStara CubovnaVel'ky KrtfsTrebiSovNitraKomarnoLevice
EOAR
[Bq.m'3l120119
9487877972
-716665
E[mSv]
7.57.45.95.45.44.94.54.44.14.1Source: UPKM
Figure 45 Average annual radon and its decayproducts inhalation effective dose in indoorfacilities - based on district division(per capita)
mSv• 0.0-1.9• 2.0-3.9• 4.0-5.9• 6.0-7.9
Source: UPKM
81

State of the Environment Report - the Slovak Republic 1997
In 1997, total amount of generated radioactive wasteproduced in V-1, V-2 and A-1 nuclear power stations inJaslovske Bohunice is presented in the following table.
Table 109 Generation of radioactive waste (RAO)
Concentrates
Sorbents
Solid RAO
Air technical filters
Total amountSalt contentTotal activityTotal amountTotal activityBurnableRefractoryTotal
V - 1263 m3
61.7 t5.3.10" Bq
--
121 mJ
61.8 m3
182.8 m3
9.7 m3
V - 2123 m3
29.5 t1.3.10'° Bq3 m3
2.5.109Bq38.75 m3
16.5 m3
55.25 m3
7.9 m3
A - 15 m3
0.3 t2.10" Bq0.86 m3
2.1014Bq
267 m3
267 m3
Note: increased amount of liquid and solid RAO in nuclear power station V-1 is due to undergoing reconstruction Source: UJD SR
The Slovak State Health Institute (SZU SR) is responsiblefor dealing with the problem of noise pollution. According tothe 1997 statistics on noise pollution, this was monitored in 46towns and villages with the total population of, 1 357 598.Railway traffic impact was tested only in the town of Trnava(71 783 inhabitants).
Table 110 Percentage of population affected Ipy road and railway traffic noise based on the equi-valent noise levels (L Aeq) excess in dB (A)
Noise level
> 55 dB(A)
> 60 dB(A)> 65 dB(A)> 70 dB(A)> 75 dB(A)
% of population affected by road trafficnoise
19.69
15.626.481.00
0.07
% of population affected by railway trafficnoise
1.27
1.260.4600
Source: SZU SR
Noise level of 65 dB (A), as given by results of medkal research, represents a level where negative impacts onhuman autonomic nervous system start. According to the Regulation of the MZ SSR No.14/1977 Coll. allowednoise limits are as follows: 60dB (A) - day-time and 5OdB (/M - night-time
82

State of the Environment Report - the Slovak Republic 1997
Table 111 Results of the noise pollution monitoring in the selected towns based on the equiva-lent levels of the road traffic noise
Place
Dunajska StredaLeviceNov6 ZamkyNitraPezinokTopoPcanyTmavaBanska BystricaBardejovCadcaLiptovsky MikulaSLuCeneoMartinPovazska BystricaZvolenZilinaKoSiceRimavska SobotaPresovSenicaVranov nad Topl'ouDubnica nad Vahom
% of population affected by road traffic noise in dB(A)
> 55 dB(A)10.81612.205
1.3719.7452.9403.503
11.0218.1721.6209.675
' 6.5874.265
12.7959.036
12.3115.573
43.0358.036
20.4497.0624.1323.293
> 60 dB(A)7.2163.4490.6498.0822.1633.3989.1095.8401.4206.0595.9422.940
10.4767.1367.5684.871
28.8016.235
13.2594.0923.2772.235
> 65 dB(A)4.1320.5040.1723.9621.6833.2283.5513.5760.3001.5284.9800.4847.0265.9803.2934.620
13.5361.6704.8420.8462.2051.360
> 70 dB(A)0.5920.0720.0031.1830.2401.59900.74600.7920.4800.00542.20900.0631.6893.5750.0741.92100.0700
> 75 dB(A)000000.1190000000.353000.1080.33800.092000
Source: SZU SR
Chemical Risk Factors, <
The new chemical legislation was prepared under the supervision of MH SR, incollaboration with MZ SR, MZP SR, MP SR, MO SR, MV SR, UBP SR, the Slovak
Association of Industrial Ecology and the Association of Chemical, PharmaceuticalIndustry. This legislation was based on the Government Decree No.533/1994 and 100/1995.
This is the act on chemical substances and products, which principles were negotiated and approved by theSlovak National Council Committees in January 1997. The juridical act wording was submitted for approvalto the Governmental Legislative Council on December 1, 1997. The relevant act creates legal preconditionson the unification in registration, classification, labelling and packaging of the chemicals and the chemicalproducts that are produced, imported and placed on the market in the SR. This also includes monitoring ofalready existing substances and their risk reduction, assessment of the chemicals potential impacts on theenvironment and results from conclusions accepted at international level (OECD and EU legislation).
83

State of the Environment Report - the Slovak Republic 1997
PMS Xenobiotics in Foodstuffs and Animal Feed consists of 3
partial systems: Co-ordinated Purpose-oriented Monitoring
System (KCM), Consumption Monitoring System (MSK), and
Monitoring of Game and Fish (MLZ),
Year 1997 was the second year of the second 5-year-cycle of partial system KCM carried out since 1991. Its main objective was to identify mutual correlationamong agricultural soil contamination, irrigation water, feed water and plant and animal production.Since 1991, the total amount of 13 133 samples have been analysed; 1 017 (7.7%) samples have exceed-ed limit values of at least one of the monitored contaminants. When regarding the samples of soil andanimal products, the most significant excess of set limit values was observed in case of fluorine and cad-mium. In the analysed samples of feed water, animal feed and plant products, the excess of nitrate limitvalues was recorded. The contamination of irrigation water was caused mainly by nitrites. Cadmium isconsidered as being the most significant contaminant from the group of monitored chemical elements.From a total amount of 4 748 soil samples being analysed since 1991, in 496 cadmium content exceed-ed set limit values which represent 10.4 % of all samples. According to assessment of the average amountof cadmium present in soil, the highest average values were registered in Cadca, Tvrdosin and Levice dis-tricts. The second most cogent chemical element is mercury. From a total amount of 4 578 soil samplesanalysed since 1991, mercury content limit value was exceeded in 301 cases (6.6%).
Since 1993, Partial system MSK aiming at gathering data about food contamination within con-sumers network has been in operation. Analyses of organic and inorganic contaminants, medicines, addi-tives and radionuclides are carried out in each group of commodities. The total amount of analysis donethrough MSK reached 46 880 (3 026 samples).
The highest values of weekly intake into human body were calculated for the following chemicalelements:• nickel - 0.88 mg per person per week• chromium - 0.37 mg per person per week• lead - 0.34 mg per person per week• arsenic - 0.17 mg per person per week.x 4
Occurrence of the samples with excessive heavy metal content was minimal. Samples not meetingset criteria were most numerous in case of cadmium (beer, table salt, pork, drinking water), nickel (vege-table oil, butter, vine) and chromium (vegetable oils, table salt). Occurrence of the samples with exces-sive heavy metal content was recorded mainly in Kezmarok and Kral'ovsky Chlmec areas. In Nitra area,unlike other areas, higher average values of nitrates present in vegetables were registered.
In 1995, for the first time, monitoring of xenobiotics presence in fish and wild animal organismswas carried out in the selected areas of different Slovak regions. Partial system MSK focuses on the moni-toring of contaminants and their penetration into organisms of wild animals and fish, as fish serve as anatural water quality bioindicator and form a part of human diet. Excessive values of risk elements wererecorded in Kosice region (Kosice - surrounding area, Trebisov, Spisska Nova Ves) and Presov region(Bardejov and Humenne). Most frequently recorded excessive values were those of cadmium, mercury,lead and copper.
84

State of the Environment Report - the Slovak Republic 1997
Table 112 Amount of samples, samples with excessive limit values and number of analyses car-ried out within the partial monitoring system xenobiotics in the food chain
subsystem
KCMMSKMLZ
Number ofanalyses
24 13514 2913 509
Number ofsamples
2 706743355
Number of samples withexcessive limit values
14723
110
Percentage of sampleswith excessive limit
values%
5.53.1
30.9Source: VUP
The Ozone LayerDepletion
The Slovak Republic succeeded the for-mer Czechoslovakia into the Vienna
Convention for the Protection the OzoneLayer (Vienna, 1985) and Montreal Protocol on
Substances that Deplete the Ozone Layer (Montreal, 1987), joined the world-wide effort concerningthe Earth ozone layer protection. Taking into consideration the fact of ever growing trend in the ozonelayer depletion, the Montreal Protocol signatories consented upon tightening measures on their meetingin London (1990), Copenhagen (1992), Vienna (1995) and Montreal (1997).
The Slovak Republic became the signatory of the London Amendment on April 16, 1994 afterapprovals of the Slovak Government (Decree No.272, April 1993) and the Slovak National Council(Decree No.393,17th February, 1994). It became the signatory of the Copenhagen Amendment onJanuary 9th, 1997 after receiving approvals from the Slovak government (Decree No.535, July 15th, 1997)and the Slovak National Council (Decree No. 732, October 2nd, 1997).
Following the Montreal Protocol Amendments and changes resulting from the London andCopenhagen Amendments, consumption of the monitored and registered substances of group IAmendment A - perchlorfluorhydrocarbons, group II Amendment A - halons, group I Amendment B-other perchlorfluorhydrocarbons, group II Amendment B - tetrachlormethane, group III Amendment B-1,1,1-trichlorethane in the Slovak Republic should be since January 1st, 1996 completely stopped. Onlyrecycled, regenerated and stocked substances are allowed to be in further use. The only exception to thisrule, is when these substances are used for laboratory and analytical purposes.
According to the Copenhagen Amendment to the Montreal Protocol (1992) which was furtherelaborated in Vienna (1995), the production and consumption of substances in group C.I. (chlorfluorhy-drocarbons) should be equal to 0.5% of calculated level of the starting year 1989 during the next decade.Production of these substances during the next decade is strictly limited to servicing purposes, with thecommitment of their total elimination by the year 2020. Methylbromide consumption (E.I.group) shouldin accordance with the Montreal Protocol changes (1997) decrease by 25% by the year 1999; by 50% bythe year 2001; by 70% by the year 2003 with its total elimination by the year 2005. The initial year of thisintention was 1991. Since January 1st 1996, production and consumption of the group C.II. substancesis banned (bromfluorhydrocarbons).
85

State of the Environment Report - the Slovak Republic 1997
The Slovak Republic fully complies with the principal commitment as given in the MontrealProtocol, accepting all its changes. Calculated consumption of the group C.I. limited production (chlor-fluorhydrocarbons) in accordance with the Copenhagen Amendment (using ozone depletion potentials -ODP) is lower than 6% of the allowed calculated consumption level of these substances. Methylbromideconsumption in 1997 reached 56% of consumption allowed.
Table 113 Consumption of substances under control (1992-1997) (t)
Group ofsubstances
AI -freons , : . .
A I I -halbris:: i: •:
BI*: -iireons : :
B n * - C C l 4 : : ; • : : : :
BHI*-i;l.l trichloroethaneC p : V : ; - : • • : , : : : • • :
CH-HBFC22B1E** - HBrTotal : :
1986/89
Initialconsumption
1 710.58.10.1
91.0
200.1
49.7
10.02 019.5
1992
Consumption
609.62.50.0
251.8
107.3
971.2
1993
Consumption
986.92.00.1
250.0
180.0
1 419.0
1994
Conanmption
229.40.00.0
315.4
136.7
717.5
1995
Consumption
3.79.2' 0.0
0.0
0.6
69.4
37.2
449.2
1996
Consumption
1.2"0.00.00.0
0.0
61.0
14.39.6
86.1
1997
Consumption
2.05°0.00.0
0.16"
0.1"
59.9
0.05.6
61.811989-starting year
*• 1991 -starting yearSource: MZP SR
1) consumption of A.I., B.H. and B.HI substances in two consecutive years 1996,1997 represents import of thesesubstances on analytical and laboratory purposes in accordance with the general exception to the Montreal Protocol.
Note 1: In 1996, besides the above mentioned substances, 250 tonnes of recycled tetrachloromethane and 20 tonnes regeneratedfreon CFC12 were imported. However, amount of these substances is not calculated towards total consumption as given by validmethodology. Data concerning consumption of C.L, C.ll. and E substances from the previous years is not available.
Note 2: In 1997, besides the above mentioned substances, 40 tonnes of used freon CFC12 were imported. Following the methodo-logy valid, this amount is not calculated towards consumption. 2.16 tonnes of methylbromide were also imported for the purposesof medicine and drug production and were received by Slovakofarma Pharmaceutical Comp. This amount is not calculated towardstotal consumption.
Since September 1993, monitoring of the total atmospheric ozone over the territory of Slovakiahas been conducted by SHMU monitoring station located in Poprad - Ganovce. This station also moni-tors intensity of UV-B radiation. The average annual total atmospheric ozone value in 1997 was 323Dobson units (D.U.). This represents 5% decrease in comparison to the long-term average value (1962-1990) - data obtained from Hradec Kralove (the Czech Republic), but used for the territory of Slovakiaas well. All monthly averaged values were lower, too; in March and May 8% decrease was recorded. Thesituation in July and August was more favourable than in the previous years, with negative deviation ofmonthly average values ranging from 2 to 3%. Weekly average values remained under the long-term averagevalues.
Intensity of UV-B radiation on the Earth surface is characterised by distinctive daily and yearlypattern depending on the Sun elevation above horizon. The route of the sunlight is dilated through theozone layer at the lower Sun elevation. Therefore, the harmful radiation is more effectively reduced. Thehighest values are being recorded in the period of May-August during sunny days, at noon. In May andJune 1997, the average ozone value was 8% below normal. Despite this fact, the harmful UV-B radiationflow density exceeded the value of 175 mW per m2 which is considered to be high. The UV-B flow den-sity is assessed by DIFFEY biological efficiency spectrum. The limit value of 175 mW per m2 was exceed-ed only during several days from the end of June to the first half of August. It was caused by prevalentcloudy weather conditions.
86

State of the Environment Report - the Slovak Republic 1997
Figure 46 Total atmospheric ozone level over the territory of Slovakia (1997)
400
S 340 —!
13 17 21
-Average value 1962 -1990
25 29
Week• Weekly average
33
- i 35
37 41 45 49 53
• Deviation Source: SHMU
Waste
In 1997, total amount of waste generated in the SR equalled 19.8 mil tonnes out of which 10.1 miltonnes were of other waste, 9.7 mil tonnes were of special waste including 1.8 mil tonnes of municipalwaste and 1.5 mil tonnes of hazardous waste. Data for statistics was collected by District Offices - sec-tions of the environment and elaborated by the Slovak Environment Agency (SAZP) - the WasteManagement Centre in Bratislava using the Regional Information System on Waste (RISO).
Table 114 Waste generation in 1997 (mil tonnes)
Waste
Other
Special
Including : Municipal
Hazardous
Total
Amount
10.1
9.7
1.8
1.5
19.8
Source: OU
87

State of the Environment Report - the Slovak Republic 1997
Figure 47 Trend in waste generation based on category classification (mil tonnes)
mil t1992 1993 1994 1995 1996 1997
Source: OU
In accordance with valid legislation, data collection concerning other waste production was notperformed in 1997. The above mentioned value represents professional estimate based on 1995-96 datacomparison.
In compliance with new valid Waste Catalogue (the Regulation of the MZP SR No. 19/1996 Coll.on Waste Categorisation), 1992-1997 comparison in total waste generation is possible only with regardto changes stated in and approved by this regulation. In concrete terms, straw and manure have beenexcluded from the total waste generation as they are directly utilised in agriculture; also soil from con-struction sites (trenches) is excluded. These exclusions refer to waste generated in 1995 in total amountof 8.6 mil tonnes. Another legislative change concerned transfer of animal faeces, dung and liquid manurefrom other waste category to special waste category (amount of 5.4 mil tonnes).
Compared to 1996, total waste generation in 1997 slightly decreased (by 0.4 mil tonnes) whichrepresents 2 % of total amount. Other and special waste production remained more or less stable. Thetotal production of special waste fell by 0.4 mil tonnes (3.9%).
From the total volume of special and hazardous waste generated, more than 54.6% was utilized.The most common disposal methods of the mentioned waste were landfill disposal followed by bio-logical treatment and physico-chemical treatment, incineration and storage.
Waste LandfillsDisposal of municipal waste on land is still the major disposal root in the SR. In 1997, 540 land-
fills were operated in Slovakia, out of which 124 fully complied with set technical standards. From thetotal amount of special and hazardous waste, 2.3 mil tonnes were deposited at landfills. This number rep-resents 25.6% of total volume of special and hazardous waste being generated. 5 new landfills (ZlateMoravce, Michalovce, Spisska Bela, Slavosovce and Zilina region landfill) were under construction in1997. Landfills at Brezova pod Bradlom, Dolny Bar, Zlkovce, Cerova and Pezinok were open in 1997 forthe first time. The process of closing down and reclamation of landfills further continued.
88
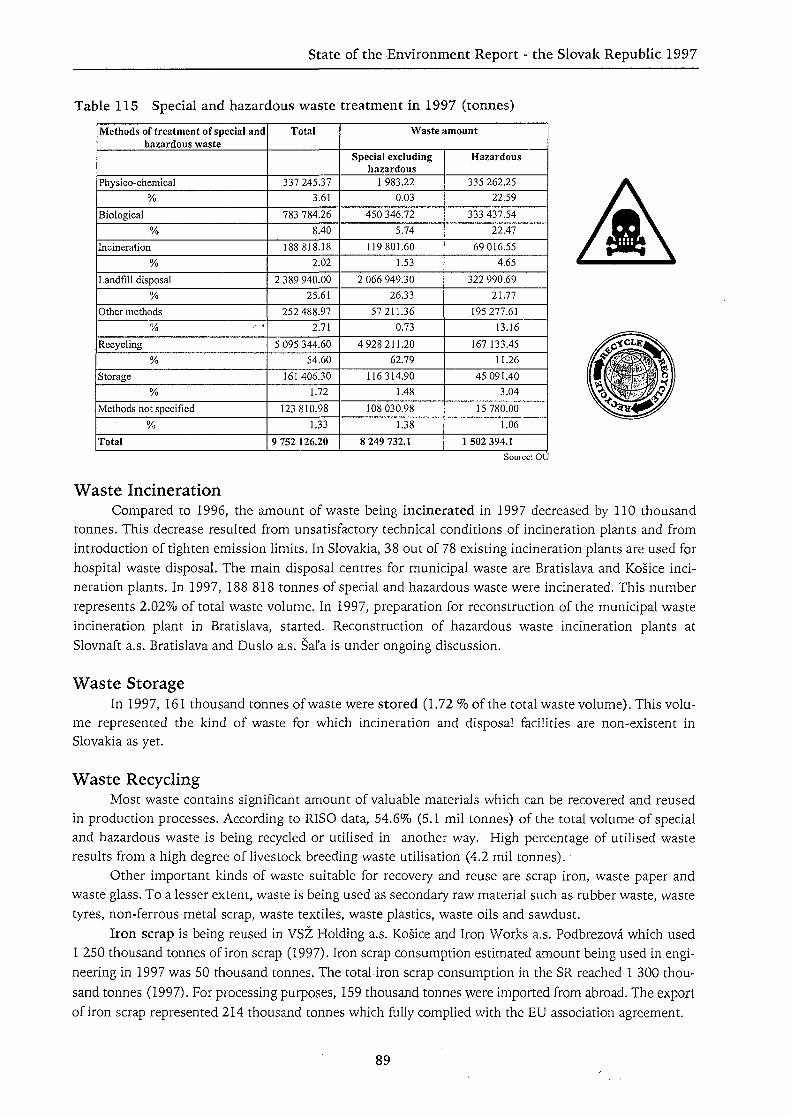
State of the Environment Report - the Slovak Republic 1997
Table 115 Special and hazardous waste treatment in 1997 (tonnes)
Methods of treatment of special andhazardous waste
Physico-chemical
%
Biological
%
Incineration
%
Landfill disposal
%
Other methods
%
Recycling
%
Storage
%
Methods not specified
%
Total
Total
337 245.37
3.61
783 784.26
8.40
188818.18
2.02
2 389 940.00
25.61
252 488.97
2.71
5 095 344.60
54.60
161406.30
1.72
123 810.98
1.33
9 752 126.20
Waste amount
Special excludinghazardous
1 983.22
0.03
450 346.72
5.74
119 801.60
1.53
2 066 949.30
26.33
57 211.36
0.73
4 928 211.20
62.79
116 314.90
1.48
108 030.98
1.38
8 249 732.1
Hazardous
335 262.25
22.59
333 437.54
22.47
69 016.55
4.65
322 990.69
21.77
195 277.61
13.16
167 133.45
11.26
45 091.40
3.04
15 780.00
1.06
1 502 394.1Source: OU
Waste IncinerationCompared to 1996, the amount of waste being incinerated in 1997 decreased by 110 thousand
tonnes. This decrease resulted from unsatisfactory technical conditions of incineration plants and fromintroduction of tighten emission limits. In Slovakia, 38 out of 78 existing incineration plants are used forhospital waste disposal. The main disposal centres for municipal waste are Bratislava and Kosice inci-neration plants. In 1997, 188 818 tonnes of special and hazardous waste were incinerated. This numberrepresents 2.02% of total waste volume. In 1997, preparation for reconstruction of the municipal wasteincineration plant in Bratislava, started. Reconstruction of hazardous waste incineration plants atSlovnaft a.s. Bratislava and Duslo a.s. Sal'a is under ongoing discussion.
Waste StorageIn 1997, 161 thousand tonnes of waste were stored (1.72 % of the total waste volume). This volu-
me represented the kind of waste for which incineration and disposal facilities are non-existent inSlovakia as yet.
Waste RecyclingMost waste contains significant amount of valuable materials which can be recovered and reused
in production processes. According to RISO data, 54.6% (5.1 mil tonnes) of the total volume of specialand hazardous waste is being recycled or utilised in another way. High percentage of utilised wasteresults from a high degree of livestock breeding waste utilisation (4.2 mil tonnes).
Other important kinds of waste suitable for recovery and reuse are scrap iron, waste paper andwaste glass. To a lesser extent, waste is being used as secondary raw material such as rubber waste, wastetyres, non-ferrous metal scrap, waste textiles, waste, plastics, waste oils and sawdust.
Iron scrap is being reused in VSZ Holding a.s. Kosice and Iron Works a.s. Podbrezova which used1 250 thousand tonnes of iron scrap (1997). Iron scrap consumption estimated amount being used in engi-neering in 1997 was 50 thousand tonnes. The total iron scrap consumption in the SR reached 1 300 thou-sand tonnes (1997). For processing purposes, 159 thousand tonnes were imported from abroad. The exportof iron scrap represented 214 thousand tonnes which fully complied with the EU association agreement.
89

State of the Environment Report - the Slovak Republic 1997
Waste paper is reused by JCP a.s. Stiirovo, PT a.s. Zilina, HP a.s. Harmanec and SCP a.s.Ruzomberok. In 1997, above mentioned companies used 115.6 thousand tonnes of waste paper. Importfrom abroad represented 71.5 thousand tonnes. The Slovak export amounted to 5 324 tonnes.
Skloobal a.s. Nemsova, specialized in waste glass processing, used 31.6 thousand tonnes of wasteglass (1997). 22.8 thousand tonnes of waste glass were provided by household collection, 8 799 tonneswere imported.
In 1997, Mach Trade Company based in Sal'a processed 6 955 tonnes of waste lead accumulators.
Situation in waste management was assessed on the grounds of municipal waste managementstatistics. In 1997, the total amount of municipal waste generated was 1.8 mil tonnes. In comparison to1996, the increase by 0.1 mil tonnes was caused by GDP growth as well as by life-standard improvement.
Per capita, 313 kg of waste per year was generated, out of which 7.88 kg of the individualcomponents were selected. A slight increase (by 9.2%) was recorded in the amount of the secondaryraw material obtained from municipal waste, mainly waste glass, waste metals and bio-waste. Municipalwaste management expenditure per cap per municipality reached 127.49 Sk on average and the cost ofwaste separation was 8.99 Sk .
According to municipal waste management analyses, prevalent part of above mentioned waste isbeing disposed via landfills operated in compliance with valid legislative regulations. However, whencompared to 1996, the amount of waste being disposed using this method decreased by 19% which iscaused by gradual introduction of waste separation in municipal sphere. Waste management benefitsfrom the fact that waste production has been restricted as a consequence of growing public awareness inthe area of waste separation.
Table 116 Waste separation in SR municipalities in 1997 (tonnes)
Kind of waste
SR total
Paper
Glass
Textiles
Plastics
Metals
Bio-waste
HazardouscomponentsOthers
Amount of waste
42 379.6
8 140.9
12 127.0
238.8
752.7
12 575.3
7 963.6
103.9
477.4
Being used asSecondary raw material
39 162.7
8 021.9
12 090.5
229.1
670.2
12 423.8
5 579.6
80.6
67.0
Energygenerationmaterial774.2
52.1
0
6.0
0
0
610.7
0
105.4
Other methods ofrecycling
2 442.7
66.9
36.5
3.7
82.5
151.5
1 773.3
23.3
305.0
Source: SU SR
90

Table 117 Municipal Waste Management (tonnes)
Denomination of waste
Municipal waste total including:
Household waste
Other waste similar to householdwaste from municipalities
Separately sorted household wastecontaining injurants
Ceespool waste
Bulky waste from households
Bulky waste from municipalities
Street litter
Green waste
%
Amount ofwaste
77 5767.0
907 606.6
226 482.5
1 484.0
324 462.3
83 188.0
81 788.3
66 435.7
84 319.6
100
Including
Being recycled as
Secondaryraw material
36 423.5
27 726.8
1 951.7
169.7
1714.1
2 650.3
1 574.1
76.7
560.1
2.05
Composting
63 165.8
2 144.3
368.2
-
24 370.9
576.6
366.1
1 299.9
34 039.8
3.6
Energygenerationmaterial
951.5
446.6
3.1
6.6
-
119.0
311.0
7.5
57.5
0.05
Methods of disposal
Landfills
Withinmunicipality
area
469 190.3
243 250.2
66 360.4
269.8
2 613.1
39 829.6
34242.7
40 777.4
18 307.1
26.4
Outsidemunicipality
area
772 533.8
531018.8
104 212.4
880.0
9 823.0
36 407.0
44 247.7
23 027.3
22 917.6
43.5
For energyproduction
153 534.2
95 193.7
51211.7
0.1
-
2 211.0
448.6
605.1
3 864.0
8.6
Incineration
Without energyproduction
7 668.9
3 546.8
306.5
2.5
30.57
633.7
352.3
269.4
2 557.1
0.43
Other methods
272 299.0
4 279.2
2 068.5
155.3
262 400.6
760.8
245.8
372.4
2 016.4
15.3
f-T
no
nW
n
3
Source: M^P SR

State of the Environment Report - the Slovak Republic 1997
In 1997, the MZP SR issued 150 permissions for import, export and transit of waste. Out ofthis number, 99 permissions referred to waste import, 15 permissions regarded hazardous waste exportand 36 permissions were issued for transit of waste through the territory of the SR.
In 1997 (regarding already existing processing facilities), the import of the following commoditieswas permitted - scrap iron, waste paper, waste copper and waste glass - with the intention of their utili-zation as secondary raw material. In some cases, insufficient number of existing facilities dealing withhazardous waste disposal and its recycling causes the need to export this waste abroad. The MZP SRissues hazardous waste export permissions in accordance to the Basel Convention on the Control ofTransboundary Movements of Hazardous Wastes and Their Disposal (1989).
Hazardous waste export permissions are issued on the grounds of officially written import per-mission issued by the relevant state administration environmental authorities of the country of wasteimport. There must be a guarantee that hazardous waste will be treated in accordance to regulations onenvironmental protection.
In 1997, hazardous waste export was permitted into 7 countries: Belgium, the Czech Republic,Finland, France, Norway, Austria and Germany. Waste import and export in the above mentioned cases issubject to the Regulation of the MH SR No. 302/1995 Coll. on Condition for Official Permission for Importand Export of Commodities and Services in wording of the Regulation of the MH SR No. 101/1996 Coll.,the Regulation of the MH SR No. 158/1996 Coll. and the Regulation of the MH SR No. 23/1997 Coll.
Year 1997 was the first year of the second phase (the year period 1997-2000) of the SlovakRepublic Waste Management Programme realization (POH SR). POH SR main objectives and meas-ures until the year 2000 were specified on the grounds of complex analysis and the first phase progressevaluation. Approved objectives and measures reflected current economic situation in Slovakia and esti-mated economic development in the context of its results achieved in individual spheres of waste mana-gement. Year 1997 was also important in terms of the SR's international recognition in the field ofwaste management.
Table 118 List of Hazardous Waste Export permissions issued in 1997 (tonnes)
Denomination of wasteLead drossLight metal dross containing AlFilter dust containing non-ferrous metalsWaste lead accumulatorsWaste barium saltsWaste transformer, heat carrying and hydraulic oils containing polychlorinated biphenyls(PCB) and polychlorinated terphenyls (PCT)Waste devices and equipment containing PCBOther waste containing PCBWaste aromatic aminesWaste catalystsPCB and PCTTotal
Amount100
13 500600900
18.2321.7
246.510
50100
1015 856.4,
Source: MZP SR
92

State of the Environment Report - the Slovak Republic 1997
Attached to SAZP, Waste Management Centre based in Bratislava, the first Regional Training Centrefor the Basel Convention and worldwide technology transfer implementation (RSC) was establishedfollowing the selection process administered by the Basel Convention Secretariat. Within the frameworkof UNEP / SBD No. BS 3100/97-01 project, RSC administers a 2-year educational project focused on fur-ther education of managers working in the field of waste management. This project is open to 19 Centraland Eastern European countries undergoing economic transformation process. RSC is also involved inactivities supporting implementation of environmentally friendly methods of hazardous waste manage-ment.
Table 119 List of waste import permissions issued in 1997 (tonnes)
^Denorolnation^fwast^S'^^r-SK
^WMte-doiorate->:-:i"':J^Hv-i.i:N^:':vi:^JW?;j:;;i:;^*^i: ' :x<x- ^x- -> • .x'^-x yy 'pyWaste chromium-magnesite ^W a s t e g l a s s s u i t a b l e f o r f u r t h e r p r o c e s s i n g ^ \ ; ' • :\ ' '",'•'•• •••'•'•••;,.,••
'Waste:plasteri'":-:'^-'->':=W';-^.':^s.' •M--^,:-?:i^-:H>^:~ ^^yy-yy^sryyJ l r o n ' s c a ] ^ ' v ^ S i ^^Scrap iron including means of transport and iMeliinery:(patticularly locomotives, vehicle:railway fleet; aircraft, vessels) meant as secondary raw material' • ' '• :'':>;•:": ' ": '. •':•••Waste from ihactiiningnot contaminated by hann&l substances- ^ ' ^ : " i: -
^ W a s t e ^ ' a l l o y s ^ c b m p b u n d s ' - ' - ' . ' ' : ; ' ^ ' " ^ - 1 ' ' ^ . x : y - ' : x ^ : - " x : : ' " " :-:;::v---''-:'-:.:';.\'. •"".: ' : ! '•'-
-Wastecopper ,a l loys ,compounds ,:; i ': '^'.-:^- ;vA:v: •';"'••:/:'::'.::"; :' P ' • • '•':••.:' -: ' • : ••'•
• W a s t e from c a b l e s - ;ri:^'$x ^'^'x-m^x^- '•>;';-,:'viy.;x::M:. ••{^•'•'^•'•''ix: "xyy-:xf'' x \
Waste transformer, heat carrying and hydraulic oils not contaminated by PCB and PCT. .• • W a s t e p o l y e f t y l e n e ' : / ' ' - ' - - - - : •••-• • ^ • ' • ' . • ^ " x x ^ x : , : v : " : * - • ' y - y ; x x ' x y ; , x x - , : > , - : : .
Waste tyres and their cuttings : . :^:
T e x t i l e s a n d f a b r i c r e s i d u e s : : :yx xx\xrx[: .• >y. ' .xx:. •-..•..... • :- :-. •, • •• . /, . ...
W a s t e g a r m e n t s , r u g s , t e x t i l e T : ? ' x y . x y x x *:•,-.;••;: :••.:;•-;,: , • ' . ' : : - x \ \ : y • - • • , . y x , x ] ' ••••:/•••
T o t a l - • • : • • • : ; • - y x x x >••:•••] x x , , . x x ; . : y . - : - A , . . • . , ; ; • • ! : . . : ; : . • • • : - : • • • . , • • • • • - • • • • • . • • ;
' Amount115 500
5006 000
21 8502 500
200420 220
16 0001146023 951
27016001 0002 580
3452 500
626 476Source: M2P SR
Table 120 Permitted amounts of hazardous waste import and export in 1997 (tonnes)
• C o u n t r y •• ; - • • • ^ r ' :'••'•' '' l'>':' :'x:: xXxxx
B e l g i u m :: : " ' • • ' : :-':" "••'x
:Belarus : • ̂ xxx/xx-x-xxy. xyyy.ryx.jxx:.TheCzechR«pubUc':;^:;:^v-w:-;M.:.-^-!-:;::....:A:;• Finland"' .^y' x•;::;• xyxx-xyK'.yyxyxxy:••France'''1::: •^^yyx:xyyy-- xyayyyx.,xx:
• • T h e N e t h e r l a n d s • ' : • " x ' } : . ' • ' • : ' • • : : : x ' . x y x : } : :
C r o a t i a '".••• - i - - - : ' - •.;•••••. •' .. • • . • y x . x . : . . : . . : .:, :..• !:
^ L i t h u a n i a •- : ^ : ^xxy.:Xx . •;;:•.•.••••,••:••: ••
^'Hungary ••x^xyxyxxy,. ;••;; :-yxy;:r,- <:,u, •
: : N o r w a y ' ; : " ' --xxx,:;->;.'::"> -y ; ^ - x y y • y x "•P o l a n d ' , :•' : ' '• .:;:;:.:•••' : . • : ; r - . . - . : . - . : :'•'••• •. : : ." ' . . . v : -
•Austria' '":::;:" :-.":'- - xx^^xyx^yy-x >x" R u s s i a n f e d e r a t i o n T ::xxx-yxx,i: r •,?>« ••.•,..• ..,-;;.-
:Slovenian ; v: ' '''•:xxyyxr..yyxy:.xyyy,::y:^
Germany-^C'-V;""-::'?:':-' '^'nxyyxy.yxx^. •y.y.'• S w i t z e r l a n d ...-'.•'"• - x \ : : x \ ' : , ; • . - : - - j • • . • . . • , „ •
Italy :^: x:>y'~ 'x^.xxyyx.yxx- yxxxyx'x-Ukraine'̂ '-:'".-:":::;: xyyyytyy -xy.x'xxxyj-x-Great Britairiir^'v-V^K ''^xx-xxiyy -iy-^oMy^xy-yyyyyyyyxyxyyy^y..^
Wasteimport.
3 200171 260
.505730
2 500600
132 300-
49 1501090
18 81570
60 2005030
185 92155
626 476
Waste export600
-2 618.2
300200----
10 000-60--
2 078.2
---
15 856.4Source: MtP SR
93
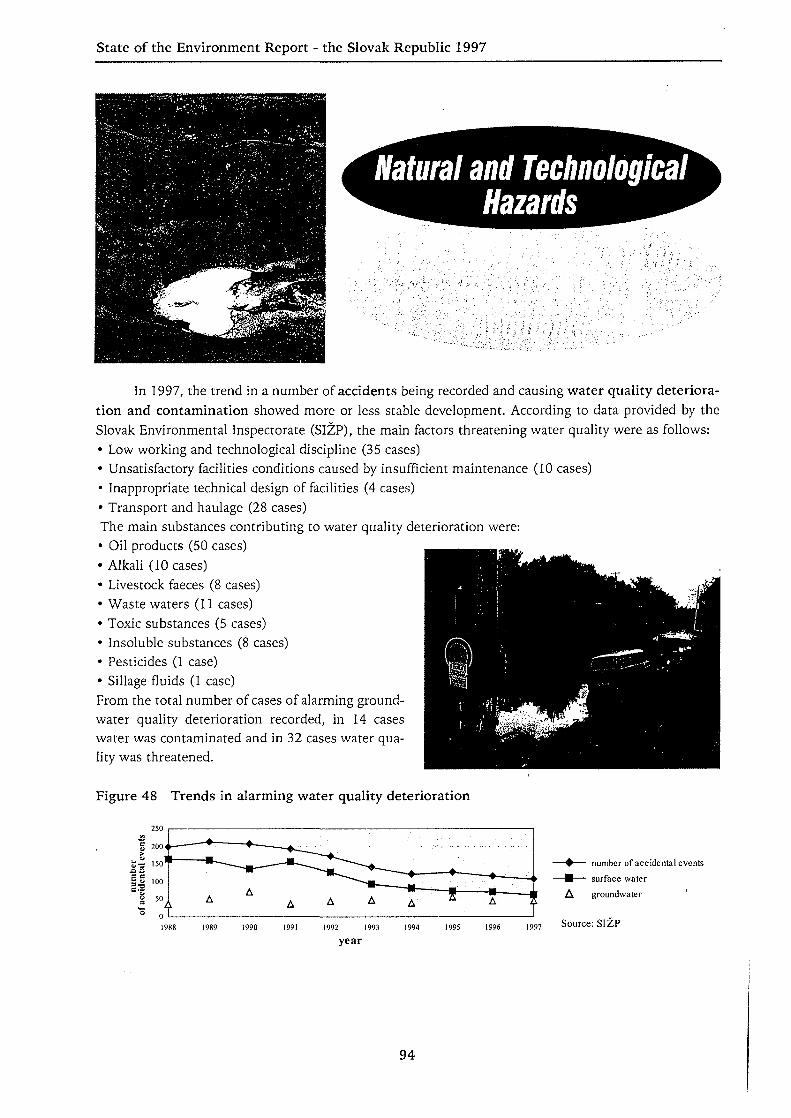
State of the Environment Report - the Slovak Republic 1997
Natural and TechnologicalHazards
In 1997, the trend in a number of accidents being recorded and causing water quality deteriora-tion and contamination showed more or less stable development. According to data provided by theSlovak Environmental Inspectorate (SIZP), the main factors threatening water quality were as follows:
• Low working and technological discipline (35 cases)• Unsatisfactory facilities conditions caused by insufficient maintenance (10 cases)• Inappropriate technical design of facilities (4 cases)• Transport and haulage (28 cases)The main substances contributing to water quality deterioration were:• Oil products (50 cases)• Alkali (10 cases)• Livestock faeces (8 cases)• Waste waters (11 cases)• Toxic substances (5 cases)• Insoluble substances (8 cases)• Pesticides (1 case)• Sillage fluids (1 case)From the total number of cases of alarming ground-water quality deterioration recorded, in 14 caseswater was contaminated and in 32 cases water qua-lity was threatened.
Figure 48 Trends in alarming water quality deterioration
number of accidental events
surface water
A groundwater
Source: SIZP° n I
1989 1991 1992 1993
year1994 1995
94

State of the Environment Report - the Slovak Republic 1997
In comparison to 1997, the number of fires recordedin the SR increased by 1 145 and direct cost of damagesincreased by 586 908 000 Sk . The death toll increased by 6persons and the number of injured persons fell by 12 cases (all comparing to 1996 statistics).
Most fires occurred in March (2 196), April (1 492) and August (1 028). Increased incidence offires during springtime was caused mainly by annually re-occurring fires accompanying dry grasslandfiring activities and human outdoor activities with nature. Higher fire risk in August resulted from post-harvest agricultural activities such as firing of straw residues left on the fields. The most common originof fires was negligence and carelessness of adult population (6 305 cases). Technological accidents resul-ting from faulty material and construction caused 1 609 fires. 874 fires were initiated by children. 609fires can be written down to arsoning activities and 302 fires to unsatisfactory conditions of heating unitsand stacks/chimneys.
The highest occurrence of fires was recorded in Banska Bystrica and Presov regions - 1 588 cases .The lowest number of fires was in Trnava region - 883 cases.
Table 121 Number of fire accidents, cost of damages, rescued material values, death toll andnumber of injured persons (1992-1997)
Year
1992
19931994199519961997
Number of fireaccidents
3 908
6 3546 9607 6399 462
10 607
Cost of damages(thousand Sk)
245 716.4
491 306.3280 971.1558 423.9342 461.4930 443.9
Rescued materialvalues (thousand Sk)
2 139 089.0
2 209795.02 020 964.82 989 076.72 365 331.63 231081.0
Death toll
68
4938596167
Injured
183
181153202167180
Source: UPO MV SR
95

State of the Environment Report - the Slovak Republic 1997SK99K0201
Environmental Protection
Economics of EnvironmentsProtection
Financial support and funding for the purposes of environmental protection is provided from Statebudget of the Slovak Republic (SR SR) through budgetary provisions of selected ministries andthrough the State Environmental Fund of the SR (SFZP SR). The contribution of particular Ministriesto the total amount of capital investment (1 825 485 thousand Sk in 1997) was as follows:• the Ministry of the Environment (MZP SR) - 1 071 983 thousand Sk (58.7 % of total)• the Ministry of Agriculture (MP SR) -377 139 thousand Sk (20.7 % of total)• the Ministry of Health (MZ SR) - 113 695 thousand Sk (6.2 % of total)• the Ministry of Defence (MO SR) - 141 300 thousand Sk (7.7 % of total)• the Ministry of Education (MS SR) - 34 397 thousand Sk (1.9 % of total)• the Ministry of Labour, Social Affairs and Family (MPSVaR SR) - 5 993 thousand Sk (0.3 % of total)• the Ministry of Economy (MH SR) - 33 008 thousand Sk (1.8 % of total)• the Ministry of Transport, Post and Telecommunication (MDPaT SR) -175 thousand Sk (0.0% of total)• the Ministry of Justice (MS SR) - 22 293 thousand Sk (1.3 % of total)• the Ministry of Culture (MK SR) - 9 800 thousand Sk (0.5 % of total)• the Ministry of Finance (MF SK) - 5 726 thousand Sk (0.3 % of total)• the Office for the Strategy Development of Society, Science and Technology of SR (USRSVT SR)- 9 976
thousand Sk (0.6 % of total).Financial contribution of the above mentioned Ministries to the total capital investment (excluding
MZP SR) amounted to 753 502 thousand Sk which represented 41.3 % of total investment.
Table 122 Environmental investments of the SR Ministries coming from the State budget and theState Environmental Fund (SFZP) - in thousand Sk
SectorMinistry
MZPSRMPSRMSSRMPSVaR SRMOSRMKSRMZSRMHSRMVSRMSSRMDPaT SRMFSRUSRSVT SRTotal
WWTPseweragesystem
364 79555 70010 005
-37 352
-1 000
506-
2 433175
5 726-
477 692
other WMactions
260 137321 439
1 500-
85 235----
13 903---
682 214
Wastemanagement
103 872-----700
19 464-
300
-9 176
133 512
Air protection
343 179-
10 7885 993
187139 800
111 99513 038
-17 761
--800
532 067
Total
1 071 983377 139
22 2935 993
141 3009 800
113 69533 008-
34 397175
5 7269 976
1 825 485
%
58.720.7
1.30.37.70.56.21.8-
1.90.00.30.6
100.0WWTP - waste water treatment plantWM - waste management
Source: relevant Ministries
96

State of the Environment Report - the Slovak Republic 1997
'/.•;
In 1997, 1 037 applications for SFZP financial supportwere approved (compared to 1 023 applications in 1996). Onthe grounds of issued approvals, agreements on SFZP financialsupport totalling 1 184 427 thousand Sk were signed (asopposed to 1 224 336 thousand Sk in 1996). Financial supportfor selected spheres was as follows:
Table 123 SFZP SR financial support according to the spheres
SpherePublic water suppliesWaste water treatment plants andsewerage systemAir protectionWaste managementNature conservationOther water management facilitiesOther activitiesResearch and promotionTotal
Number209252
25912076234949
1037
Thousands Sk228 915364 795
343 179103 87234 45831 22247 25830 728
1 184 427Source: SFZP SR
Financial resources for reduction of direct damages on the environment caused by serious acci-dents were released after official approval of the Minister of the environment. In 1997, 298 350 thousandSk were spent on dealing with 4 emergency situations directly endangering the environment (comparedto 1 762 007.80 Sk spent in 6 cases in 1996).
Environmental protection expenses classed as investment subsidies amounted to 990 176 220.76Sk. The state as of December 31st, 1997 represented additional subsidies from 1996 resulting from thelack of financial resources available at the end of 1996, using subsidies allocated in 1997 and subsidiesbalance from the final calculation.
Table 124 Allocated and actually spent financial provisions provided by SFZP SR in 1997 and1996 (thousand Sk)
Kind of activity
Public water suppliesWaste watertreatment plants andsewerage systemAir protectionWaste managementNature conservationOther watermanagement facilitiesOther activitiesResearch andpromotionAccidentsTotal
Year 1996Financialresourcesprovided
221 995
398 198
337 360147 284
8 72532 218
35 17623 380
17621 226 098
Financial resources actuallyspent
Investmentsubsidies
215 646
361714
318 067140 066
-17 937
35 862-
5911 089 883
Non-Investmentsubsidies
-
-
--
18 643-
-
21547
-
40 190
Year 1997Financialresourcesprovided
228 915
364 795
343 179103 87234 45831 222
47 25830 728
2981 184 725
Financial resources actuallyspent
Investmentsubsidies
189 364
326 906
261 31492 174
-
16915
56 565-
754943 992
Non- Investmentsubsidies
-
--
22 799-
-
23 383
-
46 182Source: SFZP SR
97

State of the Environment Report - the Slovak Republic 1997
Economic instruments of the environmental protection are understood as a part of economymanagement instruments complex leading to effective exploitation of natural resources and pollutionreduction. The following table shows total capacities of the selected economic tools applied in 1997 (incomparison to 1996 in million Sk).
Table 125 Revenues from the selected economic instruments
Type of payment in million Sk 1997 1996 Difference RecipientPayments for pollution
Penalties for air pollutionPenalties for waste water dischargePenalties for waste disposal
392195174
412234220
-20-39-46
SFZP SRSFZP SRSFZP SR
Payments for natural resources exploitationPayments for groundwater extraction
Payments for surface water extractionPayments for water supply from publicwater suppliesTaxes for occupied agricultural landTaxes for occupied forest landReimbursement for mining facilities andexploited mineralsExploited minerals separately
4.6*305.7940
2 674
86833
138134
13*129.5915
2 352
567125
130126
-8.4+ 176.2+ 25
+ 322
+ 301-92
+ 8+ 8
SFZP SRSVFwatershed administrationwater supply and sewerageadministrationSFOZPPFSFZL
SRSR
* Past period debts for payment for groundwater extraction were demanded on the grounds of judicialpayments was paid back in the first quarter of 1995 from the Ministry of Agriculture (in 1996).
proceedings (in 1997) and part ofSource: fc
Table 126 Penalties imposed by Environmental State Administration Authorities (thousand Sk)- SFZP SR as recipient
Penalties / SectorAir protectionWater protectionWaste managementNature conservationTotal
19972 0838 769
10731852
22 435
19966 3469 705
15 0688 452
39 571
Difference-4 263
-936-4 337
- 7 600
-17 136
Source: SFZP SR
98
State of the Environment Report - the Slovak Republic 1997
Environmental law
In 1997, preparation of legislative framework and policy making process regarding environmentalissues further continued in effort to approximate them to the EU valid legislative system. The followinggenerally valid regulations were enacted:• 229/1997 Coll. THE ACT which amends the Act No. 50/1976 Coll. on Territorial Planning, and on
Building Order (the Building Act), in wording of later provision• 46/1997 Coll. THE GOVERNMENT ORDER of the Slovak Republic which declares binding part of the
territorial plan of large territorial area of Kosice region• 47/1997 Coll. THE GOVERNMENT ORDER of the Slovak Republic on Pieniny National Park• 182/1997 Coll. THE GOVERNMENT ORDER of the Slovak Republic on the Nizke Tatty National Park• 258/1997 Coll. THE GOVERNMENT ORDER of the Slovak Republic on Poloniny National Park• 259/1997 ColL THE GOVERNMENT ORDER of the Slovak Republic on Muranska planina National Park• 41/1997 Coll. REGULATION of the Ministry of the Environment of the Slovak Republic on ascertain-
ing of amounts of contaminating substances and data on meeting specified limits of contamination• 268/1997 Coll. REGULATION of the Ministry of the Environment of the Slovak Republic on the Fuel
quality requirements, operative inventory management and range, kind and way of providing informa-tion to the air protection authorities.
The following generally valid obligatory judicial regulations were proposed and elaborated:• Water Act proposal• Ozone Layer Protection Act proposal• State Environmental Fund Act proposal• State Geological Administration and Geological Services Act proposal (Geology Act)• Access to Environment Information Act proposal• Waste Act proposal• Territorial Planning and Building Order Act proposal (Building Act)
99
State of the Environment Report - the Slovak Republic 1997
Environmental ImpactAssessment
In 1997, in accordance to the Act of the NC SR No. 127/1994 Coll. On Environmental ImpactAssessment, 160 proposed activities, facilities and constructions were assessed. 43 were subject to sur-vey procedure and 117 were subject to obligatory assessment.
In 1997, assessment procedures were completed for 69 constructions, facilities and activities. Withregard to insignificant environmental impact MZP SR decided that 21 proposed actions would not bereviewed in accordance to legal framework. The most numerous group from among the assessed pro-posed actions included 19 proposals concerning waste management, 14 proposals on road and motorwayconstruction and 7 proposals concerning water facilities construction.
During the period oflegal procedures, final provisions issued by MZP SR complied in all cases withthe proposed measures on reduction of negative environmental impacts.
Environmental Assessmentand Eco-labelling .
The Slovak Government adopted the National Programme of Environmental Assessment andEco-labelling (NPEHOV) by the Resolution No. 97 from February 6, 1996. Once organisation andadministration network was established, this national programme was officially declared by the SlovakMinister of the environment of the SR on April 15, 1997 and published together with its initial directives.Initial directives concerned the following groups of products:• Directive No. 0001 - 100% cotton bed linen• Directive No. 0002 - toilet paper from 100% recycled fibres• Directive No. 0003 - paper tissues made of recycled fibres• Directive No. 0004 - plastic products containing waste plastics• Directive No. 0005 - water soluble coatings
100

State of the Environment Report - the Slovak Republic 1997
• Directive No. 0006 - water soluble adhesives and binders• Directive No. 0007 - electric household washing machines.Right to use label 'Environment Friendly Product 0001' was given to the product:• 100% cotton bed linen of Technoconsulting - TEXICOM s.r.o. Ruzomberok.Right to use 'Label Environment Friendly Product 0002' was given to the following products:• Toilet paper up to 25 grams per m2 "Z" two-ply Harmasan 'Lekno' and 'Brectan'• Toilet paper more than 25 gram per m2 "Z" one-ply Harmasan 'Myval', 'Divy mak', 'Encian' of
Harmanecke papierne a.s. Harmanec.Right to use label 'Environment Friendly Product 0005' was given to the following products:• Dispersed acrylic mate paint Ekokryl mat V 2045• Dispersed acrylic lustrous paint Ekokryl lesk V 2062• Paint Farmal V 2073 of Chemolak a.s Smolenice.The right to use label 'Environment Friendly Product' terminates at the end of 1999.
Environmental ManagementSystems
Following the trend in other developed countries, theSlovak Republic is trying to establish an effective system focu-sing on the monitoring of environmental impacts of producers,manufacturers and other organisations, together with products,technologies used and services provided.
Apart from the environmental legislation and other systematic measures, EnvironmentalManagement Systems (EMS) are being gradually introduced. These systems represent generally appli-cable method of organisation management linking together environment protection principles, generalprinciples of organisation running with objective of achieving environmental and economic goals.
VSZ OCEL. spol. 8 r. o.Oiwzny zavod Sludena valcovrta
044 54Slovenska republic
J i •• s i.
Main principles for EMS introduction into companiesand organisations are formed by ISO 14000 group of stan-dards called Environmental Management and issued by theInternational Organisation for Standardization CommitteeISO/TC 207. In December 1996, Technical NormalizationCommittee TNK NO 72 called Environmental Managementwas officially declared by the Slovak Institute of TechnicalNormalization attached to UNMS Bratislava. The TNK is under
101

State of the Environment Report - the Slovak Republic 1997
supervision of the Ministry of the Environment. Within its responsibilities the following standards werereviewed in 1997:• STN EN ISO 14001 - Environmental Management Systems (Specification completed with manual)• STN EN ISO 14004 - Environmental Management Systems (General instructions comprising principles,
systems and supporting techniques)• STN EN ISO 14010 - Environmental Auditing (General principles)• STN EN ISO 14011 - Environmental Auditing (Auditing procedures, EMS Auditing)• STN EN ISO 14012 - Environmental Auditing (Qualification criteria for environmental auditors).The above mentioned standards will be issued in 1998.
ISO 14001 Standard is the certification standard forEMS implementation and certification. As it is not an obligato-ry standard, it was designed in a way that it can be applied inany size and type of organisation and type of organisationtaking into consideration various geographical, cultural andsocial conditions. Efficiency of the implemented system is ver-ified by certification auditing. Certification auditing results areused by certification organisation in the process of issuing offi-cial certificates.
Table 127 In 1997, in compliance with ISO 14001 Standard the following Slovak organisationswere issued with certificates
OrganisationMATADOR a.s. PuchovSLOVNAFT a.s. BratislavaDivision Cold Rolling VSZ OCEC s. r.o. KoSice
Certificate issued15Ih May 199718th July 199726th August 1997
Certifying bodyDET NORSKE VERITAS NetherlandsSQS SwitzerlandRW TUV Germany
Accreditation of EMS Certification Authorities in the Slovak ConditionsTechnical Committee for Accreditation of EMS Certification Authorities (TVA-COE) attached to
the Slovak Accreditation system started to work on January 1, 1997.Within its responsibilities, TVA-COEhas elaborated accreditation methodolo-gy based on EN 45012, ISO/IEC Guide61 and EAC Guide 5 Standards, andmeeting the EARA international criteria,a group of assessors and environmentalauditors for accreditation and certifica-tion procedures was formed.
102
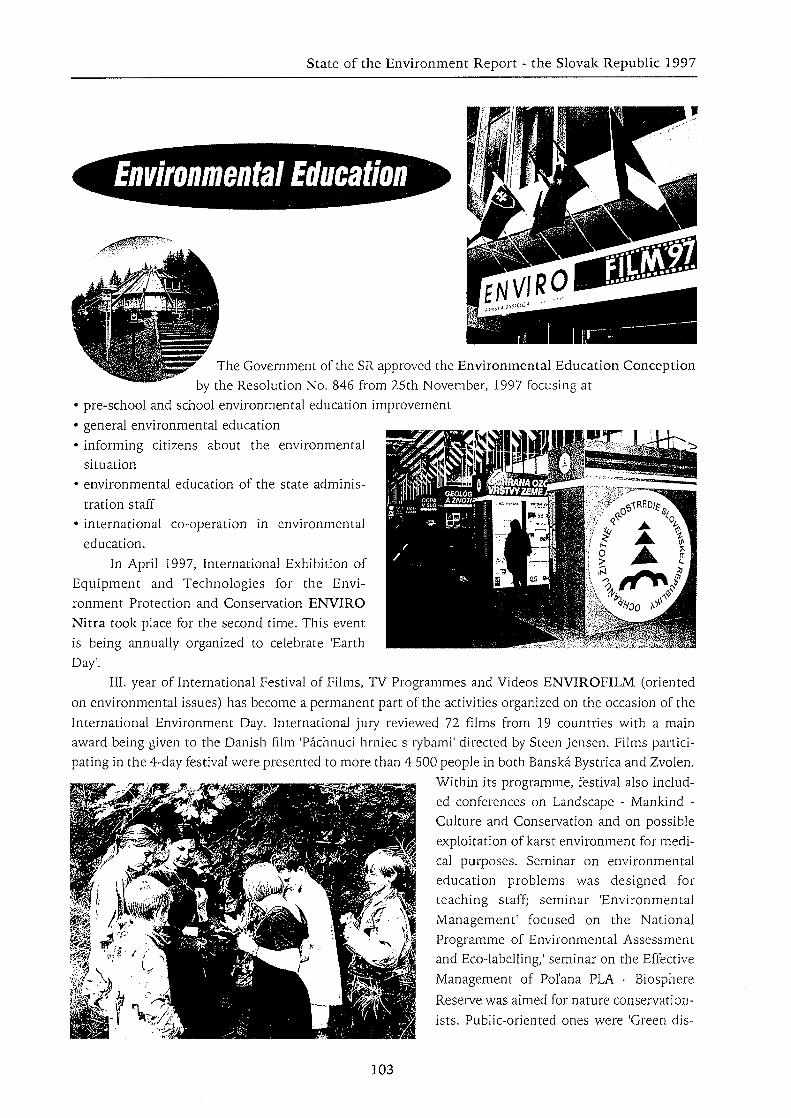
State of the Environment Report - the Slovak Republic 1997
Environmental Education
The Government of the SR approved the Environmental Education Conceptionby the Resolution No. 846 from 25th November, 1997 focusing at
• pre-school and school environmental education improvement• general environmental education• informing citizens about the environmental
situation• environmental education of the state adminis-
tration staff• international co-operation in environmental
education.In April 1997, International Exhibition of
Equipment and Technologies for the Envi-ronment Protection and Conservation ENVIRONitra took place for the second time. This eventis being annually organized to celebrate EarthDay'.
III. year of International Festival of Films, TV Programmes and Videos ENVIROFILM (orientedon environmental issues) has become a permanent part of the activities organized on the occasion of theInternational Environment Day. International jury reviewed 72 films from 19 countries with a mainaward being given to the Danish film 'Pachnuci hrniec s rybami' directed by Steen Jensen. Films partici-pating in the 4-day festival were presented to more than 4 500 people in both Banska Bystrica and Zvolen.
Within its programme, festival also includ-ed conferences on Landscape - Mankind -Culture and Conservation and on possibleexploitation of karst environment for medi-cal purposes. Seminar on environmentaleducation problems was designed forteaching staff; seminar 'EnvironmentalManagement' focused on the NationalProgramme of Environmental Assessment
/ r ^^H|^H£?*^^_ *" WMk£^!&l!%M a n ^ Eco-labelling,' seminar on the EffectiveManagement of Pol'ana PLA - Biosphere
Reserve was aimed for nature conservation-
ists. Public-oriented ones were 'Green dis-
103
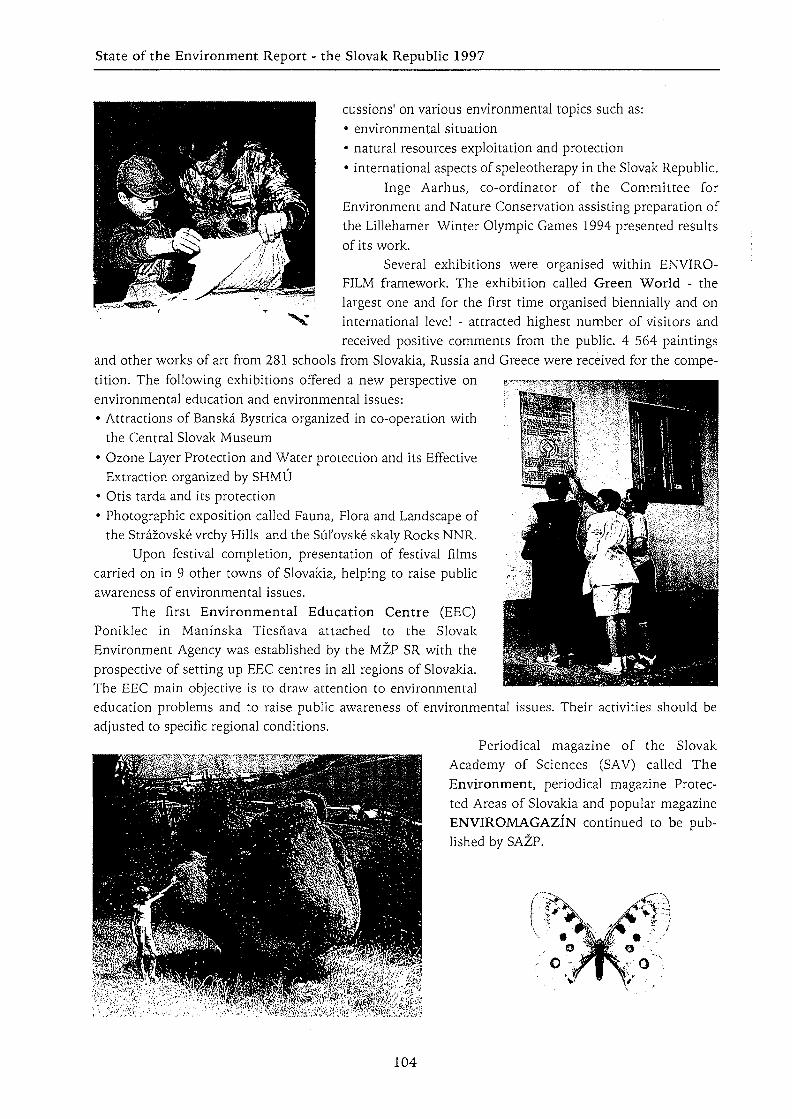
State of the Environment Report - the Slovak Republic 1997
cussions' on various environmental topics such as:• environmental situation• natural resources exploitation and protection• international aspects of speleotherapy in the Slovak Republic.
Inge Aarhus, co-ordinator of the Committee forEnvironment and Nature Conservation assisting preparation ofthe Lillehamer Winter Olympic Games 1994 presented resultsof its work.
Several exhibitions were organised within ENVIRO-FILM framework. The exhibition called Green World - thelargest one and for the first time organised biennially and oninternational level - attracted highest number of visitors andreceived positive comments from the public. 4 564 paintings
and other works of art from 281 schools from Slovakia, Russia and Greece were received for the compe-tition. The following exhibitions offered a new perspective onenvironmental education and environmental issues:• Attractions of Banska Bystrica organized in co-operation with
the Central Slovak Museum• Ozone Layer Protection and Water protection and its Effective
Extraction organized by SHMU• Otis tarda and its protection• Photographic exposition called Fauna, Flora and Landscape of
the Strazovske vrchy Hills and the Sul'ovske skaly Rocks NNR.Upon festival completion, presentation of festival films
carried on in 9 other towns of Slovakia, helping to raise publicawareness of environmental issues.
The first Environmental Education Centre (EEC)Poniklec in Manfnska Tiesnava attached to the SlovakEnvironment Agency was established by the MZP SR with theprospective of setting up EEC centres in all regions of Slovakia.The EEC main objective is to draw attention to environmentaleducation problems and to raise public awareness of environmental issues. Their activities should beadjusted to specific regional conditions.
Periodical magazine of the SlovakAcademy of Sciences (SAV) called TheEnvironment, periodical magazine Protec-ted Areas of Slovakia and popular magazineENVIROMAGAZIN continued to be pub-lished by SAZP.
O
104

State of the Environment Report - the Slovak Republic 1997
International Co-operation
International Organizations
Within the UN framework, the Slovak Republic partici-pated in the following activities:UN European Economic CommissionUN Industrial Development OrganizationUN Development ProgrammeUN Human Habitat OrganizationUN Environment Programme
- UNEEC- UNIDO-UNDP- HABITAT-UNEP
UN Commission on Sustainable Development - CSDThe SR participated in all relevant activities of the UNEEC co-ordinated by the Environmental Policy
Committee, especially in relation to preparation of the Pan-European Conference of the Ministers of theEnvironment held in June 1998 in Aarhus (Denmark). The Slovak delegation took part in the Pan-EuropeanConference of the Environment and Transport Ministers in Vienna in November 1997.
Projects on the environment improvement, co-ordinated by the Slovak Centre of Cleaner Productionand in co-operation with UNIDO, were implemented in the selected stressed regions of Slovakia.
UNDP established the programme called CAPACITY 21 to support the conclusions of the UNConference on Environment and Development in 1992. This programme should assist countries with estab-lishment of capacities for continuous sustainable development. The Programme CAPACITY 21 for the SRwas signed by the UNDP and the Slovak Government in May 1997. Its main objective is to establish a net-work supporting environment assessment, emphasizing continuous sustainable consciousness of citizensand to support participation of specialised subjects in the EIA (Environment Impact Assessment) process,that are aimed towards application of sustainable development principles in the Slovak conditions.The Slovak delegation took part in the session of the UNEP Governing Council as its member. The UNEPexecutive director Elisabeth Dowdeswell officially visited the SR in September 1997.The Slovak delegation took part in the session of the UN Commission for Sustainable Development in Apriland June 1997. It took part in the separate session of the UnitedNations General Assembly on Sustainable Development.
In March 1997, the Minister of the Environment of theSR took part in the structure dialogue at the extended sessionof the EU Ministers Council of the Environment and theMinisters of the Environment from the associated countries inBrussels. In September 1997, he took part in the consultativemeeting with the EU Director of the Environment and Nuclear
105

State of the Environment Report - the Slovak Republic 1997
Safety and Ministers of the Environment from the associated countries inBrussels. In 1996, the OECD Committee on Environmental Policy declaredthat the SR is able and prepared to act in accordance with the OECD mem-bership obligations in the environment sphere. After that, in 1997, the branchactivities of the Ministry of the Environment of the SR were concentrated onpreparation of the 4th Pan-European Conference of Environment Ministersin the Danish Aarhus.
International Conventionsand Other Forms of
Multilateral Co-operation
Within the framework of the Basle Convention on the Control of Transboundary Movements ofHazardous Wastes and their Disposal, Regional Training Centre (RTC) for Central and Eastern Europewas established and it has operated since February 1997. The main activity of RTC is oriented towards:• training• information technology (Clearing House).
The task of RTC is to organize training courses for 19 Central and Eastern European Countries:Albania, Belarus, Bosnia and Herzegovina, Bulgaria, the Czech Republic, Estonia, Croatia, the FederalYugoslav Republic, Lithuania, Latvia, Republic of Macedonia, Hungary, Moldavia, Poland, Romania,Russian Federation, the Slovak Republic, Slovenia and Ukraine. By the end of 1997, RTC organized thefollowing courses:1. Implementation of the Basle Convention into the national legislation; juridical and institutional aspects
of implementation along with the transfer principles of hazardous waste and its prevention (2-6 June1997)
2. Identification of hazardous waste, its inventory, classification and characterization of hazardous fea-tures (20-21 October 1997)
3. Control Information Systems on Waste (1-5 December 1997)According to the Convention on Long-range Transboundary Air Pollution, the SR took part in
discussions of the steering committee of the organisation and its support workgroups.In September 1997, the Slovak delegation took part in a jubilee meeting of the Montreal Protocol partici-pating countries held in Montreal (Canada).
Following the RAMSAR Convention on Wetlands of International Importance, Especially asWaterfowl Habitats (RAMSAR, 1971), the Slovak National Co-ordinating Secretariat continued to worktowards agreed engagements.
Within the framework of the Convention on International Trade in Endangered Species of WildFauna and Flora (CITES), Washington 1973, the Slovak National Co-ordinating Secretariat continued itsactivities including completion of the annual national report.
Within the framework of the Convention on Biodiversity, implementation of the project fundedfrom the Global Environment Facility (GEF) funds continued. The Convention on the Conservation ofEuropean Wildlife and Natural Habitats (Bern, 1979) was realized.
In December 1997, at the 3rd UN Framework Convention on Climate Changes in Kyoto, the Slovak
106

State of the Environment Report - the Slovak Republic 1997
delegation accepted the commitment to reduce greenhouse gases production by 8% by the year 2010, ascompared to 1990.
In September 1997, following the initiative of the Polish Minister responsible for the environment,10 ministers of the Central and Eastern European Countries signed so-called Torun Declaration onEnvironmental Protection Co-operation.
In October 1997, state secretary of the MZP SR participated in the 11th Conference of the ministersresponsible for urban planning (CEMAT) and presented the Conception of Urban Planning in theSlovak Republic.
Bilateral Co-operationDuring 1997, the following bilateral agreements were
signed:• Agreement between the Government of the Slovak Republic
and the Turkey Government on co-operation in environmentprotection (Ankara, 2.4.1997)
• Agreement between the Government of the Slovak Republicand the Government of the Republic of Germany on co-opera-tion in environment protection (Bratislava, 14.7.1997)
• Agreement between the Ministry of the Environment of theSlovak Republic and the Ministry of Science, Technology and Environment of Cuba on co-operation inenvironment protection (Havana, 22.3. 1997)
• Agreement on co-operation in geology between the Ministry of the Environment of the Slovak Republicand the Ministry of the Environment Protection, Natural Resources and Forestry of Poland (Stetin,25.6.1997)
• Agreement between the Ministry of the Environment of the Slovak Republic and the Ministry of theEnvironment Protection of Belarus on co-operation in environment protection (Bratislava, 8.7.1997).
InternationalProgrammes and Projects
The Ministry of the Environment of the SR co-ordinatesand participates in the multilateral and bilateral projects finan-cially supported by the foreign grants. In 1997, the co-operationcontinued in the following projects:1. Phare - National Programme2. Phare MCPE - Multinational Co-operation Programmeon Environment
3. Phare CBC - Cross-border Co-operation Programme4. Phare DISAE - Development of the Implementation Strategies for Approximation in the Environment5. projects in co-operation with the World Bank's GEF - Global Environmental Facility6. projects guaranteed by UNESCO7. projects guaranteed by UNEP8. projects guaranteed by UNIDOand other projects in co-operation with Belgium, Denmark, the Netherlands, Japan, Canada, Korea,Luxembourg, Norway, Austria, Republic of Germany, Switzerland, Italy, Ukraine, USA and Great Britain.
107
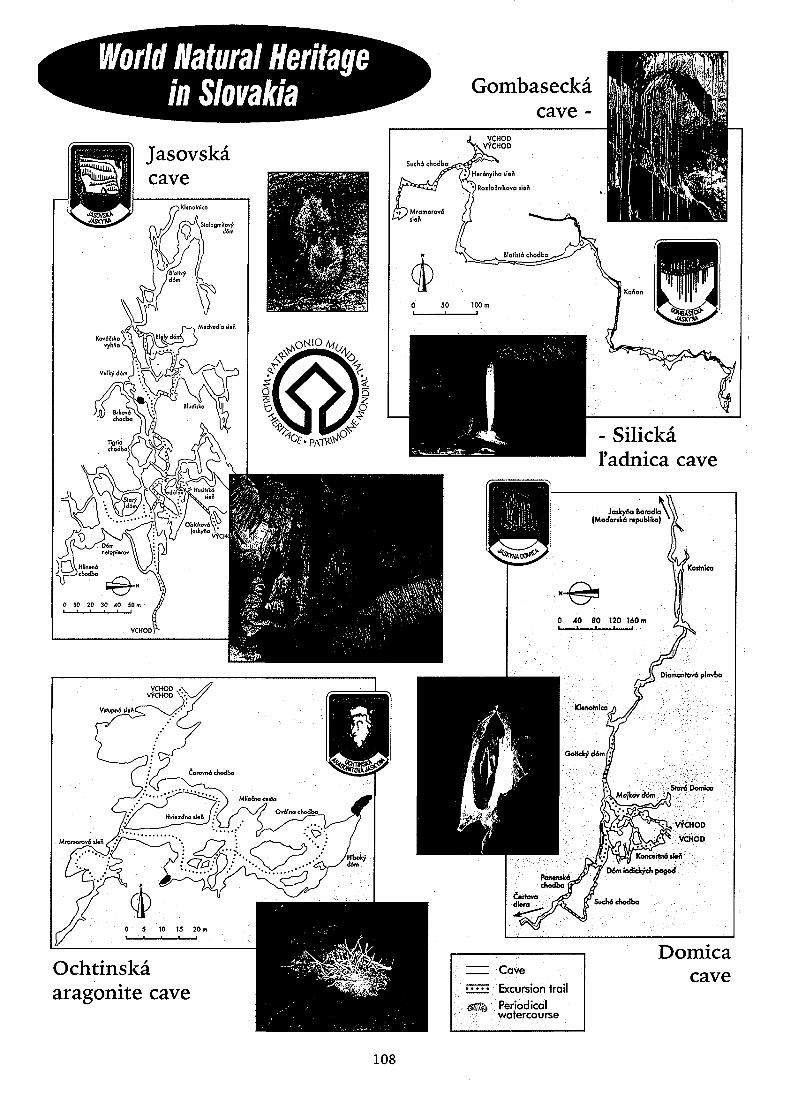
World Natural Heritagein Slovakia Gombasecka
cave -
Jasovskacave
- Silickaradnica cave
Jolkyito BaradloY
StordDomlco
VfCHOD
VCHOD
Kannrtnd iJefl
W m indidqfcfi pflQod
' SudxS dwdbo
Ochtinskaaragonite cave
Cave
Excursion trail
Periodicalwatercourse
Domicacave
108

State of the Environment Report - the Slovak Republic 1997
APIAPId
APIs
API*AQS,
AQS
AQS,
AQS81,AOT40
a.s.BOD5
BUSAV
CBCCITES
CODCMSColl.COPK
CSD
CSSRdBD.U.DISAE
Alphabetical List ofAbbreviations
Air pollution indicesDaily air pollution indicesShort-term air pollution indicesAnnual air pollution indicesAverage daily concentration of the pollut-ing substance; it is a mean concentrationlevel recorded at a designated point with-in a pan of 24 hours. Average daily con-centration is also understood as the meanof at least 12 (periodical) average concen-tration levels recorded every 30 minuteswithin a span of 24 hours (arithmeticmean)Annual average pollutant concentrationas arithmetic mean average 24-hour con-centrationAverage 30-minute pollutant (shortterm) concentrationAverage 8-hour pollutant concentrationAccumulated exposure over threshold 40ppbshare companyBiochemical oxygen demandBiological Institute of the SlovakAcademy of ScienceCross-border Co-operation ProgrammeConvention on International Trade inEndangered Species of Wild Fauna andFloraChemical oxygen demandPartial Monitoring Systemcollection of lawsNature and Landscape Protection Centre
UN Commission on SustainableDevelopmentCzechoslovak Socialist RepublicdecibelDobson's unitDevelopment of the ImplementationStrategies for Approximation in theEnvironment
EMEP
ENP
EOAREU
FAR
GDP
GEF
GSSRGWh
ha
HABITATHBUSR
HTR
IS
ISZPIUCN
krajkt
km2
LVU
MCPE
MDPT SR
MFSRMHSR
mil m3
mil tonsMKSR
MOSR
MPSR
European Monitoring and EvaluationProgrammeExtractible non-polar substancesAverage Concentration of Radon Activitythe European UnionFolk Architecture Reserve
Gross Domestic ProductGlobal Environment FacilityGeological Service of the Slovak RepublicGiga Watt hourshectarUN Human Habitat OrganisationMain Mining Office of the SlovakRepublicHistorical Town ReserveInsoluble solidsInformation System of the EnvironmentWorld Conservation Union (InternationalUnion for Conservation of Nature andNatural Resources)administrative regionkilotonnessquare kilometresForestry Research InstituteMultinational Co-operation Programmeon EnvironmentMinistry of Transport Post andTelecommunications of the SlovakRepublicMinistry of FinanceMinistry of Economy of the SlovakRepublicmillion cubic metresmillion tonnesMinistry of Culture of the SlovakRepublicMinistry of Defence of the SlovakRepublic
Ministry of Agriculture of the SlovakRepublic
109

State of the Environment Report - the Slovak Republic 1997
MPSVaR SR
MSSR
MSSRMW
MZSRMZPSR
NCM
NCSR
NO2-NNP
NPKC
NPEHOV
NMNRNNMNNROECD
OROOUpcsPCBPCT
PDEpHPLA
PMPMSPOHSR
PS •RAMSAR
RAOREC
REPREZZO
RIS
RISOSAZPSAZP-COPK
SAVSESeVaK
SO2-SSFKSFOZPPF
Ministry of Labour, Social Affairs andFamily of the Slovak RepublicMinistry of Education of the SlovakRepublicMinistry of Justice of the Slovak RepublicMegaWattMinistry of Health of the Slovak RepublicMinistry of the Environment of theSlovak RepublicNational Cultural MonumentNational Council of the Slovak Republic(NR SRINitrates-NNational ParkNational Monuments and LandscapeCentreNational Programme of EnvironmentalAssessment and EcolabellingNature MonumentNature ReserveNational Nature MonumentNational Nature ReserveOrganisation for Economic Cooperationand Developmentspecific protection regimeDistrict Officepiecespolychlorinated biphenylspolychlorinated terphenylsair-dose-equivalentacidity in pHProtected Landscape AreaParticulate matterPartial Monitoring SystemWaste Management Programme of theSlovak RepublicProtected SiteConvention on Wetlands of InternationalImportance, Especially as WaterfowlHabitatsRadioactive wasteRegional Environmental Centre for theCentral and Eastern EuropeRegional Energy Supplying CompanyRegister of Emissions on Air PollutionSourcesBranch Information SystemRegional Information System on WasteSlovak Environment AgencyCentre of Nature Conservation andLandcape Protection of the SlovakEnvironment AgencySlovak Academy of SciencesSlovak Electricity CompanyNorth Slovakia Water and SewageCompanySulphates-SState Cultural Fund 'Pro Slovakia'State Fund of Conservation and
SFZL State Fund of Forest ReclamationSFZP State Environmental FundSHMU Slovak Hydrometeorological InstituteSIZP Slovak Environmental InspectorateSk Slovak crown (currency)SNP SR Administration of the Slovak National
ParksSPM ' Solid particulate matters.p. state companySR Slovak Republics.r.o. company limited by guarantee (Ltd.)SR SR State budget of the SRSPP s.p. Slovak State Gas EnterpriseSS Soluble solidsSTN Slovak Technical StandardStVaK Central Slovakia Water and Sewage
CompanySU SR Statistical Office of the Slovak RepublicSZU SR State Health Institute of the SRSVF State Watermanagement Fundt tonnesUGKK Office of Geodesy Cartography and
Cadastre of the SRUJD Nuclear Regulatory Authority of the SRUKSUP Central Control and Testing Institute of
AgricultureUN United NationsUNCEP UN Conference on Environment and
DevelopmentUNDP UN Development ProgrammeUNEEC UN European Economic CommissionUNEP UN Environmental ProgrammeUNESCO United Nations Educational, Scientific
and Cultural OrganisationUNIDO UN Industrial Development OrganisationUPO MV SR Office of Fire Protection of Ministry of
Interior the SRUPKM Preventive and Clinical Medicine
InstituteUSRSVT SR Office for the Strategy Development of
Society, Science and Technology of theSlovak Republic
VaK Water and Sewerage CompanyVAT Value Added TaxVOC volatile organic compoundsVUP Food Research InstituteVUPU Soil Fertility Research InstituteVUVH Water Research InstituteVUZH Research Institute of IrrigationVVaK East Slovakia Water and Sewage
CompanyWHS World Heritage SiteWWTP waste water treatment plantZE Power plants linked to independent
industrial unitsZsVaK West Slovakia Water and Sewage
Company
Reclamation of Agricultural Land Fund
110

State of the Environment Report - the Slovak Republic 1997
Text to pictures
Front SIMILAR AND DIFFERENTcover: • Circus aeruginosus
• Aquilegia vulgaris• Seat of the President of the SR - Grassal-kovich Palace in Bratislava restored• The highest peak of Slovakia - theGerlach Peak (2655 m a.s.l.) in TANAP
Page 1: SYMBOLS OF THE SLOVAK LANDSCAPE• Devin NCM - a Slavic castle - part ofBratislava• Museum of the Slovak National Uprisingin Banska Bystrica with surrounding area -NCM
Page 2: BIOLOGICAL AND LANDSCAPE DIVER-SITY• Krivafi (2494 a.s.l.) in TANAP• Rupicapra rupicapra tatrica• Pulsatilla alba
Page 3: SLOVAKIA - THE COUNTRY IN THECENTRE OF EUROPE• Litvorove Lake in Bielovodska ValleyNNR (TANAP)• St. Juraj Romanesque rotunda NCM inSkalica"(llth century)
Page 4: REGIONS AND THEIR CENTRES• Bratislava (HTR): Old City Hall andRoland's fountain• Nitra (HTR): Nitriansky castle NCM• Banska Bystrica (HTR): Square with theTown castle NNM• Kosice (HTR): St. Alzbeta CathedralNCM• Presov (HTR): St. Mikulas parochialchurch• Zilina (HTR): Budatfnsky castle• Trencin: (HTR): Trenciansky castle NCM• Trnava (HTR): St. Mikulas Cathedral
age 5: • Chopok regional monitoring station in-cluded in EMEP network
Page 6:
Page 7:
Page 10:
Page 11:
Page 15:
Page 16:
Page 17:
Page 19:
• Environmental publications and periodi-cals of the MZP SR
POLLUTER PAYS PRINCIPLE• Still the biggest source of SO2 air pollu-tion in Slovakia - SE a.s. Power PlantNovaky
CONSEQUENCES OF CO2 EMISSIONGROWTH - CLIMATE CHANGES• Earth warming caused by greenhouseeffect
POLLUTANTS CONCENTRATIONS INTHE ATMOSPHERE OF REGIONS DIF-FER - IN QUANTITY AND ALSO INCOMPOSITION• We cannot still be satisfied with theimmission situation in Upper Nitra• It managed to survive
WERE THE FLOODS IN 1997 CAUSEDBY CLIMAT CHANGES?• Where remained the middle of the Mora-va river before its mouth to the Danuberiver?
LET US PROTECT STRATOSPHERICOZONE AND LET US PROTECT OUR-SELVES BEFORE TROPOSPHERICOZONE• Impacts of tropospheric ozone andstratospheric ozone quantities on a manand other organisms are different.
WATER - THE PRIORITY NUMBER ONE• Studenovodske waterfalls in the Studenavalley NNR in TANAP
• Water means life - Danube floodplainsPLA
GROUND WATER SHOULD NOT BEUSED FOR ECONOMIC PURPOSES• Micinske travertines NNR - ground waterspring
111

State of the Environment Report - the Slovak Republic 1997
Page 21: • Dobsinska Ice Cave NNM with an under-ground glacier - a Small Hall
Page 24: • Outlet of mining water into the stream ofthe Upper Nitra area (Cigef)
Page 25: WATER CLEANING BECOMES A NECES-SITY WITH TIME• Waste water treatment plant for ourhouses
Page 27: DO WE SUFFICIENTLY USE NATURALCURATIVE SPRINGS?• Curative water springs for patients ofBardejovske spa (colonnade)
POTABLE WATER IS FOR DRINKING• Krater NR - a small lake in VysneRuzbachy spa
Page 28: RELIEF FORMS ARE CONDITIONED BYROCKS - LANDSCAPE DIVERSITY ISDEFINED BY RELIEF• Stonefall in the Somoska NNR in theCerova highland PLA
Page 30: LANDSCAPE AND MAN• Unhealable wound after limestone min-ing in the Plesivska plateau in the Sloven-sky kras PLA opposite Gombasek
Page 31: SOIL - A NURTURER• ,,Semi-desert" in the Camovsky brookwatershed• Stands damaged by soil contaminationcaused by animal production excrementsnear to Cenkovo• Soil to be analysed, decontaminated andfertile
Page 34: WHERE DID THE EVERLASTING RELA-TION TO SOIL REMAIN?• Ziarska hollow and its "old environmen-tal load"• Forest residues on contaminated soilabove Jelsava• A tourist trail can also look like this -constantly wider and deeper
Page 35: HARMONY MEANS LIFE• Dependence of plant and animal realm(Vanessa c-album)• Fritillaria meleagris
Page 36: PROTECTED PLANTS IN PROTECTEDAREAS IN DIFFERENT COMMUNITIES• Gentiana asclepiadea in Janosikova kolkarenNNR in Vel'ka Fatra PLA• Adonis vernalis in Devfnska Kobyla NNR• Iris pumila in Zoborska forest-steppe NNRin Ponitrie PLA
Page 37: • Nuphar luteum in Torozlin NR
ENDANGERED AND PROTECTEDFAUNA SPECIES
• Bison bonasus
• Ablepharus kitaibelii
Page 38: • Falco cherrug• Otis tarda
Page 39: 30lh ANNIVERSARY OF PIENAP• How will PIENAP cope with the openingof the international pedestrian and cycliccrossing Szczawnica - Lesnica through theDunajec prielom?
NOMINATION TO THE WORLD HERI-
TAGE• Will the Dobsinska Ice Cave become theWorld Heritage Site in 1999?
Page 40: LANDSCAPE DIVERSITY• Ostra rock NR in the Slovak Paradise NP• Krasna Horka castle NCM in Slovak KarstPLA
Page 41: RESTORATION OF CULTURAL MONU-MENTS CONTINUES• Town castle in the Kremnica NCM (HTR)• Fil'akovsky castle CM - in the Cerovahighland PLA
Page 42: THE MOST VALUABLE MONUMENTS OFNATURE AND MAN IN THE COUNTRY -WORLD HERITAGE SITES
• WHS St. Ghost church NCM in Zehra(1275)• WHS Vlkolfnec FAR• WHS Spisska Kapitula HTR with St.Martin romanesque Cathedral• Bardejov HTR - square after the renova-tion
Page 43: SITES FROM A TENTATIVE LIST FORINSCRIPTION TO THE WORLD HERI-TAGE LIST• Switch-back forest railway in Kysuce PLAand Horna Orava PLA - 1• Wooden articular church in Kezmarok(1717)-3• Kyjatice church NCM (13th century) - 4• St. Kozma and Damian wooden churchNCM in Venecia-Lukovo (1709) - 2
Page 44: UPDATED ENVIRONMENTAL REGION-ALIZATION OF THE SR CAME INTOTHE WORLD
112

State of the Environment Report - the Slovak Republic 1997
• A team of authors conducted by PeterBonus, director of SAZP-COKOO in Koikeunder the supervision of SEKPO MZP SRduring the presentation of the environmen-tal regionalization of the SR• Mountain landscape under the Tatra Page 63:• Lowland landscape of Podunajsko
Page 45: TWO FACES OF THE 9 ENDANGEREDAREAS IN THE SR• 1) Bratislava region- Hviezdoslavovosquare / Petrzalka Page 64:
Page 46: • 2) Trnava-Galanta region - HTR Trnava /former nickel smelter in Sered'
Page 48: • 3) Upper Nitra region - Bojnice castleNCM / non-reclamated spoil banks in Page 67:Horna Nitra
Page 49: • 4) Upper Povazie region - Besefiovsketravertines NM / atmosphere inRuzomberok
Page 51: • 5) Middle Pohronie region - BanskaBystrica HTR / red sludge pit in Ziar hollow
Page 52: • Zvolen castle
Page 53: • 6) Middle Spis region - Spisska Nova Veswith the highest church in the SR / metal-lurgical industry in Krompachy
Page 54: • WHS Spissky castle NCM
Page 55: • 7) Middle Gemer region - NCM earlyGothic church in Kraskov from the 13th cen-tury / Rimava banks between Hacava andMiitnik
Page 56: • 8) Kosice region - HTR Kosice / VSZ a.s.Kosice metallurgical works
Page 58: • 9) Middle Zemplfn region - Zatinsky luhNR in Latorica PLA / Chemko a.s. Strazskechemical factor/
Page 60: CONSEQUENCES, WE SHALL NOT GETRID OF WITHIN A SHORT PERIOD OFTIME• An area of black spoil heaps near Sered'in the Trnavskogalantska endangered area
PREVENTION IS CHEAPER THAN CON- Page 74:SEQUENCES REMOVAL• Cement works in Lietavska Liicka
Page 61: • Polluted environment in Rimava valley inthe Central Gemer area
Page 62: • It did not survive
Page 68:
Page 69:
Page 70:
Page 71:
Page 72:
Page 73:
HIDDEN SCARS IN THE COUNTRY DONOT ACHE SO MUCH• Long-standing mining of rose marble inTuhar
SHALL WE AGAIN MINE GOLD IN SLO-VAKIA?• Sporadic particles of gold in antimonitefrom Magurka in the collections of theNational Museum in Prague
CAN WE STILL IMAGINE OUR LIFEWITHOUT ELECTRICITY?• Nuclear power plant injaslovske Bohuni-ce ensured in 1997 still 37.7% of the totalenergy consumed
THE VERY LAST NATURAL FORESTS OFLOWLANDS AND HOLLOWS• Alder stand in Ruzinske jelsiny NR• Rozsutec NNR in Mala Fatra NP• Belianske Tatry NNR in TANAP - bio-centre of biospheric importance
CALAMITY WITHOUT A COMMENTARY• Residue of forest stand in the Green lakevalley in TANAP
In the Central Slovakia after the whirlwind(8 July, 1996)
NEITHER THE AGRICULTURAL LAND-SCAPE SHOULD STAY WITHOUT TREES• In the Zilina hollow
ACROSS THE LAST MARSH ECOSYS-TEMS• In the Gortva floodplain in Dubna withbifurcation or without it already?
AGRICULTURAL LAND EXPLOITATIONCAN BE VARIOUS• Incorrect - sludge-drying bed of SEZ, I.p.Heating company Zilina
A CONNECTION TO BRATISLAVA'SHEART• Through a new bridge from Petrzalkadirectly to the President Palace - a realitythat has to be reckoned with during thereconstruction of the area under theBratislava castle.
IT DID NOT MANAGE TO RUN ACROSS• Roads - barriers for migrating animals(Lepus europaeus)
WHAT TYPE OF TRANSPORT IS ENVI-RONMENTALLY MOST ADVANTAGE-OUS?• Railway transport should have green light
113

State of the Environment Report - the Slovak Republic 1997
Page 75: • Water transport (Gabakovo water dam ) Page 94:
HOW AND IN WHAT ENVIRONMENTDO WE LIVE?• Free measuring of blood cholesterol andsugar during the international exhibitionENVIRO Nitra 97
Page 78: SHALL WE PASS A BILL ON OZONELAYER PPROTECTION ?• How did the ozone hole originate in 1979to 1990?
Page 79: WHAT DO THE MEASUREMENTSSHOW?• Nuclear safety must be of the first priori-ty and must reach 100% level.
Page 80: • Radon risk
Page 82: • Radioactive waste
AT HOW MANY DECIBELS WILL SHEFROWN AND AT HOW MANY BOLT ?• An amusing billboard in Petrzalka - adelight not only for ears abut also for eyes
Page 83: WITHOUT ENVIRONMENTAL RISK• If it only was possible also in nature
Page 84: WHAT IS OUR SITUATION WITHINEUROPE?• Toxic heavy metals monitoring - a condi-tion for being incorporated in EU
Page 85: UV-B RADIATION IS A MENACE TOLIFE ON THE EARTH• Will the stratospheric ozone layer protectus against it? Till when?
Page 87: HOW THESE WASTES ORIGINATED ISWELL KNOWN, HOW TO DISPOSETHEM WE DO NOT KNOW SO FAR• Central Gemer endangered area - Jelsava• Waste dump under the Tatra mountains
Page 88: • Recyclable waste paper
Page 90: THIS IS NOT OUR NOTION OF THE SEP-ARATED WASTE COLLECTION• Containers for separated waste collectionstored near Zvolen without being used
Page 92: BEWARE OF HAZARDOUS WASTETRANSPORT• Waste import, export and transit requiresa strict control according to the Basel con-vention.
Page 95:
Page 96:
Page 97:
IS IT STILL WATER?• In the Central Pohronie endangeredAREAFLOODS ENDANGER WATER QUALITYIN WELLS• Flood on the Morava river in 1997 affect-ed also Slovakia (in Devin)
NUMBER OF FIRES INCREASED IN THESR FROM 1992 TO 1997 ALMOSTTHREE TIMES• Fire risk - Earth!• This time Petrzalka, "the third largestcity of the SR", was on fire.
WILL COLLECTORS BE USED TO ALARGER EXTENT ALSO IN SLOVAKIA?• Environment in Cyprus and Turkey isbenefiting from them already. Will ourenvironment and at the same time familyand company budget profit from them, too?
MONEY - THERE WILL PROBABLY BENEVER ENOUGH OF THEM IN THESTATE ENVIRONMENTAL FUND (SEF)• In 1998 the SEF should be divided intotwo parts - returnable and unreturnable
WHO WILL PAY THE FINE ?• Polluter pays!
NEW NP WERE DESIGNATED ANDBORDERS OF THE OLD ONES WERECHANGED• Low Tatras NP with new borders since1997
CONTRASTS UNDER THE CONSTRUC-TIONAL SUPERVISION• Modern town houses in Lucenec and oldtown houses in Spisska Sobota HTR (a partof Poprad).
Page 100: THE EIA ABBREVIATION BECAME COM-MON ALSO IN OUR COUNTRY• One of the first assessed investments -water dam Zilina
ENVIRONMENTALLY SOUND PROD-UCTS FROM SLOVAKIA• First examples of environmentallylabelled products
Page 101: MANY FORMS OF ENVIRONMENTALMANAGEMENT• A stand of the MZP SR sector is waitingfor the exhibition opening• EMS implementation in VSZ OCEL s.r.o.metallurgical works in Kosice confirmed
Page 98:
Page 99:
114

State of the Environment Report - the Slovak Republic 1997
Page 102: • EMS certification in MATADOR a.s.Puchov• Harmasan toilet paper - 100% recycling
Page 103: ENVIROFILM 97 - A CONTRIBUTION TOTHE ENVIRONMENTAL EDUCATION INSR• Number of participating countries is onthe increase
SHOW CAVES• Entrance hall of the Ochtinska aragonitecave NNM - WHS
ENVIRO NITRA '97 INTERNATIONALEXHIBITION - A SOURCE OF INFORMA-TION AND INSTRUMENT FOR BUSI-NESS DEVELOPMENT• In the exhibition hall of the MZP SR sec-tor
A RARE CLUB OF YOUNG ENVIRON-MENTALISTS IN PETRZALKA• Young environmentalists from the pri-mary school at Benadicka street inBratislava
Page 104: ENVIRONMENTAL EDUCATION• Recycled paper production demonstration(Enviro Nitra International Exhibition1997)• A touching interest of blind persons inthe World Heritage emblem on the boardsituated in the information centre inVlkolinec FAR• Children learning the nature - Sul'ovskerocks NNR in Strazske hills PLA
Page 105: UNO PAYS PERMANENT ATTENTIONTO GLOBAL ENVIRONMENTAL PROB-LEMS• UNO centre in New York - venue of the5th meeting of UN Commission forSustainable Development the SR is a mem-ber of, too.
BEFORE BECOMING THE EU MEMBER• In front of the European Parliament inBrussel
Page 106: EU flag in front of the EU building inBrussel
WILL SLOVAKIA BE ELECTED TO THEWORLD HERITAGE COMMITTEE?• Moments of expectation during votecounting after the second ballot at theGeneral meeting of contractual countries tothe World Heritage Convention in Paris in1997 with the participation of 153 states.
Page 107: INTENSIFICATION OF MULTILATERALAND BILATERAL FRIENDLY RELATIONSLEADS TO EUROPEAN INTEGRATION• We have a common interest in Moravafloodplain water and ecosystems protectionwith Austria.
APPROVED STRATEGY OF BIODIVERSI-TY PROTECTION CONCERNS ALSO ME• Lynx lynx
Page 108: WORLD NATURAL HERITAGE IN SLO-VAKIA PRESENTS ITSELF• Jasovska cave NNM• Domica cave NNM• Ochtinska aragonite cave NNM• Gombasecka cave NNM and Silicka icecave NNM• Big friends of a man - small bats
Page 109: NUMBER OF SHORT CUTS IS ON THEINCREASE• Bubo bubo in Vefka Fatra PLA
Page 111 NATURAL AND CULTURAL HERITAGEOF SLOVAKIA• Stratenska cave in Slovak Paradise NP
Page 116: ON A GOTHIC RO UTE• Gothic dominating characteristics of theSpis rural landscape - Spissky Stvrtok
Page 118: LAST BUT NOT LEAST• WHS Ochtinska aragotite cave NNM• WHS Spissky castle NCM• WHS Vlkolinec FAR• WHS Banska Stiavnica HTR - Old castle
Back MAN AND NATUREcover: • Papilio machaon
• Also mushrooms need protection(Langerniannia gigantea)• Do not let it become desolated again - acastle in the Somoska NNR in Cerova high-lands PLA attracts daily attention of foreignvisitors• Limestone Sugar loaf in Zadielska valleyNNR in the Slovak Karst PLA
115

State of the Environment Report - the Slovak Republic 1997
Table of Contents
• BASIC INFORMATION ABOUT THE SLOVAK REPUBLIC 3
• INTEGRATED ENVIRONMENTAL MONITORING AND INFORMATION SYSTEM , 5
• COMPONENTS OF THE ENVIRONMENT 7AIR 7
Emission Situation 7Ambient Air Quality 11Atmospheric Precipitation 15Tropospheric Ozone 15
WATER 16Surface Water .". 16Groundwater Resources 19Waste Water 25Drinking Water 27
GEOLOGY 28Geological Factors 28
SOIL 31Area Statistics 31Soil Contamination 31Soil Reaction and Active Extractable Aluminium 34Soil Erosion 34
FLORA AND FAUNA 35National Strategy of Biodiversity Protection 35Flora 35Fauna 37
• NATURE AND LANDSCAPE PROTECTION 39NATURAL HERITAGE 39CULTURAL MONUMENTS 41SLOVAK CONTRIBUTION TO THE WORLD HERITAGE 42
• THE STATE OF ENVIRONMENT IN SELECTED REGIONS 44Bratislava Region 45Trnava - Galanta Region 46Horna Nitra (Upper Nitra) Region 48Home Povazie (Upper Povazie) Region 49Stredne Pohronie (Middle Pohronie) Region 51Stredny Spis (Middle Spis) Region 53Stredny Gemer (Middle Gemer) Region 55Kosice Region 56Stredny Zemplin (Middle Zemplfn) Region 58
116

State of the Environment Report - the Slovak Republic 1997
• STATE OF THE ENVIRONMENT - CAUSES AND CONSEQUENCES 60ECONOMIC DEVELOPMENT AND TECHNOLOGIES 60
Gross Domestic Product - GDP 60Industry 60Mineral Resources Exploitation 62Power Plant Engineering, Gas Engineering, Heat Production 64Forestry 67Agriculture 70Transport 73
PUBLIC HEALTH 75
• ENVIRONMENTAL RISK FACTORS AND PRESSURES 79PHYSICAL RISK FACTORS 79
Radiation 79Radon and its Radioactive Decay Products 80Radioactive Waste (RAO) 82Noise 82
CHEMICAL RISK FACTORS 83Chemical substances 83Xenobiotics in the food chain 84
THE OZONE LAYER DEPLETION 85WASTE 87
Waste Generation 87Waste Management 88Municipal Waste Management 90Import, Export and Transit of Waste 92
NATURAL AND TECHNOLOGICAL HAZARDS 94Water Quality Deterioration as a Result of Various Accidents 94Fire Risk 95
• ENVIRONMENTAL PROTECTION 96ECONOMICS OF ENVIRONMENTAL PROTECTION 96
State Budget 96Slovak State Environmental Fund 97Economic Instruments 98
ENVIRONMENTAL LAW 99ENVIRONMENTAL IMPACT ASSESSMENT 100ENVIRONMENTAL ASSESSMENT AND ECO-LABELLING 100ENVIRONMENTAL MANAGEMENT SYSTEMS 101
EMS Standardisation 101EMS Certification 102
ENVIRONMENTAL EDUCATION 103
• INTERNATIONAL CO-OPERATION 105INTERNATIONAL ORGANISATIONS 105
United Nations Organisation 105EUandOECD 105
INTERNATIONAL CONVENTIONS AND OTHER FORMS OF MULTILATERAL CO-OPERATION 106BILATERAL CO-OPERATION 107INTERNATIONAL PROGRAMMES AND PROJECTS 107
• ALPHABETICAL LIST OF ABBREVIATIONS 109
• TEXTS TO PICTURES I l l
117

Copyright © 2022 FDOKUMEN


![Od Abraháma k ABRAHÁMOVINÁM // From Abraham to Slovak ABRAHÁMOVINY ‘50th birthday’ [in Slovak]](https://static.fdokumen.com/doc/165x107/63208d6f069357aa45063fd4/od-abrahama-k-abrahamovinam-from-abraham-to-slovak-abrahamoviny-50th-birthday.jpg)


![review of L. Rocchi, Hungarian Loanwords in the Slovak Language, Trieste 1999–2010 (3 vols.) [in Slovak]](https://static.fdokumen.com/doc/165x107/631e9e5356cbbb475005a4f6/review-of-l-rocchi-hungarian-loanwords-in-the-slovak-language-trieste-19992010.jpg)