The XMM-Newton serendipitous survey - IV. Optical identification of the XMM-Newton medium...
15
arXiv:astro-ph/0110269v2 14 Nov 2001 Astronomy & Astrophysics manuscript no. (will be inserted by hand later) The XMM-Newton Serendipitous Survey II. First results from the AXIS high galactic latitude medium sensitivity survey ⋆ X. Barcons 1 , F.J. Carrera 1 , M.G. Watson 2 , R.G. McMahon 3 , B. Aschenbach 4 , M.J. Freyberg 4 , K. Page 2 , M.J. Page 5 , T.P. Roberts 2 , M.J.L. Turner 2 , D. Barret 6 , H. Brunner 7 , M.T. Ceballos 1 , R. Della Ceca 8 , P. Guillout 9 , G. Hasinger 4 , 7 , T. Maccacaro 8 , S. Mateos 1 , C. Motch 9 , I. Negueruela 9 , J.P. Osborne 2 , I. P´ erez-Fournon 10 , A. Schwope 7 , P. Severgnini 11 , G.P. Szokoly 7 , N.A. Webb 6 , P.J. Wheatley 2 , and D.M. Worrall 12 1 Instituto de F´ ısica de Cantabria (CSIC-UC), 39005 Santander, Spain 2 Department of Physics and Astronomy, University of Leicester, LE1 7RH, UK 3 Institute of Astronomy, Madingley Road, Cambridge CB3 0HA, UK 4 Max-Planck Institut f¨ ur Extraterrestriche Physik, Postfach 1312, 85741 Garching, Germany 5 Mullard Space Science Laboratory, UCL, Holmbury St Mary, Dorking, Surrey RH5 6NT, UK 6 Centre d’Etude Spatiale des Rayonnements, 9 Avenue du Colonel Roche, 31028 Toulouse Cedex 04, France 7 Astrophysikalishes Institut Potsdam, An der Sternwarte 16, 14482 Potsdam, Germany 8 Osservatorio Astronomico di Brera, via Brera 28, 20121 Milano, Italy 9 Observatoire Astronomique de Strasbourg, 11 rue de l’Universit´ e, 67000 Strasbourg, France 10 Instituto de Astrof´ ısica de Canarias, 38200 La Laguna, Tenerife, Spain 11 Dipartimento di Astronomia e Scienza dello Spazio, Universit`a di Firenze, Largo E. Fermi 5, 50125 Firenze, Italy 12 Department of Physics, University of Bristol, Royal Fort, Tyndall Avenue, Bristol, BS8 1TL, UK 2 November 2001 Abstract. We present the first results on the identifications of a medium sensitivity survey (X-ray flux limit 2 × 10 −14 erg cm −2 s −1 in the 0.5-4.5 keV band) at high galactic latitude (| b |> 20 ◦ ) carried out with the XMM-Newton X-ray observatory within the AXIS observing programme. This study is being conducted as part of the XMM-Newton Survey Science Centre activities towards the identification of the sources in the X-ray serendipitous sky survey. The sample contains 29 X-ray sources in a solid angle of 0.26 deg 2 (source density 113 ± 21 sources deg −2 ), out of which 27 (93%) have been identified. The majority of the sources are broad-line AGN (19), followed by narrow emission line X-ray emitting galaxies (6, all of which turn out to be AGN), 1 nearby non-emission line galaxy (NGC 4291) and 1 active coronal star. Among the identified sources we find 2 broad-absorption line QSOs (z ∼ 1.8 and z ∼ 1.9), which constitute ∼ 10% of the AGN population at this flux level, similar to optically selected samples. Identifications of a further 10 X-ray sources fainter than our survey limit are also presented. Key words. X-rays:general, galaxies, stars; Galaxies: active 1. Introduction The XMM-Newton observatory, the second cornerstone of the Horizon 2000 science programme of the European Space Agency has been carrying out science operations since early 2000. Thanks to its high collecting area, large Send offprint requests to : X. Barcons, e-mail: [email protected] ⋆ Based on observations obtained with XMM-Newton, an ESA science mission with instruments and contributions di- rectly funded by ESA Member States and the USA (NASA) field of view and moderate angular and spectral resolution XMM-Newton is the most powerful observatory in hard X-rays (photon energy > 2 keV), opening an almost un- explored window to the Universe (Jansen et al. 2001). The sensitivity to hard X-rays (not attained by previous mis- sions like Einstein and ROSAT ) allows the detection and study of the most energetic objects in the Universe (Active Galactic Nuclei - AGN), most of which are believed to be deeply hidden inside large amounts of absorbing gas and inconspicuous at virtually all other wavelengths.
-
Upload
independent -
Category
Documents
-
view
1 -
download
0
Transcript of The XMM-Newton serendipitous survey - IV. Optical identification of the XMM-Newton medium...

arX
iv:a
stro
-ph/
0110
269v
2 1
4 N
ov 2
001
Astronomy & Astrophysics manuscript no.(will be inserted by hand later)
The XMM-Newton Serendipitous Survey
II. First results from the AXIS high galactic latitude medium sensitivitysurvey⋆
X. Barcons1, F.J. Carrera1, M.G. Watson2, R.G. McMahon3, B. Aschenbach4, M.J. Freyberg4, K. Page2,M.J. Page5, T.P. Roberts2, M.J.L. Turner2, D. Barret6, H. Brunner7, M.T. Ceballos1, R. Della Ceca8, P.
Guillout9, G. Hasinger4,7, T. Maccacaro8, S. Mateos1, C. Motch9, I. Negueruela9, J.P. Osborne2, I.Perez-Fournon10, A. Schwope7, P. Severgnini11, G.P. Szokoly7, N.A. Webb6, P.J. Wheatley2, and D.M.
Worrall12
1 Instituto de Fısica de Cantabria (CSIC-UC), 39005 Santander, Spain2 Department of Physics and Astronomy, University of Leicester, LE1 7RH, UK3 Institute of Astronomy, Madingley Road, Cambridge CB3 0HA, UK4 Max-Planck Institut fur Extraterrestriche Physik, Postfach 1312, 85741 Garching, Germany5 Mullard Space Science Laboratory, UCL, Holmbury St Mary, Dorking, Surrey RH5 6NT, UK6 Centre d’Etude Spatiale des Rayonnements, 9 Avenue du Colonel Roche, 31028 Toulouse Cedex 04, France7 Astrophysikalishes Institut Potsdam, An der Sternwarte 16, 14482 Potsdam, Germany8 Osservatorio Astronomico di Brera, via Brera 28, 20121 Milano, Italy9 Observatoire Astronomique de Strasbourg, 11 rue de l’Universite, 67000 Strasbourg, France
10 Instituto de Astrofısica de Canarias, 38200 La Laguna, Tenerife, Spain11 Dipartimento di Astronomia e Scienza dello Spazio, Universita di Firenze, Largo E. Fermi 5, 50125 Firenze,
Italy12 Department of Physics, University of Bristol, Royal Fort, Tyndall Avenue, Bristol, BS8 1TL, UK
2 November 2001
Abstract. We present the first results on the identifications of a medium sensitivity survey (X-ray flux limit2 × 10−14 erg cm−2 s−1 in the 0.5-4.5 keV band) at high galactic latitude (| b |> 20◦) carried out with theXMM-Newton X-ray observatory within the AXIS observing programme. This study is being conducted as partof the XMM-Newton Survey Science Centre activities towards the identification of the sources in the X-rayserendipitous sky survey. The sample contains 29 X-ray sources in a solid angle of 0.26 deg2 (source density113 ± 21 sources deg−2), out of which 27 (93%) have been identified. The majority of the sources are broad-lineAGN (19), followed by narrow emission line X-ray emitting galaxies (6, all of which turn out to be AGN), 1nearby non-emission line galaxy (NGC 4291) and 1 active coronal star. Among the identified sources we find 2broad-absorption line QSOs (z ∼ 1.8 and z ∼ 1.9), which constitute ∼ 10% of the AGN population at this fluxlevel, similar to optically selected samples. Identifications of a further 10 X-ray sources fainter than our surveylimit are also presented.
Key words. X-rays:general, galaxies, stars; Galaxies: active
1. Introduction
The XMM-Newton observatory, the second cornerstoneof the Horizon 2000 science programme of the EuropeanSpace Agency has been carrying out science operationssince early 2000. Thanks to its high collecting area, large
Send offprint requests to: X. Barcons, e-mail:[email protected]
⋆ Based on observations obtained with XMM-Newton, anESA science mission with instruments and contributions di-rectly funded by ESA Member States and the USA (NASA)
field of view and moderate angular and spectral resolutionXMM-Newton is the most powerful observatory in hardX-rays (photon energy > 2 keV), opening an almost un-explored window to the Universe (Jansen et al. 2001). Thesensitivity to hard X-rays (not attained by previous mis-sions like Einstein and ROSAT ) allows the detection andstudy of the most energetic objects in the Universe (ActiveGalactic Nuclei - AGN), most of which are believed to bedeeply hidden inside large amounts of absorbing gas andinconspicuous at virtually all other wavelengths.

2 X. Barcons et al: AXIS medium survey
During science observations (with exposure time over∼ 10 ks) with the EPIC cameras operating in “FullFrame” mode (Turner et al. 2001; Struder et al. 2001)XMM-Newton is discovering∼ 30−150 new X-ray sources,which add to the XMM-Newton serendipitous survey at anexpected rate of ∼ 50000 new sources per year. The XMM-Newton Survey Science Centre (SSC) was appointed byESA to exploit scientifically the XMM-Newton serendipi-tous survey for the benefit of the scientific community andas a major legacy of XMM-Newton to future generations.This is being tackled by the SSC consortium in terms of amostly ground-based optical follow-up and identification(XID) programme.
The XID programme has been described in detailin Watson et al. (2001). Briefly, its implementation hasbeen divided into two parts: a core programme whichwill identify – spectroscopically – significant samples ofsources at X-ray flux limits around ∼ 10−13 erg cm−2 s−1
(bright sample), ∼ 10−14 erg cm−2 s−1 (medium sample)and ∼ 10−15 erg cm−2 s−1 (faint sample) covering a rangeof galactic latitudes, and an imaging programme aiming atproviding deep optical/infrared images in several coloursof a large number of XMM-Newton fields to facilitate sta-tistical identifications of the serendipitous sources.
AXIS (“An XMM-Newton International Survey”)1
forms the backbone of the XID programme by provid-ing the ground-based resources that are essential for theexploitation of the XMM-Newton serendipitous sky sur-vey. Besides making a first and major contribution tothe XID programme, AXIS will define the quality stan-dard and will guide future steps in the implementation ofthe XID programme. AXIS has been conceived and de-signed to make optimal use of the available instrumenta-tion on the telescopes of the Observatorio del Roque de losMuchachos. AXIS has been awarded a total of 85 observ-ing nights spread over the period April 2000 - April 2002on the 4 larger telescopes of the Observatorio del Roquede Los Muchachos: the 2.5m Isaac Newton Telescope(INT), the 2.5m Nordic Optical Telescope (NOT), the3.5m Telescopio Nazionale Galileo (TNG) and the 4.2mWilliam Herschel Telescope (WHT).
In this paper we report on the first results obtainedin the AXIS medium sensitivity survey at high galac-tic latitude. X-ray sources serendipitously found in twoXMM-Newton observations (field names G133-69 Pos 2and Mkn 205) have been studied and followed up down toa 0.5-4.5 keV flux of 2 × 10⁻¹⁴ erg cm−2 s−1. The surveyreaches a source density in excess of 100 sources deg−2,which is appropriate for spectrocopic follow up using fi-bre spectroscopy. Our survey is therefore shallower thanthe XMM-Newton Lockman Hole survey (Hasinger et al.2001) and the Chandra deep surveys (Mushotzky et al.2000; Barger et al. 2001; Giacconi et al. 2001). The surfacedensity reached is, however, similar to that of the so-calledRosat Deep Survey (Boyle et al. 1994) and deeper than theRIXOS survey (Mason et al. 2000).
1 See http://www.ifca.unican.es/˜xray/AXIS
Fig. 1. Solid angle surveyed as a function of source flux.
Although we are still dealing with a small number ofsources (29) the sample presented here provides a flavourof the dominant X-ray source populations at high galacticlatitude down to that flux level. The paper also describesthe observational techniques that we are following in theAXIS project to build up larger source catalogues at var-ious flux levels and galactic latitudes.
2. The X-ray data
2.1. XMM-Newton observations
The identifications presented in this paper correspond toX-ray sources serendipitously found in 2 XMM-Newtonimages (G133-69 Pos 2 and Mkn 205). G133-69 Pos 2 wasobserved as a Guaranteed Time observation to probe thegalactic halo using X-ray shadows. It consists of a singledata set totalling 16 ks of good exposure time in full framemode. The Mkn 205 field was observed as a calibrationobservation, and consists of 3 exposures of 17 ks each.One of these is in large-window mode (for the EPIC pncamera) which only covers half of the field of view. Theremaining 2 data sets are in full window mode, and wemerged them. One of these was free of particle backgroundflares, but the other one was strongly contaminated andonly < 3 ks of it survived the cleaning process. Details ofthe X-ray observations are reported in Table 1.
Both of these observations have been processedthrough the pipeline processing system2 (Watson etal. 2001), using tasks from the XMM-Newton ScienceAnalysis Software (SAS) v5.1. Subsequent analyses werealso performed using the same version of the SAS. Allevent patterns (single, double and triple) were kept whenconstructing the event files. This provides maximum sen-sitivity at high photon energies but the fraction of non-X-ray events rejected is consequently smaller. When flaringintervals are removed from the event lists, higher S/N isusually achieved by keeping all patterns.
The pipeline processing source searching procedure hasbeen adopted. We now sketch briefly its main features. We
2 See http://xmmssc-www.star.le.ac.uk
X. Barcons et al: AXIS medium survey 3
Table 1. Details of XMM-Newton observations.
Target G133-69 Pos 2 Mkn 205
Observation date 03-07-2000 06-05-2000XMM-Newton Obsid 0112650501 0124110101RA(J2000) 01:04:00 12:21:44DEC(J2000) -06:42:00 75:18:37b(deg) -69.35 +41.67Clean exposure time (ks)a 15.86 18.97pn Filter Thin MediumNHI 5.17 × 10²⁰ 2.81 × 10²⁰
Conversion factorb 2.47 × 10⁻¹² 2.39 × 10⁻¹²
a This corresponds to the maximum of the exposure map inthe pn imageb The conversion factor is the ratio between flux in erg cm−2 s−1
and pn count rate, both in the 0.5-4.5 keV band.
Fig. 2. Log N-Log S X-ray flux relation for this samplein the 0.5-4.5 keV band (filled circles). For comparison weoverlay source counts from ROSAT (continuous curve)from Hasinger et al. (1998) converted with a Γ = 2 spec-trum, and from ASCA (Ueda et al. 1999) and Chandra(Mushotzky et al. 2000) in the 2-10 keV band (merged to-gether, dotted curve), converted with a Γ = 1.6 power-lawspectrum.
have used data from EPIC-pn because its sensitivity isdouble that of the invidual EPIC-MOS detectors. Imageswere extracted in the following 4 spectral bands: 0.5-2 keV,2-4.5 keV, 4.5-7.5 keV and 7.5-10 keV. Exposure maps,which account for vignetting, CCD gaps, bad columns andbad pixels, were constructed for each band. The combina-tion of the 4 images was used to search for sources with anoverall likelihood above 16. This corresponds to a proba-bility of a source being spurious of ∼ 8 × 10⁻⁵, i.e., up toone spurious detection per image with that likelihood.
First, a simple sliding box algorithm was applied tomask out the brightest sources and to spline-fit the back-ground in each CCD chip. The sliding box algorithm wasapplied again to search for sources significant against thefitted background. Finally a maximum likelihood fit of thesource profiles to the images, simultaneous to all bands,was performed to produce a final source list with exposurecorrected count rates in each band. Sources were sorted in
terms of the flux in the 0.5-4.5 keV flux. Table 1 lists thecountrate to flux conversion factors for both fields whichwe derived assuming a standard Γ = 1.7 power law ab-sorbed by the galactic column. Fluxes are corrected forgalactic absorption. We experimented with variations inthe spectral shape of the sources and found changes ofup to 15% only in the conversion factor when varying thespectral index from Γ = 1.5 to Γ = 2. That was expectedas the 0.5-4.5 keV band was selected because of the fairlyflat sensitivity of XMM-Newton accross the whole band.As there are still issues regarding the processing and cal-ibration of EPIC data (out-of-time events, multiple pat-tern events, etc.), our listed fluxes have to be understoodmodulo these uncertainties.
For each 0.5-4.5 keV image we also extracted a sen-sitivity map (using the SAS task esensmap) showing theminimum count rate that a point source must have to bedetectable by the algorithm used, at every position of thedetector. We choose a likelihood limit of 10 (as opposedto 16) since we are dealing with a single band. This givesa probability ∼ 4.5 × 10⁻⁵ for a spurious detection in asingle band (again ∼ 1 spurious detection per image), sim-ilar to the multi-band source search. This map takes intoaccount vignetting, inter-CCD gaps and bad pixels andcolumns. We then computed the total solid angle where asource brighter than any given flux limit would have beendetected. In the case of the Mkn 205 we further excluded acircle of radius 2 arcmin around the target. The field alsohappens to contain an extended source which we identi-fied as the galaxy NGC 4291. The extent of this X-raysource effectively masks out a circle of 1.5 arcmin radiusaround it where the much enhanced background due toextended X-ray emission prevents us from detecting anyfurther X-ray sources. We therefore included this galaxyas a serendipitous source in our survey but ignored anyother possible sources within a circle of 1.5 arcmin radiusaround it. Fig. 1 shows the solid angle surveyed at eachflux level. At 2 × 10⁻¹⁴ erg cm−2 s−1, which is our surveylimit, we have surveyed 0.26 deg2.
2.2. X-ray sources
The source-searching algorithms produced a number ofsources in each field (37 and 52 in the G133-69 Pos 2and Mkn 205 data respectively), some as faint as 5 ×10⁻¹⁵ erg cm−2 s−1 (all fluxes refer to the 0.5-4.5 keVband). The faintest of these sources have likelihood de-tections very close to our threshold. When truncating ata flux of 2 × 10⁻¹⁴ erg cm−2 s−1 a total of 12 and 17 X-ray sources were found in the G133-69 Pos 2 and Mkn205 fields respectively. Two sources in the Mkn 205 fieldwhose positions fall in CCD gaps have already been ex-cluded from the list. The sensivity of both fields wasclearly enough to ensure completeness at that flux level,i.e., sources significantly fainter than our survey limit weredetected in each field. Care was taken to visually screenthe source lists in order to clean it from artifacts derived

4 X. Barcons et al: AXIS medium survey
Table 2. Astrometric correction to pipeline processedXMM-Newton data, derived from cross-correlation withthe i’-band optical images
Field ∆RA(′′) ∆DEC(′′) Rotation (deg)
Mkn 205 −2.67 +3.09 −0.16G133-69 Pos 2 −0.73 +0.63 −0.35
from the proximity of inter-CCD gaps, bad columns orother cosmetic effects.
The X-ray source list was then astrometrically cor-rected. The pipeline-processed data provides astrometrydrawn from the attitude and orbit control system (AOCS),which we believe to be good to within a few arcsec. To fur-ther improve that, we cross-correlated the source positionsof the X-ray sources obtained with a list of optical sourcesobtained from the i’-band images (see Sect. 3.1) using theSAS task eposcorr. To this goal, we used all detected X-ray sources and all detected optical sources in the field tomaximize the number of matches. The situation is sum-marized in Table 2, were we show that significant astro-metric shifts were still present in both data sets. One pointthat needs stressing is that the number of X-ray to opti-cal matches is much larger when we use the full catalogueof optical sources obtained in our wide-field images thanif we used, e.g., the USNO A2 (Monet et al. 1998) cata-logued sources. In that case we would be restricted to ∼ 10matches per field, with the corresponding uncertainty inthe astrometric correction parameters. We further discussthe accuracy of the astrometric solution in the X-ray im-ages in Sect. 5.1. Table 3 lists the X-ray sources brighterthan our survey limit with the astrometrically correctedpositions.
In order to gain X-ray spectral information on the X-ray sources, we used the count rates in individual bandsto construct the following hardness ratios:
HR1 =C(2 − 4.5 kev) − C(0.5 − 2 kev)
C(2 − 4.5 kev) + C(0.5 − 2 kev)
and
HR2 =C(4.5 − 10 kev) − C(2 − 4.5 kev)
C(4.5 − 10 kev) + C(2 − 4.5 kev)
Note that these are computed using the exposure-mapcorrected count-rates, so that energy dependent vignettingis approximately corrected. All sources in the sample se-lected here had positive count rates in all bands.Also, notethat the typical number of counts per source is fairly smalland therefore a detailed individual spectral analysis ofeach source is difficult and beyond the scope of this paper.Table 3 contains the basic X-ray data on these sources.
In Fig. 2 we plot the integrated source counts derivedfrom this survey. The source density at the survey limit is113±21 sources deg−2. This curve is to be compared withthe ROSAT source counts (Hasinger et al. 1998) which weconverted to our 0.5-4.5 keV band by using a Γ = 2 spec-trum which is consistent with the average value of HR1
(see below). Our source counts are ∼ 60% higher than theROSAT ones at the survey limit. Choosing a conversionfactor corresponding to a power-law with spectral indexΓ = 1.7 just brings the ROSAT curve up by ∼ 15%, stillsignificantly below our source counts.
We also compare the source counts with those de-rived in the 2-10 keV from ASCA (Ueda et al. 1999) andChandra (Mushotzky et al. 2000). Note that the Baldiet al. (2001) source counts, based on XMM-Newton data,are consistent with these earlier work. Here a conversionfactor for Γ = 1.6 has been applied, which is consistentwith the value of HR2 (see below). Our source counts fallmodestly below (17%, only ∼ 1 sigma significant) thosein the harder band at the survey limit. It is clear that byselecting in the 0.5-4.5 keV band we find a large fractionof the sources that ROSAT missed, but we may still bemissing a small fraction of the hard sources detected inthe 2-10 keV band.
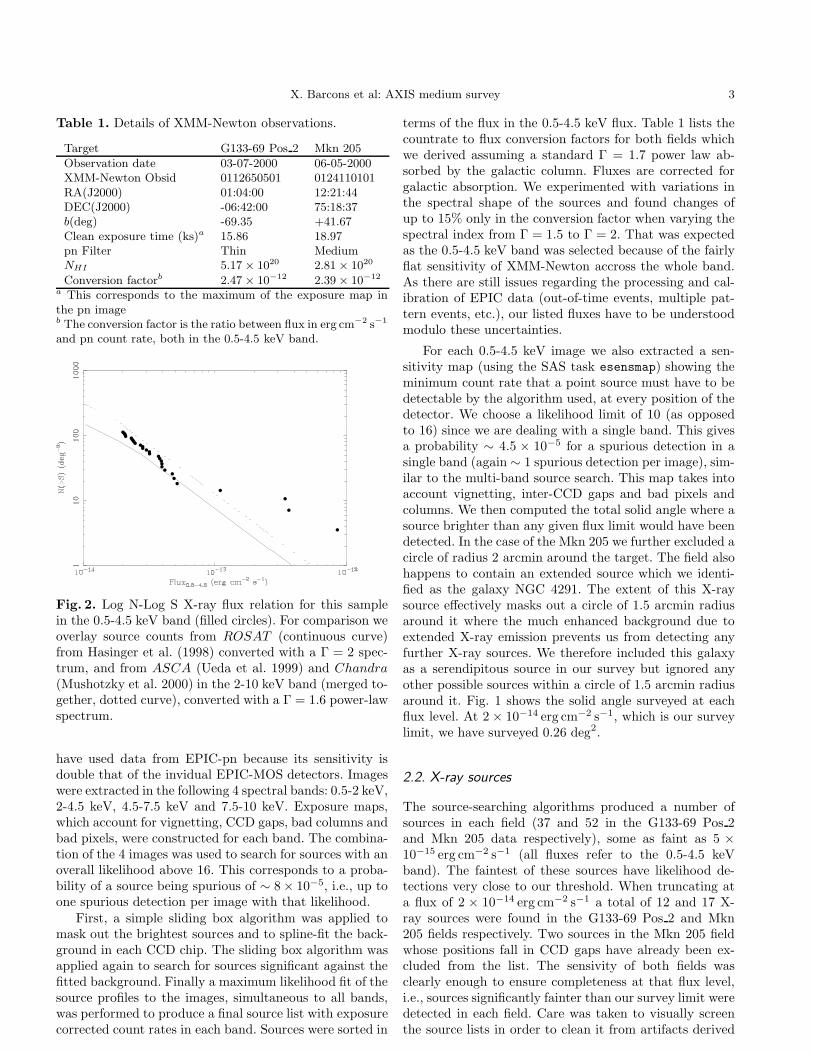
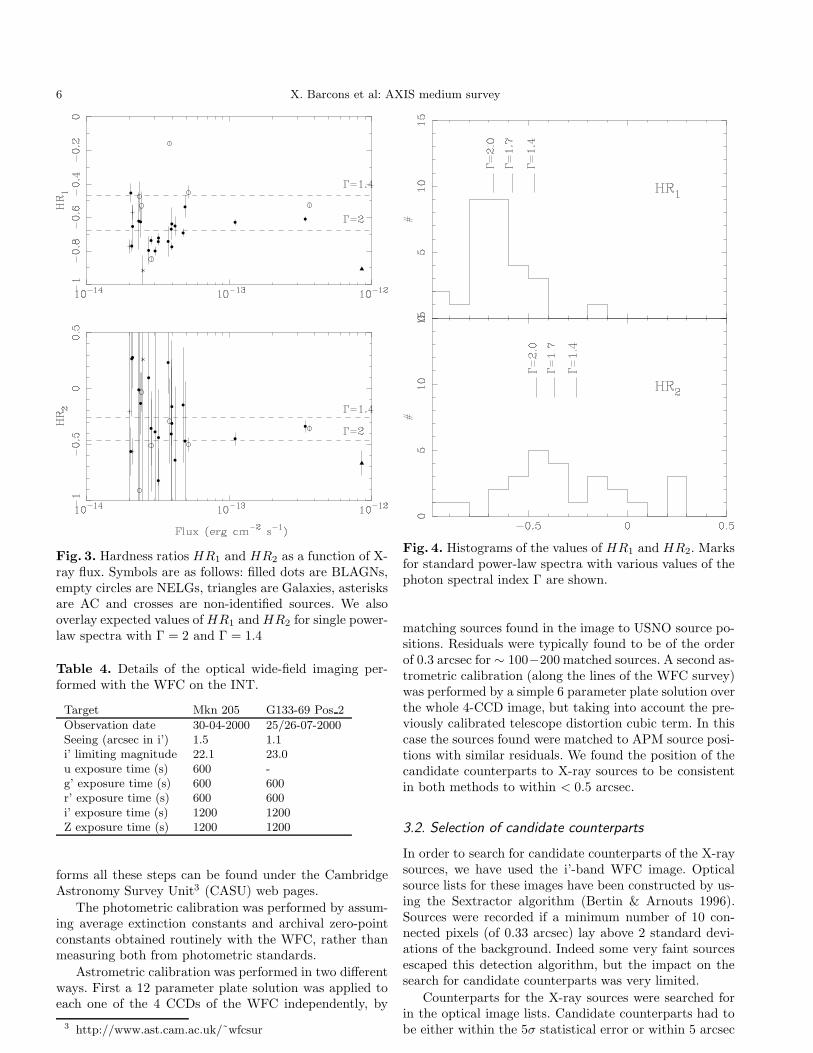
Fig. 3 shows the hardness ratios for the sources as afunction of flux. We must caution that although the twofields under consideration have different Galactic absorb-ing columns and furthermore have been observed with dif-ferent EPIC-pn filters (thin and medium, see Table 1), theeffect of both of these facts on the hardness ratios (par-ticularly HR1) is completely negligible. No obvious trendof the source spectra is seen with source flux. The so-called spectral paradox (Fabian & Barcons 1992), i.e., thesource’s spectra being steeper than the X-ray backgroundspectrum (Γ ∼ 1.4), is therefore not obviously solved atthis flux level, i.e., we do not find a significant sample ofsources that have an X-ray spectrum close to that of theX-ray background. This is also revealed by the histogramsof HR1 and HR2 which are shown in fig. 4 together withthe expected values for various power laws with galacticabsorption. The weighted averages of the hardness ratiosare 〈HR1〉 = −0.69±0.03 and 〈HR2〉 = −0.37±0.03, con-sistent with a fairly steep X-ray spectrum (Γ = 1.6− 2.0).Further details on the X-ray spectra of the different sourceclasses are given in Sect. 5.2.
3. Optical observations
3.1. Imaging
Both target fields were observed with the Wide-FieldCamera (WFC) on the 2.5m INT telescope in dark time.Table 4 summarizes the main features of the images ob-tained. The WFC covers virtually all the field of view ofEPIC, if centered optimally. In our case, all sources listedin Table 3 were imaged.
The WFC images were reduced using standard tech-niques including de-bias, non-linearity correction, flatfielding and fringe correction (in i’ and Z). Bias framesand twilight flats obtained during the same observingnights were used, but for the fringe correction contem-poraneous archival i’ and Z fringe frames were utilised.Information on the WFC pipeline procedures, which per-

X.B
arc
ons
etal:
AX
ISm
ediu
msu
rvey
5
Table 3. X-ray sources serendipitously discovered in the XMM-Newton fields under study
Source name RAaX (J2000) DECa
X (J2000) Perrb Fluxc HR1 HR2 Comments
XMMU J010316.7-065137 01:03:16.72 -06:51:37.28 1.99 2.32 ± 0.43 −0.62 ± 0.17 −0.01 ± 1.00XMMU J010327.3-064643 01:03:27.30 -06:46:43.69 0.80 4.15 ± 0.37 −0.15 ± 0.01 −0.29 ± 0.37 Close to pn noisy columnXMMU J010328.7-064633 01:03:28.71 -06:46:33.34 1.30 2.72 ± 0.31 −0.79 ± 0.08 +0.09 ± 1.00 Close to pn noisy columnXMMU J010333.8-064016 01:03:33.86 -06:40:16.07 0.82 2.65 ± 0.24 −0.53 ± 0.08 −0.03 ± 0.17XMMU J010339.8-065224 01:03:39.87 -06:52:24.74 0.96 3.73 ± 0.39 −0.74 ± 0.08 +0.23 ± 0.27XMMU J010355.6-063710 01:03:55.62 -06:37:10.48 0.82 2.56 ± 0.22 −0.47 ± 0.08 −0.91 ± 1.00XMMU J010400.9-064949 01:04:00.96 -06:49:49.37 0.96 2.70 ± 0.27 −0.91 ± 0.09 +0.25 ± 1.00XMMU J010410.5-063926 01:04:10.56 -06:39:26.46 0.62 4.17 ± 0.28 −0.65 ± 0.05 −0.64 ± 0.65XMMU J010420.9-064701 01:04:20.91 -06:47:01.46 0.89 2.39 ± 0.25 −0.62 ± 0.09 −0.13 ± 0.27XMMU J010430.1-064456 01:04:30.13 -06:44:56.07 0.72 4.90 ± 0.36 −0.53 ± 0.06 −0.46 ± 0.53XMMU J010437.5-064739 01:04:37.56 -06:47:39.29 1.15 2.29 ± 0.30 −0.65 ± 0.12 +0.27 ± 0.27XMMU J010444.6-064833 01:04:44.68 -06:48:33.42 1.16 3.96 ± 0.43 −0.63 ± 0.09 −0.16 ± 0.34XMMU J121819.4+751919 12:18:19.48 +75:19:19.61 1.29 3.17 ± 0.41 −0.79 ± 0.02 −0.38 ± 1.00
XMMU J122017.9+752212 12:20:17.98 +75:22:12.17 0.28 89.6 ± 0.72 −0.90 ± 0.01 −0.66 ± 0.11 Extendedd
XMMU J122048.4+751804 12:20:48.43 +75:18:04.10 0.69 2.97 ± 0.24 −0.73 ± 0.02 −0.35 ± 0.32XMMU J122051.4+752821 12:20:51.45 +75:28:21.84 1.26 2.07 ± 0.30 −0.76 ± 0.03 +0.26 ± 0.51XMMU J122052.0+750529 12:20:52.02 +75:05:29.44 0.40 36.0 ± 1.31 −0.60 ± 0.01 −0.33 ± 0.05XMMU J122111.2+751117 12:21:11.29 +75:11:17.19 0.54 4.12 ± 0.31 −0.66 ± 0.01 −0.40 ± 0.66XMMU J122120.5+751616 12:21:20.56 +75:16:16.10 0.57 2.98 ± 0.23 −0.84 ± 0.01 −0.50 ± 0.41XMMU J122135.5+750914 12:21:35.59 +75:09:14.28 0.63 4.99 ± 0.36 −0.69 ± 0.02 −0.14 ± 0.51XMMU J122143.8+752235 12:21:43.88 +75:22:35.32 0.77 2.20 ± 0.21 −0.57 ± 0.04 −0.56 ± 0.11XMMU J122206.4+752613 12:22:06.48 +75:26:13.78 0.21 38.4 ± 0.96 −0.52 ± 0.01 −0.35 ± 0.02XMMU J122242.6+751434 12:22:42.69 +75:14:34.96 0.75 2.15 ± 0.21 −0.45 ± 0.05 −0.56 ± 0.21 Close to pn CCD gapXMMU J122258.1+751934 12:22:58.11 +75:19:34.31 0.55 5.44 ± 0.36 −0.44 ± 0.03 −0.49 ± 0.06 Close to pn CCD gapXMMU J122318.5+751504 12:23:18.58 +75:15:04.08 0.55 3.35 ± 0.31 −0.72 ± 0.02 −0.43 ± 0.42XMMU J122344.7+751922 12:23:44.79 +75:19:22.18 0.60 3.34 ± 0.24 −0.74 ± 0.02 −0.82 ± 0.28XMMU J122351.0+752227 12:23:51.02 +75:22:27.99 0.36 11.6 ± 0.56 −0.62 ± 0.01 −0.44 ± 0.05XMMU J122435.7+750812 12:24:35.77 +75:08:12.02 1.36 2.10 ± 0.37 −0.77 ± 0.04 −0.20 ± 1.00XMMU J122445.5+752224 12:24:45.53 +75:22:24.80 0.88 4.16 ± 0.42 −0.77 ± 0.02 −0.31 ± 0.73
Notes to Table: a Position of the X-ray source after astrometric correction; b Position error in arcsec (statistical only); c Flux in the 0.5-4.5 keV band in units of10−14 erg cm−2 s−1; d The flux for this source has been estimated from aperture photometry.
6 X. Barcons et al: AXIS medium survey
Fig. 3. Hardness ratios HR1 and HR2 as a function of X-ray flux. Symbols are as follows: filled dots are BLAGNs,empty circles are NELGs, triangles are Galaxies, asterisksare AC and crosses are non-identified sources. We alsooverlay expected values of HR1 and HR2 for single power-law spectra with Γ = 2 and Γ = 1.4
Table 4. Details of the optical wide-field imaging per-formed with the WFC on the INT.
Target Mkn 205 G133-69 Pos 2
Observation date 30-04-2000 25/26-07-2000Seeing (arcsec in i’) 1.5 1.1i’ limiting magnitude 22.1 23.0u exposure time (s) 600 -g’ exposure time (s) 600 600r’ exposure time (s) 600 600i’ exposure time (s) 1200 1200Z exposure time (s) 1200 1200
forms all these steps can be found under the CambridgeAstronomy Survey Unit3 (CASU) web pages.
The photometric calibration was performed by assum-ing average extinction constants and archival zero-pointconstants obtained routinely with the WFC, rather thanmeasuring both from photometric standards.
Astrometric calibration was performed in two differentways. First a 12 parameter plate solution was applied toeach one of the 4 CCDs of the WFC independently, by
3 http://www.ast.cam.ac.uk/˜wfcsur
Fig. 4. Histograms of the values of HR1 and HR2. Marksfor standard power-law spectra with various values of thephoton spectral index Γ are shown.
matching sources found in the image to USNO source po-sitions. Residuals were typically found to be of the orderof 0.3 arcsec for ∼ 100−200 matched sources. A second as-trometric calibration (along the lines of the WFC survey)was performed by a simple 6 parameter plate solution overthe whole 4-CCD image, but taking into account the pre-viously calibrated telescope distortion cubic term. In thiscase the sources found were matched to APM source posi-tions with similar residuals. We found the position of thecandidate counterparts to X-ray sources to be consistentin both methods to within < 0.5 arcsec.
3.2. Selection of candidate counterparts
In order to search for candidate counterparts of the X-raysources, we have used the i’-band WFC image. Opticalsource lists for these images have been constructed by us-ing the Sextractor algorithm (Bertin & Arnouts 1996).Sources were recorded if a minimum number of 10 con-nected pixels (of 0.33 arcsec) lay above 2 standard devi-ations of the background. Indeed some very faint sourcesescaped this detection algorithm, but the impact on thesearch for candidate counterparts was very limited.
Counterparts for the X-ray sources were searched forin the optical image lists. Candidate counterparts had tobe either within the 5σ statistical error or within 5 arcsec
X. Barcons et al: AXIS medium survey 7
from the position of the X-ray source. This last criterionwas used to accommodate any residual systematics in theastrometric calibration of the X-ray EPIC images.
The result of this search was very encouraging. Out ofthe 29 X-ray sources, 24 showed a single candidate coun-terpart, 4 showed two candidate counterparts and the re-maining source showed no or very faint candidate counter-part in the i’-band image. The two basic conclusions to ex-tract from this are that the selection of filter and depth ofthe images are appropriate to this sample and that the X-ray positional errors provided by XMM-Newton are goodenough to single out a unique counterpart for the vastmajority of the high-galactic latitude sources.
3.3. Spectroscopic observations
Candidate counterparts were spectroscopically observedwith various spectrographs in order to identify the natureof the sources. Table 5 lists the relevant parameters ofthe spectroscopic instrumental setup used. At the sourcedensity we are dealing with (∼ 100 deg−2) fibre spectro-graphs are likely to be the most efficient. However, we hada very limited amount of nights with this instrumentationand furthermore the fibres used were too large (2.7 arcsecdiameter) to detect the faintest objects. Therefore a signif-icant fraction of the sources were identified with long-slitspectrographs.
As pointed out before, the vast majority of X-raysources have a unique candidate counterpart. For the caseswhere there were two candidate counterparts we observedthe brightest one (which happened also to be the closestone to the X-ray source) which invariably turned out tobe a plausible identification (i.e. some sort of AGN).
The spectra were reduced using standard IRAF tech-niques. These included de-biasing, flat fielding, illumina-tion correction (whenever a twilight flat was available),cosmic ray rejection, spectral extraction and backgroundsubtraction, arc lamp wavelength calibration and flux cal-ibration by using spectrophotometric standards. The fluxcalibration does not have to be understood in absoluteterms, as significant fractions of the light escaped the cor-responding apertures and no attempt has been made tocorrect for this. Nevertheless the overall spectral shape, ifnot the normalisation, should be approximately correct.That is especially true for the long-slit spectra which inthe majority of the cases were obtained with the slit ori-ented in parallactic angle.
The case of fibre spectroscopy deserves further com-ment. The relative fibre throughput was obtained by ob-serving in offset sky positions within the same fibre con-figuration under use. In the proper on-target observations,the sky was subtracted by combining all the sky fibres thatwe placed in regions free from bright sources. We appliedthe same procedure to the offset sky observations, whichallowed us to tweak the relative sensitivity of the fibresby making sure that no significant residuals were left inthese spectra after the sky was subtracted. In a couple of
iterations we found a satisfactory solution for the relativefibre sensitivity and then we used this to sky-subtract thetarget apertures. It must be stressed that sky lines arevery difficult to subtract at this spectral resolution andtherefore residuals will unavoidably be present in the fi-bre spectra.
We must emphasize that fibre spectroscopy, even withthe large fibre aperture of 2.7 arcsec, was very efficientin identifying the optically brightest conterparts in theMkn 205 field. We allocated a total of 26 fibres on opticalsources in a single setup, which included several corre-sponding to X-ray sources below the flux cutoff. We suc-ceeded in identifying 8 X-ray sources above the flux cutoffand a futher 3 below it in a total time of 2.5 hours in-cluding all overheads. This is at least twice as efficient aslong-slit spectroscopy on the same telescope.
This high efficiency in the fibre spectroscopy relied,however, on two basic facts: the night was dark (so thesky background and noise were as low as possible) andthe number of X-ray sources with a single candidate coun-terpart was very large. It must be pointed out that fibrespectrographs do not usually allow to place fibres withinseveral arcsec at best, and therefore it is not possible toobserve different candidate counterparts of the same X-raysource within the same fibre setup.
4. Identification of the X-ray sources
Table 6 lists the optical identification of the sources to-gether with their optical magnitudes. The classificationwe have chosen includes several source classes: Broad-Line Active Galactic Nuclei (BLAGN), Narrow EmissionLine Galaxies (NELG, which invariably turned out tobe Narrow-Line AGN), non-emission line galaxies (Gal),Active Coronal stars (AC), stars without signs of activity(STAR) and clusters of galaxies (Clus).
Finding charts and spectra of these sources canbe found under the AXIS programme web pages(http://www.ifca.unican.es/xray/AXIS). Here we addsome notes on individual objects
XMMU J010327.3-064643 is the faintest optical source(in r’, i’ and Z) with hints of narrow emission lines. Wehave binned the spectrum into bins of 600 A each, andapplied a photometric redshift technique using a set ofgalaxy templates as in Fernandez-Soto, Lanzetta & Yahil(1999). The minimum χ2 happens at z = 1.01, which al-lows us to interpret an apparently narrow emission line asCIII], and a dubious [OII]. We therefore tentatively clas-sify this source as a NELG, although its high luminosity(1.8 × 1044 erg s−1) would promote it to QSO2. The opti-cal colours of this source do indeed correspond to a QSOor to a starforming galaxy (see fig. 6, where this source isthe empty circle at the bottom of the graph). The clas-sification and redshift of this source are at present veryuncertain.
XMMU J122258.1+751934 is a faint source, with a de-tected but weak emission line that we believe to be [OII]and dubious [OIII] doublet at z=0.257. Since the spec-

8 X. Barcons et al: AXIS medium survey
Table 5. List of spectroscopic setups relevant to this sample.
Telescope Instrument Spectral Slit width Spectral Commentsrange (A) (arcsec) resolutiona (A)
WHT AUTOFIB2/WYFFOS 3900-7100 2.7b 6-7 FibreWHT ISIS 3500-8500 1.2-2.0 3.0-3.3 Long slitTNG DOLORES 3500-8000 1.0-1.5 14-15 Long slit
a Measured from unsaturated arc linesb Width of individual fibres
0.0
0.5
1.0
1.5
2.0
2.5
3.0
3.5
14.0 15.0 16.0 17.0 18.0 19.0 20.0 21.0 22.0 23.0i'
g'-i'
NELG
BLAGN
AC
Fig. 5. Optical colour g′−i′ as a function of i’-magnitude.Symbols as in 3
trum is very noisy, we applied the photometric redshifttechnique to the binned spectrum. The minimum χ2 isindeed found at z ∼ 0.3.
XMMU J122120.5+751616 appears to have a very bluespectrum, but the Hβ line, which is weak, does not appearto be broad. On the other hand it has strong [NeV], [OII]and [OIII] doublet. Therefore we have classified it as aNELG.
XMMU J010328.7-064633 and XMMU J010316.7-065137 appear to be BAL QSOs. They will be discussedin Sect. 5.4
Fig. 5 shows the g′ − i′ colour of the identified sourcesas a function of their i’-magnitude. As expected, BLAGNsare usually bluer than the NELGs where the optical lightis dominated by the host galaxy rather than by the activenucleus.
To further explore the optical colours, we plot in fig.6 the r′ − i′ versus g′ − r′ optical colour-colour diagramfor the identified sources. We overlay median colours forQSOs, as derived from the Sloan Digitized Sky Survey(Richards et al. 2001), in the redshift range z = 0− 3 andfor E/S0 galaxies, as derived from the Coleman, Wu &Weedman (1980) template, in the redshift range z = 0−1.For clarity we do not show the expected colours for star-forming galaxies as they are mostly coincident with thoseof QSOs, but they can follow the track marked by theE/S0 colours by adding increasing amounts of reddening.The influence of cosmological Lyman-α absorption has notbeen included, as it is only relevant in the g’-band for
0.0
0.2
0.4
0.6
0.8
1.0
1.2
1.4
1.6
-0.5 0.0 0.5 1.0 1.5 2.0 2.5g'-r'
r'-i'
NELG
BLAGN
AC
E/S0 templ
SDSS QSO
Fig. 6. Optical colour-colour diagram. Symbols as in 3.The continuous line represents the colours of E/S0 galaxiesin the redshift range z = 0 − 1 and the dashed line themedian colours of SDSS QSOs in the redshift range z =0 − 3.
redshifts z > 3. Clearly, the X-ray sources classified asBLAGNs have optical colours as expected for QSOs, andthe X-ray sources identified as NELGs fall in the regionwhere the galaxies lie (either E/S0 or more likely reddenedstarforming galaxies). This implies again that in NELGsmost of the optical light we see comes from the host galaxy,unlike the X-ray emission which comes from the nucleus.
4.1. Additional identifications
Besides the identifications corresponding to the completesample of X-ray selected sources down to an X-ray flux of2 × 10−14 erg cm−2 s−1, we have identified a few sourcesfainter than these. These 10 additional sources are notpart of the sample considered here, but still we list theiridentifications to help other researchers in possible identi-fication work of fainter sources. These identifications arelisted in Table 7.
5. Discussion
5.1. Astrometric accuracy in the X-ray source list
With the sample of X-ray sources whose optical counter-parts have been positively identified (including the onesbelow our flux limit), we check how good the astrome-try of the XMM-Newton data was. We then analyzed the

X.B
arc
ons
etal:
AX
ISm
ediu
msu
rvey
9
Table 6. Optical identifications of the X-ray sources. Under the last column we quote the main spectral features detected in the spectra.
Source name RAaO (J2000) DECa
O (J2000) u g’ r’ i’ Z Class z Lb44 Comments
XMMU J010316.7-065137 01:03:16.43 -06:51:35.83 19.85 19.23 18.74 18.57 BLAGN 1.914 4.221 CIII], CIV, MgIIXMMU J010327.3-064643 01:03:27.41 -06:46:43.31 22.26 21.86 21.77 21.06 NELG? 1.010? 2.036 CIII]?,[OII]?, [NeV]?XMMU J010328.7-064633 01:03:28.67 -06:46:32.02 20.26 19.81 19.27 19.15 BLAGN 1.820 4.467 SiIV, CIV, CIII], MgIIXMMU J010333.8-064016 01:03:33.88 -06:40:16.21 22.70 21.12 19.76 19.22 NELG 0.692 0.597 [OII],Hǫ?,Hγ,[OIII]XMMU J010339.8-065224 01:03:39.89 -06:52:25.99 21.39 20.65 20.23 19.99 BLAGN 1.128 2.297 [NIII],CIII], MgII,[OII]XMMU J010355.6-063710 01:03:55.67 -06:37:10.88 21.82 21.00 20.48 20.11 NELG? 0.314 0.114 Hβ, [OIII], Hδ, [NeV]?XMMU J010400.9-064949 01:04:01.09 -06:49:50.89 17.08 15.52 15.24 14.16 AC/dMe Ca H&K, Hβ, Hα
XMMU J010410.5-063926 01:04:10.54 -06:39:26.69 19.88 19.47 19.08 19.03 BLAGN 0.630 0.774 MgII, Hγ, Hβ, [OIII]XMMU J010420.9-064701 01:04:20.97 -06:47:01.97 19.71 18.98 18.41 18.34 BLAGN 1.536 2.773 CIV, CIII], MgIIXMMU J010430.1-064456 01:04:30.07 -06:44:56.60 18.77 18.27 18.06 17.96 BLAGN 0.910 1.937 CIII], MgII, [OII], Hγ, [NeV]XMMU J010437.5-064739 01:04:37.55 -06:47:37.23 21.19 20.71 20.24 19.76 BLAGN 2.511 7.248 Lyα, SiIV, CIV?, CIII]XMMU J010444.6-064833 01:04:44.71 -06:48:33.31 20.52 20.32 19.96 19.58 BLAGN 2.256 10.080 Lyα, CIV, CIII]XMMU J121819.4+751919 12:18:19.06 +75:19:22.02 19.53 19.79 19.21 18.96 18.55 BLAGN 2.649 11.209 Lyα, CIV, CIII]XMMU J122017.9+752212 12:20:17.70 +75:22:18.00 12.27c 11.70c Gal 0.0058 0.0013 NGC 4291d
XMMU J122048.4+751804 12:20:48.25 +75:18:07.29 18.41 18.97 18.47 17.96 17.83 BLAGN 1.687 4.181 CIV, CIII], MgIIXMMU J122051.7+752821 12:20:51.73 +75:28:20.67 20.90 22.05 21.33 20.80 BLAGN 0.181 0.030 Hβ, Hγ, Hδ? OII?XMMU J122052.0+750529 12:20:51.27 +75:05:31.62 18.24 18.62 18.20 17.92 17.85 BLAGN 0.646 7.036 [OII],MgIIXMMU J122111.2+751117 12:21:10.62 +75:11:19.39 18.78 19.54 18.79 18.47 18.32 BLAGN 1.259 3.179 EMSS sourcee
XMMU J122120.5+751616 12:21:19.90 +75:16:18.09 20.21 20.90 19.98 19.45 18.85 NELG 0.340 0.156 [OII], [OIII], [NeV]XMMU J122135.5+750914 12:21:34.92 +75:09:15.99 19.84 20.38 19.11 18.32 17.77 BLAGN 0.330 0.246 Hβ, [OIII]XMMU J122143.8+752235XMMU J122206.4+752613 12:22:06.66 +75:26:15.36 20.23 20.03 18.68 17.83 17.41 NELG 0.238 0.975 [OII],[OIII]XMMU J122242.6+751434 12:22:42.69 +75:14:34.68 20.97 21.82 21.13 20.71 19.98 BLAGN 1.065 1.174 MgII, CIII]?XMMU J122258.1+751934 12:22:58.00 +75:19:34.66 22.66 21.66 21.10 NELG? 0.257 0.161 [OII],[OIII]XMMU J122318.5+751504 12:23:18.11 +75:15:04.64 20.27 21.15 20.62 20.24 BLAGN 1.509 3.752 CIII], MgIIXMMU J122344.7+751922 12:23:45.65 +75:19:23.01 20.11 20.69 20.26 19.88 19.53 BLAGN 0.757 0.904 MgII, [NeV]?, [OII]XMMU J122351.0+752227 12:23:50.87 +75:22:28.57 19.51 19.93 19.48 18.76 18.50 BLAGN 0.565 1.718 MgII, [NeV], [OII], Hγ, [OIII]XMMU J122435.7+750812 12:24:35.31 +75:08:10.10XMMU J122445.5+752224 12:24:45.42 +75:22:24.92 19.27 20.16 19.82 19.33 19.36 BLAGN 1.852 7.088 CIV, CIII]
Notes to Table: a Position of the optical source; b Luminosity in the 0.5-4.5 keV rest frame in units of 1044 erg s−1; c B and R magnitudes from de Vaucouleurs et al (1991)and Sandage & Visvanathan (1978) quoted under g’ and r’ respectively; d Identification from Humasson, Mayall & Sandage (1956); e Identification from Stocke et al. (1991)

10
X.B
arc
ons
etal:
AX
ISm
ediu
msu
rvey
Table 7. Additional identifications below 2 × 10⁻¹⁴ erg cm−2 s−1
Source name RAaX (J2000) DECa
X (J2000) Perrb Fluxc RAdO (J2000) DECd
O (J2000) i’ Class z Le44
XMMU J010311.7-064038 01:03:11.79 -06:40:38.25 1.93 0.83 ± 0.24 01:03:11.83 -06:40:39.14 18.98 NELG 0.187 0.133XMMU J010359.8-065318 01:03:59.82 -06:53:18.46 1.95 1.25 ± 0.65 01:03:59.87 -06:53:18.87 20.92 BLAGN 1.270 0.980XMMU J010400.9-063027 01:04:00.98 -06:30:27.36 2.34 1.55 ± 0.30 01:04:01.15 -06:30:28.35 20.09 BLAGN 1.693 2.199XMMU J010402.9-063600 01:04:02.91 -06:36:00.14 1.14 1.51 ± 0.20 01:04:02.84 -06:35:59.70 21.69 BLAGN 0.932 0.629XMMU J010405.5-065359 01:04:05.57 -06:53:59.21 2.45 1.27 ± 0.26 01:04:05.33 -06:53:59.17 21.13 BLAGN 2.821 5.093XMMU J010410.0-063012 01:04:10.06 -06:30:12.92 1.77 1.63 ± 0.72 01:04:10.13 -06:30:12.78 21.13 BLAGN 1.190 1.579XMMU J010411.5-065209 01:04:11.53 -06:52:09.60 2.25 1.56 ± 0.26 01:04:11.40 -06:52:08.86 20.90 BLAGN 1.224 1.138XMMU J010439.3-064629 01:04:39.34 -06:46:29.88 1.60 1.49 ± 0.24 01:04:39.33 -06:46:27.24 20.08 BLAGN 1.620 1.927XMMU J121937.5+751042 12:19:37.57 +75:10:42.96 1.46 1.61 ± 0.28 12:19:37.34 +75:10:43.79 20.77 STARXMMU J122425.4+751818 12:24:25.46 +75:18:18.04 1.34 1.36 ± 0.22 12:24:25.50 +75:18:19.74 15.72 AC/dMe
Notes to Table: a Position of the X-ray source; b Position error (Statistical) of the X-ray source in arcsec; c Flux in the 0.5-4.5 keV band, in units of 10−14 erg cm−2 s−1; d
Position of the optical source; e Luminosity in the 0.5-4.5 keV band;
Fig
.7.O
ffse
tsbet
wee
nO
ptica
land
X-r
ayposi
tions.
The
exte
nded
X-r
ayso
urc
eX
MM
UJ122017.9
+752212
isnot
show
n.Sym
bols
as
in3.
Fig
.8.
His
togra
mof
Offse
ts(O
ptica
l–
X-r
ay)
scale
dto
the
corr
espondin
gst
atist
icalu
nce
rtain
tyin
theX
-ray
posi
-tion.T
he
bes
tfit
acc
ounting
for
syst
ematics
isals
osh
own
offse
tsof
the
optica
lposi
tion
with
resp
ect
toth
eX
-ray
posi
tion.T
hes
eare
show
nin
Fig
.7,w
her
eer
ror
bars
are
just
the
X-r
ayposi
tional
erro
rs,
whic
hby
far
dom
inate
over
the
optica
lposi
tion
ones
.A
nobvio
us
featu
reto
note
isth
at,
apart
from
the
sourc
eX
MM
UJ122017.9
+752212
whic
his
exte
nded
both
inX
-ray
sand
inth
eoptica
l(N
GC
4291),
ther
eis
no
ob-
vio
us
tren
dofoffse
tsbei
ng
larg
erfo
rany
sourc
ecl
ass
.In
part
icula
rth
eso
urc
escl
ass
ified
as
NE
LG
s(w
hic
hin
fact
are
all
AG
Ns)
are
unlikel
yto
be
chance
coin
ciden
ces,
as
inth
at
case
they
would
exhib
itla
rger
offse
tsw
ith
resp
ect
toth
eX
-ray
sourc
es.
Fig
.8
show
sth
ehis
togra
mofth
ese
offse
tsnorm
alize
dto
thei
rco
rres
pondin
gst
atist
ical
erro
rs.
Ass
um
ing
that
posi
tion
erro
rsare
wel
lre
pro
duce
dby
agauss
ian,th
isnor-
malize
doffse
tx
should
be
dis
trib
ute
das
f pos(x|x
0)∝|x−
x0|ex
p(
−|x−
x0|2
/2)
(1)
wher
ein
the
abse
nce
ofsy
stem
atic
shifts
x0
=0.A
ctually
x0
mea
sure
sth
em
agnitude
ofsy
stem
atic
resi
duals
inunits

X. Barcons et al: AXIS medium survey 11
14.0
15.0
16.0
17.0
18.0
19.0
20.0
21.0
22.0
23.0
1.0E-14 1.0E-13 1.0E-12X-ray flux (0.5-4.5)
i-mag
nitu
de
BLAGN
AC
NELG
Fig. 9. i’-magnitude vs X-ray flux for this sample.Symbols as in 3
of statistical errors. An attempt to fit the histogram of fig.8 without systematics reveals that it can only reproducethe first peak (at around x ∼ 1), but leaves the secondpeak unexplained. Then we maximum-likelihood fitted thesum of two of the above functions, one with x0 = 0 and asecond one with the systematic shift x0 as a free param-eter, the relative contribution of both terms being alsoa free parameter. The result (fit shown in fig. 8) is thatabout 83% of the sources have no significant systematicshifts and the remaining 17% of the sources have system-atic shifts of ∼ 4.5 statistical errors (typically ∼ 3 − 4arcsec).
A closer inspection of the sources showing residual as-trometric systematics shows that all of them are in theMkn 205 field, all of them are relatively bright and onlyone of them is relatively close to the centre of the field(but then close enough to the Mkn 205 point-spread func-tion tail). We do not fully understand the reason for this,but perhaps it might be related to the overall astrometricsolution being dominated by some spurious matches of X-ray sources fainter than the ones used in our survey. Theresiduals are, however, so small that they are irrelevant fora high galactic latitude field. Much more care should betaken, however, in galactic plane fields where the densityof optical sources is much larger and chance associationsmight produce a completely wrong astrometric solution.We suggest in this case to use a very limited number ofsecure identifications to derive a first astrometric correc-tion and then iterate as the number of identified sourcesgrows.
5.2. Overall source populations
As expected, the majority of the identified X-ray sourcesare extragalactic (only 1 galactic AC), and in particu-lar AGN. Fig. 9 shows the optical to X-ray relation forthe X-ray sources. We see that most, if not all, of theBLAGNs will be identified in the medium sensitivity sur-vey (i.e. at a flux limit of 2× 10⁻¹⁴ erg cm−2 s−1) down to
i’∼ 22m. NELGs and other galaxies are typically fainter,but we expect to identify large fractions of them withinthe AXIS resources. We can conclude from this pilot studythat > 90% of the medium sample can be identified withthe AXIS programme.
One remarkable feature of this survey is that we havefound no clusters of galaxies as counterparts of the iden-tified X-ray sources. Using the source counts from theROSAT Deep Cluster Survey (Rosati et al. 1998) wewould have expected < 2 − 3 clusters in our sample. Wemust further stress that there are no cluster candidatesin the unidentified sources, down to the sensitivity limitsof the optical images. Actually, the sliding box algorithmused to search for sources in the XMM-Newton imagesis not optimized for the detection of extended sources.Therefore we do not expect to be complete in groups andclusters. In fact, extended sources in XMM-Newton im-ages are the subject of on-going parallel studies withinthe XMM-Newton Survey Science Centre activities.
We have cross-correlated the X-ray source positionswith the NVSS radio survey (Condon et al. 1998). Nocoincidences closer than 10 arcsec are found for the flux-limited sample. The only radio source within 30 arcsec ofan X-ray source is a faint source of 2.4 mJy, just below thecompleteness level of NVSS, 14.4 arcsec away from XMMUJ010400.9-064949. The NVSS positional uncertainty for asource this faint (rms about 7 arcsec), when combinedwith the astrometric accuracy of our X-ray sources (Sect.5.1) make it unlikely that this is a true association. Forthe full sample of 89 sources found by our source-searchingalgorithms, the number of coincidences within 30 arcsecincreases from zero to one, with a source of 2.7 mJy beingfound 7.1 arcsec from an unidentified X-ray source of 5.6×10⁻¹⁵ erg cm−2 s−1. Despite the fact that this is likelyto be a true association, preliminary statistics based onabout 3000 X-ray sources from the ChaMP survey (Wilkeset al. 2001; Wilkes and Green 2001, private communica-tion) find a radio association with NVSS which increaseswith X-ray flux, and with which our two XMM-Newtonfields disagree at the 95% confidence level. Work is under-way to investigate the radio properties of larger samplesof sources.
5.3. The extragalactic X-ray sources
Fig. 10 shows the luminosity-redshift relation for the ex-tragalactic sources identified in our sample. With the ex-ception of NGC 4291, which has a luminosity not farfrom that of a normal galaxy (∼ 3 × 1040 erg s−1), all theremaining extragalactic objects have luminosities higherthan ∼ 1042.5 erg s−1, so there is no doubt they host anActive Galactic Nucleus. In particular, all the objects clas-sified as NELGs, should in reality be called Narrow-lineAGNs (NLAGNs). Indeed some (if not all of them) exhibit[OIII] lines much stronger than [OII] and/or [NeV] emis-sion lines, all of which are features of a hard non-stellarionizing continuum in the narrow-line emitting region.

12 X. Barcons et al: AXIS medium survey
0.001
0.010
0.100
1.000
10.000
100.000
0.0 0.5 1.0 1.5 2.0 2.5 3.0z
Lum
inos
ity/1
0E44
erg
/s
NELG
Gal
BLAGN
Fig. 10. Luminosity-redshift relation for the extragalacticsources identified in the sample. Symbols as in 3
The weighted average hardness ratios for BLAGN are〈HR1〉 = −0.68 ± 0.01 and 〈HR2〉 = −0.31 ± 0.04. It isinteresting to note that for a single power-law spectrum,these values correspond to Γ ∼ 2 and Γ ∼ 1.6 respectively,i.e., it appears that BLAGN have a hardening in theirspectrum towards high photon energies.
It is remarkable, however, that the average spectra ofBLAGN do not appear to be consistent with a single powerlaw spectrum. Indeed, while HR1 is consistent with anunabsorbed Γ = 2 spectrum, at harder photon energiesHR2 calls for a much flatter X-ray spectrum, with Γ ∼ 1.6.A similar result has been recently found by Pappa et al(2001) by co-adding ROSAT and ASCA spectra of 21BLAGN. Our result confirms that this is not due to amismatch between ROSAT and ASCA calibrations andamphasizes the power of XMM-Newton in broad-band X-ray spectral studies.
The spectral shape that we infer for BLAGN was firstempirically proposed by Schwartz & Tucker (1988) inorder to reproduce the XRB spectrum. The subsequentdiscovery of a Compton reflection bump in the X-rayspectrum of Seyfert 1 galaxies (Pounds et al 1990) sug-gested that reflection-dominated AGN (i.e., AGN where> 90% of the observed X-rays would have been reflectedin cold/warm material) could contribute the bulk of theX-ray background (Fabian et al 1990). Although no sig-nificant population of such sources has been detected, itis likely that we are witnessing the effects of Comptonreflection or a similar phenomenon in the average X-rayspectra of the z ∼ 1 − 2 BLAGN in our sample. If theCompton reflection bump entering the 4.5-10 keV band isthe ultimate reason for the hard values of HR2, then atrend with redshift should be seen. In fig. 11 we plot bothhardness ratios HR1 and HR2 as a function of redshiftfor the extragalactic objects. No trend is found in HR1
vs z for BLAGN, and at best we can only claim a hintof HR2 becoming higher at high redshifts. That, whichwould be expected if Compton reflection is responsible for
Fig. 11. Hardness ratios HR1 and HR2 as a function ofredshift z. Symbols as in 3. We also plot expected valuesfor single power law spectra with Γ = 1.4 and Γ = 2.
the hardening of the spectrum, needs much more data tobe confirmed.
We only find marginal evidence for the NLAGN havinga harder spectrum than BLAGN (see fig. 3). Such a trendhad been found in ROSAT surveys (Romero-Colmeneroet al. 1996; Almaini et al. 1996). The weighted averagehardness ratios for these objects are 〈HR1〉 = −0.48±0.11and 〈HR2〉 = −0.37± 0.04. 〈HR2〉 agrees with the corre-sponding value for BLAGNs, but HR1 is slightly higher,although only at ∼ 2σ significance. If we interpret themarginal difference in terms of a Γ = 2 power-law spec-trum being affected by intrinsic absorption in NLAGN,the inferred column density is NHI = 5 × 1022 cm−2 at aredshift of z = 0.4 where most of the NLAGNs are located.
We must recall that evidence has been accumulatedthat X-ray photoelectric absorption and optical spectro-scopic classification do not appear to have a one-to-one re-lation. For example hard X-ray sources found in ROSATsurveys contain large fractions of unobscured type 1 QSOsand Seyferts (Page, Mittaz & Carrera 2001). On the con-trary, dusty warm absorbers produce little effect in theX-ray broad-band colours of AGN, but substantially in-fluence their optical appearence. The underlying reasonfor all these apparent inconsistencies could be the differ-ent distributions of atomic gas and dust in the close envi-

X. Barcons et al: AXIS medium survey 13
Table 8. Parameters of the Broad absorption systemsfound in the BAL QSOs, based on the CIV line: Wrest
is the rest-frame equivalent width of the broad-absorptionline, vej its ejection velocity from the QSO and BI is theBalnicity index defined in Weymann et al. (1991).
Source Wrest vej BI(A) (km s−1) (km s−1)
XMMU J010316.7-065137 5 19000 580XMMU J010328.7-064633 34 34000 3650
ronment of the AGN central engine (Maiolino et al. 2001),perhaps due to dust sublimation near the center (Granato,Danese & Franceschini 1997).
Source XMMU J122017.9+752212 (NGC 4291) de-serves further comment. X-ray emission from this galaxywas detected with Einstein (Canizares, Fabbiano &Trinchieri 1987). Roberts & Warwick (2000) analyzeROSAT HRI images of nearby galaxies and find a nu-clear X-ray point source within 6.8 arcsec from the centreof NGC 4291. The extended X-ray emission of this sourcein the 0.5-4.5 keV XMM-Newton image clearly masks outa part of the sky, which is why we have removed a 1.5 ar-cmin radius circle around it. However, when this region isexamined only in the 2-10 keV band, the diffuse emissiondisappears. What is then seen is a point source approx-imately coincident with the nucleus of NGC 4291 and afurther 4 sources within the excised region, some of whichmight possibly be associated with the galaxy. The factthat NGC 4291 presents a point source in its center is astrong suggestion that an active nucleus might be actuallyhidden in the centre of this optically dull galaxy. A morecomplete discussion of this interesting galaxy and its en-vironment is beyond the scope of this paper and will bepresented elsewhere.
5.4. The Broad-Absorption Line QSOs
Among the sample of BLAGN we find 2 (XMMUJ010328.7-064633 at z = 1.82 and XMMU J010316.7-065137 at z = 1.91) Broad-Absorption-Line (BAL) QSO(see figs. 12 and 13). Parameters of the correspondingbroad-absorption line systems (based on the CIV line)are listed in Table 8. In particular we have computed theso-called Balnicity index introduced by Weymann et al.(1991) as a way to provide a continuous classification be-tween BAL and non-BAL QSOs. In the context of thesample studied by Weymann et al. (1991) the value of theBalnicity Index is in the low end for XMMU J010316.7-065137 but close to average for XMMU J010328.7-064633.
BAL QSOs have been practically absent from previousX-ray selected samples. There have been a few exceptions:1 BAL QSO in the Einstein Medium Sensitivity Surveyat z = 2.027 (Stocke et al. 1991) and more recently theELAIS/BeppoSAX survey at z = 2.2 (Alexander et al.2001), the Chandra deep field south at z = 2.75, (Giacconi
Fig. 12. Optical spectra of the BAL QSO XMMUJ010328.7-064633 obtained with the ISIS spectrograph onthe WHT. Both blue and red arm spectra (which havedifferent channel size) are shown.
Fig. 13. Optical spectra of the BAL QSO XMMUJ010316.7-065137 obtained with the ISIS double spectro-graph on the WHT. Both blue and red arm spectra (whichhave different channel size) are shown.
et al. 2001) and the survey of ROSAT hard X-ray sourcesat z = 2.21 (Page, Mittaz & Carrera 2001).
The paucity of BAL QSOs in previous X-ray surveys ishardly surprising, as the gas ejected by BAL QSOs whichis responsible for the broad absorption lines will efficientlyabsorb soft X-rays. Previous X-ray missions, mostly sen-sitive to soft X-rays like Einstein and ROSAT , are ex-pected to have a much reduced sensitivity to BAL QSOswith respect to optical surveys. It is illustrative to noticethat the only ROSAT -discovered BAL QSO was found ina selection of hard X-ray spectrum sources.
We find it intriguing that the BAL QSOs have ‘normal’values of HR1: −0.79±0.08 for XMMU J010328.7-064633and −0.62± 0.17 for XMMU J010316.7-065137 (the aver-age over all sources in the sample is ∼ −0.69 ± 0.01 forHR1). Indeed, the high redshift of the two objects helpsto move the intrinsic photoelectric absorption feature be-

14 X. Barcons et al: AXIS medium survey
low our detection band (0.5-4.5 keV). Assuming z = 1.85,and an unabsobed Γ = 2 power-law spectrum, an intrin-sic absorbing column of ∼ 1022 cm−2 increases the valueof HR1 from -0.68 in the absence of intrinsic absorptionto -0.61. It is then clear that these objects cannot haveintrinsic columns significantly in excess of 1022 cm−2 orotherwise we would see it in their X-ray spectra. However,these are unusually small values for the absorbing columnsin BAL QSOs. Gallagher et al. (2001) report on ASCAand Chandra observations of several BAL QSOs, and theinferred absorbing columns always exceed 1022 cm−2 andsometimes by a large amount. Here we see that low (neu-tral) column density BAL QSOs do exist. Perhaps highionisation and/or partial covering could bring to agree-ment the apparent small X-ray absorbing column with asizeable CIV broad absorption line.
A further remarkable fact is that both BAL QSOs lieat the redshift where the distribution of BLAGN peaks.This might be telling us that we are only seeing the tip ofthe iceberg, i.e., we have only detected BAL QSOs at theredshift where this detection would be more likely (helpedindeed by the K-correction discussed above).
What remains to be understood is why BAL QSOswere practically absent in ROSAT surveys of similardepth (e.g. Boyle et al 1994). The sensitivity to higherX-ray photons of our current survey (0.5-4.5 keV) withrespect to the standard 0.5-2 keV ROSAT band does notmake a big difference: for a z = 1.85, intrinsically ab-sorbed (1022 cm−2) power-law (Γ = 2) QSO spectrum,only ∼ 20% of the counts from the source fall in the 2-4.5keV band in EPIC pn. A source with that spectrum at oursurvey limit, would have a 0.5-2 keV flux slightly above∼ 1 × 10⁻¹⁴ erg cm−2 s−1 and would have been thereforedetectable in the so-called ROSAT deep survey (Boyle etal 1994).
6. Conclusions
As expected, the majority (25 out of 29 or 86%) of the X-ray sources identified in this sample are AGN. These aredivided into 25% Narrow-line AGN and 75% Broad-LineAGN. Narrow-line AGNs have some hints of photoelectricabsorption with respect to the BLAGN population, butthe effect is less than ∼ 2σ significant in our small sample.Inferred columns for narrow-line AGNs at z ∼ 0.4 wouldbe around ∼ 5 × 1022 cm−2.
Perhaps the most remarkable finding is that 2 out of24 AGN are BAL QSOs, i.e., ∼ 10%. This is similar tothe fraction of BAL QSOs in optically selected samples.The X-ray spectrum of these BAL QSOs does not showevidence for photoelectric absorption, and the limits wederive for the intrinsic absorption column (< 1022 cm−2)tell us that these are unusual objects among the BAL QSOpopulation in their X-ray spectra.
The AXIS high-galactic latitude medium survey is nowprogressing with ∼ 250 X-ray sources spectroscopicallyidentified. Large numbers of sources are needed, not onlyto study in detail the overall properties of the dominant
source population (AGN in this case), but also to findand characterize the rarer populations, e.g., BAL QSOsor optically dull galaxies (Mushotzky et al. 2000; Baldi etal. 2001).
Acknowledgements. We thank Alberto Fernandez-Soto for helpwith the photometric redshift techniques and the refereeIoannis Georgantopoluos for interesting suggestions. We aregrateful to the CCI of the observatories of the Canary Islandsfor a generous allocation of telescope time, through theInternational Time Programme scheme. The INT/WHT andTNG telescopes are operated on the island of La Palma bythe Isaac Newton Group and the Centro Galileo Galilei respec-tively in the Spanish Observatorio del Roque de Los Muchachosof the Instituto de Astrofısica de Canarias. XB, FJC, MTC andSM acknowledge financial support by the Spanish MCYT un-der project AYA2000-1690. RDC and TM acknowledge partialfinancial support by the Italian Space Agency (ASI) and bythe MURST (Cofin00-32-36). This project was supported bythe DLR under grants 50 OR 9908 0 (GPS) and 50 OX 98013 (HB).
References
Alexander, D., LA Franca, F., Fiore, F. et al 2001 ApJ,554, 18
Almaini, O., Shanks, T., Boyle B.J., et al, 1996 MNRAS,282, 295
Baldi, A., Molendi, S., Comastri, A. et al, 2001 ApJ, inthe press
Barger, A.J., Cowie, L.L., Mushotzky, R.F., Richards,E.A., 2001 AJ, 121, 662
Bertin, E., Arnouts, S., 1996 A&AS, 117, 393Boyle, B.J., Shanks, T., Georgantopoulos, I. et al 1994
MNRAS, 271, 639Fabian, A.C., Barcons, X., 1992 ARAA, 30, 629Canizares, C.R., Fabbiano, G., Trinchieri, G., 1987 ApJ,
312 503Coleman, G.D., Wu, C.C., Weedman, D.W., 1980 ApJS,
43, 393Condon, J.J., Cotton, W.D., Greisen, E.W., Yin, Q.F.,
Perley,R.A., Taylor, G.B., & Broderick, J.J. 1998 AJ,115, 1693
de Vaucouleurs, G., de Vaucouleurs, A., Corwin, J.R.,Buta, R.J., Paturel, G., Fouque, P., 1991. ThirdReference Catalogue of Bright galaxies, Version 3.9,Springer-Verlag.
Fabian, A.C, George, I.M., Miyoshi, S., Rees, M.J., 1990,MNRAS, 242, P14
Fernandez-Soto, A., Lanzetta, K.M., Yahil, A., 1999 ApJ,513, 34
Gallagher, S.C., Brandt, W.N., Chartas, G., Garmire,G.P., 2001 In: Mass outflow in active Galactin Nuclei:new perspectives. Ed: D.M. Crenshaw, S.B. Kraemer,I.M. George. ASP Conf Series (in the press).
Giacconi, R., Rosati, P., Tozzi, P. et al 2001 ApJ, 551, 624Granato, G.L., Danese, L., Franceschini, A., 1997 ApJ,
486, 147Hasinger, G., Burg, R., Giacconi, R., Schmidt, M.,
Trumper, Zamorani, G., 1998 A&A, 329, 482

X. Barcons et al: AXIS medium survey 15
Hasinger, G., Altieri, B., Arnaud, M., et al, 2001 A&A,365, L45
Humasson, M.L., Mayall, N.U., Sandage, A.R. 1956, AJ,61, 97
Jansen, F.A., Lumb, D., Altieri, B., et al, 2001 A&A, 365,L1
Maiolino, R., Marconi, A., Salvati, M. et al, 2001 A&A,365, 28
Mason, K.O., Carrera, F.J., Hasinger, G., et al, 2000MNRAS, 311, 456
Monet, D., Canzian, B., Dahn, C. et al, 1998 A Catalogof Astrometric Standards, U.S. Naval ObservatoryFlagstaff Station (USNOFFS) and Universities SpaceResearch Association (USRA) stationed at USNOFFS.
Mushotzky, R.F., Cowie, L.L., Barger, A.J., Arnaud,K.A., 2000 Nat, 404, 459
Page, M.J., Mittaz, J.P.D., Carrera, F.J., 2001 MNRAS,325, 575
Pappa, A., Stewart, G.C., Georgantopoulos, I., Griffiths,R.E., Boyle, B.J., Shanks, T., 2001 MNRAS, 327, 499
Pounds, K.A., Nandra, K., Stewart, G.C., George, I.M.,Fabian, A.C., 1990, Nat, 344, 132
Richards, G.T., Fan, X., Schneider, D.P., et al, 2001 AJ,121, 2308
Roberts, T.P., Warwick, R.S., 2000 MNRAS, 315, 98Romero-Colmenero, E., Branduardi-Raymont, G.,
Carrera, F.J. et al 1996 MNRAS, 282, 94Rosati, P., Della Ceca, R., Norman, C., Giacconi, R., 1998
ApJ, 492, L21Sandage, A., Visvanathan, N., 1978. ApJ, 223, 707Schwartz, D.A, Tucker, W.H., 1988, ApJ, 332, 157Stocke, J.T., Morris, S.L., Gioia, I.M., Maccacaro, T.,
Schild, R., Wolter, A., Fleming, T.A., Henry, J.P. 1991APJS, 76, 813
Struder, L., Briel, U., Dennerl, R., et al, 2001 A&A, 365,L18
Turner, M.J.L., Abbey, A., Arnaud, M., et al, 2001 A&A,365, L27
Ueda, Y., Takahashi, T., Ishisaki, Y., Ohashi, T.,Makishima, K., 1999 ApJ, 524, L11
Watson, M.G., Augueres, J.-L., Ballet, J., et al, 2001A&A, 365, L51
Weymann, R.J., Morris, S.L., Foltz, C.B., Hewett, P.C.,1991 ApJ, 373, 23
Wilkes, B.J. et al. 2001 in ”New Era of Wide Field astron-omy” ed R. Clowes, ASP Conf Proc, in press