THE VALUE OF CONSERVING MARINE TURTLES IN ASIA ...
104
MONEY TALKS: THE VALUE OF CONSERVING MARINE TURTLES IN ASIA-PACIFIC 2021 Working together to protect the hawksbill turtle.
-
Upload
khangminh22 -
Category
Documents
-
view
6 -
download
0
Transcript of THE VALUE OF CONSERVING MARINE TURTLES IN ASIA ...

MONEY TALKS: THE VALUE OF CONSERVING MARINE TURTLES IN ASIA-PACIFIC2021
Working together to protect the hawksbill turtle.
Working together to protect the hawksbill turtle.
Working together to protect the hawksbill turtle.

WWF-AUSTRALIA 2021 | THE ECONOMIC VALUE OF MARINE TURTLES IN THE ASIA-PACIFIC REGION
© WWF-Aus / Christine Hof
WWF-Australia WWF is one of the world’s largest and most experienced independent conservation organisations, with over 5 million supporters and a global network active in more than 100 countries. WWF’s mission is to stop the degradation of the planet’s natural environment and to build a future in which humans live in harmony with nature, by conserving the world’s biological diversity, ensuring that the use of renewable natural resources is sustainable, and promoting the reduction of pollution and wasteful consumption.
Royal Caribbean International This project would not have been possible without the generous support of Royal Caribbean International. Since 2018, Royal Caribbean International and WWF-Australia have been working together to better protect the hawksbill turtle from the illegal turtle trade.
Published in September 2021 by WWF – World Wide Fund For Nature Australia.
Any reproduction in full or in part must mention the title and credit the above-mentioned publisher as the copyright owner.
Design by Fresco Creative
Reviewed by Bryan Wallace (Ecolibrium, Inc., and University of Colorado Boulder), Andrew Seidl (UNDP Biodiversity Finance Initiative, and Colorado State University), Roy Brouwer (University of Waterloo) and Ram Pandit (University of Western Australia).
Edited by Amanda Burdon
WWF® and World Wide Fund for Nature® trademarks and ©1986 Panda Symbol are owned by WWF-World Wide Fund For Nature (formerly World Wildlife Fund).
All rights reserved.
For contact details and further information, please visit our website at wwf.org.au
Cover photography: © WWF-Aus / Mike Ball Dive Expeditions Back Cover photography: © naturepl.com / Graham Eaton / WWF
Acknowledgements WWF-Australia acknowledges the Traditional Owners of the land on which we work and their continuing connection to their lands, waters and culture. We pay our respects to Elders, past and present, and emerging leaders.
This study was prepared by Dr. Luke Brander on behalf of WWF-Australia. It was commissioned by WWF-Australia under WWF’s Marine Turtle Use and Trade Initiative, funded by Royal Caribbean International.
I am sincerely grateful to the project team at WWF-Australia, led by Christine Madden Hof, Joshua Bishop and Kimberly Riskas, for their insightful comments and engagement in the study design, implementation and reporting. The report also benefited greatly from the expert reviews of Bryan Wallace, Andy Seidl, Roy Brouwer and Ram Pandit. I am indebted to several people for their invaluable research support: Florian Eppink, Thijs Dekker, Victoria Guisado-Goñi, Martina Feltracco, Zoe Wong and Yuanshan Lin. For the preparation and distribution of surveys, I thank: Ana-Maria Ionescu and Lavan Shatheeshkumaran at Ipsos; Susann Adloff for conducting the Bougainville survey; Louise Teh, Lydia Teh, Bee Hong Yeo and Zara Phang for the translation and distribution of the non-use value survey in Malaysia; Luat Do for translation and distribution in Vietnam; Zoey Zhang, Wei Yi Li and Yumeng Xiao for translation into Chinese; Astrid Ocampo and Laurence Delina for translation and distribution in the Philippines; Leimona Beria for translation and distribution in Indonesia; Duncan Williams, Laitia Tamata, Francis Areki, Ravai Vafo’ou and their survey team for coordinating and conducting face-to-face interviews in Fiji; Oscar Sanchez for translation to Spanish; and Pieter van Beukering, Juha Siikamaki, Andy Seidl and many others for distributing the non-use value survey through their networks.
Suggested citation: Brander, L., Madden Hof, C., Bishop, J., and Riskas, K.A. (2021). Money talks: the value of conserving marine turtles in Asia-Pacific. Vrije Universiteit Amsterdam and Brander Environmental Economics report to WWF-Australia and WWF-Coral Triangle Programme.

3
CONTENTSKEY MESSAGES 4KEY RECOMMENDATIONS 6EXECUTIVE SUMMARY 81. BACKGROUND 13
1.1 ECONOMIC VALUATION OF WILD SPECIES 131.2 MARINE TURTLE STATUS AND THREATS 141.3 NEED FOR INFORMATION ON THE VALUE OF MARINE TURTLES 171.4 STUDY OBJECTIVES 17
2. CONCEPTUAL FRAMEWORK 182.1 TOTAL ECONOMIC VALUE 182.2 ECOSYSTEM SERVICES 192.3 THE CASE FOR ECONOMIC VALUATION OF ECOSYSTEM SERVICES 20
3. PREVIOUS RESEARCH AND KNOWLEDGE GAPS 213.1 A BRIEF REVIEW OF THE LITERATURE 213.2 KNOWLEDGE GAP ANALYSIS 25
4. VALUE OF ASIA-PACIFIC MARINE TURTLES 264.1 HARVEST FOR FOOD AND MATERIALS 284.2 EXISTENCE AND BEQUEST VALUES 324.3 SCENARIO ANALYSIS 444.4 PREFERENCES FOR POLICY ACTION 48
5. DISCUSSION AND CONCLUSIONS 525.1 SUMMARY OF FINDINGS 525.2 CAVEATS AND DIRECTIONS FOR FUTURE RESEARCH 54
6. REFERENCES 56APPENDIX 1: LIMITATIONS AND CRITICISMS OF ECONOMIC VALUATION 60APPENDIX 2: CASE STUDIES THAT ESTIMATE ECONOMIC VALUES FOR MARINE TURTLES 62APPENDIX 3: PRICES OF TURTLE PARTS AND PRODUCTS 68APPENDIX 4: NON-USE VALUE SURVEY DEVELOPMENT AND IMPLEMENTATION 72
SURVEY DEVELOPMENT 72SURVEY IMPLEMENTATION 76DATA ANALYSIS 77
APPENDIX 5: NON-USE VALUE SURVEY QUESTIONNAIRE 78APPENDIX 6: NON-USE VALUE SURVEY DATA SUMMARY 84APPENDIX 7: CHOICE EXPERIMENT RESULTS 92
CHOICE MODELLING APPROACH 92CHOICE ANALYSIS RESULTS – BASIC MODEL AND STUDY COUNTRIES 92CHOICE ANALYSIS RESULTS – EXTENDED MODEL AND OTHER COUNTRIES 96
WWF-AUSTRALIA 2021 | THE ECONOMIC VALUE OF MARINE TURTLES IN THE ASIA-PACIFIC REGION
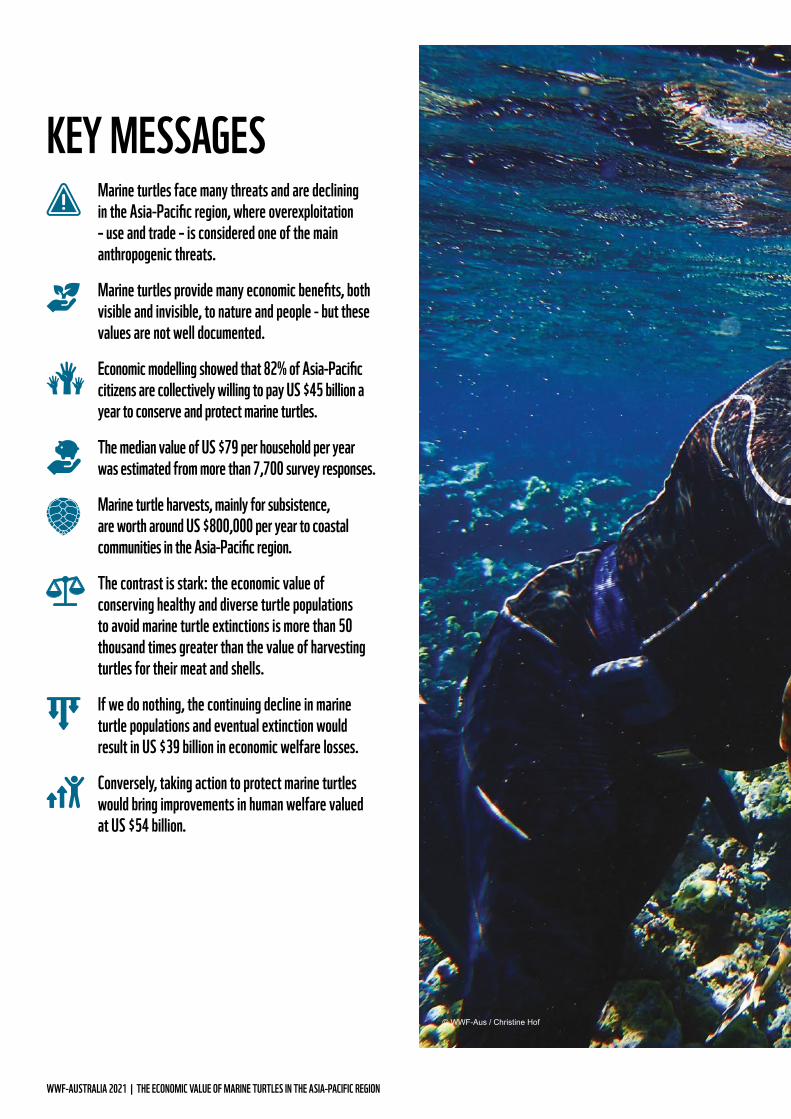
Marine turtles face many threats and are declining in the Asia-Pacific region, where overexploitation – use and trade – is considered one of the main anthropogenic threats.
The median value of US $79 per household per year was estimated from more than 7,700 survey responses.
Marine turtles provide many economic benefits, both visible and invisible, to nature and people - but these values are not well documented.
Economic modelling showed that 82% of Asia-Pacific citizens are collectively willing to pay US $45 billion a year to conserve and protect marine turtles.
Marine turtle harvests, mainly for subsistence, are worth around US $800,000 per year to coastal communities in the Asia-Pacific region.
If we do nothing, the continuing decline in marine turtle populations and eventual extinction would result in US $39 billion in economic welfare losses.
The contrast is stark: the economic value of conserving healthy and diverse turtle populations to avoid marine turtle extinctions is more than 50 thousand times greater than the value of harvesting turtles for their meat and shells.
Conversely, taking action to protect marine turtles would bring improvements in human welfare valued at US $54 billion.
KEY MESSAGES
© WWF-Aus / Christine Hof

5
Investing in marine turtle conservation delivers huge economic benefits, but letting them go extinct will result in massive economic cost.
WWF-AUSTRALIA 2021 | THE ECONOMIC VALUE OF MARINE TURTLES IN THE ASIA-PACIFIC REGION
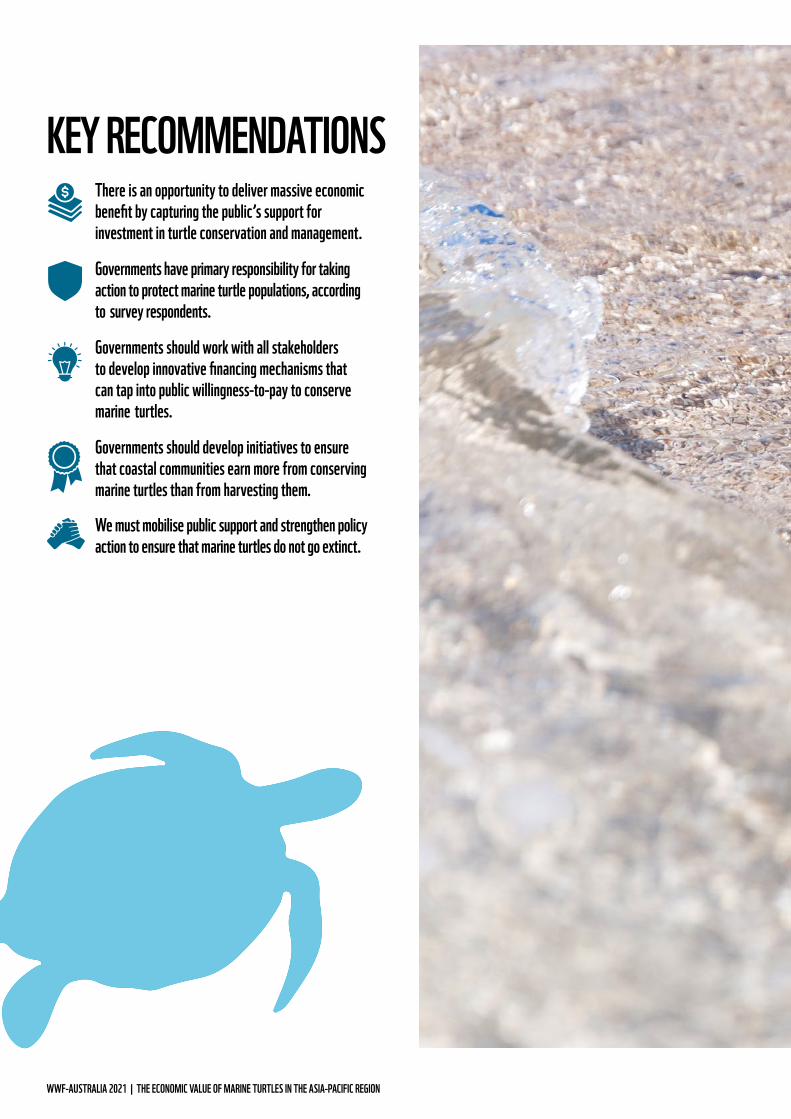
KEY RECOMMENDATIONS
Governments should work with all stakeholders to develop innovative financing mechanisms that can tap into public willingness-to-pay to conserve marine turtles.
Governments should develop initiatives to ensure that coastal communities earn more from conserving marine turtles than from harvesting them.
There is an opportunity to deliver massive economic benefit by capturing the public’s support for investment in turtle conservation and management.
Governments have primary responsibility for taking action to protect marine turtle populations, according to survey respondents.
We must mobilise public support and strengthen policy action to ensure that marine turtles do not go extinct.

7
There is huge cost to both marine turtle populations and people if ‘business as usual’ (policy inaction) is maintained.
© WWF-Aus /Gülsah Dogruer / Entox

WWF-AUSTRALIA 2021 | THE ECONOMIC VALUE OF MARINE TURTLES IN THE ASIA-PACIFIC REGION
© Brent Stirton / Getty Images / WWF-UK
Population trends for marine turtles vary among species, regions and nesting populations. The Asia-Pacific region was selected as the focus of this study because marine turtles in this region face high risks and high threats (Wallace et al., 2011) and continue to experience population decline (Mazaris et al., 2017).
Understanding the associated loss of valuable ecosystem services and impacts on human welfare can motivate increased funding, policy reforms and other actions to protect and restore marine turtle populations. This report provides a global review of published literature on the economic value of marine turtles, and estimates the value of provisioning services and non-use values in the Asia-Pacific region. Other services provided by marine turtles (e.g., cultural, recreation and ecotourism) are recognised as having economic importance but are not valued at the regional scale in this study due to a lack of data.
Building on a global assessment by Troëng and Drews (2004) of the direct consumptive use (food and materials), non-consumptive use (ecotourism) and non-use (existence and bequest) values of marine turtles, we reviewed 56 studies from 37 countries that estimated the economic value of ecosystem services provided by marine turtles. Key gaps identified in this literature include the lack of valuation estimates for some priority regions (e.g., the East Atlantic, Western Indian Ocean and South Asia) and for regulating services provided by marine turtles (e.g., control of potential pest and coral competitor species).
Marine turtle species face loss of habitat, population decline and serious risk of extinction (IPBES, 2019; CBD, 2020).
EXECUTIVE SUMMARY
Marine turtles and eggs have been harvested by humans for food, shells and other parts for millennia, with artisanal and subsistence harvesting continuing today (Groombridge and Luxmoore, 1989; Frazier, 2003). The current net value of marine turtles to harvesters in the Asia-Pacific region was estimated using data on harvested quantities (from Humber et al., 2014), together with survey data on market
prices and harvesting costs. Our central estimate of the aggregate net value of this turtle provisioning service was US $800 thousand per year across the Asia-Pacific region. Although this value is not high, consumptive use of marine turtles represents an important source of nutrition and income to relatively poor households, and the use of turtles has additional cultural significance in some contexts.

9
In addition to the value of harvests, we examined the non-use value of marine turtles. The economic welfare that people derive from knowing that marine turtles exist (“existence value”) and that they will be available for use or appreciation by future generations (“bequest value”) was estimated using a large-sample (n=7,765) global household survey. The survey focused particularly on six countries in the Asia-Pacific region (China, Fiji, Indonesia, Malaysia, the Philippines and Vietnam) but received responses from over 80 countries. We used a stated preference valuation method to elicit willingness-to-pay (WTP) for marine turtles, expressed in terms of population trends (increasing, stable or declining) and species diversity (avoided extinctions). We found that a high proportion of households (82% on average) expressed a positive WTP for turtle conservation, and that the donation amounts are substantial.
The median WTP for ensuring stable marine turtle populations, adjusted for demographic differences between the survey sample and the general population, is estimated at US $79 per household per year. When this figure is extrapolated across more than 576 million households in the Asia-Pacific region likely to be willing to pay for turtle conservation, the total value is estimated at US $45.7 billion per year. This may seem like a large sum but is equivalent to just 0.2% of total household income in the region. The aggregate value for China, alone, is US $30.9 billion per year.
This aggregate estimate is characterised by high uncertainty, but nevertheless conveys the widespread public appreciation for marine turtle conservation. It provides powerful justification for decision-makers to reinforce legislative protections and allocate increased funding to the conservation of marine turtles.
A scenario analysis was used to estimate the economic welfare changes that would result from policy inaction (i.e. business as usual, in which turtle populations continue to decline and two species become extinct) versus strong policy action (resulting in increasing turtle populations and no extinctions). The annual economic welfare loss that results from not acting was estimated to be US $39.6 billion per year, whereas the potential welfare gain from taking policy action to conserve, manage and protect marine turtles was estimated at US $54.6 billion per year.
The study also explored public preferences for the design of marine turtle conservation initiatives. We found that survey respondents see governments as having primary responsibility for marine turtle conservation. Their preferences in relation to policy action for turtle conservation were directed towards the protection of critical turtle habitats, stronger environmental legislation and the employment of turtle rangers. The most popular structure for financing turtle conservation was voluntary monthly donations for a fixed period to a fund that is managed by a public institution or environmental NGO.
The study revealed that the economic benefits of investing in the conservation of marine turtles deliver huge economic benefits, but extinction will result in massive economic cost. Non-use values also vastly outweigh the economic benefits of harvesting turtles for meat and other products. Increasing turtle populations would deliver a substantial boost to economic welfare in Asia-Pacific societies.
These results present a powerful economic justification for decision-makers to align environmental policies and budgets with Asia-Pacific peoples’ stated WTP for turtle conservation.
Our analysis also highlights the importance of ensuring that coastal communities reliant on turtle harvests are adequately supported to engage in turtle conservation activities and/or compensated for any resulting loss of access to marine resources. Governments have a clear opportunity to invest in projects that will increase economic welfare, reverse the downward trajectories of marine turtle populations, and ensure that these ancient mariners continue to thrive for generations to come.
82% of households expressed a positive WTP for turtle conservation, collectively equating to US $45.7 billion a year.

WWF-AUSTRALIA 2021 | THE ECONOMIC VALUE OF MARINE TURTLES IN THE ASIA-PACIFIC REGION
Asia-Pacific is considered the most at-risk of extinction region
THE ECONOMIC VALUE OF MARINE TURTLES IN THE ASIA-PACIFIC REGION
Governments should work with all stakeholders to develop innovative financing mechanisms that can tap public willingness-to-pay to conserve marine turtles and ensure that coastal
communities earn more from conserving marine turtles than from harvesting them.
We estimate that
82% of the general population is willing to donate funds
to conserve marine turtles.
Median willingness-to-pay is
$US 79 per household per year to ensure
stable or increasing populations of marine turtles and avoid extinctions.
This implies that over
576 MILLION households in the Asia-Pacific region
would be willing, in principle, to donate funds for conserving marine turtles.
Investing in marine turtle conservation delivers huge economic benefits. The value of marine turtles in the Asia-Pacific region equates to:
Compared to:Provisioning services
(per year) worth around
US $800,000Existence and bequest value (per year) over
US $45 BILLION
$$

11
Non-use values were estimated by surveying
>7,700 PEOPLE
How we calculated the economic value of marine turtles in the Asia-Pacific region.
Provisioning services Values of marine turtles harvested for
meat and parts
Non-use value Existence, bequest and altruistic values that people hold for marine turtle conservation
Harvest values were estimated asxharvested quantity
relevant local prices - costs of
harvesting
There is huge loss to both marine turtles and people if ‘business as usual’ (the status quo of policy inaction) is maintained.
Governments were seen to have primary responsibility for the
conservation and management of marine turtles.
Survey respondents expressed strong support for a range of conservation actions
Employment of turtle rangers
Stronger environmental legislation
Protection of turtles and their habitats
Due to policy inaction we can expect large economic welfare losses of around US $39 billion per year if marine turtles
are allowed to become extinct.
But larger welfare gains of around US $54 billion per year if effective
conservation action is taken.
Voluntary monthly donations were voted the most popular way
to pay for turtle conservation.
Marine turtle populations are in decline, particularly in the Asia-Pacific region. They require urgent intervention as they are at high risk of extinction. Unsustainable turtle harvests (for use and trade) are considered one of the greatest threats.

WWF-AUSTRALIA 2021 | THE ECONOMIC VALUE OF MARINE TURTLES IN THE ASIA-PACIFIC REGION
© Troy Mayne
13
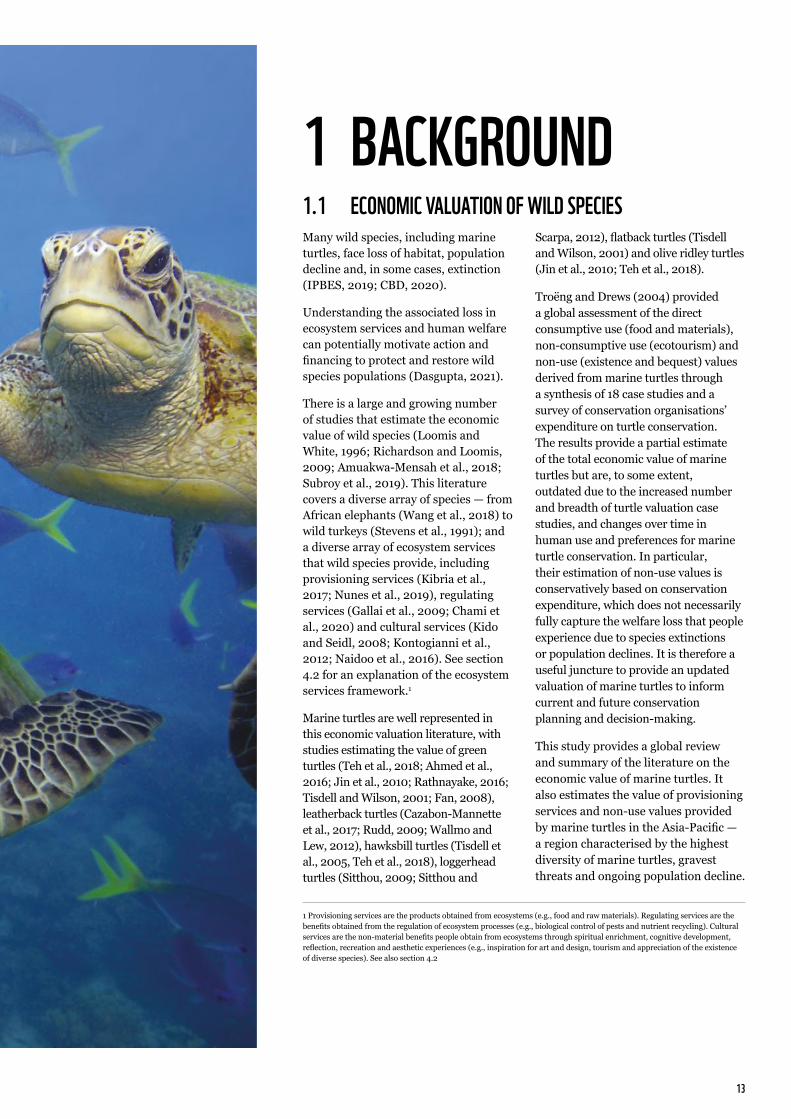
1.1 ECONOMIC VALUATION OF WILD SPECIESMany wild species, including marine turtles, face loss of habitat, population decline and, in some cases, extinction (IPBES, 2019; CBD, 2020).
Understanding the associated loss in ecosystem services and human welfare can potentially motivate action and financing to protect and restore wild species populations (Dasgupta, 2021).
There is a large and growing number of studies that estimate the economic value of wild species (Loomis and White, 1996; Richardson and Loomis, 2009; Amuakwa-Mensah et al., 2018; Subroy et al., 2019). This literature covers a diverse array of species — from African elephants (Wang et al., 2018) to wild turkeys (Stevens et al., 1991); and a diverse array of ecosystem services that wild species provide, including provisioning services (Kibria et al., 2017; Nunes et al., 2019), regulating services (Gallai et al., 2009; Chami et al., 2020) and cultural services (Kido and Seidl, 2008; Kontogianni et al., 2012; Naidoo et al., 2016). See section 4.2 for an explanation of the ecosystem services framework.1
Marine turtles are well represented in this economic valuation literature, with studies estimating the value of green turtles (Teh et al., 2018; Ahmed et al., 2016; Jin et al., 2010; Rathnayake, 2016; Tisdell and Wilson, 2001; Fan, 2008), leatherback turtles (Cazabon-Mannette et al., 2017; Rudd, 2009; Wallmo and Lew, 2012), hawksbill turtles (Tisdell et al., 2005, Teh et al., 2018), loggerhead turtles (Sitthou, 2009; Sitthou and
Scarpa, 2012), flatback turtles (Tisdell and Wilson, 2001) and olive ridley turtles (Jin et al., 2010; Teh et al., 2018).
Troëng and Drews (2004) provided a global assessment of the direct consumptive use (food and materials), non-consumptive use (ecotourism) and non-use (existence and bequest) values derived from marine turtles through a synthesis of 18 case studies and a survey of conservation organisations’ expenditure on turtle conservation. The results provide a partial estimate of the total economic value of marine turtles but are, to some extent, outdated due to the increased number and breadth of turtle valuation case studies, and changes over time in human use and preferences for marine turtle conservation. In particular, their estimation of non-use values is conservatively based on conservation expenditure, which does not necessarily fully capture the welfare loss that people experience due to species extinctions or population declines. It is therefore a useful juncture to provide an updated valuation of marine turtles to inform current and future conservation planning and decision-making.
This study provides a global review and summary of the literature on the economic value of marine turtles. It also estimates the value of provisioning services and non-use values provided by marine turtles in the Asia-Pacific — a region characterised by the highest diversity of marine turtles, gravest threats and ongoing population decline.
1 Provisioning services are the products obtained from ecosystems (e.g., food and raw materials). Regulating services are the benefits obtained from the regulation of ecosystem processes (e.g., biological control of pests and nutrient recycling). Cultural services are the non-material benefits people obtain from ecosystems through spiritual enrichment, cognitive development, reflection, recreation and aesthetic experiences (e.g., inspiration for art and design, tourism and appreciation of the existence of diverse species). See also section 4.2
1 BACKGROUND

WWF-AUSTRALIA 2021 | THE ECONOMIC VALUE OF MARINE TURTLES IN THE ASIA-PACIFIC REGION
1.2 MARINE TURTLE STATUS AND THREATSMarine turtles are present in many parts of the world, nest in over 80 countries, and live in the coastal waters of more than 140 countries (Seminoff et al., 2015).
Worldwide, marine turtle species are classified as vulnerable (loggerhead, olive ridley and leatherback), endangered (green) or critically endangered (Kemp’s ridley and hawksbill) (IUCN 2021). Sub-population level assessments are not available for all species but have classified the West Pacific leatherback and the South Pacific and Northeast Indian loggerhead sub-populations as critically endangered. The status and range of each turtle species in the Asia-Pacific is provided in Table 1.
The anthropogenic threats facing marine turtles are diverse and include injury from commercial and recreational fishing gear, direct harvest, use and trade of turtles and eggs, vessel strikes, loss and alteration of nesting habitat, degradation and loss of foraging habitat, entanglement in or ingestion of marine debris, ocean pollution, plastic pollution, ocean acidification and climate change (Wallace et al., 2011). Many countries prohibit the killing of marine turtles, while others legally permit the harvesting of turtles and their eggs. Illegal fisheries also pose a threat to turtles, shirking catch limits and bycatch regulations (e.g., gear modifications) as well as directly harvesting turtles to supply their
shells to the wildlife trade (Riskas et al., 2018).
Population trends vary among marine turtle species, regions and nesting populations. Wallace et al. (2011) provide a global assessment of the risks and threats to marine turtles at the level of Regional Management Units (RMU)2. Ten RMUs were identified as warranting the most urgent conservation intervention because of the combination of high risk and high threats. This group included more than half of the world’s hawksbill RMUs, roughly 40% of green turtle RMUs and all leatherback RMUs. The results are summarised by region in Table 2 and show that Australasia, the region that
© Veronica Joseph / WWF-Aust

15
corresponds most closely with the Asia-Pacific focus of this report, is categorised as facing high risks and high threats. Australasia’s Pacific Ocean basin was found to have the highest risk to marine turtles compared to all other ocean basins. The region also received a high threat score, with take (use and/or trade) considered one of the biggest threats.
Mazaris et al. (2017) also provide a global overview of marine turtle population trends, showing that populations are increasing in many regions. The available information
on mean population growth rates (weighted change in annual nesting abundance over a constant, six-year period post 2010) for the Asia-Pacific region is summarised in Table 3. It is important to note that these are the populations that were able to be assessed, rather than the totality of global turtle populations. These figures should therefore not be viewed as an exhaustive evaluation of population trends, but rather an indication of the trajectory of certain well-studied turtle populations. Unfortunately, the Asia-Pacific region continues to experience declining marine turtle populations.
Unfortunately, the Asia-Pacific region continues to experience declining marine turtle populations.
Table 1: Marine turtle species found in the Asia-Pacific region, their IUCN Red List status and range states. (Source data IUCN 2021; Adapted from Gomez and Krishnasamy, 2019, Table 1).
2Regional Management Units (RMUs) are spatially explicit population segments defined by biogeographical data on marine turtle species (Wallace et al., 2010).
SPECIES IUCN STATUS RANGE STATESHAWKSBILL TURTLEEretmochelys imbricata
Critically endangered American Samoa; Australia; British Indian Ocean Territory; Cambodia; China; Fiji; Guam; India; Indonesia; Japan; Malaysia; Maldives; Federated States of Micronesia; Myanmar; Palau; Papua New Guinea; Philippines; Samoa; Solomon Islands; Sri Lanka; Province of China, Taiwan; Thailand; Vanuatu; Vietnam.
GREEN TURTLE Chelonia mydas
Endangered American Samoa; Australia; Bangladesh; British Indian Ocean Territory; China; Christmas Island; Cocos (Keeling) Islands; Cook Islands; Fiji; French Polynesia; Guam; India; Indonesia; Japan; Kiribati; Malaysia; Maldives; Marshall Islands; Federated States of Micronesia; Myanmar; New Caledonia; New Zealand; Niue; Northern Mariana Islands; Palau; Papua New Guinea; Philippines; Solomon Islands; Sri Lanka; Thailand; Timor-Leste; Tokelau; Tuvalu; Vanuatu; Vietnam.
LEATHERBACK TURTLE Dermochelys coriacea
Vulnerable American Samoa; Australia; Bangladesh; Brunei; Cambodia; China; Fiji; French Polynesia; Guam; India; Indonesia; Japan; Kiribati; Democratic People's Republic of Korea; Republic of Korea; Malaysia; Marshall Islands; Federated States of Micronesia; Myanmar; New Caledonia; New Zealand; Northern Mariana Islands; Palau; Papua New Guinea; Philippines; Samoa; Solomon Islands; Sri Lanka; Province of China, Taiwan; Thailand; Tuvalu.
OLIVE RIDLEY TURTLE Lepidochelys olivacea
Vulnerable Australia; Bangladesh; Brunei; Cambodia; India (Nicobar Island and Andaman Island); Indonesia; Japan; Malaysia; Maldives; Myanmar; Papua New Guinea; Philippines; Sri Lanka; Province of China Taiwan; Thailand; Vietnam.
LOGGERHEAD TURTLECaretta caretta
Vulnerable Australia; Bangladesh; China; Fiji; French Polynesia; Indonesia; Japan; Republic of Korea; Malaysia; Myanmar; New Caledonia; New Zealand; Niue; Papua New Guinea; Philippines; Solomon Islands; Sri Lanka; Tokelau; Vietnam.
FLATBACK TURTLE Natator depressus
Data deficient Australia; Indonesia; Papua New Guinea.

WWF-AUSTRALIA 2021 | THE ECONOMIC VALUE OF MARINE TURTLES IN THE ASIA-PACIFIC REGION
REGIONAL MANAGEMENT UNIT SPECIES NAME MEAN ANNUAL GROWTH RATE
NORTH WEST PACIFIC Green -0.036
SOUTH WEST PACIFIC Flatback -0.021
WEST PACIFIC Leatherback -0.079
Table 3: Marine turtle population growth rates in the Asia-Pacific region. (source: Mazaris et al., 2017).
REGION NUMBER OF REGIONAL MANAGEMENT UNITS
AVERAGE RISK SCORE
AVERAGE THREAT SCORE
MOST PREVALENT CATEGORY*
NORTH ATLANTIC 7 1.68 2.19 LR-HT
EAST ATLANTIC 16 1.94 2.09 HR-HT
MEDITERRANEAN 4 1.65 2.25 LR-HT
WIDER CARIBBEAN 12 1.81 2.06 LR-HT
SOUTHWEST ATLANTIC 12 1.81 2.00 LR-HT
SOUTH ASIA 12 1.94 2.39 HR-HT
AUSTRALASIA 20 1.96 2.11 HR-HT
WEST INDIAN 12 1.93 2.03 HR-HT
EAST PACIFIC 11 2.14 2.01 HR-HT
PACIFIC ISLANDS 15 1.96 1.81 LR-LT
Table 2: Marine turtle average risk and threat scores by region. (adapted from Table 5 in Wallace et al., 2011).
* LR = Low Risk; HR = High Risk; LT = Low Threat; HT = High Threat
Marine turtles provide many benefits “ecosystem
services” to people.

17
1.4 STUDY OBJECTIVESThe overall objective of this study is to estimate the economic value of marine turtles in the Asia-Pacific region, to inform decision-making regarding turtle conservation. The specific objectives are to:
• Identify the main ecosystem services and economic values provided by marine turtles;
• Conduct a literature review of previous studies that estimate the economic value of marine turtles;
• Identify key gaps in existing knowledge on the economic values of marine turtles; and
• Estimate economic values for key ecosystem services provided by marine turtles in the Asia-Pacific region.
The primary target audience for the study are national-level policy-makers in the Asia-Pacific region, with the aim of strengthening the economic rationale for investing in marine turtle protection and management. The results may also be disseminated to other audiences, including the general public, conservation organisations, international policy fora, businesses and coastal communities that benefit from marine turtles.
1.3 NEED FOR INFORMATION ON THE ECONOMIC VALUE OF MARINE TURTLESMarine turtles provide a number of benefits to people (ecosystem services), including food and materials, opportunities for ecotourism, cultural identity, and in terms of the value that people place on the continued existence of diverse and fascinating wildlife. The economic value of these ecosystem services is a measure of their contribution to human wellbeing (see Section 4 for the conceptual framework used in this study). Information about the economic value of marine turtles has many potential uses, including to:
• Raise awareness of their value, which can highlight their overall importance to the public and policy-makers;
• Design effective policy instruments for environmental management. Anthropogenic activities that affect marine turtles
can be managed using a range of policy instruments, such as taxes, harvest quotas, certification and labelling, Marine Protected Areas, no-take provisions and trade restrictions. Restrictions can be placed on activities that threaten turtle populations, or price incentives set for projects or activities that are deemed to be ‘turtle safe’;
• Compare the costs and benefits of alternative uses of marine and coastal environments that impact marine turtles. For example, this may be done as part of marine spatial planning to evaluate the net benefits from alternative conservation or development activities;
• Reveal the distribution of costs and benefits of marine management decisions that impact marine turtles among different
stakeholder groups. Transparently measuring who incurs costs and who receives the benefits of resource depletion and conservation provides key information to ensure equitable policy-making and outcomes;
• Set compensation for damage to turtle populations that reflects the full economic loss; and/or
• Design mechanisms for sustainable financing of conservation, including setting appropriate fees for consumptive or non-consumptive uses of marine turtles.
This study estimates the economic value of marine turtles to strengthen the economic rationale for investing in marine turtle protection and management.
© WWF-Aus / Christine Hof

WWF-AUSTRALIA 2021 | THE ECONOMIC VALUE OF MARINE TURTLES IN THE ASIA-PACIFIC REGION
2.1 TOTAL ECONOMIC VALUEThe concept of Total Economic Value (TEV) is used to describe the comprehensive set of utilitarian values derived from a natural resource. It is useful for identifying the different types of value that may be derived from an ecosystem or species population. TEV comprises use values and non-use values. Use values are the benefits derived from physical use of the resource.
In the case of marine turtles, direct use values may derive from on-site extraction of resources (e.g., meat,
eggs and shells) or non-consumptive activities (e.g., ecotourism). Indirect use values are derived from off-site services or other processes that are impacted by the resource (e.g., control of sponges and transportation of nutrients). Option value is the value that people place on maintaining the option to use a resource in the future (e.g., the option to develop ecotourism).
Non-use values are derived from the knowledge that a species population is maintained without regard for any
current or future personal use. Non-use values may be related to altruism (maintaining a species population for use by others), bequest (for future generations) and existence (preservation unrelated to any use) motivations. The constituent values of TEV are represented in Figure 1. It should be noted that the “total” in Total Economic Value refers to the inclusion of all components of utilitarian value rather than the sum of all value derived from a resource — i.e., the TEV framework can be used to assess marginal changes in value as well as total values.
Figure 1: Components of Total Economic Value derived from marine turtles.
2 CONCEPTUAL FRAMEWORKThe conceptual framework applied in this study for identifying and valuing the benefits that people derive from marine turtles draws on both the Total Economic Value (TEV) framework (Pearce and Turner, 1990) and the Ecosystem Services (ES) approach (MA, 2005; TEEB, 2010). This framework builds on the conceptualisation of nature as a productive asset (natural capital), which provides humanity with a flow of inputs into production and consumption (Dasgupta, 2021).
e.g. meat, eggs, shells,
tourism
e.g. control of sponges
option for future use of
turtles
preservation, of turtles for
others
preservation, for future
generations
preservation, irrespective of
any use
TOTAL ECONOMIC VALUE
USE VALUE
DIRECT USE OPTIONINDIRECT USE ALTRUISM BEQUEST EXISTENCE
NON-USE VALUE
Total Economic Value is useful for identifying the different types of value that may be derived from an ecosystem or species population.

19
2.2 ECOSYSTEM SERVICESThe concept of ecosystem services provides another useful framework for identifying the importance of the living environment to humans. The term ecosystem services is an explicitly anthropocentric concept that refers to the contributions ecosystems make to human wellbeing (Haines-Young and Potschin, 2010). The Millennium Ecosystem Assessment (MA, 2005) classified ecosystem services into four categories, as follows:
• Provisioning services are the “products obtained from ecosystems” (e.g., food and raw materials);
• Regulating services are the “benefits obtained from the regulation of ecosystem processes” (e.g., biological control of pests and nutrient recycling);
• Cultural services are the “non-material benefits people obtain from ecosystems through spiritual enrichment, cognitive development, reflection, recreation and aesthetic experiences” (e.g., inspiration for art and design, tourism, and appreciation of the existence of diverse species); and
• Supporting services “are necessary for the production of all other ecosystem services” (e.g., soil formation and oxygen production).
The inclusion of supporting services can potentially lead to double counting of values. Other classification systems (e.g., The Economics of Ecosystems and Biodiversity – TEEB; and Common International Classification of Ecosystem Services – CICES) have therefore omitted such underlying services (Fisher and Turner, 2008).
Table 4 identifies some of the ecosystem services derived from marine turtles using a modified version of the TEEB classification (de Groot et al., 2010).
The classification of ecosystem services is complementary to the classification of different types of economic value within the TEV framework. Table 5 sets out the ways in which categories of ecosystem service and TEV components correspond.
© naturepl.com / Inaki Relanzon / WWF

WWF-AUSTRALIA 2021 | THE ECONOMIC VALUE OF MARINE TURTLES IN THE ASIA-PACIFIC REGION
2.3 THE CASE FOR ECONOMIC VALUATION OF ECOSYSTEM SERVICESThe concept of ecosystem services provides a useful framework for identifying the benefits that humans derive from nature. Quantifying this contribution in terms of economic value, using monetary units, can provide additional information for decision-making. There are, however, some limitations to the ecosystem services framework and frequent criticism of efforts to value ecosystem services in monetary terms (see Schröter et al., 2014; and Appendix 1).
Notwithstanding the acknowledged limitations and reservations, estimating the economic values of living resources can help to support better decision-making. Ecosystem services contribute substantially to human welfare and, in some cases, are fundamental to sustaining life (e.g., climate regulation and nutrient
recycling). The resulting natural capital is, however, finite and cannot necessarily be regenerated or replaced. With growing human populations, and consumption per capita increasing over time, it is often the case that the human use of renewable resources outstrips their natural rate of regeneration (i.e., human use is ecologically unsustainable).
Such resource limitations mean that we must constantly choose between alternative uses of available resources. Every time a decision is made to do one thing, this is also a decision to avoid another – value is implicitly placed on each option. If the valuation of alternative resource uses is unavoidable in making decisions, it is arguably better to make these values explicit and ensure that decisions are transparent and well informed.
© WWF-Aus / Christine Hof
Ecosystem services contribute substantially to human welfare and, in some cases, are fundamental to sustaining life.

21
TOTAL ECONOMIC VALUEDIRECT USE INDIRECT USE OPTION VALUE NON-USE
ECOSYSTEM SERVICE
PROVISIONING Meat, eggs, shells Option for future use
REGULATING Control of sponges Option for future use
CULTURAL Ecotourism Option for future use Existence value, etc.
Table 5: Correspondence between ecosystem services and components of Total Economic Value.
ECOSYSTEM SERVICE TURTLE SPECIFIC EXAMPLES
PROVISIONING SERVICES
Food Meat and eggs consumed for subsistence use or exchanged/traded domestically or internationally
Raw materials Turtle skin used to make leather; turtle bones used to make objects, including spades and adzes
Medicinal resources Turtle blood and oil as medicinal treatment; turtle penis as an aphrodisiac ingredient
Ornamental resources Turtle shells and bones used to make ornaments and accessories
REGULATING SERVICESBiological control Control of potential pest and coral competitor species (e.g., sponges);
grazing on invasive algae
Nutrient cycling Biological transportation of nutrients
CULTURAL SERVICES
Aesthetic enjoyment Visual enjoyment of turtles (e.g., in aquaria, images, films, etc.)
Opportunities for recreation and tourism
Recreational viewing of turtles in the wild or aquaria, including ecotourism turtle monitoring and observation
Inspiration for culture, art and design
Use of turtle images in culture, art and design (including coins, banknotes and flags)
Information for cognitive development Use of turtles for research and education
Spiritual experience Used in sacrificial ceremonies; considered incarnations of deities
Existence and bequest values
The values held by individuals for the continued existence of turtle species and populations, irrespective of any current or future use. Bequest value relates to potential enjoyment by future generations
Table 4: Ecosystem services provided by marine turtles.(adapted from Leung, 2019).

WWF-AUSTRALIA 2021 | THE ECONOMIC VALUE OF MARINE TURTLES IN THE ASIA-PACIFIC REGION
3.1 A BRIEF REVIEW OF THE LITERATUREThis section reviews the literature on the economic value of marine turtles. It builds on existing reviews and databases of the ecosystem services valuation literature, with a focus on marine turtles (e.g., Troëng and Drews, 2004; Leung, 2019; Environmental Valuation Reference Inventory – EVRI; Ecosystem Services Valuation Database – ESVD).
The search and selection criteria for the literature review were defined broadly in order to produce a comprehensive overview of existing studies. The geographic and temporal scope for selecting studies was not restricted. The types of publications include peer-reviewed journal articles, working papers, research reports, academic dissertations and theses, NGO publications and government reports.
The search of existing reviews and databases identified 56 studies that estimate the economic value of ecosystem services provided by marine turtles (see Appendix 2). Valuations of marine turtles have been conducted in at least 37 countries. The geographic distribution of marine turtle valuation studies is represented in Figure 2. Some countries have been more extensively studied than others, with 12 studies for
the United States, followed by Australia (8) and Greece (6). The countries in the Asia-Pacific region that have conducted marine turtle valuation studies include Australia, Indonesia, Malaysia, the Philippines, China, New Caledonia, Papua New Guinea, Thailand and Vietnam. It is notable that there are very few valuation studies for marine turtles in Pacific Island Countries and Territories (PICTs).
Figure 2: Number of marine turtle valuation studies per country.
3 PREVIOUS RESEARCH AND KNOWLEDGE GAPS
0
2
4
6
8
10
12
14
United
Stat
es of
Ameri
ca
Austra
lia
Greece
Costa
Rica
Mexico
Indon
esia
Barbad
os
Brazil
Comoro
s
Guatem
ala
Sri Lan
ka
Malays
ia
Nicarag
ua
Philipp
ines
Trinida
d and
Tobag
o
British
Virg
in Isl
ands
Worl
d
Caribb
ean N
etherl
ands
Canad
aChin
a
Colombia
Cape V
erdeCub
a
Domini
can R
epub
lic
Guade
loupe
Madag
asca
r
Maldive
s
New C
aledo
niaOman
Papua
New
Guin
ea
Reunio
n
Seych
elles
Thaila
nd
Turkey
Venez
uela
Vietna
m
COUNTRIES
NUMB
ER OF
STUD
IES
In over 37 countries worldwide, there have been 56 studies that estimate the ecosystem service value turtles provide, mainly focussed on recreation, tourism or their use value for food.
23
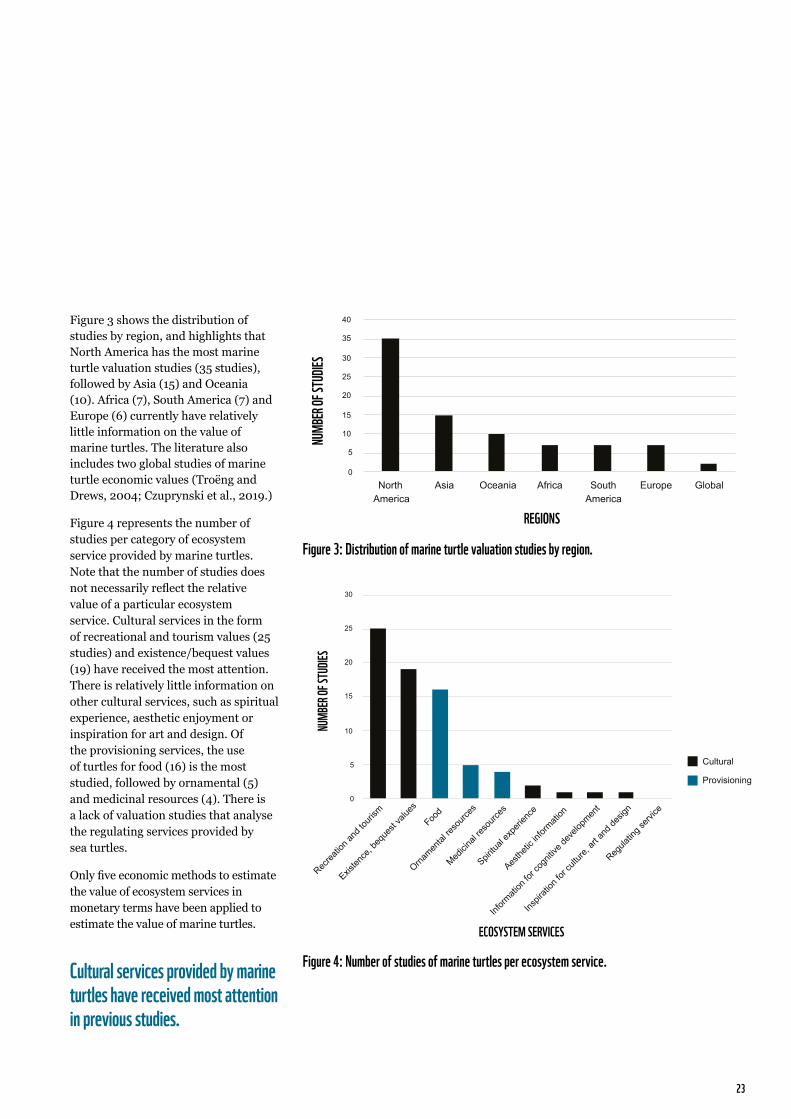
Figure 3 shows the distribution of studies by region, and highlights that North America has the most marine turtle valuation studies (35 studies), followed by Asia (15) and Oceania (10). Africa (7), South America (7) and Europe (6) currently have relatively little information on the value of marine turtles. The literature also includes two global studies of marine turtle economic values (Troëng and Drews, 2004; Czuprynski et al., 2019.)
Figure 4 represents the number of studies per category of ecosystem service provided by marine turtles. Note that the number of studies does not necessarily reflect the relative value of a particular ecosystem service. Cultural services in the form of recreational and tourism values (25 studies) and existence/bequest values (19) have received the most attention. There is relatively little information on other cultural services, such as spiritual experience, aesthetic enjoyment or inspiration for art and design. Of the provisioning services, the use of turtles for food (16) is the most studied, followed by ornamental (5) and medicinal resources (4). There is a lack of valuation studies that analyse the regulating services provided by sea turtles.
Only five economic methods to estimate the value of ecosystem services in monetary terms have been applied to estimate the value of marine turtles.
Cultural services provided by marine turtles have received most attention in previous studies.
Figure 3: Distribution of marine turtle valuation studies by region.
REGIONS
NUMB
ER OF
STUD
IES
0
5
10
15
20
25
30
35
40
NorthAmerica
Asia Oceania Africa SouthAmerica
Europe Global
Figure 4: Number of studies of marine turtles per ecosystem service.
ECOSYSTEM SERVICES
NUMB
ER OF
STUD
IES
0
5
10
15
20
25
30
Recrea
tion a
nd to
urism
Existen
ce, b
eque
st va
lues
Food
Ornamen
tal re
sourc
es
Medici
nal re
sourc
es
Spiritu
al ex
perie
nce
Aesthe
tic in
formati
on
Inform
ation
for c
ognit
ive de
velop
ment
Inspir
ation
for c
ulture
, art a
nd de
sign
Regula
ting s
ervice
Cultural
Provisioning

WWF-AUSTRALIA 2021 | THE ECONOMIC VALUE OF MARINE TURTLES IN THE ASIA-PACIFIC REGION
Table 6: Economic valuation methods applied to marine turtles.
Figure 5: Number of studies of marine turtles per valuation method.
VALUATION METHOD DESCRIPTION OF METHODChoice Modelling (Discrete Choice Experiment; Conjoint Analysis)
In a survey, beneficiaries of an ecosystem service are asked to make trade-offs between the provision of that ecosystem service and other goods or income, to elicit their specific willingness-to-pay for the service
Contingent Valuation In a survey, beneficiaries of an ecosystem service are asked to state their willingness-to-pay for the ecosystem service
Market Prices (Gross Revenue) Directly observe prices for an ecosystem service that beneficiaries pay in a market
Replacement Cost The cost of replacing an ecosystem service with an artificial equivalent
Value Transfer (Benefits Transfer)
Use existing information on the value of the ecosystem service at a different location or time (“study site”) to estimate the value of the ecosystem service at the location of present interest (“policy site”)
VALUATION METHOD
NUMB
ER OF
STUD
IES
0
5
10
15
20
25
30
ContingentValuation
Market Prices Choice Modelling Value Transfer Replacement Cost
In addition to measuring the benefits of marine turtles in the form of ecosystem services, we identified seven studies that estimate the cost of marine turtle conservation. This is potentially useful information for weighing up the benefits of conservation versus its costs (e.g., in a cost-benefit analysis of alternative conservation measures).
A number of economic methods have been developed to estimate the value of ecosystem services in monetary
terms. Several different methods have been applied to estimate the value of marine turtles (each is summarised in Table 6). Contingent valuation is the most widely used method (25 studies), followed by market price (15) and choice modelling (9) (Figure 5). It is notable that we did not find any travel cost valuations of recreation and tourism related to marine turtles. Value transfer and replacement cost methods have been used for four and three studies, respectively. Note that
the use of value transfer means that an existing value estimate is being applied to value turtle ecosystem services in a different context, which may or may not be similar in terms of key characteristics that determine value. The use of market prices to compute gross revenues from turtle-related activities is likely to result in over-estimates of economic value. This criticism has been made of the Troëng and Drews analysis (Campbell, 2007) and we attempt to address this in our analysis by computing net revenues.
25
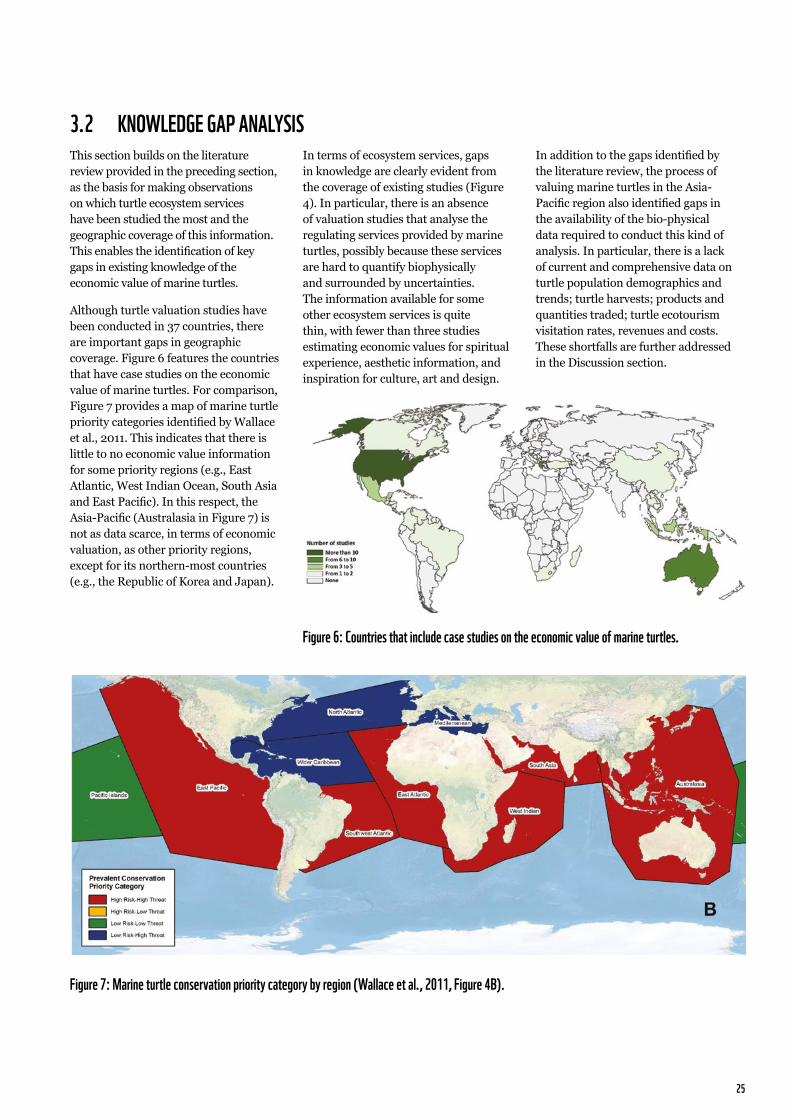
Figure 7: Marine turtle conservation priority category by region (Wallace et al., 2011, Figure 4B).
3.2 KNOWLEDGE GAP ANALYSISThis section builds on the literature review provided in the preceding section, as the basis for making observations on which turtle ecosystem services have been studied the most and the geographic coverage of this information. This enables the identification of key gaps in existing knowledge of the economic value of marine turtles.
Although turtle valuation studies have been conducted in 37 countries, there are important gaps in geographic coverage. Figure 6 features the countries that have case studies on the economic value of marine turtles. For comparison, Figure 7 provides a map of marine turtle priority categories identified by Wallace et al., 2011. This indicates that there is little to no economic value information for some priority regions (e.g., East Atlantic, West Indian Ocean, South Asia and East Pacific). In this respect, the Asia-Pacific (Australasia in Figure 7) is not as data scarce, in terms of economic valuation, as other priority regions, except for its northern-most countries (e.g., the Republic of Korea and Japan).
In terms of ecosystem services, gaps in knowledge are clearly evident from the coverage of existing studies (Figure 4). In particular, there is an absence of valuation studies that analyse the regulating services provided by marine turtles, possibly because these services are hard to quantify biophysically and surrounded by uncertainties. The information available for some other ecosystem services is quite thin, with fewer than three studies estimating economic values for spiritual experience, aesthetic information, and inspiration for culture, art and design.
In addition to the gaps identified by the literature review, the process of valuing marine turtles in the Asia-Pacific region also identified gaps in the availability of the bio-physical data required to conduct this kind of analysis. In particular, there is a lack of current and comprehensive data on turtle population demographics and trends; turtle harvests; products and quantities traded; turtle ecotourism visitation rates, revenues and costs. These shortfalls are further addressed in the Discussion section.
Figure 6: Countries that include case studies on the economic value of marine turtles.
WWF-AUSTRALIA 2021 | THE ECONOMIC VALUE OF MARINE TURTLES IN THE ASIA-PACIFIC REGION
© Hal Brindley / TravelforWildlife.com
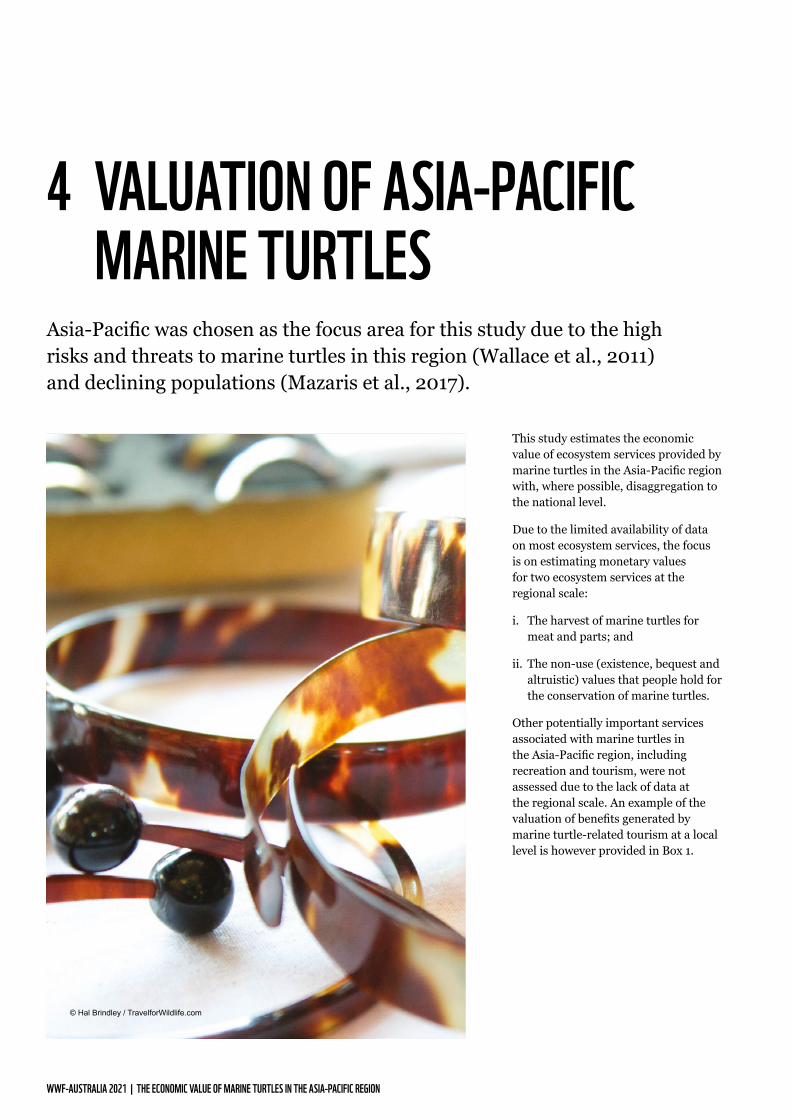
This study estimates the economic value of ecosystem services provided by marine turtles in the Asia-Pacific region with, where possible, disaggregation to the national level.
Due to the limited availability of data on most ecosystem services, the focus is on estimating monetary values for two ecosystem services at the regional scale:
i. The harvest of marine turtles for meat and parts; and
ii. The non-use (existence, bequest and altruistic) values that people hold for the conservation of marine turtles.
Other potentially important services associated with marine turtles in the Asia-Pacific region, including recreation and tourism, were not assessed due to the lack of data at the regional scale. An example of the valuation of benefits generated by marine turtle-related tourism at a local level is however provided in Box 1.
4 VALUATION OF ASIA-PACIFIC MARINE TURTLESAsia-Pacific was chosen as the focus area for this study due to the high risks and threats to marine turtles in this region (Wallace et al., 2011) and declining populations (Mazaris et al., 2017).

27
This case study is based on the report Cost-Benefit Analysis of business-as-usual conservation scenarios for marine turtles in Terengganu, Malaysia prepared for WWF-Malaysia by Louise Teh, Lydia Teh and Rushan bin Abdul Rahman (Teh et al., 2020). This study provided an overview of the ecosystem services derived from marine turtles and estimated their local economic value. It aimed to demonstrate the important contribution marine turtles make to society and to inform management decisions on marine turtle conservation. The services assessed included the harvest, trade and consumption of turtle eggs; non-consumptive turtle-related tourism; and the existence and bequest values for marine turtle species.
Two separate approaches were used to estimate the gross revenue from turtle-related tourism. The first used data on the number of visitors to marine parks; and the second used survey data on the importance of turtles in tourists’ decision to visit Terengganu. Averaging the results of these two approaches, the number of domestic and foreign tourists that visit Terengganu annually with the purpose of seeing marine turtles was estimated to be 900,000 and 145,000, respectively. The annual total expenditure by these tourists was estimated to be RM 1.85 billion (US $460 million per year), with total expenditure by domestic tourists almost double that of foreign tourists. Note that these estimates represent total
expenditure by tourists and do not account for the costs of providing tourism services. As such, they are likely to be over-estimates of producer surplus (gross revenue minus costs) derived from turtle-related tourism.
The study also provided an estimate of the contribution of turtle-related tourism to local incomes. Based on 1,269 and 1,360 locals employed in tourism jobs in Pulau Redang and Perhentian, respectively, the study estimated local income generated from turtle-related tourism to be RM 32 million (US $8 million).
These results suggest that tourists (and tour operators) derive considerable economic value from the viewing of marine turtles in the wild. However, it is not straightforward to extrapolate these results to a regional level. Further research would be required to gather data on the number and value of tourist visits to locations across the Asia-Pacific region, where marine turtles are regularly seen, and to distinguish the marginal value of viewing turtles from the many other benefits that tourists enjoy and are willing to pay for.
Box 1. Valuation of turtle-related tourism in Terengganu, Malaysia
-
200
400
600
800
1,000
1,200
1,400
Domestic Tourists Foreign Tourists
TOTA
L EXP
ENDIT
URE (
RM/Y
EAR;
MILLI
ONS)
Figure B1.1: Total annual expenditure on turtle-related tourism by domestic and foreign tourists.

WWF-AUSTRALIA 2021 | THE ECONOMIC VALUE OF MARINE TURTLES IN THE ASIA-PACIFIC REGION
The direct harvesting of marine turtles for meat, shells and other parts, and the collection of turtle eggs, has been practised by humans for millennia (Groombridge and Luxmoore, 1989; Frazier, 2003). The artisanal and subsistence harvest of marine turtles for local consumption, as part of traditional fisheries, may historically have been practised at sustainable levels (Frazier, 1980) but turtle harvests are now thought to contribute significantly to population declines (Humber et al., 2014).
The current value of marine turtles to harvesters can be estimated as the harvested quantity multiplied by relevant local prices, less the costs of harvesting. This provides a net value corresponding to a producer surplus or profit to the harvester. Where turtles are harvested for subsistence purposes, the estimated net value can be interpreted as a subsistence surplus to the household. Importantly, this approach does not provide a measure of consumer surplus from the consumption of marine turtles or their products.
Annual quantities of harvested marine turtles in the Asia-Pacific region are taken from Humber et al. (2014), which provides a global assessment of the legal and illegal direct take, based on a comprehensive review of the literature and expert consultations. The number of marine turtles harvested annually in the Asia-Pacific region is summarised by country in Table 4. This data, however, is not comprehensive and a number of countries in the region are not included (e.g., China, Malaysia, the Philippines, South Korea and Taiwan). Moreover, the data is derived only from publicly available sources and is likely to greatly underestimate actual harvested quantities. As a point of comparison, Vuto et al. (2019) used community-based monitoring methods to estimate that the annual number of marine turtles harvested in the Solomon Islands was 9,473, with a 95% confidence interval5 of 5,063-22,423 (i.e., the central estimate is five times higher than the Humber et al. estimate)6. In contrast, Opu (2018) interviewed community members in Papua New Guinea to estimate a figure of 4,760
The current value of marine turtles to harvesters can be estimated as the harvested quantity multiplied by relevant local prices, less the costs of harvesting.
© Jürgen Freund / WWF
4.1 HARVEST FOR FOOD AND MATERIALS
29
turtles caught in 2016, and 5,320 in 2017, which is approximately one-third of the Humber et al. estimate. The number of turtles harvested is evidently highly uncertain.
The gross economic value of this harvest is estimated by multiplying the harvested quantity by the price that harvesters are paid for unprocessed turtles. In the common case of harvesters consuming the turtles themselves, instead of selling them, the relevant price is for commodities that would be substituted in the absence of harvested turtles. This might be alternative forms of protein (e.g., fish or canned meat). In this analysis, we used the average local market price of US $28 per whole turtle (at 2020 prices). This price was obtained from a household survey conducted in Bougainville, Papua New Guinea (see Box 2). Lower and upper value estimates are computed using a median price of US $14 per turtle and the highest reported price of US $83 per turtle. These prices are broadly in line with those reported by Opu (2018) for Papua New Guinea. They may, however, be an underestimate of prices in other countries, given the fewer turtles harvested, higher incomes and willingness-to-pay. For example, the retail price of live turtles in Sabah, Malaysia, has been recorded as US
$350-500 (See Appendix 3). We used the prices recorded in the Bougainville survey because data on prices for harvested turtles across the region is limited and potentially inconsistent. The estimated values are therefore considered highly conservative.
Estimating the net economic value of turtle harvests requires the subtraction of annualised capital and variable costs from the gross value of harvest. Costs associated with harvesting marine turtles include basic gear (such as lines, hooks, nets, spears, goggles and lights), as well as boats and related expenses (such as fuel and boat maintenance). Data on the costs of harvesting turtles, however, is not available, so we have used estimates of the costs of subsistence fisheries from the literature (16% of gross revenue from Brander et al., 2021a) as a proxy.
Subsistence turtle harvesters are not paid a wage, but their time has value. Subtracting the opportunity costs of wage labour may be applicable in cases where wage-earning jobs are available to harvesters. However, in many instances, particularly in remote villages where there are no other employment opportunities, there are no true opportunity costs for time spent harvesting. We, therefore, do not
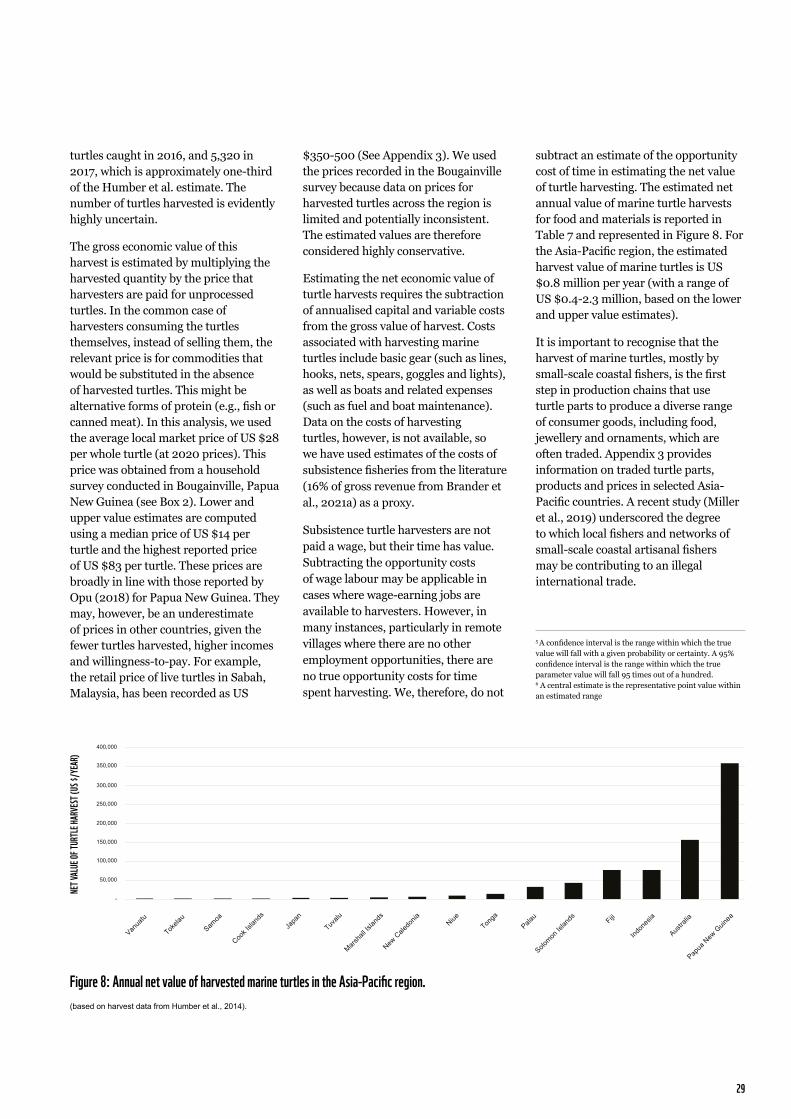
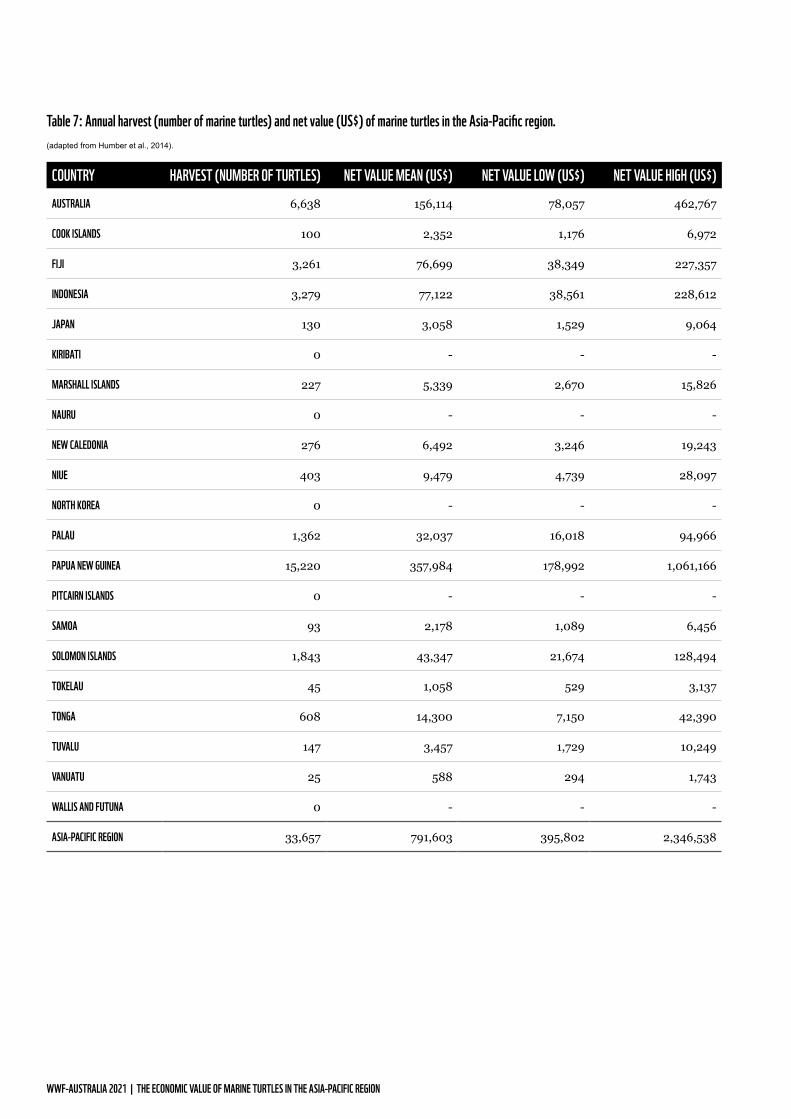
subtract an estimate of the opportunity cost of time in estimating the net value of turtle harvesting. The estimated net annual value of marine turtle harvests for food and materials is reported in Table 7 and represented in Figure 8. For the Asia-Pacific region, the estimated harvest value of marine turtles is US $0.8 million per year (with a range of US $0.4-2.3 million, based on the lower and upper value estimates).
It is important to recognise that the harvest of marine turtles, mostly by small-scale coastal fishers, is the first step in production chains that use turtle parts to produce a diverse range of consumer goods, including food, jewellery and ornaments, which are often traded. Appendix 3 provides information on traded turtle parts, products and prices in selected Asia-Pacific countries. A recent study (Miller et al., 2019) underscored the degree to which local fishers and networks of small-scale coastal artisanal fishers may be contributing to an illegal international trade.
5 A confidence interval is the range within which the true value will fall with a given probability or certainty. A 95% confidence interval is the range within which the true parameter value will fall 95 times out of a hundred. 6 A central estimate is the representative point value within an estimated range
Figure 8: Annual net value of harvested marine turtles in the Asia-Pacific region. (based on harvest data from Humber et al., 2014).
-
50,000
100,000
150,000
200,000
250,000
300,000
350,000
400,000
Vanua
tu
Tokela
u
Samoa
Cook I
sland
s
Japa
n
Tuvalu
Marsha
ll Isla
nds
New C
aledo
nia NiueTon
gaPala
u
Solomon
Islan
ds Fiji
Indon
esia
Austra
lia
Papua
New
Guin
ea
NET V
ALUE
OF TU
RTLE
HARV
EST (
US $/
YEAR
)
WWF-AUSTRALIA 2021 | THE ECONOMIC VALUE OF MARINE TURTLES IN THE ASIA-PACIFIC REGION
COUNTRY HARVEST (NUMBER OF TURTLES) NET VALUE MEAN (US$) NET VALUE LOW (US$) NET VALUE HIGH (US$)AUSTRALIA 6,638 156,114 78,057 462,767
COOK ISLANDS 100 2,352 1,176 6,972
FIJI 3,261 76,699 38,349 227,357
INDONESIA 3,279 77,122 38,561 228,612
JAPAN 130 3,058 1,529 9,064
KIRIBATI 0 - - -
MARSHALL ISLANDS 227 5,339 2,670 15,826
NAURU 0 - - -
NEW CALEDONIA 276 6,492 3,246 19,243
NIUE 403 9,479 4,739 28,097
NORTH KOREA 0 - - -
PALAU 1,362 32,037 16,018 94,966
PAPUA NEW GUINEA 15,220 357,984 178,992 1,061,166
PITCAIRN ISLANDS 0 - - -
SAMOA 93 2,178 1,089 6,456
SOLOMON ISLANDS 1,843 43,347 21,674 128,494
TOKELAU 45 1,058 529 3,137
TONGA 608 14,300 7,150 42,390
TUVALU 147 3,457 1,729 10,249
VANUATU 25 588 294 1,743
WALLIS AND FUTUNA 0 - - -
ASIA-PACIFIC REGION 33,657 791,603 395,802 2,346,538
Table 7: Annual harvest (number of marine turtles) and net value (US$) of marine turtles in the Asia-Pacific region. (adapted from Humber et al., 2014).

31
This case study describes the consumptive use of marine turtles in Bougainville, an autonomous region of Papua New Guinea (PNG) comprising a group of islands on the border of the Solomon Islands (see map). Bougainville inhabitants harvest marine turtles for different purposes and this is believed to have driven a decline in local turtle populations (Kinch et al., 2009).
A survey of 60 households using convenience sampling at three locations obtained information about the experience of harvesting turtles or collecting turtle eggs, and the use that households make of the harvest (for their own consumption, given to other villagers, or sold at market). More than half of the households interviewed reported engaging in turtle harvesting and almost one-third reported collecting turtle eggs. To a large extent, turtle meat and eggs were used for personal consumption or given to others (approximately 95%), with relatively small quantities sold at market.
Marine turtles are often used for cultural or special occasions, to celebrate public holidays, Christmas, birthdays and the opening of new houses (Figure B2.2). To a lesser extent, turtles are also used on occasions such as school closings, weddings, the opening of new churches, New Year and funerals.
This case study demonstrated the importance of the subsistence use of harvested turtles in some
countries. Turtle meat, eggs and shells were predominantly used for personal consumption or shared with other members of the village. Relatively little was sold at market. An implication of this is that the harvest and consumption of marine turtles is difficult to measure and likely to be largely unrecorded and underestimated.
The consumption of turtle meat is commonly associated with special occasions, such that the consumptive use may have cultural significance that is not necessarily reflected in the observed market prices. This has implications for conservation efforts, since it may be difficult (and ethically fraught) to persuade coastal communities to reduce their harvests or accept compensation.
Box 2. Case Study on the harvest and use of marine turtles in Bougainville, Papua New Guinea (source: Brander et al., 2021b)
Figure B2.1: Study site location.
CULTURAL PRACTICES
PERC
ENTA
GE
0%
5%
10%
15%
20%
25%
30%
35%
40%
Public holidays Christmas Birthdaycelebrations
Opening of anew house
School closing
Wedding day
Opening of achurcha
New Year Funeral
Figure B2.2: Use of marine turtles in cultural practices.
WWF-AUSTRALIA 2021 | THE ECONOMIC VALUE OF MARINE TURTLES IN THE ASIA-PACIFIC REGION
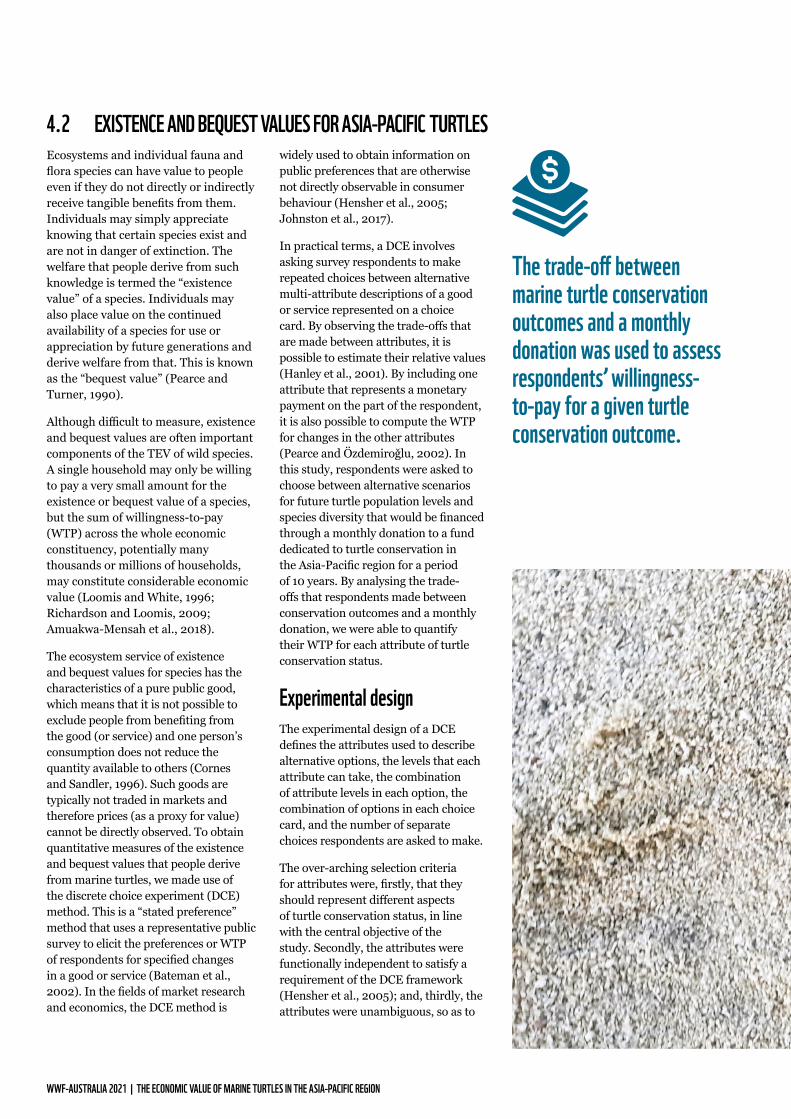
Ecosystems and individual fauna and flora species can have value to people even if they do not directly or indirectly receive tangible benefits from them. Individuals may simply appreciate knowing that certain species exist and are not in danger of extinction. The welfare that people derive from such knowledge is termed the “existence value” of a species. Individuals may also place value on the continued availability of a species for use or appreciation by future generations and derive welfare from that. This is known as the “bequest value” (Pearce and Turner, 1990).
Although difficult to measure, existence and bequest values are often important components of the TEV of wild species. A single household may only be willing to pay a very small amount for the existence or bequest value of a species, but the sum of willingness-to-pay (WTP) across the whole economic constituency, potentially many thousands or millions of households, may constitute considerable economic value (Loomis and White, 1996; Richardson and Loomis, 2009; Amuakwa-Mensah et al., 2018).
The ecosystem service of existence and bequest values for species has the characteristics of a pure public good, which means that it is not possible to exclude people from benefiting from the good (or service) and one person’s consumption does not reduce the quantity available to others (Cornes and Sandler, 1996). Such goods are typically not traded in markets and therefore prices (as a proxy for value) cannot be directly observed. To obtain quantitative measures of the existence and bequest values that people derive from marine turtles, we made use of the discrete choice experiment (DCE) method. This is a “stated preference” method that uses a representative public survey to elicit the preferences or WTP of respondents for specified changes in a good or service (Bateman et al., 2002). In the fields of market research and economics, the DCE method is
widely used to obtain information on public preferences that are otherwise not directly observable in consumer behaviour (Hensher et al., 2005; Johnston et al., 2017).
In practical terms, a DCE involves asking survey respondents to make repeated choices between alternative multi-attribute descriptions of a good or service represented on a choice card. By observing the trade-offs that are made between attributes, it is possible to estimate their relative values (Hanley et al., 2001). By including one attribute that represents a monetary payment on the part of the respondent, it is also possible to compute the WTP for changes in the other attributes (Pearce and Özdemiroǧlu, 2002). In this study, respondents were asked to choose between alternative scenarios for future turtle population levels and species diversity that would be financed through a monthly donation to a fund dedicated to turtle conservation in the Asia-Pacific region for a period of 10 years. By analysing the trade-offs that respondents made between conservation outcomes and a monthly donation, we were able to quantify their WTP for each attribute of turtle conservation status.
Experimental designThe experimental design of a DCE defines the attributes used to describe alternative options, the levels that each attribute can take, the combination of attribute levels in each option, the combination of options in each choice card, and the number of separate choices respondents are asked to make.
The over-arching selection criteria for attributes were, firstly, that they should represent different aspects of turtle conservation status, in line with the central objective of the study. Secondly, the attributes were functionally independent to satisfy a requirement of the DCE framework (Hensher et al., 2005); and, thirdly, the attributes were unambiguous, so as to
4.2 EXISTENCE AND BEQUEST VALUES FOR ASIA-PACIFIC TURTLES
The trade-off between marine turtle conservation outcomes and a monthly donation was used to assess respondents’ willingness-to-pay for a given turtle conservation outcome.

33
© Melissa Staines / WWF-Aus
not unintentionally increase the level of unobserved variance. The process of developing the survey questionnaire and testing of attributes used in the DCE is described in Appendix 4.
The experimental design in the present study included three attributes comprising two environmental characteristics and one payment vehicle. The turtle population attribute was described by three levels (declining, stable and increasing); while the diversity of marine turtles was described by four levels (0, 1, 2 and 3 species become extinct). The payment attribute was defined by seven levels (US $0, 2, 5, 10, 15, 20 and 30). The estimated value function for threatened and endangered species developed by Amuakwa-Mensah et al., (2018) was used to derive a preliminary estimate of mean household WTP for marine turtles, which served as a starting point for defining the payment amounts in our study7.
The monthly payments were described as voluntary contributions to a dedicated conservation fund, which would be used to pay for a range of conservation measures, such as turtle-safe fishing gear, protection of turtle habitats, sand-cooling structures, turtle nest protectors, and rangers to protect turtle nests from poaching. A voluntary donation was deemed to be the most realistic and acceptable payment mechanism but is recognised as prone to hypothetical strategic bias, since it is not mandatory (Johnston et al., 2017).
The survey was administered using seven versions targeting different populations: an international version distributed globally; and six country-specific versions for China, Fiji, Indonesia, Malaysia, the Philippines
and Vietnam, respectively. In the country-specific versions of the choice cards, the currency of the payment attribute was converted from US $ to national currencies using market exchange rates and adjusted in proportion with differences in per capita income between the US and each country. The income adjustment was made in order to scale the payment levels in line with average income. Converted amounts in national currencies were rounded to whole numbers and clear intervals (e.g., multiples of 5,000 in the case of Indonesia and Vietnam). The donation levels for each survey version are presented in Table 8.
7 The parameter values included in the value function were: “Reptile”; “Endangered and high charisma”; “Trust fund” (payment vehicle); and “Monthly payment” (frequency of donation). The response rate was set equal to the sample mean (61%) and the sample size to 3,000 responses. Using the value function developed by Amuakwa-Mensah et al. (2018), these parameter values give an estimated WTP/household/year of US $10.77.

WWF-AUSTRALIA 2021 | THE ECONOMIC VALUE OF MARINE TURTLES IN THE ASIA-PACIFIC REGION
© WWF-Malaysia / Eric Madeja
OTHER COUNTRIES CHINA MALAYSIA INDONESIA VIETNAM PHILIPPINES FIJI(USD) (CNY) (MYR) (IDR) (VND) (PHP) (FJD)
0 0 0 0 0 0 0
2 2 2 5,000 5,000 15 1
5 5 5 10,000 10,000 30 2
10 10 10 20,000 20,000 65 5
15 20 20 40,000 40,000 100 7
20 40 40 60,000 60,000 140 10
30 60 60 80,000 80,000 200 15
Table 8: Income-adjusted donation levels in alternative currencies.
The experimental design defined 60 choice cards. Each card presented three options depicting different scenarios of future turtle conservation outcomes, together with a corresponding payment amount. Respondents were asked to select their preferred option out of three; and then asked to repeat the choices over a total of six cards. Of the three options presented on each choice card, one option was held constant across all cards and represented a future (business as usual) scenario, in which no donation was made and the environmental attributes took the lowest possible levels (i.e., declining turtle populations and three species go extinct). This constant option provided respondents with an opt-out if they did not wish to pay for additional turtle conservation.

35
Figure 9: Sample choice card.
Figure 10: Asia-Pacific region and target countries for survey distribution, showing the geographic spread of respondents in each country (responses from other countries are not shown).
Choice representationThe attribute levels defining each option were represented on choice cards using pictograms to provide respondents with a visual support for understanding the differences between the three options. A sample choice card is provided in Figure 9. This representation was tested for comprehension through stakeholder consultation and pilot surveys and found to effectively communicate the levels of each attribute. The six choice cards seen by each respondent were randomly selected from a total set of 60 choice cards.
Before being asked to choose their preferred option on each choice card, respondents were prompted to consider carefully how much money they could actually afford to contribute each month and where that money would come from, given other expenses in their monthly budget. This reminded respondents that their donations were constrained by their income and helped to frame the conservation decision as a trade-off with other uses of income. The full survey instrument is provided in Appendix 5.
MALAYSIA CHINA
VIETNAM
INDONESIA
PHILIPPINES
FIJI
Option B
INCREASING
CONTRIBUTION PER MONTH
SPECIESDIVERSITY
TURTLEPOPULATION
OPTION A OPTION B OPTION C
STABLE DECLINING
1 SPECIES EXTINCT 3 SPECIES EXTINCT0 SPECIES EXTINCT
US$ 10 PER MONTH US$ 2 PER MONTH US$ 0 PER MONTH

WWF-AUSTRALIA 2021 | THE ECONOMIC VALUE OF MARINE TURTLES IN THE ASIA-PACIFIC REGION
7,765 respondents completed the discrete choice experiment survey.
Figure 11: Number of completed responses per survey, from a total of 7,765 completed responses.
Survey implementationThe survey was implemented using an online platform (SurveyGizmo) during the period 31 March to 10 August 2020. The survey was distributed in seven versions, including:
1. An international version in English and Spanish, distributed by email through a variety of professional, academic and personal networks;
2. Country-specific versions for China, Indonesia, Malaysia, the Philippines and Vietnam in national languages, distributed by email using a panel survey company (Ipsos); and
3. A country-specific version for Fiji, in English, conducted as a face-to-face intercept survey. This survey was administered by a team of WWF staff and volunteers using a copy of the online survey downloaded onto tablets and smart phones.
It is possible that the differences in sampling and survey administration have implications for the responses
obtained and the overall results. The six target countries and respondent locations are represented in Figure 10. In total, 10,548 respondents accessed one of the online survey instruments hosted by SurveyGizmo. Of these, 7,765 respondents (74%) completed the questionnaire.The number of complete responses per survey country is represented in Figure 11.
The sample is reasonably dispersed across age and income groups, and balanced by gender, but is biased towards people with a university education and those living in major urban areas. This has implications for the representativeness of the sample and we attempt to account for this when extrapolating the valuation results to the general population. Regarding direct experience of marine turtles, 43% of the sample said they had seen a live marine turtle, either in the wild or in a zoo/aquarium. A detailed description of respondent characteristics and responses is provided in Appendix 6.
Philippines (828)
Malaysia (1464)
Vietnam (1250)
Indonesia (1065)
International (858)
China (1078)
Fiji (1222)

37
Estimates of existence and bequest values for marine turtlesThe statistical analysis of the choice data is described in detail in Appendix 7. The results of the choice model are used to estimate median WTP for changes in the turtle population trend and the number of avoided species extinctions. The median WTP is used instead of the mean WTP to mitigate the influence of extreme outliers on the results. These values for the six target countries and the “rest of the world” are presented in Table 9. The estimated WTP for Fiji is unexpectedly high and possibly reflects the influence of the face-to-face mode of survey implementation in that country only.
The WTP amounts for a “stable population” and “increasing population” are defined relative to the current situation, with a declining turtle population in the Asia-Pacific region. In other words, the values
express the amount that households are willing to pay to achieve a change from declining to a stable or increasing turtle population. It is notable that the median WTP for an increasing turtle population is only marginally higher than the median WTP for a stable population. This suggests that people are most concerned about, and willing to pay to avoid, a declining population of marine turtles.
The median WTP for “species diversity” is defined per avoided turtle species extinction. These values are consistently lower than those estimated for improving the population trend, which suggests that people are more concerned about ensuring a healthy population of marine turtles than they are about the number of different turtle species that exist.
People are willing to pay to avoid declining turtle populations.
COUNTRY STABLE POPULATION INCREASING POPULATION SPECIES DIVERSITY
CHINA33.57
(26.48-41.83)38.33
(31.13-46.55)12.21
(10.12-14.56)
FIJI240.25
(165.48-332.48)274.17
(192.9-373.54)87.29
(62.64-117.14)
INDONESIA14.71
(11.95-17.86)16.82
(13.83-20.23)5.36
(4.45-6.37)
MALAYSIA12.99
(10.28-16.13)14.84
(12.09-17.93)4.73
(3.9-5.67)
PHILIPPINES9.07
(6.73-11.87)10.36
(7.83-13.37)3.3
(2.53-4.22)
VIETNAM16.43
(12.71-20.78)18.77
(14.88-23.25)5.98
(4.79-7.36)
OTHER COUNTRIES32.68
(26.11-40.28)37.31
(30.85-44.65)11.89
(10.03-13.94)
Table 9: Estimated median WTP for improvements in marine turtle conservation status in the Asia-Pacific region (US$/household/month; 2020 price levels; 95% statistical confidence intervals in parentheses).

WWF-AUSTRALIA 2021 | THE ECONOMIC VALUE OF MARINE TURTLES IN THE ASIA-PACIFIC REGION
Aggregate existence and bequest values for marine turtlesTo arrive at an aggregate measure of existence and bequest values for each country in the region, we estimated both the number of households that would be willing to donate money for marine turtle conservation and the amount that they would be willing to pay.
82% of survey respondents were willing to pay for marine turtle conservation. The sample of respondents, however, is not representative of the general
population of the region (respondents were generally younger, more educated and had higher incomes than average for their country). To account for these differences and estimate the number of households in each country that would be willing to pay for turtle conservation, we estimated a logistic regression to explain the variation in respondents’ indication that they were, in principle, willing to pay. The explanatory variables included in the regression model were age, gender, income and a dummy variable for each target country. The estimated model is reported in Table
10. The overall explanatory power of the model is low (Nagelkerke R2 = 0.073) but we obtained statistically significant coefficients for age (a negative relationship, indicating that older people are less likely to say they are willing to donate) and income (a positive relationship, indicating that people with higher incomes are more likely to say they are willing to donate). We found no statistically significant difference between men and women in terms of their in-principle WTP for turtle conservation.
Table 10: Logistic regression model for WTP in principle. (dependent variable: 0 = not willing to pay; 1 = willing to pay)
VARIABLE B (ESTIMATED COEFFICIENT) STANDARD ERROR P-VALUEAGE -0.028 0.003 <0.001
FEMALE -0.017 0.069 0.806
INCOME (LN) 0.336 0.032 <0.001
CHINA 0.656 0.139 <0.001
FIJI 0.929 0.164 <0.001
INDONESIA 0.237 0.127 0.062
MALAYSIA 0.225 0.122 0.064
PHILIPPINES 0.768 0.145 <0.001
VIETNAM 0.763 0.136 <0.001
CONSTANT -0.059 0.255 0.817
N 7,746
-2 LOG LIKELIHOOD 5642.845
NAGELKERKE R2 0.073

39
To estimate the proportion of households in each country that would be willing, in principle, to donate money to turtle conservation, we applied the characteristics of a representative household for each country (using median values for age and income) to the regression model described above. The estimated proportion of households and total number of households by country are reported in Table 11. Countries with younger and wealthier populations (e.g., Guam and Brunei) had a higher proportion of households that were willing to donate; whereas countries with older and poorer populations (e.g., Palau) had a lower proportion of households willing to donate.
To determine the median WTP per household in each country we estimated a separate model using the choice data that included interaction terms between the payment amount and age and income. This model was used to predict the median WTP of a representative household
by again inputting the median age and income for each country (See Appendix 7). We conservatively used the lower bound of the 95% confidence interval of median annual WTP per household for an improvement in the marine turtle population trend, from declining to stable.
For each country, the median WTP of a representative household was then multiplied by the estimated number of households in that country that are likely to be willing to donate money for marine turtle conservation. This yielded an estimate of the total annual WTP for each country. The results presented in Table 11 suggest that over 576 million households in the Asia-Pacific region would be collectively willing to pay US $45.7 billion annually over a 10-year period for an improvement in marine turtle populations (from declining to stable or increasing). This is a large sum but equivalent to just 0.2% of total household income in the region. Due to its large population, China accounted for two-thirds of this estimated total.
576 million households in the Asia-Pacific region would be collectively willing to pay US $45.7 billion annually over a 10-year period for an improvement in marine turtle populations.
US $45.7 BILLION

WWF-AUSTRALIA 2021 | THE ECONOMIC VALUE OF MARINE TURTLES IN THE ASIA-PACIFIC REGION
COUNTRYPROPORTION OF
HOUSEHOLDS WILLING TO PAY
NUMBER OF HOUSEHOLDS WILLING TO PAY
MEDIAN WTP PERHOUSEHOLD/YEAR
TOTAL WTP(US$/YEAR))
AMERICAN SAMOA 0.89 8,777 105.96 930,047
AUSTRALIA 0.89 9,100,925 84.21 766,428,746
BRUNEI 0.92 73,112 95.28 6,966,373
CAMBODIA 0.77 2,838,842 107.82 306,083,607
CHINA 0.80 370,478,750 83.49 30,930,512,361
COOK ISLANDS 0.89 4,238 82.03 347,651
FIJI 0.88 163,715 39.94 6,538,305
FRENCH POLYNESIA 0.91 65,781 91.69 6,031,460
GUAM 0.91 41,647 99.35 4,137,851
HONG KONG 0.85 2,283,728 71.09 162,348,208
INDONESIA 0.76 52,262,149 66.98 3,500,492,636
JAPAN 0.84 44,511,608 66.65 2,966,916,837
KIRIBATI 0.87 17,263 109.20 1,885,018
MACAU 0.90 198,634 77.79 15,452,337
MALAYSIA 0.85 5,959,356 70.75 421,620,116
MARSHALL ISLANDS 0.88 7,549 116.69 880,909
MICRONESIA 0.87 16,682 107.85 1,799,097
NAURU 0.78 1,416 111.37 157,705
NEW CALEDONIA 0.89 72,671 91.89 6,677,494
NEW ZEALAND 0.89 1,582,480 84.95 134,433,230
Table 11: Aggregated WTP for improvements in marine turtle population trends, from declining to stable, in the Asia-Pacific region (US$/year; 2020 price levels).

41
COUNTRYPROPORTION OF
HOUSEHOLDS WILLING TO PAY
NUMBER OF HOUSEHOLDS WILLING TO PAY
MEDIAN WTP PERHOUSEHOLD/YEAR
TOTAL WTP(US$/YEAR))
NIUE 0.87 458 108.07 49,481
NORTH KOREA 0.70 4,086,197 87.40 357,136,741
NORTHERN MARIANA ISLANDS 0.89 15,472 91.13 1,409,961
PALAU 0.78 4,848 87.98 426,543
PAPUA NEW GUINEA 0.86 1,452,583 116.62 169,400,720
PHILIPPINES 0.79 18,441,367 60.66 1,118,723,258
SAMOA 0.88 25,184 110.72 2,788,336
SINGAPORE 0.87 1,547,440 88.21 136,498,025
SOLOMON ISLANDS 0.85 105,910 117.53 12,447,239
SOUTH KOREA 0.87 18,527,844 74.76 1,385,175,906
TAIWAN 0.85 5,938,458 76.56 454,642,836
THAILAND 0.80 15,005,433 82.26 1,234,289,324
TIMOR-LESTE 0.86 194,435 126.96 24,684,984
TOKELAU 0.88 230 116.51 26,747
TONGA 0.88 16,403 115.01 1,886,580
TUVALU 0.84 1,646 106.64 175,542
VANUATU 0.87 55,988 118.01 6,607,294
VIETNAM 0.80 21,688,232 73.01 1,583,448,896
WALLIS AND FUTUNA 0.83 2,346 89.46 209,864
ASIA-PACIFIC REGION 576,799,798 79.28 45,730,668,262

WWF-AUSTRALIA 2021 | THE ECONOMIC VALUE OF MARINE TURTLES IN THE ASIA-PACIFIC REGION
To put these estimated values into context, we summarised the results of 305 valuations of household WTP to conserve various wildlife species, obtained from 74 publications (see Table 12). These valuations cover a range of different terrestrial and marine species from around the world and include:
• birds (e.g., griffon vultures — Becker et al., 2005; bald eagles — Boyle and Bishop, 1987; northern pintails — Haefele et al., 2019);
• fish (e.g., coho salmon — Bell et al., 2003; whale sharks — Indab, 2016; shortnose sturgeons — Kotchen and Reiling, 2000);
• reptiles (e.g., green turtles, —Teh et al., 2018; loggerhead turtles — Whitehead et al., 1992); and
• mammals (e.g., lions and gorillas — Morse-Jones et al., 2014; Asian elephants — Nabangchang, 2008; African elephants — Poufoun et al., 2016; black rhinoceros — Lee and Du Preez, 2016; grey whales — Loomis and Larson, 2004).
The split of valuation estimates across terrestrial and marine species was approximately even. To facilitate comparison across value estimates, we standardised the reported WTP to US$/household/year at 2020 price levels.
Our results for marine turtle conservation in the Asia-Pacific region were similar in magnitude to the mean household WTP for coral and mammal conservation, and somewhat higher than the mean household WTP for reptiles. Our estimate of household WTP for marine turtle conservation in the Asia-Pacific region (US $79/household/year) was below the highest
value WTP for marine turtles reported in the literature (about US $153/household/year expressed by visitors for conservation of marine turtles at Mon Repos Beach, Queensland, Australia – Tisdell and Wilson, 2001) and considerably lower than WTP for Asian elephants (US $1,074/household/year – Bandara and Tisdell, 2004), beluga whales, harbour seals and blue whales (US $212/household/year – Boxall et al., 2012) and orangutans (US $200/household/year – Zander et al., 2014).
It is worth noting that the geographic scope of conservation scenarios valued in the literature is generally much smaller than the Asia-Pacific region. The majority of studies assessed local or sub-national conservation programs. This suggests that our WTP estimates for conservation at a continental scale are not out of proportion. Comparing our results to those of Jin et al. (2010), for example, who used the contingent valuation method to estimate mean household WTP for marine turtle conservation in China (US $16.30), the Philippines (US $5.87), Vietnam (US $10.22) and Thailand (US $18.12), we observe that our estimated household WTP for these countries follows the same relative ordering but with higher absolute values. In addition to differences in study design and the geographic scope of the conservation programs (Jin et al., assess national and multi-country conservation programs), the apparent increase in median household WTP over the 10-year gap between studies could potentially reflect both increasing incomes and the growing strength of public support for wildlife conservation in Asian societies.
Our results for marine turtle conservation in the Asia-Pacific region were similar in magnitude to the mean household WTP for coral and mammal conservation.
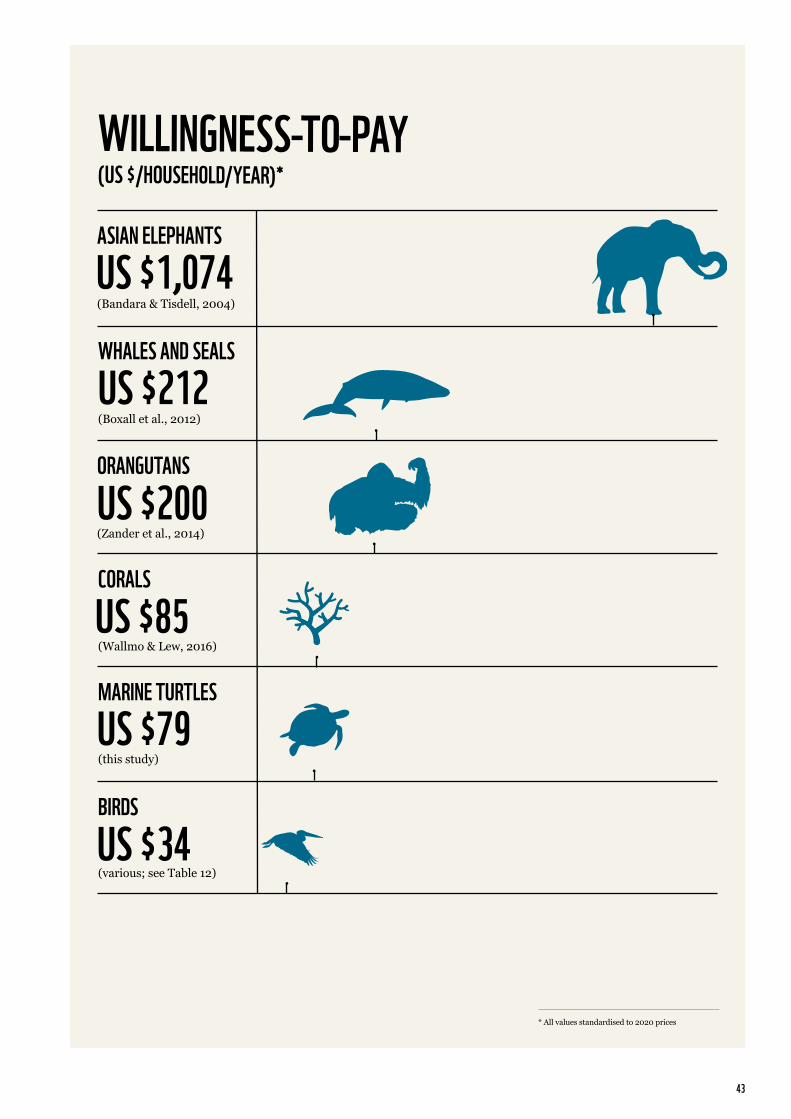
43
WILLINGNESS-TO-PAY (US $/HOUSEHOLD/YEAR)*
US $79MARINE TURTLES
US $34
US $85
BIRDS
CORALS
US $1,074ASIAN ELEPHANTS
US $212WHALES AND SEALS
US $200ORANGUTANS
(Zander et al., 2014)
(Bandara & Tisdell, 2004)
(Boxall et al., 2012)
(this study)
(Wallmo & Lew, 2016)
(various; see Table 12)
* All values standardised to 2020 prices
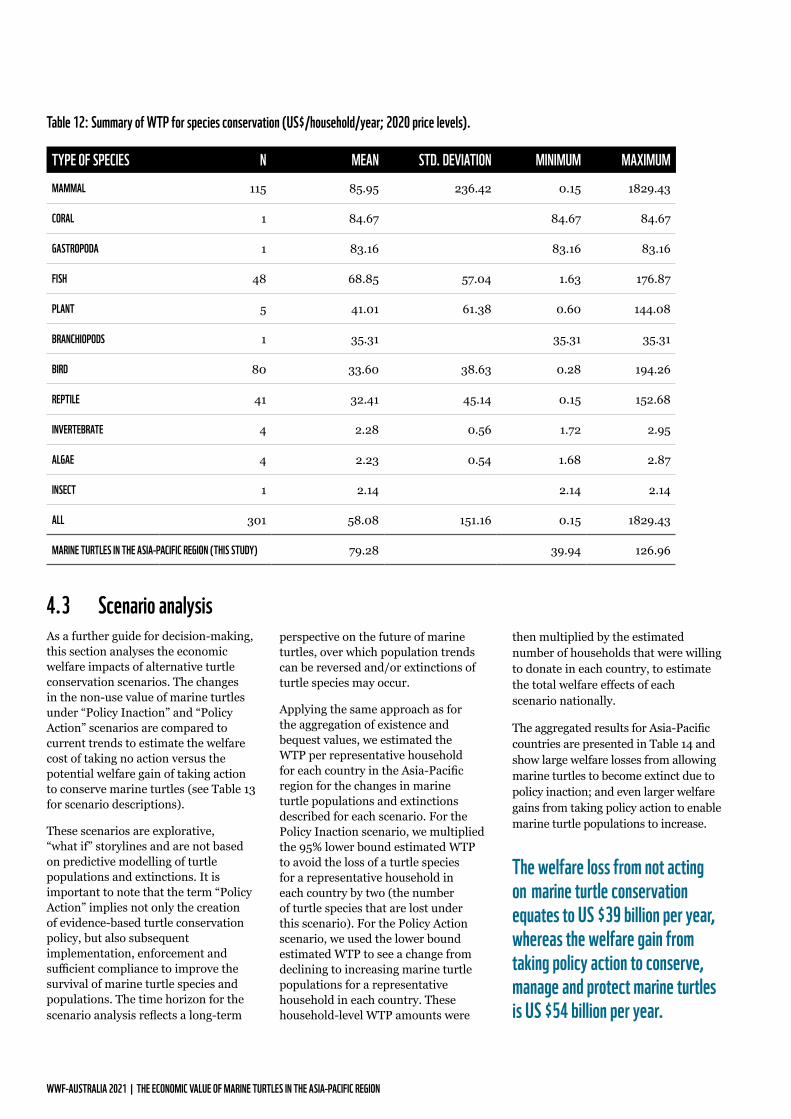
WWF-AUSTRALIA 2021 | THE ECONOMIC VALUE OF MARINE TURTLES IN THE ASIA-PACIFIC REGION
4.3 Scenario analysis As a further guide for decision-making, this section analyses the economic welfare impacts of alternative turtle conservation scenarios. The changes in the non-use value of marine turtles under “Policy Inaction” and “Policy Action” scenarios are compared to current trends to estimate the welfare cost of taking no action versus the potential welfare gain of taking action to conserve marine turtles (see Table 13 for scenario descriptions).
These scenarios are explorative, “what if” storylines and are not based on predictive modelling of turtle populations and extinctions. It is important to note that the term “Policy Action” implies not only the creation of evidence-based turtle conservation policy, but also subsequent implementation, enforcement and sufficient compliance to improve the survival of marine turtle species and populations. The time horizon for the scenario analysis reflects a long-term
perspective on the future of marine turtles, over which population trends can be reversed and/or extinctions of turtle species may occur.
Applying the same approach as for the aggregation of existence and bequest values, we estimated the WTP per representative household for each country in the Asia-Pacific region for the changes in marine turtle populations and extinctions described for each scenario. For the Policy Inaction scenario, we multiplied the 95% lower bound estimated WTP to avoid the loss of a turtle species for a representative household in each country by two (the number of turtle species that are lost under this scenario). For the Policy Action scenario, we used the lower bound estimated WTP to see a change from declining to increasing marine turtle populations for a representative household in each country. These household-level WTP amounts were
then multiplied by the estimated number of households that were willing to donate in each country, to estimate the total welfare effects of each scenario nationally.
The aggregated results for Asia-Pacific countries are presented in Table 14 and show large welfare losses from allowing marine turtles to become extinct due to policy inaction; and even larger welfare gains from taking policy action to enable marine turtle populations to increase.
The welfare loss from not acting on marine turtle conservation equates to US $39 billion per year, whereas the welfare gain from taking policy action to conserve, manage and protect marine turtles is US $54 billion per year.
TYPE OF SPECIES N MEAN STD. DEVIATION MINIMUM MAXIMUMMAMMAL 115 85.95 236.42 0.15 1829.43
CORAL 1 84.67 84.67 84.67
GASTROPODA 1 83.16 83.16 83.16
FISH 48 68.85 57.04 1.63 176.87
PLANT 5 41.01 61.38 0.60 144.08
BRANCHIOPODS 1 35.31 35.31 35.31
BIRD 80 33.60 38.63 0.28 194.26
REPTILE 41 32.41 45.14 0.15 152.68
INVERTEBRATE 4 2.28 0.56 1.72 2.95
ALGAE 4 2.23 0.54 1.68 2.87
INSECT 1 2.14 2.14 2.14
ALL 301 58.08 151.16 0.15 1829.43
MARINE TURTLES IN THE ASIA-PACIFIC REGION (THIS STUDY) 79.28 39.94 126.96
Table 12: Summary of WTP for species conservation (US$/household/year; 2020 price levels).

45
© Placebo365 / iStock Unreleased / Getty Images
SCENARIO DESCRIPTION
CURRENT This scenario describes the current trend (“business as usual”) in which no marine turtle extinctions have occurred but populations in the Asia-Pacific region are declining.
POLICY INACTION This scenario represents a situation with no additional conservation intervention or regulatory enforcement. Marine turtle populations continue to decline and two species become extinct.
POLICY ACTION
This scenario describes a future in which conservation interventions are successful, resulting in increasing turtle populations and no species extinctions. Conservation interventions might include:
• National action plans to mitigate threats to marine turtle populations, affording species and their habitat protection;
• The Convention on International Trade in Endangered Species of Wild Fauna and Flora (CITES) introducing a total ban on the international trade in turtle products, which is enforced by all Parties to the Convention (i.e. signatory governments);
• Parties to the Convention on the Conservation of Migratory Species of Wild Animals (CMS) agree to and implement effective conservation management plans for migratory marine turtles;
• The ratification, by major seafood producers and importers, of the Agreement on Port State Measures to Prevent, Deter and Eliminate Illegal, Unreported and Unregulated fishing (IUU); and
• Achievement of the UN Sustainable Development Goal relating to sustainable fisheries, IUU fishing and marine protection (SDG14).
Table 13: Scenario descriptions.

WWF-AUSTRALIA 2021 | THE ECONOMIC VALUE OF MARINE TURTLES IN THE ASIA-PACIFIC REGION
Table 14: Welfare changes due to policy inaction and action for marine turtle conservation (US$/year; 2020 price level).
COUNTRY POLICY INACTION(DECLINING TURTLE POPULATIONS AND TWO SPECIES BECOME EXTINCT)
POLICY ACTION(INCREASING TURTLE POPULATIONS AND NO EXTINCTIONS)
AMERICAN SAMOA -803,336 1,109,096
AUSTRALIA -667,734,175 915,838,403
BRUNEI -6,027,479 8,281,539
CAMBODIA -263,841,177 365,025,238
CHINA -26,936,807,766 36,902,648,697
COOK ISLANDS -302,205 414,025
FIJI -5,928,169 7,887,021
FRENCH POLYNESIA -5,239,345 7,170,318
GUAM -3,576,424 4,908,288
HONG KONG -142,194,394 193,895,324
INDONESIA -2,914,055,818 4,184,742,251
JAPAN -2,612,433,403 3,565,464,080
KIRIBATI -1,624,953 2,249,226
MACAU -13,454,903 18,383,149
MALAYSIA -349,040,563 502,148,808
MARSHALL ISLANDS -758,718 1,053,693
MICRONESIA -1,551,222 2,144,857
NAURU -135,565 188,241
NEW CALEDONIA -5,798,309 7,943,738
NEW ZEALAND -117,186,715 160,289,178
NIUE -42,682 59,009
NORTH KOREA -310,893,796 427,079,601
NORTHERN MARIANA ISLANDS -1,224,875 1,677,931
PALAU -371,169 509,260
PAPUA NEW GUINEA -145,873,231 202,506,876
PHILIPPINES -894,368,908 1,325,290,631
SAMOA -2,399,708 3,333,097
SINGAPORE -118,870,019 162,833,819
SOLOMON ISLANDS -10,704,485 14,904,847

47
COUNTRY POLICY INACTION(DECLINING TURTLE POPULATIONS AND TWO SPECIES BECOME EXTINCT)
POLICY ACTION(INCREASING TURTLE POPULATIONS AND NO EXTINCTIONS)
SOUTH KOREA -1,209,412,063 1,654,620,656
TAIWAN -395,388,278 540,466,110
THAILAND -1,075,137,966 1,473,299,471
TIMOR-LESTE -21,189,691 29,499,247
TOKELAU -23,024 31,952
TONGA -1,621,985 2,250,655
TUVALU -151,423 209,704
VANUATU -5,681,421 7,907,295
VIETNAM -1,332,639,302 1,903,185,780
WALLIS AND FUTUNA -182,401 250,604
ASIA-PACIFIC REGION -39,574,671,065 54,601,701,716
US $54 BILLION PER YEAR GAIN
US $39 BILLION PER YEAR LOSS
Welfare increase due to policy action for marine turtle conservation in Asia-Pacific
Welfare loss due to policy inaction for marine turtle conservation in Asia-Pacific
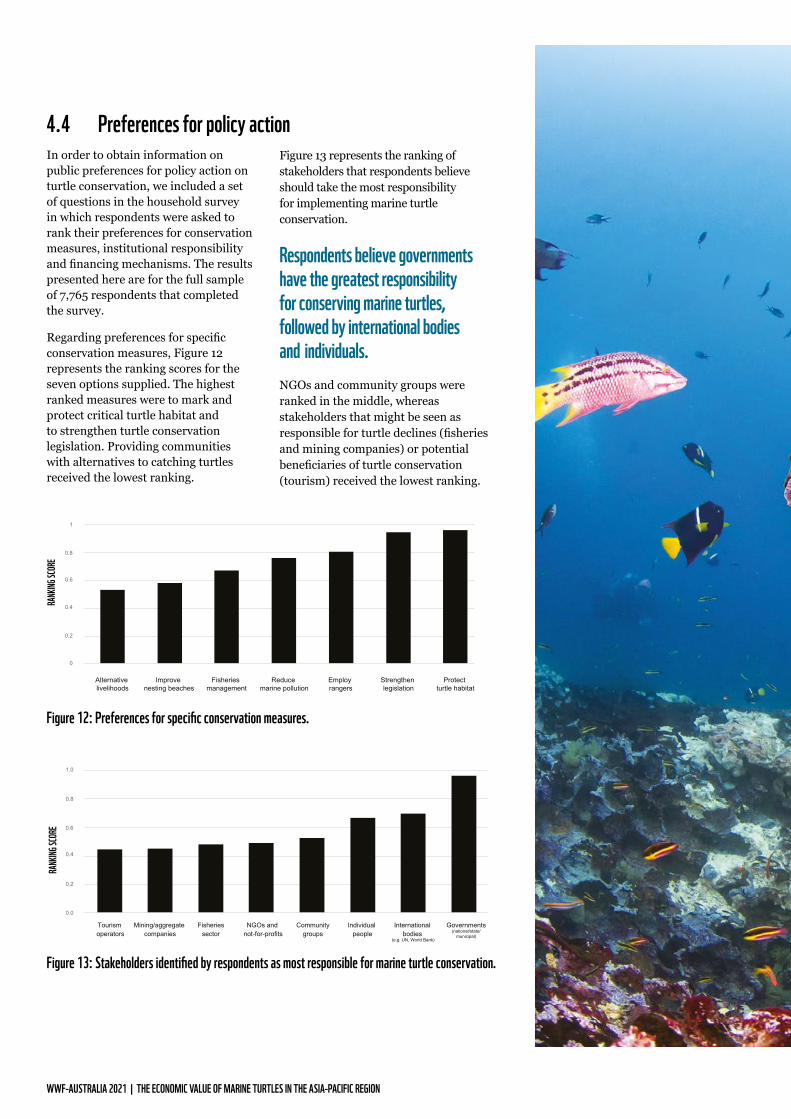
WWF-AUSTRALIA 2021 | THE ECONOMIC VALUE OF MARINE TURTLES IN THE ASIA-PACIFIC REGION
4.4 Preferences for policy action In order to obtain information on public preferences for policy action on turtle conservation, we included a set of questions in the household survey in which respondents were asked to rank their preferences for conservation measures, institutional responsibility and financing mechanisms. The results presented here are for the full sample of 7,765 respondents that completed the survey.
Regarding preferences for specific conservation measures, Figure 12 represents the ranking scores for the seven options supplied. The highest ranked measures were to mark and protect critical turtle habitat and to strengthen turtle conservation legislation. Providing communities with alternatives to catching turtles received the lowest ranking.
Figure 13 represents the ranking of stakeholders that respondents believe should take the most responsibility for implementing marine turtle conservation.
Respondents believe governments have the greatest responsibility for conserving marine turtles, followed by international bodies and individuals. NGOs and community groups were ranked in the middle, whereas stakeholders that might be seen as responsible for turtle declines (fisheries and mining companies) or potential beneficiaries of turtle conservation (tourism) received the lowest ranking.
0
0.2
0.4
0.6
0.8
1
RANK
ING SC
ORE
Protect turtle habitat
Strengthen legislation
Employ rangers
Reduce marine pollution
Fisheries management
Improve nesting beaches
Alternative livelihoods
Figure 12: Preferences for specific conservation measures.
Figure 13: Stakeholders identified by respondents as most responsible for marine turtle conservation.
0.0
0.2
0.4
0.6
0.8
1.0
Mining/aggregate companies
Individual people
RANK
ING SC
ORE
Tourism operators
Governments(national/state/
municipal)
International bodies
(e.g. UN, World Bank)
Communitygroups
Fisheriessector
NGOs and not-for-profits
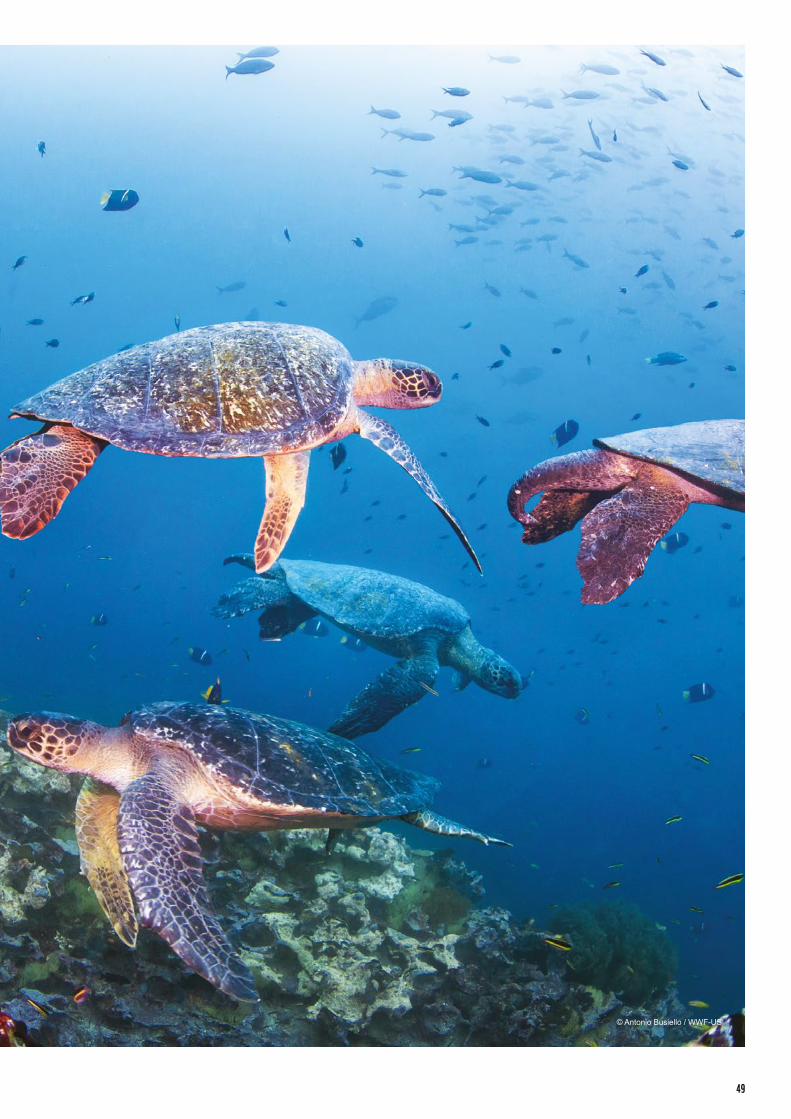
49
© Antonio Busiello / WWF-US
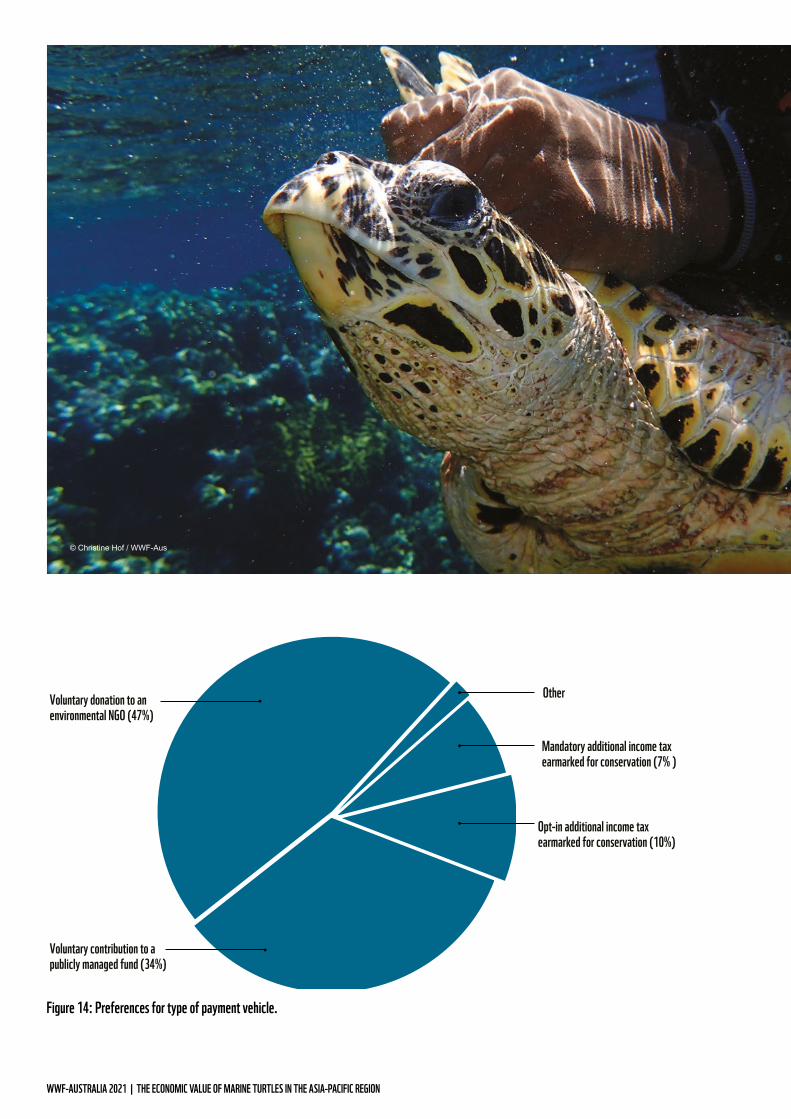
WWF-AUSTRALIA 2021 | THE ECONOMIC VALUE OF MARINE TURTLES IN THE ASIA-PACIFIC REGION
Other
Mandatory additional income tax earmarked for conservation (7% )
Opt-in additional income tax earmarked for conservation (10%)
Voluntary contribution to a publicly managed fund (34%)
Voluntary donation to an environmental NGO (47%)
Figure 14: Preferences for type of payment vehicle.
© Christine Hof / WWF-Aus

51
Regarding the financing of turtle conservation, Figure 14 presents respondents’ preferences for alternative payment vehicles. The most popular option was to make voluntary donations to an environmental NGO, followed by voluntary donations to a publicly managed fund. Mandatory or opt-in income tax contributions that are earmarked for conservation were less popular.
Figure 15 presents respondents’ preferences for the timing of donations. The most popular option was to make monthly donations for a limited period of time (40% of respondents), followed by one-off donations (34%) and monthly donations indefinitely (25%). Respondents who selected the “other” payment option were asked to specify what that was. Of these respondents, many indicated they would make donations occasionally, when they had money to spare.
The most popular conservation measures were those that provide direct protection (such as protecting critical turtle habitat, strengthening legislation and employing turtle rangers) over measures that compensate or disincentivise turtle harvesting (such as developing alternative livelihoods for turtle harvesters). Respondents see governments as the insititution with prime responsibility for implementing marine turtle conservation (over international organisations, community groups, NGOs or the private sector). To finance conservation activities, the most popular structure would be voluntary monthly donations for a limited period of time to a fund that is managed by a public institution or an environmental NGO. Compulsory payments, such as a tax, were not popular.
Figure 15: Preferences for the timing of donations.
Monthly contributionsfor a limited time (40%)
Other (1%)
One-o� contribution (34%)
Monthly contributionsindefinitely (25%)
WWF-AUSTRALIA 2021 | THE ECONOMIC VALUE OF MARINE TURTLES IN THE ASIA-PACIFIC REGION
Understanding the associated loss in ecosystem services and human welfare can potentially motivate action and increased financing to protect and restore marine turtle populations. This study provides a global review and summary of the literature on the economic value of marine turtles, and estimates the value of provisioning services and non-use values that marine turtles provide in the Asia-Pacific region. Ecotourism related to marine turtles is also of economic importance but was not valued at the regional scale in this study due to a lack of data.
The total annual net value of marine turtles to harvesters in the Asia-Pacific region was estimated to be US $800 thousand (range $0.4-2.3 million). Although this value is not high, it represents an important source of nutrition and income to relatively poor households, and in some contexts the use of turtles has cultural significance.
Across the Asia-Pacific region as a whole, 82% of households appear to be willing to pay substantial sums to prevent marine turtle populations from declining and species going extinct. The median WTP based on our survey was US $79 per household per year, which includes an adjustment to account for differences between the survey sample and the general population in each country. This value is comparable to WTP for coral and mammal species, but lower than for some other species, like Asian elephants.
We extrapolated median household WTP across the Asia Pacific region, based on the proportion of households who said they were willing to pay (and once again adjusting for differences between the survey sample and the general population). This yielded a conservative estimate of US $45.7 billion per year as the value that 576 million households across the Asia-Pacific region would be willing to pay to ensure stable or increasing marine turtle populations. This estimate is characterised by high uncertainty, but nevertheless conveys the widespread public appreciation for turtle conservation in the region.
Our results also revealed the large welfare losses people may experience from allowing marine turtles to become extinct due to policy inaction (US $39 billion per year). Notably, the welfare gains from taking policy action to enable marine turtle populations to increase are even larger (US $54 billion per year).
As such, the economic benefit of investing in the conservation of turtle populations is huge, but letting them go extinct will result in massive economic cost. Our results provide a strong economic rationale for governments to increase their investments in marine turtle conservation and explore publicly-funded marine turtle conservation programs.
5 DISCUSSION AND CONCLUSIONS5.1 SUMMARY OF FINDINGSMarine turtle species face loss of habitat, declining populations and, in some cases, extinction. Population trends vary among species, regions and nesting populations but, in general, the Asia-Pacific region faces high risks and high threats, and continues to experience turtle population declines
The economic benefit of investing in the conservation of marine turtle populations is huge, but letting them go extinct will result in massive economic cost.

53
The difference in value revealed by this study is stark: total WTP for the conservation of marine turtles across the Asia-Pacific region is over 50,000 times greater than the local subsistence value of turtle harvests (US $45.7 billion divided by US $800 thousand per year). Even if the non-use value of marine turtles was less than half as large (US $20 billion per year), and local harvesting was over 10 times more valuable (US $10 million per year), the difference would still be overwhelming.
This disparity in economic benefit does not negate the importance of local and cultural values associated with marine turtle harvesting, which may be timeless and virtually priceless for some coastal communities. But the difference does raise questions for future research, conservation policy and field interventions, as discussed further below.
Marine turtle conservation requires financing, and has cost implications for the institutions implementing conservation measures, the sectors that are required to change practices, coastal development and the small-scale fishers that currently harvest turtles. The cost of conservation raises important issues of equity and compensation, particularly where
income and nutritional sources are at stake. Our results indicate that the economic benefits of marine turtle conservation are very high and there is scope for funding compensation, alternative livelihoods, or other incentives to discourage the unsustainable harvesting of marine turtles. We found that people see governments as the insititution with primary responsibility for designing and implementing marine turtle conservation (over international organisations, community groups, NGOs or the private sector). To finance conservation, the most popular structure was voluntary monthly donations, for a limited period of time, to a fund managed by a public institution or environmental NGO.
© WWF-Aus / Christine Hof

WWF-AUSTRALIA 2021 | THE ECONOMIC VALUE OF MARINE TURTLES IN THE ASIA-PACIFIC REGION
The analysis and results described in this report are constrained by several limitations and uncertainties. These are identified below and intended to support future research.
Regarding the provisioning services from marine turtles, there is, in general, a lack of data and high uncertainty on the quantities of turtles and eggs harvested. Similarly, prices paid for harvested marine turtles vary across and within countries. Better data on the cost of harvesting (in terms of equipment, fuel and time) is needed to estimate the net values accruing to turtle harvesters. In addition, an assessment of the long-term value of turtle harvests requires an understanding of the effect of harvesting and other pressures on turtle populations (i.e., the sustainability of harvesting). The valuation of turtle harvests in this report provides a snapshot of the current harvest level but does not assess whether this level is sustainable. Such an assessment would require understanding and modelling of harvests and population dynamics over time.
Recreational and tourism values related to marine turtles were not assessed at a regional scale in this report, principally due to a lack of data. A regional valuation of the economic importance
of recreational and tourism activities related to marine turtles (e.g., eco-tourism, volunteeer tourism, diving, snorkelling and viewing) would require data on the numbers of people that engage in such activities in different locations; the revenues and costs to diving, snorkelling and other tourism service providers; and the willingness of tourists and other beneficiaries to pay to view marine turtles, relative to other attractions. Using social media data to identify references to turtles in travel reviews and photos (e.g., Sinclair et al., 2018; Spalding and Parrett, 2019) is one potential way to measure the role of marine turtles in recreation and tourism actvities.
The valuation of existence and bequest values for marine turtles using stated preference methods faces a gamut of limitations and potential biases. Potential future refinements might include the use of alternative payment vehicles to avoid hypothetical bias associated with voluntary donations; using quantitative measures of change in turtle populations; specifying attributes for specific turtle species; and testing for the influence of the survey mode on respondent choice and uncertainty.
There is a lack of data and high uncertainty on the quantities of marine turtles and eggs harvested.
5.2 CAVEATS AND DIRECTIONS FOR FUTURE RESEARCH

55
The evaluation of marine turtle conservation measures would require a direct comparison of both the cost and benefits of alternative options. Such a cost-benefit analysis would require quantified measurement of the effectiveness of various conservation actions and their respective costs, including both implementation costs and the opportunity costs of restricted activities. At a national level, evaluating the extent to which the benefits of turtle conservation outweigh the costs (which could include many different actions addressing the threats facing marine turtles) and the relative cost-effectiveness of specific measures requires further research.
What are the social impacts of conservation interventions, especially for coastal communities that use marine turtles for subsistence and/or cultural activities?
Additional questions for future research projects include:How can we ‘capture’ public WTP for marine turtle conservation (i.e. turn hypothetical demand for non-use value into real cashflow)?
How can local turtle harvesters be recruited to support turtle conservation (i.e. can they switch from ‘poachers’ to ‘turtle keepers’)?

WWF-AUSTRALIA 2021 | THE ECONOMIC VALUE OF MARINE TURTLES IN THE ASIA-PACIFIC REGION
Alchemer, 2020. Alchemer survey tool: https://www.alchemer.com/survey-tools/
Amuakwa-Mensah, F., Bärenbold, R. and O. Riemer. 2018. Deriving a benefit transfer function for threatened and endangered species in interaction with their level of charisma. Environments, 5(2), 31.
Bandara, R. and Tisdell, C. 2004. The net benefit of saving the Asian elephant: a policy and contingent valuation study. Ecological Economics, 48(1), 93-107.
Bateman, I.J., Carson, R.T., Day, B., Hanemann, M., Hanley, N., Hett, T., Jones-Lee, M., Loomes, G., Mourato, S., Pearce, D.W. and R. Sugden. 2002. Economic valuation with stated preference techniques: a manual. Edward Elgar.
Becker, N., Inbar, M., Bahat, O., Choresh, Y., Ben-Noon, G. and O. Yaffe. 2005. Estimating the economic value of viewing griffon vultures (Gyps fulvus): A travel cost model study at Gamla Nature Reserve, Israel. Oryx, 39(4), pp.429-434.
Bell, K.P., Huppert, D. and R.L Johnson. 2003. Willingness to pay for local coho salmon enhancement in coastal communities. Marine Resource Economics, 18(1), pp.15-31.
Bliemer, M.C. and Rose, J.M. 2013. Confidence intervals of willingness-to-pay for random coefficient logit models. Transportation Research Part B: Methodological, 58, 199-214.
Boxall, P.C., Adamowicz, W.L., Olar, M., West, G.E. and G. Cantin. 2012. Analysis of the economic benefits associated with the recovery of threatened marine mammal species in the Canadian St. Lawrence Estuary. Marine Policy, 36(1), 189-197.
Boyle, K.J. and Bishop, R.C. 1987. Valuing wildlife in benefit—cost analyses: A case study involving endangered species. Water Resources Research, 23(5), pp.943-950.
Brander, L. 2013. Guidance manual on value transfer methods for ecosystem services. United Nations Environment Programme.
Brander, L.M., Passfield, K., McKessar, K., Davey, K., Guisado, V., Eppink, F., Conner, N. and H. Weeks. 2021a. Cook Islands Marine Ecosystem Service Valuation. Report to the Cook Islands National Environment Service.
Brander, L.M., Adloff, S. and V. Guisado-Goni. 2021b. Harvest and use of marine turtles in Bougainville, Papua New Guinea. Report for WWF Australia.
Campbell, L.M. and Smith, C. 2006. What makes them pay? Values of volunteer tourists working for sea turtle conservation. Environmental Management, 38(1), 84-98.
Campbell, L.M. 2007. Local conservation practice and global discourse: a political ecology of sea turtle conservation. Annals of the Association of American Geographers, 97(2), 313-334.
Caussade, S., de Dios Ortúzar, J., Rizzi, L.I. and D.A. Hensher. 2005. Assessing the influence of design dimensions on stated choice experiment estimates. Transportation Research Part B: Methodological, 39(7), 621-640. doi: 10.1016/j.trb.2004.07.006
Cazabon-Mannette, M., Schuhmann, P.W., Hailey, A. and J. Horrocks. 2017. Estimates of the non-market value of sea turtles in Tobago using stated preference techniques. Journal of Environmental Management, 192, pp.281-291.
CBD. 2020. Convention on Biological Diversity Global Biodiversity Outlook 5. Montreal.
Chami, R., Fullenkamp, C., Berzaghi, F., Español-Jiménez, S., Marcondes, M. and J. Palazzo, J., 2020. On Valuing Nature-Based Solutions to Climate Change: A Framework with Application to Elephants and Whales. Economic Research Initiatives at Duke (ERID) Working Paper No. 297, Duke University, Durham, NC.
CMC. 2018. CMC choice modelling code for R. Choice Modelling Centre. University of Leeds. www.cmc.leeds.ac.uk.
Cornes, R. and Sandler, T. 1996. The theory of externalities, public goods, and club goods. Cambridge University Press.
Czuprynski et al., 2019. The hidden value of sea turtles: An exploration of the distance decay relationship from proximal and distal value perspectives. Vrije Universiteit Amsterdam.
Daly, H. 2020. A note in defense of the concept of natural capital. Ecosystem Services, 41, 101051.
Dasgupta, P. 2021. The Economics of Biodiversity: The Dasgupta Review. HM Treasury.
De Groot, R., Brander, L., van der Ploeg, S., Bernard, F., Braat, L., Christie, M., Costanza, R., Crossman, N., Ghermandi, A., Hein, L., Hussain, S., Kumar, P., McVittie, A., Portela, R., Rodriguez, L.C., ten Brink, P. and P. van Beukering. 2012. Global estimates of the value of ecosystems and their services in monetary units. Ecosystem Services, 1(1), 50-61.
De Groot, R.S., Fisher, B., Christie, M., Aronson, J., Braat, L., Haines-Young, R., Gowdy, J., Maltby, E., Neuville, A., Polasky, S., Portela, R. and I. Ring. 2010. Integrating the ecological and economic dimensions in biodiversity and ecosystem service valuation. The Economics of Ecosystems and Biodiversity (TEEB): Ecological and Economic Foundations (pp. 9-40). Earthscan, Routledge.
de Vasconcellos Pegas, F. and Stronza, A. 2010. Ecotourism and sea turtle harvesting in a fishing village of Bahia, Brazil. Conservation and Society, 8(1), 15-25.
6 REFERENCES

57
Dutton, P.H. and Squires, D. 2008. Reconciling biodiversity with fishing: a holistic strategy for Pacific sea turtle recovery. Ocean Development and International Law, 39(2), 200-222.
Engeman, R.M., Shwiff, S.A., Constantin, B., Stahl, M. and H.T. Smith. 2002. An economic analysis of predator removal approaches for protecting marine turtle nests at Hobe Sound National Wildlife Refuge. Ecological Economics, 42(3), 469-478.
ESVD. 2020. Ecosystem Services Valuation Database 1.0, (20/05/2020), Foundation for Sustainable Development, https://esvd.net.
EVRI. 2020. Environmental Valuation Reference Inventory (20/05/2020), https://evri.ca/en/user
Fan, Z. 2008. Investigating the Potential for a PES (Payment for Environmental Services) System for Marine Turtle Conservation: The Case of Protection of Marine Turtle Breeding Sites in Crete, Greece. Master’s Thesis, ITC, Enschede, The Netherlands.
Fisher, B. and Turner, R.K. 2008. Ecosystem services: classification for valuation. Biological Conservation, 141(5), 1167-1169.
Frazier, J. 1980. Exploitation of marine turtles in the Indian Ocean. Human Ecology, 8(4), pp.329-370.
Frazier, J. 2003. Prehistoric and ancient historic interactions between humans and marine turtles. In The biology of sea turtles, Volume II (ed. by P.L. Lutz, J.A. Musick and J. Wyneken), Vol. 2, pp. 1–38. CRC Press.
Gallai, N., Salles, J.M., Settele, J. and B.E. Vaissière. 2009. Economic valuation of the vulnerability of world agriculture confronted with pollinator decline. Ecological Economics, 68(3), 810-821.
Gomez, L. and Krishnasamy, K. 2019. A rapid assessment on the trade in marine turtles in Indonesia, Malaysia and Vietnam. TRAFFIC.
Groombridge, B. and Luxmoore, R. 1989. The green turtle and hawksbill (Reptilia: Cheloniidae): world status, exploitation and trade. CITES Secretariat of the Convention on International Trade in Endangered Species of Wild Flora and Fauna.
Gutic, J. 1994. Sea turtle ecotourism brings economic benefit to community. Marine Turtle Newsletter, 64, 10-12.
Haefele, M.A., Loomis, J.B., Lien, A.M., Dubovsky, J.A., Merideth, R.W., Bagstad, K.J., Huang, T.K., Mattsson, B.J., Semmens, D.J., Thogmartin, W.E. and R. Wiederholt. 2019. Multi-country willingness to pay for transborder migratory species conservation: A case study of northern pintails. Ecological Economics, 157, pp.321-331.
Haines-Young, R. and Potschin, M. 2010. The links between biodiversity, ecosystem services and human well-being. Ecosystem Ecology: a new synthesis, 1, 110-139.
Hamed, A., Madani, K., Von Holle, B., Wright, J., Milon, J. W. and M. Bossick. 2016. How much are Floridians willing to pay for protecting sea turtles from sea level rise? Environmental Management, 57(1), 176-188
Hanley, N., Mourato, S. and R. Wright. 2001. Choice modelling approaches: A superior alternative for environmental valuation? Journal of Economic Surveys, 15(3), pp. 435-462.
Hanson, L.W., Allen, B.J., Bourke, R.M. and T.J. McCarthy. 2001. Papua New Guinea rural development handbook. Australian National University.
Hensher, D., Rose, J. and W. Greene. 2005. Applied choice analysis: A primer. Cambridge University Press.
Hess, S. and Palma, D., 2019. Apollo: a flexible, powerful and customisable freeware package for choice model estimation and application. Journal of Choice Modelling, 32, p.100170.
Humber, F., Godley, B.J. and A.C. Broderick. 2014. So excellent a fishe: a global overview of legal marine turtle fisheries. Diversity and Distributions, 20(5), 579-590.
IBM. 2017. IBM SPSS Statistics for Windows, Version 25.0. IBM Corp.
Indab, A.L. 2016. Willingness to pay for whale shark conservation in Sorsogon, Philippines. In Marine and Coastal Ecosystem Valuation, Institutions, and Policy in Southeast Asia, pp. 93-128. Springer, Singapore.
IPBES. 2019. Summary for policy-makers of the global assessment report on biodiversity and ecosystem services of the Intergovernmental Science-Policy Platform on Biodiversity and Ecosystem Services. IPBES Secretariat.
IUCN. 2021. The IUCN Red List of Threatened Species. Version 2021-1. https://www.iucnredlist.org. Downloaded on 26 March 2021.
Jin, J., Indab, A., Nabangchang, O., Thuy, T.D., Harder, D. and R.F. Subade. 2010. Valuing marine turtle conservation: A cross-country study in Asian cities. Ecological Economics, 69(10), pp.2020-2026.
Johnston, R.J., Boyle, K.J., Adamowicz, W., Bennett, J., Brouwer, R., Cameron, T.A., Hanemann, W.M., Hanley, N., Ryan, M., Scarpa, R., Tourangeau, R. and C.A. Vossler. 2017. Contemporary guidance for stated preference studies. Journal of the Association of Environmental and Resource Economists, 4(2), 319-405.
Kibria, A.S., Behie, A., Costanza, R., Groves, C. and T. Farrell. 2017. The value of ecosystem services obtained from the protected forest of Cambodia: The case of Veun Sai-Siem Pang National Park. Ecosystem Services, 26, 27-36.

WWF-AUSTRALIA 2021 | THE ECONOMIC VALUE OF MARINE TURTLES IN THE ASIA-PACIFIC REGION
Kido, A. and Seidl, A. 2008. Optimizing protected area entry fees across stakeholders: the Monarch Butterfly Biosphere Reserve, Michoacan, Mexico. Environment and Development Economics, 229-243.
Kinch, J., Anderson, P. and K. Anana. 2009. Assessment of leatherback turtle nesting and consumptive use in the autonomous region of Bougainville, Papua New Guinea. Western Pacific Regional Fisheries Management Council.
Kontogianni, A., Tourkolias, C., Machleras, A. and M. Skourtos. 2012. Service providing units, existence values and the valuation of endangered species: A methodological test. Ecological Economics, 79, 97-104.
Kotchen, M.J. and Reiling, S.D. 2000. Environmental attitudes, motivations, and contingent valuation of nonuse values: a case study involving endangered species. Ecological Economics, 32(1), pp.93-107.
Krinsky, I. and Robb, A.L. 1986. On approximating the statistical properties of elasticities. The Review of Economics and Statistics, 715-719.
Lancaster, K. 1966. A new approach to consumer theory. Journal of Political Economy, vol. 74, pp. 132–157.
Lee, D.E. and Du Preez, M. 2016. Determining visitor preferences for rhinoceros conservation management at private, ecotourism game reserves in the Eastern Cape Province, South Africa: A choice modeling experiment. Ecological Economics, 130, pp.106-116.
Leung, W. 2019. Ecosystem services framework for marine turtles. University of Exeter.
Loomis, J.B. and Larson, D.M. 1994. Total economic values of increasing gray whale populations: results from a contingent valuation survey of visitors and households. Marine Resource Economics, 9(3), pp.275-286
Loomis, J.B. and White, D.S. 1996. Economic benefits of rare and endangered species: summary and meta-analysis. Ecological Economics, 18(3), 197-206.
Louvière, J.J., Hensher, D. and J. Swait. 2000. Stated choice methods: Analysis and applications. Cambridge University Press.
MA. 2005. Millennium Ecosystem Assessment: Ecosystems and human well-being (Vol. 5). Island Press, Washington, D.C.
Manski, C.F. 1977. The structure of random utility models. Theory and Decision, 8(3), 229-254. doi: 10.1007/BF00133443.
Mazaris, A.D., Schofield, G., Gkazinou, C., Almpanidou, V. and G.C. Hays. 2017. Global sea turtle conservation successes. Science Advances, 3(9), e1600730.
Mazzotta, M.J. and Opaluch, J.J. 1995. Decision-making when choices are complex: a test of Heiner's hypothesis. Land Economics, pp. 500-515.
McFadden, D. 1974. Conditional logit analysis of qualitative choice behavior. In Zarembka, P. (ed.) Frontiers in Econometrics, pp. 105–142. Academic Press.
McLellan, E., Arps, E., Donnelly, M. and A. Leslie. 2012. WWF Global Marine Turtle Strategy 2.0 2012–2020. WWF.
Miller, E. A., McClenachan, L., Uni, Y., Phocas, G., Hagemann, M. E., & Van Houtan, K. S. (2019). The historical development of complex global trafficking networks for marine wildlife. Science advances, 5(3), eaav5948.
Morse-Jones, S., Bateman, I.J., Kontoleon, A., Ferrini, S., Burgess, N.D. and R.K. Turner. 2014. Stated preferences for tropical wildlife conservation amongst distant beneficiaries: charisma, endemism, scope and substitution effects. In Valuing Ecosystem Services. Edward Elgar Publishing.
Nabangchang, O. 2008. Private contributions towards the provision of public goods: the conservation of Thailand's endangered species. EEPSEA, IDRC Regional Office for Southeast and East Asia, Singapore, SG.
Naidoo, R., Fisher, B., Manica, A. and A. Balmford. 2016. Estimating economic losses to tourism in Africa from the illegal killing of elephants. Nature Communications, 7(1), 1-9.
Nunes, A.V., Peres, C.A., Constantino, P.D.A.L., Santos, B.A. and E. Fischer. 2019. Irreplaceable socioeconomic value of wild meat extraction to local food security in rural Amazonia. Biological Conservation, 236, 171-179.
Opu, J. 2018. An assessment of marine turtle exploitation in Papua New Guinea. Final Report prepared for the Secretariat of the Pacific Regional Environment Programme (SPREP).
Pearce, D.W. and Turner, R.K. 1990. Economics of Natural Resources and the Environment. Harvester Wheatsheaf, London.
Pearce, D. and Özdemiroǧlu, E. 2002. Economic valuation with stated preference techniques: summary guide. Department for Transport, Local Government and the Regions.
Poufoun, J.N., Abildtrup, J., Sonwa, D.J. and P. Delacote. 2016. The value of endangered forest elephants to local communities in a transboundary conservation landscape. Ecological Economics, 126, pp.70-86.
Rathnayake, R.M.W. 2016. ‘Turtle watching’: A strategy for endangered marine turtle conservation through community participation in Sri Lanka. Ocean and Coastal Management, 119, pp.199-207.
R Core Team. 2018. R: A Language and Environment for Statistical Computing. R Foundation for Statistical Computing. https://www.R-project.org
Rice, S.M. and Moore, M.K. 2008. Trade secrets: a ten-year overview of the illegal import of sea turtle products into the United States. Marine Turtle Newsletter, (121), 1-5.
Richardson, L. and Loomis, J. 2009. The total economic value of threatened, endangered and rare species: an updated meta-analysis. Ecological Economics, 68(5), 1535-1548.

59
Riskas, K.A., Tobin, R.C., Fuentes, M.M. and M. Hamann. 2018. Evaluating the threat of IUU fishing to sea turtles in the Indian Ocean and Southeast Asia using expert elicitation. Biological Conservation, 217, 232-239.
Rose, J.M., Bliemer, M.C., Hensher, D.A. and A.T. Collins. 2008. Designing efficient stated choice experiments in the presence of reference alternatives. Transportation Research Part B: Methodological, 42(4), 395-406.
Rudd, M.A. 2009. National values for regional aquatic species at risk in Canada. Endangered Species Research, 6(3), pp.239-249
Schröter, M., Van der Zanden, E.H., van Oudenhoven, A.P., Remme, R.P., Serna-Chavez, H.M., De Groot, R.S. and P. Opdam. 2014. Ecosystem services as a contested concept: a synthesis of critique and counter—arguments. Conservation Letters, 7(6), 514-523.
Seminoff, J.A., Allen, C.D., Balazs, G.H., Dutton, P.H., Eguchi, T., Haas, H.L., Hargrove, S.A., Jensen, M.P., Klemm, D.L., Lauritsen, A.M., MacPherson, S.L., Opay, P., Possardt, E.E., Pultz, S.L., Seney, E.E., Van Houtan, K.S. and R.S. Waples. 2015. Status Review of the Green Turtle (Chelonia mydas) Under the U.S. Endangered Species Act. NOAA Technical Memorandum, NOAA- NMFS-SWFSC-539.
Sinclair, M., Ghermandi, A. and A.M. Sheela. 2018. A crowdsourced valuation of recreational ecosystem services using social media data: An application to a tropical wetland in India. Science of the Total Environment, 642, 356-365.
Spalding, M. and Parrett, C.L. 2019. Global patterns in mangrove recreation and tourism. Marine Policy, 110, 103540.
Stevens, T.H., Echeverria, J., Glass, R.J., Hager, T. and T.A. More. 1991. Measuring the existence value of wildlife: what do CVM estimates really show? Land Economics, 67(4), 390-400.
Subroy, V., Gunawardena, A., Polyakov, M., Pandit, R. and D.J. Pannell. 2019. The worth of wildlife: A meta-analysis of global non-market values of threatened species. Ecological Economics, 164, 106374.
SurveyGizmo. 2020. https://www.surveygizmo.com/. Accessed 25/9/2020.
Swait, J. and Adamowicz, W. 1996. The effect of choice environment and task demands on consumer behaviour. Paper to 1996 Canadian Resource and Environmental Economics Study Group, Montreal.
TEEB. 2010. The Economics of Ecosystems and Biodiversity Ecological and Economic Foundations. Edited by P. Kumar. Earthscan, London and Washington.
Teh, L.S., Teh, L.C. and G. Jolis. 2018. An economic approach to marine megafauna conservation in the coral triangle: Marine turtles in Sabah, Malaysia. Marine Policy, 89, pp.1-10.
Teh, L., Teh, L. and R. Rahman. 2020. Cost-Benefit Analysis of Business-As-Usual Conservation Scenarios for Marine Turtles in Terengganu, Malaysia. Report to WWF Malaysia.
Tisdell, C. and Wilson, C. 2001. Wildlife-based tourism and increased support for nature conservation financially and otherwise: evidence from sea turtle ecotourism at Mon Repos. Tourism Economics, 7(3), 233-249.
Tisdell, C. and Wilson, C. 2002. Ecotourism for the survival of sea turtles and other wildlife. Biodiversity and Conservation, 11(9), 1521-1538.
Tisdell, C.A. (ed.) 2005. Economics of environmental conservation (Vol. 1). Edward Elgar Publishing.
Train, K.E. 2009. Discrete choice methods with simulation. Cambridge University Press.
Train, K. 2016. Comment on “A revealed preference approach to valuing non-market recreational fishing losses from the Deepwater Horizon Oil Spill” and its “Corrigendum” by Alvarez et al. Journal of Environmental Management, 167, 259-261.
Troëng, S. and Drews, C. 2004. Money talks: economic aspects of marine turtle use and conservation. WWF-International.
Vuto, S., Hamilton, R., Brown, C., Waldie, P., Pita, J., Peterson, N., Hof, C. and C. Limpus. 2019. A report on turtle harvest and trade in Solomon Islands. The Nature Conservancy Pacific Division. 32 pp.
Wallace, B.P., DiMatteo, A.D., Hurley, B.J., Finkbeiner, E.M., Bolten, A.B., Chaloupka, M.Y., Hutchison, B.J., Abreu-Grobois, F.A., Amorocho, D., Bjorndal, K.A., and Bourjea, J. 2010. Regional management units for marine turtles: a novel framework for prioritizing conservation and research across multiple scales. Plos one, 5(12), p.e15465.
Wallace, B.P., DiMatteo, A.D., Bolten, A.B., Chaloupka, M.Y., Hutchinson, B.J., Abreu-Grobois, F.A., Mortimer, J.A., Seminoff, J.A., Amorocho, D., Bjorndal, K.A. and J. Bourjea. 2011. Global conservation priorities for marine turtles. PloS one, 6(9), p.e24510
Wallmo, K. and Lew, D.K. 2012. Public willingness to pay for recovering and downlisting threatened and endangered marine species. Conservation Biology, 26(5), pp.830-839.
Wallmo, K., and Lew, D.K. 2016. A comparison of regional and national values for recovering threatened and endangered marine species in the United States. Journal of Environmental Management 179, 38-46.
Wang, Z., Gong, Y. and X. Mao. 2018. Exploring the value of overseas biodiversity to Chinese netizens based on willingness to pay for the African elephants' protection. Science of the Total Environment, 637, 600-608.
Whitehead, J.C. 1992. Ex ante willingness to pay with supply and demand uncertainty: implications for valuing a sea turtle protection programme. Applied Economics, 24(9), 981-988.
Wilson, C. and Tisdell, C. 2003. Conservation and economic benefits of wildlife-based marine tourism: sea turtles and whales as case studies. Human Dimensions of Wildlife, 8(1), 49-58.
Zander, K.K., Pang, S.T., Jinam, C., Tuen, A.A. and S.T. Garnett. 2014. Wild and valuable? Tourist values for orang-utan conservation in Sarawak. Conservation and Society, 12(1), 27.
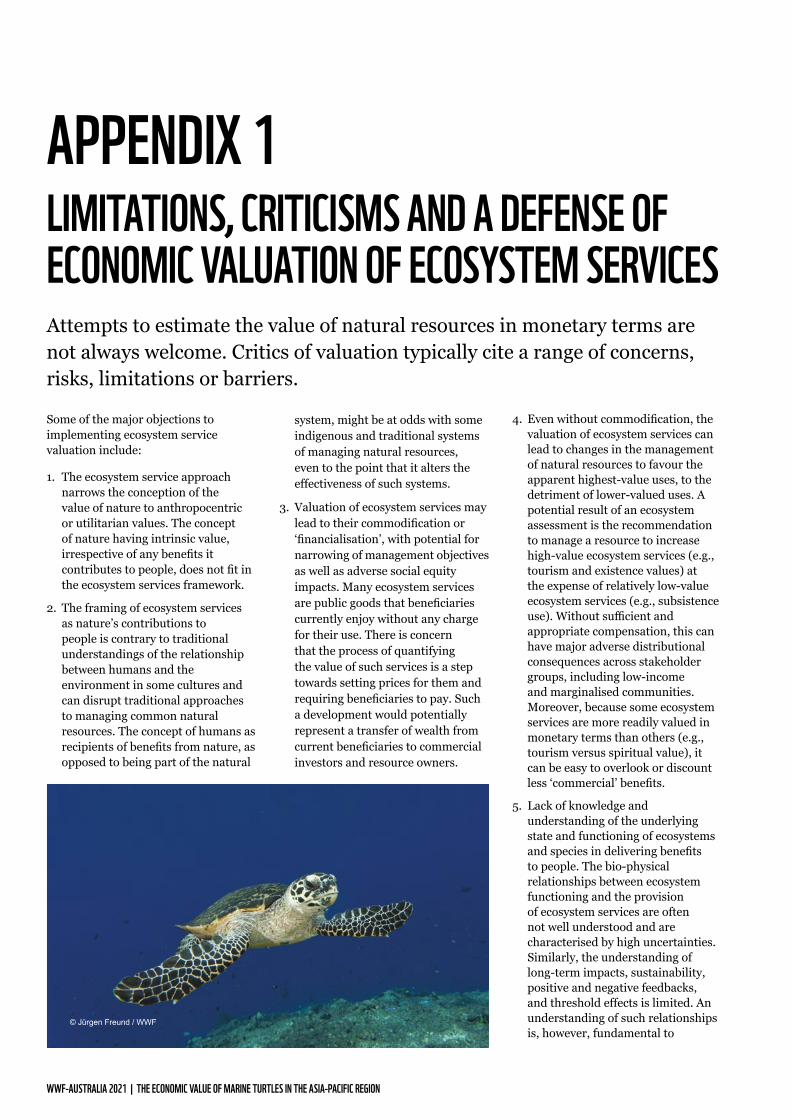
WWF-AUSTRALIA 2021 | THE ECONOMIC VALUE OF MARINE TURTLES IN THE ASIA-PACIFIC REGION
APPENDIX 1LIMITATIONS, CRITICISMS AND A DEFENSE OF ECONOMIC VALUATION OF ECOSYSTEM SERVICESAttempts to estimate the value of natural resources in monetary terms are not always welcome. Critics of valuation typically cite a range of concerns, risks, limitations or barriers.
Some of the major objections to implementing ecosystem service valuation include:
1. The ecosystem service approach narrows the conception of the value of nature to anthropocentric or utilitarian values. The concept of nature having intrinsic value, irrespective of any benefits it contributes to people, does not fit in the ecosystem services framework.
2. The framing of ecosystem services as nature’s contributions to people is contrary to traditional understandings of the relationship between humans and the environment in some cultures and can disrupt traditional approaches to managing common natural resources. The concept of humans as recipients of benefits from nature, as opposed to being part of the natural
system, might be at odds with some indigenous and traditional systems of managing natural resources, even to the point that it alters the effectiveness of such systems.
3. Valuation of ecosystem services may lead to their commodification or ‘financialisation’, with potential for narrowing of management objectives as well as adverse social equity impacts. Many ecosystem services are public goods that beneficiaries currently enjoy without any charge for their use. There is concern that the process of quantifying the value of such services is a step towards setting prices for them and requiring beneficiaries to pay. Such a development would potentially represent a transfer of wealth from current beneficiaries to commercial investors and resource owners.
4. Even without commodification, the valuation of ecosystem services can lead to changes in the management of natural resources to favour the apparent highest-value uses, to the detriment of lower-valued uses. A potential result of an ecosystem assessment is the recommendation to manage a resource to increase high-value ecosystem services (e.g., tourism and existence values) at the expense of relatively low-value ecosystem services (e.g., subsistence use). Without sufficient and appropriate compensation, this can have major adverse distributional consequences across stakeholder groups, including low-income and marginalised communities. Moreover, because some ecosystem services are more readily valued in monetary terms than others (e.g., tourism versus spiritual value), it can be easy to overlook or discount less ‘commercial’ benefits.
5. Lack of knowledge and understanding of the underlying state and functioning of ecosystems and species in delivering benefits to people. The bio-physical relationships between ecosystem functioning and the provision of ecosystem services are often not well understood and are characterised by high uncertainties. Similarly, the understanding of long-term impacts, sustainability, positive and negative feedbacks, and threshold effects is limited. An understanding of such relationships is, however, fundamental to
© Jürgen Freund / WWF

61
determining how policy decisions that affect natural capital stocks (including populations of wildlife) and ecosystem functioning will filter through to changes in the flow and value of ecosystem services.
6. A related challenge in ecosystem service valuation is due to the complexity of assessing trade-offs. In many cases, the level of sustainable activity for one ecosystem service may not be compatible with the sustainable level of another. In the case of marine turtles, for instance, there is a potential trade-off between the harvesting of turtles for food and managing them in ways that maximise value to recreational and other tourist activities. Such trade-offs introduce further complexity to any analysis, since it becomes necessary to consider how one use of a marine resource affects other potential uses and values. This, however, can also be seen as a strength of ecosystem service valuation, in that it enables these trade-offs to be explicitly analysed and expressed in monetary terms.
7. The explicit identification of resource owners, custodians, users and beneficiaries can raise questions of property rights and tenure, and may create conflict. The tenure or property rights to many natural resources remains unassigned or unenforced. For society, this can be both a positive characteristic, from the perspective that such resources are open to all, or a negative characteristic, since such resources may be over-exploited. A potential risk in applying an ecosystem service approach is that values become more explicit and issues of resource ownership create or exacerbate conflict among stakeholders.
8. Ecosystem service valuation is often resource-intensive and time-consuming. The bio-physical and social scientific methods required to assess and value ecosystem services are sophisticated and often expensive to implement. Assessment methods typically require extensive data, which may not be available, especially for small-scale studies. Moreover, the necessary technical expertise to conduct valuation studies is often lacking in the agencies responsible for environmental protection and natural resource management.
9. The ecosystem services approach has yet to deliver substantial changes in policy or human behaviour to address the serious environmental challenges that society faces. The required scale and pace of change in humanity’s use of natural resources to avoid major environmental disasters (e.g., climate change and the massive loss of biodiversity) is not taking place fast enough, according to many observers. The ecosystem services approach has arguably resulted in only small, incremental changes in environmental and development policies and not the fundamental changes to economic systems that many believe are necessary. This has led to impatience and frustration in some quarters.
Economists offer various responses to the criticisms and concerns summarised above. One common starting point is to point out that economic value is simply a terms to describe how important things are to us, including our use of the natural world or “natural capital”. In the case of ecosystem services from the marine environment, there are often
no prices that reflect their value, since the services provided are not traded in markets (e.g., climate regulation, coastal protection and biodiversity conservation). As a result, many people tend not to take the value of ecosystem services into consideration when they make decisions that affect the marine environment. Defenders of economic valuation further note that when we investigate the consequences of environmental change (e.g., climate change, coastal development and marine accidents), it is essential to assess the effects on ecosystem services and human wellbeing.
Economic valuation of ecosystem services involves identifying and quantifying the contribution of environmental resources to human wellbeing, and incorporating this information into decision-making and the design of financing mechanisms and policy instruments. Admittedly, this does not often result in a radical restructuring of existing human behaviour, institutions or the economic system, but it supports the incremental process of improving behaviour and decision-making towards more sustainable use of the environment.
Economic valuation does not stand alone but is generally used in combination with information from other methods and disciplines for assessing environmental change, the provision of ecosystem services and resulting social consequences. The added value of economic valuation is that the importance of ecosystem services is expressed in terms of human welfare and measured in common units (i.e., money), allowing values to be aggregated across ecosystem services and directly compared to the values of other goods and services in the economy that people are concerned about.
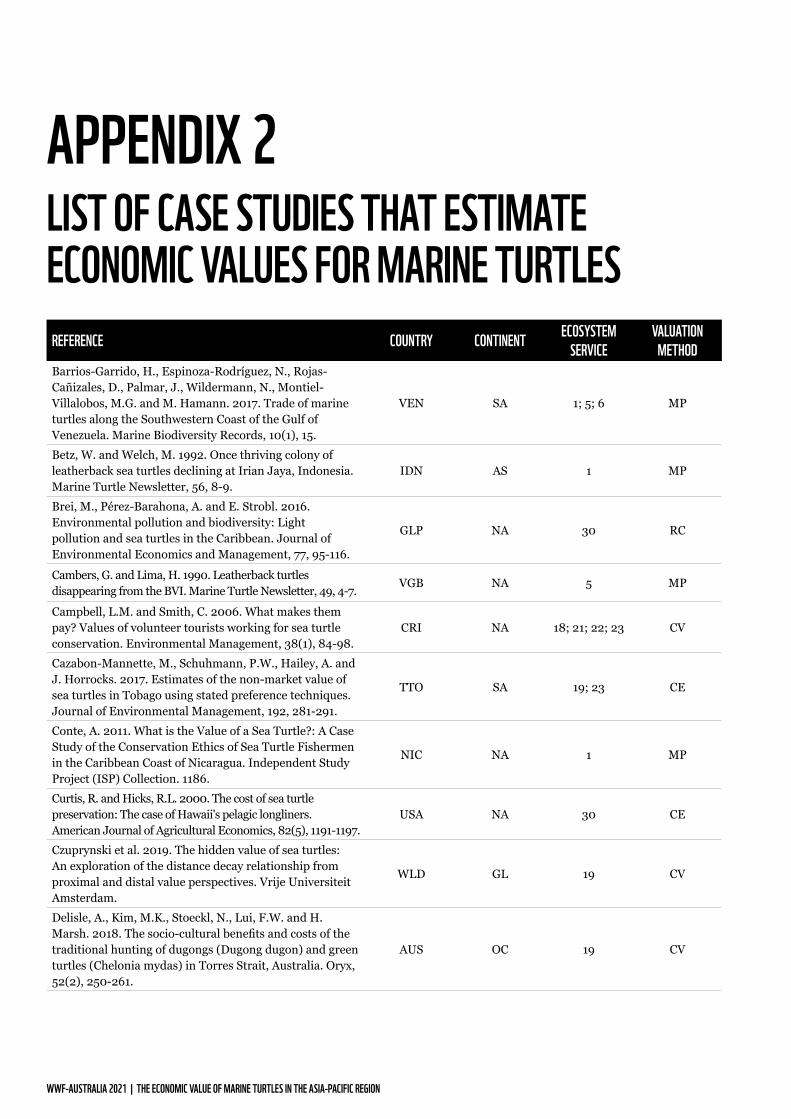
WWF-AUSTRALIA 2021 | THE ECONOMIC VALUE OF MARINE TURTLES IN THE ASIA-PACIFIC REGION
APPENDIX 2LIST OF CASE STUDIES THAT ESTIMATE ECONOMIC VALUES FOR MARINE TURTLES
REFERENCE COUNTRY CONTINENT ECOSYSTEM SERVICE
VALUATION METHOD
Barrios-Garrido, H., Espinoza-Rodríguez, N., Rojas-Cañizales, D., Palmar, J., Wildermann, N., Montiel-Villalobos, M.G. and M. Hamann. 2017. Trade of marine turtles along the Southwestern Coast of the Gulf of Venezuela. Marine Biodiversity Records, 10(1), 15.
VEN SA 1; 5; 6 MP
Betz, W. and Welch, M. 1992. Once thriving colony of leatherback sea turtles declining at Irian Jaya, Indonesia. Marine Turtle Newsletter, 56, 8-9.
IDN AS 1 MP
Brei, M., Pérez-Barahona, A. and E. Strobl. 2016. Environmental pollution and biodiversity: Light pollution and sea turtles in the Caribbean. Journal of Environmental Economics and Management, 77, 95-116.
GLP NA 30 RC
Cambers, G. and Lima, H. 1990. Leatherback turtles disappearing from the BVI. Marine Turtle Newsletter, 49, 4-7. VGB NA 5 MP
Campbell, L.M. and Smith, C. 2006. What makes them pay? Values of volunteer tourists working for sea turtle conservation. Environmental Management, 38(1), 84-98.
CRI NA 18; 21; 22; 23 CV
Cazabon-Mannette, M., Schuhmann, P.W., Hailey, A. and J. Horrocks. 2017. Estimates of the non-market value of sea turtles in Tobago using stated preference techniques. Journal of Environmental Management, 192, 281-291.
TTO SA 19; 23 CE
Conte, A. 2011. What is the Value of a Sea Turtle?: A Case Study of the Conservation Ethics of Sea Turtle Fishermen in the Caribbean Coast of Nicaragua. Independent Study Project (ISP) Collection. 1186.
NIC NA 1 MP
Curtis, R. and Hicks, R.L. 2000. The cost of sea turtle preservation: The case of Hawaii's pelagic longliners. American Journal of Agricultural Economics, 82(5), 1191-1197.
USA NA 30 CE
Czuprynski et al. 2019. The hidden value of sea turtles: An exploration of the distance decay relationship from proximal and distal value perspectives. Vrije Universiteit Amsterdam.
WLD GL 19 CV
Delisle, A., Kim, M.K., Stoeckl, N., Lui, F.W. and H. Marsh. 2018. The socio-cultural benefits and costs of the traditional hunting of dugongs (Dugong dugon) and green turtles (Chelonia mydas) in Torres Strait, Australia. Oryx, 52(2), 250-261.
AUS OC 19 CV
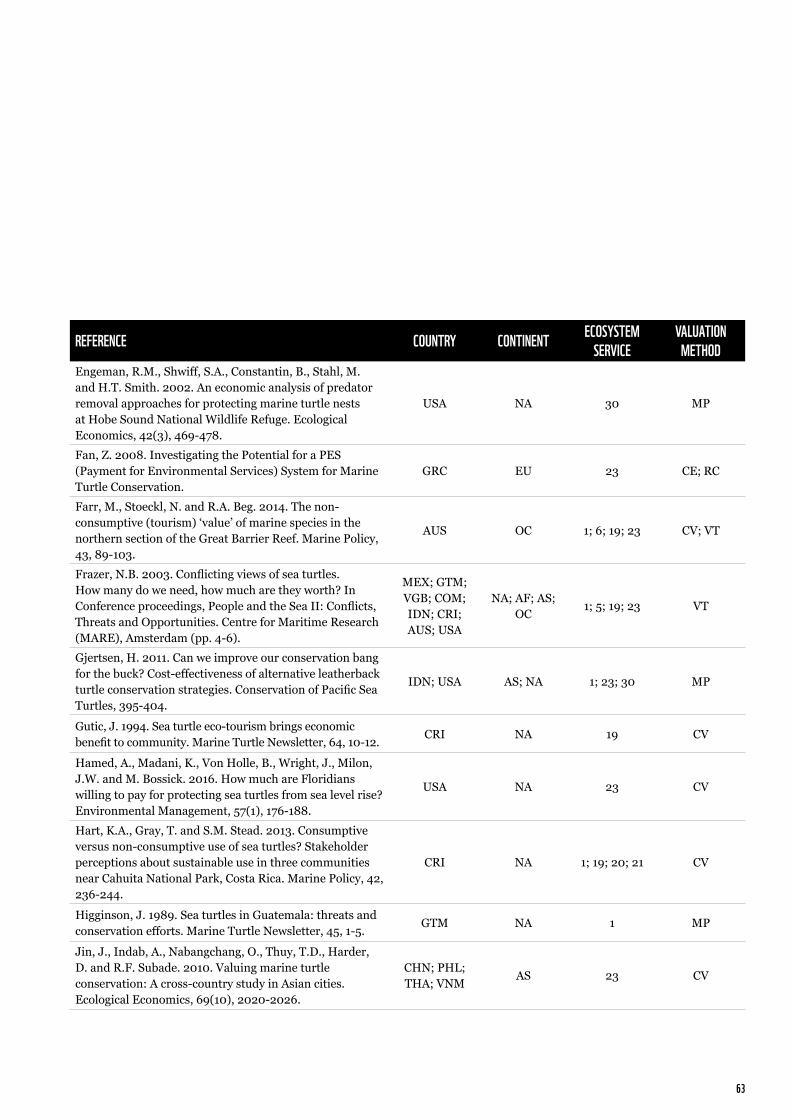
63
REFERENCE COUNTRY CONTINENT ECOSYSTEM SERVICE
VALUATION METHOD
Engeman, R.M., Shwiff, S.A., Constantin, B., Stahl, M. and H.T. Smith. 2002. An economic analysis of predator removal approaches for protecting marine turtle nests at Hobe Sound National Wildlife Refuge. Ecological Economics, 42(3), 469-478.
USA NA 30 MP
Fan, Z. 2008. Investigating the Potential for a PES (Payment for Environmental Services) System for Marine Turtle Conservation.
GRC EU 23 CE; RC
Farr, M., Stoeckl, N. and R.A. Beg. 2014. The non-consumptive (tourism) ‘value’ of marine species in the northern section of the Great Barrier Reef. Marine Policy, 43, 89-103.
AUS OC 1; 6; 19; 23 CV; VT
Frazer, N.B. 2003. Conflicting views of sea turtles. How many do we need, how much are they worth? In Conference proceedings, People and the Sea II: Conflicts, Threats and Opportunities. Centre for Maritime Research (MARE), Amsterdam (pp. 4-6).
MEX; GTM; VGB; COM; IDN; CRI; AUS; USA
NA; AF; AS; OC 1; 5; 19; 23 VT
Gjertsen, H. 2011. Can we improve our conservation bang for the buck? Cost-effectiveness of alternative leatherback turtle conservation strategies. Conservation of Pacific Sea Turtles, 395-404.
IDN; USA AS; NA 1; 23; 30 MP
Gutic, J. 1994. Sea turtle eco-tourism brings economic benefit to community. Marine Turtle Newsletter, 64, 10-12. CRI NA 19 CV
Hamed, A., Madani, K., Von Holle, B., Wright, J., Milon, J.W. and M. Bossick. 2016. How much are Floridians willing to pay for protecting sea turtles from sea level rise? Environmental Management, 57(1), 176-188.
USA NA 23 CV
Hart, K.A., Gray, T. and S.M. Stead. 2013. Consumptive versus non-consumptive use of sea turtles? Stakeholder perceptions about sustainable use in three communities near Cahuita National Park, Costa Rica. Marine Policy, 42, 236-244.
CRI NA 1; 19; 20; 21 CV
Higginson, J. 1989. Sea turtles in Guatemala: threats and conservation efforts. Marine Turtle Newsletter, 45, 1-5. GTM NA 1 MP
Jin, J., Indab, A., Nabangchang, O., Thuy, T.D., Harder, D. and R.F. Subade. 2010. Valuing marine turtle conservation: A cross-country study in Asian cities. Ecological Economics, 69(10), 2020-2026.
CHN; PHL; THA; VNM AS 23 CV

WWF-AUSTRALIA 2021 | THE ECONOMIC VALUE OF MARINE TURTLES IN THE ASIA-PACIFIC REGION
REFERENCE COUNTRY CONTINENT ECOSYSTEM SERVICE
VALUATION METHOD
Jones, N., Panagiotidou, K., Spilanis, I., Evangelinos, K. I. and P. G. Dimitrakopoulos. 2011. Visitors’ perceptions on the management of an important nesting site for the loggerhead sea turtle (Caretta caretta L.): The case of Rethymno coastal area in Greece. Ocean and Coastal Management, 54(8), 577-584.
GRC EU 19 CV
Lew, D. K. 2015. Willingness to pay for threatened and endangered marine species: a review of the literature and prospects for policy use. Frontiers in Marine Science, 2, 96.
GRC; USA EU; NA 19 VT
Mancini, A. and Koch, V. 2009. Sea turtle consumption and black market trade in Baja California Sur, Mexico. Endangered Species Research, 7(1), 1-10.
MEX NA 1 CV
de Vasconcellos Pegas, F. and Stronza, A. 2010. Ecotourism and sea turtle harvesting in a fishing village of Bahia, Brazil. Conservation and Society, 8(1), 15-25.
BRA SA 30 CV
Rathnayake, R.M.W. 2016. ‘Turtle watching’: A strategy for endangered marine turtle conservation through community participation in Sri Lanka. Ocean and Coastal Management, 119, 199-207.
LKA AS 19 CV
Read, T.C., Petit, M., Magnan, M. and R. Farman. 2019.Turtle Watching - Combining Conservation and Tourism: A Case Study in New Caledonia. Marine Turtle Newsletter, 156, 13-15.
NCL OC 19 CE; MP
Reuter, A. and Allan, C. 2006. Tourists, Turtles and Trinkets. TRAFFIC. DOM; COL NA; SA 1; 5; 6 MP
Rice, S. M. and Moore, M. K. 2008. Trade secrets: a ten-year overview of the illegal import of sea turtle products into the United States. Marine Turtle Newsletter, (121), 1-5.
USA NA 1 MP
Rudd, M. A. 2009. National values for regional aquatic species at risk in Canada. Endangered Species Research, 6(3), 239-249.
CAN NA 23 CE
Sayan, S., Williams, A.T., Johnson, D.E. and Ö. Ünal. 2011. A pilot study for sustainable tourism in the coastal zone of Antalya, Turkey: tourists, turtles or both? Journal of Coastal Research, 1806-1810.
TUR EU/AS 19 CV
Schuhmann, P.W., Casey, J.F., Horrocks, J.A. and H.A. Oxenford. 2013. Recreational SCUBA divers' willingness to pay for marine biodiversity in Barbados. Journal of Environmental Management, 121, 29-36.
BRB NA 19 CE
Senko, J., Schneller, A.J., Solis, J., Ollervides, F. and W. J. Nichols. 2011. People helping turtles, turtles helping people: understanding resident attitudes towards sea turtle conservation and opportunities for enhanced community participation in Bahia Magdalena, Mexico. Ocean and Coastal Management, 54(2), 148-157.
MEX NA 6; 19 CV
Stithou, M. 2009. Respondent certainty and payment vehicle effect in contingent valuation: an empirical study for the conservation of two endangered species in Zakynthos Island, Greece. Stirling Economics Discussion Paper, 2009-21.
GRC EU 19 CV

65
REFERENCE COUNTRY CONTINENT ECOSYSTEM SERVICE
VALUATION METHOD
Stithou, M. and Scarpa, R. 2012. Collective versus voluntary payment in contingent valuation for the conservation of marine biodiversity: an exploratory study from Zakynthos, Greece. Ocean and Coastal Management, 56, 1-9.
GRC EU 19 CV
Stoeckl, N., Birtles, A., Farr, M., Mangott, A., Curnock, M. and P. Valentine. 2010. Live-aboard dive boats in the Great Barrier Reef: regional economic impact and the relative values of their target marine species. Tourism Economics, 16(4), 995-1018.
AUS OC 19 CV
Teh, L.S., Teh, L.C. and G. Jolis. 2018. An economic approach to marine megafauna conservation in the coral triangle: Marine turtles in Sabah, Malaysia. Marine Policy, 89, 1-10.
MYS AS 1; 19; 23; 30 CV
Tisdell, C. and Wilson, C. 2001. Wildlife-based tourism and increased support for nature conservation financially and otherwise: evidence from sea turtle ecotourism at Mon Repos. Tourism Economics, 7(3), 233-249.
AUS OC 19; 23 CV
Tisdell, C.A., Swarna Nantha, H. and C. Wilson. 2005. Public Valuation of and Attitudes Towards the Conservation and Use of the Hawksbill Turtle: An Australian Case Study. Economics, Ecology and Environment Working Papers 55066, University of Queensland, School of Economics (No. 1741-2016-140529).
AUS OC 23 CV
Tisdell, C. and Wilson, C. 2002. Ecotourism for the survival of sea turtles and other wildlife. Biodiversity and Conservation, 11(9), 1521-1538.
AUS OC 19 CV
Wilson, C. and Tisdell, C. 2003. Conservation and economic benefits of wildlife-based marine tourism: sea turtles and whales as case studies. Human Dimensions of Wildlife, 8(1), 49-58.
AUS OC 19; 23 CV
Togridou, A., Hovardas, T. and J.D. Pantis. 2006. Determinants of visitors' willingness to pay for the National Marine Park of Zakynthos, Greece. Ecological Economics, 60(1), 308-319.
GRC EU 19; 23 CV
Kinch, J. and Burgess, E.A. 2009. An assessment of the trade in hawksbill turtles in Papua New Guinea. Traffic Bulletin, 22(2), 62-72.
PNG OC 6 MP
Troëng, S. and Drews, C. 2004. Money talks: economic aspects of marine turtle use and conservation. WWF.
WLD; IDN; MEX; CUB;
CRI NIC; SYC; PHL; MDV; BRA; CRI;
OMN; MYS; TTO; LKA; BRB; ZAF; CPV; REU; MYS; WLD
GL; AS; NA; AF; SA 1; 19; 23; 30 MP; RC

WWF-AUSTRALIA 2021 | THE ECONOMIC VALUE OF MARINE TURTLES IN THE ASIA-PACIFIC REGION
REFERENCE COUNTRY CONTINENT ECOSYSTEM SERVICE
VALUATION METHOD
Uyarra, M.C., Cote, I.M., Gill, J.A., Tinch, R.R., Viner, D. and A.R. Watkinson. 2005. Island-specific preferences of tourists for environmental features: implications of climate change for tourism-dependent states. Environmental Conservation, 32(1), 11-19.
BES; BRB SA; NA 19 CE
Walker, R.C., Roberts, E. and E. Fanning. 2004. The trade of marine turtles in the Toliara region, south west Madagascar. Marine Turtle Newsletter, 106, 7-10.
MDG AF 1 MP
Wallmo, K. and Lew, D.K. 2012. Public willingness to pay for recovering and down-listing threatened and endangered marine species. Conservation Biology, 26(5), 830-839.
USA NA 23 CE
Wallmo, K. and Lew, D.K. 2016. A comparison of regional and national values for recovering threatened and endangered marine species in the United States. Journal of Environmental Management, 179, 38-46.
USA NA 23 CE
White, L. 2008. Sea the value: quantifying the value of marine life to divers. Unpublished Master’s thesis. Durham, Duke University.
USA NA 19 CV
Whitehead, J.C. 1992. Ex ante willingness to pay with supply and demand uncertainty: implications for valuing a sea turtle protection programme. Applied Economics, 24(9), 981-988.
USA NA 23 VT
Whitehead, J.C. 1993. Total economic values for coastal and marine wildlife: specification, validity, and valuation issues. Marine Resource Economics, 8(2), 119-132.
USA NA 23 CV
Woody, J.B. 1986. On the dollar value of the Oaxacan ridley fishery. Marine Turtle Newsletter, 36, 6-7. MEX NA 1 MP
Woodsworth, G. 1992. Sea turtles in the Comoros Islands. Marine Turtle Newsletter, 59, 4-5. COM AF 1 MP

67
Country Codes AUS=Australia, Commonwealth of; BES=Bonaire, Sint Eustatius and Saba; BRA=Brazil, Federative Republic of; BRB=Barbados; CAN=Canada; CHN=China, People’s Republic of; COL=Colombia, Republic of; OM=Comoros, Union of the; CPV=Cape Verde, Republic of; CRI=Costa Rica, Republic of; CUB=Cuba, Republic of; DOM=Dominican Republic; GLP=Guadeloupe;
GRC=Greece, Hellenic Republic; GTM=Guatemala, Republic of; IDN=Indonesia, Republic of; LKA=Sri Lanka, Democratic Socialist Republic of; MDG=Madagascar, Republic of; MDV=Maldives, Republic of; MEX=Mexico, United Mexican States; MYS=Malaysia; NCL=New Caledonia; NIC=Nicaragua, Republic of;OMN=Oman, Sultanate of;PHL=Philippines, Republic of the;
PNG=Papua New Guinea, Independent State of; REU=Reunion; SYC=Seychelles, Republic of; THA=Thailand, Kingdom of; TTO=Trinidad and Tobago, Republic of; TUR=Turkey, Republic of; USA=United States of America; VEN=Venezuela, Bolivarian Republic of; VGB=British Virgin Islands;VNM=Vietnam, Socialist Republic of; WLD=Vanuatu, Republic of;ZAF=South Africa, Republic of.
Continent CodesAF=Africa; AN=Antarctica; AS=Asia; EU=Europe; NA=North America;OC=Oceania; SA=South America; GL=Global.
Ecosystem Service Codes1=Food; 2=Water; 3=Raw materials; 4=Genetic resources; 5=Medicinal resources;6=Ornamental resources; 7=Air quality regulation; 8=Climate regulation; 9=Moderation of extreme events; 10=Regulation of water flows; 11=Waste treatment; 12=Erosion prevention;13=Maintenance of soil fertility;
14=Pollination; 15=Biological control;16=Maintenance of life cycles;17=Maintenance of genetic diversity;18=Aesthetic information;19=Opportunities for recreation and tourism;20=Inspiration for culture, art and design; 21=Spiritual experience; 22=Information for cognitive development;23=Existence, bequest values; 30=Cost of conservation (not an ecosystem service).
Valuation Method CodesCE=Choice Modelling (Discrete Choice Experiment; Conjoint Analysis); CV=Contingent Valuation;DC=Damage Cost Avoided;DE=Defensive Expenditure;GV=Group Valuation (Participatory Valuation);
HP=Hedonic Pricing; IO=Input-Output Modelling; MP=Market Prices (Gross Revenue); FI=Net Factor Income (Residual Value; Resource Rent); OC=Opportunity Cost;PF=Production Function; PP=Public Pricing;
RC=Replacement Cost;RT=Restoration Cost;SC=Social Cost of Carbon;TC=Travel Cost;VT=Value Transfer (Benefits Transfer);OT=Other.
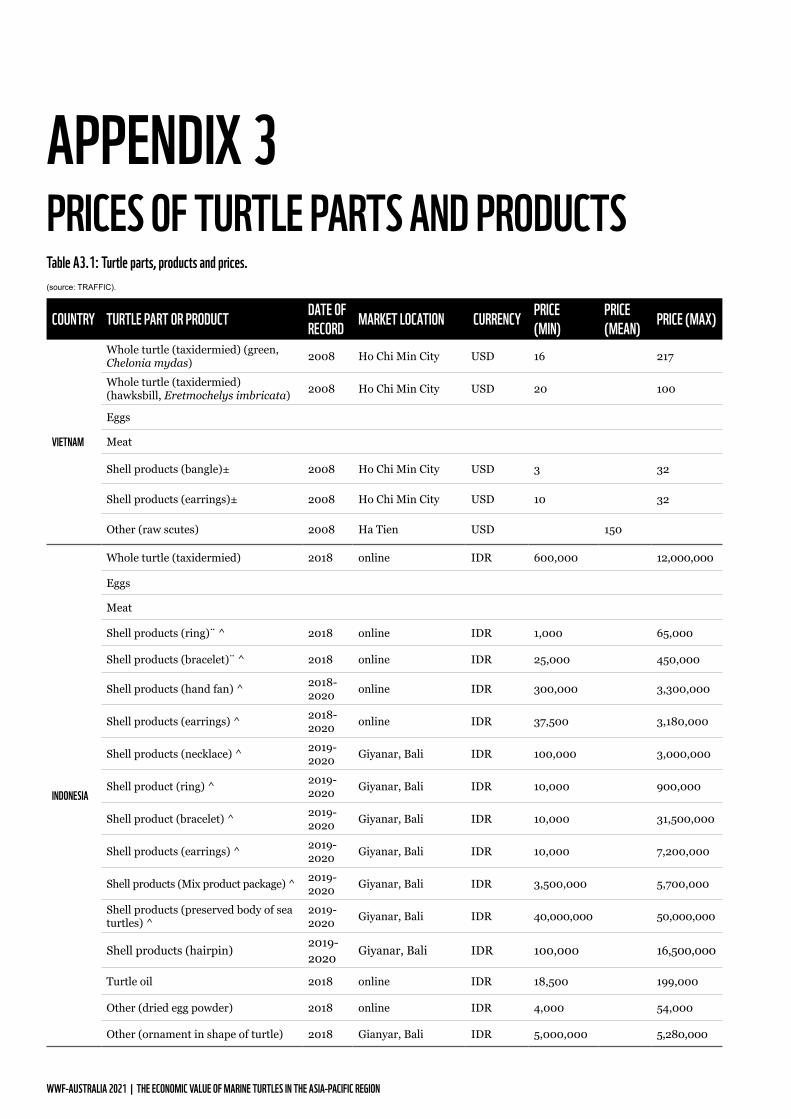
WWF-AUSTRALIA 2021 | THE ECONOMIC VALUE OF MARINE TURTLES IN THE ASIA-PACIFIC REGION
APPENDIX 3PRICES OF TURTLE PARTS AND PRODUCTS
COUNTRY TURTLE PART OR PRODUCT DATE OF RECORD MARKET LOCATION CURRENCY PRICE
(MIN)PRICE (MEAN) PRICE (MAX)
VIETNAM
Whole turtle (taxidermied) (green, Chelonia mydas) 2008 Ho Chi Min City USD 16 217
Whole turtle (taxidermied) (hawksbill, Eretmochelys imbricata) 2008 Ho Chi Min City USD 20 100
Eggs
Meat
Shell products (bangle)± 2008 Ho Chi Min City USD 3 32
Shell products (earrings)± 2008 Ho Chi Min City USD 10 32
Other (raw scutes) 2008 Ha Tien USD 150
INDONESIA
Whole turtle (taxidermied) 2018 online IDR 600,000 12,000,000
Eggs
Meat
Shell products (ring)¨ ^ 2018 online IDR 1,000 65,000
Shell products (bracelet)¨ ^ 2018 online IDR 25,000 450,000
Shell products (hand fan) ^ 2018-2020 online IDR 300,000 3,300,000
Shell products (earrings) ^ 2018-2020 online IDR 37,500 3,180,000
Shell products (necklace) ^ 2019-2020 Giyanar, Bali IDR 100,000 3,000,000
Shell product (ring) ^ 2019-2020 Giyanar, Bali IDR 10,000 900,000
Shell product (bracelet) ^ 2019-2020 Giyanar, Bali IDR 10,000 31,500,000
Shell products (earrings) ^ 2019-2020 Giyanar, Bali IDR 10,000 7,200,000
Shell products (Mix product package) ^ 2019-2020 Giyanar, Bali IDR 3,500,000 5,700,000
Shell products (preserved body of sea turtles) ^
2019-2020 Giyanar, Bali IDR 40,000,000 50,000,000
Shell products (hairpin) 2019-2020 Giyanar, Bali IDR 100,000 16,500,000
Turtle oil 2018 online IDR 18,500 199,000
Other (dried egg powder) 2018 online IDR 4,000 54,000
Other (ornament in shape of turtle) 2018 Gianyar, Bali IDR 5,000,000 5,280,000
Table A3.1: Turtle parts, products and prices. (source: TRAFFIC).

69
COUNTRY TURTLE PART OR PRODUCT DATE OF RECORD MARKET LOCATION CURRENCY PRICE
(MIN)PRICE (MEAN) PRICE (MAX)
MALAYSIA
Whole turtle (live juvenile) 2018 Sabah MYR 1,300
Whole turtle (live adult) 2018 Sabah MYR 2,000
Eggs 2018 Sarawak MYR 2
Eggs 2018 Terengganu MYR 4 6
Meat (fresh) 2018 Sabah MYR 300
Meat (dried) 2018 Sabah MYR 100
Shell products (specify)
Other (specify)
CHINA
Whole turtle (green, Chelonia mydas)
2009 USD 88 396 659
2012Beihai and Dongxing, Guangxi provinces
CNY 3,000 5,000
2014 Beihai, Guangxi Province CNY 75,000
Whole turtle (hawksbill, Eretmochelys imbricata)
2009 USD 59 612 2,635
2011 Tianjin, CNY 1,800 18,000
2012Beihai and Dongxing, Guangxi Province
CNY 770 10,459 60,000
2012 1,500
2014 Guangzhou, CNY 3,700
2014 Beihai, Guangxi Province CNY 540 9,179 50,000
2015 Dongxing, Guangxi Province CNY 2,800
2015 Pingxiang, GuangxiProvince CNY 1,500 2,250 3,000
2016 Beihai, Guangxi Province CNY 850 11,236 30,000
2017 Beihai, Guangxi Province CNY 2,000
2017 Nanning, Guangxi Province CNY 3,500
2018 Anguo, Hebei Province CNY 10,000
2018 Bozhou, Anhui Province CNY 1,500 10,900 20,000
Eggs
Meat
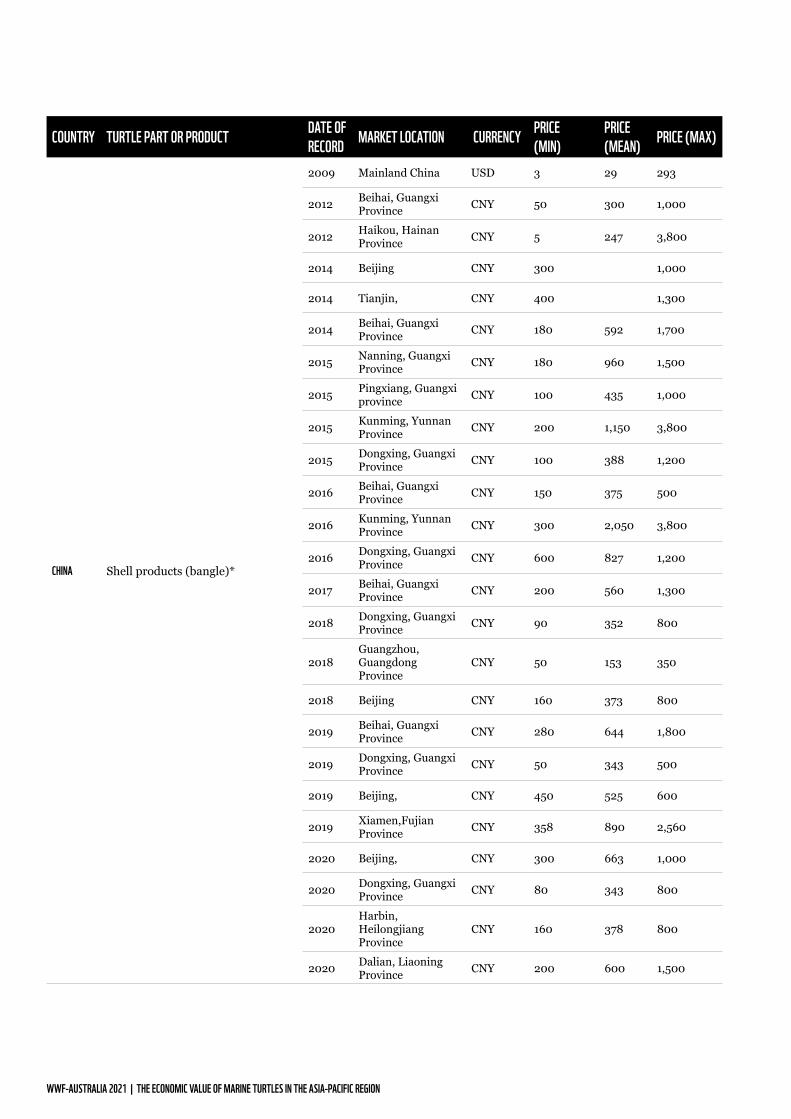
WWF-AUSTRALIA 2021 | THE ECONOMIC VALUE OF MARINE TURTLES IN THE ASIA-PACIFIC REGION
COUNTRY TURTLE PART OR PRODUCT DATE OF RECORD MARKET LOCATION CURRENCY PRICE
(MIN)PRICE (MEAN) PRICE (MAX)
CHINA Shell products (bangle)*
2009 Mainland China USD 3 29 293
2012 Beihai, Guangxi Province CNY 50 300 1,000
2012 Haikou, Hainan Province CNY 5 247 3,800
2014 Beijing CNY 300 1,000
2014 Tianjin, CNY 400 1,300
2014 Beihai, Guangxi Province CNY 180 592 1,700
2015 Nanning, Guangxi Province CNY 180 960 1,500
2015 Pingxiang, Guangxi province CNY 100 435 1,000
2015 Kunming, Yunnan Province CNY 200 1,150 3,800
2015 Dongxing, Guangxi Province CNY 100 388 1,200
2016 Beihai, Guangxi Province CNY 150 375 500
2016 Kunming, Yunnan Province CNY 300 2,050 3,800
2016 Dongxing, Guangxi Province CNY 600 827 1,200
2017 Beihai, Guangxi Province CNY 200 560 1,300
2018 Dongxing, Guangxi Province CNY 90 352 800
2018Guangzhou, Guangdong Province
CNY 50 153 350
2018 Beijing CNY 160 373 800
2019 Beihai, Guangxi Province CNY 280 644 1,800
2019 Dongxing, Guangxi Province CNY 50 343 500
2019 Beijing, CNY 450 525 600
2019 Xiamen,Fujian Province CNY 358 890 2,560
2020 Beijing, CNY 300 663 1,000
2020 Dongxing, Guangxi Province CNY 80 343 800
2020Harbin, Heilongjiang Province
CNY 160 378 800
2020 Dalian, Liaoning Province CNY 200 600 1,500

71
COUNTRY TURTLE PART OR PRODUCT DATE OF RECORD MARKET LOCATION CURRENCY PRICE
(MIN)PRICE (MEAN) PRICE (MAX)
CHINA Other (raw hawksbill scutes)
2009 Anugo market, Hebei Province USD 37 46 59
2009Qingping market, Guangzhou Province
USD 34 154
2011 Tianjin CNY 2,500
2012 Kunming, Yunnan Province CNY 1,200
2014 Kunming, Yunnan Province CNY 700
2014 Beijing, CNY 4,000 5,500 7,000
2018 Anguo, Hebei Province CNY 350 500 700
2018 Chengdu, Sichuan Province CNY 850 900 950
2018 Xian, Shaanxi Province CNY 650
PAPUA NEW GUINEA
Whole turtle
Eggs
Meat
Shell products (jewellery) 2007 Port Moresby USD 0.33 8.2 165
Other (whole carapace olive ridley, Lepidochelys olivacea) 2007 Madang USD 16.5
Other (whole carapace green, Chelonia mydas) 2007 Madang USD 26.4
JAPAN
Whole turtle (taxidermied) 2009 Nagasaki JPY 2,800,000 3,200,000
Eggs
Meat
Shell products (ring)‡ 2009 Nagasaki JPY 4,150 73,500
Shell products (earrings)‡ 2009 Nagasaki JPY 4,730 52,500
Shell products (earrings)† 2009 Tokyo JPY 5,600 38,000
Shell products (hairpin (Kanzashi))† 2009 Tokyo JPY 23,000 1,750,000
Shell products (earrings)° 2009 Okinawa USD 79 789
Shell products (chain)° 2009 Okinawa USD 28 1,020
Notes:
± TRAFFIC report lists 19 types of bekko (turtle shell) items for sale.
¨ TRAFFIC report lists 14 types of turtle products sold online in Indonesia during the study period. These two were the most commonly listed shell products.
^ Expensive price because some products include silver or gold jewellery.
* TRAFFIC report lists over 25 types of bekko items, ranging in price from US $0.73-117,030 per item. Bangles were by far the most numerous. These prices are averaged across multiple markets in mainland China.
† TRAFFIC report lists 12 types of bekko items for sale. These two were the most commonly encountered items.
‡ TRAFFIC report lists 16 types of bekko items for sale. These two were the most commonly encountered items.
° TRAFFIC report lists 11 types of bekko items for sale. These two were the most commonly encountered items.

WWF-AUSTRALIA 2021 | THE ECONOMIC VALUE OF MARINE TURTLES IN THE ASIA-PACIFIC REGION
APPENDIX 4NON-USE VALUE SURVEY DEVELOPMENT AND IMPLEMENTATIONThis appendix describes how the non-use value survey was developed and implemented.
The overall process is represented in Figure A4.1. The survey included a discrete choice experiment (DCE) to elicit respondent preferences and willingness-to-pay for turtle conservation. The survey instrument and DCE were developed through stakeholder consultation and field tests on sample respondents. The survey was implemented through an online platform during the period 31 March
to 10 August 2020 and distributed in seven versions:
1. An international version in English and Spanish, distributed by email through a variety of professional, academic and personal networks; and
2. Country-specific versions for Fiji, China, Indonesia, Malaysia, the
Philippines and Vietnam in national languages. The country-specific versions were distributed using a panel survey company (Ipsos), except for Fiji, where the survey was conducted as a face-to-face intercept by WWF staff and volunteers.
The survey development and implementation is described in detail in the following sections.
SURVEY DEVELOPMENTSurvey instrumentThe survey instrument was built using a professional licence for the online survey platform Alchemer, formerly SurveyGizmo (Alchemer, 2020). The survey instrument comprised 14 pages and 30 questions with sections on:
1. General environmental awareness and experience of marine turtles;
2. Discrete choice experiment on turtle conservation scenarios;
3. Conservation finance; and
4. Socio-demographics.
The English version of the final survey instrument is reproduced in Appendix 5. The survey instrument was translated from English into six other languages: Chinese (simplified characters), Bhasa Indonesian, Bhasa Malay, Tagalog, Spanish and Vietnamese. © Michel Gunther / WWF

73
Figure A4.1: Survey development and implementation process.
Discrete Choice ExperimentTo obtain quantitative measures of respondent preferences for turtle conservation, we made use of the DCE method. This stated preference method uses a public survey to elicit the preferences or values of respondents for specified changes in a good or service (Hensher et al., 2005). In the fields of market research and economics, the DCE method is widely used to obtain information on public preferences that are otherwise not observable in consumer behaviour (Johnston et al., 2017).
The main theoretical underpinnings of the DCE method are derived from the characteristics theory of value (Lancaster, 1966) and random utility theory (McFadden, 1974). The characteristics theory of value posits that consumer behaviour is driven by the constituent characteristics of a good, rather than the good itself. Random utility theory posits that measured consumer utilities should be treated as random variables, to reflect that the observer lacks information on each good’s characteristics and alternatives, as well as incomplete information on consumers (Manski, 1977; Caussade et al., 2005). The
DCE method attempts to measure the preferences (random utilities) people have for environmental qualities (characteristics of a good they “consume”). The term consume is used broadly here to mean the beneficial use of something and, in the context of this study, people use and enjoy the knowledge that species such as turtles exist in the wild.
In practical terms, a DCE involves asking survey respondents to make repeated choices between alternative, multi-attribute descriptions of a good or service. By observing the trade-offs that are made between attributes, it is possible to estimate their relative values (Hanley et al., 2001). By including one attribute that represents a monetary payment on the part of the respondent, it is also possible to compute the WTP for changes in the other attributes (Pearce and Özdemiroǧlu, 2002). In the present study, respondents were asked to choose between alternative options for turtle conservation that would be financed through a monthly donation to a fund dedicated to turtle conservation in the Asia-Pacific region
for a period of 10 years. By analysing the trade-offs that respondents make between conservation measures and a monthly donation, we were able to quantify their WTP for each attribute of turtle conservation status.
A recurring issue in DCE applications is cognitive burden on the part of respondents. There is evidence to suggest that individuals can be overwhelmed when presented with multiple choices between options that comprise many attributes and levels (Mazzotta and Opaluch, 1995; Swait and Adamowicz, 1996; Hanley, 2001). It is therefore necessary to limit the complexity of the choice task in terms of the number of attributes and levels, and to test the capacity of respondents to process the choices they are asked to make (Johnston et al., 2017).
Hanley et al. (2001) and Hensher et al. (2005) provide practical guidelines for the development and implementation of a DCE. Modified for the context of this study, the steps include selection of attributes, stakeholder consultation, experimental design, choice representation and pilot surveys.
SURVEY TESTING
DCE ATTRIBUTESSURVEY INSTRUMENT DCE STATISTICAL DESIGN
STAKEHOLDER CONSULTATION
DRAFT SURVEY INSTRUMENT DRAFT DCE ATTRIBUTES
Email Face-to-face Survey panel (Ipsos)
INTERNATIONALN=858
FIJIN=1,222
CHINAN=1,078
INDONESIAN=1,065
MALAYSIAN=1,464
PHILIPPINESN=828
PHILIPPINESN=1,250

WWF-AUSTRALIA 2021 | THE ECONOMIC VALUE OF MARINE TURTLES IN THE ASIA-PACIFIC REGION
Experimental designThe experimental design of a DCE defines the attributes used to describe alternative options, the levels that each attribute can take, the combination of attribute levels in each option, the combination of options in each choice card, and the number of separate choices respondents are asked to make.
The experimental design in the present study included the three selected attributes described above, comprising two environmental characteristics and one payment vehicle. In our experimental design, the turtle population attribute was described by three levels (declining, stable and increasing) and the diversity of marine turtles attribute was described by four levels (0, 1, 2 or 3 species extinct). The payment attribute was defined by seven levels (US $0, 2, 5, 10, 15, 20, 30). In the country-specific versions of the survey, the currency was converted from USD to national currencies
using market exchange rates and adjustment factors reflecting proportionate differences in per capita income between the US and each country. The income adjustment was made in order to scale the payment levels in line with income. Converted amounts in national currencies were then rounded to whole numbers and clear intervals (e.g., multiples of 5,000 in the case of IDR and VND). The donation levels for each survey version are presented in Table A4.1.
Since the representation of all possible combinations of attribute levels across options would generate an infeasible number of choices, a fractional factorial design was used to limit choices and ensure orthogonality (statistical independence of attributes and levels). The statistical design was generated using Sawtooth software8 to optimise the combinations of attribute levels within and across
choice cards, enabling the statistical estimation of the influence of each attribute level on respondent choice. We note that a common alternative to using orthogonal designs are so-called efficient designs, which are capable of producing more reliable parameter estimates with an equal or smaller sample size (Rose et al., 2008). The experimental design defines 60 choice cards. Each card presents three options, and respondents are asked to select their preferred option and to repeat the choice process over six cards. Of the three options on each choice card, one option is held constant across all cards. The constant option was used to provide an opt-out, for which the environmental attributes take the lowest levels and no donation is made. We manually checked and modified the statistical design to avoid the occurrence of dominant options, i.e. the case whereby one option is superior to others across all attributes.
Stakeholder consultationThe relevance and suitability of attributes and levels was then assessed through a process of interviews and a small survey of 30 stakeholders in different countries. The stakeholders
included employees of the funding organisation, academic researchers, and members of the public in Australia, Europe, North America, Vietnam, the Philippines and China. This process
yielded comments and suggestions, which were incorporated to produce a revised description of the attributes and levels.
Selection of attributesThe over-arching selection criteria for attributes were, firstly, that they should represent different aspects of turtle conservation status, in line with the central objective of the study; secondly, the attributes should be functionally independent to satisfy a requirement
of the DCE framework (Hensher et al., 2005); and, thirdly, the attributes should be unambiguous, so as not to unintentionally increase the level of unobserved variance.
The initial set of attributes included:
1. Turtle population (levels: scarce, common, abundant);
2. Species diversity (levels: 0-6 species extinct); and
3. Monthly donation (levels: US $0, 2, 5, 10, 20, 40, 60).
8 Orem, Utah, United States (2016) https://www.sawtoothsoftware.com/.
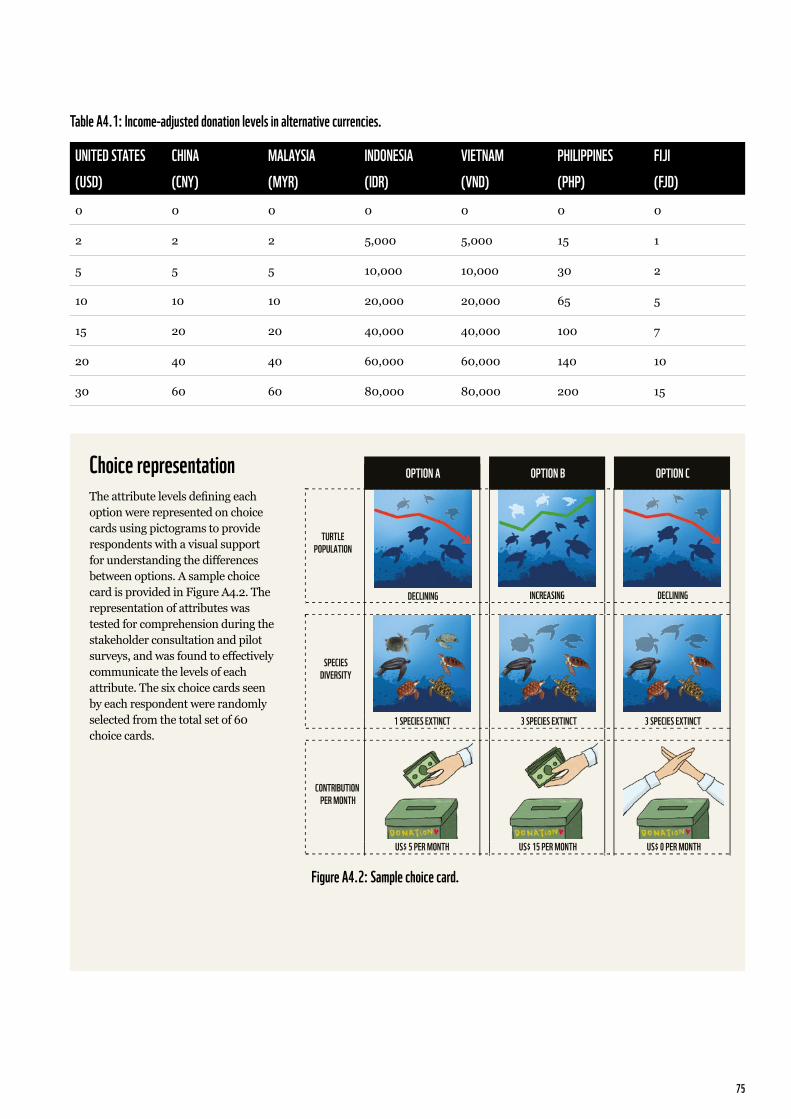
75
Table A4.1: Income-adjusted donation levels in alternative currencies.
UNITED STATES CHINA MALAYSIA INDONESIA VIETNAM PHILIPPINES FIJI(USD) (CNY) (MYR) (IDR) (VND) (PHP) (FJD)0 0 0 0 0 0 0
2 2 2 5,000 5,000 15 1
5 5 5 10,000 10,000 30 2
10 10 10 20,000 20,000 65 5
15 20 20 40,000 40,000 100 7
20 40 40 60,000 60,000 140 10
30 60 60 80,000 80,000 200 15
Choice representationThe attribute levels defining each option were represented on choice cards using pictograms to provide respondents with a visual support for understanding the differences between options. A sample choice card is provided in Figure A4.2. The representation of attributes was tested for comprehension during the stakeholder consultation and pilot surveys, and was found to effectively communicate the levels of each attribute. The six choice cards seen by each respondent were randomly selected from the total set of 60 choice cards.
Option B
DECLINING
CONTRIBUTION PER MONTH
SPECIESDIVERSITY
TURTLEPOPULATION
OPTION A OPTION B OPTION C
INCREASING DECLINING
3 SPECIES EXTINCT 3 SPECIES EXTINCT1 SPECIES EXTINCT
US$ 5 PER MONTH US$ 15 PER MONTH US$ 0 PER MONTH
Figure A4.2: Sample choice card.

WWF-AUSTRALIA 2021 | THE ECONOMIC VALUE OF MARINE TURTLES IN THE ASIA-PACIFIC REGION
SURVEY IMPLEMENTATIONThe survey was implemented through an online survey platform (SurveyGizmo) during the period 31 March to 10 August 2020 and distributed in seven versions:
1. An international version in English and Spanish, distributed by email through a variety of professional, academic and personal networks;
2. Country-specific versions for China, Indonesia, Malaysia, the Philippines and Vietnam, in national languages, distributed using a panel survey company (Ipsos); and
3. A country-specific version for Fiji, in English, conducted as a face-to-face intercept survey. This was administered by a team of WWF staff and volunteers using a copy of the online survey downloaded to tablets and smart phones.
© Jürgen Freund / WWF
Pilot surveysA pilot survey of 50 respondents was conducted using the international (English language) version of the online survey instrument to test the representation, understanding of attributes and choice cards, and distribution of choices between policy and opt-out options. On this
basis, minor adjustments were made to the text, explaining the choice questions and the description of the payment vehicle (changed from “donation” to “contribution”). In addition, pilot surveys were conducted of approximately 100
respondents to each of the country-specific versions of the survey, to test the understanding of all questions, response options, randomisation of choice cards and data recording. In all cases, the process ran smoothly and no further changes were made.

77
DATA ANALYSISAnalysis of respondent characteristicsData on respondents’ general environmental awareness, experience of marine turtles, opinions on conservation finance and socio-demographic characteristics was analysed using SPSS statistic software (IBM, 2017).
Analysis of the discrete choice experimentChoice data was analysed using multinomial logit (MNL) and mixed multinomial logit (MMNL) regressions, to examine the relative influence of each attribute level on the respondent’s choice. The estimated coefficients can be interpreted as the marginal utility of each attribute level.
Utility of a respondent for option i is explained by the following utility function:
Ui = V(X1l, X2l, …, Xkl) + εi
A respondent’s utility consists of a deterministic and in-principle observable component (Vi) and a random and unobservable component (εi). The random and unobservable component represents the idiosyncrasy of the respondent that is unobservable to the analyst. The observable component (Vi) consists of k attributes (X) and their corresponding levels (l), presented in the option (i) that is chosen. The observable component (Vi) can be further explained by the following equation:
Vi = β1l X1l + β2l X2l +…+ βklXkl
where βkl is a coefficient representing the utility derived from attribute Xk with level l. These utilities are estimated in the regression models by fitting the observed data to the
experimental design. The selection of one option over another in a choice card implies that the utility associated with that option is greater than the utility of the other. Comparison of estimated marginal utilities for each attribute level reflects relative preferences and can be used to compute rates of exchange between attributes.
The dependent variable in the regression is binary and indicates whether an option is chosen or not; the explanatory variables are the attribute levels defining the option. The estimated coefficients for the explanatory variables quantify the relative influence of each attribute level on respondent choice. Attribute levels for the environmental characteristics are coded as dummy variables (taking either the value 0 or 1) and the lowest level of each environmental characteristic is used as a reference point and omitted from the regression equation. The payment attribute is coded as a continuous variable, to enable more straightforward computation and interpretation of WTP for specific changes in the environmental attributes.
The MMNL is used to explore preference heterogeneity in the sample. This model allows a relaxation of the assumption that preferences are constant across the sample by treating selected attributes in the model as random instead of fixed parameters. In the present case, the environmental and payment attributes are treated as random parameters in order to identify heterogeneity across individuals in terms of their preferences for environmental management. The number of replications of simulated draws, from which the random parameters are drawn, is specified at 5,000 using Halton draws, and we assume that the random parameters follow lognormal distributions. The data has a panel structure in that each respondent answered six choice questions, and this is accounted for in
the MMNL specification. The analysis was conducted using R software (R Core Team, 2018) and the code developed by the Choice Modelling Centre at the University of Leeds (CMC, 2018).
Estimation of marginal willingness-to-payMean marginal WTP for each turtle conservation attribute, together with 95% confidence intervals, were derived using the method developed by Krinsky and Robb (1986). This involves a Monte Carlo simulation taking draws from a multivariate normal distribution, which accounts for both the standard errors of the estimated parameters and the parameter covariances. Draws from the Monte Carlo simulation of the multivariate normal parameter distribution are used to compute mean and median marginal WTP values and to construct confidence intervals around these values. The use of percentiles to construct the confidence intervals does not predetermine the upper and lower bounds to be symmetrical (Bliemer and Rose, 2013). Note that the estimation of confidence intervals for WTP does not make use of the estimated standard deviations of the environmental attribute random parameters and that aggregation of WTP evaluated at the mean of the random coefficients potentially does not approximate the actual welfare gain (Train, 2016).
Estimation of aggregate willingness-to-payEstimating an aggregate WTP involves multiplying the mean WTP for a specific composite description of turtle conservation by the relevant population of beneficiaries. The mean WTP for a specific turtle conservation status (in terms of population and species diversity) was computed by summing the WTP for each attribute. The relevant population of beneficiaries for turtle conservation is global.
WWF-AUSTRALIA 2021 | THE ECONOMIC VALUE OF MARINE TURTLES IN THE ASIA-PACIFIC REGION
APPENDIX 5NON-USE VALUE SURVEYThe survey instrument for the non-use value survey was developed in English and translated into six other languages: Chinese (simplified characters), Bhasa Indonesian, Bhasa Malay, Tagalog, Spanish and Vietnamese. The English language version is provided here. The other language versions are available on request.
TURTLE SURVEYThis survey is conducted on behalf of the World Wide Fund for Nature (WWF) by researchers at the Institute for Environmental Studies, Vrije Universiteit Amsterdam and Brander Environmental Economics.
The collected data will be used as part of a research report on public preferences for marine turtle conservation. The survey is anonymous. There are no right or wrong answers. Please answer as truthfully as possible.
The survey will take around 5-10 minutes to complete.

79
General Environmental Awareness1) Are you a member of any environmental
group/organization?*
� Yes � No
2) Have you donated any money to an environmental cause in the last 12 months?*
� Yes � No
3) If yes, how much money?*
Amount : ______________________________
Currency : _____________________________
4) Have you volunteered your time for an environmental cause in the last 12 months (e.g., fund raising, beach clean-up, tree planting)?*
� Yes � No
5) If yes, how much time? (please specify whether hours, days, weeks, etc)*
____________________________________
6) How concerned are you about the following environmental issues? (1 = not at all concerned; 5 = very concerned)*
1 2 3 4 5Air Pollution � � � � �Marine Plastic � � � � �Climate Change � � � � �Species Extinction � � � � �Water Pollution � � � � �Overfishing � � � � �Deforestation � � � � �
7) Have you ever had any direct experience of a live marine turtle?*
� Yes � No
8) Please select all that apply*
� In the water (e.g., swimming, snorkelling, diving)
� Seen from a boat (e.g., while fishing, sailing, on a cruise)
� On a beach (e.g., nesting or basking)
� At a facility (e.g., zoo, aquarium, rehabilitation centre)
� Other (please specify): _____________________________________________________________________________________________
9) Have you ever purchased (or received as a gift) an item made from marine turtle shell or other turtle body parts?*
� Yes � No
10) Please select all that apply*
� Jewellery
� Ornament
� Other (please specify): ________________________________________________________
11) In principle, would you be willing to contribute money to support turtle conservation?
� Yes � No
12) Which of the following best describes your reason for not being willing to contribute money to support turtle conservation in principle?*
� 1. I cannot afford to make a monthly donation
� 2. I do not believe species conservation is my responsibility
� 3. Even if I don’t donate, someone else will
� 4. I am morally opposed to putting a dollar value on a species
� 5. I do not trust large organisations to handle my money responsibly
� 6. I do not care if marine turtles decline or go extinct
� 7. I am content seeing a turtle in a zoo or aquarium
� 8. I already contribute to or participate in conservation activities
� 9. Other (please specify): _____________________________________________________*

WWF-AUSTRALIA 2021 | THE ECONOMIC VALUE OF MARINE TURTLES IN THE ASIA-PACIFIC REGION
Turtle Conservation ScenariosCurrently 6 out of 7 marine turtle species globally are classified as threatened, endangered or critically endangered by the International Union for the Conservation of Nature (IUCN). This is due to various threats including the loss of turtle habitat and nesting sites; marine waste and pollution; ingestion of plastic waste; over-harvesting of turtle eggs, meat and shells; entanglement in fishing gear; and warming sands and sea level rise.
If no additional effort is made to protect marine turtles, it is possible that some species could become extinct in the next few decades.
One effective way to conserve marine turtle populations and maintain the rich diversity of species could be for people like you to make ongoing monthly contributions to a dedicated conservation fund. Your contribution would be used to pay for turtle-safe fishing gear, protection of turtle habitats, sand cooling structures, turtle nest protectors, turtle rangers to protect nests from poaching, or other conservation measures.
Your response to the following questions will help us understand your willingness to contribute money for marine turtle conservation. This survey focuses on the Asia-Pacific region because it is a globally important area for marine biodiversity and turtle populations. Although the following questions refer to marine turtles in this region, we are interested in your response regardless of where you are based.
You will be asked to choose between possible conservation options that are defined by the following features:
• Turtle Population — described by whether the population of marine turtles in the Asia-Pacific region is declining, stable or increasing.
• Species Diversity — described by the number of species expected to become extinct in the Asia-Pacific region.
• Contribution per month — the money amount in US$ that you would contribute each month for a period of 10 years to a fund dedicated to turtle conservation in the Asia-Pacific region.
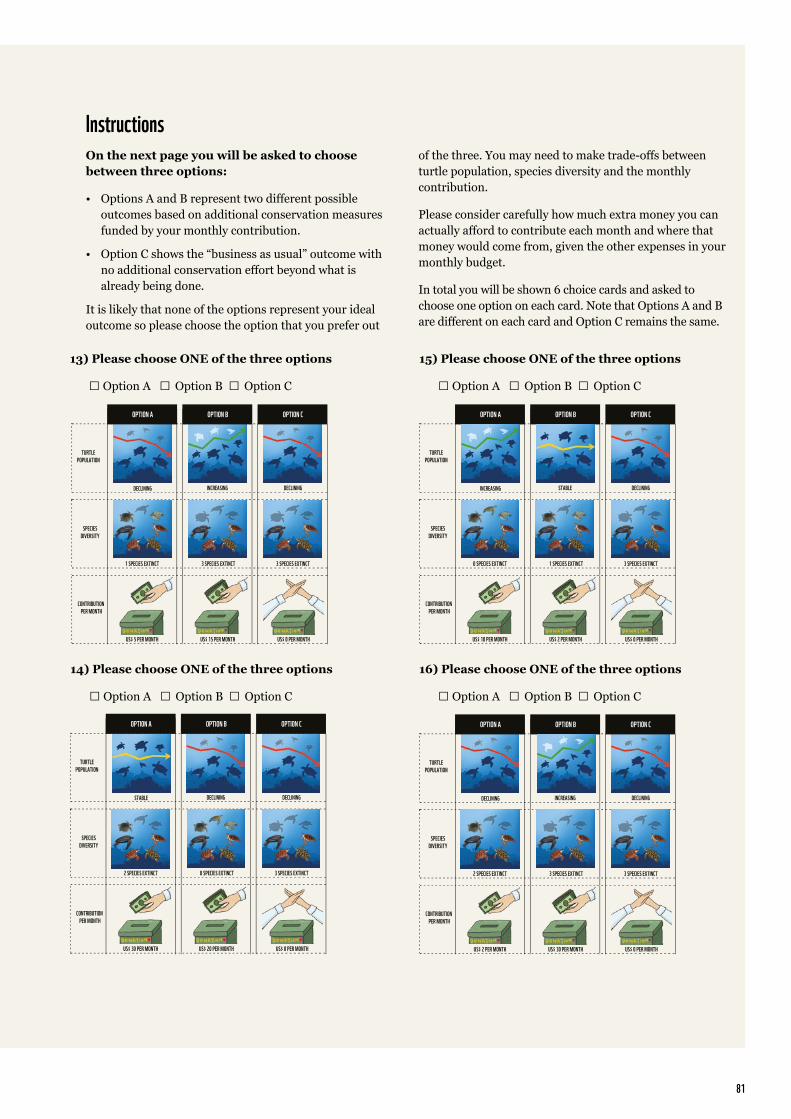
81
InstructionsOn the next page you will be asked to choose between three options:
• Options A and B represent two different possible outcomes based on additional conservation measures funded by your monthly contribution.
• Option C shows the “business as usual” outcome with no additional conservation effort beyond what is already being done.
It is likely that none of the options represent your ideal outcome so please choose the option that you prefer out
of the three. You may need to make trade-offs between turtle population, species diversity and the monthly contribution.
Please consider carefully how much extra money you can actually afford to contribute each month and where that money would come from, given the other expenses in your monthly budget.
In total you will be shown 6 choice cards and asked to choose one option on each card. Note that Options A and B are different on each card and Option C remains the same.
Option B
DECLINING
CONTRIBUTION PER MONTH
SPECIESDIVERSITY
TURTLEPOPULATION
OPTION A OPTION B OPTION C
INCREASING DECLINING
3 SPECIES EXTINCT 3 SPECIES EXTINCT1 SPECIES EXTINCT
US$ 5 PER MONTH US$ 15 PER MONTH US$ 0 PER MONTH
Option B
INCREASING
CONTRIBUTION PER MONTH
SPECIESDIVERSITY
TURTLEPOPULATION
OPTION A OPTION B OPTION C
STABLE DECLINING
1 SPECIES EXTINCT 3 SPECIES EXTINCT0 SPECIES EXTINCT
US$ 10 PER MONTH US$ 2 PER MONTH US$ 0 PER MONTH
Option B
STABLE
CONTRIBUTION PER MONTH
SPECIESDIVERSITY
TURTLEPOPULATION
OPTION A OPTION B OPTION C
DECLINING DECLINING
0 SPECIES EXTINCT 3 SPECIES EXTINCT2 SPECIES EXTINCT
US$ 30 PER MONTH US$ 20 PER MONTH US$ 0 PER MONTH
Option B
DECLINING
CONTRIBUTION PER MONTH
SPECIESDIVERSITY
TURTLEPOPULATION
OPTION A OPTION B OPTION C
INCREASING DECLINING
3 SPECIES EXTINCT 3 SPECIES EXTINCT2 SPECIES EXTINCT
US$ 2 PER MONTH US$ 30 PER MONTH US$ 0 PER MONTH
13) Please choose ONE of the three options
� Option A � Option B � Option C
15) Please choose ONE of the three options
� Option A � Option B � Option C
16) Please choose ONE of the three options
� Option A � Option B � Option C
14) Please choose ONE of the three options
� Option A � Option B � Option C

WWF-AUSTRALIA 2021 | THE ECONOMIC VALUE OF MARINE TURTLES IN THE ASIA-PACIFIC REGION
17) Please choose ONE of the three options
� Option A � Option B � Option C
18) Please choose ONE of the three options
� Option A � Option B � Option C
Option B
DECLINING
CONTRIBUTION PER MONTH
SPECIESDIVERSITY
TURTLEPOPULATION
OPTION A OPTION B OPTION C
INCREASING DECLINING
2 SPECIES EXTINCT 3 SPECIES EXTINCT0 SPECIES EXTINCT
US$ 5 PER MONTH US$ 20 PER MONTH US$ 0 PER MONTH
Option B
STABLE
CONTRIBUTION PER MONTH
SPECIESDIVERSITY
TURTLEPOPULATION
OPTION A OPTION B OPTION C
DECLINING DECLINING
1 SPECIES EXTINCT 3 SPECIES EXTINCT3 SPECIES EXTINCT
US$ 15 PER MONTH US$ 10 PER MONTH US$ 0 PER MONTH
Conservation finance21) When making contributions to pay for turtle
conservation, which of these payment options would you prefer?*
� One-off contribution
� Monthly contributions for a limited period of time
� Monthly contributions indefinitely until conservation goals are met
� Other — Write In: ____________________________________________________________
22) What type of payment would you prefer?*
� Voluntary contribution to a publicly managed fund
� Voluntary donation to an environmental NGO
� Opt-in additional income tax ear-marked for conservation
� Mandatory additional income tax ear-marked for conservation
� Other — Write In: ____________________________________________________________
How Did you Make your Choices?19) How did you make your choices?*
� Considered all three features simultaneously
� Considered two of the features
� Considered only one of the features
� Used my intuition
� Made random choices
� Don’t know
� Other (specify): ______________________________________________________________*
20) In making your choice, how important were the following features to you? (1 = very important; 5 = not important)*
1 2 3 4 5Turtle Population � � � � �Species Diversity � � � � �Donation per Month � � � � �

83
23) Which specific conservation measures would you like to see implemented?
� Employ rangers for turtle monitoring and protection
� Mark and protect critical turtle habitat
� Strengthen legislation on turtle conservation
� Provide communities with alternatives to catching turtles
� Fisheries management to reduce turtle bycatch and mortality
� Waste management to reduce marine pollution
� Improve beaches for better nesting and hatching success
24) Who do you believe should take the most responsibility for implementing marine turtle conservation? (Rank the top three: 1 = most responsible for turtle conservation, 2 = second most responsible, 3 = third most responsible):*
___ a) Governments (national/state/municipal)
___ b) International bodies (e.g., United Nations, World Bank)
___ c) NGOs and not-for-profits
___ d) Community groups
___ e) Individual people
___ f) Tourism operators
___ g) Fisheries sector
___ h) Mining/aggregate companies
THANK YOU!Thank you for taking our survey. Your response is very important to us.
Demographic and Other InformationThe following questions are for statistical purposes only.
25) How did you learn about this survey?*
� An environmental NGO
� From a colleague
� From family member
� From a friend
� Other (please specify): _______________________________________________________________*
26) Age?
� Under 18
� 18 - 25
� 26 - 35
� 36 - 45
� 46 - 55
� 56 - 65
� Over 65
27) Gender?
� Female
� Male
� Other
� Decline to answer
28) In which country do you currently reside?
29) What is the highest level of formal education you have completed?*
� Primary School
� High School
� Technical/ Vocational/ Diploma
� University Degree
� None
� Decline to answer
30) Please indicate your monthly household income (in US dollars)?*
� Under $100
� $100 - $500
� $500 - $1,000
� $1,000 - $3,000
� $3,000 - $6,000
� $6,000 - $10,000
� Over $10,000
� Decline to answer

WWF-AUSTRALIA 2021 | THE ECONOMIC VALUE OF MARINE TURTLES IN THE ASIA-PACIFIC REGION
APPENDIX 6NON-USE VALUE SURVEY DATA SUMMARYThis appendix provides a summary of the data collected through the non-use value survey.
In total, 10,548 respondents accessed one of the online surveys hosted on SurveyGizmo. Of these, 7,765 respondents (74%) completed the questionnaire. Respondents who partially completed the questionnaire stopped at varying points for unknown reasons; their data is not used in the analysis to avoid the possibility of using duplicate responses from the same individual (i.e. from respondents who partially completed the survey
but stopped and provided a complete response at a later time).
The number of complete responses from each of the seven surveys is represented in Figure A6.1. The international survey received responses from 85 countries (represented in Figure A6.2), of which 26 are in the Asia-Pacific region. The total number of complete responses from the Asia-Pacific region is 6,333 (82%).
Philippines (828)
Malaysia (1464)
Vietnam (1250)
Indonesia (1065)
International (858)
China (1078)
Fiji (1222)
Figure A6.1: Number of complete responses per survey.
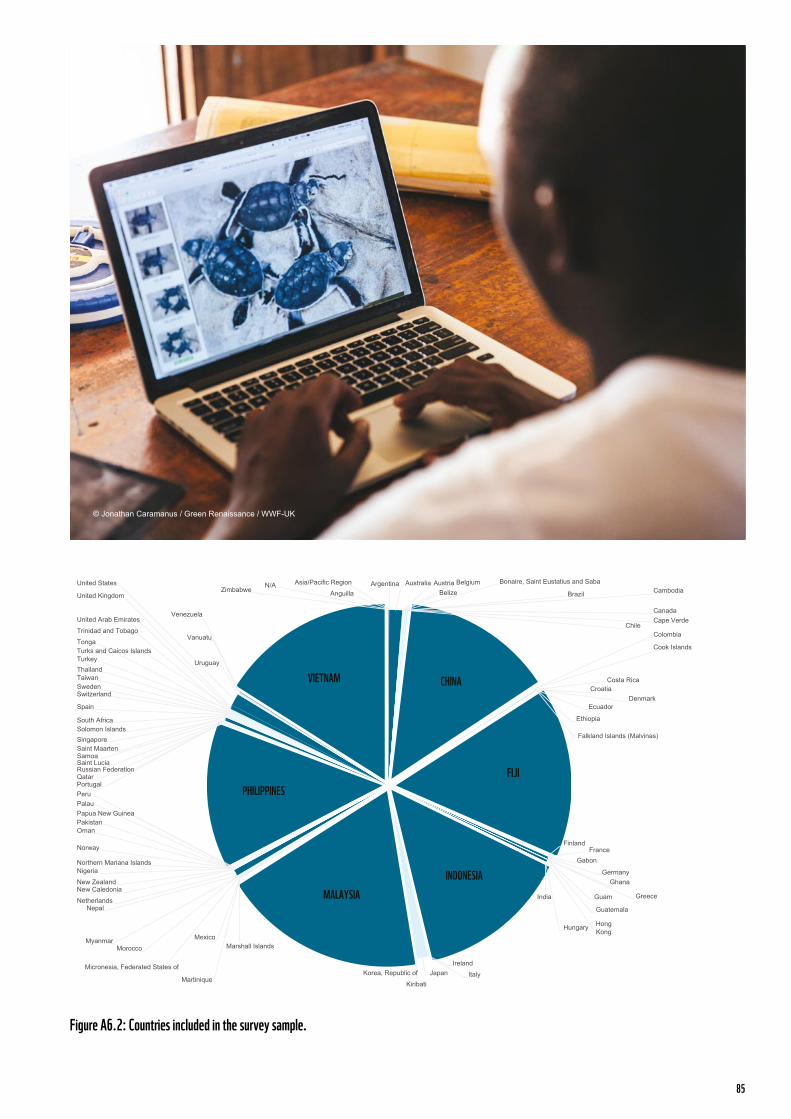
85
Figure A6.2: Countries included in the survey sample.
N/AAnguilla
ArgentinaAsia/Pacific Region Australia Austria BelgiumBelize
Bonaire, Saint Eustatius and Saba
Brazil Cambodia
CanadaCape Verde
Chile
CHINA
Colombia
Cook Islands
Costa RicaCroatia
DenmarkEcuador
Ethiopia
Falkland Islands (Malvinas)
FIJI
FinlandFrance
Gabon
GermanyGhana
GreeceGuam
Guatemala
Hong Kong
Hungary
India
INDONESIA
Ireland
ItalyJapan
Kiribati
Korea, Republic of
MALAYSIA
Marshall Islands
Martinique
Mexico
Micronesia, Federated States of
MoroccoMyanmar
NepalNetherlands
New CaledoniaNew Zealand
NigeriaNorthern Mariana Islands
Norway
OmanPakistan
PalauPapua New Guinea
Peru PHILIPPINESPortugalQatarRussian FederationSaint LuciaSamoa
SingaporeSaint Maarten
Solomon IslandsSouth Africa
Spain
SwedenSwitzerland
TaiwanThailand
Tonga
Trinidad and Tobago
TurkeyTurks and Caicos Islands
United Arab Emirates
United Kingdom
United States
Uruguay
Vanuatu
Venezuela
VIETNAM
Zimbabwe
© Jonathan Caramanus / Green Renaissance / WWF-UK

WWF-AUSTRALIA 2021 | THE ECONOMIC VALUE OF MARINE TURTLES IN THE ASIA-PACIFIC REGION
Regarding respondent engagement with environmental causes, Figure A6.3 shows the percentages of respondents who said that they were a member of an environmental group, have donated money to an environmental cause, or volunteered their time to an environmental cause. Of those who
have donated money, the mean and median donations per year are US $420 and US $78, respectively. The median donation is remarkably similar to the median household willingness to pay for marine turtle conservation estimated in this study. Over the whole sample of respondents (i.e. including
zero donations), the mean and median donations per year are US $90 and US $0, respectively. Figure A6.4 represents the mean donations across the sample for each survey. Chinese respondents report notably higher donations to environmental causes, which is unexpected and difficult to validate.
0
5
10
15
20
25
30
35
40
45
Member EnvironmentalGroup
Donated to EnvironmentalCause
Volunteered forEnvironmental Cause
% OF R
ESPO
NDEN
TS
0
50
100
150
200
250
300
350
MEAN
DONA
TION (
US $/
YEAR
)
VietnamPhilippinesMalaysiaIndonesiaFijiChinaInternational
Figure A6.3: Engagement with environmental causes.
Figure A6.4: Mean annual donations to environmental causes.

87
Regarding environmental concern, Figure A6.5 represents mean Likert scale (1-5) scores for the level of concern for seven environmental issues. In general, levels of concern are high (above 4) for all issues. The figure shows that overfishing and species extinction are of relatively lower concern and that water pollution is of highest concern. Deforestation, marine plastic, air pollution and climate
change are of approximately the same level of concern.
In terms of direct experience of marine turtles, 43% of respondents said they had seen a live marine turtle. Figure A6.6 represents the types of locations where live turtles had been seen (note that individual respondents may have seen live turtles in multiple, different contexts). Respondents who selected “other” type of location were
asked to specify where, which gives further insight into the respondent’s experience. Several respondents stated they had seen live turtles for sale at markets. A large number of respondents indicated they had worked at turtle sanctuaries/centres or on turtle research. Several respondents answered that they had seen turtles in pet shops, which suggests they were thinking of freshwater turtles.
Figure A6.5: Mean level of concern for environmental issues.
Figure A6.6: Types of locations where respondents had seen live marine turtles.
4
4.1
4.2
4.3
4.4
4.5
Overfis
hing
Specie
s Exti
nctio
n
Defores
tation
Marine
Plas
tic
Air Poll
ution
Climate
Cha
nge
Wate
r Poll
ution
LEVEL
OF CO
NCER
N (0-5
)
Water Boat Beach Zoo/aquarium Other0%
10%
20%
30%
40%
50%
60%
Respondents were most concerned about water pollution and climate change as opposed to species extinction and overfishing.

WWF-AUSTRALIA 2021 | THE ECONOMIC VALUE OF MARINE TURTLES IN THE ASIA-PACIFIC REGION
82% of respondents said they would be willing to pay for turtle conservation. Respondents who answered that they were not willing to pay in principle were asked to indicate the main reason. The responses are represented in Figure A6.7. The most common
reason given was that the respondent felt they could not afford to pay a donation. Other frequently cited reasons included a lack of trust in large organisations (to manage donations and implement conservation) and that the respondent already contributed to conservation efforts. Respondents who selected the “other” option were asked to specify the reason, to give further
insight into why people were unwilling to contribute. One commonly given reason was that the respondent preferred to donate to people/humanitarian/children/community-related programs or were more concerned about other environmental issues (e.g., climate change, tiger and elephant conservation).
Regarding payment mechanisms for turtle conservation, Figure A6.8 represents respondent preferences for the timing of donations. The most popular option was to make monthly donations for a limited period of time (40% of respondents), followed by one-off donations (34%) and monthly donations indefinitely (25%). Respondents who selected the “other” payment option were asked to specify what that was. Of these, many indicated they would make donations occasionally, when they had money to spare.
Figure A6.9 represents respondent preferences for alternative payment vehicles.
The most popular option was to make voluntary donations to an environmental NGO, followed by voluntary donations to a publicly managed fund. Mandatory or opt-in income tax contributions that are earmarked for conservation were less popular.
Figure A6.7: Reasons for being unwilling to pay for turtle conservation.
0%
10%
20%
30%
40%
50%
60%
70%
Canno
t affo
rd do
natio
n
Not my r
espo
nsibi
lity
Someo
ne el
se w
ill do
nate
Morally
oppo
sed t
o mon
etary
valua
tion
No trus
t in la
rge or
ganis
ation
s
I do n
ot ca
re ab
out m
arine
turtle
s
Conten
t to se
e turt
les in
zoo/a
quari
um
I alre
ady c
ontrib
ute to
cons
ervati
onOthe
r

89
Figure A6.8: Preferences for the timing of donations.
Figure A6.9: Preferences for type of payment vehicle.
Other
Mandatory additional income tax earmarked for conservation (7% )
Opt-in additional income tax earmarked for conservation (10%)
Voluntary contribution to a publicly managed fund (34%)
Voluntary donation to an environmental NGO (47%)
Monthly contributionsfor a limited time (40%)
Other (1%)
One-o� contribution (34%)
Monthly contributionsindefinitely (25%)

WWF-AUSTRALIA 2021 | THE ECONOMIC VALUE OF MARINE TURTLES IN THE ASIA-PACIFIC REGION
Regarding preferences for specific conservation measures, Figure A6.10 represents the ranking scores for seven options.
The highest ranked measures were to protect critical turtle habitat and to strengthen legislation on turtle conservation. Providing communities with alternatives to catching turtles received the lowest ranking.
Figure A6.11 represents the ranking of stakeholders that respondents believe should take the most responsibility for implementing marine turtle conservation. Governments are clearly seen as the actors that should take the greatest responsibility for turtle conservation, followed by international bodies and individual people. NGOs and community groups were ranked in the middle, whereas stakeholders that might be seen as responsible for turtle declines (fisheries and mining companies) or potential beneficiaries of turtle conservation (tourism) received the lowest ranking.
The socio-demographic characteristics of the sample are represented in the following figures. Figures A6.12, A6.13 and A6.14, respectively, show the percentage of the sample by category for age, education and income. The sample was reasonably dispersed across age and income groups. Table A6.1 compares the median age and income of the sample with the population of each of the six target countries. The sample was highly biased towards people with university education. The distribution by gender was balanced, with 50.9% female and 47.4% male, and the remainder indicating other gender or declining to answer.
0
0.2
0.4
0.6
0.8
1
Alterna
tive l
ivelih
oods
Impro
ve ne
sting
beac
hes
Fisheri
es m
anag
emen
t
Reduc
e mari
ne po
llutio
n
Employ r
ange
rs
Streng
then l
egisl
ation
Protec
t turtle
habit
at
RANK
ING SC
ORE
0.0
0.2
0.4
0.6
0.8
1.0
Touris
m opera
tors
Mining
/ agg
regate
compa
nies
Fisheri
es se
ctor
NGOs and
not-fo
r-prof
its
Commun
ity gr
oups
Indivi
dual
peop
le
Intern
ation
al bo
dies (
e.g. U
N, Worl
d Ban
k)
Govern
ments
(natio
nal/s
tate/m
unici
pal)
RANK
ING SC
ORE
Figure A6.10: Preferences for specific conservation measures.
Figure A6.12: Respondents’ age distribution.
Figure A6.11: Stakeholders identified by respondents as most responsible for marine turtle conservation.
0%
5%
10%
15%
20%
25%
30%
Under 18 18 - 25 26 - 35 36 - 45 46 - 55 56 - 65 Over 65 Decline toanswer

91
Figure A6.13: Respondents’ education distribution.
Figure A6.14: Respondents’ monthly income distribution.
Table A6.1: Median age and annual household income (US $) for the survey sample and population of the six target countries.
0%
10%
20%
30%
40%
50%
60%
70%
None
Primary
Sch
ool
Secon
dary/
High S
choo
l
Techn
ical/ V
ocati
onal/
Dipl
oma
Univers
ity D
egree
Other
Declin
e to a
nswer
0%
5%
10%
15%
20%
25%
Under $100
$100 - $500
$500 - $1,000
$1,000 - $3,000
$3,000 - $6,000
$6,000 - $10,000
Over $
10,000
Decline to
answer
MONTHLY INCOME DISTRIBUTION (US $)
SAMPLE POPULATIONAGE1 INCOME1 AGE INCOME
CHINA 30 35,004 38 5,537
FIJI 30 18,144 30 24,658
INDONESIA 30 8,184 31 2,164
MALAYSIA 30 19,200 29 10,428
PHILIPPINES 30 9,000 24 2,247
VIETNAM 30 24,600 24 4,046 1 Age and income from the sample are derived from response ranges.

WWF-AUSTRALIA 2021 | THE ECONOMIC VALUE OF MARINE TURTLES IN THE ASIA-PACIFIC REGION
APPENDIX 7CHOICE EXPERIMENT RESULTSThis appendix provides an overview of the modelling approach used to estimate the choice models and the estimated willingness-to-pay for turtle population and species diversity.
CHOICE MODELLING APPROACHData from the choice experiments was analysed using a mixed logit (MIXL) model (Revelt and Train, 1998). The MIXL model is a generalisation of the standard logit model in that it accounts for the possibility that the preferences determining choices differ between individuals. MIXL models generally fit the data better than do standard logit models.
We assumed that the estimated random parameters were normally distributed, except for the parameter for the variable ‘payment’, which we assumed to have a negative lognormal distribution. We normalised the alternative-specific constants (which capture unobserved biases) on the opt-out option.
The choice experiment included a categorical variable for the trend in turtle population, which could decline, remain steady or increase. The estimated model contains two variables that are both normalised on the possibility of a declining turtle population. We considered country-specific shifts in the ‘payment’ attribute for the six target countries, non-target countries in East Asia and the Pacific, Europe, North America and respondents from the other countries. Successive model iterations indicated that the shifts for non-target countries were not significantly different from each other and were grouped for normalisation of the target country-specific shifts.
We estimated an extended model, in which the parameter for ‘payment’ is adjusted for age (in years) and household income (in US $1,000 per month). These socio-economic characteristics are included as linear variables. This extended model enables further specificity in WTP estimations, particularly when applying the model results to non-target countries.
The software used to estimate the choice models was the Apollo package version 0.2.4 (Hess and Palma, 2019; 2021) for use with R version 4.0.5 (R Core Team, 2021). To estimate WTP and the confidence intervals, we used procedures specified by Train (2009) and Krinsky and Robb (1986).
CHOICE ANALYSIS RESULTS – BASIC MODEL AND STUDY COUNTRIESThe basic version of the estimated choice model is given in Table A7.1. All estimated coefficients are significant at the 1% level. Model fit, as indicated by the adjusted ρ2 (McFadden, 1974), is good, at 0.27.
The alternative specific constants (ASC) for options 1 and 2 are both positive, indicating respondents were more likely to select a conservation option than the “business as usual”
option. Furthermore, the estimated ASC coefficients were of a similar size, indicating the absence of unobserved biases in respondents’ choices.

93
Table A7.1: Estimated basic choice model.
ESTIMATE S.E.a SIGNIFICANCEb
OPTION 1 1.976 0.049 ***
OPTION 2 1.977 0.047 ***
POPULATION STEADY
MEAN 0.653 0.027 ***
S.D. 0.709 0.040 ***
POPULATION GROWING
MEAN 0.848 0.031 ***
S.D. 1.062 0.039 ***
SPECIES LOSS PREVENTION
MEAN 0.370 0.013 ***
S.D. -0.642 0.016 ***
PAYMENT
MEAN -4.661 0.113 ***
S.D. -2.709 0.082 ***
COUNTRY EFFECTS
CHINA -0.026 0.044
FIJI -1.980 0.175 ***
INDONESIA 0.797 0.054 ***
MALAYSIA 0.923 0.109 ***
PHILIPPINES 1.287 0.159 ***
VIETNAM 0.689 0.130 ***
N 37,523
LOG-LIKELIHOOD -29,919.7
ADJ. Ρ2 0.274a robust standard errors b *** p < 0.01, ** p < 0.05, * p < 0.1
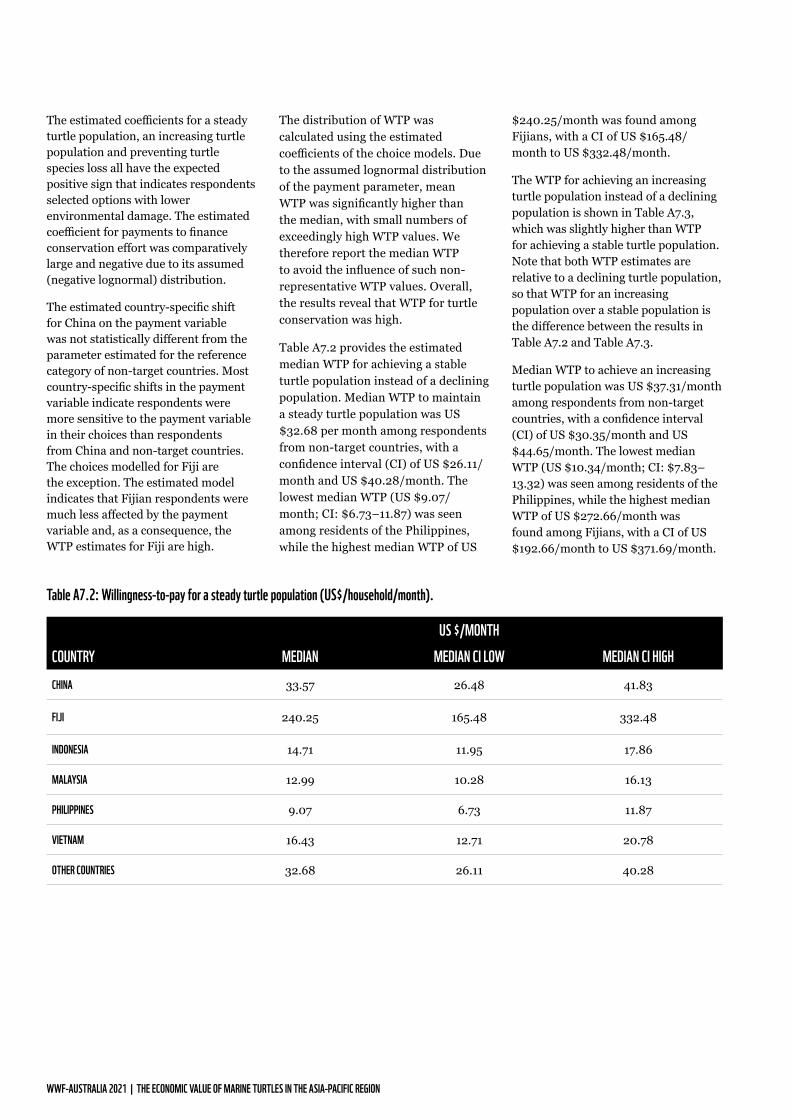
WWF-AUSTRALIA 2021 | THE ECONOMIC VALUE OF MARINE TURTLES IN THE ASIA-PACIFIC REGION
The estimated coefficients for a steady turtle population, an increasing turtle population and preventing turtle species loss all have the expected positive sign that indicates respondents selected options with lower environmental damage. The estimated coefficient for payments to finance conservation effort was comparatively large and negative due to its assumed (negative lognormal) distribution.
The estimated country-specific shift for China on the payment variable was not statistically different from the parameter estimated for the reference category of non-target countries. Most country-specific shifts in the payment variable indicate respondents were more sensitive to the payment variable in their choices than respondents from China and non-target countries. The choices modelled for Fiji are the exception. The estimated model indicates that Fijian respondents were much less affected by the payment variable and, as a consequence, the WTP estimates for Fiji are high.
The distribution of WTP was calculated using the estimated coefficients of the choice models. Due to the assumed lognormal distribution of the payment parameter, mean WTP was significantly higher than the median, with small numbers of exceedingly high WTP values. We therefore report the median WTP to avoid the influence of such non-representative WTP values. Overall, the results reveal that WTP for turtle conservation was high.
Table A7.2 provides the estimated median WTP for achieving a stable turtle population instead of a declining population. Median WTP to maintain a steady turtle population was US $32.68 per month among respondents from non-target countries, with a confidence interval (CI) of US $26.11/month and US $40.28/month. The lowest median WTP (US $9.07/month; CI: $6.73–11.87) was seen among residents of the Philippines, while the highest median WTP of US
$240.25/month was found among Fijians, with a CI of US $165.48/month to US $332.48/month.
The WTP for achieving an increasing turtle population instead of a declining population is shown in Table A7.3, which was slightly higher than WTP for achieving a stable turtle population. Note that both WTP estimates are relative to a declining turtle population, so that WTP for an increasing population over a stable population is the difference between the results in Table A7.2 and Table A7.3.
Median WTP to achieve an increasing turtle population was US $37.31/month among respondents from non-target countries, with a confidence interval (CI) of US $30.35/month and US $44.65/month. The lowest median WTP (US $10.34/month; CI: $7.83–13.32) was seen among residents of the Philippines, while the highest median WTP of US $272.66/month was found among Fijians, with a CI of US $192.66/month to US $371.69/month.
Table A7.2: Willingness-to-pay for a steady turtle population (US$/household/month).
US $/MONTHCOUNTRY MEDIAN MEDIAN CI LOW MEDIAN CI HIGHCHINA 33.57 26.48 41.83
FIJI 240.25 165.48 332.48
INDONESIA 14.71 11.95 17.86
MALAYSIA 12.99 10.28 16.13
PHILIPPINES 9.07 6.73 11.87
VIETNAM 16.43 12.71 20.78
OTHER COUNTRIES 32.68 26.11 40.28

95
Table A7.3: Willingness-to-pay for an increasing turtle population (US$/household/month).
US $/MONTHCOUNTRY MEDIAN MEDIAN CI LOW MEDIAN CI HIGHCHINA 38.33 31.13 46.55
FIJI 274.17 192.90 373.54
INDONESIA 16.82 13.83 20.23
MALAYSIA 14.84 12.09 17.93
PHILIPPINES 10.36 7.83 13.37
VIETNAM 18.77 14.88 23.25
OTHER COUNTRIES 37.31 30.85 44.65
© Roger Leguen / WWF
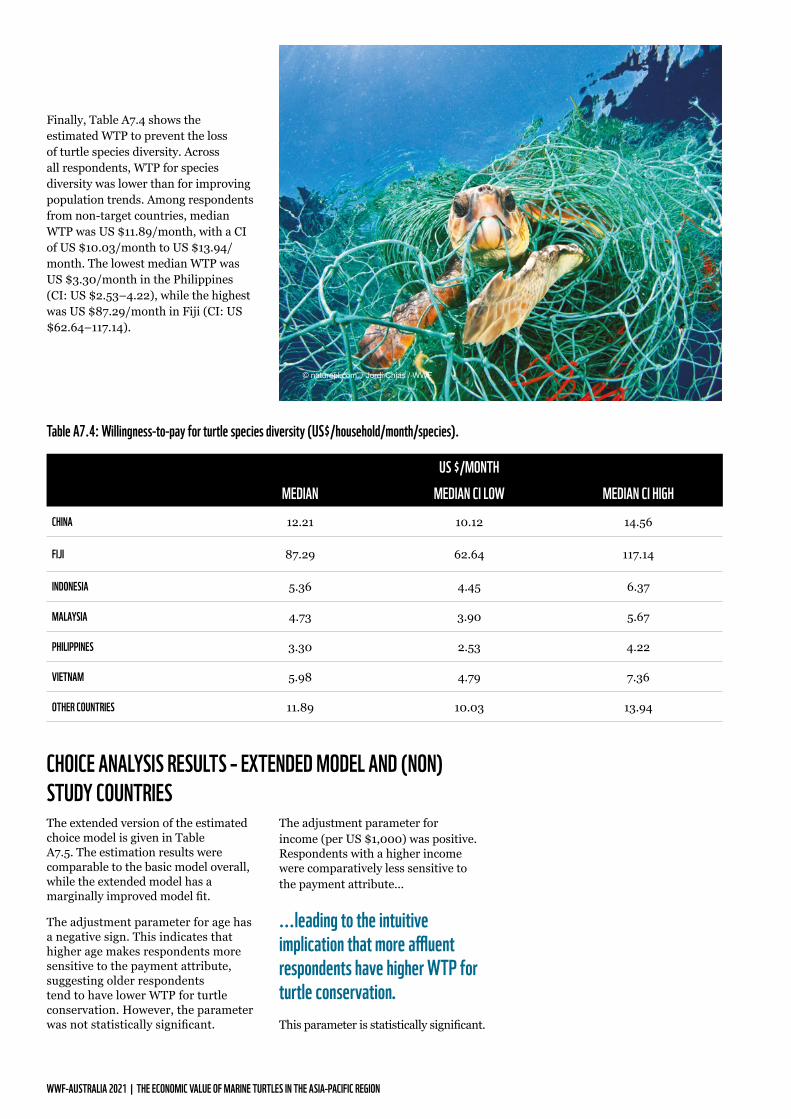
WWF-AUSTRALIA 2021 | THE ECONOMIC VALUE OF MARINE TURTLES IN THE ASIA-PACIFIC REGION
CHOICE ANALYSIS RESULTS – EXTENDED MODEL AND (NON) STUDY COUNTRIESThe extended version of the estimated choice model is given in Table A7.5. The estimation results were comparable to the basic model overall, while the extended model has a marginally improved model fit.
The adjustment parameter for age has a negative sign. This indicates that higher age makes respondents more sensitive to the payment attribute, suggesting older respondents tend to have lower WTP for turtle conservation. However, the parameter was not statistically significant.
The adjustment parameter for income (per US $1,000) was positive. Respondents with a higher income were comparatively less sensitive to the payment attribute...
...leading to the intuitive implication that more affluent respondents have higher WTP for turtle conservation. This parameter is statistically significant.
Table A7.4: Willingness-to-pay for turtle species diversity (US$/household/month/species).
US $/MONTHMEDIAN MEDIAN CI LOW MEDIAN CI HIGH
CHINA 12.21 10.12 14.56
FIJI 87.29 62.64 117.14
INDONESIA 5.36 4.45 6.37
MALAYSIA 4.73 3.90 5.67
PHILIPPINES 3.30 2.53 4.22
VIETNAM 5.98 4.79 7.36
OTHER COUNTRIES 11.89 10.03 13.94
Finally, Table A7.4 shows the estimated WTP to prevent the loss of turtle species diversity. Across all respondents, WTP for species diversity was lower than for improving population trends. Among respondents from non-target countries, median WTP was US $11.89/month, with a CI of US $10.03/month to US $13.94/month. The lowest median WTP was US $3.30/month in the Philippines (CI: US $2.53–4.22), while the highest was US $87.29/month in Fiji (CI: US $62.64–117.14).
© naturepl.com / Jordi Chias / WWF
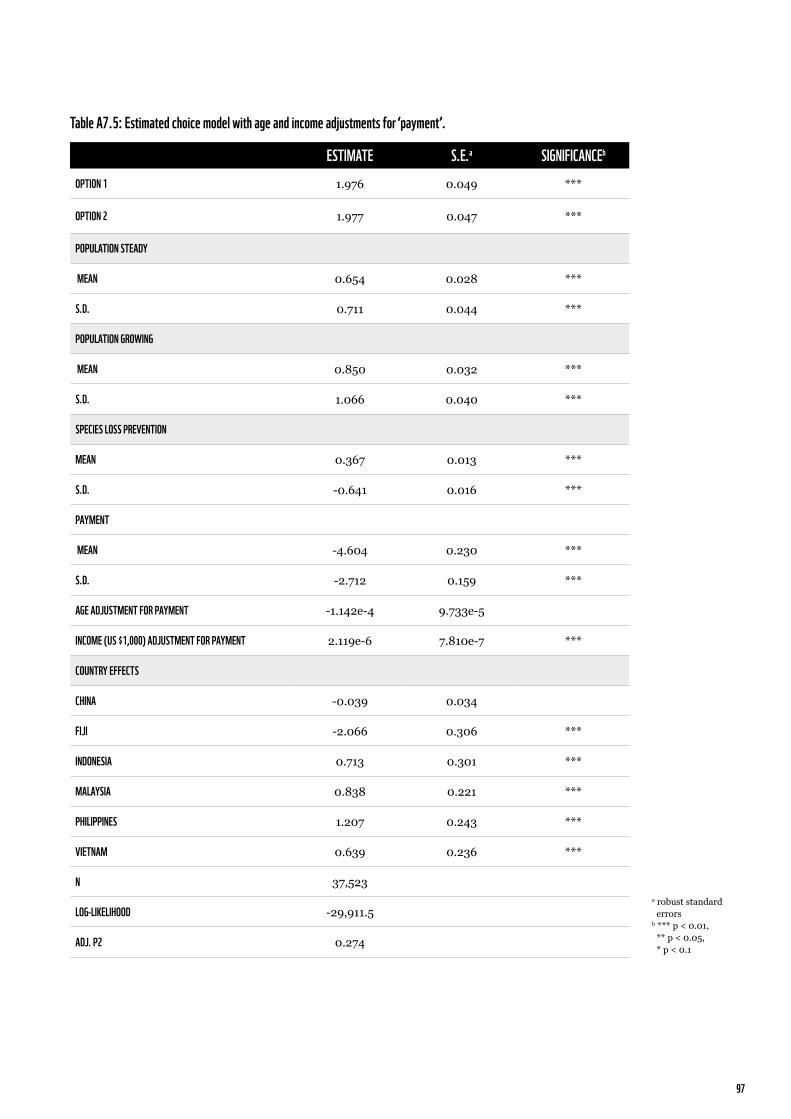
97
ESTIMATE S.E.a SIGNIFICANCEb
OPTION 1 1.976 0.049 ***
OPTION 2 1.977 0.047 ***
POPULATION STEADY
MEAN 0.654 0.028 ***
S.D. 0.711 0.044 ***
POPULATION GROWING
MEAN 0.850 0.032 ***
S.D. 1.066 0.040 ***
SPECIES LOSS PREVENTION
MEAN 0.367 0.013 ***
S.D. -0.641 0.016 ***
PAYMENT
MEAN -4.604 0.230 ***
S.D. -2.712 0.159 ***
AGE ADJUSTMENT FOR PAYMENT -1.142e-4 9.733e-5
INCOME (US $1,000) ADJUSTMENT FOR PAYMENT 2.119e-6 7.810e-7 ***
COUNTRY EFFECTS
CHINA -0.039 0.034
FIJI -2.066 0.306 ***
INDONESIA 0.713 0.301 ***
MALAYSIA 0.838 0.221 ***
PHILIPPINES 1.207 0.243 ***
VIETNAM 0.639 0.236 ***
N 37,523
LOG-LIKELIHOOD -29,911.5
ADJ. Ρ2 0.274
Table A7.5: Estimated choice model with age and income adjustments for ‘payment’.
a robust standard errors b *** p < 0.01, ** p < 0.05, * p < 0.1
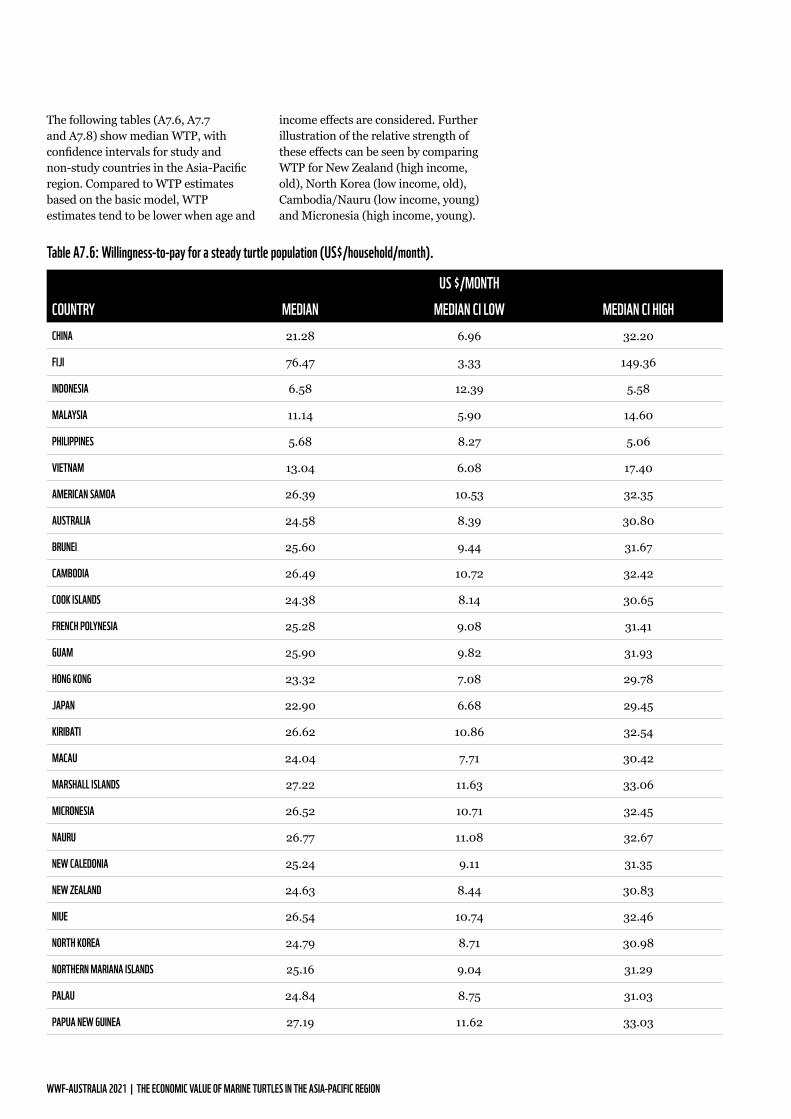
WWF-AUSTRALIA 2021 | THE ECONOMIC VALUE OF MARINE TURTLES IN THE ASIA-PACIFIC REGION
US $/MONTHCOUNTRY MEDIAN MEDIAN CI LOW MEDIAN CI HIGHCHINA 21.28 6.96 32.20
FIJI 76.47 3.33 149.36
INDONESIA 6.58 12.39 5.58
MALAYSIA 11.14 5.90 14.60
PHILIPPINES 5.68 8.27 5.06
VIETNAM 13.04 6.08 17.40
AMERICAN SAMOA 26.39 10.53 32.35
AUSTRALIA 24.58 8.39 30.80
BRUNEI 25.60 9.44 31.67
CAMBODIA 26.49 10.72 32.42
COOK ISLANDS 24.38 8.14 30.65
FRENCH POLYNESIA 25.28 9.08 31.41
GUAM 25.90 9.82 31.93
HONG KONG 23.32 7.08 29.78
JAPAN 22.90 6.68 29.45
KIRIBATI 26.62 10.86 32.54
MACAU 24.04 7.71 30.42
MARSHALL ISLANDS 27.22 11.63 33.06
MICRONESIA 26.52 10.71 32.45
NAURU 26.77 11.08 32.67
NEW CALEDONIA 25.24 9.11 31.35
NEW ZEALAND 24.63 8.44 30.83
NIUE 26.54 10.74 32.46
NORTH KOREA 24.79 8.71 30.98
NORTHERN MARIANA ISLANDS 25.16 9.04 31.29
PALAU 24.84 8.75 31.03
PAPUA NEW GUINEA 27.19 11.62 33.03
Table A7.6: Willingness-to-pay for a steady turtle population (US$/household/month).
The following tables (A7.6, A7.7 and A7.8) show median WTP, with confidence intervals for study and non-study countries in the Asia-Pacific region. Compared to WTP estimates based on the basic model, WTP estimates tend to be lower when age and
income effects are considered. Further illustration of the relative strength of these effects can be seen by comparing WTP for New Zealand (high income, old), North Korea (low income, old), Cambodia/Nauru (low income, young) and Micronesia (high income, young).

99
US $/MONTHCOUNTRY MEDIAN MEDIAN CI LOW MEDIAN CI HIGHSAMOA 26.75 11.03 32.65
SINGAPORE 24.90 8.77 31.07
SOLOMON ISLANDS 27.26 11.73 33.10
SOUTH KOREA 23.67 7.44 30.09
TAIWAN 23.81 7.58 30.19
THAILAND 24.32 8.18 30.59
TIMOR-LESTE 27.95 12.64 33.76
TOKELAU 27.19 11.60 33.04
TONGA 27.08 11.43 32.94
TUVALU 26.41 10.62 32.36
VANUATU 27.31 11.77 33.15
WALLIS AND FUTUNA 24.98 8.90 31.13
© Roger Leguen / WWF

WWF-AUSTRALIA 2021 | THE ECONOMIC VALUE OF MARINE TURTLES IN THE ASIA-PACIFIC REGION
Table A7.7: Willingness-to-pay for an increasing turtle population (US$/household/month).
US $/MONTHCOUNTRY MEDIAN MEDIAN CI LOW MEDIAN CI HIGHCHINA 25.19 8.30 37.54
FIJI 93.55 4.01 177.19
INDONESIA 14.49 6.67 19.78
MALAYSIA 12.99 7.02 16.63
PHILIPPINES 9.60 5.99 13.00
VIETNAM 15.25 7.31 19.96
AMERICAN SAMOA 26.39 10.53 37.44
AUSTRALIA 24.58 8.39 35.78
BRUNEI 25.60 9.44 36.72
CAMBODIA 26.49 10.72 37.51
COOK ISLANDS 24.38 8.14 35.64
FRENCH POLYNESIA 25.28 9.08 36.44
GUAM 25.90 9.82 36.97
HONG KONG 23.32 7.08 34.70
JAPAN 22.90 6.68 34.36
KIRIBATI 26.62 10.86 37.63
MACAU 24.04 7.71 35.34
MARSHALL ISLANDS 27.22 11.63 38.23
MICRONESIA 26.52 10.71 37.55
NAURU 26.77 11.08 37.78
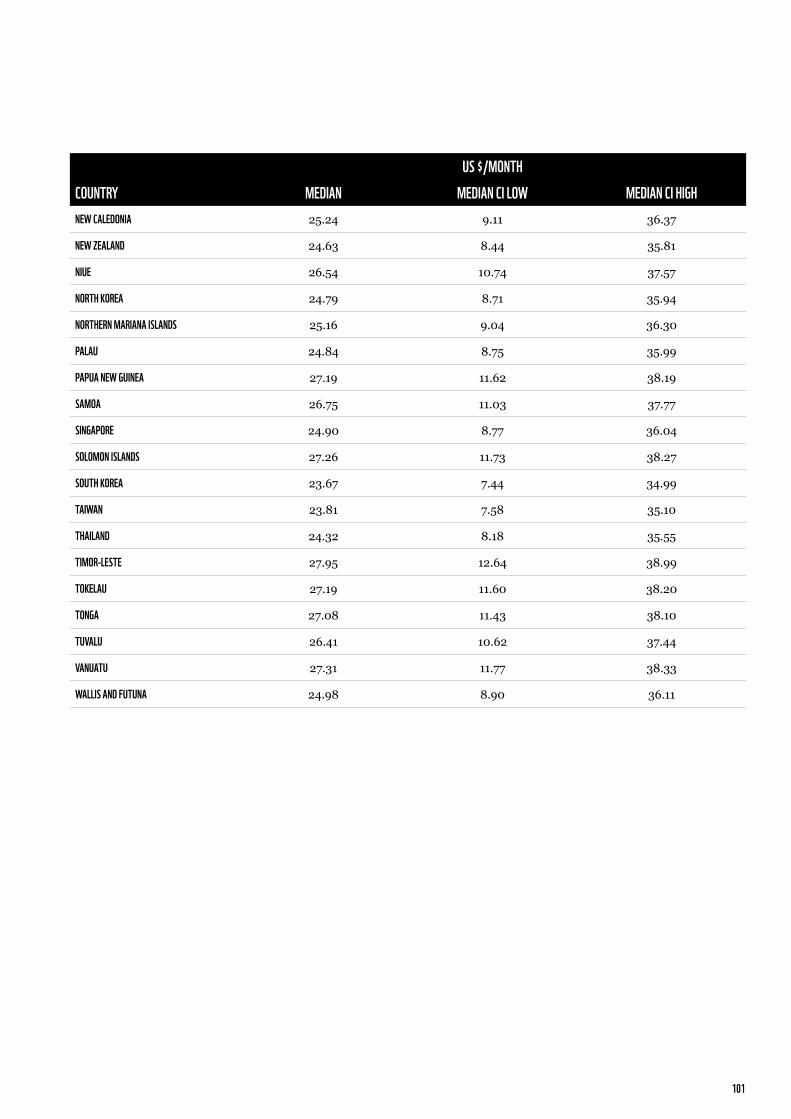
101
US $/MONTHCOUNTRY MEDIAN MEDIAN CI LOW MEDIAN CI HIGHNEW CALEDONIA 25.24 9.11 36.37
NEW ZEALAND 24.63 8.44 35.81
NIUE 26.54 10.74 37.57
NORTH KOREA 24.79 8.71 35.94
NORTHERN MARIANA ISLANDS 25.16 9.04 36.30
PALAU 24.84 8.75 35.99
PAPUA NEW GUINEA 27.19 11.62 38.19
SAMOA 26.75 11.03 37.77
SINGAPORE 24.90 8.77 36.04
SOLOMON ISLANDS 27.26 11.73 38.27
SOUTH KOREA 23.67 7.44 34.99
TAIWAN 23.81 7.58 35.10
THAILAND 24.32 8.18 35.55
TIMOR-LESTE 27.95 12.64 38.99
TOKELAU 27.19 11.60 38.20
TONGA 27.08 11.43 38.10
TUVALU 26.41 10.62 37.44
VANUATU 27.31 11.77 38.33
WALLIS AND FUTUNA 24.98 8.90 36.11

WWF-AUSTRALIA 2021 | THE ECONOMIC VALUE OF MARINE TURTLES IN THE ASIA-PACIFIC REGION
Table A7.8: Willingness-to-pay for turtle species diversity (US$/household/month/species).
US $/MONTHCOUNTRY MEDIAN MEDIAN CI LOW MEDIAN CI HIGHCHINA 8.47 3.03 12.30
FIJI 34.26 1.51 60.34
INDONESIA 4.72 4.72 2.32
MALAYSIA 4.19 2.44 5.29
PHILIPPINES 3.06 3.06 2.02
VIETNAM 4.97 2.56 6.42
AMERICAN SAMOA 8.75 3.81 12.17
AUSTRALIA 8.24 3.06 11.70
BRUNEI 8.53 3.44 11.97
CAMBODIA 8.77 3.87 12.20
COOK ISLANDS 8.18 2.97 11.64
FRENCH POLYNESIA 8.44 3.32 11.88
GUAM 8.61 3.58 12.05
HONG KONG 7.88 2.59 11.38
JAPAN 7.76 2.45 11.28
KIRIBATI 8.81 3.92 12.23
MACAU 8.09 2.82 11.56
MARSHALL ISLANDS 8.97 4.19 12.39
MICRONESIA 8.78 3.87 12.21
NAURU 8.85 3.99 12.27

103
US $/MONTHCOUNTRY MEDIAN MEDIAN CI LOW MEDIAN CI HIGHNEW CALEDONIA 8.43 3.32 11.86
NEW ZEALAND 8.25 3.09 11.71
NIUE 8.79 3.88 12.21
NORTH KOREA 8.30 3.17 11.74
NORTHERN MARIANA ISLANDS 8.41 3.30 11.85
PALAU 8.32 3.19 11.76
PAPUA NEW GUINEA 8.96 4.18 12.38
SAMOA 8.84 3.97 12.26
SINGAPORE 8.33 3.20 11.78
SOLOMON ISLANDS 8.98 4.21 12.40
SOUTH KOREA 7.98 2.72 11.47
TAIWAN 8.02 2.77 11.49
THAILAND 8.17 2.99 11.62
TIMOR-LESTE 9.17 4.54 12.61
TOKELAU 8.96 4.18 12.38
TONGA 8.93 4.12 12.35
TUVALU 8.75 3.83 12.18
VANUATU 8.99 4.23 12.42
WALLIS AND FUTUNA 8.35 3.24 11.80

wwf.org.au
Level 1/1 Smail Street,Ultimo NSW 2007GPO Box 528Sydney NSW 2001
Tel:+1800 032 [email protected]@WWF_Australiawwf.org.au
WWF-Australia National Office
OUR MISSION IS TO CONSERVE NATURE AND REDUCE THE MOST PRESSING THREATS TO THE DIVERSITY OF LIFE
ON EARTH.